UNITED STATES
SECURITIES AND EXCHANGE COMMISSION
Washington, D.C. 20549
FORM N-CSR
CERTIFIED SHAREHOLDER REPORT OF REGISTERED
MANAGEMENT INVESTMENT COMPANIES
Investment Company Act file number 811-4008
Fidelity Investment Trust
(Exact name of registrant as specified in charter)
82 Devonshire St., Boston, Massachusetts 02109
(Address of principal executive offices) (Zip code)
Scott C. Goebel, Secretary
82 Devonshire St.
Boston, Massachusetts 02109
(Name and address of agent for service)
Registrant's telephone number, including area code: 617-563-7000
Date of fiscal year end: | October 31 |
| |
Date of reporting period: | October 31, 2010 |
Item 1. Reports to Stockholders
Fidelity's
Broadly Diversified International Equity
Funds
Fidelity® Diversified International Fund
Fidelity International Capital Appreciation Fund
Fidelity Overseas Fund
Fidelity Worldwide Fund
Annual Report
October 31, 2010
(2_fidelity_logos) (Registered_Trademark)
Contents
To view a fund's proxy voting guidelines and proxy voting record for the 12-month period ended June 30, visit http://www.fidelity.com/proxyvotingresults or visit the Securities and Exchange Commission's (SEC) web site at http://www.sec.gov. You may also call 1-800-544-8544 to request a free copy of the proxy voting guidelines.
Standard & Poor's, S&P and S&P 500 are registered service marks of The McGraw-Hill Companies, Inc. and have been licensed for use by Fidelity Distributors Corporation.
Other third party marks appearing herein are the property of their respective owners.
All other marks appearing herein are registered or unregistered trademarks or service marks of FMR LLC or an affiliated company.
This report and the financial statements contained herein are submitted for the general information of the shareholders of the funds. This report is not authorized for distribution to prospective investors in the funds unless preceded or accompanied by an effective prospectus.
A fund files its complete schedule of portfolio holdings with the SEC for the first and third quarters of each fiscal year on Form N-Q. Forms N-Q are available on the SEC's web site at http://www.sec.gov. A fund's Forms N-Q may be reviewed and copied at the SEC's Public Reference Room in Washington, DC. Information regarding the operation of the SEC's Public Reference Room may be obtained by calling 1-800-SEC-0330. For a complete list of a fund's portfolio holdings, view the most recent holdings listing, semiannual report, or annual report on Fidelity's web site at http://www.fidelity.com or http://www.advisor.fidelity.com, as applicable.
NOT FDIC INSURED • MAY LOSE VALUE • NO BANK GUARANTEE
Neither the funds nor Fidelity Distributors Corporation is a bank.
Annual Report
(photo_of_Edward_C_Johnson_3d)
Dear Shareholder:
Equities staged a rally during the third quarter of 2010, shaking off concerns about the European debt crisis and the possibility of a double-dip recession in the U.S. Although the short-term surge pushed major equity indexes back into positive territory for the year, several questions remained about the longer-term outlook, including lackluster economic growth and persistently high unemployment. Financial markets are always unpredictable, of course, but there also are several time-tested investment principles that can help put the odds in your favor.
One of the basic tenets is to invest for the long term. Over time, riding out the markets' inevitable ups and downs has proven much more effective than selling into panic or chasing the hottest trend. Even missing only a few of the markets' best days can significantly diminish investor returns. Patience also affords the benefits of compounding - of earning interest on additional income or reinvested dividends and capital gains. There can be tax advantages and cost benefits to consider as well. While staying the course doesn't eliminate risk, it can considerably lessen the effect of short-term declines.
You can further manage your investing risk through diversification. And today, more than ever, geographic diversification should be taken into account. Studies indicate that asset allocation is the single most important determinant of a portfolio's long-term success. The right mix of stocks, bonds and cash - aligned to your particular risk tolerance and investment objective - is very important. Age-appropriate rebalancing is also an essential aspect of asset allocation. For younger investors, an emphasis on equities - which historically have been the best-performing asset class over time - is encouraged. As investors near their specific goal, such as retirement or sending a child to college, consideration may be given to replacing volatile assets (e.g. common stocks) with more-stable fixed investments (bonds or saving plans).
A third principle - investing regularly - can help lower the average cost of your purchases. Investing a certain amount of money each month or quarter helps ensure you won't pay for all your shares at market highs. This strategy - known as dollar cost averaging - also reduces "emotion" from investing, helping shareholders avoid selling weak performers just prior to an upswing, or chasing a hot performer just before a correction.
We invite you to contact us via the Internet, through our Investor Centers or by phone. It is our privilege to provide you the information you need to make the investments that are right for you.
Sincerely,
(The chairman's signature appears here.)
Edward C. Johnson 3d
Annual Report
Fidelity Diversified International Fund
As a shareholder of the Fund, you incur two types of costs: (1) transaction costs, including redemption fees, and (2) ongoing costs, including management fees and other Fund expenses. This Example is intended to help you understand your ongoing costs (in dollars) of investing in the Fund and to compare these costs with the ongoing costs of investing in other mutual funds.
The Example is based on an investment of $1,000 invested at the beginning of the period and held for the entire period (May 1, 2010 to October 31, 2010).
Actual Expenses
The first line of the accompanying table for each class of the Fund provides information about actual account values and actual expenses. You may use the information in this line, together with the amount you invested, to estimate the expenses that you paid over the period. Simply divide your account value by $1,000.00 (for example, an $8,600 account value divided by $1,000.00 = 8.6), then multiply the result by the number in the first line for a class of the Fund under the heading entitled "Expenses Paid During Period" to estimate the expenses you paid on your account during this period. A small balance maintenance fee of $12.00 that is charged once a year may apply for certain accounts with a value of less than $2,000. This fee is not included in the table below. If it was, the estimate of expenses you paid during the period would be higher, and your ending account value lower, by this amount. In addition, the Fund, as a shareholder in the underlying Fidelity Central Funds, will indirectly bear its pro-rata share of the fees and expenses incurred by the underlying Fidelity Central Funds. These fees and expenses are not included in the Fund's annualized expense ratio used to calculate the expense estimate in the table below.
Hypothetical Example for Comparison Purposes
The second line of the accompanying table for each class of the Fund provides information about hypothetical account values and hypothetical expenses based on a Class' actual expense ratio and an assumed rate of return of 5% per year before expenses, which is not the Class' actual return. The hypothetical account values and expenses may not be used to estimate the actual ending account balance or expenses you paid for the period. You may use this information to compare the ongoing costs of investing in the Fund and other funds. To do so, compare this 5% hypothetical example with the 5% hypothetical examples that appear in the shareholder reports of the other funds. A small balance maintenance fee of $12.00 that is charged once a year may apply for certain accounts with a value of less than $2,000. This fee is not included in the table below. If it was, the estimate of expenses you paid during the period would be higher, and your ending account value lower, by this amount. In addition, the Fund, as a shareholder in the underlying Fidelity Central Funds, will indirectly bear its pro-rata share of the fees and expenses incurred by the underlying Fidelity Central Funds. These fees and expenses are not included in the Fund's annualized expense ratio used to calculate the expense estimate in the table below.
Please note that the expenses shown in the table are meant to highlight your ongoing costs only and do not reflect any transaction costs. Therefore, the second line of the table is useful in comparing ongoing costs only, and will not help you determine the relative total costs of owning different funds. In addition, if these transactional costs were included, your costs would have been higher.
| Annualized
Expense Ratio | Beginning
Account Value
May 1, 2010 | Ending
Account Value
October 31, 2010 | Expenses Paid
During Period*
May 1, 2010
to October 31, 2010 |
Diversified International | .96% | | | |
Actual | | $ 1,000.00 | $ 1,062.30 | $ 4.99 |
HypotheticalA | | $ 1,000.00 | $ 1,020.37 | $ 4.89 |
Class K | .78% | | | |
Actual | | $ 1,000.00 | $ 1,063.00 | $ 4.06 |
HypotheticalA | | $ 1,000.00 | $ 1,021.27 | $ 3.97 |
Class F | .73% | | | |
Actual | | $ 1,000.00 | $ 1,063.80 | $ 3.80 |
HypotheticalA | | $ 1,000.00 | $ 1,021.53 | $ 3.72 |
A 5% return per year before expenses
* Expenses are equal to each Class' annualized expense ratio, multiplied by the average account value over the period, multiplied by 184/365 (to reflect the one-half year period).
Annual Report
Fidelity Diversified International Fund
Performance: The Bottom Line
Average annual total return reflects the change in the value of an investment, assuming reinvestment of the class' distributions from dividend income and capital gains (the profits earned upon the sale of securities that have grown in value, if any) and assuming a constant rate of performance each year. The $10,000 table and the fund's returns do not reflect the deduction of taxes that a shareholder would pay on fund distributions or the redemption of fund shares. During periods of reimbursement by Fidelity, a fund's total return will be greater than it would be had the reimbursement not occurred. How a fund did yesterday is no guarantee of how it will do tomorrow.
Average Annual Total Returns
Periods ended October 31, 2010 | Past 1
year | Past 5
years | Past 10
years |
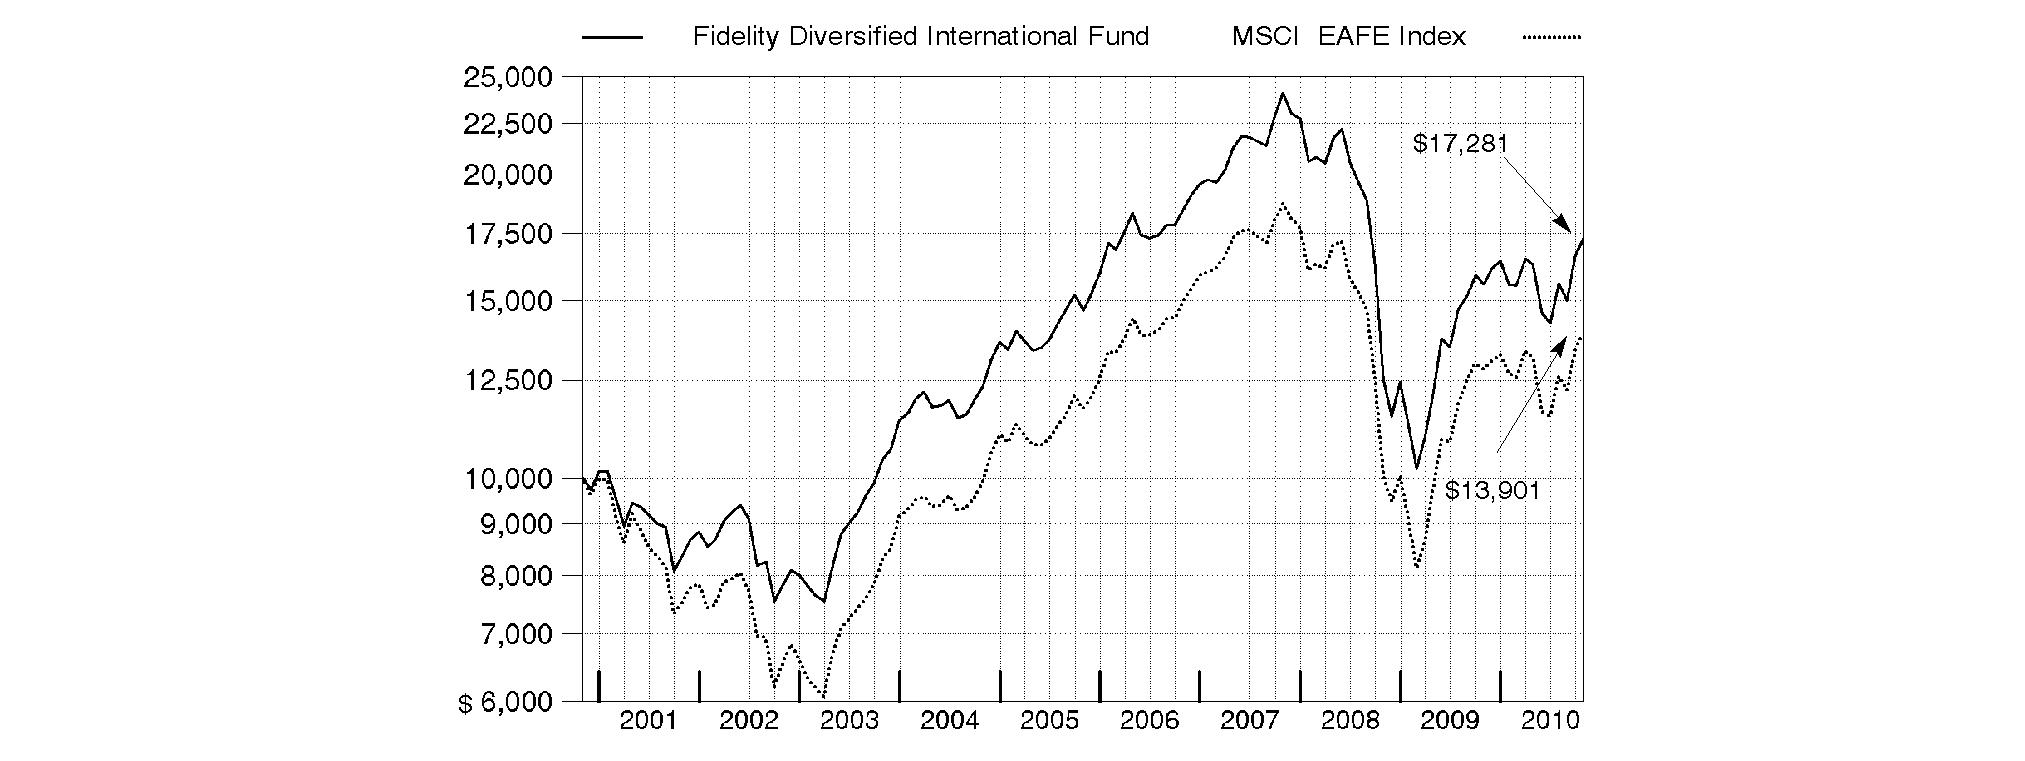
Fidelity Diversified International Fund | 11.15% | 3.34% | 5.62% |
$10,000 Over 10 Years
Let's say hypothetically that $10,000 was invested in Fidelity Diversified International Fund, a class of the fund, on October 31, 2000. The chart shows how the value of your investment would have changed, and also shows how the MSCI® EAFE ® (Europe, Australasia, Far East) Index performed over the same period.
Annual Report
Fidelity Diversified International Fund
Market Recap: International stocks rode a wave of volatility similar to that of their U.S. counterparts during the 12 months ending October 31, 2010. Stocks gained modestly in the first half of the period, despite growing concerns about the European debt crisis. Sentiment turned decidedly negative in May and June, however, and the market suffered a precipitous decline. These losses were more than offset during the last four months of the period, when signs of economic growth and subsiding debt fears helped propel international stocks about 21%. For the full year, the MSCI® ACWI® (All Country World Index) ex USA Index gained 12.76%, boosted in part by a generally depreciating U.S. dollar. Within the index, Canada and emerging markets were standouts, returning 23% and 24%, respectively. Results in the latter group were led by strong-performing India, Mexico and South Africa, while China fell short of the MSCI benchmark due to cooling economic growth. The developed Asia ex Japan segment rose 16% for the period, lifted by solid results from Singapore and Hong Kong. Meanwhile, Europe rose just 9%, held back mainly by debt-riddled Spain and Italy, as well as lagging major constituent France. Japan returned only 5%, a result of that nation's continued weak economy.
Comments from William Bower, Portfolio Manager of Fidelity® Diversified International Fund: For the year, the fund's Retail Class shares gained 11.15%, solidly outperforming the 8.49% return of the MSCI EAFE® (Europe, Australasia, Far East) Index. The fund was helped most by strong security selection in the consumer discretionary, materials, technology, financials and health care groups. In terms of countries, my picks in Germany were particularly productive, while underweighting Japan and overweighting China also aided results. Individual contributors included Danish pharmaceutical company Novo Nordisk, German automakers Volkswagen - since sold - and BMW, two out-of-benchmark positions - Chinese Internet search provider Baidu and Taiwanese smart phone manufacturer HTC - German medical equipment company Fresenius and French holding company PPR. Conversely, underweighting industrials hurt, as did overweighting energy. Geographically, unfavorable stock selection in the United Kingdom and China curtailed results. At the issuer level, detractors included out-of-index energy company Transocean, Spanish telecommunications company Telefonica, an out-of-benchmark investment in Canadian energy firm Petrobank Energy & Resources, not owning French luxury goods company and index component Richemont and a since-sold position in Swiss pharmaceutical firm Actelion.
The views expressed above reflect those of the portfolio manager(s) only through the end of the period as stated on the cover of this report and do not necessarily represent the views of Fidelity or any other person in the Fidelity organization. Any such views are subject to change at any time based upon market or other conditions and Fidelity disclaims any responsibility to update such views. These views may not be relied on as investment advice and, because investment decisions for a Fidelity fund are based on numerous factors, may not be relied on as an indication of trading intent on behalf of any Fidelity fund.
Annual Report
Fidelity Diversified International Fund
Investment Changes (Unaudited)
Geographic Diversification (% of fund's net assets) |
As of October 31, 2010 |
 | United Kingdom | 18.4% | |
 | Japan | 11.8% | |
 | United States of America | 10.4% | |
 | Germany | 8.1% | |
 | Switzerland | 7.7% | |
 | France | 7.0% | |
 | Canada | 4.3% | |
 | Spain | 3.9% | |
 | Netherlands | 3.2% | |
 | Other | 25.2% | |

Percentages are adjusted for the effect of futures contracts, if applicable. |
As of April 30, 2010 |
| United Kingdom | 17.1% | |
| Japan | 15.1% | |
| United States of America | 10.7% | |
| France | 9.5% | |
| Switzerland | 8.0% | |
| Germany | 7.6% | |
| Spain | 4.2% | |
| Canada | 4.0% | |
| Australia | 2.8% | |
| Other | 21.0% | |

Percentages are adjusted for the effect of futures contracts, if applicable. |
Asset Allocation |
| % of fund's
net assets | % of fund's net assets
6 months ago |
Stocks | 95.9 | 96.9 |
Short-Term Investments and Net Other Assets | 4.1 | 3.1 |
Top Ten Stocks as of October 31, 2010 |
| % of fund's
net assets | % of fund's net assets
6 months ago |
Nestle SA (Switzerland, Food Products) | 2.3 | 1.9 |
BP PLC (United Kingdom, Oil, Gas & Consumable Fuels) | 2.1 | 0.9 |
Royal Dutch Shell PLC Class B ADR (United Kingdom, Oil, Gas & Consumable Fuels) | 2.0 | 1.3 |
Vodafone Group PLC (United Kingdom, Wireless Telecommunication Services) | 1.9 | 1.4 |
BHP Billiton Ltd. sponsored ADR (Australia, Metals & Mining) | 1.7 | 1.3 |
Banco Santander SA sponsored ADR (Spain, Commercial Banks) | 1.5 | 1.2 |
HSBC Holdings PLC (United Kingdom, Commercial Banks) | 1.5 | 2.0 |
Novo Nordisk AS Series B (Denmark, Pharmaceuticals) | 1.4 | 1.1 |
Anheuser-Busch InBev SA NV (Belgium, Beverages) | 1.1 | 1.0 |
Siemens AG (Germany, Industrial Conglomerates) | 1.1 | 0.7 |
| 16.6 | |
Market Sectors as of October 31, 2010 |
| % of fund's
net assets | % of fund's net assets
6 months ago |
Financials | 20.5 | 21.3 |
Consumer Discretionary | 13.8 | 10.3 |
Energy | 11.4 | 10.6 |
Materials | 10.2 | 8.8 |
Information Technology | 9.5 | 10.6 |
Consumer Staples | 9.2 | 8.9 |
Industrials | 8.2 | 9.5 |
Health Care | 7.3 | 9.4 |
Telecommunication Services | 5.4 | 5.3 |
Utilities | 0.4 | 2.2 |
Annual Report
Fidelity Diversified International Fund
Investments October 31, 2010
Showing Percentage of Net Assets
Common Stocks - 94.4% |
| Shares | | Value |
Argentina - 0.0% |
Telecom Argentina SA Class B sponsored ADR | 45,100 | | $ 1,075,184 |
Australia - 3.1% |
AMP Ltd. | 14,831,137 | | 77,586,587 |
BHP Billiton Ltd. sponsored ADR (d) | 7,059,600 | | 583,052,364 |
Centamin Egypt Ltd. (United Kingdom) (a) | 173,900 | | 482,002 |
Newcrest Mining Ltd. | 7,469,169 | | 292,394,171 |
QBE Insurance Group Ltd. | 4,150,000 | | 69,846,106 |
Westfield Group unit | 4,650,000 | | 56,395,512 |
TOTAL AUSTRALIA | | 1,079,756,742 |
Bahamas (Nassau) - 0.0% |
Petrominerales Ltd. | 19,000 | | 486,783 |
Bailiwick of Guernsey - 0.6% |
Resolution Ltd. | 50,499,100 | | 211,895,783 |
Bailiwick of Jersey - 1.7% |
Experian PLC | 16,227,900 | | 188,626,591 |
Informa PLC | 13,102,770 | | 91,527,749 |
Randgold Resources Ltd. sponsored ADR | 888,300 | | 83,429,136 |
Shire PLC | 2,291,500 | | 53,768,144 |
WPP PLC | 15,153,311 | | 176,073,094 |
TOTAL BAILIWICK OF JERSEY | | 593,424,714 |
Belgium - 1.3% |
Ageas | 25,335,700 | | 77,874,672 |
Anheuser-Busch InBev SA NV | 6,035,621 | | 378,215,859 |
Anheuser-Busch InBev SA NV (strip VVPR) (a) | 5,339,200 | | 22,288 |
Telenet Group Holding NV | 35,000 | | 1,461,023 |
TOTAL BELGIUM | | 457,573,842 |
Bermuda - 0.7% |
Central European Media Enterprises Ltd. Class A (a) | 19,000 | | 437,950 |
China Green (Holdings) Ltd. | 471,000 | | 483,077 |
GP Investments, Ltd. unit (a) | 121,051 | | 512,325 |
Huabao International Holdings Ltd. | 77,697,000 | | 117,078,015 |
Li & Fung Ltd. | 23,006,000 | | 121,541,132 |
Sihuan Pharmaceutical Holdings Group Ltd. | 1,715,000 | | 1,245,664 |
Vtech Holdings Ltd. | 93,100 | | 968,684 |
TOTAL BERMUDA | | 242,266,847 |
Brazil - 1.6% |
Banco Bradesco SA | 124,600 | | 2,006,842 |
Banco do Brasil SA | 5,700,000 | | 110,904,068 |
Banco Santander (Brasil) SA ADR | 5,000,000 | | 72,000,000 |
BM&F Bovespa SA | 11,250,000 | | 94,234,952 |
Drogasil SA | 2,204,300 | | 55,755,366 |
Estacio Participacoes SA | 2,189,965 | | 32,710,446 |
Fleury SA | 40,400 | | 522,455 |
|
| Shares | | Value |
Hypermarcas SA (a) | 29,700 | | $ 488,831 |
Itau Unibanco Banco Multiplo SA ADR | 4,088,800 | | 100,420,928 |
Mills Estruturas e Servicos de Engenharia SA (a) | 1,727,100 | | 20,842,560 |
Porto Seguro SA | 33,400 | | 490,830 |
Souza Cruz Industria Comerico | 875,000 | | 44,958,706 |
Tractebel Energia SA | 64,300 | | 978,938 |
Weg SA | 1,248,292 | | 16,120,959 |
TOTAL BRAZIL | | 552,435,881 |
British Virgin Islands - 0.0% |
HLS Systems International Ltd. (a) | 40,900 | | 516,976 |
Canada - 4.3% |
Agnico-Eagle Mines Ltd. (Canada) | 1,250,000 | | 96,945,779 |
Barrick Gold Corp. | 1,500,000 | | 72,242,377 |
Canadian Natural Resources Ltd. | 4,000,000 | | 145,622,120 |
Fairfax Financial Holdings Ltd. (sub. vtg.) | 170,000 | | 69,538,484 |
Goldcorp, Inc. | 1,475,000 | | 65,860,869 |
InterOil Corp. (a)(d) | 560,000 | | 39,860,800 |
Ivanhoe Mines Ltd. (a) | 1,958,400 | | 46,890,997 |
Loblaw Companies Ltd. (d) | 787,000 | | 33,628,258 |
Niko Resources Ltd. | 2,242,600 | | 213,947,426 |
Open Text Corp. (a) | 1,445,400 | | 63,943,963 |
OZ Optics Ltd. unit (a)(g) | 102,000 | | 451,860 |
Painted Pony Petroleum Ltd. (a)(e)(f) | 1,386,600 | | 9,544,006 |
Painted Pony Petroleum Ltd. Class A (a)(e) | 3,125,000 | | 21,509,462 |
Petrobank Energy & Resources Ltd. (a)(e) | 5,625,000 | | 223,863,859 |
Silver Wheaton Corp. (a) | 2,126,900 | | 61,143,944 |
Suncor Energy, Inc. | 3,100,000 | | 99,331,307 |
Talisman Energy, Inc. | 8,454,900 | | 153,280,813 |
Uranium One, Inc. (a) | 20,200,000 | | 82,590,450 |
TOTAL CANADA | | 1,500,196,774 |
Cayman Islands - 0.6% |
A8 Digital Music Holdings Ltd. | 1,206,000 | | 486,990 |
BaWang International (Group) Holding Ltd. | 15,728,000 | | 6,614,840 |
Belle International Holdings Ltd. | 9,507,000 | | 17,171,166 |
China Lodging Group Ltd. ADR | 19,300 | | 469,183 |
Consolidated Water Co., Inc. | 100,800 | | 1,031,184 |
Fook Woo Group Holdings Ltd. | 1,396,000 | | 493,474 |
Hengan International Group Co. Ltd. | 7,325,500 | | 68,990,357 |
Hengdeli Holdings Ltd. | 74,000,000 | | 41,051,443 |
Hua Han Bio-Pharmaceutical Holdings Ltd. | 1,504,000 | | 506,427 |
Lijun International Pharmaceutical Holding Ltd. | 69,995,000 | | 24,020,216 |
Microport Scientific Corp. | 1,375,000 | | 1,401,387 |
Silver Base Group Holdings Ltd. | 25,672,000 | | 18,745,818 |
Want Want China Holdings Ltd. | 36,665,000 | | 33,820,964 |
Wasion Group Holdings Ltd. | 686,000 | | 499,150 |
TOTAL CAYMAN ISLANDS | | 215,302,599 |
Common Stocks - continued |
| Shares | | Value |
China - 1.5% |
Agricultural Bank of China (H Shares) | 169,770,000 | | $ 89,580,300 |
Baidu.com, Inc. sponsored ADR (a) | 1,065,700 | | 117,237,657 |
China Merchants Bank Co. Ltd. (H Shares) | 75,991,000 | | 215,681,600 |
China Resources Land Ltd. | 458,000 | | 902,853 |
Minth Group Ltd. | 4,366,000 | | 8,167,328 |
NetEase.com, Inc. sponsored ADR (a) | 1,279,400 | | 53,478,920 |
Tingyi (Cayman Islands) Holding Corp. | 7,700,000 | | 20,960,490 |
Xinhua Winshare Publishing and Media Co. Ltd. | 911,000 | | 541,811 |
TOTAL CHINA | | 506,550,959 |
Colombia - 0.0% |
BanColombia SA sponsored ADR | 7,400 | | 499,130 |
Denmark - 2.4% |
Carlsberg AS Series B | 1,980,450 | | 216,555,709 |
Novo Nordisk AS Series B | 4,627,712 | | 485,827,751 |
Pandora A/S | 1,108,600 | | 53,784,404 |
William Demant Holding AS (a) | 1,250,000 | | 93,695,770 |
TOTAL DENMARK | | 849,863,634 |
Egypt - 0.0% |
Commercial International Bank Ltd. | 64,500 | | 485,865 |
Finland - 0.2% |
Nokia Corp. | 67,000 | | 719,358 |
Nokia Corp. sponsored ADR (d) | 8,000,000 | | 85,440,000 |
TOTAL FINLAND | | 86,159,358 |
France - 7.0% |
Accor SA | 425,000 | | 17,424,607 |
Alstom SA | 699,330 | | 35,283,980 |
Atos Origin SA (a) | 1,499,892 | | 69,341,397 |
AXA SA sponsored ADR | 9,441,700 | | 172,122,191 |
BNP Paribas SA | 3,958,600 | | 289,455,595 |
Cap Gemini SA | 2,023,500 | | 103,205,785 |
Carrefour SA | 49,000 | | 2,644,061 |
Casino Guichard Perrachon et Compagnie | 16,017 | | 1,504,363 |
Danone | 36,500 | | 2,309,581 |
Dassault Aviation SA | 36,265 | | 30,024,256 |
Essilor International SA | 1,868,672 | | 124,755,853 |
Euler Hermes SA (a) | 440,000 | | 41,417,901 |
Iliad Group SA (d) | 725,000 | | 81,612,022 |
Lafarge SA (Bearer) | 17,200 | | 982,687 |
LVMH Moet Hennessy - Louis Vuitton | 1,943,198 | | 304,454,959 |
Pernod-Ricard SA | 805,100 | | 71,371,535 |
PPR SA | 1,535,200 | | 251,638,947 |
Sanofi-Aventis | 2,590,429 | | 181,443,991 |
Schneider Electric SA | 767,042 | | 108,864,661 |
SEB SA | 5,400 | | 517,477 |
Societe Generale Series A | 4,207,250 | | 251,876,010 |
|
| Shares | | Value |
Technip SA | 1,401,500 | | $ 117,767,577 |
Vallourec SA (d) | 1,633,946 | | 169,538,935 |
TOTAL FRANCE | | 2,429,558,371 |
Germany - 6.6% |
adidas AG | 18,300 | | 1,193,476 |
BASF AG | 1,967,023 | | 143,091,101 |
Bayerische Motoren Werke AG (BMW) | 5,114,261 | | 366,557,445 |
Daimler AG (Germany) (a) | 3,665,693 | | 241,922,812 |
Deutsche Boerse AG | 1,721,100 | | 121,082,332 |
ElringKlinger AG | 310,500 | | 10,345,323 |
Fresenius Medical Care AG & Co. KGaA | 2,706,700 | | 172,380,701 |
Fresenius SE | 2,317,000 | | 204,433,185 |
GFK AG | 1,600,000 | | 67,546,549 |
HeidelbergCement AG | 1,700,000 | | 88,906,002 |
Kabel Deutschland Holding AG | 44,300 | | 1,994,402 |
Linde AG | 1,520,355 | | 218,848,266 |
Metro AG | 1,000,000 | | 70,073,422 |
Munich Re Group | 602,751 | | 94,227,707 |
Rheinmetall AG | 553,250 | | 39,845,869 |
SAP AG | 1,153,350 | | 60,132,938 |
Siemens AG | 25,416 | | 2,902,767 |
Siemens AG sponsored ADR | 3,300,000 | | 377,223,000 |
Symrise AG | 90,000 | | 2,733,156 |
TOTAL GERMANY | | 2,285,440,453 |
Greece - 0.0% |
Coca-Cola Hellenic Bottling Co. SA sponsored ADR | 39,200 | | 997,248 |
Hong Kong - 0.8% |
AIA Group Ltd. | 18,365,200 | | 54,612,851 |
China Insurance International Holdings Co. Ltd. (a) | 281,000 | | 1,033,188 |
China Mobile (Hong Kong) Ltd. | 145,000 | | 1,480,786 |
China Travel International Investment HK Ltd. (a) | 4,062,000 | | 969,482 |
Henderson Land Development Co. Ltd. | 11,788,155 | | 83,720,424 |
Henderson Land Development Co. Ltd. warrants 6/1/11 (a) | 2,171,600 | | 840,484 |
Hopewell Holdings Ltd. | 309,500 | | 974,269 |
Swire Pacific Ltd. (A Shares) | 4,577,000 | | 64,953,395 |
Wharf Holdings Ltd. | 10,294,000 | | 67,597,433 |
TOTAL HONG KONG | | 276,182,312 |
India - 1.0% |
Adani Enterprises Ltd. | 31,720 | | 504,121 |
Bajaj Holdings & Investment Ltd. | 51,421 | | 1,014,557 |
CESC Ltd. GDR | 113,611 | | 951,692 |
Cipla Ltd. | 131,491 | | 1,047,033 |
DB Corp. Ltd. | 83,211 | | 517,100 |
Grasim Industries Ltd. | 3,416 | | 179,604 |
HDFC Bank Ltd. | 1,971,144 | | 101,606,011 |
Housing Development Finance Corp. Ltd. | 4,336,280 | | 67,277,153 |
Common Stocks - continued |
| Shares | | Value |
India - continued |
Infrastructure Development Finance Co. Ltd. | 11,302,606 | | $ 51,011,537 |
Jyothy Laboratories Ltd. | 78,521 | | 488,929 |
KPIT Cummins Infosystems Ltd. | 128,981 | | 457,144 |
Larsen & Toubro Ltd. | 844,293 | | 38,625,096 |
Motherson Sumi Systems Ltd. | 116,901 | | 483,428 |
Oracle Finance Services Software Ltd. (a) | 9,100 | | 453,758 |
Reliance Industries Ltd. | 61,982 | | 1,532,945 |
Rural Electrification Corp. Ltd. | 117,280 | | 980,707 |
Shriram Transport Finance Co. Ltd. | 1,091,429 | | 21,703,001 |
State Bank of India | 1,012,201 | | 71,946,768 |
TOTAL INDIA | | 360,780,584 |
Indonesia - 0.1% |
PT Bank Rakyat Indonesia Tbk | 827,500 | | 1,055,495 |
PT Perusahaan Gas Negara Tbk Series B | 80,497,000 | | 36,476,926 |
PT Semen Gresik (Persero) Tbk | 907,500 | | 995,076 |
TOTAL INDONESIA | | 38,527,497 |
Ireland - 0.4% |
CRH PLC | 4,883,800 | | 84,338,043 |
Ingersoll-Rand Co. Ltd. | 1,186,300 | | 46,633,453 |
TOTAL IRELAND | | 130,971,496 |
Italy - 2.2% |
Fiat SpA | 13,462,200 | | 227,780,856 |
Impregilo SpA (a) | 151,300 | | 484,211 |
Intesa Sanpaolo SpA | 30,390,000 | | 106,878,284 |
Intesa Sanpaolo SpA (Risparmio Shares) | 18,000,000 | | 49,315,771 |
Mediaset SpA | 12,409,400 | | 91,515,417 |
Saipem SpA | 6,774,150 | | 300,968,702 |
TOTAL ITALY | | 776,943,241 |
Japan - 11.8% |
Canon, Inc. sponsored ADR (d) | 4,439,100 | | 204,198,600 |
Denso Corp. | 5,225,000 | | 162,487,556 |
eAccess Ltd. | 42,870 | | 31,272,138 |
Fanuc Ltd. | 710,500 | | 102,858,849 |
Fast Retailing Co. Ltd. | 752,400 | | 98,557,803 |
Honda Motor Co. Ltd. | 4,770,000 | | 171,952,704 |
Hoya Corp. | 2,000,000 | | 46,775,194 |
Itochu Corp. | 8,481,700 | | 74,336,019 |
Japan Tobacco, Inc. | 61,388 | | 190,713,128 |
JSR Corp. | 4,543,500 | | 78,651,613 |
Keyence Corp. | 731,100 | | 181,253,194 |
Komatsu Ltd. | 4,298,900 | | 105,071,267 |
Mazda Motor Corp. | 32,330,000 | | 82,165,026 |
Mitsubishi Corp. | 5,819,600 | | 139,784,919 |
Mitsubishi UFJ Financial Group, Inc. | 47,105,400 | | 218,616,347 |
Mitsui & Co. Ltd. | 13,129,900 | | 206,499,314 |
Murata Manufacturing Co. Ltd. | 641,400 | | 36,067,291 |
|
| Shares | | Value |
Nintendo Co. Ltd. | 473,100 | | $ 122,581,517 |
Nippon Electric Glass Co. Ltd. | 409,000 | | 5,257,211 |
Nitori Holdings Co. Ltd. | 441,400 | | 38,835,739 |
NSK Ltd. | 11,469,000 | | 86,710,755 |
NTT DoCoMo, Inc. | 46,000 | | 77,541,081 |
ORIX Corp. | 4,020,290 | | 366,707,190 |
Rakuten, Inc. | 196,702 | | 151,553,667 |
Ricoh Co. Ltd. | 5,500,000 | | 76,937,398 |
ROHM Co. Ltd. | 1,346,800 | | 84,018,091 |
SOFTBANK CORP. | 10,973,000 | | 352,398,190 |
Sony Financial Holdings, Inc. | 16,100 | | 56,020,875 |
Sumitomo Corp. | 2,944,600 | | 37,281,016 |
Sumitomo Mitsui Financial Group, Inc. | 5,251,900 | | 156,757,373 |
Tokai Carbon Co. Ltd. | 5,950,000 | | 35,083,044 |
Tokyo Electron Ltd. | 2,698,100 | | 152,235,861 |
Toyota Motor Corp. sponsored ADR (d) | 1,162,100 | | 82,299,922 |
Yahoo! Japan Corp. | 299,774 | | 104,640,393 |
TOTAL JAPAN | | 4,118,120,285 |
Korea (South) - 1.9% |
Amorepacific Corp. | 106,907 | | 98,873,512 |
Cheil Worldwide, Inc. | 84,120 | | 916,380 |
Grand Korea Leisure Co. Ltd. | 51,900 | | 1,056,923 |
Hynix Semiconductor, Inc. (a) | 48,350 | | 995,378 |
Hyundai Mipo Dockyard Co. Ltd. | 6,050 | | 1,011,472 |
Hyundai Mobis | 4,420 | | 1,100,578 |
Korea Investment Holdings Co. Ltd. | 30,660 | | 966,560 |
KT Corp. | 37,160 | | 1,465,083 |
LG Corp. | 20,438 | | 1,463,103 |
NCsoft Corp. | 405,877 | | 89,332,631 |
NHN Corp. (a) | 744,844 | | 132,144,381 |
Samchully Co. Ltd. | 9,630 | | 1,053,348 |
Samsung Electronics Co. Ltd. | 355,464 | | 235,500,794 |
Shinhan Financial Group Co. Ltd. | 2,186,480 | | 84,678,693 |
Yuhan Corp. | 6,340 | | 899,271 |
TOTAL KOREA (SOUTH) | | 651,458,107 |
Luxembourg - 0.3% |
Millicom International Cellular SA | 9,900 | | 936,540 |
SES SA FDR (France) unit | 4,182,920 | | 107,181,268 |
TOTAL LUXEMBOURG | | 108,117,808 |
Malaysia - 0.0% |
Berjaya Sports Toto Bhd | 749,300 | | 1,004,365 |
Parkson Holdings Bhd | 517,400 | | 986,237 |
Top Glove Corp. Bhd | 269,500 | | 476,455 |
TOTAL MALAYSIA | | 2,467,057 |
Mexico - 0.2% |
Banco Compartamos SA de CV | 69,200 | | 490,208 |
Wal-Mart de Mexico SA de CV Series V | 23,500,000 | | 64,275,131 |
TOTAL MEXICO | | 64,765,339 |
Common Stocks - continued |
| Shares | | Value |
Netherlands - 3.2% |
AEGON NV (a) | 13,650,000 | | $ 86,488,759 |
Gemalto NV | 1,700,000 | | 77,398,015 |
ING Groep NV: | | | |
(Certificaten Van Aandelen) unit (a) | 219,000 | | 2,342,425 |
sponsored ADR (a) | 20,112,800 | | 216,815,984 |
Koninklijke Ahold NV | 5,271,802 | | 72,841,008 |
Koninklijke KPN NV | 9,835,116 | | 164,220,867 |
Koninklijke Philips Electronics NV | 47,250 | | 1,440,873 |
Koninklijke Philips Electronics NV unit | 6,500,600 | | 197,943,270 |
LyondellBasell Industries NV Class A (a) | 2,653,300 | | 71,267,638 |
Randstad Holdings NV (a) | 2,062,625 | | 98,155,353 |
Reed Elsevier NV | 170,500 | | 2,226,793 |
Wolters Kluwer NV (Certificaten Van Aandelen) | 4,925,000 | | 112,010,508 |
TOTAL NETHERLANDS | | 1,103,151,493 |
Netherlands Antilles - 0.4% |
Schlumberger Ltd. | 1,953,000 | | 136,495,170 |
Nigeria - 0.0% |
Guaranty Trust Bank PLC GDR (Reg. S) | 74,000 | | 537,240 |
Norway - 1.2% |
DnB NOR ASA | 12,195,600 | | 167,345,287 |
Pronova BioPharma ASA (a)(d) | 13,000,000 | | 21,743,212 |
Storebrand ASA (A Shares) (a) | 4,980,000 | | 36,215,555 |
Telenor ASA | 11,802,200 | | 190,247,604 |
TOTAL NORWAY | | 415,551,658 |
Philippines - 0.0% |
Manila Water Co., Inc. | 2,331,300 | | 1,014,034 |
Pepsi-Cola Products Philippines, Inc. | 8,284,000 | | 503,992 |
Universal Robina Corp. | 480,000 | | 486,154 |
TOTAL PHILIPPINES | | 2,004,180 |
Poland - 0.0% |
Telekomunikacja Polska SA | 154,000 | | 980,548 |
Qatar - 0.1% |
Commercial Bank of Qatar GDR (Reg. S) | 9,000,000 | | 41,239,492 |
Russia - 0.2% |
Mobile TeleSystems OJSC sponsored ADR | 45,300 | | 980,745 |
OJSC MMC Norilsk Nickel sponsored ADR | 2,000,000 | | 37,300,000 |
Sberbank (Savings Bank of the Russian Federation) GDR | 5,300 | | 1,991,165 |
Uralkali JSC GDR (Reg. S) | 725,000 | | 17,943,750 |
TOTAL RUSSIA | | 58,215,660 |
Singapore - 0.0% |
SIA Engineering Co. Ltd. | 288,000 | | 965,711 |
Straits Asia Resources Ltd. | 558,000 | | 987,267 |
TOTAL SINGAPORE | | 1,952,978 |
|
| Shares | | Value |
South Africa - 0.5% |
African Bank Investments Ltd. | 188,900 | | $ 969,167 |
African Rainbow Minerals Ltd. | 38,200 | | 974,543 |
AngloGold Ashanti Ltd. | 21,000 | | 984,902 |
AngloGold Ashanti Ltd. sponsored ADR | 1,750,000 | | 82,442,500 |
Aveng Ltd. | 165,600 | | 1,040,164 |
City Lodge Hotels Ltd. | 44,000 | | 513,487 |
Harmony Gold Mining Co. Ltd. | 90,300 | | 1,036,985 |
Illovo Sugar Ltd. | 262,700 | | 975,039 |
Impala Platinum Holdings Ltd. | 1,232,700 | | 34,842,664 |
Mr Price Group Ltd. | 124,400 | | 1,130,514 |
Naspers Ltd. Class N | 690,100 | | 36,235,656 |
Shoprite Holdings Ltd. | 728,800 | | 10,301,964 |
Standard Bank Group Ltd. | 61,700 | | 909,859 |
Sun International Ltd. | 71,000 | | 993,283 |
TOTAL SOUTH AFRICA | | 173,350,727 |
Spain - 3.9% |
Banco Bilbao Vizcaya Argentaria SA | 6,400,000 | | 84,295,123 |
Banco Santander SA sponsored ADR | 40,900,000 | | 523,929,000 |
Enagas SA | 1,662,431 | | 36,629,358 |
Gestevision Telecinco SA | 3,503,300 | | 44,681,196 |
Inditex SA (d) | 2,314,910 | | 193,297,103 |
Obrascon Huarte Lain SA | 30,400 | | 994,475 |
Prosegur Compania de Seguridad SA (Reg.) | 1,216,300 | | 72,875,633 |
Red Electrica Corporacion SA | 1,450,000 | | 72,825,363 |
Telefonica SA | 12,400,723 | | 335,014,393 |
TOTAL SPAIN | | 1,364,541,644 |
Sweden - 0.9% |
H&M Hennes & Mauritz AB (B Shares) | 5,753,543 | | 202,703,547 |
Swedbank AB (A Shares) (a) | 8,311,300 | | 115,994,481 |
TOTAL SWEDEN | | 318,698,028 |
Switzerland - 7.7% |
Adecco SA (Reg.) | 24,000 | | 1,340,986 |
Bank Sarasin & Co. Ltd. Series B (Reg.) | 32,400 | | 1,184,944 |
Clariant AG (Reg.) (a) | 5,152,500 | | 87,100,726 |
Kuehne & Nagel International AG | 1,440,840 | | 178,138,089 |
Lonza Group AG | 609,718 | | 53,362,326 |
Nestle SA | 14,605,918 | | 799,775,457 |
Novartis AG | 72,700 | | 4,211,153 |
Novartis AG sponsored ADR (d) | 3,011,300 | | 174,504,835 |
Roche Holding AG (participation certificate) | 983,512 | | 144,376,984 |
Schindler Holding AG: | | | |
(participation certificate) | 14,300 | | 1,532,636 |
(Reg.) | 1,278,570 | | 138,982,059 |
Sonova Holding AG Class B | 865,781 | | 100,268,232 |
Syngenta AG (Switzerland) | 590,110 | | 163,343,743 |
Common Stocks - continued |
| Shares | | Value |
Switzerland - continued |
Tecan Group AG | 342,635 | | $ 23,843,651 |
Transocean Ltd. (a) | 2,625,000 | | 166,320,000 |
Transocean, Inc. (a) | 22,160 | | 1,403,643 |
UBS AG (a) | 19,336,655 | | 328,382,161 |
Zurich Financial Services AG | 1,268,730 | | 310,496,324 |
TOTAL SWITZERLAND | | 2,678,567,949 |
Taiwan - 1.3% |
Advantech Co. Ltd. | 195,000 | | 532,658 |
Chroma ATE, Inc. | 417,000 | | 1,073,668 |
Delta Electronics, Inc. | 244,000 | | 1,008,528 |
Giant Manufacturing Co. Ltd. | 261,000 | | 1,027,626 |
Hon Hai Precision Industry Co. Ltd. (Foxconn) | 19,141,040 | | 72,548,952 |
HTC Corp. | 13,847,000 | | 312,637,710 |
Powertech Technology, Inc. | 324,000 | | 1,069,237 |
Synnex Technology International Corp. | 423,000 | | 1,035,213 |
Taiwan Fertilizer Co. Ltd. | 15,418,000 | | 52,644,372 |
TOTAL TAIWAN | | 443,577,964 |
Thailand - 0.0% |
Charoen Pokphand Foods PCL (For. Reg.) | 621,900 | | 483,977 |
Turkey - 0.0% |
Hurriyet Gazetecilik ve Matbaacilik AS | 394,044 | | 453,303 |
Koc Holding AS | 203,000 | | 969,497 |
TOTAL TURKEY | | 1,422,800 |
United Kingdom - 18.4% |
Anglo American PLC (United Kingdom) | 2,523,300 | | 117,561,865 |
Associated British Foods PLC | 4,920,900 | | 82,545,689 |
Barclays PLC | 34,210,000 | | 150,315,042 |
BG Group PLC | 11,074,979 | | 215,675,618 |
BHP Billiton PLC | 4,748,480 | | 168,193,866 |
BP PLC | 279,500 | | 1,899,571 |
BP PLC sponsored ADR | 17,725,000 | | 723,711,750 |
British Airways PLC (a) | 316,000 | | 1,370,498 |
British American Tobacco PLC: | | | |
(United Kingdom) | 91,200 | | 3,473,947 |
sponsored ADR | 2,163,700 | | 164,938,851 |
Britvic PLC | 4,600,700 | | 35,557,760 |
Burberry Group PLC | 6,982,900 | | 114,002,187 |
Cable & Wireless PLC | 1,154,800 | | 988,912 |
Capita Group PLC | 22,817,500 | | 280,209,848 |
Carphone Warehouse Group PLC | 12,014,300 | | 58,612,325 |
Centrica PLC | 502,000 | | 2,671,816 |
Ensco International Ltd. ADR | 10,500 | | 486,570 |
GlaxoSmithKline PLC | 9,537,800 | | 186,226,415 |
GlaxoSmithKline PLC sponsored ADR | 4,130,400 | | 161,250,816 |
HSBC Holdings PLC: | | | |
(United Kingdom) | 434,871 | | 4,525,417 |
sponsored ADR | 9,939,900 | | 517,968,189 |
|
| Shares | | Value |
Imperial Tobacco Group PLC | 99,050 | | $ 3,172,272 |
Inchcape PLC (a) | 18,399,998 | | 102,795,215 |
International Personal Finance PLC | 104,600 | | 521,189 |
ITV PLC (a) | 84,576,200 | | 92,481,316 |
Johnson Matthey PLC | 1,813,800 | | 55,620,451 |
Kalahari Minerals PLC (a) | 186,400 | | 523,368 |
Kazakhmys PLC | 45,100 | | 950,902 |
Lloyds Banking Group PLC (a) | 221,683,500 | | 243,627,024 |
Lonmin PLC (a) | 34,400 | | 963,943 |
Misys PLC (a) | 15,000,355 | | 67,628,352 |
Next PLC | 970,700 | | 35,536,480 |
Ocado Group PLC (a) | 6,000,000 | | 13,429,221 |
Pearson PLC | 10,425,200 | | 159,651,691 |
Premier Oil PLC (a) | 19,171 | | 516,316 |
Prudential PLC | 171,500 | | 1,734,339 |
QinetiQ Group PLC | 20,900,000 | | 35,962,820 |
Reckitt Benckiser Group PLC | 5,197,800 | | 290,718,447 |
Rio Tinto PLC | 45,550 | | 2,958,115 |
Rio Tinto PLC sponsored ADR | 3,501,000 | | 227,985,120 |
Royal Dutch Shell PLC: | | | |
Class A (United Kingdom) | 162,500 | | 5,274,678 |
Class A sponsored ADR | 4,900,000 | | 318,157,000 |
Class B ADR | 10,800,000 | | 694,656,000 |
Standard Chartered PLC: | | | |
rights 11/5/10 (a) | 12,287 | | 103,448 |
(United Kingdom) | 3,835,644 | | 110,952,977 |
TalkTalk Telecom Group PLC (a) | 20,856,732 | | 44,075,194 |
Tesco PLC | 28,030,100 | | 191,691,612 |
Vedanta Resources PLC | 1,525,000 | | 50,698,034 |
Vodafone Group PLC | 1,664,000 | | 4,548,148 |
Vodafone Group PLC sponsored ADR | 23,309,200 | | 641,236,092 |
TOTAL UNITED KINGDOM | | 6,390,356,716 |
United States of America - 6.3% |
Anadarko Petroleum Corp. | 2,715,900 | | 167,217,963 |
Apple, Inc. (a) | 700,800 | | 210,849,696 |
Avon Products, Inc. | 35,800 | | 1,090,110 |
C. R. Bard, Inc. | 1,030,000 | | 85,613,600 |
Central European Distribution Corp. (a) | 41,700 | | 1,041,249 |
CF Industries Holdings, Inc. | 899,500 | | 110,215,735 |
Chevron Corp. | 1,060,000 | | 87,566,600 |
China-Biotics, Inc. (a) | 39,200 | | 491,568 |
Citigroup, Inc. (a) | 16,600,000 | | 69,222,000 |
Corning, Inc. | 53,500 | | 977,980 |
eBay, Inc. (a) | 2,883,600 | | 85,960,116 |
First Cash Financial Services, Inc. (a) | 17,900 | | 520,353 |
Google, Inc. Class A (a) | 406,608 | | 249,246,638 |
Gran Tierra Energy, Inc. (a) | 64,500 | | 481,170 |
Hewlett-Packard Co. | 1,200,000 | | 50,472,000 |
Illumina, Inc. (a) | 1,027,800 | | 55,819,818 |
Jacobs Engineering Group, Inc. (a) | 1,150,000 | | 44,401,500 |
JPMorgan Chase & Co. | 1,605,800 | | 60,426,254 |
Common Stocks - continued |
| Shares | | Value |
United States of America - continued |
Lear Corp. (a) | 206,100 | | $ 18,219,240 |
Medco Health Solutions, Inc. (a) | 2,286,700 | | 120,120,351 |
Morgan Stanley | 2,504,100 | | 62,276,967 |
Newmont Mining Corp. | 1,000,000 | | 60,870,000 |
Philip Morris International, Inc. | 2,212,900 | | 129,454,650 |
QUALCOMM, Inc. | 22,100 | | 997,373 |
Regions Financial Corp. | 7,913,500 | | 49,855,050 |
SanDisk Corp. (a) | 2,180,900 | | 81,958,222 |
Schweitzer-Mauduit International, Inc. (e) | 1,297,914 | | 83,300,121 |
The Walt Disney Co. | 1,423,200 | | 51,391,752 |
The Western Union Co. | 56,700 | | 997,920 |
Visa, Inc. Class A | 1,400,000 | | 109,438,000 |
Wells Fargo & Co. | 6,137,200 | | 160,058,176 |
TOTAL UNITED STATES OF AMERICA | | 2,210,552,172 |
TOTAL COMMON STOCKS (Cost $26,841,115,573) | 32,884,501,265 |
Nonconvertible Preferred Stocks - 1.5% |
| | | |
Germany - 1.5% |
Bayerische Motoren Werke AG (BMW) (non-vtg.) | 800,000 | | 38,949,469 |
ProSiebenSat.1 Media AG | 5,548,800 | | 146,619,469 |
Volkswagen AG | 2,232,900 | | 335,552,622 |
TOTAL NONCONVERTIBLE PREFERRED STOCKS (Cost $305,707,723) | 521,121,560 |
Money Market Funds - 5.6% |
| Shares | | Value |
Fidelity Cash Central Fund, 0.23% (b) | 1,313,905,689 | | $ 1,313,905,689 |
Fidelity Securities Lending Cash Central Fund, 0.24% (b)(c) | 620,968,677 | | 620,968,677 |
TOTAL MONEY MARKET FUNDS (Cost $1,934,874,366) | 1,934,874,366 |
TOTAL INVESTMENT
PORTFOLIO - 101.5% (Cost $29,081,697,662) | | 35,340,497,191 |
NET OTHER ASSETS (LIABILITIES) - (1.5)% | | (521,262,073) |
NET ASSETS - 100% | $ 34,819,235,118 |
Legend |
(a) Non-income producing |
(b) Affiliated fund that is available only to investment companies and other accounts managed by Fidelity Investments. The rate quoted is the annualized seven-day yield of the fund at period end. A complete unaudited listing of the fund's holdings as of its most recent quarter end is available upon request. In addition, each Fidelity Central Fund's financial statements, which are not covered by the Fund's report of Independent Registered Public Accounting Firm, are available on the SEC's website or upon request. |
(c) Investment made with cash collateral received from securities on loan. |
(d) Security or a portion of the security is on loan at period end. |
(e) Affiliated company |
(f) Security exempt from registration under Rule 144A of the Securities Act of 1933. These securities may be resold in transactions exempt from registration, normally to qualified institutional buyers. At the end of the period, the value of these securities amounted to $9,544,006 or 0.0% of net assets. |
(g) Restricted securities - Investment in securities not registered under the Securities Act of 1933 (excluding 144A issues). At the end of the period, the value of restricted securities (excluding 144A issues) amounted to $451,860 or 0.0% of net assets. |
Additional information on each holding is as follows: |
Security | Acquisition Date | Acquisition Cost |
OZ Optics Ltd. unit | 8/18/00 | $ 1,505,520 |
Affiliated Central Funds |
Information regarding fiscal year to date income earned by the Fund from investments in Fidelity Central Funds is as follows: |
Fund | Income earned |
Fidelity Cash Central Fund | $ 1,916,208 |
Fidelity Securities Lending Cash Central Fund | 21,351,864 |
Total | $ 23,268,072 |
Other Affiliated Issuers |
An affiliated company is a company in which the Fund has ownership of at least 5% of the voting securities. Fiscal year to date transactions with companies which are or were affiliates are as follows: |
Affiliate | Value,
beginning of period | Purchases | Sales Proceeds | Dividend Income | Value,
end of
period |
Bovis Homes Group PLC | $ 49,028,663 | $ - | $ 40,862,474 | $ - | $ - |
easyJet PLC | 168,495,470 | - | 164,901,608 | - | - |
Informa PLC | 163,485,254 | 209,835 | 123,704,482 | 5,004,506 | - |
Niko Resources Ltd. | 204,266,519 | 3,831,199 | 32,663,592 | 287,709 | - |
Painted Pony Petroleum Ltd. 144A | 3,676,731 | 4,520,708 | - | - | 9,544,006 |
Painted Pony Petroleum Ltd. Class A | 3,972,148 | 15,732,670 | - | - | 21,509,462 |
Petrobank Energy & Resources Ltd. | 239,355,866 | 7,034,675 | - | - | 223,863,859 |
Pronova BioPharma ASA | 48,182,882 | 1,312,775 | 8,079,938 | - | - |
Resolution Ltd. | - | 203,988,590 | 3,235,783 | 4,279,791 | - |
Schweitzer-Mauduit International, Inc. | - | 66,984,142 | - | 319,904 | 83,300,121 |
Tecan Group AG | 67,537,277 | - | 49,592,334 | 749,837 | - |
Trican Well Service Ltd. | 81,839,590 | - | 104,622,102 | 436,015 | - |
Total | $ 1,029,840,400 | $ 303,614,594 | $ 527,662,313 | $ 11,077,762 | $ 338,217,448 |
Other Information |
The following is a summary of the inputs used, as of October 31, 2010, involving the Fund's assets and liabilities carried at fair value. The inputs or methodology used for valuing securities may not be an indication of the risk associated with investing in those securities. For more information on valuation inputs, and their aggregation into the levels used in the tables below, please refer to the Security Valuation section in the accompanying Notes to Financial Statements. |
Valuation Inputs at Reporting Date: |
Description | Total | Level 1 | Level 2 | Level 3 |
Investments in Securities: | | | | |
Equities: | | | | |
United Kingdom | $ 6,390,356,716 | $ 5,463,203,141 | $ 927,153,575 | $ - |
Japan | 4,118,120,285 | 1,480,235,031 | 2,637,885,254 | - |
Germany | 2,806,562,013 | 2,571,145,607 | 235,416,406 | - |
Switzerland | 2,678,567,949 | 2,182,630,892 | 495,937,057 | - |
France | 2,429,558,371 | 2,248,114,380 | 181,443,991 | - |
United States of America | 2,210,552,172 | 2,210,552,172 | - | - |
Canada | 1,500,196,774 | 1,499,744,914 | - | 451,860 |
Spain | 1,364,541,644 | 945,232,128 | 419,309,516 | - |
Netherlands | 1,103,151,493 | 1,010,652,643 | 92,498,850 | - |
Other | 8,804,015,408 | 7,896,535,647 | 907,479,761 | - |
Money Market Funds | 1,934,874,366 | 1,934,874,366 | - | - |
Total Investments in Securities: | $ 35,340,497,191 | $ 29,442,920,921 | $ 5,897,124,410 | $ 451,860 |
The following is a reconciliation of Investments in Securities for which Level 3 inputs were used in determining value: |
Investments in Securities: | |
Beginning Balance | $ 481,440 |
Total Realized Gain (Loss) | - |
Total Unrealized Gain (Loss) | (29,580) |
Cost of Purchases | - |
Proceeds of Sales | - |
Amortization/Accretion | - |
Transfers in to Level 3 | - |
Transfers out of Level 3 | - |
Ending Balance | $ 451,860 |
The change in unrealized gain (loss) for the period attributable to Level 3 securities held at October 31, 2010 | $ (29,580) |
The information used in the above reconciliation represents fiscal year to date activity for any Investments in Securities identified as using Level 3 inputs at either the beginning or the end of the current fiscal period. Transfers in or out of Level 3 represent the beginning value of any Security or Instrument where a change in the pricing level occurred from the beginning to the end of the period. The cost of purchases and the proceeds of sales may include securities received or delivered through corporate actions or exchanges. Realized and unrealized gains (losses) disclosed in the reconciliation are included in Net Gain (Loss) on the Fund's Statement of Operations. |
Income Tax Information |
At October 31, 2010, the Fund had a capital loss carryforward of approximately $5,177,653,127 of which $956,598,602, $3,601,913,096 and $619,141,429 will expire on October 31, 2016, 2017 and 2018, respectively. Capital loss carryforwards are only available to offset future capital gains of the Fund to the extent provided by regulations and may be limited. |
See accompanying notes which are an integral part of the financial statements.
Annual Report
Fidelity Diversified International Fund
Statement of Assets and Liabilities
| October 31, 2010 |
| | |
Assets | | |
Investment in securities, at value (including securities loaned of $599,538,721) - See accompanying schedule: Unaffiliated issuers (cost $26,810,900,728) | $ 33,067,405,377 | |
Fidelity Central Funds (cost $1,934,874,366) | 1,934,874,366 | |
Other affiliated issuers (cost $335,922,568) | 338,217,448 | |
Total Investments (cost $29,081,697,662) | | $ 35,340,497,191 |
Cash | | 1,944,256 |
Receivable for investments sold | | 152,958,867 |
Receivable for fund shares sold | | 42,373,584 |
Dividends receivable | | 93,945,387 |
Distributions receivable from
Fidelity Central Funds | | 250,116 |
Other receivables | | 3,118,617 |
Total assets | | 35,635,088,018 |
| | |
Liabilities | | |
Payable for investments purchased | $ 114,316,055 | |
Payable for fund shares redeemed | 49,570,390 | |
Accrued management fee | 19,084,476 | |
Other affiliated payables | 5,585,364 | |
Other payables and accrued
expenses | 6,327,938 | |
Collateral on securities loaned,
at value | 620,968,677 | |
Total liabilities | | 815,852,900 |
| | |
Net Assets | | $ 34,819,235,118 |
Net Assets consist of: | | |
Paid in capital | | $ 33,386,450,830 |
Undistributed net investment income | | 424,022,673 |
Accumulated undistributed net realized gain (loss) on investments and foreign currency transactions | | (5,250,875,923) |
Net unrealized appreciation (depreciation) on investments and assets and liabilities in foreign
currencies | | 6,259,637,538 |
Net Assets | | $ 34,819,235,118 |
| | |
Diversified International:
Net Asset Value, offering price and redemption price per share ($26,527,228,516 ÷ 899,570,270 shares) | | $ 29.49 |
| | |
Class K:
Net Asset Value, offering price and redemption price per share ($7,697,404,912 ÷
260,809,944 shares) | | $ 29.51 |
| | |
Class F:
Net Asset Value, offering price and redemption price per share ($594,601,690 ÷
20,144,672 shares) | | $ 29.52 |
Statement of Operations
| Year ended October 31, 2010 |
| | |
Investment Income | | |
Dividends (including $11,077,762 earned from other affiliated issuers) | | $ 865,768,030 |
Interest | | 7,798 |
Income from Fidelity Central Funds | | 23,268,072 |
Income before foreign taxes withheld | | 889,043,900 |
Less foreign taxes withheld | | (76,318,519) |
Total income | | 812,725,381 |
| | |
Expenses | | |
Management fee
Basic fee | $ 250,126,269 | |
Performance adjustment | (1,938,601) | |
Transfer agent fees | 73,940,178 | |
Accounting and security
lending fees | 2,719,020 | |
Custodian fees and expenses | 6,509,391 | |
Independent trustees' compensation | 202,342 | |
Appreciation in deferred trustee compensation account | 10 | |
Registration fees | 239,837 | |
Audit | 225,084 | |
Legal | 218,627 | |
Interest | 393 | |
Miscellaneous | 491,243 | |
Total expenses before reductions | 332,733,793 | |
Expense reductions | (6,448,403) | 326,285,390 |
Net investment income (loss) | | 486,439,991 |
Realized and Unrealized Gain (Loss) Net realized gain (loss) on: | | |
Investment securities: | | |
Unaffiliated issuers (net of foreign taxes of $1,783,507) | (337,674,020) | |
Other affiliated issuers | (213,110,117) | |
Foreign currency transactions | (11,019,334) | |
Capital gain distributions from Fidelity Central Funds | 50,714 | |
Total net realized gain (loss) | | (561,752,757) |
Change in net unrealized appreciation (depreciation) on: Investment securities (net of increase in deferred foreign taxes of $3,976,979) | 3,611,091,904 | |
Assets and liabilities in foreign currencies | 3,060,095 | |
Total change in net unrealized appreciation (depreciation) | | 3,614,151,999 |
Net gain (loss) | | 3,052,399,242 |
Net increase (decrease) in net assets resulting from operations | | $ 3,538,839,233 |
See accompanying notes which are an integral part of the financial statements.
Annual Report
Statement of Changes in Net Assets
| Year ended
October 31,
2010 | Year ended
October 31,
2009 |
Increase (Decrease) in Net Assets | | |
Operations | | |
Net investment income (loss) | $ 486,439,991 | $ 476,097,261 |
Net realized gain (loss) | (561,752,757) | (3,390,561,829) |
Change in net unrealized appreciation (depreciation) | 3,614,151,999 | 9,739,007,983 |
Net increase (decrease) in net assets resulting from operations | 3,538,839,233 | 6,824,543,415 |
Distributions to shareholders from net investment income | (474,506,693) | (412,836,673) |
Share transactions - net increase (decrease) | (3,995,252,806) | 129,291,951 |
Redemption fees | 822,251 | 1,098,454 |
Total increase (decrease) in net assets | (930,098,015) | 6,542,097,147 |
| | |
Net Assets | | |
Beginning of period | 35,749,333,133 | 29,207,235,986 |
End of period (including undistributed net investment income of $424,022,673 and undistributed net investment income of $412,089,844, respectively) | $ 34,819,235,118 | $ 35,749,333,133 |
Financial Highlights - Diversified International
Years ended October 31, | 2010 | 2009 | 2008 | 2007 | 2006 |
Selected Per-Share Data | | | | | |
Net asset value, beginning of period | $ 26.86 | $ 21.96 | $ 45.41 | $ 37.58 | $ 30.80 |
Income from Investment Operations | | | | | |
Net investment income (loss) B | .37 | .35 | .55 | .47 | .46 |
Net realized and unrealized gain (loss) | 2.61 | 4.86 | (20.96) | 10.23 | 7.33 |
Total from investment operations | 2.98 | 5.21 | (20.41) | 10.70 | 7.79 |
Distributions from net investment income | (.35) | (.31) | (.47) | (.36) | (.28) |
Distributions from net realized gain | - | - | (2.57) | (2.51) | (.73) |
Total distributions | (.35) | (.31) | (3.04) | (2.87) | (1.01) |
Redemption fees added to paid in capital B, F | - | - | - | - | - |
Net asset value, end of period | $ 29.49 | $ 26.86 | $ 21.96 | $ 45.41 | $ 37.58 |
Total Return A | 11.15% | 24.32% | (48.04)% | 30.37% | 25.89% |
Ratios to Average Net Assets C, E | | | | | |
Expenses before reductions | .98% | 1.01% | 1.04% | .93% | 1.01% |
Expenses net of fee waivers, if any | .98% | 1.01% | 1.04% | .93% | 1.01% |
Expenses net of all reductions | .96% | .99% | 1.02% | .91% | .97% |
Net investment income (loss) | 1.34% | 1.58% | 1.53% | 1.20% | 1.32% |
Supplemental Data | | | | | |
Net assets, end of period (000 omitted) | $ 26,527,229 | $ 30,998,270 | $ 28,274,961 | $ 59,929,942 | $ 43,965,189 |
Portfolio turnover rate D | 57% | 54% | 49% | 51% | 59% |
A Total returns would have been lower had certain expenses not been reduced during the periods shown.
B Calculated based on average shares outstanding during the period.
C Fees and expenses of the underlying Fidelity Central Funds are not included in the Fund's expense ratio. The Fund indirectly bears its proportionate share of the expenses of any underlying Fidelity Central Funds.
D Amount does not include the portfolio activity of any underlying Fidelity Central Funds.
E Expense ratios reflect operating expenses of the class. Expenses before reductions do not reflect amounts reimbursed by the investment adviser or reductions from brokerage service arrangements or reductions from other expense offset arrangements and do not represent the amount paid by the class during periods when reimbursements or reductions occur. Expenses net of fee waivers reflect expenses after reimbursement by the investment adviser but prior to reductions from brokerage service arrangements or other expense offset arrangements. Expenses net of all reductions represent the net expenses paid by the class.
F Amount represents less than $.01 per share.
See accompanying notes which are an integral part of the financial statements.
Annual Report
Financial Highlights - Class K
Years ended October 31, | 2010 | 2009 | 2008 G |
Selected Per-Share Data | | | |
Net asset value, beginning of period | $ 26.89 | $ 21.98 | $ 38.39 |
Income from Investment Operations | | | |
Net investment income (loss) D | .42 | .42 | .16 |
Net realized and unrealized gain (loss) | 2.61 | 4.85 | (16.57) |
Total from investment operations | 3.03 | 5.27 | (16.41) |
Distributions from net investment income | (.41) | (.36) | - |
Redemption fees added to paid in capital D,I | - | - | - |
Net asset value, end of period | $ 29.51 | $ 26.89 | $ 21.98 |
Total Return B, C | 11.33% | 24.64% | (42.75)% |
Ratios to Average Net Assets E, H | | | |
Expenses before reductions | .79% | .77% | .88% A |
Expenses net of fee waivers, if any | .79% | .77% | .88% A |
Expenses net of all reductions | .77% | .76% | .87% A |
Net investment income (loss) | 1.54% | 1.81% | 1.45% A |
Supplemental Data | | | |
Net assets, end of period (000 omitted) | $ 7,697,405 | $ 4,713,909 | $ 932,275 |
Portfolio turnover rate F | 57% | 54% | 49% |
A Annualized
B Total returns for periods of less than one year are not annualized.
C Total returns would have been lower had certain expenses not been reduced during the periods shown.
D Calculated based on average shares outstanding during the period.
E Fees and expenses of the underlying Fidelity Central Funds are not included in the Fund's expense ratio. The Fund indirectly bears its proportionate share of the expenses of any underlying Fidelity Central Funds.
F Amount does not include the portfolio activity of any underlying Fidelity Central Funds.
G For the period May 9, 2008 (commencement of sale of shares) to October 31, 2008.
H Expense ratios reflect operating expenses of the class. Expenses before reductions do not reflect amounts reimbursed by the investment adviser or reductions from brokerage service arrangements or reductions from other expense offset arrangements and do not represent the amount paid by the class during periods when reimbursements or reductions occur. Expense ratios before reductions for start-up periods may not be representative of longer-term operating periods. Expenses net of fee waivers reflect expenses after reimbursement by the investment adviser but prior to reductions from brokerage service arrangements or other expense offset arrangements. Expenses net of all reductions represent the net expenses paid by the class.
I Amount represents less than $.01 per share.
Financial Highlights - Class F
Years ended October 31, | 2010 | 2009 G |
Selected Per-Share Data | | |
Net asset value, beginning of period | $ 26.89 | $ 23.29 |
Income from Investment Operations | | |
Net investment income (loss) D | .43 | (.02) |
Net realized and unrealized gain (loss) | 2.62 | 3.62 |
Total from investment operations | 3.05 | 3.60 |
Distributions from net investment income | (.42) | - |
Redemption fees added to paid in capital D,I | - | - |
Net asset value, end of period | $ 29.52 | $ 26.89 |
Total Return B, C | 11.41% | 15.46% |
Ratios to Average Net Assets E, H | | |
Expenses before reductions | .73% | .71% A |
Expenses net of fee waivers, if any | .73% | .71% A |
Expenses net of all reductions | .72% | .70% A |
Net investment income (loss) | 1.59% | (.19)% A |
Supplemental Data | | |
Net assets, end of period (000 omitted) | $ 594,602 | $ 37,155 |
Portfolio turnover rate F | 57% | 54% |
A Annualized
B Total returns for periods of less than one year are not annualized.
C Total returns would have been lower had certain expenses not been reduced during the periods shown.
D Calculated based on average shares outstanding during the period.
E Fees and expenses of the underlying Fidelity Central Funds are not included in the Fund's expense ratio. The Fund indirectly bears its proportionate share of the expenses of any underlying Fidelity Central Funds.
F Amount does not include the portfolio activity of any underlying Fidelity Central Funds.
G For the period June 26, 2009 (commencement of sale of shares) to October 31, 2009.
H Expense ratios reflect operating expenses of the class. Expenses before reductions do not reflect amounts reimbursed by the investment adviser or reductions from brokerage service arrangements or reductions from other expense offset arrangements and do not represent the amount paid by the class during periods when reimbursements or reductions occur. Expense ratios before reductions for start-up periods may not be representative of longer-term operating periods. Expenses net of fee waivers reflect expenses after reimbursement by the investment adviser but prior to reductions from brokerage service arrangements or other expense offset arrangements. Expenses net of all reductions represent the net expenses paid by the class.
I Amount represents less than $.01 per share.
See accompanying notes which are an integral part of the financial statements.
Annual Report
Notes to Financial Statements
For the period ended October 31, 2010
1. Organization.
Fidelity Diversified International Fund (the Fund) is a fund of Fidelity Investment Trust (the Trust) and is authorized to issue an unlimited number of shares. The Trust is registered under the Investment Company Act of 1940, as amended (the 1940 Act), as an open-end management investment company organized as a Massachusetts business trust. The Fund offers Diversified International, Class K and Class F shares, each of which has equal rights as to assets and voting privileges. Each class has exclusive voting rights with respect to matters that affect that class. Class F shares of the Fund are only available for purchase by mutual funds for which Fidelity Management & Research Company (FMR) or an affiliate serves as investment manager. Investment income, realized and unrealized capital gains and losses, the common expenses of the Fund, and certain fund-level expense reductions, if any, are allocated on a pro-rata basis to each class based on the relative net assets of each class to the total net assets of the Fund. Each class differs with respect to transfer agent fees incurred. Certain expense reductions also differ by class. The Fund's investments in emerging markets can be subject to social, economic, regulatory, and political uncertainties and can be extremely volatile.
2. Investments in Fidelity Central Funds.
The Fund may invest in Fidelity Central Funds, which are open-end investment companies available only to other investment companies and accounts managed by FMR and its affiliates. The Fund's Schedule of Investments lists each of the Fidelity Central Funds held as of period end, if any, as an investment of the Fund, but does not include the underlying holdings of each Fidelity Central Fund. As an Investing Fund, the Fund indirectly bears its proportionate share of the expenses of the underlying Fidelity Central Funds.
The Money Market Central Funds seek preservation of capital and current income and are managed by Fidelity Investments Money Management, Inc. (FIMM), an affiliate of FMR.
A complete unaudited list of holdings for each Fidelity Central Fund is available upon request or at the Securities and Exchange Commission (the SEC) web site at www.sec.gov. In addition, the financial statements of the Fidelity Central Funds, which are not covered by the Fund's Report of Independent Registered Public Accounting Firm, are available on the SEC web site or upon request.
3. Significant Accounting Policies.
The financial statements have been prepared in conformity with accounting principles generally accepted in the United States of America (GAAP), which require management to make certain estimates and assumptions at the date of the financial statements. Actual results could differ from those estimates. The following summarizes the significant accounting policies of the Fund:
Security Valuation. Investments are valued as of 4:00 p.m. Eastern time on the last calendar day of the period. The Fund uses independent pricing services approved by the Board of Trustees to value its investments. When current market prices or quotations are not readily available or reliable, valuations may be determined in good faith in accordance with procedures adopted by the Board of Trustees. Factors used in determining value may include market or security specific events. The frequency with which these procedures are used cannot be predicted and they may be utilized to a significant extent. The value used for net asset value (NAV) calculation under these procedures may differ from published prices for the same securities.
The Fund categorizes the inputs to valuation techniques used to value its investments into a disclosure hierarchy consisting of three levels as shown below.
Level 1 - quoted prices in active markets for identical investments
Level 2 - other significant observable inputs (including quoted prices for similar investments, interest rates, prepayment speeds, etc.)
Level 3 - unobservable inputs (including the fund's own assumptions based on the best information available)
Changes in valuation techniques may result in transfers in or out of an assigned level within the disclosure hierarchy. The aggregate value of investments by input level, as of October 31, 2010, as well as a roll forward of Level 3 securities, is included at the end of the Fund's Schedule of Investments. Valuation techniques used to value the Fund's investments by major category are as follows.
Equity securities, including restricted securities, for which market quotations are readily available, are valued at the last reported sale price or official closing price as reported by an independent pricing service on the primary market or exchange on which they are traded and are categorized as Level 1 in the hierarchy. In the event there were no sales during the day or closing prices are not available, securities are valued at the last quoted bid price or may be valued using the last available price and are generally categorized as Level 2 in the hierarchy. For foreign equity securities, when significant market or security specific events arise, comparisons to the valuation of American Depositary Receipts (ADRs), futures contracts, Exchange-traded funds (ETFs) and certain indexes as well as quoted prices for similar securities are used and are categorized as Level 2 in the hierarchy in these circumstances. Utilizing these techniques may result in transfers between Level 1 and Level 2. For restricted equity securities and private placements where observable inputs are limited, assumptions about market activity and risk are used and are categorized as Level 3 in the hierarchy.
Annual Report
3. Significant Accounting Policies - continued
Security Valuation - continued
Investments in open-end mutual funds,including the Fidelity Central Funds, are valued at their closing net asset value each business day and are categorized as Level 1 in the hierarchy. Short-term securities with remaining maturities of sixty days or less for which quotations are not readily available are valued at amortized cost, which approximates fair value and are categorized as Level 2 in the hierarchy.
Foreign Currency. The Fund uses foreign currency contracts to facilitate transactions in foreign-denominated securities. Gains and losses from these transactions may arise from changes in the value of the foreign currency or if the counterparties do not perform under the contracts' terms.
Foreign-denominated assets, including investment securities, and liabilities are translated into U.S. dollars at the exchange rate at period end. Purchases and sales of investment securities, income and dividends received and expenses denominated in foreign currencies are translated into U.S. dollars at the exchange rate in effect on the transaction date.
The effects of exchange rate fluctuations on investments are included with the net realized and unrealized gain (loss) on investment securities. Other foreign currency transactions resulting in realized and unrealized gain (loss) are disclosed separately.
Investment Transactions and Income. For financial reporting purposes, the Fund's investment holdings and NAV include trades executed through the end of the last business day of the period. The NAV per share for processing shareholder transactions is calculated as of the close of business of the New York Stock Exchange (NYSE), normally 4:00 p.m. Eastern time and includes trades executed through the end of the prior business day. Gains and losses on securities sold are determined on the basis of identified cost and may include proceeds received from litigation. Dividend income is recorded on the ex-dividend date, except for certain dividends from foreign securities where the ex-dividend date may have passed, which are recorded as soon as the Fund is informed of the ex-dividend date. Non-cash dividends included in dividend income, if any, are recorded at the fair market value of the securities received. Distributions received on securities that represent a return of capital or capital gain are recorded as a reduction of cost of investments and/or as a realized gain. The Fund estimates the components of distributions received that may be considered return of capital distributions or capital gain distributions. Interest income and distributions from the Fidelity Central Funds are accrued as earned. Interest income includes coupon interest and amortization of premium and accretion of discount on debt securities. Investment income is recorded net of foreign taxes withheld where recovery of such taxes is uncertain.
Expenses. Most expenses of the Trust can be directly attributed to a fund. Expenses which cannot be directly attributed are apportioned amongst each fund in the Trust. Expense estimates are accrued in the period to which they relate and adjustments are made when actual amounts are known.
Deferred Trustee Compensation. Under a Deferred Compensation Plan (the Plan), independent Trustees may elect to defer receipt of a portion of their annual compensation. Deferred amounts are invested in a cross-section of Fidelity funds, are marked-to-market and remain in the Fund until distributed in accordance with the Plan. The investment of deferred amounts and the offsetting payable to the Trustees are included in the accompanying Statement of Assets and Liabilities.
Income Tax Information and Distributions to Shareholders. Each year the Fund intends to qualify as a regulated investment company, including distributing substantially all of its taxable income and realized gains under Subchapter M of the Internal Revenue Code and filing its U.S. federal tax return. As a result, no provision for income taxes is required. As of October 31, 2010, the Fund did not have any unrecognized tax benefits in the accompanying financial statements. A fund's federal tax return is subject to examination by the Internal Revenue Service (IRS) for a period of three years. Foreign taxes are provided for based on the Fund's understanding of the tax rules and rates that exist in the foreign markets in which it invests. The Fund is subject to a tax imposed on short term capital gains on securities of certain issuers domiciled in India. The Fund records an estimated deferred tax liability included in Other payables and accrued expenses in the accompanying Statement of Assets & Liabilities for net unrealized gains on these securities in an amount that would be payable if the securities were disposed of at period end.
Distributions are declared and recorded on the ex-dividend date. Income dividends and capital gain distributions are declared separately for each class. Income and capital gain distributions are determined in accordance with income tax regulations, which may differ from GAAP.
Capital accounts within the financial statements are adjusted for permanent book-tax differences. These adjustments have no impact on net assets or the results of operations. Temporary book-tax differences will reverse in a subsequent period.
Book-tax differences are primarily due to the short-term gain distributions from the Fidelity Central Funds, foreign currency transactions, certain foreign taxes, passive foreign investment companies (PFIC), deferred trustees compensation, capital loss carryforwards and losses deferred due to wash sales.
Annual Report
Notes to Financial Statements - continued
3. Significant Accounting Policies - continued
Income Tax Information and Distributions to Shareholders - continued
The federal tax cost of investment securities and unrealized appreciation (depreciation) as of period end were as follows:
Gross unrealized appreciation | $ 7,056,729,422 |
Gross unrealized depreciation | (962,448,025) |
Net unrealized appreciation (depreciation) | $ 6,094,281,397 |
| |
Tax Cost | $ 29,246,215,794 |
The tax-based components of distributable earnings as of period end were as follows:
Undistributed ordinary income | $ 515,990,332 |
Capital loss carryforward | $ (5,177,653,127) |
Net unrealized appreciation (depreciation) | $ (6,099,096,385) |
The tax character of distributions paid was as follows:
| October 31, 2010 | October 31, 2009 |
Ordinary Income | $ 474,506,693 | $ 412,836,673 |
Short-Term Trading (Redemption) Fees. Shares held by investors in the Fund less than 30 days are subject to a redemption fee equal to 1.00% of the net asset value of shares redeemed. All redemption fees, which reduce the proceeds of the shareholder redemption, are retained by the Fund and accounted for as an addition to paid in capital.
4. Operating Policies.
Restricted Securities. The Fund may invest in securities that are subject to legal or contractual restrictions on resale. These securities generally may be resold in transactions exempt from registration or to the public if the securities are registered. Disposal of these securities may involve time-consuming negotiations and expense, and prompt sale at an acceptable price may be difficult. Information regarding restricted securities is included at the end of the Fund's Schedule of Investments.
5. Purchases and Sales of Investments.
Purchases and sales of securities, other than short-term securities, aggregated $19,113,606,387 and $23,210,049,761, respectively.
6. Fees and Other Transactions with Affiliates.
Management Fee. FMR and its affiliates provide the Fund with investment management related services for which the Fund pays a monthly management fee. The management fee is the sum of an individual fund fee rate that is based on an annual rate of .45% of the Fund's average net assets and a group fee rate that averaged .26% during the period. The group fee rate is based upon the average net assets of all the mutual funds advised by FMR. The group fee rate decreases as assets under management increase and increases as assets under management decrease. In addition, the management fee is subject to a performance adjustment (up to a maximum of ±.20% of the Fund's average net assets over a 36 month performance period). The upward or downward adjustment to the management fee is based on the relative investment performance of Diversified International as compared to an appropriate benchmark index. For the period, the total annual management fee rate, including the performance adjustment, was .70% of the Fund's average net assets.
Transfer Agent Fees. Fidelity Investments Institutional Operations Company, Inc. (FIIOC), an affiliate of FMR, is the transfer, dividend disbursing and shareholder servicing agent for each class of the Fund. FIIOC receives account fees and asset-based fees that vary according to the account size and type of account of the shareholders of Diversified International. FIIOC receives an asset-based fee of Class K's average net assets. FIIOC receives no fees for providing transfer agency services to Class F. FIIOC pays for typesetting, printing and mailing of shareholder reports, except proxy statements. For the period, transfer agent fees for each class were as follows:
Annual Report
6. Fees and Other Transactions with Affiliates - continued
Transfer Agent Fees - continued
| Amount | % of
Average
Net Assets |
Diversified International | 70,681,751 | .25 |
Class K | 3,258,427 | .05 |
| $ 73,940,178 | |
Accounting and Security Lending Fees. Fidelity Service Company, Inc. (FSC), an affiliate of FMR, maintains the Fund's accounting records. The accounting fee is based on the level of average net assets for the month. Under a separate contract, FSC administers the security lending program. The security lending fee is based on the number and duration of lending transactions.
Brokerage Commissions. The Fund placed a portion of its portfolio transactions with brokerage firms which are affiliates of the investment adviser. The commissions paid to these affiliated firms were $73,316 for the period.
Interfund Lending Program. Pursuant to an Exemptive Order issued by the SEC, the Fund, along with other registered investment companies having management contracts with FMR, may participate in an interfund lending program. This program provides an alternative credit facility allowing the funds to borrow from, or lend money to, other participating affiliated funds. At period end, there were no interfund loans outstanding. The Fund's activity in this program during the period for which loans were outstanding was as follows:
Borrower or Lender | Average Daily
Loan Balance | Weighted Average
Interest Rate | Interest
Expense |
Borrower | $ 30,883,000 | .46% | $ 393 |
7. Committed Line of Credit.
The Fund participates with other funds managed by FMR or an affiliate in a $3.75 billion credit facility (the "line of credit") to be utilized for temporary or emergency purposes to fund shareholder redemptions or for other short-term liquidity purposes. The Fund has agreed to pay commitment fees on its pro-rata portion of the line of credit, which amounted to $139,855 and is reflected in Miscellaneous expenses on the Statement of Operations. During the period, there were no borrowings on this line of credit.
8. Security Lending.
The Fund lends portfolio securities through a lending agent from time to time in order to earn additional income. The lending agent may loan securities to certain qualified borrowers, including Fidelity Capital Markets (FCM), a broker dealer affiliated with the Fund. On the settlement date of the loan, the Fund receives collateral (in the form of U.S. Treasury obligations, letters of credit and/or cash) against the loaned securities and maintains collateral in an amount not less than 100% of the market value of the loaned securities during the period of the loan. The market value of the loaned securities is determined at the close of business of the Fund and any additional required collateral is delivered to the Fund on the next business day. If the borrower defaults on its obligation to return the securities loaned because of insolvency or other reasons, a fund could experience delays and costs in recovering the securities loaned or in gaining access to the collateral. Any cash collateral received is invested in the Fidelity Securities Lending Cash Central Fund. The value of loaned securities and cash collateral at period end are disclosed on the Fund's Statement of Assets and Liabilities. Security lending income represents the income earned on investing cash collateral, less rebates paid to borrowers and lending agent fees associated with the loan, plus any premium payments received for lending certain types of securities. Security lending income is presented in the Statement of Operations as a component of income from Fidelity Central Funds. Total security lending income during the period amounted to $21,351,864. During the period, there were no securities loaned to FCM.
9. Expense Reductions.
Many of the brokers with whom FMR places trades on behalf of the Fund provided services to the Fund in addition to trade execution. These services included payments of certain expenses on behalf of the Fund totaling $6,448,114 for the period. In addition, through arrangements with the Fund's custodian, credits realized as a result of uninvested cash balances were used to reduce the Fund's expenses. During the period, these credits reduced the Fund's custody expenses by $289.
Annual Report
Notes to Financial Statements - continued
10. Distributions to Shareholders.
Distributions to shareholders of each class were as follows:
Years ended October 31, | 2010 | 2009A |
From net investment income | | |
Diversified International | $ 398,456,259 | $ 394,538,470 |
Class K | 74,880,028 | 18,298,203 |
Class F | 1,170,406 | - |
Total | $ 474,506,693 | $ 412,836,673 |
A Distributions to shareholders for Class F are for the period June 26, 2009 (commencement of sale of shares) to October 31, 2009.
11. Share Transactions.
Transactions for each class of shares were as follows:
| Shares | Dollars |
Years ended October 31, | 2010 | 2009A | 2010 | 2009A |
Diversified International | | | | |
Shares sold | 179,662,935 | 266,412,212 | $ 4,893,668,837 | $ 5,884,913,394 |
Conversion to Class K B | - | (113,348,310) | - | (2,310,072,040) |
Reinvestment of distributions | 13,627,007 | 20,012,374 | 384,281,814 | 380,635,740 |
Shares redeemed | (447,584,331) | (307,025,690) | (12,092,134,122) | (6,660,643,668) |
Net increase (decrease) | (254,294,389) | (133,949,414) | $ (6,814,183,471) | $ (2,705,166,574) |
Class K | | | | |
Shares sold | 151,794,829 | 46,252,428 | $ 4,125,917,772 | $ 1,096,724,275 |
Conversion from Diversified InternationalB | - | 113,393,333 | - | 2,310,072,040 |
Reinvestment of distributions | 2,657,205 | 963,570 | 74,880,028 | 18,298,203 |
Shares redeemed | (68,937,812) | (27,732,811) | (1,889,669,527) | (629,090,058) |
Net increase (decrease) | 85,514,222 | 132,876,520 | $ 2,311,128,273 | $ 2,796,004,460 |
Class F | | | | |
Shares sold | 24,587,499 | 1,396,615 | $ 664,182,809 | $ 38,873,992 |
Reinvestment of distributions | 41,548 | - | 1,170,406 | - |
Shares redeemed | (5,866,038) | (14,952) | (157,550,823) | (419,927) |
Net increase (decrease) | 18,763,009 | 1,381,663 | $ 507,802,392 | $ 38,454,065 |
A Share transactions for Class F are for the period June 26, 2009 (commencement of sale of shares) to October 31, 2009.
B Conversion transactions for Class K and Diversified International are presented for the period November 1, 2008 through August 31, 2009.
12. Other.
The Fund's organizational documents provide former and current trustees and officers with a limited indemnification against liabilities arising in connection with the performance of their duties to the Fund. In the normal course of business, the Fund may also enter into contracts that provide general indemnifications. The Fund's maximum exposure under these arrangements is unknown as this would be dependent on future claims that may be made against the Fund. The risk of material loss from such claims is considered remote.
Annual Report
Report of Independent Registered Public Accounting Firm
To the Trustees of Fidelity Investment Trust and Shareholders of Fidelity Diversified International Fund:
We have audited the accompanying statement of assets and liabilities of Fidelity Diversified International Fund (the Fund), a fund of Fidelity Investment Trust, including the schedule of investments, as of October 31, 2010, and the related statement of operations for the year then ended, the statement of changes in net assets for each of the two years in the period then ended, and the financial highlights for each of the five years in the period then ended. These financial statements and financial highlights are the responsibility of the Fund's management. Our responsibility is to express an opinion on these financial statements and financial highlights based on our audits.
We conducted our audits in accordance with standards of the Public Company Accounting Oversight Board (United States). Those standards require that we plan and perform the audit to obtain reasonable assurance about whether the financial statements and financial highlights are free of material misstatement. The Fund is not required to have, nor were we engaged to perform, an audit of its internal control over financial reporting. Our audits included consideration of internal control over financial reporting as a basis for designing audit procedures that are appropriate in the circumstances, but not for the purpose of expressing an opinion on the effectiveness of the Fund's internal control over financial reporting. Accordingly, we express no such opinion. An audit also includes examining, on a test basis, evidence supporting the amounts and disclosures in the financial statements, assessing the accounting principles used and significant estimates made by management, as well as evaluating the overall financial statement presentation. Our procedures included confirmation of securities owned as of October 31, 2010, by correspondence with the custodians and brokers; where replies were not received from brokers, we performed other auditing procedures. We believe that our audits provide a reasonable basis for our opinion.
In our opinion, the financial statements and financial highlights referred to above present fairly, in all material respects, the financial position of Fidelity Diversified International Fund as of October 31, 2010, the results of its operations for the year then ended, the changes in its net assets for each of the two years in the period then ended, and its financial highlights for each of the five years in the period then ended, in conformity with accounting principles generally accepted in the United States of America.
/s/ Deloitte & Touche LLP
DELOITTE & TOUCHE LLP
Boston, Massachusetts
December 17, 2010
Annual Report
Fidelity International Capital Appreciation Fund
As a shareholder of the Fund, you incur two types of costs: (1) transaction costs, including redemption fees, and (2) ongoing costs, including management fees and other Fund expenses. This Example is intended to help you understand your ongoing costs (in dollars) of investing in the Fund and to compare these costs with the ongoing costs of investing in other mutual funds.
The Example is based on an investment of $1,000 invested at the beginning of the period and held for the entire period (May 1, 2010 to October 31, 2010).
Actual Expenses
The first line of the accompanying table provides information about actual account values and actual expenses. You may use the information in this line, together with the amount you invested, to estimate the expenses that you paid over the period. Simply divide your account value by $1,000.00 (for example, an $8,600 account value divided by $1,000.00 = 8.6), then multiply the result by the number in the first line under the heading entitled "Expenses Paid During Period" to estimate the expenses you paid on your account during this period. A small balance maintenance fee of $12.00 that is charged once a year may apply for certain accounts with a value of less than $2,000. This fee is not included in the table below. If it was, the estimate of expenses you paid during the period would be higher, and your ending account value lower, by this amount. In addition, the Fund, as a shareholder in the underlying Fidelity Central Funds, will indirectly bear its pro-rata share of the fees and expenses incurred by the underlying Fidelity Central Funds. These fees and expenses are not included in the Fund's annualized expense ratio used to calculate the expense estimate in the table below.
Hypothetical Example for Comparison Purposes
The second line of the accompanying table provides information about hypothetical account values and hypothetical expenses based on the Fund's actual expense ratio and an assumed rate of return of 5% per year before expenses, which is not the Fund's actual return. The hypothetical account values and expenses may not be used to estimate the actual ending account balance or expenses you paid for the period. You may use this information to compare the ongoing costs of investing in the Fund and other funds. To do so, compare this 5% hypothetical example with the 5% hypothetical examples that appear in the shareholder reports of the other funds. A small balance maintenance fee of $12.00 that is charged once a year may apply for certain accounts with a value of less than $2,000. This fee is not included in the table below. If it was, the estimate of expenses you paid during the period would be higher, and your ending account value lower, by this amount. In addition, the Fund, as a shareholder in the underlying Fidelity Central Funds, will indirectly bear its pro-rata share of the fees and expenses incurred by the underlying Fidelity Central Funds. These fees and expenses are not included in the Fund's annualized expense ratio used to calculate the expense estimate in the table below.
Please note that the expenses shown in the table are meant to highlight your ongoing costs only and do not reflect any transaction costs. Therefore, the second line of the table is useful in comparing ongoing costs only, and will not help you determine the relative total costs of owning different funds. In addition, if these transactional costs were included, your costs would have been higher.
| Annualized
Expense Ratio | Beginning
Account Value
May 1, 2010 | Ending
Account Value
October 31, 2010 | Expenses Paid
During Period*
May 1, 2010
to October 31, 2010 |
Actual | 1.08% | $ 1,000.00 | $ 1,078.60 | $ 5.66 |
Hypothetical (5% return per year before expenses) | | $ 1,000.00 | $ 1,019.76 | $ 5.50 |
* Expenses are equal to the Fund's annualized expense ratio, multiplied by the average account value over the period, multiplied by 184/365 (to reflect the one-half year period).
Annual Report
Fidelity International Capital Appreciation Fund
Performance: The Bottom Line
Average annual total return reflects the change in the value of an investment, assuming reinvestment of the fund's distributions from dividend income and capital gains (the profits earned upon the sale of securities that have grown in value, if any) and assuming a constant rate of performance each year. The $10,000 table and the fund's returns do not reflect the deduction of taxes that a shareholder would pay on fund distributions or the redemption of fund shares. During periods of reimbursement by Fidelity, a fund's total return will be greater than it would be had the reimbursement not occurred. How a fund did yesterday is no guarantee of how it will do tomorrow.
Average Annual Total Returns
Periods ended October 31, 2010 | Past 1
year | Past 5
years | Past 10 years |
Fidelity International Capital Appreciation Fund A | 19.12% | 2.78% | 3.42% |
A Prior to February 11, 2000, Fidelity International Capital Appreciation Fund operated under certain different investment policies. The fund's historical performance may not represent its current investment policies.
$10,000 Over 10 Years
Let's say hypothetically that $10,000 was invested in Fidelity International Capital Appreciation Fund on October 31, 2000. The chart shows how the value of your investment would have changed, and also shows how the MSCI ACWISM (All Country World Index) ex USA Index performed over the same period.
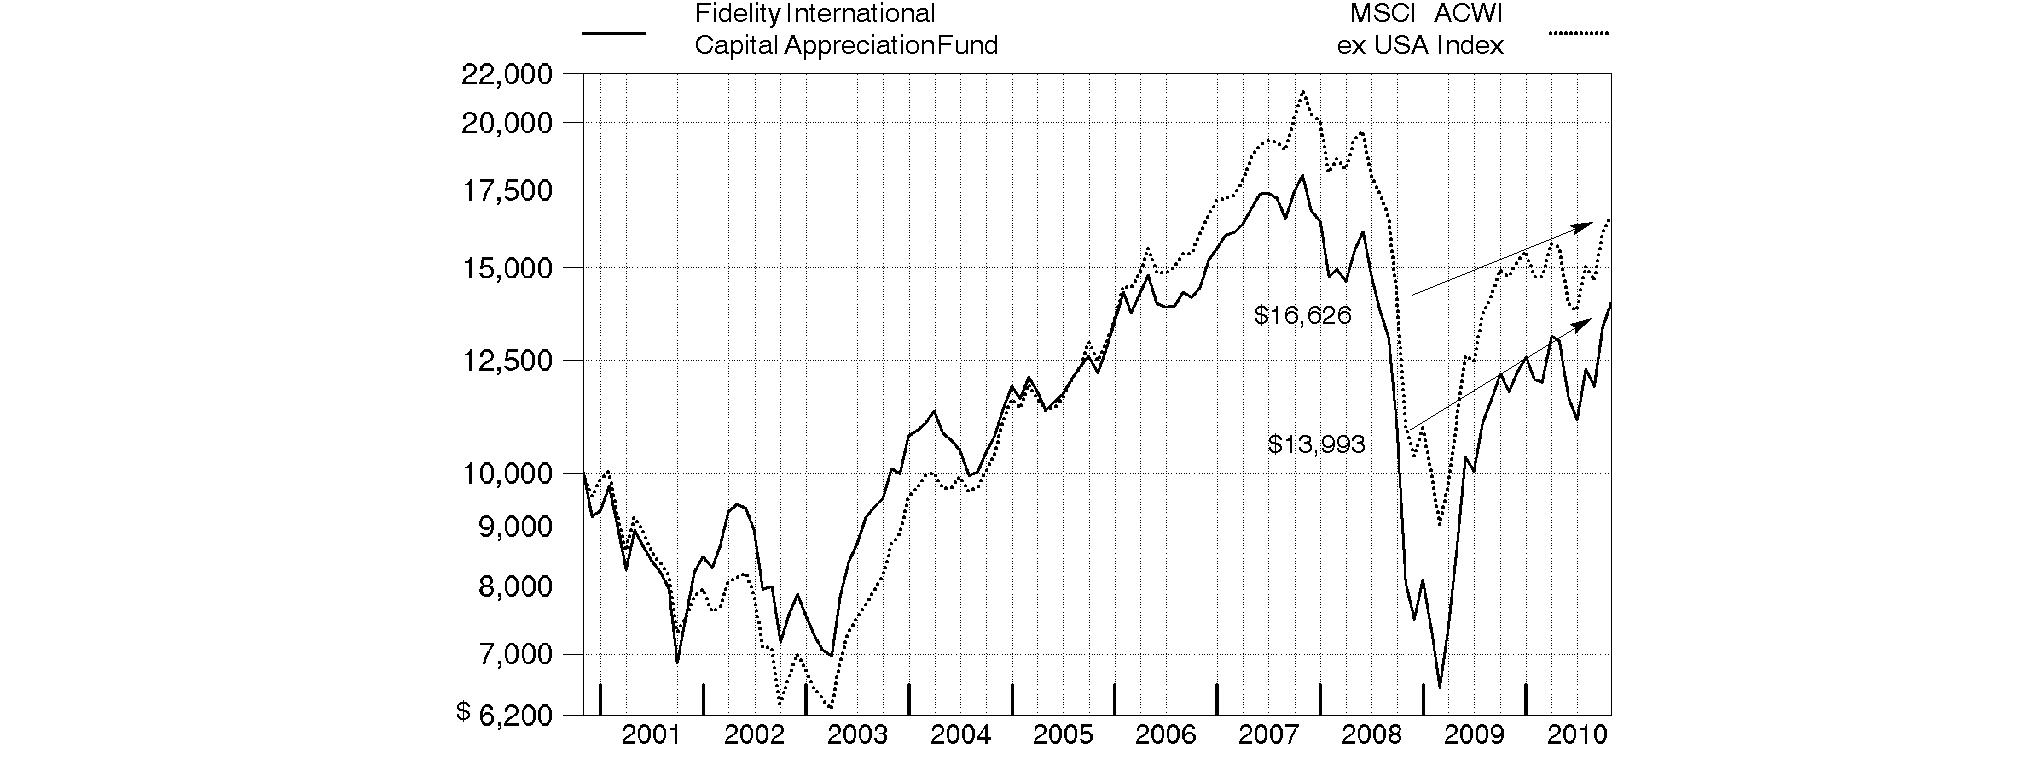
Annual Report
Fidelity International Capital Appreciation Fund
Market Recap: International stocks rode a wave of volatility similar to that of their U.S. counterparts during the 12 months ending October 31, 2010. Stocks gained modestly in the first half of the period, despite growing concerns about the European debt crisis. Sentiment turned decidedly negative in May and June, however, and the market suffered a precipitous decline. These losses were more than offset during the last four months of the period, when signs of economic growth and subsiding debt fears helped propel international stocks about 21%. For the full year, the MSCI® ACWI® (All Country World Index) ex USA Index gained 12.76%, boosted in part by a generally depreciating U.S. dollar. Within the index, Canada and emerging markets were standouts, returning 23% and 24%, respectively. Results in the latter group were led by strong-performing India, Mexico and South Africa, while China fell short of the MSCI benchmark due to cooling economic growth. The developed Asia ex Japan segment rose 16% for the period, lifted by solid results from Singapore and Hong Kong. Meanwhile, Europe rose just 9%, held back mainly by debt-riddled Spain and Italy, as well as lagging major constituent France. Japan returned only 5%, a result of that nation's continued weak economy.
Comments from Sammy Simnegar, Portfolio Manager of Fidelity® International Capital Appreciation Fund: During the year, the fund returned 19.12%, well ahead of the MSCI index. Stock selection and an overweighting in consumer discretionary added the most value, followed by favorable picks in information technology and several other sectors. Geographically, an underweighting and strong stock picks in Japan lifted performance, as did security selection in Brazil and South Korea. A meaningful stake in strong-performing U.S. stocks also helped. Grande Cache Coal and Western Coal, two Canadian producers of metallurgical coal, were key contributors to performance, along with casino operator Las Vegas Sands, minimal exposure to energy giant BP, and two LED (light-emitting diode) plays, Veeco Instruments and Rubicon Technology. Conversely, stock picking in financials and telecommunication services modestly detracted, while at the country level our positioning in Greece and Belgium was lackluster. First Uranium, a Canadian mining company with assets in South Africa, was hampered by its weak balance sheet. National Bank of Greece, Belgian insurer Ageas and OPTI Canada, a small Canadian oil company, also detracted. Many of the stocks I've mentioned were out-of-benchmark positions, and a number of them were sold during the period.
The views expressed above reflect those of the portfolio manager(s) only through the end of the period as stated on the cover of this report and do not necessarily represent the views of Fidelity or any other person in the Fidelity organization. Any such views are subject to change at any time based upon market or other conditions and Fidelity disclaims any responsibility to update such views. These views may not be relied on as investment advice and, because investment decisions for a Fidelity fund are based on numerous factors, may not be relied on as an indication of trading intent on behalf of any Fidelity fund.
Annual Report
Fidelity International Capital Appreciation Fund
Investment Changes (Unaudited)
Geographic Diversification (% of fund's net assets) |
As of October 31, 2010 |
| United Kingdom | 10.7% | |
| United States of America | 9.1% | |
| India | 8.1% | |
| Japan | 7.5% | |
| France | 7.0% | |
| Canada | 5.6% | |
| Brazil | 5.6% | |
| Cayman Islands | 4.6% | |
| China | 3.5% | |
| Other | 38.3% | |

Percentages are adjusted for the effect of futures contracts, if applicable. |
As of April 30, 2010 |
| Japan | 14.3% | |
| United Kingdom | 10.2% | |
| France | 8.5% | |
| United States of America | 7.3% | |
| Germany | 4.9% | |
| Netherlands | 4.9% | |
| Spain | 4.8% | |
| Canada | 4.8% | |
| Australia | 3.6% | |
| Other | 36.7% | |

Percentages are adjusted for the effect of futures contracts, if applicable. |
Asset Allocation |
| % of fund's
net assets | % of fund's net assets
6 months ago |
Stocks | 99.0 | 98.9 |
Bonds | 0.0 | 0.6 |
Short-Term Investments and Net Other Assets | 1.0 | 0.5 |
Top Ten Stocks as of October 31, 2010 |
| % of fund's
net assets | % of fund's net assets
6 months ago |
Royal Dutch Shell PLC Class B (United Kingdom, Oil, Gas & Consumable Fuels) | 1.8 | 1.8 |
Telefonica SA sponsored ADR (Spain, Diversified Telecommunication Services) | 1.2 | 1.1 |
Banco Santander SA sponsored ADR (Spain, Commercial Banks) | 1.1 | 1.3 |
British American Tobacco PLC (United Kingdom) (United Kingdom, Tobacco) | 1.0 | 0.9 |
BG Group PLC (United Kingdom, Oil, Gas & Consumable Fuels) | 1.0 | 0.9 |
BNP Paribas SA (France, Commercial Banks) | 0.9 | 1.0 |
Anglo American PLC (United Kingdom) (United Kingdom, Metals & Mining) | 0.9 | 0.9 |
Daimler AG (Germany) (Germany, Automobiles) | 0.8 | 0.8 |
Standard Chartered PLC (United Kingdom) (United Kingdom, Commercial Banks) | 0.9 | 0.0 |
Itau Unibanco Banco Multiplo SA ADR (Brazil, Commercial Banks) | 0.8 | 0.0 |
| 10.4 | |
Market Sectors as of October 31, 2010 |
| % of fund's
net assets | % of fund's net assets
6 months ago |
Consumer Discretionary | 21.9 | 12.2 |
Financials | 21.8 | 24.6 |
Materials | 12.1 | 9.6 |
Consumer Staples | 11.1 | 8.9 |
Information Technology | 9.1 | 8.3 |
Industrials | 9.0 | 12.3 |
Energy | 7.2 | 8.7 |
Telecommunication Services | 4.0 | 4.9 |
Health Care | 2.3 | 5.7 |
Utilities | 0.5 | 4.3 |
Annual Report
Fidelity International Capital Appreciation Fund
Investments October 31, 2010
Showing Percentage of Net Assets
Common Stocks - 97.8% |
| Shares | | Value |
Australia - 1.7% |
Fortescue Metals Group Ltd. (a) | 531,427 | | $ 3,253,828 |
JB Hi-Fi Ltd. (d) | 156,362 | | 3,045,219 |
Newcrest Mining Ltd. | 108,241 | | 4,237,290 |
TOTAL AUSTRALIA | | 10,536,337 |
Austria - 0.5% |
Erste Bank AG | 76,500 | | 3,452,041 |
Bailiwick of Jersey - 0.5% |
Randgold Resources Ltd. sponsored ADR | 37,067 | | 3,481,333 |
Belgium - 1.3% |
Anheuser-Busch InBev SA NV | 75,516 | | 4,732,131 |
KBC Groupe SA (a) | 75,925 | | 3,301,961 |
TOTAL BELGIUM | | 8,034,092 |
Bermuda - 1.1% |
China Yurun Food Group Ltd. | 800,000 | | 3,111,756 |
Petra Diamonds Ltd. (a) | 2,430,100 | | 3,533,247 |
TOTAL BERMUDA | | 6,645,003 |
Brazil - 5.6% |
Anhanguera Educacional Participacoes SA unit | 177,410 | | 3,514,412 |
Banco do Brasil SA | 181,000 | | 3,521,691 |
BR Malls Participacoes SA | 328,800 | | 3,140,724 |
Cia Hering SA | 60,000 | | 2,953,797 |
Iguatemi Empresa de Shopping Centers SA | 130,900 | | 3,054,744 |
Itau Unibanco Banco Multiplo SA ADR (a)(e) | 217,400 | | 5,339,344 |
Lojas Renner SA | 86,100 | | 3,401,082 |
Mills Estruturas e Servicos de Engenharia SA (a) | 292,900 | | 3,534,703 |
Natura Cosmeticos SA | 116,200 | | 3,326,440 |
TIM Participacoes SA sponsored ADR (non-vtg.) | 98,034 | | 3,162,577 |
TOTAL BRAZIL | | 34,949,514 |
Canada - 5.6% |
Cline Mining Corp. (a) | 488,500 | | 1,288,425 |
Cline Mining Corp. (a)(e)(f) | 601,400 | | 1,586,201 |
Consolidated Thompson Iron Mines Ltd. (a) | 321,600 | | 3,115,411 |
Goldcorp, Inc. | 101,300 | | 4,523,191 |
Grande Cache Coal Corp. (a) | 445,000 | | 3,054,221 |
Niko Resources Ltd. | 33,700 | | 3,215,031 |
Petrobank Energy & Resources Ltd. (a) | 84,700 | | 3,370,892 |
Suncor Energy, Inc. | 156,200 | | 5,005,016 |
Teck Resources Ltd. Class B (sub. vtg.) | 87,100 | | 3,894,264 |
Uranium One, Inc. (a) | 749,100 | | 3,062,797 |
Western Coal Corp. (a) | 429,500 | | 2,905,726 |
TOTAL CANADA | | 35,021,175 |
|
| Shares | | Value |
Cayman Islands - 4.6% |
Belle International Holdings Ltd. | 1,803,000 | | $ 3,256,507 |
Bosideng International Holdings Ltd. | 6,428,000 | | 3,250,800 |
Ctrip.com International Ltd. sponsored ADR (a) | 64,245 | | 3,345,237 |
Hengan International Group Co. Ltd. | 359,500 | | 3,385,712 |
Hengdeli Holdings Ltd. | 5,984,000 | | 3,319,619 |
Kingdee International Software Group Co. Ltd. | 5,506,000 | | 2,905,279 |
Maoye International Holdings Ltd. (d) | 6,678,000 | | 2,877,538 |
Shenguan Holdings Group Ltd. | 2,362,000 | | 3,077,723 |
Trina Solar Ltd. ADR (a)(d) | 120,120 | | 3,214,411 |
TOTAL CAYMAN ISLANDS | | 28,632,826 |
China - 3.5% |
Agricultural Bank of China (H Shares) | 6,840,000 | | 3,609,173 |
Baidu.com, Inc. sponsored ADR (a) | 27,700 | | 3,047,277 |
China Life Insurance Co. Ltd. (H Shares) | 942,000 | | 4,141,302 |
Digital China Holdings Ltd. (H Shares) | 774,000 | | 1,397,968 |
Golden Eagle Retail Group Ltd. (H Shares) | 1,262,000 | | 3,353,936 |
Shandong Weigao Group Medical Polymer Co. Ltd. (H Shares) | 1,240,000 | | 3,287,470 |
Tingyi (Cayman Islands) Holding Corp. | 1,238,000 | | 3,370,011 |
TOTAL CHINA | | 22,207,137 |
Cyprus - 0.5% |
AFI Development PLC: | | | |
(B Shares) (a) | 2,086,976 | | 2,332,196 |
GDR (Reg. S) | 647,076 | | 763,550 |
TOTAL CYPRUS | | 3,095,746 |
Denmark - 1.8% |
Carlsberg AS Series B | 31,900 | | 3,488,160 |
Novo Nordisk AS Series B sponsored ADR | 47,400 | | 4,967,520 |
Pandora A/S | 65,000 | | 3,153,515 |
TOTAL DENMARK | | 11,609,195 |
France - 7.0% |
Atos Origin SA (a) | 62,652 | | 2,896,460 |
BNP Paribas SA | 78,491 | | 5,739,317 |
Carrefour SA | 81,262 | | 4,384,933 |
Christian Dior SA | 24,400 | | 3,529,246 |
Credit Agricole SA | 224,700 | | 3,681,558 |
Edenred (a) | 154,200 | | 3,229,152 |
Iliad Group SA | 28,014 | | 3,153,489 |
LVMH Moet Hennessy - Louis Vuitton | 29,941 | | 4,691,074 |
PPR SA | 21,600 | | 3,540,517 |
Schneider Electric SA | 31,632 | | 4,489,463 |
Societe Generale Series A | 75,869 | | 4,542,060 |
TOTAL FRANCE | | 43,877,269 |
Germany - 2.7% |
Bayerische Motoren Werke AG (BMW) | 59,620 | | 4,273,179 |
Common Stocks - continued |
| Shares | | Value |
Germany - continued |
Daimler AG (Germany) (a) | 82,599 | | $ 5,451,243 |
HeidelbergCement AG | 69,288 | | 3,623,599 |
MAN SE | 33,088 | | 3,637,184 |
TOTAL GERMANY | | 16,985,205 |
Hong Kong - 1.2% |
AIA Group Ltd. | 328,800 | | 977,757 |
China Unicom (Hong Kong) Ltd. sponsored ADR | 233,200 | | 3,264,800 |
Emperor Watch & Jewellery Ltd. | 22,770,000 | | 3,260,726 |
TOTAL HONG KONG | | 7,503,283 |
India - 8.1% |
Adani Enterprises Ltd. | 209,230 | | 3,325,258 |
Asian Paints India Ltd. | 50,045 | | 3,034,596 |
Bank of Baroda | 134,838 | | 3,199,223 |
Crompton Greaves Ltd. | 426,240 | | 3,057,485 |
Gitanjali Gems Ltd. | 497,354 | | 3,326,353 |
Housing Development Finance Corp. Ltd. | 230,367 | | 3,574,132 |
INFO Edge India Ltd. | 205,665 | | 3,156,778 |
Infrastructure Development Finance Co. Ltd. | 692,917 | | 3,127,311 |
ITC Ltd. | 841,795 | | 3,251,332 |
Jain Irrigation Systems Ltd. | 641,145 | | 3,355,796 |
LIC Housing Finance Ltd. | 95,867 | | 2,899,369 |
Rural Electrification Corp. Ltd. | 367,850 | | 3,075,998 |
Sun TV Ltd. | 268,262 | | 3,021,844 |
Titan Industries Ltd. | 39,088 | | 3,132,463 |
United Spirits Ltd. | 83,256 | | 2,808,352 |
Voltas Ltd. | 584,504 | | 3,233,398 |
TOTAL INDIA | | 50,579,688 |
Indonesia - 1.1% |
PT Bank Rakyat Indonesia Tbk | 2,692,500 | | 3,434,346 |
PT Mayora Indah Tbk | 306,000 | | 412,565 |
PT Mitra Adiperkasa Tbk | 11,656,000 | | 3,325,625 |
TOTAL INDONESIA | | 7,172,536 |
Italy - 0.6% |
Saipem SpA | 82,303 | | 3,656,640 |
Japan - 7.5% |
Canon, Inc. sponsored ADR (d) | 109,200 | | 5,023,200 |
eAccess Ltd. | 4,117 | | 3,003,205 |
Fanuc Ltd. | 29,000 | | 4,198,320 |
Itochu Corp. | 398,700 | | 3,494,320 |
Komatsu Ltd. | 176,500 | | 4,313,913 |
Marubeni Corp. | 566,000 | | 3,555,565 |
Mitsubishi Corp. | 180,300 | | 4,330,748 |
Mitsui & Co. Ltd. | 272,500 | | 4,285,719 |
Nitori Holdings Co. Ltd. | 40,250 | | 3,541,320 |
ORIX Corp. | 41,210 | | 3,758,934 |
|
| Shares | | Value |
Rakuten, Inc. | 4,704 | | $ 3,624,307 |
SOFTBANK CORP. | 120,400 | | 3,866,649 |
TOTAL JAPAN | | 46,996,200 |
Korea (South) - 1.2% |
Hyundai Motor Co. | 28,116 | | 4,250,529 |
Lock & Lock Co. Ltd. | 94,190 | | 3,115,934 |
TOTAL KOREA (SOUTH) | | 7,366,463 |
Malaysia - 1.1% |
Genting Bhd | 1,022,300 | | 3,430,669 |
QSR Brands Bhd | 1,944,500 | | 3,300,212 |
TOTAL MALAYSIA | | 6,730,881 |
Mexico - 1.8% |
Fomento Economico Mexicano SAB de CV sponsored ADR | 64,300 | | 3,530,713 |
Grupo Mexico SA de CV Series B | 1,124,600 | | 3,697,826 |
Wal-Mart de Mexico SA de CV Series V | 1,429,300 | | 3,909,296 |
TOTAL MEXICO | | 11,137,835 |
Netherlands - 3.1% |
ASM International NV (Netherlands) (a) | 123,300 | | 3,146,517 |
ING Groep NV sponsored ADR (a) | 430,996 | | 4,646,137 |
Koninklijke KPN NV | 259,324 | | 4,330,037 |
Koninklijke Philips Electronics NV | 140,715 | | 4,291,056 |
X5 Retail Group NV GDR (Reg. S) (a) | 74,400 | | 3,117,360 |
TOTAL NETHERLANDS | | 19,531,107 |
Nigeria - 0.5% |
Guaranty Trust Bank PLC GDR (Reg. S) | 449,600 | | 3,264,096 |
Norway - 0.5% |
Aker Solutions ASA | 213,200 | | 3,245,685 |
Qatar - 0.5% |
Commercial Bank of Qatar GDR (Reg. S) | 637,519 | | 2,921,218 |
Russia - 3.2% |
LSR Group OJSC GDR (Reg. S) (a) | 358,100 | | 3,043,850 |
Magnit OJSC GDR (Reg. S) | 131,300 | | 3,510,962 |
Mechel Steel Group OAO sponsored ADR (a) | 382,700 | | 3,015,676 |
OAO NOVATEK GDR | 36,700 | | 3,510,355 |
Sberbank (Savings Bank of the Russian Federation) GDR | 11,020 | | 4,140,120 |
TNK-BP Holding (a) | 1,503,400 | | 3,074,453 |
TOTAL RUSSIA | | 20,295,416 |
South Africa - 2.8% |
AngloGold Ashanti Ltd. sponsored ADR | 84,100 | | 3,961,951 |
Clicks Group Ltd. | 461,685 | | 3,011,971 |
Mr Price Group Ltd. | 345,682 | | 3,141,465 |
Naspers Ltd. Class N | 75,900 | | 3,985,345 |
Shoprite Holdings Ltd. | 226,300 | | 3,198,867 |
TOTAL SOUTH AFRICA | | 17,299,599 |
Common Stocks - continued |
| Shares | | Value |
Spain - 2.9% |
Banco Santander SA sponsored ADR | 560,776 | | $ 7,183,541 |
Inditex SA (d) | 45,792 | | 3,823,674 |
Telefonica SA sponsored ADR | 90,600 | | 7,351,284 |
TOTAL SPAIN | | 18,358,499 |
Sweden - 1.7% |
Elekta AB (B Shares) | 82,693 | | 3,128,710 |
EnergyO Solutions AB (a) | 501,739 | | 3,341,623 |
H&M Hennes & Mauritz AB (B Shares) | 128,164 | | 4,515,356 |
TOTAL SWEDEN | | 10,985,689 |
Switzerland - 3.1% |
Compagnie Financiere Richemont SA Series A | 85,439 | | 4,260,015 |
Credit Suisse Group sponsored ADR (d) | 120,600 | | 5,004,900 |
Dufry AG (a) | 27,660 | | 3,211,803 |
Lonza Group AG | 36,101 | | 3,159,548 |
The Swatch Group AG (Bearer) | 9,700 | | 3,706,172 |
TOTAL SWITZERLAND | | 19,342,438 |
Taiwan - 1.1% |
HTC Corp. | 167,800 | | 3,788,590 |
Ruentex Development Co. Ltd. | 1,944,000 | | 3,226,767 |
TOTAL TAIWAN | | 7,015,357 |
Turkey - 0.6% |
Turkiye Garanti Bankasi AS | 571,000 | | 3,503,312 |
United Kingdom - 10.7% |
Anglo American PLC (United Kingdom) | 121,100 | | 5,642,112 |
Associated British Foods PLC | 193,100 | | 3,239,158 |
Barclays PLC Sponsored ADR (d) | 291,870 | | 5,151,506 |
BG Group PLC | 308,729 | | 6,012,230 |
British American Tobacco PLC (United Kingdom) | 159,600 | | 6,079,407 |
Britvic PLC | 433,300 | | 3,348,877 |
Burberry Group PLC | 205,500 | | 3,354,974 |
Imperial Tobacco Group PLC | 138,474 | | 4,434,904 |
Lloyds Banking Group PLC (a) | 4,749,800 | | 5,219,963 |
Royal Dutch Shell PLC Class B | 353,007 | | 11,295,382 |
Standard Chartered PLC: | | | |
rights 11/5/10 (a) | 23,311 | | 196,262 |
(United Kingdom) | 186,495 | | 5,394,707 |
Vedanta Resources PLC | 102,300 | | 3,400,924 |
Xstrata PLC | 236,488 | | 4,582,665 |
TOTAL UNITED KINGDOM | | 67,353,071 |
United States of America - 8.1% |
Apple, Inc. (a) | 9,945 | | 2,992,152 |
AsiaInfo Holdings, Inc. (a)(d) | 146,400 | | 3,253,008 |
Citigroup, Inc. (a) | 725,600 | | 3,025,752 |
First Cash Financial Services, Inc. (a) | 116,634 | | 3,390,550 |
|
| Shares | | Value |
Google, Inc. Class A (a) | 5,200 | | $ 3,187,548 |
JPMorgan Chase & Co. | 83,294 | | 3,134,353 |
Juniper Networks, Inc. (a) | 102,100 | | 3,307,019 |
Las Vegas Sands Corp. (a)(d) | 67,700 | | 3,106,076 |
MasterCard, Inc. Class A | 12,660 | | 3,039,160 |
Mercadolibre, Inc. (a)(d) | 48,900 | | 3,233,757 |
Morgan Stanley | 132,200 | | 3,287,814 |
Motorola, Inc. (a) | 356,000 | | 2,901,400 |
Tiffany & Co., Inc. | 60,900 | | 3,227,700 |
Visa, Inc. Class A | 37,860 | | 2,959,516 |
Walter Energy, Inc. | 38,300 | | 3,368,868 |
Wells Fargo & Co. | 131,452 | | 3,428,268 |
TOTAL UNITED STATES OF AMERICA | | 50,842,941 |
TOTAL COMMON STOCKS (Cost $540,025,148) | 613,628,827 |
Nonconvertible Preferred Stocks - 1.2% |
| | | |
Germany - 0.7% |
Volkswagen AG | 28,600 | | 4,297,911 |
Italy - 0.5% |
Fiat SpA (Risparmio Shares) | 289,900 | | 3,406,556 |
TOTAL NONCONVERTIBLE PREFERRED STOCKS (Cost $5,356,926) | 7,704,467 |
Money Market Funds - 4.3% |
| | | |
Fidelity Cash Central Fund, 0.23% (b) | 10,533,368 | | 10,533,368 |
Fidelity Securities Lending Cash Central Fund, 0.24% (b)(c) | 16,171,726 | | 16,171,726 |
TOTAL MONEY MARKET FUNDS (Cost $26,705,094) | 26,705,094 |
TOTAL INVESTMENT PORTFOLIO - 103.3% (Cost $572,087,168) | 648,038,388 |
NET OTHER ASSETS (LIABILITIES) - (3.3)% | | (20,909,873) |
NET ASSETS - 100% | $ 627,128,515 |
Legend |
(a) Non-income producing |
(b) Affiliated fund that is available only to investment companies and other accounts managed by Fidelity Investments. The rate quoted is the annualized seven-day yield of the fund at period end. A complete unaudited listing of the fund's holdings as of its most recent quarter end is available upon request. In addition, each Fidelity Central Fund's financial statements, which are not covered by the Fund's report of Independent Registered Public Accounting Firm, are available on the SEC's website or upon request. |
(c) Investment made with cash collateral received from securities on loan. |
(d) Security or a portion of the security is on loan at period end. |
(e) Security exempt from registration under Rule 144A of the Securities Act of 1933. These securities may be resold in transactions exempt from registration, normally to qualified institutional buyers. At the end of the period, the value of these securities amounted to $6,925,545 or 1.1% of net assets. |
(f) Security or a portion of the security purchased on a delayed delivery or when-issued basis. |
Affiliated Central Funds |
Information regarding fiscal year to date income earned by the Fund from investments in Fidelity Central Funds is as follows: |
Fund | Income earned |
Fidelity Cash Central Fund | $ 8,477 |
Fidelity Securities Lending Cash Central Fund | 331,605 |
Total | $ 340,082 |
Other Information |
The following is a summary of the inputs used, as of October 31, 2010, involving the Fund's assets and liabilities carried at fair value. The inputs or methodology used for valuing securities may not be an indication of the risk associated with investing in those securities. For more information on valuation inputs, and their aggregation into the levels used in the table below, please refer to the Security Valuation section in the accompanying Notes to Financial Statements. |
Valuation Inputs at Reporting Date: |
Description | Total | Level 1 | Level 2 | Level 3 |
Investments in Securities: | | | | |
Equities: | | | | |
United Kingdom | $ 67,353,071 | $ 44,758,319 | $ 22,594,752 | $ - |
United States of America | 50,842,941 | 50,842,941 | - | - |
India | 50,579,688 | 47,380,465 | 3,199,223 | - |
Japan | 46,996,200 | 18,950,966 | 28,045,234 | - |
France | 43,877,269 | 43,877,269 | - | - |
Canada | 35,021,175 | 35,021,175 | - | - |
Brazil | 34,949,514 | 34,949,514 | - | - |
Cayman Islands | 28,632,826 | 28,632,826 | - | - |
China | 22,207,137 | 18,065,835 | 4,141,302 | - |
Other | 240,873,473 | 236,582,417 | 4,291,056 | - |
Money Market Funds | 26,705,094 | 26,705,094 | - | - |
Total Investments in Securities: | $ 648,038,388 | $ 585,766,821 | $ 62,271,567 | $ - |
Income Tax Information |
At October 31, 2010, the Fund had a capital loss carryforward of approximately $156,762,594 of which $128,288,484 and $28,474,110 will expire on October 31, 2016 and 2017, respectively. Capital loss carryforwards are only available to offset future capital gains of the Fund to the extent provided by regulations and may be limited. |
See accompanying notes which are an integral part of the financial statements.
Annual Report
Fidelity International Capital Appreciation Fund
Statement of Assets and Liabilities
| October 31, 2010 |
| | |
Assets | | |
Investment in securities, at value (including securities loaned of $15,506,518) - See accompanying schedule: Unaffiliated issuers (cost $545,382,074) | $ 621,333,294 | |
Fidelity Central Funds (cost $26,705,094) | 26,705,094 | |
Total Investments (cost $572,087,168) | | $ 648,038,388 |
Foreign currency held at value (cost $945,043) | | 943,855 |
Receivable for investments sold | | 18,588,607 |
Receivable for fund shares sold | | 1,026,662 |
Dividends receivable | | 1,798,203 |
Distributions receivable from Fidelity Central Funds | | 7,297 |
Other receivables | | 676,315 |
Total assets | | 671,079,327 |
| | |
Liabilities | | |
Payable for investments purchased
Regular delivery | $ 24,356,108 | |
Delayed delivery | 1,149,848 | |
Payable for fund shares redeemed | 680,693 | |
Accrued management fee | 362,432 | |
Other affiliated payables | 169,314 | |
Other payables and accrued expenses | 1,060,691 | |
Collateral on securities loaned, at value | 16,171,726 | |
Total liabilities | | 43,950,812 |
| | |
Net Assets | | $ 627,128,515 |
Net Assets consist of: | | |
Paid in capital | | $ 710,214,127 |
Undistributed net investment income | | 5,819,595 |
Accumulated undistributed net realized gain (loss) on investments and foreign currency transactions | | (163,893,201) |
Net unrealized appreciation (depreciation) on investments and assets and liabilities in foreign currencies | | 74,987,994 |
Net Assets, for 49,656,848 shares outstanding | | $ 627,128,515 |
Net Asset Value, offering price and redemption price per share ($627,128,515 ÷ 49,656,848 shares) | | $ 12.63 |
Statement of Operations
| Year ended October 31, 2010 |
| | |
Investment Income | | |
Dividends | | $ 11,204,593 |
Interest | | 79,017 |
Income from Fidelity Central Funds | | 340,082 |
Income before foreign taxes withheld | | 11,623,692 |
Less foreign taxes withheld | | (975,741) |
Total income | | 10,647,951 |
| | |
Expenses | | |
Management fee
Basic fee | $ 3,882,561 | |
Performance adjustment | (613,211) | |
Transfer agent fees | 1,659,069 | |
Accounting and security lending fees | 284,781 | |
Custodian fees and expenses | 354,030 | |
Independent trustees' compensation | 3,091 | |
Registration fees | 47,664 | |
Audit | 82,538 | |
Legal | 2,473 | |
Interest | 6,469 | |
Miscellaneous | 6,107 | |
Total expenses before reductions | 5,715,572 | |
Expense reductions | (936,551) | 4,779,021 |
Net investment income (loss) | | 5,868,930 |
Realized and Unrealized Gain (Loss) Net realized gain (loss) on: | | |
Investment securities: | | |
Unaffiliated issuers (net of foreign taxes of $254,279) | 34,708,994 | |
Foreign currency transactions | (2,486,377) | |
Capital gain distributions from Fidelity Central Funds | 1,139 | |
Total net realized gain (loss) | | 32,223,756 |
Change in net unrealized appreciation (depreciation) on: Investment securities (net of increase in deferred foreign taxes of $852,962) | 58,822,371 | |
Assets and liabilities in foreign currencies | 27,496 | |
Total change in net unrealized appreciation (depreciation) | | 58,849,867 |
Net gain (loss) | | 91,073,623 |
Net increase (decrease) in net assets resulting from operations | | $ 96,942,553 |
See accompanying notes which are an integral part of the financial statements.
Annual Report
Statement of Changes in Net Assets
| Year ended
October 31,
2010 | Year ended
October 31,
2009 |
Increase (Decrease) in Net Assets | | |
Operations | | |
Net investment income (loss) | $ 5,868,930 | $ 3,952,683 |
Net realized gain (loss) | 32,223,756 | (28,330,147) |
Change in net unrealized appreciation (depreciation) | 58,849,867 | 121,858,369 |
Net increase (decrease) in net assets resulting from operations | 96,942,553 | 97,480,905 |
Distributions to shareholders from net investment income | (3,188,361) | (813,634) |
Distributions to shareholders from net realized gain | (5,465,762) | - |
Total distributions | (8,654,123) | (813,634) |
Share transactions
Proceeds from sales of shares | 275,756,138 | 231,674,751 |
Reinvestment of distributions | 8,469,995 | 789,571 |
Cost of shares redeemed | (201,747,591) | (77,561,298) |
Net increase (decrease) in net assets resulting from share transactions | 82,478,542 | 154,903,024 |
Redemption fees | 31,259 | 16,981 |
Total increase (decrease) in net assets | 170,798,231 | 251,587,276 |
| | |
Net Assets | | |
Beginning of period | 456,330,284 | 204,743,008 |
End of period (including undistributed net investment income of $5,819,595 and undistributed net investment income of $3,139,027, respectively) | $ 627,128,515 | $ 456,330,284 |
Other Information Shares | | |
Sold | 24,602,735 | 23,747,061 |
Issued in reinvestment of distributions | 746,913 | 121,286 |
Redeemed | (18,030,644) | (9,131,697) |
Net increase (decrease) | 7,319,004 | 14,736,650 |
Financial Highlights
Years ended October 31, | 2010 | 2009 | 2008 | 2007 | 2006 |
Selected Per-Share Data | | | | | |
Net asset value, beginning of period | $ 10.78 | $ 7.42 | $ 19.30 | $ 18.14 | $ 17.19 |
Income from Investment Operations | | | | | |
Net investment income (loss)B | .12 | .13 | .19 | .20 | .24 |
Net realized and unrealized gain (loss) | 1.92 | 3.26 | (9.54) | 3.80 | 2.70 |
Total from investment operations | 2.04 | 3.39 | (9.35) | 4.00 | 2.94 |
Distributions from net investment income | (.07) | (.03) | (.14) | (.20) | (.23) |
Distributions from net realized gain | (.12) | - | (2.39) | (2.64) | (1.77) |
Total distributions | (.19) | (.03) | (2.53) | (2.84) | (2.00) |
Redemption fees added to paid in capitalB | -F | -F | -F | -F | .01 |
Net asset value, end of period | $ 12.63 | $ 10.78 | $ 7.42 | $ 19.30 | $ 18.14 |
Total ReturnA | 19.12% | 45.95% | (55.30)% | 24.81% | 18.26% |
Ratios to Average Net AssetsC,E | | | | | |
Expenses before reductions | 1.04% | .84% | .89% | .85% | .87% |
Expenses net of fee waivers, if any | 1.04% | .84% | .89% | .85% | .87% |
Expenses net of all reductions | .87% | .72% | .72% | .79% | .75% |
Net investment income (loss) | 1.07% | 1.49% | 1.39% | 1.11% | 1.36% |
Supplemental Data | | | | | |
Net assets, end of period (000 omitted) | $ 627,129 | $ 456,330 | $ 204,743 | $ 747,095 | $ 476,147 |
Portfolio turnover rateD | 480% | 387% | 387% | 138% | 176% |
A Total returns would have been lower had certain expenses not been reduced during the periods shown.
B Calculated based on average shares outstanding during the period.
C Fees and expenses of the underlying Fidelity Central Funds are not included in the Fund's expense ratio. The Fund indirectly bears its proportionate share of the expenses of any underlying Fidelity Central Funds.
D Amount does not include the portfolio activity of any underlying Fidelity Central Funds.
E Expense ratios reflect operating expenses of the Fund. Expenses before reductions do not reflect amounts reimbursed by the investment adviser or reductions from brokerage service arrangements or reductions from other expense offset arrangements and do not represent the amount paid by the Fund during periods when reimbursements or reductions occur. Expenses net of fee waivers reflect expenses after reimbursement by the investment adviser but prior to reductions from brokerage service arrangements or other expense offset arrangements. Expenses net of all reductions represent the net expenses paid by the Fund.
F Amount represents less than $.01 per share.
See accompanying notes which are an integral part of the financial statements.
Annual Report
Notes to Financial Statements
For the period ended October 31, 2010
1. Organization.
Fidelity International Capital Appreciation Fund (the Fund) is a fund of Fidelity Investment Trust (the Trust) and is authorized to issue an unlimited number of shares. The Trust is registered under the Investment Company Act of 1940, as amended (the 1940 Act), as an open-end management investment company organized as a Massachusetts business trust. The Fund's investments in emerging markets can be subject to social, economic, regulatory, and political uncertainties and can be extremely volatile.
2. Investments in Fidelity Central Funds.
The Fund may invest in Fidelity Central Funds, which are open-end investment companies available only to other investment companies and accounts managed by Fidelity Management & Research Company (FMR) and its affiliates. The Fund's Schedule of Investments lists each of the Fidelity Central Funds held as of period end, if any, as an investment of the Fund, but does not include the underlying holdings of each Fidelity Central Fund. As an Investing Fund, the Fund indirectly bears its proportionate share of the expenses of the underlying Fidelity Central Funds.
The Money Market Central Funds seek preservation of capital and current income and are managed by Fidelity Investments Money Management, Inc. (FIMM), an affiliate of FMR.
A complete unaudited list of holdings for each Fidelity Central Fund is available upon request or at the Securities and Exchange Commission (the SEC) web site at www.sec.gov. In addition, the financial statements of the Fidelity Central Funds, which are not covered by the Fund's Report of Independent Registered Public Accounting Firm, are available on the SEC web site or upon request.
3. Significant Accounting Policies.
The financial statements have been prepared in conformity with accounting principles generally accepted in the United States of America (GAAP), which require management to make certain estimates and assumptions at the date of the financial statements. Actual results could differ from those estimates. The following summarizes the significant accounting policies of the Fund:
Security Valuation. Investments are valued as of 4:00 p.m. Eastern time on the last calendar day of the period. The Fund uses independent pricing services approved by the Board of Trustees to value its investments. When current market prices or quotations are not readily available or reliable, valuations may be determined in good faith in accordance with procedures adopted by the Board of Trustees. Factors used in determining value may include market or security specific events. The frequency with which these procedures are used cannot be predicted and they may be utilized to a significant extent. The value used for net asset value (NAV) calculation under these procedures may differ from published prices for the same securities.
The Fund categorizes the inputs to valuation techniques used to value its investments into a disclosure hierarchy consisting of three levels as shown below.
Level 1 - quoted prices in active markets for identical investments
Level 2 - other significant observable inputs (including quoted prices for similar investments, interest rates, prepayment speeds, etc.)
Level 3 - unobservable inputs (including the fund's own assumptions based on the best information available)
Changes in valuation techniques may result in transfers in or out of an assigned level within the disclosure hierarchy. The aggregate value of investments by input level, as of October 31, 2010 is included at the end of the Fund's Schedule of Investments. Valuation techniques used to value the Fund's investments by major category are as follows.
Equity securities, including restricted securities, for which market quotations are readily available, are valued at the last reported sale price or official closing price as reported by an independent pricing service on the primary market or exchange on which they are traded and are categorized as Level 1 in the hierarchy. In the event there were no sales during the day or closing prices are not available, securities are valued at the last quoted bid price or may be valued using the last available price and are generally categorized as Level 2 in the hierarchy. For foreign equity securities, when significant market or security specific events arise, comparisons to the valuation of American Depositary Receipts (ADRs), futures contracts, Exchange-traded funds (ETFs) and certain indexes as well as quoted prices for similar securities are used and are categorized as Level 2 in the hierarchy in these circumstances. Utilizing these techniques may result in transfers between Level 1 and Level 2. For restricted equity securities and private placements where observable inputs are limited, assumptions about market activity and risk are used and are categorized as Level 3 in the hierarchy.
Investments in open-end mutual funds, including the Fidelity Central Funds, are valued at their closing net asset value each business day and are categorized as Level 1 in the hierarchy. Short-term securities with remaining maturities of sixty days or less for which quotations are not readily available are valued at amortized cost, which approximates fair value and are categorized as Level 2 in the hierarchy.
Annual Report
Notes to Financial Statements - continued
3. Significant Accounting Policies - continued
Foreign Currency. The Fund uses foreign currency contracts to facilitate transactions in foreign-denominated securities. Gains and losses from these transactions may arise from changes in the value of the foreign currency or if the counterparties do not perform under the contracts' terms.
Foreign-denominated assets, including investment securities, and liabilities are translated into U.S. dollars at the exchange rate at period end. Purchases and sales of investment securities, income and dividends received and expenses denominated in foreign currencies are translated into U.S. dollars at the exchange rate in effect on the transaction date.
The effects of exchange rate fluctuations on investments are included with the net realized and unrealized gain (loss) on investment securities. Other foreign currency transactions resulting in realized and unrealized gain (loss) are disclosed separately.
Investment Transactions and Income. For financial reporting purposes, the Fund's investment holdings and NAV include trades executed through the end of the last business day of the period. The NAV per share for processing shareholder transactions is calculated as of the close of business of the New York Stock Exchange (NYSE), normally 4:00 p.m. Eastern time and includes trades executed through the end of the prior business day. Gains and losses on securities sold are determined on the basis of identified cost and may include proceeds received from litigation. Dividend income is recorded on the ex-dividend date, except for certain dividends from foreign securities where the ex-dividend date may have passed, which are recorded as soon as the Fund is informed of the ex-dividend date. Non-cash dividends included in dividend income, if any, are recorded at the fair market value of the securities received. Distributions received on securities that represent a return of capital or capital gain are recorded as a reduction of cost of investments and/or as a realized gain. The Fund estimates the components of distributions received that may be considered return of capital distributions or capital gain distributions. Interest income and distributions from the Fidelity Central Funds are accrued as earned. Interest income includes coupon interest and amortization of premium and accretion of discount on debt securities. Investment income is recorded net of foreign taxes withheld where recovery of such taxes is uncertain.
Expenses. Most expenses of the Trust can be directly attributed to a fund. Expenses which cannot be directly attributed are apportioned amongst each fund in the Trust. Expense estimates are accrued in the period to which they relate and adjustments are made when actual amounts are known.
Income Tax Information and Distributions to Shareholders. Each year the Fund intends to qualify as a regulated investment company, including distributing substantially all of its taxable income and realized gains under Subchapter M of the Internal Revenue Code and filing its U.S. federal tax return. As a result, no provision for income taxes is required. As of October 31, 2010, the Fund did not have any unrecognized tax benefits in the accompanying financial statements. A fund's federal tax return is subject to examination by the Internal Revenue Service (IRS) for a period of three years. Foreign taxes are provided for based on the Fund's understanding of the tax rules and rates that exist in the foreign markets in which it invests. The Fund is subject to a tax imposed on short term capital gains on securities of certain issuers domiciled in India. The Fund records an estimated deferred tax liability included in Other payables and accrued expenses in the accompanying Statement of Assets & Liabilities for net unrealized gains on these securities in an amount that would be payable if the securities were disposed of at period end.
Distributions are declared and recorded on the ex-dividend date. Income and capital gain distributions are determined in accordance with income tax regulations, which may differ from GAAP.
Capital accounts within the financial statements are adjusted for permanent book-tax differences. These adjustments have no impact on net assets or the results of operations. Temporary book-tax differences will reverse in a subsequent period.
Book-tax differences are primarily due to the short-term gain distributions from the Fidelity Central Funds, foreign currency transactions, certain foreign taxes, passive foreign investment companies (PFIC), capital loss carryforwards and losses deferred due to wash sales.
The federal tax cost of investment securities and unrealized appreciation (depreciation) as of period end were as follows:
Gross unrealized appreciation | $ 75,226,751 |
Gross unrealized depreciation | (11,491,484) |
Net unrealized appreciation (depreciation) | $ 63,735,267 |
| |
Tax Cost | $ 584,303,121 |
The tax-based components of distributable earnings as of period end were as follows:
Undistributed ordinary income | $ 10,904,942 |
Capital loss carryforward | $ (156,762,594) |
Net unrealized appreciation (depreciation) | $ 63,709,157 |
Annual Report
3. Significant Accounting Policies - continued
Income Tax Information and Distributions to Shareholders - continued
The tax character of distributions paid was as follows:
| October 31, 2010 | October 31, 2009 |
Ordinary Income | $ 8,654,123 | $ 813,634 |
Short-Term Trading (Redemption) Fees. Shares held by investors in the Fund less than 30 days are subject to a redemption fee equal to 1.00% of the net asset value of shares redeemed. All redemption fees, which reduce the proceeds of the shareholder redemption, are retained by the Fund and accounted for as an addition to paid in capital.
4. Operating Policies.
Delayed Delivery Transactions and When-Issued Securities. The Fund may purchase or sell securities on a delayed delivery or when-issued basis. Payment and delivery may take place after the customary settlement period for that security. The price of the underlying securities and the date when the securities will be delivered and paid for are fixed at the time the transaction is negotiated. During the time a delayed delivery sell is outstanding, the contract is marked-to-market daily and equivalent deliverable securities are held for the transaction. The securities purchased on a delayed delivery or when-issued basis are identified as such in the Fund's Schedule of Investments. The Fund may receive compensation for interest forgone in the purchase of a delayed delivery or when-issued security. With respect to purchase commitments, the Fund identifies securities as segregated in its records with a value at least equal to the amount of the commitment. Losses may arise due to changes in the value of the underlying securities or if the counterparty does not perform under the contract's terms, or if the issuer does not issue the securities due to political, economic, or other factors.
Restricted Securities. The Fund may invest in securities that are subject to legal or contractual restrictions on resale. These securities generally may be resold in transactions exempt from registration or to the public if the securities are registered. Disposal of these securities may involve time-consuming negotiations and expense, and prompt sale at an acceptable price may be difficult. Information regarding restricted securities is included at the end of the Fund's Schedule of Investments.
5. Purchases and Sales of Investments.
Purchases and sales of securities other than short-term securities, aggregated $2,647,573,228 and $2,573,966,786, respectively.
6. Fees and Other Transactions with Affiliates.
Management Fee. FMR and its affiliates provide the Fund with investment management related services for which the Fund pays a monthly management fee. The management fee is the sum of an individual fund fee rate that is based on an annual rate of .45% of the Fund's average net assets and a group fee rate that averaged .26% during the period. The group fee rate is based upon the average net assets of all the mutual funds advised by FMR. The group fee rate decreases as assets under management increase and increases as assets under management decrease. In addition, the management fee is subject to a performance adjustment (up to a maximum of ±.20% of the Fund's average net assets over a 36 month performance period). The upward or downward adjustment to the management fee is based on the Fund's relative investment performance as compared to an appropriate benchmark index. For the period, the total annual management fee rate, including the performance adjustment, was .60% of the Fund's average net assets.
Transfer Agent Fees. Fidelity Investments Institutional Operations Company, Inc. (FIIOC), an affiliate of FMR, is the Fund's transfer, dividend disbursing and shareholder servicing agent. FIIOC receives account fees and asset-based fees that vary according to account size and type of account. FIIOC pays for typesetting, printing and mailing of shareholder reports, except proxy statements. For the period, the transfer agent fees were equivalent to an annual rate of .30% of average net assets.
Accounting and Security Lending Fees. Fidelity Service Company, Inc. (FSC), an affiliate of FMR, maintains the Fund's accounting records. The accounting fee is based on the level of average net assets for the month. Under a separate contract, FSC administers the security lending program. The security lending fee is based on the number and duration of lending transactions.
Brokerage Commissions. The Fund placed a portion of its portfolio transactions with brokerage firms which are affiliates of the investment adviser. The commissions paid to these affiliated firms were $22,244 for the period.
Interfund Lending Program. Pursuant to an Exemptive Order issued by the SEC, the Fund, along with other registered investment companies having management contracts with FMR, may participate in an interfund lending program. This program provides an alternative credit facility allowing the funds to borrow from, or lend money to, other participating affiliated funds. At period end, there were no interfund loans outstanding. The Fund's activity in this program during the period for which loans were outstanding was as follows:
Annual Report
Notes to Financial Statements - continued
6. Fees and Other Transactions with Affiliates - continued
Interfund Lending Program - continued
Borrower or Lender | Average Daily
Loan Balance | Weighted Average
Interest Rate | Interest
Expense |
Borrower | $ 8,080,174 | .42% | $ 6,469 |
7. Committed Line of Credit.
The Fund participates with other funds managed by FMR or an affiliate in a $3.75 billion credit facility (the "line of credit") to be utilized for temporary or emergency purposes to fund shareholder redemptions or for other short-term liquidity purposes. The Fund has agreed to pay commitment fees on its pro-rata portion of the line of credit, which amounted to $2,096 and is reflected in Miscellaneous expenses on the Statement of Operations. During the period, there were no borrowings on this line of credit.
8. Security Lending.
The Fund lends portfolio securities through a lending agent from time to time in order to earn additional income. The lending agent may loan securities to certain qualified borrowers, including Fidelity Capital Markets (FCM), a broker-dealer affiliated with the Fund. On the settlement date of the loan, the Fund receives collateral (in the form of U.S. Treasury obligations, letters of credit and/or cash) against the loaned securities and maintains collateral in an amount not less than 100% of the market value of the loaned securities during the period of the loan. The market value of the loaned securities is determined at the close of business of the Fund and any additional required collateral is delivered to the Fund on the next business day. If the borrower defaults on its obligation to return the securities loaned because of insolvency or other reasons, a fund could experience delays and costs in recovering the securities loaned or in gaining access to the collateral. Any cash collateral received is invested in the Fidelity Securities Lending Cash Central Fund. The value of loaned securities and cash collateral at period end are disclosed on the Fund's Statement of Assets and Liabilities. Security lending income represents the income earned on investing cash collateral, less rebates paid to borrowers and lending agent fees associated with the loan, plus any premium payments received for lending certain types of securities. Security lending income is presented in the Statement of Operations as a component of income from Fidelity Central Funds. Total security lending income during the period amounted to $331,605. During the period, there were no securities loaned to FCM.
9. Expense Reductions.
Many of the brokers with whom FMR places trades on behalf of the Fund provided services to the Fund in addition to trade execution. These services included payments of certain expenses on behalf of the Fund totaling $936,551 for the period.
10. Other.
The Fund's organizational documents provide former and current trustees and officers with a limited indemnification against liabilities arising in connection with the performance of their duties to the Fund. In the normal course of business, the Fund may also enter into contracts that provide general indemnifications. The Fund's maximum exposure under these arrangements is unknown as this would be dependent on future claims that may be made against the Fund. The risk of material loss from such claims is considered remote.
Annual Report
Report of Independent Registered Public Accounting Firm
To the Trustees of Fidelity Investment Trust and Shareholders of Fidelity International Capital Appreciation Fund:
We have audited the accompanying statement of assets and liabilities of Fidelity International Capital Appreciation Fund (the Fund), a fund of Fidelity Investment Trust, including the schedule of investments, as of October 31, 2010, and the related statement of operations for the year then ended, the statement of changes in net assets for each of the two years in the period then ended, and the financial highlights for each of the five years in the period then ended. These financial statements and financial highlights are the responsibility of the Fund's management. Our responsibility is to express an opinion on these financial statements and financial highlights based on our audits.
We conducted our audits in accordance with standards of the Public Company Accounting Oversight Board (United States). Those standards require that we plan and perform the audit to obtain reasonable assurance about whether the financial statements and financial highlights are free of material misstatement. The Fund is not required to have, nor were we engaged to perform, an audit of its internal control over financial reporting. Our audits included consideration of internal control over financial reporting as a basis for designing audit procedures that are appropriate in the circumstances, but not for the purpose of expressing an opinion on the effectiveness of the Fund's internal control over financial reporting. Accordingly, we express no such opinion. An audit also includes examining, on a test basis, evidence supporting the amounts and disclosures in the financial statements, assessing the accounting principles used and significant estimates made by management, as well as evaluating the overall financial statement presentation. Our procedures included confirmation of securities owned as of October 31, 2010, by correspondence with the custodians and brokers; where replies were not received from brokers, we performed other auditing procedures. We believe that our audits provide a reasonable basis for our opinion.
In our opinion, the financial statements and financial highlights referred to above present fairly, in all material respects, the financial position of Fidelity International Capital Appreciation Fund as of October 31, 2010, the results of its operations for the year then ended, the changes in its net assets for each of the two years in the period then ended, and its financial highlights for each of the five years in the period then ended, in conformity with accounting principles generally accepted in the United States of America.
/s/ Deloitte & Touche LLP
DELOITTE & TOUCHE LLP
Boston, Massachusetts
December 17, 2010
Annual Report
Fidelity Overseas Fund
As a shareholder of the Fund, you incur two types of costs: (1) transaction costs, including redemption fees, and (2) ongoing costs, including management fees and other Fund expenses. This Example is intended to help you understand your ongoing costs (in dollars) of investing in the Fund and to compare these costs with the ongoing costs of investing in other mutual funds.
The Example is based on an investment of $1,000 invested at the beginning of the period and held for the entire period (May 1, 2010 to October 31, 2010).
Actual Expenses
The first line of the accompanying table for each class of the Fund provides information about actual account values and actual expenses. You may use the information in this line, together with the amount you invested, to estimate the expenses that you paid over the period. Simply divide your account value by $1,000.00 (for example, an $8,600 account value divided by $1,000.00 = 8.6), then multiply the result by the number in the first line for a class of the Fund under the heading entitled "Expenses Paid During Period" to estimate the expenses you paid on your account during this period. A small balance maintenance fee of $12.00 that is charged once a year may apply for certain accounts with a value of less than $2,000. This fee is not included in the table below. If it was, the estimate of expenses you paid during the period would be higher, and your ending account value lower, by this amount. In addition, the Fund, as a shareholder in the underlying Fidelity Central Funds, will indirectly bear its pro-rata share of the fees and expenses incurred by the underlying Fidelity Central Funds. These fees and expenses are not included in the Fund's annualized expense ratio used to calculate the expense estimate in the table below.
Hypothetical Example for Comparison Purposes
The second line of the accompanying table for each class of the Fund provides information about hypothetical account values and hypothetical expenses based on a Class' actual expense ratio and an assumed rate of return of 5% per year before expenses, which is not the Class' actual return. The hypothetical account values and expenses may not be used to estimate the actual ending account balance or expenses you paid for the period. You may use this information to compare the ongoing costs of investing in the Fund and other funds. To do so, compare this 5% hypothetical example with the 5% hypothetical examples that appear in the shareholder reports of the other funds. A small balance maintenance fee of $12.00 that is charged once a year may apply for certain accounts with a value of less than $2,000. This fee is not included in the table below. If it was, the estimate of expenses you paid during the period would be higher, and your ending account value lower, by this amount. In addition, the Fund, as a shareholder in the underlying Fidelity Central Funds, will indirectly bear its pro-rata share of the fees and expenses incurred by the underlying Fidelity Central Funds. These fees and expenses are not included in the Fund's annualized expense ratio used to calculate the expense estimate in the table below.
Please note that the expenses shown in the table are meant to highlight your ongoing costs only and do not reflect any transaction costs. Therefore, the second line of the table is useful in comparing ongoing costs only, and will not help you determine the relative total costs of owning different funds. In addition, if these transactional costs were included, your costs would have been higher.
| Annualized
Expense Ratio | Beginning
Account Value
May 1, 2010 | Ending
Account Value
October 31, 2010 | Expenses Paid
During Period*
May 1, 2010
to October 31, 2010 |
Overseas | .83% | | | |
Actual | | $ 1,000.00 | $ 1,037.80 | $ 4.26 |
HypotheticalA | | $ 1,000.00 | $ 1,021.02 | $ 4.23 |
Class K | .64% | | | |
Actual | | $ 1,000.00 | $ 1,038.80 | $ 3.29 |
HypotheticalA | | $ 1,000.00 | $ 1,021.98 | $ 3.26 |
Class F | .62% | | | |
Actual | | $ 1,000.00 | $ 1,038.80 | $ 3.19 |
HypotheticalA | | $ 1,000.00 | $ 1,022.08 | $ 3.16 |
A 5% return per year before expenses
* Expenses are equal to each Class' annualized expense ratio, multiplied by the average account value over the period, multiplied by 184/365 (to reflect the one-half year period).
Annual Report
Fidelity Overseas Fund
Performance: The Bottom Line
Average annual total return reflects the change in the value of an investment, assuming reinvestment of the class' distributions from dividend income and capital gains (the profits earned upon the sale of securities that have grown in value, if any) and assuming a constant rate of performance each year. The $10,000 table and the fund's returns do not reflect the deduction of taxes that a shareholder would pay on fund distributions or the redemption of fund shares. During periods of reimbursement by Fidelity, a fund's total return will be greater than it would be had the reimbursement not occurred. How a fund did yesterday is no guarantee of how it will do tomorrow.
Average Annual Total Returns
Periods ended October 31, 2010 | Past 1
year | Past 5
years | Past 10
years |
Fidelity Overseas Fund | 6.33% | 2.06% | 1.79% |
$10,000 Over 10 Years
Let's say hypothetically that $10,000 was invested in Fidelity Overseas Fund, a class of the fund, on October 31, 2000. The chart shows how the value of your investment would have changed, and also shows how the MSCI EAFE Index performed over the same period.
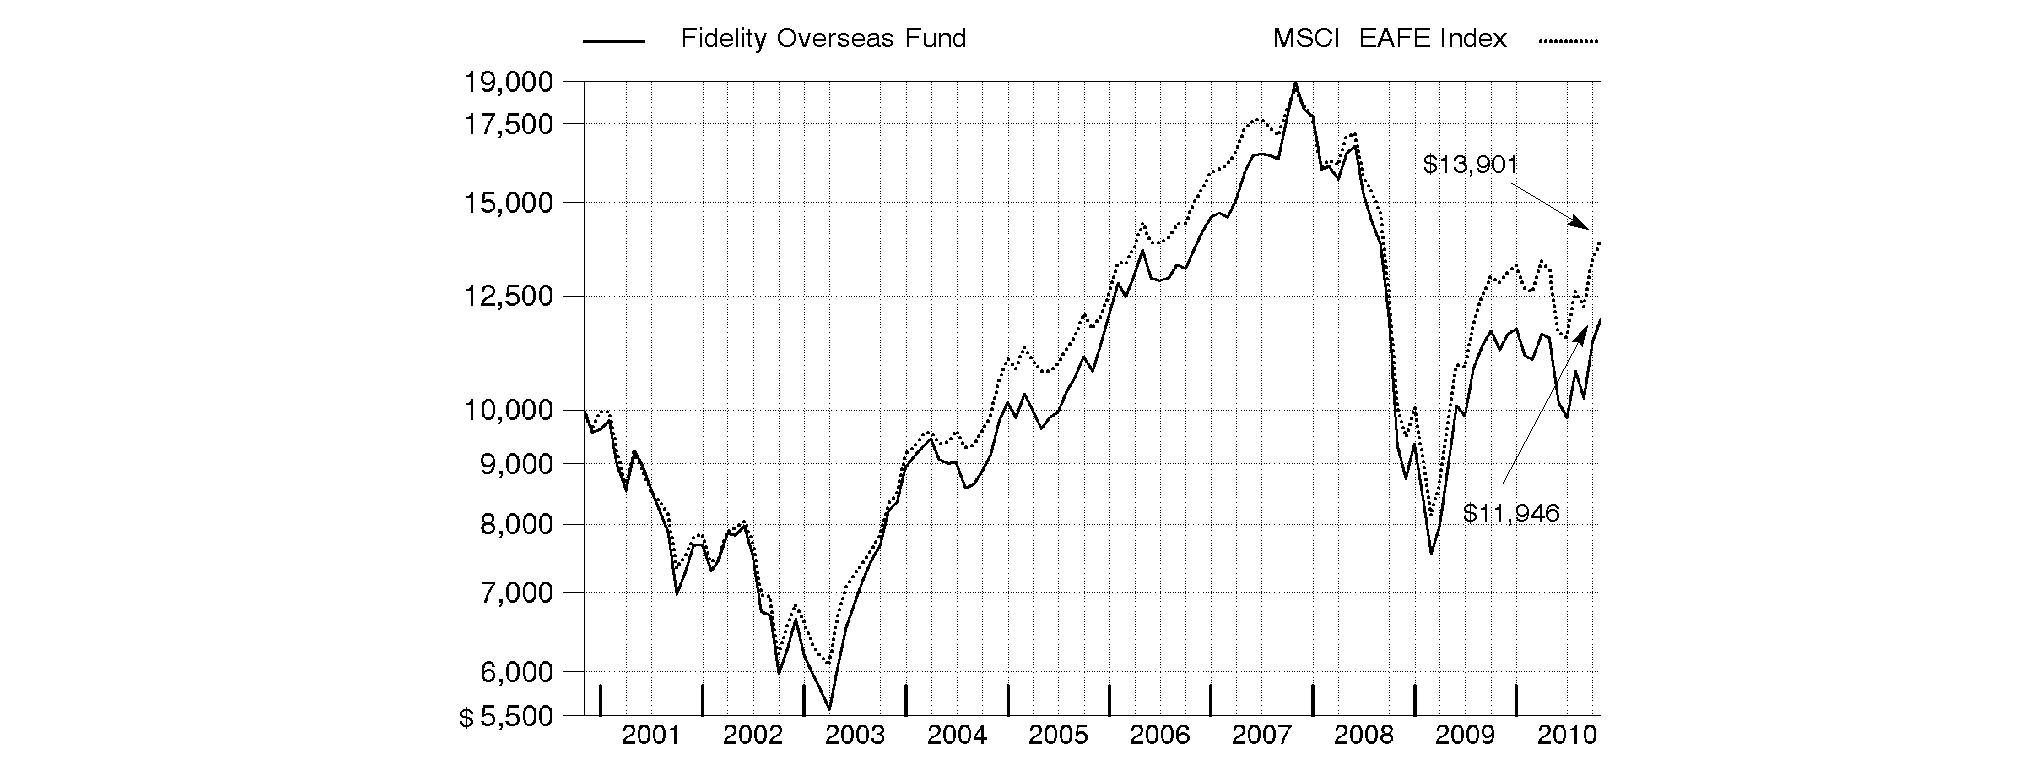
Annual Report
Fidelity Overseas Fund
Market Recap: International stocks rode a wave of volatility similar to that of their U.S. counterparts during the 12 months ending October 31, 2010. Stocks gained modestly in the first half of the period, despite growing concerns about the European debt crisis. Sentiment turned decidedly negative in May and June, however, and the market suffered a precipitous decline. These losses were more than offset during the last four months of the period, when signs of economic growth and subsiding debt fears helped propel international stocks about 21%. For the full year, the MSCI® ACWI® (All Country World Index) ex USA Index gained 12.76%, boosted in part by a generally depreciating U.S. dollar. Within the index, Canada and emerging markets were standouts, returning 23% and 24%, respectively. Results in the latter group were led by strong-performing India, Mexico and South Africa, while China fell short of the MSCI benchmark due to cooling economic growth. The developed Asia ex Japan segment rose 16% for the period, lifted by solid results from Singapore and Hong Kong. Meanwhile, Europe rose just 9%, held back mainly by debt-riddled Spain and Italy, as well as lagging major constituent France. Japan returned only 5%, a result of that nation's continued weak economy.
Comments from Ian Hart, Portfolio Manager of Fidelity® Overseas Fund: For the year, the fund's Retail Class shares rose 6.33%, underperforming the 8.49% gain of the MSCI EAFE® (Europe, Australasia, Far East) Index. The fund's relative performance was hurt by unfavorable positioning within industrials, specifically the capital goods group, consumer staples and financials. On a geographic basis, performance was stymied by an underweighting in Australia and stock picking in several countries, including Japan, the U.K. and Switzerland, but helped by investments in Italy and Germany. On an individual security basis, the fund's largest detractor was an out-of-index stake in U.S.-based Scientific Games, a provider of technology systems to the gaming industry, whose stock disappointed when new online gaming opportunities failed to materialize. I also missed with Hellenic Telecommunications Organization (OTE), the Greek firm whose stock struggled amid the country's economic crisis. I cut back on Scientific Games and sold OTE by period end. Within financials, the fund's investment in Italian banking group Intesa Sanpaolo detracted. Conversely, German automaker Volkswagen was the fund's top individual contributor. Underweighting energy giant BP helped, as the stock dropped after its oil-well blowout in the Gulf of Mexico. An out-of-index stake in luxury goods maker Bulgari was a solid contributor, as demand for its products surged within emerging markets.
The views expressed above reflect those of the portfolio manager(s) only through the end of the period as stated on the cover of this report and do not necessarily represent the views of Fidelity or any other person in the Fidelity organization. Any such views are subject to change at any time based upon market or other conditions and Fidelity disclaims any responsibility to update such views. These views may not be relied on as investment advice and, because investment decisions for a Fidelity fund are based on numerous factors, may not be relied on as an indication of trading intent on behalf of any Fidelity fund.
Annual Report
Fidelity Overseas Fund
Investment Changes (Unaudited)
Geographic Diversification (% of fund's net assets) |
As of October 31, 2010 |
| Japan | 18.1% | |
| France | 18.1% | |
| Germany | 16.1% | |
| United Kingdom | 12.7% | |
| United States of America | 5.5% | |
| Italy | 4.8% | |
| Switzerland | 3.7% | |
| Australia | 2.6% | |
| Bailiwick of Jersey | 2.5% | |
| Other | 15.9% | |

Percentages are adjusted for the effect of futures contracts, if applicable. |
As of April 30, 2010 |
| United Kingdom | 23.1% | |
| Japan | 21.6% | |
| Germany | 13.3% | |
| France | 12.0% | |
| United States of America | 7.0% | |
| Italy | 3.9% | |
| Switzerland | 3.1% | |
| Australia | 2.6% | |
| Spain | 2.5% | |
| Other | 10.9% | |

Percentages are adjusted for the effect of futures contracts, if applicable. |
Asset Allocation |
| % of fund's
net assets | % of fund's net assets
6 months ago |
Stocks | 98.6 | 97.3 |
Short-Term Investments and Net Other Assets | 1.4 | 2.7 |
Top Ten Stocks as of October 31, 2010 |
| % of fund's
net assets | % of fund's net assets
6 months ago |
Pernod-Ricard SA (France, Beverages) | 5.3 | 1.0 |
SAP AG (Germany, Software) | 5.1 | 3.4 |
Volkswagen AG (Germany, Automobiles) | 3.5 | 0.7 |
Mazda Motor Corp. (Japan, Automobiles) | 3.4 | 2.3 |
Japan Tobacco, Inc. (Japan, Tobacco) | 3.2 | 0.5 |
Bulgari SpA (Italy, Textiles, Apparel & Luxury Goods) | 3.1 | 1.2 |
Siemens AG (Germany, Industrial Conglomerates) | 1.8 | 1.8 |
Royal Dutch Shell PLC Class B ADR (United Kingdom, Oil, Gas & Consumable Fuels) | 1.6 | 2.4 |
Fluor Corp. (United States of America, Construction & Engineering) | 1.5 | 0.9 |
Ricoh Co. Ltd. (Japan, Office Electronics) | 1.5 | 2.5 |
| 30.0 | |
Market Sectors as of October 31, 2010 |
| % of fund's
net assets | % of fund's net assets
6 months ago |
Consumer Discretionary | 22.1 | 15.4 |
Financials | 17.4 | 23.0 |
Consumer Staples | 12.4 | 8.1 |
Information Technology | 11.2 | 12.6 |
Industrials | 11.1 | 10.1 |
Energy | 8.3 | 6.7 |
Materials | 7.8 | 8.9 |
Telecommunication Services | 4.5 | 3.5 |
Health Care | 2.6 | 5.9 |
Utilities | 1.2 | 3.1 |
Annual Report
Fidelity Overseas Fund
Investments October 31, 2010
Showing Percentage of Net Assets
Common Stocks - 94.6% |
| Shares | | Value |
Australia - 2.6% |
Australia & New Zealand Banking Group Ltd. | 2,742,327 | | $ 66,652,578 |
Macquarie Group Ltd. | 862,470 | | 30,586,058 |
Newcrest Mining Ltd. | 1,898,098 | | 74,304,490 |
TOTAL AUSTRALIA | | 171,543,126 |
Austria - 0.9% |
Erste Bank AG | 563,100 | | 25,409,732 |
Wienerberger AG (a) | 1,786,918 | | 30,085,525 |
TOTAL AUSTRIA | | 55,495,257 |
Bailiwick of Jersey - 2.5% |
Charter International PLC | 1,557,500 | | 18,415,673 |
Heritage Oil PLC | 2,780,200 | | 15,345,055 |
United Business Media Ltd. | 5,000,000 | | 52,710,735 |
WPP PLC | 6,514,338 | | 75,693,005 |
TOTAL BAILIWICK OF JERSEY | | 162,164,468 |
Belgium - 1.5% |
Ageas | 8,054,178 | | 24,756,232 |
Anheuser-Busch InBev SA NV | 780,339 | | 48,899,125 |
Anheuser-Busch InBev SA NV (strip VVPR) (a) | 6,312,640 | | 26,351 |
KBC Groupe SA (a) | 486,408 | | 21,153,772 |
TOTAL BELGIUM | | 94,835,480 |
Bermuda - 0.5% |
GOME Electrical Appliances Holdings Ltd. (a) | 93,574,000 | | 31,508,226 |
Brazil - 1.8% |
Banco do Brasil SA | 1,437,500 | | 27,969,228 |
BM&F Bovespa SA | 3,905,100 | | 32,710,836 |
Centrais Eletricas Brasileiras SA (Electrobras) sponsored ADR (d) | 3,938,600 | | 55,022,242 |
TOTAL BRAZIL | | 115,702,306 |
Canada - 1.5% |
Harry Winston Diamond Corp. (a) | 2,390,974 | | 30,546,516 |
Niko Resources Ltd. | 341,600 | | 32,589,156 |
Talisman Energy, Inc. | 1,931,800 | | 35,022,043 |
TOTAL CANADA | | 98,157,715 |
Cayman Islands - 0.3% |
3SBio, Inc. sponsored ADR (a) | 37,000 | | 556,850 |
China Shanshui Cement Group Ltd. | 3,219,000 | | 2,292,389 |
PCD Stores Group Ltd. | 4,666,000 | | 1,504,919 |
Peak Sport Products Co. Ltd. | 16,175,000 | | 12,896,178 |
TOTAL CAYMAN ISLANDS | | 17,250,336 |
|
| Shares | | Value |
China - 0.5% |
China Merchants Bank Co. Ltd. (H Shares) | 12,276,500 | | $ 34,843,799 |
Minth Group Ltd. | 72,000 | | 134,688 |
TOTAL CHINA | | 34,978,487 |
Denmark - 0.5% |
Carlsberg AS Series B | 284,700 | | 31,131,011 |
France - 18.1% |
Accor SA | 806,023 | | 33,046,197 |
Alstom SA | 1,556,065 | | 78,509,668 |
Atos Origin SA (a) | 803,297 | | 37,137,165 |
AXA SA | 1,253,837 | | 22,820,042 |
BNP Paribas SA | 617,426 | | 45,146,620 |
Carrefour SA | 1,432,468 | | 77,296,591 |
Christian Dior SA | 281,800 | | 40,759,898 |
Compagnie de St. Gobain | 1,180,629 | | 55,131,906 |
Compagnie Generale de Geophysique SA (a) | 2,168,200 | | 50,633,571 |
L'Oreal SA | 198,100 | | 23,253,517 |
LVMH Moet Hennessy - Louis Vuitton | 508,209 | | 79,624,799 |
Pernod-Ricard SA | 3,860,967 | | 342,271,944 |
PPR SA | 446,469 | | 73,181,989 |
Renault SA (a) | 725,300 | | 40,293,056 |
Safran SA | 1,265,056 | | 40,098,772 |
Sanofi-Aventis | 619,478 | | 43,390,713 |
Schneider Electric SA | 234,583 | | 33,293,873 |
Societe Generale Series A | 1,097,908 | | 65,728,608 |
TOTAL FRANCE | | 1,181,618,929 |
Germany - 12.1% |
Deutsche Boerse AG | 1,176,192 | | 82,747,121 |
Fresenius Medical Care AG & Co. KGaA (d) | 954,400 | | 60,782,555 |
HeidelbergCement AG | 1,413,029 | | 73,898,094 |
Linde AG | 341,697 | | 49,185,747 |
Munich Re Group | 129,625 | | 20,264,200 |
Puma AG | 144,300 | | 47,967,832 |
SAP AG | 6,381,161 | | 332,698,622 |
Siemens AG | 1,040,567 | | 118,843,382 |
TOTAL GERMANY | | 786,387,553 |
Hong Kong - 1.4% |
China Unicom (Hong Kong) Ltd. sponsored ADR (d) | 5,330,700 | | 74,629,800 |
Henderson Land Development Co. Ltd. | 2,758,000 | | 19,587,538 |
TOTAL HONG KONG | | 94,217,338 |
India - 0.3% |
Bharti Airtel Ltd. | 2,628,490 | | 19,311,174 |
Indonesia - 0.2% |
PT Indosat Tbk sponsored ADR (d) | 425,600 | | 14,019,264 |
Common Stocks - continued |
| Shares | | Value |
Israel - 0.4% |
Teva Pharmaceutical Industries Ltd. sponsored ADR | 454,800 | | $ 23,604,120 |
Italy - 4.8% |
Bulgari SpA (d)(e) | 18,976,214 | | 203,182,267 |
Intesa Sanpaolo SpA | 17,104,673 | | 60,155,252 |
Saipem SpA | 1,039,967 | | 46,204,693 |
TOTAL ITALY | | 309,542,212 |
Japan - 18.1% |
Denso Corp. | 1,410,300 | | 43,857,646 |
Hitachi Ltd. (a) | 6,197,000 | | 28,008,276 |
Japan Tobacco, Inc. | 66,332 | | 206,072,575 |
Kenedix, Inc. (a)(d) | 71,644 | | 14,449,883 |
Keyence Corp. | 110,000 | | 27,271,032 |
Mazda Motor Corp. | 87,560,000 | | 222,529,219 |
Mitsubishi Corp. | 3,326,700 | | 79,906,263 |
Mitsubishi UFJ Financial Group, Inc. | 10,993,100 | | 51,019,020 |
Mitsui & Co. Ltd. | 5,632,000 | | 88,576,770 |
Mizuho Financial Group, Inc. | 12,656,900 | | 18,356,540 |
Rakuten, Inc. | 87,129 | | 67,130,581 |
Ricoh Co. Ltd. | 6,888,000 | | 96,353,600 |
SOFTBANK CORP. | 1,562,000 | | 50,163,672 |
Sumitomo Mitsui Financial Group, Inc. | 1,168,700 | | 34,883,060 |
Tokyo Broadcasting System Holding | 1,852,500 | | 22,836,833 |
Tokyo Electron Ltd. | 1,655,700 | | 93,420,153 |
Toshiba Corp. (a) | 4,682,000 | | 23,434,099 |
Toto Ltd. (d) | 2,025,000 | | 13,453,746 |
TOTAL JAPAN | | 1,181,722,968 |
Korea (South) - 0.6% |
Shinhan Financial Group Co. Ltd. | 495,630 | | 19,194,916 |
SK Telecom Co. Ltd. sponsored ADR (d) | 1,152,400 | | 21,238,732 |
TOTAL KOREA (SOUTH) | | 40,433,648 |
Netherlands - 1.4% |
AEGON NV (a) | 4,267,800 | | 27,041,518 |
ING Groep NV (Certificaten Van Aandelen) unit (a) | 3,711,800 | | 39,701,429 |
Koninklijke Philips Electronics NV | 802,100 | | 24,459,768 |
TOTAL NETHERLANDS | | 91,202,715 |
Norway - 1.5% |
Aker Solutions ASA | 4,406,500 | | 67,083,064 |
Sevan Marine ASA (a)(d) | 24,336,552 | | 32,791,814 |
TOTAL NORWAY | | 99,874,878 |
|
| Shares | | Value |
Russia - 0.6% |
Mobile TeleSystems OJSC sponsored ADR | 1,052,500 | | $ 22,786,625 |
OAO Gazprom sponsored ADR | 737,700 | | 16,118,745 |
TOTAL RUSSIA | | 38,905,370 |
Spain - 2.0% |
Banco Bilbao Vizcaya Argentaria SA | 4,148,498 | | 54,640,336 |
Inditex SA (d) | 459,185 | | 38,342,368 |
Indra Sistemas SA (d) | 1,047,400 | | 20,498,398 |
Red Electrica Corporacion SA | 397,300 | | 19,954,149 |
TOTAL SPAIN | | 133,435,251 |
Switzerland - 3.7% |
Julius Baer Group Ltd. | 1,451,350 | | 61,247,604 |
Roche Holding AG (participation certificate) | 267,163 | | 39,218,828 |
The Swatch Group AG (Bearer) | 120,060 | | 45,872,470 |
Transocean Ltd. (a) | 556,300 | | 35,247,168 |
UBS AG (a) | 3,366,813 | | 57,176,452 |
TOTAL SWITZERLAND | | 238,762,522 |
United Kingdom - 12.7% |
Anglo American PLC (United Kingdom) | 1,823,500 | | 84,957,817 |
BAE Systems PLC | 5,367,400 | | 29,642,063 |
Barclays PLC | 9,627,323 | | 42,301,417 |
BG Group PLC | 3,213,318 | | 62,576,583 |
BHP Billiton PLC | 2,041,281 | | 72,303,336 |
BP PLC sponsored ADR | 1,140,200 | | 46,554,366 |
Capita Group PLC | 1,188,700 | | 14,597,806 |
HSBC Holdings PLC sponsored ADR | 1,368,764 | | 71,326,292 |
Imperial Tobacco Group PLC | 2,114,240 | | 67,712,719 |
ITV PLC (a) | 21,426,630 | | 23,429,321 |
Lloyds Banking Group PLC (a) | 31,001,210 | | 34,069,890 |
Micro Focus International PLC | 4,399,600 | | 26,912,392 |
Misys PLC (a) | 6,860,500 | | 30,930,222 |
Rio Tinto PLC | 1,255,810 | | 81,555,009 |
Royal Dutch Shell PLC Class B ADR | 1,635,700 | | 105,208,224 |
Xstrata PLC | 1,872,200 | | 36,279,500 |
TOTAL UNITED KINGDOM | | 830,356,957 |
United States of America - 4.1% |
AsiaInfo Holdings, Inc. (a) | 735,335 | | 16,339,144 |
CME Group, Inc. | 126,200 | | 36,553,830 |
Fluor Corp. | 2,020,100 | | 97,348,619 |
NII Holdings, Inc. (a) | 2,134,400 | | 89,239,264 |
Scientific Games Corp. Class A (a) | 3,345,209 | | 26,427,151 |
Viad Corp. | 98,936 | | 1,974,763 |
TOTAL UNITED STATES OF AMERICA | | 267,882,771 |
TOTAL COMMON STOCKS (Cost $5,942,808,667) | 6,164,044,082 |
Nonconvertible Preferred Stocks - 4.0% |
| Shares | | Value |
Germany - 4.0% |
Porsche Automobil Holding SE | 593,200 | | $ 30,387,401 |
Volkswagen AG | 1,511,968 | | 227,213,411 |
TOTAL NONCONVERTIBLE PREFERRED STOCKS (Cost $188,849,860) | 257,600,812 |
Money Market Funds - 2.7% |
| | | |
Fidelity Cash Central Fund, 0.23% (b) | 46,818,828 | | 46,818,828 |
Fidelity Securities Lending Cash Central Fund, 0.24% (b)(c) | 131,257,696 | | 131,257,696 |
TOTAL MONEY MARKET FUNDS (Cost $178,076,524) | 178,076,524 |
TOTAL INVESTMENT PORTFOLIO - 101.3% (Cost $6,309,735,051) | | 6,599,721,418 |
NET OTHER ASSETS (LIABILITIES) - (1.3)% | | (87,032,730) |
NET ASSETS - 100% | $ 6,512,688,688 |
Legend |
(a) Non-income producing |
(b) Affiliated fund that is available only to investment companies and other accounts managed by Fidelity Investments. The rate quoted is the annualized seven-day yield of the fund at period end. A complete unaudited listing of the fund's holdings as of its most recent quarter end is available upon request. In addition, each Fidelity Central Fund's financial statements, which are not covered by the Fund's report of Independent Registered Public Accounting Firm, are available on the SEC's website or upon request. |
(c) Investment made with cash collateral received from securities on loan. |
(d) Security or a portion of the security is on loan at period end. |
(e) Affiliated company |
Affiliated Central Funds |
Information regarding fiscal year to date income earned by the Fund from investments in Fidelity Central Funds is as follows: |
Fund | Income earned |
Fidelity Cash Central Fund | $ 215,905 |
Fidelity Securities Lending Cash Central Fund | 6,382,864 |
Total | $ 6,598,769 |
Other Affiliated Issuers |
An affiliated company is a company in which the Fund has ownership of at least 5% of the voting securities. Fiscal year to date transactions with companies which are or were affiliates are as follows: |
Affiliate | Value,
beginning of
period | Purchases | Sales
Proceeds | Dividend
Income | Value,
end of
period |
Bulgari SpA | $ 113,852,096 | $ 108,432,769 | $ 67,968,297 | $ 392,681 | $ 203,182,267 |
Harry Winston Diamond Corp. | 35,080,049 | - | 21,459,940 | - | - |
Kenedix, Inc. | 28,504,228 | 13,220,143 | 12,411,387 | - | - |
William Hill PLC | 71,632,544 | 29,169,053 | 94,152,324 | 2,667,780 | - |
Total | $ 249,068,917 | $ 150,821,965 | $ 195,991,948 | $ 3,060,461 | $ 203,182,267 |
Other Information |
The following is a summary of the inputs used, as of October 31, 2010, involving the Fund's assets and liabilities carried at fair value. The inputs or methodology used for valuing securities may not be an indication of the risk associated with investing in those securities. For more information on valuation inputs, and their aggregation into the levels used in the tables below, please refer to the Security Valuation section in the accompanying Notes to Financial Statements. |
Valuation Inputs at Reporting Date: |
Description | Total | Level 1 | Level 2 | Level 3 |
Investments in Securities: | | | | |
Equities: | | | | |
Japan | $ 1,181,722,968 | $ 131,688,329 | $ 1,050,034,639 | $ - |
France | 1,181,618,929 | 1,087,594,645 | 94,024,284 | - |
Germany | 1,043,988,365 | 1,043,988,365 | - | - |
United Kingdom | 830,356,957 | 600,127,305 | 230,229,652 | - |
Italy | 309,542,212 | 309,542,212 | - | - |
United States of America | 267,882,771 | 267,882,771 | - | - |
Switzerland | 238,762,522 | 181,586,070 | 57,176,452 | - |
Australia | 171,543,126 | 171,543,126 | - | - |
Bailiwick of Jersey | 162,164,468 | 86,471,463 | 75,693,005 | - |
Other | 1,034,062,576 | 888,219,525 | 145,843,051 | - |
Money Market Funds | 178,076,524 | 178,076,524 | - | - |
Total Investments in Securities: | $ 6,599,721,418 | $ 4,946,720,335 | $ 1,653,001,083 | $ - |
The following is a reconciliation of Investments in Securities for which Level 3 inputs were used in determining value: |
Investments in Securities: | |
Beginning Balance | $ 35 |
Total Realized Gain (Loss) | - |
Total Unrealized Gain (Loss) | (35) |
Cost of Purchases | - |
Proceeds of Sales | - |
Amortization/Accretion | - |
Transfers in to Level 3 | - |
Transfers out of Level 3 | - |
Ending Balance | $ - |
The change in unrealized gain (loss) for the period attributable to Level 3 securities held at October 31, 2010 | $ - |
The information used in the above reconciliation represents fiscal year to date activity for any Investments in Securities identified as using Level 3 inputs at either the beginning or the end of the current fiscal period. Transfers in or out of Level 3 represent the beginning value of any Security or Instrument where a change in the pricing level occurred from the beginning to the end of the period. The cost of purchases and the proceeds of sales may include securities received or delivered through corporate actions or exchanges. Realized and unrealized gains (losses) disclosed in the reconciliation are included in Net Gain (Loss) on the Fund's Statement of Operations. |
Income Tax Information |
At October 31, 2010, the Fund had a capital loss carryforward of approximately $1,637,677,232 of which $697,957,467 and $939,719,765 will expire on October 31, 2016 and 2017, respectively. Capital loss carryforwards are only available to offset future capital gains of the Fund to the extent provided by regulations and may be limited. |
See accompanying notes which are an integral part of the financial statements.
Annual Report
Fidelity Overseas Fund
Statement of Assets and Liabilities
| October 31, 2010 |
| | |
Assets | | |
Investment in securities, at value (including securities loaned of $126,027,467) - See accompanying schedule: Unaffiliated issuers (cost $5,979,280,612) | $ 6,218,462,627 | |
Fidelity Central Funds (cost $178,076,524) | 178,076,524 | |
Other affiliated issuers (cost $152,377,915) | 203,182,267 | |
Total Investments (cost $6,309,735,051) | | $ 6,599,721,418 |
Receivable for investments sold | | 136,276,399 |
Receivable for fund shares sold | | 7,122,890 |
Dividends receivable | | 15,109,772 |
Distributions receivable from Fidelity Central Funds | | 80,022 |
Other receivables | | 947,969 |
Total assets | | 6,759,258,470 |
| | |
Liabilities | | |
Payable for investments purchased | $ 108,531,107 | |
Payable for fund shares redeemed | 2,267,344 | |
Accrued management fee | 2,739,436 | |
Other affiliated payables | 1,272,757 | |
Other payables and accrued expenses | 501,442 | |
Collateral on securities loaned, at value | 131,257,696 | |
Total liabilities | | 246,569,782 |
| | |
Net Assets | | $ 6,512,688,688 |
Net Assets consist of: | | |
Paid in capital | | $ 7,864,527,445 |
Undistributed net investment income | | 85,893,161 |
Accumulated undistributed net realized gain (loss) on investments and foreign currency transactions | | (1,728,566,184) |
Net unrealized appreciation (depreciation) on investments and assets and liabilities in foreign currencies | | 290,834,266 |
Net Assets | | $ 6,512,688,688 |
Overseas:
Net Asset Value, offering price and redemption price per share ($5,548,689,358 ÷ 175,814,142 shares) | | $ 31.56 |
| | |
Class K:
Net Asset Value, offering price and redemption price per share ($368,004,318 ÷ 11,650,042 shares) | | $ 31.59 |
| | |
Class F:
Net Asset Value, offering price and redemption price per share ($595,995,012 ÷ 18,870,397 shares) | | $ 31.58 |
Statement of Operations
| Year ended October 31, 2010 |
| | |
Investment Income | | |
Dividends (including $3,060,461 earned from other affiliated issuers) | | $ 160,786,466 |
Interest | | 25,831 |
Income from Fidelity Central Funds | | 6,598,769 |
Income before foreign taxes withheld | | 167,411,066 |
Less foreign taxes withheld | | (12,596,890) |
Total income | | 154,814,176 |
| | |
Expenses | | |
Management fee
Basic fee | $ 48,637,860 | |
Performance adjustment | (7,944,328) | |
Transfer agent fees | 15,331,656 | |
Accounting and security lending fees | 1,712,692 | |
Custodian fees and expenses | 1,207,677 | |
Independent trustees' compensation | 39,713 | |
Depreciation in deferred trustee compensation account | (37) | |
Registration fees | 56,697 | |
Audit | 113,545 | |
Legal | 51,751 | |
Interest | 7,829 | |
Miscellaneous | 97,194 | |
Total expenses before reductions | 59,312,249 | |
Expense reductions | (2,662,088) | 56,650,161 |
Net investment income (loss) | | 98,164,015 |
Realized and Unrealized Gain (Loss) Net realized gain (loss) on: | | |
Investment securities: | | |
Unaffiliated issuers | 160,999,122 | |
Other affiliated issuers | 21,634,517 | |
Foreign currency transactions | (2,096,186) | |
Capital gain distributions from Fidelity Central Funds | 17,805 | |
Total net realized gain (loss) | | 180,555,258 |
Change in net unrealized appreciation (depreciation) on: Investment securities | 94,183,082 | |
Assets and liabilities in foreign currencies | 666,146 | |
Total change in net unrealized appreciation (depreciation) | | 94,849,228 |
Net gain (loss) | | 275,404,486 |
Net increase (decrease) in net assets resulting from operations | | $ 373,568,501 |
See accompanying notes which are an integral part of the financial statements.
Annual Report
Statement of Changes in Net Assets
| Year ended
October 31,
2010 | Year ended
October 31,
2009 |
Increase (Decrease) in Net Assets | | |
Operations | | |
Net investment income (loss) | $ 98,164,015 | $ 119,329,980 |
Net realized gain (loss) | 180,555,258 | (1,003,646,089) |
Change in net unrealized appreciation (depreciation) | 94,849,228 | 2,100,809,355 |
Net increase (decrease) in net assets resulting from operations | 373,568,501 | 1,216,493,246 |
Distributions to shareholders from net investment income | (108,455,793) | (81,537,156) |
Distributions to shareholders from net realized gain | (2,308,848) | - |
Total distributions | (110,764,641) | (81,537,156) |
Share transactions - net increase (decrease) | (771,649,789) | 377,264,123 |
Redemption fees | 54,523 | 81,713 |
Total increase (decrease) in net assets | (508,791,406) | 1,512,301,926 |
| | |
Net Assets | | |
Beginning of period | 7,021,480,094 | 5,509,178,168 |
End of period (including undistributed net investment income of $85,893,161 and undistributed net investment income of $98,105,298, respectively) | $ 6,512,688,688 | $ 7,021,480,094 |
Financial Highlights - Overseas
Years ended October 31, | 2010 | 2009 | 2008 | 2007 | 2006 |
Selected Per-Share Data | | | | | |
Net asset value, beginning of period | $ 30.13 | $ 25.43 | $ 58.39 | $ 47.08 | $ 37.65 |
Income from Investment Operations | | | | | |
Net investment income (loss)B | .42 | .52 | .55 | .70 | .63 |
Net realized and unrealized gain (loss) | 1.49 | 4.55 | (27.19) | 15.80 | 9.37 |
Total from investment operations | 1.91 | 5.07 | (26.64) | 16.50 | 10.00 |
Distributions from net investment income | (.47) | (.37) | (.57) | (.55) | (.41) |
Distributions from net realized gain | (.01) | - | (5.75) | (4.64) | (.16) |
Total distributions | (.48) | (.37) | (6.32) | (5.19) | (.57) |
Redemption fees added to paid in capitalB,F | - | - | - | - | - |
Net asset value, end of period | $ 31.56 | $ 30.13 | $ 25.43 | $ 58.39 | $ 47.08 |
Total ReturnA | 6.33% | 20.44% | (50.88)% | 38.79% | 26.83% |
Ratios to Average Net AssetsC,E | | | | | |
Expenses before reductions | .89% | 1.02% | 1.13% | .95% | 1.00% |
Expenses net of fee waivers, if any | .89% | 1.02% | 1.13% | .95% | 1.00% |
Expenses net of all reductions | .85% | .98% | 1.10% | .91% | .90% |
Net investment income (loss) | 1.41% | 2.01% | 1.33% | 1.43% | 1.43% |
Supplemental Data | | | | | |
Net assets, end of period (000 omitted) | $ 5,548,689 | $ 6,602,017 | $ 5,464,901 | $ 9,543,353 | $ 7,217,287 |
Portfolio turnover rateD | 111% | 115% | 113% | 87% | 132% |
A Total returns would have been lower had certain expenses not been reduced during the periods shown.
B Calculated based on average shares outstanding during the period.
C Fees and expenses of the underlying Fidelity Central Funds are not included in the Fund's expense ratio. The Fund indirectly bears its proportionate share of the expenses of any underlying Fidelity Central Funds.
D Amount does not include the portfolio activity of any underlying Fidelity Central Funds.
E Expense ratios reflect operating expenses of the class. Expenses before reductions do not reflect amounts reimbursed by the investment adviser or reductions from brokerage service arrangements or reductions from other expense offset arrangements and do not represent the amount paid by the class during periods when reimbursements or reductions occur. Expenses net of fee waivers reflect expenses after reimbursement by the investment adviser but prior to reductions from brokerage service arrangements or other expense offset arrangements. Expenses net of all reductions represent the net expenses paid by the class.
F Amount represents less than $.01 per share.
See accompanying notes which are an integral part of the financial statements.
Annual Report
Financial Highlights - Class K
Years ended October 31, | 2010 | 2009 | 2008G |
Selected Per-Share Data | | | |
Net asset value, beginning of period | $ 30.16 | $ 25.45 | $ 45.00 |
Income from Investment Operations | | | |
Net investment income (loss)D | .47 | .59 | .13 |
Net realized and unrealized gain (loss) | 1.50 | 4.54 | (19.68) |
Total from investment operations | 1.97 | 5.13 | (19.55) |
Distributions from net investment income | (.53) | (.42) | - |
Distributions from net realized gain | (.01) | - | - |
Total distributions | (.54) | (.42) | - |
Redemption fees added to paid in capitalD,I | - | - | - |
Net asset value, end of period | $ 31.59 | $ 30.16 | $ 25.45 |
Total ReturnB,C | 6.55% | 20.73% | (43.44)% |
Ratios to Average Net AssetsE,H | | | |
Expenses before reductions | .69% | .78% | .96%A |
Expenses net of fee waivers, if any | .69% | .78% | .96%A |
Expenses net of all reductions | .66% | .74% | .93%A |
Net investment income (loss) | 1.60% | 2.25% | 1.08%A |
Supplemental Data | | | |
Net assets, end of period (000 omitted) | $ 368,004 | $ 383,048 | $ 44,277 |
Portfolio turnover rateF | 111% | 115% | 113% |
A Annualized
B Total returns for periods of less than one year are not annualized.
C Total returns would have been lower had certain expenses not been reduced during the periods shown.
D Calculated based on average shares outstanding during the period.
E Fees and expenses of the underlying Fidelity Central Funds are not included in the Fund's expense ratio. The Fund indirectly bears its proportionate share of the expenses of any underlying Fidelity Central Funds.
F Amount does not include the portfolio activity of any underlying Fidelity Central Funds.
G For the period May 9, 2008 (commencement of sale of shares) to October 31, 2008.
H Expense ratios reflect operating expenses of the class. Expenses before reductions do not reflect amounts reimbursed by the investment adviser or reductions from brokerage service arrangements or reductions from other expense offset arrangements and do not represent the amount paid by the class during periods when reimbursements or reductions occur. Expense ratios before reductions for start-up periods may not be representative of longer-term operating periods. Expenses net of fee waivers reflect expenses after reimbursement by the investment adviser but prior to reductions from brokerage service arrangements or other expense offset arrangements. Expenses net of all reductions represent the net expenses paid by the class.
I Amount represents less than $.01 per share.
Financial Highlights - Class F
Years ended October 31, | 2010 | 2009G |
Selected Per-Share Data | | |
Net asset value, beginning of period | $ 30.15 | $ 26.62 |
Income from Investment Operations | | |
Net investment income (loss)D | .48 | .07 |
Net realized and unrealized gain (loss) | 1.51 | 3.46 |
Total from investment operations | 1.99 | 3.53 |
Distributions from net investment income | (.55) | - |
Distributions from net realized gain | (.01) | - |
Total distributions | (.56) | - |
Redemption fees added to paid in capitalD,I | - | - |
Net asset value, end of period | $ 31.58 | $ 30.15 |
Total ReturnB,C | 6.60% | 13.26% |
Ratios to Average Net AssetsE,H | | |
Expenses before reductions | .64% | .68%A |
Expenses net of fee waivers, if any | .64% | .68%A |
Expenses net of all reductions | .60% | .64%A |
Net investment income (loss) | 1.66% | .70%A |
Supplemental Data | | |
Net assets, end of period (000 omitted) | $ 595,995 | $ 36,415 |
Portfolio turnover rateF | 111% | 115% |
A Annualized
B Total returns for periods of less than one year are not annualized.
C Total returns would have been lower had certain expenses not been reduced during the periods shown.
D Calculated based on average shares outstanding during the period.
E Fees and expenses of the underlying Fidelity Central Funds are not included in the Fund's expense ratio. The Fund indirectly bears its proportionate share of the expenses of any underlying Fidelity Central Funds.
F Amount does not include the portfolio activity of any underlying Fidelity Central Funds.
G For the period June 26, 2009 (commencement of sale of shares) to October 31, 2009.
H Expense ratios reflect operating expenses of the class. Expenses before reductions do not reflect amounts reimbursed by the investment adviser or reductions from brokerage service arrangements or reductions from other expense offset arrangements and do not represent the amount paid by the class during periods when reimbursements or reductions occur. Expense ratios before reductions for start-up periods may not be representative of longer-term operating periods. Expenses net of fee waivers reflect expenses after reimbursement by the investment adviser but prior to reductions from brokerage service arrangements or other expense offset arrangements. Expenses net of all reductions represent the net expenses paid by the class.
I Amount represents less than $.01 per share.
See accompanying notes which are an integral part of the financial statements.
Annual Report
Notes to Financial Statements
For the period ended October 31, 2010
1. Organization.
Fidelity Overseas Fund (the Fund) is a fund of Fidelity Investment Trust (the Trust) and is authorized to issue an unlimited number of shares. The Trust is registered under the Investment Company Act of 1940, as amended (the 1940 Act), as an open-end management investment company organized as a Massachusetts business trust. The Fund offers Overseas, Class K, and Class F shares each of which has equal rights as to assets and voting privileges. Each class has exclusive voting rights with respect to matters that affect that class. Class F shares of the Fund are only available for purchase by mutual funds for which Fidelity Management & Research Company (FMR) or an affiliate serves as investment manager. Investment income, realized and unrealized capital gains and losses, the common expenses of the Fund, and certain fund-level expense reductions, if any, are allocated on a pro-rata basis to each class based on the relative net assets of each class to the total net assets of the Fund. Each class differs with respect to transfer agent fees incurred. Certain expense reductions also differ by class. The Fund's investments in emerging markets can be subject to social, economic, regulatory, and political uncertainties and can be extremely volatile.
2. Investments in Fidelity Central Funds.
The Fund may invest in Fidelity Central Funds, which are open-end investment companies available only to other investment companies and accounts managed by FMR and its affiliates. The Fund's Schedule of Investments lists each of the Fidelity Central Funds held as of period end, if any, as an investment of the Fund, but does not include the underlying holdings of each Fidelity Central Fund. As an Investing Fund, the Fund indirectly bears its proportionate share of the expenses of the underlying Fidelity Central Funds.
The Money Market Central Funds seek preservation of capital and current income and are managed by Fidelity Investments Money Management, Inc. (FIMM), an affiliate of FMR.
A complete unaudited list of holdings for each Fidelity Central Fund is available upon request or at the Securities and Exchange Commission (the SEC) web site at www.sec.gov. In addition, the financial statements of the Fidelity Central Funds, which are not covered by the Fund's Report of Independent Registered Public Accounting Firm, are available on the SEC web site or upon request.
3. Significant Accounting Policies.
The financial statements have been prepared in conformity with accounting principles generally accepted in the United States of America (GAAP), which require management to make certain estimates and assumptions at the date of the financial statements. Actual results could differ from those estimates. The following summarizes the significant accounting policies of the Fund:
Security Valuation. Investments are valued as of 4:00 p.m. Eastern time on the last calendar day of the period. The Fund uses independent pricing services approved by the Board of Trustees to value its investments. When current market prices or quotations are not readily available or reliable, valuations may be determined in good faith in accordance with procedures adopted by the Board of Trustees. Factors used in determining value may include market or security specific events. The frequency with which these procedures are used cannot be predicted and they may be utilized to a significant extent. The value used for net asset value (NAV) calculation under these procedures may differ from published prices for the same securities.
The Fund categorizes the inputs to valuation techniques used to value its investments into a disclosure hierarchy consisting of three levels as shown below.
Level 1 - quoted prices in active markets for identical investments
Level 2 - other significant observable inputs (including quoted prices for similar investments, interest rates, prepayment speeds, etc.)
Level 3 - unobservable inputs (including the fund's own assumptions based on the best information available)
Changes in valuation techniques may result in transfers in or out of an assigned level within the disclosure hierarchy. The aggregate value of investments by input level, as of October 31, 2010, as well as a roll forward of Level 3 securities, is included at the end of the Fund's Schedule of Investments. Valuation techniques used to value the Fund's investments by major category are as follows.
Equity securities, including restricted securities, for which market quotations are readily available, are valued at the last reported sale price or official closing price as reported by an independent pricing service on the primary market or exchange on which they are traded and are categorized as Level 1 in the hierarchy. In the event there were no sales during the day or closing prices are not available, securities are valued at the last quoted bid price or may be valued using the last available price and are generally categorized as Level 2 in the hierarchy. For foreign equity securities, when significant market or security specific events arise, comparisons to the valuation of American Depositary Receipts (ADRs), futures contracts, Exchange-traded funds (ETFs) and certain indexes as well as quoted prices for similar securities are used and are categorized as Level 2 in the hierarchy in these circumstances. Utilizing these techniques may result in transfers between Level 1 and Level 2. For restricted equity securities and private placements where observable inputs are limited, assumptions about market activity and risk are used and are categorized as Level 3 in the hierarchy.
Annual Report
Notes to Financial Statements - continued
3. Significant Accounting Policies - continued
Security Valuation - continued
Investments in open-end mutual funds,including Fidelity Central Funds, are valued at their closing net asset value each business day and are categorized as Level 1 in the hierarchy. Short-term securities with remaining maturities of sixty days or less for which quotations are not readily available are valued at amortized cost, which approximates fair value and are categorized as Level 2 in the hierarchy.
Foreign Currency. The Fund uses foreign currency contracts to facilitate transactions in foreign-denominated securities. Gains and losses from these transactions may arise from changes in the value of the foreign currency or if the counterparties do not perform under the contracts' terms.
Foreign-denominated assets, including investment securities, and liabilities are translated into U.S. dollars at the exchange rate at period end. Purchases and sales of investment securities, income and dividends received and expenses denominated in foreign currencies are translated into U.S. dollars at the exchange rate in effect on the transaction date.
The effects of exchange rate fluctuations on investments are included with the net realized and unrealized gain (loss) on investment securities. Other foreign currency transactions resulting in realized and unrealized gain (loss) are disclosed separately.
Investment Transactions and Income. For financial reporting purposes, the Fund's investment holdings and NAV include trades executed through the end of the last business day of the period. The NAV per share for processing shareholder transactions is calculated as of the close of business of the New York Stock Exchange (NYSE), normally 4:00 p.m. Eastern time and includes trades executed through the end of the prior business day. Gains and losses on securities sold are determined on the basis of identified cost and may include proceeds received from litigation. Dividend income is recorded on the ex-dividend date, except for certain dividends from foreign securities where the ex-dividend date may have passed, which are recorded as soon as the Fund is informed of the ex-dividend date. Non-cash dividends included in dividend income, if any, are recorded at the fair market value of the securities received. Distributions received on securities that represent a return of capital or capital gain are recorded as a reduction of cost of investments and/or as a realized gain. The Fund estimates the components of distributions received that may be considered return of capital distributions or capital gain distributions. Interest income and distributions from the Fidelity Central Funds are accrued as earned. Interest income includes coupon interest and amortization of premium and accretion of discount on debt securities. Investment income is recorded net of foreign taxes withheld where recovery of such taxes is uncertain.
Expenses. Most expenses of the Trust can be directly attributed to a fund. Expenses which cannot be directly attributed are apportioned amongst each fund in the Trust. Expense estimates are accrued in the period to which they relate and adjustments are made when actual amounts are known.
Deferred Trustee Compensation. Under a Deferred Compensation Plan (the Plan), independent Trustees may elect to defer receipt of a portion of their annual compensation. Deferred amounts are invested in a cross-section of Fidelity funds, are marked-to-market and remain in the Fund until distributed in accordance with the Plan. The investment of deferred amounts and the offsetting payable to the Trustees are included in the accompanying Statement of Assets and Liabilities.
Income Tax Information and Distributions to Shareholders. Each year the Fund intends to qualify as a regulated investment company, including distributing substantially all of its taxable income and realized gains under Subchapter M of the Internal Revenue Code and filing its U.S. federal tax return. As a result, no provision for income taxes is required. As of October 31, 2010, the Fund did not have any unrecognized tax benefits in the accompanying financial statements. A fund's federal tax return is subject to examination by the Internal Revenue Service (IRS) for a period of three years. Foreign taxes are provided for based on the Fund's understanding of the tax rules and rates that exist in the foreign markets in which it invests.
Distributions are declared and recorded on the ex-dividend date. Income dividends and capital gain distributions are declared separately for each class. Income and capital gain distributions are determined in accordance with income tax regulations, which may differ from GAAP.
Capital accounts within the financial statements are adjusted for permanent book-tax differences. These adjustments have no impact on net assets or the results of operations. Temporary book-tax differences will reverse in a subsequent period.
Book-tax differences are primarily due to short-term capital gain distributions from the Fidelity Central Funds, foreign currency transactions, passive foreign investment companies (PFIC), deferred trustees compensation, capital loss carryforwards and losses deferred due to wash sales.
The federal tax cost of investment securities and unrealized appreciation (depreciation) as of period end were as follows:
Gross unrealized appreciation | $ 680,769,014 |
Gross unrealized depreciation | (481,671,593) |
Net unrealized appreciation (depreciation) | $ 199,097,421 |
| |
Tax Cost | $ 6,400,623,997 |
Annual Report
3. Significant Accounting Policies - continued
Income Tax Information and Distributions to Shareholders - continued
The tax-based components of distributable earnings as of period end were as follows:
Undistributed ordinary income | $ 86,052,773 |
Capital loss carryforward | $ (1,637,677,232) |
Net unrealized appreciation (depreciation) | $ 199,945,316 |
The tax character of distributions paid was as follows:
| October 31, 2010 | October 31, 2009 |
Ordinary Income | $ 110,764,641 | $ 81,537,156 |
Short-Term Trading (Redemption) Fees. Shares held by investors in the Fund less than 30 days are subject to a redemption fee equal to 1.00% of the net asset value of shares redeemed. All redemption fees, which reduce the proceeds of the shareholder redemption, are retained by the Fund and accounted for as an addition to paid in capital.
4. Purchases and Sales of Investments.
Purchases and sales of securities, other than short-term securities, aggregated $7,369,512,168 and $8,098,799,007, respectively.
5. Fees and Other Transactions with Affiliates.
Management Fee. FMR and its affiliates provide the Fund with investment management related services for which the Fund pays a monthly management fee. The management fee is the sum of an individual fund fee rate that is based on an annual rate of .45% of the Fund's average net assets and a group fee rate that averaged .26% during the period. The group fee rate is based upon the average net assets of all the mutual funds advised by FMR. The group fee rate decreases as assets under management increase and increases as assets under management decrease. In addition, the management fee is subject to a performance adjustment(up to a maximum of ±.20% of the Fund's average net assets over a 36 month performance period). The upward or downward adjustment to the management fee is based on the relative investment performance of Overseas as compared to an appropriate benchmark index. For the period, the total annual management fee rate, including the performance adjustment, was ..59% of the Fund's average net assets.
Transfer Agent Fees. Fidelity Investments Institutional Operations Company, Inc. (FIIOC), an affiliate of FMR, is the transfer, dividend disbursing and shareholder servicing agent for each class of the Fund. FIIOC receives account fees and asset-based fees that vary according to the account size and type of account of the shareholders of Overseas. FIIOC receives an asset-based fee of Class K's average net assets. FIIOC receives no fees for providing transfer agency services to Class F. FIIOC pays for typesetting, printing and mailing of shareholder reports, except proxy statements. For the period, transfer agent fees for each class were as follows:
| Amount | % of
Average
Net Assets |
Overseas | 15,119,234 | .25 |
Class K | 212,422 | .05 |
| $ 15,331,656 | |
Accounting and Security Lending Fees. Fidelity Service Company, Inc. (FSC), an affiliate of FMR, maintains the Fund's accounting records. The accounting fee is based on the level of average net assets for the month. Under a separate contract, FSC administers the security lending program. The security lending fee is based on the number and duration of lending transactions.
Brokerage Commissions. The Fund placed a portion of its portfolio transactions with brokerage firms which are affiliates of the investment adviser. The commissions paid to these affiliated firms were $7,413 for the period.
Annual Report
Notes to Financial Statements - continued
5. Fees and Other Transactions with Affiliates - continued
Interfund Lending Program. Pursuant to an Exemptive Order issued by the SEC, the Fund, along with other registered investment companies having management contracts with FMR, may participate in an interfund lending program. This program provides an alternative credit facility allowing the funds to borrow from, or lend money to, other participating affiliated funds. At period end, there were no interfund loans outstanding. The Fund's activity in this program during the period for which loans were outstanding was as follows:
Borrower or Lender | Average Daily
Loan Balance | Weighted Average
Interest Rate | Interest
Expense |
Borrower | $ 22,768,107 | .44% | $ 7,829 |
6. Committed Line of Credit.
The Fund participates with other funds managed by FMR or an affiliate in a $3.75 billion credit facility (the "line of credit") to be utilized for temporary or emergency purposes to fund shareholder redemptions or for other short-term liquidity purposes. The Fund has agreed to pay commitment fees on its pro-rata portion of the line of credit, which amounted to $27,318 and is reflected in Miscellaneous expenses on the Statement of Operations. During the period, there were no borrowings on this line of credit.
7. Security Lending.
The Fund lends portfolio securities through a lending agent from time to time in order to earn additional income. The lending agent may loan securities to certain qualified borrowers, including Fidelity Capital Markets (FCM), a broker-dealer affiliated with the Fund. On the settlement date of the loan, the Fund receives collateral (in the form of U.S. Treasury obligations, letters of credit and/or cash) against the loaned securities and maintains collateral in an amount not less than 100% of the market value of the loaned securities during the period of the loan. The market value of the loaned securities is determined at the close of business of the Fund and any additional required collateral is delivered to the Fund on the next business day. If the borrower defaults on its obligation to return the securities loaned because of insolvency or other reasons, a fund could experience delays and costs in recovering the securities loaned or in gaining access to the collateral. Any cash collateral received is invested in the Fidelity Securities Lending Cash Central Fund. The value of loaned securities and cash collateral at period end are disclosed on the Fund's Statement of Assets and Liabilities. Security lending income represents the income earned on investing cash collateral, less rebates paid to borrowers and lending agent fees associated with the loan, plus any premium payments received for lending certain types of securities. Security lending income is presented in the Statement of Operations as a component of income from Fidelity Central Funds. Total security lending income during the period amounted to $6,382,864. During the period, there were no securities loaned to FCM.
8. Expense Reductions.
Many of the brokers with whom FMR places trades on behalf of the Fund provided services to the Fund in addition to trade execution. These services included payments of certain expenses on behalf of the Fund totaling $2,661,854 for the period. In addition, through arrangements with the Fund's custodian credits realized as a result of uninvested cash balances were used to reduce the Fund's expenses. During the period, these credits reduced the Fund's custody expenses by $234.
9. Distributions to Shareholders.
Distributions to shareholders of each class were as follows:
Years ended October 31, | 2010 | 2009A |
From net investment income | | |
Overseas | $ 100,374,591 | $ 78,759,447 |
Class K | 6,711,130 | 2,777,709 |
Class F | 1,370,072 | - |
Total | $ 108,455,793 | $ 81,537,156 |
From net realized gain | | |
Overseas | $ 2,158,312 | $ - |
Class K | 126,111 | - |
Class F | 24,425 | - |
Total | $ 2,308,848 | $ - |
A Distributions to shareholders for Class F are for the period June 26, 2009 (commencement of sale of shares) to October 31, 2009.
Annual Report
10. Share Transactions.
Transactions for each class of shares were as follows:
| Shares | Dollars |
Years ended October 31, | 2010 | 2009A | 2010 | 2009A |
Overseas | | | | |
Shares sold | 36,113,789 | 47,857,124 | $ 1,067,886,397 | $ 1,179,178,777 |
Conversion to Class KB | - | (11,269,934) | - | (265,380,751) |
Reinvestment of distributions | 3,238,247 | 3,481,434 | 101,747,555 | 78,089,426 |
Shares redeemed | (82,678,886) | (35,803,556) | (2,430,908,864) | (910,091,016) |
Net increase (decrease) | (43,326,850) | 4,265,068 | ($ 1,261,274,912) | $ 81,796,436 |
Class K | | | | |
Shares sold | 5,090,117 | 2,178,017 | $ 151,156,491 | $ 56,176,528 |
Conversion from OverseasB | - | 11,270,235 | - | 265,380,751 |
Reinvestment of distributions | 217,803 | 123,950 | 6,837,242 | 2,777,709 |
Shares redeemed | (6,358,836) | (2,610,676) | (189,093,826) | (67,054,987) |
Net increase (decrease) | (1,050,916) | 10,961,526 | ($ 31,100,093) | $ 257,280,001 |
Class F | | | | |
Shares sold | 22,173,982 | 1,220,610 | $ 652,570,206 | $ 38,599,366 |
Reinvestment of distributions | 44,465 | - | 1,394,498 | - |
Shares redeemed | (4,555,729) | (12,931) | (133,239,488) | (411,680) |
Net increase (decrease) | 17,662,718 | 1,207,679 | $ 520,725,216 | $ 38,187,686 |
A Share transactions for Class F are for the period June 26, 2009 (commencement of sale of shares) to October 31, 2009.
B Conversion transactions for class K and Overseas are presented for the period November 1, 2008 through August 31, 2009.
11. Other.
The Fund's organizational documents provide former and current trustees and officers with a limited indemnification against liabilities arising in connection with the performance of their duties to the Fund. In the normal course of business, the Fund may also enter into contracts that provide general indemnifications. The Fund's maximum exposure under these arrangements is unknown as this would be dependent on future claims that may be made against the Fund. The risk of material loss from such claims is considered remote.
The Fidelity Freedom Funds and Fidelity Freedom K® Funds were the owners of record, in the aggregate, of approximately 52% of the total outstanding shares of the Fund.
Annual Report
Report of Independent Registered Public Accounting Firm
To the Trustees of Fidelity Investment Trust and the Shareholders of Fidelity Overseas Fund:
In our opinion, the accompanying statement of assets and liabilities, including the schedule of investments, and the related statements of operations and of changes in net assets and the financial highlights present fairly, in all material respects, the financial position of Fidelity Overseas Fund (a fund of Fidelity Investment Trust) at October 31, 2010, the results of its operations for the year then ended, the changes in its net assets for each of the two years in the period then ended and the financial highlights for each of the periods indicated, in conformity with accounting principles generally accepted in the United States of America. These financial statements and financial highlights (hereafter referred to as "financial statements") are the responsibility of the Fidelity Overseas Fund's management. Our responsibility is to express an opinion on these financial statements based on our audits. We conducted our audits of these financial statements in accordance with the standards of the Public Company Accounting Oversight Board (United States). Those standards require that we plan and perform the audit to obtain reasonable assurance about whether the financial statements are free of material misstatement. An audit includes examining, on a test basis, evidence supporting the amounts and disclosures in the financial statements, assessing the accounting principles used and significant estimates made by management, and evaluating the overall financial statement presentation. We believe that our audits, which included confirmation of securities at October 31, 2010 by correspondence with the custodian and brokers, provide a reasonable basis for our opinion.
/s/ PricewaterhouseCoopers LLP
PricewaterhouseCoopers LLP
Boston, Massachusetts
December 17, 2010
Annual Report
Fidelity Worldwide Fund
As a shareholder of the Fund, you incur two types of costs: (1) transaction costs, including sales charges (loads) on purchase payments or redemption proceeds, redemption fees, and (2) ongoing costs, including management fees, distribution and/or service (12b-1) fees and other Fund expenses. This Example is intended to help you understand your ongoing costs (in dollars) of investing in the Fund and to compare these costs with the ongoing costs of investing in other mutual funds.
The Example is based on an investment of $1,000 invested at the beginning of the period and held for the entire period (May 1, 2010 to October 31, 2010).
Actual Expenses
The first line of the accompanying table for each class of the Fund provides information about actual account values and actual expenses. You may use the information in this line, together with the amount you invested, to estimate the expenses that you paid over the period. Simply divide your account value by $1,000.00 (for example, an $8,600 account value divided by $1,000.00 = 8.6), then multiply the result by the number in the first line for a class of the Fund under the heading entitled "Expenses Paid During Period" to estimate the expenses you paid on your account during this period. A small balance maintenance fee of $12.00 that is charged once a year may apply for certain accounts with a value of less than $2,000. This fee is not included in the table below. If it was, the estimate of expenses you paid during the period would be higher, and your ending account value lower, by this amount. In addition, the Fund, as a shareholder in the underlying Fidelity Central Funds, will indirectly bear its pro-rata share of the fees and expenses incurred by the underlying Fidelity Central Funds. These fees and expenses are not included in the Fund's annualized expense ratio used to calculate the expense estimate in the table below.
Hypothetical Example for Comparison Purposes
The second line of the accompanying table for each class of the Fund provides information about hypothetical account values and hypothetical expenses based on a Class' actual expense ratio and an assumed rate of return of 5% per year before expenses, which is not the Class' actual return. The hypothetical account values and expenses may not be used to estimate the actual ending account balance or expenses you paid for the period. You may use this information to compare the ongoing costs of investing in the Fund and other funds. To do so, compare this 5% hypothetical example with the 5% hypothetical examples that appear in the shareholder reports of the other funds. A small balance maintenance fee of $12.00 that is charged once a year may apply for certain accounts with a value of less than $2,000. This fee is not included in the table below. If it was, the estimate of expenses you paid during the period would be higher, and your ending account value lower, by this amount. In addition, the Fund, as a shareholder in the underlying Fidelity Central Funds, will indirectly bear its pro-rata share of the fees and expenses incurred by the underlying Fidelity Central Funds. These fees and expenses are not included in the Fund's annualized expense ratio used to calculate the expense estimate in the table below.
Please note that the expenses shown in the table are meant to highlight your ongoing costs only and do not reflect any transaction costs. Therefore, the second line of the table is useful in comparing ongoing costs only, and will not help you determine the relative total costs of owning different funds. In addition, if these transactional costs were included, your costs would have been higher.
| Annualized
Expense Ratio | Beginning
Account Value
May 1, 2010 | Ending
Account Value
October 31, 2010 | Expenses Paid
During Period*
May 1, 2010
to October 31, 2010 |
Class A | 1.42% | | | |
Actual | | $ 1,000.00 | $ 1,044.80 | $ 7.32 |
HypotheticalA | | $ 1,000.00 | $ 1,018.05 | $ 7.22 |
Class T | 1.68% | | | |
Actual | | $ 1,000.00 | $ 1,043.60 | $ 8.65 |
HypotheticalA | | $ 1,000.00 | $ 1,016.74 | $ 8.54 |
Class B | 2.17% | | | |
Actual | | $ 1,000.00 | $ 1,040.70 | $ 11.16 |
HypotheticalA | | $ 1,000.00 | $ 1,014.27 | $ 11.02 |
Class C | 2.17% | | | |
Actual | | $ 1,000.00 | $ 1,040.80 | $ 11.16 |
HypotheticalA | | $ 1,000.00 | $ 1,014.27 | $ 11.02 |
Worldwide | 1.11% | | | |
Actual | | $ 1,000.00 | $ 1,045.80 | $ 5.72 |
HypotheticalA | | $ 1,000.00 | $ 1,019.61 | $ 5.65 |
Institutional Class | 1.18% | | | |
Actual | | $ 1,000.00 | $ 1,045.80 | $ 6.08 |
HypotheticalA | | $ 1,000.00 | $ 1,019.26 | $ 6.01 |
A 5% return per year before expenses
* Expenses are equal to each Class' annualized expense ratio, multiplied by the average account value over the period, multiplied by 184/365 (to reflect the one-half year period).
Annual Report
Fidelity Worldwide Fund
Performance: The Bottom Line
Average annual total return reflects the change in the value of an investment, assuming reinvestment of the class' distributions from dividend income and capital gains (the profits earned upon the sale of securities that have grown in value, if any) and assuming a constant rate of performance each year. The $10,000 table and the fund's returns do not reflect the deduction of taxes that a shareholder would pay on fund distributions or the redemption of fund shares. During periods of reimbursement by Fidelity, a fund's total return will be greater than it would be had the reimbursement not occurred. How a fund did yesterday is no guarantee of how it will do tomorrow.
Average Annual Total Returns
Periods ended October 31, 2010 | Past 1
year | Past 5
years | Past 10
years |
Fidelity Worldwide Fund | 18.18% | 4.93% | 4.19% |
$10,000 Over 10 Years
Let's say hypothetically that $10,000 was invested in Fidelity Worldwide Fund, a class of the fund, on October 31, 2000. The chart shows how the value of your investment would have changed, and also shows how the MSCI World Index performed over the same period.
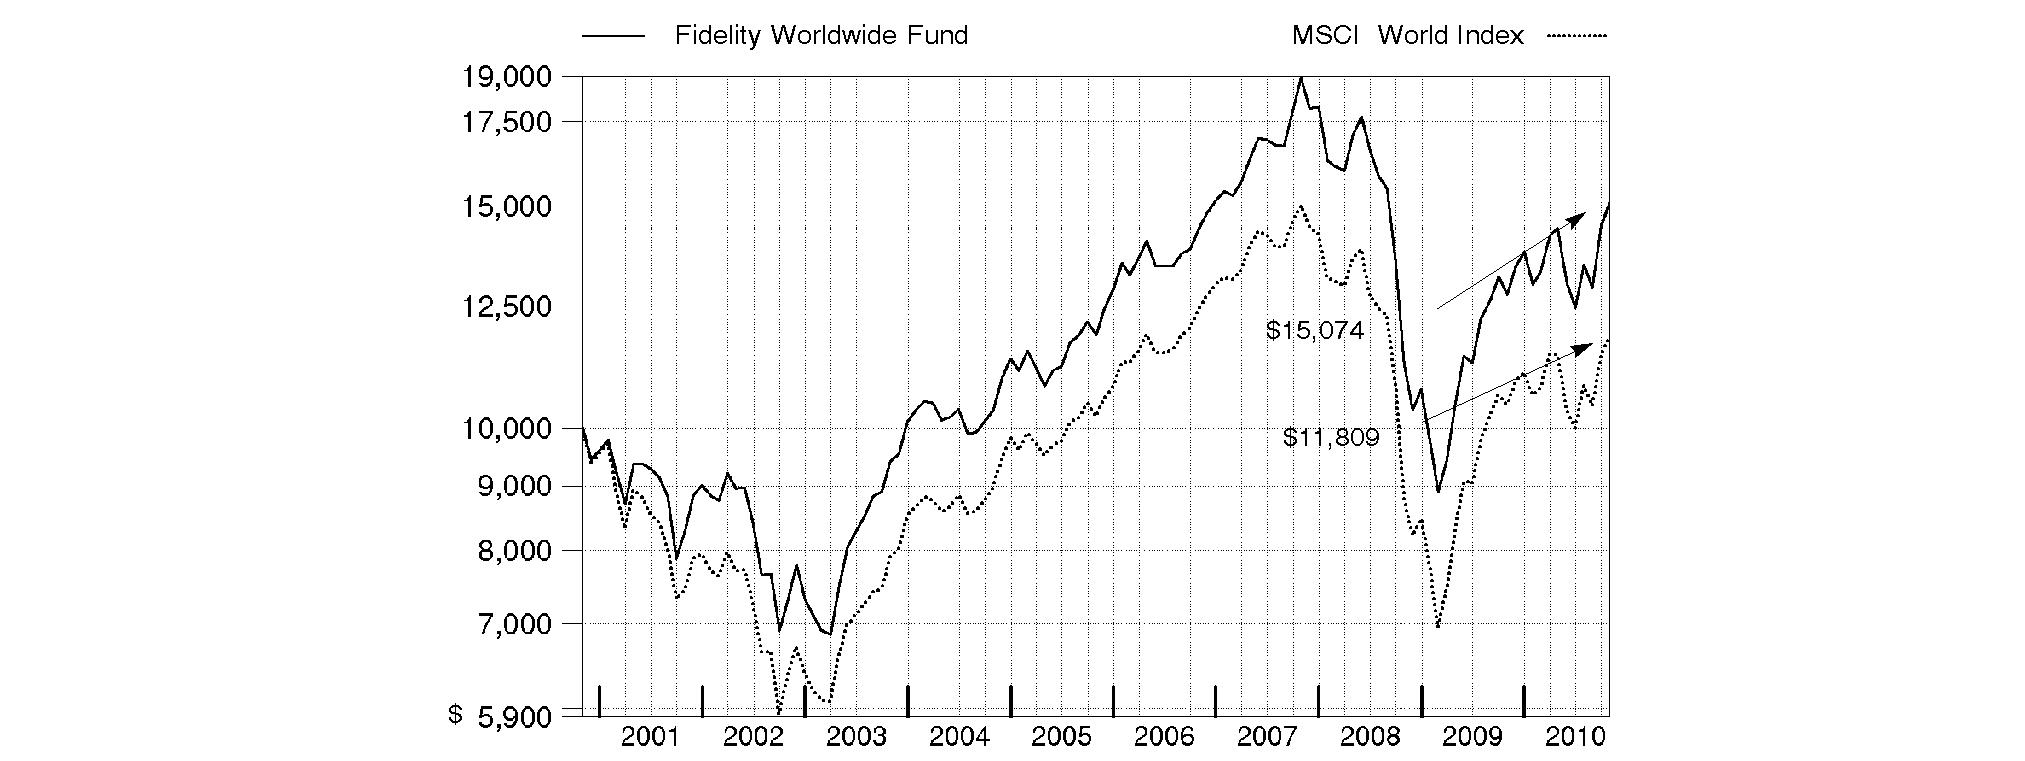
Annual Report
Fidelity Worldwide Fund
Market Recap: Developed-markets equities rode a wave of volatility during the 12 months ending October 31, 2010, en route to producing above-average gains. Stocks posted solid advances in the first half of the period, despite growing concerns about the Greece-led European debt crisis. Sentiment turned decidedly negative in May and June, however, and the market suffered a precipitous decline. These losses were more than offset during the last four months of the period, when signs of economic growth and subsiding debt fears helped propel developed-world stocks about 18%. For the full year, the MSCI® World Index gained 13.15%, boosted in part by a generally depreciating U.S. dollar. Within the index, Canada and the United States were standouts, returning 23% and 17%, respectively. U.S. stocks - which comprised almost half of the index - were lifted by economic optimism, encouraging earnings reports and a wave of corporate mergers. The Pacific Basin ex-Japan segment rose 15% for the period, aided in part by solid results from Hong Kong. Elsewhere, the U.K. returned 13%, while the remainder of Europe rose just 7%, held back mainly by debt-riddled Spain and Italy, as well as lagging major constituent France. Japan advanced only 5%, a result of that nation's continued weak economy.
Comments from William Kennedy, Lead Portfolio Manager of Fidelity® Worldwide Fund and manager of its non-U.S. equity subportfolio, and Stephen DuFour, Co-Portfolio Manager responsible for the fund's U.S. equity subportfolio: For the 12 months ending October 31, 2010, the fund's Retail Class shares returned 18.18%, outpacing the MSCI index. Our focus on reasonably valued stocks with good balance sheets and strong earnings growth prospects helped drive favorable stock selection, especially in the information technology and industrials sectors. U.S. stocks - about 47% of assets, on average - had the biggest positive impact on performance. Good stock picking within strong-performing emerging markets, where the fund had a small out-of-benchmark stake, also contributed, as did favorable positioning in Europe and Japan. Weak security selection and an underweighting in Canada - along with the associated currency drag - disappointing stock selection in energy and a small cash position hampered performance. Individual contributors included Cummins, a leading diesel engine manufacturer, and Union Pacific, a West Coast railroad company. Both of these industrials firms benefited from a recovering economy. Within technology, Apple was up sharply, thanks to the successful launch of the iPad and worldwide growth of the iPhone. Untimely ownership of both General Electric, a diversified conglomerate in the industrials sector, and coal company Peabody Energy detracted from results. These stocks were sold from the fund by period end.
The views expressed above reflect those of the portfolio manager(s) only through the end of the period as stated on the cover of this report and do not necessarily represent the views of Fidelity or any other person in the Fidelity organization. Any such views are subject to change at any time based upon market or other conditions and Fidelity disclaims any responsibility to update such views. These views may not be relied on as investment advice and, because investment decisions for a Fidelity fund are based on numerous factors, may not be relied on as an indication of trading intent on behalf of any Fidelity fund.
Annual Report
Fidelity Worldwide Fund
Investment Changes (Unaudited)
Geographic Diversification (% of fund's net assets) |
As of October 31, 2010 |
| United States of America | 47.3% | |
| United Kingdom | 10.6% | |
| Japan | 6.1% | |
| Germany | 4.5% | |
| France | 4.4% | |
| Switzerland | 3.9% | |
| Spain | 1.9% | |
| Denmark | 1.9% | |
| India | 1.7% | |
| Other | 17.7% | |

Percentages are adjusted for the effect of futures contracts, if applicable. |
As of April 30, 2010 |
| United States of America | 50.2% | |
| United Kingdom | 9.8% | |
| Japan | 9.1% | |
| France | 4.7% | |
 | Switzerland | 3.6% | |
| Germany | 3.3% | |
| Netherlands | 1.8% | |
| Australia | 1.5% | |
| Spain | 1.4% | |
| Other | 14.6% | |

Percentages are adjusted for the effect of futures contracts, if applicable. |
Asset Allocation |
| % of fund's
net assets | % of fund's net assets
6 months ago |
Stocks | 98.2 | 98.6 |
Bonds | 0.2 | 0.0 |
Short-Term Investments and Net Other Assets | 1.6 | 1.4 |
Top Ten Stocks as of October 31, 2010 |
| % of fund's
net assets | % of fund's net assets
6 months ago |
Union Pacific Corp. (United States of America, Road & Rail) | 2.7 | 2.7 |
Cummins, Inc. (United States of America, Machinery) | 2.3 | 2.2 |
Exxon Mobil Corp. (United States of America, Oil, Gas & Consumable Fuels) | 2.0 | 0.0 |
Estee Lauder Companies, Inc. Class A (United States of America, Personal Products) | 1.9 | 0.9 |
Google, Inc. Class A (United States of America, Internet Software & Services) | 1.8 | 0.0 |
Apple, Inc. (United States of America, Computers & Peripherals) | 1.8 | 2.3 |
Perrigo Co. (United States of America, Pharmaceuticals) | 1.5 | 0.4 |
Edwards Lifesciences Corp. (United States of America, Health Care Equipment & Supplies) | 1.3 | 0.6 |
eBay, Inc. (United States of America, Internet Software & Services) | 1.3 | 0.0 |
CSX Corp. (United States of America, Road & Rail) | 1.3 | 0.9 |
| 17.9 | |
Market Sectors as of October 31, 2010 |
| % of fund's
net assets | % of fund's net assets
6 months ago |
Industrials | 17.0 | 15.8 |
Consumer Discretionary | 17.1 | 16.7 |
Information Technology | 15.6 | 15.2 |
Financials | 13.5 | 18.9 |
Health Care | 10.3 | 10.3 |
Energy | 8.4 | 8.8 |
Consumer Staples | 7.0 | 5.6 |
Materials | 6.3 | 4.6 |
Telecommunication Services | 3.0 | 1.9 |
Utilities | 0.2 | 0.8 |
Annual Report
Fidelity Worldwide Fund
Investments October 31, 2010
Showing Percentage of Net Assets
Common Stocks - 96.8% |
| Shares | | Value |
Australia - 1.5% |
Australia & New Zealand Banking Group Ltd. | 244,941 | | $ 5,953,320 |
JB Hi-Fi Ltd. | 75,078 | | 1,462,177 |
Macquarie Group Ltd. | 78,951 | | 2,799,865 |
Newcrest Mining Ltd. | 70,629 | | 2,764,900 |
Wesfarmers Ltd. | 61,452 | | 1,995,076 |
Westfield Group unit | 128,519 | | 1,558,687 |
TOTAL AUSTRALIA | | 16,534,025 |
Bailiwick of Jersey - 0.3% |
Experian PLC | 201,300 | | 2,339,830 |
Informa PLC | 111,595 | | 779,533 |
TOTAL BAILIWICK OF JERSEY | | 3,119,363 |
Belgium - 0.6% |
Anheuser-Busch InBev SA NV | 98,425 | | 6,167,699 |
EVS Broadcast Equipment SA | 13,200 | | 828,358 |
TOTAL BELGIUM | | 6,996,057 |
Bermuda - 0.5% |
Huabao International Holdings Ltd. | 1,495,000 | | 2,252,746 |
Li & Fung Ltd. | 258,000 | | 1,363,019 |
Noble Group Ltd. | 1,474,363 | | 2,118,763 |
Sihuan Pharmaceutical Holdings Group Ltd. | 53,000 | | 38,496 |
TOTAL BERMUDA | | 5,773,024 |
Brazil - 1.0% |
Banco ABC Brasil SA | 60,000 | | 591,112 |
Banco Santander (Brasil) SA ADR | 102,900 | | 1,481,760 |
Cia Hering SA | 4,000 | | 196,920 |
Diagnosticos da America SA | 135,000 | | 1,666,471 |
Drogasil SA | 85,300 | | 2,157,571 |
Hypermarcas SA (a) | 13,000 | | 213,967 |
Lojas Renner SA | 7,000 | | 276,511 |
Natura Cosmeticos SA | 7,000 | | 200,388 |
Souza Cruz Industria Comerico | 85,300 | | 4,382,832 |
TOTAL BRAZIL | | 11,167,532 |
British Virgin Islands - 0.7% |
HLS Systems International Ltd. (a) | 67,343 | | 851,216 |
Playtech Ltd. | 200,359 | | 1,437,301 |
UTI Worldwide, Inc. | 303,000 | | 5,823,660 |
TOTAL BRITISH VIRGIN ISLANDS | | 8,112,177 |
Canada - 1.5% |
Agrium, Inc. | 20,000 | | 1,769,193 |
Dollarama, Inc. | 72,209 | | 1,903,106 |
First Quantum Minerals Ltd. | 13,800 | | 1,208,430 |
InterOil Corp. (a) | 13,400 | | 953,812 |
Keyera Facilities Income Fund | 99,000 | | 3,072,213 |
Niko Resources Ltd. | 26,700 | | 2,547,220 |
Open Text Corp. (a) | 41,800 | | 1,849,217 |
|
| Shares | | Value |
Pan American Silver Corp. | 45,500 | | $ 1,452,360 |
Petrobank Energy & Resources Ltd. (a) | 46,800 | | 1,862,547 |
TOTAL CANADA | | 16,618,098 |
Cayman Islands - 1.5% |
Belle International Holdings Ltd. | 505,000 | | 912,111 |
Bosideng International Holdings Ltd. | 4,572,000 | | 2,312,174 |
China Lodging Group Ltd. ADR | 36,400 | | 884,884 |
Ctrip.com International Ltd. sponsored ADR (a) | 27,200 | | 1,416,304 |
Eurasia Drilling Co. Ltd. GDR (d) | 27,400 | | 698,700 |
Evergreen International Holdings Ltd. (a) | 58,000 | | 34,420 |
Hengdeli Holdings Ltd. | 4,104,000 | | 2,276,691 |
Herbalife Ltd. | 26,000 | | 1,660,360 |
Mongolian Mining Corp. | 1,526,000 | | 1,651,752 |
Perfect World Co. Ltd. sponsored ADR Class B (a) | 50,200 | | 1,626,480 |
Shenguan Holdings Group Ltd. | 1,148,000 | | 1,495,862 |
TPK Holdings Co. | 3,000 | | 49,502 |
Want Want China Holdings Ltd. | 2,043,000 | | 1,884,528 |
TOTAL CAYMAN ISLANDS | | 16,903,768 |
China - 0.6% |
Baidu.com, Inc. sponsored ADR (a) | 17,900 | | 1,969,179 |
China Merchants Bank Co. Ltd. (H Shares) | 1,000,500 | | 2,839,671 |
Comba Telecom Systems Holdings Ltd. | 408,980 | | 464,315 |
Minth Group Ltd. | 238,000 | | 445,218 |
Zhaojin Mining Industry Co. Ltd. (H Shares) | 255,500 | | 794,394 |
ZTE Corp. (H Shares) | 128,376 | | 476,985 |
TOTAL CHINA | | 6,989,762 |
Cyprus - 0.0% |
Aisi Realty Public Ltd. (a) | 1,232,268 | | 34,550 |
Denmark - 1.9% |
Carlsberg AS Series B | 37,700 | | 4,122,371 |
Novo Nordisk AS Series B | 94,116 | | 9,880,512 |
Pandora A/S | 41,900 | | 2,032,804 |
William Demant Holding AS (a) | 58,200 | | 4,362,475 |
TOTAL DENMARK | | 20,398,162 |
Egypt - 0.1% |
Orascom Construction Industries SAE GDR | 24,600 | | 1,138,980 |
France - 4.4% |
Accor SA | 39,500 | | 1,619,463 |
Atos Origin SA (a) | 65,745 | | 3,039,452 |
AXA SA | 119,037 | | 2,166,493 |
BNP Paribas SA | 53,888 | | 3,940,328 |
Carrefour SA | 53,867 | | 2,906,687 |
Compagnie Generale de Geophysique SA (a) | 58,200 | | 1,359,134 |
Edenred (a) | 59,000 | | 1,235,538 |
Essilor International SA | 30,396 | | 2,029,291 |
Common Stocks - continued |
| Shares | | Value |
France - continued |
GDF Suez | 41,100 | | $ 1,640,169 |
Iliad Group SA | 27,158 | | 3,057,130 |
LVMH Moet Hennessy - Louis Vuitton | 42,788 | | 6,703,907 |
Pernod-Ricard SA | 21,114 | | 1,871,741 |
PPR SA | 36,550 | | 5,991,013 |
Sanofi-Aventis | 15,104 | | 1,057,944 |
Schneider Electric SA | 32,065 | | 4,550,918 |
Societe Generale Series A | 64,751 | | 3,876,457 |
Unibail-Rodamco | 6,389 | | 1,330,829 |
TOTAL FRANCE | | 48,376,494 |
Germany - 3.1% |
Bayerische Motoren Werke AG (BMW) | 121,009 | | 8,673,149 |
Fresenius Medical Care AG & Co. KGaA | 53,500 | | 3,407,237 |
GEA Group AG | 110,697 | | 2,894,211 |
HeidelbergCement AG | 11,766 | | 615,334 |
Kabel Deutschland Holding AG | 68,500 | | 3,083,895 |
MAN SE | 45,742 | | 5,028,169 |
Metro AG | 23,500 | | 1,646,725 |
PSI AG | 69,000 | | 1,515,999 |
Siemens AG | 59,514 | | 6,797,107 |
Software AG (Bearer) | 6,000 | | 840,714 |
TOTAL GERMANY | | 34,502,540 |
Greece - 0.1% |
Coca-Cola Hellenic Bottling Co. SA | 36,300 | | 939,479 |
Hong Kong - 0.9% |
AIA Group Ltd. | 543,200 | | 1,615,321 |
Henderson Land Development Co. Ltd. | 204,232 | | 1,450,472 |
I.T Ltd. | 1,134,000 | | 956,795 |
Techtronic Industries Co. Ltd. | 3,575,500 | | 3,621,051 |
Wharf Holdings Ltd. | 264,000 | | 1,733,604 |
TOTAL HONG KONG | | 9,377,243 |
India - 1.7% |
Adani Enterprises Ltd. | 108,277 | | 1,720,829 |
Gitanjali Gems Ltd. | 135,298 | | 904,886 |
Housing Development Finance Corp. Ltd. | 81,615 | | 1,266,252 |
IndusInd Bank Ltd. | 112,500 | | 669,036 |
INFO Edge India Ltd. | 36,696 | | 563,252 |
Infrastructure Development Finance Co. Ltd. | 329,354 | | 1,486,458 |
Larsen & Toubro Ltd. | 57,646 | | 2,637,215 |
LIC Housing Finance Ltd. | 108,161 | | 3,271,184 |
Reliance Industries Ltd. | 74,372 | | 1,839,375 |
Rural Electrification Corp. Ltd. | 149,130 | | 1,247,040 |
Shriram Transport Finance Co. Ltd. | 33,464 | | 665,430 |
State Bank of India | 11,744 | | 834,758 |
The Jammu & Kashmir Bank Ltd. | 30,114 | | 618,551 |
Titan Industries Ltd. | 8,771 | | 702,897 |
TOTAL INDIA | | 18,427,163 |
|
| Shares | | Value |
Indonesia - 0.4% |
PT Bank Rakyat Indonesia Tbk | 1,171,000 | | $ 1,493,638 |
PT Tower Bersama Infrastructure Tbk | 514,500 | | 146,794 |
PT XL Axiata Tbk (a) | 3,712,000 | | 2,388,137 |
TOTAL INDONESIA | | 4,028,569 |
Ireland - 0.3% |
Ingersoll-Rand Co. Ltd. | 39,200 | | 1,540,952 |
James Hardie Industries NV unit (a) | 206,041 | | 1,087,961 |
Ryanair Holdings PLC sponsored ADR | 17,000 | | 554,710 |
TOTAL IRELAND | | 3,183,623 |
Israel - 0.1% |
Israel Chemicals Ltd. | 81,400 | | 1,245,073 |
Italy - 0.7% |
Intesa Sanpaolo SpA | 304,069 | | 1,069,377 |
Intesa Sanpaolo SpA (Risparmio Shares) | 347,700 | | 952,616 |
Prysmian SpA | 75,500 | | 1,463,409 |
Saipem SpA | 102,206 | | 4,540,910 |
TOTAL ITALY | | 8,026,312 |
Japan - 6.1% |
ABC-Mart, Inc. | 84,500 | | 2,874,071 |
Asics Corp. | 155,000 | | 1,673,854 |
Canon, Inc. | 72,250 | | 3,325,904 |
Cosmos Pharmaceutical Corp. | 29,500 | | 928,588 |
Denso Corp. | 86,400 | | 2,686,876 |
Don Quijote Co. Ltd. | 53,400 | | 1,459,259 |
eAccess Ltd. | 1,324 | | 965,811 |
Fast Retailing Co. Ltd. | 4,800 | | 628,758 |
Goldcrest Co. Ltd. | 8,680 | | 187,364 |
Honda Motor Co. Ltd. | 94,600 | | 3,410,215 |
JSR Corp. | 126,300 | | 2,186,354 |
Keyence Corp. | 10,400 | | 2,578,352 |
Komatsu Ltd. | 99,000 | | 2,419,702 |
Mazda Motor Corp. | 807,000 | | 2,050,949 |
Misumi Group, Inc. | 46,300 | | 992,513 |
Mitsubishi Corp. | 107,700 | | 2,586,919 |
Mitsubishi UFJ Financial Group, Inc. | 691,500 | | 3,209,254 |
Mitsui & Co. Ltd. | 120,900 | | 1,901,444 |
Mizuho Financial Group, Inc. | 985,000 | | 1,428,564 |
Nichi-iko Pharmaceutical Co. Ltd. | 64,000 | | 2,257,139 |
Nintendo Co. Ltd. | 4,700 | | 1,217,783 |
Omron Corp. | 75,900 | | 1,761,914 |
ORIX Corp. | 66,920 | | 6,104,048 |
Osaka Securities Exchange Co. Ltd. | 101 | | 508,326 |
Rakuten, Inc. | 4,389 | | 3,381,608 |
Ricoh Co. Ltd. | 164,000 | | 2,294,133 |
Sawai Pharmaceutical Co. Ltd. | 9,100 | | 794,992 |
SOFTBANK CORP. | 220,500 | | 7,081,363 |
Sony Financial Holdings, Inc. | 381 | | 1,325,711 |
Common Stocks - continued |
| Shares | | Value |
Japan - continued |
Start Today Co. Ltd. | 392 | | $ 1,219,307 |
Sumitomo Mitsui Financial Group, Inc. | 63,100 | | 1,883,393 |
TOTAL JAPAN | | 67,324,468 |
Korea (South) - 0.8% |
Hyundai Motor Co. | 10,383 | | 1,569,684 |
Kia Motors Corp. | 57,390 | | 2,291,517 |
NCsoft Corp. | 5,052 | | 1,111,934 |
NHN Corp. (a) | 6,568 | | 1,165,243 |
Samsung Electronics Co. Ltd. | 1,927 | | 1,276,669 |
Shinhan Financial Group Co. Ltd. | 22,350 | | 865,578 |
TOTAL KOREA (SOUTH) | | 8,280,625 |
Luxembourg - 0.1% |
Millicom International Cellular SA | 15,000 | | 1,419,000 |
Mauritius - 0.2% |
MakeMyTrip Ltd. | 48,400 | | 1,749,660 |
Mexico - 0.2% |
Wal-Mart de Mexico SA de CV Series V | 831,200 | | 2,273,425 |
Netherlands - 1.5% |
AEGON NV (a) | 192,700 | | 1,220,981 |
CNH Global NV (a) | 29,000 | | 1,151,010 |
Gemalto NV | 38,267 | | 1,742,229 |
ING Groep NV (Certificaten Van Aandelen) unit (a) | 279,400 | | 2,988,464 |
Koninklijke Philips Electronics NV | 124,481 | | 3,796,006 |
LyondellBasell Industries NV Class A (a) | 203,000 | | 5,452,580 |
Randstad Holdings NV (a) | 10,195 | | 485,155 |
TOTAL NETHERLANDS | | 16,836,425 |
Norway - 0.8% |
Aker Solutions ASA | 102,200 | | 1,555,858 |
DnB NOR ASA | 278,200 | | 3,817,398 |
Telenor ASA | 83,600 | | 1,347,605 |
Yara International ASA | 33,200 | | 1,745,191 |
TOTAL NORWAY | | 8,466,052 |
Poland - 0.1% |
Eurocash SA | 106,300 | | 977,025 |
Qatar - 0.1% |
Commercial Bank of Qatar GDR (Reg. S) | 279,659 | | 1,281,444 |
Singapore - 0.2% |
Keppel Corp. Ltd. | 234,000 | | 1,804,311 |
South Africa - 1.1% |
African Rainbow Minerals Ltd. | 33,000 | | 841,883 |
AngloGold Ashanti Ltd. sponsored ADR | 44,700 | | 2,105,817 |
Clicks Group Ltd. | 425,706 | | 2,777,248 |
Mr Price Group Ltd. | 201,100 | | 1,827,542 |
Sanlam Ltd. | 389,600 | | 1,460,503 |
|
| Shares | | Value |
Standard Bank Group Ltd. | 72,700 | | $ 1,072,071 |
Woolworths Holdings Ltd. | 542,336 | | 2,125,199 |
TOTAL SOUTH AFRICA | | 12,210,263 |
Spain - 1.9% |
Antena 3 Television SA | 118,200 | | 1,207,205 |
Banco Bilbao Vizcaya Argentaria SA | 227,085 | | 2,990,962 |
Banco Santander SA | 477,562 | | 6,128,223 |
Gestevision Telecinco SA | 125,500 | | 1,600,631 |
Inditex SA (c) | 21,397 | | 1,786,669 |
Prosegur Compania de Seguridad SA (Reg.) | 25,800 | | 1,545,829 |
Telefonica SA | 197,595 | | 5,338,170 |
TOTAL SPAIN | | 20,597,689 |
Sweden - 0.9% |
Elekta AB (B Shares) | 119,900 | | 4,536,446 |
H&M Hennes & Mauritz AB (B Shares) | 72,098 | | 2,540,091 |
Modern Times Group MTG AB (B Shares) | 32,200 | | 2,308,881 |
TOTAL SWEDEN | | 9,385,418 |
Switzerland - 3.9% |
Adecco SA (Reg.) | 13,014 | | 727,150 |
Compagnie Financiere Richemont SA Series A | 38,215 | | 1,905,412 |
Credit Suisse Group | 34,493 | | 1,427,527 |
Kuehne & Nagel International AG | 10,620 | | 1,313,002 |
Lonza Group AG | 18,865 | | 1,651,059 |
Nestle SA | 155,400 | | 8,509,229 |
Novartis AG | 145,299 | | 8,416,456 |
Partners Group Holding | 9,538 | | 1,744,136 |
Schindler Holding AG (participation certificate) | 12,684 | | 1,359,437 |
Sonova Holding AG Class B | 11,956 | | 1,384,654 |
Syngenta AG sponsored ADR | 75,000 | | 4,153,500 |
The Swatch Group AG (Bearer) | 9,810 | | 3,748,200 |
UBS AG (a) | 192,640 | | 3,271,483 |
Zurich Financial Services AG | 13,722 | | 3,358,185 |
TOTAL SWITZERLAND | | 42,969,430 |
Taiwan - 0.3% |
HTC Corp. | 126,150 | | 2,848,216 |
Thailand - 0.2% |
Bangkok Bank Public Co. Ltd. (For. Reg.) | 467,000 | | 2,409,870 |
Turkey - 0.4% |
Boyner Buyuk Magazacilik AS (a) | 386,000 | | 898,864 |
Dogus Otomotiv Servis ve Ticaret AS (a) | 158,000 | | 1,189,709 |
Turkiye Garanti Bankasi AS | 371,000 | | 2,276,232 |
TOTAL TURKEY | | 4,364,805 |
United Kingdom - 10.6% |
Aberdeen Asset Management PLC | 653,342 | | 1,861,125 |
Aegis Group PLC | 684,232 | | 1,377,977 |
Anglo American PLC (United Kingdom) | 87,218 | | 4,063,532 |
AstraZeneca PLC (United Kingdom) | 98,174 | | 4,937,722 |
Common Stocks - continued |
| Shares | | Value |
United Kingdom - continued |
Barclays PLC | 1,108,831 | | $ 4,872,084 |
BG Group PLC | 45,448 | | 885,060 |
BHP Billiton PLC | 293,276 | | 10,388,003 |
BP PLC | 1,345,000 | | 9,141,048 |
British American Tobacco PLC (United Kingdom) | 17,600 | | 670,411 |
British Land Co. PLC | 128,755 | | 1,051,021 |
Britvic PLC | 295,400 | | 2,283,079 |
Burberry Group PLC | 132,500 | | 2,163,183 |
Carphone Warehouse Group PLC | 852,279 | | 4,157,883 |
Cookson Group PLC (a) | 82,570 | | 681,291 |
Dialog Semiconductor PLC (a) | 25,000 | | 456,048 |
GlaxoSmithKline PLC | 343,200 | | 6,701,011 |
HSBC Holdings PLC (United Kingdom) | 643,709 | | 6,698,656 |
IG Group Holdings PLC | 354,329 | | 3,000,232 |
InterContinental Hotel Group PLC | 115,278 | | 2,226,098 |
International Personal Finance PLC | 517,515 | | 2,578,615 |
International Power PLC | 213,071 | | 1,424,544 |
Legal & General Group PLC | 996,089 | | 1,602,268 |
Lloyds Banking Group PLC (a) | 2,775,954 | | 3,050,734 |
Micro Focus International PLC | 116,800 | | 714,467 |
Ocado Group PLC (a) | 898,900 | | 2,011,921 |
Reckitt Benckiser Group PLC | 77,341 | | 4,325,764 |
Rio Tinto PLC | 81,540 | | 5,295,383 |
Royal Dutch Shell PLC Class B | 323,756 | | 10,359,427 |
Schroders PLC | 85,800 | | 2,170,564 |
SuperGroup PLC | 11,000 | | 199,147 |
TalkTalk Telecom Group PLC (a) | 964,758 | | 2,038,761 |
Ultra Electronics Holdings PLC | 32,400 | | 966,039 |
Vodafone Group PLC | 1,916,500 | | 5,238,297 |
Vodafone Group PLC sponsored ADR | 47,212 | | 1,298,802 |
Wolseley PLC (a) | 75,760 | | 2,018,531 |
Xstrata PLC | 173,300 | | 3,358,208 |
TOTAL UNITED KINGDOM | | 116,266,936 |
United States of America - 45.5% |
Amazon.com, Inc. (a) | 47,800 | | 7,893,692 |
Ameriprise Financial, Inc. | 110,000 | | 5,685,900 |
AMETEK, Inc. | 85,000 | | 4,594,250 |
Anadarko Petroleum Corp. | 156,000 | | 9,604,920 |
AnnTaylor Stores Corp. (a) | 61,000 | | 1,421,300 |
Apple, Inc. (a) | 64,600 | | 19,436,202 |
Ardea Biosciences, Inc. (a) | 33,058 | | 704,797 |
AsiaInfo Holdings, Inc. (a) | 39,100 | | 868,802 |
Autoliv, Inc. | 38,000 | | 2,709,400 |
Berkshire Hathaway, Inc. Class B (a) | 134,000 | | 10,661,040 |
BioMarin Pharmaceutical, Inc. (a) | 124,000 | | 3,243,840 |
Broadcom Corp. Class A | 140,000 | | 5,703,600 |
C.H. Robinson Worldwide, Inc. | 66,000 | | 4,651,680 |
Caterpillar, Inc. | 86,000 | | 6,759,600 |
Celanese Corp. Class A | 18,000 | | 641,700 |
CF Industries Holdings, Inc. | 15,200 | | 1,862,456 |
Chevron Corp. | 102,000 | | 8,426,220 |
|
| Shares | | Value |
Citi Trends, Inc. (a) | 53,000 | | $ 1,111,940 |
Citrix Systems, Inc. (a) | 82,000 | | 5,253,740 |
Cloud Peak Energy, Inc. | 137,000 | | 2,379,690 |
Cognizant Technology Solutions Corp. Class A (a) | 161,000 | | 10,495,590 |
CSX Corp. | 224,000 | | 13,764,800 |
Cummins, Inc. | 287,000 | | 25,284,700 |
Danaher Corp. | 13,000 | | 563,680 |
Eaton Corp. | 83,000 | | 7,372,890 |
eBay, Inc. (a) | 476,000 | | 14,189,560 |
Echo Global Logistics, Inc. | 25,000 | | 355,000 |
Edwards Lifesciences Corp. (a) | 228,000 | | 14,571,480 |
Elizabeth Arden, Inc. (a) | 44,547 | | 910,986 |
Emerson Electric Co. | 169,000 | | 9,278,100 |
Endo Pharmaceuticals Holdings, Inc. (a) | 179,000 | | 6,576,460 |
EnerSys (a) | 30,000 | | 790,800 |
Estee Lauder Companies, Inc. Class A | 288,000 | | 20,496,960 |
Exxon Mobil Corp. | 331,000 | | 22,001,570 |
Ford Motor Co. (a) | 180,000 | | 2,543,400 |
Fossil, Inc. (a) | 105,900 | | 6,247,041 |
Freeport-McMoRan Copper & Gold, Inc. | 92,300 | | 8,738,964 |
G-III Apparel Group Ltd. (a) | 147,600 | | 3,896,640 |
Google, Inc. Class A (a) | 33,000 | | 20,228,670 |
Greenbrier Companies, Inc. (a) | 81,000 | | 1,474,200 |
Hess Corp. | 51,000 | | 3,214,530 |
HMS Holdings Corp. (a) | 30,000 | | 1,803,300 |
Holly Corp. | 33,000 | | 1,080,090 |
Illumina, Inc. (a) | 16,800 | | 912,408 |
ImmunoGen, Inc. (a) | 45,523 | | 374,199 |
Informatica Corp. (a) | 109,970 | | 4,474,679 |
iRobot Corp. (a) | 194,000 | | 4,050,720 |
Isilon Systems, Inc. (a) | 48,000 | | 1,366,560 |
Jos. A. Bank Clothiers, Inc. (a) | 190,500 | | 8,305,800 |
Juniper Networks, Inc. (a) | 69,000 | | 2,234,910 |
M.D.C. Holdings, Inc. | 25,000 | | 643,750 |
Mako Surgical Corp. (a)(c) | 155,300 | | 1,674,134 |
MasterCard, Inc. Class A | 5,000 | | 1,200,300 |
Micromet, Inc. (a) | 100,000 | | 749,000 |
MIPS Technologies, Inc. (a) | 330,000 | | 4,851,000 |
Molycorp, Inc. (c) | 34,000 | | 1,203,600 |
NetApp, Inc. (a) | 15,000 | | 798,750 |
Neurocrine Biosciences, Inc. (a) | 27,895 | | 227,065 |
NII Holdings, Inc. (a) | 101,200 | | 4,231,172 |
NIKE, Inc. Class B | 32,000 | | 2,606,080 |
Oil States International, Inc. (a) | 72,000 | | 3,680,640 |
OpenTable, Inc. (a) | 7,000 | | 429,450 |
Oracle Corp. | 291,000 | | 8,555,400 |
PACCAR, Inc. | 72,000 | | 3,690,720 |
Perrigo Co. | 252,000 | | 16,601,760 |
Phillips-Van Heusen Corp. | 149,900 | | 9,194,866 |
Precision Castparts Corp. | 27,000 | | 3,687,660 |
Prestige Brands Holdings, Inc. (a) | 179,000 | | 1,924,250 |
Public Storage | 32,000 | | 3,175,040 |
Common Stocks - continued |
| Shares | | Value |
United States of America - continued |
QUALCOMM, Inc. | 215,000 | | $ 9,702,950 |
Red Hat, Inc. (a) | 38,000 | | 1,605,880 |
Riverbed Technology, Inc. (a) | 42,000 | | 2,416,680 |
Roper Industries, Inc. | 20,000 | | 1,388,600 |
Ross Stores, Inc. | 15,000 | | 884,850 |
Salesforce.com, Inc. (a) | 31,055 | | 3,604,554 |
Sapient Corp. | 95,000 | | 1,250,200 |
Skyworks Solutions, Inc. (a) | 544,000 | | 12,463,040 |
Solera Holdings, Inc. | 20,000 | | 961,000 |
Southwest Airlines Co. | 549,000 | | 7,554,240 |
Stericycle, Inc. (a) | 28,000 | | 2,008,720 |
Steven Madden Ltd. (a) | 21,000 | | 888,300 |
Summer Infant, Inc. (a) | 50,000 | | 400,000 |
Susser Holdings Corp. (a) | 5,000 | | 68,350 |
SVB Financial Group (a) | 72,730 | | 3,152,118 |
Targacept, Inc. (a) | 53,000 | | 1,312,280 |
Tenneco, Inc. (a) | 37,000 | | 1,206,940 |
The Mosaic Co. | 20,900 | | 1,529,044 |
Theravance, Inc. (a) | 137,000 | | 2,792,060 |
Titan International, Inc. (c) | 119,000 | | 1,805,230 |
TJX Companies, Inc. | 20,000 | | 917,800 |
TRW Automotive Holdings Corp. (a) | 44,000 | | 2,010,360 |
Union Pacific Corp. | 337,600 | | 29,600,776 |
United Therapeutics Corp. (a) | 12,600 | | 756,000 |
Vera Bradley, Inc. (a) | 1,100 | | 30,085 |
VeriFone Holdings, Inc. (a) | 42,000 | | 1,420,860 |
Virgin Media, Inc. | 160,500 | | 4,081,515 |
VMware, Inc. Class A (a) | 6,000 | | 458,760 |
Volcano Corp. (a) | 123,000 | | 3,003,660 |
Walter Energy, Inc. | 15,900 | | 1,398,564 |
WebMD Health Corp. (a) | 71,726 | | 3,749,835 |
Whiting Petroleum Corp. (a) | 24,000 | | 2,410,560 |
WMS Industries, Inc. (a) | 20,000 | | 872,600 |
ZIOPHARM Oncology, Inc. (a) | 270,000 | | 1,163,700 |
Zix Corp. (a) | 100,000 | | 389,000 |
TOTAL UNITED STATES OF AMERICA | | 499,597,204 |
TOTAL COMMON STOCKS (Cost $913,622,525) | 1,062,954,260 |
Nonconvertible Preferred Stocks - 1.4% |
| | | |
Germany - 1.4% |
ProSiebenSat.1 Media AG | 41,900 | | 1,107,150 |
Volkswagen AG | 91,000 | | 13,675,171 |
TOTAL NONCONVERTIBLE PREFERRED STOCKS (Cost $11,953,393) | 14,782,321 |
Convertible Bonds - 0.2% |
| Principal Amount | | Value |
United States of America - 0.2% |
Newpark Resources, Inc. 4% 10/1/17 | | $ 750,000 | | $ 690,825 |
Volcano Corp. 2.875% 9/1/15 | | 860,000 | | 940,926 |
TOTAL CONVERTIBLE BONDS (Cost $1,610,000) | 1,631,751 |
Money Market Funds - 1.5% |
| Shares | | |
Fidelity Cash Central Fund, 0.23% (b) | 13,142,928 | | 13,142,928 |
Fidelity Securities Lending Cash Central Fund, 0.24% (b)(c) | 3,828,100 | | 3,828,100 |
TOTAL MONEY MARKET FUNDS (Cost $16,971,028) | 16,971,028 |
TOTAL INVESTMENT PORTFOLIO - 99.9% (Cost $944,156,946) | | 1,096,339,360 |
NET OTHER ASSETS (LIABILITIES) - 0.1% | | 1,588,761 |
NET ASSETS - 100% | $ 1,097,928,121 |
Legend |
(a) Non-income producing |
(b) Affiliated fund that is available only to investment companies and other accounts managed by Fidelity Investments. The rate quoted is the annualized seven-day yield of the fund at period end. A complete unaudited listing of the fund's holdings as of its most recent quarter end is available upon request. In addition, each Fidelity Central Fund's financial statements, which are not covered by the Fund's report of Independent Registered Public Accounting Firm, are available on the SEC's website or upon request. |
(c) Security or a portion of the security is on loan at period end. |
(d) Security exempt from registration under Rule 144A of the Securities Act of 1933. These securities may be resold in transactions exempt from registration, normally to qualified institutional buyers. At the end of the period, the value of these securities amounted to $698,700 or 0.1% of net assets. |
Affiliated Central Funds |
Information regarding fiscal year to date income earned by the Fund from investments in Fidelity Central Funds is as follows: |
Fund | Income earned |
Fidelity Cash Central Fund | $ 33,659 |
Fidelity Securities Lending Cash Central Fund | 257,400 |
Total | $ 291,059 |
Other Information |
The following is a summary of the inputs used, as of October 31, 2010, involving the Fund's assets and liabilities carried at fair value. The inputs or methodology used for valuing securities may not be an indication of the risk associated with investing in those securities. For more information on valuation inputs, and their aggregation into the levels used in the tables below, please refer to the Security Valuation section in the accompanying Notes to Financial Statements. |
Valuation Inputs at Reporting Date: |
Description | Total | Level 1 | Level 2 | Level 3 |
Investments in Securities: | | | | |
Equities: | | | | |
United States of America | $ 499,597,204 | $ 499,597,204 | $ - | $ - |
United Kingdom | 116,266,936 | 46,688,062 | 69,578,874 | - |
Japan | 67,324,468 | 32,416,994 | 34,907,474 | - |
Germany | 49,284,861 | 39,080,517 | 10,204,344 | - |
France | 48,376,494 | 45,959,416 | 2,417,078 | - |
Switzerland | 42,969,430 | 29,853,964 | 13,115,466 | - |
Spain | 20,597,689 | 6,140,334 | 14,457,355 | - |
Denmark | 20,398,162 | 10,517,650 | 9,880,512 | - |
India | 18,427,163 | 18,427,163 | - | - |
Cyprus | 34,550 | - | - | 34,550 |
Other | 194,459,624 | 186,419,753 | 8,039,871 | - |
Corporate Bonds | 1,631,751 | - | 1,631,751 | - |
Money Market Funds | 16,971,028 | 16,971,028 | - | - |
Total Investments in Securities: | $ 1,096,339,360 | $ 932,072,085 | $ 164,232,725 | $ 34,550 |
The following is a reconciliation of Investments in Securities for which Level 3 inputs were used in determining value: |
Investments in Securities: | |
Beginning Balance | $ - |
Total Realized Gain (Loss) | - |
Total Unrealized Gain (Loss) | (36,260) |
Cost of Purchases | - |
Proceeds of Sales | - |
Amortization/Accretion | - |
Transfers in to Level 3 | 70,810 |
Transfers out of Level 3 | - |
Ending Balance | $ 34,550 |
The change in unrealized gain (loss) for the period attributable to Level 3 securities held at October 31, 2010 | $ (36,260) |
The information used in the above reconciliation represents fiscal year to date activity for any Investments in Securities identified as using Level 3 inputs at either the beginning or the end of the current fiscal period. Transfers in or out of Level 3 represent the beginning value of any Security or Instrument where a change in the pricing level occurred from the beginning to the end of the period. The cost of purchases and the proceeds of sales may include securities received or delivered through corporate actions or exchanges. Realized and unrealized gains (losses) disclosed in the reconciliation are included in Net Gain (Loss) on the Fund's Statement of Operations. |
Income Tax Information |
At October 31, 2010, the Fund had a capital loss carryforward of approximately $165,341,843 of which $21,859,750 and $143,482,093 will expire on October 31, 2016 and 2017, respectively. Capital loss carryforwards are only available to offset future capital gains of the Fund to the extent provided by regulations and may be limited. |
See accompanying notes which are an integral part of the financial statements.
Annual Report
Fidelity Worldwide Fund
Statement of Assets and Liabilities
| October 31, 2010 |
| | |
Assets | | |
Investment in securities, at value (including securities loaned of $3,745,161) - See accompanying schedule: Unaffiliated issuers (cost $927,185,918) | $ 1,079,368,332 | |
Fidelity Central Funds (cost $16,971,028) | 16,971,028 | |
Total Investments (cost $944,156,946) | | $ 1,096,339,360 |
Cash | | 1 |
Receivable for investments sold | | 28,129,502 |
Receivable for fund shares sold | | 823,725 |
Dividends receivable | | 1,062,804 |
Interest receivable | | 4,914 |
Distributions receivable from Fidelity Central Funds | | 6,115 |
Other receivables | | 273,028 |
Total assets | | 1,126,639,449 |
| | |
Liabilities | | |
Payable for investments purchased | $ 22,295,156 | |
Payable for fund shares redeemed | 1,004,722 | |
Accrued management fee | 654,093 | |
Distribution and service plan fees payable | 2,780 | |
Other affiliated payables | 259,457 | |
Other payables and accrued expenses | 667,020 | |
Collateral on securities loaned, at value | 3,828,100 | |
Total liabilities | | 28,711,328 |
| | |
Net Assets | | $ 1,097,928,121 |
Net Assets consist of: | | |
Paid in capital | | $ 1,119,079,477 |
Undistributed net investment income | | 4,480,160 |
Accumulated undistributed net realized gain (loss) on investments and foreign currency transactions | | (177,294,491) |
Net unrealized appreciation (depreciation) on investments and assets and liabilities in foreign currencies | | 151,662,975 |
Net Assets | | $ 1,097,928,121 |
Statement of Assets and Liabilities - continued
| October 31, 2010 |
| | |
Calculation of Maximum Offering Price Class A:
Net Asset Value and redemption price per share ($7,530,175 ÷ 430,387 shares) | | $ 17.50 |
| | |
Maximum offering price per share (100/94.25 of $17.50) | | $ 18.57 |
Class T:
Net Asset Value and redemption price per share ($1,120,118 ÷ 64,167 shares) | | $ 17.46 |
| | |
Maximum offering price per share (100/96.50 of $17.46) | | $ 18.09 |
Class B:
Net Asset Value and offering price per share ($305,259 ÷ 17,554 shares)A | | $ 17.39 |
| | |
Class C:
Net Asset Value and offering price per share ($709,608 ÷ 40,879 shares)A | | $ 17.36 |
| | |
| | |
Worldwide:
Net Asset Value, offering price and redemption price per share ($1,087,928,252 ÷ 61,872,662 shares) | | $ 17.58 |
| | |
Institutional Class:
Net Asset Value, offering price and redemption price per share ($334,709 ÷ 19,050 shares) | | $ 17.57 |
A Redemption price per share is equal to net asset value less any applicable contingent deferred sales charge.
See accompanying notes which are an integral part of the financial statements.
Annual Report
Fidelity Worldwide Fund
Financial Statements - continued
Statement of Operations
| Year ended October 31, 2010 |
Investment Income | | |
Dividends | | $ 17,385,889 |
Interest | | 56,807 |
Income from Fidelity Central Funds | | 291,059 |
Income before foreign taxes withheld | | 17,733,755 |
Less foreign taxes withheld | | (1,004,412) |
Total income | | 16,729,343 |
| | |
Expenses | | |
Management fee
Basic fee | $ 7,318,345 | |
Performance adjustment | 963,702 | |
Transfer agent fees | 2,662,400 | |
Distribution and service plan fees | 20,954 | |
Accounting and security lending fees | 482,070 | |
Custodian fees and expenses | 253,340 | |
Independent trustees' compensation | 5,982 | |
Registration fees | 81,815 | |
Audit | 77,918 | |
Legal | 5,594 | |
Miscellaneous | 14,254 | |
Total expenses before reductions | 11,886,374 | |
Expense reductions | (325,816) | 11,560,558 |
Net investment income (loss) | | 5,168,785 |
Realized and Unrealized Gain (Loss) Net realized gain (loss) on: | | |
Investment securities: | | |
Unaffiliated issuers (net of foreign taxes of $6,310) | 100,622,328 | |
Foreign currency transactions | (292,326) | |
Total net realized gain (loss) | | 100,330,002 |
Change in net unrealized appreciation (depreciation) on: Investment securities (net of increase in deferred foreign taxes of $504,850) | 67,000,721 | |
Assets and liabilities in foreign currencies | (9,475) | |
Total change in net unrealized appreciation (depreciation) | | 66,991,246 |
Net gain (loss) | | 167,321,248 |
Net increase (decrease) in net assets resulting from operations | | $ 172,490,033 |
Statement of Changes in Net Assets
| Year ended
October 31,
2010 | Year ended
October 31,
2009 |
Increase (Decrease) in Net Assets | | |
Operations | | |
Net investment income (loss) | $ 5,168,785 | $ 8,075,049 |
Net realized gain (loss) | 100,330,002 | (130,252,833) |
Change in net unrealized appreciation (depreciation) | 66,991,246 | 233,691,843 |
Net increase (decrease) in net assets resulting from operations | 172,490,033 | 111,514,059 |
Distributions to shareholders from net investment income | (6,419,967) | (11,746,083) |
Distributions to shareholders from net realized gain | (993,213) | - |
Total distributions | (7,413,180) | (11,746,083) |
Share transactions - net increase (decrease) | (61,476,980) | (40,383,349) |
Redemption fees | 31,293 | 26,981 |
Total increase (decrease) in net assets | 103,631,166 | 59,411,608 |
| | |
Net Assets | | |
Beginning of period | 994,296,955 | 934,885,347 |
End of period (including undistributed net investment income of $4,480,160 and undistributed net investment income of $5,696,383, respectively) | $ 1,097,928,121 | $ 994,296,955 |
See accompanying notes which are an integral part of the financial statements.
Annual Report
Financial Highlights - Class A
Years ended October 31, | 2010 | 2009H |
Selected Per-Share Data | | |
Net asset value, beginning of period | $ 14.96 | $ 10.88 |
Income from Investment Operations | | |
Net investment income (loss)E | .03 | (.01) |
Net realized and unrealized gain (loss) | 2.63 | 4.09 |
Total from investment operations | 2.66 | 4.08 |
Distributions from net investment income | (.10) | - |
Distributions from net realized gain | (.02) | - |
Total distributions | (.12) | - |
Redemption fees added to paid in capital E,J | - | - |
Net asset value, end of period | $ 17.50 | $ 14.96 |
Total ReturnB,C,D | 17.85% | 37.50% |
Ratios to Average Net AssetsF,I | | |
Expenses before reductions | 1.43% | 1.52%A |
Expenses net of fee waivers, if any | 1.43% | 1.52%A |
Expenses net of all reductions | 1.41% | 1.49%A |
Net investment income (loss) | .21% | (.06)%A |
Supplemental Data | | |
Net assets, end of period (000 omitted) | $ 7,530 | $ 993 |
Portfolio turnover rateG | 166% | 224% |
A Annualized
B Total returns for periods of less than one year are not annualized.
C Total returns would have been lower had certain expenses not been reduced during the periods shown.
D Total returns do not include the effect of the sales charges.
E Calculated based on average shares outstanding during the period.
F Fees and expenses of the underlying Fidelity Central Funds are not included in the Fund's expense ratio. The Fund indirectly bears its proportionate share of the expenses of any underlying Fidelity Central Funds.
G Amount does not include the portfolio activity of any underlying Fidelity Central Funds.
H For the period February 19, 2009 (commencement of sale of shares) to October 31, 2009.
I Expense ratios reflect operating expenses of the class. Expenses before reductions do not reflect amounts reimbursed by the investment adviser or reductions from brokerage service arrangements or reductions from other expense offset arrangements and do not represent the amount paid by the class during periods when reimbursements or reductions occur. Expense ratios before reductions for start-up periods may not be representative of longer-term operating periods. Expenses net of fee waivers reflect expenses after reimbursement by the investment adviser but prior to reductions from brokerage service arrangements or other expense offset arrangements. Expenses net of all reductions represent the net expenses paid by the class.
J Amount represents less than $.01 per share.
Financial Highlights - Class T
Years ended October 31, | 2010 | 2009H |
Selected Per-Share Data | | |
Net asset value, beginning of period | $ 14.94 | $ 10.88 |
Income from Investment Operations | | |
Net investment income (loss)E | (.01) | (.01) |
Net realized and unrealized gain (loss) | 2.62 | 4.07 |
Total from investment operations | 2.61 | 4.06 |
Distributions from net investment income | (.08) | - |
Distributions from net realized gain | (.02) | - |
Total distributions | (.09)K | - |
Redemption fees added to paid in capital E,J | - | - |
Net asset value, end of period | $ 17.46 | $ 14.94 |
Total ReturnB,C,D | 17.53% | 37.32% |
Ratios to Average Net AssetsF,I | | |
Expenses before reductions | 1.70% | 1.73%A |
Expenses net of fee waivers, if any | 1.70% | 1.73%A |
Expenses net of all reductions | 1.68% | 1.70%A |
Net investment income (loss) | (.05) % | (.08)%A |
Supplemental Data | | |
Net assets, end of period (000 omitted) | $ 1,120 | $ 458 |
Portfolio turnover rateG | 166% | 224% |
A Annualized
B Total returns for periods of less than one year are not annualized.
C Total returns would have been lower had certain expenses not been reduced during the periods shown.
D Total returns do not include the effect of the sales charges.
E Calculated based on average shares outstanding during the period.
F Fees and expenses of the underlying Fidelity Central Funds are not included in the Fund's expense ratio. The Fund indirectly bears its proportionate share of the expenses of any underlying Fidelity Central Funds.
G Amount does not include the portfolio activity of any underlying Fidelity Central Funds.
H For the period February 19, 2009 (commencement of sale of shares) to October 31, 2009.
I Expense ratios reflect operating expenses of the class. Expenses before reductions do not reflect amounts reimbursed by the investment adviser or reductions from brokerage service arrangements or reductions from other expense offset arrangements and do not represent the amount paid by the class during periods when reimbursements or reductions occur. Expense ratios before reductions for start-up periods may not be representative of longer-term operating periods. Expenses net of fee waivers reflect expenses after reimbursement by the investment adviser but prior to reductions from brokerage service arrangements or other expense offset arrangements. Expenses net of all reductions represent the net expenses paid by the class.
J Amount represents less than $.01 per share.
K Total distributions of $.09 per share is comprised of distributions from net investment income of $.075 and distributions from net realized gain of $.015 per share.
See accompanying notes which are an integral part of the financial statements.
Annual Report
Financial Highlights - Class B
Years ended October 31, | 2010 | 2009H |
Selected Per-Share Data | | |
Net asset value, beginning of period | $ 14.89 | $ 10.88 |
Income from Investment Operations | | |
Net investment income (loss)E | (.09) | (.03) |
Net realized and unrealized gain (loss) | 2.61 | 4.04 |
Total from investment operations | 2.52 | 4.01 |
Distributions from net investment income | (.01) | - |
Distributions from net realized gain | (.01) | - |
Total distributions | (.02) | - |
Redemption fees added to paid in capital E,J | - | - |
Net asset value, end of period | $ 17.39 | $ 14.89 |
Total ReturnB,C,D | 16.92% | 36.86% |
Ratios to Average Net AssetsF,I | | |
Expenses before reductions | 2.19% | 2.20%A |
Expenses net of fee waivers, if any | 2.19% | 2.20%A |
Expenses net of all reductions | 2.17% | 2.17%A |
Net investment income (loss) | (.55)% | (.30)%A |
Supplemental Data | | |
Net assets, end of period (000 omitted) | $ 305 | $ 224 |
Portfolio turnover rateG | 166% | 224% |
A Annualized
B Total returns for periods of less than one year are not annualized.
C Total returns would have been lower had certain expenses not been reduced during the periods shown.
D Total returns do not include the effect of the contingent deferred sales charge.
E Calculated based on average shares outstanding during the period.
F Fees and expenses of the underlying Fidelity Central Funds are not included in the Fund's expense ratio. The Fund indirectly bears its proportionate share of the expenses of any underlying Fidelity Central Funds.
G Amount does not include the portfolio activity of any underlying Fidelity Central Funds.
H For the period February 19, 2009 (commencement of sale of shares) to October 31, 2009.
I Expense ratios reflect operating expenses of the class. Expenses before reductions do not reflect amounts reimbursed by the investment adviser or reductions from brokerage service arrangements or reductions from other expense offset arrangements and do not represent the amount paid by the class during periods when reimbursements or reductions occur. Expense ratios before reductions for start-up periods may not be representative of longer-term operating periods. Expenses net of fee waivers reflect expenses after reimbursement by the investment adviser but prior to reductions from brokerage service arrangements or other expense offset arrangements. Expenses net of all reductions represent the net expenses paid by the class.
J Amount represents less than $.01 per share.
Financial Highlights - Class C
Years ended October 31, | 2010 | 2009H |
Selected Per-Share Data | | |
Net asset value, beginning of period | $ 14.89 | $ 10.88 |
Income from Investment Operations | | |
Net investment income (loss)E | (.09) | (.04) |
Net realized and unrealized gain (loss) | 2.61 | 4.05 |
Total from investment operations | 2.52 | 4.01 |
Distributions from net investment income | (.03) | - |
Distributions from net realized gain | (.02) | - |
Total distributions | (.05) | - |
Redemption fees added to paid in capital E,J | - | - |
Net asset value, end of period | $ 17.36 | $ 14.89 |
Total ReturnB,C,D | 16.94% | 36.86% |
Ratios to Average Net AssetsF,I | | |
Expenses before reductions | 2.19% | 2.18%A |
Expenses net of fee waivers, if any | 2.19% | 2.18%A |
Expenses net of all reductions | 2.16% | 2.15%A |
Net investment income (loss) | (.54)% | (.39)%A |
Supplemental Data | | |
Net assets, end of period (000 omitted) | $ 710 | $ 335 |
Portfolio turnover rateG | 166% | 224% |
A Annualized
B Total returns for periods of less than one year are not annualized.
C Total returns would have been lower had certain expenses not been reduced during the periods shown.
D Total returns do not include the effect of the contingent deferred sales charge.
E Calculated based on average shares outstanding during the period.
F Fees and expenses of the underlying Fidelity Central Funds are not included in the Fund's expense ratio. The Fund indirectly bears its proportionate share of the expenses of any underlying Fidelity Central Funds.
G Amount does not include the portfolio activity of any underlying Fidelity Central Funds.
H For the period February 19, 2009 (commencement of sale of shares) to October 31, 2009.
I Expense ratios reflect operating expenses of the class. Expenses before reductions do not reflect amounts reimbursed by the investment adviser or reductions from brokerage service arrangements or reductions from other expense offset arrangements and do not represent the amount paid by the class during periods when reimbursements or reductions occur. Expense ratios before reductions for start-up periods may not be representative of longer-term operating periods. Expenses net of fee waivers reflect expenses after reimbursement by the investment adviser but prior to reductions from brokerage service arrangements or other expense offset arrangements. Expenses net of all reductions represent the net expenses paid by the class.
J Amount represents less than $.01 per share.
See accompanying notes which are an integral part of the financial statements.
Annual Report
Financial Highlights - Worldwide
Years ended October 31, | 2010 | 2009 | 2008 | 2007 | 2006 |
Selected Per-Share Data | | | | | |
Net asset value, beginning of period | $ 14.98 | $ 13.40 | $ 25.18 | $ 21.82 | $ 19.05 |
Income from Investment Operations | | | | | |
Net investment income (loss)B | .08 | .12 | .16 | .14 | .17 |
Net realized and unrealized gain (loss) | 2.63 | 1.63 | (9.44) | 6.05 | 3.74 |
Total from investment operations | 2.71 | 1.75 | (9.28) | 6.19 | 3.91 |
Distributions from net investment income | (.10) | (.17) | (.12) | (.17) | (.10) |
Distributions from net realized gain | (.02) | - | (2.38) | (2.66) | (1.04) |
Total distributions | (.11)G | (.17) | (2.50) | (2.83) | (1.14) |
Redemption fees added to paid in capitalB,F | - | - | - | - | - |
Net asset value, end of period | $ 17.58 | $ 14.98 | $ 13.40 | $ 25.18 | $ 21.82 |
Total ReturnA | 18.18% | 13.39% | (40.66)% | 31.87% | 21.31% |
Ratios to Average Net AssetsC,E | | | | | |
Expenses before reductions | 1.15% | 1.27% | 1.21% | 1.04% | 1.08% |
Expenses net of fee waivers, if any | 1.15% | 1.27% | 1.21% | 1.04% | 1.08% |
Expenses net of all reductions | 1.12% | 1.24% | 1.19% | 1.02% | 1.02% |
Net investment income (loss) | .50% | .92% | .84% | .66% | .85% |
Supplemental Data | | | | | |
Net assets, end of period (000 omitted) | $ 1,087,928 | $ 991,996 | $ 934,885 | $ 1,773,603 | $ 1,328,219 |
Portfolio turnover rateD | 166% | 224% | 264% | 128% | 205% |
A Total returns would have been lower had certain expenses not been reduced during the periods shown.
B Calculated based on average shares outstanding during the period.
C Fees and expenses of the underlying Fidelity Central Funds are not included in the Fund's expense ratio. The Fund indirectly bears its proportionate share of the expenses of any underlying Fidelity Central Funds.
D Amount does not include the portfolio activity of any underlying Fidelity Central Funds.
E Expense ratios reflect operating expenses of the class. Expenses before reductions do not reflect amounts reimbursed by the investment adviser or reductions from brokerage service arrangements or reductions from other expense offset arrangements and do not represent the amount paid by the class during periods when reimbursements or reductions occur. Expenses net of fee waivers reflect expenses after reimbursement by the investment adviser but prior to reductions from brokerage service arrangements or other expense offset arrangements. Expenses net of all reductions represent the net expenses paid by the class.
F Amount represents less than $.01 per share.
G Total distributions of $.11 per share is comprised of distributions from net investment income of $.097 and distributions from net realized gain of $.015 per share.
Financial Highlights - Institutional Class
Years ended October 31, | 2010 | 2009G |
Selected Per-Share Data | | |
Net asset value, beginning of period | $ 15.00 | $ 10.88 |
Income from Investment Operations | | |
Net investment income (loss)D | .07 | .06 |
Net realized and unrealized gain (loss) | 2.63 | 4.06 |
Total from investment operations | 2.70 | 4.12 |
Distributions from net investment income | (.11) | - |
Distributions from net realized gain | (.02) | - |
Total distributions | (.13) | - |
Redemption fees added to paid in capital D,I | - | - |
Net asset value, end of period | $ 17.57 | $ 15.00 |
Total ReturnB,C | 18.08% | 37.87% |
Ratios to Average Net AssetsE,H | | |
Expenses before reductions | 1.21% | 1.17%A |
Expenses net of fee waivers, if any | 1.21% | 1.17%A |
Expenses net of all reductions | 1.19% | 1.15%A |
Net investment income (loss) | .44% | .62%A |
Supplemental Data | | |
Net assets, end of period (000 omitted) | $ 335 | $ 290 |
Portfolio turnover rateF | 166% | 224% |
A Annualized
B Total returns for periods of less than one year are not annualized.
C Total returns would have been lower had certain expenses not been reduced during the periods shown.
D Calculated based on average shares outstanding during the period.
E Fees and expenses of the underlying Fidelity Central Funds are not included in the Fund's expense ratio. The Fund indirectly bears its proportionate share of the expenses of any underlying Fidelity Central Funds.
F Amount does not include the portfolio activity of any underlying Fidelity Central Funds.
G For the period February 19, 2009 (commencement of sale of shares) to October 31, 2009.
H Expense ratios reflect operating expenses of the class. Expenses before reductions do not reflect amounts reimbursed by the investment adviser or reductions from brokerage service arrangements or reductions from other expense offset arrangements and do not represent the amount paid by the class during periods when reimbursements or reductions occur. Expense ratios before reductions for start-up periods may not be representative of longer-term operating periods. Expenses net of fee waivers reflect expenses after reimbursement by the investment adviser but prior to reductions from brokerage service arrangements or other expense offset arrangements. Expenses net of all reductions represent the net expenses paid by the class.
I Amount represents less than $.01 per share.
See accompanying notes which are an integral part of the financial statements.
Annual Report
Notes to Financial Statements
For the period ended October 31, 2010
1. Organization.
Fidelity Worldwide Fund (the Fund) is a fund of Fidelity Investment Trust (the Trust) and is authorized to issue an unlimited number of shares. The Trust is registered under the Investment Company Act of 1940, as amended (the 1940 Act), as an open-end management investment company organized as a Massachusetts business trust. The Fund offers Class A, Class T, Class C, Worldwide and Institutional Class shares, each of which has equal rights as to assets and voting privileges. Effective after the close of business on September 1, 2010, Class B shares were closed to new accounts and additional purchases by existing shareholders. Each class has exclusive voting rights with respect to matters that affect that class. Class B shares will automatically convert to Class A shares after a holding period of seven years from the initial date of purchase. Investment income, realized and unrealized capital gains and losses, the common expenses of the Fund, and certain fund-level expense reductions, if any, are allocated on a pro-rata basis to each class based on the relative net assets of each class to the total net assets of the Fund. Each class differs with respect to transfer agent and distribution and service plan fees incurred. Certain expense reductions also differ by class. The Fund's investments in emerging markets can be subject to social, economic, regulatory, and political uncertainties and can be extremely volatile.
2. Investments in Fidelity Central Funds.
The Fund may invest in Fidelity Central Funds, which are open-end investment companies available only to other investment companies and accounts managed by Fidelity Management & Research Company (FMR) and its affiliates. The Fund's Schedule of Investments lists each of the Fidelity Central Funds held as of period end, if any, as an investment of the Fund, but does not include the underlying holdings of each Fidelity Central Fund. As an Investing Fund, the Fund indirectly bears its proportionate share of the expenses of the underlying Fidelity Central Funds.
The Money Market Central Funds seek preservation of capital and current income and are managed by Fidelity Investments Money Management, Inc. (FIMM), an affiliate of FMR.
A complete unaudited list of holdings for each Fidelity Central Fund is available upon request or at the Securities and Exchange Commission (the SEC) web site at www.sec.gov. In addition, the financial statements of the Fidelity Central Funds which are not covered by the Fund's Report of Independent Registered Public Accounting Firm, are available on the SEC web site or upon request.
3. Significant Accounting Policies.
The financial statements have been prepared in conformity with accounting principles generally accepted in the United States of America (GAAP), which require management to make certain estimates and assumptions at the date of the financial statements. Actual results could differ from those estimates. The following summarizes the significant accounting policies of the Fund:
Security Valuation. Investments are valued as of 4:00 p.m. Eastern time on the last calendar day of the period. The Fund uses independent pricing services approved by the Board of Trustees to value its investments. When current market prices or quotations are not readily available or reliable, valuations may be determined in good faith in accordance with procedures adopted by the Board of Trustees. Factors used in determining value may include market or security specific events, changes in interest rates and credit quality. The frequency with which these procedures are used cannot be predicted and they may be utilized to a significant extent. The value used for net asset value (NAV) calculation under these procedures may differ from published prices for the same securities.
The Fund categorizes the inputs to valuation techniques used to value its investments into a disclosure hierarchy consisting of three levels as shown below.
Level 1 - quoted prices in active markets for identical investments
Level 2 - other significant observable inputs (including quoted prices for similar investments, interest rates, prepayment speeds, etc.)
Level 3 - unobservable inputs (including the fund's own assumptions based on the best information available)
Changes in valuation techniques may result in transfers in or out of an assigned level within the disclosure hierarchy. The aggregate value of investments by input level, as of October 31, 2010, as well as a roll forward of Level 3 securities, is included at the end of the Fund's Schedule of Investments. Valuation techniques used to value the Fund's investments by major category are as follows.
Equity securities, including restricted securities, for which market quotations are readily available, are valued at the last reported sale price or official closing price as reported by an independent pricing service on the primary market or exchange on which they are traded and are categorized as Level 1 in the hierarchy. In the event there were no sales during the day or closing prices are not available, securities are valued at the last quoted bid price or may be valued using the last available price and are generally categorized as Level 2 in the hierarchy. For foreign equity securities, when significant market or security specific events arise, comparisons to the valuation of American Depositary Receipts (ADRs), futures contracts, Exchange-traded funds (ETFs) and certain indexes as well as quoted prices for similar securities are used and are categorized as Level 2 in the hierarchy in these circumstances. Utilizing these techniques may result in transfers between Level 1 and Level 2. For restricted equity securities and private placements where observable inputs are limited, assumptions about market activity and risk are used and are categorized as Level 3 in the hierarchy.
Annual Report
3. Significant Accounting Policies - continued
Security Valuation - continued
Debt securities, including restricted securities, are valued based on evaluated prices received from independent pricing services or from dealers who make markets in such securities. For corporate bonds pricing services utilize matrix pricing which considers yield or price of bonds of comparable quality, coupon, maturity and type as well as dealer supplied prices and are generally categorized as Level 2 in the hierarchy.
Investments in open-end mutual funds, including Fidelity Central Funds, are valued at their closing net asset value each business day and are categorized as Level 1 in the hierarchy. Short-term securities with remaining maturities of sixty days or less for which quotations are not readily available are valued at amortized cost, which approximates fair value and are categorized as Level 2 in the hierarchy.
When independent prices are unavailable or unreliable, debt securities may be valued utilizing pricing matrices which consider similar factors that would be used by independent pricing services. These are generally categorized as Level 2 in the hierarchy but may be Level 3 depending on the circumstances.
Foreign Currency. The Fund uses foreign currency contracts to facilitate transactions in foreign-denominated securities. Gains and losses from these transactions may arise from changes in the value of the foreign currency or if the counterparties do not perform under the contracts' terms.
Foreign-denominated assets, including investment securities, and liabilities are translated into U.S. dollars at the exchange rate at period end. Purchases and sales of investment securities, income and dividends received and expenses denominated in foreign currencies are translated into U.S. dollars at the exchange rate in effect on the transaction date.
The effects of exchange rate fluctuations on investments are included with the net realized and unrealized gain (loss) on investment securities. Other foreign currency transactions resulting in realized and unrealized gain (loss) are disclosed separately.
Investment Transactions and Income. For financial reporting purposes, the Fund's investment holdings and NAV include trades executed through the end of the last business day of the period. The NAV per share for processing shareholder transactions is calculated as of the close of business of the New York Stock Exchange (NYSE), normally 4:00 p.m. Eastern time and includes trades executed through the end of the prior business day. Gains and losses on securities sold are determined on the basis of identified cost and may include proceeds received from litigation. Dividend income is recorded on the ex-dividend date, except for certain dividends from foreign securities where the ex-dividend date may have passed, which are recorded as soon as the Fund is informed of the ex-dividend date. Non-cash dividends included in dividend income, if any, are recorded at the fair market value of the securities received. Distributions received on securities that represent a return of capital or capital gain are recorded as a reduction of cost of investments and/or as a realized gain. The Fund estimates the components of distributions received that may be considered return of capital distributions or capital gain distributions. Interest income and distributions from the Fidelity Central Funds are accrued as earned. Interest income includes coupon interest and amortization of premium and accretion of discount on debt securities. Investment income is recorded net of foreign taxes withheld where recovery of such taxes is uncertain.
Expenses. Most expenses of the Trust can be directly attributed to a fund. Expenses which cannot be directly attributed are apportioned amongst each fund in the Trust. Expense estimates are accrued in the period to which they relate and adjustments are made when actual amounts are known.
Income Tax Information and Distributions to Shareholders. Each year the Fund intends to qualify as a regulated investment company, including distributing substantially all of its taxable income and realized gains under Subchapter M of the Internal Revenue Code and filing its U.S. federal tax return. As a result, no provision for income taxes is required. As of October 31, 2010, the Fund did not have any unrecognized tax benefits in the accompanying financial statements. A fund's federal tax return is subject to examination by the Internal Revenue Service (IRS) for a period of three years. Foreign taxes are provided for based on the Fund's understanding of the tax rules and rates that exist in the foreign markets in which it invests. The Fund is subject to a tax imposed on short term capital gains on securities of certain issuers domiciled in India. The Fund records an estimated deferred tax liability included in Other payables and accrued expenses in the accompanying Statement of Assets & Liabilities for net unrealized gains on these securities in an amount that would be payable if the securities were disposed of at period end.
Distributions are declared and recorded on the ex-dividend date. Income dividends and capital gain distributions are declared separately for each class. Income and capital gain distributions are determined in accordance with income tax regulations, which may differ from GAAP.
Capital accounts within the financial statements are adjusted for permanent book-tax differences. These adjustments have no impact on net assets or the results of operations. Temporary book-tax differences will reverse in a subsequent period.
Book-tax differences are primarily due to short-term capital gain distributions from the Fidelity Central Funds, foreign currency transactions, certain foreign taxes, passive foreign investment companies (PFIC), market discount, deferred trustees compensation, capital loss carryforwards and losses deferred due to wash sales.
Annual Report
Notes to Financial Statements - continued
3. Significant Accounting Policies - continued
Income Tax Information and Distributions to Shareholders - continued
The federal tax cost of investment securities and unrealized appreciation (depreciation) as of period end were as follows:
Gross unrealized appreciation | $ 169,802,860 |
Gross unrealized depreciation | (32,295,987) |
Net unrealized appreciation (depreciation) | $ 137,506,873 |
| |
Tax Cost | $ 958,832,487 |
The tax-based components of distributable earnings as of period end were as follows:
Undistributed ordinary income | $ 7,203,381 |
Capital loss carryforward | $ (165,341,843) |
Net unrealized appreciation (depreciation) | $ 137,543,936 |
The tax character of distributions paid was as follows:
| October 31, 2010 | October 31, 2009 |
Ordinary Income | $ 7,413,180 | $ 11,746,083 |
Short-Term Trading (Redemption) Fees. Shares held by investors in the Fund less than 30 days are subject to a redemption fee equal to 1.00% of the net asset value of shares redeemed. All redemption fees, which reduce the proceeds of the shareholder redemption, are retained by the Fund and accounted for as an addition to paid in capital.
4. Operating Policies.
Restricted Securities. The Fund may invest in securities that are subject to legal or contractual restrictions on resale. These securities generally may be resold in transactions exempt from registration or to the public if the securities are registered. Disposal of these securities may involve time-consuming negotiations and expense, and prompt sale at an acceptable price may be difficult. Information regarding restricted securities is included at the end of the Fund's Schedule of Investments.
5. Purchases and Sales of Investments.
Purchases and sales of securities, other than short-term securities, aggregated $1,661,853,880 and $1,707,033,315, respectively.
6. Fees and Other Transactions with Affiliates.
Management Fee. FMR and its affiliates provide the Fund with investment management related services for which the Fund pays a monthly management fee. The management fee is the sum of an individual fund fee rate that is based on an annual rate of .45% of the Fund's average net assets and a group fee rate that averaged .26% during the period. The group fee rate is based upon the average net assets of all the mutual funds advised by FMR. The group fee rate decreases as assets under management increase and increases as assets under management decrease. In addition, the management fee is subject to a performance adjustment (up to a maximum of ±.20% of the Fund's average net assets over a 36 month performance period). The upward or downward adjustment to the management fee is based on the relative investment performance of Worldwide as compared to an appropriate benchmark index. For the period, the total annual management fee rate, including the performance adjustment, was .80% of the Fund's average net assets.
Distribution and Service Plan Fees. In accordance with Rule 12b-1 of the 1940 Act, the Fund has adopted separate Distribution and Service Plans for each class of shares. Certain classes pay Fidelity Distributors Corporation (FDC), an affiliate of FMR, separate Distribution and Service Fees, each of which is based on an annual percentage of each class' average net assets. In addition, FDC may pay financial intermediaries for selling shares of the Fund and providing shareholder support services. For the period, the Distribution and Service Fee rates, total fees and amounts retained by FDC were as follows:
Annual Report
6. Fees and Other Transactions with Affiliates - continued
Distribution and Service Plan Fees - continued
| Distribution
Fee | Service
Fee | Total
Fees | Retained
by FDC |
Class A | -% | .25% | $ 8,876 | $ 1,881 |
Class T | .25% | .25% | 3,697 | 386 |
Class B | .75% | .25% | 2,689 | 2,305 |
Class C | .75% | .25% | 5,692 | 3,823 |
| | | $ 20,954 | $ 8,395 |
Sales Load. FDC receives a front-end sales charge of up to 5.75% for selling Class A shares, and 3.50% for selling Class T shares, some of which is paid to financial intermediaries for selling shares of the Fund. FDC receives the proceeds of contingent deferred sales charges levied on Class A, Class T, Class B, and Class C redemptions. These charges depend on the holding period. The deferred sales charges range from 5% to 1% for Class B, 1% for Class C, 1.00% for certain purchases of Class A shares (1.00% to .50% prior to July 12, 2010) and .25% for certain purchases of Class T shares.
For the period, sales charge amounts retained by FDC were as follows:
| Retained
by FDC |
Class A | $ 5,564 |
Class T | 943 |
Class B* | 250 |
Class C* | 11 |
| $ 6,768 |
* When Class B and Class C shares are initially sold, FDC pays commissions from its own resources to financial intermediaries through which the sales are made.
Transfer Agent Fees. Fidelity Investments Institutional Operations Company, Inc. (FIIOC), an affiliate of FMR, is the transfer, dividend disbursing and shareholder servicing agent for each class of the Fund. FIIOC receives account fees and asset-based fees that vary according to the account size and type of account of the shareholders of the respective classes of the Fund. FIIOC pays for typesetting, printing and mailing of shareholder reports, except proxy statements. For the period, transfer agent fees for each class were as follows:
| Amount | % of
Average
Net Assets |
Class A | $ 10,509 | .29 |
Class T | 2,317 | .31 |
Class B | 823 | .31 |
Class C | 1,715 | .30 |
Worldwide | 2,645,955 | .26 |
Institutional Class | 1,081 | .32 |
| $ 2,662,400 | |
Accounting and Security Lending Fees. Fidelity Service Company, Inc. (FSC), an affiliate of FMR, maintains the Fund's accounting records. The accounting fee is based on the level of average net assets for the month. Under a separate contract, FSC administers the security lending program. The security lending fee is based on the number and duration of lending transactions.
Brokerage Commissions. The Fund placed a portion of its portfolio transactions with brokerage firms which are affiliates of the investment adviser. The commissions paid to these affiliated firms were $34,964 for the period.
7. Committed Line of Credit.
The Fund participates with other funds managed by FMR or an affiliate in a $3.75 billion credit facility (the "line of credit") to be utilized for temporary or emergency purposes to fund shareholder redemptions or for other short-term liquidity purposes. The Fund has agreed to pay commitment fees on its pro-rata portion of the line of credit, which amounted to $4,054 and is reflected in Miscellaneous expenses on the Statement of Operations. During the period, there were no borrowings on this line of credit.
Annual Report
Notes to Financial Statements - continued
8. Security Lending.
The Fund lends portfolio securities through a lending agent from time to time in order to earn additional income. The lending agent may loan securities to certain qualified borrowers, including Fidelity Capital Markets (FCM), a broker-dealer affiliated with the Fund. On the settlement date of the loan, the Fund receives collateral (in the form of U.S. Treasury obligations, letters of credit and/or cash) against the loaned securities and maintains collateral in an amount not less than 100% of the market value of the loaned securities during the period of the loan. The market value of the loaned securities is determined at the close of business of the Fund and any additional required collateral is delivered to the Fund on the next business day. If the borrower defaults on its obligation to return the securities loaned because of insolvency or other reasons, a fund could experience delays and costs in recovering the securities loaned or in gaining access to the collateral. Any cash collateral received is invested in the Fidelity Securities Lending Cash Central Fund. The value of loaned securities and cash collateral at period end are disclosed on the Fund's Statement of Assets and Liabilities. Security lending income represents the income earned on investing cash collateral, less rebates paid to borrowers and lending agent fees associated with the loan, plus any premium payments received for lending certain types of securities. Security lending income is presented in the Statement of Operations as a component of income from Fidelity Central Funds. Total security lending income during the period amounted to $257,400.During the period, there were no securities loaned to FCM.
9. Expense Reductions.
FMR voluntarily agreed to reimburse a portion of Worldwide's operating expenses. During the period, this reimbursement reduced the class' expenses by $43,251.
Many of the brokers with whom FMR places trades on behalf of the Fund provided services to the Fund in addition to trade execution. These services included payments of certain expenses on behalf of the Fund totaling $282,565 for the period.
10. Distributions to Shareholders.
Distributions to shareholders of each class were as follows:
Years ended October 31, | 2010 | 2009A |
From net investment income | | |
Class A | $ 9,814 | $ - |
Class T | 2,409 | - |
Class B | 75 | - |
Class C | 827 | - |
Worldwide | 6,404,601 | 11,746,083 |
Institutional Class | 2,241 | - |
Total | $ 6,419,967 | $ 11,746,083 |
From net realized gain | | |
Class A | $ 1,404 | $ - |
Class T | 480 | - |
Class B | 191 | - |
Class C | 373 | - |
Worldwide | 990,471 | - |
Institutional Class | 294 | - |
Total | $ 993,213 | $ - |
A Distributions for Class A, Class T, Class B Class C and Institutional class are for the period February 19, 2009 (commencement of sale of shares) to October 31, 2009.
11. Share Transactions.
Transactions for each class of shares were as follows:
| Shares | Dollars |
Years ended October 31, | 2010 | 2009A | 2010 | 2009A |
Class A | | | | |
Shares sold | 404,777 | 68,262 | $ 6,463,954 | $ 954,848 |
Reinvestment of distributions | 589 | - | 9,399 | - |
Shares redeemed | (41,328) | (1,913) | (668,935) | (30,621) |
Net increase (decrease) | 364,038 | 66,349 | $ 5,804,418 | $ 924,227 |
Annual Report
11. Share Transactions - continued
| Shares | Dollars |
Years ended October 31, | 2010 | 2009A | 2010 | 2009A |
Class T | | | | |
Shares sold | 57,729 | 31,350 | $ 930,150 | $ 413,190 |
Reinvestment of distributions | 156 | - | 2,498 | - |
Shares redeemed | (24,377) | (691) | (385,540) | (10,728) |
Net increase (decrease) | 33,508 | 30,659 | $ 547,108 | $ 402,462 |
Class B | | | | |
Shares sold | 11,168 | 16,229 | $ 177,092 | $ 199,531 |
Reinvestment of distributions | 16 | - | 260 | - |
Shares redeemed | (8,709) | (1,150) | (138,098) | (18,389) |
Net increase (decrease) | 2,475 | 15,079 | $ 39,254 | $ 181,142 |
Class C | | | | |
Shares sold | 34,028 | 23,542 | $ 543,674 | $ 304,403 |
Reinvestment of distributions | 68 | - | 1,087 | - |
Shares redeemed | (15,747) | (1,012) | (246,126) | (14,575) |
Net increase (decrease) | 18,349 | 22,530 | $ 298,635 | $ 289,828 |
Worldwide | | | | |
Shares sold | 8,421,228 | 9,823,250 | $ 135,177,567 | $ 126,506,866 |
Reinvestment of distributions | 449,494 | 959,833 | 7,194,622 | 11,413,258 |
Shares redeemed | (13,209,138) | (14,319,175) | (210,537,866) | (180,350,310) |
Net increase (decrease) | (4,338,416) | (3,536,092) | $ (68,165,677) | $ (42,430,186) |
Institutional Class | | | | |
Shares sold | 9,920 | 19,375 | $ 162,697 | $ 249,261 |
Reinvestment of distributions | 158 | - | 2,535 | - |
Shares redeemed | (10,397) | (6) | (165,950) | (83) |
Net increase (decrease) | (319) | 19,369 | $ (718) | $ 249,178 |
A Share transactions for Class A, Class T, Class B Class C and Institutional class are for the period February 19, 2009 (commencement of sale of shares) to October 31, 2009.
12. Other.
The Fund's organizational documents provide former and current trustees and officers with a limited indemnification against liabilities arising in connection with the performance of their duties to the Fund. In the normal course of business, the Fund may also enter into contracts that provide general indemnifications. The Fund's maximum exposure under these arrangements is unknown as this would be dependent on future claims that may be made against the Fund. The risk of material loss from such claims is considered remote.
Annual Report
Report of Independent Registered Public Accounting Firm
To the Trustees of Fidelity Investment Trust and Shareholders of Fidelity Worldwide Fund:
We have audited the accompanying statement of assets and liabilities of Fidelity Worldwide Fund (the Fund), a fund of Fidelity Investment Trust, including the schedule of investments, as of October 31, 2010, and the related statement of operations for the year then ended, the statement of changes in net assets for each of the two years in the period then ended, and the financial highlights for each of the five years in the period then ended. These financial statements and financial highlights are the responsibility of the Fund's management. Our responsibility is to express an opinion on these financial statements and financial highlights based on our audits.
We conducted our audits in accordance with standards of the Public Company Accounting Oversight Board (United States). Those standards require that we plan and perform the audit to obtain reasonable assurance about whether the financial statements and financial highlights are free of material misstatement. The Fund is not required to have, nor were we engaged to perform, an audit of its internal control over financial reporting. Our audits included consideration of internal control over financial reporting as a basis for designing audit procedures that are appropriate in the circumstances, but not for the purpose of expressing an opinion on the effectiveness of the Fund's internal control over financial reporting. Accordingly, we express no such opinion. An audit also includes examining, on a test basis, evidence supporting the amounts and disclosures in the financial statements, assessing the accounting principles used and significant estimates made by management, as well as evaluating the overall financial statement presentation. Our procedures included confirmation of securities owned as of October 31, 2010, by correspondence with the custodians and brokers; where replies were not received from brokers, we performed other auditing procedures. We believe that our audits provide a reasonable basis for our opinion.
In our opinion, the financial statements and financial highlights referred to above present fairly, in all material respects, the financial position of Fidelity Worldwide Fund as of October 31, 2010, the results of its operations for the year then ended, the changes in its net assets for each of the two years in the period then ended, and its financial highlights for each of the five years in the period then ended, in conformity with accounting principles generally accepted in the United States of America.
/s/ Deloitte & Touche LLP
DELOITTE & TOUCHE LLP
Boston, Massachusetts
December 17, 2010
Annual Report
The Trustees, Member of the Advisory Board, and executive officers of the trust and funds, as applicable, are listed below. The Board of Trustees governs each fund and is responsible for protecting the interests of shareholders. The Trustees are experienced executives who meet periodically throughout the year to oversee each fund's activities, review contractual arrangements with companies that provide services to each fund, oversee management of the risks associated with such activities and contractual arrangements, and review each fund's performance. Except for James C. Curvey, each of the Trustees oversees 221 funds advised by FMR or an affiliate. Mr. Curvey oversees 410 funds advised by FMR or an affiliate.
The Trustees hold office without limit in time except that (a) any Trustee may resign; (b) any Trustee may be removed by written instrument, signed by at least two-thirds of the number of Trustees prior to such removal; (c) any Trustee who requests to be retired or who has become incapacitated by illness or injury may be retired by written instrument signed by a majority of the other Trustees; and (d) any Trustee may be removed at any special meeting of shareholders by a two-thirds vote of the outstanding voting securities of the trust. Each Trustee who is not an interested person (as defined in the 1940 Act) (Independent Trustee), shall retire not later than the last day of the calendar year in which his or her 72nd birthday occurs. The Independent Trustees may waive this mandatory retirement age policy with respect to individual Trustees. The executive officers and Advisory Board Member hold office without limit in time, except that any officer and Advisory Board Member may resign or may be removed by a vote of a majority of the Trustees at any regular meeting or any special meeting of the Trustees. Except as indicated, each individual has held the office shown or other offices in the same company for the past five years.
Experience, Skills, Attributes, and Qualifications of the Funds' Trustees. The Governance and Nominating Committee has adopted a statement of policy that describes the experience, qualifications, attributes, and skills that are necessary and desirable for potential Independent Trustee candidates (Statement of Policy). The Board believes that each Trustee satisfied at the time he or she was initially elected or appointed a Trustee, and continues to satisfy, the standards contemplated by the Statement of Policy. The Governance and Nominating Committee also engages professional search firms to help identify potential Independent Trustee candidates who have the experience, qualifications, attributes, and skills consistent with the Statement of Policy. From time to time, additional criteria based on the composition and skills of the current Independent Trustees, as well as experience or skills that may be appropriate in light of future changes to board composition, business conditions, and regulatory or other developments, have also been considered by the professional search firms and the Governance and Nominating Committee. In addition, the Board takes into account the Trustees' commitment and participation in Board and committee meetings, as well as their leadership of standing and ad hoc committees throughout their tenure.
In determining that a particular Trustee was and continues to be qualified to serve as a Trustee, the Board has considered a variety of criteria, none of which, in isolation, was controlling. The Board believes that, collectively, the Trustees have balanced and diverse experience, qualifications, attributes, and skills, which allow the Board to operate effectively in governing each fund and protecting the interests of shareholders. Information about the specific experience, skills, attributes, and qualifications of each Trustee, which in each case led to the Board's conclusion that the Trustee should serve (or continue to serve) as a trustee of the funds, is provided below.
Board Structure and Oversight Function. Edward C. Johnson 3d is an interested person (as defined in the 1940 Act) and currently serves as Chairman. The Trustees have determined that an interested Chairman is appropriate and benefits shareholders because an interested Chairman has a personal and professional stake in the quality and continuity of services provided to the funds. Independent Trustees exercise their informed business judgment to appoint an individual of their choosing to serve as Chairman, regardless of whether the Trustee happens to be independent or a member of management. The Independent Trustees have determined that they can act independently and effectively without having an Independent Trustee serve as Chairman and that a key structural component for assuring that they are in a position to do so is for the Independent Trustees to constitute a substantial majority for the Board. The Independent Trustees also regularly meet in executive session. Ned C. Lautenbach serves as Chairman of the Independent Trustees and as such (i) acts as a liaison between the Independent Trustees and management with respect to matters important to the Independent Trustees and (ii) with management prepares agendas for Board meetings.
Fidelity funds are overseen by different Boards of Trustees. The funds' Board oversees Fidelity's equity and high income funds and another Board oversees Fidelity's investment-grade bond, money market, and asset allocation funds. The asset allocation funds may invest in Fidelity funds overseen by the funds' Board. The use of separate Boards, each with its own committee structure, allows the Trustees of each group of Fidelity funds to focus on the unique issues of the funds they oversee, including common research, investment, and operational issues. On occasion, the separate Boards establish joint committees to address issues of overlapping consequences for the Fidelity funds overseen by each Board.
The Trustees operate using a system of committees to facilitate the timely and efficient consideration of all matters of importance to the Trustees, each fund, and fund shareholders and to facilitate compliance with legal and regulatory requirements and oversight of the funds' activities and associated risks. The Board, acting through its committees, has charged FMR and its affiliates with (i) identifying events or circumstances the occurrence of which could have demonstrably adverse effects on the funds' business and/or reputation; (ii) implementing processes and controls to lessen the possibility that such events or circumstances occur or to mitigate the effects of such events or circumstances if they do occur; and (iii) creating and maintaining a system designed to evaluate continuously business and market conditions in order to facilitate the identification and implementation processes described in (i) and (ii) above. Because the day-to-day operations and activities of the funds are carried out by or through FMR, its affiliates and other service providers, the funds' exposure to risks is mitigated but not eliminated by the processes overseen by the Trustees. While each of the Board's committees has responsibility for overseeing different aspects of the funds' activities, oversight is exercised primarily through the Operations, Audit, and Compliance Committees. Appropriate personnel, including but not limited to the funds' Chief Compliance Officer (CCO), FMR's internal auditor, the independent accountants, the funds' Treasurer and portfolio management personnel, make periodic reports to the Board's committees, as appropriate. The responsibilities of each committee, including their oversight responsibilities, are described further under "Standing Committees of the Funds' Trustees."
Annual Report
Trustees and Officers - continued
The funds' Statement of Additional Information (SAI) includes more information about the Trustees. To request a free copy, call Fidelity at 1-800-544-8544.
Interested Trustees*:
Correspondence intended for each Trustee who is an interested person may be sent to Fidelity Investments, 82 Devonshire Street, Boston, Massachusetts 02109.
Name, Age; Principal Occupations and Other Relevant Experience+ |
Edward C. Johnson 3d (80) |
| Year of Election or Appointment: 1984 Mr. Johnson is Trustee and Chairman of the Board of Trustees of certain Trusts. Mr. Johnson serves as Chief Executive Officer, Chairman, and a Director of FMR LLC; Chairman and a Director of FMR; Chairman and a Director of Fidelity Research & Analysis Company (FRAC); Chairman and a Director of Fidelity Investments Money Management, Inc.; and Chairman and a Director of FMR Co., Inc. In addition, Mr. Johnson serves as Chairman and Director of FIL Limited. Previously, Mr. Johnson served as President of FMR LLC (2006-2007). |
James C. Curvey (75) |
| Year of Election or Appointment: 2007 Mr. Curvey also serves as Trustee (2007-present) of other investment companies advised by FMR. Mr. Curvey is a Director of Fidelity Investments Money Management, Inc. (2009-present), Director of Fidelity Research & Analysis Co. (2009-present) and Director of FMR and FMR Co., Inc. (2007-present). Mr. Curvey is also Vice Chairman (2007-present) and Director of FMR LLC. In addition,
Mr. Curvey serves as an Overseer for the Boston Symphony Orchestra and a member of the Trustees of Villanova University. Previously, Mr. Curvey was the Vice Chairman (2006-2007) and Director (2000-2007) of FMR Corp. |
* Trustees have been determined to be "Interested Trustees" by virtue of, among other things, their affiliation with the trust or various entities under common control with FMR.
+ The information above includes each Trustee's principal occupation during the last five years and other information relating to the experience, attributes, and skills relevant to each Trustee's qualifications to serve as a Trustee, which led to the conclusion that each Trustee should serve as a Trustee for each fund.
Independent Trustees:
Correspondence intended for each Independent Trustee (that is, the Trustees other than the Interested Trustees) may be sent to Fidelity Investments, P.O. Box 55235, Boston, Massachusetts 02205-5235.
Name, Age; Principal Occupations and Other Relevant Experience+ |
Dennis J. Dirks (62) |
| Year of Election or Appointment: 2005 Prior to his retirement in May 2003, Mr. Dirks was Chief Operating Officer and a member of the Board of The Depository Trust & Clearing Corporation (DTCC). He also served as President, Chief Operating Officer, and Board member of The Depository Trust Company (DTC) and President and Board member of the National Securities Clearing Corporation (NSCC). In addition, Mr. Dirks served as Chief Executive Officer and Board member of the Government Securities Clearing Corporation, Chief Executive Officer and Board member of the Mortgage-Backed Securities Clearing Corporation, as a Trustee and a member of the Finance Committee of Manhattan College (2005-2008), and as a Trustee and a member of the Finance Committee of AHRC of Nassau County (2006-2008). Mr. Dirks is a member of the Independent Directors Council (IDC) Governing Council (2010-Present) and Board of Directors for The Brookville Center for Children's Services, Inc. (2009-present). |
Alan J. Lacy (57) |
| Year of Election or Appointment: 2008 Mr. Lacy serves as Senior Adviser (2007-present) of Oak Hill Capital Partners, L.P. (private equity). Mr. Lacy also served as Chief Executive Officer (2000-2005) and Vice Chairman (2005-2006) of Sears Holdings Corporation and Sears, Roebuck and Co. (retail). In addition, Mr. Lacy serves as a member of the Board of Directors of The Western Union Company (global money transfer, 2006-present) and Bristol-Myers Squibb Company (global pharmaceuticals, 2007-present). Mr. Lacy is Chairman (2008-present) and a member (2006-present) of the Board of Trustees of The National Parks Conservation Association. |
Ned C. Lautenbach (66) |
| Year of Election or Appointment: 2000 Mr. Lautenbach is Chairman of the Independent Trustees of the Equity and High Income Funds (2006-present). Mr. Lautenbach currently serves as the Lead Director of the Eaton Corporation Board of Directors (diversified industrial, 1997-present). Mr. Lautenbach is also a member of the Board of Directors of the Philharmonic Center for the Arts in Naples, Florida (1999 - present); a member of the Board of Trustees of Fairfield University (2005-present); and a member of the Council on Foreign Relations (1994 - present). Previously, Mr. Lautenbach was a Partner/Advisory Partner at Clayton, Dubilier & Rice, Inc. (private equity investment, 1998-2010), as well as a Director of Sony Corporation (2006-2007). |
Joseph Mauriello (66) |
| Year of Election or Appointment: 2008 Prior to his retirement in January 2006, Mr. Mauriello served in numerous senior management positions including Deputy Chairman and Chief Operating Officer (2004-2005), and Vice Chairman of Financial Services (2002-2004) of KPMG LLP US (professional services, 1965-2005). Mr. Mauriello currently serves as a member of the Board of Directors of XL Group plc. (global insurance and re-insurance, 2006-present) and of Arcadia Resources Inc. (health care services and products, 2007-present). Previously, Mr. Mauriello served as a Director of the Hamilton Funds of the Bank of New York (2006-2007). |
Cornelia M. Small (66) |
| Year of Election or Appointment: 2005 Ms. Small is a member of the Board of Directors of the Teagle Foundation (2009-present). Ms. Small is also a member of the Investment Committee, and Chair (2008-present) and a member of the Board of Trustees of Smith College. In addition, Ms. Small serves on the Investment Committee of the Berkshire Taconic Community Foundation (2008-present). Previously, Ms. Small served as Chairperson of the Investment Committee (2002-2008) of Smith College. In addition, Ms. Small served as Chief Investment Officer, Director of Global Equity Investments, and a member of the Board of Directors of Scudder, Stevens & Clark and Scudder Kemper Investments. |
William S. Stavropoulos (71) |
| Year of Election or Appointment: 2001 Mr. Stavropoulos is Vice Chairman of the Independent Trustees of the Equity and High Income Funds (2006-present). Mr. Stavropoulos serves as President and Founder of the Michigan Baseball Foundation, the Great Lakes Loons (2007-present). Mr. Stavropoulos is Chairman Emeritus of the Board of Directors of The Dow Chemical Company, where he previously served in numerous senior management positions, including President, CEO (1995-2000; 2002-2004), Chairman of the Executive Committee (2000-2006), and as a member of the Board of Directors (1990-2006). Currently, Mr. Stavropoulos is Chairman of Univar (global distributor of commodity and specialty chemicals, 2010-present), a Director of Teradata Corporation (data warehousing and technology solutions, 2008-present), Chemical Financial Corporation, Maersk Inc. (industrial conglomerate), Tyco International, Inc. (multinational manufacturing and services, 2007-present), and a member of the Advisory Board for Metalmark Capital (private equity investment, 2005-present). Mr. Stavropoulos is a special advisor to Clayton, Dubilier & Rice, Inc. (private equity investment). In addition, Mr. Stavropoulos is a member of the University of Notre Dame Advisory Council for the College of Science. |
David M. Thomas (61) |
| Year of Election or Appointment: 2008 Previously, Mr. Thomas served as Executive Chairman (2005-2006) and Chairman and Chief Executive Officer (2000-2005) of IMS Health, Inc. (pharmaceutical and healthcare information solutions). In addition, Mr. Thomas serves as a member of the Board of Directors of Fortune Brands, Inc. (consumer products), and Interpublic Group of Companies, Inc. (marketing communication, 2004-present). |
Michael E. Wiley (60) |
| Year of Election or Appointment: 2008 Mr. Wiley also serves as a Director of Asia Pacific Exploration Consolidated (international oil and gas exploration and production, 2008-present). Mr. Wiley serves as a Director of Tesoro Corporation (independent oil refiner and marketer, 2005-present), and a Director of Bill Barrett Corporation (exploration and production, 2005-present). In addition, Mr. Wiley also serves as a Director of Post Oak Bank (privately-held bank, 2004-present). Previously, Mr. Wiley served as a member of the Board of Trustees of the University of Tulsa (2000-2006; 2007-2010), as a Senior Energy Advisor of Katzenbach Partners, LLC (consulting, 2006-2007), as an Advisory Director of Riverstone Holdings (private investment), Chairman, President, and CEO of Baker Hughes, Inc. (oilfield services, 2000-2004), and as Director of Spinnaker Exploration Company (exploration and production, 2001-2005). |
+ The information above includes each Trustee's principal occupation during the last five years and other information relating to the experience, attributes, and skills relevant to each Trustee's qualifications to serve as a Trustee, which led to the conclusion that each Trustee should serve as a Trustee for each fund.
Annual Report
Trustees and Officers - continued
Advisory Board Member and Executive Officers:
Correspondence intended for each executive officer and Peter S. Lynch may be sent to Fidelity Investments, 82 Devonshire Street, Boston, Massachusetts 02109.
Name, Age; Principal Occupation |
Peter S. Lynch (66) |
| Year of Election or Appointment: 2003 Member of the Advisory Board of Fidelity's Equity and High Income Funds. Mr. Lynch is Vice Chairman and a Director of FMR and FMR Co., Inc. In addition, Mr. Lynch serves as a Trustee of Boston College and as the Chairman of the Inner-City Scholarship Fund. Previously, Mr. Lynch served on the Special Olympics International Board of Directors (1997-2006). |
Kenneth B. Robins (41) |
| Year of Election or Appointment: 2008 President and Treasurer of Fidelity's Equity and High Income Funds. Mr. Robins also serves as President and Treasurer (2010-present) and Assistant Treasurer (2009-present) of other Fidelity funds and is an employee of Fidelity Investments (2004-present). Previously, Mr. Robins served as Deputy Treasurer of the Fidelity funds (2005-2008) and Treasurer and Chief Financial Officer of The North Carolina Capital Management Trust: Cash and Term Portfolios (2006-2008). |
Bruce T. Herring (45) |
| Year of Election or Appointment: 2006 Vice President of certain Equity Funds. Mr. Herring also serves as Chief Investment Officer and Director of Fidelity Management & Research (U.K.) Inc. (2010-present) and Group Chief Investments Officer of FMR. Previously, Mr. Herring served as Vice President (2005-2006) and Senior Vice President (2006-2007) of Fidelity Management & Research Company, Vice President of FMR Co., Inc. (2001-2007) and as a portfolio manager for Fidelity U.S. Equity Funds. |
Brian B. Hogan (46) |
| Year of Election or Appointment: 2009 Vice President of certain Equity Funds and Vice President of Sector Funds. Mr. Hogan also serves as President of FMR's Equity Division (2009-present). Previously, Mr. Hogan served as Senior Vice President, Equity Research of FMR (2006-2009) and as a portfolio manager. |
Scott C. Goebel (42) |
| Year of Election or Appointment: 2008 Secretary and Chief Legal Officer (CLO) of the Fidelity funds. Mr. Goebel also serves as Secretary and CLO of The North Carolina Capital Management Trust: Cash and Term Portfolio (2008-present); General Counsel, Secretary, and Senior Vice President of FMR (2008-present) and FMR Co., Inc. (2008-present); Deputy General Counsel of FMR LLC; Chief Legal Officer of Fidelity Management & Research (Hong Kong) Limited (2008-present) and Assistant Secretary of Fidelity Management & Research (Japan) Inc. (2008-present), Fidelity Investments Money Management, Inc. (2008-present), Fidelity Management & Research (U.K.) Inc. (2008-present), and Fidelity Research and Analysis Company (2008-present). Previously, Mr. Goebel served as Assistant Secretary of the Funds (2007-2008) and as Vice President and Secretary of Fidelity Distributors Corporation (FDC) (2005-2007). |
William C. Coffey (41) |
| Year of Election or Appointment: 2009 Assistant Secretary of Fidelity's Equity and High Income Funds. Mr. Coffey also serves as Senior Vice President and Deputy General Counsel of FMR LLC (2010-present), and is an employee of Fidelity Investments. Previously, Mr. Coffey served as Vice President and Associate General Counsel of FMR LLC (2005-2009). |
Holly C. Laurent (56) |
| Year of Election or Appointment: 2008 Anti-Money Laundering (AML) Officer of the Fidelity funds. Ms. Laurent also serves as AML Officer of The North Carolina Capital Management Trust: Cash and Term Portfolio (2008-present) and is an employee of Fidelity Investments. Previously, Ms. Laurent was Senior Vice President and Head of Legal for Fidelity Business Services India Pvt. Ltd. (2006-2008), and Senior Vice President, Deputy General Counsel and Group Head for FMR LLC (2005-2006). |
Christine Reynolds (52) |
| Year of Election or Appointment: 2008 Chief Financial Officer of the Fidelity funds. Ms. Reynolds became President of Fidelity Pricing and Cash Management Services (FPCMS) in August 2008. Ms. Reynolds served as Chief Operating Officer of FPCMS (2007-2008). Previously, Ms. Reynolds served as President, Treasurer, and Anti-Money Laundering officer of the Fidelity funds (2004-2007). |
Kenneth A. Rathgeber (63) |
| Year of Election or Appointment: 2004 Chief Compliance Officer of Fidelity's Equity and High Income Funds. Mr. Rathgeber is Chief Compliance Officer of Fidelity Management & Research (Hong Kong) Limited (2008-present), Fidelity Management & Research (Japan) Inc. (2008-present), FMR (2005-present), FMR Co., Inc. (2005-present), Fidelity Management & Research (U.K.) Inc. (2005-present), Fidelity Research & Analysis Company (2005-present), Fidelity Investments Money Management, Inc. (2005-present), Pyramis Global Advisors, LLC (2005-present), and Strategic Advisers, Inc. (2005-present). |
Jeffrey S. Christian (49) |
| Year of Election or Appointment: 2009 Deputy Treasurer of the Fidelity funds. Mr. Christian is an employee of Fidelity Investments. Previously, Mr. Christian served as Chief Financial Officer (2008-2009) of certain Fidelity funds and Senior Vice President of Fidelity Pricing and Cash Management Services (FPCMS) (2004-2009). |
Bryan A. Mehrmann (49) |
| Year of Election or Appointment: 2005 Deputy Treasurer of the Fidelity funds. Mr. Mehrmann is an employee of Fidelity Investments. |
Adrien E. Deberghes (43) |
| Year of Election or Appointment: 2008 Deputy Treasurer of Fidelity's Equity and High Income Funds. Mr. Deberghes also serves as Assistant Treasurer of other Fidelity funds (2010-present) and is an employee of Fidelity Investments (2008-present). Previously, Mr. Deberghes served as Senior Vice President of Mutual Fund Administration at State Street Corporation (2007-2008), Senior Director of Mutual Fund Administration at Investors Bank & Trust (2005-2007), and Director of Finance for Dunkin' Brands (2000-2005). |
Stephanie J. Dorsey (41) |
| Year of Election or Appointment: 2010 Assistant Treasurer of Fidelity's Equity and High Income Funds. Ms. Dorsey also serves as Deputy Treasurer of other Fidelity funds (2008-present) and is an employee of Fidelity Investments (2008-present). Previously, Ms. Dorsey served as Treasurer (2004-2008) of the JPMorgan Mutual Funds and Vice President (2004-2008) of JPMorgan Chase Bank. |
John R. Hebble (52) |
| Year of Election or Appointment: 2009 Assistant Treasurer of Fidelity's Equity and High Income Funds. Mr. Hebble also serves as Treasurer and Chief Financial Officer of The North Carolina Capital Management Trust: Cash and Term Portfolio (2008-present), President and Treasurer of other Fidelity funds (2008-present) and is an employee of Fidelity Investments. |
Gary W. Ryan (52) |
| Year of Election or Appointment: 2005 Assistant Treasurer of the Fidelity funds. Mr. Ryan is an employee of Fidelity Investments. Previously, Mr. Ryan served as Vice President of Fund Reporting in Fidelity Pricing and Cash Management Services (FPCMS) (1999-2005). |
Jonathan Davis (42) |
| Year of Election or Appointment: 2010 Assistant Treasurer of the Fidelity funds. Mr. Davis is an employee of Fidelity Investments. Previously, Mr. Davis served as Vice President and Associate General Counsel of FMR LLC (2003-2010). |
Annual Report
The Board of Trustees of each fund voted to pay to shareholders of record at the opening of business on record date the following distributions per share derived from capital gains realized from sales of portfolio securities and dividends derived from net investment income:
| Pay Date | Record Date | Dividends | Capital Gains |
Fidelity Diversified International Fund | 12/06/10 | 12/03/10 | $0.368 | $0.081 |
Fidelity International Capital Appreciation Fund | 12/06/10 | 12/03/10 | $0.120 | $0.100 |
Fidelity Overseas Fund | 12/06/10 | 12/03/10 | $0.481 | $0.000 |
Fidelity Worldwide Fund | 12/06/10 | 12/03/10 | $0.078 | $0.046 |
A percentage of the dividends distributed during the fiscal year for the following funds may be taken into account as a dividend for purposes of the maximum rate under section 1(h) (11) of the Internal Revenue Code:
| Ex Date | |
Fidelity Diversified International Fund | 12/04/2009 | 100% |
Fidelity International Capital Appreciation Fund | 12/04/2009 | 40% |
Fidelity Overseas Fund | 12/04/2009 | 100% |
Fidelity Overseas Fund | 12/30/2009 | 100% |
Fidelity Worldwide Fund | 12/04/2009 | 100% |
Fidelity Worldwide Fund | 12/30/2009 | 100% |
A percentage of the dividends distributed during the fiscal year for the following funds qualify for the dividends-received deduction for corporate shareholders:
| Ex Date | |
Fidelity Worldwide Fund | 12/04/2009 | 58% |
Fidelity Worldwide Fund | 12/30/2009 | 100% |
The amounts per share which represent income derived from sources within, and taxes paid to, foreign countries or possessions of the United States are as follows:
| Pay Date | Income | Taxes |
Fidelity Diversified International Fund | 12/07/2009 | 0.296 | 0.031 |
Fidelity International Capital Appreciation Fund | 12/07/2009 | 0.084 | 0.0145 |
Fidelity Overseas Fund | 12/07/2009 | 0.435 | 0.0394 |
Fidelity Overseas Fund | 12/31/2009 | 0.009 | 0.0000 |
Fidelity Worldwide Fund | 12/07/2009 | 0.097 | 0.0113 |
Fidelity Worldwide Fund | 12/31/2009 | 0.004 | 0.0000 |
The funds will notify shareholders in January 2011 of amounts for use in preparing 2010 income tax returns.
Annual Report
Board Approval of Investment Advisory Contracts and Management Fees
Broadly Diversified International Equity Funds
Each year, the Board of Trustees, including the Independent Trustees (together, the Board), votes on the renewal of the management contract and sub-advisory agreements (together, the Advisory Contracts) for each fund. The Board, assisted by the advice of fund counsel and Independent Trustees' counsel, requests and considers a broad range of information relevant to the renewal of the Advisory Contracts throughout the year.
The Board meets regularly and considers at each of its meetings factors that are relevant to its annual consideration of the renewal of each fund's Advisory Contracts, including the services and support provided to each fund and its shareholders. The Board has established various standing committees, each composed of Independent Trustees with varying backgrounds, to which the Board has assigned specific subject matter responsibilities in order to enhance effective decision-making by the Board. The Board, acting directly and through its Committees, requests and receives information concerning the annual consideration of the renewal of each fund's Advisory Contracts. The Board also meets as needed to consider matters specifically related to the Board's annual consideration of the renewal of Advisory Contracts. Members of the Board may also meet with trustees of other Fidelity funds through ad hoc joint committees to discuss certain matters relevant to the Fidelity funds.
At its July 2010 meeting, the Board of Trustees, including the Independent Trustees, unanimously determined to renew each fund's Advisory Contracts. In reaching its determination, the Board considered all factors it believed relevant, including (i) the nature, extent, and quality of the services to be provided to each fund and its shareholders (including the investment performance of each fund); (ii) the competitiveness of each fund's management fee and total expenses; (iii) the total costs of the services to be provided by and the profits to be realized by Fidelity from its relationship with each fund; (iv) the extent to which economies of scale would be realized as each fund grows; and (v) whether fee levels reflect these economies of scale, if any, for the benefit of fund shareholders.
In considering whether to renew the Advisory Contracts for each fund, the Board reached a determination, with the assistance of fund counsel and Independent Trustees' counsel and through the exercise of its business judgment, that the renewal of the Advisory Contracts is in the best interests of fund shareholders and that the compensation to be received by Fidelity under the management contracts is fair and reasonable. The Board's decision to renew the Advisory Contracts was not based on any single factor noted above, but rather was based on a comprehensive consideration of all the information provided to the Board at its meetings throughout the year. The Board, in reaching its determination to renew the Advisory Contracts, is aware that shareholders in each fund have a broad range of investment choices available to them, including a wide choice among mutual funds offered by Fidelity's competitors, and that each fund's shareholders, with the opportunity to review and weigh the disclosure provided by the fund in its prospectus and other public disclosures, have chosen to invest in that fund, managed by Fidelity.
Nature, Extent, and Quality of Services Provided. The Board considered the staffing within the investment adviser, FMR, and the sub-advisers (together, the Investment Advisers), including the backgrounds of the funds' investment personnel and the funds' investment objectives and disciplines. The Independent Trustees also had discussions with senior management of Fidelity's investment operations and investment groups. The Board considered the structure of the portfolio manager compensation program and whether this structure provides appropriate incentives to act in the best interest of each fund.
Resources Dedicated to Investment Management and Support Services. The Board and the equity research subcommittee of the Board's Fund Oversight Committee reviewed the size, education, and experience of the Investment Advisers' investment staff, their use of technology, and the Investment Advisers' approach to recruiting, training, and retaining portfolio managers and other research, advisory, and management personnel. The Board noted that Fidelity's analysts have access to a variety of technological tools and market and securities data that enable them to perform both fundamental and quantitative analysis and to specialize in various disciplines. The Board considered Fidelity's extensive global research capabilities that enable the Investment Advisers to aggregate data from various sources in an effort to produce positive investment results. The Board also considered that Fidelity's portfolio managers and analysts have access to daily portfolio attribution that allows for monitoring of a fund's portfolio, as well as an electronic communication system that provides immediate real-time access to research concerning issuers and credit enhancers. The Board noted FMR's continued focus on strengthening the organization and discipline of equity portfolio management and research.
Shareholder and Administrative Services. The Board considered (i) the nature, extent, quality, and cost of advisory, administrative, and shareholder services performed by the Investment Advisers and their affiliates under the Advisory Contracts and under separate agreements covering transfer agency, pricing and bookkeeping, and securities lending services for each fund; (ii) the nature and extent of the investment adviser's supervision of third party service providers, principally custodians and subcustodians; and (iii) the resources devoted to, and the record of compliance with, each fund's compliance policies and procedures. The Board also reviewed the allocation of fund brokerage, including allocations to brokers affiliated with the Investment Advisers, the use of brokerage commissions to pay fund expenses, and the use of "soft" commission dollars to pay for research services.
The Board noted that the growth of fund assets over time across the complex allows Fidelity to reinvest in the development of services designed to enhance the value or convenience of the Fidelity funds as investment vehicles. These services include 24-hour access to account information and market information through phone representatives and over the Internet, and investor education materials and asset allocation tools.
Investment in a Large Fund Family. The Board considered the benefits to shareholders of investing in a Fidelity fund, including the benefits of investing in a fund that is part of a large family of funds offering a variety of investment disciplines and providing a large variety of mutual fund investor services. The Board noted that Fidelity had taken, or had made recommendations that resulted in the Fidelity funds taking, a number of actions over the previous year that benefited particular funds, including (i) dedicating additional resources to investment research and restructuring and broadening the focus of the investment research teams; (ii) bolstering the senior management team that oversees asset management; (iii) launching Class F of certain funds as a lower-fee class available to Freedom K and Freedom Index Funds; (iv) lowering the initial investment minimums and ongoing balance requirements for Real Estate High Income Fund; (v) eliminating subsequent purchase minimums for all funds and adding a waiver of the investment minimum requirement for new accounts opened with the proceeds of a systematic withdrawal plan; (vi) eliminating the withdrawal minimum and maximum limits for systematic withdrawals from Advisor funds; (vii) expanding sales load waivers on Class A shares for Destiny Planholders and expanding Institutional Class eligibility for Class O Destiny Planholders; and (viii) changing certain Class A and Class T sales charge structures to further align them with industry practices.
Annual Report
Board Approval of Investment Advisory Contracts and Management Fees - continued
Investment Performance (Diversified International Fund and Overseas Fund). The Board considered whether each fund has operated in accordance with its investment objective, as well as its record of compliance with its investment restrictions. It also reviewed each fund's absolute investment performance for each class (except Class F), as well as each fund's relative investment performance for each class (except Class F) measured over multiple periods against (i) a broad-based securities market index, and (ii) a peer group of mutual funds deemed appropriate by Fidelity and reviewed by the Board. The following charts considered by the Board show, over the one-, three-, and five-year periods ended December 31, 2009, as available, the cumulative total returns of Class K and the retail class of the fund, the cumulative total returns of a broad-based securities market index ("benchmark"), and a range of cumulative total returns of a peer group of mutual funds identified by Morningstar, Inc. as having an investment style similar to that of the fund based on underlying portfolio holdings. (Class F of each fund had less than one year of performance as of December 31, 2009.) The box within each chart shows the 25th percentile return (bottom of box) and the 75th percentile return (top of box) of the peer group. Returns shown above the box are in the first quartile and returns shown below the box are in the fourth quartile. The percentage beaten numbers noted below each chart correspond to the percentile box and represent the percentage of funds in the peer group whose performance was equal to or lower than that of the class indicated.
Fidelity Diversified International Fund

The Board reviewed the fund's relative investment performance against its peer group and noted that the performance of the retail class of the fund (the class with the longer performance record) was in the second quartile for all the periods shown. The Board also noted that the investment performance of the retail class of the fund compared favorably to its benchmark for the three- and five-year periods, although the one-year cumulative total return of the retail class of the fund was lower than its benchmark. The Board considered that the variations in performance between the fund's classes reflect the variations in class expenses, which result in lower performance for the higher expense class. The Board also reviewed the fund's performance since inception as well as performance in the current year.
Annual Report
Fidelity Overseas Fund
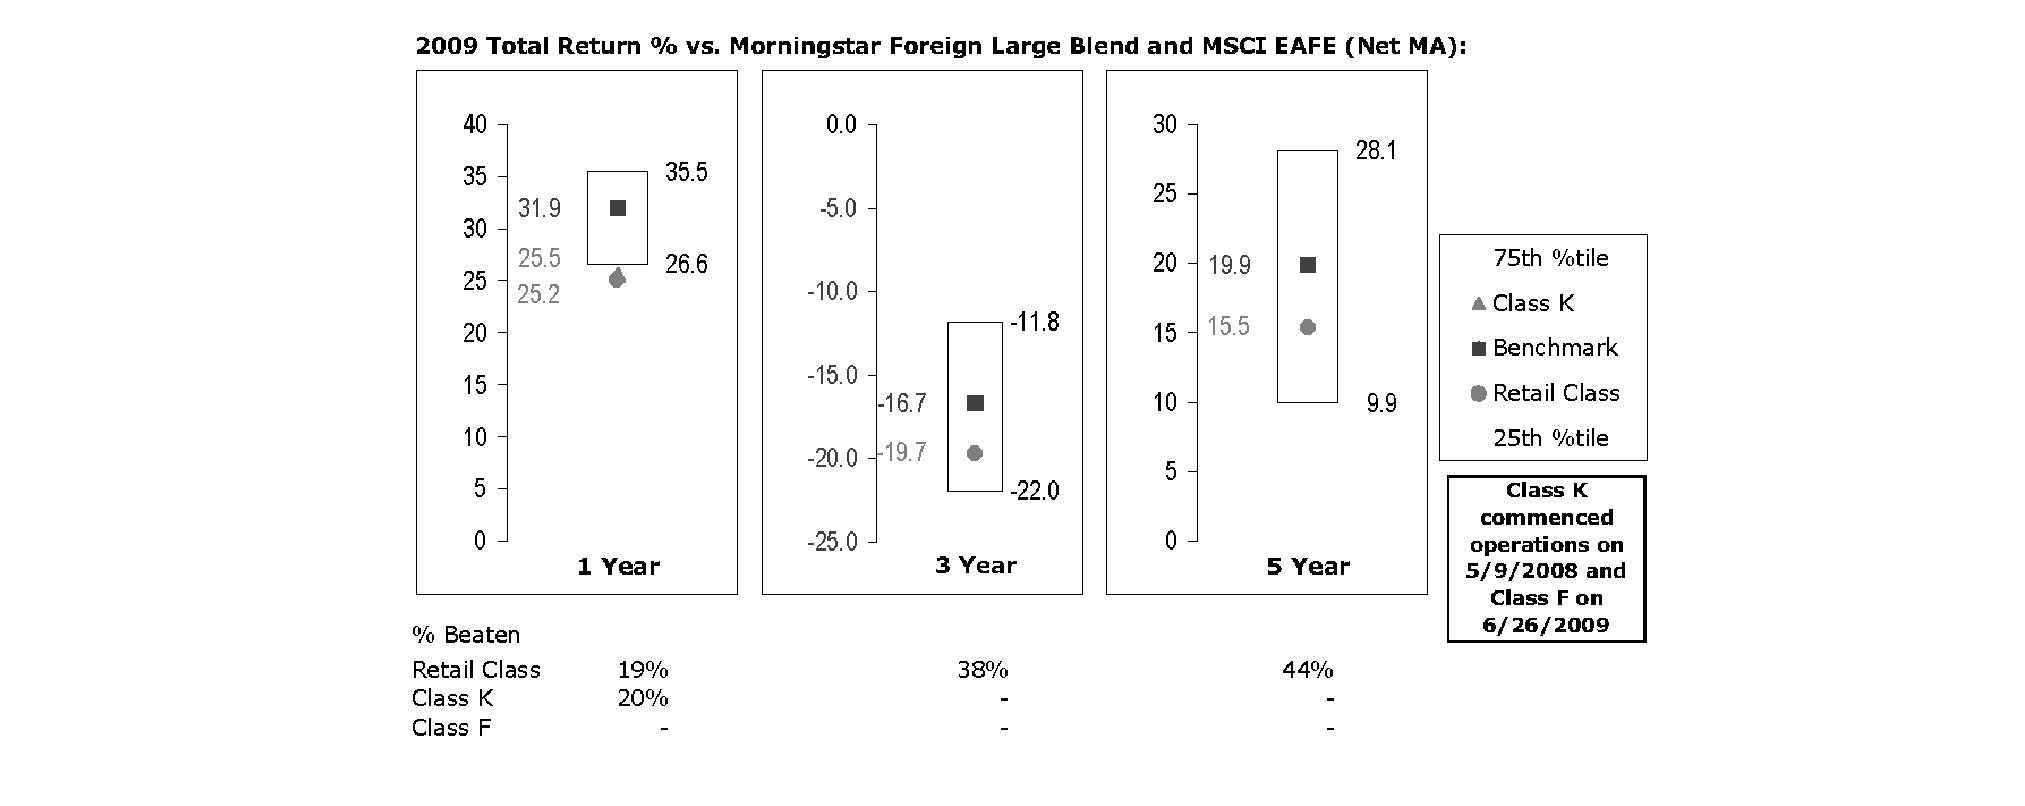
The Board reviewed the fund's relative investment performance against its peer group and noted that the performance of the retail class of the fund (the class with the longer performance record) was in the fourth quartile for the one-year period and the third quartile for the three- and five-year periods. The Board also noted that the investment performance of the fund was lower than its benchmark for all the periods shown. The Board discussed with FMR actions that have been taken by FMR to improve the fund's disappointing performance relative to its peer group and benchmark. The Board noted that this fund had underperformed in the previous year and discussed with FMR its disappointment with the continued underperformance of the fund. The Board also reviewed the fund's performance since inception as well as performance in the current year. The Board will continue to closely monitor the performance of the fund in the coming year and discuss with FMR other appropriate actions to address the performance of the fund.
The Board also considered that each fund's management fee is subject to upward or downward adjustment depending upon whether, and to what extent, the fund's investment performance for the performance period exceeds, or is exceeded by, the record (over the same period) of a Board-approved performance adjustment index. The Board realizes that the performance adjustment provides FMR with a strong economic incentive to seek to achieve superior performance for each fund's shareholders and helps to more closely align the interests of FMR and each fund's shareholders.
Based on its review, and giving particular weight to the nature and quality of the resources dedicated by the Investment Advisers to maintain and improve relative performance and factoring in the unprecedented market events in recent years, the Board concluded that the nature, extent, and quality of investment management and support services and of shareholder and administrative services provided to each fund will benefit each fund's shareholders, particularly in light of the Board's view that each fund's shareholders benefit from investing in a fund that is part of a large family of funds offering a variety of investment disciplines and services.
Investment Performance (International Capital Appreciation Fund). The Board considered whether the fund has operated in accordance with its investment objective, as well as its record of compliance with its investment restrictions. It also reviewed the fund's absolute investment performance, as well as the fund's relative investment performance measured over multiple periods against (i) a broad-based securities market index, and (ii) a custom peer group of mutual funds deemed appropriate by Fidelity and reviewed by the Board. The following charts considered by the Board show, over the one-, three-, and five-year periods ended December 31, 2009, the fund's cumulative total returns, the cumulative total returns of a broad-based securities market index ("benchmark"), and a range of cumulative total returns of a custom peer group of mutual funds defined by FMR based on categories assigned by Morningstar, Inc. The fund's custom peer group, defined by FMR, is a peer group that FMR believes provides a more meaningful performance comparison than the peer group assigned by Morningstar, Inc., which assigns mutual funds to categories based on their investment styles as measured by their underlying portfolio holdings. The box within each chart shows the 25th percentile return (bottom of box) and the 75th percentile return (top of box) of the peer group. Returns shown above the box are in the first quartile and returns shown below the box are in the fourth quartile. The percentage beaten number noted below each chart corresponds to the percentile box and represents the percentage of funds in the peer group whose performance was equal to or lower than that of the fund.
Annual Report
Board Approval of Investment Advisory Contracts and Management Fees - continued
Fidelity International Capital Appreciation Fund
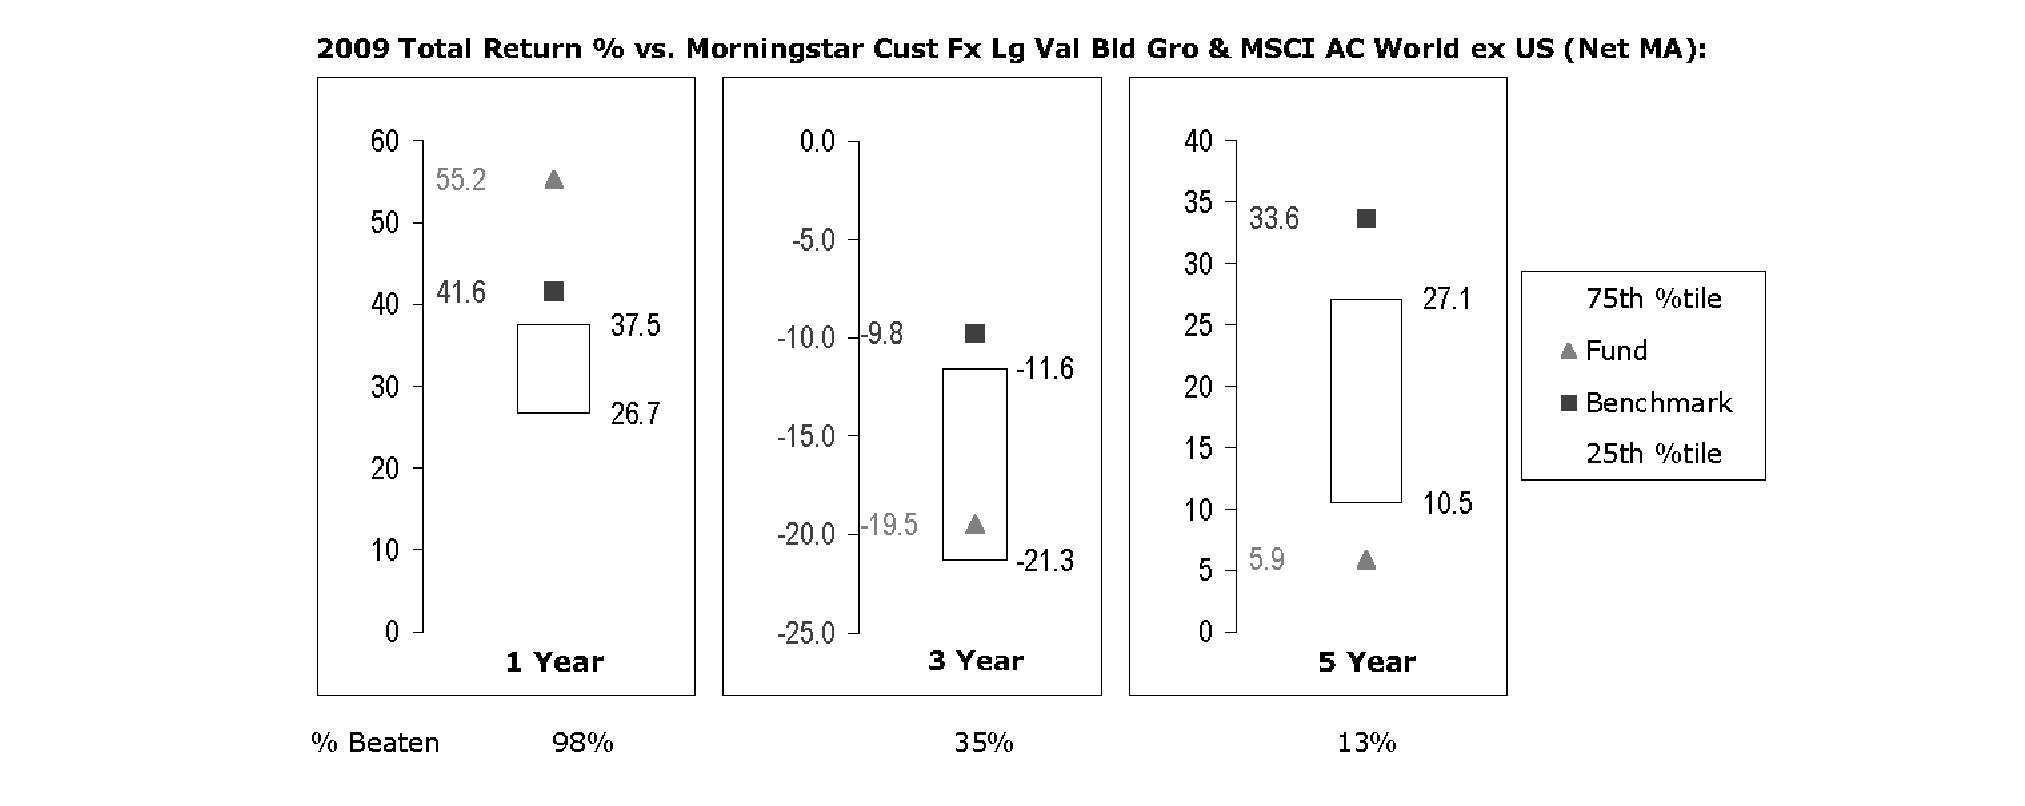
The Board reviewed the fund's relative investment performance against its peer group and noted that the performance of the fund was in the first quartile for the one-year period, the third quartile for the three-year period, and the fourth quartile for the five-year period. The Board also noted that the investment performance of the fund was lower than its benchmark for the three- and five-year periods, although the fund's one-year cumulative total return compared favorably to its benchmark. The Board also reviewed the fund's performance since inception as well as performance in the current year.
The Board also considered that the fund's management fee is subject to upward or downward adjustment depending upon whether, and to what extent, the fund's investment performance for the performance period exceeds, or is exceeded by, the record (over the same period) of a Board-approved performance adjustment index. The Board realizes that the performance adjustment provides FMR with a strong economic incentive to seek to achieve superior performance for the fund's shareholders and helps to more closely align the interests of FMR and the fund's shareholders.
Based on its review, and giving particular weight to the nature and quality of the resources dedicated by the Investment Advisers to maintain and improve relative performance and factoring in the unprecedented market events in recent years, the Board concluded that the nature, extent, and quality of investment management and support services and of shareholder and administrative services provided to the fund will benefit the fund's shareholders, particularly in light of the Board's view that the fund's shareholders benefit from investing in a fund that is part of a large family of funds offering a variety of investment disciplines and services.
Investment Performance (Worldwide Fund). The Board considered whether the fund has operated in accordance with its investment objective, as well as its record of compliance with its investment restrictions. It reviewed the fund's absolute investment performance for the retail class, as well as the fund's relative investment performance for the retail class measured over multiple periods against (i) a broad-based securities market index, and (ii) a peer group of mutual funds deemed appropriate by Fidelity and reviewed by the Board. The following charts considered by the Board show, over the one-, three-, and five-year periods ended December 31, 2009, the cumulative total returns of the retail class of the fund, the cumulative total returns of a broad-based securities market index ("benchmark"), and a range of cumulative total returns of a peer group of mutual funds identified by Morningstar, Inc. as having an investment style similar to that of the fund based on underlying portfolio holdings. (The Advisor classes of the fund had less than one year of performance as of December 31, 2009.) The box within each chart shows the 25th percentile return (bottom of box) and the 75th percentile return (top of box) of the peer group. Returns shown above the box are in the first quartile and returns shown below the box are in the fourth quartile. The percentage beaten number noted below each chart corresponds to the percentile box and represents the percentage of funds in the peer group whose performance was equal to or lower than that of the retail class of the fund.
Annual Report
Fidelity Worldwide Fund

The Board reviewed the fund's relative investment performance against its peer group and noted that the performance of the retail class of the fund was in the third quartile for the one-year period and the second quartile for the three- and five-year periods. The Board also noted that the investment performance of the retail class of the fund compared favorably to its benchmark for the three- and five-year periods, although the fund's one-year cumulative total return was below its benchmark. The Board also reviewed the fund's performance since inception as well as performance in the current year.
The Board also considered that the fund's management fee is subject to upward or downward adjustment depending upon whether, and to what extent, the fund's investment performance for the performance period exceeds, or is exceeded by, the record (over the same period) of a Board-approved performance adjustment index. The Board realizes that the performance adjustment provides FMR with a strong economic incentive to seek to achieve superior performance for the fund's shareholders and helps to more closely align the interests of FMR and the fund's shareholders.
Based on its review, and giving particular weight to the nature and quality of the resources dedicated by the Investment Advisers to maintain and improve relative performance and factoring in the unprecedented market events in recent years, the Board concluded that the nature, extent, and quality of investment management and support services and of shareholder and administrative services provided to the fund will benefit the fund's shareholders, particularly in light of the Board's view that the fund's shareholders benefit from investing in a fund that is part of a large family of funds offering a variety of investment disciplines and services.
Competitiveness of Management Fee and Total Fund Expenses. The Board considered each fund's management fee and total expenses compared to "mapped groups" of competitive funds and classes. Fidelity creates "mapped groups" by combining similar Lipper investment objective categories that have comparable management fee characteristics. Combining Lipper investment objective categories aids the Board's management fee and total expense comparisons by broadening the competitive group used for comparison and by reducing the number of universes to which various Fidelity funds are compared.
Management Fee. The Board considered two proprietary management fee comparisons for the 12-month periods shown in the charts below. The group of Lipper funds used by the Board for management fee comparisons is referred to below as the "Total Mapped Group." The Total Mapped Group comparison focuses on a fund's standing relative to the total universe of comparable funds available to investors, in terms of gross management fees before expense reimbursements or caps, and without giving effect to a fund's performance adjustment (if applicable). "TMG %" represents the percentage of funds in the Total Mapped Group that had management fees that were lower than a fund's. For example, a TMG % of 15% means that 85% of the funds in the Total Mapped Group had higher management fees than a fund. The "Asset-Size Peer Group" (ASPG) comparison focuses on a fund's standing relative to non-Fidelity funds similar in size to the fund within the Total Mapped Group. The ASPG represents at least 15% of the funds in the Total Mapped Group with comparable asset size and management fee characteristics, subject to a minimum of 50 funds (or all funds in the Total Mapped Group if fewer than 50). Additional information, such as the ASPG quartile in which a fund's management fee ranked and the impact of a fund's performance adjustment, is also included in the charts and considered by the Board.
Annual Report
Board Approval of Investment Advisory Contracts and Management Fees - continued
Fidelity Diversified International Fund
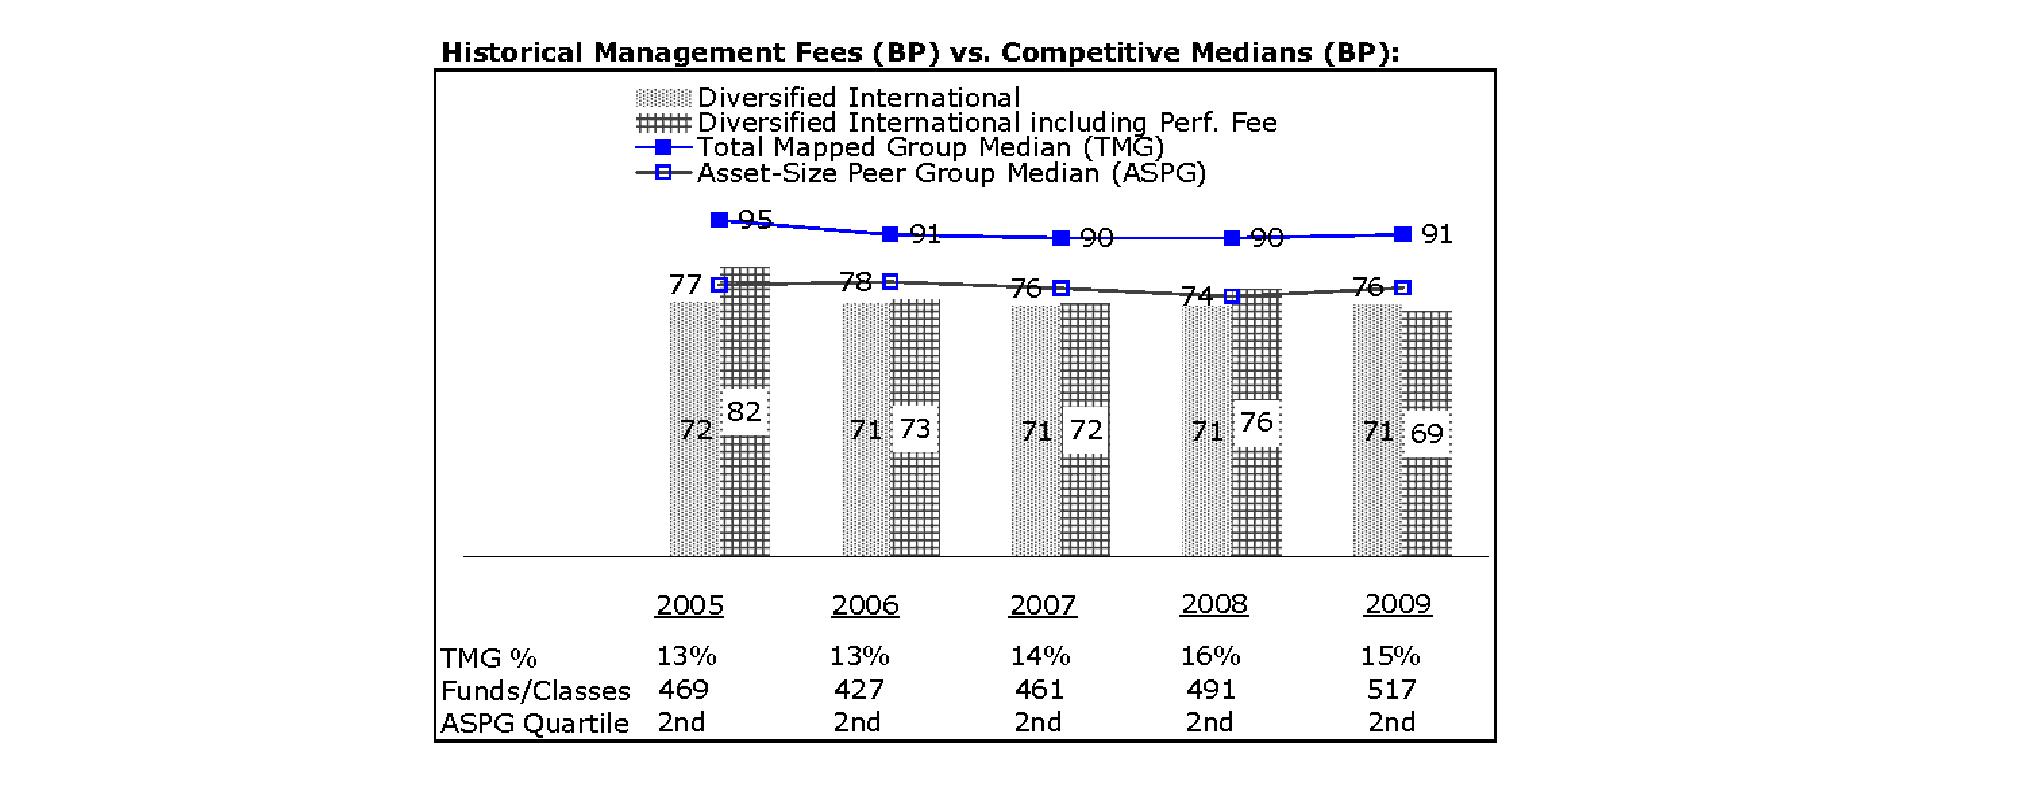
The Board noted that the fund's management fee ranked below the median of its Total Mapped Group and below the median of its ASPG for 2009. The Board also noted the effect of the fund's negative performance adjustment on the fund's management fee ranking. The Board noted that the performance adjustment for each year represents calculations for performance periods that differ from the periods shown in the performance charts above.
Fidelity International Capital Appreciation Fund
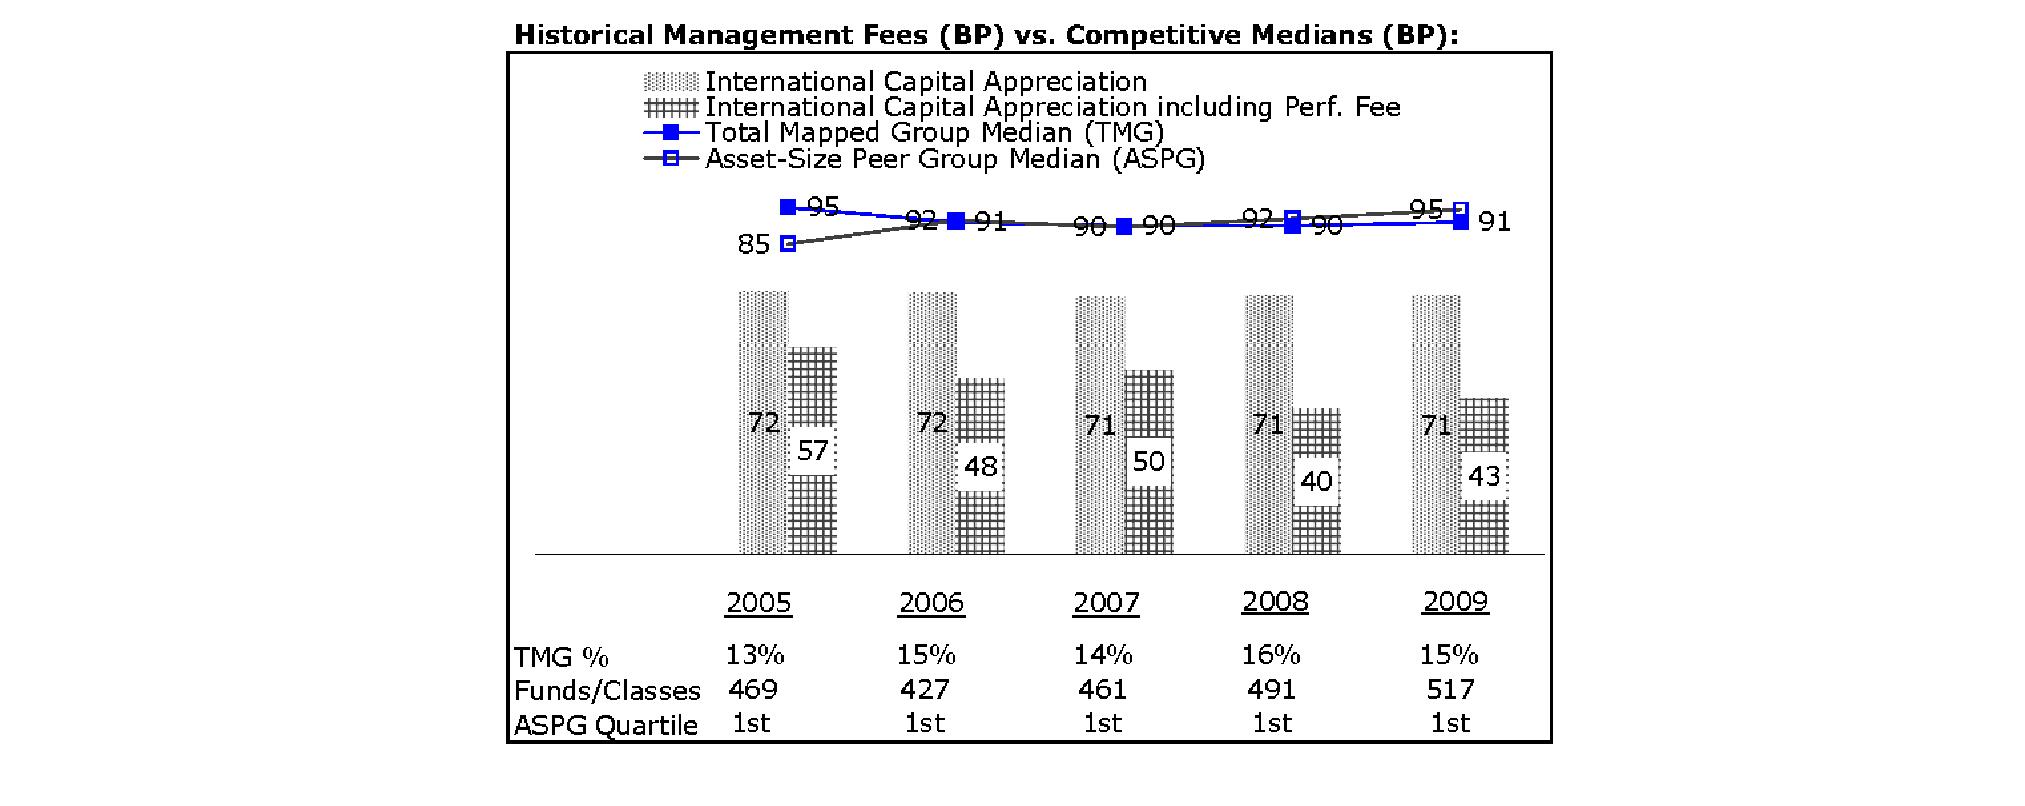
The Board noted that the fund's management fee ranked below the median of its Total Mapped Group and below the median of its ASPG for 2009. The Board also noted the effect of the fund's negative performance adjustment on the fund's management fee ranking. The Board noted that the performance adjustment for each year represents calculations for performance periods that differ from the periods shown in the performance charts above.
Annual Report
Fidelity Overseas Fund

The Board noted that the fund's management fee ranked below the median of its Total Mapped Group and below the median of its ASPG for 2009. The Board also noted the effect of the fund's negative performance adjustment on the fund's management fee ranking. The Board noted that the performance adjustment for each year represents calculations for performance periods that differ from the periods shown in the performance charts above.
Fidelity Worldwide Fund

The Board noted that the fund's management fee ranked below the median of its Total Mapped Group and below the median of its ASPG for 2009. The Board also noted the effect of the fund's positive performance adjustment on the fund's management fee ranking. The Board noted that the performance adjustment for each year represents calculations for performance periods that differ from the periods shown in the performance charts above.
Based on its review, the Board concluded that each fund's management fee is fair and reasonable in light of the services that the fund receives and the other factors considered.
Total Expenses. In its review of International Capital Appreciation Fund's total expenses, the Board considered the fund's management fee as well as other fund expenses, such as transfer agent fees, pricing and bookkeeping fees, and custodial, legal, and audit fees. The Board also noted the effects of any waivers and reimbursements on fees and expenses, as well as the impact of the fund's performance adjustment. As part of its review, the Board also considered current and historical total expenses of the fund compared to competitive fund median expenses. The fund is compared to those funds and classes in the Total Mapped Group (used by the Board for management fee comparisons) that have a similar sales load structure.
Annual Report
Board Approval of Investment Advisory Contracts and Management Fees - continued
In its review of the total expenses of each class of each of Diversified International Fund, Overseas Fund, and Worldwide Fund, the Board considered the fund's management fee as well as other fund or class expenses, as applicable, such as transfer agent fees, pricing and bookkeeping fees, fund-paid 12b-1 fees (in the case of Worldwide Fund), and custodial, legal, and audit fees. The Board also noted the effects of any waivers and reimbursements on fees and expenses, as well as the impact of each fund's performance adjustment. As part of its review, the Board also considered current and historical total expenses of each class of each fund compared to competitive fund median expenses. Each class of each fund is compared to those funds and classes in the Total Mapped Group (used by the Board for management fee comparisons) that have a similar sales load structure.
The Board noted that the total expenses of each class of Diversified International Fund and Overseas Fund ranked below its competitive median for 2009.
The Board noted that the total expenses of International Capital Appreciation ranked below its competitive median for 2009.
The Board noted that the total expenses of each of Class B, Class C, and the retail class of Worldwide Fund ranked below its competitive median for 2009, the total expenses of Class A ranked equal to its competitive median for 2009, and the total expenses of each of Class T and Institutional Class ranked above its competitive median for 2009. The Board considered that the total expenses for Class T were above the median primarily because its 12b-1 fee is higher than the typical front-end load class. The Board noted that the fund offers multiple classes, each of which has a different sales load and 12b-1 fee structure, and that the multiple structures are intended to offer a range of pricing options for the intermediary market. The Board also noted that the total expenses of the classes vary primarily by the level of their 12b-1 fees, although differences in transfer agent fees may also cause expenses to vary from class to class.
Fees Charged to Other Fidelity Clients. The Board also considered Fidelity fee structures and other information with respect to clients of FMR and its affiliates, such as other mutual funds advised or subadvised by FMR or its affiliates, pension plan clients, and other institutional clients. In March 2010, the Board created an ad hoc joint committee with the board of other Fidelity funds (the Committee) to review and compare Fidelity's institutional investment advisory business with its business of providing services to the Fidelity funds, including the differences in services provided, fees charged, and costs incurred, as well as competition in their respective marketplaces.
Based on its review of total expenses and fees charged to other Fidelity clients, the Board concluded that the total expenses of International Capital Appreciation Fund and the total expenses of each class of Diversified International Fund, Overseas Fund, and Worldwide Fund were reasonable, although in some cases above the median of the universe presented for comparison, in light of the services that the fund and its shareholders receive and the other factors considered, including the findings of the Committee.
Costs of the Services and Profitability. The Board considered the revenues earned and the expenses incurred by Fidelity in conducting the business of developing, marketing, distributing, managing, administering and servicing each fund and its shareholders. The Board also considered the level of Fidelity's profits in respect of all the Fidelity funds.
On an annual basis, FMR presents to the Board Fidelity's profitability for each fund. Fidelity calculates the profitability for each fund, as well as aggregate profitability for groups of Fidelity funds and all Fidelity funds, using a series of detailed revenue and cost allocation methodologies which originate with the audited books and records of Fidelity. The Audit Committee of the Board reviews any significant changes from the prior year's methodologies.
PricewaterhouseCoopers LLP (PwC), independent registered public accounting firm and auditor to Fidelity and certain Fidelity funds, has been engaged annually by the Board as part of the Board's assessment of Fidelity's profitability analysis. PwC's engagement includes the review and assessment of Fidelity's methodologies used in determining the revenues and expenses attributable to Fidelity's mutual fund business, and completion of agreed-upon procedures surrounding the mathematical accuracy of fund profitability and its conformity to allocation methodologies. After considering PwC's reports issued under the engagement and information provided by Fidelity, the Board believes that while other allocation methods may also be reasonable, Fidelity's profitability methodologies are reasonable in all material respects.
The Board has also reviewed Fidelity's non-fund businesses and fall-out benefits related to the mutual fund business as well as cases where Fidelity's affiliates may benefit from or be related to the funds' business.
The Board considered the costs of the services provided by and the profits realized by Fidelity in connection with the operation of each fund and were satisfied that the profitability was not excessive in the circumstances.
Economies of Scale. The Board considered whether there have been economies of scale in respect of the management of the Fidelity funds, whether the Fidelity funds (including each fund) have appropriately benefited from any such economies of scale, and whether there is potential for realization of any further economies of scale. The Board considered the extent to which each fund will benefit from economies of scale through increased services to the fund, through waivers or reimbursements, or through fee or expense reductions.
In February 2009, the Board and the board of other Fidelity funds created an ad hoc committee (the Economies of Scale Committee) to analyze whether FMR attains economies of scale in respect of the management and servicing of the Fidelity funds, whether the Fidelity funds have appropriately benefited from such economies of scale, and whether there is potential for realization of any further economies of scale.
Annual Report
The Board recognized that each fund's management contract incorporates a "group fee" structure, which provides for lower group fee rates as total fund assets under FMR's management increase, and for higher group fee rates as total fund assets under FMR's management decrease. FMR calculates the group fee rates based on a tiered asset "breakpoint" schedule that varies based on asset class. The Board considered that the group fee is designed to deliver the benefits of economies of scale to fund shareholders when total Fidelity fund assets increase, even if assets of any particular fund are unchanged or have declined, because some portion of Fidelity's costs are attributable to services provided to all Fidelity funds, and all funds benefit if those costs can be allocated among more assets. The Board concluded that, given the group fee structure, fund shareholders will benefit from lower management fees as assets under FMR's management increase at the fund complex level, regardless of whether Fidelity achieves any such economies of scale.
The Board concluded, considering the findings of the Economies of Scale Committee, that any potential economies of scale are being appropriately shared between fund shareholders and Fidelity.
Additional Information Requested by the Board. In order to develop fully the factual basis for consideration of the Fidelity funds' Advisory Contracts, the Board requested and received additional information on certain topics, including (i) fund performance trends, actions to be taken by FMR to improve certain funds' overall performance, and Fidelity's long-term strategies for certain funds; (ii) portfolio manager changes that have occurred during the past year and length of portfolio manager tenure for different categories of funds over time; (iii) Fidelity's compensation structure for portfolio managers, research analysts, and other key personnel, the rationale for the compensation structure, and how the compensation structure provides appropriate performance incentives; (iv) the amount of the investment that each portfolio manager has made in the Fidelity fund(s) that he or she manages; (v) management and other fees paid by FMR to affiliated sub-advisers on behalf of the Fidelity funds; (vi) Fidelity's fee structures and rationale for recommending different fees among different categories of funds; (vii) Fidelity's rationale for recommending which funds should have a performance adjustment component as part of their management fees; (viii) the rationale for any differences between fund fee structures and fee structures in place for other Fidelity clients; and (ix) explanations regarding the relative total expenses borne by certain funds and classes, total expense competitive trends, and actions that might be taken by FMR to reduce total expenses for certain funds and classes.
Based on its evaluation of all of the conclusions noted above, and after considering all factors it believed relevant, the Board ultimately concluded that the advisory fee structures are fair and reasonable, and that each fund's Advisory Contracts should be renewed.
Annual Report
Investment Adviser
Fidelity Management & Research Company
Boston, MA
Investment Sub-Advisers
FMR Co., Inc.
Fidelity Management & Research
(U.K.) Inc.
Fidelity Management & Research
(Hong Kong) Limited
Fidelity Management & Research
(Japan) Inc.
Fidelity Research & Analysis Company
FIL Investments (Japan) Limited
FIL Investment Advisors
FIL Investment Advisors
(U.K.) Ltd.
General Distributor
Fidelity Distributors Corporation
Boston, MA
Transfer and Service Agents
Fidelity Investments Institutional
Operations Company, Inc.
Boston, MA
Fidelity Service Company, Inc.
Boston, MA
Custodians
JPMorgan Chase Bank
New York, NY
Fidelity Diversified International Fund, Fidelity Overseas Fund, and Fidelity Worldwide Fund
The Northern Trust Company
Chicago, IL
Fidelity International Capital Appreciation Fund
Corporate Headquarters
82 Devonshire Street
Boston, MA 02109
www.fidelity.com
The Fidelity Telephone Connection
Mutual Fund 24-Hour Service
Exchanges/Redemptions
and Account Assistance 1-800-544-6666
Product Information 1-800-544-6666
Retirement Accounts 1-800-544-4774
(8 a.m. - 9 p.m.)
TDD Service 1-800-544-0118
for the deaf and hearing impaired
(9 a.m. - 9 p.m. Eastern time)
Fidelity Automated Service
Telephone (FAST®)
1-800-544-5555
Automated line for quickest service
IBD-UANNPRO-1210
1.784774.107
Fidelity®
Diversified International
Fund -
Class F
Annual Report
October 31, 2010
(2_fidelity_logos) (Registered_Trademark)
Contents
Performance | <Click Here> | How the fund has done over time. |
Management's Discussion of Fund Performance | <Click Here> | The Portfolio Manager's review of fund performance and strategy. |
Shareholder Expense Example | <Click Here> | An example of shareholder expenses. |
Investment Changes | <Click Here> | A summary of major shifts in the fund's investments over the past six months. |
Investments | <Click Here> | A complete list of the fund's investments with their market values. |
Financial Statements | <Click Here> | Statements of assets and liabilities, operations, and changes in net assets, as well as financial highlights. |
Notes | <Click Here> | Notes to the financial statements. |
Report of Independent Registered Public Accounting Firm | <Click Here> | |
Trustees and Officers | <Click Here> | |
Distributions | <Click Here> | |
Board Approval of Investment Advisory Contracts and Management Fees | <Click Here> | |
To view a fund's proxy voting guidelines and proxy voting record for the 12-month period ended June 30, visit http://www.fidelity.com/proxyvotingresults or visit the Securities and Exchange Commission's (SEC) web site at http://www.sec.gov. You may also call 1-800-835-5092 to request a free copy of the proxy voting guidelines.
Standard & Poor's, S&P and S&P 500 are registered service marks of The McGraw-Hill Companies, Inc. and have been licensed for use by Fidelity Distributors Corporation.
Other third party marks appearing herein are the property of their respective owners.
All other marks appearing herein are registered or unregistered trademarks or service marks of FMR LLC or an affiliated company.
This report and the financial statements contained herein are submitted for the general information of the shareholders of the fund. This report is not authorized for distribution to prospective investors in the fund unless preceded or accompanied by an effective prospectus.
A fund files its complete schedule of portfolio holdings with the SEC for the first and third quarters of each fiscal year on Form N-Q. Forms N-Q are available on the SEC's web site at http://www.sec.gov. A fund's Forms N-Q may be reviewed and copied at the SEC's Public Reference Room in Washington, DC. Information regarding the operation of the SEC's Public Reference Room may be obtained by calling 1-800-SEC-0330. For a complete list of a fund's portfolio holdings, view the most recent holdings listing, semiannual report, or annual report on Fidelity's web site at http://www.fidelity.com or http://www.advisor.fidelity.com, as applicable.
NOT FDIC INSURED • MAY LOSE VALUE • NO BANK GUARANTEE
Neither the fund nor Fidelity Distributors Corporation is a bank.
Annual Report
Average annual total return reflects the change in the value of an investment, assuming reinvestment of the class' distributions from dividend income and capital gains (the profits earned upon the sale of securities that have grown in value, if any) and assuming a constant rate of performance each year. The $10,000 table and the fund's returns do not reflect the deduction of taxes that a shareholder would pay on fund distributions or the redemption of fund shares. During periods of reimbursement by Fidelity, a fund's total return will be greater than it would be had the reimbursement not occurred. How a fund did yesterday is no guarantee of how it will do tomorrow.
Average Annual Total Returns
Periods ended October 31, 2010 | Past 1
year | Past 5
years | Past 10
years |
Class F A | 11.41% | 3.41% | 5.66% |
A The initial offering of Class F shares took place on June 26, 2009. Returns prior to June 26, 2009 are those of Fidelity Diversified International Fund, the original class of the fund.
$10,000 Over 10 Years
Let's say hypothetically that $10,000 was invested in Fidelity Diversified International Fund - Class F on October 31, 2000. The chart shows how the value of your investment would have changed, and also shows how the MSCI® EAFE® (Europe, Australasia, Far East) Index performed over the same period. The initial offering of Class F took place on June 26, 2009. See above for additional information regarding the performance of Class F.
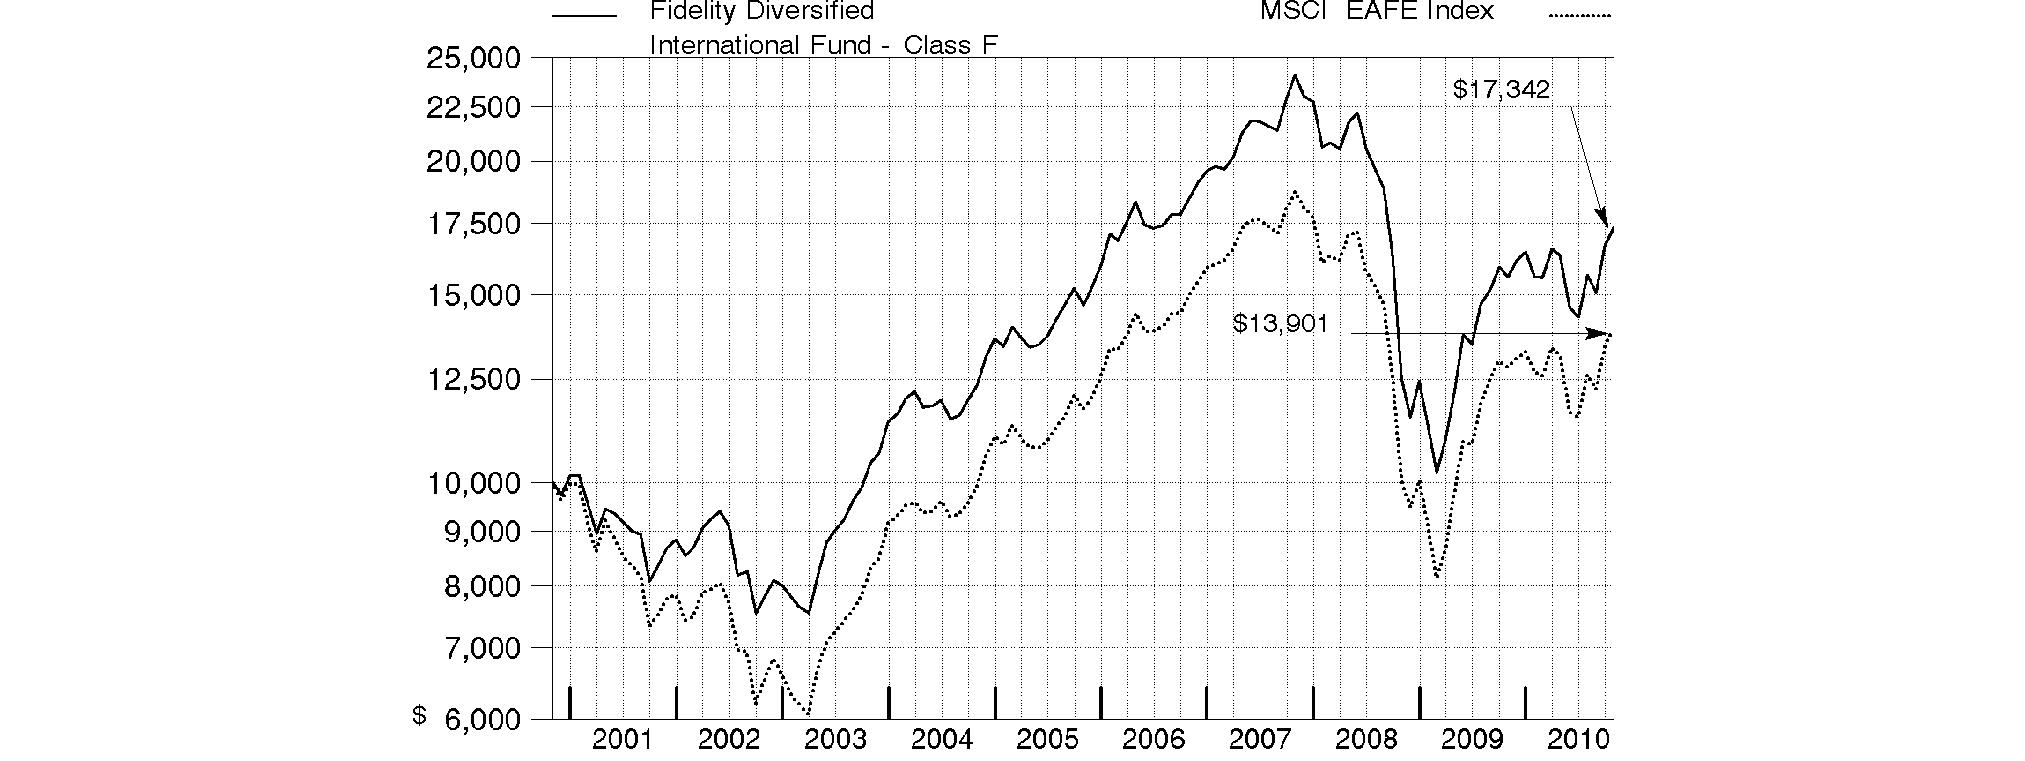
Annual Report
Market Recap: International stocks rode a wave of volatility similar to that of their U.S. counterparts during the 12 months ending October 31, 2010. Stocks gained modestly in the first half of the period, despite growing concerns about the European debt crisis. Sentiment turned decidedly negative in May and June, however, and the market suffered a precipitous decline. These losses were more than offset during the last four months of the period, when signs of economic growth and subsiding debt fears helped propel international stocks about 21%. For the full year, the MSCI® ACWI® (All Country World Index) ex USA Index gained 12.76%, boosted in part by a generally depreciating U.S. dollar. Within the index, Canada and emerging markets were standouts, returning 23% and 24%, respectively. Results in the latter group were led by strong-performing India, Mexico and South Africa, while China fell short of the MSCI benchmark due to cooling economic growth. The developed Asia ex Japan segment rose 16% for the period, lifted by solid results from Singapore and Hong Kong. Meanwhile, Europe rose just 9%, held back mainly by debt-riddled Spain and Italy, as well as lagging major constituent France. Japan returned only 5%, a result of that nation's continued weak economy.
Comments from William Bower, Portfolio Manager of Fidelity® Diversified International Fund: For the year, the fund's Class F shares gained 11.41%, solidly outperforming the 8.49% return of the MSCI EAFE® (Europe, Australasia, Far East) Index. The fund was helped most by strong security selection in the consumer discretionary, materials, technology, financials and health care groups. In terms of countries, my picks in Germany were particularly productive, while underweighting Japan and overweighting China also aided results. Individual contributors included Danish pharmaceutical company Novo Nordisk, German automakers Volkswagen - since sold - and BMW, two out-of-benchmark positions - Chinese Internet search provider Baidu and Taiwanese smart phone manufacturer HTC - German medical equipment company Fresenius and French holding company PPR. Conversely, underweighting industrials hurt, as did overweighting energy. Geographically, unfavorable stock selection in the United Kingdom and China curtailed results. At the issuer level, detractors included out-of-index energy company Transocean, Spanish telecommunications company Telefonica, an out-of-benchmark investment in Canadian energy firm Petrobank Energy & Resources, not owning French luxury goods and index component Richemont and a since-sold position in Swiss pharmaceutical firm Actelion.
The views expressed above reflect those of the portfolio manager(s) only through the end of the period as stated on the cover of this report and do not necessarily represent the views of Fidelity or any other person in the Fidelity organization. Any such views are subject to change at any time based upon market or other conditions and Fidelity disclaims any responsibility to update such views. These views may not be relied on as investment advice and, because investment decisions for a Fidelity fund are based on numerous factors, may not be relied on as an indication of trading intent on behalf of any Fidelity fund.
Annual Report
Fidelity Diversified International Fund
As a shareholder of the Fund, you incur two types of costs: (1) transaction costs, including redemption fees, and (2) ongoing costs, including management fees and other Fund expenses. This Example is intended to help you understand your ongoing costs (in dollars) of investing in the Fund and to compare these costs with the ongoing costs of investing in other mutual funds.
The Example is based on an investment of $1,000 invested at the beginning of the period and held for the entire period (May 1, 2010 to October 31, 2010).
Actual Expenses
The first line of the accompanying table for each class of the Fund provides information about actual account values and actual expenses. You may use the information in this line, together with the amount you invested, to estimate the expenses that you paid over the period. Simply divide your account value by $1,000.00 (for example, an $8,600 account value divided by $1,000.00 = 8.6), then multiply the result by the number in the first line for a class of the Fund under the heading entitled "Expenses Paid During Period" to estimate the expenses you paid on your account during this period. A small balance maintenance fee of $12.00 that is charged once a year may apply for certain accounts with a value of less than $2,000. This fee is not included in the table below. If it was, the estimate of expenses you paid during the period would be higher, and your ending account value lower, by this amount. In addition, the Fund, as a shareholder in the underlying Fidelity Central Funds, will indirectly bear its pro-rata share of the fees and expenses incurred by the underlying Fidelity Central Funds. These fees and expenses are not included in the Fund's annualized expense ratio used to calculate the expense estimate in the table below.
Hypothetical Example for Comparison Purposes
The second line of the accompanying table for each class of the Fund provides information about hypothetical account values and hypothetical expenses based on a Class' actual expense ratio and an assumed rate of return of 5% per year before expenses, which is not the Class' actual return. The hypothetical account values and expenses may not be used to estimate the actual ending account balance or expenses you paid for the period. You may use this information to compare the ongoing costs of investing in the Fund and other funds. To do so, compare this 5% hypothetical example with the 5% hypothetical examples that appear in the shareholder reports of the other funds. A small balance maintenance fee of $12.00 that is charged once a year may apply for certain accounts with a value of less than $2,000. This fee is not included in the table below. If it was, the estimate of expenses you paid during the period would be higher, and your ending account value lower, by this amount. In addition, the Fund, as a shareholder in the underlying Fidelity Central Funds, will indirectly bear its pro-rata share of the fees and expenses incurred by the underlying Fidelity Central Funds. These fees and expenses are not included in the Fund's annualized expense ratio used to calculate the expense estimate in the table below.
Please note that the expenses shown in the table are meant to highlight your ongoing costs only and do not reflect any transaction costs. Therefore, the second line of the table is useful in comparing ongoing costs only, and will not help you determine the relative total costs of owning different funds. In addition, if these transactional costs were included, your costs would have been higher.
| Annualized
Expense Ratio | Beginning
Account Value
May 1, 2010 | Ending
Account Value
October 31, 2010 | Expenses Paid
During Period*
May 1, 2010
to October 31, 2010 |
Diversified International | .96% | | | |
Actual | | $ 1,000.00 | $ 1,062.30 | $ 4.99 |
HypotheticalA | | $ 1,000.00 | $ 1,020.37 | $ 4.89 |
Class K | .78% | | | |
Actual | | $ 1,000.00 | $ 1,063.00 | $ 4.06 |
HypotheticalA | | $ 1,000.00 | $ 1,021.27 | $ 3.97 |
Class F | .73% | | | |
Actual | | $ 1,000.00 | $ 1,063.80 | $ 3.80 |
HypotheticalA | | $ 1,000.00 | $ 1,021.53 | $ 3.72 |
A 5% return per year before expenses
* Expenses are equal to each Class' annualized expense ratio, multiplied by the average account value over the period, multiplied by 184/365 (to reflect the one-half year period).
Annual Report
Fidelity Diversified International Fund
Investment Changes (Unaudited)
Geographic Diversification (% of fund's net assets) |
As of October 31, 2010 |
 | United Kingdom | 18.4% | |
 | Japan | 11.8% | |
 | United States of America | 10.4% | |
 | Germany | 8.1% | |
 | Switzerland | 7.7% | |
 | France | 7.0% | |
 | Canada | 4.3% | |
 | Spain | 3.9% | |
 | Netherlands | 3.2% | |
 | Other | 25.2% | |

Percentages are adjusted for the effect of futures contracts, if applicable. |
As of April 30, 2010 |
| United Kingdom | 17.1% | |
| Japan | 15.1% | |
| United States of America | 10.7% | |
| France | 9.5% | |
| Switzerland | 8.0% | |
| Germany | 7.6% | |
| Spain | 4.2% | |
| Canada | 4.0% | |
| Australia | 2.8% | |
| Other | 21.0% | |

Percentages are adjusted for the effect of futures contracts, if applicable. |
Asset Allocation |
| % of fund's
net assets | % of fund's net assets
6 months ago |
Stocks | 95.9 | 96.9 |
Short-Term Investments and Net Other Assets | 4.1 | 3.1 |
Top Ten Stocks as of October 31, 2010 |
| % of fund's
net assets | % of fund's net assets
6 months ago |
Nestle SA (Switzerland, Food Products) | 2.3 | 1.9 |
BP PLC (United Kingdom, Oil, Gas & Consumable Fuels) | 2.1 | 0.9 |
Royal Dutch Shell PLC Class B ADR (United Kingdom, Oil, Gas & Consumable Fuels) | 2.0 | 1.3 |
Vodafone Group PLC (United Kingdom, Wireless Telecommunication Services) | 1.9 | 1.4 |
BHP Billiton Ltd. sponsored ADR (Australia, Metals & Mining) | 1.7 | 1.3 |
Banco Santander SA sponsored ADR (Spain, Commercial Banks) | 1.5 | 1.2 |
HSBC Holdings PLC (United Kingdom, Commercial Banks) | 1.5 | 2.0 |
Novo Nordisk AS Series B (Denmark, Pharmaceuticals) | 1.4 | 1.1 |
Anheuser-Busch InBev SA NV (Belgium, Beverages) | 1.1 | 1.0 |
Siemens AG (Germany, Industrial Conglomerates) | 1.1 | 0.7 |
| 16.6 | |
Market Sectors as of October 31, 2010 |
| % of fund's
net assets | % of fund's net assets
6 months ago |
Financials | 20.5 | 21.3 |
Consumer Discretionary | 13.8 | 10.3 |
Energy | 11.4 | 10.6 |
Materials | 10.2 | 8.8 |
Information Technology | 9.5 | 10.6 |
Consumer Staples | 9.2 | 8.9 |
Industrials | 8.2 | 9.5 |
Health Care | 7.3 | 9.4 |
Telecommunication Services | 5.4 | 5.3 |
Utilities | 0.4 | 2.2 |
Annual Report
Fidelity Diversified International Fund
Investments October 31, 2010
Showing Percentage of Net Assets
Common Stocks - 94.4% |
| Shares | | Value |
Argentina - 0.0% |
Telecom Argentina SA Class B sponsored ADR | 45,100 | | $ 1,075,184 |
Australia - 3.1% |
AMP Ltd. | 14,831,137 | | 77,586,587 |
BHP Billiton Ltd. sponsored ADR (d) | 7,059,600 | | 583,052,364 |
Centamin Egypt Ltd. (United Kingdom) (a) | 173,900 | | 482,002 |
Newcrest Mining Ltd. | 7,469,169 | | 292,394,171 |
QBE Insurance Group Ltd. | 4,150,000 | | 69,846,106 |
Westfield Group unit | 4,650,000 | | 56,395,512 |
TOTAL AUSTRALIA | | 1,079,756,742 |
Bahamas (Nassau) - 0.0% |
Petrominerales Ltd. | 19,000 | | 486,783 |
Bailiwick of Guernsey - 0.6% |
Resolution Ltd. | 50,499,100 | | 211,895,783 |
Bailiwick of Jersey - 1.7% |
Experian PLC | 16,227,900 | | 188,626,591 |
Informa PLC | 13,102,770 | | 91,527,749 |
Randgold Resources Ltd. sponsored ADR | 888,300 | | 83,429,136 |
Shire PLC | 2,291,500 | | 53,768,144 |
WPP PLC | 15,153,311 | | 176,073,094 |
TOTAL BAILIWICK OF JERSEY | | 593,424,714 |
Belgium - 1.3% |
Ageas | 25,335,700 | | 77,874,672 |
Anheuser-Busch InBev SA NV | 6,035,621 | | 378,215,859 |
Anheuser-Busch InBev SA NV (strip VVPR) (a) | 5,339,200 | | 22,288 |
Telenet Group Holding NV | 35,000 | | 1,461,023 |
TOTAL BELGIUM | | 457,573,842 |
Bermuda - 0.7% |
Central European Media Enterprises Ltd. Class A (a) | 19,000 | | 437,950 |
China Green (Holdings) Ltd. | 471,000 | | 483,077 |
GP Investments, Ltd. unit (a) | 121,051 | | 512,325 |
Huabao International Holdings Ltd. | 77,697,000 | | 117,078,015 |
Li & Fung Ltd. | 23,006,000 | | 121,541,132 |
Sihuan Pharmaceutical Holdings Group Ltd. | 1,715,000 | | 1,245,664 |
Vtech Holdings Ltd. | 93,100 | | 968,684 |
TOTAL BERMUDA | | 242,266,847 |
Brazil - 1.6% |
Banco Bradesco SA | 124,600 | | 2,006,842 |
Banco do Brasil SA | 5,700,000 | | 110,904,068 |
Banco Santander (Brasil) SA ADR | 5,000,000 | | 72,000,000 |
BM&F Bovespa SA | 11,250,000 | | 94,234,952 |
Drogasil SA | 2,204,300 | | 55,755,366 |
Estacio Participacoes SA | 2,189,965 | | 32,710,446 |
Fleury SA | 40,400 | | 522,455 |
|
| Shares | | Value |
Hypermarcas SA (a) | 29,700 | | $ 488,831 |
Itau Unibanco Banco Multiplo SA ADR | 4,088,800 | | 100,420,928 |
Mills Estruturas e Servicos de Engenharia SA (a) | 1,727,100 | | 20,842,560 |
Porto Seguro SA | 33,400 | | 490,830 |
Souza Cruz Industria Comerico | 875,000 | | 44,958,706 |
Tractebel Energia SA | 64,300 | | 978,938 |
Weg SA | 1,248,292 | | 16,120,959 |
TOTAL BRAZIL | | 552,435,881 |
British Virgin Islands - 0.0% |
HLS Systems International Ltd. (a) | 40,900 | | 516,976 |
Canada - 4.3% |
Agnico-Eagle Mines Ltd. (Canada) | 1,250,000 | | 96,945,779 |
Barrick Gold Corp. | 1,500,000 | | 72,242,377 |
Canadian Natural Resources Ltd. | 4,000,000 | | 145,622,120 |
Fairfax Financial Holdings Ltd. (sub. vtg.) | 170,000 | | 69,538,484 |
Goldcorp, Inc. | 1,475,000 | | 65,860,869 |
InterOil Corp. (a)(d) | 560,000 | | 39,860,800 |
Ivanhoe Mines Ltd. (a) | 1,958,400 | | 46,890,997 |
Loblaw Companies Ltd. (d) | 787,000 | | 33,628,258 |
Niko Resources Ltd. | 2,242,600 | | 213,947,426 |
Open Text Corp. (a) | 1,445,400 | | 63,943,963 |
OZ Optics Ltd. unit (a)(g) | 102,000 | | 451,860 |
Painted Pony Petroleum Ltd. (a)(e)(f) | 1,386,600 | | 9,544,006 |
Painted Pony Petroleum Ltd. Class A (a)(e) | 3,125,000 | | 21,509,462 |
Petrobank Energy & Resources Ltd. (a)(e) | 5,625,000 | | 223,863,859 |
Silver Wheaton Corp. (a) | 2,126,900 | | 61,143,944 |
Suncor Energy, Inc. | 3,100,000 | | 99,331,307 |
Talisman Energy, Inc. | 8,454,900 | | 153,280,813 |
Uranium One, Inc. (a) | 20,200,000 | | 82,590,450 |
TOTAL CANADA | | 1,500,196,774 |
Cayman Islands - 0.6% |
A8 Digital Music Holdings Ltd. | 1,206,000 | | 486,990 |
BaWang International (Group) Holding Ltd. | 15,728,000 | | 6,614,840 |
Belle International Holdings Ltd. | 9,507,000 | | 17,171,166 |
China Lodging Group Ltd. ADR | 19,300 | | 469,183 |
Consolidated Water Co., Inc. | 100,800 | | 1,031,184 |
Fook Woo Group Holdings Ltd. | 1,396,000 | | 493,474 |
Hengan International Group Co. Ltd. | 7,325,500 | | 68,990,357 |
Hengdeli Holdings Ltd. | 74,000,000 | | 41,051,443 |
Hua Han Bio-Pharmaceutical Holdings Ltd. | 1,504,000 | | 506,427 |
Lijun International Pharmaceutical Holding Ltd. | 69,995,000 | | 24,020,216 |
Microport Scientific Corp. | 1,375,000 | | 1,401,387 |
Silver Base Group Holdings Ltd. | 25,672,000 | | 18,745,818 |
Want Want China Holdings Ltd. | 36,665,000 | | 33,820,964 |
Wasion Group Holdings Ltd. | 686,000 | | 499,150 |
TOTAL CAYMAN ISLANDS | | 215,302,599 |
Common Stocks - continued |
| Shares | | Value |
China - 1.5% |
Agricultural Bank of China (H Shares) | 169,770,000 | | $ 89,580,300 |
Baidu.com, Inc. sponsored ADR (a) | 1,065,700 | | 117,237,657 |
China Merchants Bank Co. Ltd. (H Shares) | 75,991,000 | | 215,681,600 |
China Resources Land Ltd. | 458,000 | | 902,853 |
Minth Group Ltd. | 4,366,000 | | 8,167,328 |
NetEase.com, Inc. sponsored ADR (a) | 1,279,400 | | 53,478,920 |
Tingyi (Cayman Islands) Holding Corp. | 7,700,000 | | 20,960,490 |
Xinhua Winshare Publishing and Media Co. Ltd. | 911,000 | | 541,811 |
TOTAL CHINA | | 506,550,959 |
Colombia - 0.0% |
BanColombia SA sponsored ADR | 7,400 | | 499,130 |
Denmark - 2.4% |
Carlsberg AS Series B | 1,980,450 | | 216,555,709 |
Novo Nordisk AS Series B | 4,627,712 | | 485,827,751 |
Pandora A/S | 1,108,600 | | 53,784,404 |
William Demant Holding AS (a) | 1,250,000 | | 93,695,770 |
TOTAL DENMARK | | 849,863,634 |
Egypt - 0.0% |
Commercial International Bank Ltd. | 64,500 | | 485,865 |
Finland - 0.2% |
Nokia Corp. | 67,000 | | 719,358 |
Nokia Corp. sponsored ADR (d) | 8,000,000 | | 85,440,000 |
TOTAL FINLAND | | 86,159,358 |
France - 7.0% |
Accor SA | 425,000 | | 17,424,607 |
Alstom SA | 699,330 | | 35,283,980 |
Atos Origin SA (a) | 1,499,892 | | 69,341,397 |
AXA SA sponsored ADR | 9,441,700 | | 172,122,191 |
BNP Paribas SA | 3,958,600 | | 289,455,595 |
Cap Gemini SA | 2,023,500 | | 103,205,785 |
Carrefour SA | 49,000 | | 2,644,061 |
Casino Guichard Perrachon et Compagnie | 16,017 | | 1,504,363 |
Danone | 36,500 | | 2,309,581 |
Dassault Aviation SA | 36,265 | | 30,024,256 |
Essilor International SA | 1,868,672 | | 124,755,853 |
Euler Hermes SA (a) | 440,000 | | 41,417,901 |
Iliad Group SA (d) | 725,000 | | 81,612,022 |
Lafarge SA (Bearer) | 17,200 | | 982,687 |
LVMH Moet Hennessy - Louis Vuitton | 1,943,198 | | 304,454,959 |
Pernod-Ricard SA | 805,100 | | 71,371,535 |
PPR SA | 1,535,200 | | 251,638,947 |
Sanofi-Aventis | 2,590,429 | | 181,443,991 |
Schneider Electric SA | 767,042 | | 108,864,661 |
SEB SA | 5,400 | | 517,477 |
Societe Generale Series A | 4,207,250 | | 251,876,010 |
|
| Shares | | Value |
Technip SA | 1,401,500 | | $ 117,767,577 |
Vallourec SA (d) | 1,633,946 | | 169,538,935 |
TOTAL FRANCE | | 2,429,558,371 |
Germany - 6.6% |
adidas AG | 18,300 | | 1,193,476 |
BASF AG | 1,967,023 | | 143,091,101 |
Bayerische Motoren Werke AG (BMW) | 5,114,261 | | 366,557,445 |
Daimler AG (Germany) (a) | 3,665,693 | | 241,922,812 |
Deutsche Boerse AG | 1,721,100 | | 121,082,332 |
ElringKlinger AG | 310,500 | | 10,345,323 |
Fresenius Medical Care AG & Co. KGaA | 2,706,700 | | 172,380,701 |
Fresenius SE | 2,317,000 | | 204,433,185 |
GFK AG | 1,600,000 | | 67,546,549 |
HeidelbergCement AG | 1,700,000 | | 88,906,002 |
Kabel Deutschland Holding AG | 44,300 | | 1,994,402 |
Linde AG | 1,520,355 | | 218,848,266 |
Metro AG | 1,000,000 | | 70,073,422 |
Munich Re Group | 602,751 | | 94,227,707 |
Rheinmetall AG | 553,250 | | 39,845,869 |
SAP AG | 1,153,350 | | 60,132,938 |
Siemens AG | 25,416 | | 2,902,767 |
Siemens AG sponsored ADR | 3,300,000 | | 377,223,000 |
Symrise AG | 90,000 | | 2,733,156 |
TOTAL GERMANY | | 2,285,440,453 |
Greece - 0.0% |
Coca-Cola Hellenic Bottling Co. SA sponsored ADR | 39,200 | | 997,248 |
Hong Kong - 0.8% |
AIA Group Ltd. | 18,365,200 | | 54,612,851 |
China Insurance International Holdings Co. Ltd. (a) | 281,000 | | 1,033,188 |
China Mobile (Hong Kong) Ltd. | 145,000 | | 1,480,786 |
China Travel International Investment HK Ltd. (a) | 4,062,000 | | 969,482 |
Henderson Land Development Co. Ltd. | 11,788,155 | | 83,720,424 |
Henderson Land Development Co. Ltd. warrants 6/1/11 (a) | 2,171,600 | | 840,484 |
Hopewell Holdings Ltd. | 309,500 | | 974,269 |
Swire Pacific Ltd. (A Shares) | 4,577,000 | | 64,953,395 |
Wharf Holdings Ltd. | 10,294,000 | | 67,597,433 |
TOTAL HONG KONG | | 276,182,312 |
India - 1.0% |
Adani Enterprises Ltd. | 31,720 | | 504,121 |
Bajaj Holdings & Investment Ltd. | 51,421 | | 1,014,557 |
CESC Ltd. GDR | 113,611 | | 951,692 |
Cipla Ltd. | 131,491 | | 1,047,033 |
DB Corp. Ltd. | 83,211 | | 517,100 |
Grasim Industries Ltd. | 3,416 | | 179,604 |
HDFC Bank Ltd. | 1,971,144 | | 101,606,011 |
Housing Development Finance Corp. Ltd. | 4,336,280 | | 67,277,153 |
Common Stocks - continued |
| Shares | | Value |
India - continued |
Infrastructure Development Finance Co. Ltd. | 11,302,606 | | $ 51,011,537 |
Jyothy Laboratories Ltd. | 78,521 | | 488,929 |
KPIT Cummins Infosystems Ltd. | 128,981 | | 457,144 |
Larsen & Toubro Ltd. | 844,293 | | 38,625,096 |
Motherson Sumi Systems Ltd. | 116,901 | | 483,428 |
Oracle Finance Services Software Ltd. (a) | 9,100 | | 453,758 |
Reliance Industries Ltd. | 61,982 | | 1,532,945 |
Rural Electrification Corp. Ltd. | 117,280 | | 980,707 |
Shriram Transport Finance Co. Ltd. | 1,091,429 | | 21,703,001 |
State Bank of India | 1,012,201 | | 71,946,768 |
TOTAL INDIA | | 360,780,584 |
Indonesia - 0.1% |
PT Bank Rakyat Indonesia Tbk | 827,500 | | 1,055,495 |
PT Perusahaan Gas Negara Tbk Series B | 80,497,000 | | 36,476,926 |
PT Semen Gresik (Persero) Tbk | 907,500 | | 995,076 |
TOTAL INDONESIA | | 38,527,497 |
Ireland - 0.4% |
CRH PLC | 4,883,800 | | 84,338,043 |
Ingersoll-Rand Co. Ltd. | 1,186,300 | | 46,633,453 |
TOTAL IRELAND | | 130,971,496 |
Italy - 2.2% |
Fiat SpA | 13,462,200 | | 227,780,856 |
Impregilo SpA (a) | 151,300 | | 484,211 |
Intesa Sanpaolo SpA | 30,390,000 | | 106,878,284 |
Intesa Sanpaolo SpA (Risparmio Shares) | 18,000,000 | | 49,315,771 |
Mediaset SpA | 12,409,400 | | 91,515,417 |
Saipem SpA | 6,774,150 | | 300,968,702 |
TOTAL ITALY | | 776,943,241 |
Japan - 11.8% |
Canon, Inc. sponsored ADR (d) | 4,439,100 | | 204,198,600 |
Denso Corp. | 5,225,000 | | 162,487,556 |
eAccess Ltd. | 42,870 | | 31,272,138 |
Fanuc Ltd. | 710,500 | | 102,858,849 |
Fast Retailing Co. Ltd. | 752,400 | | 98,557,803 |
Honda Motor Co. Ltd. | 4,770,000 | | 171,952,704 |
Hoya Corp. | 2,000,000 | | 46,775,194 |
Itochu Corp. | 8,481,700 | | 74,336,019 |
Japan Tobacco, Inc. | 61,388 | | 190,713,128 |
JSR Corp. | 4,543,500 | | 78,651,613 |
Keyence Corp. | 731,100 | | 181,253,194 |
Komatsu Ltd. | 4,298,900 | | 105,071,267 |
Mazda Motor Corp. | 32,330,000 | | 82,165,026 |
Mitsubishi Corp. | 5,819,600 | | 139,784,919 |
Mitsubishi UFJ Financial Group, Inc. | 47,105,400 | | 218,616,347 |
Mitsui & Co. Ltd. | 13,129,900 | | 206,499,314 |
Murata Manufacturing Co. Ltd. | 641,400 | | 36,067,291 |
|
| Shares | | Value |
Nintendo Co. Ltd. | 473,100 | | $ 122,581,517 |
Nippon Electric Glass Co. Ltd. | 409,000 | | 5,257,211 |
Nitori Holdings Co. Ltd. | 441,400 | | 38,835,739 |
NSK Ltd. | 11,469,000 | | 86,710,755 |
NTT DoCoMo, Inc. | 46,000 | | 77,541,081 |
ORIX Corp. | 4,020,290 | | 366,707,190 |
Rakuten, Inc. | 196,702 | | 151,553,667 |
Ricoh Co. Ltd. | 5,500,000 | | 76,937,398 |
ROHM Co. Ltd. | 1,346,800 | | 84,018,091 |
SOFTBANK CORP. | 10,973,000 | | 352,398,190 |
Sony Financial Holdings, Inc. | 16,100 | | 56,020,875 |
Sumitomo Corp. | 2,944,600 | | 37,281,016 |
Sumitomo Mitsui Financial Group, Inc. | 5,251,900 | | 156,757,373 |
Tokai Carbon Co. Ltd. | 5,950,000 | | 35,083,044 |
Tokyo Electron Ltd. | 2,698,100 | | 152,235,861 |
Toyota Motor Corp. sponsored ADR (d) | 1,162,100 | | 82,299,922 |
Yahoo! Japan Corp. | 299,774 | | 104,640,393 |
TOTAL JAPAN | | 4,118,120,285 |
Korea (South) - 1.9% |
Amorepacific Corp. | 106,907 | | 98,873,512 |
Cheil Worldwide, Inc. | 84,120 | | 916,380 |
Grand Korea Leisure Co. Ltd. | 51,900 | | 1,056,923 |
Hynix Semiconductor, Inc. (a) | 48,350 | | 995,378 |
Hyundai Mipo Dockyard Co. Ltd. | 6,050 | | 1,011,472 |
Hyundai Mobis | 4,420 | | 1,100,578 |
Korea Investment Holdings Co. Ltd. | 30,660 | | 966,560 |
KT Corp. | 37,160 | | 1,465,083 |
LG Corp. | 20,438 | | 1,463,103 |
NCsoft Corp. | 405,877 | | 89,332,631 |
NHN Corp. (a) | 744,844 | | 132,144,381 |
Samchully Co. Ltd. | 9,630 | | 1,053,348 |
Samsung Electronics Co. Ltd. | 355,464 | | 235,500,794 |
Shinhan Financial Group Co. Ltd. | 2,186,480 | | 84,678,693 |
Yuhan Corp. | 6,340 | | 899,271 |
TOTAL KOREA (SOUTH) | | 651,458,107 |
Luxembourg - 0.3% |
Millicom International Cellular SA | 9,900 | | 936,540 |
SES SA FDR (France) unit | 4,182,920 | | 107,181,268 |
TOTAL LUXEMBOURG | | 108,117,808 |
Malaysia - 0.0% |
Berjaya Sports Toto Bhd | 749,300 | | 1,004,365 |
Parkson Holdings Bhd | 517,400 | | 986,237 |
Top Glove Corp. Bhd | 269,500 | | 476,455 |
TOTAL MALAYSIA | | 2,467,057 |
Mexico - 0.2% |
Banco Compartamos SA de CV | 69,200 | | 490,208 |
Wal-Mart de Mexico SA de CV Series V | 23,500,000 | | 64,275,131 |
TOTAL MEXICO | | 64,765,339 |
Common Stocks - continued |
| Shares | | Value |
Netherlands - 3.2% |
AEGON NV (a) | 13,650,000 | | $ 86,488,759 |
Gemalto NV | 1,700,000 | | 77,398,015 |
ING Groep NV: | | | |
(Certificaten Van Aandelen) unit (a) | 219,000 | | 2,342,425 |
sponsored ADR (a) | 20,112,800 | | 216,815,984 |
Koninklijke Ahold NV | 5,271,802 | | 72,841,008 |
Koninklijke KPN NV | 9,835,116 | | 164,220,867 |
Koninklijke Philips Electronics NV | 47,250 | | 1,440,873 |
Koninklijke Philips Electronics NV unit | 6,500,600 | | 197,943,270 |
LyondellBasell Industries NV Class A (a) | 2,653,300 | | 71,267,638 |
Randstad Holdings NV (a) | 2,062,625 | | 98,155,353 |
Reed Elsevier NV | 170,500 | | 2,226,793 |
Wolters Kluwer NV (Certificaten Van Aandelen) | 4,925,000 | | 112,010,508 |
TOTAL NETHERLANDS | | 1,103,151,493 |
Netherlands Antilles - 0.4% |
Schlumberger Ltd. | 1,953,000 | | 136,495,170 |
Nigeria - 0.0% |
Guaranty Trust Bank PLC GDR (Reg. S) | 74,000 | | 537,240 |
Norway - 1.2% |
DnB NOR ASA | 12,195,600 | | 167,345,287 |
Pronova BioPharma ASA (a)(d) | 13,000,000 | | 21,743,212 |
Storebrand ASA (A Shares) (a) | 4,980,000 | | 36,215,555 |
Telenor ASA | 11,802,200 | | 190,247,604 |
TOTAL NORWAY | | 415,551,658 |
Philippines - 0.0% |
Manila Water Co., Inc. | 2,331,300 | | 1,014,034 |
Pepsi-Cola Products Philippines, Inc. | 8,284,000 | | 503,992 |
Universal Robina Corp. | 480,000 | | 486,154 |
TOTAL PHILIPPINES | | 2,004,180 |
Poland - 0.0% |
Telekomunikacja Polska SA | 154,000 | | 980,548 |
Qatar - 0.1% |
Commercial Bank of Qatar GDR (Reg. S) | 9,000,000 | | 41,239,492 |
Russia - 0.2% |
Mobile TeleSystems OJSC sponsored ADR | 45,300 | | 980,745 |
OJSC MMC Norilsk Nickel sponsored ADR | 2,000,000 | | 37,300,000 |
Sberbank (Savings Bank of the Russian Federation) GDR | 5,300 | | 1,991,165 |
Uralkali JSC GDR (Reg. S) | 725,000 | | 17,943,750 |
TOTAL RUSSIA | | 58,215,660 |
Singapore - 0.0% |
SIA Engineering Co. Ltd. | 288,000 | | 965,711 |
Straits Asia Resources Ltd. | 558,000 | | 987,267 |
TOTAL SINGAPORE | | 1,952,978 |
|
| Shares | | Value |
South Africa - 0.5% |
African Bank Investments Ltd. | 188,900 | | $ 969,167 |
African Rainbow Minerals Ltd. | 38,200 | | 974,543 |
AngloGold Ashanti Ltd. | 21,000 | | 984,902 |
AngloGold Ashanti Ltd. sponsored ADR | 1,750,000 | | 82,442,500 |
Aveng Ltd. | 165,600 | | 1,040,164 |
City Lodge Hotels Ltd. | 44,000 | | 513,487 |
Harmony Gold Mining Co. Ltd. | 90,300 | | 1,036,985 |
Illovo Sugar Ltd. | 262,700 | | 975,039 |
Impala Platinum Holdings Ltd. | 1,232,700 | | 34,842,664 |
Mr Price Group Ltd. | 124,400 | | 1,130,514 |
Naspers Ltd. Class N | 690,100 | | 36,235,656 |
Shoprite Holdings Ltd. | 728,800 | | 10,301,964 |
Standard Bank Group Ltd. | 61,700 | | 909,859 |
Sun International Ltd. | 71,000 | | 993,283 |
TOTAL SOUTH AFRICA | | 173,350,727 |
Spain - 3.9% |
Banco Bilbao Vizcaya Argentaria SA | 6,400,000 | | 84,295,123 |
Banco Santander SA sponsored ADR | 40,900,000 | | 523,929,000 |
Enagas SA | 1,662,431 | | 36,629,358 |
Gestevision Telecinco SA | 3,503,300 | | 44,681,196 |
Inditex SA (d) | 2,314,910 | | 193,297,103 |
Obrascon Huarte Lain SA | 30,400 | | 994,475 |
Prosegur Compania de Seguridad SA (Reg.) | 1,216,300 | | 72,875,633 |
Red Electrica Corporacion SA | 1,450,000 | | 72,825,363 |
Telefonica SA | 12,400,723 | | 335,014,393 |
TOTAL SPAIN | | 1,364,541,644 |
Sweden - 0.9% |
H&M Hennes & Mauritz AB (B Shares) | 5,753,543 | | 202,703,547 |
Swedbank AB (A Shares) (a) | 8,311,300 | | 115,994,481 |
TOTAL SWEDEN | | 318,698,028 |
Switzerland - 7.7% |
Adecco SA (Reg.) | 24,000 | | 1,340,986 |
Bank Sarasin & Co. Ltd. Series B (Reg.) | 32,400 | | 1,184,944 |
Clariant AG (Reg.) (a) | 5,152,500 | | 87,100,726 |
Kuehne & Nagel International AG | 1,440,840 | | 178,138,089 |
Lonza Group AG | 609,718 | | 53,362,326 |
Nestle SA | 14,605,918 | | 799,775,457 |
Novartis AG | 72,700 | | 4,211,153 |
Novartis AG sponsored ADR (d) | 3,011,300 | | 174,504,835 |
Roche Holding AG (participation certificate) | 983,512 | | 144,376,984 |
Schindler Holding AG: | | | |
(participation certificate) | 14,300 | | 1,532,636 |
(Reg.) | 1,278,570 | | 138,982,059 |
Sonova Holding AG Class B | 865,781 | | 100,268,232 |
Syngenta AG (Switzerland) | 590,110 | | 163,343,743 |
Common Stocks - continued |
| Shares | | Value |
Switzerland - continued |
Tecan Group AG | 342,635 | | $ 23,843,651 |
Transocean Ltd. (a) | 2,625,000 | | 166,320,000 |
Transocean, Inc. (a) | 22,160 | | 1,403,643 |
UBS AG (a) | 19,336,655 | | 328,382,161 |
Zurich Financial Services AG | 1,268,730 | | 310,496,324 |
TOTAL SWITZERLAND | | 2,678,567,949 |
Taiwan - 1.3% |
Advantech Co. Ltd. | 195,000 | | 532,658 |
Chroma ATE, Inc. | 417,000 | | 1,073,668 |
Delta Electronics, Inc. | 244,000 | | 1,008,528 |
Giant Manufacturing Co. Ltd. | 261,000 | | 1,027,626 |
Hon Hai Precision Industry Co. Ltd. (Foxconn) | 19,141,040 | | 72,548,952 |
HTC Corp. | 13,847,000 | | 312,637,710 |
Powertech Technology, Inc. | 324,000 | | 1,069,237 |
Synnex Technology International Corp. | 423,000 | | 1,035,213 |
Taiwan Fertilizer Co. Ltd. | 15,418,000 | | 52,644,372 |
TOTAL TAIWAN | | 443,577,964 |
Thailand - 0.0% |
Charoen Pokphand Foods PCL (For. Reg.) | 621,900 | | 483,977 |
Turkey - 0.0% |
Hurriyet Gazetecilik ve Matbaacilik AS | 394,044 | | 453,303 |
Koc Holding AS | 203,000 | | 969,497 |
TOTAL TURKEY | | 1,422,800 |
United Kingdom - 18.4% |
Anglo American PLC (United Kingdom) | 2,523,300 | | 117,561,865 |
Associated British Foods PLC | 4,920,900 | | 82,545,689 |
Barclays PLC | 34,210,000 | | 150,315,042 |
BG Group PLC | 11,074,979 | | 215,675,618 |
BHP Billiton PLC | 4,748,480 | | 168,193,866 |
BP PLC | 279,500 | | 1,899,571 |
BP PLC sponsored ADR | 17,725,000 | | 723,711,750 |
British Airways PLC (a) | 316,000 | | 1,370,498 |
British American Tobacco PLC: | | | |
(United Kingdom) | 91,200 | | 3,473,947 |
sponsored ADR | 2,163,700 | | 164,938,851 |
Britvic PLC | 4,600,700 | | 35,557,760 |
Burberry Group PLC | 6,982,900 | | 114,002,187 |
Cable & Wireless PLC | 1,154,800 | | 988,912 |
Capita Group PLC | 22,817,500 | | 280,209,848 |
Carphone Warehouse Group PLC | 12,014,300 | | 58,612,325 |
Centrica PLC | 502,000 | | 2,671,816 |
Ensco International Ltd. ADR | 10,500 | | 486,570 |
GlaxoSmithKline PLC | 9,537,800 | | 186,226,415 |
GlaxoSmithKline PLC sponsored ADR | 4,130,400 | | 161,250,816 |
HSBC Holdings PLC: | | | |
(United Kingdom) | 434,871 | | 4,525,417 |
sponsored ADR | 9,939,900 | | 517,968,189 |
|
| Shares | | Value |
Imperial Tobacco Group PLC | 99,050 | | $ 3,172,272 |
Inchcape PLC (a) | 18,399,998 | | 102,795,215 |
International Personal Finance PLC | 104,600 | | 521,189 |
ITV PLC (a) | 84,576,200 | | 92,481,316 |
Johnson Matthey PLC | 1,813,800 | | 55,620,451 |
Kalahari Minerals PLC (a) | 186,400 | | 523,368 |
Kazakhmys PLC | 45,100 | | 950,902 |
Lloyds Banking Group PLC (a) | 221,683,500 | | 243,627,024 |
Lonmin PLC (a) | 34,400 | | 963,943 |
Misys PLC (a) | 15,000,355 | | 67,628,352 |
Next PLC | 970,700 | | 35,536,480 |
Ocado Group PLC (a) | 6,000,000 | | 13,429,221 |
Pearson PLC | 10,425,200 | | 159,651,691 |
Premier Oil PLC (a) | 19,171 | | 516,316 |
Prudential PLC | 171,500 | | 1,734,339 |
QinetiQ Group PLC | 20,900,000 | | 35,962,820 |
Reckitt Benckiser Group PLC | 5,197,800 | | 290,718,447 |
Rio Tinto PLC | 45,550 | | 2,958,115 |
Rio Tinto PLC sponsored ADR | 3,501,000 | | 227,985,120 |
Royal Dutch Shell PLC: | | | |
Class A (United Kingdom) | 162,500 | | 5,274,678 |
Class A sponsored ADR | 4,900,000 | | 318,157,000 |
Class B ADR | 10,800,000 | | 694,656,000 |
Standard Chartered PLC: | | | |
rights 11/5/10 (a) | 12,287 | | 103,448 |
(United Kingdom) | 3,835,644 | | 110,952,977 |
TalkTalk Telecom Group PLC (a) | 20,856,732 | | 44,075,194 |
Tesco PLC | 28,030,100 | | 191,691,612 |
Vedanta Resources PLC | 1,525,000 | | 50,698,034 |
Vodafone Group PLC | 1,664,000 | | 4,548,148 |
Vodafone Group PLC sponsored ADR | 23,309,200 | | 641,236,092 |
TOTAL UNITED KINGDOM | | 6,390,356,716 |
United States of America - 6.3% |
Anadarko Petroleum Corp. | 2,715,900 | | 167,217,963 |
Apple, Inc. (a) | 700,800 | | 210,849,696 |
Avon Products, Inc. | 35,800 | | 1,090,110 |
C. R. Bard, Inc. | 1,030,000 | | 85,613,600 |
Central European Distribution Corp. (a) | 41,700 | | 1,041,249 |
CF Industries Holdings, Inc. | 899,500 | | 110,215,735 |
Chevron Corp. | 1,060,000 | | 87,566,600 |
China-Biotics, Inc. (a) | 39,200 | | 491,568 |
Citigroup, Inc. (a) | 16,600,000 | | 69,222,000 |
Corning, Inc. | 53,500 | | 977,980 |
eBay, Inc. (a) | 2,883,600 | | 85,960,116 |
First Cash Financial Services, Inc. (a) | 17,900 | | 520,353 |
Google, Inc. Class A (a) | 406,608 | | 249,246,638 |
Gran Tierra Energy, Inc. (a) | 64,500 | | 481,170 |
Hewlett-Packard Co. | 1,200,000 | | 50,472,000 |
Illumina, Inc. (a) | 1,027,800 | | 55,819,818 |
Jacobs Engineering Group, Inc. (a) | 1,150,000 | | 44,401,500 |
JPMorgan Chase & Co. | 1,605,800 | | 60,426,254 |
Common Stocks - continued |
| Shares | | Value |
United States of America - continued |
Lear Corp. (a) | 206,100 | | $ 18,219,240 |
Medco Health Solutions, Inc. (a) | 2,286,700 | | 120,120,351 |
Morgan Stanley | 2,504,100 | | 62,276,967 |
Newmont Mining Corp. | 1,000,000 | | 60,870,000 |
Philip Morris International, Inc. | 2,212,900 | | 129,454,650 |
QUALCOMM, Inc. | 22,100 | | 997,373 |
Regions Financial Corp. | 7,913,500 | | 49,855,050 |
SanDisk Corp. (a) | 2,180,900 | | 81,958,222 |
Schweitzer-Mauduit International, Inc. (e) | 1,297,914 | | 83,300,121 |
The Walt Disney Co. | 1,423,200 | | 51,391,752 |
The Western Union Co. | 56,700 | | 997,920 |
Visa, Inc. Class A | 1,400,000 | | 109,438,000 |
Wells Fargo & Co. | 6,137,200 | | 160,058,176 |
TOTAL UNITED STATES OF AMERICA | | 2,210,552,172 |
TOTAL COMMON STOCKS (Cost $26,841,115,573) | 32,884,501,265 |
Nonconvertible Preferred Stocks - 1.5% |
| | | |
Germany - 1.5% |
Bayerische Motoren Werke AG (BMW) (non-vtg.) | 800,000 | | 38,949,469 |
ProSiebenSat.1 Media AG | 5,548,800 | | 146,619,469 |
Volkswagen AG | 2,232,900 | | 335,552,622 |
TOTAL NONCONVERTIBLE PREFERRED STOCKS (Cost $305,707,723) | 521,121,560 |
Money Market Funds - 5.6% |
| Shares | | Value |
Fidelity Cash Central Fund, 0.23% (b) | 1,313,905,689 | | $ 1,313,905,689 |
Fidelity Securities Lending Cash Central Fund, 0.24% (b)(c) | 620,968,677 | | 620,968,677 |
TOTAL MONEY MARKET FUNDS (Cost $1,934,874,366) | 1,934,874,366 |
TOTAL INVESTMENT
PORTFOLIO - 101.5% (Cost $29,081,697,662) | | 35,340,497,191 |
NET OTHER ASSETS (LIABILITIES) - (1.5)% | | (521,262,073) |
NET ASSETS - 100% | $ 34,819,235,118 |
Legend |
(a) Non-income producing |
(b) Affiliated fund that is available only to investment companies and other accounts managed by Fidelity Investments. The rate quoted is the annualized seven-day yield of the fund at period end. A complete unaudited listing of the fund's holdings as of its most recent quarter end is available upon request. In addition, each Fidelity Central Fund's financial statements, which are not covered by the Fund's report of Independent Registered Public Accounting Firm, are available on the SEC's website or upon request. |
(c) Investment made with cash collateral received from securities on loan. |
(d) Security or a portion of the security is on loan at period end. |
(e) Affiliated company |
(f) Security exempt from registration under Rule 144A of the Securities Act of 1933. These securities may be resold in transactions exempt from registration, normally to qualified institutional buyers. At the end of the period, the value of these securities amounted to $9,544,006 or 0.0% of net assets. |
(g) Restricted securities - Investment in securities not registered under the Securities Act of 1933 (excluding 144A issues). At the end of the period, the value of restricted securities (excluding 144A issues) amounted to $451,860 or 0.0% of net assets. |
Additional information on each holding is as follows: |
Security | Acquisition Date | Acquisition Cost |
OZ Optics Ltd. unit | 8/18/00 | $ 1,505,520 |
Affiliated Central Funds |
Information regarding fiscal year to date income earned by the Fund from investments in Fidelity Central Funds is as follows: |
Fund | Income earned |
Fidelity Cash Central Fund | $ 1,916,208 |
Fidelity Securities Lending Cash Central Fund | 21,351,864 |
Total | $ 23,268,072 |
Other Affiliated Issuers |
An affiliated company is a company in which the Fund has ownership of at least 5% of the voting securities. Fiscal year to date transactions with companies which are or were affiliates are as follows: |
Affiliate | Value,
beginning of period | Purchases | Sales Proceeds | Dividend Income | Value,
end of
period |
Bovis Homes Group PLC | $ 49,028,663 | $ - | $ 40,862,474 | $ - | $ - |
easyJet PLC | 168,495,470 | - | 164,901,608 | - | - |
Informa PLC | 163,485,254 | 209,835 | 123,704,482 | 5,004,506 | - |
Niko Resources Ltd. | 204,266,519 | 3,831,199 | 32,663,592 | 287,709 | - |
Painted Pony Petroleum Ltd. 144A | 3,676,731 | 4,520,708 | - | - | 9,544,006 |
Painted Pony Petroleum Ltd. Class A | 3,972,148 | 15,732,670 | - | - | 21,509,462 |
Petrobank Energy & Resources Ltd. | 239,355,866 | 7,034,675 | - | - | 223,863,859 |
Pronova BioPharma ASA | 48,182,882 | 1,312,775 | 8,079,938 | - | - |
Resolution Ltd. | - | 203,988,590 | 3,235,783 | 4,279,791 | - |
Schweitzer-Mauduit International, Inc. | - | 66,984,142 | - | 319,904 | 83,300,121 |
Tecan Group AG | 67,537,277 | - | 49,592,334 | 749,837 | - |
Trican Well Service Ltd. | 81,839,590 | - | 104,622,102 | 436,015 | - |
Total | $ 1,029,840,400 | $ 303,614,594 | $ 527,662,313 | $ 11,077,762 | $ 338,217,448 |
Other Information |
The following is a summary of the inputs used, as of October 31, 2010, involving the Fund's assets and liabilities carried at fair value. The inputs or methodology used for valuing securities may not be an indication of the risk associated with investing in those securities. For more information on valuation inputs, and their aggregation into the levels used in the tables below, please refer to the Security Valuation section in the accompanying Notes to Financial Statements. |
Valuation Inputs at Reporting Date: |
Description | Total | Level 1 | Level 2 | Level 3 |
Investments in Securities: | | | | |
Equities: | | | | |
United Kingdom | $ 6,390,356,716 | $ 5,463,203,141 | $ 927,153,575 | $ - |
Japan | 4,118,120,285 | 1,480,235,031 | 2,637,885,254 | - |
Germany | 2,806,562,013 | 2,571,145,607 | 235,416,406 | - |
Switzerland | 2,678,567,949 | 2,182,630,892 | 495,937,057 | - |
France | 2,429,558,371 | 2,248,114,380 | 181,443,991 | - |
United States of America | 2,210,552,172 | 2,210,552,172 | - | - |
Canada | 1,500,196,774 | 1,499,744,914 | - | 451,860 |
Spain | 1,364,541,644 | 945,232,128 | 419,309,516 | - |
Netherlands | 1,103,151,493 | 1,010,652,643 | 92,498,850 | - |
Other | 8,804,015,408 | 7,896,535,647 | 907,479,761 | - |
Money Market Funds | 1,934,874,366 | 1,934,874,366 | - | - |
Total Investments in Securities: | $ 35,340,497,191 | $ 29,442,920,921 | $ 5,897,124,410 | $ 451,860 |
The following is a reconciliation of Investments in Securities for which Level 3 inputs were used in determining value: |
Investments in Securities: | |
Beginning Balance | $ 481,440 |
Total Realized Gain (Loss) | - |
Total Unrealized Gain (Loss) | (29,580) |
Cost of Purchases | - |
Proceeds of Sales | - |
Amortization/Accretion | - |
Transfers in to Level 3 | - |
Transfers out of Level 3 | - |
Ending Balance | $ 451,860 |
The change in unrealized gain (loss) for the period attributable to Level 3 securities held at October 31, 2010 | $ (29,580) |
The information used in the above reconciliation represents fiscal year to date activity for any Investments in Securities identified as using Level 3 inputs at either the beginning or the end of the current fiscal period. Transfers in or out of Level 3 represent the beginning value of any Security or Instrument where a change in the pricing level occurred from the beginning to the end of the period. The cost of purchases and the proceeds of sales may include securities received or delivered through corporate actions or exchanges. Realized and unrealized gains (losses) disclosed in the reconciliation are included in Net Gain (Loss) on the Fund's Statement of Operations. |
Income Tax Information |
At October 31, 2010, the Fund had a capital loss carryforward of approximately $5,177,653,127 of which $956,598,602, $3,601,913,096 and $619,141,429 will expire on October 31, 2016, 2017 and 2018, respectively. Capital loss carryforwards are only available to offset future capital gains of the Fund to the extent provided by regulations and may be limited. |
See accompanying notes which are an integral part of the financial statements.
Annual Report
Fidelity Diversified International Fund
Statement of Assets and Liabilities
| October 31, 2010 |
| | |
Assets | | |
Investment in securities, at value (including securities loaned of $599,538,721) - See accompanying schedule: Unaffiliated issuers (cost $26,810,900,728) | $ 33,067,405,377 | |
Fidelity Central Funds (cost $1,934,874,366) | 1,934,874,366 | |
Other affiliated issuers (cost $335,922,568) | 338,217,448 | |
Total Investments (cost $29,081,697,662) | | $ 35,340,497,191 |
Cash | | 1,944,256 |
Receivable for investments sold | | 152,958,867 |
Receivable for fund shares sold | | 42,373,584 |
Dividends receivable | | 93,945,387 |
Distributions receivable from
Fidelity Central Funds | | 250,116 |
Other receivables | | 3,118,617 |
Total assets | | 35,635,088,018 |
| | |
Liabilities | | |
Payable for investments purchased | $ 114,316,055 | |
Payable for fund shares redeemed | 49,570,390 | |
Accrued management fee | 19,084,476 | |
Other affiliated payables | 5,585,364 | |
Other payables and accrued
expenses | 6,327,938 | |
Collateral on securities loaned,
at value | 620,968,677 | |
Total liabilities | | 815,852,900 |
| | |
Net Assets | | $ 34,819,235,118 |
Net Assets consist of: | | |
Paid in capital | | $ 33,386,450,830 |
Undistributed net investment income | | 424,022,673 |
Accumulated undistributed net realized gain (loss) on investments and foreign currency transactions | | (5,250,875,923) |
Net unrealized appreciation (depreciation) on investments and assets and liabilities in foreign
currencies | | 6,259,637,538 |
Net Assets | | $ 34,819,235,118 |
| | |
Diversified International:
Net Asset Value, offering price and redemption price per share ($26,527,228,516 ÷ 899,570,270 shares) | | $ 29.49 |
| | |
Class K:
Net Asset Value, offering price and redemption price per share ($7,697,404,912 ÷
260,809,944 shares) | | $ 29.51 |
| | |
Class F:
Net Asset Value, offering price and redemption price per share ($594,601,690 ÷
20,144,672 shares) | | $ 29.52 |
Statement of Operations
| Year ended October 31, 2010 |
| | |
Investment Income | | |
Dividends (including $11,077,762 earned from other affiliated issuers) | | $ 865,768,030 |
Interest | | 7,798 |
Income from Fidelity Central Funds | | 23,268,072 |
Income before foreign taxes withheld | | 889,043,900 |
Less foreign taxes withheld | | (76,318,519) |
Total income | | 812,725,381 |
| | |
Expenses | | |
Management fee
Basic fee | $ 250,126,269 | |
Performance adjustment | (1,938,601) | |
Transfer agent fees | 73,940,178 | |
Accounting and security
lending fees | 2,719,020 | |
Custodian fees and expenses | 6,509,391 | |
Independent trustees' compensation | 202,342 | |
Appreciation in deferred trustee compensation account | 10 | |
Registration fees | 239,837 | |
Audit | 225,084 | |
Legal | 218,627 | |
Interest | 393 | |
Miscellaneous | 491,243 | |
Total expenses before reductions | 332,733,793 | |
Expense reductions | (6,448,403) | 326,285,390 |
Net investment income (loss) | | 486,439,991 |
Realized and Unrealized Gain (Loss) Net realized gain (loss) on: | | |
Investment securities: | | |
Unaffiliated issuers (net of foreign taxes of $1,783,507) | (337,674,020) | |
Other affiliated issuers | (213,110,117) | |
Foreign currency transactions | (11,019,334) | |
Capital gain distributions from Fidelity Central Funds | 50,714 | |
Total net realized gain (loss) | | (561,752,757) |
Change in net unrealized appreciation (depreciation) on: Investment securities (net of increase in deferred foreign taxes of $3,976,979) | 3,611,091,904 | |
Assets and liabilities in foreign currencies | 3,060,095 | |
Total change in net unrealized appreciation (depreciation) | | 3,614,151,999 |
Net gain (loss) | | 3,052,399,242 |
Net increase (decrease) in net assets resulting from operations | | $ 3,538,839,233 |
See accompanying notes which are an integral part of the financial statements.
Annual Report
Statement of Changes in Net Assets
| Year ended
October 31,
2010 | Year ended
October 31,
2009 |
Increase (Decrease) in Net Assets | | |
Operations | | |
Net investment income (loss) | $ 486,439,991 | $ 476,097,261 |
Net realized gain (loss) | (561,752,757) | (3,390,561,829) |
Change in net unrealized appreciation (depreciation) | 3,614,151,999 | 9,739,007,983 |
Net increase (decrease) in net assets resulting from operations | 3,538,839,233 | 6,824,543,415 |
Distributions to shareholders from net investment income | (474,506,693) | (412,836,673) |
Share transactions - net increase (decrease) | (3,995,252,806) | 129,291,951 |
Redemption fees | 822,251 | 1,098,454 |
Total increase (decrease) in net assets | (930,098,015) | 6,542,097,147 |
| | |
Net Assets | | |
Beginning of period | 35,749,333,133 | 29,207,235,986 |
End of period (including undistributed net investment income of $424,022,673 and undistributed net investment income of $412,089,844, respectively) | $ 34,819,235,118 | $ 35,749,333,133 |
Financial Highlights - Diversified International
Years ended October 31, | 2010 | 2009 | 2008 | 2007 | 2006 |
Selected Per-Share Data | | | | | |
Net asset value, beginning of period | $ 26.86 | $ 21.96 | $ 45.41 | $ 37.58 | $ 30.80 |
Income from Investment Operations | | | | | |
Net investment income (loss) B | .37 | .35 | .55 | .47 | .46 |
Net realized and unrealized gain (loss) | 2.61 | 4.86 | (20.96) | 10.23 | 7.33 |
Total from investment operations | 2.98 | 5.21 | (20.41) | 10.70 | 7.79 |
Distributions from net investment income | (.35) | (.31) | (.47) | (.36) | (.28) |
Distributions from net realized gain | - | - | (2.57) | (2.51) | (.73) |
Total distributions | (.35) | (.31) | (3.04) | (2.87) | (1.01) |
Redemption fees added to paid in capital B, F | - | - | - | - | - |
Net asset value, end of period | $ 29.49 | $ 26.86 | $ 21.96 | $ 45.41 | $ 37.58 |
Total Return A | 11.15% | 24.32% | (48.04)% | 30.37% | 25.89% |
Ratios to Average Net Assets C, E | | | | | |
Expenses before reductions | .98% | 1.01% | 1.04% | .93% | 1.01% |
Expenses net of fee waivers, if any | .98% | 1.01% | 1.04% | .93% | 1.01% |
Expenses net of all reductions | .96% | .99% | 1.02% | .91% | .97% |
Net investment income (loss) | 1.34% | 1.58% | 1.53% | 1.20% | 1.32% |
Supplemental Data | | | | | |
Net assets, end of period (000 omitted) | $ 26,527,229 | $ 30,998,270 | $ 28,274,961 | $ 59,929,942 | $ 43,965,189 |
Portfolio turnover rate D | 57% | 54% | 49% | 51% | 59% |
A Total returns would have been lower had certain expenses not been reduced during the periods shown.
B Calculated based on average shares outstanding during the period.
C Fees and expenses of the underlying Fidelity Central Funds are not included in the Fund's expense ratio. The Fund indirectly bears its proportionate share of the expenses of any underlying Fidelity Central Funds.
D Amount does not include the portfolio activity of any underlying Fidelity Central Funds.
E Expense ratios reflect operating expenses of the class. Expenses before reductions do not reflect amounts reimbursed by the investment adviser or reductions from brokerage service arrangements or reductions from other expense offset arrangements and do not represent the amount paid by the class during periods when reimbursements or reductions occur. Expenses net of fee waivers reflect expenses after reimbursement by the investment adviser but prior to reductions from brokerage service arrangements or other expense offset arrangements. Expenses net of all reductions represent the net expenses paid by the class.
F Amount represents less than $.01 per share.
See accompanying notes which are an integral part of the financial statements.
Annual Report
Financial Highlights - Class K
Years ended October 31, | 2010 | 2009 | 2008 G |
Selected Per-Share Data | | | |
Net asset value, beginning of period | $ 26.89 | $ 21.98 | $ 38.39 |
Income from Investment Operations | | | |
Net investment income (loss) D | .42 | .42 | .16 |
Net realized and unrealized gain (loss) | 2.61 | 4.85 | (16.57) |
Total from investment operations | 3.03 | 5.27 | (16.41) |
Distributions from net investment income | (.41) | (.36) | - |
Redemption fees added to paid in capital D,I | - | - | - |
Net asset value, end of period | $ 29.51 | $ 26.89 | $ 21.98 |
Total Return B, C | 11.33% | 24.64% | (42.75)% |
Ratios to Average Net Assets E, H | | | |
Expenses before reductions | .79% | .77% | .88% A |
Expenses net of fee waivers, if any | .79% | .77% | .88% A |
Expenses net of all reductions | .77% | .76% | .87% A |
Net investment income (loss) | 1.54% | 1.81% | 1.45% A |
Supplemental Data | | | |
Net assets, end of period (000 omitted) | $ 7,697,405 | $ 4,713,909 | $ 932,275 |
Portfolio turnover rate F | 57% | 54% | 49% |
A Annualized
B Total returns for periods of less than one year are not annualized.
C Total returns would have been lower had certain expenses not been reduced during the periods shown.
D Calculated based on average shares outstanding during the period.
E Fees and expenses of the underlying Fidelity Central Funds are not included in the Fund's expense ratio. The Fund indirectly bears its proportionate share of the expenses of any underlying Fidelity Central Funds.
F Amount does not include the portfolio activity of any underlying Fidelity Central Funds.
G For the period May 9, 2008 (commencement of sale of shares) to October 31, 2008.
H Expense ratios reflect operating expenses of the class. Expenses before reductions do not reflect amounts reimbursed by the investment adviser or reductions from brokerage service arrangements or reductions from other expense offset arrangements and do not represent the amount paid by the class during periods when reimbursements or reductions occur. Expense ratios before reductions for start-up periods may not be representative of longer-term operating periods. Expenses net of fee waivers reflect expenses after reimbursement by the investment adviser but prior to reductions from brokerage service arrangements or other expense offset arrangements. Expenses net of all reductions represent the net expenses paid by the class.
I Amount represents less than $.01 per share.
Financial Highlights - Class F
Years ended October 31, | 2010 | 2009 G |
Selected Per-Share Data | | |
Net asset value, beginning of period | $ 26.89 | $ 23.29 |
Income from Investment Operations | | |
Net investment income (loss) D | .43 | (.02) |
Net realized and unrealized gain (loss) | 2.62 | 3.62 |
Total from investment operations | 3.05 | 3.60 |
Distributions from net investment income | (.42) | - |
Redemption fees added to paid in capital D,I | - | - |
Net asset value, end of period | $ 29.52 | $ 26.89 |
Total Return B, C | 11.41% | 15.46% |
Ratios to Average Net Assets E, H | | |
Expenses before reductions | .73% | .71% A |
Expenses net of fee waivers, if any | .73% | .71% A |
Expenses net of all reductions | .72% | .70% A |
Net investment income (loss) | 1.59% | (.19)% A |
Supplemental Data | | |
Net assets, end of period (000 omitted) | $ 594,602 | $ 37,155 |
Portfolio turnover rate F | 57% | 54% |
A Annualized
B Total returns for periods of less than one year are not annualized.
C Total returns would have been lower had certain expenses not been reduced during the periods shown.
D Calculated based on average shares outstanding during the period.
E Fees and expenses of the underlying Fidelity Central Funds are not included in the Fund's expense ratio. The Fund indirectly bears its proportionate share of the expenses of any underlying Fidelity Central Funds.
F Amount does not include the portfolio activity of any underlying Fidelity Central Funds.
G For the period June 26, 2009 (commencement of sale of shares) to October 31, 2009.
H Expense ratios reflect operating expenses of the class. Expenses before reductions do not reflect amounts reimbursed by the investment adviser or reductions from brokerage service arrangements or reductions from other expense offset arrangements and do not represent the amount paid by the class during periods when reimbursements or reductions occur. Expense ratios before reductions for start-up periods may not be representative of longer-term operating periods. Expenses net of fee waivers reflect expenses after reimbursement by the investment adviser but prior to reductions from brokerage service arrangements or other expense offset arrangements. Expenses net of all reductions represent the net expenses paid by the class.
I Amount represents less than $.01 per share.
See accompanying notes which are an integral part of the financial statements.
Annual Report
Notes to Financial Statements
For the period ended October 31, 2010
1. Organization.
Fidelity Diversified International Fund (the Fund) is a fund of Fidelity Investment Trust (the Trust) and is authorized to issue an unlimited number of shares. The Trust is registered under the Investment Company Act of 1940, as amended (the 1940 Act), as an open-end management investment company organized as a Massachusetts business trust. The Fund offers Diversified International, Class K and Class F shares, each of which has equal rights as to assets and voting privileges. Each class has exclusive voting rights with respect to matters that affect that class. Class F shares of the Fund are only available for purchase by mutual funds for which Fidelity Management & Research Company (FMR) or an affiliate serves as investment manager. Investment income, realized and unrealized capital gains and losses, the common expenses of the Fund, and certain fund-level expense reductions, if any, are allocated on a pro-rata basis to each class based on the relative net assets of each class to the total net assets of the Fund. Each class differs with respect to transfer agent fees incurred. Certain expense reductions also differ by class. The Fund's investments in emerging markets can be subject to social, economic, regulatory, and political uncertainties and can be extremely volatile.
2. Investments in Fidelity Central Funds.
The Fund may invest in Fidelity Central Funds, which are open-end investment companies available only to other investment companies and accounts managed by FMR and its affiliates. The Fund's Schedule of Investments lists each of the Fidelity Central Funds held as of period end, if any, as an investment of the Fund, but does not include the underlying holdings of each Fidelity Central Fund. As an Investing Fund, the Fund indirectly bears its proportionate share of the expenses of the underlying Fidelity Central Funds.
The Money Market Central Funds seek preservation of capital and current income and are managed by Fidelity Investments Money Management, Inc. (FIMM), an affiliate of FMR.
A complete unaudited list of holdings for each Fidelity Central Fund is available upon request or at the Securities and Exchange Commission (the SEC) web site at www.sec.gov. In addition, the financial statements of the Fidelity Central Funds, which are not covered by the Fund's Report of Independent Registered Public Accounting Firm, are available on the SEC web site or upon request.
3. Significant Accounting Policies.
The financial statements have been prepared in conformity with accounting principles generally accepted in the United States of America (GAAP), which require management to make certain estimates and assumptions at the date of the financial statements. Actual results could differ from those estimates. The following summarizes the significant accounting policies of the Fund:
Security Valuation. Investments are valued as of 4:00 p.m. Eastern time on the last calendar day of the period. The Fund uses independent pricing services approved by the Board of Trustees to value its investments. When current market prices or quotations are not readily available or reliable, valuations may be determined in good faith in accordance with procedures adopted by the Board of Trustees. Factors used in determining value may include market or security specific events. The frequency with which these procedures are used cannot be predicted and they may be utilized to a significant extent. The value used for net asset value (NAV) calculation under these procedures may differ from published prices for the same securities.
The Fund categorizes the inputs to valuation techniques used to value its investments into a disclosure hierarchy consisting of three levels as shown below.
Level 1 - quoted prices in active markets for identical investments
Level 2 - other significant observable inputs (including quoted prices for similar investments, interest rates, prepayment speeds, etc.)
Level 3 - unobservable inputs (including the fund's own assumptions based on the best information available)
Changes in valuation techniques may result in transfers in or out of an assigned level within the disclosure hierarchy. The aggregate value of investments by input level, as of October 31, 2010, as well as a roll forward of Level 3 securities, is included at the end of the Fund's Schedule of Investments. Valuation techniques used to value the Fund's investments by major category are as follows.
Equity securities, including restricted securities, for which market quotations are readily available, are valued at the last reported sale price or official closing price as reported by an independent pricing service on the primary market or exchange on which they are traded and are categorized as Level 1 in the hierarchy. In the event there were no sales during the day or closing prices are not available, securities are valued at the last quoted bid price or may be valued using the last available price and are generally categorized as Level 2 in the hierarchy. For foreign equity securities, when significant market or security specific events arise, comparisons to the valuation of American Depositary Receipts (ADRs), futures contracts, Exchange-traded funds (ETFs) and certain indexes as well as quoted prices for similar securities are used and are categorized as Level 2 in the hierarchy in these circumstances. Utilizing these techniques may result in transfers between Level 1 and Level 2. For restricted equity securities and private placements where observable inputs are limited, assumptions about market activity and risk are used and are categorized as Level 3 in the hierarchy.
Annual Report
3. Significant Accounting Policies - continued
Security Valuation - continued
Investments in open-end mutual funds,including the Fidelity Central Funds, are valued at their closing net asset value each business day and are categorized as Level 1 in the hierarchy. Short-term securities with remaining maturities of sixty days or less for which quotations are not readily available are valued at amortized cost, which approximates fair value and are categorized as Level 2 in the hierarchy.
Foreign Currency. The Fund uses foreign currency contracts to facilitate transactions in foreign-denominated securities. Gains and losses from these transactions may arise from changes in the value of the foreign currency or if the counterparties do not perform under the contracts' terms.
Foreign-denominated assets, including investment securities, and liabilities are translated into U.S. dollars at the exchange rate at period end. Purchases and sales of investment securities, income and dividends received and expenses denominated in foreign currencies are translated into U.S. dollars at the exchange rate in effect on the transaction date.
The effects of exchange rate fluctuations on investments are included with the net realized and unrealized gain (loss) on investment securities. Other foreign currency transactions resulting in realized and unrealized gain (loss) are disclosed separately.
Investment Transactions and Income. For financial reporting purposes, the Fund's investment holdings and NAV include trades executed through the end of the last business day of the period. The NAV per share for processing shareholder transactions is calculated as of the close of business of the New York Stock Exchange (NYSE), normally 4:00 p.m. Eastern time and includes trades executed through the end of the prior business day. Gains and losses on securities sold are determined on the basis of identified cost and may include proceeds received from litigation. Dividend income is recorded on the ex-dividend date, except for certain dividends from foreign securities where the ex-dividend date may have passed, which are recorded as soon as the Fund is informed of the ex-dividend date. Non-cash dividends included in dividend income, if any, are recorded at the fair market value of the securities received. Distributions received on securities that represent a return of capital or capital gain are recorded as a reduction of cost of investments and/or as a realized gain. The Fund estimates the components of distributions received that may be considered return of capital distributions or capital gain distributions. Interest income and distributions from the Fidelity Central Funds are accrued as earned. Interest income includes coupon interest and amortization of premium and accretion of discount on debt securities. Investment income is recorded net of foreign taxes withheld where recovery of such taxes is uncertain.
Expenses. Most expenses of the Trust can be directly attributed to a fund. Expenses which cannot be directly attributed are apportioned amongst each fund in the Trust. Expense estimates are accrued in the period to which they relate and adjustments are made when actual amounts are known.
Deferred Trustee Compensation. Under a Deferred Compensation Plan (the Plan), independent Trustees may elect to defer receipt of a portion of their annual compensation. Deferred amounts are invested in a cross-section of Fidelity funds, are marked-to-market and remain in the Fund until distributed in accordance with the Plan. The investment of deferred amounts and the offsetting payable to the Trustees are included in the accompanying Statement of Assets and Liabilities.
Income Tax Information and Distributions to Shareholders. Each year the Fund intends to qualify as a regulated investment company, including distributing substantially all of its taxable income and realized gains under Subchapter M of the Internal Revenue Code and filing its U.S. federal tax return. As a result, no provision for income taxes is required. As of October 31, 2010, the Fund did not have any unrecognized tax benefits in the accompanying financial statements. A fund's federal tax return is subject to examination by the Internal Revenue Service (IRS) for a period of three years. Foreign taxes are provided for based on the Fund's understanding of the tax rules and rates that exist in the foreign markets in which it invests. The Fund is subject to a tax imposed on short term capital gains on securities of certain issuers domiciled in India. The Fund records an estimated deferred tax liability included in Other payables and accrued expenses in the accompanying Statement of Assets & Liabilities for net unrealized gains on these securities in an amount that would be payable if the securities were disposed of at period end.
Distributions are declared and recorded on the ex-dividend date. Income dividends and capital gain distributions are declared separately for each class. Income and capital gain distributions are determined in accordance with income tax regulations, which may differ from GAAP.
Capital accounts within the financial statements are adjusted for permanent book-tax differences. These adjustments have no impact on net assets or the results of operations. Temporary book-tax differences will reverse in a subsequent period.
Book-tax differences are primarily due to the short-term gain distributions from the Fidelity Central Funds, foreign currency transactions, certain foreign taxes, passive foreign investment companies (PFIC), deferred trustees compensation, capital loss carryforwards and losses deferred due to wash sales.
Annual Report
Notes to Financial Statements - continued
3. Significant Accounting Policies - continued
Income Tax Information and Distributions to Shareholders - continued
The federal tax cost of investment securities and unrealized appreciation (depreciation) as of period end were as follows:
Gross unrealized appreciation | $ 7,056,729,422 |
Gross unrealized depreciation | (962,448,025) |
Net unrealized appreciation (depreciation) | $ 6,094,281,397 |
| |
Tax Cost | $ 29,246,215,794 |
The tax-based components of distributable earnings as of period end were as follows:
Undistributed ordinary income | $ 515,990,332 |
Capital loss carryforward | $ (5,177,653,127) |
Net unrealized appreciation (depreciation) | $ (6,099,096,385) |
The tax character of distributions paid was as follows:
| October 31, 2010 | October 31, 2009 |
Ordinary Income | $ 474,506,693 | $ 412,836,673 |
Short-Term Trading (Redemption) Fees. Shares held by investors in the Fund less than 30 days are subject to a redemption fee equal to 1.00% of the net asset value of shares redeemed. All redemption fees, which reduce the proceeds of the shareholder redemption, are retained by the Fund and accounted for as an addition to paid in capital.
4. Operating Policies.
Restricted Securities. The Fund may invest in securities that are subject to legal or contractual restrictions on resale. These securities generally may be resold in transactions exempt from registration or to the public if the securities are registered. Disposal of these securities may involve time-consuming negotiations and expense, and prompt sale at an acceptable price may be difficult. Information regarding restricted securities is included at the end of the Fund's Schedule of Investments.
5. Purchases and Sales of Investments.
Purchases and sales of securities, other than short-term securities, aggregated $19,113,606,387 and $23,210,049,761, respectively.
6. Fees and Other Transactions with Affiliates.
Management Fee. FMR and its affiliates provide the Fund with investment management related services for which the Fund pays a monthly management fee. The management fee is the sum of an individual fund fee rate that is based on an annual rate of .45% of the Fund's average net assets and a group fee rate that averaged .26% during the period. The group fee rate is based upon the average net assets of all the mutual funds advised by FMR. The group fee rate decreases as assets under management increase and increases as assets under management decrease. In addition, the management fee is subject to a performance adjustment (up to a maximum of ±.20% of the Fund's average net assets over a 36 month performance period). The upward or downward adjustment to the management fee is based on the relative investment performance of Diversified International as compared to an appropriate benchmark index. For the period, the total annual management fee rate, including the performance adjustment, was .70% of the Fund's average net assets.
Transfer Agent Fees. Fidelity Investments Institutional Operations Company, Inc. (FIIOC), an affiliate of FMR, is the transfer, dividend disbursing and shareholder servicing agent for each class of the Fund. FIIOC receives account fees and asset-based fees that vary according to the account size and type of account of the shareholders of Diversified International. FIIOC receives an asset-based fee of Class K's average net assets. FIIOC receives no fees for providing transfer agency services to Class F. FIIOC pays for typesetting, printing and mailing of shareholder reports, except proxy statements. For the period, transfer agent fees for each class were as follows:
Annual Report
6. Fees and Other Transactions with Affiliates - continued
Transfer Agent Fees - continued
| Amount | % of
Average
Net Assets |
Diversified International | 70,681,751 | .25 |
Class K | 3,258,427 | .05 |
| $ 73,940,178 | |
Accounting and Security Lending Fees. Fidelity Service Company, Inc. (FSC), an affiliate of FMR, maintains the Fund's accounting records. The accounting fee is based on the level of average net assets for the month. Under a separate contract, FSC administers the security lending program. The security lending fee is based on the number and duration of lending transactions.
Brokerage Commissions. The Fund placed a portion of its portfolio transactions with brokerage firms which are affiliates of the investment adviser. The commissions paid to these affiliated firms were $73,316 for the period.
Interfund Lending Program. Pursuant to an Exemptive Order issued by the SEC, the Fund, along with other registered investment companies having management contracts with FMR, may participate in an interfund lending program. This program provides an alternative credit facility allowing the funds to borrow from, or lend money to, other participating affiliated funds. At period end, there were no interfund loans outstanding. The Fund's activity in this program during the period for which loans were outstanding was as follows:
Borrower or Lender | Average Daily
Loan Balance | Weighted Average
Interest Rate | Interest
Expense |
Borrower | $ 30,883,000 | .46% | $ 393 |
7. Committed Line of Credit.
The Fund participates with other funds managed by FMR or an affiliate in a $3.75 billion credit facility (the "line of credit") to be utilized for temporary or emergency purposes to fund shareholder redemptions or for other short-term liquidity purposes. The Fund has agreed to pay commitment fees on its pro-rata portion of the line of credit, which amounted to $139,855 and is reflected in Miscellaneous expenses on the Statement of Operations. During the period, there were no borrowings on this line of credit.
8. Security Lending.
The Fund lends portfolio securities through a lending agent from time to time in order to earn additional income. The lending agent may loan securities to certain qualified borrowers, including Fidelity Capital Markets (FCM), a broker dealer affiliated with the Fund. On the settlement date of the loan, the Fund receives collateral (in the form of U.S. Treasury obligations, letters of credit and/or cash) against the loaned securities and maintains collateral in an amount not less than 100% of the market value of the loaned securities during the period of the loan. The market value of the loaned securities is determined at the close of business of the Fund and any additional required collateral is delivered to the Fund on the next business day. If the borrower defaults on its obligation to return the securities loaned because of insolvency or other reasons, a fund could experience delays and costs in recovering the securities loaned or in gaining access to the collateral. Any cash collateral received is invested in the Fidelity Securities Lending Cash Central Fund. The value of loaned securities and cash collateral at period end are disclosed on the Fund's Statement of Assets and Liabilities. Security lending income represents the income earned on investing cash collateral, less rebates paid to borrowers and lending agent fees associated with the loan, plus any premium payments received for lending certain types of securities. Security lending income is presented in the Statement of Operations as a component of income from Fidelity Central Funds. Total security lending income during the period amounted to $21,351,864. During the period, there were no securities loaned to FCM.
9. Expense Reductions.
Many of the brokers with whom FMR places trades on behalf of the Fund provided services to the Fund in addition to trade execution. These services included payments of certain expenses on behalf of the Fund totaling $6,448,114 for the period. In addition, through arrangements with the Fund's custodian, credits realized as a result of uninvested cash balances were used to reduce the Fund's expenses. During the period, these credits reduced the Fund's custody expenses by $289.
Annual Report
Notes to Financial Statements - continued
10. Distributions to Shareholders.
Distributions to shareholders of each class were as follows:
Years ended October 31, | 2010 | 2009A |
From net investment income | | |
Diversified International | $ 398,456,259 | $ 394,538,470 |
Class K | 74,880,028 | 18,298,203 |
Class F | 1,170,406 | - |
Total | $ 474,506,693 | $ 412,836,673 |
A Distributions to shareholders for Class F are for the period June 26, 2009 (commencement of sale of shares) to October 31, 2009.
11. Share Transactions.
Transactions for each class of shares were as follows:
| Shares | Dollars |
Years ended October 31, | 2010 | 2009A | 2010 | 2009A |
Diversified International | | | | |
Shares sold | 179,662,935 | 266,412,212 | $ 4,893,668,837 | $ 5,884,913,394 |
Conversion to Class K B | - | (113,348,310) | - | (2,310,072,040) |
Reinvestment of distributions | 13,627,007 | 20,012,374 | 384,281,814 | 380,635,740 |
Shares redeemed | (447,584,331) | (307,025,690) | (12,092,134,122) | (6,660,643,668) |
Net increase (decrease) | (254,294,389) | (133,949,414) | $ (6,814,183,471) | $ (2,705,166,574) |
Class K | | | | |
Shares sold | 151,794,829 | 46,252,428 | $ 4,125,917,772 | $ 1,096,724,275 |
Conversion from Diversified InternationalB | - | 113,393,333 | - | 2,310,072,040 |
Reinvestment of distributions | 2,657,205 | 963,570 | 74,880,028 | 18,298,203 |
Shares redeemed | (68,937,812) | (27,732,811) | (1,889,669,527) | (629,090,058) |
Net increase (decrease) | 85,514,222 | 132,876,520 | $ 2,311,128,273 | $ 2,796,004,460 |
Class F | | | | |
Shares sold | 24,587,499 | 1,396,615 | $ 664,182,809 | $ 38,873,992 |
Reinvestment of distributions | 41,548 | - | 1,170,406 | - |
Shares redeemed | (5,866,038) | (14,952) | (157,550,823) | (419,927) |
Net increase (decrease) | 18,763,009 | 1,381,663 | $ 507,802,392 | $ 38,454,065 |
A Share transactions for Class F are for the period June 26, 2009 (commencement of sale of shares) to October 31, 2009.
B Conversion transactions for Class K and Diversified International are presented for the period November 1, 2008 through August 31, 2009.
12. Other.
The Fund's organizational documents provide former and current trustees and officers with a limited indemnification against liabilities arising in connection with the performance of their duties to the Fund. In the normal course of business, the Fund may also enter into contracts that provide general indemnifications. The Fund's maximum exposure under these arrangements is unknown as this would be dependent on future claims that may be made against the Fund. The risk of material loss from such claims is considered remote.
Annual Report
Report of Independent Registered Public Accounting Firm
To the Trustees of Fidelity Investment Trust and Shareholders of Fidelity Diversified International Fund:
We have audited the accompanying statement of assets and liabilities of Fidelity Diversified International Fund (the Fund), a fund of Fidelity Investment Trust, including the schedule of investments, as of October 31, 2010, and the related statement of operations for the year then ended, the statement of changes in net assets for each of the two years in the period then ended, and the financial highlights for each of the five years in the period then ended. These financial statements and financial highlights are the responsibility of the Fund's management. Our responsibility is to express an opinion on these financial statements and financial highlights based on our audits.
We conducted our audits in accordance with standards of the Public Company Accounting Oversight Board (United States). Those standards require that we plan and perform the audit to obtain reasonable assurance about whether the financial statements and financial highlights are free of material misstatement. The Fund is not required to have, nor were we engaged to perform, an audit of its internal control over financial reporting. Our audits included consideration of internal control over financial reporting as a basis for designing audit procedures that are appropriate in the circumstances, but not for the purpose of expressing an opinion on the effectiveness of the Fund's internal control over financial reporting. Accordingly, we express no such opinion. An audit also includes examining, on a test basis, evidence supporting the amounts and disclosures in the financial statements, assessing the accounting principles used and significant estimates made by management, as well as evaluating the overall financial statement presentation. Our procedures included confirmation of securities owned as of October 31, 2010, by correspondence with the custodians and brokers; where replies were not received from brokers, we performed other auditing procedures. We believe that our audits provide a reasonable basis for our opinion.
In our opinion, the financial statements and financial highlights referred to above present fairly, in all material respects, the financial position of Fidelity Diversified International Fund as of October 31, 2010, the results of its operations for the year then ended, the changes in its net assets for each of the two years in the period then ended, and its financial highlights for each of the five years in the period then ended, in conformity with accounting principles generally accepted in the United States of America.
/s/ Deloitte & Touche LLP
DELOITTE & TOUCHE LLP
Boston, Massachusetts
December 17, 2010
Annual Report
The Trustees Member of the Advisory Board, and executive officers of the trust and fund, as applicable, are listed below. The Board of Trustees governs the fund and is responsible for protecting the interests of shareholders. The Trustees are experienced executives who meet periodically throughout the year to oversee the fund's activities, review contractual arrangements with companies that provide services to the fund, oversee management of the risks associated with such activities and contractual arrangements, and review the fund's performance. Except for James C. Curvey, each of the Trustees oversees 221 funds advised by FMR or an affiliate. Mr. Curvey oversees 410 funds advised by FMR or an affiliate.
The Trustees hold office without limit in time except that (a) any Trustee may resign; (b) any Trustee may be removed by written instrument, signed by at least two-thirds of the number of Trustees prior to such removal; (c) any Trustee who requests to be retired or who has become incapacitated by illness or injury may be retired by written instrument signed by a majority of the other Trustees; and (d) any Trustee may be removed at any special meeting of shareholders by a two-thirds vote of the outstanding voting securities of the trust. Each Trustee who is not an interested person (as defined in the 1940 Act) (Independent Trustee), shall retire not later than the last day of the calendar year in which his or her 72nd birthday occurs. The Independent Trustees may waive this mandatory retirement age policy with respect to individual Trustees. The executive officers and Advisory Board Member hold office without limit in time, except that any officer and Advisory Board Member may resign or may be removed by a vote of a majority of the Trustees at any regular meeting or any special meeting of the Trustees. Except as indicated, each individual has held the office shown or other offices in the same company for the past five years.
Experience, Skills, Attributes, and Qualifications of the Fund's Trustees. The Governance and Nominating Committee has adopted a statement of policy that describes the experience, qualifications, attributes, and skills that are necessary and desirable for potential Independent Trustee candidates (Statement of Policy). The Board believes that each Trustee satisfied at the time he or she was initially elected or appointed a Trustee, and continues to satisfy, the standards contemplated by the Statement of Policy. The Governance and Nominating Committee also engages professional search firms to help identify potential Independent Trustee candidates who have the experience, qualifications, attributes, and skills consistent with the Statement of Policy. From time to time, additional criteria based on the composition and skills of the current Independent Trustees, as well as experience or skills that may be appropriate in light of future changes to board composition, business conditions, and regulatory or other developments, have also been considered by the professional search firms and the Governance and Nominating Committee. In addition, the Board takes into account the Trustees' commitment and participation in Board and committee meetings, as well as their leadership of standing and ad hoc committees throughout their tenure.
In determining that a particular Trustee was and continues to be qualified to serve as a Trustee, the Board has considered a variety of criteria, none of which, in isolation, was controlling. The Board believes that, collectively, the Trustees have balanced and diverse experience, qualifications, attributes, and skills, which allow the Board to operate effectively in governing the fund and protecting the interests of shareholders. Information about the specific experience, skills, attributes, and qualifications of each Trustee, which in each case led to the Board's conclusion that the Trustee should serve (or continue to serve) as a trustee of the fund, is provided below.
Board Structure and Oversight Function. Edward C. Johnson 3d is an interested person (as defined in the 1940 Act) and currently serves as Chairman. The Trustees have determined that an interested Chairman is appropriate and benefits shareholders because an interested Chairman has a personal and professional stake in the quality and continuity of services provided to the fund. Independent Trustees exercise their informed business judgment to appoint an individual of their choosing to serve as Chairman, regardless of whether the Trustee happens to be independent or a member of management. The Independent Trustees have determined that they can act independently and effectively without having an Independent Trustee serve as Chairman and that a key structural component for assuring that they are in a position to do so is for the Independent Trustees to constitute a substantial majority for the Board. The Independent Trustees also regularly meet in executive session. Ned C. Lautenbach serves as Chairman of the Independent Trustees and as such (i) acts as a liaison between the Independent Trustees and management with respect to matters important to the Independent Trustees and (ii) with management prepares agendas for Board meetings.
Fidelity funds are overseen by different Boards of Trustees. The fund's Board oversees Fidelity's equity and high income funds and another Board oversees Fidelity's investment-grade bond, money market, and asset allocation funds. The asset allocation funds may invest in Fidelity funds overseen by the fund's Board. The use of separate Boards, each with its own committee structure, allows the Trustees of each group of Fidelity funds to focus on the unique issues of the funds they oversee, including common research, investment, and operational issues. On occasion, the separate Boards establish joint committees to address issues of overlapping consequences for the Fidelity funds overseen by each Board.
The Trustees operate using a system of committees to facilitate the timely and efficient consideration of all matters of importance to the Trustees, the fund, and fund shareholders and to facilitate compliance with legal and regulatory requirements and oversight of the fund's activities and associated risks. The Board, acting through its committees, has charged FMR and its affiliates with (i) identifying events or circumstances the occurrence of which could have demonstrably adverse effects on the fund's business and/or reputation; (ii) implementing processes and controls to lessen the possibility that such events or circumstances occur or to mitigate the effects of such events or circumstances if they do occur; and (iii) creating and maintaining a system designed to evaluate continuously business and market conditions in order to facilitate the identification and implementation processes described in (i) and (ii) above. Because the day-to-day operations and activities of the fund are carried out by or through FMR, its affiliates and other service providers, the fund's exposure to risks is mitigated but not eliminated by the processes overseen by the Trustees. While each of the Board's committees has responsibility for overseeing different aspects of the fund's activities, oversight is exercised primarily through the Operations, Audit, and Compliance Committees. Appropriate personnel, including but not limited to the fund's Chief Compliance Officer (CCO), FMR's internal auditor, the independent accountants, the fund's Treasurer and portfolio management personnel, make periodic reports to the Board's committees, as appropriate. The responsibilities of each committee, including their oversight responsibilities, are described further under "Standing Committees of the Fund's Trustees."
Annual Report
Trustees and Officers - continued
The fund's Statement of Additional Information (SAI) includes more information about the Trustees. To request a free copy, call Fidelity at 1-800-835-5092.
Interested Trustees*:
Correspondence intended for each Trustee who is an interested person may be sent to Fidelity Investments, 82 Devonshire Street, Boston, Massachusetts 02109.
Name, Age; Principal Occupations and Other Relevant Experience+ |
Edward C. Johnson 3d (80) |
| Year of Election or Appointment: 1984 Mr. Johnson is Trustee and Chairman of the Board of Trustees of certain Trusts. Mr. Johnson serves as Chief Executive Officer, Chairman, and a Director of FMR LLC; Chairman and a Director of FMR; Chairman and a Director of Fidelity Research & Analysis Company (FRAC); Chairman and a Director of Fidelity Investments Money Management, Inc.; and Chairman and a Director of FMR Co., Inc. In addition, Mr. Johnson serves as Chairman and Director of FIL Limited. Previously, Mr. Johnson served as President of FMR LLC (2006-2007). |
James C. Curvey (75) |
| Year of Election or Appointment: 2007 Mr. Curvey also serves as Trustee (2007-present) of other investment companies advised by FMR. Mr. Curvey is a Director of Fidelity Investments Money Management, Inc. (2009-present), Director of Fidelity Research & Analysis Co. (2009-present) and Director of FMR and FMR Co., Inc. (2007-present). Mr. Curvey is also Vice Chairman (2007-present) and Director of FMR LLC. In addition, Mr. Curvey serves as an Overseer for the Boston Symphony Orchestra and a member of the Trustees of Villanova University. Previously, Mr. Curvey was the Vice Chairman (2006-2007) and Director (2000-2007) of FMR Corp. |
* Trustees have been determined to be "Interested Trustees" by virtue of, among other things, their affiliation with the trust or various entities under common control with FMR.
+ The information above includes each Trustee's principal occupation during the last five years and other information relating to the experience, attributes, and skills relevant to each Trustee's qualifications to serve as a Trustee, which led to the conclusion that each Trustee should serve as a Trustee for each fund.
Independent Trustees:
Correspondence intended for each Independent Trustee (that is, the Trustees other than the Interested Trustees) may be sent to Fidelity Investments, P.O. Box 55235, Boston, Massachusetts 02205-5235.
Name, Age; Principal Occupations and Other Relevant Experience+ |
Dennis J. Dirks (62) |
| Year of Election or Appointment: 2005 Prior to his retirement in May 2003, Mr. Dirks was Chief Operating Officer and a member of the Board of The Depository Trust & Clearing Corporation (DTCC). He also served as President, Chief Operating Officer, and Board member of The Depository Trust Company (DTC) and President and Board member of the National Securities Clearing Corporation (NSCC). In addition, Mr. Dirks served as Chief Executive Officer and Board member of the Government Securities Clearing Corporation, Chief Executive Officer and Board member of the Mortgage-Backed Securities Clearing Corporation, as a Trustee and a member of the Finance Committee of Manhattan College (2005-2008), and as a Trustee and a member of the Finance Committee of AHRC of Nassau County (2006-2008). Mr. Dirks is a member of the Independent Directors Council (IDC) Governing Council (2010-Present) and Board of Directors for The Brookville Center for Children's Services, Inc. (2009-present). |
Alan J. Lacy (57) |
| Year of Election or Appointment: 2008 Mr. Lacy serves as Senior Adviser (2007-present) of Oak Hill Capital Partners, L.P. (private equity). Mr. Lacy also served as Chief Executive Officer (2000-2005) and Vice Chairman (2005-2006) of Sears Holdings Corporation and Sears, Roebuck and Co. (retail). In addition, Mr. Lacy serves as a member of the Board of Directors of The Western Union Company (global money transfer, 2006-present) and Bristol-Myers Squibb Company (global pharmaceuticals, 2007-present). Mr. Lacy is Chairman (2008-present) and a member (2006-present) of the Board of Trustees of The National Parks Conservation Association. |
Ned C. Lautenbach (66) |
| Year of Election or Appointment: 2000 Mr. Lautenbach is Chairman of the Independent Trustees of the Equity and High Income Funds (2006-present). Mr. Lautenbach currently serves as the Lead Director of the Eaton Corporation Board of Directors (diversified industrial, 1997-present). Mr. Lautenbach is also a member of the Board of Directors of the Philharmonic Center for the Arts in Naples, Florida (1999-
present); a member of the Board of Trustees of Fairfield University (2005-present); and a member of the Council on Foreign Relations (1994-present). Previously, Mr. Lautenbach was a Partner/Advisory Partner at Clayton, Dubilier & Rice, Inc. (private equity investment, 1998-2010), as well as a Director of Sony Corporation (2006-2007). |
Joseph Mauriello (66) |
| Year of Election or Appointment: 2008 Prior to his retirement in January 2006, Mr. Mauriello served in numerous senior management positions including Deputy Chairman and Chief Operating Officer (2004-2005), and Vice Chairman of Financial Services (2002-2004) of KPMG LLP US (professional services, 1965-2005). Mr. Mauriello currently serves as a member of the Board of Directors of XL Group plc. (global insurance and re-insurance, 2006-present) and of Arcadia Resources Inc. (health care services and products, 2007-present). Previously, Mr. Mauriello served as a Director of the Hamilton Funds of the Bank of New York (2006-2007). |
Cornelia M. Small (66) |
| Year of Election or Appointment: 2005 Ms. Small is a member of the Board of Directors of the Teagle Foundation (2009-present). Ms. Small is also a member of the Investment Committee, and Chair (2008-present) and a member of the Board of Trustees of Smith College. In addition, Ms. Small serves on the Investment Committee of the Berkshire Taconic Community Foundation (2008-present). Previously, Ms. Small served as Chairperson of the Investment Committee (2002-2008) of Smith College. In addition, Ms. Small served as Chief Investment Officer, Director of Global Equity Investments, and a member of the Board of Directors of Scudder, Stevens & Clark and Scudder Kemper Investments. |
William S. Stavropoulos (71) |
| Year of Election or Appointment: 2001 Mr. Stavropoulos is Vice Chairman of the Independent Trustees of the Equity and High Income Funds (2006-present). Mr. Stavropoulos serves as President and Founder of the Michigan Baseball Foundation, the Great Lakes Loons (2007-present). Mr. Stavropoulos is Chairman Emeritus of the Board of Directors of The Dow Chemical Company, where he previously served in numerous senior management positions, including President, CEO (1995-2000; 2002-2004), Chairman of the Executive Committee (2000-2006), and as a member of the Board of Directors (1990-2006). Currently, Mr. Stavropoulos is Chairman of Univar (global distributor of commodity and specialty chemicals, 2010-present), a Director of Teradata Corporation (data warehousing and technology solutions, 2008-present), Chemical Financial Corporation, Maersk Inc. (industrial conglomerate), Tyco International, Inc. (multinational manufacturing and services, 2007-present), and a member of the Advisory Board for Metalmark Capital (private equity investment, 2005-present). Mr. Stavropoulos is a special advisor to Clayton, Dubilier & Rice, Inc. (private equity investment). In addition, Mr. Stavropoulos is a member of the University of Notre Dame Advisory Council for the College of Science. |
David M. Thomas (61) |
| Year of Election or Appointment: 2008 Previously, Mr. Thomas served as Executive Chairman (2005-2006) and Chairman and Chief Executive Officer (2000-2005) of IMS Health, Inc. (pharmaceutical and healthcare information solutions). In addition, Mr. Thomas serves as a member of the Board of Directors of Fortune Brands, Inc. (consumer products), and Interpublic Group of Companies, Inc. (marketing communication, 2004-present). |
Michael E. Wiley (60) |
| Year of Election or Appointment: 2008 Mr. Wiley also serves as a Director of Asia Pacific Exploration Consolidated (international oil and gas exploration and production, 2008-present). Mr. Wiley serves as a Director of Tesoro Corporation (independent oil refiner and marketer, 2005-present), and a Director of Bill Barrett Corporation (exploration and production, 2005-present). In addition, Mr. Wiley also serves as a Director of Post Oak Bank (privately-held bank, 2004-present). Previously, Mr. Wiley served as a member of the Board of Trustees of the University of Tulsa (2000-2006; 2007-2010), as a Senior Energy Advisor of Katzenbach Partners, LLC (consulting, 2006-2007), as an Advisory Director of Riverstone Holdings (private investment), Chairman, President, and CEO of Baker Hughes, Inc. (oilfield services, 2000-2004), and as Director of Spinnaker Exploration Company (exploration and production, 2001-2005). |
+ The information above includes each Trustee's principal occupation during the last five years and other information relating to the experience, attributes, and skills relevant to each Trustee's qualifications to serve as a Trustee, which led to the conclusion that each Trustee should serve as a Trustee for each fund.
Annual Report
Trustees and Officers - continued
Advisory Board Member and Executive Officers:
Correspondence intended for each executive officer, and Peter S. Lynch may be sent to Fidelity Investments, 82 Devonshire Street, Boston, Massachusetts 02109.
Name, Age; Principal Occupation |
Peter S. Lynch (66) |
| Year of Election or Appointment: 2003 Member of the Advisory Board of Fidelity's Equity and High Income Funds. Mr. Lynch is Vice Chairman and a Director of FMR and FMR Co., Inc. In addition, Mr. Lynch serves as a Trustee of Boston College and as the Chairman of the Inner-City Scholarship Fund. Previously, Mr. Lynch served on the Special Olympics International Board of Directors (1997-2006). |
Kenneth B. Robins (41) |
| Year of Election or Appointment: 2008 President and Treasurer of Fidelity's Equity and High Income Funds. Mr. Robins also serves as President and Treasurer (2010-
present) and Assistant Treasurer (2009-present) of other Fidelity funds and is an employee of Fidelity Investments (2004-present). Previously, Mr. Robins served as Deputy Treasurer of the Fidelity funds (2005-2008) and Treasurer and Chief Financial Officer of The North Carolina Capital Management Trust: Cash and Term Portfolios (2006-2008). |
Bruce T. Herring (45) |
| Year of Election or Appointment: 2006 Vice President of certain Equity Funds. Mr. Herring also serves as Chief Investment Officer and Director of Fidelity Management & Research (U.K.) Inc. (2010-present) and Group Chief Investments Officer of FMR. Previously, Mr. Herring served as Vice President (2005-2006) and Senior Vice President (2006-2007) of Fidelity Management & Research Company, Vice President of FMR Co., Inc. (2001-2007) and as a portfolio manager for Fidelity U.S. Equity Funds. |
Brian B. Hogan (46) |
| Year of Election or Appointment: 2009 Vice President of certain Equity Funds and Vice President of Sector Funds. Mr. Hogan also serves as President of FMR's Equity Division (2009-present). Previously, Mr. Hogan served as Senior Vice President, Equity Research of FMR (2006-2009) and as a portfolio manager. |
Scott C. Goebel (42) |
| Year of Election or Appointment: 2008 Secretary and Chief Legal Officer (CLO) of the Fidelity funds. Mr. Goebel also serves as Secretary and CLO of The North Carolina Capital Management Trust: Cash and Term Portfolio (2008-present); General Counsel, Secretary, and Senior Vice President of FMR (2008-present) and FMR Co., Inc. (2008-present); Deputy General Counsel of FMR LLC; Chief Legal Officer of Fidelity Management & Research (Hong Kong) Limited (2008-present) and Assistant Secretary of Fidelity Management & Research (Japan) Inc. (2008-present), Fidelity Investments Money Management, Inc. (2008-present), Fidelity Management & Research (U.K.) Inc. (2008-present), and Fidelity Research and Analysis Company (2008-present). Previously, Mr. Goebel served as Assistant Secretary of the Funds (2007-2008) and as Vice President and Secretary of Fidelity Distributors Corporation (FDC) (2005-2007). |
William C. Coffey (41) |
| Year of Election or Appointment: 2009 Assistant Secretary of Fidelity's Equity and High Income Funds. Mr. Coffey also serves as Senior Vice President and Deputy General Counsel of FMR LLC (2010-present), and is an employee of Fidelity Investments. Previously, Mr. Coffey served as Vice President and Associate General Counsel of FMR LLC (2005-2009). |
Holly C. Laurent (56) |
| Year of Election or Appointment: 2008 Anti-Money Laundering (AML) Officer of the Fidelity funds. Ms. Laurent also serves as AML Officer of The North Carolina Capital Management Trust: Cash and Term Portfolio (2008-present) and is an employee of Fidelity Investments. Previously, Ms. Laurent was Senior Vice President and Head of Legal for Fidelity Business Services India Pvt. Ltd. (2006-2008), and Senior Vice President, Deputy General Counsel and Group Head for FMR LLC (2005-2006). |
Christine Reynolds (52) |
| Year of Election or Appointment: 2008 Chief Financial Officer of the Fidelity funds. Ms. Reynolds became President of Fidelity Pricing and Cash Management Services (FPCMS) in August 2008. Ms. Reynolds served as Chief Operating Officer of FPCMS (2007-2008). Previously, Ms. Reynolds served as President, Treasurer, and Anti-Money Laundering officer of the Fidelity funds (2004-2007). |
Kenneth A. Rathgeber (63) |
| Year of Election or Appointment: 2004 Chief Compliance Officer of Fidelity's Equity and High Income Funds. Mr. Rathgeber is Chief Compliance Officer of Fidelity Management & Research (Hong Kong) Limited (2008-present), Fidelity Management & Research (Japan) Inc. (2008-present), FMR (2005-present), FMR Co., Inc. (2005-present), Fidelity Management & Research (U.K.) Inc. (2005-present), Fidelity Research & Analysis Company (2005-present), Fidelity Investments Money Management, Inc. (2005-present), Pyramis Global Advisors, LLC (2005-present), and Strategic Advisers, Inc. (2005-present). |
Jeffrey S. Christian (49) |
| Year of Election or Appointment: 2009 Deputy Treasurer of the Fidelity funds. Mr. Christian is an employee of Fidelity Investments. Previously, Mr. Christian served as Chief Financial Officer (2008-2009) of certain Fidelity funds and Senior Vice President of Fidelity Pricing and Cash Management Services (FPCMS) (2004-2009). |
Bryan A. Mehrmann (49) |
| Year of Election or Appointment: 2005 Deputy Treasurer of the Fidelity funds. Mr. Mehrmann is an employee of Fidelity Investments. |
Adrien E. Deberghes (43) |
| Year of Election or Appointment: 2008 Deputy Treasurer of Fidelity's Equity and High Income Funds. Mr. Deberghes also serves as Assistant Treasurer of other Fidelity funds (2010-present) and is an employee of Fidelity Investments (2008-present). Previously, Mr. Deberghes served as Senior Vice President of Mutual Fund Administration at State Street Corporation (2007-2008), Senior Director of Mutual Fund Administration at Investors Bank & Trust (2005-2007), and Director of Finance for Dunkin' Brands (2000-2005). |
Stephanie J. Dorsey (41) |
| Year of Election or Appointment: 2010 Assistant Treasurer of Fidelity's Equity and High Income Funds. Ms. Dorsey also serves as Deputy Treasurer of other Fidelity funds (2008-present) and is an employee of Fidelity Investments (2008-present). Previously, Ms. Dorsey served as Treasurer (2004-2008) of the JPMorgan Mutual Funds and Vice President (2004-2008) of JPMorgan Chase Bank. |
John R. Hebble (52) |
| Year of Election or Appointment: 2009 Assistant Treasurer of Fidelity's Equity and High Income Funds. Mr. Hebble also serves as Treasurer and Chief Financial Officer of The North Carolina Capital Management Trust: Cash and Term Portfolio (2008-present), President and Treasurer of other Fidelity funds (2008-present) and is an employee of Fidelity Investments. |
Gary W. Ryan (52) |
| Year of Election or Appointment: 2005 Assistant Treasurer of the Fidelity funds. Mr. Ryan is an employee of Fidelity Investments. Previously, Mr. Ryan served as Vice President of Fund Reporting in Fidelity Pricing and Cash Management Services (FPCMS) (1999-2005). |
Jonathan Davis (42) |
| Year of Election or Appointment: 2010 Assistant Treasurer of the Fidelity funds. Mr. Davis is an employee of Fidelity Investments. Previously, Mr. Davis served as Vice President and Associate General Counsel of FMR LLC (2003-2010). |
Annual Report
The Board of Trustees of Fidelity Diversified International Fund voted to pay on December 6, 2010 to shareholders of record at the opening of business on December 3, 2010, the following distributions per share derived from capital gains realized from sales of portfolio securities and dividends derived from net investment income:
| Pay Date | Record Date | Dividends | Capital Gains |
Class F | 12/06/10 | 12/03/10 | $0.445 | $0.081 |
Class F designates 100% of the dividends distributed during the fiscal year as amounts which may be taken into account as a dividend for the purposes of the maximum rate under section 1(h)(11) of the Internal Revenue Code.
The amounts per share which represent income derived from sources within, and taxes paid to, foreign countries or possessions of the United States are as follows:
| Pay Date | Income | Taxes |
Class F | 12/07/2009 | $0.352 | $0.031 |
The fund will notify shareholders in January 2011 of amounts for use in preparing 2010 income tax returns.
Annual Report
Board Approval of Investment Advisory Contracts and Management Fees
Fidelity Diversified International Fund
Each year, the Board of Trustees, including the Independent Trustees (together, the Board), votes on the renewal of the management contract and sub-advisory agreements (together, the Advisory Contracts) for the fund. The Board, assisted by the advice of fund counsel and Independent Trustees' counsel, requests and considers a broad range of information relevant to the renewal of the Advisory Contracts throughout the year.
The Board meets regularly and considers at each of its meetings factors that are relevant to its annual consideration of the renewal of the fund's Advisory Contracts, including the services and support provided to the fund and its shareholders. The Board has established various standing committees, each composed of Independent Trustees with varying backgrounds, to which the Board has assigned specific subject matter responsibilities in order to enhance effective decision-making by the Board. The Board, acting directly and through its Committees, requests and receives information concerning the annual consideration of the renewal of the fund's Advisory Contracts. The Board also meets as needed to consider matters specifically related to the Board's annual consideration of the renewal of Advisory Contracts. Members of the Board may also meet with trustees of other Fidelity funds through ad hoc joint committees to discuss certain matters relevant to the Fidelity funds.
At its July 2010 meeting, the Board of Trustees, including the Independent Trustees, unanimously determined to renew the fund's Advisory Contracts. In reaching its determination, the Board considered all factors it believed relevant, including (i) the nature, extent, and quality of the services to be provided to the fund and its shareholders (including the investment performance of the fund); (ii) the competitiveness of the fund's management fee and total expenses; (iii) the total costs of the services to be provided by and the profits to be realized by Fidelity from its relationship with the fund; (iv) the extent to which economies of scale would be realized as the fund grows; and (v) whether fee levels reflect these economies of scale, if any, for the benefit of fund shareholders.
In considering whether to renew the Advisory Contracts for the fund, the Board reached a determination, with the assistance of fund counsel and Independent Trustees' counsel and through the exercise of its business judgment, that the renewal of the Advisory Contracts is in the best interests of fund shareholders and that the compensation to be received by Fidelity under the management contract is fair and reasonable. The Board's decision to renew the Advisory Contracts was not based on any single factor noted above, but rather was based on a comprehensive consideration of all the information provided to the Board at its meetings throughout the year. The Board, in reaching its determination to renew the Advisory Contracts, is aware that shareholders in the fund have a broad range of investment choices available to them, including a wide choice among mutual funds offered by Fidelity's competitors, and that the fund's shareholders, with the opportunity to review and weigh the disclosure provided by the fund in its prospectus and other public disclosures, have chosen to invest in this fund, managed by Fidelity.
Nature, Extent, and Quality of Services Provided. The Board considered the staffing within the investment adviser, FMR, and the sub-advisers (together, the Investment Advisers), including the backgrounds of the fund's investment personnel and the fund's investment objective and discipline. The Independent Trustees also had discussions with senior management of Fidelity's investment operations and investment groups. The Board considered the structure of the portfolio manager compensation program and whether this structure provides appropriate incentives to act in the best interest of the fund.
Resources Dedicated to Investment Management and Support Services. The Board and the equity research subcommittee of the Board's Fund Oversight Committee reviewed the size, education, and experience of the Investment Advisers' investment staff, their use of technology, and the Investment Advisers' approach to recruiting, training, and retaining portfolio managers and other research, advisory, and management personnel. The Board noted that Fidelity's analysts have access to a variety of technological tools and market and securities data that enable them to perform both fundamental and quantitative analysis and to specialize in various disciplines. The Board considered Fidelity's extensive global research capabilities that enable the Investment Advisers to aggregate data from various sources in an effort to produce positive investment results. The Board also considered that Fidelity's portfolio managers and analysts have access to daily portfolio attribution that allows for monitoring of a fund's portfolio, as well as an electronic communication system that provides immediate real-time access to research concerning issuers and credit enhancers. The Board noted FMR's continued focus on strengthening the organization and discipline of equity portfolio management and research.
Shareholder and Administrative Services. The Board considered (i) the nature, extent, quality, and cost of advisory, administrative, and shareholder services performed by the Investment Advisers and their affiliates under the Advisory Contracts and under separate agreements covering transfer agency, pricing and bookkeeping, and securities lending services for the fund; (ii) the nature and extent of the investment adviser's supervision of third party service providers, principally custodians and subcustodians; and (iii) the resources devoted to, and the record of compliance with, the fund's compliance policies and procedures. The Board also reviewed the allocation of fund brokerage, including allocations to brokers affiliated with the Investment Advisers, the use of brokerage commissions to pay fund expenses, and the use of "soft" commission dollars to pay for research services.
The Board noted that the growth of fund assets over time across the complex allows Fidelity to reinvest in the development of services designed to enhance the value or convenience of the Fidelity funds as investment vehicles. These services include 24-hour access to account information and market information through phone representatives and over the Internet, and investor education materials and asset allocation tools.
Investment in a Large Fund Family. The Board considered the benefits to shareholders of investing in a Fidelity fund, including the benefits of investing in a fund that is part of a large family of funds offering a variety of investment disciplines and providing a large variety of mutual fund investor services. The Board noted that Fidelity had taken, or had made recommendations that resulted in the Fidelity funds taking, a number of actions over the previous year that benefited particular funds, including (i) dedicating additional resources to investment research and restructuring and broadening the focus of the investment research teams; (ii) bolstering the senior management team that oversees asset management; (iii) launching Class F of certain funds as a lower-fee class available to Freedom K and Freedom Index Funds; (iv) lowering the initial investment minimums and ongoing balance requirements for Real Estate High Income Fund; (v) eliminating subsequent purchase minimums for all funds and adding a waiver of the investment minimum requirement for new accounts opened with the proceeds of a systematic withdrawal plan; (vi) eliminating the withdrawal minimum and maximum limits for systematic withdrawals from Advisor funds; (vii) expanding sales load waivers on Class A shares for Destiny Planholders and expanding Institutional Class eligibility for Class O Destiny Planholders; and (viii) changing certain Class A and Class T sales charge structures to further align them with industry practices.
Annual Report
Board Approval of Investment Advisory Contracts and Management Fees - continued
Investment Performance. The Board considered whether the fund has operated in accordance with its investment objective, as well as its record of compliance with its investment restrictions. It also reviewed the fund's absolute investment performance for each class (except Class F), as well as the fund's relative investment performance for each class (except Class F) measured over multiple periods against (i) a broad-based securities market index, and (ii) a peer group of mutual funds deemed appropriate by Fidelity and reviewed by the Board. The following charts considered by the Board show, over the one-, three-, and five-year periods ended December 31, 2009, the cumulative total returns of Class K and the retail class of the fund, the cumulative total returns of a broad-based securities market index ("benchmark"), and a range of cumulative total returns of a peer group of mutual funds identified by Morningstar, Inc. as having an investment style similar to that of the fund based on underlying portfolio holdings. (Class F of the fund had less than one year of performance as of December 31, 2009.) The box within each chart shows the 25th percentile return (bottom of box) and the 75th percentile return (top of box) of the peer group. Returns shown above the box are in the first quartile and returns shown below the box are in the fourth quartile. The percentage beaten numbers noted below each chart correspond to the percentile box and represent the percentage of funds in the peer group whose performance was equal to or lower than that of the class indicated.
Fidelity Diversified International Fund
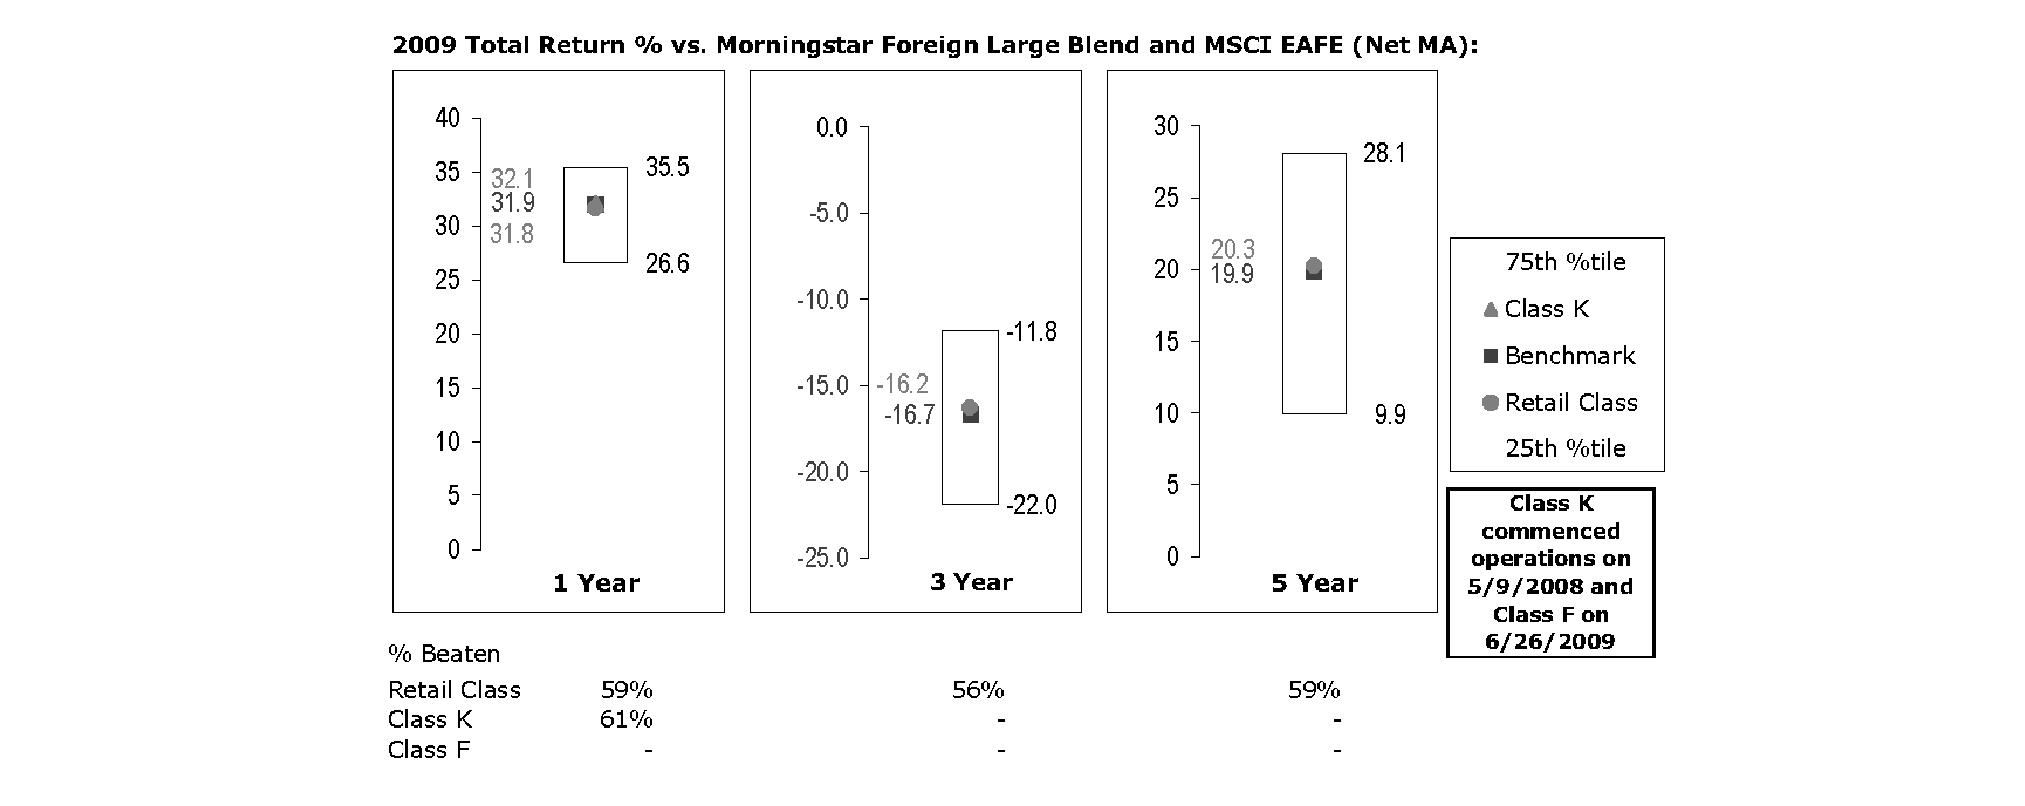
The Board reviewed the fund's relative investment performance against its peer group and noted that the performance of the retail class of the fund (the class with the longer performance record) was in the second quartile for all the periods shown. The Board also noted that the investment performance of the retail class of the fund compared favorably to its benchmark for the three- and five-year periods, although the one-year cumulative total return of the retail class of the fund was lower than its benchmark. The Board considered that the variations in performance between the fund's classes reflect the variations in class expenses, which result in lower performance for the higher expense class. The Board also reviewed the fund's performance since inception as well as performance in the current year.
The Board also considered that the fund's management fee is subject to upward or downward adjustment depending upon whether, and to what extent, the fund's investment performance for the performance period exceeds, or is exceeded by, the record (over the same period) of a Board-approved performance adjustment index. The Board realizes that the performance adjustment provides FMR with a strong economic incentive to seek to achieve superior performance for the fund's shareholders and helps to more closely align the interests of FMR and the fund's shareholders.
Based on its review, and giving particular weight to the nature and quality of the resources dedicated by the Investment Advisers to maintain and improve relative performance and factoring in the unprecedented market events in recent years, the Board concluded that the nature, extent, and quality of investment management and support services and of shareholder and administrative services provided to the fund will benefit the fund's shareholders, particularly in light of the Board's view that the fund's shareholders benefit from investing in a fund that is part of a large family of funds offering a variety of investment disciplines and services.
Annual Report
Competitiveness of Management Fee and Total Fund Expenses. The Board considered the fund's management fee and total expenses compared to "mapped groups" of competitive funds and classes. Fidelity creates "mapped groups" by combining similar Lipper investment objective categories that have comparable management fee characteristics. Combining Lipper investment objective categories aids the Board's management fee and total expense comparisons by broadening the competitive group used for comparison and by reducing the number of universes to which various Fidelity funds are compared.
Management Fee. The Board considered two proprietary management fee comparisons for the 12-month periods shown in the chart below. The group of Lipper funds used by the Board for management fee comparisons is referred to below as the "Total Mapped Group." The Total Mapped Group comparison focuses on a fund's standing relative to the total universe of comparable funds available to investors, in terms of gross management fees before expense reimbursements or caps, and without giving effect to the fund's performance adjustment. "TMG %" represents the percentage of funds in the Total Mapped Group that had management fees that were lower than the fund's. For example, a TMG % of 15% means that 85% of the funds in the Total Mapped Group had higher management fees than the fund. The "Asset-Size Peer Group" (ASPG) comparison focuses on a fund's standing relative to non-Fidelity funds similar in size to the fund within the Total Mapped Group. The ASPG represents at least 15% of the funds in the Total Mapped Group with comparable asset size and management fee characteristics, subject to a minimum of 50 funds (or all funds in the Total Mapped Group if fewer than 50). Additional information, such as the ASPG quartile in which the fund's management fee ranked and the impact of the fund's performance adjustment, is also included in the chart and considered by the Board.
Fidelity Diversified International Fund
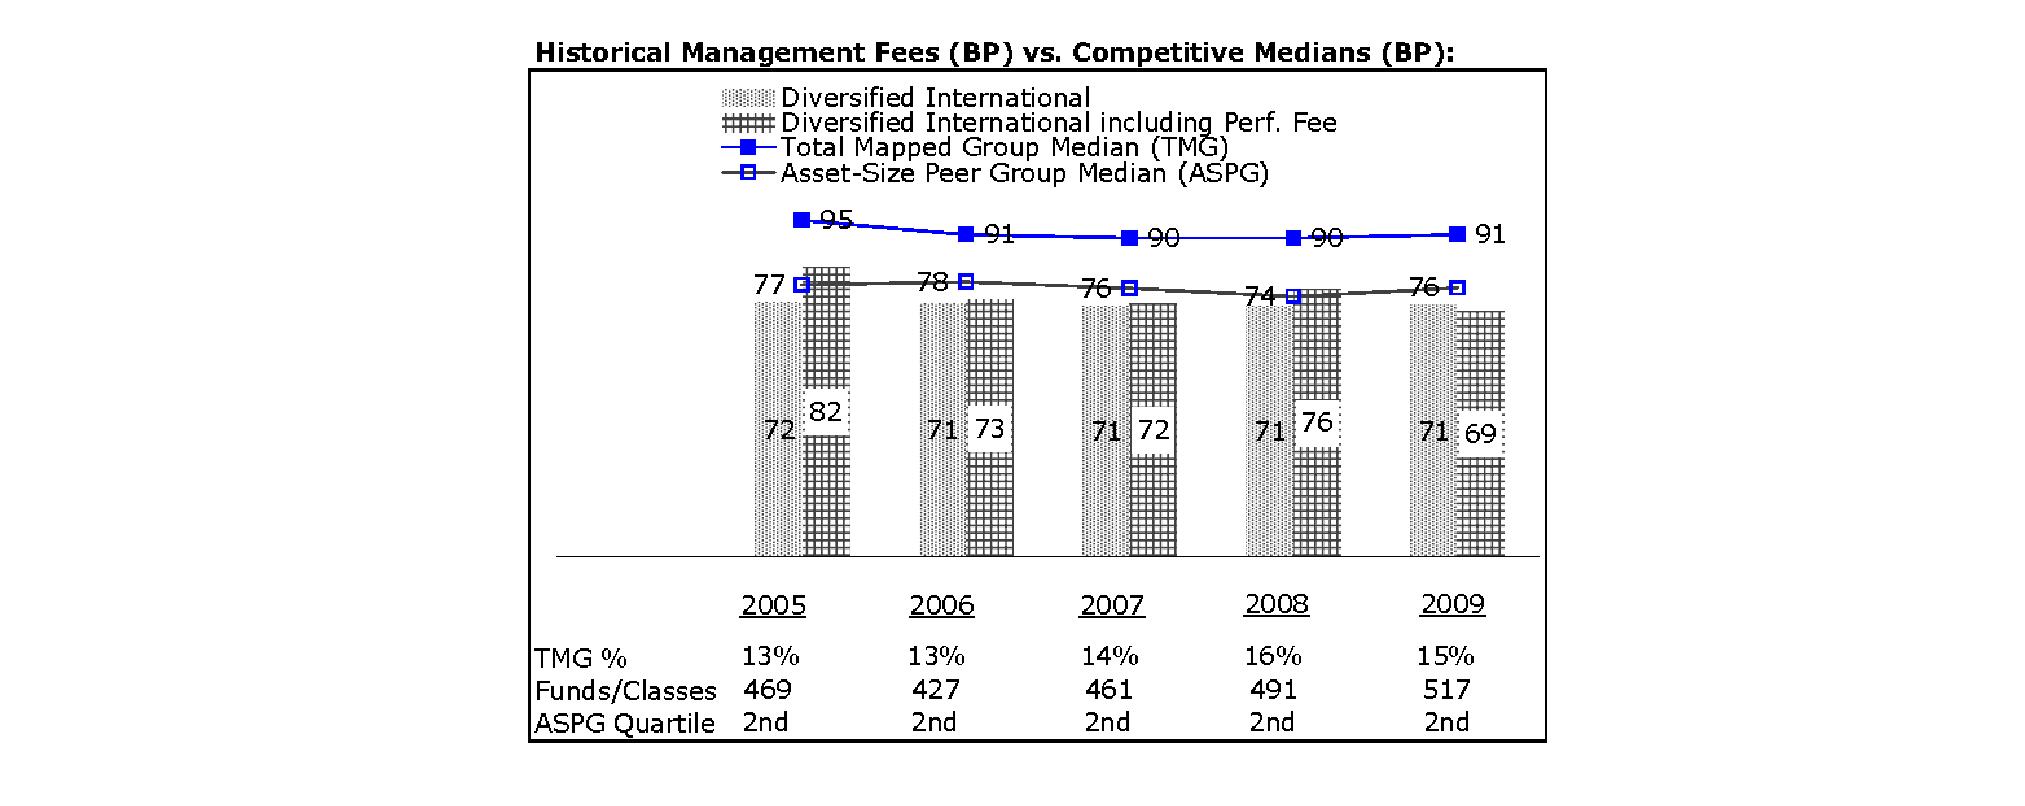
The Board noted that the fund's management fee ranked below the median of its Total Mapped Group and below the median of its ASPG for 2009. The Board also noted the effect of the fund's negative performance adjustment on the fund's management fee ranking. The Board noted that the performance adjustment for each year represents calculations for performance periods that differ from the periods shown in the performance charts above.
Based on its review, the Board concluded that the fund's management fee is fair and reasonable in light of the services that the fund receives and the other factors considered.
Total Expenses. In its review of each class's total expenses, the Board considered the fund's management fee as well as other fund or class expenses, as applicable, such as transfer agent fees, pricing and bookkeeping fees, and custodial, legal, and audit fees. The Board also noted the effects of any waivers and reimbursements on fees and expenses, as well as the impact of the fund's performance adjustment. As part of its review, the Board also considered current and historical total expenses of each class of the fund compared to competitive fund median expenses. Each class of the fund is compared to those funds and classes in the Total Mapped Group (used by the Board for management fee comparisons) that have a similar sales load structure.
The Board noted that the total expenses of each class ranked below its competitive median for the period.
Fees Charged to Other Fidelity Clients. The Board also considered Fidelity fee structures and other information with respect to clients of FMR and its affiliates, such as other mutual funds advised or subadvised by FMR or its affiliates, pension plan clients, and other institutional clients. In March 2010, the Board created an ad hoc joint committee with the board of other Fidelity funds (the Committee) to review and compare Fidelity's institutional investment advisory business with its business of providing services to the Fidelity funds, including the differences in services provided, fees charged, and costs incurred, as well as competition in their respective marketplaces.
Annual Report
Board Approval of Investment Advisory Contracts and Management Fees - continued
Based on its review of total expenses and fees charged to other Fidelity clients, the Board concluded that the total expenses of each class of the fund were reasonable in light of the services that the fund and its shareholders receive and the other factors considered, including the findings of the Committee.
Costs of the Services and Profitability. The Board considered the revenues earned and the expenses incurred by Fidelity in conducting the business of developing, marketing, distributing, managing, administering and servicing the fund and its shareholders. The Board also considered the level of Fidelity's profits in respect of all the Fidelity funds.
On an annual basis, FMR presents to the Board Fidelity's profitability for the fund. Fidelity calculates the profitability for each fund, as well as aggregate profitability for groups of Fidelity funds and all Fidelity funds, using a series of detailed revenue and cost allocation methodologies which originate with the audited books and records of Fidelity. The Audit Committee of the Board reviews any significant changes from the prior year's methodologies.
PricewaterhouseCoopers LLP (PwC), independent registered public accounting firm and auditor to Fidelity and certain Fidelity funds, has been engaged annually by the Board as part of the Board's assessment of Fidelity's profitability analysis. PwC's engagement includes the review and assessment of Fidelity's methodologies used in determining the revenues and expenses attributable to Fidelity's mutual fund business, and completion of agreed-upon procedures surrounding the mathematical accuracy of fund profitability and its conformity to allocation methodologies. After considering PwC's reports issued under the engagement and information provided by Fidelity, the Board believes that while other allocation methods may also be reasonable, Fidelity's profitability methodologies are reasonable in all material respects.
The Board has also reviewed Fidelity's non-fund businesses and fall-out benefits related to the mutual fund business as well as cases where Fidelity's affiliates may benefit from or be related to the fund's business.
The Board considered the costs of the services provided by and the profits realized by Fidelity in connection with the operation of the fund and were satisfied that the profitability was not excessive in the circumstances.
Economies of Scale. The Board considered whether there have been economies of scale in respect of the management of the Fidelity funds, whether the Fidelity funds (including the fund) have appropriately benefited from any such economies of scale, and whether there is potential for realization of any further economies of scale. The Board considered the extent to which the fund will benefit from economies of scale through increased services to the fund, through waivers or reimbursements, or through fee or expense reductions.
In February 2009, the Board and the board of other Fidelity funds created an ad hoc committee (the Economies of Scale Committee) to analyze whether FMR attains economies of scale in respect of the management and servicing of the Fidelity funds, whether the Fidelity funds have appropriately benefited from such economies of scale, and whether there is potential for realization of any further economies of scale.
The Board recognized that the fund's management contract incorporates a "group fee" structure, which provides for lower group fee rates as total fund assets under FMR's management increase, and for higher group fee rates as total fund assets under FMR's management decrease. FMR calculates the group fee rates based on a tiered asset "breakpoint" schedule that varies based on asset class. The Board considered that the group fee is designed to deliver the benefits of economies of scale to fund shareholders when total Fidelity fund assets increase, even if assets of any particular fund are unchanged or have declined, because some portion of Fidelity's costs are attributable to services provided to all Fidelity funds, and all funds benefit if those costs can be allocated among more assets. The Board concluded that, given the group fee structure, fund shareholders will benefit from lower management fees as assets under FMR's management increase at the fund complex level, regardless of whether Fidelity achieves any such economies of scale.
The Board concluded, considering the findings of the Economies of Scale Committee, that any potential economies of scale are being appropriately shared between fund shareholders and Fidelity.
Additional Information Requested by the Board. In order to develop fully the factual basis for consideration of the Fidelity funds' Advisory Contracts, the Board requested and received additional information on certain topics, including (i) fund performance trends, actions to be taken by FMR to improve certain funds' overall performance, and Fidelity's long-term strategies for certain funds; (ii) portfolio manager changes that have occurred during the past year and length of portfolio manager tenure for different categories of funds over time; (iii) Fidelity's compensation structure for portfolio managers, research analysts, and other key personnel, the rationale for the compensation structure, and how the compensation structure provides appropriate performance incentives; (iv) the amount of the investment that each portfolio manager has made in the Fidelity fund(s) that he or she manages; (v) management and other fees paid by FMR to affiliated sub-advisers on behalf of the Fidelity funds; (vi) Fidelity's fee structures and rationale for recommending different fees among different categories of funds; (vii) Fidelity's rationale for recommending which funds should have a performance adjustment component as part of their management fees; (viii) the rationale for any differences between fund fee structures and fee structures in place for other Fidelity clients; and (ix) explanations regarding the relative total expenses borne by certain funds and classes, total expense competitive trends, and actions that might be taken by FMR to reduce total expenses for certain funds and classes.
Annual Report
Based on its evaluation of all of the conclusions noted above, and after considering all factors it believed relevant, the Board ultimately concluded that the advisory fee structures are fair and reasonable, and that the fund's Advisory Contracts should be renewed.
Annual Report
Managing Your Investments
Fidelity offers several ways to conveniently manage your workplace benefits (including your workplace savings plan, investments, and additional services) via your telephone or PC. You can access your plan and account information and research your investments 24 hours a day.
By Phone
Fidelity provides a single toll-free number to access plan information, account balances, positions, and quotes*. It's easy to navigate the service, and on your first call, the system will help you create a personal identification number (PIN) for security.
(phone_graphic)
Fidelity Workplace Investing
1-800-835-5092
By PC
Fidelity's web site on the Internet provides a wide range of information, including plan information, daily financial news, fund performance, interactive planning tools, and news about Fidelity products and services.
(computer_graphic)
Fidelity's Web Site
www.401k.com
* When you call the quotes line, please remember that a fund's yield and return will vary and, except for money market funds, share price will also vary. This means that you may have a gain or loss when you sell your shares. There is no assurance that money market funds will be able to maintain a stable $1 share price; an investment in a money market fund is not insured or guaranteed by the U.S. government. Total returns are historical and include changes in share price, reinvestment of dividends and capital gains, and the effects of any sales charges.
Annual Report
Investment Adviser
Fidelity Management & Research Company
Boston, MA
Investment Sub-Advisers
FMR Co., Inc.
Fidelity Management & Research (U.K.) Inc.
Fidelity Management & Research
(Hong Kong) Limited
Fidelity Management & Research
(Japan) Inc.
Fidelity Research & Analysis Company
General Distributor
Fidelity Distributors Corporation
Boston, MA
Transfer and Service Agents
Fidelity Investments Institutional
Operations Company, Inc.
Boston, MA
Fidelity Service Company, Inc.
Boston, MA
Custodian
JPMorgan Chase Bank
New York, NY
DIF-F-ANN-1210
1.891706.101

Fidelity®
Diversified International
Fund -
Class K
Annual Report
October 31, 2010
(2_fidelity_logos) (Registered_Trademark)
Contents
Chairman's Message | <Click Here> | The Chairman's message to shareholders. |
Performance | <Click Here> | How the fund has done over time. |
Management's Discussion of Fund Performance | <Click Here> | The Portfolio Manager's review of fund performance and strategy. |
Shareholder Expense Example | <Click Here> | An example of shareholder expenses. |
Investment Changes | <Click Here> | A summary of major shifts in the fund's investments over the past six months. |
Investments | <Click Here> | A complete list of the fund's investments with their market values. |
Financial Statements | <Click Here> | Statements of assets and liabilities, operations, and changes in net assets, as well as financial highlights. |
Notes | <Click Here> | Notes to the financial statements. |
Report of Independent Registered Public Accounting Firm | <Click Here> | |
Trustees and Officers | <Click Here> | |
Distributions | <Click Here> | |
Board Approval of Investment Advisory Contracts and Management Fees | <Click Here> | |
To view a fund's proxy voting guidelines and proxy voting record for the 12-month period ended June 30, visit http://www.fidelity.com/proxyvotingresults or visit the Securities and Exchange Commission's (SEC) web site at http://www.sec.gov. You may also call 1-800-835-5092 to request a free copy of the proxy voting guidelines.
Standard & Poor's, S&P and S&P 500 are registered service marks of The McGraw-Hill Companies, Inc. and have been licensed for use by Fidelity Distributors Corporation.
Other third party marks appearing herein are the property of their respective owners.
All other marks appearing herein are registered or unregistered trademarks or service marks of FMR LLC or an affiliated company.
This report and the financial statements contained herein are submitted for the general information of the shareholders of the fund. This report is not authorized for distribution to prospective investors in the fund unless preceded or accompanied by an effective prospectus.
A fund files its complete schedule of portfolio holdings with the SEC for the first and third quarters of each fiscal year on Form N-Q. Forms N-Q are available on the SEC's web site at http://www.sec.gov. A fund's Forms N-Q may be reviewed and copied at the SEC's Public Reference Room in Washington, DC. Information regarding the operation of the SEC's Public Reference Room may be obtained by calling 1-800-SEC-0330. For a complete list of a fund's portfolio holdings, view the most recent holdings listing, semiannual report, or annual report on Fidelity's web site at http://www.fidelity.com or http://www.advisor.fidelity.com, as applicable.
NOT FDIC INSURED • MAY LOSE VALUE • NO BANK GUARANTEE
Neither the fund nor Fidelity Distributors Corporation is a bank.
Annual Report
(photo_of_Edward_C_Johnson_3d)
Dear Shareholder:
Equities have staged a rally in the second half of 2010, shaking off concerns about the European debt crisis and the possibility of a double-dip recession in the U.S. Although the short-term surge pushed major equity indexes back into positive territory for the year, several questions remain about the longer-term outlook, including lackluster economic growth and persistently high unemployment. Financial markets are always unpredictable, of course, but there also are several time-tested investment principles that can help put the odds in your favor.
One of the basic tenets is to invest for the long term. Over time, riding out the markets' inevitable ups and downs has proven much more effective than selling into panic or chasing the hottest trend. Even missing only a few of the markets' best days can significantly diminish investor returns. Patience also affords the benefits of compounding - of earning interest on additional income or reinvested dividends and capital gains. There can be tax advantages and cost benefits to consider as well. While staying the course doesn't eliminate risk, it can considerably lessen the effect of short-term declines.
You can further manage your investing risk through diversification. And today, more than ever, geographic diversification should be taken into account. Studies indicate that asset allocation is the single most important determinant of a portfolio's long-term success. The right mix of stocks, bonds and cash - aligned to your particular risk tolerance and investment objective - is very important. Age-appropriate rebalancing is also an essential aspect of asset allocation. For younger investors, an emphasis on equities - which historically have been the best-performing asset class over time - is encouraged. As investors near their specific goal, such as retirement or sending a child to college, consideration may be given to replacing volatile assets (e.g. common stocks) with more-stable fixed investments (bonds or savings plans).
A third principle - investing regularly - can help lower the average cost of your purchases. Investing a certain amount of money each month or quarter helps ensure you won't pay for all your shares at market highs. This strategy - known as dollar cost averaging - also reduces "emotion" from investing, helping shareholders avoid selling weak performers just prior to an upswing, or chasing a hot performer just before a correction.
We invite you to contact us via the Internet, through our Investor Centers or by phone. It is our privilege to provide you the information you need to make the investments that are right for you.
Sincerely,
(The chairman's signature appears here.)
Edward C. Johnson 3d
Annual Report
Average annual total return reflects the change in the value of an investment, assuming reinvestment of the class' distributions from dividend income and capital gains (the profits earned upon the sale of securities that have grown in value, if any) and assuming a constant rate of performance each year. The $10,000 table and the fund's returns do not reflect the deduction of taxes that a shareholder would pay on fund distributions or the redemption of fund shares. During periods of reimbursement by Fidelity, a fund's total return will be greater than it would be had the reimbursement not occurred. How a fund did yesterday is no guarantee of how it will do tomorrow.
Average Annual Total Returns
Periods ended October 31, 2010 | Past 1
year | Past 5
years | Past 10
years |
Class K A | 11.33% | 3.44% | 5.68% |
A The initial offering of Class K shares took place on May 9, 2008. Returns prior to May 9, 2008 are those of Fidelity Diversified International Fund, the original class of the fund.
$10,000 Over 10 Years
Let's say hypothetically that $10,000 was invested in Fidelity Diversified International Fund - Class K on October 31, 2000. The chart shows how the value of your investment would have changed, and also shows how the MSCI® EAFE® (Europe, Australasia, Far East) Index performed over the same period. The initial offering of Class K took place on May 9, 2008. See above for additional information regarding the performance of Class K.
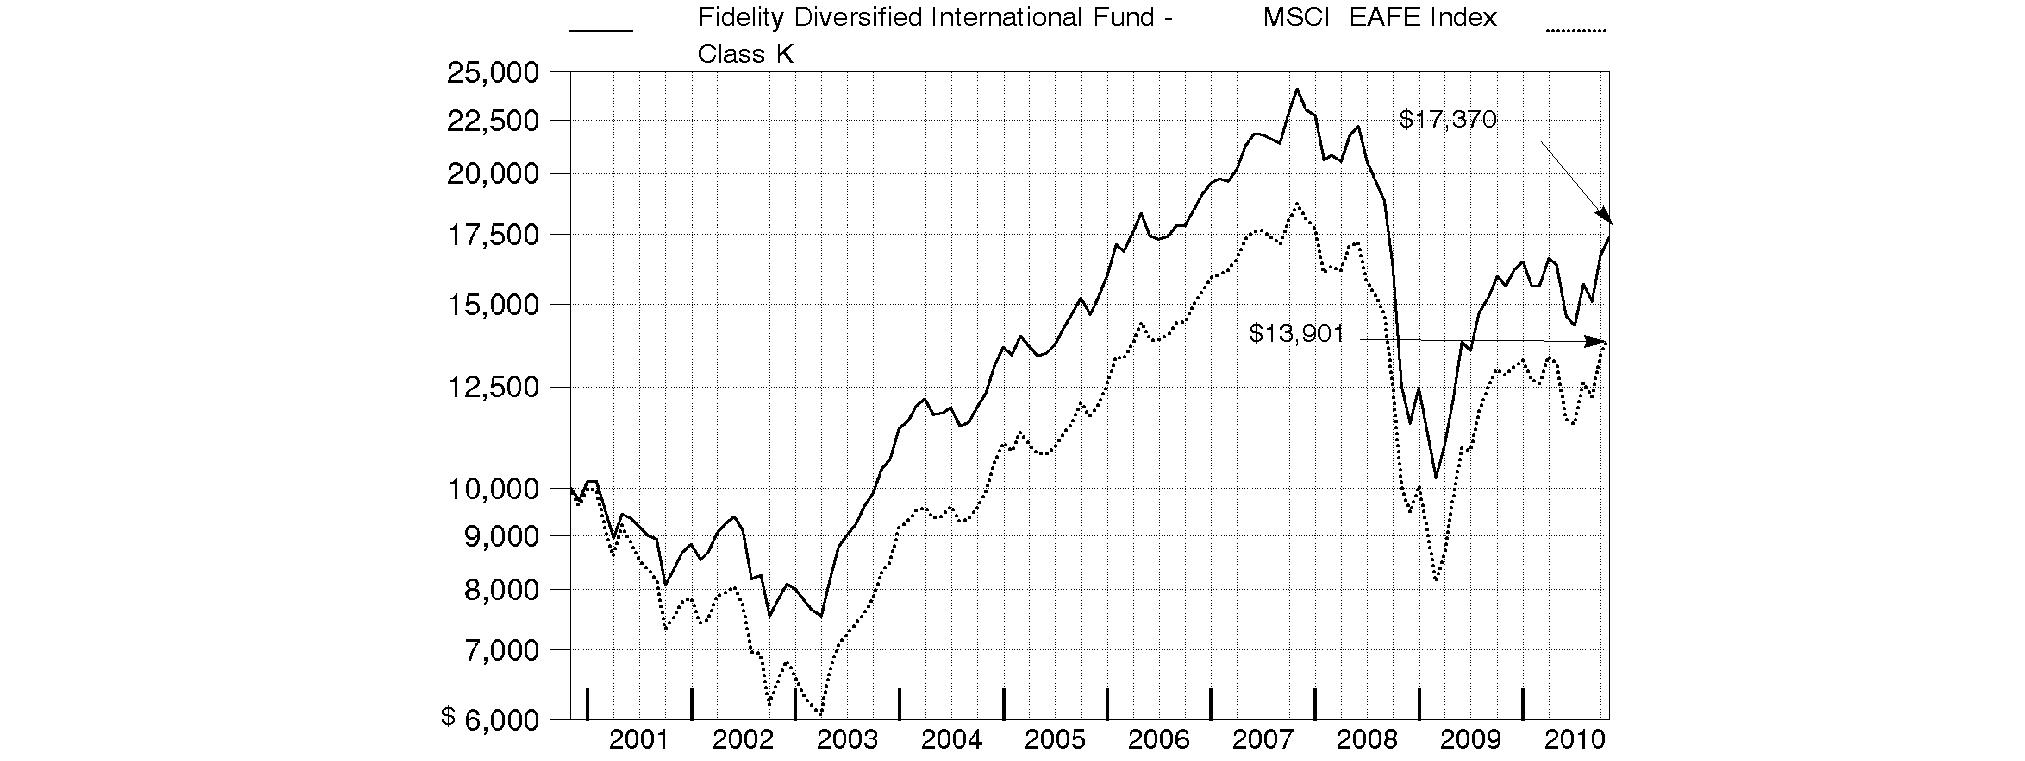
Annual Report
Market Recap: International stocks rode a wave of volatility similar to that of their U.S. counterparts during the 12 months ending October 31, 2010. Stocks gained modestly in the first half of the period, despite growing concerns about the European debt crisis. Sentiment turned decidedly negative in May and June, however, and the market suffered a precipitous decline. These losses were more than offset during the last four months of the period, when signs of economic growth and subsiding debt fears helped propel international stocks about 21%. For the full year, the MSCI® ACWI® (All Country World Index) ex USA Index gained 12.76%, boosted in part by a generally depreciating U.S. dollar. Within the index, Canada and emerging markets were standouts, returning 23% and 24%, respectively. Results in the latter group were led by strong-performing India, Mexico and South Africa, while China fell short of the MSCI benchmark due to cooling economic growth. The developed Asia ex Japan segment rose 16% for the period, lifted by solid results from Singapore and Hong Kong. Meanwhile, Europe rose just 9%, held back mainly by debt-riddled Spain and Italy, as well as lagging major constituent France. Japan returned only 5%, a result of that nation's continued weak economy.
Comments from William Bower, Portfolio Manager of Fidelity® Diversified International Fund: For the year, the fund's Class K shares gained 11.33%, solidly outperforming the 8.49% return of the MSCI EAFE® (Europe, Australasia, Far East) Index. The fund was helped most by strong security selection in the consumer discretionary, materials, technology, financials and health care groups. In terms of countries, my picks in Germany were particularly productive, while underweighting Japan and overweighting China also aided results. Individual contributors included Danish pharmaceutical company Novo Nordisk, German automakers Volkswagen - since sold - and BMW, two out-of-benchmark positions - Chinese Internet search provider Baidu and Taiwanese smart phone manufacturer HTC - German medical equipment company Fresenius and French holding company PPR. Conversely, underweighting industrials hurt, as did overweighting energy. Geographically, unfavorable stock selection in the United Kingdom and China curtailed results. At the issuer level, detractors included out-of-index energy company Transocean, Spanish telecommunications company Telefonica, an out-of-benchmark investment in Canadian energy firm Petrobank Energy & Resources, not owning French luxury goods and index component Richemont and a since-sold position in Swiss pharmaceutical firm Actelion.
The views expressed above reflect those of the portfolio manager(s) only through the end of the period as stated on the cover of this report and do not necessarily represent the views of Fidelity or any other person in the Fidelity organization. Any such views are subject to change at any time based upon market or other conditions and Fidelity disclaims any responsibility to update such views. These views may not be relied on as investment advice and, because investment decisions for a Fidelity fund are based on numerous factors, may not be relied on as an indication of trading intent on behalf of any Fidelity fund.
Annual Report
Fidelity Diversified International Fund
As a shareholder of the Fund, you incur two types of costs: (1) transaction costs, including redemption fees, and (2) ongoing costs, including management fees and other Fund expenses. This Example is intended to help you understand your ongoing costs (in dollars) of investing in the Fund and to compare these costs with the ongoing costs of investing in other mutual funds.
The Example is based on an investment of $1,000 invested at the beginning of the period and held for the entire period (May 1, 2010 to October 31, 2010).
Actual Expenses
The first line of the accompanying table for each class of the Fund provides information about actual account values and actual expenses. You may use the information in this line, together with the amount you invested, to estimate the expenses that you paid over the period. Simply divide your account value by $1,000.00 (for example, an $8,600 account value divided by $1,000.00 = 8.6), then multiply the result by the number in the first line for a class of the Fund under the heading entitled "Expenses Paid During Period" to estimate the expenses you paid on your account during this period. A small balance maintenance fee of $12.00 that is charged once a year may apply for certain accounts with a value of less than $2,000. This fee is not included in the table below. If it was, the estimate of expenses you paid during the period would be higher, and your ending account value lower, by this amount. In addition, the Fund, as a shareholder in the underlying Fidelity Central Funds, will indirectly bear its pro-rata share of the fees and expenses incurred by the underlying Fidelity Central Funds. These fees and expenses are not included in the Fund's annualized expense ratio used to calculate the expense estimate in the table below.
Hypothetical Example for Comparison Purposes
The second line of the accompanying table for each class of the Fund provides information about hypothetical account values and hypothetical expenses based on a Class' actual expense ratio and an assumed rate of return of 5% per year before expenses, which is not the Class' actual return. The hypothetical account values and expenses may not be used to estimate the actual ending account balance or expenses you paid for the period. You may use this information to compare the ongoing costs of investing in the Fund and other funds. To do so, compare this 5% hypothetical example with the 5% hypothetical examples that appear in the shareholder reports of the other funds. A small balance maintenance fee of $12.00 that is charged once a year may apply for certain accounts with a value of less than $2,000. This fee is not included in the table below. If it was, the estimate of expenses you paid during the period would be higher, and your ending account value lower, by this amount. In addition, the Fund, as a shareholder in the underlying Fidelity Central Funds, will indirectly bear its pro-rata share of the fees and expenses incurred by the underlying Fidelity Central Funds. These fees and expenses are not included in the Fund's annualized expense ratio used to calculate the expense estimate in the table below.
Please note that the expenses shown in the table are meant to highlight your ongoing costs only and do not reflect any transaction costs. Therefore, the second line of the table is useful in comparing ongoing costs only, and will not help you determine the relative total costs of owning different funds. In addition, if these transactional costs were included, your costs would have been higher.
| Annualized
Expense Ratio | Beginning
Account Value
May 1, 2010 | Ending
Account Value
October 31, 2010 | Expenses Paid
During Period*
May 1, 2010
to October 31, 2010 |
Diversified International | .96% | | | |
Actual | | $ 1,000.00 | $ 1,062.30 | $ 4.99 |
HypotheticalA | | $ 1,000.00 | $ 1,020.37 | $ 4.89 |
Class K | .78% | | | |
Actual | | $ 1,000.00 | $ 1,063.00 | $ 4.06 |
HypotheticalA | | $ 1,000.00 | $ 1,021.27 | $ 3.97 |
Class F | .73% | | | |
Actual | | $ 1,000.00 | $ 1,063.80 | $ 3.80 |
HypotheticalA | | $ 1,000.00 | $ 1,021.53 | $ 3.72 |
A 5% return per year before expenses
* Expenses are equal to each Class' annualized expense ratio, multiplied by the average account value over the period, multiplied by 184/365 (to reflect the one-half year period).
Annual Report
Fidelity Diversified International Fund
Investment Changes (Unaudited)
Geographic Diversification (% of fund's net assets) |
As of October 31, 2010 |
 | United Kingdom | 18.4% | |
 | Japan | 11.8% | |
 | United States of America | 10.4% | |
 | Germany | 8.1% | |
 | Switzerland | 7.7% | |
 | France | 7.0% | |
 | Canada | 4.3% | |
 | Spain | 3.9% | |
 | Netherlands | 3.2% | |
 | Other | 25.2% | |

Percentages are adjusted for the effect of futures contracts, if applicable. |
As of April 30, 2010 |
| United Kingdom | 17.1% | |
| Japan | 15.1% | |
| United States of America | 10.7% | |
| France | 9.5% | |
| Switzerland | 8.0% | |
| Germany | 7.6% | |
| Spain | 4.2% | |
| Canada | 4.0% | |
| Australia | 2.8% | |
| Other | 21.0% | |

Percentages are adjusted for the effect of futures contracts, if applicable. |
Asset Allocation |
| % of fund's
net assets | % of fund's net assets
6 months ago |
Stocks | 95.9 | 96.9 |
Short-Term Investments and Net Other Assets | 4.1 | 3.1 |
Top Ten Stocks as of October 31, 2010 |
| % of fund's
net assets | % of fund's net assets
6 months ago |
Nestle SA (Switzerland, Food Products) | 2.3 | 1.9 |
BP PLC (United Kingdom, Oil, Gas & Consumable Fuels) | 2.1 | 0.9 |
Royal Dutch Shell PLC Class B ADR (United Kingdom, Oil, Gas & Consumable Fuels) | 2.0 | 1.3 |
Vodafone Group PLC (United Kingdom, Wireless Telecommunication Services) | 1.9 | 1.4 |
BHP Billiton Ltd. sponsored ADR (Australia, Metals & Mining) | 1.7 | 1.3 |
Banco Santander SA sponsored ADR (Spain, Commercial Banks) | 1.5 | 1.2 |
HSBC Holdings PLC (United Kingdom, Commercial Banks) | 1.5 | 2.0 |
Novo Nordisk AS Series B (Denmark, Pharmaceuticals) | 1.4 | 1.1 |
Anheuser-Busch InBev SA NV (Belgium, Beverages) | 1.1 | 1.0 |
Siemens AG (Germany, Industrial Conglomerates) | 1.1 | 0.7 |
| 16.6 | |
Market Sectors as of October 31, 2010 |
| % of fund's
net assets | % of fund's net assets
6 months ago |
Financials | 20.5 | 21.3 |
Consumer Discretionary | 13.8 | 10.3 |
Energy | 11.4 | 10.6 |
Materials | 10.2 | 8.8 |
Information Technology | 9.5 | 10.6 |
Consumer Staples | 9.2 | 8.9 |
Industrials | 8.2 | 9.5 |
Health Care | 7.3 | 9.4 |
Telecommunication Services | 5.4 | 5.3 |
Utilities | 0.4 | 2.2 |
Annual Report
Fidelity Diversified International Fund
Investments October 31, 2010
Showing Percentage of Net Assets
Common Stocks - 94.4% |
| Shares | | Value |
Argentina - 0.0% |
Telecom Argentina SA Class B sponsored ADR | 45,100 | | $ 1,075,184 |
Australia - 3.1% |
AMP Ltd. | 14,831,137 | | 77,586,587 |
BHP Billiton Ltd. sponsored ADR (d) | 7,059,600 | | 583,052,364 |
Centamin Egypt Ltd. (United Kingdom) (a) | 173,900 | | 482,002 |
Newcrest Mining Ltd. | 7,469,169 | | 292,394,171 |
QBE Insurance Group Ltd. | 4,150,000 | | 69,846,106 |
Westfield Group unit | 4,650,000 | | 56,395,512 |
TOTAL AUSTRALIA | | 1,079,756,742 |
Bahamas (Nassau) - 0.0% |
Petrominerales Ltd. | 19,000 | | 486,783 |
Bailiwick of Guernsey - 0.6% |
Resolution Ltd. | 50,499,100 | | 211,895,783 |
Bailiwick of Jersey - 1.7% |
Experian PLC | 16,227,900 | | 188,626,591 |
Informa PLC | 13,102,770 | | 91,527,749 |
Randgold Resources Ltd. sponsored ADR | 888,300 | | 83,429,136 |
Shire PLC | 2,291,500 | | 53,768,144 |
WPP PLC | 15,153,311 | | 176,073,094 |
TOTAL BAILIWICK OF JERSEY | | 593,424,714 |
Belgium - 1.3% |
Ageas | 25,335,700 | | 77,874,672 |
Anheuser-Busch InBev SA NV | 6,035,621 | | 378,215,859 |
Anheuser-Busch InBev SA NV (strip VVPR) (a) | 5,339,200 | | 22,288 |
Telenet Group Holding NV | 35,000 | | 1,461,023 |
TOTAL BELGIUM | | 457,573,842 |
Bermuda - 0.7% |
Central European Media Enterprises Ltd. Class A (a) | 19,000 | | 437,950 |
China Green (Holdings) Ltd. | 471,000 | | 483,077 |
GP Investments, Ltd. unit (a) | 121,051 | | 512,325 |
Huabao International Holdings Ltd. | 77,697,000 | | 117,078,015 |
Li & Fung Ltd. | 23,006,000 | | 121,541,132 |
Sihuan Pharmaceutical Holdings Group Ltd. | 1,715,000 | | 1,245,664 |
Vtech Holdings Ltd. | 93,100 | | 968,684 |
TOTAL BERMUDA | | 242,266,847 |
Brazil - 1.6% |
Banco Bradesco SA | 124,600 | | 2,006,842 |
Banco do Brasil SA | 5,700,000 | | 110,904,068 |
Banco Santander (Brasil) SA ADR | 5,000,000 | | 72,000,000 |
BM&F Bovespa SA | 11,250,000 | | 94,234,952 |
Drogasil SA | 2,204,300 | | 55,755,366 |
Estacio Participacoes SA | 2,189,965 | | 32,710,446 |
Fleury SA | 40,400 | | 522,455 |
|
| Shares | | Value |
Hypermarcas SA (a) | 29,700 | | $ 488,831 |
Itau Unibanco Banco Multiplo SA ADR | 4,088,800 | | 100,420,928 |
Mills Estruturas e Servicos de Engenharia SA (a) | 1,727,100 | | 20,842,560 |
Porto Seguro SA | 33,400 | | 490,830 |
Souza Cruz Industria Comerico | 875,000 | | 44,958,706 |
Tractebel Energia SA | 64,300 | | 978,938 |
Weg SA | 1,248,292 | | 16,120,959 |
TOTAL BRAZIL | | 552,435,881 |
British Virgin Islands - 0.0% |
HLS Systems International Ltd. (a) | 40,900 | | 516,976 |
Canada - 4.3% |
Agnico-Eagle Mines Ltd. (Canada) | 1,250,000 | | 96,945,779 |
Barrick Gold Corp. | 1,500,000 | | 72,242,377 |
Canadian Natural Resources Ltd. | 4,000,000 | | 145,622,120 |
Fairfax Financial Holdings Ltd. (sub. vtg.) | 170,000 | | 69,538,484 |
Goldcorp, Inc. | 1,475,000 | | 65,860,869 |
InterOil Corp. (a)(d) | 560,000 | | 39,860,800 |
Ivanhoe Mines Ltd. (a) | 1,958,400 | | 46,890,997 |
Loblaw Companies Ltd. (d) | 787,000 | | 33,628,258 |
Niko Resources Ltd. | 2,242,600 | | 213,947,426 |
Open Text Corp. (a) | 1,445,400 | | 63,943,963 |
OZ Optics Ltd. unit (a)(g) | 102,000 | | 451,860 |
Painted Pony Petroleum Ltd. (a)(e)(f) | 1,386,600 | | 9,544,006 |
Painted Pony Petroleum Ltd. Class A (a)(e) | 3,125,000 | | 21,509,462 |
Petrobank Energy & Resources Ltd. (a)(e) | 5,625,000 | | 223,863,859 |
Silver Wheaton Corp. (a) | 2,126,900 | | 61,143,944 |
Suncor Energy, Inc. | 3,100,000 | | 99,331,307 |
Talisman Energy, Inc. | 8,454,900 | | 153,280,813 |
Uranium One, Inc. (a) | 20,200,000 | | 82,590,450 |
TOTAL CANADA | | 1,500,196,774 |
Cayman Islands - 0.6% |
A8 Digital Music Holdings Ltd. | 1,206,000 | | 486,990 |
BaWang International (Group) Holding Ltd. | 15,728,000 | | 6,614,840 |
Belle International Holdings Ltd. | 9,507,000 | | 17,171,166 |
China Lodging Group Ltd. ADR | 19,300 | | 469,183 |
Consolidated Water Co., Inc. | 100,800 | | 1,031,184 |
Fook Woo Group Holdings Ltd. | 1,396,000 | | 493,474 |
Hengan International Group Co. Ltd. | 7,325,500 | | 68,990,357 |
Hengdeli Holdings Ltd. | 74,000,000 | | 41,051,443 |
Hua Han Bio-Pharmaceutical Holdings Ltd. | 1,504,000 | | 506,427 |
Lijun International Pharmaceutical Holding Ltd. | 69,995,000 | | 24,020,216 |
Microport Scientific Corp. | 1,375,000 | | 1,401,387 |
Silver Base Group Holdings Ltd. | 25,672,000 | | 18,745,818 |
Want Want China Holdings Ltd. | 36,665,000 | | 33,820,964 |
Wasion Group Holdings Ltd. | 686,000 | | 499,150 |
TOTAL CAYMAN ISLANDS | | 215,302,599 |
Common Stocks - continued |
| Shares | | Value |
China - 1.5% |
Agricultural Bank of China (H Shares) | 169,770,000 | | $ 89,580,300 |
Baidu.com, Inc. sponsored ADR (a) | 1,065,700 | | 117,237,657 |
China Merchants Bank Co. Ltd. (H Shares) | 75,991,000 | | 215,681,600 |
China Resources Land Ltd. | 458,000 | | 902,853 |
Minth Group Ltd. | 4,366,000 | | 8,167,328 |
NetEase.com, Inc. sponsored ADR (a) | 1,279,400 | | 53,478,920 |
Tingyi (Cayman Islands) Holding Corp. | 7,700,000 | | 20,960,490 |
Xinhua Winshare Publishing and Media Co. Ltd. | 911,000 | | 541,811 |
TOTAL CHINA | | 506,550,959 |
Colombia - 0.0% |
BanColombia SA sponsored ADR | 7,400 | | 499,130 |
Denmark - 2.4% |
Carlsberg AS Series B | 1,980,450 | | 216,555,709 |
Novo Nordisk AS Series B | 4,627,712 | | 485,827,751 |
Pandora A/S | 1,108,600 | | 53,784,404 |
William Demant Holding AS (a) | 1,250,000 | | 93,695,770 |
TOTAL DENMARK | | 849,863,634 |
Egypt - 0.0% |
Commercial International Bank Ltd. | 64,500 | | 485,865 |
Finland - 0.2% |
Nokia Corp. | 67,000 | | 719,358 |
Nokia Corp. sponsored ADR (d) | 8,000,000 | | 85,440,000 |
TOTAL FINLAND | | 86,159,358 |
France - 7.0% |
Accor SA | 425,000 | | 17,424,607 |
Alstom SA | 699,330 | | 35,283,980 |
Atos Origin SA (a) | 1,499,892 | | 69,341,397 |
AXA SA sponsored ADR | 9,441,700 | | 172,122,191 |
BNP Paribas SA | 3,958,600 | | 289,455,595 |
Cap Gemini SA | 2,023,500 | | 103,205,785 |
Carrefour SA | 49,000 | | 2,644,061 |
Casino Guichard Perrachon et Compagnie | 16,017 | | 1,504,363 |
Danone | 36,500 | | 2,309,581 |
Dassault Aviation SA | 36,265 | | 30,024,256 |
Essilor International SA | 1,868,672 | | 124,755,853 |
Euler Hermes SA (a) | 440,000 | | 41,417,901 |
Iliad Group SA (d) | 725,000 | | 81,612,022 |
Lafarge SA (Bearer) | 17,200 | | 982,687 |
LVMH Moet Hennessy - Louis Vuitton | 1,943,198 | | 304,454,959 |
Pernod-Ricard SA | 805,100 | | 71,371,535 |
PPR SA | 1,535,200 | | 251,638,947 |
Sanofi-Aventis | 2,590,429 | | 181,443,991 |
Schneider Electric SA | 767,042 | | 108,864,661 |
SEB SA | 5,400 | | 517,477 |
Societe Generale Series A | 4,207,250 | | 251,876,010 |
|
| Shares | | Value |
Technip SA | 1,401,500 | | $ 117,767,577 |
Vallourec SA (d) | 1,633,946 | | 169,538,935 |
TOTAL FRANCE | | 2,429,558,371 |
Germany - 6.6% |
adidas AG | 18,300 | | 1,193,476 |
BASF AG | 1,967,023 | | 143,091,101 |
Bayerische Motoren Werke AG (BMW) | 5,114,261 | | 366,557,445 |
Daimler AG (Germany) (a) | 3,665,693 | | 241,922,812 |
Deutsche Boerse AG | 1,721,100 | | 121,082,332 |
ElringKlinger AG | 310,500 | | 10,345,323 |
Fresenius Medical Care AG & Co. KGaA | 2,706,700 | | 172,380,701 |
Fresenius SE | 2,317,000 | | 204,433,185 |
GFK AG | 1,600,000 | | 67,546,549 |
HeidelbergCement AG | 1,700,000 | | 88,906,002 |
Kabel Deutschland Holding AG | 44,300 | | 1,994,402 |
Linde AG | 1,520,355 | | 218,848,266 |
Metro AG | 1,000,000 | | 70,073,422 |
Munich Re Group | 602,751 | | 94,227,707 |
Rheinmetall AG | 553,250 | | 39,845,869 |
SAP AG | 1,153,350 | | 60,132,938 |
Siemens AG | 25,416 | | 2,902,767 |
Siemens AG sponsored ADR | 3,300,000 | | 377,223,000 |
Symrise AG | 90,000 | | 2,733,156 |
TOTAL GERMANY | | 2,285,440,453 |
Greece - 0.0% |
Coca-Cola Hellenic Bottling Co. SA sponsored ADR | 39,200 | | 997,248 |
Hong Kong - 0.8% |
AIA Group Ltd. | 18,365,200 | | 54,612,851 |
China Insurance International Holdings Co. Ltd. (a) | 281,000 | | 1,033,188 |
China Mobile (Hong Kong) Ltd. | 145,000 | | 1,480,786 |
China Travel International Investment HK Ltd. (a) | 4,062,000 | | 969,482 |
Henderson Land Development Co. Ltd. | 11,788,155 | | 83,720,424 |
Henderson Land Development Co. Ltd. warrants 6/1/11 (a) | 2,171,600 | | 840,484 |
Hopewell Holdings Ltd. | 309,500 | | 974,269 |
Swire Pacific Ltd. (A Shares) | 4,577,000 | | 64,953,395 |
Wharf Holdings Ltd. | 10,294,000 | | 67,597,433 |
TOTAL HONG KONG | | 276,182,312 |
India - 1.0% |
Adani Enterprises Ltd. | 31,720 | | 504,121 |
Bajaj Holdings & Investment Ltd. | 51,421 | | 1,014,557 |
CESC Ltd. GDR | 113,611 | | 951,692 |
Cipla Ltd. | 131,491 | | 1,047,033 |
DB Corp. Ltd. | 83,211 | | 517,100 |
Grasim Industries Ltd. | 3,416 | | 179,604 |
HDFC Bank Ltd. | 1,971,144 | | 101,606,011 |
Housing Development Finance Corp. Ltd. | 4,336,280 | | 67,277,153 |
Common Stocks - continued |
| Shares | | Value |
India - continued |
Infrastructure Development Finance Co. Ltd. | 11,302,606 | | $ 51,011,537 |
Jyothy Laboratories Ltd. | 78,521 | | 488,929 |
KPIT Cummins Infosystems Ltd. | 128,981 | | 457,144 |
Larsen & Toubro Ltd. | 844,293 | | 38,625,096 |
Motherson Sumi Systems Ltd. | 116,901 | | 483,428 |
Oracle Finance Services Software Ltd. (a) | 9,100 | | 453,758 |
Reliance Industries Ltd. | 61,982 | | 1,532,945 |
Rural Electrification Corp. Ltd. | 117,280 | | 980,707 |
Shriram Transport Finance Co. Ltd. | 1,091,429 | | 21,703,001 |
State Bank of India | 1,012,201 | | 71,946,768 |
TOTAL INDIA | | 360,780,584 |
Indonesia - 0.1% |
PT Bank Rakyat Indonesia Tbk | 827,500 | | 1,055,495 |
PT Perusahaan Gas Negara Tbk Series B | 80,497,000 | | 36,476,926 |
PT Semen Gresik (Persero) Tbk | 907,500 | | 995,076 |
TOTAL INDONESIA | | 38,527,497 |
Ireland - 0.4% |
CRH PLC | 4,883,800 | | 84,338,043 |
Ingersoll-Rand Co. Ltd. | 1,186,300 | | 46,633,453 |
TOTAL IRELAND | | 130,971,496 |
Italy - 2.2% |
Fiat SpA | 13,462,200 | | 227,780,856 |
Impregilo SpA (a) | 151,300 | | 484,211 |
Intesa Sanpaolo SpA | 30,390,000 | | 106,878,284 |
Intesa Sanpaolo SpA (Risparmio Shares) | 18,000,000 | | 49,315,771 |
Mediaset SpA | 12,409,400 | | 91,515,417 |
Saipem SpA | 6,774,150 | | 300,968,702 |
TOTAL ITALY | | 776,943,241 |
Japan - 11.8% |
Canon, Inc. sponsored ADR (d) | 4,439,100 | | 204,198,600 |
Denso Corp. | 5,225,000 | | 162,487,556 |
eAccess Ltd. | 42,870 | | 31,272,138 |
Fanuc Ltd. | 710,500 | | 102,858,849 |
Fast Retailing Co. Ltd. | 752,400 | | 98,557,803 |
Honda Motor Co. Ltd. | 4,770,000 | | 171,952,704 |
Hoya Corp. | 2,000,000 | | 46,775,194 |
Itochu Corp. | 8,481,700 | | 74,336,019 |
Japan Tobacco, Inc. | 61,388 | | 190,713,128 |
JSR Corp. | 4,543,500 | | 78,651,613 |
Keyence Corp. | 731,100 | | 181,253,194 |
Komatsu Ltd. | 4,298,900 | | 105,071,267 |
Mazda Motor Corp. | 32,330,000 | | 82,165,026 |
Mitsubishi Corp. | 5,819,600 | | 139,784,919 |
Mitsubishi UFJ Financial Group, Inc. | 47,105,400 | | 218,616,347 |
Mitsui & Co. Ltd. | 13,129,900 | | 206,499,314 |
Murata Manufacturing Co. Ltd. | 641,400 | | 36,067,291 |
|
| Shares | | Value |
Nintendo Co. Ltd. | 473,100 | | $ 122,581,517 |
Nippon Electric Glass Co. Ltd. | 409,000 | | 5,257,211 |
Nitori Holdings Co. Ltd. | 441,400 | | 38,835,739 |
NSK Ltd. | 11,469,000 | | 86,710,755 |
NTT DoCoMo, Inc. | 46,000 | | 77,541,081 |
ORIX Corp. | 4,020,290 | | 366,707,190 |
Rakuten, Inc. | 196,702 | | 151,553,667 |
Ricoh Co. Ltd. | 5,500,000 | | 76,937,398 |
ROHM Co. Ltd. | 1,346,800 | | 84,018,091 |
SOFTBANK CORP. | 10,973,000 | | 352,398,190 |
Sony Financial Holdings, Inc. | 16,100 | | 56,020,875 |
Sumitomo Corp. | 2,944,600 | | 37,281,016 |
Sumitomo Mitsui Financial Group, Inc. | 5,251,900 | | 156,757,373 |
Tokai Carbon Co. Ltd. | 5,950,000 | | 35,083,044 |
Tokyo Electron Ltd. | 2,698,100 | | 152,235,861 |
Toyota Motor Corp. sponsored ADR (d) | 1,162,100 | | 82,299,922 |
Yahoo! Japan Corp. | 299,774 | | 104,640,393 |
TOTAL JAPAN | | 4,118,120,285 |
Korea (South) - 1.9% |
Amorepacific Corp. | 106,907 | | 98,873,512 |
Cheil Worldwide, Inc. | 84,120 | | 916,380 |
Grand Korea Leisure Co. Ltd. | 51,900 | | 1,056,923 |
Hynix Semiconductor, Inc. (a) | 48,350 | | 995,378 |
Hyundai Mipo Dockyard Co. Ltd. | 6,050 | | 1,011,472 |
Hyundai Mobis | 4,420 | | 1,100,578 |
Korea Investment Holdings Co. Ltd. | 30,660 | | 966,560 |
KT Corp. | 37,160 | | 1,465,083 |
LG Corp. | 20,438 | | 1,463,103 |
NCsoft Corp. | 405,877 | | 89,332,631 |
NHN Corp. (a) | 744,844 | | 132,144,381 |
Samchully Co. Ltd. | 9,630 | | 1,053,348 |
Samsung Electronics Co. Ltd. | 355,464 | | 235,500,794 |
Shinhan Financial Group Co. Ltd. | 2,186,480 | | 84,678,693 |
Yuhan Corp. | 6,340 | | 899,271 |
TOTAL KOREA (SOUTH) | | 651,458,107 |
Luxembourg - 0.3% |
Millicom International Cellular SA | 9,900 | | 936,540 |
SES SA FDR (France) unit | 4,182,920 | | 107,181,268 |
TOTAL LUXEMBOURG | | 108,117,808 |
Malaysia - 0.0% |
Berjaya Sports Toto Bhd | 749,300 | | 1,004,365 |
Parkson Holdings Bhd | 517,400 | | 986,237 |
Top Glove Corp. Bhd | 269,500 | | 476,455 |
TOTAL MALAYSIA | | 2,467,057 |
Mexico - 0.2% |
Banco Compartamos SA de CV | 69,200 | | 490,208 |
Wal-Mart de Mexico SA de CV Series V | 23,500,000 | | 64,275,131 |
TOTAL MEXICO | | 64,765,339 |
Common Stocks - continued |
| Shares | | Value |
Netherlands - 3.2% |
AEGON NV (a) | 13,650,000 | | $ 86,488,759 |
Gemalto NV | 1,700,000 | | 77,398,015 |
ING Groep NV: | | | |
(Certificaten Van Aandelen) unit (a) | 219,000 | | 2,342,425 |
sponsored ADR (a) | 20,112,800 | | 216,815,984 |
Koninklijke Ahold NV | 5,271,802 | | 72,841,008 |
Koninklijke KPN NV | 9,835,116 | | 164,220,867 |
Koninklijke Philips Electronics NV | 47,250 | | 1,440,873 |
Koninklijke Philips Electronics NV unit | 6,500,600 | | 197,943,270 |
LyondellBasell Industries NV Class A (a) | 2,653,300 | | 71,267,638 |
Randstad Holdings NV (a) | 2,062,625 | | 98,155,353 |
Reed Elsevier NV | 170,500 | | 2,226,793 |
Wolters Kluwer NV (Certificaten Van Aandelen) | 4,925,000 | | 112,010,508 |
TOTAL NETHERLANDS | | 1,103,151,493 |
Netherlands Antilles - 0.4% |
Schlumberger Ltd. | 1,953,000 | | 136,495,170 |
Nigeria - 0.0% |
Guaranty Trust Bank PLC GDR (Reg. S) | 74,000 | | 537,240 |
Norway - 1.2% |
DnB NOR ASA | 12,195,600 | | 167,345,287 |
Pronova BioPharma ASA (a)(d) | 13,000,000 | | 21,743,212 |
Storebrand ASA (A Shares) (a) | 4,980,000 | | 36,215,555 |
Telenor ASA | 11,802,200 | | 190,247,604 |
TOTAL NORWAY | | 415,551,658 |
Philippines - 0.0% |
Manila Water Co., Inc. | 2,331,300 | | 1,014,034 |
Pepsi-Cola Products Philippines, Inc. | 8,284,000 | | 503,992 |
Universal Robina Corp. | 480,000 | | 486,154 |
TOTAL PHILIPPINES | | 2,004,180 |
Poland - 0.0% |
Telekomunikacja Polska SA | 154,000 | | 980,548 |
Qatar - 0.1% |
Commercial Bank of Qatar GDR (Reg. S) | 9,000,000 | | 41,239,492 |
Russia - 0.2% |
Mobile TeleSystems OJSC sponsored ADR | 45,300 | | 980,745 |
OJSC MMC Norilsk Nickel sponsored ADR | 2,000,000 | | 37,300,000 |
Sberbank (Savings Bank of the Russian Federation) GDR | 5,300 | | 1,991,165 |
Uralkali JSC GDR (Reg. S) | 725,000 | | 17,943,750 |
TOTAL RUSSIA | | 58,215,660 |
Singapore - 0.0% |
SIA Engineering Co. Ltd. | 288,000 | | 965,711 |
Straits Asia Resources Ltd. | 558,000 | | 987,267 |
TOTAL SINGAPORE | | 1,952,978 |
|
| Shares | | Value |
South Africa - 0.5% |
African Bank Investments Ltd. | 188,900 | | $ 969,167 |
African Rainbow Minerals Ltd. | 38,200 | | 974,543 |
AngloGold Ashanti Ltd. | 21,000 | | 984,902 |
AngloGold Ashanti Ltd. sponsored ADR | 1,750,000 | | 82,442,500 |
Aveng Ltd. | 165,600 | | 1,040,164 |
City Lodge Hotels Ltd. | 44,000 | | 513,487 |
Harmony Gold Mining Co. Ltd. | 90,300 | | 1,036,985 |
Illovo Sugar Ltd. | 262,700 | | 975,039 |
Impala Platinum Holdings Ltd. | 1,232,700 | | 34,842,664 |
Mr Price Group Ltd. | 124,400 | | 1,130,514 |
Naspers Ltd. Class N | 690,100 | | 36,235,656 |
Shoprite Holdings Ltd. | 728,800 | | 10,301,964 |
Standard Bank Group Ltd. | 61,700 | | 909,859 |
Sun International Ltd. | 71,000 | | 993,283 |
TOTAL SOUTH AFRICA | | 173,350,727 |
Spain - 3.9% |
Banco Bilbao Vizcaya Argentaria SA | 6,400,000 | | 84,295,123 |
Banco Santander SA sponsored ADR | 40,900,000 | | 523,929,000 |
Enagas SA | 1,662,431 | | 36,629,358 |
Gestevision Telecinco SA | 3,503,300 | | 44,681,196 |
Inditex SA (d) | 2,314,910 | | 193,297,103 |
Obrascon Huarte Lain SA | 30,400 | | 994,475 |
Prosegur Compania de Seguridad SA (Reg.) | 1,216,300 | | 72,875,633 |
Red Electrica Corporacion SA | 1,450,000 | | 72,825,363 |
Telefonica SA | 12,400,723 | | 335,014,393 |
TOTAL SPAIN | | 1,364,541,644 |
Sweden - 0.9% |
H&M Hennes & Mauritz AB (B Shares) | 5,753,543 | | 202,703,547 |
Swedbank AB (A Shares) (a) | 8,311,300 | | 115,994,481 |
TOTAL SWEDEN | | 318,698,028 |
Switzerland - 7.7% |
Adecco SA (Reg.) | 24,000 | | 1,340,986 |
Bank Sarasin & Co. Ltd. Series B (Reg.) | 32,400 | | 1,184,944 |
Clariant AG (Reg.) (a) | 5,152,500 | | 87,100,726 |
Kuehne & Nagel International AG | 1,440,840 | | 178,138,089 |
Lonza Group AG | 609,718 | | 53,362,326 |
Nestle SA | 14,605,918 | | 799,775,457 |
Novartis AG | 72,700 | | 4,211,153 |
Novartis AG sponsored ADR (d) | 3,011,300 | | 174,504,835 |
Roche Holding AG (participation certificate) | 983,512 | | 144,376,984 |
Schindler Holding AG: | | | |
(participation certificate) | 14,300 | | 1,532,636 |
(Reg.) | 1,278,570 | | 138,982,059 |
Sonova Holding AG Class B | 865,781 | | 100,268,232 |
Syngenta AG (Switzerland) | 590,110 | | 163,343,743 |
Common Stocks - continued |
| Shares | | Value |
Switzerland - continued |
Tecan Group AG | 342,635 | | $ 23,843,651 |
Transocean Ltd. (a) | 2,625,000 | | 166,320,000 |
Transocean, Inc. (a) | 22,160 | | 1,403,643 |
UBS AG (a) | 19,336,655 | | 328,382,161 |
Zurich Financial Services AG | 1,268,730 | | 310,496,324 |
TOTAL SWITZERLAND | | 2,678,567,949 |
Taiwan - 1.3% |
Advantech Co. Ltd. | 195,000 | | 532,658 |
Chroma ATE, Inc. | 417,000 | | 1,073,668 |
Delta Electronics, Inc. | 244,000 | | 1,008,528 |
Giant Manufacturing Co. Ltd. | 261,000 | | 1,027,626 |
Hon Hai Precision Industry Co. Ltd. (Foxconn) | 19,141,040 | | 72,548,952 |
HTC Corp. | 13,847,000 | | 312,637,710 |
Powertech Technology, Inc. | 324,000 | | 1,069,237 |
Synnex Technology International Corp. | 423,000 | | 1,035,213 |
Taiwan Fertilizer Co. Ltd. | 15,418,000 | | 52,644,372 |
TOTAL TAIWAN | | 443,577,964 |
Thailand - 0.0% |
Charoen Pokphand Foods PCL (For. Reg.) | 621,900 | | 483,977 |
Turkey - 0.0% |
Hurriyet Gazetecilik ve Matbaacilik AS | 394,044 | | 453,303 |
Koc Holding AS | 203,000 | | 969,497 |
TOTAL TURKEY | | 1,422,800 |
United Kingdom - 18.4% |
Anglo American PLC (United Kingdom) | 2,523,300 | | 117,561,865 |
Associated British Foods PLC | 4,920,900 | | 82,545,689 |
Barclays PLC | 34,210,000 | | 150,315,042 |
BG Group PLC | 11,074,979 | | 215,675,618 |
BHP Billiton PLC | 4,748,480 | | 168,193,866 |
BP PLC | 279,500 | | 1,899,571 |
BP PLC sponsored ADR | 17,725,000 | | 723,711,750 |
British Airways PLC (a) | 316,000 | | 1,370,498 |
British American Tobacco PLC: | | | |
(United Kingdom) | 91,200 | | 3,473,947 |
sponsored ADR | 2,163,700 | | 164,938,851 |
Britvic PLC | 4,600,700 | | 35,557,760 |
Burberry Group PLC | 6,982,900 | | 114,002,187 |
Cable & Wireless PLC | 1,154,800 | | 988,912 |
Capita Group PLC | 22,817,500 | | 280,209,848 |
Carphone Warehouse Group PLC | 12,014,300 | | 58,612,325 |
Centrica PLC | 502,000 | | 2,671,816 |
Ensco International Ltd. ADR | 10,500 | | 486,570 |
GlaxoSmithKline PLC | 9,537,800 | | 186,226,415 |
GlaxoSmithKline PLC sponsored ADR | 4,130,400 | | 161,250,816 |
HSBC Holdings PLC: | | | |
(United Kingdom) | 434,871 | | 4,525,417 |
sponsored ADR | 9,939,900 | | 517,968,189 |
|
| Shares | | Value |
Imperial Tobacco Group PLC | 99,050 | | $ 3,172,272 |
Inchcape PLC (a) | 18,399,998 | | 102,795,215 |
International Personal Finance PLC | 104,600 | | 521,189 |
ITV PLC (a) | 84,576,200 | | 92,481,316 |
Johnson Matthey PLC | 1,813,800 | | 55,620,451 |
Kalahari Minerals PLC (a) | 186,400 | | 523,368 |
Kazakhmys PLC | 45,100 | | 950,902 |
Lloyds Banking Group PLC (a) | 221,683,500 | | 243,627,024 |
Lonmin PLC (a) | 34,400 | | 963,943 |
Misys PLC (a) | 15,000,355 | | 67,628,352 |
Next PLC | 970,700 | | 35,536,480 |
Ocado Group PLC (a) | 6,000,000 | | 13,429,221 |
Pearson PLC | 10,425,200 | | 159,651,691 |
Premier Oil PLC (a) | 19,171 | | 516,316 |
Prudential PLC | 171,500 | | 1,734,339 |
QinetiQ Group PLC | 20,900,000 | | 35,962,820 |
Reckitt Benckiser Group PLC | 5,197,800 | | 290,718,447 |
Rio Tinto PLC | 45,550 | | 2,958,115 |
Rio Tinto PLC sponsored ADR | 3,501,000 | | 227,985,120 |
Royal Dutch Shell PLC: | | | |
Class A (United Kingdom) | 162,500 | | 5,274,678 |
Class A sponsored ADR | 4,900,000 | | 318,157,000 |
Class B ADR | 10,800,000 | | 694,656,000 |
Standard Chartered PLC: | | | |
rights 11/5/10 (a) | 12,287 | | 103,448 |
(United Kingdom) | 3,835,644 | | 110,952,977 |
TalkTalk Telecom Group PLC (a) | 20,856,732 | | 44,075,194 |
Tesco PLC | 28,030,100 | | 191,691,612 |
Vedanta Resources PLC | 1,525,000 | | 50,698,034 |
Vodafone Group PLC | 1,664,000 | | 4,548,148 |
Vodafone Group PLC sponsored ADR | 23,309,200 | | 641,236,092 |
TOTAL UNITED KINGDOM | | 6,390,356,716 |
United States of America - 6.3% |
Anadarko Petroleum Corp. | 2,715,900 | | 167,217,963 |
Apple, Inc. (a) | 700,800 | | 210,849,696 |
Avon Products, Inc. | 35,800 | | 1,090,110 |
C. R. Bard, Inc. | 1,030,000 | | 85,613,600 |
Central European Distribution Corp. (a) | 41,700 | | 1,041,249 |
CF Industries Holdings, Inc. | 899,500 | | 110,215,735 |
Chevron Corp. | 1,060,000 | | 87,566,600 |
China-Biotics, Inc. (a) | 39,200 | | 491,568 |
Citigroup, Inc. (a) | 16,600,000 | | 69,222,000 |
Corning, Inc. | 53,500 | | 977,980 |
eBay, Inc. (a) | 2,883,600 | | 85,960,116 |
First Cash Financial Services, Inc. (a) | 17,900 | | 520,353 |
Google, Inc. Class A (a) | 406,608 | | 249,246,638 |
Gran Tierra Energy, Inc. (a) | 64,500 | | 481,170 |
Hewlett-Packard Co. | 1,200,000 | | 50,472,000 |
Illumina, Inc. (a) | 1,027,800 | | 55,819,818 |
Jacobs Engineering Group, Inc. (a) | 1,150,000 | | 44,401,500 |
JPMorgan Chase & Co. | 1,605,800 | | 60,426,254 |
Common Stocks - continued |
| Shares | | Value |
United States of America - continued |
Lear Corp. (a) | 206,100 | | $ 18,219,240 |
Medco Health Solutions, Inc. (a) | 2,286,700 | | 120,120,351 |
Morgan Stanley | 2,504,100 | | 62,276,967 |
Newmont Mining Corp. | 1,000,000 | | 60,870,000 |
Philip Morris International, Inc. | 2,212,900 | | 129,454,650 |
QUALCOMM, Inc. | 22,100 | | 997,373 |
Regions Financial Corp. | 7,913,500 | | 49,855,050 |
SanDisk Corp. (a) | 2,180,900 | | 81,958,222 |
Schweitzer-Mauduit International, Inc. (e) | 1,297,914 | | 83,300,121 |
The Walt Disney Co. | 1,423,200 | | 51,391,752 |
The Western Union Co. | 56,700 | | 997,920 |
Visa, Inc. Class A | 1,400,000 | | 109,438,000 |
Wells Fargo & Co. | 6,137,200 | | 160,058,176 |
TOTAL UNITED STATES OF AMERICA | | 2,210,552,172 |
TOTAL COMMON STOCKS (Cost $26,841,115,573) | 32,884,501,265 |
Nonconvertible Preferred Stocks - 1.5% |
| | | |
Germany - 1.5% |
Bayerische Motoren Werke AG (BMW) (non-vtg.) | 800,000 | | 38,949,469 |
ProSiebenSat.1 Media AG | 5,548,800 | | 146,619,469 |
Volkswagen AG | 2,232,900 | | 335,552,622 |
TOTAL NONCONVERTIBLE PREFERRED STOCKS (Cost $305,707,723) | 521,121,560 |
Money Market Funds - 5.6% |
| Shares | | Value |
Fidelity Cash Central Fund, 0.23% (b) | 1,313,905,689 | | $ 1,313,905,689 |
Fidelity Securities Lending Cash Central Fund, 0.24% (b)(c) | 620,968,677 | | 620,968,677 |
TOTAL MONEY MARKET FUNDS (Cost $1,934,874,366) | 1,934,874,366 |
TOTAL INVESTMENT
PORTFOLIO - 101.5% (Cost $29,081,697,662) | | 35,340,497,191 |
NET OTHER ASSETS (LIABILITIES) - (1.5)% | | (521,262,073) |
NET ASSETS - 100% | $ 34,819,235,118 |
Legend |
(a) Non-income producing |
(b) Affiliated fund that is available only to investment companies and other accounts managed by Fidelity Investments. The rate quoted is the annualized seven-day yield of the fund at period end. A complete unaudited listing of the fund's holdings as of its most recent quarter end is available upon request. In addition, each Fidelity Central Fund's financial statements, which are not covered by the Fund's report of Independent Registered Public Accounting Firm, are available on the SEC's website or upon request. |
(c) Investment made with cash collateral received from securities on loan. |
(d) Security or a portion of the security is on loan at period end. |
(e) Affiliated company |
(f) Security exempt from registration under Rule 144A of the Securities Act of 1933. These securities may be resold in transactions exempt from registration, normally to qualified institutional buyers. At the end of the period, the value of these securities amounted to $9,544,006 or 0.0% of net assets. |
(g) Restricted securities - Investment in securities not registered under the Securities Act of 1933 (excluding 144A issues). At the end of the period, the value of restricted securities (excluding 144A issues) amounted to $451,860 or 0.0% of net assets. |
Additional information on each holding is as follows: |
Security | Acquisition Date | Acquisition Cost |
OZ Optics Ltd. unit | 8/18/00 | $ 1,505,520 |
Affiliated Central Funds |
Information regarding fiscal year to date income earned by the Fund from investments in Fidelity Central Funds is as follows: |
Fund | Income earned |
Fidelity Cash Central Fund | $ 1,916,208 |
Fidelity Securities Lending Cash Central Fund | 21,351,864 |
Total | $ 23,268,072 |
Other Affiliated Issuers |
An affiliated company is a company in which the Fund has ownership of at least 5% of the voting securities. Fiscal year to date transactions with companies which are or were affiliates are as follows: |
Affiliate | Value,
beginning of period | Purchases | Sales Proceeds | Dividend Income | Value,
end of
period |
Bovis Homes Group PLC | $ 49,028,663 | $ - | $ 40,862,474 | $ - | $ - |
easyJet PLC | 168,495,470 | - | 164,901,608 | - | - |
Informa PLC | 163,485,254 | 209,835 | 123,704,482 | 5,004,506 | - |
Niko Resources Ltd. | 204,266,519 | 3,831,199 | 32,663,592 | 287,709 | - |
Painted Pony Petroleum Ltd. 144A | 3,676,731 | 4,520,708 | - | - | 9,544,006 |
Painted Pony Petroleum Ltd. Class A | 3,972,148 | 15,732,670 | - | - | 21,509,462 |
Petrobank Energy & Resources Ltd. | 239,355,866 | 7,034,675 | - | - | 223,863,859 |
Pronova BioPharma ASA | 48,182,882 | 1,312,775 | 8,079,938 | - | - |
Resolution Ltd. | - | 203,988,590 | 3,235,783 | 4,279,791 | - |
Schweitzer-Mauduit International, Inc. | - | 66,984,142 | - | 319,904 | 83,300,121 |
Tecan Group AG | 67,537,277 | - | 49,592,334 | 749,837 | - |
Trican Well Service Ltd. | 81,839,590 | - | 104,622,102 | 436,015 | - |
Total | $ 1,029,840,400 | $ 303,614,594 | $ 527,662,313 | $ 11,077,762 | $ 338,217,448 |
Other Information |
The following is a summary of the inputs used, as of October 31, 2010, involving the Fund's assets and liabilities carried at fair value. The inputs or methodology used for valuing securities may not be an indication of the risk associated with investing in those securities. For more information on valuation inputs, and their aggregation into the levels used in the tables below, please refer to the Security Valuation section in the accompanying Notes to Financial Statements. |
Valuation Inputs at Reporting Date: |
Description | Total | Level 1 | Level 2 | Level 3 |
Investments in Securities: | | | | |
Equities: | | | | |
United Kingdom | $ 6,390,356,716 | $ 5,463,203,141 | $ 927,153,575 | $ - |
Japan | 4,118,120,285 | 1,480,235,031 | 2,637,885,254 | - |
Germany | 2,806,562,013 | 2,571,145,607 | 235,416,406 | - |
Switzerland | 2,678,567,949 | 2,182,630,892 | 495,937,057 | - |
France | 2,429,558,371 | 2,248,114,380 | 181,443,991 | - |
United States of America | 2,210,552,172 | 2,210,552,172 | - | - |
Canada | 1,500,196,774 | 1,499,744,914 | - | 451,860 |
Spain | 1,364,541,644 | 945,232,128 | 419,309,516 | - |
Netherlands | 1,103,151,493 | 1,010,652,643 | 92,498,850 | - |
Other | 8,804,015,408 | 7,896,535,647 | 907,479,761 | - |
Money Market Funds | 1,934,874,366 | 1,934,874,366 | - | - |
Total Investments in Securities: | $ 35,340,497,191 | $ 29,442,920,921 | $ 5,897,124,410 | $ 451,860 |
The following is a reconciliation of Investments in Securities for which Level 3 inputs were used in determining value: |
Investments in Securities: | |
Beginning Balance | $ 481,440 |
Total Realized Gain (Loss) | - |
Total Unrealized Gain (Loss) | (29,580) |
Cost of Purchases | - |
Proceeds of Sales | - |
Amortization/Accretion | - |
Transfers in to Level 3 | - |
Transfers out of Level 3 | - |
Ending Balance | $ 451,860 |
The change in unrealized gain (loss) for the period attributable to Level 3 securities held at October 31, 2010 | $ (29,580) |
The information used in the above reconciliation represents fiscal year to date activity for any Investments in Securities identified as using Level 3 inputs at either the beginning or the end of the current fiscal period. Transfers in or out of Level 3 represent the beginning value of any Security or Instrument where a change in the pricing level occurred from the beginning to the end of the period. The cost of purchases and the proceeds of sales may include securities received or delivered through corporate actions or exchanges. Realized and unrealized gains (losses) disclosed in the reconciliation are included in Net Gain (Loss) on the Fund's Statement of Operations. |
Income Tax Information |
At October 31, 2010, the Fund had a capital loss carryforward of approximately $5,177,653,127 of which $956,598,602, $3,601,913,096 and $619,141,429 will expire on October 31, 2016, 2017 and 2018, respectively. Capital loss carryforwards are only available to offset future capital gains of the Fund to the extent provided by regulations and may be limited. |
See accompanying notes which are an integral part of the financial statements.
Annual Report
Fidelity Diversified International Fund
Statement of Assets and Liabilities
| October 31, 2010 |
| | |
Assets | | |
Investment in securities, at value (including securities loaned of $599,538,721) - See accompanying schedule: Unaffiliated issuers (cost $26,810,900,728) | $ 33,067,405,377 | |
Fidelity Central Funds (cost $1,934,874,366) | 1,934,874,366 | |
Other affiliated issuers (cost $335,922,568) | 338,217,448 | |
Total Investments (cost $29,081,697,662) | | $ 35,340,497,191 |
Cash | | 1,944,256 |
Receivable for investments sold | | 152,958,867 |
Receivable for fund shares sold | | 42,373,584 |
Dividends receivable | | 93,945,387 |
Distributions receivable from
Fidelity Central Funds | | 250,116 |
Other receivables | | 3,118,617 |
Total assets | | 35,635,088,018 |
| | |
Liabilities | | |
Payable for investments purchased | $ 114,316,055 | |
Payable for fund shares redeemed | 49,570,390 | |
Accrued management fee | 19,084,476 | |
Other affiliated payables | 5,585,364 | |
Other payables and accrued
expenses | 6,327,938 | |
Collateral on securities loaned,
at value | 620,968,677 | |
Total liabilities | | 815,852,900 |
| | |
Net Assets | | $ 34,819,235,118 |
Net Assets consist of: | | |
Paid in capital | | $ 33,386,450,830 |
Undistributed net investment income | | 424,022,673 |
Accumulated undistributed net realized gain (loss) on investments and foreign currency transactions | | (5,250,875,923) |
Net unrealized appreciation (depreciation) on investments and assets and liabilities in foreign
currencies | | 6,259,637,538 |
Net Assets | | $ 34,819,235,118 |
| | |
Diversified International:
Net Asset Value, offering price and redemption price per share ($26,527,228,516 ÷ 899,570,270 shares) | | $ 29.49 |
| | |
Class K:
Net Asset Value, offering price and redemption price per share ($7,697,404,912 ÷
260,809,944 shares) | | $ 29.51 |
| | |
Class F:
Net Asset Value, offering price and redemption price per share ($594,601,690 ÷
20,144,672 shares) | | $ 29.52 |
Statement of Operations
| Year ended October 31, 2010 |
| | |
Investment Income | | |
Dividends (including $11,077,762 earned from other affiliated issuers) | | $ 865,768,030 |
Interest | | 7,798 |
Income from Fidelity Central Funds | | 23,268,072 |
Income before foreign taxes withheld | | 889,043,900 |
Less foreign taxes withheld | | (76,318,519) |
Total income | | 812,725,381 |
| | |
Expenses | | |
Management fee
Basic fee | $ 250,126,269 | |
Performance adjustment | (1,938,601) | |
Transfer agent fees | 73,940,178 | |
Accounting and security
lending fees | 2,719,020 | |
Custodian fees and expenses | 6,509,391 | |
Independent trustees' compensation | 202,342 | |
Appreciation in deferred trustee compensation account | 10 | |
Registration fees | 239,837 | |
Audit | 225,084 | |
Legal | 218,627 | |
Interest | 393 | |
Miscellaneous | 491,243 | |
Total expenses before reductions | 332,733,793 | |
Expense reductions | (6,448,403) | 326,285,390 |
Net investment income (loss) | | 486,439,991 |
Realized and Unrealized Gain (Loss) Net realized gain (loss) on: | | |
Investment securities: | | |
Unaffiliated issuers (net of foreign taxes of $1,783,507) | (337,674,020) | |
Other affiliated issuers | (213,110,117) | |
Foreign currency transactions | (11,019,334) | |
Capital gain distributions from Fidelity Central Funds | 50,714 | |
Total net realized gain (loss) | | (561,752,757) |
Change in net unrealized appreciation (depreciation) on: Investment securities (net of increase in deferred foreign taxes of $3,976,979) | 3,611,091,904 | |
Assets and liabilities in foreign currencies | 3,060,095 | |
Total change in net unrealized appreciation (depreciation) | | 3,614,151,999 |
Net gain (loss) | | 3,052,399,242 |
Net increase (decrease) in net assets resulting from operations | | $ 3,538,839,233 |
See accompanying notes which are an integral part of the financial statements.
Annual Report
Fidelity Diversified International Fund
Financial Statements - continued
Statement of Changes in Net Assets
| Year ended
October 31,
2010 | Year ended
October 31,
2009 |
Increase (Decrease) in Net Assets | | |
Operations | | |
Net investment income (loss) | $ 486,439,991 | $ 476,097,261 |
Net realized gain (loss) | (561,752,757) | (3,390,561,829) |
Change in net unrealized appreciation (depreciation) | 3,614,151,999 | 9,739,007,983 |
Net increase (decrease) in net assets resulting from operations | 3,538,839,233 | 6,824,543,415 |
Distributions to shareholders from net investment income | (474,506,693) | (412,836,673) |
Share transactions - net increase (decrease) | (3,995,252,806) | 129,291,951 |
Redemption fees | 822,251 | 1,098,454 |
Total increase (decrease) in net assets | (930,098,015) | 6,542,097,147 |
| | |
Net Assets | | |
Beginning of period | 35,749,333,133 | 29,207,235,986 |
End of period (including undistributed net investment income of $424,022,673 and undistributed net investment income of $412,089,844, respectively) | $ 34,819,235,118 | $ 35,749,333,133 |
Financial Highlights - Diversified International
Years ended October 31, | 2010 | 2009 | 2008 | 2007 | 2006 |
Selected Per-Share Data | | | | | |
Net asset value, beginning of period | $ 26.86 | $ 21.96 | $ 45.41 | $ 37.58 | $ 30.80 |
Income from Investment Operations | | | | | |
Net investment income (loss) B | .37 | .35 | .55 | .47 | .46 |
Net realized and unrealized gain (loss) | 2.61 | 4.86 | (20.96) | 10.23 | 7.33 |
Total from investment operations | 2.98 | 5.21 | (20.41) | 10.70 | 7.79 |
Distributions from net investment income | (.35) | (.31) | (.47) | (.36) | (.28) |
Distributions from net realized gain | - | - | (2.57) | (2.51) | (.73) |
Total distributions | (.35) | (.31) | (3.04) | (2.87) | (1.01) |
Redemption fees added to paid in capital B, F | - | - | - | - | - |
Net asset value, end of period | $ 29.49 | $ 26.86 | $ 21.96 | $ 45.41 | $ 37.58 |
Total Return A | 11.15% | 24.32% | (48.04)% | 30.37% | 25.89% |
Ratios to Average Net Assets C, E | | | | | |
Expenses before reductions | .98% | 1.01% | 1.04% | .93% | 1.01% |
Expenses net of fee waivers, if any | .98% | 1.01% | 1.04% | .93% | 1.01% |
Expenses net of all reductions | .96% | .99% | 1.02% | .91% | .97% |
Net investment income (loss) | 1.34% | 1.58% | 1.53% | 1.20% | 1.32% |
Supplemental Data | | | | | |
Net assets, end of period (000 omitted) | $ 26,527,229 | $ 30,998,270 | $ 28,274,961 | $ 59,929,942 | $ 43,965,189 |
Portfolio turnover rate D | 57% | 54% | 49% | 51% | 59% |
A Total returns would have been lower had certain expenses not been reduced during the periods shown.
B Calculated based on average shares outstanding during the period.
C Fees and expenses of the underlying Fidelity Central Funds are not included in the Fund's expense ratio. The Fund indirectly bears its proportionate share of the expenses of any underlying Fidelity Central Funds.
D Amount does not include the portfolio activity of any underlying Fidelity Central Funds.
E Expense ratios reflect operating expenses of the class. Expenses before reductions do not reflect amounts reimbursed by the investment adviser or reductions from brokerage service arrangements or reductions from other expense offset arrangements and do not represent the amount paid by the class during periods when reimbursements or reductions occur. Expenses net of fee waivers reflect expenses after reimbursement by the investment adviser but prior to reductions from brokerage service arrangements or other expense offset arrangements. Expenses net of all reductions represent the net expenses paid by the class.
F Amount represents less than $.01 per share.
See accompanying notes which are an integral part of the financial statements.
Annual Report
Financial Highlights - Class K
Years ended October 31, | 2010 | 2009 | 2008 G |
Selected Per-Share Data | | | |
Net asset value, beginning of period | $ 26.89 | $ 21.98 | $ 38.39 |
Income from Investment Operations | | | |
Net investment income (loss) D | .42 | .42 | .16 |
Net realized and unrealized gain (loss) | 2.61 | 4.85 | (16.57) |
Total from investment operations | 3.03 | 5.27 | (16.41) |
Distributions from net investment income | (.41) | (.36) | - |
Redemption fees added to paid in capital D,I | - | - | - |
Net asset value, end of period | $ 29.51 | $ 26.89 | $ 21.98 |
Total Return B, C | 11.33% | 24.64% | (42.75)% |
Ratios to Average Net Assets E, H | | | |
Expenses before reductions | .79% | .77% | .88% A |
Expenses net of fee waivers, if any | .79% | .77% | .88% A |
Expenses net of all reductions | .77% | .76% | .87% A |
Net investment income (loss) | 1.54% | 1.81% | 1.45% A |
Supplemental Data | | | |
Net assets, end of period (000 omitted) | $ 7,697,405 | $ 4,713,909 | $ 932,275 |
Portfolio turnover rate F | 57% | 54% | 49% |
A Annualized
B Total returns for periods of less than one year are not annualized.
C Total returns would have been lower had certain expenses not been reduced during the periods shown.
D Calculated based on average shares outstanding during the period.
E Fees and expenses of the underlying Fidelity Central Funds are not included in the Fund's expense ratio. The Fund indirectly bears its proportionate share of the expenses of any underlying Fidelity Central Funds.
F Amount does not include the portfolio activity of any underlying Fidelity Central Funds.
G For the period May 9, 2008 (commencement of sale of shares) to October 31, 2008.
H Expense ratios reflect operating expenses of the class. Expenses before reductions do not reflect amounts reimbursed by the investment adviser or reductions from brokerage service arrangements or reductions from other expense offset arrangements and do not represent the amount paid by the class during periods when reimbursements or reductions occur. Expense ratios before reductions for start-up periods may not be representative of longer-term operating periods. Expenses net of fee waivers reflect expenses after reimbursement by the investment adviser but prior to reductions from brokerage service arrangements or other expense offset arrangements. Expenses net of all reductions represent the net expenses paid by the class.
I Amount represents less than $.01 per share.
Financial Highlights - Class F
Years ended October 31, | 2010 | 2009 G |
Selected Per-Share Data | | |
Net asset value, beginning of period | $ 26.89 | $ 23.29 |
Income from Investment Operations | | |
Net investment income (loss) D | .43 | (.02) |
Net realized and unrealized gain (loss) | 2.62 | 3.62 |
Total from investment operations | 3.05 | 3.60 |
Distributions from net investment income | (.42) | - |
Redemption fees added to paid in capital D,I | - | - |
Net asset value, end of period | $ 29.52 | $ 26.89 |
Total Return B, C | 11.41% | 15.46% |
Ratios to Average Net Assets E, H | | |
Expenses before reductions | .73% | .71% A |
Expenses net of fee waivers, if any | .73% | .71% A |
Expenses net of all reductions | .72% | .70% A |
Net investment income (loss) | 1.59% | (.19)% A |
Supplemental Data | | |
Net assets, end of period (000 omitted) | $ 594,602 | $ 37,155 |
Portfolio turnover rate F | 57% | 54% |
A Annualized
B Total returns for periods of less than one year are not annualized.
C Total returns would have been lower had certain expenses not been reduced during the periods shown.
D Calculated based on average shares outstanding during the period.
E Fees and expenses of the underlying Fidelity Central Funds are not included in the Fund's expense ratio. The Fund indirectly bears its proportionate share of the expenses of any underlying Fidelity Central Funds.
F Amount does not include the portfolio activity of any underlying Fidelity Central Funds.
G For the period June 26, 2009 (commencement of sale of shares) to October 31, 2009.
H Expense ratios reflect operating expenses of the class. Expenses before reductions do not reflect amounts reimbursed by the investment adviser or reductions from brokerage service arrangements or reductions from other expense offset arrangements and do not represent the amount paid by the class during periods when reimbursements or reductions occur. Expense ratios before reductions for start-up periods may not be representative of longer-term operating periods. Expenses net of fee waivers reflect expenses after reimbursement by the investment adviser but prior to reductions from brokerage service arrangements or other expense offset arrangements. Expenses net of all reductions represent the net expenses paid by the class.
I Amount represents less than $.01 per share.
See accompanying notes which are an integral part of the financial statements.
Annual Report
Notes to Financial Statements
For the period ended October 31, 2010
1. Organization.
Fidelity Diversified International Fund (the Fund) is a fund of Fidelity Investment Trust (the Trust) and is authorized to issue an unlimited number of shares. The Trust is registered under the Investment Company Act of 1940, as amended (the 1940 Act), as an open-end management investment company organized as a Massachusetts business trust. The Fund offers Diversified International, Class K and Class F shares, each of which has equal rights as to assets and voting privileges. Each class has exclusive voting rights with respect to matters that affect that class. Class F shares of the Fund are only available for purchase by mutual funds for which Fidelity Management & Research Company (FMR) or an affiliate serves as investment manager. Investment income, realized and unrealized capital gains and losses, the common expenses of the Fund, and certain fund-level expense reductions, if any, are allocated on a pro-rata basis to each class based on the relative net assets of each class to the total net assets of the Fund. Each class differs with respect to transfer agent fees incurred. Certain expense reductions also differ by class. The Fund's investments in emerging markets can be subject to social, economic, regulatory, and political uncertainties and can be extremely volatile.
2. Investments in Fidelity Central Funds.
The Fund may invest in Fidelity Central Funds, which are open-end investment companies available only to other investment companies and accounts managed by FMR and its affiliates. The Fund's Schedule of Investments lists each of the Fidelity Central Funds held as of period end, if any, as an investment of the Fund, but does not include the underlying holdings of each Fidelity Central Fund. As an Investing Fund, the Fund indirectly bears its proportionate share of the expenses of the underlying Fidelity Central Funds.
The Money Market Central Funds seek preservation of capital and current income and are managed by Fidelity Investments Money Management, Inc. (FIMM), an affiliate of FMR.
A complete unaudited list of holdings for each Fidelity Central Fund is available upon request or at the Securities and Exchange Commission (the SEC) web site at www.sec.gov. In addition, the financial statements of the Fidelity Central Funds, which are not covered by the Fund's Report of Independent Registered Public Accounting Firm, are available on the SEC web site or upon request.
3. Significant Accounting Policies.
The financial statements have been prepared in conformity with accounting principles generally accepted in the United States of America (GAAP), which require management to make certain estimates and assumptions at the date of the financial statements. Actual results could differ from those estimates. The following summarizes the significant accounting policies of the Fund:
Security Valuation. Investments are valued as of 4:00 p.m. Eastern time on the last calendar day of the period. The Fund uses independent pricing services approved by the Board of Trustees to value its investments. When current market prices or quotations are not readily available or reliable, valuations may be determined in good faith in accordance with procedures adopted by the Board of Trustees. Factors used in determining value may include market or security specific events. The frequency with which these procedures are used cannot be predicted and they may be utilized to a significant extent. The value used for net asset value (NAV) calculation under these procedures may differ from published prices for the same securities.
The Fund categorizes the inputs to valuation techniques used to value its investments into a disclosure hierarchy consisting of three levels as shown below.
Level 1 - quoted prices in active markets for identical investments
Level 2 - other significant observable inputs (including quoted prices for similar investments, interest rates, prepayment speeds, etc.)
Level 3 - unobservable inputs (including the fund's own assumptions based on the best information available)
Changes in valuation techniques may result in transfers in or out of an assigned level within the disclosure hierarchy. The aggregate value of investments by input level, as of October 31, 2010, as well as a roll forward of Level 3 securities, is included at the end of the Fund's Schedule of Investments. Valuation techniques used to value the Fund's investments by major category are as follows.
Equity securities, including restricted securities, for which market quotations are readily available, are valued at the last reported sale price or official closing price as reported by an independent pricing service on the primary market or exchange on which they are traded and are categorized as Level 1 in the hierarchy. In the event there were no sales during the day or closing prices are not available, securities are valued at the last quoted bid price or may be valued using the last available price and are generally categorized as Level 2 in the hierarchy. For foreign equity securities, when significant market or security specific events arise, comparisons to the valuation of American Depositary Receipts (ADRs), futures contracts, Exchange-traded funds (ETFs) and certain indexes as well as quoted prices for similar securities are used and are categorized as Level 2 in the hierarchy in these circumstances. Utilizing these techniques may result in transfers between Level 1 and Level 2. For restricted equity securities and private placements where observable inputs are limited, assumptions about market activity and risk are used and are categorized as Level 3 in the hierarchy.
Annual Report
Notes to Financial Statements - continued
3. Significant Accounting Policies - continued
Security Valuation - continued
Investments in open-end mutual funds,including the Fidelity Central Funds, are valued at their closing net asset value each business day and are categorized as Level 1 in the hierarchy. Short-term securities with remaining maturities of sixty days or less for which quotations are not readily available are valued at amortized cost, which approximates fair value and are categorized as Level 2 in the hierarchy.
Foreign Currency. The Fund uses foreign currency contracts to facilitate transactions in foreign-denominated securities. Gains and losses from these transactions may arise from changes in the value of the foreign currency or if the counterparties do not perform under the contracts' terms.
Foreign-denominated assets, including investment securities, and liabilities are translated into U.S. dollars at the exchange rate at period end. Purchases and sales of investment securities, income and dividends received and expenses denominated in foreign currencies are translated into U.S. dollars at the exchange rate in effect on the transaction date.
The effects of exchange rate fluctuations on investments are included with the net realized and unrealized gain (loss) on investment securities. Other foreign currency transactions resulting in realized and unrealized gain (loss) are disclosed separately.
Investment Transactions and Income. For financial reporting purposes, the Fund's investment holdings and NAV include trades executed through the end of the last business day of the period. The NAV per share for processing shareholder transactions is calculated as of the close of business of the New York Stock Exchange (NYSE), normally 4:00 p.m. Eastern time and includes trades executed through the end of the prior business day. Gains and losses on securities sold are determined on the basis of identified cost and may include proceeds received from litigation. Dividend income is recorded on the ex-dividend date, except for certain dividends from foreign securities where the ex-dividend date may have passed, which are recorded as soon as the Fund is informed of the ex-dividend date. Non-cash dividends included in dividend income, if any, are recorded at the fair market value of the securities received. Distributions received on securities that represent a return of capital or capital gain are recorded as a reduction of cost of investments and/or as a realized gain. The Fund estimates the components of distributions received that may be considered return of capital distributions or capital gain distributions. Interest income and distributions from the Fidelity Central Funds are accrued as earned. Interest income includes coupon interest and amortization of premium and accretion of discount on debt securities. Investment income is recorded net of foreign taxes withheld where recovery of such taxes is uncertain.
Expenses. Most expenses of the Trust can be directly attributed to a fund. Expenses which cannot be directly attributed are apportioned amongst each fund in the Trust. Expense estimates are accrued in the period to which they relate and adjustments are made when actual amounts are known.
Deferred Trustee Compensation. Under a Deferred Compensation Plan (the Plan), independent Trustees may elect to defer receipt of a portion of their annual compensation. Deferred amounts are invested in a cross-section of Fidelity funds, are marked-to-market and remain in the Fund until distributed in accordance with the Plan. The investment of deferred amounts and the offsetting payable to the Trustees are included in the accompanying Statement of Assets and Liabilities.
Income Tax Information and Distributions to Shareholders. Each year the Fund intends to qualify as a regulated investment company, including distributing substantially all of its taxable income and realized gains under Subchapter M of the Internal Revenue Code and filing its U.S. federal tax return. As a result, no provision for income taxes is required. As of October 31, 2010, the Fund did not have any unrecognized tax benefits in the accompanying financial statements. A fund's federal tax return is subject to examination by the Internal Revenue Service (IRS) for a period of three years. Foreign taxes are provided for based on the Fund's understanding of the tax rules and rates that exist in the foreign markets in which it invests. The Fund is subject to a tax imposed on short term capital gains on securities of certain issuers domiciled in India. The Fund records an estimated deferred tax liability included in Other payables and accrued expenses in the accompanying Statement of Assets & Liabilities for net unrealized gains on these securities in an amount that would be payable if the securities were disposed of at period end.
Distributions are declared and recorded on the ex-dividend date. Income dividends and capital gain distributions are declared separately for each class. Income and capital gain distributions are determined in accordance with income tax regulations, which may differ from GAAP.
Capital accounts within the financial statements are adjusted for permanent book-tax differences. These adjustments have no impact on net assets or the results of operations. Temporary book-tax differences will reverse in a subsequent period.
Book-tax differences are primarily due to the short-term gain distributions from the Fidelity Central Funds, foreign currency transactions, certain foreign taxes, passive foreign investment companies (PFIC), deferred trustees compensation, capital loss carryforwards and losses deferred due to wash sales.
Annual Report
3. Significant Accounting Policies - continued
Income Tax Information and Distributions to Shareholders - continued
The federal tax cost of investment securities and unrealized appreciation (depreciation) as of period end were as follows:
Gross unrealized appreciation | $ 7,056,729,422 |
Gross unrealized depreciation | (962,448,025) |
Net unrealized appreciation (depreciation) | $ 6,094,281,397 |
| |
Tax Cost | $ 29,246,215,794 |
The tax-based components of distributable earnings as of period end were as follows:
Undistributed ordinary income | $ 515,990,332 |
Capital loss carryforward | $ (5,177,653,127) |
Net unrealized appreciation (depreciation) | $ (6,099,096,385) |
The tax character of distributions paid was as follows:
| October 31, 2010 | October 31, 2009 |
Ordinary Income | $ 474,506,693 | $ 412,836,673 |
Short-Term Trading (Redemption) Fees. Shares held by investors in the Fund less than 30 days are subject to a redemption fee equal to 1.00% of the net asset value of shares redeemed. All redemption fees, which reduce the proceeds of the shareholder redemption, are retained by the Fund and accounted for as an addition to paid in capital.
4. Operating Policies.
Restricted Securities. The Fund may invest in securities that are subject to legal or contractual restrictions on resale. These securities generally may be resold in transactions exempt from registration or to the public if the securities are registered. Disposal of these securities may involve time-consuming negotiations and expense, and prompt sale at an acceptable price may be difficult. Information regarding restricted securities is included at the end of the Fund's Schedule of Investments.
5. Purchases and Sales of Investments.
Purchases and sales of securities, other than short-term securities, aggregated $19,113,606,387 and $23,210,049,761, respectively.
6. Fees and Other Transactions with Affiliates.
Management Fee. FMR and its affiliates provide the Fund with investment management related services for which the Fund pays a monthly management fee. The management fee is the sum of an individual fund fee rate that is based on an annual rate of .45% of the Fund's average net assets and a group fee rate that averaged .26% during the period. The group fee rate is based upon the average net assets of all the mutual funds advised by FMR. The group fee rate decreases as assets under management increase and increases as assets under management decrease. In addition, the management fee is subject to a performance adjustment (up to a maximum of ±.20% of the Fund's average net assets over a 36 month performance period). The upward or downward adjustment to the management fee is based on the relative investment performance of Diversified International as compared to an appropriate benchmark index. For the period, the total annual management fee rate, including the performance adjustment, was .70% of the Fund's average net assets.
Transfer Agent Fees. Fidelity Investments Institutional Operations Company, Inc. (FIIOC), an affiliate of FMR, is the transfer, dividend disbursing and shareholder servicing agent for each class of the Fund. FIIOC receives account fees and asset-based fees that vary according to the account size and type of account of the shareholders of Diversified International. FIIOC receives an asset-based fee of Class K's average net assets. FIIOC receives no fees for providing transfer agency services to Class F. FIIOC pays for typesetting, printing and mailing of shareholder reports, except proxy statements. For the period, transfer agent fees for each class were as follows:
Annual Report
Notes to Financial Statements - continued
6. Fees and Other Transactions with Affiliates - continued
Transfer Agent Fees - continued
| Amount | % of
Average
Net Assets |
Diversified International | 70,681,751 | .25 |
Class K | 3,258,427 | .05 |
| $ 73,940,178 | |
Accounting and Security Lending Fees. Fidelity Service Company, Inc. (FSC), an affiliate of FMR, maintains the Fund's accounting records. The accounting fee is based on the level of average net assets for the month. Under a separate contract, FSC administers the security lending program. The security lending fee is based on the number and duration of lending transactions.
Brokerage Commissions. The Fund placed a portion of its portfolio transactions with brokerage firms which are affiliates of the investment adviser. The commissions paid to these affiliated firms were $73,316 for the period.
Interfund Lending Program. Pursuant to an Exemptive Order issued by the SEC, the Fund, along with other registered investment companies having management contracts with FMR, may participate in an interfund lending program. This program provides an alternative credit facility allowing the funds to borrow from, or lend money to, other participating affiliated funds. At period end, there were no interfund loans outstanding. The Fund's activity in this program during the period for which loans were outstanding was as follows:
Borrower or Lender | Average Daily
Loan Balance | Weighted Average
Interest Rate | Interest
Expense |
Borrower | $ 30,883,000 | .46% | $ 393 |
7. Committed Line of Credit.
The Fund participates with other funds managed by FMR or an affiliate in a $3.75 billion credit facility (the "line of credit") to be utilized for temporary or emergency purposes to fund shareholder redemptions or for other short-term liquidity purposes. The Fund has agreed to pay commitment fees on its pro-rata portion of the line of credit, which amounted to $139,855 and is reflected in Miscellaneous expenses on the Statement of Operations. During the period, there were no borrowings on this line of credit.
8. Security Lending.
The Fund lends portfolio securities through a lending agent from time to time in order to earn additional income. The lending agent may loan securities to certain qualified borrowers, including Fidelity Capital Markets (FCM), a broker dealer affiliated with the Fund. On the settlement date of the loan, the Fund receives collateral (in the form of U.S. Treasury obligations, letters of credit and/or cash) against the loaned securities and maintains collateral in an amount not less than 100% of the market value of the loaned securities during the period of the loan. The market value of the loaned securities is determined at the close of business of the Fund and any additional required collateral is delivered to the Fund on the next business day. If the borrower defaults on its obligation to return the securities loaned because of insolvency or other reasons, a fund could experience delays and costs in recovering the securities loaned or in gaining access to the collateral. Any cash collateral received is invested in the Fidelity Securities Lending Cash Central Fund. The value of loaned securities and cash collateral at period end are disclosed on the Fund's Statement of Assets and Liabilities. Security lending income represents the income earned on investing cash collateral, less rebates paid to borrowers and lending agent fees associated with the loan, plus any premium payments received for lending certain types of securities. Security lending income is presented in the Statement of Operations as a component of income from Fidelity Central Funds. Total security lending income during the period amounted to $21,351,864. During the period, there were no securities loaned to FCM.
9. Expense Reductions.
Many of the brokers with whom FMR places trades on behalf of the Fund provided services to the Fund in addition to trade execution. These services included payments of certain expenses on behalf of the Fund totaling $6,448,114 for the period. In addition, through arrangements with the Fund's custodian, credits realized as a result of uninvested cash balances were used to reduce the Fund's expenses. During the period, these credits reduced the Fund's custody expenses by $289.
Annual Report
10. Distributions to Shareholders.
Distributions to shareholders of each class were as follows:
Years ended October 31, | 2010 | 2009A |
From net investment income | | |
Diversified International | $ 398,456,259 | $ 394,538,470 |
Class K | 74,880,028 | 18,298,203 |
Class F | 1,170,406 | - |
Total | $ 474,506,693 | $ 412,836,673 |
A Distributions to shareholders for Class F are for the period June 26, 2009 (commencement of sale of shares) to October 31, 2009.
11. Share Transactions.
Transactions for each class of shares were as follows:
| Shares | Dollars |
Years ended October 31, | 2010 | 2009A | 2010 | 2009A |
Diversified International | | | | |
Shares sold | 179,662,935 | 266,412,212 | $ 4,893,668,837 | $ 5,884,913,394 |
Conversion to Class K B | - | (113,348,310) | - | (2,310,072,040) |
Reinvestment of distributions | 13,627,007 | 20,012,374 | 384,281,814 | 380,635,740 |
Shares redeemed | (447,584,331) | (307,025,690) | (12,092,134,122) | (6,660,643,668) |
Net increase (decrease) | (254,294,389) | (133,949,414) | $ (6,814,183,471) | $ (2,705,166,574) |
Class K | | | | |
Shares sold | 151,794,829 | 46,252,428 | $ 4,125,917,772 | $ 1,096,724,275 |
Conversion from Diversified InternationalB | - | 113,393,333 | - | 2,310,072,040 |
Reinvestment of distributions | 2,657,205 | 963,570 | 74,880,028 | 18,298,203 |
Shares redeemed | (68,937,812) | (27,732,811) | (1,889,669,527) | (629,090,058) |
Net increase (decrease) | 85,514,222 | 132,876,520 | $ 2,311,128,273 | $ 2,796,004,460 |
Class F | | | | |
Shares sold | 24,587,499 | 1,396,615 | $ 664,182,809 | $ 38,873,992 |
Reinvestment of distributions | 41,548 | - | 1,170,406 | - |
Shares redeemed | (5,866,038) | (14,952) | (157,550,823) | (419,927) |
Net increase (decrease) | 18,763,009 | 1,381,663 | $ 507,802,392 | $ 38,454,065 |
A Share transactions for Class F are for the period June 26, 2009 (commencement of sale of shares) to October 31, 2009.
B Conversion transactions for Class K and Diversified International are presented for the period November 1, 2008 through August 31, 2009.
12. Other.
The Fund's organizational documents provide former and current trustees and officers with a limited indemnification against liabilities arising in connection with the performance of their duties to the Fund. In the normal course of business, the Fund may also enter into contracts that provide general indemnifications. The Fund's maximum exposure under these arrangements is unknown as this would be dependent on future claims that may be made against the Fund. The risk of material loss from such claims is considered remote.
Annual Report
Report of Independent Registered Public Accounting Firm
To the Trustees of Fidelity Investment Trust and Shareholders of Fidelity Diversified International Fund:
We have audited the accompanying statement of assets and liabilities of Fidelity Diversified International Fund (the Fund), a fund of Fidelity Investment Trust, including the schedule of investments, as of October 31, 2010, and the related statement of operations for the year then ended, the statement of changes in net assets for each of the two years in the period then ended, and the financial highlights for each of the five years in the period then ended. These financial statements and financial highlights are the responsibility of the Fund's management. Our responsibility is to express an opinion on these financial statements and financial highlights based on our audits.
We conducted our audits in accordance with standards of the Public Company Accounting Oversight Board (United States). Those standards require that we plan and perform the audit to obtain reasonable assurance about whether the financial statements and financial highlights are free of material misstatement. The Fund is not required to have, nor were we engaged to perform, an audit of its internal control over financial reporting. Our audits included consideration of internal control over financial reporting as a basis for designing audit procedures that are appropriate in the circumstances, but not for the purpose of expressing an opinion on the effectiveness of the Fund's internal control over financial reporting. Accordingly, we express no such opinion. An audit also includes examining, on a test basis, evidence supporting the amounts and disclosures in the financial statements, assessing the accounting principles used and significant estimates made by management, as well as evaluating the overall financial statement presentation. Our procedures included confirmation of securities owned as of October 31, 2010, by correspondence with the custodians and brokers; where replies were not received from brokers, we performed other auditing procedures. We believe that our audits provide a reasonable basis for our opinion.
In our opinion, the financial statements and financial highlights referred to above present fairly, in all material respects, the financial position of Fidelity Diversified International Fund as of October 31, 2010, the results of its operations for the year then ended, the changes in its net assets for each of the two years in the period then ended, and its financial highlights for each of the five years in the period then ended, in conformity with accounting principles generally accepted in the United States of America.
/s/ Deloitte & Touche LLP
DELOITTE & TOUCHE LLP
Boston, Massachusetts
December 17, 2010
Annual Report
The Trustees Member of the Advisory Board, and executive officers of the trust and fund, as applicable, are listed below. The Board of Trustees governs the fund and is responsible for protecting the interests of shareholders. The Trustees are experienced executives who meet periodically throughout the year to oversee the fund's activities, review contractual arrangements with companies that provide services to the fund, oversee management of the risks associated with such activities and contractual arrangements, and review the fund's performance. Except for James C. Curvey, each of the Trustees oversees 221 funds advised by FMR or an affiliate. Mr. Curvey oversees 410 funds advised by FMR or an affiliate.
The Trustees hold office without limit in time except that (a) any Trustee may resign; (b) any Trustee may be removed by written instrument, signed by at least two-thirds of the number of Trustees prior to such removal; (c) any Trustee who requests to be retired or who has become incapacitated by illness or injury may be retired by written instrument signed by a majority of the other Trustees; and (d) any Trustee may be removed at any special meeting of shareholders by a two-thirds vote of the outstanding voting securities of the trust. Each Trustee who is not an interested person (as defined in the 1940 Act) (Independent Trustee), shall retire not later than the last day of the calendar year in which his or her 72nd birthday occurs. The Independent Trustees may waive this mandatory retirement age policy with respect to individual Trustees. The executive officers and Advisory Board Member hold office without limit in time, except that any officer and Advisory Board Member may resign or may be removed by a vote of a majority of the Trustees at any regular meeting or any special meeting of the Trustees. Except as indicated, each individual has held the office shown or other offices in the same company for the past five years.
Experience, Skills, Attributes, and Qualifications of the Fund's Trustees. The Governance and Nominating Committee has adopted a statement of policy that describes the experience, qualifications, attributes, and skills that are necessary and desirable for potential Independent Trustee candidates (Statement of Policy). The Board believes that each Trustee satisfied at the time he or she was initially elected or appointed a Trustee, and continues to satisfy, the standards contemplated by the Statement of Policy. The Governance and Nominating Committee also engages professional search firms to help identify potential Independent Trustee candidates who have the experience, qualifications, attributes, and skills consistent with the Statement of Policy. From time to time, additional criteria based on the composition and skills of the current Independent Trustees, as well as experience or skills that may be appropriate in light of future changes to board composition, business conditions, and regulatory or other developments, have also been considered by the professional search firms and the Governance and Nominating Committee. In addition, the Board takes into account the Trustees' commitment and participation in Board and committee meetings, as well as their leadership of standing and ad hoc committees throughout their tenure.
In determining that a particular Trustee was and continues to be qualified to serve as a Trustee, the Board has considered a variety of criteria, none of which, in isolation, was controlling. The Board believes that, collectively, the Trustees have balanced and diverse experience, qualifications, attributes, and skills, which allow the Board to operate effectively in governing the fund and protecting the interests of shareholders. Information about the specific experience, skills, attributes, and qualifications of each Trustee, which in each case led to the Board's conclusion that the Trustee should serve (or continue to serve) as a trustee of the fund, is provided below.
Board Structure and Oversight Function. Edward C. Johnson 3d is an interested person (as defined in the 1940 Act) and currently serves as Chairman. The Trustees have determined that an interested Chairman is appropriate and benefits shareholders because an interested Chairman has a personal and professional stake in the quality and continuity of services provided to the fund. Independent Trustees exercise their informed business judgment to appoint an individual of their choosing to serve as Chairman, regardless of whether the Trustee happens to be independent or a member of management. The Independent Trustees have determined that they can act independently and effectively without having an Independent Trustee serve as Chairman and that a key structural component for assuring that they are in a position to do so is for the Independent Trustees to constitute a substantial majority for the Board. The Independent Trustees also regularly meet in executive session. Ned C. Lautenbach serves as Chairman of the Independent Trustees and as such (i) acts as a liaison between the Independent Trustees and management with respect to matters important to the Independent Trustees and (ii) with management prepares agendas for Board meetings.
Fidelity funds are overseen by different Boards of Trustees. The fund's Board oversees Fidelity's equity and high income funds and another Board oversees Fidelity's investment-grade bond, money market, and asset allocation funds. The asset allocation funds may invest in Fidelity funds overseen by the fund's Board. The use of separate Boards, each with its own committee structure, allows the Trustees of each group of Fidelity funds to focus on the unique issues of the funds they oversee, including common research, investment, and operational issues. On occasion, the separate Boards establish joint committees to address issues of overlapping consequences for the Fidelity funds overseen by each Board.
The Trustees operate using a system of committees to facilitate the timely and efficient consideration of all matters of importance to the Trustees, the fund, and fund shareholders and to facilitate compliance with legal and regulatory requirements and oversight of the fund's activities and associated risks. The Board, acting through its committees, has charged FMR and its affiliates with (i) identifying events or circumstances the occurrence of which could have demonstrably adverse effects on the fund's business and/or reputation; (ii) implementing processes and controls to lessen the possibility that such events or circumstances occur or to mitigate the effects of such events or circumstances if they do occur; and (iii) creating and maintaining a system designed to evaluate continuously business and market conditions in order to facilitate the identification and implementation processes described in (i) and (ii) above. Because the day-to-day operations and activities of the fund are carried out by or through FMR, its affiliates and other service providers, the fund's exposure to risks is mitigated but not eliminated by the processes overseen by the Trustees. While each of the Board's committees has responsibility for overseeing different aspects of the fund's activities, oversight is exercised primarily through the Operations, Audit, and Compliance Committees. Appropriate personnel, including but not limited to the fund's Chief Compliance Officer (CCO), FMR's internal auditor, the independent accountants, the fund's Treasurer and portfolio management personnel, make periodic reports to the Board's committees, as appropriate. The responsibilities of each committee, including their oversight responsibilities, are described further under "Standing Committees of the Fund's Trustees."
Annual Report
The fund's Statement of Additional Information (SAI) includes more information about the Trustees. To request a free copy, call Fidelity at 1-800-835-5092.
Interested Trustees*:
Correspondence intended for each Trustee who is an interested person may be sent to Fidelity Investments, 82 Devonshire Street, Boston, Massachusetts 02109.
Name, Age; Principal Occupations and Other Relevant Experience+ |
Edward C. Johnson 3d (80) |
| Year of Election or Appointment: 1984 Mr. Johnson is Trustee and Chairman of the Board of Trustees of certain Trusts. Mr. Johnson serves as Chief Executive Officer, Chairman, and a Director of FMR LLC; Chairman and a Director of FMR; Chairman and a Director of Fidelity Research & Analysis Company (FRAC); Chairman and a Director of Fidelity Investments Money Management, Inc.; and Chairman and a Director of FMR Co., Inc. In addition, Mr. Johnson serves as Chairman and Director of FIL Limited. Previously, Mr. Johnson served as President of FMR LLC (2006-2007). |
James C. Curvey (75) |
| Year of Election or Appointment: 2007 Mr. Curvey also serves as Trustee (2007-present) of other investment companies advised by FMR. Mr. Curvey is a Director of Fidelity Investments Money Management, Inc. (2009-present), Director of Fidelity Research & Analysis Co. (2009-present) and Director of FMR and FMR Co., Inc. (2007-present). Mr. Curvey is also Vice Chairman (2007-present) and Director of FMR LLC. In addition, Mr. Curvey serves as an Overseer for the Boston Symphony Orchestra and a member of the Trustees of Villanova University. Previously, Mr. Curvey was the Vice Chairman (2006-2007) and Director (2000-2007) of FMR Corp. |
* Trustees have been determined to be "Interested Trustees" by virtue of, among other things, their affiliation with the trust or various entities under common control with FMR.
+ The information above includes each Trustee's principal occupation during the last five years and other information relating to the experience, attributes, and skills relevant to each Trustee's qualifications to serve as a Trustee, which led to the conclusion that each Trustee should serve as a Trustee for each fund.
Independent Trustees:
Correspondence intended for each Independent Trustee (that is, the Trustees other than the Interested Trustees) may be sent to Fidelity Investments, P.O. Box 55235, Boston, Massachusetts 02205-5235.
Name, Age; Principal Occupations and Other Relevant Experience+ |
Dennis J. Dirks (62) |
| Year of Election or Appointment: 2005 Prior to his retirement in May 2003, Mr. Dirks was Chief Operating Officer and a member of the Board of The Depository Trust & Clearing Corporation (DTCC). He also served as President, Chief Operating Officer, and Board member of The Depository Trust Company (DTC) and President and Board member of the National Securities Clearing Corporation (NSCC). In addition, Mr. Dirks served as Chief Executive Officer and Board member of the Government Securities Clearing Corporation, Chief Executive Officer and Board member of the Mortgage-Backed Securities Clearing Corporation, as a Trustee and a member of the Finance Committee of Manhattan College (2005-2008), and as a Trustee and a member of the Finance Committee of AHRC of Nassau County (2006-2008). Mr. Dirks is a member of the Independent Directors Council (IDC) Governing Council (2010-Present) and Board of Directors for The Brookville Center for Children's Services, Inc. (2009-present). |
Alan J. Lacy (57) |
| Year of Election or Appointment: 2008 Mr. Lacy serves as Senior Adviser (2007-present) of Oak Hill Capital Partners, L.P. (private equity). Mr. Lacy also served as Chief Executive Officer (2000-2005) and Vice Chairman (2005-2006) of Sears Holdings Corporation and Sears, Roebuck and Co. (retail). In addition, Mr. Lacy serves as a member of the Board of Directors of The Western Union Company (global money transfer, 2006-present) and Bristol-Myers Squibb Company (global pharmaceuticals, 2007-present). Mr. Lacy is Chairman (2008-present) and a member (2006-present) of the Board of Trustees of The National Parks Conservation Association. |
Ned C. Lautenbach (66) |
| Year of Election or Appointment: 2000 Mr. Lautenbach is Chairman of the Independent Trustees of the Equity and High Income Funds (2006-present). Mr. Lautenbach currently serves as the Lead Director of the Eaton Corporation Board of Directors (diversified industrial, 1997-present). Mr. Lautenbach is also a member of the Board of Directors of the Philharmonic Center for the Arts in Naples, Florida (1999-
present); a member of the Board of Trustees of Fairfield University (2005-present); and a member of the Council on Foreign Relations (1994-present). Previously, Mr. Lautenbach was a Partner/Advisory Partner at Clayton, Dubilier & Rice, Inc. (private equity investment, 1998-2010), as well as a Director of Sony Corporation (2006-2007). |
Joseph Mauriello (66) |
| Year of Election or Appointment: 2008 Prior to his retirement in January 2006, Mr. Mauriello served in numerous senior management positions including Deputy Chairman and Chief Operating Officer (2004-2005), and Vice Chairman of Financial Services (2002-2004) of KPMG LLP US (professional services, 1965-2005). Mr. Mauriello currently serves as a member of the Board of Directors of XL Group plc. (global insurance and re-insurance, 2006-present) and of Arcadia Resources Inc. (health care services and products, 2007-present). Previously, Mr. Mauriello served as a Director of the Hamilton Funds of the Bank of New York (2006-2007). |
Cornelia M. Small (66) |
| Year of Election or Appointment: 2005 Ms. Small is a member of the Board of Directors of the Teagle Foundation (2009-present). Ms. Small is also a member of the Investment Committee, and Chair (2008-present) and a member of the Board of Trustees of Smith College. In addition, Ms. Small serves on the Investment Committee of the Berkshire Taconic Community Foundation (2008-present). Previously, Ms. Small served as Chairperson of the Investment Committee (2002-2008) of Smith College. In addition, Ms. Small served as Chief Investment Officer, Director of Global Equity Investments, and a member of the Board of Directors of Scudder, Stevens & Clark and Scudder Kemper Investments. |
William S. Stavropoulos (71) |
| Year of Election or Appointment: 2001 Mr. Stavropoulos is Vice Chairman of the Independent Trustees of the Equity and High Income Funds (2006-present). Mr. Stavropoulos serves as President and Founder of the Michigan Baseball Foundation, the Great Lakes Loons (2007-present). Mr. Stavropoulos is Chairman Emeritus of the Board of Directors of The Dow Chemical Company, where he previously served in numerous senior management positions, including President, CEO (1995-2000; 2002-2004), Chairman of the Executive Committee (2000-2006), and as a member of the Board of Directors (1990-2006). Currently, Mr. Stavropoulos is Chairman of Univar (global distributor of commodity and specialty chemicals, 2010-present), a Director of Teradata Corporation (data warehousing and technology solutions, 2008-present), Chemical Financial Corporation, Maersk Inc. (industrial conglomerate), Tyco International, Inc. (multinational manufacturing and services, 2007-present), and a member of the Advisory Board for Metalmark Capital (private equity investment, 2005-present). Mr. Stavropoulos is a special advisor to Clayton, Dubilier & Rice, Inc. (private equity investment). In addition, Mr. Stavropoulos is a member of the University of Notre Dame Advisory Council for the College of Science. |
David M. Thomas (61) |
| Year of Election or Appointment: 2008 Previously, Mr. Thomas served as Executive Chairman (2005-2006) and Chairman and Chief Executive Officer (2000-2005) of IMS Health, Inc. (pharmaceutical and healthcare information solutions). In addition, Mr. Thomas serves as a member of the Board of Directors of Fortune Brands, Inc. (consumer products), and Interpublic Group of Companies, Inc. (marketing communication, 2004-present). |
Michael E. Wiley (60) |
| Year of Election or Appointment: 2008 Mr. Wiley also serves as a Director of Asia Pacific Exploration Consolidated (international oil and gas exploration and production, 2008-present). Mr. Wiley serves as a Director of Tesoro Corporation (independent oil refiner and marketer, 2005-present), and a Director of Bill Barrett Corporation (exploration and production, 2005-present). In addition, Mr. Wiley also serves as a Director of Post Oak Bank (privately-held bank, 2004-present). Previously, Mr. Wiley served as a member of the Board of Trustees of the University of Tulsa (2000-2006; 2007-2010), as a Senior Energy Advisor of Katzenbach Partners, LLC (consulting, 2006-2007), as an Advisory Director of Riverstone Holdings (private investment), Chairman, President, and CEO of Baker Hughes, Inc. (oilfield services, 2000-2004), and as Director of Spinnaker Exploration Company (exploration and production, 2001-2005). |
+ The information above includes each Trustee's principal occupation during the last five years and other information relating to the experience, attributes, and skills relevant to each Trustee's qualifications to serve as a Trustee, which led to the conclusion that each Trustee should serve as a Trustee for each fund.
Annual Report
Advisory Board Member and Executive Officers:
Correspondence intended for each executive officer, and Peter S. Lynch may be sent to Fidelity Investments, 82 Devonshire Street, Boston, Massachusetts 02109.
Name, Age; Principal Occupation |
Peter S. Lynch (66) |
| Year of Election or Appointment: 2003 Member of the Advisory Board of Fidelity's Equity and High Income Funds. Mr. Lynch is Vice Chairman and a Director of FMR and FMR Co., Inc. In addition, Mr. Lynch serves as a Trustee of Boston College and as the Chairman of the Inner-City Scholarship Fund. Previously, Mr. Lynch served on the Special Olympics International Board of Directors (1997-2006). |
Kenneth B. Robins (41) |
| Year of Election or Appointment: 2008 President and Treasurer of Fidelity's Equity and High Income Funds. Mr. Robins also serves as President and Treasurer (2010-
present) and Assistant Treasurer (2009-present) of other Fidelity funds and is an employee of Fidelity Investments (2004-present). Previously, Mr. Robins served as Deputy Treasurer of the Fidelity funds (2005-2008) and Treasurer and Chief Financial Officer of The North Carolina Capital Management Trust: Cash and Term Portfolios (2006-2008). |
Bruce T. Herring (45) |
| Year of Election or Appointment: 2006 Vice President of certain Equity Funds. Mr. Herring also serves as Chief Investment Officer and Director of Fidelity Management & Research (U.K.) Inc. (2010-present) and Group Chief Investments Officer of FMR. Previously, Mr. Herring served as Vice President (2005-2006) and Senior Vice President (2006-2007) of Fidelity Management & Research Company, Vice President of FMR Co., Inc. (2001-2007) and as a portfolio manager for Fidelity U.S. Equity Funds. |
Brian B. Hogan (46) |
| Year of Election or Appointment: 2009 Vice President of certain Equity Funds and Vice President of Sector Funds. Mr. Hogan also serves as President of FMR's Equity Division (2009-present). Previously, Mr. Hogan served as Senior Vice President, Equity Research of FMR (2006-2009) and as a portfolio manager. |
Scott C. Goebel (42) |
| Year of Election or Appointment: 2008 Secretary and Chief Legal Officer (CLO) of the Fidelity funds. Mr. Goebel also serves as Secretary and CLO of The North Carolina Capital Management Trust: Cash and Term Portfolio (2008-present); General Counsel, Secretary, and Senior Vice President of FMR (2008-present) and FMR Co., Inc. (2008-present); Deputy General Counsel of FMR LLC; Chief Legal Officer of Fidelity Management & Research (Hong Kong) Limited (2008-present) and Assistant Secretary of Fidelity Management & Research (Japan) Inc. (2008-present), Fidelity Investments Money Management, Inc. (2008-present), Fidelity Management & Research (U.K.) Inc. (2008-present), and Fidelity Research and Analysis Company (2008-present). Previously, Mr. Goebel served as Assistant Secretary of the Funds (2007-2008) and as Vice President and Secretary of Fidelity Distributors Corporation (FDC) (2005-2007). |
William C. Coffey (41) |
| Year of Election or Appointment: 2009 Assistant Secretary of Fidelity's Equity and High Income Funds. Mr. Coffey also serves as Senior Vice President and Deputy General Counsel of FMR LLC (2010-present), and is an employee of Fidelity Investments. Previously, Mr. Coffey served as Vice President and Associate General Counsel of FMR LLC (2005-2009). |
Holly C. Laurent (56) |
| Year of Election or Appointment: 2008 Anti-Money Laundering (AML) Officer of the Fidelity funds. Ms. Laurent also serves as AML Officer of The North Carolina Capital Management Trust: Cash and Term Portfolio (2008-present) and is an employee of Fidelity Investments. Previously, Ms. Laurent was Senior Vice President and Head of Legal for Fidelity Business Services India Pvt. Ltd. (2006-2008), and Senior Vice President, Deputy General Counsel and Group Head for FMR LLC (2005-2006). |
Christine Reynolds (52) |
| Year of Election or Appointment: 2008 Chief Financial Officer of the Fidelity funds. Ms. Reynolds became President of Fidelity Pricing and Cash Management Services (FPCMS) in August 2008. Ms. Reynolds served as Chief Operating Officer of FPCMS (2007-2008). Previously, Ms. Reynolds served as President, Treasurer, and Anti-Money Laundering officer of the Fidelity funds (2004-2007). |
Kenneth A. Rathgeber (63) |
| Year of Election or Appointment: 2004 Chief Compliance Officer of Fidelity's Equity and High Income Funds. Mr. Rathgeber is Chief Compliance Officer of Fidelity Management & Research (Hong Kong) Limited (2008-present), Fidelity Management & Research (Japan) Inc. (2008-present), FMR (2005-present), FMR Co., Inc. (2005-present), Fidelity Management & Research (U.K.) Inc. (2005-present), Fidelity Research & Analysis Company (2005-present), Fidelity Investments Money Management, Inc. (2005-present), Pyramis Global Advisors, LLC (2005-present), and Strategic Advisers, Inc. (2005-present). |
Jeffrey S. Christian (49) |
| Year of Election or Appointment: 2009 Deputy Treasurer of the Fidelity funds. Mr. Christian is an employee of Fidelity Investments. Previously, Mr. Christian served as Chief Financial Officer (2008-2009) of certain Fidelity funds and Senior Vice President of Fidelity Pricing and Cash Management Services (FPCMS) (2004-2009). |
Bryan A. Mehrmann (49) |
| Year of Election or Appointment: 2005 Deputy Treasurer of the Fidelity funds. Mr. Mehrmann is an employee of Fidelity Investments. |
Adrien E. Deberghes (43) |
| Year of Election or Appointment: 2008 Deputy Treasurer of Fidelity's Equity and High Income Funds. Mr. Deberghes also serves as Assistant Treasurer of other Fidelity funds (2010-present) and is an employee of Fidelity Investments (2008-present). Previously, Mr. Deberghes served as Senior Vice President of Mutual Fund Administration at State Street Corporation (2007-2008), Senior Director of Mutual Fund Administration at Investors Bank & Trust (2005-2007), and Director of Finance for Dunkin' Brands (2000-2005). |
Stephanie J. Dorsey (41) |
| Year of Election or Appointment: 2010 Assistant Treasurer of Fidelity's Equity and High Income Funds. Ms. Dorsey also serves as Deputy Treasurer of other Fidelity funds (2008-present) and is an employee of Fidelity Investments (2008-present). Previously, Ms. Dorsey served as Treasurer (2004-2008) of the JPMorgan Mutual Funds and Vice President (2004-2008) of JPMorgan Chase Bank. |
John R. Hebble (52) |
| Year of Election or Appointment: 2009 Assistant Treasurer of Fidelity's Equity and High Income Funds. Mr. Hebble also serves as Treasurer and Chief Financial Officer of The North Carolina Capital Management Trust: Cash and Term Portfolio (2008-present), President and Treasurer of other Fidelity funds (2008-present) and is an employee of Fidelity Investments. |
Gary W. Ryan (52) |
| Year of Election or Appointment: 2005 Assistant Treasurer of the Fidelity funds. Mr. Ryan is an employee of Fidelity Investments. Previously, Mr. Ryan served as Vice President of Fund Reporting in Fidelity Pricing and Cash Management Services (FPCMS) (1999-2005). |
Jonathan Davis (42) |
| Year of Election or Appointment: 2010 Assistant Treasurer of the Fidelity funds. Mr. Davis is an employee of Fidelity Investments. Previously, Mr. Davis served as Vice President and Associate General Counsel of FMR LLC (2003-2010). |
Annual Report
The Board of Trustees of Fidelity Diversified International Fund voted to pay on December 6, 2010 to shareholders of record at the opening of business on December 3, 2010, the following distributions per share derived from capital gains realized from sales of portfolio securities and dividends derived from net investment income:
| Pay Date | Record Date | Dividends | Capital Gains |
Class K | 12/06/10 | 12/03/10 | $0.431 | $0.081 |
Class K designates 100% of the dividends distributed during the fiscal year as amounts which may be taken into account as a dividend for the purposes of the maximum rate under section 1(h)(11) of the Internal Revenue Code.
The amounts per share which represent income derived from sources within, and taxes paid to, foreign countries or possessions of the United States are as follows:
| Pay Date | Income | Taxes |
Class K | 12/07/2009 | $0.342 | $0.031 |
The fund will notify shareholders in January 2011 of amounts for use in preparing 2010 income tax returns.
Annual Report
Board Approval of Investment Advisory Contracts and Management Fees
Fidelity Diversified International Fund
Each year, the Board of Trustees, including the Independent Trustees (together, the Board), votes on the renewal of the management contract and sub-advisory agreements (together, the Advisory Contracts) for the fund. The Board, assisted by the advice of fund counsel and Independent Trustees' counsel, requests and considers a broad range of information relevant to the renewal of the Advisory Contracts throughout the year.
The Board meets regularly and considers at each of its meetings factors that are relevant to its annual consideration of the renewal of the fund's Advisory Contracts, including the services and support provided to the fund and its shareholders. The Board has established various standing committees, each composed of Independent Trustees with varying backgrounds, to which the Board has assigned specific subject matter responsibilities in order to enhance effective decision-making by the Board. The Board, acting directly and through its Committees, requests and receives information concerning the annual consideration of the renewal of the fund's Advisory Contracts. The Board also meets as needed to consider matters specifically related to the Board's annual consideration of the renewal of Advisory Contracts. Members of the Board may also meet with trustees of other Fidelity funds through ad hoc joint committees to discuss certain matters relevant to the Fidelity funds.
At its July 2010 meeting, the Board of Trustees, including the Independent Trustees, unanimously determined to renew the fund's Advisory Contracts. In reaching its determination, the Board considered all factors it believed relevant, including (i) the nature, extent, and quality of the services to be provided to the fund and its shareholders (including the investment performance of the fund); (ii) the competitiveness of the fund's management fee and total expenses; (iii) the total costs of the services to be provided by and the profits to be realized by Fidelity from its relationship with the fund; (iv) the extent to which economies of scale would be realized as the fund grows; and (v) whether fee levels reflect these economies of scale, if any, for the benefit of fund shareholders.
In considering whether to renew the Advisory Contracts for the fund, the Board reached a determination, with the assistance of fund counsel and Independent Trustees' counsel and through the exercise of its business judgment, that the renewal of the Advisory Contracts is in the best interests of fund shareholders and that the compensation to be received by Fidelity under the management contract is fair and reasonable. The Board's decision to renew the Advisory Contracts was not based on any single factor noted above, but rather was based on a comprehensive consideration of all the information provided to the Board at its meetings throughout the year. The Board, in reaching its determination to renew the Advisory Contracts, is aware that shareholders in the fund have a broad range of investment choices available to them, including a wide choice among mutual funds offered by Fidelity's competitors, and that the fund's shareholders, with the opportunity to review and weigh the disclosure provided by the fund in its prospectus and other public disclosures, have chosen to invest in this fund, managed by Fidelity.
Nature, Extent, and Quality of Services Provided. The Board considered the staffing within the investment adviser, FMR, and the sub-advisers (together, the Investment Advisers), including the backgrounds of the fund's investment personnel and the fund's investment objective and discipline. The Independent Trustees also had discussions with senior management of Fidelity's investment operations and investment groups. The Board considered the structure of the portfolio manager compensation program and whether this structure provides appropriate incentives to act in the best interest of the fund.
Resources Dedicated to Investment Management and Support Services. The Board and the equity research subcommittee of the Board's Fund Oversight Committee reviewed the size, education, and experience of the Investment Advisers' investment staff, their use of technology, and the Investment Advisers' approach to recruiting, training, and retaining portfolio managers and other research, advisory, and management personnel. The Board noted that Fidelity's analysts have access to a variety of technological tools and market and securities data that enable them to perform both fundamental and quantitative analysis and to specialize in various disciplines. The Board considered Fidelity's extensive global research capabilities that enable the Investment Advisers to aggregate data from various sources in an effort to produce positive investment results. The Board also considered that Fidelity's portfolio managers and analysts have access to daily portfolio attribution that allows for monitoring of a fund's portfolio, as well as an electronic communication system that provides immediate real-time access to research concerning issuers and credit enhancers. The Board noted FMR's continued focus on strengthening the organization and discipline of equity portfolio management and research.
Shareholder and Administrative Services. The Board considered (i) the nature, extent, quality, and cost of advisory, administrative, and shareholder services performed by the Investment Advisers and their affiliates under the Advisory Contracts and under separate agreements covering transfer agency, pricing and bookkeeping, and securities lending services for the fund; (ii) the nature and extent of the investment adviser's supervision of third party service providers, principally custodians and subcustodians; and (iii) the resources devoted to, and the record of compliance with, the fund's compliance policies and procedures. The Board also reviewed the allocation of fund brokerage, including allocations to brokers affiliated with the Investment Advisers, the use of brokerage commissions to pay fund expenses, and the use of "soft" commission dollars to pay for research services.
The Board noted that the growth of fund assets over time across the complex allows Fidelity to reinvest in the development of services designed to enhance the value or convenience of the Fidelity funds as investment vehicles. These services include 24-hour access to account information and market information through phone representatives and over the Internet, and investor education materials and asset allocation tools.
Investment in a Large Fund Family. The Board considered the benefits to shareholders of investing in a Fidelity fund, including the benefits of investing in a fund that is part of a large family of funds offering a variety of investment disciplines and providing a large variety of mutual fund investor services. The Board noted that Fidelity had taken, or had made recommendations that resulted in the Fidelity funds taking, a number of actions over the previous year that benefited particular funds, including (i) dedicating additional resources to investment research and restructuring and broadening the focus of the investment research teams; (ii) bolstering the senior management team that oversees asset management; (iii) launching Class F of certain funds as a lower-fee class available to Freedom K and Freedom Index Funds; (iv) lowering the initial investment minimums and ongoing balance requirements for Real Estate High Income Fund; (v) eliminating subsequent purchase minimums for all funds and adding a waiver of the investment minimum requirement for new accounts opened with the proceeds of a systematic withdrawal plan; (vi) eliminating the withdrawal minimum and maximum limits for systematic withdrawals from Advisor funds; (vii) expanding sales load waivers on Class A shares for Destiny Planholders and expanding Institutional Class eligibility for Class O Destiny Planholders; and (viii) changing certain Class A and Class T sales charge structures to further align them with industry practices.
Annual Report
Investment Performance. The Board considered whether the fund has operated in accordance with its investment objective, as well as its record of compliance with its investment restrictions. It also reviewed the fund's absolute investment performance for each class (except Class F), as well as the fund's relative investment performance for each class (except Class F) measured over multiple periods against (i) a broad-based securities market index, and (ii) a peer group of mutual funds deemed appropriate by Fidelity and reviewed by the Board. The following charts considered by the Board show, over the one-, three-, and five-year periods ended December 31, 2009, the cumulative total returns of Class K and the retail class of the fund, the cumulative total returns of a broad-based securities market index ("benchmark"), and a range of cumulative total returns of a peer group of mutual funds identified by Morningstar, Inc. as having an investment style similar to that of the fund based on underlying portfolio holdings. (Class F of the fund had less than one year of performance as of December 31, 2009.) The box within each chart shows the 25th percentile return (bottom of box) and the 75th percentile return (top of box) of the peer group. Returns shown above the box are in the first quartile and returns shown below the box are in the fourth quartile. The percentage beaten numbers noted below each chart correspond to the percentile box and represent the percentage of funds in the peer group whose performance was equal to or lower than that of the class indicated.
Fidelity Diversified International Fund

The Board reviewed the fund's relative investment performance against its peer group and noted that the performance of the retail class of the fund (the class with the longer performance record) was in the second quartile for all the periods shown. The Board also noted that the investment performance of the retail class of the fund compared favorably to its benchmark for the three- and five-year periods, although the one-year cumulative total return of the retail class of the fund was lower than its benchmark. The Board considered that the variations in performance between the fund's classes reflect the variations in class expenses, which result in lower performance for the higher expense class. The Board also reviewed the fund's performance since inception as well as performance in the current year.
The Board also considered that the fund's management fee is subject to upward or downward adjustment depending upon whether, and to what extent, the fund's investment performance for the performance period exceeds, or is exceeded by, the record (over the same period) of a Board-approved performance adjustment index. The Board realizes that the performance adjustment provides FMR with a strong economic incentive to seek to achieve superior performance for the fund's shareholders and helps to more closely align the interests of FMR and the fund's shareholders.
Based on its review, and giving particular weight to the nature and quality of the resources dedicated by the Investment Advisers to maintain and improve relative performance and factoring in the unprecedented market events in recent years, the Board concluded that the nature, extent, and quality of investment management and support services and of shareholder and administrative services provided to the fund will benefit the fund's shareholders, particularly in light of the Board's view that the fund's shareholders benefit from investing in a fund that is part of a large family of funds offering a variety of investment disciplines and services.
Annual Report
Board Approval of Investment Advisory Contracts and Management Fees - continued
Competitiveness of Management Fee and Total Fund Expenses. The Board considered the fund's management fee and total expenses compared to "mapped groups" of competitive funds and classes. Fidelity creates "mapped groups" by combining similar Lipper investment objective categories that have comparable management fee characteristics. Combining Lipper investment objective categories aids the Board's management fee and total expense comparisons by broadening the competitive group used for comparison and by reducing the number of universes to which various Fidelity funds are compared.
Management Fee. The Board considered two proprietary management fee comparisons for the 12-month periods shown in the chart below. The group of Lipper funds used by the Board for management fee comparisons is referred to below as the "Total Mapped Group." The Total Mapped Group comparison focuses on a fund's standing relative to the total universe of comparable funds available to investors, in terms of gross management fees before expense reimbursements or caps, and without giving effect to the fund's performance adjustment. "TMG %" represents the percentage of funds in the Total Mapped Group that had management fees that were lower than the fund's. For example, a TMG % of 15% means that 85% of the funds in the Total Mapped Group had higher management fees than the fund. The "Asset-Size Peer Group" (ASPG) comparison focuses on a fund's standing relative to non-Fidelity funds similar in size to the fund within the Total Mapped Group. The ASPG represents at least 15% of the funds in the Total Mapped Group with comparable asset size and management fee characteristics, subject to a minimum of 50 funds (or all funds in the Total Mapped Group if fewer than 50). Additional information, such as the ASPG quartile in which the fund's management fee ranked and the impact of the fund's performance adjustment, is also included in the chart and considered by the Board.
Fidelity Diversified International Fund

The Board noted that the fund's management fee ranked below the median of its Total Mapped Group and below the median of its ASPG for 2009. The Board also noted the effect of the fund's negative performance adjustment on the fund's management fee ranking. The Board noted that the performance adjustment for each year represents calculations for performance periods that differ from the periods shown in the performance charts above.
Based on its review, the Board concluded that the fund's management fee is fair and reasonable in light of the services that the fund receives and the other factors considered.
Total Expenses. In its review of each class's total expenses, the Board considered the fund's management fee as well as other fund or class expenses, as applicable, such as transfer agent fees, pricing and bookkeeping fees, and custodial, legal, and audit fees. The Board also noted the effects of any waivers and reimbursements on fees and expenses, as well as the impact of the fund's performance adjustment. As part of its review, the Board also considered current and historical total expenses of each class of the fund compared to competitive fund median expenses. Each class of the fund is compared to those funds and classes in the Total Mapped Group (used by the Board for management fee comparisons) that have a similar sales load structure.
The Board noted that the total expenses of each class ranked below its competitive median for the period.
Fees Charged to Other Fidelity Clients. The Board also considered Fidelity fee structures and other information with respect to clients of FMR and its affiliates, such as other mutual funds advised or subadvised by FMR or its affiliates, pension plan clients, and other institutional clients. In March 2010, the Board created an ad hoc joint committee with the board of other Fidelity funds (the Committee) to review and compare Fidelity's institutional investment advisory business with its business of providing services to the Fidelity funds, including the differences in services provided, fees charged, and costs incurred, as well as competition in their respective marketplaces.
Annual Report
Based on its review of total expenses and fees charged to other Fidelity clients, the Board concluded that the total expenses of each class of the fund were reasonable in light of the services that the fund and its shareholders receive and the other factors considered, including the findings of the Committee.
Costs of the Services and Profitability. The Board considered the revenues earned and the expenses incurred by Fidelity in conducting the business of developing, marketing, distributing, managing, administering and servicing the fund and its shareholders. The Board also considered the level of Fidelity's profits in respect of all the Fidelity funds.
On an annual basis, FMR presents to the Board Fidelity's profitability for the fund. Fidelity calculates the profitability for each fund, as well as aggregate profitability for groups of Fidelity funds and all Fidelity funds, using a series of detailed revenue and cost allocation methodologies which originate with the audited books and records of Fidelity. The Audit Committee of the Board reviews any significant changes from the prior year's methodologies.
PricewaterhouseCoopers LLP (PwC), independent registered public accounting firm and auditor to Fidelity and certain Fidelity funds, has been engaged annually by the Board as part of the Board's assessment of Fidelity's profitability analysis. PwC's engagement includes the review and assessment of Fidelity's methodologies used in determining the revenues and expenses attributable to Fidelity's mutual fund business, and completion of agreed-upon procedures surrounding the mathematical accuracy of fund profitability and its conformity to allocation methodologies. After considering PwC's reports issued under the engagement and information provided by Fidelity, the Board believes that while other allocation methods may also be reasonable, Fidelity's profitability methodologies are reasonable in all material respects.
The Board has also reviewed Fidelity's non-fund businesses and fall-out benefits related to the mutual fund business as well as cases where Fidelity's affiliates may benefit from or be related to the fund's business.
The Board considered the costs of the services provided by and the profits realized by Fidelity in connection with the operation of the fund and were satisfied that the profitability was not excessive in the circumstances.
Economies of Scale. The Board considered whether there have been economies of scale in respect of the management of the Fidelity funds, whether the Fidelity funds (including the fund) have appropriately benefited from any such economies of scale, and whether there is potential for realization of any further economies of scale. The Board considered the extent to which the fund will benefit from economies of scale through increased services to the fund, through waivers or reimbursements, or through fee or expense reductions.
In February 2009, the Board and the board of other Fidelity funds created an ad hoc committee (the Economies of Scale Committee) to analyze whether FMR attains economies of scale in respect of the management and servicing of the Fidelity funds, whether the Fidelity funds have appropriately benefited from such economies of scale, and whether there is potential for realization of any further economies of scale.
The Board recognized that the fund's management contract incorporates a "group fee" structure, which provides for lower group fee rates as total fund assets under FMR's management increase, and for higher group fee rates as total fund assets under FMR's management decrease. FMR calculates the group fee rates based on a tiered asset "breakpoint" schedule that varies based on asset class. The Board considered that the group fee is designed to deliver the benefits of economies of scale to fund shareholders when total Fidelity fund assets increase, even if assets of any particular fund are unchanged or have declined, because some portion of Fidelity's costs are attributable to services provided to all Fidelity funds, and all funds benefit if those costs can be allocated among more assets. The Board concluded that, given the group fee structure, fund shareholders will benefit from lower management fees as assets under FMR's management increase at the fund complex level, regardless of whether Fidelity achieves any such economies of scale.
The Board concluded, considering the findings of the Economies of Scale Committee, that any potential economies of scale are being appropriately shared between fund shareholders and Fidelity.
Additional Information Requested by the Board. In order to develop fully the factual basis for consideration of the Fidelity funds' Advisory Contracts, the Board requested and received additional information on certain topics, including (i) fund performance trends, actions to be taken by FMR to improve certain funds' overall performance, and Fidelity's long-term strategies for certain funds; (ii) portfolio manager changes that have occurred during the past year and length of portfolio manager tenure for different categories of funds over time; (iii) Fidelity's compensation structure for portfolio managers, research analysts, and other key personnel, the rationale for the compensation structure, and how the compensation structure provides appropriate performance incentives; (iv) the amount of the investment that each portfolio manager has made in the Fidelity fund(s) that he or she manages; (v) management and other fees paid by FMR to affiliated sub-advisers on behalf of the Fidelity funds; (vi) Fidelity's fee structures and rationale for recommending different fees among different categories of funds; (vii) Fidelity's rationale for recommending which funds should have a performance adjustment component as part of their management fees; (viii) the rationale for any differences between fund fee structures and fee structures in place for other Fidelity clients; and (ix) explanations regarding the relative total expenses borne by certain funds and classes, total expense competitive trends, and actions that might be taken by FMR to reduce total expenses for certain funds and classes.
Annual Report
Board Approval of Investment Advisory Contracts and Management Fees - continued
Based on its evaluation of all of the conclusions noted above, and after considering all factors it believed relevant, the Board ultimately concluded that the advisory fee structures are fair and reasonable, and that the fund's Advisory Contracts should be renewed.
Annual Report
Investment Adviser
Fidelity Management & Research Company
Boston, MA
Investment Sub-Advisers
FMR Co., Inc.
Fidelity Management & Research (U.K.) Inc.
Fidelity Research & Analysis Company
Fidelity Management & Research
(Hong Kong) Limited
Fidelity Management & Research
(Japan) Inc.
General Distributor
Fidelity Distributors Corporation
Boston, MA
Transfer and Service Agents
Fidelity Investments Institutional
Operations Company, Inc.
Boston, MA
Fidelity Service Company, Inc.
Boston, MA
Custodian
JPMorgan Chase Bank
New York, NY
DIF-K-UANN-1210
1.863004.102
Fidelity®
Overseas
Fund -
Class F
Annual Report
October 31, 2010
(2_fidelity_logos) (Registered_Trademark)
Contents
Performance | <Click Here> | How the fund has done over time. |
Management's Discussion of Fund Performance | <Click Here> | The Portfolio Manager's review of fund performance and strategy. |
Shareholder Expense Example | <Click Here> | An example of shareholder expenses. |
Investment Changes | <Click Here> | A summary of major shifts in the fund's investments over the past six months. |
Investments | <Click Here> | A complete list of the fund's investments with their market values. |
Financial Statements | <Click Here> | Statements of assets and liabilities, operations, and changes in net assets, as well as financial highlights. |
Notes | <Click Here> | Notes to the financial statements. |
Report of Independent Registered Public Accounting Firm | <Click Here> | |
Trustees and Officers | <Click Here> | |
Distributions | <Click Here> | |
Board Approval of Investment Advisory Contracts and Management Fees | <Click Here> | |
To view a fund's proxy voting guidelines and proxy voting record for the 12-month period ended June 30, visit http://www.fidelity.com/proxyvotingresults or visit the Securities and Exchange Commission's (SEC) web site at http://www.sec.gov. You may also call 1-800-835-5092 to request a free copy of the proxy voting guidelines.
Standard & Poor's, S&P and S&P 500 are registered service marks of The McGraw-Hill Companies, Inc. and have been licensed for use by Fidelity Distributors Corporation.
Other third party marks appearing herein are the property of their respective owners.
All other marks appearing herein are registered or unregistered trademarks or service marks of FMR LLC or an affiliated company.
This report and the financial statements contained herein are submitted for the general information of the shareholders of the fund. This report is not authorized for distribution to prospective investors in the fund unless preceded or accompanied by an effective prospectus.
A fund files its complete schedule of portfolio holdings with the SEC for the first and third quarters of each fiscal year on Form N-Q. Forms N-Q are available on the SEC's web site at http://www.sec.gov. A fund's Forms N-Q may be reviewed and copied at the SEC's Public Reference Room in Washington, DC. Information regarding the operation of the SEC's Public Reference Room may be obtained by calling 1-800-SEC-0330. For a complete list of a fund's portfolio holdings, view the most recent holdings listing, semiannual report, or annual report on Fidelity's web site at http://www.fidelity.com or http://www.advisor.fidelity.com, as applicable.
NOT FDIC INSURED • MAY LOSE VALUE • NO BANK GUARANTEE
Neither the fund nor Fidelity Distributors Corporation is a bank.
Annual Report
Average annual total return reflects the change in the value of an investment, assuming reinvestment of the class' distributions from dividend income and capital gains (the profits earned upon the sale of securities that have grown in value, if any) and assuming a constant rate of performance each year. The $10,000 table and the fund's returns do not reflect the deduction of taxes that a shareholder would pay on fund distributions or the redemption of fund shares. During periods of reimbursement by Fidelity, a fund's total returns will be greater than it would be had the reimbursement not occurred. How a fund did yesterday is no guarantee of how it will do tomorrow.
Average Annual Total Returns
Periods ended October 31, 2010 | Past 1
year | Past 5
years | Past 10
years |
Class F A | 6.60% | 2.12% | 1.83% |
A The initial offering of Class F shares took place on June 26, 2009. Returns prior to June 26, 2009 are those of Fidelity Overseas Fund, the original class of the fund.
$10,000 Over 10 Years
Let's say hypothetically that $10,000 was invested in Fidelity Overseas Fund - Class F, a class of the fund, on October 31, 2000. The chart shows how the value of your investment would have changed, and also shows how the MSCI® EAFE® (Europe, Australasia, Far East) Index performed over the same period. The initial offering of Class F took place on June 26, 2009. See above for additional information regarding the performance of Class F.
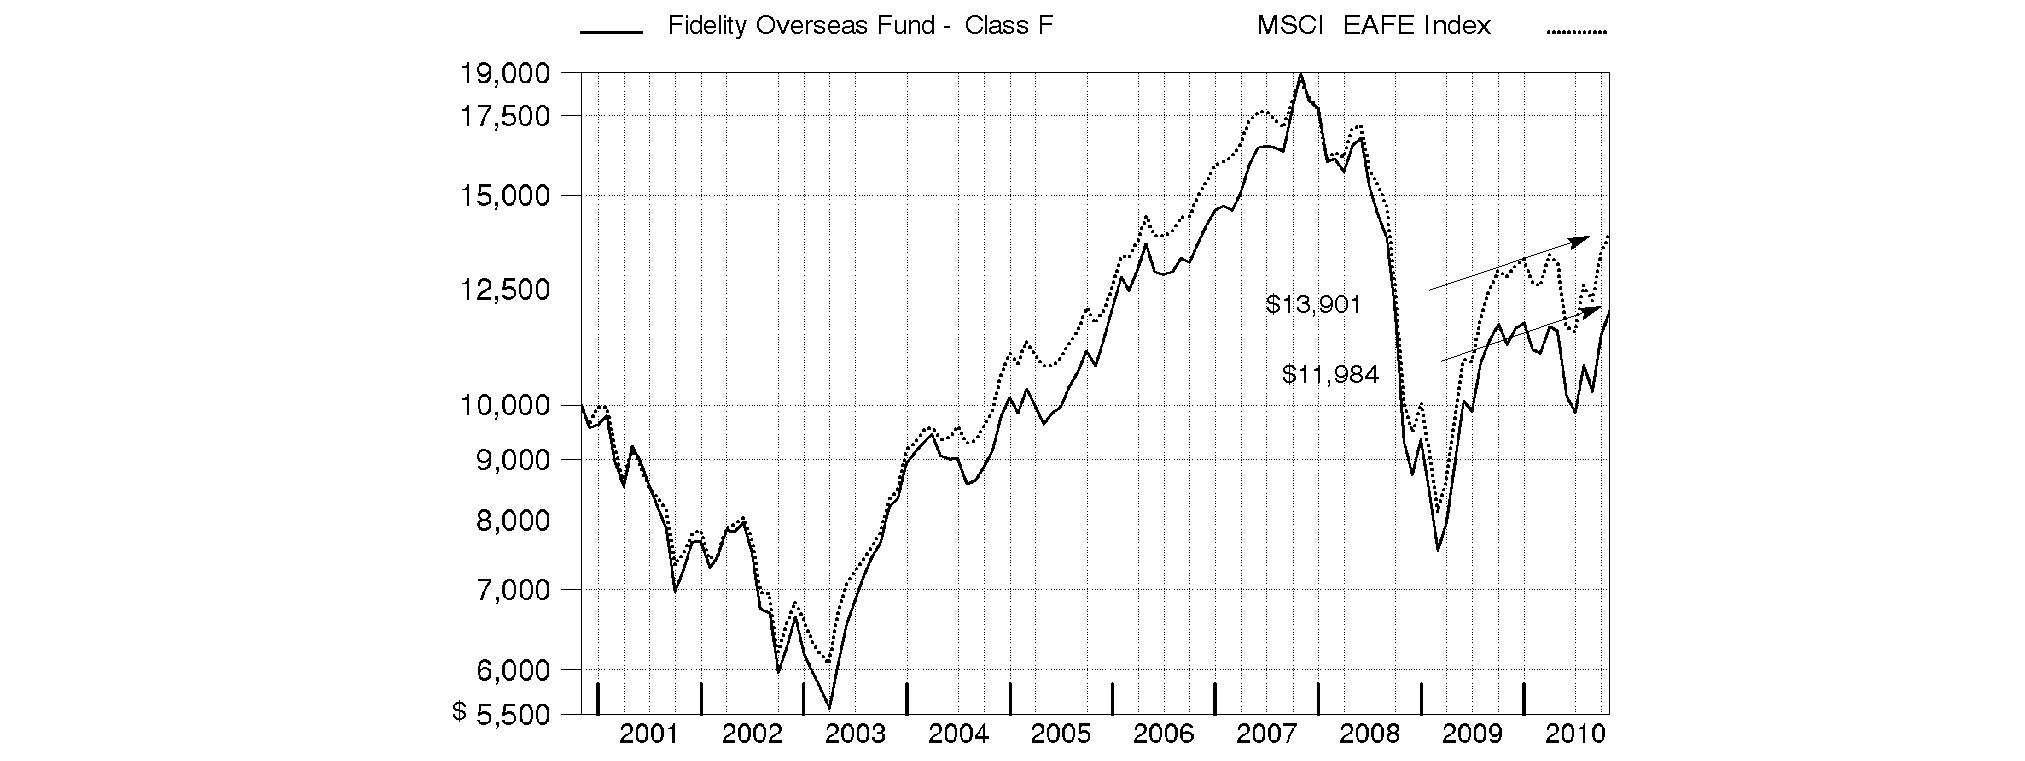
Annual Report
Market Recap: International stocks rode a wave of volatility similar to that of their U.S. counterparts during the 12 months ending October 31, 2010. Stocks gained modestly in the first half of the period, despite growing concerns about the European debt crisis. Sentiment turned decidedly negative in May and June, however, and the market suffered a precipitous decline. These losses were more than offset during the last four months of the period, when signs of economic growth and subsiding debt fears helped propel international stocks about 21%. For the full year, the MSCI® ACWI® (All Country World Index) ex USA Index gained 12.76%, boosted in part by a generally depreciating U.S. dollar. Within the index, Canada and emerging markets were standouts, returning 23% and 24%, respectively. Results in the latter group were led by strong-performing India, Mexico and South Africa, while China fell short of the MSCI benchmark due to cooling economic growth. The developed Asia ex Japan segment rose 16% for the period, lifted by solid results from Singapore and Hong Kong. Meanwhile, Europe rose just 9%, held back mainly by debt-riddled Spain and Italy, as well as lagging major constituent France. Japan returned only 5%, a result of that nation's continued weak economy.
Comments from Ian Hart, Portfolio Manager of Fidelity® Overseas Fund: For the year, the fund's Class F shares rose 6.60%, underperforming the 8.49% gain of the MSCI EAFE® (Europe, Australasia, Far East) Index. The fund's relative performance was hurt by industrials, specifically the capital goods group, consumer staples and financials. On a geographic basis, performance was stymied by an underweighting in Australia and stock picking in several countries, including Japan, the U.K. and Switzerland, but helped by investments in Italy and Germany. On an individual security basis, the fund's largest detractor was an out-of-index stake in U.S.-based Scientific Games, a provider of technology systems to the gaming industry, whose stock disappointed when new online gaming opportunities failed to materialize. I also missed with Hellenic Telecommunications Organization (OTE), the Greek firm whose stock struggled amid the country's economic crisis. I cut back on Scientific Games and sold OTE by period end. Within financials, the fund's investment in Italian banking group Intesa Sanpaolo detracted. Conversely, German automaker Volkswagen was the fund's top individual contributor. Underweighting energy giant BP helped, as the stock dropped after its oil-well blowout in the Gulf of Mexico. An out-of-index stake in luxury goods maker Bulgari was a solid contributor, as demand for its products surged within emerging markets.
The views expressed above reflect those of the portfolio manager(s) only through the end of the period as stated on the cover of this report and do not necessarily represent the views of Fidelity or any other person in the Fidelity organization. Any such views are subject to change at any time based upon market or other conditions and Fidelity disclaims any responsibility to update such views. These views may not be relied on as investment advice and, because investment decisions for a Fidelity fund are based on numerous factors, may not be relied on as an indication of trading intent on behalf of any Fidelity fund.
Annual Report
Fidelity Overseas Fund
As a shareholder of the Fund, you incur two types of costs: (1) transaction costs, including redemption fees, and (2) ongoing costs, including management fees and other Fund expenses. This Example is intended to help you understand your ongoing costs (in dollars) of investing in the Fund and to compare these costs with the ongoing costs of investing in other mutual funds.
The Example is based on an investment of $1,000 invested at the beginning of the period and held for the entire period (May 1, 2010 to October 31, 2010).
Actual Expenses
The first line of the accompanying table for each class of the Fund provides information about actual account values and actual expenses. You may use the information in this line, together with the amount you invested, to estimate the expenses that you paid over the period. Simply divide your account value by $1,000.00 (for example, an $8,600 account value divided by $1,000.00 = 8.6), then multiply the result by the number in the first line for a class of the Fund under the heading entitled "Expenses Paid During Period" to estimate the expenses you paid on your account during this period. A small balance maintenance fee of $12.00 that is charged once a year may apply for certain accounts with a value of less than $2,000. This fee is not included in the table below. If it was, the estimate of expenses you paid during the period would be higher, and your ending account value lower, by this amount. In addition, the Fund, as a shareholder in the underlying Fidelity Central Funds, will indirectly bear its pro-rata share of the fees and expenses incurred by the underlying Fidelity Central Funds. These fees and expenses are not included in the Fund's annualized expense ratio used to calculate the expense estimate in the table below.
Hypothetical Example for Comparison Purposes
The second line of the accompanying table for each class of the Fund provides information about hypothetical account values and hypothetical expenses based on a Class' actual expense ratio and an assumed rate of return of 5% per year before expenses, which is not the Class' actual return. The hypothetical account values and expenses may not be used to estimate the actual ending account balance or expenses you paid for the period. You may use this information to compare the ongoing costs of investing in the Fund and other funds. To do so, compare this 5% hypothetical example with the 5% hypothetical examples that appear in the shareholder reports of the other funds. A small balance maintenance fee of $12.00 that is charged once a year may apply for certain accounts with a value of less than $2,000. This fee is not included in the table below. If it was, the estimate of expenses you paid during the period would be higher, and your ending account value lower, by this amount. In addition, the Fund, as a shareholder in the underlying Fidelity Central Funds, will indirectly bear its pro-rata share of the fees and expenses incurred by the underlying Fidelity Central Funds. These fees and expenses are not included in the Fund's annualized expense ratio used to calculate the expense estimate in the table below.
Please note that the expenses shown in the table are meant to highlight your ongoing costs only and do not reflect any transaction costs. Therefore, the second line of the table is useful in comparing ongoing costs only, and will not help you determine the relative total costs of owning different funds. In addition, if these transactional costs were included, your costs would have been higher.
| Annualized
Expense Ratio | Beginning
Account Value
May 1, 2010 | Ending
Account Value
October 31, 2010 | Expenses Paid
During Period*
May 1, 2010
to October 31, 2010 |
Overseas | .83% | | | |
Actual | | $ 1,000.00 | $ 1,037.80 | $ 4.26 |
HypotheticalA | | $ 1,000.00 | $ 1,021.02 | $ 4.23 |
Class K | .64% | | | |
Actual | | $ 1,000.00 | $ 1,038.80 | $ 3.29 |
HypotheticalA | | $ 1,000.00 | $ 1,021.98 | $ 3.26 |
Class F | .62% | | | |
Actual | | $ 1,000.00 | $ 1,038.80 | $ 3.19 |
HypotheticalA | | $ 1,000.00 | $ 1,022.08 | $ 3.16 |
A 5% return per year before expenses
* Expenses are equal to each Class' annualized expense ratio, multiplied by the average account value over the period, multiplied by 184/365 (to reflect the one-half year period).
Annual Report
Fidelity Overseas Fund
Investment Changes (Unaudited)
Geographic Diversification (% of fund's net assets) |
As of October 31, 2010 |
| Japan | 18.1% | |
| France | 18.1% | |
| Germany | 16.1% | |
| United Kingdom | 12.7% | |
| United States of America | 5.5% | |
| Italy | 4.8% | |
| Switzerland | 3.7% | |
| Australia | 2.6% | |
| Bailiwick of Jersey | 2.5% | |
| Other | 15.9% | |

Percentages are adjusted for the effect of futures contracts, if applicable. |
As of April 30, 2010 |
| United Kingdom | 23.1% | |
| Japan | 21.6% | |
| Germany | 13.3% | |
| France | 12.0% | |
| United States of America | 7.0% | |
| Italy | 3.9% | |
| Switzerland | 3.1% | |
| Australia | 2.6% | |
| Spain | 2.5% | |
| Other | 10.9% | |

Percentages are adjusted for the effect of futures contracts, if applicable. |
Asset Allocation |
| % of fund's
net assets | % of fund's net assets
6 months ago |
Stocks | 98.6 | 97.3 |
Short-Term Investments and Net Other Assets | 1.4 | 2.7 |
Top Ten Stocks as of October 31, 2010 |
| % of fund's
net assets | % of fund's net assets
6 months ago |
Pernod-Ricard SA (France, Beverages) | 5.3 | 1.0 |
SAP AG (Germany, Software) | 5.1 | 3.4 |
Volkswagen AG (Germany, Automobiles) | 3.5 | 0.7 |
Mazda Motor Corp. (Japan, Automobiles) | 3.4 | 2.3 |
Japan Tobacco, Inc. (Japan, Tobacco) | 3.2 | 0.5 |
Bulgari SpA (Italy, Textiles, Apparel & Luxury Goods) | 3.1 | 1.2 |
Siemens AG (Germany, Industrial Conglomerates) | 1.8 | 1.8 |
Royal Dutch Shell PLC Class B ADR (United Kingdom, Oil, Gas & Consumable Fuels) | 1.6 | 2.4 |
Fluor Corp. (United States of America, Construction & Engineering) | 1.5 | 0.9 |
Ricoh Co. Ltd. (Japan, Office Electronics) | 1.5 | 2.5 |
| 30.0 | |
Market Sectors as of October 31, 2010 |
| % of fund's
net assets | % of fund's net assets
6 months ago |
Consumer Discretionary | 22.1 | 15.4 |
Financials | 17.4 | 23.0 |
Consumer Staples | 12.4 | 8.1 |
Information Technology | 11.2 | 12.6 |
Industrials | 11.1 | 10.1 |
Energy | 8.3 | 6.7 |
Materials | 7.8 | 8.9 |
Telecommunication Services | 4.5 | 3.5 |
Health Care | 2.6 | 5.9 |
Utilities | 1.2 | 3.1 |
Annual Report
Fidelity Overseas Fund
Investments October 31, 2010
Showing Percentage of Net Assets
Common Stocks - 94.6% |
| Shares | | Value |
Australia - 2.6% |
Australia & New Zealand Banking Group Ltd. | 2,742,327 | | $ 66,652,578 |
Macquarie Group Ltd. | 862,470 | | 30,586,058 |
Newcrest Mining Ltd. | 1,898,098 | | 74,304,490 |
TOTAL AUSTRALIA | | 171,543,126 |
Austria - 0.9% |
Erste Bank AG | 563,100 | | 25,409,732 |
Wienerberger AG (a) | 1,786,918 | | 30,085,525 |
TOTAL AUSTRIA | | 55,495,257 |
Bailiwick of Jersey - 2.5% |
Charter International PLC | 1,557,500 | | 18,415,673 |
Heritage Oil PLC | 2,780,200 | | 15,345,055 |
United Business Media Ltd. | 5,000,000 | | 52,710,735 |
WPP PLC | 6,514,338 | | 75,693,005 |
TOTAL BAILIWICK OF JERSEY | | 162,164,468 |
Belgium - 1.5% |
Ageas | 8,054,178 | | 24,756,232 |
Anheuser-Busch InBev SA NV | 780,339 | | 48,899,125 |
Anheuser-Busch InBev SA NV (strip VVPR) (a) | 6,312,640 | | 26,351 |
KBC Groupe SA (a) | 486,408 | | 21,153,772 |
TOTAL BELGIUM | | 94,835,480 |
Bermuda - 0.5% |
GOME Electrical Appliances Holdings Ltd. (a) | 93,574,000 | | 31,508,226 |
Brazil - 1.8% |
Banco do Brasil SA | 1,437,500 | | 27,969,228 |
BM&F Bovespa SA | 3,905,100 | | 32,710,836 |
Centrais Eletricas Brasileiras SA (Electrobras) sponsored ADR (d) | 3,938,600 | | 55,022,242 |
TOTAL BRAZIL | | 115,702,306 |
Canada - 1.5% |
Harry Winston Diamond Corp. (a) | 2,390,974 | | 30,546,516 |
Niko Resources Ltd. | 341,600 | | 32,589,156 |
Talisman Energy, Inc. | 1,931,800 | | 35,022,043 |
TOTAL CANADA | | 98,157,715 |
Cayman Islands - 0.3% |
3SBio, Inc. sponsored ADR (a) | 37,000 | | 556,850 |
China Shanshui Cement Group Ltd. | 3,219,000 | | 2,292,389 |
PCD Stores Group Ltd. | 4,666,000 | | 1,504,919 |
Peak Sport Products Co. Ltd. | 16,175,000 | | 12,896,178 |
TOTAL CAYMAN ISLANDS | | 17,250,336 |
|
| Shares | | Value |
China - 0.5% |
China Merchants Bank Co. Ltd. (H Shares) | 12,276,500 | | $ 34,843,799 |
Minth Group Ltd. | 72,000 | | 134,688 |
TOTAL CHINA | | 34,978,487 |
Denmark - 0.5% |
Carlsberg AS Series B | 284,700 | | 31,131,011 |
France - 18.1% |
Accor SA | 806,023 | | 33,046,197 |
Alstom SA | 1,556,065 | | 78,509,668 |
Atos Origin SA (a) | 803,297 | | 37,137,165 |
AXA SA | 1,253,837 | | 22,820,042 |
BNP Paribas SA | 617,426 | | 45,146,620 |
Carrefour SA | 1,432,468 | | 77,296,591 |
Christian Dior SA | 281,800 | | 40,759,898 |
Compagnie de St. Gobain | 1,180,629 | | 55,131,906 |
Compagnie Generale de Geophysique SA (a) | 2,168,200 | | 50,633,571 |
L'Oreal SA | 198,100 | | 23,253,517 |
LVMH Moet Hennessy - Louis Vuitton | 508,209 | | 79,624,799 |
Pernod-Ricard SA | 3,860,967 | | 342,271,944 |
PPR SA | 446,469 | | 73,181,989 |
Renault SA (a) | 725,300 | | 40,293,056 |
Safran SA | 1,265,056 | | 40,098,772 |
Sanofi-Aventis | 619,478 | | 43,390,713 |
Schneider Electric SA | 234,583 | | 33,293,873 |
Societe Generale Series A | 1,097,908 | | 65,728,608 |
TOTAL FRANCE | | 1,181,618,929 |
Germany - 12.1% |
Deutsche Boerse AG | 1,176,192 | | 82,747,121 |
Fresenius Medical Care AG & Co. KGaA (d) | 954,400 | | 60,782,555 |
HeidelbergCement AG | 1,413,029 | | 73,898,094 |
Linde AG | 341,697 | | 49,185,747 |
Munich Re Group | 129,625 | | 20,264,200 |
Puma AG | 144,300 | | 47,967,832 |
SAP AG | 6,381,161 | | 332,698,622 |
Siemens AG | 1,040,567 | | 118,843,382 |
TOTAL GERMANY | | 786,387,553 |
Hong Kong - 1.4% |
China Unicom (Hong Kong) Ltd. sponsored ADR (d) | 5,330,700 | | 74,629,800 |
Henderson Land Development Co. Ltd. | 2,758,000 | | 19,587,538 |
TOTAL HONG KONG | | 94,217,338 |
India - 0.3% |
Bharti Airtel Ltd. | 2,628,490 | | 19,311,174 |
Indonesia - 0.2% |
PT Indosat Tbk sponsored ADR (d) | 425,600 | | 14,019,264 |
Common Stocks - continued |
| Shares | | Value |
Israel - 0.4% |
Teva Pharmaceutical Industries Ltd. sponsored ADR | 454,800 | | $ 23,604,120 |
Italy - 4.8% |
Bulgari SpA (d)(e) | 18,976,214 | | 203,182,267 |
Intesa Sanpaolo SpA | 17,104,673 | | 60,155,252 |
Saipem SpA | 1,039,967 | | 46,204,693 |
TOTAL ITALY | | 309,542,212 |
Japan - 18.1% |
Denso Corp. | 1,410,300 | | 43,857,646 |
Hitachi Ltd. (a) | 6,197,000 | | 28,008,276 |
Japan Tobacco, Inc. | 66,332 | | 206,072,575 |
Kenedix, Inc. (a)(d) | 71,644 | | 14,449,883 |
Keyence Corp. | 110,000 | | 27,271,032 |
Mazda Motor Corp. | 87,560,000 | | 222,529,219 |
Mitsubishi Corp. | 3,326,700 | | 79,906,263 |
Mitsubishi UFJ Financial Group, Inc. | 10,993,100 | | 51,019,020 |
Mitsui & Co. Ltd. | 5,632,000 | | 88,576,770 |
Mizuho Financial Group, Inc. | 12,656,900 | | 18,356,540 |
Rakuten, Inc. | 87,129 | | 67,130,581 |
Ricoh Co. Ltd. | 6,888,000 | | 96,353,600 |
SOFTBANK CORP. | 1,562,000 | | 50,163,672 |
Sumitomo Mitsui Financial Group, Inc. | 1,168,700 | | 34,883,060 |
Tokyo Broadcasting System Holding | 1,852,500 | | 22,836,833 |
Tokyo Electron Ltd. | 1,655,700 | | 93,420,153 |
Toshiba Corp. (a) | 4,682,000 | | 23,434,099 |
Toto Ltd. (d) | 2,025,000 | | 13,453,746 |
TOTAL JAPAN | | 1,181,722,968 |
Korea (South) - 0.6% |
Shinhan Financial Group Co. Ltd. | 495,630 | | 19,194,916 |
SK Telecom Co. Ltd. sponsored ADR (d) | 1,152,400 | | 21,238,732 |
TOTAL KOREA (SOUTH) | | 40,433,648 |
Netherlands - 1.4% |
AEGON NV (a) | 4,267,800 | | 27,041,518 |
ING Groep NV (Certificaten Van Aandelen) unit (a) | 3,711,800 | | 39,701,429 |
Koninklijke Philips Electronics NV | 802,100 | | 24,459,768 |
TOTAL NETHERLANDS | | 91,202,715 |
Norway - 1.5% |
Aker Solutions ASA | 4,406,500 | | 67,083,064 |
Sevan Marine ASA (a)(d) | 24,336,552 | | 32,791,814 |
TOTAL NORWAY | | 99,874,878 |
|
| Shares | | Value |
Russia - 0.6% |
Mobile TeleSystems OJSC sponsored ADR | 1,052,500 | | $ 22,786,625 |
OAO Gazprom sponsored ADR | 737,700 | | 16,118,745 |
TOTAL RUSSIA | | 38,905,370 |
Spain - 2.0% |
Banco Bilbao Vizcaya Argentaria SA | 4,148,498 | | 54,640,336 |
Inditex SA (d) | 459,185 | | 38,342,368 |
Indra Sistemas SA (d) | 1,047,400 | | 20,498,398 |
Red Electrica Corporacion SA | 397,300 | | 19,954,149 |
TOTAL SPAIN | | 133,435,251 |
Switzerland - 3.7% |
Julius Baer Group Ltd. | 1,451,350 | | 61,247,604 |
Roche Holding AG (participation certificate) | 267,163 | | 39,218,828 |
The Swatch Group AG (Bearer) | 120,060 | | 45,872,470 |
Transocean Ltd. (a) | 556,300 | | 35,247,168 |
UBS AG (a) | 3,366,813 | | 57,176,452 |
TOTAL SWITZERLAND | | 238,762,522 |
United Kingdom - 12.7% |
Anglo American PLC (United Kingdom) | 1,823,500 | | 84,957,817 |
BAE Systems PLC | 5,367,400 | | 29,642,063 |
Barclays PLC | 9,627,323 | | 42,301,417 |
BG Group PLC | 3,213,318 | | 62,576,583 |
BHP Billiton PLC | 2,041,281 | | 72,303,336 |
BP PLC sponsored ADR | 1,140,200 | | 46,554,366 |
Capita Group PLC | 1,188,700 | | 14,597,806 |
HSBC Holdings PLC sponsored ADR | 1,368,764 | | 71,326,292 |
Imperial Tobacco Group PLC | 2,114,240 | | 67,712,719 |
ITV PLC (a) | 21,426,630 | | 23,429,321 |
Lloyds Banking Group PLC (a) | 31,001,210 | | 34,069,890 |
Micro Focus International PLC | 4,399,600 | | 26,912,392 |
Misys PLC (a) | 6,860,500 | | 30,930,222 |
Rio Tinto PLC | 1,255,810 | | 81,555,009 |
Royal Dutch Shell PLC Class B ADR | 1,635,700 | | 105,208,224 |
Xstrata PLC | 1,872,200 | | 36,279,500 |
TOTAL UNITED KINGDOM | | 830,356,957 |
United States of America - 4.1% |
AsiaInfo Holdings, Inc. (a) | 735,335 | | 16,339,144 |
CME Group, Inc. | 126,200 | | 36,553,830 |
Fluor Corp. | 2,020,100 | | 97,348,619 |
NII Holdings, Inc. (a) | 2,134,400 | | 89,239,264 |
Scientific Games Corp. Class A (a) | 3,345,209 | | 26,427,151 |
Viad Corp. | 98,936 | | 1,974,763 |
TOTAL UNITED STATES OF AMERICA | | 267,882,771 |
TOTAL COMMON STOCKS (Cost $5,942,808,667) | 6,164,044,082 |
Nonconvertible Preferred Stocks - 4.0% |
| Shares | | Value |
Germany - 4.0% |
Porsche Automobil Holding SE | 593,200 | | $ 30,387,401 |
Volkswagen AG | 1,511,968 | | 227,213,411 |
TOTAL NONCONVERTIBLE PREFERRED STOCKS (Cost $188,849,860) | 257,600,812 |
Money Market Funds - 2.7% |
| | | |
Fidelity Cash Central Fund, 0.23% (b) | 46,818,828 | | 46,818,828 |
Fidelity Securities Lending Cash Central Fund, 0.24% (b)(c) | 131,257,696 | | 131,257,696 |
TOTAL MONEY MARKET FUNDS (Cost $178,076,524) | 178,076,524 |
TOTAL INVESTMENT PORTFOLIO - 101.3% (Cost $6,309,735,051) | | 6,599,721,418 |
NET OTHER ASSETS (LIABILITIES) - (1.3)% | | (87,032,730) |
NET ASSETS - 100% | $ 6,512,688,688 |
Legend |
(a) Non-income producing |
(b) Affiliated fund that is available only to investment companies and other accounts managed by Fidelity Investments. The rate quoted is the annualized seven-day yield of the fund at period end. A complete unaudited listing of the fund's holdings as of its most recent quarter end is available upon request. In addition, each Fidelity Central Fund's financial statements, which are not covered by the Fund's report of Independent Registered Public Accounting Firm, are available on the SEC's website or upon request. |
(c) Investment made with cash collateral received from securities on loan. |
(d) Security or a portion of the security is on loan at period end. |
(e) Affiliated company |
Affiliated Central Funds |
Information regarding fiscal year to date income earned by the Fund from investments in Fidelity Central Funds is as follows: |
Fund | Income earned |
Fidelity Cash Central Fund | $ 215,905 |
Fidelity Securities Lending Cash Central Fund | 6,382,864 |
Total | $ 6,598,769 |
Other Affiliated Issuers |
An affiliated company is a company in which the Fund has ownership of at least 5% of the voting securities. Fiscal year to date transactions with companies which are or were affiliates are as follows: |
Affiliate | Value,
beginning of
period | Purchases | Sales
Proceeds | Dividend
Income | Value,
end of
period |
Bulgari SpA | $ 113,852,096 | $ 108,432,769 | $ 67,968,297 | $ 392,681 | $ 203,182,267 |
Harry Winston Diamond Corp. | 35,080,049 | - | 21,459,940 | - | - |
Kenedix, Inc. | 28,504,228 | 13,220,143 | 12,411,387 | - | - |
William Hill PLC | 71,632,544 | 29,169,053 | 94,152,324 | 2,667,780 | - |
Total | $ 249,068,917 | $ 150,821,965 | $ 195,991,948 | $ 3,060,461 | $ 203,182,267 |
Other Information |
The following is a summary of the inputs used, as of October 31, 2010, involving the Fund's assets and liabilities carried at fair value. The inputs or methodology used for valuing securities may not be an indication of the risk associated with investing in those securities. For more information on valuation inputs, and their aggregation into the levels used in the tables below, please refer to the Security Valuation section in the accompanying Notes to Financial Statements. |
Valuation Inputs at Reporting Date: |
Description | Total | Level 1 | Level 2 | Level 3 |
Investments in Securities: | | | | |
Equities: | | | | |
Japan | $ 1,181,722,968 | $ 131,688,329 | $ 1,050,034,639 | $ - |
France | 1,181,618,929 | 1,087,594,645 | 94,024,284 | - |
Germany | 1,043,988,365 | 1,043,988,365 | - | - |
United Kingdom | 830,356,957 | 600,127,305 | 230,229,652 | - |
Italy | 309,542,212 | 309,542,212 | - | - |
United States of America | 267,882,771 | 267,882,771 | - | - |
Switzerland | 238,762,522 | 181,586,070 | 57,176,452 | - |
Australia | 171,543,126 | 171,543,126 | - | - |
Bailiwick of Jersey | 162,164,468 | 86,471,463 | 75,693,005 | - |
Other | 1,034,062,576 | 888,219,525 | 145,843,051 | - |
Money Market Funds | 178,076,524 | 178,076,524 | - | - |
Total Investments in Securities: | $ 6,599,721,418 | $ 4,946,720,335 | $ 1,653,001,083 | $ - |
The following is a reconciliation of Investments in Securities for which Level 3 inputs were used in determining value: |
Investments in Securities: | |
Beginning Balance | $ 35 |
Total Realized Gain (Loss) | - |
Total Unrealized Gain (Loss) | (35) |
Cost of Purchases | - |
Proceeds of Sales | - |
Amortization/Accretion | - |
Transfers in to Level 3 | - |
Transfers out of Level 3 | - |
Ending Balance | $ - |
The change in unrealized gain (loss) for the period attributable to Level 3 securities held at October 31, 2010 | $ - |
The information used in the above reconciliation represents fiscal year to date activity for any Investments in Securities identified as using Level 3 inputs at either the beginning or the end of the current fiscal period. Transfers in or out of Level 3 represent the beginning value of any Security or Instrument where a change in the pricing level occurred from the beginning to the end of the period. The cost of purchases and the proceeds of sales may include securities received or delivered through corporate actions or exchanges. Realized and unrealized gains (losses) disclosed in the reconciliation are included in Net Gain (Loss) on the Fund's Statement of Operations. |
Income Tax Information |
At October 31, 2010, the Fund had a capital loss carryforward of approximately $1,637,677,232 of which $697,957,467 and $939,719,765 will expire on October 31, 2016 and 2017, respectively. Capital loss carryforwards are only available to offset future capital gains of the Fund to the extent provided by regulations and may be limited. |
See accompanying notes which are an integral part of the financial statements.
Annual Report
Fidelity Overseas Fund
Financial Statements
Statement of Assets and Liabilities
| October 31, 2010 |
| | |
Assets | | |
Investment in securities, at value (including securities loaned of $126,027,467) - See accompanying schedule: Unaffiliated issuers (cost $5,979,280,612) | $ 6,218,462,627 | |
Fidelity Central Funds (cost $178,076,524) | 178,076,524 | |
Other affiliated issuers (cost $152,377,915) | 203,182,267 | |
Total Investments (cost $6,309,735,051) | | $ 6,599,721,418 |
Receivable for investments sold | | 136,276,399 |
Receivable for fund shares sold | | 7,122,890 |
Dividends receivable | | 15,109,772 |
Distributions receivable from Fidelity Central Funds | | 80,022 |
Other receivables | | 947,969 |
Total assets | | 6,759,258,470 |
| | |
Liabilities | | |
Payable for investments purchased | $ 108,531,107 | |
Payable for fund shares redeemed | 2,267,344 | |
Accrued management fee | 2,739,436 | |
Other affiliated payables | 1,272,757 | |
Other payables and accrued expenses | 501,442 | |
Collateral on securities loaned, at value | 131,257,696 | |
Total liabilities | | 246,569,782 |
| | |
Net Assets | | $ 6,512,688,688 |
Net Assets consist of: | | |
Paid in capital | | $ 7,864,527,445 |
Undistributed net investment income | | 85,893,161 |
Accumulated undistributed net realized gain (loss) on investments and foreign currency transactions | | (1,728,566,184) |
Net unrealized appreciation (depreciation) on investments and assets and liabilities in foreign currencies | | 290,834,266 |
Net Assets | | $ 6,512,688,688 |
Overseas:
Net Asset Value, offering price and redemption price per share ($5,548,689,358 ÷ 175,814,142 shares) | | $ 31.56 |
| | |
Class K:
Net Asset Value, offering price and redemption price per share ($368,004,318 ÷ 11,650,042 shares) | | $ 31.59 |
| | |
Class F:
Net Asset Value, offering price and redemption price per share ($595,995,012 ÷ 18,870,397 shares) | | $ 31.58 |
Statement of Operations
| Year ended October 31, 2010 |
| | |
Investment Income | | |
Dividends (including $3,060,461 earned from other affiliated issuers) | | $ 160,786,466 |
Interest | | 25,831 |
Income from Fidelity Central Funds | | 6,598,769 |
Income before foreign taxes withheld | | 167,411,066 |
Less foreign taxes withheld | | (12,596,890) |
Total income | | 154,814,176 |
| | |
Expenses | | |
Management fee
Basic fee | $ 48,637,860 | |
Performance adjustment | (7,944,328) | |
Transfer agent fees | 15,331,656 | |
Accounting and security lending fees | 1,712,692 | |
Custodian fees and expenses | 1,207,677 | |
Independent trustees' compensation | 39,713 | |
Depreciation in deferred trustee compensation account | (37) | |
Registration fees | 56,697 | |
Audit | 113,545 | |
Legal | 51,751 | |
Interest | 7,829 | |
Miscellaneous | 97,194 | |
Total expenses before reductions | 59,312,249 | |
Expense reductions | (2,662,088) | 56,650,161 |
Net investment income (loss) | | 98,164,015 |
Realized and Unrealized Gain (Loss) Net realized gain (loss) on: | | |
Investment securities: | | |
Unaffiliated issuers | 160,999,122 | |
Other affiliated issuers | 21,634,517 | |
Foreign currency transactions | (2,096,186) | |
Capital gain distributions from Fidelity Central Funds | 17,805 | |
Total net realized gain (loss) | | 180,555,258 |
Change in net unrealized appreciation (depreciation) on: Investment securities | 94,183,082 | |
Assets and liabilities in foreign currencies | 666,146 | |
Total change in net unrealized appreciation (depreciation) | | 94,849,228 |
Net gain (loss) | | 275,404,486 |
Net increase (decrease) in net assets resulting from operations | | $ 373,568,501 |
See accompanying notes which are an integral part of the financial statements.
Annual Report
Statement of Changes in Net Assets
| Year ended
October 31,
2010 | Year ended
October 31,
2009 |
Increase (Decrease) in Net Assets | | |
Operations | | |
Net investment income (loss) | $ 98,164,015 | $ 119,329,980 |
Net realized gain (loss) | 180,555,258 | (1,003,646,089) |
Change in net unrealized appreciation (depreciation) | 94,849,228 | 2,100,809,355 |
Net increase (decrease) in net assets resulting from operations | 373,568,501 | 1,216,493,246 |
Distributions to shareholders from net investment income | (108,455,793) | (81,537,156) |
Distributions to shareholders from net realized gain | (2,308,848) | - |
Total distributions | (110,764,641) | (81,537,156) |
Share transactions - net increase (decrease) | (771,649,789) | 377,264,123 |
Redemption fees | 54,523 | 81,713 |
Total increase (decrease) in net assets | (508,791,406) | 1,512,301,926 |
| | |
Net Assets | | |
Beginning of period | 7,021,480,094 | 5,509,178,168 |
End of period (including undistributed net investment income of $85,893,161 and undistributed net investment income of $98,105,298, respectively) | $ 6,512,688,688 | $ 7,021,480,094 |
Financial Highlights - Overseas
Years ended October 31, | 2010 | 2009 | 2008 | 2007 | 2006 |
Selected Per-Share Data | | | | | |
Net asset value, beginning of period | $ 30.13 | $ 25.43 | $ 58.39 | $ 47.08 | $ 37.65 |
Income from Investment Operations | | | | | |
Net investment income (loss)B | .42 | .52 | .55 | .70 | .63 |
Net realized and unrealized gain (loss) | 1.49 | 4.55 | (27.19) | 15.80 | 9.37 |
Total from investment operations | 1.91 | 5.07 | (26.64) | 16.50 | 10.00 |
Distributions from net investment income | (.47) | (.37) | (.57) | (.55) | (.41) |
Distributions from net realized gain | (.01) | - | (5.75) | (4.64) | (.16) |
Total distributions | (.48) | (.37) | (6.32) | (5.19) | (.57) |
Redemption fees added to paid in capitalB,F | - | - | - | - | - |
Net asset value, end of period | $ 31.56 | $ 30.13 | $ 25.43 | $ 58.39 | $ 47.08 |
Total ReturnA | 6.33% | 20.44% | (50.88)% | 38.79% | 26.83% |
Ratios to Average Net AssetsC,E | | | | | |
Expenses before reductions | .89% | 1.02% | 1.13% | .95% | 1.00% |
Expenses net of fee waivers, if any | .89% | 1.02% | 1.13% | .95% | 1.00% |
Expenses net of all reductions | .85% | .98% | 1.10% | .91% | .90% |
Net investment income (loss) | 1.41% | 2.01% | 1.33% | 1.43% | 1.43% |
Supplemental Data | | | | | |
Net assets, end of period (000 omitted) | $ 5,548,689 | $ 6,602,017 | $ 5,464,901 | $ 9,543,353 | $ 7,217,287 |
Portfolio turnover rateD | 111% | 115% | 113% | 87% | 132% |
A Total returns would have been lower had certain expenses not been reduced during the periods shown.
B Calculated based on average shares outstanding during the period.
C Fees and expenses of the underlying Fidelity Central Funds are not included in the Fund's expense ratio. The Fund indirectly bears its proportionate share of the expenses of any underlying Fidelity Central Funds.
D Amount does not include the portfolio activity of any underlying Fidelity Central Funds.
E Expense ratios reflect operating expenses of the class. Expenses before reductions do not reflect amounts reimbursed by the investment adviser or reductions from brokerage service arrangements or reductions from other expense offset arrangements and do not represent the amount paid by the class during periods when reimbursements or reductions occur. Expenses net of fee waivers reflect expenses after reimbursement by the investment adviser but prior to reductions from brokerage service arrangements or other expense offset arrangements. Expenses net of all reductions represent the net expenses paid by the class.
F Amount represents less than $.01 per share.
See accompanying notes which are an integral part of the financial statements.
Annual Report
Financial Highlights - Class K
Years ended October 31, | 2010 | 2009 | 2008G |
Selected Per-Share Data | | | |
Net asset value, beginning of period | $ 30.16 | $ 25.45 | $ 45.00 |
Income from Investment Operations | | | |
Net investment income (loss)D | .47 | .59 | .13 |
Net realized and unrealized gain (loss) | 1.50 | 4.54 | (19.68) |
Total from investment operations | 1.97 | 5.13 | (19.55) |
Distributions from net investment income | (.53) | (.42) | - |
Distributions from net realized gain | (.01) | - | - |
Total distributions | (.54) | (.42) | - |
Redemption fees added to paid in capitalD,I | - | - | - |
Net asset value, end of period | $ 31.59 | $ 30.16 | $ 25.45 |
Total ReturnB,C | 6.55% | 20.73% | (43.44)% |
Ratios to Average Net AssetsE,H | | | |
Expenses before reductions | .69% | .78% | .96%A |
Expenses net of fee waivers, if any | .69% | .78% | .96%A |
Expenses net of all reductions | .66% | .74% | .93%A |
Net investment income (loss) | 1.60% | 2.25% | 1.08%A |
Supplemental Data | | | |
Net assets, end of period (000 omitted) | $ 368,004 | $ 383,048 | $ 44,277 |
Portfolio turnover rateF | 111% | 115% | 113% |
A Annualized
B Total returns for periods of less than one year are not annualized.
C Total returns would have been lower had certain expenses not been reduced during the periods shown.
D Calculated based on average shares outstanding during the period.
E Fees and expenses of the underlying Fidelity Central Funds are not included in the Fund's expense ratio. The Fund indirectly bears its proportionate share of the expenses of any underlying Fidelity Central Funds.
F Amount does not include the portfolio activity of any underlying Fidelity Central Funds.
G For the period May 9, 2008 (commencement of sale of shares) to October 31, 2008.
H Expense ratios reflect operating expenses of the class. Expenses before reductions do not reflect amounts reimbursed by the investment adviser or reductions from brokerage service arrangements or reductions from other expense offset arrangements and do not represent the amount paid by the class during periods when reimbursements or reductions occur. Expense ratios before reductions for start-up periods may not be representative of longer-term operating periods. Expenses net of fee waivers reflect expenses after reimbursement by the investment adviser but prior to reductions from brokerage service arrangements or other expense offset arrangements. Expenses net of all reductions represent the net expenses paid by the class.
I Amount represents less than $.01 per share.
Financial Highlights - Class F
Years ended October 31, | 2010 | 2009G |
Selected Per-Share Data | | |
Net asset value, beginning of period | $ 30.15 | $ 26.62 |
Income from Investment Operations | | |
Net investment income (loss)D | .48 | .07 |
Net realized and unrealized gain (loss) | 1.51 | 3.46 |
Total from investment operations | 1.99 | 3.53 |
Distributions from net investment income | (.55) | - |
Distributions from net realized gain | (.01) | - |
Total distributions | (.56) | - |
Redemption fees added to paid in capitalD,I | - | - |
Net asset value, end of period | $ 31.58 | $ 30.15 |
Total ReturnB,C | 6.60% | 13.26% |
Ratios to Average Net AssetsE,H | | |
Expenses before reductions | .64% | .68%A |
Expenses net of fee waivers, if any | .64% | .68%A |
Expenses net of all reductions | .60% | .64%A |
Net investment income (loss) | 1.66% | .70%A |
Supplemental Data | | |
Net assets, end of period (000 omitted) | $ 595,995 | $ 36,415 |
Portfolio turnover rateF | 111% | 115% |
A Annualized
B Total returns for periods of less than one year are not annualized.
C Total returns would have been lower had certain expenses not been reduced during the periods shown.
D Calculated based on average shares outstanding during the period.
E Fees and expenses of the underlying Fidelity Central Funds are not included in the Fund's expense ratio. The Fund indirectly bears its proportionate share of the expenses of any underlying Fidelity Central Funds.
F Amount does not include the portfolio activity of any underlying Fidelity Central Funds.
G For the period June 26, 2009 (commencement of sale of shares) to October 31, 2009.
H Expense ratios reflect operating expenses of the class. Expenses before reductions do not reflect amounts reimbursed by the investment adviser or reductions from brokerage service arrangements or reductions from other expense offset arrangements and do not represent the amount paid by the class during periods when reimbursements or reductions occur. Expense ratios before reductions for start-up periods may not be representative of longer-term operating periods. Expenses net of fee waivers reflect expenses after reimbursement by the investment adviser but prior to reductions from brokerage service arrangements or other expense offset arrangements. Expenses net of all reductions represent the net expenses paid by the class.
I Amount represents less than $.01 per share.
See accompanying notes which are an integral part of the financial statements.
Annual Report
Notes to Financial Statements
For the period ended October 31, 2010
1. Organization.
Fidelity Overseas Fund (the Fund) is a fund of Fidelity Investment Trust (the Trust) and is authorized to issue an unlimited number of shares. The Trust is registered under the Investment Company Act of 1940, as amended (the 1940 Act), as an open-end management investment company organized as a Massachusetts business trust. The Fund offers Overseas, Class K, and Class F shares each of which has equal rights as to assets and voting privileges. Each class has exclusive voting rights with respect to matters that affect that class. Class F shares of the Fund are only available for purchase by mutual funds for which Fidelity Management & Research Company (FMR) or an affiliate serves as investment manager. Investment income, realized and unrealized capital gains and losses, the common expenses of the Fund, and certain fund-level expense reductions, if any, are allocated on a pro-rata basis to each class based on the relative net assets of each class to the total net assets of the Fund. Each class differs with respect to transfer agent fees incurred. Certain expense reductions also differ by class. The Fund's investments in emerging markets can be subject to social, economic, regulatory, and political uncertainties and can be extremely volatile.
2. Investments in Fidelity Central Funds.
The Fund may invest in Fidelity Central Funds, which are open-end investment companies available only to other investment companies and accounts managed by FMR and its affiliates. The Fund's Schedule of Investments lists each of the Fidelity Central Funds held as of period end, if any, as an investment of the Fund, but does not include the underlying holdings of each Fidelity Central Fund. As an Investing Fund, the Fund indirectly bears its proportionate share of the expenses of the underlying Fidelity Central Funds.
The Money Market Central Funds seek preservation of capital and current income and are managed by Fidelity Investments Money Management, Inc. (FIMM), an affiliate of FMR.
A complete unaudited list of holdings for each Fidelity Central Fund is available upon request or at the Securities and Exchange Commission (the SEC) web site at www.sec.gov. In addition, the financial statements of the Fidelity Central Funds, which are not covered by the Fund's Report of Independent Registered Public Accounting Firm, are available on the SEC web site or upon request.
3. Significant Accounting Policies.
The financial statements have been prepared in conformity with accounting principles generally accepted in the United States of America (GAAP), which require management to make certain estimates and assumptions at the date of the financial statements. Actual results could differ from those estimates. The following summarizes the significant accounting policies of the Fund:
Security Valuation. Investments are valued as of 4:00 p.m. Eastern time on the last calendar day of the period. The Fund uses independent pricing services approved by the Board of Trustees to value its investments. When current market prices or quotations are not readily available or reliable, valuations may be determined in good faith in accordance with procedures adopted by the Board of Trustees. Factors used in determining value may include market or security specific events. The frequency with which these procedures are used cannot be predicted and they may be utilized to a significant extent. The value used for net asset value (NAV) calculation under these procedures may differ from published prices for the same securities.
The Fund categorizes the inputs to valuation techniques used to value its investments into a disclosure hierarchy consisting of three levels as shown below.
Level 1 - quoted prices in active markets for identical investments
Level 2 - other significant observable inputs (including quoted prices for similar investments, interest rates, prepayment speeds, etc.)
Level 3 - unobservable inputs (including the fund's own assumptions based on the best information available)
Changes in valuation techniques may result in transfers in or out of an assigned level within the disclosure hierarchy. The aggregate value of investments by input level, as of October 31, 2010, as well as a roll forward of Level 3 securities, is included at the end of the Fund's Schedule of Investments. Valuation techniques used to value the Fund's investments by major category are as follows.
Equity securities, including restricted securities, for which market quotations are readily available, are valued at the last reported sale price or official closing price as reported by an independent pricing service on the primary market or exchange on which they are traded and are categorized as Level 1 in the hierarchy. In the event there were no sales during the day or closing prices are not available, securities are valued at the last quoted bid price or may be valued using the last available price and are generally categorized as Level 2 in the hierarchy. For foreign equity securities, when significant market or security specific events arise, comparisons to the valuation of American Depositary Receipts (ADRs), futures contracts, Exchange-traded funds (ETFs) and certain indexes as well as quoted prices for similar securities are used and are categorized as Level 2 in the hierarchy in these circumstances. Utilizing these techniques may result in transfers between Level 1 and Level 2. For restricted equity securities and private placements where observable inputs are limited, assumptions about market activity and risk are used and are categorized as Level 3 in the hierarchy.
Annual Report
Notes to Financial Statements - continued
3. Significant Accounting Policies - continued
Security Valuation - continued
Investments in open-end mutual funds,including Fidelity Central Funds, are valued at their closing net asset value each business day and are categorized as Level 1 in the hierarchy. Short-term securities with remaining maturities of sixty days or less for which quotations are not readily available are valued at amortized cost, which approximates fair value and are categorized as Level 2 in the hierarchy.
Foreign Currency. The Fund uses foreign currency contracts to facilitate transactions in foreign-denominated securities. Gains and losses from these transactions may arise from changes in the value of the foreign currency or if the counterparties do not perform under the contracts' terms.
Foreign-denominated assets, including investment securities, and liabilities are translated into U.S. dollars at the exchange rate at period end. Purchases and sales of investment securities, income and dividends received and expenses denominated in foreign currencies are translated into U.S. dollars at the exchange rate in effect on the transaction date.
The effects of exchange rate fluctuations on investments are included with the net realized and unrealized gain (loss) on investment securities. Other foreign currency transactions resulting in realized and unrealized gain (loss) are disclosed separately.
Investment Transactions and Income. For financial reporting purposes, the Fund's investment holdings and NAV include trades executed through the end of the last business day of the period. The NAV per share for processing shareholder transactions is calculated as of the close of business of the New York Stock Exchange (NYSE), normally 4:00 p.m. Eastern time and includes trades executed through the end of the prior business day. Gains and losses on securities sold are determined on the basis of identified cost and may include proceeds received from litigation. Dividend income is recorded on the ex-dividend date, except for certain dividends from foreign securities where the ex-dividend date may have passed, which are recorded as soon as the Fund is informed of the ex-dividend date. Non-cash dividends included in dividend income, if any, are recorded at the fair market value of the securities received. Distributions received on securities that represent a return of capital or capital gain are recorded as a reduction of cost of investments and/or as a realized gain. The Fund estimates the components of distributions received that may be considered return of capital distributions or capital gain distributions. Interest income and distributions from the Fidelity Central Funds are accrued as earned. Interest income includes coupon interest and amortization of premium and accretion of discount on debt securities. Investment income is recorded net of foreign taxes withheld where recovery of such taxes is uncertain.
Expenses. Most expenses of the Trust can be directly attributed to a fund. Expenses which cannot be directly attributed are apportioned amongst each fund in the Trust. Expense estimates are accrued in the period to which they relate and adjustments are made when actual amounts are known.
Deferred Trustee Compensation. Under a Deferred Compensation Plan (the Plan), independent Trustees may elect to defer receipt of a portion of their annual compensation. Deferred amounts are invested in a cross-section of Fidelity funds, are marked-to-market and remain in the Fund until distributed in accordance with the Plan. The investment of deferred amounts and the offsetting payable to the Trustees are included in the accompanying Statement of Assets and Liabilities.
Income Tax Information and Distributions to Shareholders. Each year the Fund intends to qualify as a regulated investment company, including distributing substantially all of its taxable income and realized gains under Subchapter M of the Internal Revenue Code and filing its U.S. federal tax return. As a result, no provision for income taxes is required. As of October 31, 2010, the Fund did not have any unrecognized tax benefits in the accompanying financial statements. A fund's federal tax return is subject to examination by the Internal Revenue Service (IRS) for a period of three years. Foreign taxes are provided for based on the Fund's understanding of the tax rules and rates that exist in the foreign markets in which it invests.
Distributions are declared and recorded on the ex-dividend date. Income dividends and capital gain distributions are declared separately for each class. Income and capital gain distributions are determined in accordance with income tax regulations, which may differ from GAAP.
Capital accounts within the financial statements are adjusted for permanent book-tax differences. These adjustments have no impact on net assets or the results of operations. Temporary book-tax differences will reverse in a subsequent period.
Book-tax differences are primarily due to short-term capital gain distributions from the Fidelity Central Funds, foreign currency transactions, passive foreign investment companies (PFIC), deferred trustees compensation, capital loss carryforwards and losses deferred due to wash sales.
The federal tax cost of investment securities and unrealized appreciation (depreciation) as of period end were as follows:
Gross unrealized appreciation | $ 680,769,014 |
Gross unrealized depreciation | (481,671,593) |
Net unrealized appreciation (depreciation) | $ 199,097,421 |
| |
Tax Cost | $ 6,400,623,997 |
Annual Report
3. Significant Accounting Policies - continued
Income Tax Information and Distributions to Shareholders - continued
The tax-based components of distributable earnings as of period end were as follows:
Undistributed ordinary income | $ 86,052,773 |
Capital loss carryforward | $ (1,637,677,232) |
Net unrealized appreciation (depreciation) | $ 199,945,316 |
The tax character of distributions paid was as follows:
| October 31, 2010 | October 31, 2009 |
Ordinary Income | $ 110,764,641 | $ 81,537,156 |
Short-Term Trading (Redemption) Fees. Shares held by investors in the Fund less than 30 days are subject to a redemption fee equal to 1.00% of the net asset value of shares redeemed. All redemption fees, which reduce the proceeds of the shareholder redemption, are retained by the Fund and accounted for as an addition to paid in capital.
4. Purchases and Sales of Investments.
Purchases and sales of securities, other than short-term securities, aggregated $7,369,512,168 and $8,098,799,007, respectively.
5. Fees and Other Transactions with Affiliates.
Management Fee. FMR and its affiliates provide the Fund with investment management related services for which the Fund pays a monthly management fee. The management fee is the sum of an individual fund fee rate that is based on an annual rate of .45% of the Fund's average net assets and a group fee rate that averaged .26% during the period. The group fee rate is based upon the average net assets of all the mutual funds advised by FMR. The group fee rate decreases as assets under management increase and increases as assets under management decrease. In addition, the management fee is subject to a performance adjustment(up to a maximum of ±.20% of the Fund's average net assets over a 36 month performance period). The upward or downward adjustment to the management fee is based on the relative investment performance of Overseas as compared to an appropriate benchmark index. For the period, the total annual management fee rate, including the performance adjustment, was ..59% of the Fund's average net assets.
Transfer Agent Fees. Fidelity Investments Institutional Operations Company, Inc. (FIIOC), an affiliate of FMR, is the transfer, dividend disbursing and shareholder servicing agent for each class of the Fund. FIIOC receives account fees and asset-based fees that vary according to the account size and type of account of the shareholders of Overseas. FIIOC receives an asset-based fee of Class K's average net assets. FIIOC receives no fees for providing transfer agency services to Class F. FIIOC pays for typesetting, printing and mailing of shareholder reports, except proxy statements. For the period, transfer agent fees for each class were as follows:
| Amount | % of
Average
Net Assets |
Overseas | 15,119,234 | .25 |
Class K | 212,422 | .05 |
| $ 15,331,656 | |
Accounting and Security Lending Fees. Fidelity Service Company, Inc. (FSC), an affiliate of FMR, maintains the Fund's accounting records. The accounting fee is based on the level of average net assets for the month. Under a separate contract, FSC administers the security lending program. The security lending fee is based on the number and duration of lending transactions.
Brokerage Commissions. The Fund placed a portion of its portfolio transactions with brokerage firms which are affiliates of the investment adviser. The commissions paid to these affiliated firms were $7,413 for the period.
Annual Report
Notes to Financial Statements - continued
5. Fees and Other Transactions with Affiliates - continued
Interfund Lending Program. Pursuant to an Exemptive Order issued by the SEC, the Fund, along with other registered investment companies having management contracts with FMR, may participate in an interfund lending program. This program provides an alternative credit facility allowing the funds to borrow from, or lend money to, other participating affiliated funds. At period end, there were no interfund loans outstanding. The Fund's activity in this program during the period for which loans were outstanding was as follows:
Borrower or Lender | Average Daily
Loan Balance | Weighted Average
Interest Rate | Interest
Expense |
Borrower | $ 22,768,107 | .44% | $ 7,829 |
6. Committed Line of Credit.
The Fund participates with other funds managed by FMR or an affiliate in a $3.75 billion credit facility (the "line of credit") to be utilized for temporary or emergency purposes to fund shareholder redemptions or for other short-term liquidity purposes. The Fund has agreed to pay commitment fees on its pro-rata portion of the line of credit, which amounted to $27,318 and is reflected in Miscellaneous expenses on the Statement of Operations. During the period, there were no borrowings on this line of credit.
7. Security Lending.
The Fund lends portfolio securities through a lending agent from time to time in order to earn additional income. The lending agent may loan securities to certain qualified borrowers, including Fidelity Capital Markets (FCM), a broker-dealer affiliated with the Fund. On the settlement date of the loan, the Fund receives collateral (in the form of U.S. Treasury obligations, letters of credit and/or cash) against the loaned securities and maintains collateral in an amount not less than 100% of the market value of the loaned securities during the period of the loan. The market value of the loaned securities is determined at the close of business of the Fund and any additional required collateral is delivered to the Fund on the next business day. If the borrower defaults on its obligation to return the securities loaned because of insolvency or other reasons, a fund could experience delays and costs in recovering the securities loaned or in gaining access to the collateral. Any cash collateral received is invested in the Fidelity Securities Lending Cash Central Fund. The value of loaned securities and cash collateral at period end are disclosed on the Fund's Statement of Assets and Liabilities. Security lending income represents the income earned on investing cash collateral, less rebates paid to borrowers and lending agent fees associated with the loan, plus any premium payments received for lending certain types of securities. Security lending income is presented in the Statement of Operations as a component of income from Fidelity Central Funds. Total security lending income during the period amounted to $6,382,864. During the period, there were no securities loaned to FCM.
8. Expense Reductions.
Many of the brokers with whom FMR places trades on behalf of the Fund provided services to the Fund in addition to trade execution. These services included payments of certain expenses on behalf of the Fund totaling $2,661,854 for the period. In addition, through arrangements with the Fund's custodian credits realized as a result of uninvested cash balances were used to reduce the Fund's expenses. During the period, these credits reduced the Fund's custody expenses by $234.
9. Distributions to Shareholders.
Distributions to shareholders of each class were as follows:
Years ended October 31, | 2010 | 2009A |
From net investment income | | |
Overseas | $ 100,374,591 | $ 78,759,447 |
Class K | 6,711,130 | 2,777,709 |
Class F | 1,370,072 | - |
Total | $ 108,455,793 | $ 81,537,156 |
From net realized gain | | |
Overseas | $ 2,158,312 | $ - |
Class K | 126,111 | - |
Class F | 24,425 | - |
Total | $ 2,308,848 | $ - |
A Distributions to shareholders for Class F are for the period June 26, 2009 (commencement of sale of shares) to October 31, 2009.
Annual Report
10. Share Transactions.
Transactions for each class of shares were as follows:
| Shares | Dollars |
Years ended October 31, | 2010 | 2009A | 2010 | 2009A |
Overseas | | | | |
Shares sold | 36,113,789 | 47,857,124 | $ 1,067,886,397 | $ 1,179,178,777 |
Conversion to Class KB | - | (11,269,934) | - | (265,380,751) |
Reinvestment of distributions | 3,238,247 | 3,481,434 | 101,747,555 | 78,089,426 |
Shares redeemed | (82,678,886) | (35,803,556) | (2,430,908,864) | (910,091,016) |
Net increase (decrease) | (43,326,850) | 4,265,068 | ($ 1,261,274,912) | $ 81,796,436 |
Class K | | | | |
Shares sold | 5,090,117 | 2,178,017 | $ 151,156,491 | $ 56,176,528 |
Conversion from OverseasB | - | 11,270,235 | - | 265,380,751 |
Reinvestment of distributions | 217,803 | 123,950 | 6,837,242 | 2,777,709 |
Shares redeemed | (6,358,836) | (2,610,676) | (189,093,826) | (67,054,987) |
Net increase (decrease) | (1,050,916) | 10,961,526 | ($ 31,100,093) | $ 257,280,001 |
Class F | | | | |
Shares sold | 22,173,982 | 1,220,610 | $ 652,570,206 | $ 38,599,366 |
Reinvestment of distributions | 44,465 | - | 1,394,498 | - |
Shares redeemed | (4,555,729) | (12,931) | (133,239,488) | (411,680) |
Net increase (decrease) | 17,662,718 | 1,207,679 | $ 520,725,216 | $ 38,187,686 |
A Share transactions for Class F are for the period June 26, 2009 (commencement of sale of shares) to October 31, 2009.
B Conversion transactions for class K and Overseas are presented for the period November 1, 2008 through August 31, 2009.
11. Other.
The Fund's organizational documents provide former and current trustees and officers with a limited indemnification against liabilities arising in connection with the performance of their duties to the Fund. In the normal course of business, the Fund may also enter into contracts that provide general indemnifications. The Fund's maximum exposure under these arrangements is unknown as this would be dependent on future claims that may be made against the Fund. The risk of material loss from such claims is considered remote.
The Fidelity Freedom Funds and Fidelity Freedom K® Funds were the owners of record, in the aggregate, of approximately 52% of the total outstanding shares of the Fund.
Annual Report
Report of Independent Registered Public Accounting Firm
To the Trustees of Fidelity Investment Trust and the Shareholders of Fidelity Overseas Fund:
In our opinion, the accompanying statement of assets and liabilities, including the schedule of investments, and the related statements of operations and of changes in net assets and the financial highlights present fairly, in all material respects, the financial position of Fidelity Overseas Fund (a fund of Fidelity Investment Trust) at October 31, 2010, the results of its operations for the year then ended, the changes in its net assets for each of the two years in the period then ended and the financial highlights for each of the periods indicated, in conformity with accounting principles generally accepted in the United States of America. These financial statements and financial highlights (hereafter referred to as "financial statements") are the responsibility of the Fidelity Overseas Fund's management. Our responsibility is to express an opinion on these financial statements based on our audits. We conducted our audits of these financial statements in accordance with the standards of the Public Company Accounting Oversight Board (United States). Those standards require that we plan and perform the audit to obtain reasonable assurance about whether the financial statements are free of material misstatement. An audit includes examining, on a test basis, evidence supporting the amounts and disclosures in the financial statements, assessing the accounting principles used and significant estimates made by management, and evaluating the overall financial statement presentation. We believe that our audits, which included confirmation of securities at October 31, 2010 by correspondence with the custodian and brokers, provide a reasonable basis for our opinion.
/s/ PricewaterhouseCoopers LLP
PricewaterhouseCoopers LLP
Boston, Massachusetts
December 17, 2010
Annual Report
The Trustees, Member of the Advisory Board, and executive officers of the trust and fund, as applicable, are listed below. The Board of Trustees governs each fund and is responsible for protecting the interests of shareholders. The Trustees are experienced executives who meet periodically throughout the year to oversee each fund's activities, review contractual arrangements with companies that provide services to each fund, oversee management of the risks associated with such activities and contractual arrangements, and review each fund's performance. Except for James C. Curvey, each of the Trustees oversees 221 funds advised by FMR or an affiliate. Mr. Curvey oversees 410 funds advised by FMR or an affiliate.
The Trustees hold office without limit in time except that (a) any Trustee may resign; (b) any Trustee may be removed by written instrument, signed by at least two-thirds of the number of Trustees prior to such removal; (c) any Trustee who requests to be retired or who has become incapacitated by illness or injury may be retired by written instrument signed by a majority of the other Trustees; and (d) any Trustee may be removed at any special meeting of shareholders by a two-thirds vote of the outstanding voting securities of the trust. Each Trustee who is not an interested person (as defined in the 1940 Act) (Independent Trustee), shall retire not later than the last day of the calendar year in which his or her 72nd birthday occurs. The Independent Trustees may waive this mandatory retirement age policy with respect to individual Trustees. The executive officers and Advisory Board Members hold office without limit in time, except that any officer and Advisory Board Member may resign or may be removed by a vote of a majority of the Trustees at any regular meeting or any special meeting of the Trustees. Except as indicated, each individual has held the office shown or other offices in the same company for the past five years.
Experience, Skills, Attributes, and Qualifications of the Fund's Trustees. The Governance and Nominating Committee has adopted a statement of policy that describes the experience, qualifications, attributes, and skills that are necessary and desirable for potential Independent Trustee candidates (Statement of Policy). The Board believes that each Trustee satisfied at the time he or she was initially elected or appointed a Trustee, and continues to satisfy, the standards contemplated by the Statement of Policy. The Governance and Nominating Committee also engages professional search firms to help identify potential Independent Trustee candidates who have the experience, qualifications, attributes, and skills consistent with the Statement of Policy. From time to time, additional criteria based on the composition and skills of the current Independent Trustees, as well as experience or skills that may be appropriate in light of future changes to board composition, business conditions, and regulatory or other developments, have also been considered by the professional search firms and the Governance and Nominating Committee. In addition, the Board takes into account the Trustees' commitment and participation in Board and committee meetings, as well as their leadership of standing and ad hoc committees throughout their tenure.
In determining that a particular Trustee was and continues to be qualified to serve as a Trustee, the Board has considered a variety of criteria, none of which, in isolation, was controlling. The Board believes that, collectively, the Trustees have balanced and diverse experience, qualifications, attributes, and skills, which allow the Board to operate effectively in governing the fund and protecting the interests of shareholders. Information about the specific experience, skills, attributes, and qualifications of each Trustee, which in each case led to the Board's conclusion that the Trustee should serve (or continue to serve) as a trustee of the fund, is provided below.
Board Structure and Oversight Function. Edward C. Johnson 3d is an interested person (as defined in the 1940 Act) and currently serves as Chairman. The Trustees have determined that an interested Chairman is appropriate and benefits shareholders because an interested Chairman has a personal and professional stake in the quality and continuity of services provided to the fund. Independent Trustees exercise their informed business judgment to appoint an individual of their choosing to serve as Chairman, regardless of whether the Trustee happens to be independent or a member of management. The Independent Trustees have determined that they can act independently and effectively without having an Independent Trustee serve as Chairman and that a key structural component for assuring that they are in a position to do so is for the Independent Trustees to constitute a substantial majority for the Board. The Independent Trustees also regularly meet in executive session. Ned C. Lautenbach serves as Chairman of the Independent Trustees and as such (i) acts as a liaison between the Independent Trustees and management with respect to matters important to the Independent Trustees and (ii) with management prepares agendas for Board meetings.
Fidelity funds are overseen by different Boards of Trustees. The fund's Board oversees Fidelity's equity and high income funds and another Board oversees Fidelity's investment-grade bond, money market, and asset allocation funds. The asset allocation funds may invest in Fidelity funds overseen by the fund's Board. The use of separate Boards, each with its own committee structure, allows the Trustees of each group of Fidelity funds to focus on the unique issues of the funds they oversee, including common research, investment, and operational issues. On occasion, the separate Boards establish joint committees to address issues of overlapping consequences for the Fidelity funds overseen by each Board.
The Trustees operate using a system of committees to facilitate the timely and efficient consideration of all matters of importance to the Trustees, the fund, and fund shareholders and to facilitate compliance with legal and regulatory requirements and oversight of the fund's activities and associated risks. The Board, acting through its committees, has charged FMR and its affiliates with (i) identifying events or circumstances the occurrence of which could have demonstrably adverse effects on the fund's business and/or reputation; (ii) implementing processes and controls to lessen the possibility that such events or circumstances occur or to mitigate the effects of such events or circumstances if they do occur; and (iii) creating and maintaining a system designed to evaluate continuously business and market conditions in order to facilitate the identification and implementation processes described in (i) and (ii) above. Because the day-to-day operations and activities of the fund's are carried out by or through FMR, its affiliates and other service providers, the fund's exposure to risks is mitigated but not eliminated by the processes overseen by the Trustees. While each of the Board's committees has responsibility for overseeing different aspects of the fund's activities, oversight is exercised primarily through the Operations, Audit, and Compliance Committees. Appropriate personnel, including but not limited to the fund's Chief Compliance Officer (CCO), FMR's internal auditor, the independent accountants, the fund's Treasurer and portfolio management personnel, make periodic reports to the Board's committees, as appropriate. The responsibilities of each committee, including their oversight responsibilities, are described further under "Standing Committees of the Fund's Trustees."
Annual Report
The fund's Statement of Additional Information (SAI) includes more information about the Trustees. To request a free copy, call Fidelity at 1-800-835-5092.
Interested Trustees*:
Correspondence intended for each Trustee who is an interested person may be sent to Fidelity Investments, 82 Devonshire Street, Boston, Massachusetts 02109.
Name, Age; Principal Occupations and Other Relevant Experience+ |
Edward C. Johnson 3d (80) |
| Year of Election or Appointment: 1984 Mr. Johnson is Trustee and Chairman of the Board of Trustees of certain Trusts. Mr. Johnson serves as Chief Executive Officer, Chairman, and a Director of FMR LLC; Chairman and a Director of FMR; Chairman and a Director of Fidelity Research & Analysis Company (FRAC); Chairman and a Director of Fidelity Investments Money Management, Inc.; and Chairman and a Director of FMR Co., Inc. In addition, Mr. Johnson serves as Chairman and Director of FIL Limited. Previously, Mr. Johnson served as President of FMR LLC (2006-2007). |
James C. Curvey (75) |
| Year of Election or Appointment: 2007 Mr. Curvey also serves as Trustee (2007-present) of other investment companies advised by FMR. Mr. Curvey is a Director of Fidelity Investments Money Management, Inc. (2009-present), Director of Fidelity Research & Analysis Co. (2009-present) and Director of FMR and FMR Co., Inc. (2007-present). Mr. Curvey is also Vice Chairman (2007-present) and Director of FMR LLC. In addition, Mr. Curvey serves as an Overseer for the Boston Symphony Orchestra and a member of the Trustees of Villanova University. Previously, Mr. Curvey was the Vice Chairman (2006-2007) and Director (2000-2007) of FMR Corp. |
* Trustees have been determined to be "Interested Trustees" by virtue of, among other things, their affiliation with the trusts or various entities under common control with FMR.
+ The information above includes each Trustee's principal occupation during the last five years and other information relating to the experience, attributes, and skills relevant to each Trustee's qualifications to serve as a Trustee, which led to the conclusion that each Trustee should serve as a Trustee for the fund.
Independent Trustees:
Correspondence intended for each Independent Trustee (that is, the Trustees other than the Interested Trustees) may be sent to Fidelity Investments, P.O. Box 55235, Boston, Massachusetts 02205-5235.
Name, Age; Principal Occupations and Other Relevant Experience+ |
Dennis J. Dirks (62) |
| Year of Election or Appointment: 2005 Prior to his retirement in May 2003, Mr. Dirks was Chief Operating Officer and a member of the Board of The Depository Trust & Clearing Corporation (DTCC). He also served as President, Chief Operating Officer, and Board member of The Depository Trust Company (DTC) and President and Board member of the National Securities Clearing Corporation (NSCC). In addition, Mr. Dirks served as Chief Executive Officer and Board member of the Government Securities Clearing Corporation, Chief Executive Officer and Board member of the Mortgage-Backed Securities Clearing Corporation, as a Trustee and a member of the Finance Committee of Manhattan College (2005-2008), and as a Trustee and a member of the Finance Committee of AHRC of Nassau County (2006-2008). Mr. Dirks is a member of the Independent Directors Council (IDC) Governing Council (2010-Present) and Board of Directors for The Brookville Center for Children's Services, Inc. (2009-present). |
Alan J. Lacy (57) |
| Year of Election or Appointment: 2008 Mr. Lacy serves as Senior Adviser (2007-present) of Oak Hill Capital Partners, L.P. (private equity). Mr. Lacy also served as Chief Executive Officer (2000-2005) and Vice Chairman (2005-2006) of Sears Holdings Corporation and Sears, Roebuck and Co. (retail). In addition, Mr. Lacy serves as a member of the Board of Directors of The Western Union Company (global money transfer, 2006-present) and Bristol-Myers Squibb Company (global pharmaceuticals, 2007-present). Mr. Lacy is Chairman (2008-present) and a member (2006-present) of the Board of Trustees of The National Parks Conservation Association. |
Ned C. Lautenbach (66) |
| Year of Election or Appointment: 2000 Mr. Lautenbach is Chairman of the Independent Trustees of the Equity and High Income Funds (2006-present). Mr. Lautenbach currently serves as the Lead Director of the Eaton Corporation Board of Directors (diversified industrial, 1997-present). Mr. Lautenbach is also a member of the Board of Directors of the Philharmonic Center for the Arts in Naples, Florida (1999-present); a member of the Board of Trustees of Fairfield University (2005-present); and a member of the Council on Foreign Relations (1994-present). Previously, Mr. Lautenbach was a Partner/Advisory Partner at Clayton, Dubilier & Rice, Inc. (private equity investment, 1998-2010), as well as a Director of Sony Corporation (2006-2007). |
Joseph Mauriello (66) |
| Year of Election or Appointment: 2008 Prior to his retirement in January 2006, Mr. Mauriello served in numerous senior management positions including Deputy Chairman and Chief Operating Officer (2004-2005), and Vice Chairman of Financial Services (2002-2004) of KPMG LLP US (professional services, 1965-2005). Mr. Mauriello currently serves as a member of the Board of Directors of XL Group plc. (global insurance and re-insurance, 2006-present) and of Arcadia Resources Inc. (health care services and products, 2007-present). Previously, Mr. Mauriello served as a Director of the Hamilton Funds of the Bank of New York (2006-2007). |
Cornelia M. Small (66) |
| Year of Election or Appointment: 2005 Ms. Small is a member of the Board of Directors of the Teagle Foundation (2009-present). Ms. Small is also a member of the Investment Committee, and Chair (2008-present) and a member of the Board of Trustees of Smith College. In addition, Ms. Small serves on the Investment Committee of the Berkshire Taconic Community Foundation (2008-present). Previously, Ms. Small served as Chairperson of the Investment Committee (2002-2008) of Smith College. In addition, Ms. Small served as Chief Investment Officer, Director of Global Equity Investments, and a member of the Board of Directors of Scudder, Stevens & Clark and Scudder Kemper Investments. |
William S. Stavropoulos (71) |
| Year of Election or Appointment: 2001 Mr. Stavropoulos is Vice Chairman of the Independent Trustees of the Equity and High Income Funds (2006-present). Mr. Stavropoulos serves as President and Founder of the Michigan Baseball Foundation, the Great Lakes Loons (2007-present). Mr. Stavropoulos is Chairman Emeritus of the Board of Directors of The Dow Chemical Company, where he previously served in numerous senior management positions, including President, CEO (1995-2000; 2002-2004), Chairman of the Executive Committee (2000-2006), and as a member of the Board of Directors (1990-2006). Currently, Mr. Stavropoulos is Chairman of Univar (global distributor of commodity and speciality chemicals, 2010-present), a Director of Teradata Corporation (data warehousing and technology solutions, 2008-present), Chemical Financial Corporation, Maersk Inc. (industrial conglomerate), Tyco International, Inc. (multinational manufacturing and services, 2007-present), and a member of the Advisory Board for Metalmark Capital (private equity investment, 2005-present). Mr. Stavropoulos is a special advisor to Clayton, Dubilier & Rice, Inc. (private equity investment). In addition, Mr. Stavropoulos is a member of the University of Notre Dame Advisory Council for the College of Science. |
David M. Thomas (61) |
| Year of Election or Appointment: 2008 Previously, Mr. Thomas served as Executive Chairman (2005-2006) and Chairman and Chief Executive Officer (2000-2005) of IMS Health, Inc. (pharmaceutical and healthcare information solutions). In addition, Mr. Thomas serves as a member of the Board of Directors of Fortune Brands, Inc. (consumer products), and Interpublic Group of Companies, Inc. (marketing communication, 2004-present). |
Michael E. Wiley (60) |
| Year of Election or Appointment: 2008 Mr. Wiley also serves as a Director of Asia Pacific Exploration Consolidated (international oil and gas exploration and production, 2008-present). Mr. Wiley serves as a Director of Tesoro Corporation (independent oil refiner and marketer, 2005-present), and a Director of Bill Barrett Corporation (exploration and production, 2005-present). In addition, Mr. Wiley also serves as a Director of Post Oak Bank (privately-held bank, 2004-present). Previously, Mr. Wiley served as a member of the Board of Trustees of the University of Tulsa (2000-2006; 2007-2010), as a Senior Energy Advisor of Katzenbach Partners, LLC (consulting, 2006-2007), as an Advisory Director of Riverstone Holdings (private investment), Chairman, President, and CEO of Baker Hughes, Inc. (oilfield services, 2000-2004), and as Director of Spinnaker Exploration Company (exploration and production, 2001-2005). |
+ The information above includes each Trustee's principal occupation during the last five years and other information relating to the experience, attributes, and skills relevant to each Trustee's qualifications to serve as a Trustee, which led to the conclusion that each Trustee should serve as a Trustee for the fund.
Annual Report
Advisory Board Member and Executive Officers:
Correspondence intended for each executive officer, and Peter S. Lynch may be sent to Fidelity Investments, 82 Devonshire Street, Boston, Massachusetts 02109.
Name, Age; Principal Occupation |
Peter S. Lynch (66) |
| Year of Election or Appointment: 2003 Member of the Advisory Board of Fidelity's Equity and High Income Funds. Mr. Lynch is Vice Chairman and a Director of FMR and FMR Co., Inc. In addition, Mr. Lynch serves as a Trustee of Boston College and as the Chairman of the Inner-City Scholarship Fund. Previously, Mr. Lynch served on the Special Olympics International Board of Directors (1997-2006). |
Kenneth B. Robins (41) |
| Year of Election or Appointment: 2008 President and Treasurer of Fidelity's Equity and High Income Funds. Mr. Robins also serves as President and Treasurer (2010-present) and Assistant Treasurer (2009-present) of other Fidelity funds and is an employee of Fidelity Investments (2004-present). Previously, Mr. Robins served as Deputy Treasurer of the Fidelity funds (2005-2008) and Treasurer and Chief Financial Officer of The North Carolina Capital Management Trust: Cash and Term Portfolios (2006-2008). |
Bruce T. Herring (45) |
| Year of Election or Appointment: 2006 Vice President of certain Equity Funds. Mr. Herring also serves as Chief Investment Officer and Director of Fidelity Management & Research (U.K.) Inc. (2010-present) and Group Chief Investments Officer of FMR. Previously, Mr. Herring served as Vice President (2005-2006) and Senior Vice President (2006-2007) of Fidelity Management & Research Company, Vice President of FMR Co., Inc. (2001-2007) and as a portfolio manager for Fidelity U.S. Equity Funds. |
Brian B. Hogan (46) |
| Year of Election or Appointment: 2009 Vice President of certain Equity Funds and Vice President of Sector Funds. Mr. Hogan also serves as President of FMR's Equity Division (2009-present). Previously, Mr. Hogan served as Senior Vice President, Equity Research of FMR (2006-2009) and as a portfolio manager. |
Scott C. Goebel (42) |
| Year of Election or Appointment: 2008 Secretary and Chief Legal Officer (CLO) of the Fidelity funds. Mr. Goebel also serves as Secretary and CLO of The North Carolina Capital Management Trust: Cash and Term Portfolio (2008-present); General Counsel, Secretary, and Senior Vice President of FMR (2008-present) and FMR Co., Inc. (2008-present); Deputy General Counsel of FMR LLC; Chief Legal Officer of Fidelity Management & Research (Hong Kong) Limited (2008-present) and Assistant Secretary of Fidelity Management & Research (Japan) Inc. (2008-present), Fidelity Investments Money Management, Inc. (2008-present), Fidelity Management & Research (U.K.) Inc. (2008-present), and Fidelity Research and Analysis Company (2008-present). Previously, Mr. Goebel served as Assistant Secretary of the Funds (2007-2008) and as Vice President and Secretary of Fidelity Distributors Corporation (FDC) (2005-2007). |
William C. Coffey (41) |
| Year of Election or Appointment: 2009 Assistant Secretary of Fidelity's Equity and High Income Funds. Mr. Coffey also serves as Senior Vice President and Deputy General Counsel of FMR LLC (2010-present), and is an employee of Fidelity Investments. Previously, Mr. Coffey served as Vice President and Associate General Counsel of FMR LLC (2005-2009). |
Holly C. Laurent (56) |
| Year of Election or Appointment: 2008 Anti-Money Laundering (AML) Officer of the Fidelity funds. Ms. Laurent also serves as AML Officer of The North Carolina Capital Management Trust: Cash and Term Portfolio (2008-present) and is an employee of Fidelity Investments. Previously, Ms. Laurent was Senior Vice President and Head of Legal for Fidelity Business Services India Pvt. Ltd. (2006-2008), and Senior Vice President, Deputy General Counsel and Group Head for FMR LLC (2005-2006). |
Christine Reynolds (52) |
| Year of Election or Appointment: 2008 Chief Financial Officer of the Fidelity funds. Ms. Reynolds became President of Fidelity Pricing and Cash Management Services (FPCMS) in August 2008. Ms. Reynolds served as Chief Operating Officer of FPCMS (2007-2008). Previously, Ms. Reynolds served as President, Treasurer, and Anti-Money Laundering officer of the Fidelity funds (2004-2007). |
Kenneth A. Rathgeber (63) |
| Year of Election or Appointment: 2004 Chief Compliance Officer of Fidelity's Equity and High Income Funds. Mr. Rathgeber is Chief Compliance Officer of Fidelity Management & Research (Hong Kong) Limited (2008-present), Fidelity Management & Research (Japan) Inc. (2008-present), FMR (2005-present), FMR Co., Inc. (2005-present), Fidelity Management & Research (U.K.) Inc. (2005-present), Fidelity Research & Analysis Company (2005-present), Fidelity Investments Money Management, Inc. (2005-present), Pyramis Global Advisors, LLC (2005-present), and Strategic Advisers, Inc. (2005-present). |
Jeffrey S. Christian (49) |
| Year of Election or Appointment: 2009 Deputy Treasurer of the Fidelity funds. Mr. Christian is an employee of Fidelity Investments. Previously, Mr. Christian served as Chief Financial Officer (2008-2009) of certain Fidelity funds and Senior Vice President of Fidelity Pricing and Cash Management Services (FPCMS) (2004-2009). |
Bryan A. Mehrmann (49) |
| Year of Election or Appointment: 2005 Deputy Treasurer of the Fidelity funds. Mr. Mehrmann is an employee of Fidelity Investments. |
Adrien E. Deberghes (43) |
| Year of Election or Appointment: 2008 Deputy Treasurer of Fidelity's Equity and High Income Funds. Mr. Deberghes also serves as Assistant Treasurer of other Fidelity funds (2010-present) and is an employee of Fidelity Investments (2008-present). Previously, Mr. Deberghes served as Senior Vice President of Mutual Fund Administration at State Street Corporation (2007-2008), Senior Director of Mutual Fund Administration at Investors Bank & Trust (2005-2007), and Director of Finance for Dunkin' Brands (2000-2005). |
Stephanie J. Dorsey (41) |
| Year of Election or Appointment: 2010 Assistant Treasurer of Fidelity's Equity and High Income Funds. Ms. Dorsey also serves as Deputy Treasurer of other Fidelity funds (2008-present) and is an employee of Fidelity Investments (2008-present). Previously, Ms. Dorsey served as Treasurer (2004-2008) of the JPMorgan Mutual Funds and Vice President (2004-2008) of JPMorgan Chase Bank. |
John R. Hebble (52) |
| Year of Election or Appointment: 2009 Assistant Treasurer of Fidelity's Equity and High Income Funds. Mr. Hebble also serves as Treasurer and Chief Financial Officer of The North Carolina Capital Management Trust: Cash and Term Portfolio (2008-present), President and Treasurer of other Fidelity funds (2008-present) and is an employee of Fidelity Investments. |
Gary W. Ryan (52) |
| Year of Election or Appointment: 2005 Assistant Treasurer of the Fidelity funds. Mr. Ryan is an employee of Fidelity Investments. Previously, Mr. Ryan served as Vice President of Fund Reporting in Fidelity Pricing and Cash Management Services (FPCMS) (1999-2005). |
Jonathan Davis (42) |
| Year of Election or Appointment: 2010 Assistant Treasurer of the Fidelity funds. Mr. Davis is an employee of Fidelity Investments. Previously, Mr. Davis served as Vice President and Associate General Counsel of FMR LLC (2003-2010). |
Annual Report
The Board of Trustees of Fidelity Overseas Fund voted to pay on December 6, 2010 to shareholders of record at the opening of business on December 3, 2010, the following distributions per share derived from capital gains realized from sales of portfolio securities and dividends derived from net investment income:
| Pay Date | Record Date | Dividends | Capital Gains |
Class F | 12/06/10 | 12/03/10 | $0.571 | $0.000 |
A percentage of the dividends distributed during the fiscal year for the following fund may be taken into account as a dividend for purposes of the maximum rate under section 1(h) (11) of the Internal Revenue Code:
| Ex Date | |
Class F | 12/04/2009 | 100% |
Class F | 12/30/2009 | 100% |
The amounts per share which represent income derived from sources within, and taxes paid to, foreign countries or possessions of the United States are as follows:
| Pay Date | Income | Taxes |
Class F | 12/07/2009 | $0.505 | $0.0394 |
Class F | 12/31/2009 | $0.009 | $0.000 |
The fund will notify shareholders in January 2011 of amounts for use in preparing 2010 income tax returns.
Annual Report
Board Approval of Investment Advisory Contracts and Management Fees
Fidelity Overseas Fund
Each year, the Board of Trustees, including the Independent Trustees (together, the Board), votes on the renewal of the management contract and sub-advisory agreements (together, the Advisory Contracts) for the fund. The Board, assisted by the advice of fund counsel and Independent Trustees' counsel, requests and considers a broad range of information relevant to the renewal of the Advisory Contracts throughout the year.
The Board meets regularly and considers at each of its meetings factors that are relevant to its annual consideration of the renewal of the fund's Advisory Contracts, including the services and support provided to the fund and its shareholders. The Board has established various standing committees, each composed of Independent Trustees with varying backgrounds, to which the Board has assigned specific subject matter responsibilities in order to enhance effective decision-making by the Board. The Board, acting directly and through its Committees, requests and receives information concerning the annual consideration of the renewal of the fund's Advisory Contracts. The Board also meets as needed to consider matters specifically related to the Board's annual consideration of the renewal of Advisory Contracts. Members of the Board may also meet with trustees of other Fidelity funds through ad hoc joint committees to discuss certain matters relevant to the Fidelity funds.
At its July 2010 meeting, the Board of Trustees, including the Independent Trustees, unanimously determined to renew the fund's Advisory Contracts. In reaching its determination, the Board considered all factors it believed relevant, including (i) the nature, extent, and quality of the services to be provided to the fund and its shareholders (including the investment performance of the fund); (ii) the competitiveness of the fund's management fee and total expenses; (iii) the total costs of the services to be provided by and the profits to be realized by Fidelity from its relationship with the fund; (iv) the extent to which economies of scale would be realized as the fund grows; and (v) whether fee levels reflect these economies of scale, if any, for the benefit of fund shareholders.
In considering whether to renew the Advisory Contracts for the fund, the Board reached a determination, with the assistance of fund counsel and Independent Trustees' counsel and through the exercise of its business judgment, that the renewal of the Advisory Contracts is in the best interests of fund shareholders and that the compensation to be received by Fidelity under the management contract is fair and reasonable. The Board's decision to renew the Advisory Contracts was not based on any single factor noted above, but rather was based on a comprehensive consideration of all the information provided to the Board at its meetings throughout the year. The Board, in reaching its determination to renew the Advisory Contracts, is aware that shareholders in the fund have a broad range of investment choices available to them, including a wide choice among mutual funds offered by Fidelity's competitors, and that the fund's shareholders, with the opportunity to review and weigh the disclosure provided by the fund in its prospectus and other public disclosures, have chosen to invest in this fund, managed by Fidelity.
Nature, Extent, and Quality of Services Provided. The Board considered the staffing within the investment adviser, FMR, and the sub-advisers (together, the Investment Advisers), including the backgrounds of the fund's investment personnel and the fund's investment objective and discipline. The Independent Trustees also had discussions with senior management of Fidelity's investment operations and investment groups. The Board considered the structure of the portfolio manager compensation program and whether this structure provides appropriate incentives to act in the best interest of the fund.
Resources Dedicated to Investment Management and Support Services. The Board and the equity research subcommittee of the Board's Fund Oversight Committee reviewed the size, education, and experience of the Investment Advisers' investment staff, their use of technology, and the Investment Advisers' approach to recruiting, training, and retaining portfolio managers and other research, advisory, and management personnel. The Board noted that Fidelity's analysts have access to a variety of technological tools and market and securities data that enable them to perform both fundamental and quantitative analysis and to specialize in various disciplines. The Board considered Fidelity's extensive global research capabilities that enable the Investment Advisers to aggregate data from various sources in an effort to produce positive investment results. The Board also considered that Fidelity's portfolio managers and analysts have access to daily portfolio attribution that allows for monitoring of a fund's portfolio, as well as an electronic communication system that provides immediate real-time access to research concerning issuers and credit enhancers. The Board noted FMR's continued focus on strengthening the organization and discipline of equity portfolio management and research.
Shareholder and Administrative Services. The Board considered (i) the nature, extent, quality, and cost of advisory, administrative, and shareholder services performed by the Investment Advisers and their affiliates under the Advisory Contracts and under separate agreements covering transfer agency, pricing and bookkeeping, and securities lending services for the fund; (ii) the nature and extent of the investment adviser's supervision of third party service providers, principally custodians and subcustodians; and (iii) the resources devoted to, and the record of compliance with, the fund's compliance policies and procedures. The Board also reviewed the allocation of fund brokerage, including allocations to brokers affiliated with the Investment Advisers, the use of brokerage commissions to pay fund expenses, and the use of "soft" commission dollars to pay for research services.
The Board noted that the growth of fund assets over time across the complex allows Fidelity to reinvest in the development of services designed to enhance the value or convenience of the Fidelity funds as investment vehicles. These services include 24-hour access to account information and market information through phone representatives and over the Internet, and investor education materials and asset allocation tools.
Investment in a Large Fund Family. The Board considered the benefits to shareholders of investing in a Fidelity fund, including the benefits of investing in a fund that is part of a large family of funds offering a variety of investment disciplines and providing a large variety of mutual fund investor services. The Board noted that Fidelity had taken, or had made recommendations that resulted in the Fidelity funds taking, a number of actions over the previous year that benefited particular funds, including (i) dedicating additional resources to investment research and restructuring and broadening the focus of the investment research teams; (ii) bolstering the senior management team that oversees asset management; (iii) launching Class F of certain funds as a lower-fee class available to Freedom K and Freedom Index Funds; (iv) lowering the initial investment minimums and ongoing balance requirements for Real Estate High Income Fund; (v) eliminating subsequent purchase minimums for all funds and adding a waiver of the investment minimum requirement for new accounts opened with the proceeds of a systematic withdrawal plan; (vi) eliminating the withdrawal minimum and maximum limits for systematic withdrawals from Advisor funds; (vii) expanding sales load waivers on Class A shares for Destiny Planholders and expanding Institutional Class eligibility for Class O Destiny Planholders; and (viii) changing certain Class A and Class T sales charge structures to further align them with industry practices.
Annual Report
Investment Performance. The Board considered whether the fund has operated in accordance with its investment objective, as well as its record of compliance with its investment restrictions. It also reviewed the fund's absolute investment performance for each class (except Class F), as well as the fund's relative investment performance for each class (except Class F) measured over multiple periods against (i) a broad-based securities market index, and (ii) a peer group of mutual funds deemed appropriate by Fidelity and reviewed by the Board. The following charts considered by the Board show, over the one-, three-, and five-year periods ended December 31, 2009, the cumulative total returns of Class K and the retail class of the fund, the cumulative total returns of a broad-based securities market index ("benchmark"), and a range of cumulative total returns of a peer group of mutual funds identified by Morningstar, Inc. as having an investment style similar to that of the fund based on underlying portfolio holdings. (Class F of the fund had less than one year of performance as of December 31, 2009.) The box within each chart shows the 25th percentile return (bottom of box) and the 75th percentile return (top of box) of the peer group. Returns shown above the box are in the first quartile and returns shown below the box are in the fourth quartile. The percentage beaten numbers noted below each chart correspond to the percentile box and represent the percentage of funds in the peer group whose performance was equal to or lower than that of the class indicated.
Fidelity Overseas Fund

The Board reviewed the fund's relative investment performance against its peer group and noted that the performance of the retail class of the fund (the class with the longer performance record) was in the fourth quartile for the one-year period and the third quartile for the three- and five-year periods. The Board also noted that the investment performance of the fund was lower than its benchmark for all the periods shown. The Board discussed with FMR actions that have been taken by FMR to improve the fund's disappointing performance relative to its peer group and benchmark. The Board noted that this fund had underperformed in the previous year and discussed with FMR its disappointment with the continued underperformance of the fund. The Board also reviewed the fund's performance since inception as well as performance in the current year. The Board will continue to closely monitor the performance of the fund in the coming year and discuss with FMR other appropriate actions to address the performance of the fund.
The Board also considered that the fund's management fee is subject to upward or downward adjustment depending upon whether, and to what extent, the fund's investment performance for the performance period exceeds, or is exceeded by, the record (over the same period) of a Board-approved performance adjustment index. The Board realizes that the performance adjustment provides FMR with a strong economic incentive to seek to achieve superior performance for the fund's shareholders and helps to more closely align the interests of FMR and the fund's shareholders.
Based on its review, and giving particular weight to the nature and quality of the resources dedicated by the Investment Advisers to maintain and improve relative performance and factoring in the unprecedented market events in recent years, the Board concluded that the nature, extent, and quality of investment management and support services and of shareholder and administrative services provided to the fund will benefit the fund's shareholders, particularly in light of the Board's view that the fund's shareholders benefit from investing in a fund that is part of a large family of funds offering a variety of investment disciplines and services.
Annual Report
Board Approval of Investment Advisory Contracts and Management Fees - continued
Competitiveness of Management Fee and Total Fund Expenses. The Board considered the fund's management fee and total expenses compared to "mapped groups" of competitive funds and classes. Fidelity creates "mapped groups" by combining similar Lipper investment objective categories that have comparable management fee characteristics. Combining Lipper investment objective categories aids the Board's management fee and total expense comparisons by broadening the competitive group used for comparison and by reducing the number of universes to which various Fidelity funds are compared.
Management Fee. The Board considered two proprietary management fee comparisons for the 12-month periods shown in the chart below. The group of Lipper funds used by the Board for management fee comparisons is referred to below as the "Total Mapped Group." The Total Mapped Group comparison focuses on a fund's standing relative to the total universe of comparable funds available to investors, in terms of gross management fees before expense reimbursements or caps, and without giving effect to the fund's performance adjustment. "TMG %" represents the percentage of funds in the Total Mapped Group that had management fees that were lower than the fund's. For example, a TMG % of 15% means that 85% of the funds in the Total Mapped Group had higher management fees than the fund. The "Asset-Size Peer Group" (ASPG) comparison focuses on a fund's standing relative to non-Fidelity funds similar in size to the fund within the Total Mapped Group. The ASPG represents at least 15% of the funds in the Total Mapped Group with comparable asset size and management fee characteristics, subject to a minimum of 50 funds (or all funds in the Total Mapped Group if fewer than 50). Additional information, such as the ASPG quartile in which the fund's management fee ranked and the impact of the fund's performance adjustment, is also included in the chart and considered by the Board.
Fidelity Overseas Fund
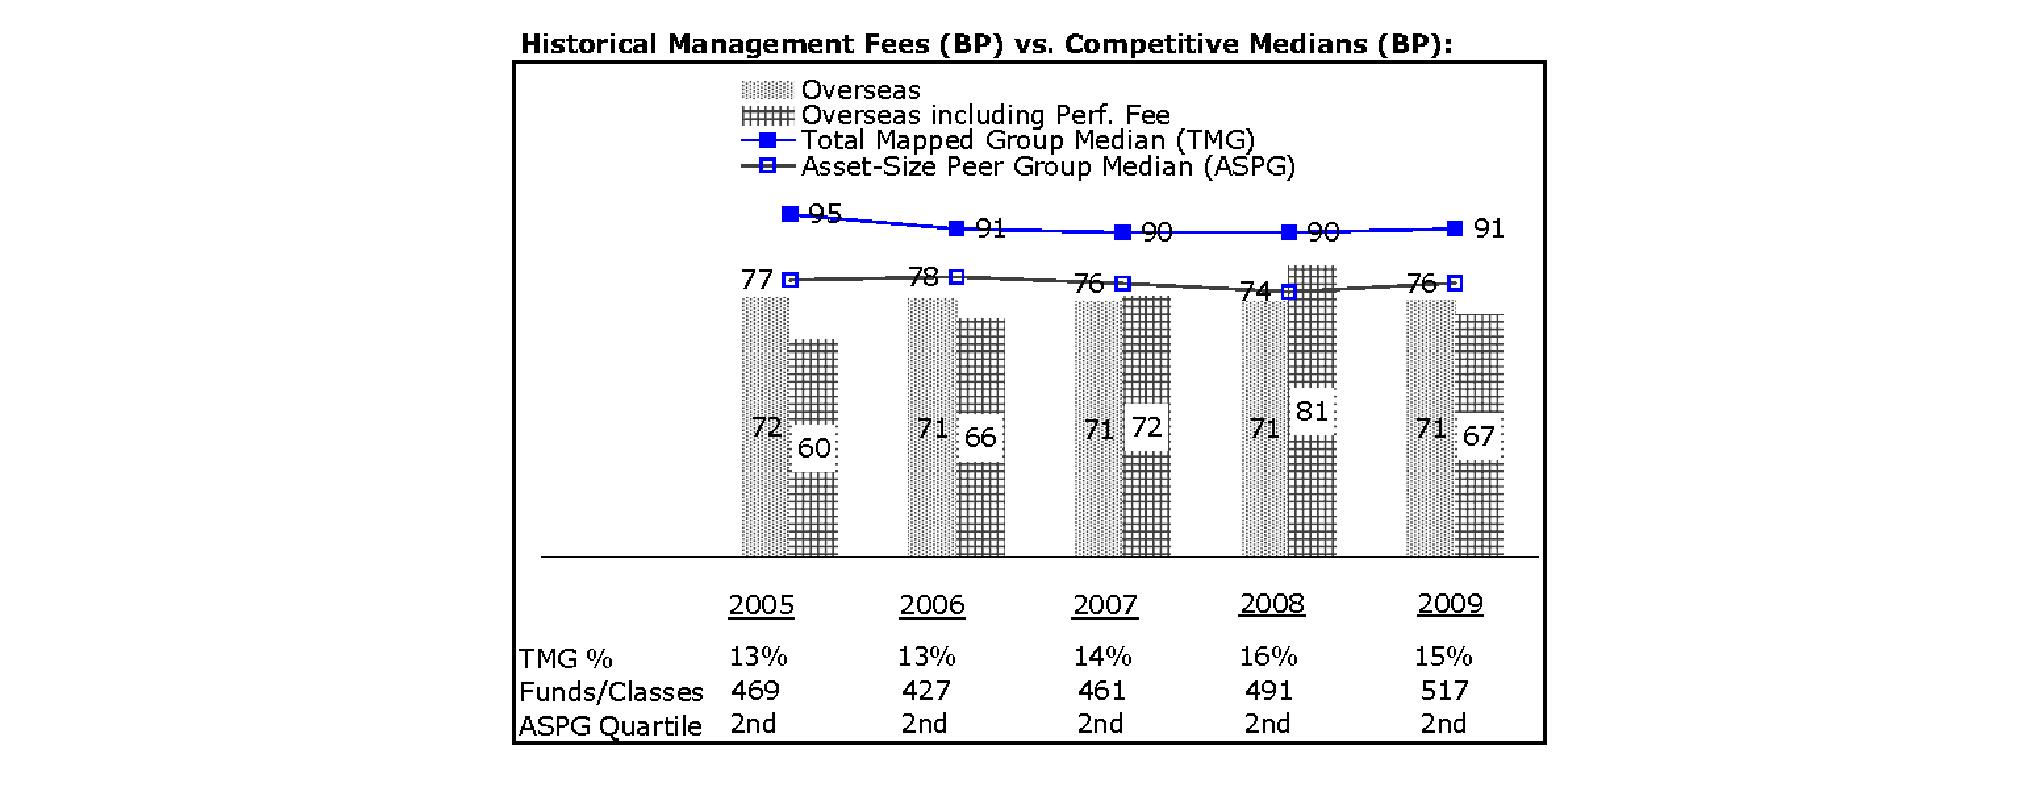
The Board noted that the fund's management fee ranked below the median of its Total Mapped Group and below the median of its ASPG for 2009. The Board also noted the effect of the fund's negative performance adjustment on the fund's management fee ranking. The Board noted that the performance adjustment for each year represents calculations for performance periods that differ from the periods shown in the performance charts above.
Based on its review, the Board concluded that the fund's management fee is fair and reasonable in light of the services that the fund receives and the other factors considered.
Total Expenses. In its review of each class's total expenses, the Board considered the fund's management fee as well as other fund or class expenses, as applicable, such as transfer agent fees, pricing and bookkeeping fees, and custodial, legal, and audit fees. The Board also noted the effects of any waivers and reimbursements on fees and expenses, as well as the impact of the fund's performance adjustment. As part of its review, the Board also considered current and historical total expenses of each class of the fund compared to competitive fund median expenses. Each class of the fund is compared to those funds and classes in the Total Mapped Group (used by the Board for management fee comparisons) that have a similar sales load structure.
The Board noted that the total expenses of each class ranked below its competitive median for the period.
Annual Report
Fees Charged to Other Fidelity Clients. The Board also considered Fidelity fee structures and other information with respect to clients of FMR and its affiliates, such as other mutual funds advised or subadvised by FMR or its affiliates, pension plan clients, and other institutional clients. In March 2010, the Board created an ad hoc joint committee with the board of other Fidelity funds (the Committee) to review and compare Fidelity's institutional investment advisory business with its business of providing services to the Fidelity funds, including the differences in services provided, fees charged, and costs incurred, as well as competition in their respective marketplaces.
Based on its review of total expenses and fees charged to other Fidelity clients, the Board concluded that the total expenses of each class of the fund were reasonable in light of the services that the fund and its shareholders receive and the other factors considered, including the findings of the Committee.
Costs of the Services and Profitability. The Board considered the revenues earned and the expenses incurred by Fidelity in conducting the business of developing, marketing, distributing, managing, administering and servicing the fund and its shareholders. The Board also considered the level of Fidelity's profits in respect of all the Fidelity funds.
On an annual basis, FMR presents to the Board Fidelity's profitability for the fund. Fidelity calculates the profitability for each fund, as well as aggregate profitability for groups of Fidelity funds and all Fidelity funds, using a series of detailed revenue and cost allocation methodologies which originate with the audited books and records of Fidelity. The Audit Committee of the Board reviews any significant changes from the prior year's methodologies.
PricewaterhouseCoopers LLP (PwC), independent registered public accounting firm and auditor to Fidelity and certain Fidelity funds, has been engaged annually by the Board as part of the Board's assessment of Fidelity's profitability analysis. PwC's engagement includes the review and assessment of Fidelity's methodologies used in determining the revenues and expenses attributable to Fidelity's mutual fund business, and completion of agreed-upon procedures surrounding the mathematical accuracy of fund profitability and its conformity to allocation methodologies. After considering PwC's reports issued under the engagement and information provided by Fidelity, the Board believes that while other allocation methods may also be reasonable, Fidelity's profitability methodologies are reasonable in all material respects.
The Board has also reviewed Fidelity's non-fund businesses and fall-out benefits related to the mutual fund business as well as cases where Fidelity's affiliates may benefit from or be related to the fund's business.
The Board considered the costs of the services provided by and the profits realized by Fidelity in connection with the operation of the fund and were satisfied that the profitability was not excessive in the circumstances.
Economies of Scale. The Board considered whether there have been economies of scale in respect of the management of the Fidelity funds, whether the Fidelity funds (including the fund) have appropriately benefited from any such economies of scale, and whether there is potential for realization of any further economies of scale. The Board considered the extent to which the fund will benefit from economies of scale through increased services to the fund, through waivers or reimbursements, or through fee or expense reductions.
In February 2009, the Board and the board of other Fidelity funds created an ad hoc committee (the Economies of Scale Committee) to analyze whether FMR attains economies of scale in respect of the management and servicing of the Fidelity funds, whether the Fidelity funds have appropriately benefited from such economies of scale, and whether there is potential for realization of any further economies of scale.
The Board recognized that the fund's management contract incorporates a "group fee" structure, which provides for lower group fee rates as total fund assets under FMR's management increase, and for higher group fee rates as total fund assets under FMR's management decrease. FMR calculates the group fee rates based on a tiered asset "breakpoint" schedule that varies based on asset class. The Board considered that the group fee is designed to deliver the benefits of economies of scale to fund shareholders when total Fidelity fund assets increase, even if assets of any particular fund are unchanged or have declined, because some portion of Fidelity's costs are attributable to services provided to all Fidelity funds, and all funds benefit if those costs can be allocated among more assets. The Board concluded that, given the group fee structure, fund shareholders will benefit from lower management fees as assets under FMR's management increase at the fund complex level, regardless of whether Fidelity achieves any such economies of scale.
The Board concluded, considering the findings of the Economies of Scale Committee, that any potential economies of scale are being appropriately shared between fund shareholders and Fidelity.
Additional Information Requested by the Board. In order to develop fully the factual basis for consideration of the Fidelity funds' Advisory Contracts, the Board requested and received additional information on certain topics, including (i) fund performance trends, actions to be taken by FMR to improve certain funds' overall performance, and Fidelity's long-term strategies for certain funds; (ii) portfolio manager changes that have occurred during the past year and length of portfolio manager tenure for different categories of funds over time; (iii) Fidelity's compensation structure for portfolio managers, research analysts, and other key personnel, the rationale for the compensation structure, and how the compensation structure provides appropriate performance incentives; (iv) the amount of the investment that each portfolio manager has made in the Fidelity fund(s) that he or she manages; (v) management and other fees paid by FMR to affiliated sub-advisers on behalf of the Fidelity funds; (vi) Fidelity's fee structures and rationale for recommending different fees among different categories of funds; (vii) Fidelity's rationale for recommending which funds should have a performance adjustment component as part of their management fees; (viii) the rationale for any differences between fund fee structures and fee structures in place for other Fidelity clients; and (ix) explanations regarding the relative total expenses borne by certain funds and classes, total expense competitive trends, and actions that might be taken by FMR to reduce total expenses for certain funds and classes.
Annual Report
Board Approval of Investment Advisory Contracts and Management Fees - continued
Based on its evaluation of all of the conclusions noted above, and after considering all factors it believed relevant, the Board ultimately concluded that the advisory fee structures are fair and reasonable, and that the fund's Advisory Contracts should be renewed.
Annual Report
Managing Your Investments
Fidelity offers several ways to conveniently manage your workplace benefits (including your workplace savings plan, investments, and additional services) via your telephone or PC. You can access your plan and account information and research your investments 24 hours a day.
By Phone
Fidelity provides a single toll-free number to access plan information, account balances, positions, and quotes*. It's easy to navigate the service, and on your first call, the system will help you create a personal identification number (PIN) for security.
(phone_graphic)
Fidelity Workplace Investing
1-800-835-5092
By PC
Fidelity's web site on the Internet provides a wide range of information, including plan information, daily financial news, fund performance, interactive planning tools, and news about Fidelity products and services.
(computer_graphic)
Fidelity's Web Site
www.401k.com
* When you call the quotes line, please remember that a fund's yield and return will vary and, except for money market funds, share price will also vary. This means that you may have a gain or loss when you sell your shares. There is no assurance that money market funds will be able to maintain a stable $1 share price; an investment in a money market fund is not insured or guaranteed by the U.S. government. Total returns are historical and include changes in share price, reinvestment of dividends and capital gains, and the effects of any sales charges.
Annual Report
Investment Adviser
Fidelity Management & Research Company
Boston, MA
Investment Sub-Advisers
FMR Co., Inc.
Fidelity Management & Research (U.K.) Inc.
Fidelity Management & Research
(Hong Kong) Limited
Fidelity Management & Research
(Japan) Inc.
Fidelity Research & Analysis Company
FIL Investment Advisors
FIL Investment Advisors (U.K.) Ltd.
FIL Investments (Japan) Limited
General Distributor
Fidelity Distributors Corporation
Boston, MA
Transfer and Service Agents
Fidelity Investments Institutional
Operations Company, Inc.
Boston, MA
Fidelity Service Company, Inc.
Boston, MA
Custodian
JPMorgan Chase Bank
New York, NY
OVE-F-ANN-1210
1.891736.101
Fidelity®
Overseas
Fund -
Class K
Annual Report
October 31, 2010
(2_fidelity_logos) (Registered_Trademark)
Contents
Chairman's Message | <Click Here> | The Chairman's message to shareholders. |
Performance | <Click Here> | How the fund has done over time. |
Management's Discussion of Fund Performance | <Click Here> | The Portfolio Manager's review of fund performance and strategy. |
Shareholder Expense Example | <Click Here> | An example of shareholder expenses. |
Investment Changes | <Click Here> | A summary of major shifts in the fund's investments over the past six months. |
Investments | <Click Here> | A complete list of the fund's investments with their market values. |
Financial Statements | <Click Here> | Statements of assets and liabilities, operations, and changes in net assets, as well as financial highlights. |
Notes | <Click Here> | Notes to the financial statements. |
Report of Independent Registered Public Accounting Firm | <Click Here> | |
Trustees and Officers | <Click Here> | |
Distributions | <Click Here> | |
Board Approval of Investment Advisory Contracts and Management Fees | <Click Here> | |
To view a fund's proxy voting guidelines and proxy voting record for the 12-month period ended June 30, visit http://www.fidelity.com/proxyvotingresults or visit the Securities and Exchange Commission's (SEC) web site at http://www.sec.gov. You may also call 1-800-835-5092 to request a free copy of the proxy voting guidelines.
Standard & Poor's, S&P and S&P 500 are registered service marks of The McGraw-Hill Companies, Inc. and have been licensed for use by Fidelity Distributors Corporation.
Other third party marks appearing herein are the property of their respective owners.
All other marks appearing herein are registered or unregistered trademarks or service marks of FMR LLC or an affiliated company.
This report and the financial statements contained herein are submitted for the general information of the shareholders of the fund. This report is not authorized for distribution to prospective investors in the fund unless preceded or accompanied by an effective prospectus.
A fund files its complete schedule of portfolio holdings with the SEC for the first and third quarters of each fiscal year on Form N-Q. Forms N-Q are available on the SEC's web site at http://www.sec.gov. A fund's Forms N-Q may be reviewed and copied at the SEC's Public Reference Room in Washington, DC. Information regarding the operation of the SEC's Public Reference Room may be obtained by calling 1-800-SEC-0330. For a complete list of a fund's portfolio holdings, view the most recent holdings listing, semiannual report, or annual report on Fidelity's web site at http://www.fidelity.com or http://www.advisor.fidelity.com, as applicable.
NOT FDIC INSURED • MAY LOSE VALUE • NO BANK GUARANTEE
Neither the fund nor Fidelity Distributors Corporation is a bank.
Annual Report
(photo_of_Edward_C_Johnson_3d)
Dear Shareholder:
Equities have staged a rally in the second half of 2010, shaking off concerns about the European debt crisis and the possibility of a double-dip recession in the U.S. Although the short-term surge pushed major equity indexes back into positive territory for the year, several questions remain about the longer-term outlook, including lackluster economic growth and persistently high unemployment. Financial markets are always unpredictable, of course, but there also are several time-tested investment principles that can help put the odds in your favor.
One of the basic tenets is to invest for the long term. Over time, riding out the markets' inevitable ups and downs has proven much more effective than selling into panic or chasing the hottest trend. Even missing only a few of the markets' best days can significantly diminish investor returns. Patience also affords the benefits of compounding - of earning interest on additional income or reinvested dividends and capital gains. There can be tax advantages and cost benefits to consider as well. While staying the course doesn't eliminate risk, it can considerably lessen the effect of short-term declines.
You can further manage your investing risk through diversification. And today, more than ever, geographic diversification should be taken into account. Studies indicate that asset allocation is the single most important determinant of a portfolio's long-term success. The right mix of stocks, bonds and cash - aligned to your particular risk tolerance and investment objective - is very important. Age-appropriate rebalancing is also an essential aspect of asset allocation. For younger investors, an emphasis on equities - which historically have been the best-performing asset class over time - is encouraged. As investors near their specific goal, such as retirement or sending a child to college, consideration may be given to replacing volatile assets (e.g. common stocks) with more-stable fixed investments (bonds or savings plans).
A third principle - investing regularly - can help lower the average cost of your purchases. Investing a certain amount of money each month or quarter helps ensure you won't pay for all your shares at market highs. This strategy - known as dollar cost averaging - also reduces "emotion" from investing, helping shareholders avoid selling weak performers just prior to an upswing, or chasing a hot performer just before a correction.
We invite you to contact us via the Internet, through our Investor Centers or by phone. It is our privilege to provide you the information you need to make the investments that are right for you.
Sincerely,
(The chairman's signature appears here.)
Edward C. Johnson 3d
Annual Report
Average annual total return reflects the change in the value of an investment, assuming reinvestment of the class' distributions from dividend income and capital gains (the profits earned upon the sale of securities that have grown in value, if any) and assuming a constant rate of performance each year. The $10,000 table and the fund's returns do not reflect the deduction of taxes that a shareholder would pay on fund distributions or the redemption of fund shares. During periods of reimbursement by Fidelity, a fund's total return will be greater than it would be had the reimbursement not occurred. How a fund did yesterday is no guarantee of how it will do tomorrow.
Average Annual Total Returns
Periods ended October 31, 2010 | Past 1
year | Past 5
years | Past 10
years |
Class K A | 6.55% | 2.17% | 1.85% |
A The initial offering of Class K shares took place on May 9, 2008. Returns prior to May 9, 2008 are those of Fidelity Overseas Fund, the original class of the fund.
$10,000 Over 10 Years
Let's say hypothetically that $10,000 was invested in Fidelity® Overseas Fund - Class K on October 31, 2000. The chart shows how the value of your investment would have changed, and also shows how the MSCI® EAFE® (Europe, Australasia, Far East) Index performed over the same period. The initial offering of Class K took place on May 9, 2008. See above for additional information regarding the performance of Class K.
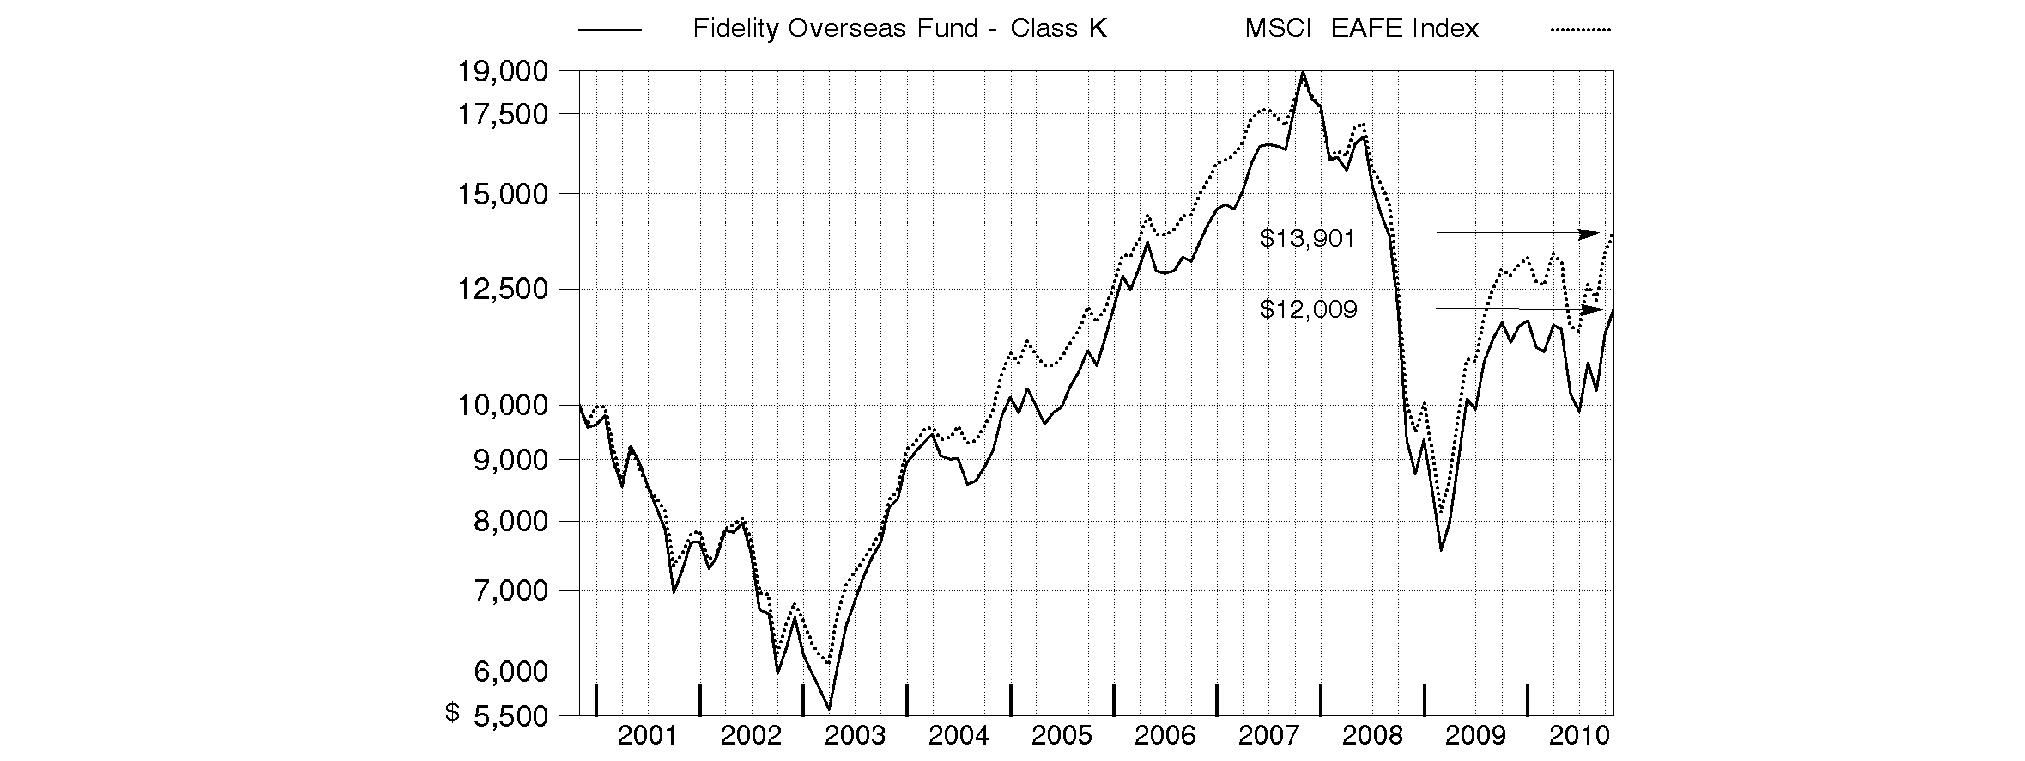
Annual Report
Market Recap: International stocks rode a wave of volatility similar to that of their U.S. counterparts during the 12 months ending October 31, 2010. Stocks gained modestly in the first half of the period, despite growing concerns about the European debt crisis. Sentiment turned decidedly negative in May and June, however, and the market suffered a precipitous decline. These losses were more than offset during the last four months of the period, when signs of economic growth and subsiding debt fears helped propel international stocks about 21%. For the full year, the MSCI® ACWI® (All Country World Index) ex USA Index gained 12.76%, boosted in part by a generally depreciating U.S. dollar. Within the index, Canada and emerging markets were standouts, returning 23% and 24%, respectively. Results in the latter group were led by strong-performing India, Mexico and South Africa, while China fell short of the MSCI benchmark due to cooling economic growth. The developed Asia ex Japan segment rose 16% for the period, lifted by solid results from Singapore and Hong Kong. Meanwhile, Europe rose just 9%, held back mainly by debt-riddled Spain and Italy, as well as lagging major constituent France. Japan returned only 5%, a result of that nation's continued weak economy.
Comments from Ian Hart, Portfolio Manager of Fidelity® Overseas Fund: For the year, the fund's Class K shares rose 6.55%, underperforming the 8.49% gain of the MSCI EAFE® (Europe, Australasia, Far East) Index. The fund's relative performance was hurt by unfavorable positioning within industrials, specifically the capital goods group, consumer staples and financials. On a geographic basis, performance was stymied by an underweighting in Australia and stock picking in several countries, including Japan, the U.K. and Switzerland, but helped by investments in Italy and Germany. On an individual security basis, the fund's largest detractor was an out-of-index stake in U.S.-based Scientific Games, a provider of technology systems to the gaming industry, whose stock disappointed when new online gaming opportunities failed to materialize. I also missed with Hellenic Telecommunications Organization (OTE), the Greek firm whose stock struggled amid the country's economic crisis. I cut back on Scientific Games and sold OTE by period end. Within financials, the fund's investment in Italian banking group Intesa Sanpaolo detracted. Conversely, German automaker Volkswagen was the fund's top individual contributor. Underweighting energy giant BP helped, as the stock dropped after its oil-well blowout in the Gulf of Mexico. An out-of-index stake in luxury goods maker Bulgari was a solid contributor, as demand for its products surged within emerging markets.
The views expressed above reflect those of the portfolio manager(s) only through the end of the period as stated on the cover of this report and do not necessarily represent the views of Fidelity or any other person in the Fidelity organization. Any such views are subject to change at any time based upon market or other conditions and Fidelity disclaims any responsibility to update such views. These views may not be relied on as investment advice and, because investment decisions for a Fidelity fund are based on numerous factors, may not be relied on as an indication of trading intent on behalf of any Fidelity fund.
Annual Report
Fidelity Overseas Fund
As a shareholder of the Fund, you incur two types of costs: (1) transaction costs, including redemption fees, and (2) ongoing costs, including management fees and other Fund expenses. This Example is intended to help you understand your ongoing costs (in dollars) of investing in the Fund and to compare these costs with the ongoing costs of investing in other mutual funds.
The Example is based on an investment of $1,000 invested at the beginning of the period and held for the entire period (May 1, 2010 to October 31, 2010).
Actual Expenses
The first line of the accompanying table for each class of the Fund provides information about actual account values and actual expenses. You may use the information in this line, together with the amount you invested, to estimate the expenses that you paid over the period. Simply divide your account value by $1,000.00 (for example, an $8,600 account value divided by $1,000.00 = 8.6), then multiply the result by the number in the first line for a class of the Fund under the heading entitled "Expenses Paid During Period" to estimate the expenses you paid on your account during this period. A small balance maintenance fee of $12.00 that is charged once a year may apply for certain accounts with a value of less than $2,000. This fee is not included in the table below. If it was, the estimate of expenses you paid during the period would be higher, and your ending account value lower, by this amount. In addition, the Fund, as a shareholder in the underlying Fidelity Central Funds, will indirectly bear its pro-rata share of the fees and expenses incurred by the underlying Fidelity Central Funds. These fees and expenses are not included in the Fund's annualized expense ratio used to calculate the expense estimate in the table below.
Hypothetical Example for Comparison Purposes
The second line of the accompanying table for each class of the Fund provides information about hypothetical account values and hypothetical expenses based on a Class' actual expense ratio and an assumed rate of return of 5% per year before expenses, which is not the Class' actual return. The hypothetical account values and expenses may not be used to estimate the actual ending account balance or expenses you paid for the period. You may use this information to compare the ongoing costs of investing in the Fund and other funds. To do so, compare this 5% hypothetical example with the 5% hypothetical examples that appear in the shareholder reports of the other funds. A small balance maintenance fee of $12.00 that is charged once a year may apply for certain accounts with a value of less than $2,000. This fee is not included in the table below. If it was, the estimate of expenses you paid during the period would be higher, and your ending account value lower, by this amount. In addition, the Fund, as a shareholder in the underlying Fidelity Central Funds, will indirectly bear its pro-rata share of the fees and expenses incurred by the underlying Fidelity Central Funds. These fees and expenses are not included in the Fund's annualized expense ratio used to calculate the expense estimate in the table below.
Please note that the expenses shown in the table are meant to highlight your ongoing costs only and do not reflect any transaction costs. Therefore, the second line of the table is useful in comparing ongoing costs only, and will not help you determine the relative total costs of owning different funds. In addition, if these transactional costs were included, your costs would have been higher.
| Annualized
Expense Ratio | Beginning
Account Value
May 1, 2010 | Ending
Account Value
October 31, 2010 | Expenses Paid
During Period*
May 1, 2010
to October 31, 2010 |
Overseas | .83% | | | |
Actual | | $ 1,000.00 | $ 1,037.80 | $ 4.26 |
HypotheticalA | | $ 1,000.00 | $ 1,021.02 | $ 4.23 |
Class K | .64% | | | |
Actual | | $ 1,000.00 | $ 1,038.80 | $ 3.29 |
HypotheticalA | | $ 1,000.00 | $ 1,021.98 | $ 3.26 |
Class F | .62% | | | |
Actual | | $ 1,000.00 | $ 1,038.80 | $ 3.19 |
HypotheticalA | | $ 1,000.00 | $ 1,022.08 | $ 3.16 |
A 5% return per year before expenses
* Expenses are equal to each Class' annualized expense ratio, multiplied by the average account value over the period, multiplied by 184/365 (to reflect the one-half year period).
Annual Report
Fidelity Overseas Fund
Investment Changes (Unaudited)
Geographic Diversification (% of fund's net assets) |
As of October 31, 2010 |
| Japan | 18.1% | |
| France | 18.1% | |
| Germany | 16.1% | |
| United Kingdom | 12.7% | |
| United States of America | 5.5% | |
| Italy | 4.8% | |
| Switzerland | 3.7% | |
| Australia | 2.6% | |
| Bailiwick of Jersey | 2.5% | |
| Other | 15.9% | |

Percentages are adjusted for the effect of futures contracts, if applicable. |
As of April 30, 2010 |
| United Kingdom | 23.1% | |
| Japan | 21.6% | |
| Germany | 13.3% | |
| France | 12.0% | |
| United States of America | 7.0% | |
| Italy | 3.9% | |
| Switzerland | 3.1% | |
| Australia | 2.6% | |
| Spain | 2.5% | |
| Other | 10.9% | |

Percentages are adjusted for the effect of futures contracts, if applicable. |
Asset Allocation |
| % of fund's
net assets | % of fund's net assets
6 months ago |
Stocks | 98.6 | 97.3 |
Short-Term Investments and Net Other Assets | 1.4 | 2.7 |
Top Ten Stocks as of October 31, 2010 |
| % of fund's
net assets | % of fund's net assets
6 months ago |
Pernod-Ricard SA (France, Beverages) | 5.3 | 1.0 |
SAP AG (Germany, Software) | 5.1 | 3.4 |
Volkswagen AG (Germany, Automobiles) | 3.5 | 0.7 |
Mazda Motor Corp. (Japan, Automobiles) | 3.4 | 2.3 |
Japan Tobacco, Inc. (Japan, Tobacco) | 3.2 | 0.5 |
Bulgari SpA (Italy, Textiles, Apparel & Luxury Goods) | 3.1 | 1.2 |
Siemens AG (Germany, Industrial Conglomerates) | 1.8 | 1.8 |
Royal Dutch Shell PLC Class B ADR (United Kingdom, Oil, Gas & Consumable Fuels) | 1.6 | 2.4 |
Fluor Corp. (United States of America, Construction & Engineering) | 1.5 | 0.9 |
Ricoh Co. Ltd. (Japan, Office Electronics) | 1.5 | 2.5 |
| 30.0 | |
Market Sectors as of October 31, 2010 |
| % of fund's
net assets | % of fund's net assets
6 months ago |
Consumer Discretionary | 22.1 | 15.4 |
Financials | 17.4 | 23.0 |
Consumer Staples | 12.4 | 8.1 |
Information Technology | 11.2 | 12.6 |
Industrials | 11.1 | 10.1 |
Energy | 8.3 | 6.7 |
Materials | 7.8 | 8.9 |
Telecommunication Services | 4.5 | 3.5 |
Health Care | 2.6 | 5.9 |
Utilities | 1.2 | 3.1 |
Annual Report
Fidelity Overseas Fund
Investments October 31, 2010
Showing Percentage of Net Assets
Common Stocks - 94.6% |
| Shares | | Value |
Australia - 2.6% |
Australia & New Zealand Banking Group Ltd. | 2,742,327 | | $ 66,652,578 |
Macquarie Group Ltd. | 862,470 | | 30,586,058 |
Newcrest Mining Ltd. | 1,898,098 | | 74,304,490 |
TOTAL AUSTRALIA | | 171,543,126 |
Austria - 0.9% |
Erste Bank AG | 563,100 | | 25,409,732 |
Wienerberger AG (a) | 1,786,918 | | 30,085,525 |
TOTAL AUSTRIA | | 55,495,257 |
Bailiwick of Jersey - 2.5% |
Charter International PLC | 1,557,500 | | 18,415,673 |
Heritage Oil PLC | 2,780,200 | | 15,345,055 |
United Business Media Ltd. | 5,000,000 | | 52,710,735 |
WPP PLC | 6,514,338 | | 75,693,005 |
TOTAL BAILIWICK OF JERSEY | | 162,164,468 |
Belgium - 1.5% |
Ageas | 8,054,178 | | 24,756,232 |
Anheuser-Busch InBev SA NV | 780,339 | | 48,899,125 |
Anheuser-Busch InBev SA NV (strip VVPR) (a) | 6,312,640 | | 26,351 |
KBC Groupe SA (a) | 486,408 | | 21,153,772 |
TOTAL BELGIUM | | 94,835,480 |
Bermuda - 0.5% |
GOME Electrical Appliances Holdings Ltd. (a) | 93,574,000 | | 31,508,226 |
Brazil - 1.8% |
Banco do Brasil SA | 1,437,500 | | 27,969,228 |
BM&F Bovespa SA | 3,905,100 | | 32,710,836 |
Centrais Eletricas Brasileiras SA (Electrobras) sponsored ADR (d) | 3,938,600 | | 55,022,242 |
TOTAL BRAZIL | | 115,702,306 |
Canada - 1.5% |
Harry Winston Diamond Corp. (a) | 2,390,974 | | 30,546,516 |
Niko Resources Ltd. | 341,600 | | 32,589,156 |
Talisman Energy, Inc. | 1,931,800 | | 35,022,043 |
TOTAL CANADA | | 98,157,715 |
Cayman Islands - 0.3% |
3SBio, Inc. sponsored ADR (a) | 37,000 | | 556,850 |
China Shanshui Cement Group Ltd. | 3,219,000 | | 2,292,389 |
PCD Stores Group Ltd. | 4,666,000 | | 1,504,919 |
Peak Sport Products Co. Ltd. | 16,175,000 | | 12,896,178 |
TOTAL CAYMAN ISLANDS | | 17,250,336 |
|
| Shares | | Value |
China - 0.5% |
China Merchants Bank Co. Ltd. (H Shares) | 12,276,500 | | $ 34,843,799 |
Minth Group Ltd. | 72,000 | | 134,688 |
TOTAL CHINA | | 34,978,487 |
Denmark - 0.5% |
Carlsberg AS Series B | 284,700 | | 31,131,011 |
France - 18.1% |
Accor SA | 806,023 | | 33,046,197 |
Alstom SA | 1,556,065 | | 78,509,668 |
Atos Origin SA (a) | 803,297 | | 37,137,165 |
AXA SA | 1,253,837 | | 22,820,042 |
BNP Paribas SA | 617,426 | | 45,146,620 |
Carrefour SA | 1,432,468 | | 77,296,591 |
Christian Dior SA | 281,800 | | 40,759,898 |
Compagnie de St. Gobain | 1,180,629 | | 55,131,906 |
Compagnie Generale de Geophysique SA (a) | 2,168,200 | | 50,633,571 |
L'Oreal SA | 198,100 | | 23,253,517 |
LVMH Moet Hennessy - Louis Vuitton | 508,209 | | 79,624,799 |
Pernod-Ricard SA | 3,860,967 | | 342,271,944 |
PPR SA | 446,469 | | 73,181,989 |
Renault SA (a) | 725,300 | | 40,293,056 |
Safran SA | 1,265,056 | | 40,098,772 |
Sanofi-Aventis | 619,478 | | 43,390,713 |
Schneider Electric SA | 234,583 | | 33,293,873 |
Societe Generale Series A | 1,097,908 | | 65,728,608 |
TOTAL FRANCE | | 1,181,618,929 |
Germany - 12.1% |
Deutsche Boerse AG | 1,176,192 | | 82,747,121 |
Fresenius Medical Care AG & Co. KGaA (d) | 954,400 | | 60,782,555 |
HeidelbergCement AG | 1,413,029 | | 73,898,094 |
Linde AG | 341,697 | | 49,185,747 |
Munich Re Group | 129,625 | | 20,264,200 |
Puma AG | 144,300 | | 47,967,832 |
SAP AG | 6,381,161 | | 332,698,622 |
Siemens AG | 1,040,567 | | 118,843,382 |
TOTAL GERMANY | | 786,387,553 |
Hong Kong - 1.4% |
China Unicom (Hong Kong) Ltd. sponsored ADR (d) | 5,330,700 | | 74,629,800 |
Henderson Land Development Co. Ltd. | 2,758,000 | | 19,587,538 |
TOTAL HONG KONG | | 94,217,338 |
India - 0.3% |
Bharti Airtel Ltd. | 2,628,490 | | 19,311,174 |
Indonesia - 0.2% |
PT Indosat Tbk sponsored ADR (d) | 425,600 | | 14,019,264 |
Common Stocks - continued |
| Shares | | Value |
Israel - 0.4% |
Teva Pharmaceutical Industries Ltd. sponsored ADR | 454,800 | | $ 23,604,120 |
Italy - 4.8% |
Bulgari SpA (d)(e) | 18,976,214 | | 203,182,267 |
Intesa Sanpaolo SpA | 17,104,673 | | 60,155,252 |
Saipem SpA | 1,039,967 | | 46,204,693 |
TOTAL ITALY | | 309,542,212 |
Japan - 18.1% |
Denso Corp. | 1,410,300 | | 43,857,646 |
Hitachi Ltd. (a) | 6,197,000 | | 28,008,276 |
Japan Tobacco, Inc. | 66,332 | | 206,072,575 |
Kenedix, Inc. (a)(d) | 71,644 | | 14,449,883 |
Keyence Corp. | 110,000 | | 27,271,032 |
Mazda Motor Corp. | 87,560,000 | | 222,529,219 |
Mitsubishi Corp. | 3,326,700 | | 79,906,263 |
Mitsubishi UFJ Financial Group, Inc. | 10,993,100 | | 51,019,020 |
Mitsui & Co. Ltd. | 5,632,000 | | 88,576,770 |
Mizuho Financial Group, Inc. | 12,656,900 | | 18,356,540 |
Rakuten, Inc. | 87,129 | | 67,130,581 |
Ricoh Co. Ltd. | 6,888,000 | | 96,353,600 |
SOFTBANK CORP. | 1,562,000 | | 50,163,672 |
Sumitomo Mitsui Financial Group, Inc. | 1,168,700 | | 34,883,060 |
Tokyo Broadcasting System Holding | 1,852,500 | | 22,836,833 |
Tokyo Electron Ltd. | 1,655,700 | | 93,420,153 |
Toshiba Corp. (a) | 4,682,000 | | 23,434,099 |
Toto Ltd. (d) | 2,025,000 | | 13,453,746 |
TOTAL JAPAN | | 1,181,722,968 |
Korea (South) - 0.6% |
Shinhan Financial Group Co. Ltd. | 495,630 | | 19,194,916 |
SK Telecom Co. Ltd. sponsored ADR (d) | 1,152,400 | | 21,238,732 |
TOTAL KOREA (SOUTH) | | 40,433,648 |
Netherlands - 1.4% |
AEGON NV (a) | 4,267,800 | | 27,041,518 |
ING Groep NV (Certificaten Van Aandelen) unit (a) | 3,711,800 | | 39,701,429 |
Koninklijke Philips Electronics NV | 802,100 | | 24,459,768 |
TOTAL NETHERLANDS | | 91,202,715 |
Norway - 1.5% |
Aker Solutions ASA | 4,406,500 | | 67,083,064 |
Sevan Marine ASA (a)(d) | 24,336,552 | | 32,791,814 |
TOTAL NORWAY | | 99,874,878 |
|
| Shares | | Value |
Russia - 0.6% |
Mobile TeleSystems OJSC sponsored ADR | 1,052,500 | | $ 22,786,625 |
OAO Gazprom sponsored ADR | 737,700 | | 16,118,745 |
TOTAL RUSSIA | | 38,905,370 |
Spain - 2.0% |
Banco Bilbao Vizcaya Argentaria SA | 4,148,498 | | 54,640,336 |
Inditex SA (d) | 459,185 | | 38,342,368 |
Indra Sistemas SA (d) | 1,047,400 | | 20,498,398 |
Red Electrica Corporacion SA | 397,300 | | 19,954,149 |
TOTAL SPAIN | | 133,435,251 |
Switzerland - 3.7% |
Julius Baer Group Ltd. | 1,451,350 | | 61,247,604 |
Roche Holding AG (participation certificate) | 267,163 | | 39,218,828 |
The Swatch Group AG (Bearer) | 120,060 | | 45,872,470 |
Transocean Ltd. (a) | 556,300 | | 35,247,168 |
UBS AG (a) | 3,366,813 | | 57,176,452 |
TOTAL SWITZERLAND | | 238,762,522 |
United Kingdom - 12.7% |
Anglo American PLC (United Kingdom) | 1,823,500 | | 84,957,817 |
BAE Systems PLC | 5,367,400 | | 29,642,063 |
Barclays PLC | 9,627,323 | | 42,301,417 |
BG Group PLC | 3,213,318 | | 62,576,583 |
BHP Billiton PLC | 2,041,281 | | 72,303,336 |
BP PLC sponsored ADR | 1,140,200 | | 46,554,366 |
Capita Group PLC | 1,188,700 | | 14,597,806 |
HSBC Holdings PLC sponsored ADR | 1,368,764 | | 71,326,292 |
Imperial Tobacco Group PLC | 2,114,240 | | 67,712,719 |
ITV PLC (a) | 21,426,630 | | 23,429,321 |
Lloyds Banking Group PLC (a) | 31,001,210 | | 34,069,890 |
Micro Focus International PLC | 4,399,600 | | 26,912,392 |
Misys PLC (a) | 6,860,500 | | 30,930,222 |
Rio Tinto PLC | 1,255,810 | | 81,555,009 |
Royal Dutch Shell PLC Class B ADR | 1,635,700 | | 105,208,224 |
Xstrata PLC | 1,872,200 | | 36,279,500 |
TOTAL UNITED KINGDOM | | 830,356,957 |
United States of America - 4.1% |
AsiaInfo Holdings, Inc. (a) | 735,335 | | 16,339,144 |
CME Group, Inc. | 126,200 | | 36,553,830 |
Fluor Corp. | 2,020,100 | | 97,348,619 |
NII Holdings, Inc. (a) | 2,134,400 | | 89,239,264 |
Scientific Games Corp. Class A (a) | 3,345,209 | | 26,427,151 |
Viad Corp. | 98,936 | | 1,974,763 |
TOTAL UNITED STATES OF AMERICA | | 267,882,771 |
TOTAL COMMON STOCKS (Cost $5,942,808,667) | 6,164,044,082 |
Nonconvertible Preferred Stocks - 4.0% |
| Shares | | Value |
Germany - 4.0% |
Porsche Automobil Holding SE | 593,200 | | $ 30,387,401 |
Volkswagen AG | 1,511,968 | | 227,213,411 |
TOTAL NONCONVERTIBLE PREFERRED STOCKS (Cost $188,849,860) | 257,600,812 |
Money Market Funds - 2.7% |
| | | |
Fidelity Cash Central Fund, 0.23% (b) | 46,818,828 | | 46,818,828 |
Fidelity Securities Lending Cash Central Fund, 0.24% (b)(c) | 131,257,696 | | 131,257,696 |
TOTAL MONEY MARKET FUNDS (Cost $178,076,524) | 178,076,524 |
TOTAL INVESTMENT PORTFOLIO - 101.3% (Cost $6,309,735,051) | | 6,599,721,418 |
NET OTHER ASSETS (LIABILITIES) - (1.3)% | | (87,032,730) |
NET ASSETS - 100% | $ 6,512,688,688 |
Legend |
(a) Non-income producing |
(b) Affiliated fund that is available only to investment companies and other accounts managed by Fidelity Investments. The rate quoted is the annualized seven-day yield of the fund at period end. A complete unaudited listing of the fund's holdings as of its most recent quarter end is available upon request. In addition, each Fidelity Central Fund's financial statements, which are not covered by the Fund's report of Independent Registered Public Accounting Firm, are available on the SEC's website or upon request. |
(c) Investment made with cash collateral received from securities on loan. |
(d) Security or a portion of the security is on loan at period end. |
(e) Affiliated company |
Affiliated Central Funds |
Information regarding fiscal year to date income earned by the Fund from investments in Fidelity Central Funds is as follows: |
Fund | Income earned |
Fidelity Cash Central Fund | $ 215,905 |
Fidelity Securities Lending Cash Central Fund | 6,382,864 |
Total | $ 6,598,769 |
Other Affiliated Issuers |
An affiliated company is a company in which the Fund has ownership of at least 5% of the voting securities. Fiscal year to date transactions with companies which are or were affiliates are as follows: |
Affiliate | Value,
beginning of
period | Purchases | Sales
Proceeds | Dividend
Income | Value,
end of
period |
Bulgari SpA | $ 113,852,096 | $ 108,432,769 | $ 67,968,297 | $ 392,681 | $ 203,182,267 |
Harry Winston Diamond Corp. | 35,080,049 | - | 21,459,940 | - | - |
Kenedix, Inc. | 28,504,228 | 13,220,143 | 12,411,387 | - | - |
William Hill PLC | 71,632,544 | 29,169,053 | 94,152,324 | 2,667,780 | - |
Total | $ 249,068,917 | $ 150,821,965 | $ 195,991,948 | $ 3,060,461 | $ 203,182,267 |
Other Information |
The following is a summary of the inputs used, as of October 31, 2010, involving the Fund's assets and liabilities carried at fair value. The inputs or methodology used for valuing securities may not be an indication of the risk associated with investing in those securities. For more information on valuation inputs, and their aggregation into the levels used in the tables below, please refer to the Security Valuation section in the accompanying Notes to Financial Statements. |
Valuation Inputs at Reporting Date: |
Description | Total | Level 1 | Level 2 | Level 3 |
Investments in Securities: | | | | |
Equities: | | | | |
Japan | $ 1,181,722,968 | $ 131,688,329 | $ 1,050,034,639 | $ - |
France | 1,181,618,929 | 1,087,594,645 | 94,024,284 | - |
Germany | 1,043,988,365 | 1,043,988,365 | - | - |
United Kingdom | 830,356,957 | 600,127,305 | 230,229,652 | - |
Italy | 309,542,212 | 309,542,212 | - | - |
United States of America | 267,882,771 | 267,882,771 | - | - |
Switzerland | 238,762,522 | 181,586,070 | 57,176,452 | - |
Australia | 171,543,126 | 171,543,126 | - | - |
Bailiwick of Jersey | 162,164,468 | 86,471,463 | 75,693,005 | - |
Other | 1,034,062,576 | 888,219,525 | 145,843,051 | - |
Money Market Funds | 178,076,524 | 178,076,524 | - | - |
Total Investments in Securities: | $ 6,599,721,418 | $ 4,946,720,335 | $ 1,653,001,083 | $ - |
The following is a reconciliation of Investments in Securities for which Level 3 inputs were used in determining value: |
Investments in Securities: | |
Beginning Balance | $ 35 |
Total Realized Gain (Loss) | - |
Total Unrealized Gain (Loss) | (35) |
Cost of Purchases | - |
Proceeds of Sales | - |
Amortization/Accretion | - |
Transfers in to Level 3 | - |
Transfers out of Level 3 | - |
Ending Balance | $ - |
The change in unrealized gain (loss) for the period attributable to Level 3 securities held at October 31, 2010 | $ - |
The information used in the above reconciliation represents fiscal year to date activity for any Investments in Securities identified as using Level 3 inputs at either the beginning or the end of the current fiscal period. Transfers in or out of Level 3 represent the beginning value of any Security or Instrument where a change in the pricing level occurred from the beginning to the end of the period. The cost of purchases and the proceeds of sales may include securities received or delivered through corporate actions or exchanges. Realized and unrealized gains (losses) disclosed in the reconciliation are included in Net Gain (Loss) on the Fund's Statement of Operations. |
Income Tax Information |
At October 31, 2010, the Fund had a capital loss carryforward of approximately $1,637,677,232 of which $697,957,467 and $939,719,765 will expire on October 31, 2016 and 2017, respectively. Capital loss carryforwards are only available to offset future capital gains of the Fund to the extent provided by regulations and may be limited. |
See accompanying notes which are an integral part of the financial statements.
Annual Report
Fidelity Overseas Fund
Statement of Assets and Liabilities
| October 31, 2010 |
| | |
Assets | | |
Investment in securities, at value (including securities loaned of $126,027,467) - See accompanying schedule: Unaffiliated issuers (cost $5,979,280,612) | $ 6,218,462,627 | |
Fidelity Central Funds (cost $178,076,524) | 178,076,524 | |
Other affiliated issuers (cost $152,377,915) | 203,182,267 | |
Total Investments (cost $6,309,735,051) | | $ 6,599,721,418 |
Receivable for investments sold | | 136,276,399 |
Receivable for fund shares sold | | 7,122,890 |
Dividends receivable | | 15,109,772 |
Distributions receivable from Fidelity Central Funds | | 80,022 |
Other receivables | | 947,969 |
Total assets | | 6,759,258,470 |
| | |
Liabilities | | |
Payable for investments purchased | $ 108,531,107 | |
Payable for fund shares redeemed | 2,267,344 | |
Accrued management fee | 2,739,436 | |
Other affiliated payables | 1,272,757 | |
Other payables and accrued expenses | 501,442 | |
Collateral on securities loaned, at value | 131,257,696 | |
Total liabilities | | 246,569,782 |
| | |
Net Assets | | $ 6,512,688,688 |
Net Assets consist of: | | |
Paid in capital | | $ 7,864,527,445 |
Undistributed net investment income | | 85,893,161 |
Accumulated undistributed net realized gain (loss) on investments and foreign currency transactions | | (1,728,566,184) |
Net unrealized appreciation (depreciation) on investments and assets and liabilities in foreign currencies | | 290,834,266 |
Net Assets | | $ 6,512,688,688 |
Overseas:
Net Asset Value, offering price and redemption price per share ($5,548,689,358 ÷ 175,814,142 shares) | | $ 31.56 |
| | |
Class K:
Net Asset Value, offering price and redemption price per share ($368,004,318 ÷ 11,650,042 shares) | | $ 31.59 |
| | |
Class F:
Net Asset Value, offering price and redemption price per share ($595,995,012 ÷ 18,870,397 shares) | | $ 31.58 |
Statement of Operations
| Year ended October 31, 2010 |
| | |
Investment Income | | |
Dividends (including $3,060,461 earned from other affiliated issuers) | | $ 160,786,466 |
Interest | | 25,831 |
Income from Fidelity Central Funds | | 6,598,769 |
Income before foreign taxes withheld | | 167,411,066 |
Less foreign taxes withheld | | (12,596,890) |
Total income | | 154,814,176 |
| | |
Expenses | | |
Management fee
Basic fee | $ 48,637,860 | |
Performance adjustment | (7,944,328) | |
Transfer agent fees | 15,331,656 | |
Accounting and security lending fees | 1,712,692 | |
Custodian fees and expenses | 1,207,677 | |
Independent trustees' compensation | 39,713 | |
Depreciation in deferred trustee compensation account | (37) | |
Registration fees | 56,697 | |
Audit | 113,545 | |
Legal | 51,751 | |
Interest | 7,829 | |
Miscellaneous | 97,194 | |
Total expenses before reductions | 59,312,249 | |
Expense reductions | (2,662,088) | 56,650,161 |
Net investment income (loss) | | 98,164,015 |
Realized and Unrealized Gain (Loss) Net realized gain (loss) on: | | |
Investment securities: | | |
Unaffiliated issuers | 160,999,122 | |
Other affiliated issuers | 21,634,517 | |
Foreign currency transactions | (2,096,186) | |
Capital gain distributions from Fidelity Central Funds | 17,805 | |
Total net realized gain (loss) | | 180,555,258 |
Change in net unrealized appreciation (depreciation) on: Investment securities | 94,183,082 | |
Assets and liabilities in foreign currencies | 666,146 | |
Total change in net unrealized appreciation (depreciation) | | 94,849,228 |
Net gain (loss) | | 275,404,486 |
Net increase (decrease) in net assets resulting from operations | | $ 373,568,501 |
See accompanying notes which are an integral part of the financial statements.
Annual Report
Fidelity Overseas Fund
Financial Statements - continued
Statement of Changes in Net Assets
| Year ended
October 31,
2010 | Year ended
October 31,
2009 |
Increase (Decrease) in Net Assets | | |
Operations | | |
Net investment income (loss) | $ 98,164,015 | $ 119,329,980 |
Net realized gain (loss) | 180,555,258 | (1,003,646,089) |
Change in net unrealized appreciation (depreciation) | 94,849,228 | 2,100,809,355 |
Net increase (decrease) in net assets resulting from operations | 373,568,501 | 1,216,493,246 |
Distributions to shareholders from net investment income | (108,455,793) | (81,537,156) |
Distributions to shareholders from net realized gain | (2,308,848) | - |
Total distributions | (110,764,641) | (81,537,156) |
Share transactions - net increase (decrease) | (771,649,789) | 377,264,123 |
Redemption fees | 54,523 | 81,713 |
Total increase (decrease) in net assets | (508,791,406) | 1,512,301,926 |
| | |
Net Assets | | |
Beginning of period | 7,021,480,094 | 5,509,178,168 |
End of period (including undistributed net investment income of $85,893,161 and undistributed net investment income of $98,105,298, respectively) | $ 6,512,688,688 | $ 7,021,480,094 |
Financial Highlights - Overseas
Years ended October 31, | 2010 | 2009 | 2008 | 2007 | 2006 |
Selected Per-Share Data | | | | | |
Net asset value, beginning of period | $ 30.13 | $ 25.43 | $ 58.39 | $ 47.08 | $ 37.65 |
Income from Investment Operations | | | | | |
Net investment income (loss)B | .42 | .52 | .55 | .70 | .63 |
Net realized and unrealized gain (loss) | 1.49 | 4.55 | (27.19) | 15.80 | 9.37 |
Total from investment operations | 1.91 | 5.07 | (26.64) | 16.50 | 10.00 |
Distributions from net investment income | (.47) | (.37) | (.57) | (.55) | (.41) |
Distributions from net realized gain | (.01) | - | (5.75) | (4.64) | (.16) |
Total distributions | (.48) | (.37) | (6.32) | (5.19) | (.57) |
Redemption fees added to paid in capitalB,F | - | - | - | - | - |
Net asset value, end of period | $ 31.56 | $ 30.13 | $ 25.43 | $ 58.39 | $ 47.08 |
Total ReturnA | 6.33% | 20.44% | (50.88)% | 38.79% | 26.83% |
Ratios to Average Net AssetsC,E | | | | | |
Expenses before reductions | .89% | 1.02% | 1.13% | .95% | 1.00% |
Expenses net of fee waivers, if any | .89% | 1.02% | 1.13% | .95% | 1.00% |
Expenses net of all reductions | .85% | .98% | 1.10% | .91% | .90% |
Net investment income (loss) | 1.41% | 2.01% | 1.33% | 1.43% | 1.43% |
Supplemental Data | | | | | |
Net assets, end of period (000 omitted) | $ 5,548,689 | $ 6,602,017 | $ 5,464,901 | $ 9,543,353 | $ 7,217,287 |
Portfolio turnover rateD | 111% | 115% | 113% | 87% | 132% |
A Total returns would have been lower had certain expenses not been reduced during the periods shown.
B Calculated based on average shares outstanding during the period.
C Fees and expenses of the underlying Fidelity Central Funds are not included in the Fund's expense ratio. The Fund indirectly bears its proportionate share of the expenses of any underlying Fidelity Central Funds.
D Amount does not include the portfolio activity of any underlying Fidelity Central Funds.
E Expense ratios reflect operating expenses of the class. Expenses before reductions do not reflect amounts reimbursed by the investment adviser or reductions from brokerage service arrangements or reductions from other expense offset arrangements and do not represent the amount paid by the class during periods when reimbursements or reductions occur. Expenses net of fee waivers reflect expenses after reimbursement by the investment adviser but prior to reductions from brokerage service arrangements or other expense offset arrangements. Expenses net of all reductions represent the net expenses paid by the class.
F Amount represents less than $.01 per share.
See accompanying notes which are an integral part of the financial statements.
Annual Report
Financial Highlights - Class K
Years ended October 31, | 2010 | 2009 | 2008G |
Selected Per-Share Data | | | |
Net asset value, beginning of period | $ 30.16 | $ 25.45 | $ 45.00 |
Income from Investment Operations | | | |
Net investment income (loss)D | .47 | .59 | .13 |
Net realized and unrealized gain (loss) | 1.50 | 4.54 | (19.68) |
Total from investment operations | 1.97 | 5.13 | (19.55) |
Distributions from net investment income | (.53) | (.42) | - |
Distributions from net realized gain | (.01) | - | - |
Total distributions | (.54) | (.42) | - |
Redemption fees added to paid in capitalD,I | - | - | - |
Net asset value, end of period | $ 31.59 | $ 30.16 | $ 25.45 |
Total ReturnB,C | 6.55% | 20.73% | (43.44)% |
Ratios to Average Net AssetsE,H | | | |
Expenses before reductions | .69% | .78% | .96%A |
Expenses net of fee waivers, if any | .69% | .78% | .96%A |
Expenses net of all reductions | .66% | .74% | .93%A |
Net investment income (loss) | 1.60% | 2.25% | 1.08%A |
Supplemental Data | | | |
Net assets, end of period (000 omitted) | $ 368,004 | $ 383,048 | $ 44,277 |
Portfolio turnover rateF | 111% | 115% | 113% |
A Annualized
B Total returns for periods of less than one year are not annualized.
C Total returns would have been lower had certain expenses not been reduced during the periods shown.
D Calculated based on average shares outstanding during the period.
E Fees and expenses of the underlying Fidelity Central Funds are not included in the Fund's expense ratio. The Fund indirectly bears its proportionate share of the expenses of any underlying Fidelity Central Funds.
F Amount does not include the portfolio activity of any underlying Fidelity Central Funds.
G For the period May 9, 2008 (commencement of sale of shares) to October 31, 2008.
H Expense ratios reflect operating expenses of the class. Expenses before reductions do not reflect amounts reimbursed by the investment adviser or reductions from brokerage service arrangements or reductions from other expense offset arrangements and do not represent the amount paid by the class during periods when reimbursements or reductions occur. Expense ratios before reductions for start-up periods may not be representative of longer-term operating periods. Expenses net of fee waivers reflect expenses after reimbursement by the investment adviser but prior to reductions from brokerage service arrangements or other expense offset arrangements. Expenses net of all reductions represent the net expenses paid by the class.
I Amount represents less than $.01 per share.
Financial Highlights - Class F
Years ended October 31, | 2010 | 2009G |
Selected Per-Share Data | | |
Net asset value, beginning of period | $ 30.15 | $ 26.62 |
Income from Investment Operations | | |
Net investment income (loss)D | .48 | .07 |
Net realized and unrealized gain (loss) | 1.51 | 3.46 |
Total from investment operations | 1.99 | 3.53 |
Distributions from net investment income | (.55) | - |
Distributions from net realized gain | (.01) | - |
Total distributions | (.56) | - |
Redemption fees added to paid in capitalD,I | - | - |
Net asset value, end of period | $ 31.58 | $ 30.15 |
Total ReturnB,C | 6.60% | 13.26% |
Ratios to Average Net AssetsE,H | | |
Expenses before reductions | .64% | .68%A |
Expenses net of fee waivers, if any | .64% | .68%A |
Expenses net of all reductions | .60% | .64%A |
Net investment income (loss) | 1.66% | .70%A |
Supplemental Data | | |
Net assets, end of period (000 omitted) | $ 595,995 | $ 36,415 |
Portfolio turnover rateF | 111% | 115% |
A Annualized
B Total returns for periods of less than one year are not annualized.
C Total returns would have been lower had certain expenses not been reduced during the periods shown.
D Calculated based on average shares outstanding during the period.
E Fees and expenses of the underlying Fidelity Central Funds are not included in the Fund's expense ratio. The Fund indirectly bears its proportionate share of the expenses of any underlying Fidelity Central Funds.
F Amount does not include the portfolio activity of any underlying Fidelity Central Funds.
G For the period June 26, 2009 (commencement of sale of shares) to October 31, 2009.
H Expense ratios reflect operating expenses of the class. Expenses before reductions do not reflect amounts reimbursed by the investment adviser or reductions from brokerage service arrangements or reductions from other expense offset arrangements and do not represent the amount paid by the class during periods when reimbursements or reductions occur. Expense ratios before reductions for start-up periods may not be representative of longer-term operating periods. Expenses net of fee waivers reflect expenses after reimbursement by the investment adviser but prior to reductions from brokerage service arrangements or other expense offset arrangements. Expenses net of all reductions represent the net expenses paid by the class.
I Amount represents less than $.01 per share.
See accompanying notes which are an integral part of the financial statements.
Annual Report
Notes to Financial Statements
For the period ended October 31, 2010
1. Organization.
Fidelity Overseas Fund (the Fund) is a fund of Fidelity Investment Trust (the Trust) and is authorized to issue an unlimited number of shares. The Trust is registered under the Investment Company Act of 1940, as amended (the 1940 Act), as an open-end management investment company organized as a Massachusetts business trust. The Fund offers Overseas, Class K, and Class F shares each of which has equal rights as to assets and voting privileges. Each class has exclusive voting rights with respect to matters that affect that class. Class F shares of the Fund are only available for purchase by mutual funds for which Fidelity Management & Research Company (FMR) or an affiliate serves as investment manager. Investment income, realized and unrealized capital gains and losses, the common expenses of the Fund, and certain fund-level expense reductions, if any, are allocated on a pro-rata basis to each class based on the relative net assets of each class to the total net assets of the Fund. Each class differs with respect to transfer agent fees incurred. Certain expense reductions also differ by class. The Fund's investments in emerging markets can be subject to social, economic, regulatory, and political uncertainties and can be extremely volatile.
2. Investments in Fidelity Central Funds.
The Fund may invest in Fidelity Central Funds, which are open-end investment companies available only to other investment companies and accounts managed by FMR and its affiliates. The Fund's Schedule of Investments lists each of the Fidelity Central Funds held as of period end, if any, as an investment of the Fund, but does not include the underlying holdings of each Fidelity Central Fund. As an Investing Fund, the Fund indirectly bears its proportionate share of the expenses of the underlying Fidelity Central Funds.
The Money Market Central Funds seek preservation of capital and current income and are managed by Fidelity Investments Money Management, Inc. (FIMM), an affiliate of FMR.
A complete unaudited list of holdings for each Fidelity Central Fund is available upon request or at the Securities and Exchange Commission (the SEC) web site at www.sec.gov. In addition, the financial statements of the Fidelity Central Funds, which are not covered by the Fund's Report of Independent Registered Public Accounting Firm, are available on the SEC web site or upon request.
3. Significant Accounting Policies.
The financial statements have been prepared in conformity with accounting principles generally accepted in the United States of America (GAAP), which require management to make certain estimates and assumptions at the date of the financial statements. Actual results could differ from those estimates. The following summarizes the significant accounting policies of the Fund:
Security Valuation. Investments are valued as of 4:00 p.m. Eastern time on the last calendar day of the period. The Fund uses independent pricing services approved by the Board of Trustees to value its investments. When current market prices or quotations are not readily available or reliable, valuations may be determined in good faith in accordance with procedures adopted by the Board of Trustees. Factors used in determining value may include market or security specific events. The frequency with which these procedures are used cannot be predicted and they may be utilized to a significant extent. The value used for net asset value (NAV) calculation under these procedures may differ from published prices for the same securities.
The Fund categorizes the inputs to valuation techniques used to value its investments into a disclosure hierarchy consisting of three levels as shown below.
Level 1 - quoted prices in active markets for identical investments
Level 2 - other significant observable inputs (including quoted prices for similar investments, interest rates, prepayment speeds, etc.)
Level 3 - unobservable inputs (including the fund's own assumptions based on the best information available)
Changes in valuation techniques may result in transfers in or out of an assigned level within the disclosure hierarchy. The aggregate value of investments by input level, as of October 31, 2010, as well as a roll forward of Level 3 securities, is included at the end of the Fund's Schedule of Investments. Valuation techniques used to value the Fund's investments by major category are as follows.
Equity securities, including restricted securities, for which market quotations are readily available, are valued at the last reported sale price or official closing price as reported by an independent pricing service on the primary market or exchange on which they are traded and are categorized as Level 1 in the hierarchy. In the event there were no sales during the day or closing prices are not available, securities are valued at the last quoted bid price or may be valued using the last available price and are generally categorized as Level 2 in the hierarchy. For foreign equity securities, when significant market or security specific events arise, comparisons to the valuation of American Depositary Receipts (ADRs), futures contracts, Exchange-traded funds (ETFs) and certain indexes as well as quoted prices for similar securities are used and are categorized as Level 2 in the hierarchy in these circumstances. Utilizing these techniques may result in transfers between Level 1 and Level 2. For restricted equity securities and private placements where observable inputs are limited, assumptions about market activity and risk are used and are categorized as Level 3 in the hierarchy.
Annual Report
3. Significant Accounting Policies - continued
Security Valuation - continued
Investments in open-end mutual funds,including Fidelity Central Funds, are valued at their closing net asset value each business day and are categorized as Level 1 in the hierarchy. Short-term securities with remaining maturities of sixty days or less for which quotations are not readily available are valued at amortized cost, which approximates fair value and are categorized as Level 2 in the hierarchy.
Foreign Currency. The Fund uses foreign currency contracts to facilitate transactions in foreign-denominated securities. Gains and losses from these transactions may arise from changes in the value of the foreign currency or if the counterparties do not perform under the contracts' terms.
Foreign-denominated assets, including investment securities, and liabilities are translated into U.S. dollars at the exchange rate at period end. Purchases and sales of investment securities, income and dividends received and expenses denominated in foreign currencies are translated into U.S. dollars at the exchange rate in effect on the transaction date.
The effects of exchange rate fluctuations on investments are included with the net realized and unrealized gain (loss) on investment securities. Other foreign currency transactions resulting in realized and unrealized gain (loss) are disclosed separately.
Investment Transactions and Income. For financial reporting purposes, the Fund's investment holdings and NAV include trades executed through the end of the last business day of the period. The NAV per share for processing shareholder transactions is calculated as of the close of business of the New York Stock Exchange (NYSE), normally 4:00 p.m. Eastern time and includes trades executed through the end of the prior business day. Gains and losses on securities sold are determined on the basis of identified cost and may include proceeds received from litigation. Dividend income is recorded on the ex-dividend date, except for certain dividends from foreign securities where the ex-dividend date may have passed, which are recorded as soon as the Fund is informed of the ex-dividend date. Non-cash dividends included in dividend income, if any, are recorded at the fair market value of the securities received. Distributions received on securities that represent a return of capital or capital gain are recorded as a reduction of cost of investments and/or as a realized gain. The Fund estimates the components of distributions received that may be considered return of capital distributions or capital gain distributions. Interest income and distributions from the Fidelity Central Funds are accrued as earned. Interest income includes coupon interest and amortization of premium and accretion of discount on debt securities. Investment income is recorded net of foreign taxes withheld where recovery of such taxes is uncertain.
Expenses. Most expenses of the Trust can be directly attributed to a fund. Expenses which cannot be directly attributed are apportioned amongst each fund in the Trust. Expense estimates are accrued in the period to which they relate and adjustments are made when actual amounts are known.
Deferred Trustee Compensation. Under a Deferred Compensation Plan (the Plan), independent Trustees may elect to defer receipt of a portion of their annual compensation. Deferred amounts are invested in a cross-section of Fidelity funds, are marked-to-market and remain in the Fund until distributed in accordance with the Plan. The investment of deferred amounts and the offsetting payable to the Trustees are included in the accompanying Statement of Assets and Liabilities.
Income Tax Information and Distributions to Shareholders. Each year the Fund intends to qualify as a regulated investment company, including distributing substantially all of its taxable income and realized gains under Subchapter M of the Internal Revenue Code and filing its U.S. federal tax return. As a result, no provision for income taxes is required. As of October 31, 2010, the Fund did not have any unrecognized tax benefits in the accompanying financial statements. A fund's federal tax return is subject to examination by the Internal Revenue Service (IRS) for a period of three years. Foreign taxes are provided for based on the Fund's understanding of the tax rules and rates that exist in the foreign markets in which it invests.
Distributions are declared and recorded on the ex-dividend date. Income dividends and capital gain distributions are declared separately for each class. Income and capital gain distributions are determined in accordance with income tax regulations, which may differ from GAAP.
Capital accounts within the financial statements are adjusted for permanent book-tax differences. These adjustments have no impact on net assets or the results of operations. Temporary book-tax differences will reverse in a subsequent period.
Book-tax differences are primarily due to short-term capital gain distributions from the Fidelity Central Funds, foreign currency transactions, passive foreign investment companies (PFIC), deferred trustees compensation, capital loss carryforwards and losses deferred due to wash sales.
The federal tax cost of investment securities and unrealized appreciation (depreciation) as of period end were as follows:
Gross unrealized appreciation | $ 680,769,014 |
Gross unrealized depreciation | (481,671,593) |
Net unrealized appreciation (depreciation) | $ 199,097,421 |
| |
Tax Cost | $ 6,400,623,997 |
Annual Report
Notes to Financial Statements - continued
3. Significant Accounting Policies - continued
Income Tax Information and Distributions to Shareholders - continued
The tax-based components of distributable earnings as of period end were as follows:
Undistributed ordinary income | $ 86,052,773 |
Capital loss carryforward | $ (1,637,677,232) |
Net unrealized appreciation (depreciation) | $ 199,945,316 |
The tax character of distributions paid was as follows:
| October 31, 2010 | October 31, 2009 |
Ordinary Income | $ 110,764,641 | $ 81,537,156 |
Short-Term Trading (Redemption) Fees. Shares held by investors in the Fund less than 30 days are subject to a redemption fee equal to 1.00% of the net asset value of shares redeemed. All redemption fees, which reduce the proceeds of the shareholder redemption, are retained by the Fund and accounted for as an addition to paid in capital.
4. Purchases and Sales of Investments.
Purchases and sales of securities, other than short-term securities, aggregated $7,369,512,168 and $8,098,799,007, respectively.
5. Fees and Other Transactions with Affiliates.
Management Fee. FMR and its affiliates provide the Fund with investment management related services for which the Fund pays a monthly management fee. The management fee is the sum of an individual fund fee rate that is based on an annual rate of .45% of the Fund's average net assets and a group fee rate that averaged .26% during the period. The group fee rate is based upon the average net assets of all the mutual funds advised by FMR. The group fee rate decreases as assets under management increase and increases as assets under management decrease. In addition, the management fee is subject to a performance adjustment(up to a maximum of ±.20% of the Fund's average net assets over a 36 month performance period). The upward or downward adjustment to the management fee is based on the relative investment performance of Overseas as compared to an appropriate benchmark index. For the period, the total annual management fee rate, including the performance adjustment, was ..59% of the Fund's average net assets.
Transfer Agent Fees. Fidelity Investments Institutional Operations Company, Inc. (FIIOC), an affiliate of FMR, is the transfer, dividend disbursing and shareholder servicing agent for each class of the Fund. FIIOC receives account fees and asset-based fees that vary according to the account size and type of account of the shareholders of Overseas. FIIOC receives an asset-based fee of Class K's average net assets. FIIOC receives no fees for providing transfer agency services to Class F. FIIOC pays for typesetting, printing and mailing of shareholder reports, except proxy statements. For the period, transfer agent fees for each class were as follows:
| Amount | % of
Average
Net Assets |
Overseas | 15,119,234 | .25 |
Class K | 212,422 | .05 |
| $ 15,331,656 | |
Accounting and Security Lending Fees. Fidelity Service Company, Inc. (FSC), an affiliate of FMR, maintains the Fund's accounting records. The accounting fee is based on the level of average net assets for the month. Under a separate contract, FSC administers the security lending program. The security lending fee is based on the number and duration of lending transactions.
Brokerage Commissions. The Fund placed a portion of its portfolio transactions with brokerage firms which are affiliates of the investment adviser. The commissions paid to these affiliated firms were $7,413 for the period.
Annual Report
5. Fees and Other Transactions with Affiliates - continued
Interfund Lending Program. Pursuant to an Exemptive Order issued by the SEC, the Fund, along with other registered investment companies having management contracts with FMR, may participate in an interfund lending program. This program provides an alternative credit facility allowing the funds to borrow from, or lend money to, other participating affiliated funds. At period end, there were no interfund loans outstanding. The Fund's activity in this program during the period for which loans were outstanding was as follows:
Borrower or Lender | Average Daily
Loan Balance | Weighted Average
Interest Rate | Interest
Expense |
Borrower | $ 22,768,107 | .44% | $ 7,829 |
6. Committed Line of Credit.
The Fund participates with other funds managed by FMR or an affiliate in a $3.75 billion credit facility (the "line of credit") to be utilized for temporary or emergency purposes to fund shareholder redemptions or for other short-term liquidity purposes. The Fund has agreed to pay commitment fees on its pro-rata portion of the line of credit, which amounted to $27,318 and is reflected in Miscellaneous expenses on the Statement of Operations. During the period, there were no borrowings on this line of credit.
7. Security Lending.
The Fund lends portfolio securities through a lending agent from time to time in order to earn additional income. The lending agent may loan securities to certain qualified borrowers, including Fidelity Capital Markets (FCM), a broker-dealer affiliated with the Fund. On the settlement date of the loan, the Fund receives collateral (in the form of U.S. Treasury obligations, letters of credit and/or cash) against the loaned securities and maintains collateral in an amount not less than 100% of the market value of the loaned securities during the period of the loan. The market value of the loaned securities is determined at the close of business of the Fund and any additional required collateral is delivered to the Fund on the next business day. If the borrower defaults on its obligation to return the securities loaned because of insolvency or other reasons, a fund could experience delays and costs in recovering the securities loaned or in gaining access to the collateral. Any cash collateral received is invested in the Fidelity Securities Lending Cash Central Fund. The value of loaned securities and cash collateral at period end are disclosed on the Fund's Statement of Assets and Liabilities. Security lending income represents the income earned on investing cash collateral, less rebates paid to borrowers and lending agent fees associated with the loan, plus any premium payments received for lending certain types of securities. Security lending income is presented in the Statement of Operations as a component of income from Fidelity Central Funds. Total security lending income during the period amounted to $6,382,864. During the period, there were no securities loaned to FCM.
8. Expense Reductions.
Many of the brokers with whom FMR places trades on behalf of the Fund provided services to the Fund in addition to trade execution. These services included payments of certain expenses on behalf of the Fund totaling $2,661,854 for the period. In addition, through arrangements with the Fund's custodian credits realized as a result of uninvested cash balances were used to reduce the Fund's expenses. During the period, these credits reduced the Fund's custody expenses by $234.
9. Distributions to Shareholders.
Distributions to shareholders of each class were as follows:
Years ended October 31, | 2010 | 2009A |
From net investment income | | |
Overseas | $ 100,374,591 | $ 78,759,447 |
Class K | 6,711,130 | 2,777,709 |
Class F | 1,370,072 | - |
Total | $ 108,455,793 | $ 81,537,156 |
From net realized gain | | |
Overseas | $ 2,158,312 | $ - |
Class K | 126,111 | - |
Class F | 24,425 | - |
Total | $ 2,308,848 | $ - |
A Distributions to shareholders for Class F are for the period June 26, 2009 (commencement of sale of shares) to October 31, 2009.
Annual Report
Notes to Financial Statements - continued
10. Share Transactions.
Transactions for each class of shares were as follows:
| Shares | Dollars |
Years ended October 31, | 2010 | 2009A | 2010 | 2009A |
Overseas | | | | |
Shares sold | 36,113,789 | 47,857,124 | $ 1,067,886,397 | $ 1,179,178,777 |
Conversion to Class KB | - | (11,269,934) | - | (265,380,751) |
Reinvestment of distributions | 3,238,247 | 3,481,434 | 101,747,555 | 78,089,426 |
Shares redeemed | (82,678,886) | (35,803,556) | (2,430,908,864) | (910,091,016) |
Net increase (decrease) | (43,326,850) | 4,265,068 | ($ 1,261,274,912) | $ 81,796,436 |
Class K | | | | |
Shares sold | 5,090,117 | 2,178,017 | $ 151,156,491 | $ 56,176,528 |
Conversion from OverseasB | - | 11,270,235 | - | 265,380,751 |
Reinvestment of distributions | 217,803 | 123,950 | 6,837,242 | 2,777,709 |
Shares redeemed | (6,358,836) | (2,610,676) | (189,093,826) | (67,054,987) |
Net increase (decrease) | (1,050,916) | 10,961,526 | ($ 31,100,093) | $ 257,280,001 |
Class F | | | | |
Shares sold | 22,173,982 | 1,220,610 | $ 652,570,206 | $ 38,599,366 |
Reinvestment of distributions | 44,465 | - | 1,394,498 | - |
Shares redeemed | (4,555,729) | (12,931) | (133,239,488) | (411,680) |
Net increase (decrease) | 17,662,718 | 1,207,679 | $ 520,725,216 | $ 38,187,686 |
A Share transactions for Class F are for the period June 26, 2009 (commencement of sale of shares) to October 31, 2009.
B Conversion transactions for class K and Overseas are presented for the period November 1, 2008 through August 31, 2009.
11. Other.
The Fund's organizational documents provide former and current trustees and officers with a limited indemnification against liabilities arising in connection with the performance of their duties to the Fund. In the normal course of business, the Fund may also enter into contracts that provide general indemnifications. The Fund's maximum exposure under these arrangements is unknown as this would be dependent on future claims that may be made against the Fund. The risk of material loss from such claims is considered remote.
The Fidelity Freedom Funds and Fidelity Freedom K® Funds were the owners of record, in the aggregate, of approximately 52% of the total outstanding shares of the Fund.
Annual Report
Report of Independent Registered Public Accounting Firm
To the Trustees of Fidelity Investment Trust and the Shareholders of Fidelity Overseas Fund:
In our opinion, the accompanying statement of assets and liabilities, including the schedule of investments, and the related statements of operations and of changes in net assets and the financial highlights present fairly, in all material respects, the financial position of Fidelity Overseas Fund (a fund of Fidelity Investment Trust) at October 31, 2010, the results of its operations for the year then ended, the changes in its net assets for each of the two years in the period then ended and the financial highlights for each of the periods indicated, in conformity with accounting principles generally accepted in the United States of America. These financial statements and financial highlights (hereafter referred to as "financial statements") are the responsibility of the Fidelity Overseas Fund's management. Our responsibility is to express an opinion on these financial statements based on our audits. We conducted our audits of these financial statements in accordance with the standards of the Public Company Accounting Oversight Board (United States). Those standards require that we plan and perform the audit to obtain reasonable assurance about whether the financial statements are free of material misstatement. An audit includes examining, on a test basis, evidence supporting the amounts and disclosures in the financial statements, assessing the accounting principles used and significant estimates made by management, and evaluating the overall financial statement presentation. We believe that our audits, which included confirmation of securities at October 31, 2010 by correspondence with the custodian and brokers, provide a reasonable basis for our opinion.
/s/ PricewaterhouseCoopers LLP
PricewaterhouseCoopers LLP
Boston, Massachusetts
December 17, 2010
Annual Report
The Trustees, Member of the Advisory Board, and executive officers of the trust and fund, as applicable, are listed below. The Board of Trustees governs each fund and is responsible for protecting the interests of shareholders. The Trustees are experienced executives who meet periodically throughout the year to oversee each fund's activities, review contractual arrangements with companies that provide services to each fund, oversee management of the risks associated with such activities and contractual arrangements, and review each fund's performance. Except for James C. Curvey, each of the Trustees oversees 221 funds advised by FMR or an affiliate. Mr. Curvey oversees 410 funds advised by FMR or an affiliate.
The Trustees hold office without limit in time except that (a) any Trustee may resign; (b) any Trustee may be removed by written instrument, signed by at least two-thirds of the number of Trustees prior to such removal; (c) any Trustee who requests to be retired or who has become incapacitated by illness or injury may be retired by written instrument signed by a majority of the other Trustees; and (d) any Trustee may be removed at any special meeting of shareholders by a two-thirds vote of the outstanding voting securities of the trust. Each Trustee who is not an interested person (as defined in the 1940 Act) (Independent Trustee), shall retire not later than the last day of the calendar year in which his or her 72nd birthday occurs. The Independent Trustees may waive this mandatory retirement age policy with respect to individual Trustees. The executive officers and Advisory Board Members hold office without limit in time, except that any officer and Advisory Board Member may resign or may be removed by a vote of a majority of the Trustees at any regular meeting or any special meeting of the Trustees. Except as indicated, each individual has held the office shown or other offices in the same company for the past five years.
Experience, Skills, Attributes, and Qualifications of the Fund's Trustees. The Governance and Nominating Committee has adopted a statement of policy that describes the experience, qualifications, attributes, and skills that are necessary and desirable for potential Independent Trustee candidates (Statement of Policy). The Board believes that each Trustee satisfied at the time he or she was initially elected or appointed a Trustee, and continues to satisfy, the standards contemplated by the Statement of Policy. The Governance and Nominating Committee also engages professional search firms to help identify potential Independent Trustee candidates who have the experience, qualifications, attributes, and skills consistent with the Statement of Policy. From time to time, additional criteria based on the composition and skills of the current Independent Trustees, as well as experience or skills that may be appropriate in light of future changes to board composition, business conditions, and regulatory or other developments, have also been considered by the professional search firms and the Governance and Nominating Committee. In addition, the Board takes into account the Trustees' commitment and participation in Board and committee meetings, as well as their leadership of standing and ad hoc committees throughout their tenure.
In determining that a particular Trustee was and continues to be qualified to serve as a Trustee, the Board has considered a variety of criteria, none of which, in isolation, was controlling. The Board believes that, collectively, the Trustees have balanced and diverse experience, qualifications, attributes, and skills, which allow the Board to operate effectively in governing the fund and protecting the interests of shareholders. Information about the specific experience, skills, attributes, and qualifications of each Trustee, which in each case led to the Board's conclusion that the Trustee should serve (or continue to serve) as a trustee of the fund, is provided below.
Board Structure and Oversight Function. Edward C. Johnson 3d is an interested person (as defined in the 1940 Act) and currently serves as Chairman. The Trustees have determined that an interested Chairman is appropriate and benefits shareholders because an interested Chairman has a personal and professional stake in the quality and continuity of services provided to the fund. Independent Trustees exercise their informed business judgment to appoint an individual of their choosing to serve as Chairman, regardless of whether the Trustee happens to be independent or a member of management. The Independent Trustees have determined that they can act independently and effectively without having an Independent Trustee serve as Chairman and that a key structural component for assuring that they are in a position to do so is for the Independent Trustees to constitute a substantial majority for the Board. The Independent Trustees also regularly meet in executive session. Ned C. Lautenbach serves as Chairman of the Independent Trustees and as such (i) acts as a liaison between the Independent Trustees and management with respect to matters important to the Independent Trustees and (ii) with management prepares agendas for Board meetings.
Fidelity funds are overseen by different Boards of Trustees. The fund's Board oversees Fidelity's equity and high income funds and another Board oversees Fidelity's investment-grade bond, money market, and asset allocation funds. The asset allocation funds may invest in Fidelity funds overseen by the fund's Board. The use of separate Boards, each with its own committee structure, allows the Trustees of each group of Fidelity funds to focus on the unique issues of the funds they oversee, including common research, investment, and operational issues. On occasion, the separate Boards establish joint committees to address issues of overlapping consequences for the Fidelity funds overseen by each Board.
The Trustees operate using a system of committees to facilitate the timely and efficient consideration of all matters of importance to the Trustees, the fund, and fund shareholders and to facilitate compliance with legal and regulatory requirements and oversight of the fund's activities and associated risks. The Board, acting through its committees, has charged FMR and its affiliates with (i) identifying events or circumstances the occurrence of which could have demonstrably adverse effects on the fund's business and/or reputation; (ii) implementing processes and controls to lessen the possibility that such events or circumstances occur or to mitigate the effects of such events or circumstances if they do occur; and (iii) creating and maintaining a system designed to evaluate continuously business and market conditions in order to facilitate the identification and implementation processes described in (i) and (ii) above. Because the day-to-day operations and activities of the fund's are carried out by or through FMR, its affiliates and other service providers, the fund's exposure to risks is mitigated but not eliminated by the processes overseen by the Trustees. While each of the Board's committees has responsibility for overseeing different aspects of the fund's activities, oversight is exercised primarily through the Operations, Audit, and Compliance Committees. Appropriate personnel, including but not limited to the fund's Chief Compliance Officer (CCO), FMR's internal auditor, the independent accountants, the fund's Treasurer and portfolio management personnel, make periodic reports to the Board's committees, as appropriate. The responsibilities of each committee, including their oversight responsibilities, are described further under "Standing Committees of the Fund's Trustees."
Annual Report
Trustees and Officers - continued
The fund's Statement of Additional Information (SAI) includes more information about the Trustees. To request a free copy, call Fidelity at 1-800-835-5092.
Interested Trustees*:
Correspondence intended for each Trustee who is an interested person may be sent to Fidelity Investments, 82 Devonshire Street, Boston, Massachusetts 02109.
Name, Age; Principal Occupations and Other Relevant Experience+ |
Edward C. Johnson 3d (80) |
| Year of Election or Appointment: 1984 Mr. Johnson is Trustee and Chairman of the Board of Trustees of certain Trusts. Mr. Johnson serves as Chief Executive Officer, Chairman, and a Director of FMR LLC; Chairman and a Director of FMR; Chairman and a Director of Fidelity Research & Analysis Company (FRAC); Chairman and a Director of Fidelity Investments Money Management, Inc.; and Chairman and a Director of FMR Co., Inc. In addition, Mr. Johnson serves as Chairman and Director of FIL Limited. Previously, Mr. Johnson served as President of FMR LLC (2006-2007). |
James C. Curvey (75) |
| Year of Election or Appointment: 2007 Mr. Curvey also serves as Trustee (2007-present) of other investment companies advised by FMR. Mr. Curvey is a Director of Fidelity Investments Money Management, Inc. (2009-present), Director of Fidelity Research & Analysis Co. (2009-present) and Director of FMR and FMR Co., Inc. (2007-present). Mr. Curvey is also Vice Chairman (2007-present) and Director of FMR LLC. In addition, Mr. Curvey serves as an Overseer for the Boston Symphony Orchestra and a member of the Trustees of Villanova University. Previously, Mr. Curvey was the Vice Chairman (2006-2007) and Director (2000-2007) of FMR Corp. |
* Trustees have been determined to be "Interested Trustees" by virtue of, among other things, their affiliation with the trusts or various entities under common control with FMR.
+ The information above includes each Trustee's principal occupation during the last five years and other information relating to the experience, attributes, and skills relevant to each Trustee's qualifications to serve as a Trustee, which led to the conclusion that each Trustee should serve as a Trustee for the fund.
Independent Trustees:
Correspondence intended for each Independent Trustee (that is, the Trustees other than the Interested Trustees) may be sent to Fidelity Investments, P.O. Box 55235, Boston, Massachusetts 02205-5235.
Name, Age; Principal Occupations and Other Relevant Experience+ |
Dennis J. Dirks (62) |
| Year of Election or Appointment: 2005 Prior to his retirement in May 2003, Mr. Dirks was Chief Operating Officer and a member of the Board of The Depository Trust & Clearing Corporation (DTCC). He also served as President, Chief Operating Officer, and Board member of The Depository Trust Company (DTC) and President and Board member of the National Securities Clearing Corporation (NSCC). In addition, Mr. Dirks served as Chief Executive Officer and Board member of the Government Securities Clearing Corporation, Chief Executive Officer and Board member of the Mortgage-Backed Securities Clearing Corporation, as a Trustee and a member of the Finance Committee of Manhattan College (2005-2008), and as a Trustee and a member of the Finance Committee of AHRC of Nassau County (2006-2008). Mr. Dirks is a member of the Independent Directors Council (IDC) Governing Council (2010-Present) and Board of Directors for The Brookville Center for Children's Services, Inc. (2009-present). |
Alan J. Lacy (57) |
| Year of Election or Appointment: 2008 Mr. Lacy serves as Senior Adviser (2007-present) of Oak Hill Capital Partners, L.P. (private equity). Mr. Lacy also served as Chief Executive Officer (2000-2005) and Vice Chairman (2005-2006) of Sears Holdings Corporation and Sears, Roebuck and Co. (retail). In addition, Mr. Lacy serves as a member of the Board of Directors of The Western Union Company (global money transfer, 2006-present) and Bristol-Myers Squibb Company (global pharmaceuticals, 2007-present). Mr. Lacy is Chairman (2008-present) and a member (2006-present) of the Board of Trustees of The National Parks Conservation Association. |
Ned C. Lautenbach (66) |
| Year of Election or Appointment: 2000 Mr. Lautenbach is Chairman of the Independent Trustees of the Equity and High Income Funds (2006-present). Mr. Lautenbach currently serves as the Lead Director of the Eaton Corporation Board of Directors (diversified industrial, 1997-present). Mr. Lautenbach is also a member of the Board of Directors of the Philharmonic Center for the Arts in Naples, Florida (1999-present); a member of the Board of Trustees of Fairfield University (2005-present); and a member of the Council on Foreign Relations (1994-present). Previously, Mr. Lautenbach was a Partner/Advisory Partner at Clayton, Dubilier & Rice, Inc. (private equity investment, 1998-2010), as well as a Director of Sony Corporation (2006-2007). |
Joseph Mauriello (66) |
| Year of Election or Appointment: 2008 Prior to his retirement in January 2006, Mr. Mauriello served in numerous senior management positions including Deputy Chairman and Chief Operating Officer (2004-2005), and Vice Chairman of Financial Services (2002-2004) of KPMG LLP US (professional services, 1965-2005). Mr. Mauriello currently serves as a member of the Board of Directors of XL Group plc. (global insurance and re-insurance, 2006-present) and of Arcadia Resources Inc. (health care services and products, 2007-present). Previously, Mr. Mauriello served as a Director of the Hamilton Funds of the Bank of New York (2006-2007). |
Cornelia M. Small (66) |
| Year of Election or Appointment: 2005 Ms. Small is a member of the Board of Directors of the Teagle Foundation (2009-present). Ms. Small is also a member of the Investment Committee, and Chair (2008-present) and a member of the Board of Trustees of Smith College. In addition, Ms. Small serves on the Investment Committee of the Berkshire Taconic Community Foundation (2008-present). Previously, Ms. Small served as Chairperson of the Investment Committee (2002-2008) of Smith College. In addition, Ms. Small served as Chief Investment Officer, Director of Global Equity Investments, and a member of the Board of Directors of Scudder, Stevens & Clark and Scudder Kemper Investments. |
William S. Stavropoulos (71) |
| Year of Election or Appointment: 2001 Mr. Stavropoulos is Vice Chairman of the Independent Trustees of the Equity and High Income Funds (2006-present). Mr. Stavropoulos serves as President and Founder of the Michigan Baseball Foundation, the Great Lakes Loons (2007-present). Mr. Stavropoulos is Chairman Emeritus of the Board of Directors of The Dow Chemical Company, where he previously served in numerous senior management positions, including President, CEO (1995-2000; 2002-2004), Chairman of the Executive Committee (2000-2006), and as a member of the Board of Directors (1990-2006). Currently, Mr. Stavropoulos is Chairman of Univar (global distributor of commodity and speciality chemicals, 2010-present), a Director of Teradata Corporation (data warehousing and technology solutions, 2008-present), Chemical Financial Corporation, Maersk Inc. (industrial conglomerate), Tyco International, Inc. (multinational manufacturing and services, 2007-present), and a member of the Advisory Board for Metalmark Capital (private equity investment, 2005-present). Mr. Stavropoulos is a special advisor to Clayton, Dubilier & Rice, Inc. (private equity investment). In addition, Mr. Stavropoulos is a member of the University of Notre Dame Advisory Council for the College of Science. |
David M. Thomas (61) |
| Year of Election or Appointment: 2008 Previously, Mr. Thomas served as Executive Chairman (2005-2006) and Chairman and Chief Executive Officer (2000-2005) of IMS Health, Inc. (pharmaceutical and healthcare information solutions). In addition, Mr. Thomas serves as a member of the Board of Directors of Fortune Brands, Inc. (consumer products), and Interpublic Group of Companies, Inc. (marketing communication, 2004-present). |
Michael E. Wiley (60) |
| Year of Election or Appointment: 2008 Mr. Wiley also serves as a Director of Asia Pacific Exploration Consolidated (international oil and gas exploration and production, 2008-present). Mr. Wiley serves as a Director of Tesoro Corporation (independent oil refiner and marketer, 2005-present), and a Director of Bill Barrett Corporation (exploration and production, 2005-present). In addition, Mr. Wiley also serves as a Director of Post Oak Bank (privately-held bank, 2004-present). Previously, Mr. Wiley served as a member of the Board of Trustees of the University of Tulsa (2000-2006; 2007-2010), as a Senior Energy Advisor of Katzenbach Partners, LLC (consulting, 2006-2007), as an Advisory Director of Riverstone Holdings (private investment), Chairman, President, and CEO of Baker Hughes, Inc. (oilfield services, 2000-2004), and as Director of Spinnaker Exploration Company (exploration and production, 2001-2005). |
+ The information above includes each Trustee's principal occupation during the last five years and other information relating to the experience, attributes, and skills relevant to each Trustee's qualifications to serve as a Trustee, which led to the conclusion that each Trustee should serve as a Trustee for the fund.
Annual Report
Trustees and Officers - continued
Advisory Board Member and Executive Officers:
Correspondence intended for each executive officer, and Peter S. Lynch may be sent to Fidelity Investments, 82 Devonshire Street, Boston, Massachusetts 02109.
Name, Age; Principal Occupation |
Peter S. Lynch (66) |
| Year of Election or Appointment: 2003 Member of the Advisory Board of Fidelity's Equity and High Income Funds. Mr. Lynch is Vice Chairman and a Director of FMR and FMR Co., Inc. In addition, Mr. Lynch serves as a Trustee of Boston College and as the Chairman of the Inner-City Scholarship Fund. Previously, Mr. Lynch served on the Special Olympics International Board of Directors (1997-2006). |
Kenneth B. Robins (41) |
| Year of Election or Appointment: 2008 President and Treasurer of Fidelity's Equity and High Income Funds. Mr. Robins also serves as President and Treasurer (2010-present) and Assistant Treasurer (2009-present) of other Fidelity funds and is an employee of Fidelity Investments (2004-present). Previously, Mr. Robins served as Deputy Treasurer of the Fidelity funds (2005-2008) and Treasurer and Chief Financial Officer of The North Carolina Capital Management Trust: Cash and Term Portfolios (2006-2008). |
Bruce T. Herring (45) |
| Year of Election or Appointment: 2006 Vice President of certain Equity Funds. Mr. Herring also serves as Chief Investment Officer and Director of Fidelity Management & Research (U.K.) Inc. (2010-present) and Group Chief Investments Officer of FMR. Previously, Mr. Herring served as Vice President (2005-2006) and Senior Vice President (2006-2007) of Fidelity Management & Research Company, Vice President of FMR Co., Inc. (2001-2007) and as a portfolio manager for Fidelity U.S. Equity Funds. |
Brian B. Hogan (46) |
| Year of Election or Appointment: 2009 Vice President of certain Equity Funds and Vice President of Sector Funds. Mr. Hogan also serves as President of FMR's Equity Division (2009-present). Previously, Mr. Hogan served as Senior Vice President, Equity Research of FMR (2006-2009) and as a portfolio manager. |
Scott C. Goebel (42) |
| Year of Election or Appointment: 2008 Secretary and Chief Legal Officer (CLO) of the Fidelity funds. Mr. Goebel also serves as Secretary and CLO of The North Carolina Capital Management Trust: Cash and Term Portfolio (2008-present); General Counsel, Secretary, and Senior Vice President of FMR (2008-present) and FMR Co., Inc. (2008-present); Deputy General Counsel of FMR LLC; Chief Legal Officer of Fidelity Management & Research (Hong Kong) Limited (2008-present) and Assistant Secretary of Fidelity Management & Research (Japan) Inc. (2008-present), Fidelity Investments Money Management, Inc. (2008-present), Fidelity Management & Research (U.K.) Inc. (2008-present), and Fidelity Research and Analysis Company (2008-present). Previously, Mr. Goebel served as Assistant Secretary of the Funds (2007-2008) and as Vice President and Secretary of Fidelity Distributors Corporation (FDC) (2005-2007). |
William C. Coffey (41) |
| Year of Election or Appointment: 2009 Assistant Secretary of Fidelity's Equity and High Income Funds. Mr. Coffey also serves as Senior Vice President and Deputy General Counsel of FMR LLC (2010-present), and is an employee of Fidelity Investments. Previously, Mr. Coffey served as Vice President and Associate General Counsel of FMR LLC (2005-2009). |
Holly C. Laurent (56) |
| Year of Election or Appointment: 2008 Anti-Money Laundering (AML) Officer of the Fidelity funds. Ms. Laurent also serves as AML Officer of The North Carolina Capital Management Trust: Cash and Term Portfolio (2008-present) and is an employee of Fidelity Investments. Previously, Ms. Laurent was Senior Vice President and Head of Legal for Fidelity Business Services India Pvt. Ltd. (2006-2008), and Senior Vice President, Deputy General Counsel and Group Head for FMR LLC (2005-2006). |
Christine Reynolds (52) |
| Year of Election or Appointment: 2008 Chief Financial Officer of the Fidelity funds. Ms. Reynolds became President of Fidelity Pricing and Cash Management Services (FPCMS) in August 2008. Ms. Reynolds served as Chief Operating Officer of FPCMS (2007-2008). Previously, Ms. Reynolds served as President, Treasurer, and Anti-Money Laundering officer of the Fidelity funds (2004-2007). |
Kenneth A. Rathgeber (63) |
| Year of Election or Appointment: 2004 Chief Compliance Officer of Fidelity's Equity and High Income Funds. Mr. Rathgeber is Chief Compliance Officer of Fidelity Management & Research (Hong Kong) Limited (2008-present), Fidelity Management & Research (Japan) Inc. (2008-present), FMR (2005-present), FMR Co., Inc. (2005-present), Fidelity Management & Research (U.K.) Inc. (2005-present), Fidelity Research & Analysis Company (2005-present), Fidelity Investments Money Management, Inc. (2005-present), Pyramis Global Advisors, LLC (2005-present), and Strategic Advisers, Inc. (2005-present). |
Jeffrey S. Christian (49) |
| Year of Election or Appointment: 2009 Deputy Treasurer of the Fidelity funds. Mr. Christian is an employee of Fidelity Investments. Previously, Mr. Christian served as Chief Financial Officer (2008-2009) of certain Fidelity funds and Senior Vice President of Fidelity Pricing and Cash Management Services (FPCMS) (2004-2009). |
Bryan A. Mehrmann (49) |
| Year of Election or Appointment: 2005 Deputy Treasurer of the Fidelity funds. Mr. Mehrmann is an employee of Fidelity Investments. |
Adrien E. Deberghes (43) |
| Year of Election or Appointment: 2008 Deputy Treasurer of Fidelity's Equity and High Income Funds. Mr. Deberghes also serves as Assistant Treasurer of other Fidelity funds (2010-present) and is an employee of Fidelity Investments (2008-present). Previously, Mr. Deberghes served as Senior Vice President of Mutual Fund Administration at State Street Corporation (2007-2008), Senior Director of Mutual Fund Administration at Investors Bank & Trust (2005-2007), and Director of Finance for Dunkin' Brands (2000-2005). |
Stephanie J. Dorsey (41) |
| Year of Election or Appointment: 2010 Assistant Treasurer of Fidelity's Equity and High Income Funds. Ms. Dorsey also serves as Deputy Treasurer of other Fidelity funds (2008-present) and is an employee of Fidelity Investments (2008-present). Previously, Ms. Dorsey served as Treasurer (2004-2008) of the JPMorgan Mutual Funds and Vice President (2004-2008) of JPMorgan Chase Bank. |
John R. Hebble (52) |
| Year of Election or Appointment: 2009 Assistant Treasurer of Fidelity's Equity and High Income Funds. Mr. Hebble also serves as Treasurer and Chief Financial Officer of The North Carolina Capital Management Trust: Cash and Term Portfolio (2008-present), President and Treasurer of other Fidelity funds (2008-present) and is an employee of Fidelity Investments. |
Gary W. Ryan (52) |
| Year of Election or Appointment: 2005 Assistant Treasurer of the Fidelity funds. Mr. Ryan is an employee of Fidelity Investments. Previously, Mr. Ryan served as Vice President of Fund Reporting in Fidelity Pricing and Cash Management Services (FPCMS) (1999-2005). |
Jonathan Davis (42) |
| Year of Election or Appointment: 2010 Assistant Treasurer of the Fidelity funds. Mr. Davis is an employee of Fidelity Investments. Previously, Mr. Davis served as Vice President and Associate General Counsel of FMR LLC (2003-2010). |
Annual Report
The Board of Trustees of Fidelity Overseas Fund voted to pay on December 6, 2010 to shareholders of record at the opening of business on December 3, 2010, the following distributions per share derived from capital gains realized from sales of portfolio securities and dividends derived from net investment income:
| Pay Date | Record Date | Dividends | Capital Gains |
Class K | 12/06/10 | 12/03/10 | $0.553 | $0.000 |
A percentage of the dividends distributed during the fiscal year for the following fund may be taken into account as a dividend for purposes of the maximum rate under section 1(h) (11) of the Internal Revenue Code:
| Ex Date | |
Class K | 12/04/2009 | 100% |
Class K | 12/30/2009 | 100% |
The amounts per share which represent income derived from sources within, and taxes paid to, foreign countries or possessions of the United States are as follows:
| Pay Date | Income | Taxes |
Class K | 12/07/09 | $0.493 | $0.0394 |
Class K | 12/31/09 | $0.009 | $0.000 |
The fund will notify shareholders in January 2011 of amounts for use in preparing 2010 income tax returns.
Annual Report
Board Approval of Investment Advisory Contracts and Management Fees
Fidelity Overseas Fund
Each year, the Board of Trustees, including the Independent Trustees (together, the Board), votes on the renewal of the management contract and sub-advisory agreements (together, the Advisory Contracts) for the fund. The Board, assisted by the advice of fund counsel and Independent Trustees' counsel, requests and considers a broad range of information relevant to the renewal of the Advisory Contracts throughout the year.
The Board meets regularly and considers at each of its meetings factors that are relevant to its annual consideration of the renewal of the fund's Advisory Contracts, including the services and support provided to the fund and its shareholders. The Board has established various standing committees, each composed of Independent Trustees with varying backgrounds, to which the Board has assigned specific subject matter responsibilities in order to enhance effective decision-making by the Board. The Board, acting directly and through its Committees, requests and receives information concerning the annual consideration of the renewal of the fund's Advisory Contracts. The Board also meets as needed to consider matters specifically related to the Board's annual consideration of the renewal of Advisory Contracts. Members of the Board may also meet with trustees of other Fidelity funds through ad hoc joint committees to discuss certain matters relevant to the Fidelity funds.
At its July 2010 meeting, the Board of Trustees, including the Independent Trustees, unanimously determined to renew the fund's Advisory Contracts. In reaching its determination, the Board considered all factors it believed relevant, including (i) the nature, extent, and quality of the services to be provided to the fund and its shareholders (including the investment performance of the fund); (ii) the competitiveness of the fund's management fee and total expenses; (iii) the total costs of the services to be provided by and the profits to be realized by Fidelity from its relationship with the fund; (iv) the extent to which economies of scale would be realized as the fund grows; and (v) whether fee levels reflect these economies of scale, if any, for the benefit of fund shareholders.
In considering whether to renew the Advisory Contracts for the fund, the Board reached a determination, with the assistance of fund counsel and Independent Trustees' counsel and through the exercise of its business judgment, that the renewal of the Advisory Contracts is in the best interests of fund shareholders and that the compensation to be received by Fidelity under the management contract is fair and reasonable. The Board's decision to renew the Advisory Contracts was not based on any single factor noted above, but rather was based on a comprehensive consideration of all the information provided to the Board at its meetings throughout the year. The Board, in reaching its determination to renew the Advisory Contracts, is aware that shareholders in the fund have a broad range of investment choices available to them, including a wide choice among mutual funds offered by Fidelity's competitors, and that the fund's shareholders, with the opportunity to review and weigh the disclosure provided by the fund in its prospectus and other public disclosures, have chosen to invest in this fund, managed by Fidelity.
Nature, Extent, and Quality of Services Provided. The Board considered the staffing within the investment adviser, FMR, and the sub-advisers (together, the Investment Advisers), including the backgrounds of the fund's investment personnel and the fund's investment objective and discipline. The Independent Trustees also had discussions with senior management of Fidelity's investment operations and investment groups. The Board considered the structure of the portfolio manager compensation program and whether this structure provides appropriate incentives to act in the best interest of the fund.
Resources Dedicated to Investment Management and Support Services. The Board and the equity research subcommittee of the Board's Fund Oversight Committee reviewed the size, education, and experience of the Investment Advisers' investment staff, their use of technology, and the Investment Advisers' approach to recruiting, training, and retaining portfolio managers and other research, advisory, and management personnel. The Board noted that Fidelity's analysts have access to a variety of technological tools and market and securities data that enable them to perform both fundamental and quantitative analysis and to specialize in various disciplines. The Board considered Fidelity's extensive global research capabilities that enable the Investment Advisers to aggregate data from various sources in an effort to produce positive investment results. The Board also considered that Fidelity's portfolio managers and analysts have access to daily portfolio attribution that allows for monitoring of a fund's portfolio, as well as an electronic communication system that provides immediate real-time access to research concerning issuers and credit enhancers. The Board noted FMR's continued focus on strengthening the organization and discipline of equity portfolio management and research.
Shareholder and Administrative Services. The Board considered (i) the nature, extent, quality, and cost of advisory, administrative, and shareholder services performed by the Investment Advisers and their affiliates under the Advisory Contracts and under separate agreements covering transfer agency, pricing and bookkeeping, and securities lending services for the fund; (ii) the nature and extent of the investment adviser's supervision of third party service providers, principally custodians and subcustodians; and (iii) the resources devoted to, and the record of compliance with, the fund's compliance policies and procedures. The Board also reviewed the allocation of fund brokerage, including allocations to brokers affiliated with the Investment Advisers, the use of brokerage commissions to pay fund expenses, and the use of "soft" commission dollars to pay for research services.
The Board noted that the growth of fund assets over time across the complex allows Fidelity to reinvest in the development of services designed to enhance the value or convenience of the Fidelity funds as investment vehicles. These services include 24-hour access to account information and market information through phone representatives and over the Internet, and investor education materials and asset allocation tools.
Investment in a Large Fund Family. The Board considered the benefits to shareholders of investing in a Fidelity fund, including the benefits of investing in a fund that is part of a large family of funds offering a variety of investment disciplines and providing a large variety of mutual fund investor services. The Board noted that Fidelity had taken, or had made recommendations that resulted in the Fidelity funds taking, a number of actions over the previous year that benefited particular funds, including (i) dedicating additional resources to investment research and restructuring and broadening the focus of the investment research teams; (ii) bolstering the senior management team that oversees asset management; (iii) launching Class F of certain funds as a lower-fee class available to Freedom K and Freedom Index Funds; (iv) lowering the initial investment minimums and ongoing balance requirements for Real Estate High Income Fund; (v) eliminating subsequent purchase minimums for all funds and adding a waiver of the investment minimum requirement for new accounts opened with the proceeds of a systematic withdrawal plan; (vi) eliminating the withdrawal minimum and maximum limits for systematic withdrawals from Advisor funds; (vii) expanding sales load waivers on Class A shares for Destiny Planholders and expanding Institutional Class eligibility for Class O Destiny Planholders; and (viii) changing certain Class A and Class T sales charge structures to further align them with industry practices.
Annual Report
Board Approval of Investment Advisory Contracts and Management Fees - continued
Investment Performance. The Board considered whether the fund has operated in accordance with its investment objective, as well as its record of compliance with its investment restrictions. It also reviewed the fund's absolute investment performance for each class (except Class F), as well as the fund's relative investment performance for each class (except Class F) measured over multiple periods against (i) a broad-based securities market index, and (ii) a peer group of mutual funds deemed appropriate by Fidelity and reviewed by the Board. The following charts considered by the Board show, over the one-, three-, and five-year periods ended December 31, 2009, the cumulative total returns of Class K and the retail class of the fund, the cumulative total returns of a broad-based securities market index ("benchmark"), and a range of cumulative total returns of a peer group of mutual funds identified by Morningstar, Inc. as having an investment style similar to that of the fund based on underlying portfolio holdings. (Class F of the fund had less than one year of performance as of December 31, 2009.) The box within each chart shows the 25th percentile return (bottom of box) and the 75th percentile return (top of box) of the peer group. Returns shown above the box are in the first quartile and returns shown below the box are in the fourth quartile. The percentage beaten numbers noted below each chart correspond to the percentile box and represent the percentage of funds in the peer group whose performance was equal to or lower than that of the class indicated.
Fidelity Overseas Fund

The Board reviewed the fund's relative investment performance against its peer group and noted that the performance of the retail class of the fund (the class with the longer performance record) was in the fourth quartile for the one-year period and the third quartile for the three- and five-year periods. The Board also noted that the investment performance of the fund was lower than its benchmark for all the periods shown. The Board discussed with FMR actions that have been taken by FMR to improve the fund's disappointing performance relative to its peer group and benchmark. The Board noted that this fund had underperformed in the previous year and discussed with FMR its disappointment with the continued underperformance of the fund. The Board also reviewed the fund's performance since inception as well as performance in the current year. The Board will continue to closely monitor the performance of the fund in the coming year and discuss with FMR other appropriate actions to address the performance of the fund.
The Board also considered that the fund's management fee is subject to upward or downward adjustment depending upon whether, and to what extent, the fund's investment performance for the performance period exceeds, or is exceeded by, the record (over the same period) of a Board-approved performance adjustment index. The Board realizes that the performance adjustment provides FMR with a strong economic incentive to seek to achieve superior performance for the fund's shareholders and helps to more closely align the interests of FMR and the fund's shareholders.
Based on its review, and giving particular weight to the nature and quality of the resources dedicated by the Investment Advisers to maintain and improve relative performance and factoring in the unprecedented market events in recent years, the Board concluded that the nature, extent, and quality of investment management and support services and of shareholder and administrative services provided to the fund will benefit the fund's shareholders, particularly in light of the Board's view that the fund's shareholders benefit from investing in a fund that is part of a large family of funds offering a variety of investment disciplines and services.
Annual Report
Competitiveness of Management Fee and Total Fund Expenses. The Board considered the fund's management fee and total expenses compared to "mapped groups" of competitive funds and classes. Fidelity creates "mapped groups" by combining similar Lipper investment objective categories that have comparable management fee characteristics. Combining Lipper investment objective categories aids the Board's management fee and total expense comparisons by broadening the competitive group used for comparison and by reducing the number of universes to which various Fidelity funds are compared.
Management Fee. The Board considered two proprietary management fee comparisons for the 12-month periods shown in the chart below. The group of Lipper funds used by the Board for management fee comparisons is referred to below as the "Total Mapped Group." The Total Mapped Group comparison focuses on a fund's standing relative to the total universe of comparable funds available to investors, in terms of gross management fees before expense reimbursements or caps, and without giving effect to the fund's performance adjustment. "TMG %" represents the percentage of funds in the Total Mapped Group that had management fees that were lower than the fund's. For example, a TMG % of 15% means that 85% of the funds in the Total Mapped Group had higher management fees than the fund. The "Asset-Size Peer Group" (ASPG) comparison focuses on a fund's standing relative to non-Fidelity funds similar in size to the fund within the Total Mapped Group. The ASPG represents at least 15% of the funds in the Total Mapped Group with comparable asset size and management fee characteristics, subject to a minimum of 50 funds (or all funds in the Total Mapped Group if fewer than 50). Additional information, such as the ASPG quartile in which the fund's management fee ranked and the impact of the fund's performance adjustment, is also included in the chart and considered by the Board.
Fidelity Overseas Fund
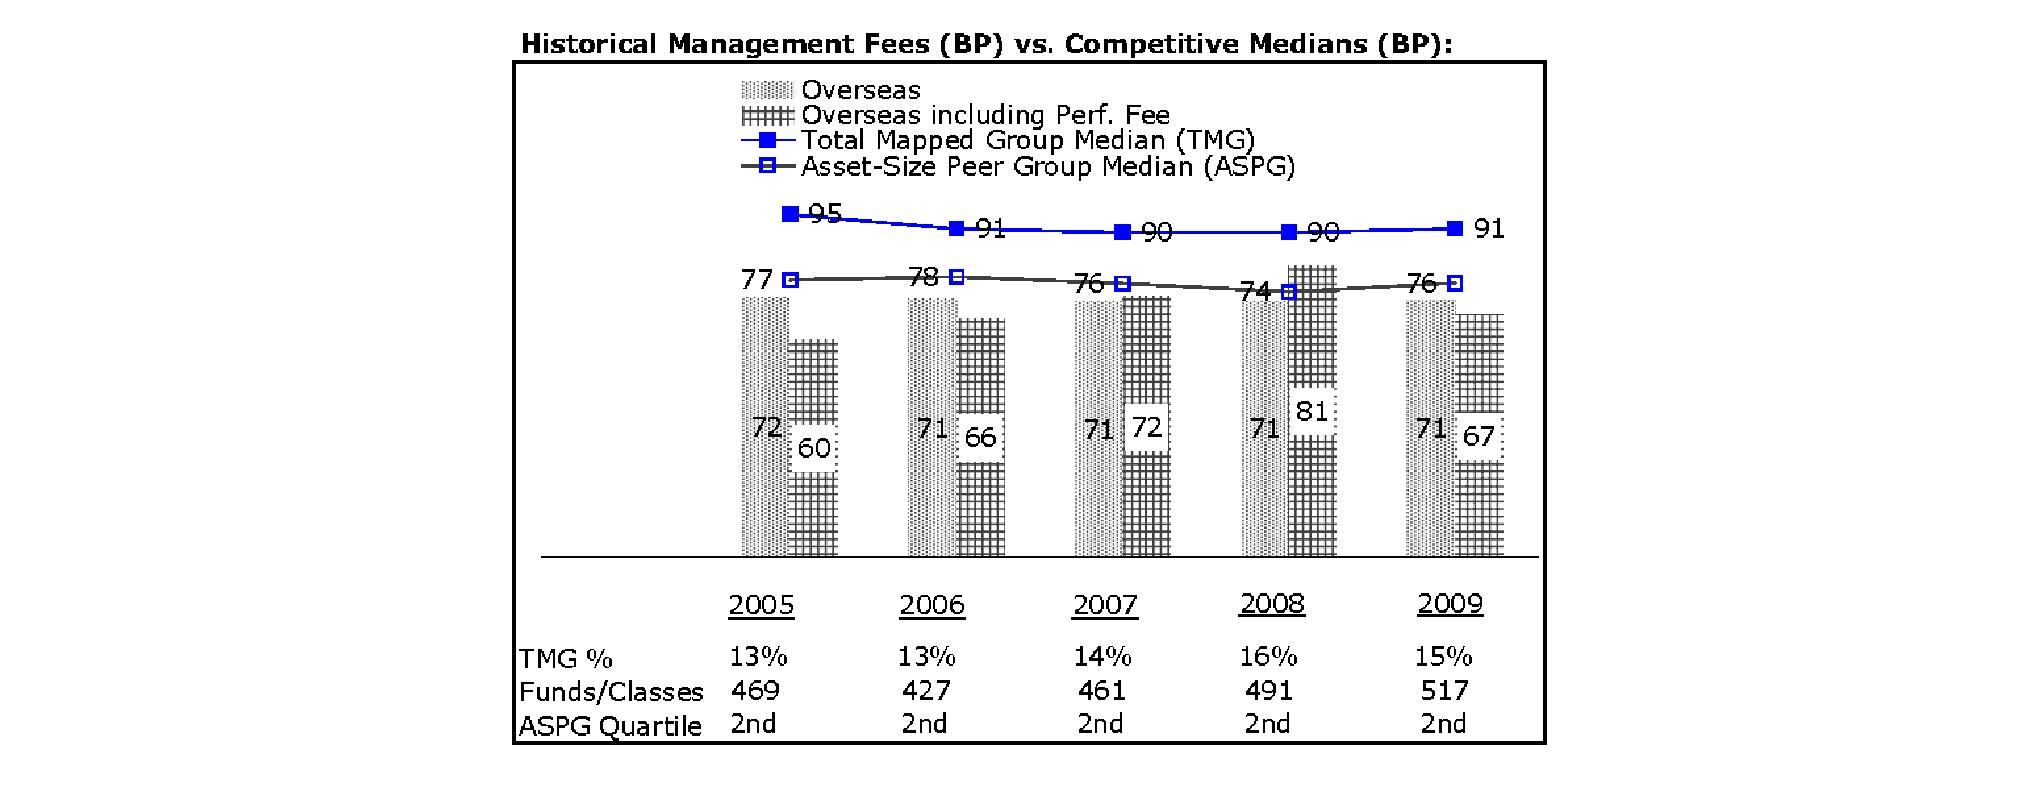
The Board noted that the fund's management fee ranked below the median of its Total Mapped Group and below the median of its ASPG for 2009. The Board also noted the effect of the fund's negative performance adjustment on the fund's management fee ranking. The Board noted that the performance adjustment for each year represents calculations for performance periods that differ from the periods shown in the performance charts above.
Based on its review, the Board concluded that the fund's management fee is fair and reasonable in light of the services that the fund receives and the other factors considered.
Total Expenses. In its review of each class's total expenses, the Board considered the fund's management fee as well as other fund or class expenses, as applicable, such as transfer agent fees, pricing and bookkeeping fees, and custodial, legal, and audit fees. The Board also noted the effects of any waivers and reimbursements on fees and expenses, as well as the impact of the fund's performance adjustment. As part of its review, the Board also considered current and historical total expenses of each class of the fund compared to competitive fund median expenses. Each class of the fund is compared to those funds and classes in the Total Mapped Group (used by the Board for management fee comparisons) that have a similar sales load structure.
The Board noted that the total expenses of each class ranked below its competitive median for the period.
Annual Report
Board Approval of Investment Advisory Contracts and Management Fees - continued
Fees Charged to Other Fidelity Clients. The Board also considered Fidelity fee structures and other information with respect to clients of FMR and its affiliates, such as other mutual funds advised or subadvised by FMR or its affiliates, pension plan clients, and other institutional clients. In March 2010, the Board created an ad hoc joint committee with the board of other Fidelity funds (the Committee) to review and compare Fidelity's institutional investment advisory business with its business of providing services to the Fidelity funds, including the differences in services provided, fees charged, and costs incurred, as well as competition in their respective marketplaces.
Based on its review of total expenses and fees charged to other Fidelity clients, the Board concluded that the total expenses of each class of the fund were reasonable in light of the services that the fund and its shareholders receive and the other factors considered, including the findings of the Committee.
Costs of the Services and Profitability. The Board considered the revenues earned and the expenses incurred by Fidelity in conducting the business of developing, marketing, distributing, managing, administering and servicing the fund and its shareholders. The Board also considered the level of Fidelity's profits in respect of all the Fidelity funds.
On an annual basis, FMR presents to the Board Fidelity's profitability for the fund. Fidelity calculates the profitability for each fund, as well as aggregate profitability for groups of Fidelity funds and all Fidelity funds, using a series of detailed revenue and cost allocation methodologies which originate with the audited books and records of Fidelity. The Audit Committee of the Board reviews any significant changes from the prior year's methodologies.
PricewaterhouseCoopers LLP (PwC), independent registered public accounting firm and auditor to Fidelity and certain Fidelity funds, has been engaged annually by the Board as part of the Board's assessment of Fidelity's profitability analysis. PwC's engagement includes the review and assessment of Fidelity's methodologies used in determining the revenues and expenses attributable to Fidelity's mutual fund business, and completion of agreed-upon procedures surrounding the mathematical accuracy of fund profitability and its conformity to allocation methodologies. After considering PwC's reports issued under the engagement and information provided by Fidelity, the Board believes that while other allocation methods may also be reasonable, Fidelity's profitability methodologies are reasonable in all material respects.
The Board has also reviewed Fidelity's non-fund businesses and fall-out benefits related to the mutual fund business as well as cases where Fidelity's affiliates may benefit from or be related to the fund's business.
The Board considered the costs of the services provided by and the profits realized by Fidelity in connection with the operation of the fund and were satisfied that the profitability was not excessive in the circumstances.
Economies of Scale. The Board considered whether there have been economies of scale in respect of the management of the Fidelity funds, whether the Fidelity funds (including the fund) have appropriately benefited from any such economies of scale, and whether there is potential for realization of any further economies of scale. The Board considered the extent to which the fund will benefit from economies of scale through increased services to the fund, through waivers or reimbursements, or through fee or expense reductions.
In February 2009, the Board and the board of other Fidelity funds created an ad hoc committee (the Economies of Scale Committee) to analyze whether FMR attains economies of scale in respect of the management and servicing of the Fidelity funds, whether the Fidelity funds have appropriately benefited from such economies of scale, and whether there is potential for realization of any further economies of scale.
The Board recognized that the fund's management contract incorporates a "group fee" structure, which provides for lower group fee rates as total fund assets under FMR's management increase, and for higher group fee rates as total fund assets under FMR's management decrease. FMR calculates the group fee rates based on a tiered asset "breakpoint" schedule that varies based on asset class. The Board considered that the group fee is designed to deliver the benefits of economies of scale to fund shareholders when total Fidelity fund assets increase, even if assets of any particular fund are unchanged or have declined, because some portion of Fidelity's costs are attributable to services provided to all Fidelity funds, and all funds benefit if those costs can be allocated among more assets. The Board concluded that, given the group fee structure, fund shareholders will benefit from lower management fees as assets under FMR's management increase at the fund complex level, regardless of whether Fidelity achieves any such economies of scale.
The Board concluded, considering the findings of the Economies of Scale Committee, that any potential economies of scale are being appropriately shared between fund shareholders and Fidelity.
Additional Information Requested by the Board. In order to develop fully the factual basis for consideration of the Fidelity funds' Advisory Contracts, the Board requested and received additional information on certain topics, including (i) fund performance trends, actions to be taken by FMR to improve certain funds' overall performance, and Fidelity's long-term strategies for certain funds; (ii) portfolio manager changes that have occurred during the past year and length of portfolio manager tenure for different categories of funds over time; (iii) Fidelity's compensation structure for portfolio managers, research analysts, and other key personnel, the rationale for the compensation structure, and how the compensation structure provides appropriate performance incentives; (iv) the amount of the investment that each portfolio manager has made in the Fidelity fund(s) that he or she manages; (v) management and other fees paid by FMR to affiliated sub-advisers on behalf of the Fidelity funds; (vi) Fidelity's fee structures and rationale for recommending different fees among different categories of funds; (vii) Fidelity's rationale for recommending which funds should have a performance adjustment component as part of their management fees; (viii) the rationale for any differences between fund fee structures and fee structures in place for other Fidelity clients; and (ix) explanations regarding the relative total expenses borne by certain funds and classes, total expense competitive trends, and actions that might be taken by FMR to reduce total expenses for certain funds and classes.
Annual Report
Based on its evaluation of all of the conclusions noted above, and after considering all factors it believed relevant, the Board ultimately concluded that the advisory fee structures are fair and reasonable, and that the fund's Advisory Contracts should be renewed.
Annual Report
Managing Your Investments
Fidelity offers several ways to conveniently manage your workplace benefits (including your workplace savings plan, investments, and additional services) via your telephone or PC. You can access your plan and account information and research your investments 24 hours a day.
By Phone
Fidelity provides a single toll-free number to access plan information, account balances, positions, and quotes*. It's easy to navigate the service, and on your first call, the system will help you create a personal identification number (PIN) for security.
(phone_graphic)
Fidelity Workplace Investing
1-800-835-5092
By PC
Fidelity's web site on the Internet provides a wide range of information, including plan information, daily financial news, fund performance, interactive planning tools, and news about Fidelity products and services.
(computer_graphic)
Fidelity's Web Site
www.401k.com
* When you call the quotes line, please remember that a fund's yield and return will vary and, except for money market funds, share price will also vary. This means that you may have a gain or loss when you sell your shares. There is no assurance that money market funds will be able to maintain a stable $1 share price; an investment in a money market fund is not insured or guaranteed by the U.S. government. Total returns are historical and include changes in share price, reinvestment of dividends and capital gains, and the effects of any sales charges.
Annual Report
To Write Fidelity
We'll give your correspondence immediate attention and send you written confirmation upon completion of your request.
(letter_graphic)
For Non-Retirement
Accounts
Buying shares
Fidelity Investments
P.O. Box 770001
Cincinnati, OH 45277-0003
Overnight Express
Fidelity Investments
Attn: Distribution Services
100 Crosby Parkway - KC1H
Covington, KY 41015
Selling shares
Fidelity Investments
P.O. Box 770001
Cincinnati, OH 45277-0035
Overnight Express
Fidelity Investments
Attn: Distribution Services
100 Crosby Parkway - KC1H
Covington, KY 41015
General Correspondence
Fidelity Investments
P.O. Box 500
Merrimack, NH 03054-0500
(letter_graphic)
For Retirement
Accounts
Buying shares
Fidelity Investments
P.O. Box 770001
Cincinnati, OH 45277-0003
Selling shares
Fidelity Investments
P.O. Box 770001
Cincinnati, OH 45277-0035
Overnight Express
Fidelity Investments
Attn: Distribution Services
100 Crosby Parkway - KC1H
Covington, KY 41015
General Correspondence
Fidelity Investments
P.O. Box 500
Merrimack, NH 03054-0500
Annual Report
Investment Adviser
Fidelity Management & Research Company
Boston, MA
Investment Sub-Advisers
FMR Co., Inc.
Fidelity Management & Research (U.K.) Inc.
Fidelity Management & Research
(Hong Kong) Limited
Fidelity Management & Research
(Japan) Inc.
Fidelity Research & Analysis Company
FIL Investment Advisors
FIL Investment Advisors (U.K.) Ltd.
FIL Investments (Japan) Limited
General Distributor
Fidelity Distributors Corporation
Boston, MA
Transfer and Service Agents
Fidelity Investments Institutional
Operations Company, Inc.
Boston, MA
Fidelity Service Company, Inc.
Boston, MA
Custodian
JPMorgan Chase Bank
New York, NY
OVE-K-UANN-1210
1.863317.102
(Fidelity Investment logo)(registered trademark)
Fidelity AdvisorSM
Worldwide Fund
Class A, Class T, Class B, and Class C
Annual Report
October 31, 2010
Class A, Class T, Class B, and Class C are
classes of Fidelity® Worldwide Fund
(2_fidelity_logos) (Registered_Trademark)
Contents
Chairman's Message | <Click Here> | The Chairman's message to shareholders. |
Performance | <Click Here> | How the fund has done over time. |
Management's Discussion of Fund Performance | <Click Here> | The Portfolio Managers' review of fund performance and strategy. |
Shareholder Expense Example | <Click Here> | An example of shareholder expenses. |
Investment Changes | <Click Here> | A summary of major shifts in the fund's investments over the past six months. |
Investments | <Click Here> | A complete list of the fund's investments with their market values. |
Financial Statements | <Click Here> | Statements of assets and liabilities, operations, and changes in net assets, as well as financial highlights. |
Notes | <Click Here> | Notes to the financial statements. |
Report of Independent Registered Public Accounting Firm | <Click Here> | |
Trustees and Officers | <Click Here> | |
Distributions | <Click Here> | |
Board Approval of Investment Advisory Contracts and Management Fees | <Click Here> | |
To view a fund's proxy voting guidelines and proxy voting record for the 12-month period ended June 30, visit http://www.fidelity.com/proxyvotingresults or visit the Securities and Exchange Commission's (SEC) web site at http://www.sec.gov. You may also call 1-877-208-0098 to request a free copy of the proxy voting guidelines.
Standard & Poor's, S&P and S&P 500 are registered service marks of The McGraw-Hill Companies, Inc. and have been licensed for use by Fidelity Distributors Corporation.
Other third party marks appearing herein are the property of their respective owners.
All other marks appearing herein are registered or unregistered trademarks or service marks of FMR LLC or an affiliated company.
This report and the financial statements contained herein are submitted for the general information of the shareholders of the fund. This report is not authorized for distribution to prospective investors in the fund unless preceded or accompanied by an effective prospectus.
A fund files its complete schedule of portfolio holdings with the SEC for the first and third quarters of each fiscal year on Form N-Q. Forms N-Q are available on the SEC's web site at http://www.sec.gov. A fund's Forms N-Q may be reviewed and copied at the SEC's Public Reference Room in Washington, DC. Information regarding the operation of the SEC's Public Reference Room may be obtained by calling 1-800-SEC-0330. For a complete list of a fund's portfolio holdings, view the most recent holdings listing, semiannual report, or annual report on Fidelity's web site at http://www.fidelity.com or http://www.advisor.fidelity.com, as applicable.
NOT FDIC INSURED • MAY LOSE VALUE • NO BANK GUARANTEE
Neither the fund nor Fidelity Distributors Corporation is a bank.
Annual Report
(photo_of_Edward_C_Johnson_3d)
Dear Shareholder:
Equities have staged a rally in the second half of 2010, shaking off concerns about the European debt crisis and the possibility of a double-dip recession in the U.S. Although the short-term surge pushed major equity indexes back into positive territory for the year, several questions remain about the longer-term outlook, including lackluster economic growth and persistently high unemployment. Financial markets are always unpredictable, of course, but there also are several time-tested investment principles that can help put the odds in your favor.
One of the basic tenets is to invest for the long term. Over time, riding out the markets' inevitable ups and downs has proven much more effective than selling into panic or chasing the hottest trend. Even missing only a few of the markets' best days can significantly diminish investor returns. Patience also affords the benefits of compounding - of earning interest on additional income or reinvested dividends and capital gains. There can be tax advantages and cost benefits to consider as well. While staying the course doesn't eliminate risk, it can considerably lessen the effect of short-term declines.
You can further manage your investing risk through diversification. And today, more than ever, geographic diversification should be taken into account. Studies indicate that asset allocation is the single most important determinant of a portfolio's long-term success. The right mix of stocks, bonds and cash - aligned to your particular risk tolerance and investment objective - is very important. Age-appropriate rebalancing is also an essential aspect of asset allocation. For younger investors, an emphasis on equities - which historically have been the best-performing asset class over time - is encouraged. As investors near their specific goal, such as retirement or sending a child to college, consideration may be given to replacing volatile assets (e.g. common stocks) with more-stable fixed investments (bonds or savings plans).
A third principle - investing regularly - can help lower the average cost of your purchases. Investing a certain amount of money each month or quarter helps ensure you won't pay for all your shares at market highs. This strategy - known as dollar cost averaging - also reduces "emotion" from investing, helping shareholders avoid selling weak performers just prior to an upswing, or chasing a hot performer just before a correction.
We invite you to contact us via the Internet, through our Investor Centers or by phone. It is our privilege to provide you the information you need to make the investments that are right for you.
Sincerely,
(The chairman's signature appears here.)
Edward C. Johnson 3d
Annual Report
Performance: The Bottom Line
Average annual total return reflects the change in the value of an investment, assuming reinvestment of the class' distributions from dividend income and capital gains (the profits earned upon the sale of securities that have grown in value, if any) and assuming a constant rate of performance each year. The $10,000 table and the fund's returns do not reflect the deduction of taxes that a shareholder would pay on fund distributions or the redemption of fund shares. During periods of reimbursement by Fidelity, a fund's total return will be greater than it would be had the reimbursement not occurred. How a fund did yesterday is no guarantee of how it will do tomorrow.
Average Annual Total Returns
Periods ended October 31, 2010 | Past 1
year | Past 5
years | Past 10 years |
Class A (incl. 5.75% sales charge) A | 11.07% | 3.61% | 3.53% |
Class T (incl. 3.50% sales charge) B | 13.41% | 4.01% | 3.73% |
Class B (incl. contingent deferred sales charge) C | 11.92% | 4.27% | 4.02% |
Class C (incl. contingent deferred sales charge) D | 15.94% | 4.58% | 4.02% |
A Class A shares bear a 0.25% 12b-1 fee. The initial offering of Class A took place on February 19, 2009. Returns prior to February 19, 2009 are those of Fidelity Worldwide Fund, the original class of the fund, which does not bear a 12b-1 fee. Had Class A shares' 12b-1 fee been reflected, returns prior to February 19, 2009 would have been lower.
B Class T shares bear a 0.50% 12b-1 fee. The initial offering of Class T took place on February 19, 2009. Returns prior to February 19, 2009 are those of Fidelity Worldwide Fund, the original class of the fund, which does not bear a 12b-1 fee. Had Class T shares' 12b-1 fee been reflected, returns prior to February 19, 2009 would have been lower.
C Class B shares bear a 1.00% 12b-1 fee. The initial offering of Class B took place on February 19, 2009. Returns prior to February 19, 2009 are those of Fidelity Worldwide Fund, the original class of the fund, which does not bear a 12b-1 fee. Had Class B shares' 12b-1 fee been reflected, returns prior to February 19, 2009 would have been lower. Class B shares' contingent deferred sales charges included in the past one year, past five years, and past ten years total return figures are 5%, 2%, and 0%, respectively.
D Class C shares bear a 1.00% 12b-1 fee. The initial offering of Class C took place on February 19, 2009. Returns prior to February 19, 2009 are those of Fidelity Worldwide Fund, the original class of the fund, which does not bear a 12b-1 fee. Had Class C shares' 12b-1 fee been reflected, returns prior to February 19, 2009 would have been lower. Class C shares' contingent deferred sales charges included in the past one year, past five years, and past ten years total return figures are 1%, 0%, and 0%, respectively.
$10,000 Over 10 Years
Let's say hypothetically that $10,000 was invested in Fidelity Advisor Worldwide Fund - Class A, a class of the fund, on October 31, 2000, and the current 5.75% sales charge was paid. The chart shows how the value of your investment would have changed, and also shows how the MSCI® World Index performed over the same period. The initial offering of Class A took place on February 19, 2009. See above for additional information regarding the performance of Class A.
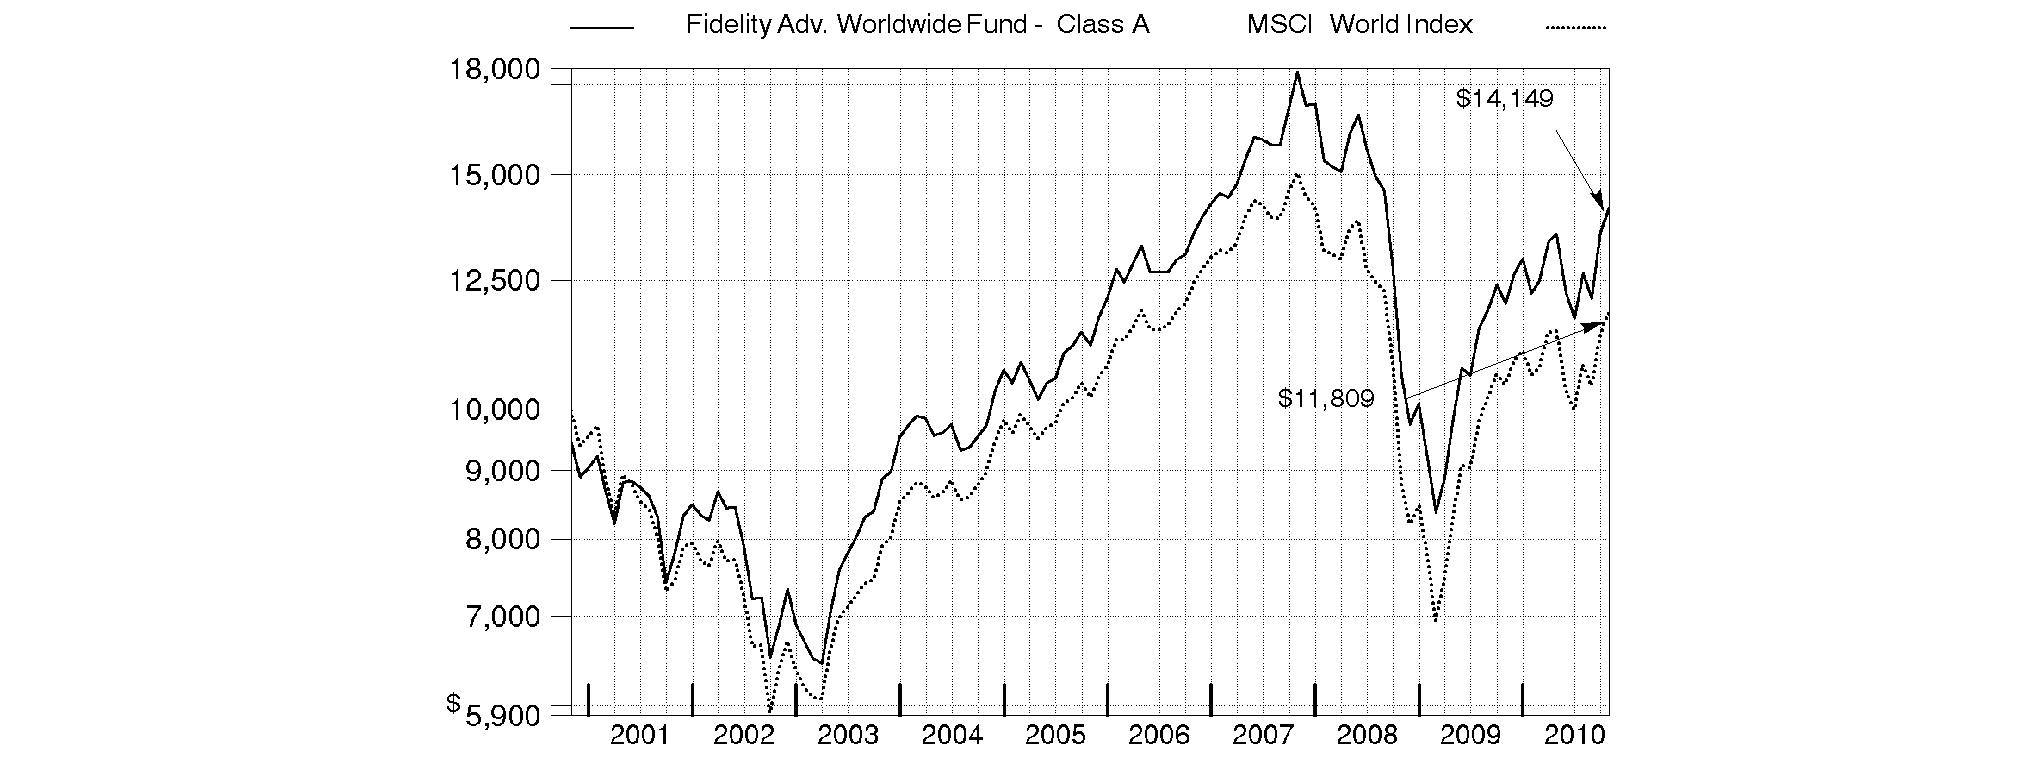
Annual Report
Market Recap: Developed-markets equities rode a wave of volatility during the 12 months ending October 31, 2010, en route to producing above-average gains. Stocks posted solid advances in the first half of the period, despite growing concerns about the Greece-led European debt crisis. Sentiment turned decidedly negative in May and June, however, and the market suffered a precipitous decline. These losses were more than offset during the last four months of the period, when signs of economic growth and subsiding debt fears helped propel developed-world stocks about 18%. For the full year, the MSCI® World Index gained 13.15%, boosted in part by a generally depreciating U.S. dollar. Within the index, Canada and the United States were standouts, returning 23% and 17%, respectively. U.S. stocks - which comprised almost half of the index - were lifted by economic optimism, encouraging earnings reports and a wave of corporate mergers. The Pacific Basin ex-Japan segment rose 15% for the period, aided in part by solid results from Hong Kong. Elsewhere, the U.K. returned 13%, while the remainder of Europe rose just 7%, held back mainly by debt-riddled Spain and Italy, as well as lagging major constituent France. Japan advanced only 5%, a result of that nation's continued weak economy.
Comments from William Kennedy, Lead Portfolio Manager of Fidelity AdvisorSM Worldwide Fund and manager of its non-U.S. equity subportfolio, and Stephen DuFour, Co-Portfolio Manager responsible for the fund's U.S. equity subportfolio: For the 12 months ending October 31, 2010, the fund's Class A, Class T, Class B and Class C shares returned 17.85%, 17.53%, 16.92% and 16.94% (excluding sales charge), outpacing the MSCI index. Our focus on reasonably valued stocks with good balance sheets and strong earnings growth prospects helped drive favorable stock selection, especially in the information technology and industrials sectors. U.S. stocks - about 47% of assets, on average - had the biggest positive impact on performance. Good stock picking within strong-performing emerging markets, where the fund had a small out-of-benchmark stake, also contributed, as did favorable positioning in Europe and Japan. Weak security selection and an underweighting in Canada - along with the associated currency drag - disappointing stock selection in energy and a small cash position hampered performance Individual contributors included Cummins, a leading diesel engine manufacturer, and Union Pacific, a West Coast railroad company. Both of these industrials firms benefited from a recovering economy. Within technology, Apple was up sharply, thanks to the successful launch of the iPad and worldwide growth of the iPhone. Untimely ownership of both General Electric, a diversified conglomerate in the industrials sector, and coal company Peabody Energy detracted from results. These stocks were sold from the fund by period end
The views expressed above reflect those of the portfolio manager(s) only through the end of the period as stated on the cover of this report and do not necessarily represent the views of Fidelity or any other person in the Fidelity organization. Any such views are subject to change at any time based upon market or other conditions and Fidelity disclaims any responsibility to update such views. These views may not be relied on as investment advice and, because investment decisions for a Fidelity fund are based on numerous factors, may not be relied on as an indication of trading intent on behalf of any Fidelity fund.
Annual Report
Fidelity Worldwide Fund
As a shareholder of the Fund, you incur two types of costs: (1) transaction costs, including sales charges (loads) on purchase payments or redemption proceeds, redemption fees, and (2) ongoing costs, including management fees, distribution and/or service (12b-1) fees and other Fund expenses. This Example is intended to help you understand your ongoing costs (in dollars) of investing in the Fund and to compare these costs with the ongoing costs of investing in other mutual funds.
The Example is based on an investment of $1,000 invested at the beginning of the period and held for the entire period (May 1, 2010 to October 31, 2010).
Actual Expenses
The first line of the accompanying table for each class of the Fund provides information about actual account values and actual expenses. You may use the information in this line, together with the amount you invested, to estimate the expenses that you paid over the period. Simply divide your account value by $1,000.00 (for example, an $8,600 account value divided by $1,000.00 = 8.6), then multiply the result by the number in the first line for a class of the Fund under the heading entitled "Expenses Paid During Period" to estimate the expenses you paid on your account during this period. A small balance maintenance fee of $12.00 that is charged once a year may apply for certain accounts with a value of less than $2,000. This fee is not included in the table below. If it was, the estimate of expenses you paid during the period would be higher, and your ending account value lower, by this amount. In addition, the Fund, as a shareholder in the underlying Fidelity Central Funds, will indirectly bear its pro-rata share of the fees and expenses incurred by the underlying Fidelity Central Funds. These fees and expenses are not included in the Fund's annualized expense ratio used to calculate the expense estimate in the table below.
Hypothetical Example for Comparison Purposes
The second line of the accompanying table for each class of the Fund provides information about hypothetical account values and hypothetical expenses based on a Class' actual expense ratio and an assumed rate of return of 5% per year before expenses, which is not the Class' actual return. The hypothetical account values and expenses may not be used to estimate the actual ending account balance or expenses you paid for the period. You may use this information to compare the ongoing costs of investing in the Fund and other funds. To do so, compare this 5% hypothetical example with the 5% hypothetical examples that appear in the shareholder reports of the other funds. A small balance maintenance fee of $12.00 that is charged once a year may apply for certain accounts with a value of less than $2,000. This fee is not included in the table below. If it was, the estimate of expenses you paid during the period would be higher, and your ending account value lower, by this amount. In addition, the Fund, as a shareholder in the underlying Fidelity Central Funds, will indirectly bear its pro-rata share of the fees and expenses incurred by the underlying Fidelity Central Funds. These fees and expenses are not included in the Fund's annualized expense ratio used to calculate the expense estimate in the table below.
Please note that the expenses shown in the table are meant to highlight your ongoing costs only and do not reflect any transaction costs. Therefore, the second line of the table is useful in comparing ongoing costs only, and will not help you determine the relative total costs of owning different funds. In addition, if these transactional costs were included, your costs would have been higher.
| Annualized
Expense Ratio | Beginning
Account Value
May 1, 2010 | Ending
Account Value
October 31, 2010 | Expenses Paid
During Period*
May 1, 2010
to October 31, 2010 |
Class A | 1.42% | | | |
Actual | | $ 1,000.00 | $ 1,044.80 | $ 7.32 |
HypotheticalA | | $ 1,000.00 | $ 1,018.05 | $ 7.22 |
Class T | 1.68% | | | |
Actual | | $ 1,000.00 | $ 1,043.60 | $ 8.65 |
HypotheticalA | | $ 1,000.00 | $ 1,016.74 | $ 8.54 |
Class B | 2.17% | | | |
Actual | | $ 1,000.00 | $ 1,040.70 | $ 11.16 |
HypotheticalA | | $ 1,000.00 | $ 1,014.27 | $ 11.02 |
Class C | 2.17% | | | |
Actual | | $ 1,000.00 | $ 1,040.80 | $ 11.16 |
HypotheticalA | | $ 1,000.00 | $ 1,014.27 | $ 11.02 |
Worldwide | 1.11% | | | |
Actual | | $ 1,000.00 | $ 1,045.80 | $ 5.72 |
HypotheticalA | | $ 1,000.00 | $ 1,019.61 | $ 5.65 |
Institutional Class | 1.18% | | | |
Actual | | $ 1,000.00 | $ 1,045.80 | $ 6.08 |
HypotheticalA | | $ 1,000.00 | $ 1,019.26 | $ 6.01 |
A 5% return per year before expenses
* Expenses are equal to each Class' annualized expense ratio, multiplied by the average account value over the period, multiplied by 184/365 (to reflect the one-half year period).
Annual Report
Fidelity Worldwide Fund
Investment Changes (Unaudited)
Geographic Diversification (% of fund's net assets) |
As of October 31, 2010 |
| United States of America | 47.3% | |
| United Kingdom | 10.6% | |
| Japan | 6.1% | |
| Germany | 4.5% | |
| France | 4.4% | |
| Switzerland | 3.9% | |
| Spain | 1.9% | |
| Denmark | 1.9% | |
| India | 1.7% | |
| Other | 17.7% | |

Percentages are adjusted for the effect of futures contracts, if applicable. |
As of April 30, 2010 |
| United States of America | 50.2% | |
| United Kingdom | 9.8% | |
| Japan | 9.1% | |
| France | 4.7% | |
| Switzerland | 3.6% | |
| Germany | 3.3% | |
| Netherlands | 1.8% | |
| Australia | 1.5% | |
| Spain | 1.4% | |
| Other | 14.6% | |

Percentages are adjusted for the effect of futures contracts, if applicable. |
Asset Allocation |
| % of fund's
net assets | % of fund's net assets
6 months ago |
Stocks | 98.2 | 98.6 |
Bonds | 0.2 | 0.0 |
Short-Term Investments and Net Other Assets | 1.6 | 1.4 |
Top Ten Stocks as of October 31, 2010 |
| % of fund's
net assets | % of fund's net assets
6 months ago |
Union Pacific Corp. (United States of America, Road & Rail) | 2.7 | 2.7 |
Cummins, Inc. (United States of America, Machinery) | 2.3 | 2.2 |
Exxon Mobil Corp. (United States of America, Oil, Gas & Consumable Fuels) | 2.0 | 0.0 |
Estee Lauder Companies, Inc. Class A (United States of America, Personal Products) | 1.9 | 0.9 |
Google, Inc. Class A (United States of America, Internet Software & Services) | 1.8 | 0.0 |
Apple, Inc. (United States of America, Computers & Peripherals) | 1.8 | 2.3 |
Perrigo Co. (United States of America, Pharmaceuticals) | 1.5 | 0.4 |
Edwards Lifesciences Corp. (United States of America, Health Care Equipment & Supplies) | 1.3 | 0.6 |
eBay, Inc. (United States of America, Internet Software & Services) | 1.3 | 0.0 |
CSX Corp. (United States of America, Road & Rail) | 1.3 | 0.9 |
| 17.9 | |
Market Sectors as of October 31, 2010 |
| % of fund's
net assets | % of fund's net assets
6 months ago |
Industrials | 17.0 | 15.8 |
Consumer Discretionary | 17.1 | 16.7 |
Information Technology | 15.6 | 15.2 |
Financials | 13.5 | 18.9 |
Health Care | 10.3 | 10.3 |
Energy | 8.4 | 8.8 |
Consumer Staples | 7.0 | 5.6 |
Materials | 6.3 | 4.6 |
Telecommunication Services | 3.0 | 1.9 |
Utilities | 0.2 | 0.8 |
Annual Report
Fidelity Worldwide Fund
Investments October 31, 2010
Showing Percentage of Net Assets
Common Stocks - 96.8% |
| Shares | | Value |
Australia - 1.5% |
Australia & New Zealand Banking Group Ltd. | 244,941 | | $ 5,953,320 |
JB Hi-Fi Ltd. | 75,078 | | 1,462,177 |
Macquarie Group Ltd. | 78,951 | | 2,799,865 |
Newcrest Mining Ltd. | 70,629 | | 2,764,900 |
Wesfarmers Ltd. | 61,452 | | 1,995,076 |
Westfield Group unit | 128,519 | | 1,558,687 |
TOTAL AUSTRALIA | | 16,534,025 |
Bailiwick of Jersey - 0.3% |
Experian PLC | 201,300 | | 2,339,830 |
Informa PLC | 111,595 | | 779,533 |
TOTAL BAILIWICK OF JERSEY | | 3,119,363 |
Belgium - 0.6% |
Anheuser-Busch InBev SA NV | 98,425 | | 6,167,699 |
EVS Broadcast Equipment SA | 13,200 | | 828,358 |
TOTAL BELGIUM | | 6,996,057 |
Bermuda - 0.5% |
Huabao International Holdings Ltd. | 1,495,000 | | 2,252,746 |
Li & Fung Ltd. | 258,000 | | 1,363,019 |
Noble Group Ltd. | 1,474,363 | | 2,118,763 |
Sihuan Pharmaceutical Holdings Group Ltd. | 53,000 | | 38,496 |
TOTAL BERMUDA | | 5,773,024 |
Brazil - 1.0% |
Banco ABC Brasil SA | 60,000 | | 591,112 |
Banco Santander (Brasil) SA ADR | 102,900 | | 1,481,760 |
Cia Hering SA | 4,000 | | 196,920 |
Diagnosticos da America SA | 135,000 | | 1,666,471 |
Drogasil SA | 85,300 | | 2,157,571 |
Hypermarcas SA (a) | 13,000 | | 213,967 |
Lojas Renner SA | 7,000 | | 276,511 |
Natura Cosmeticos SA | 7,000 | | 200,388 |
Souza Cruz Industria Comerico | 85,300 | | 4,382,832 |
TOTAL BRAZIL | | 11,167,532 |
British Virgin Islands - 0.7% |
HLS Systems International Ltd. (a) | 67,343 | | 851,216 |
Playtech Ltd. | 200,359 | | 1,437,301 |
UTI Worldwide, Inc. | 303,000 | | 5,823,660 |
TOTAL BRITISH VIRGIN ISLANDS | | 8,112,177 |
Canada - 1.5% |
Agrium, Inc. | 20,000 | | 1,769,193 |
Dollarama, Inc. | 72,209 | | 1,903,106 |
First Quantum Minerals Ltd. | 13,800 | | 1,208,430 |
InterOil Corp. (a) | 13,400 | | 953,812 |
Keyera Facilities Income Fund | 99,000 | | 3,072,213 |
Niko Resources Ltd. | 26,700 | | 2,547,220 |
Open Text Corp. (a) | 41,800 | | 1,849,217 |
|
| Shares | | Value |
Pan American Silver Corp. | 45,500 | | $ 1,452,360 |
Petrobank Energy & Resources Ltd. (a) | 46,800 | | 1,862,547 |
TOTAL CANADA | | 16,618,098 |
Cayman Islands - 1.5% |
Belle International Holdings Ltd. | 505,000 | | 912,111 |
Bosideng International Holdings Ltd. | 4,572,000 | | 2,312,174 |
China Lodging Group Ltd. ADR | 36,400 | | 884,884 |
Ctrip.com International Ltd. sponsored ADR (a) | 27,200 | | 1,416,304 |
Eurasia Drilling Co. Ltd. GDR (d) | 27,400 | | 698,700 |
Evergreen International Holdings Ltd. (a) | 58,000 | | 34,420 |
Hengdeli Holdings Ltd. | 4,104,000 | | 2,276,691 |
Herbalife Ltd. | 26,000 | | 1,660,360 |
Mongolian Mining Corp. | 1,526,000 | | 1,651,752 |
Perfect World Co. Ltd. sponsored ADR Class B (a) | 50,200 | | 1,626,480 |
Shenguan Holdings Group Ltd. | 1,148,000 | | 1,495,862 |
TPK Holdings Co. | 3,000 | | 49,502 |
Want Want China Holdings Ltd. | 2,043,000 | | 1,884,528 |
TOTAL CAYMAN ISLANDS | | 16,903,768 |
China - 0.6% |
Baidu.com, Inc. sponsored ADR (a) | 17,900 | | 1,969,179 |
China Merchants Bank Co. Ltd. (H Shares) | 1,000,500 | | 2,839,671 |
Comba Telecom Systems Holdings Ltd. | 408,980 | | 464,315 |
Minth Group Ltd. | 238,000 | | 445,218 |
Zhaojin Mining Industry Co. Ltd. (H Shares) | 255,500 | | 794,394 |
ZTE Corp. (H Shares) | 128,376 | | 476,985 |
TOTAL CHINA | | 6,989,762 |
Cyprus - 0.0% |
Aisi Realty Public Ltd. (a) | 1,232,268 | | 34,550 |
Denmark - 1.9% |
Carlsberg AS Series B | 37,700 | | 4,122,371 |
Novo Nordisk AS Series B | 94,116 | | 9,880,512 |
Pandora A/S | 41,900 | | 2,032,804 |
William Demant Holding AS (a) | 58,200 | | 4,362,475 |
TOTAL DENMARK | | 20,398,162 |
Egypt - 0.1% |
Orascom Construction Industries SAE GDR | 24,600 | | 1,138,980 |
France - 4.4% |
Accor SA | 39,500 | | 1,619,463 |
Atos Origin SA (a) | 65,745 | | 3,039,452 |
AXA SA | 119,037 | | 2,166,493 |
BNP Paribas SA | 53,888 | | 3,940,328 |
Carrefour SA | 53,867 | | 2,906,687 |
Compagnie Generale de Geophysique SA (a) | 58,200 | | 1,359,134 |
Edenred (a) | 59,000 | | 1,235,538 |
Essilor International SA | 30,396 | | 2,029,291 |
Common Stocks - continued |
| Shares | | Value |
France - continued |
GDF Suez | 41,100 | | $ 1,640,169 |
Iliad Group SA | 27,158 | | 3,057,130 |
LVMH Moet Hennessy - Louis Vuitton | 42,788 | | 6,703,907 |
Pernod-Ricard SA | 21,114 | | 1,871,741 |
PPR SA | 36,550 | | 5,991,013 |
Sanofi-Aventis | 15,104 | | 1,057,944 |
Schneider Electric SA | 32,065 | | 4,550,918 |
Societe Generale Series A | 64,751 | | 3,876,457 |
Unibail-Rodamco | 6,389 | | 1,330,829 |
TOTAL FRANCE | | 48,376,494 |
Germany - 3.1% |
Bayerische Motoren Werke AG (BMW) | 121,009 | | 8,673,149 |
Fresenius Medical Care AG & Co. KGaA | 53,500 | | 3,407,237 |
GEA Group AG | 110,697 | | 2,894,211 |
HeidelbergCement AG | 11,766 | | 615,334 |
Kabel Deutschland Holding AG | 68,500 | | 3,083,895 |
MAN SE | 45,742 | | 5,028,169 |
Metro AG | 23,500 | | 1,646,725 |
PSI AG | 69,000 | | 1,515,999 |
Siemens AG | 59,514 | | 6,797,107 |
Software AG (Bearer) | 6,000 | | 840,714 |
TOTAL GERMANY | | 34,502,540 |
Greece - 0.1% |
Coca-Cola Hellenic Bottling Co. SA | 36,300 | | 939,479 |
Hong Kong - 0.9% |
AIA Group Ltd. | 543,200 | | 1,615,321 |
Henderson Land Development Co. Ltd. | 204,232 | | 1,450,472 |
I.T Ltd. | 1,134,000 | | 956,795 |
Techtronic Industries Co. Ltd. | 3,575,500 | | 3,621,051 |
Wharf Holdings Ltd. | 264,000 | | 1,733,604 |
TOTAL HONG KONG | | 9,377,243 |
India - 1.7% |
Adani Enterprises Ltd. | 108,277 | | 1,720,829 |
Gitanjali Gems Ltd. | 135,298 | | 904,886 |
Housing Development Finance Corp. Ltd. | 81,615 | | 1,266,252 |
IndusInd Bank Ltd. | 112,500 | | 669,036 |
INFO Edge India Ltd. | 36,696 | | 563,252 |
Infrastructure Development Finance Co. Ltd. | 329,354 | | 1,486,458 |
Larsen & Toubro Ltd. | 57,646 | | 2,637,215 |
LIC Housing Finance Ltd. | 108,161 | | 3,271,184 |
Reliance Industries Ltd. | 74,372 | | 1,839,375 |
Rural Electrification Corp. Ltd. | 149,130 | | 1,247,040 |
Shriram Transport Finance Co. Ltd. | 33,464 | | 665,430 |
State Bank of India | 11,744 | | 834,758 |
The Jammu & Kashmir Bank Ltd. | 30,114 | | 618,551 |
Titan Industries Ltd. | 8,771 | | 702,897 |
TOTAL INDIA | | 18,427,163 |
|
| Shares | | Value |
Indonesia - 0.4% |
PT Bank Rakyat Indonesia Tbk | 1,171,000 | | $ 1,493,638 |
PT Tower Bersama Infrastructure Tbk | 514,500 | | 146,794 |
PT XL Axiata Tbk (a) | 3,712,000 | | 2,388,137 |
TOTAL INDONESIA | | 4,028,569 |
Ireland - 0.3% |
Ingersoll-Rand Co. Ltd. | 39,200 | | 1,540,952 |
James Hardie Industries NV unit (a) | 206,041 | | 1,087,961 |
Ryanair Holdings PLC sponsored ADR | 17,000 | | 554,710 |
TOTAL IRELAND | | 3,183,623 |
Israel - 0.1% |
Israel Chemicals Ltd. | 81,400 | | 1,245,073 |
Italy - 0.7% |
Intesa Sanpaolo SpA | 304,069 | | 1,069,377 |
Intesa Sanpaolo SpA (Risparmio Shares) | 347,700 | | 952,616 |
Prysmian SpA | 75,500 | | 1,463,409 |
Saipem SpA | 102,206 | | 4,540,910 |
TOTAL ITALY | | 8,026,312 |
Japan - 6.1% |
ABC-Mart, Inc. | 84,500 | | 2,874,071 |
Asics Corp. | 155,000 | | 1,673,854 |
Canon, Inc. | 72,250 | | 3,325,904 |
Cosmos Pharmaceutical Corp. | 29,500 | | 928,588 |
Denso Corp. | 86,400 | | 2,686,876 |
Don Quijote Co. Ltd. | 53,400 | | 1,459,259 |
eAccess Ltd. | 1,324 | | 965,811 |
Fast Retailing Co. Ltd. | 4,800 | | 628,758 |
Goldcrest Co. Ltd. | 8,680 | | 187,364 |
Honda Motor Co. Ltd. | 94,600 | | 3,410,215 |
JSR Corp. | 126,300 | | 2,186,354 |
Keyence Corp. | 10,400 | | 2,578,352 |
Komatsu Ltd. | 99,000 | | 2,419,702 |
Mazda Motor Corp. | 807,000 | | 2,050,949 |
Misumi Group, Inc. | 46,300 | | 992,513 |
Mitsubishi Corp. | 107,700 | | 2,586,919 |
Mitsubishi UFJ Financial Group, Inc. | 691,500 | | 3,209,254 |
Mitsui & Co. Ltd. | 120,900 | | 1,901,444 |
Mizuho Financial Group, Inc. | 985,000 | | 1,428,564 |
Nichi-iko Pharmaceutical Co. Ltd. | 64,000 | | 2,257,139 |
Nintendo Co. Ltd. | 4,700 | | 1,217,783 |
Omron Corp. | 75,900 | | 1,761,914 |
ORIX Corp. | 66,920 | | 6,104,048 |
Osaka Securities Exchange Co. Ltd. | 101 | | 508,326 |
Rakuten, Inc. | 4,389 | | 3,381,608 |
Ricoh Co. Ltd. | 164,000 | | 2,294,133 |
Sawai Pharmaceutical Co. Ltd. | 9,100 | | 794,992 |
SOFTBANK CORP. | 220,500 | | 7,081,363 |
Sony Financial Holdings, Inc. | 381 | | 1,325,711 |
Common Stocks - continued |
| Shares | | Value |
Japan - continued |
Start Today Co. Ltd. | 392 | | $ 1,219,307 |
Sumitomo Mitsui Financial Group, Inc. | 63,100 | | 1,883,393 |
TOTAL JAPAN | | 67,324,468 |
Korea (South) - 0.8% |
Hyundai Motor Co. | 10,383 | | 1,569,684 |
Kia Motors Corp. | 57,390 | | 2,291,517 |
NCsoft Corp. | 5,052 | | 1,111,934 |
NHN Corp. (a) | 6,568 | | 1,165,243 |
Samsung Electronics Co. Ltd. | 1,927 | | 1,276,669 |
Shinhan Financial Group Co. Ltd. | 22,350 | | 865,578 |
TOTAL KOREA (SOUTH) | | 8,280,625 |
Luxembourg - 0.1% |
Millicom International Cellular SA | 15,000 | | 1,419,000 |
Mauritius - 0.2% |
MakeMyTrip Ltd. | 48,400 | | 1,749,660 |
Mexico - 0.2% |
Wal-Mart de Mexico SA de CV Series V | 831,200 | | 2,273,425 |
Netherlands - 1.5% |
AEGON NV (a) | 192,700 | | 1,220,981 |
CNH Global NV (a) | 29,000 | | 1,151,010 |
Gemalto NV | 38,267 | | 1,742,229 |
ING Groep NV (Certificaten Van Aandelen) unit (a) | 279,400 | | 2,988,464 |
Koninklijke Philips Electronics NV | 124,481 | | 3,796,006 |
LyondellBasell Industries NV Class A (a) | 203,000 | | 5,452,580 |
Randstad Holdings NV (a) | 10,195 | | 485,155 |
TOTAL NETHERLANDS | | 16,836,425 |
Norway - 0.8% |
Aker Solutions ASA | 102,200 | | 1,555,858 |
DnB NOR ASA | 278,200 | | 3,817,398 |
Telenor ASA | 83,600 | | 1,347,605 |
Yara International ASA | 33,200 | | 1,745,191 |
TOTAL NORWAY | | 8,466,052 |
Poland - 0.1% |
Eurocash SA | 106,300 | | 977,025 |
Qatar - 0.1% |
Commercial Bank of Qatar GDR (Reg. S) | 279,659 | | 1,281,444 |
Singapore - 0.2% |
Keppel Corp. Ltd. | 234,000 | | 1,804,311 |
South Africa - 1.1% |
African Rainbow Minerals Ltd. | 33,000 | | 841,883 |
AngloGold Ashanti Ltd. sponsored ADR | 44,700 | | 2,105,817 |
Clicks Group Ltd. | 425,706 | | 2,777,248 |
Mr Price Group Ltd. | 201,100 | | 1,827,542 |
Sanlam Ltd. | 389,600 | | 1,460,503 |
|
| Shares | | Value |
Standard Bank Group Ltd. | 72,700 | | $ 1,072,071 |
Woolworths Holdings Ltd. | 542,336 | | 2,125,199 |
TOTAL SOUTH AFRICA | | 12,210,263 |
Spain - 1.9% |
Antena 3 Television SA | 118,200 | | 1,207,205 |
Banco Bilbao Vizcaya Argentaria SA | 227,085 | | 2,990,962 |
Banco Santander SA | 477,562 | | 6,128,223 |
Gestevision Telecinco SA | 125,500 | | 1,600,631 |
Inditex SA (c) | 21,397 | | 1,786,669 |
Prosegur Compania de Seguridad SA (Reg.) | 25,800 | | 1,545,829 |
Telefonica SA | 197,595 | | 5,338,170 |
TOTAL SPAIN | | 20,597,689 |
Sweden - 0.9% |
Elekta AB (B Shares) | 119,900 | | 4,536,446 |
H&M Hennes & Mauritz AB (B Shares) | 72,098 | | 2,540,091 |
Modern Times Group MTG AB (B Shares) | 32,200 | | 2,308,881 |
TOTAL SWEDEN | | 9,385,418 |
Switzerland - 3.9% |
Adecco SA (Reg.) | 13,014 | | 727,150 |
Compagnie Financiere Richemont SA Series A | 38,215 | | 1,905,412 |
Credit Suisse Group | 34,493 | | 1,427,527 |
Kuehne & Nagel International AG | 10,620 | | 1,313,002 |
Lonza Group AG | 18,865 | | 1,651,059 |
Nestle SA | 155,400 | | 8,509,229 |
Novartis AG | 145,299 | | 8,416,456 |
Partners Group Holding | 9,538 | | 1,744,136 |
Schindler Holding AG (participation certificate) | 12,684 | | 1,359,437 |
Sonova Holding AG Class B | 11,956 | | 1,384,654 |
Syngenta AG sponsored ADR | 75,000 | | 4,153,500 |
The Swatch Group AG (Bearer) | 9,810 | | 3,748,200 |
UBS AG (a) | 192,640 | | 3,271,483 |
Zurich Financial Services AG | 13,722 | | 3,358,185 |
TOTAL SWITZERLAND | | 42,969,430 |
Taiwan - 0.3% |
HTC Corp. | 126,150 | | 2,848,216 |
Thailand - 0.2% |
Bangkok Bank Public Co. Ltd. (For. Reg.) | 467,000 | | 2,409,870 |
Turkey - 0.4% |
Boyner Buyuk Magazacilik AS (a) | 386,000 | | 898,864 |
Dogus Otomotiv Servis ve Ticaret AS (a) | 158,000 | | 1,189,709 |
Turkiye Garanti Bankasi AS | 371,000 | | 2,276,232 |
TOTAL TURKEY | | 4,364,805 |
United Kingdom - 10.6% |
Aberdeen Asset Management PLC | 653,342 | | 1,861,125 |
Aegis Group PLC | 684,232 | | 1,377,977 |
Anglo American PLC (United Kingdom) | 87,218 | | 4,063,532 |
AstraZeneca PLC (United Kingdom) | 98,174 | | 4,937,722 |
Common Stocks - continued |
| Shares | | Value |
United Kingdom - continued |
Barclays PLC | 1,108,831 | | $ 4,872,084 |
BG Group PLC | 45,448 | | 885,060 |
BHP Billiton PLC | 293,276 | | 10,388,003 |
BP PLC | 1,345,000 | | 9,141,048 |
British American Tobacco PLC (United Kingdom) | 17,600 | | 670,411 |
British Land Co. PLC | 128,755 | | 1,051,021 |
Britvic PLC | 295,400 | | 2,283,079 |
Burberry Group PLC | 132,500 | | 2,163,183 |
Carphone Warehouse Group PLC | 852,279 | | 4,157,883 |
Cookson Group PLC (a) | 82,570 | | 681,291 |
Dialog Semiconductor PLC (a) | 25,000 | | 456,048 |
GlaxoSmithKline PLC | 343,200 | | 6,701,011 |
HSBC Holdings PLC (United Kingdom) | 643,709 | | 6,698,656 |
IG Group Holdings PLC | 354,329 | | 3,000,232 |
InterContinental Hotel Group PLC | 115,278 | | 2,226,098 |
International Personal Finance PLC | 517,515 | | 2,578,615 |
International Power PLC | 213,071 | | 1,424,544 |
Legal & General Group PLC | 996,089 | | 1,602,268 |
Lloyds Banking Group PLC (a) | 2,775,954 | | 3,050,734 |
Micro Focus International PLC | 116,800 | | 714,467 |
Ocado Group PLC (a) | 898,900 | | 2,011,921 |
Reckitt Benckiser Group PLC | 77,341 | | 4,325,764 |
Rio Tinto PLC | 81,540 | | 5,295,383 |
Royal Dutch Shell PLC Class B | 323,756 | | 10,359,427 |
Schroders PLC | 85,800 | | 2,170,564 |
SuperGroup PLC | 11,000 | | 199,147 |
TalkTalk Telecom Group PLC (a) | 964,758 | | 2,038,761 |
Ultra Electronics Holdings PLC | 32,400 | | 966,039 |
Vodafone Group PLC | 1,916,500 | | 5,238,297 |
Vodafone Group PLC sponsored ADR | 47,212 | | 1,298,802 |
Wolseley PLC (a) | 75,760 | | 2,018,531 |
Xstrata PLC | 173,300 | | 3,358,208 |
TOTAL UNITED KINGDOM | | 116,266,936 |
United States of America - 45.5% |
Amazon.com, Inc. (a) | 47,800 | | 7,893,692 |
Ameriprise Financial, Inc. | 110,000 | | 5,685,900 |
AMETEK, Inc. | 85,000 | | 4,594,250 |
Anadarko Petroleum Corp. | 156,000 | | 9,604,920 |
AnnTaylor Stores Corp. (a) | 61,000 | | 1,421,300 |
Apple, Inc. (a) | 64,600 | | 19,436,202 |
Ardea Biosciences, Inc. (a) | 33,058 | | 704,797 |
AsiaInfo Holdings, Inc. (a) | 39,100 | | 868,802 |
Autoliv, Inc. | 38,000 | | 2,709,400 |
Berkshire Hathaway, Inc. Class B (a) | 134,000 | | 10,661,040 |
BioMarin Pharmaceutical, Inc. (a) | 124,000 | | 3,243,840 |
Broadcom Corp. Class A | 140,000 | | 5,703,600 |
C.H. Robinson Worldwide, Inc. | 66,000 | | 4,651,680 |
Caterpillar, Inc. | 86,000 | | 6,759,600 |
Celanese Corp. Class A | 18,000 | | 641,700 |
CF Industries Holdings, Inc. | 15,200 | | 1,862,456 |
Chevron Corp. | 102,000 | | 8,426,220 |
|
| Shares | | Value |
Citi Trends, Inc. (a) | 53,000 | | $ 1,111,940 |
Citrix Systems, Inc. (a) | 82,000 | | 5,253,740 |
Cloud Peak Energy, Inc. | 137,000 | | 2,379,690 |
Cognizant Technology Solutions Corp. Class A (a) | 161,000 | | 10,495,590 |
CSX Corp. | 224,000 | | 13,764,800 |
Cummins, Inc. | 287,000 | | 25,284,700 |
Danaher Corp. | 13,000 | | 563,680 |
Eaton Corp. | 83,000 | | 7,372,890 |
eBay, Inc. (a) | 476,000 | | 14,189,560 |
Echo Global Logistics, Inc. | 25,000 | | 355,000 |
Edwards Lifesciences Corp. (a) | 228,000 | | 14,571,480 |
Elizabeth Arden, Inc. (a) | 44,547 | | 910,986 |
Emerson Electric Co. | 169,000 | | 9,278,100 |
Endo Pharmaceuticals Holdings, Inc. (a) | 179,000 | | 6,576,460 |
EnerSys (a) | 30,000 | | 790,800 |
Estee Lauder Companies, Inc. Class A | 288,000 | | 20,496,960 |
Exxon Mobil Corp. | 331,000 | | 22,001,570 |
Ford Motor Co. (a) | 180,000 | | 2,543,400 |
Fossil, Inc. (a) | 105,900 | | 6,247,041 |
Freeport-McMoRan Copper & Gold, Inc. | 92,300 | | 8,738,964 |
G-III Apparel Group Ltd. (a) | 147,600 | | 3,896,640 |
Google, Inc. Class A (a) | 33,000 | | 20,228,670 |
Greenbrier Companies, Inc. (a) | 81,000 | | 1,474,200 |
Hess Corp. | 51,000 | | 3,214,530 |
HMS Holdings Corp. (a) | 30,000 | | 1,803,300 |
Holly Corp. | 33,000 | | 1,080,090 |
Illumina, Inc. (a) | 16,800 | | 912,408 |
ImmunoGen, Inc. (a) | 45,523 | | 374,199 |
Informatica Corp. (a) | 109,970 | | 4,474,679 |
iRobot Corp. (a) | 194,000 | | 4,050,720 |
Isilon Systems, Inc. (a) | 48,000 | | 1,366,560 |
Jos. A. Bank Clothiers, Inc. (a) | 190,500 | | 8,305,800 |
Juniper Networks, Inc. (a) | 69,000 | | 2,234,910 |
M.D.C. Holdings, Inc. | 25,000 | | 643,750 |
Mako Surgical Corp. (a)(c) | 155,300 | | 1,674,134 |
MasterCard, Inc. Class A | 5,000 | | 1,200,300 |
Micromet, Inc. (a) | 100,000 | | 749,000 |
MIPS Technologies, Inc. (a) | 330,000 | | 4,851,000 |
Molycorp, Inc. (c) | 34,000 | | 1,203,600 |
NetApp, Inc. (a) | 15,000 | | 798,750 |
Neurocrine Biosciences, Inc. (a) | 27,895 | | 227,065 |
NII Holdings, Inc. (a) | 101,200 | | 4,231,172 |
NIKE, Inc. Class B | 32,000 | | 2,606,080 |
Oil States International, Inc. (a) | 72,000 | | 3,680,640 |
OpenTable, Inc. (a) | 7,000 | | 429,450 |
Oracle Corp. | 291,000 | | 8,555,400 |
PACCAR, Inc. | 72,000 | | 3,690,720 |
Perrigo Co. | 252,000 | | 16,601,760 |
Phillips-Van Heusen Corp. | 149,900 | | 9,194,866 |
Precision Castparts Corp. | 27,000 | | 3,687,660 |
Prestige Brands Holdings, Inc. (a) | 179,000 | | 1,924,250 |
Public Storage | 32,000 | | 3,175,040 |
Common Stocks - continued |
| Shares | | Value |
United States of America - continued |
QUALCOMM, Inc. | 215,000 | | $ 9,702,950 |
Red Hat, Inc. (a) | 38,000 | | 1,605,880 |
Riverbed Technology, Inc. (a) | 42,000 | | 2,416,680 |
Roper Industries, Inc. | 20,000 | | 1,388,600 |
Ross Stores, Inc. | 15,000 | | 884,850 |
Salesforce.com, Inc. (a) | 31,055 | | 3,604,554 |
Sapient Corp. | 95,000 | | 1,250,200 |
Skyworks Solutions, Inc. (a) | 544,000 | | 12,463,040 |
Solera Holdings, Inc. | 20,000 | | 961,000 |
Southwest Airlines Co. | 549,000 | | 7,554,240 |
Stericycle, Inc. (a) | 28,000 | | 2,008,720 |
Steven Madden Ltd. (a) | 21,000 | | 888,300 |
Summer Infant, Inc. (a) | 50,000 | | 400,000 |
Susser Holdings Corp. (a) | 5,000 | | 68,350 |
SVB Financial Group (a) | 72,730 | | 3,152,118 |
Targacept, Inc. (a) | 53,000 | | 1,312,280 |
Tenneco, Inc. (a) | 37,000 | | 1,206,940 |
The Mosaic Co. | 20,900 | | 1,529,044 |
Theravance, Inc. (a) | 137,000 | | 2,792,060 |
Titan International, Inc. (c) | 119,000 | | 1,805,230 |
TJX Companies, Inc. | 20,000 | | 917,800 |
TRW Automotive Holdings Corp. (a) | 44,000 | | 2,010,360 |
Union Pacific Corp. | 337,600 | | 29,600,776 |
United Therapeutics Corp. (a) | 12,600 | | 756,000 |
Vera Bradley, Inc. (a) | 1,100 | | 30,085 |
VeriFone Holdings, Inc. (a) | 42,000 | | 1,420,860 |
Virgin Media, Inc. | 160,500 | | 4,081,515 |
VMware, Inc. Class A (a) | 6,000 | | 458,760 |
Volcano Corp. (a) | 123,000 | | 3,003,660 |
Walter Energy, Inc. | 15,900 | | 1,398,564 |
WebMD Health Corp. (a) | 71,726 | | 3,749,835 |
Whiting Petroleum Corp. (a) | 24,000 | | 2,410,560 |
WMS Industries, Inc. (a) | 20,000 | | 872,600 |
ZIOPHARM Oncology, Inc. (a) | 270,000 | | 1,163,700 |
Zix Corp. (a) | 100,000 | | 389,000 |
TOTAL UNITED STATES OF AMERICA | | 499,597,204 |
TOTAL COMMON STOCKS (Cost $913,622,525) | 1,062,954,260 |
Nonconvertible Preferred Stocks - 1.4% |
| | | |
Germany - 1.4% |
ProSiebenSat.1 Media AG | 41,900 | | 1,107,150 |
Volkswagen AG | 91,000 | | 13,675,171 |
TOTAL NONCONVERTIBLE PREFERRED STOCKS (Cost $11,953,393) | 14,782,321 |
Convertible Bonds - 0.2% |
| Principal Amount | | Value |
United States of America - 0.2% |
Newpark Resources, Inc. 4% 10/1/17 | | $ 750,000 | | $ 690,825 |
Volcano Corp. 2.875% 9/1/15 | | 860,000 | | 940,926 |
TOTAL CONVERTIBLE BONDS (Cost $1,610,000) | 1,631,751 |
Money Market Funds - 1.5% |
| Shares | | |
Fidelity Cash Central Fund, 0.23% (b) | 13,142,928 | | 13,142,928 |
Fidelity Securities Lending Cash Central Fund, 0.24% (b)(c) | 3,828,100 | | 3,828,100 |
TOTAL MONEY MARKET FUNDS (Cost $16,971,028) | 16,971,028 |
TOTAL INVESTMENT PORTFOLIO - 99.9% (Cost $944,156,946) | | 1,096,339,360 |
NET OTHER ASSETS (LIABILITIES) - 0.1% | | 1,588,761 |
NET ASSETS - 100% | $ 1,097,928,121 |
Legend |
(a) Non-income producing |
(b) Affiliated fund that is available only to investment companies and other accounts managed by Fidelity Investments. The rate quoted is the annualized seven-day yield of the fund at period end. A complete unaudited listing of the fund's holdings as of its most recent quarter end is available upon request. In addition, each Fidelity Central Fund's financial statements, which are not covered by the Fund's report of Independent Registered Public Accounting Firm, are available on the SEC's website or upon request. |
(c) Security or a portion of the security is on loan at period end. |
(d) Security exempt from registration under Rule 144A of the Securities Act of 1933. These securities may be resold in transactions exempt from registration, normally to qualified institutional buyers. At the end of the period, the value of these securities amounted to $698,700 or 0.1% of net assets. |
Affiliated Central Funds |
Information regarding fiscal year to date income earned by the Fund from investments in Fidelity Central Funds is as follows: |
Fund | Income earned |
Fidelity Cash Central Fund | $ 33,659 |
Fidelity Securities Lending Cash Central Fund | 257,400 |
Total | $ 291,059 |
Other Information |
The following is a summary of the inputs used, as of October 31, 2010, involving the Fund's assets and liabilities carried at fair value. The inputs or methodology used for valuing securities may not be an indication of the risk associated with investing in those securities. For more information on valuation inputs, and their aggregation into the levels used in the tables below, please refer to the Security Valuation section in the accompanying Notes to Financial Statements. |
Valuation Inputs at Reporting Date: |
Description | Total | Level 1 | Level 2 | Level 3 |
Investments in Securities: | | | | |
Equities: | | | | |
United States of America | $ 499,597,204 | $ 499,597,204 | $ - | $ - |
United Kingdom | 116,266,936 | 46,688,062 | 69,578,874 | - |
Japan | 67,324,468 | 32,416,994 | 34,907,474 | - |
Germany | 49,284,861 | 39,080,517 | 10,204,344 | - |
France | 48,376,494 | 45,959,416 | 2,417,078 | - |
Switzerland | 42,969,430 | 29,853,964 | 13,115,466 | - |
Spain | 20,597,689 | 6,140,334 | 14,457,355 | - |
Denmark | 20,398,162 | 10,517,650 | 9,880,512 | - |
India | 18,427,163 | 18,427,163 | - | - |
Cyprus | 34,550 | - | - | 34,550 |
Other | 194,459,624 | 186,419,753 | 8,039,871 | - |
Corporate Bonds | 1,631,751 | - | 1,631,751 | - |
Money Market Funds | 16,971,028 | 16,971,028 | - | - |
Total Investments in Securities: | $ 1,096,339,360 | $ 932,072,085 | $ 164,232,725 | $ 34,550 |
The following is a reconciliation of Investments in Securities for which Level 3 inputs were used in determining value: |
Investments in Securities: | |
Beginning Balance | $ - |
Total Realized Gain (Loss) | - |
Total Unrealized Gain (Loss) | (36,260) |
Cost of Purchases | - |
Proceeds of Sales | - |
Amortization/Accretion | - |
Transfers in to Level 3 | 70,810 |
Transfers out of Level 3 | - |
Ending Balance | $ 34,550 |
The change in unrealized gain (loss) for the period attributable to Level 3 securities held at October 31, 2010 | $ (36,260) |
The information used in the above reconciliation represents fiscal year to date activity for any Investments in Securities identified as using Level 3 inputs at either the beginning or the end of the current fiscal period. Transfers in or out of Level 3 represent the beginning value of any Security or Instrument where a change in the pricing level occurred from the beginning to the end of the period. The cost of purchases and the proceeds of sales may include securities received or delivered through corporate actions or exchanges. Realized and unrealized gains (losses) disclosed in the reconciliation are included in Net Gain (Loss) on the Fund's Statement of Operations. |
Income Tax Information |
At October 31, 2010, the Fund had a capital loss carryforward of approximately $165,341,843 of which $21,859,750 and $143,482,093 will expire on October 31, 2016 and 2017, respectively. Capital loss carryforwards are only available to offset future capital gains of the Fund to the extent provided by regulations and may be limited. |
See accompanying notes which are an integral part of the financial statements.
Annual Report
Fidelity Worldwide Fund
Statement of Assets and Liabilities
| October 31, 2010 |
| | |
Assets | | |
Investment in securities, at value (including securities loaned of $3,745,161) - See accompanying schedule: Unaffiliated issuers (cost $927,185,918) | $ 1,079,368,332 | |
Fidelity Central Funds (cost $16,971,028) | 16,971,028 | |
Total Investments (cost $944,156,946) | | $ 1,096,339,360 |
Cash | | 1 |
Receivable for investments sold | | 28,129,502 |
Receivable for fund shares sold | | 823,725 |
Dividends receivable | | 1,062,804 |
Interest receivable | | 4,914 |
Distributions receivable from Fidelity Central Funds | | 6,115 |
Other receivables | | 273,028 |
Total assets | | 1,126,639,449 |
| | |
Liabilities | | |
Payable for investments purchased | $ 22,295,156 | |
Payable for fund shares redeemed | 1,004,722 | |
Accrued management fee | 654,093 | |
Distribution and service plan fees payable | 2,780 | |
Other affiliated payables | 259,457 | |
Other payables and accrued expenses | 667,020 | |
Collateral on securities loaned, at value | 3,828,100 | |
Total liabilities | | 28,711,328 |
| | |
Net Assets | | $ 1,097,928,121 |
Net Assets consist of: | | |
Paid in capital | | $ 1,119,079,477 |
Undistributed net investment income | | 4,480,160 |
Accumulated undistributed net realized gain (loss) on investments and foreign currency transactions | | (177,294,491) |
Net unrealized appreciation (depreciation) on investments and assets and liabilities in foreign currencies | | 151,662,975 |
Net Assets | | $ 1,097,928,121 |
Statement of Assets and Liabilities - continued
| October 31, 2010 |
| | |
Calculation of Maximum Offering Price Class A:
Net Asset Value and redemption price per share ($7,530,175 ÷ 430,387 shares) | | $ 17.50 |
| | |
Maximum offering price per share (100/94.25 of $17.50) | | $ 18.57 |
Class T:
Net Asset Value and redemption price per share ($1,120,118 ÷ 64,167 shares) | | $ 17.46 |
| | |
Maximum offering price per share (100/96.50 of $17.46) | | $ 18.09 |
Class B:
Net Asset Value and offering price per share ($305,259 ÷ 17,554 shares)A | | $ 17.39 |
| | |
Class C:
Net Asset Value and offering price per share ($709,608 ÷ 40,879 shares)A | | $ 17.36 |
| | |
| | |
Worldwide:
Net Asset Value, offering price and redemption price per share ($1,087,928,252 ÷ 61,872,662 shares) | | $ 17.58 |
| | |
Institutional Class:
Net Asset Value, offering price and redemption price per share ($334,709 ÷ 19,050 shares) | | $ 17.57 |
A Redemption price per share is equal to net asset value less any applicable contingent deferred sales charge.
See accompanying notes which are an integral part of the financial statements.
Annual Report
Fidelity Worldwide Fund
Financial Statements - continued
Statement of Operations
| Year ended October 31, 2010 |
Investment Income | | |
Dividends | | $ 17,385,889 |
Interest | | 56,807 |
Income from Fidelity Central Funds | | 291,059 |
Income before foreign taxes withheld | | 17,733,755 |
Less foreign taxes withheld | | (1,004,412) |
Total income | | 16,729,343 |
| | |
Expenses | | |
Management fee
Basic fee | $ 7,318,345 | |
Performance adjustment | 963,702 | |
Transfer agent fees | 2,662,400 | |
Distribution and service plan fees | 20,954 | |
Accounting and security lending fees | 482,070 | |
Custodian fees and expenses | 253,340 | |
Independent trustees' compensation | 5,982 | |
Registration fees | 81,815 | |
Audit | 77,918 | |
Legal | 5,594 | |
Miscellaneous | 14,254 | |
Total expenses before reductions | 11,886,374 | |
Expense reductions | (325,816) | 11,560,558 |
Net investment income (loss) | | 5,168,785 |
Realized and Unrealized Gain (Loss) Net realized gain (loss) on: | | |
Investment securities: | | |
Unaffiliated issuers (net of foreign taxes of $6,310) | 100,622,328 | |
Foreign currency transactions | (292,326) | |
Total net realized gain (loss) | | 100,330,002 |
Change in net unrealized appreciation (depreciation) on: Investment securities (net of increase in deferred foreign taxes of $504,850) | 67,000,721 | |
Assets and liabilities in foreign currencies | (9,475) | |
Total change in net unrealized appreciation (depreciation) | | 66,991,246 |
Net gain (loss) | | 167,321,248 |
Net increase (decrease) in net assets resulting from operations | | $ 172,490,033 |
Statement of Changes in Net Assets
| Year ended
October 31,
2010 | Year ended
October 31,
2009 |
Increase (Decrease) in Net Assets | | |
Operations | | |
Net investment income (loss) | $ 5,168,785 | $ 8,075,049 |
Net realized gain (loss) | 100,330,002 | (130,252,833) |
Change in net unrealized appreciation (depreciation) | 66,991,246 | 233,691,843 |
Net increase (decrease) in net assets resulting from operations | 172,490,033 | 111,514,059 |
Distributions to shareholders from net investment income | (6,419,967) | (11,746,083) |
Distributions to shareholders from net realized gain | (993,213) | - |
Total distributions | (7,413,180) | (11,746,083) |
Share transactions - net increase (decrease) | (61,476,980) | (40,383,349) |
Redemption fees | 31,293 | 26,981 |
Total increase (decrease) in net assets | 103,631,166 | 59,411,608 |
| | |
Net Assets | | |
Beginning of period | 994,296,955 | 934,885,347 |
End of period (including undistributed net investment income of $4,480,160 and undistributed net investment income of $5,696,383, respectively) | $ 1,097,928,121 | $ 994,296,955 |
See accompanying notes which are an integral part of the financial statements.
Annual Report
Financial Highlights - Class A
Years ended October 31, | 2010 | 2009H |
Selected Per-Share Data | | |
Net asset value, beginning of period | $ 14.96 | $ 10.88 |
Income from Investment Operations | | |
Net investment income (loss)E | .03 | (.01) |
Net realized and unrealized gain (loss) | 2.63 | 4.09 |
Total from investment operations | 2.66 | 4.08 |
Distributions from net investment income | (.10) | - |
Distributions from net realized gain | (.02) | - |
Total distributions | (.12) | - |
Redemption fees added to paid in capital E,J | - | - |
Net asset value, end of period | $ 17.50 | $ 14.96 |
Total ReturnB,C,D | 17.85% | 37.50% |
Ratios to Average Net AssetsF,I | | |
Expenses before reductions | 1.43% | 1.52%A |
Expenses net of fee waivers, if any | 1.43% | 1.52%A |
Expenses net of all reductions | 1.41% | 1.49%A |
Net investment income (loss) | .21% | (.06)%A |
Supplemental Data | | |
Net assets, end of period (000 omitted) | $ 7,530 | $ 993 |
Portfolio turnover rateG | 166% | 224% |
A Annualized
B Total returns for periods of less than one year are not annualized.
C Total returns would have been lower had certain expenses not been reduced during the periods shown.
D Total returns do not include the effect of the sales charges.
E Calculated based on average shares outstanding during the period.
F Fees and expenses of the underlying Fidelity Central Funds are not included in the Fund's expense ratio. The Fund indirectly bears its proportionate share of the expenses of any underlying Fidelity Central Funds.
G Amount does not include the portfolio activity of any underlying Fidelity Central Funds.
H For the period February 19, 2009 (commencement of sale of shares) to October 31, 2009.
I Expense ratios reflect operating expenses of the class. Expenses before reductions do not reflect amounts reimbursed by the investment adviser or reductions from brokerage service arrangements or reductions from other expense offset arrangements and do not represent the amount paid by the class during periods when reimbursements or reductions occur. Expense ratios before reductions for start-up periods may not be representative of longer-term operating periods. Expenses net of fee waivers reflect expenses after reimbursement by the investment adviser but prior to reductions from brokerage service arrangements or other expense offset arrangements. Expenses net of all reductions represent the net expenses paid by the class.
J Amount represents less than $.01 per share.
Financial Highlights - Class T
Years ended October 31, | 2010 | 2009H |
Selected Per-Share Data | | |
Net asset value, beginning of period | $ 14.94 | $ 10.88 |
Income from Investment Operations | | |
Net investment income (loss)E | (.01) | (.01) |
Net realized and unrealized gain (loss) | 2.62 | 4.07 |
Total from investment operations | 2.61 | 4.06 |
Distributions from net investment income | (.08) | - |
Distributions from net realized gain | (.02) | - |
Total distributions | (.09)K | - |
Redemption fees added to paid in capital E,J | - | - |
Net asset value, end of period | $ 17.46 | $ 14.94 |
Total ReturnB,C,D | 17.53% | 37.32% |
Ratios to Average Net AssetsF,I | | |
Expenses before reductions | 1.70% | 1.73%A |
Expenses net of fee waivers, if any | 1.70% | 1.73%A |
Expenses net of all reductions | 1.68% | 1.70%A |
Net investment income (loss) | (.05) % | (.08)%A |
Supplemental Data | | |
Net assets, end of period (000 omitted) | $ 1,120 | $ 458 |
Portfolio turnover rateG | 166% | 224% |
A Annualized
B Total returns for periods of less than one year are not annualized.
C Total returns would have been lower had certain expenses not been reduced during the periods shown.
D Total returns do not include the effect of the sales charges.
E Calculated based on average shares outstanding during the period.
F Fees and expenses of the underlying Fidelity Central Funds are not included in the Fund's expense ratio. The Fund indirectly bears its proportionate share of the expenses of any underlying Fidelity Central Funds.
G Amount does not include the portfolio activity of any underlying Fidelity Central Funds.
H For the period February 19, 2009 (commencement of sale of shares) to October 31, 2009.
I Expense ratios reflect operating expenses of the class. Expenses before reductions do not reflect amounts reimbursed by the investment adviser or reductions from brokerage service arrangements or reductions from other expense offset arrangements and do not represent the amount paid by the class during periods when reimbursements or reductions occur. Expense ratios before reductions for start-up periods may not be representative of longer-term operating periods. Expenses net of fee waivers reflect expenses after reimbursement by the investment adviser but prior to reductions from brokerage service arrangements or other expense offset arrangements. Expenses net of all reductions represent the net expenses paid by the class.
J Amount represents less than $.01 per share.
K Total distributions of $.09 per share is comprised of distributions from net investment income of $.075 and distributions from net realized gain of $.015 per share.
See accompanying notes which are an integral part of the financial statements.
Annual Report
Financial Highlights - Class B
Years ended October 31, | 2010 | 2009H |
Selected Per-Share Data | | |
Net asset value, beginning of period | $ 14.89 | $ 10.88 |
Income from Investment Operations | | |
Net investment income (loss)E | (.09) | (.03) |
Net realized and unrealized gain (loss) | 2.61 | 4.04 |
Total from investment operations | 2.52 | 4.01 |
Distributions from net investment income | (.01) | - |
Distributions from net realized gain | (.01) | - |
Total distributions | (.02) | - |
Redemption fees added to paid in capital E,J | - | - |
Net asset value, end of period | $ 17.39 | $ 14.89 |
Total ReturnB,C,D | 16.92% | 36.86% |
Ratios to Average Net AssetsF,I | | |
Expenses before reductions | 2.19% | 2.20%A |
Expenses net of fee waivers, if any | 2.19% | 2.20%A |
Expenses net of all reductions | 2.17% | 2.17%A |
Net investment income (loss) | (.55)% | (.30)%A |
Supplemental Data | | |
Net assets, end of period (000 omitted) | $ 305 | $ 224 |
Portfolio turnover rateG | 166% | 224% |
A Annualized
B Total returns for periods of less than one year are not annualized.
C Total returns would have been lower had certain expenses not been reduced during the periods shown.
D Total returns do not include the effect of the contingent deferred sales charge.
E Calculated based on average shares outstanding during the period.
F Fees and expenses of the underlying Fidelity Central Funds are not included in the Fund's expense ratio. The Fund indirectly bears its proportionate share of the expenses of any underlying Fidelity Central Funds.
G Amount does not include the portfolio activity of any underlying Fidelity Central Funds.
H For the period February 19, 2009 (commencement of sale of shares) to October 31, 2009.
I Expense ratios reflect operating expenses of the class. Expenses before reductions do not reflect amounts reimbursed by the investment adviser or reductions from brokerage service arrangements or reductions from other expense offset arrangements and do not represent the amount paid by the class during periods when reimbursements or reductions occur. Expense ratios before reductions for start-up periods may not be representative of longer-term operating periods. Expenses net of fee waivers reflect expenses after reimbursement by the investment adviser but prior to reductions from brokerage service arrangements or other expense offset arrangements. Expenses net of all reductions represent the net expenses paid by the class.
J Amount represents less than $.01 per share.
Financial Highlights - Class C
Years ended October 31, | 2010 | 2009H |
Selected Per-Share Data | | |
Net asset value, beginning of period | $ 14.89 | $ 10.88 |
Income from Investment Operations | | |
Net investment income (loss)E | (.09) | (.04) |
Net realized and unrealized gain (loss) | 2.61 | 4.05 |
Total from investment operations | 2.52 | 4.01 |
Distributions from net investment income | (.03) | - |
Distributions from net realized gain | (.02) | - |
Total distributions | (.05) | - |
Redemption fees added to paid in capital E,J | - | - |
Net asset value, end of period | $ 17.36 | $ 14.89 |
Total ReturnB,C,D | 16.94% | 36.86% |
Ratios to Average Net AssetsF,I | | |
Expenses before reductions | 2.19% | 2.18%A |
Expenses net of fee waivers, if any | 2.19% | 2.18%A |
Expenses net of all reductions | 2.16% | 2.15%A |
Net investment income (loss) | (.54)% | (.39)%A |
Supplemental Data | | |
Net assets, end of period (000 omitted) | $ 710 | $ 335 |
Portfolio turnover rateG | 166% | 224% |
A Annualized
B Total returns for periods of less than one year are not annualized.
C Total returns would have been lower had certain expenses not been reduced during the periods shown.
D Total returns do not include the effect of the contingent deferred sales charge.
E Calculated based on average shares outstanding during the period.
F Fees and expenses of the underlying Fidelity Central Funds are not included in the Fund's expense ratio. The Fund indirectly bears its proportionate share of the expenses of any underlying Fidelity Central Funds.
G Amount does not include the portfolio activity of any underlying Fidelity Central Funds.
H For the period February 19, 2009 (commencement of sale of shares) to October 31, 2009.
I Expense ratios reflect operating expenses of the class. Expenses before reductions do not reflect amounts reimbursed by the investment adviser or reductions from brokerage service arrangements or reductions from other expense offset arrangements and do not represent the amount paid by the class during periods when reimbursements or reductions occur. Expense ratios before reductions for start-up periods may not be representative of longer-term operating periods. Expenses net of fee waivers reflect expenses after reimbursement by the investment adviser but prior to reductions from brokerage service arrangements or other expense offset arrangements. Expenses net of all reductions represent the net expenses paid by the class.
J Amount represents less than $.01 per share.
See accompanying notes which are an integral part of the financial statements.
Annual Report
Financial Highlights - Worldwide
Years ended October 31, | 2010 | 2009 | 2008 | 2007 | 2006 |
Selected Per-Share Data | | | | | |
Net asset value, beginning of period | $ 14.98 | $ 13.40 | $ 25.18 | $ 21.82 | $ 19.05 |
Income from Investment Operations | | | | | |
Net investment income (loss)B | .08 | .12 | .16 | .14 | .17 |
Net realized and unrealized gain (loss) | 2.63 | 1.63 | (9.44) | 6.05 | 3.74 |
Total from investment operations | 2.71 | 1.75 | (9.28) | 6.19 | 3.91 |
Distributions from net investment income | (.10) | (.17) | (.12) | (.17) | (.10) |
Distributions from net realized gain | (.02) | - | (2.38) | (2.66) | (1.04) |
Total distributions | (.11)G | (.17) | (2.50) | (2.83) | (1.14) |
Redemption fees added to paid in capitalB,F | - | - | - | - | - |
Net asset value, end of period | $ 17.58 | $ 14.98 | $ 13.40 | $ 25.18 | $ 21.82 |
Total ReturnA | 18.18% | 13.39% | (40.66)% | 31.87% | 21.31% |
Ratios to Average Net AssetsC,E | | | | | |
Expenses before reductions | 1.15% | 1.27% | 1.21% | 1.04% | 1.08% |
Expenses net of fee waivers, if any | 1.15% | 1.27% | 1.21% | 1.04% | 1.08% |
Expenses net of all reductions | 1.12% | 1.24% | 1.19% | 1.02% | 1.02% |
Net investment income (loss) | .50% | .92% | .84% | .66% | .85% |
Supplemental Data | | | | | |
Net assets, end of period (000 omitted) | $ 1,087,928 | $ 991,996 | $ 934,885 | $ 1,773,603 | $ 1,328,219 |
Portfolio turnover rateD | 166% | 224% | 264% | 128% | 205% |
A Total returns would have been lower had certain expenses not been reduced during the periods shown.
B Calculated based on average shares outstanding during the period.
C Fees and expenses of the underlying Fidelity Central Funds are not included in the Fund's expense ratio. The Fund indirectly bears its proportionate share of the expenses of any underlying Fidelity Central Funds.
D Amount does not include the portfolio activity of any underlying Fidelity Central Funds.
E Expense ratios reflect operating expenses of the class. Expenses before reductions do not reflect amounts reimbursed by the investment adviser or reductions from brokerage service arrangements or reductions from other expense offset arrangements and do not represent the amount paid by the class during periods when reimbursements or reductions occur. Expenses net of fee waivers reflect expenses after reimbursement by the investment adviser but prior to reductions from brokerage service arrangements or other expense offset arrangements. Expenses net of all reductions represent the net expenses paid by the class.
F Amount represents less than $.01 per share.
G Total distributions of $.11 per share is comprised of distributions from net investment income of $.097 and distributions from net realized gain of $.015 per share.
Financial Highlights - Institutional Class
Years ended October 31, | 2010 | 2009G |
Selected Per-Share Data | | |
Net asset value, beginning of period | $ 15.00 | $ 10.88 |
Income from Investment Operations | | |
Net investment income (loss)D | .07 | .06 |
Net realized and unrealized gain (loss) | 2.63 | 4.06 |
Total from investment operations | 2.70 | 4.12 |
Distributions from net investment income | (.11) | - |
Distributions from net realized gain | (.02) | - |
Total distributions | (.13) | - |
Redemption fees added to paid in capital D,I | - | - |
Net asset value, end of period | $ 17.57 | $ 15.00 |
Total ReturnB,C | 18.08% | 37.87% |
Ratios to Average Net AssetsE,H | | |
Expenses before reductions | 1.21% | 1.17%A |
Expenses net of fee waivers, if any | 1.21% | 1.17%A |
Expenses net of all reductions | 1.19% | 1.15%A |
Net investment income (loss) | .44% | .62%A |
Supplemental Data | | |
Net assets, end of period (000 omitted) | $ 335 | $ 290 |
Portfolio turnover rateF | 166% | 224% |
A Annualized
B Total returns for periods of less than one year are not annualized.
C Total returns would have been lower had certain expenses not been reduced during the periods shown.
D Calculated based on average shares outstanding during the period.
E Fees and expenses of the underlying Fidelity Central Funds are not included in the Fund's expense ratio. The Fund indirectly bears its proportionate share of the expenses of any underlying Fidelity Central Funds.
F Amount does not include the portfolio activity of any underlying Fidelity Central Funds.
G For the period February 19, 2009 (commencement of sale of shares) to October 31, 2009.
H Expense ratios reflect operating expenses of the class. Expenses before reductions do not reflect amounts reimbursed by the investment adviser or reductions from brokerage service arrangements or reductions from other expense offset arrangements and do not represent the amount paid by the class during periods when reimbursements or reductions occur. Expense ratios before reductions for start-up periods may not be representative of longer-term operating periods. Expenses net of fee waivers reflect expenses after reimbursement by the investment adviser but prior to reductions from brokerage service arrangements or other expense offset arrangements. Expenses net of all reductions represent the net expenses paid by the class.
I Amount represents less than $.01 per share.
See accompanying notes which are an integral part of the financial statements.
Annual Report
Notes to Financial Statements
For the period ended October 31, 2010
1. Organization.
Fidelity Worldwide Fund (the Fund) is a fund of Fidelity Investment Trust (the Trust) and is authorized to issue an unlimited number of shares. The Trust is registered under the Investment Company Act of 1940, as amended (the 1940 Act), as an open-end management investment company organized as a Massachusetts business trust. The Fund offers Class A, Class T, Class C, Worldwide and Institutional Class shares, each of which has equal rights as to assets and voting privileges. Effective after the close of business on September 1, 2010, Class B shares were closed to new accounts and additional purchases by existing shareholders. Each class has exclusive voting rights with respect to matters that affect that class. Class B shares will automatically convert to Class A shares after a holding period of seven years from the initial date of purchase. Investment income, realized and unrealized capital gains and losses, the common expenses of the Fund, and certain fund-level expense reductions, if any, are allocated on a pro-rata basis to each class based on the relative net assets of each class to the total net assets of the Fund. Each class differs with respect to transfer agent and distribution and service plan fees incurred. Certain expense reductions also differ by class. The Fund's investments in emerging markets can be subject to social, economic, regulatory, and political uncertainties and can be extremely volatile.
2. Investments in Fidelity Central Funds.
The Fund may invest in Fidelity Central Funds, which are open-end investment companies available only to other investment companies and accounts managed by Fidelity Management & Research Company (FMR) and its affiliates. The Fund's Schedule of Investments lists each of the Fidelity Central Funds held as of period end, if any, as an investment of the Fund, but does not include the underlying holdings of each Fidelity Central Fund. As an Investing Fund, the Fund indirectly bears its proportionate share of the expenses of the underlying Fidelity Central Funds.
The Money Market Central Funds seek preservation of capital and current income and are managed by Fidelity Investments Money Management, Inc. (FIMM), an affiliate of FMR.
A complete unaudited list of holdings for each Fidelity Central Fund is available upon request or at the Securities and Exchange Commission (the SEC) web site at www.sec.gov. In addition, the financial statements of the Fidelity Central Funds which are not covered by the Fund's Report of Independent Registered Public Accounting Firm, are available on the SEC web site or upon request.
3. Significant Accounting Policies.
The financial statements have been prepared in conformity with accounting principles generally accepted in the United States of America (GAAP), which require management to make certain estimates and assumptions at the date of the financial statements. Actual results could differ from those estimates. The following summarizes the significant accounting policies of the Fund:
Security Valuation. Investments are valued as of 4:00 p.m. Eastern time on the last calendar day of the period. The Fund uses independent pricing services approved by the Board of Trustees to value its investments. When current market prices or quotations are not readily available or reliable, valuations may be determined in good faith in accordance with procedures adopted by the Board of Trustees. Factors used in determining value may include market or security specific events, changes in interest rates and credit quality. The frequency with which these procedures are used cannot be predicted and they may be utilized to a significant extent. The value used for net asset value (NAV) calculation under these procedures may differ from published prices for the same securities.
The Fund categorizes the inputs to valuation techniques used to value its investments into a disclosure hierarchy consisting of three levels as shown below.
Level 1 - quoted prices in active markets for identical investments
Level 2 - other significant observable inputs (including quoted prices for similar investments, interest rates, prepayment speeds, etc.)
Level 3 - unobservable inputs (including the fund's own assumptions based on the best information available)
Changes in valuation techniques may result in transfers in or out of an assigned level within the disclosure hierarchy. The aggregate value of investments by input level, as of October 31, 2010, as well as a roll forward of Level 3 securities, is included at the end of the Fund's Schedule of Investments. Valuation techniques used to value the Fund's investments by major category are as follows.
Equity securities, including restricted securities, for which market quotations are readily available, are valued at the last reported sale price or official closing price as reported by an independent pricing service on the primary market or exchange on which they are traded and are categorized as Level 1 in the hierarchy. In the event there were no sales during the day or closing prices are not available, securities are valued at the last quoted bid price or may be valued using the last available price and are generally categorized as Level 2 in the hierarchy. For foreign equity securities, when significant market or security specific events arise, comparisons to the valuation of American Depositary Receipts (ADRs), futures contracts, Exchange-traded funds (ETFs) and certain indexes as well as quoted prices for similar securities are used and are categorized as Level 2 in the hierarchy in these circumstances. Utilizing these techniques may result in transfers between Level 1 and Level 2. For restricted equity securities and private placements where observable inputs are limited, assumptions about market activity and risk are used and are categorized as Level 3 in the hierarchy.
Annual Report
3. Significant Accounting Policies - continued
Security Valuation - continued
Debt securities, including restricted securities, are valued based on evaluated prices received from independent pricing services or from dealers who make markets in such securities. For corporate bonds pricing services utilize matrix pricing which considers yield or price of bonds of comparable quality, coupon, maturity and type as well as dealer supplied prices and are generally categorized as Level 2 in the hierarchy.
Investments in open-end mutual funds, including Fidelity Central Funds, are valued at their closing net asset value each business day and are categorized as Level 1 in the hierarchy. Short-term securities with remaining maturities of sixty days or less for which quotations are not readily available are valued at amortized cost, which approximates fair value and are categorized as Level 2 in the hierarchy.
When independent prices are unavailable or unreliable, debt securities may be valued utilizing pricing matrices which consider similar factors that would be used by independent pricing services. These are generally categorized as Level 2 in the hierarchy but may be Level 3 depending on the circumstances.
Foreign Currency. The Fund uses foreign currency contracts to facilitate transactions in foreign-denominated securities. Gains and losses from these transactions may arise from changes in the value of the foreign currency or if the counterparties do not perform under the contracts' terms.
Foreign-denominated assets, including investment securities, and liabilities are translated into U.S. dollars at the exchange rate at period end. Purchases and sales of investment securities, income and dividends received and expenses denominated in foreign currencies are translated into U.S. dollars at the exchange rate in effect on the transaction date.
The effects of exchange rate fluctuations on investments are included with the net realized and unrealized gain (loss) on investment securities. Other foreign currency transactions resulting in realized and unrealized gain (loss) are disclosed separately.
Investment Transactions and Income. For financial reporting purposes, the Fund's investment holdings and NAV include trades executed through the end of the last business day of the period. The NAV per share for processing shareholder transactions is calculated as of the close of business of the New York Stock Exchange (NYSE), normally 4:00 p.m. Eastern time and includes trades executed through the end of the prior business day. Gains and losses on securities sold are determined on the basis of identified cost and may include proceeds received from litigation. Dividend income is recorded on the ex-dividend date, except for certain dividends from foreign securities where the ex-dividend date may have passed, which are recorded as soon as the Fund is informed of the ex-dividend date. Non-cash dividends included in dividend income, if any, are recorded at the fair market value of the securities received. Distributions received on securities that represent a return of capital or capital gain are recorded as a reduction of cost of investments and/or as a realized gain. The Fund estimates the components of distributions received that may be considered return of capital distributions or capital gain distributions. Interest income and distributions from the Fidelity Central Funds are accrued as earned. Interest income includes coupon interest and amortization of premium and accretion of discount on debt securities. Investment income is recorded net of foreign taxes withheld where recovery of such taxes is uncertain.
Expenses. Most expenses of the Trust can be directly attributed to a fund. Expenses which cannot be directly attributed are apportioned amongst each fund in the Trust. Expense estimates are accrued in the period to which they relate and adjustments are made when actual amounts are known.
Income Tax Information and Distributions to Shareholders. Each year the Fund intends to qualify as a regulated investment company, including distributing substantially all of its taxable income and realized gains under Subchapter M of the Internal Revenue Code and filing its U.S. federal tax return. As a result, no provision for income taxes is required. As of October 31, 2010, the Fund did not have any unrecognized tax benefits in the accompanying financial statements. A fund's federal tax return is subject to examination by the Internal Revenue Service (IRS) for a period of three years. Foreign taxes are provided for based on the Fund's understanding of the tax rules and rates that exist in the foreign markets in which it invests. The Fund is subject to a tax imposed on short term capital gains on securities of certain issuers domiciled in India. The Fund records an estimated deferred tax liability included in Other payables and accrued expenses in the accompanying Statement of Assets & Liabilities for net unrealized gains on these securities in an amount that would be payable if the securities were disposed of at period end.
Distributions are declared and recorded on the ex-dividend date. Income dividends and capital gain distributions are declared separately for each class. Income and capital gain distributions are determined in accordance with income tax regulations, which may differ from GAAP.
Capital accounts within the financial statements are adjusted for permanent book-tax differences. These adjustments have no impact on net assets or the results of operations. Temporary book-tax differences will reverse in a subsequent period.
Book-tax differences are primarily due to short-term capital gain distributions from the Fidelity Central Funds, foreign currency transactions, certain foreign taxes, passive foreign investment companies (PFIC), market discount, deferred trustees compensation, capital loss carryforwards and losses deferred due to wash sales.
Annual Report
Notes to Financial Statements - continued
3. Significant Accounting Policies - continued
Income Tax Information and Distributions to Shareholders - continued
The federal tax cost of investment securities and unrealized appreciation (depreciation) as of period end were as follows:
Gross unrealized appreciation | $ 169,802,860 |
Gross unrealized depreciation | (32,295,987) |
Net unrealized appreciation (depreciation) | $ 137,506,873 |
| |
Tax Cost | $ 958,832,487 |
The tax-based components of distributable earnings as of period end were as follows:
Undistributed ordinary income | $ 7,203,381 |
Capital loss carryforward | $ (165,341,843) |
Net unrealized appreciation (depreciation) | $ 137,543,936 |
The tax character of distributions paid was as follows:
| October 31, 2010 | October 31, 2009 |
Ordinary Income | $ 7,413,180 | $ 11,746,083 |
Short-Term Trading (Redemption) Fees. Shares held by investors in the Fund less than 30 days are subject to a redemption fee equal to 1.00% of the net asset value of shares redeemed. All redemption fees, which reduce the proceeds of the shareholder redemption, are retained by the Fund and accounted for as an addition to paid in capital.
4. Operating Policies.
Restricted Securities. The Fund may invest in securities that are subject to legal or contractual restrictions on resale. These securities generally may be resold in transactions exempt from registration or to the public if the securities are registered. Disposal of these securities may involve time-consuming negotiations and expense, and prompt sale at an acceptable price may be difficult. Information regarding restricted securities is included at the end of the Fund's Schedule of Investments.
5. Purchases and Sales of Investments.
Purchases and sales of securities, other than short-term securities, aggregated $1,661,853,880 and $1,707,033,315, respectively.
6. Fees and Other Transactions with Affiliates.
Management Fee. FMR and its affiliates provide the Fund with investment management related services for which the Fund pays a monthly management fee. The management fee is the sum of an individual fund fee rate that is based on an annual rate of .45% of the Fund's average net assets and a group fee rate that averaged .26% during the period. The group fee rate is based upon the average net assets of all the mutual funds advised by FMR. The group fee rate decreases as assets under management increase and increases as assets under management decrease. In addition, the management fee is subject to a performance adjustment (up to a maximum of ±.20% of the Fund's average net assets over a 36 month performance period). The upward or downward adjustment to the management fee is based on the relative investment performance of Worldwide as compared to an appropriate benchmark index. For the period, the total annual management fee rate, including the performance adjustment, was .80% of the Fund's average net assets.
Distribution and Service Plan Fees. In accordance with Rule 12b-1 of the 1940 Act, the Fund has adopted separate Distribution and Service Plans for each class of shares. Certain classes pay Fidelity Distributors Corporation (FDC), an affiliate of FMR, separate Distribution and Service Fees, each of which is based on an annual percentage of each class' average net assets. In addition, FDC may pay financial intermediaries for selling shares of the Fund and providing shareholder support services. For the period, the Distribution and Service Fee rates, total fees and amounts retained by FDC were as follows:
Annual Report
6. Fees and Other Transactions with Affiliates - continued
Distribution and Service Plan Fees - continued
| Distribution
Fee | Service
Fee | Total
Fees | Retained
by FDC |
Class A | -% | .25% | $ 8,876 | $ 1,881 |
Class T | .25% | .25% | 3,697 | 386 |
Class B | .75% | .25% | 2,689 | 2,305 |
Class C | .75% | .25% | 5,692 | 3,823 |
| | | $ 20,954 | $ 8,395 |
Sales Load. FDC receives a front-end sales charge of up to 5.75% for selling Class A shares, and 3.50% for selling Class T shares, some of which is paid to financial intermediaries for selling shares of the Fund. FDC receives the proceeds of contingent deferred sales charges levied on Class A, Class T, Class B, and Class C redemptions. These charges depend on the holding period. The deferred sales charges range from 5% to 1% for Class B, 1% for Class C, 1.00% for certain purchases of Class A shares (1.00% to .50% prior to July 12, 2010) and .25% for certain purchases of Class T shares.
For the period, sales charge amounts retained by FDC were as follows:
| Retained
by FDC |
Class A | $ 5,564 |
Class T | 943 |
Class B* | 250 |
Class C* | 11 |
| $ 6,768 |
* When Class B and Class C shares are initially sold, FDC pays commissions from its own resources to financial intermediaries through which the sales are made.
Transfer Agent Fees. Fidelity Investments Institutional Operations Company, Inc. (FIIOC), an affiliate of FMR, is the transfer, dividend disbursing and shareholder servicing agent for each class of the Fund. FIIOC receives account fees and asset-based fees that vary according to the account size and type of account of the shareholders of the respective classes of the Fund. FIIOC pays for typesetting, printing and mailing of shareholder reports, except proxy statements. For the period, transfer agent fees for each class were as follows:
| Amount | % of
Average
Net Assets |
Class A | $ 10,509 | .29 |
Class T | 2,317 | .31 |
Class B | 823 | .31 |
Class C | 1,715 | .30 |
Worldwide | 2,645,955 | .26 |
Institutional Class | 1,081 | .32 |
| $ 2,662,400 | |
Accounting and Security Lending Fees. Fidelity Service Company, Inc. (FSC), an affiliate of FMR, maintains the Fund's accounting records. The accounting fee is based on the level of average net assets for the month. Under a separate contract, FSC administers the security lending program. The security lending fee is based on the number and duration of lending transactions.
Brokerage Commissions. The Fund placed a portion of its portfolio transactions with brokerage firms which are affiliates of the investment adviser. The commissions paid to these affiliated firms were $34,964 for the period.
7. Committed Line of Credit.
The Fund participates with other funds managed by FMR or an affiliate in a $3.75 billion credit facility (the "line of credit") to be utilized for temporary or emergency purposes to fund shareholder redemptions or for other short-term liquidity purposes. The Fund has agreed to pay commitment fees on its pro-rata portion of the line of credit, which amounted to $4,054 and is reflected in Miscellaneous expenses on the Statement of Operations. During the period, there were no borrowings on this line of credit.
Annual Report
Notes to Financial Statements - continued
8. Security Lending.
The Fund lends portfolio securities through a lending agent from time to time in order to earn additional income. The lending agent may loan securities to certain qualified borrowers, including Fidelity Capital Markets (FCM), a broker-dealer affiliated with the Fund. On the settlement date of the loan, the Fund receives collateral (in the form of U.S. Treasury obligations, letters of credit and/or cash) against the loaned securities and maintains collateral in an amount not less than 100% of the market value of the loaned securities during the period of the loan. The market value of the loaned securities is determined at the close of business of the Fund and any additional required collateral is delivered to the Fund on the next business day. If the borrower defaults on its obligation to return the securities loaned because of insolvency or other reasons, a fund could experience delays and costs in recovering the securities loaned or in gaining access to the collateral. Any cash collateral received is invested in the Fidelity Securities Lending Cash Central Fund. The value of loaned securities and cash collateral at period end are disclosed on the Fund's Statement of Assets and Liabilities. Security lending income represents the income earned on investing cash collateral, less rebates paid to borrowers and lending agent fees associated with the loan, plus any premium payments received for lending certain types of securities. Security lending income is presented in the Statement of Operations as a component of income from Fidelity Central Funds. Total security lending income during the period amounted to $257,400.During the period, there were no securities loaned to FCM.
9. Expense Reductions.
FMR voluntarily agreed to reimburse a portion of Worldwide's operating expenses. During the period, this reimbursement reduced the class' expenses by $43,251.
Many of the brokers with whom FMR places trades on behalf of the Fund provided services to the Fund in addition to trade execution. These services included payments of certain expenses on behalf of the Fund totaling $282,565 for the period.
10. Distributions to Shareholders.
Distributions to shareholders of each class were as follows:
Years ended October 31, | 2010 | 2009A |
From net investment income | | |
Class A | $ 9,814 | $ - |
Class T | 2,409 | - |
Class B | 75 | - |
Class C | 827 | - |
Worldwide | 6,404,601 | 11,746,083 |
Institutional Class | 2,241 | - |
Total | $ 6,419,967 | $ 11,746,083 |
From net realized gain | | |
Class A | $ 1,404 | $ - |
Class T | 480 | - |
Class B | 191 | - |
Class C | 373 | - |
Worldwide | 990,471 | - |
Institutional Class | 294 | - |
Total | $ 993,213 | $ - |
A Distributions for Class A, Class T, Class B Class C and Institutional class are for the period February 19, 2009 (commencement of sale of shares) to October 31, 2009.
11. Share Transactions.
Transactions for each class of shares were as follows:
| Shares | Dollars |
Years ended October 31, | 2010 | 2009A | 2010 | 2009A |
Class A | | | | |
Shares sold | 404,777 | 68,262 | $ 6,463,954 | $ 954,848 |
Reinvestment of distributions | 589 | - | 9,399 | - |
Shares redeemed | (41,328) | (1,913) | (668,935) | (30,621) |
Net increase (decrease) | 364,038 | 66,349 | $ 5,804,418 | $ 924,227 |
Annual Report
11. Share Transactions - continued
| Shares | Dollars |
Years ended October 31, | 2010 | 2009A | 2010 | 2009A |
Class T | | | | |
Shares sold | 57,729 | 31,350 | $ 930,150 | $ 413,190 |
Reinvestment of distributions | 156 | - | 2,498 | - |
Shares redeemed | (24,377) | (691) | (385,540) | (10,728) |
Net increase (decrease) | 33,508 | 30,659 | $ 547,108 | $ 402,462 |
Class B | | | | |
Shares sold | 11,168 | 16,229 | $ 177,092 | $ 199,531 |
Reinvestment of distributions | 16 | - | 260 | - |
Shares redeemed | (8,709) | (1,150) | (138,098) | (18,389) |
Net increase (decrease) | 2,475 | 15,079 | $ 39,254 | $ 181,142 |
Class C | | | | |
Shares sold | 34,028 | 23,542 | $ 543,674 | $ 304,403 |
Reinvestment of distributions | 68 | - | 1,087 | - |
Shares redeemed | (15,747) | (1,012) | (246,126) | (14,575) |
Net increase (decrease) | 18,349 | 22,530 | $ 298,635 | $ 289,828 |
Worldwide | | | | |
Shares sold | 8,421,228 | 9,823,250 | $ 135,177,567 | $ 126,506,866 |
Reinvestment of distributions | 449,494 | 959,833 | 7,194,622 | 11,413,258 |
Shares redeemed | (13,209,138) | (14,319,175) | (210,537,866) | (180,350,310) |
Net increase (decrease) | (4,338,416) | (3,536,092) | $ (68,165,677) | $ (42,430,186) |
Institutional Class | | | | |
Shares sold | 9,920 | 19,375 | $ 162,697 | $ 249,261 |
Reinvestment of distributions | 158 | - | 2,535 | - |
Shares redeemed | (10,397) | (6) | (165,950) | (83) |
Net increase (decrease) | (319) | 19,369 | $ (718) | $ 249,178 |
A Share transactions for Class A, Class T, Class B Class C and Institutional class are for the period February 19, 2009 (commencement of sale of shares) to October 31, 2009.
12. Other.
The Fund's organizational documents provide former and current trustees and officers with a limited indemnification against liabilities arising in connection with the performance of their duties to the Fund. In the normal course of business, the Fund may also enter into contracts that provide general indemnifications. The Fund's maximum exposure under these arrangements is unknown as this would be dependent on future claims that may be made against the Fund. The risk of material loss from such claims is considered remote.
Annual Report
Report of Independent Registered Public Accounting Firm
To the Trustees of Fidelity Investment Trust and Shareholders of Fidelity Worldwide Fund:
We have audited the accompanying statement of assets and liabilities of Fidelity Worldwide Fund (the Fund), a fund of Fidelity Investment Trust, including the schedule of investments, as of October 31, 2010, and the related statement of operations for the year then ended, the statement of changes in net assets for each of the two years in the period then ended, and the financial highlights for each of the five years in the period then ended. These financial statements and financial highlights are the responsibility of the Fund's management. Our responsibility is to express an opinion on these financial statements and financial highlights based on our audits.
We conducted our audits in accordance with standards of the Public Company Accounting Oversight Board (United States). Those standards require that we plan and perform the audit to obtain reasonable assurance about whether the financial statements and financial highlights are free of material misstatement. The Fund is not required to have, nor were we engaged to perform, an audit of its internal control over financial reporting. Our audits included consideration of internal control over financial reporting as a basis for designing audit procedures that are appropriate in the circumstances, but not for the purpose of expressing an opinion on the effectiveness of the Fund's internal control over financial reporting. Accordingly, we express no such opinion. An audit also includes examining, on a test basis, evidence supporting the amounts and disclosures in the financial statements, assessing the accounting principles used and significant estimates made by management, as well as evaluating the overall financial statement presentation. Our procedures included confirmation of securities owned as of October 31, 2010, by correspondence with the custodians and brokers; where replies were not received from brokers, we performed other auditing procedures. We believe that our audits provide a reasonable basis for our opinion.
In our opinion, the financial statements and financial highlights referred to above present fairly, in all material respects, the financial position of Fidelity Worldwide Fund as of October 31, 2010, the results of its operations for the year then ended, the changes in its net assets for each of the two years in the period then ended, and its financial highlights for each of the five years in the period then ended, in conformity with accounting principles generally accepted in the United States of America.
/s/ Deloitte & Touche LLP
DELOITTE & TOUCHE LLP
Boston, Massachusetts
December 17, 2010
Annual Report
The Trustees, Member of the Advisory Board, and executive officers of the trust and fund, as applicable, are listed below. The Board of Trustees governs the fund and is responsible for protecting the interests of shareholders. The Trustees are experienced executives who meet periodically throughout the year to oversee the fund's activities, review contractual arrangements with companies that provide services to the fund, oversee management of the risks associated with such activities and contractual arrangements, and review the fund's performance. Except for James C. Curvey, each of the Trustees oversees 221 funds advised by FMR or an affiliate. Mr. Curvey oversees 410 funds advised by FMR or an affiliate.
The Trustees hold office without limit in time except that (a) any Trustee may resign; (b) any Trustee may be removed by written instrument, signed by at least two-thirds of the number of Trustees prior to such removal; (c) any Trustee who requests to be retired or who has become incapacitated by illness or injury may be retired by written instrument signed by a majority of the other Trustees; and (d) any Trustee may be removed at any special meeting of shareholders by a two-thirds vote of the outstanding voting securities of the trust. Each Trustee who is not an interested person (as defined in the 1940 Act) (Independent Trustee), shall retire not later than the last day of the calendar year in which his or her 72nd birthday occurs. The Independent Trustees may waive this mandatory retirement age policy with respect to individual Trustees. The executive officers and Advisory Board Member hold office without limit in time, except that any officer and Advisory Board Member may resign or may be removed by a vote of a majority of the Trustees at any regular meeting or any special meeting of the Trustees. Except as indicated, each individual has held the office shown or other offices in the same company for the past five years.
Experience, Skills, Attributes, and Qualifications of the Fund's Trustees. The Governance and Nominating Committee has adopted a statement of policy that describes the experience, qualifications, attributes, and skills that are necessary and desirable for potential Independent Trustee candidates (Statement of Policy). The Board believes that each Trustee satisfied at the time he or she was initially elected or appointed a Trustee, and continues to satisfy, the standards contemplated by the Statement of Policy. The Governance and Nominating Committee also engages professional search firms to help identify potential Independent Trustee candidates who have the experience, qualifications, attributes, and skills consistent with the Statement of Policy. From time to time, additional criteria based on the composition and skills of the current Independent Trustees, as well as experience or skills that may be appropriate in light of future changes to board composition, business conditions, and regulatory or other developments, have also been considered by the professional search firms and the Governance and Nominating Committee. In addition, the Board takes into account the Trustees' commitment and participation in Board and committee meetings, as well as their leadership of standing and ad hoc committees throughout their tenure.
In determining that a particular Trustee was and continues to be qualified to serve as a Trustee, the Board has considered a variety of criteria, none of which, in isolation, was controlling. The Board believes that, collectively, the Trustees have balanced and diverse experience, qualifications, attributes, and skills, which allow the Board to operate effectively in governing the fund and protecting the interests of shareholders. Information about the specific experience, skills, attributes, and qualifications of each Trustee, which in each case led to the Board's conclusion that the Trustee should serve (or continue to serve) as a trustee of the fund, is provided below.
Board Structure and Oversight Function. Edward C. Johnson 3d is an interested person (as defined in the 1940 Act) and currently serves as Chairman. The Trustees have determined that an interested Chairman is appropriate and benefits shareholders because an interested Chairman has a personal and professional stake in the quality and continuity of services provided to the fund. Independent Trustees exercise their informed business judgment to appoint an individual of their choosing to serve as Chairman, regardless of whether the Trustee happens to be independent or a member of management. The Independent Trustees have determined that they can act independently and effectively without having an Independent Trustee serve as Chairman and that a key structural component for assuring that they are in a position to do so is for the Independent Trustees to constitute a substantial majority for the Board. The Independent Trustees also regularly meet in executive session. Ned C. Lautenbach serves as Chairman of the Independent Trustees and as such (i) acts as a liaison between the Independent Trustees and management with respect to matters important to the Independent Trustees and (ii) with management prepares agendas for Board meetings.
Fidelity funds are overseen by different Boards of Trustees. The fund's Board oversees Fidelity's equity and high income funds and another Board oversees Fidelity's investment-grade bond, money market, and asset allocation funds. The asset allocation funds may invest in Fidelity funds overseen by the fund's Board. The use of separate Boards, each with its own committee structure, allows the Trustees of each group of Fidelity funds to focus on the unique issues of the funds they oversee, including common research, investment, and operational issues. On occasion, the separate Boards establish joint committees to address issues of overlapping consequences for the Fidelity funds overseen by each Board.
The Trustees operate using a system of committees to facilitate the timely and efficient consideration of all matters of importance to the Trustees, the fund, and fund shareholders and to facilitate compliance with legal and regulatory requirements and oversight of the fund's activities and associated risks. The Board, acting through its committees, has charged FMR and its affiliates with (i) identifying events or circumstances the occurrence of which could have demonstrably adverse effects on the fund's business and/or reputation; (ii) implementing processes and controls to lessen the possibility that such events or circumstances occur or to mitigate the effects of such events or circumstances if they do occur; and (iii) creating and maintaining a system designed to evaluate continuously business and market conditions in order to facilitate the identification and implementation processes described in (i) and (ii) above. Because the day-to-day operations and activities of the fund are carried out by or through FMR, its affiliates and other service providers, the fund's exposure to risks is mitigated but not eliminated by the processes overseen by the Trustees. While each of the Board's committees has responsibility for overseeing different aspects of the fund's activities, oversight is exercised primarily through the Operations, Audit, and Compliance Committees. Appropriate personnel, including but not limited to the fund's Chief Compliance Officer (CCO), FMR's internal auditor, the independent accountants, the fund's Treasurer and portfolio management personnel, make periodic reports to the Board's committees, as appropriate. The responsibilities of each committee, including their oversight responsibilities, are described further under "Standing Committees of the Fund's Trustees."
Annual Report
Trustees and Officers - continued
The fund's Statement of Additional Information (SAI) includes more information about the Trustees. To request a free copy, call Fidelity at 1-877-208-0098.
Interested Trustees*:
Correspondence intended for each Trustee who is an interested person may be sent to Fidelity Investments, 82 Devonshire Street, Boston, Massachusetts 02109.
Name, Age; Principal Occupations and Other Relevant Experience+ |
Edward C. Johnson 3d (80) |
| Year of Election or Appointment: 1984 Mr. Johnson is Trustee and Chairman of the Board of Trustees of certain Trusts. Mr. Johnson serves as Chief Executive Officer, Chairman, and a Director of FMR LLC; Chairman and a Director of FMR; Chairman and a Director of Fidelity Research & Analysis Company (FRAC); Chairman and a Director of Fidelity Investments Money Management, Inc.; and Chairman and a Director of FMR Co., Inc. In addition, Mr. Johnson serves as Chairman and Director of FIL Limited. Previously, Mr. Johnson served as President of FMR LLC (2006-2007). |
James C. Curvey (75) |
| Year of Election or Appointment: 2007 Mr. Curvey also serves as Trustee (2007-present) of other investment companies advised by FMR. Mr. Curvey is a Director of Fidelity Investments Money Management, Inc. (2009-present), Director of Fidelity Research & Analysis Co. (2009-present) and Director of FMR and FMR Co., Inc. (2007-present). Mr. Curvey is also Vice Chairman (2007-present) and Director of FMR LLC. In addition, Mr. Curvey serves as an Overseer for the Boston Symphony Orchestra and a member of the Trustees of Villanova University. Previously, Mr. Curvey was the Vice Chairman (2006-2007) and Director (2000-2007) of FMR Corp. |
* Trustees have been determined to be "Interested Trustees" by virtue of, among other things, their affiliation with the trust or various entities under common control with FMR.
+ The information above includes each Trustee's principal occupation during the last five years and other information relating to the experience, attributes, and skills relevant to each Trustee's qualifications to serve as a Trustee, which led to the conclusion that each Trustee should serve as a Trustee for the fund.
Independent Trustees:
Correspondence intended for each Independent Trustee (that is, the Trustees other than the Interested Trustees) may be sent to Fidelity Investments, P.O. Box 55235, Boston, Massachusetts 02205-5235.
Name, Age; Principal Occupations and Other Relevant Experience+ |
Dennis J. Dirks (62) |
| Year of Election or Appointment: 2005 Prior to his retirement in May 2003, Mr. Dirks was Chief Operating Officer and a member of the Board of The Depository Trust & Clearing Corporation (DTCC). He also served as President, Chief Operating Officer, and Board member of The Depository Trust Company (DTC) and President and Board member of the National Securities Clearing Corporation (NSCC). In addition, Mr. Dirks served as Chief Executive Officer and Board member of the Government Securities Clearing Corporation, Chief Executive Officer and Board member of the Mortgage-Backed Securities Clearing Corporation, as a Trustee and a member of the Finance Committee of Manhattan College (2005-2008), and as a Trustee and a member of the Finance Committee of AHRC of Nassau County (2006-2008). Mr. Dirks is a member of the Independent Directors Council (IDC) Governing Council (2010-Present) and Board of Directors for The Brookville Center for Children's Services, Inc. (2009-present). |
Alan J. Lacy (57) |
| Year of Election or Appointment: 2008 Mr. Lacy serves as Senior Adviser (2007-present) of Oak Hill Capital Partners, L.P. (private equity). Mr. Lacy also served as Chief Executive Officer (2000-2005) and Vice Chairman (2005-2006) of Sears Holdings Corporation and Sears, Roebuck and Co. (retail). In addition, Mr. Lacy serves as a member of the Board of Directors of The Western Union Company (global money transfer, 2006-present) and Bristol-Myers Squibb Company (global pharmaceuticals, 2007-present). Mr. Lacy is Chairman (2008-present) and a member (2006-present) of the Board of Trustees of The National Parks Conservation Association. |
Ned C. Lautenbach (66) |
| Year of Election or Appointment: 2000 Mr. Lautenbach is Chairman of the Independent Trustees of the Equity and High Income Funds (2006-present). Mr. Lautenbach currently serves as the Lead Director of the Eaton Corporation Board of Directors (diversified industrial, 1997-present). Mr. Lautenbach is also a member of the Board of Directors of the Philharmonic Center for the Arts in Naples, Florida (1999 -
present); a member of the Board of Trustees of Fairfield University (2005-present); and a member of the Council on Foreign Relations (1994 - present). Previously, Mr. Lautenbach was a Partner/Advisory Partner at Clayton, Dubilier & Rice, Inc. (private equity investment, 1998-2010), as well as a Director of Sony Corporation (2006-2007). |
Joseph Mauriello (66) |
| Year of Election or Appointment: 2008 Prior to his retirement in January 2006, Mr. Mauriello served in numerous senior management positions including Deputy Chairman and Chief Operating Officer (2004-2005), and Vice Chairman of Financial Services (2002-2004) of KPMG LLP US (professional services, 1965-2005). Mr. Mauriello currently serves as a member of the Board of Directors of XL Group plc. (global insurance and re-insurance, 2006-present) and of Arcadia Resources Inc. (health care services and products, 2007-present). Previously, Mr. Mauriello served as a Director of the Hamilton Funds of the Bank of New York (2006-2007). |
Cornelia M. Small (66) |
| Year of Election or Appointment: 2005 Ms. Small is a member of the Board of Directors of the Teagle Foundation (2009-present). Ms. Small is also a member of the Investment Committee, and Chair (2008-present) and a member of the Board of Trustees of Smith College. In addition, Ms. Small serves on the Investment Committee of the Berkshire Taconic Community Foundation (2008-present). Previously, Ms. Small served as Chairperson of the Investment Committee (2002-2008) of Smith College. In addition, Ms. Small served as Chief Investment Officer, Director of Global Equity Investments, and a member of the Board of Directors of Scudder, Stevens & Clark and Scudder Kemper Investments. |
William S. Stavropoulos (71) |
| Year of Election or Appointment: 2001 Mr. Stavropoulos is Vice Chairman of the Independent Trustees of the Equity and High Income Funds (2006-present). Mr. Stavropoulos serves as President and Founder of the Michigan Baseball Foundation, the Great Lakes Loons (2007-present). Mr. Stavropoulos is Chairman Emeritus of the Board of Directors of The Dow Chemical Company, where he previously served in numerous senior management positions, including President, CEO (1995-2000; 2002-2004), Chairman of the Executive Committee (2000-2006), and as a member of the Board of Directors (1990-2006). Currently, Mr. Stavropoulos is Chairman of Univar (global distributor of commodity and specialty chemicals, 2010-present), a Director of Teradata Corporation (data warehousing and technology solutions, 2008-present), Chemical Financial Corporation, Maersk Inc. (industrial conglomerate), Tyco International, Inc. (multinational manufacturing and services, 2007-present), and a member of the Advisory Board for Metalmark Capital (private equity investment, 2005-present). Mr. Stavropoulos is a special advisor to Clayton, Dubilier & Rice, Inc. (private equity investment). In addition, Mr. Stavropoulos is a member of the University of Notre Dame Advisory Council for the College of Science. |
David M. Thomas (61) |
| Year of Election or Appointment: 2008 Previously, Mr. Thomas served as Executive Chairman (2005-2006) and Chairman and Chief Executive Officer (2000-2005) of IMS Health, Inc. (pharmaceutical and healthcare information solutions). In addition, Mr. Thomas serves as a member of the Board of Directors of Fortune Brands, Inc. (consumer products), and Interpublic Group of Companies, Inc. (marketing communication, 2004-present). |
Michael E. Wiley (60) |
| Year of Election or Appointment: 2008 Mr. Wiley also serves as a Director of Asia Pacific Exploration Consolidated (international oil and gas exploration and production, 2008-present). Mr. Wiley serves as a Director of Tesoro Corporation (independent oil refiner and marketer, 2005-present), and a Director of Bill Barrett Corporation (exploration and production, 2005-present). In addition, Mr. Wiley also serves as a Director of Post Oak Bank (privately-held bank, 2004-present). Previously, Mr. Wiley served as a member of the Board of Trustees of the University of Tulsa (2000-2006; 2007-2010), as a Senior Energy Advisor of Katzenbach Partners, LLC (consulting, 2006-2007), as an Advisory Director of Riverstone Holdings (private investment), Chairman, President, and CEO of Baker Hughes, Inc. (oilfield services, 2000-2004), and as Director of Spinnaker Exploration Company (exploration and production, 2001-2005). |
+ The information above includes each Trustee's principal occupation during the last five years and other information relating to the experience, attributes, and skills relevant to each Trustee's qualifications to serve as a Trustee, which led to the conclusion that each Trustee should serve as a Trustee for the fund.
Annual Report
Trustees and Officers - continued
Advisory Board Member and Executive Officers:
Correspondence intended for each executive officer and Peter S. Lynch may be sent to Fidelity Investments, 82 Devonshire Street, Boston, Massachusetts 02109.
Name, Age; Principal Occupation |
Peter S. Lynch (66) |
| Year of Election or Appointment: 2003 Member of the Advisory Board of Fidelity's Equity and High Income Funds. Mr. Lynch is Vice Chairman and a Director of FMR and FMR Co., Inc. In addition, Mr. Lynch serves as a Trustee of Boston College and as the Chairman of the Inner-City Scholarship Fund. Previously, Mr. Lynch served on the Special Olympics International Board of Directors (1997-2006). |
Kenneth B. Robins (41) |
| Year of Election or Appointment: 2008 President and Treasurer of Fidelity's Equity and High Income Funds. Mr. Robins also serves as President and Treasurer (2010-
present) and Assistant Treasurer (2009-present) of other Fidelity funds and is an employee of Fidelity Investments (2004-present). Previously, Mr. Robins served as Deputy Treasurer of the Fidelity funds (2005-2008) and Treasurer and Chief Financial Officer of The North Carolina Capital Management Trust: Cash and Term Portfolios (2006-2008). |
Bruce T. Herring (45) |
| Year of Election or Appointment: 2006 Vice President of certain Equity Funds. Mr. Herring also serves as Chief Investment Officer and Director of Fidelity Management & Research (U.K.) Inc. (2010-present) and Group Chief Investments Officer of FMR. Previously, Mr. Herring served as Vice President (2005-2006) and Senior Vice President (2006-2007) of Fidelity Management & Research Company, Vice President of FMR Co., Inc. (2001-2007) and as a portfolio manager for Fidelity U.S. Equity Funds. |
Brian B. Hogan (46) |
| Year of Election or Appointment: 2009 Vice President of certain Equity Funds and Vice President of Sector Funds. Mr. Hogan also serves as President of FMR's Equity Division (2009-present). Previously, Mr. Hogan served as Senior Vice President, Equity Research of FMR (2006-2009) and as a portfolio manager. |
Scott C. Goebel (42) |
| Year of Election or Appointment: 2008 Secretary and Chief Legal Officer (CLO) of the Fidelity funds. Mr. Goebel also serves as Secretary and CLO of The North Carolina Capital Management Trust: Cash and Term Portfolio (2008-present); General Counsel, Secretary, and Senior Vice President of FMR (2008-present) and FMR Co., Inc. (2008-present); Deputy General Counsel of FMR LLC; Chief Legal Officer of Fidelity Management & Research (Hong Kong) Limited (2008-present) and Assistant Secretary of Fidelity Management & Research (Japan) Inc. (2008-present), Fidelity Investments Money Management, Inc. (2008-present), Fidelity Management & Research (U.K.) Inc. (2008-present), and Fidelity Research and Analysis Company (2008-present). Previously, Mr. Goebel served as Assistant Secretary of the Funds (2007-2008) and as Vice President and Secretary of Fidelity Distributors Corporation (FDC) (2005-2007). |
William C. Coffey (41) |
| Year of Election or Appointment: 2009 Assistant Secretary of Fidelity's Equity and High Income Funds. Mr. Coffey also serves as Senior Vice President and Deputy General Counsel of FMR LLC (2010-present), and is an employee of Fidelity Investments. Previously, Mr. Coffey served as Vice President and Associate General Counsel of FMR LLC (2005-2009). |
Holly C. Laurent (56) |
| Year of Election or Appointment: 2008 Anti-Money Laundering (AML) Officer of the Fidelity funds. Ms. Laurent also serves as AML Officer of The North Carolina Capital Management Trust: Cash and Term Portfolio (2008-present) and is an employee of Fidelity Investments. Previously, Ms. Laurent was Senior Vice President and Head of Legal for Fidelity Business Services India Pvt. Ltd. (2006-2008), and Senior Vice President, Deputy General Counsel and Group Head for FMR LLC (2005-2006). |
Christine Reynolds (52) |
| Year of Election or Appointment: 2008 Chief Financial Officer of the Fidelity funds. Ms. Reynolds became President of Fidelity Pricing and Cash Management Services (FPCMS) in August 2008. Ms. Reynolds served as Chief Operating Officer of FPCMS (2007-2008). Previously, Ms. Reynolds served as President, Treasurer, and Anti-Money Laundering officer of the Fidelity funds (2004-2007). |
Kenneth A. Rathgeber (63) |
| Year of Election or Appointment: 2004 Chief Compliance Officer of Fidelity's Equity and High Income Funds. Mr. Rathgeber is Chief Compliance Officer of Fidelity Management & Research (Hong Kong) Limited (2008-present), Fidelity Management & Research (Japan) Inc. (2008-present), FMR (2005-present), FMR Co., Inc. (2005-present), Fidelity Management & Research (U.K.) Inc. (2005-present), Fidelity Research & Analysis Company (2005-present), Fidelity Investments Money Management, Inc. (2005-present), Pyramis Global Advisors, LLC (2005-present), and Strategic Advisers, Inc. (2005-present). |
Jeffrey S. Christian (49) |
| Year of Election or Appointment: 2009 Deputy Treasurer of the Fidelity funds. Mr. Christian is an employee of Fidelity Investments. Previously, Mr. Christian served as Chief Financial Officer (2008-2009) of certain Fidelity funds and Senior Vice President of Fidelity Pricing and Cash Management Services (FPCMS) (2004-2009). |
Bryan A. Mehrmann (49) |
| Year of Election or Appointment: 2005 Deputy Treasurer of the Fidelity funds. Mr. Mehrmann is an employee of Fidelity Investments. |
Adrien E. Deberghes (43) |
| Year of Election or Appointment: 2008 Deputy Treasurer of Fidelity's Equity and High Income Funds. Mr. Deberghes also serves as Assistant Treasurer of other Fidelity funds (2010-present) and is an employee of Fidelity Investments (2008-present). Previously, Mr. Deberghes served as Senior Vice President of Mutual Fund Administration at State Street Corporation (2007-2008), Senior Director of Mutual Fund Administration at Investors Bank & Trust (2005-2007), and Director of Finance for Dunkin' Brands (2000-2005). |
Stephanie J. Dorsey (41) |
| Year of Election or Appointment: 2010 Assistant Treasurer of Fidelity's Equity and High Income Funds. Ms. Dorsey also serves as Deputy Treasurer of other Fidelity funds (2008-present) and is an employee of Fidelity Investments (2008-present). Previously, Ms. Dorsey served as Treasurer (2004-2008) of the JPMorgan Mutual Funds and Vice President (2004-2008) of JPMorgan Chase Bank. |
John R. Hebble (52) |
| Year of Election or Appointment: 2009 Assistant Treasurer of Fidelity's Equity and High Income Funds. Mr. Hebble also serves as Treasurer and Chief Financial Officer of The North Carolina Capital Management Trust: Cash and Term Portfolio (2008-present), President and Treasurer of other Fidelity funds (2008-present) and is an employee of Fidelity Investments. |
Gary W. Ryan (52) |
| Year of Election or Appointment: 2005 Assistant Treasurer of the Fidelity funds. Mr. Ryan is an employee of Fidelity Investments. Previously, Mr. Ryan served as Vice President of Fund Reporting in Fidelity Pricing and Cash Management Services (FPCMS) (1999-2005). |
Jonathan Davis (42) |
| Year of Election or Appointment: 2010 Assistant Treasurer of the Fidelity funds. Mr. Davis is an employee of Fidelity Investments. Previously, Mr. Davis served as Vice President and Associate General Counsel of FMR LLC (2003-2010). |
Annual Report
The Board of Trustees of Fidelity Worldwide Fund voted to pay to shareholders of record at the opening of business on record date the following distributions per share derived from capital gains realized from sales of portfolio securities and dividends derived from net investment income:
| Pay Date | Record Date | Dividends | Capital Gains |
Class A | 12/06/10 | 12/03/10 | $0.059 | $0.046 |
Class T | 12/06/10 | 12/03/10 | $0.020 | $0.046 |
Class B | 12/06/10 | 12/03/10 | $0.00 | $0.00 |
Class C | 12/06/10 | 12/03/10 | $0.00 | $0.00 |
A percentage of the dividends distributed during the fiscal year for the following fund may be taken into account as a dividend for purposes of the maximum rate under section 1(h)(11) of the Internal Revenue Code:
| Ex Date | % |
Class A | 12/04/2009 | 100% |
Class A | 12/30/2009 | 100% |
Class B | 12/04/2009 | 100% |
Class B | 12/30/2009 | 100% |
Class C | 12/04/2009 | 100% |
Class C | 12/30/2009 | 100% |
Class T | 12/04/2009 | 100% |
Class T | 12/30/2009 | 100% |
A percentage of the dividends distributed during the fiscal year for the following funds qualify for the dividends-received deduction for corporate shareholders:
| Ex Date | % |
Class A | 12/04/2009 | 55% |
Class A | 12/30/2009 | 100% |
Class B | 12/04/2009 | 100% |
Class B | 12/30/2009 | 100% |
Class C | 12/04/2009 | 100% |
Class C | 12/30/2009 | 100% |
Class T | 12/04/2009 | 73% |
Class T | 12/30/2009 | 100% |
The amounts per share which represent income derived from sources within, and taxes paid to, foreign countries or possessions of the United States are as follows:
| Pay Date | Income | Taxes |
Class A | 12/07/2009 | 0.102 | 0.0113 |
Class A | 12/31/2009 | 0.004 | 0.0000 |
Class B | 12/07/2009 | 0.020 | 0.0113 |
Class B | 12/31/2009 | 0.004 | 0.0000 |
Class C | 12/07/2009 | 0.044 | 0.0113 |
Class C | 12/31/2009 | 0.004 | 0.0000 |
Class T | 12/07/2009 | 0.079 | 0.0113 |
Class T | 12/31/2009 | 0.004 | 0.0000 |
The funds will notify shareholders in January 2011 of amounts for use in preparing 2010 income tax returns.
Annual Report
Board Approval of Investment Advisory Contracts and Management Fees
Fidelity Worldwide Fund
Each year, the Board of Trustees, including the Independent Trustees (together, the Board), votes on the renewal of the management contract and sub-advisory agreements (together, the Advisory Contracts) for the fund. The Board, assisted by the advice of fund counsel and Independent Trustees' counsel, requests and considers a broad range of information relevant to the renewal of the Advisory Contracts throughout the year.
The Board meets regularly and considers at each of its meetings factors that are relevant to its annual consideration of the renewal of the fund's Advisory Contracts, including the services and support provided to the fund and its shareholders. The Board has established various standing committees, each composed of Independent Trustees with varying backgrounds, to which the Board has assigned specific subject matter responsibilities in order to enhance effective decision-making by the Board. The Board, acting directly and through its Committees, requests and receives information concerning the annual consideration of the renewal of the fund's Advisory Contracts. The Board also meets as needed to consider matters specifically related to the Board's annual consideration of the renewal of Advisory Contracts. Members of the Board may also meet with trustees of other Fidelity funds through ad hoc joint committees to discuss certain matters relevant to the Fidelity funds.
At its July 2010 meeting, the Board of Trustees, including the Independent Trustees, unanimously determined to renew the fund's Advisory Contracts. In reaching its determination, the Board considered all factors it believed relevant, including (i) the nature, extent, and quality of the services to be provided to the fund and its shareholders (including the investment performance of the fund); (ii) the competitiveness of the fund's management fee and total expenses; (iii) the total costs of the services to be provided by and the profits to be realized by Fidelity from its relationship with the fund; (iv) the extent to which economies of scale would be realized as the fund grows; and (v) whether fee levels reflect these economies of scale, if any, for the benefit of fund shareholders.
In considering whether to renew the Advisory Contracts for the fund, the Board reached a determination, with the assistance of fund counsel and Independent Trustees' counsel and through the exercise of its business judgment, that the renewal of the Advisory Contracts is in the best interests of fund shareholders and that the compensation to be received by Fidelity under the management contract is fair and reasonable. The Board's decision to renew the Advisory Contracts was not based on any single factor noted above, but rather was based on a comprehensive consideration of all the information provided to the Board at its meetings throughout the year. The Board, in reaching its determination to renew the Advisory Contracts, is aware that shareholders in the fund have a broad range of investment choices available to them, including a wide choice among mutual funds offered by Fidelity's competitors, and that the fund's shareholders, with the opportunity to review and weigh the disclosure provided by the fund in its prospectus and other public disclosures, have chosen to invest in this fund, managed by Fidelity.
Nature, Extent, and Quality of Services Provided. The Board considered the staffing within the investment adviser, FMR, and the sub-advisers (together, the Investment Advisers), including the backgrounds of the fund's investment personnel and the fund's investment objective and discipline. The Independent Trustees also had discussions with senior management of Fidelity's investment operations and investment groups. The Board considered the structure of the portfolio manager compensation program and whether this structure provides appropriate incentives to act in the best interest of the fund.
Resources Dedicated to Investment Management and Support Services. The Board and the equity research subcommittee of the Board's Fund Oversight Committee reviewed the size, education, and experience of the Investment Advisers' investment staff, their use of technology, and the Investment Advisers' approach to recruiting, training, and retaining portfolio managers and other research, advisory, and management personnel. The Board noted that Fidelity's analysts have access to a variety of technological tools and market and securities data that enable them to perform both fundamental and quantitative analysis and to specialize in various disciplines. The Board considered Fidelity's extensive global research capabilities that enable the Investment Advisers to aggregate data from various sources in an effort to produce positive investment results. The Board also considered that Fidelity's portfolio managers and analysts have access to daily portfolio attribution that allows for monitoring of a fund's portfolio, as well as an electronic communication system that provides immediate real-time access to research concerning issuers and credit enhancers. The Board noted FMR's continued focus on strengthening the organization and discipline of equity portfolio management and research.
Shareholder and Administrative Services. The Board considered (i) the nature, extent, quality, and cost of advisory, administrative, and shareholder services performed by the Investment Advisers and their affiliates under the Advisory Contracts and under separate agreements covering transfer agency, pricing and bookkeeping, and securities lending services for the fund; (ii) the nature and extent of the investment adviser's supervision of third party service providers, principally custodians and subcustodians; and (iii) the resources devoted to, and the record of compliance with, the fund's compliance policies and procedures. The Board also reviewed the allocation of fund brokerage, including allocations to brokers affiliated with the Investment Advisers, the use of brokerage commissions to pay fund expenses, and the use of "soft" commission dollars to pay for research services.
The Board noted that the growth of fund assets over time across the complex allows Fidelity to reinvest in the development of services designed to enhance the value or convenience of the Fidelity funds as investment vehicles. These services include 24-hour access to account information and market information through phone representatives and over the Internet, and investor education materials and asset allocation tools.
Investment in a Large Fund Family. The Board considered the benefits to shareholders of investing in a Fidelity fund, including the benefits of investing in a fund that is part of a large family of funds offering a variety of investment disciplines and providing a large variety of mutual fund investor services. The Board noted that Fidelity had taken, or had made recommendations that resulted in the Fidelity funds taking, a number of actions over the previous year that benefited particular funds, including (i) dedicating additional resources to investment research and restructuring and broadening the focus of the investment research teams; (ii) bolstering the senior management team that oversees asset management; (iii) launching Class F of certain funds as a lower-fee class available to Freedom K and Freedom Index Funds; (iv) lowering the initial investment minimums and ongoing balance requirements for Real Estate High Income Fund; (v) eliminating subsequent purchase minimums for all funds and adding a waiver of the investment minimum requirement for new accounts opened with the proceeds of a systematic withdrawal plan; (vi) eliminating the withdrawal minimum and maximum limits for systematic withdrawals from Advisor funds; (vii) expanding sales load waivers on Class A shares for Destiny Planholders and expanding Institutional Class eligibility for Class O Destiny Planholders; and (viii) changing certain Class A and Class T sales charge structures to further align them with industry practices.
Annual Report
Investment Performance. The Board considered whether the fund has operated in accordance with its investment objective, as well as its record of compliance with its investment restrictions. It reviewed the fund's absolute investment performance for the retail class, as well as the fund's relative investment performance for the retail class measured over multiple periods against (i) a broad-based securities market index, and (ii) a peer group of mutual funds deemed appropriate by Fidelity and reviewed by the Board. The following charts considered by the Board show, over the one-, three-, and five-year periods ended December 31, 2009, the cumulative total returns of the retail class of the fund, the cumulative total returns of a broad-based securities market index ("benchmark"), and a range of cumulative total returns of a peer group of mutual funds identified by Morningstar, Inc. as having an investment style similar to that of the fund based on underlying portfolio holdings. (The Advisor classes of the fund had less than one year of performance as of December 31, 2009.) The box within each chart shows the 25th percentile return (bottom of box) and the 75th percentile return (top of box) of the peer group. Returns shown above the box are in the first quartile and returns shown below the box are in the fourth quartile. The percentage beaten number noted below each chart corresponds to the percentile box and represents the percentage of funds in the peer group whose performance was equal to or lower than that of the retail class of the fund.
Fidelity Worldwide Fund

The Board reviewed the fund's relative investment performance against its peer group and noted that the performance of the retail class of the fund was in the third quartile for the one-year period and the second quartile for the three- and five-year periods. The Board also noted that the investment performance of the retail class of the fund compared favorably to its benchmark for the three- and five-year periods, although the fund's one-year cumulative total return was below its benchmark. The Board also reviewed the fund's performance since inception as well as performance in the current year.
The Board also considered that the fund's management fee is subject to upward or downward adjustment depending upon whether, and to what extent, the fund's investment performance for the performance period exceeds, or is exceeded by, the record (over the same period) of a Board-approved performance adjustment index. The Board realizes that the performance adjustment provides FMR with a strong economic incentive to seek to achieve superior performance for the fund's shareholders and helps to more closely align the interests of FMR and the fund's shareholders.
Based on its review, and giving particular weight to the nature and quality of the resources dedicated by the Investment Advisers to maintain and improve relative performance and factoring in the unprecedented market events in recent years, the Board concluded that the nature, extent, and quality of investment management and support services and of shareholder and administrative services provided to the fund will benefit the fund's shareholders, particularly in light of the Board's view that the fund's shareholders benefit from investing in a fund that is part of a large family of funds offering a variety of investment disciplines and services.
Annual Report
Board Approval of Investment Advisory Contracts and Management Fees - continued
Competitiveness of Management Fee and Total Fund Expenses. The Board considered the fund's management fee and total expenses compared to "mapped groups" of competitive funds and classes. Fidelity creates "mapped groups" by combining similar Lipper investment objective categories that have comparable management fee characteristics. Combining Lipper investment objective categories aids the Board's management fee and total expense comparisons by broadening the competitive group used for comparison and by reducing the number of universes to which various Fidelity funds are compared.
Management Fee. The Board considered two proprietary management fee comparisons for the 12-month periods shown in the chart below. The group of Lipper funds used by the Board for management fee comparisons is referred to below as the "Total Mapped Group." The Total Mapped Group comparison focuses on a fund's standing relative to the total universe of comparable funds available to investors, in terms of gross management fees before expense reimbursements or caps, and without giving effect to the fund's performance adjustment. "TMG %" represents the percentage of funds in the Total Mapped Group that had management fees that were lower than the fund's. For example, a TMG % of 15% means that 85% of the funds in the Total Mapped Group had higher management fees than the fund. The "Asset-Size Peer Group" (ASPG) comparison focuses on a fund's standing relative to non-Fidelity funds similar in size to the fund within the Total Mapped Group. The ASPG represents at least 15% of the funds in the Total Mapped Group with comparable asset size and management fee characteristics, subject to a minimum of 50 funds (or all funds in the Total Mapped Group if fewer than 50). Additional information, such as the ASPG quartile in which the fund's management fee ranked and the impact of the fund's performance adjustment, is also included in the chart and considered by the Board.
Fidelity Worldwide Fund

The Board noted that the fund's management fee ranked below the median of its Total Mapped Group and below the median of its ASPG for 2009. The Board also noted the effect of the fund's positive performance adjustment on the fund's management fee ranking. The Board noted that the performance adjustment for each year represents calculations for performance periods that differ from the periods shown in the performance charts above.
Based on its review, the Board concluded that the fund's management fee is fair and reasonable in light of the services that the fund receives and the other factors considered.
Total Expenses. In its review of each class's total expenses, the Board considered the fund's management fee as well as other fund or class expenses, as applicable, such as transfer agent fees, pricing and bookkeeping fees, fund-paid 12b-1 fees, and custodial, legal, and audit fees. The Board also noted the effects of any waivers and reimbursements on fees and expenses, as well as the impact of the fund's performance adjustment. As part of its review, the Board also considered current and historical total expenses of each class of the fund compared to competitive fund median expenses. Each class of the fund is compared to those funds and classes in the Total Mapped Group (used by the Board for management fee comparisons) that have a similar sales load structure.
The Board noted that the total expenses of each of Class B, Class C, and the retail class of Worldwide Fund ranked below its competitive median for 2009, the total expenses of Class A ranked equal to its competitive median for 2009, and the total expenses of each of Class T and Institutional Class ranked above its competitive median for 2009. The Board considered that the total expenses for Class T were above the median primarily because its 12b-1 fee is higher than the typical front-end load class. The Board noted that the fund offers multiple classes, each of which has a different sales load and 12b-1 fee structure, and that the multiple structures are intended to offer a range of pricing options for the intermediary market. The Board also noted that the total expenses of the classes vary primarily by the level of their 12b-1 fees, although differences in transfer agent fees may also cause expenses to vary from class to class.
Annual Report
Fees Charged to Other Fidelity Clients. The Board also considered Fidelity fee structures and other information with respect to clients of FMR and its affiliates, such as other mutual funds advised or subadvised by FMR or its affiliates, pension plan clients, and other institutional clients. In March 2010, the Board created an ad hoc joint committee with the board of other Fidelity funds (the Committee) to review and compare Fidelity's institutional investment advisory business with its business of providing services to the Fidelity funds, including the differences in services provided, fees charged, and costs incurred, as well as competition in their respective marketplaces.
Based on its review of total expenses and fees charged to other Fidelity clients, the Board concluded that the total expenses of each class of the fund were reasonable in light of the services that the fund and its shareholders receive and the other factors considered, including the findings of the Committee.
Costs of the Services and Profitability. The Board considered the revenues earned and the expenses incurred by Fidelity in conducting the business of developing, marketing, distributing, managing, administering and servicing the fund and its shareholders. The Board also considered the level of Fidelity's profits in respect of all the Fidelity funds.
On an annual basis, FMR presents to the Board Fidelity's profitability for the fund. Fidelity calculates the profitability for each fund, as well as aggregate profitability for groups of Fidelity funds and all Fidelity funds, using a series of detailed revenue and cost allocation methodologies which originate with the audited books and records of Fidelity. The Audit Committee of the Board reviews any significant changes from the prior year's methodologies.
PricewaterhouseCoopers LLP (PwC), independent registered public accounting firm and auditor to Fidelity and certain Fidelity funds, has been engaged annually by the Board as part of the Board's assessment of Fidelity's profitability analysis. PwC's engagement includes the review and assessment of Fidelity's methodologies used in determining the revenues and expenses attributable to Fidelity's mutual fund business, and completion of agreed-upon procedures surrounding the mathematical accuracy of fund profitability and its conformity to allocation methodologies. After considering PwC's reports issued under the engagement and information provided by Fidelity, the Board believes that while other allocation methods may also be reasonable, Fidelity's profitability methodologies are reasonable in all material respects.
The Board has also reviewed Fidelity's non-fund businesses and fall-out benefits related to the mutual fund business as well as cases where Fidelity's affiliates may benefit from or be related to the fund's business.
The Board considered the costs of the services provided by and the profits realized by Fidelity in connection with the operation of the fund and were satisfied that the profitability was not excessive in the circumstances.
Economies of Scale. The Board considered whether there have been economies of scale in respect of the management of the Fidelity funds, whether the Fidelity funds (including the fund) have appropriately benefited from any such economies of scale, and whether there is potential for realization of any further economies of scale. The Board considered the extent to which the fund will benefit from economies of scale through increased services to the fund, through waivers or reimbursements, or through fee or expense reductions.
In February 2009, the Board and the board of other Fidelity funds created an ad hoc committee (the Economies of Scale Committee) to analyze whether FMR attains economies of scale in respect of the management and servicing of the Fidelity funds, whether the Fidelity funds have appropriately benefited from such economies of scale, and whether there is potential for realization of any further economies of scale.
The Board recognized that the fund's management contract incorporates a "group fee" structure, which provides for lower group fee rates as total fund assets under FMR's management increase, and for higher group fee rates as total fund assets under FMR's management decrease. FMR calculates the group fee rates based on a tiered asset "breakpoint" schedule that varies based on asset class. The Board considered that the group fee is designed to deliver the benefits of economies of scale to fund shareholders when total Fidelity fund assets increase, even if assets of any particular fund are unchanged or have declined, because some portion of Fidelity's costs are attributable to services provided to all Fidelity funds, and all funds benefit if those costs can be allocated among more assets. The Board concluded that, given the group fee structure, fund shareholders will benefit from lower management fees as assets under FMR's management increase at the fund complex level, regardless of whether Fidelity achieves any such economies of scale.
The Board concluded, considering the findings of the Economies of Scale Committee, that any potential economies of scale are being appropriately shared between fund shareholders and Fidelity.
Additional Information Requested by the Board. In order to develop fully the factual basis for consideration of the Fidelity funds' Advisory Contracts, the Board requested and received additional information on certain topics, including (i) fund performance trends, actions to be taken by FMR to improve certain funds' overall performance, and Fidelity's long-term strategies for certain funds; (ii) portfolio manager changes that have occurred during the past year and length of portfolio manager tenure for different categories of funds over time; (iii) Fidelity's compensation structure for portfolio managers, research analysts, and other key personnel, the rationale for the compensation structure, and how the compensation structure provides appropriate performance incentives; (iv) the amount of the investment that each portfolio manager has made in the Fidelity fund(s) that he or she manages; (v) management and other fees paid by FMR to affiliated sub-advisers on behalf of the Fidelity funds; (vi) Fidelity's fee structures and rationale for recommending different fees among different categories of funds; (vii) Fidelity's rationale for recommending which funds should have a performance adjustment component as part of their management fees; (viii) the rationale for any differences between fund fee structures and fee structures in place for other Fidelity clients; and (ix) explanations regarding the relative total expenses borne by certain funds and classes, total expense competitive trends, and actions that might be taken by FMR to reduce total expenses for certain funds and classes.
Annual Report
Board Approval of Investment Advisory Contracts and Management Fees - continued
Based on its evaluation of all of the conclusions noted above, and after considering all factors it believed relevant, the Board ultimately concluded that the advisory fee structures are fair and reasonable, and that the fund's Advisory Contracts should be renewed.
Annual Report
Investment Adviser
Fidelity Management & Research Company
Boston, MA
Investment Sub-Advisers
FMR Co., Inc.
Fidelity Management & Research
(U.K.) Inc.
Fidelity Research & Analysis Company
FIL Investments (Japan) Limited
FIL Investment Advisors
FIL Investment Advisors
(U.K.) Ltd.
Fidelity Management & Research
(Hong Kong) Limited
Fidelity Management & Research
(Japan) Inc.
General Distributor
Fidelity Distributors Corporation
Boston, MA
Transfer and Service Agents
Fidelity Investments Institutional
Operations Company, Inc.
Boston, MA
Fidelity Service Company, Inc.
Boston, MA
Custodian
JPMorgan Chase Bank
New York, NY
AWLD-UANN-1210
1.883445.101
(Fidelity Investment logo)(registered trademark)
Fidelity AdvisorSM
Worldwide Fund
Institutional Class
Annual Report
October 31, 2010
Institutional Class is a class of
Fidelity® Worldwide Fund
(2_fidelity_logos) (Registered_Trademark)
Contents
Chairman's Message | <Click Here> | The Chairman's message to shareholders. |
Performance | <Click Here> | How the fund has done over time. |
Management's Discussion of Fund Performance | <Click Here> | The Portfolio Managers' review of fund performance and strategy. |
Shareholder Expense Example | <Click Here> | An example of shareholder expenses. |
Investment Changes | <Click Here> | A summary of major shifts in the fund's investments over the past six months. |
Investments | <Click Here> | A complete list of the fund's investments with their market values. |
Financial Statements | <Click Here> | Statements of assets and liabilities, operations, and changes in net assets, as well as financial highlights. |
Notes | <Click Here> | Notes to the financial statements. |
Report of Independent Registered Public Accounting Firm | <Click Here> | |
Trustees and Officers | <Click Here> | |
Distributions | <Click Here> | |
Board Approval of Investment Advisory Contracts and Management Fees | <Click Here> | |
To view a fund's proxy voting guidelines and proxy voting record for the 12-month period ended June 30, visit http://www.fidelity.com/proxyvotingresults or visit the Securities and Exchange Commission's (SEC) web site at http://www.sec.gov. You may also call 1-877-208-0098 to request a free copy of the proxy voting guidelines.
Standard & Poor's, S&P and S&P 500 are registered service marks of The McGraw-Hill Companies, Inc. and have been licensed for use by Fidelity Distributors Corporation.
Other third party marks appearing herein are the property of their respective owners.
All other marks appearing herein are registered or unregistered trademarks or service marks of FMR LLC or an affiliated company.
This report and the financial statements contained herein are submitted for the general information of the shareholders of the fund. This report is not authorized for distribution to prospective investors in the fund unless preceded or accompanied by an effective prospectus.
A fund files its complete schedule of portfolio holdings with the SEC for the first and third quarters of each fiscal year on Form N-Q. Forms N-Q are available on the SEC's web site at http://www.sec.gov. A fund's Forms N-Q may be reviewed and copied at the SEC's Public Reference Room in Washington, DC. Information regarding the operation of the SEC's Public Reference Room may be obtained by calling 1-800-SEC-0330. For a complete list of a fund's portfolio holdings, view the most recent holdings listing, semiannual report, or annual report on Fidelity's web site at http://www.fidelity.com or http://www.advisor.fidelity.com, as applicable.
NOT FDIC INSURED • MAY LOSE VALUE • NO BANK GUARANTEE
Neither the fund nor Fidelity Distributors Corporation is a bank.
Annual Report
(photo_of_Edward_C_Johnson_3d)
Dear Shareholder:
Equities have staged a rally in the second half of 2010, shaking off concerns about the European debt crisis and the possibility of a double-dip recession in the U.S. Although the short-term surge pushed major equity indexes back into positive territory for the year, several questions remain about the longer-term outlook, including lackluster economic growth and persistently high unemployment. Financial markets are always unpredictable, of course, but there also are several time-tested investment principles that can help put the odds in your favor.
One of the basic tenets is to invest for the long term. Over time, riding out the markets' inevitable ups and downs has proven much more effective than selling into panic or chasing the hottest trend. Even missing only a few of the markets' best days can significantly diminish investor returns. Patience also affords the benefits of compounding - of earning interest on additional income or reinvested dividends and capital gains. There can be tax advantages and cost benefits to consider as well. While staying the course doesn't eliminate risk, it can considerably lessen the effect of short-term declines.
You can further manage your investing risk through diversification. And today, more than ever, geographic diversification should be taken into account. Studies indicate that asset allocation is the single most important determinant of a portfolio's long-term success. The right mix of stocks, bonds and cash - aligned to your particular risk tolerance and investment objective - is very important. Age-appropriate rebalancing is also an essential aspect of asset allocation. For younger investors, an emphasis on equities - which historically have been the best-performing asset class over time - is encouraged. As investors near their specific goal, such as retirement or sending a child to college, consideration may be given to replacing volatile assets (e.g. common stocks) with more-stable fixed investments (bonds or savings plans).
A third principle - investing regularly - can help lower the average cost of your purchases. Investing a certain amount of money each month or quarter helps ensure you won't pay for all your shares at market highs. This strategy - known as dollar cost averaging - also reduces "emotion" from investing, helping shareholders avoid selling weak performers just prior to an upswing, or chasing a hot performer just before a correction.
We invite you to contact us via the Internet, through our Investor Centers or by phone. It is our privilege to provide you the information you need to make the investments that are right for you.
Sincerely,
(The chairman's signature appears here.)
Edward C. Johnson 3d
Annual Report
Average annual total return reflects the change in the value of an investment, assuming reinvestment of the class' distributions from dividend income and capital gains (the profits earned upon the sale of securities that have grown in value, if any) and assuming a constant rate of performance each year. The $10,000 table and the fund's returns do not reflect the deduction of taxes that a shareholder would pay on fund distributions or the redemption of fund shares. During periods of reimbursement by Fidelity, a fund's total return will be greater than it would be had the reimbursement not occurred. How a fund did yesterday is no guarantee of how it will do tomorrow.
Average Annual Total Returns
Periods ended October 31, 2010 | Past 1
year | Past 5
years | Past 10
years |
Institutional Class A | 18.08% | 4.94% | 4.19% |
A The initial offering of Institutional Class took place on February 19, 2009. Returns prior to February 19, 2009 are those of Fidelity Worldwide Fund, the original class of the fund.
$10,000 Over 10 Years
Let's say hypothetically that $10,000 was invested in Fidelity Advisor Worldwide Fund - Institutional Class, on October 31, 2000. The chart shows how the value of your investment would have changed, and also shows how the MSCI® World Index performed over the same period. The initial offering of Institutional Class took place on February 19, 2009. See above for additional information regarding the performance of Institutional Class.

Annual Report
Market Recap: Developed-markets equities rode a wave of volatility during the 12 months ending October 31, 2010, en route to producing above-average gains. Stocks posted solid advances in the first half of the period, despite growing concerns about the Greece-led European debt crisis. Sentiment turned decidedly negative in May and June, however, and the market suffered a precipitous decline. These losses were more than offset during the last four months of the period, when signs of economic growth and subsiding debt fears helped propel developed-world stocks about 18%. For the full year, the MSCI® World Index gained 13.15%, boosted in part by a generally depreciating U.S. dollar. Within the index, Canada and the United States were standouts, returning 23% and 17%, respectively. U.S. stocks - which comprised almost half of the index - were lifted by economic optimism, encouraging earnings reports and a wave of corporate mergers. The Pacific Basin ex-Japan segment rose 15% for the period, aided in part by solid results from Hong Kong. Elsewhere, the U.K. returned 13%, while the remainder of Europe rose just 7%, held back mainly by debt-riddled Spain and Italy, as well as lagging major constituent France. Japan advanced only 5%, a result of that nation's continued weak economy.
Comments from William Kennedy, Lead Portfolio Manager of Fidelity AdvisorSM Worldwide Fund and manager of its non-U.S. equity subportfolio, and Stephen DuFour, Co-Portfolio Manager responsible for the fund's U.S. equity subportfolio: For the 12 months ending October 31, 2010, the fund's Institutional Class shares returned 18.08%, outpacing the MSCI index. Our focus on reasonably valued stocks with good balance sheets and strong earnings growth prospects helped drive favorable stock selection, especially in the information technology and industrials sectors. U.S. stocks - about 47% of assets, on average - had the biggest positive impact on performance. Good stock picking within strong-performing emerging markets, where the fund had a small out-of-benchmark stake, also contributed, as did favorable positioning in Europe and Japan. Weak security selection and an underweighting in Canada - along with the associated currency drag - disappointing stock selection in energy and a small cash position hampered performance Individual contributors included Cummins, a leading diesel engine manufacturer, and Union Pacific, a West Coast railroad company. Both of these industrials firms benefited from a recovering economy. Within technology, Apple was up sharply, thanks to the successful launch of the iPad and worldwide growth of the iPhone. Untimely ownership of General Electric, a diversified conglomerate in the industrials sector, and coal company Peabody Energy detracted from results. These stocks were sold from the fund by period end.
The views expressed above reflect those of the portfolio manager(s) only through the end of the period as stated on the cover of this report and do not necessarily represent the views of Fidelity or any other person in the Fidelity organization. Any such views are subject to change at any time based upon market or other conditions and Fidelity disclaims any responsibility to update such views. These views may not be relied on as investment advice and, because investment decisions for a Fidelity fund are based on numerous factors, may not be relied on as an indication of trading intent on behalf of any Fidelity fund.
Annual Report
Fidelity Worldwide Fund
As a shareholder of the Fund, you incur two types of costs: (1) transaction costs, including sales charges (loads) on purchase payments or redemption proceeds, redemption fees, and (2) ongoing costs, including management fees, distribution and/or service (12b-1) fees and other Fund expenses. This Example is intended to help you understand your ongoing costs (in dollars) of investing in the Fund and to compare these costs with the ongoing costs of investing in other mutual funds.
The Example is based on an investment of $1,000 invested at the beginning of the period and held for the entire period (May 1, 2010 to October 31, 2010).
Actual Expenses
The first line of the accompanying table for each class of the Fund provides information about actual account values and actual expenses. You may use the information in this line, together with the amount you invested, to estimate the expenses that you paid over the period. Simply divide your account value by $1,000.00 (for example, an $8,600 account value divided by $1,000.00 = 8.6), then multiply the result by the number in the first line for a class of the Fund under the heading entitled "Expenses Paid During Period" to estimate the expenses you paid on your account during this period. A small balance maintenance fee of $12.00 that is charged once a year may apply for certain accounts with a value of less than $2,000. This fee is not included in the table below. If it was, the estimate of expenses you paid during the period would be higher, and your ending account value lower, by this amount. In addition, the Fund, as a shareholder in the underlying Fidelity Central Funds, will indirectly bear its pro-rata share of the fees and expenses incurred by the underlying Fidelity Central Funds. These fees and expenses are not included in the Fund's annualized expense ratio used to calculate the expense estimate in the table below.
Hypothetical Example for Comparison Purposes
The second line of the accompanying table for each class of the Fund provides information about hypothetical account values and hypothetical expenses based on a Class' actual expense ratio and an assumed rate of return of 5% per year before expenses, which is not the Class' actual return. The hypothetical account values and expenses may not be used to estimate the actual ending account balance or expenses you paid for the period. You may use this information to compare the ongoing costs of investing in the Fund and other funds. To do so, compare this 5% hypothetical example with the 5% hypothetical examples that appear in the shareholder reports of the other funds. A small balance maintenance fee of $12.00 that is charged once a year may apply for certain accounts with a value of less than $2,000. This fee is not included in the table below. If it was, the estimate of expenses you paid during the period would be higher, and your ending account value lower, by this amount. In addition, the Fund, as a shareholder in the underlying Fidelity Central Funds, will indirectly bear its pro-rata share of the fees and expenses incurred by the underlying Fidelity Central Funds. These fees and expenses are not included in the Fund's annualized expense ratio used to calculate the expense estimate in the table below.
Please note that the expenses shown in the table are meant to highlight your ongoing costs only and do not reflect any transaction costs. Therefore, the second line of the table is useful in comparing ongoing costs only, and will not help you determine the relative total costs of owning different funds. In addition, if these transactional costs were included, your costs would have been higher.
| Annualized
Expense Ratio | Beginning
Account Value
May 1, 2010 | Ending
Account Value
October 31, 2010 | Expenses Paid
During Period*
May 1, 2010
to October 31, 2010 |
Class A | 1.42% | | | |
Actual | | $ 1,000.00 | $ 1,044.80 | $ 7.32 |
HypotheticalA | | $ 1,000.00 | $ 1,018.05 | $ 7.22 |
Class T | 1.68% | | | |
Actual | | $ 1,000.00 | $ 1,043.60 | $ 8.65 |
HypotheticalA | | $ 1,000.00 | $ 1,016.74 | $ 8.54 |
Class B | 2.17% | | | |
Actual | | $ 1,000.00 | $ 1,040.70 | $ 11.16 |
HypotheticalA | | $ 1,000.00 | $ 1,014.27 | $ 11.02 |
Class C | 2.17% | | | |
Actual | | $ 1,000.00 | $ 1,040.80 | $ 11.16 |
HypotheticalA | | $ 1,000.00 | $ 1,014.27 | $ 11.02 |
Worldwide | 1.11% | | | |
Actual | | $ 1,000.00 | $ 1,045.80 | $ 5.72 |
HypotheticalA | | $ 1,000.00 | $ 1,019.61 | $ 5.65 |
Institutional Class | 1.18% | | | |
Actual | | $ 1,000.00 | $ 1,045.80 | $ 6.08 |
HypotheticalA | | $ 1,000.00 | $ 1,019.26 | $ 6.01 |
A 5% return per year before expenses
* Expenses are equal to each Class' annualized expense ratio, multiplied by the average account value over the period, multiplied by 184/365 (to reflect the one-half year period).
Annual Report
Fidelity Worldwide Fund
Investment Changes (Unaudited)
Geographic Diversification (% of fund's net assets) |
As of October 31, 2010 |
| United States of America | 47.3% | |
| United Kingdom | 10.6% | |
| Japan | 6.1% | |
| Germany | 4.5% | |
| France | 4.4% | |
| Switzerland | 3.9% | |
| Spain | 1.9% | |
| Denmark | 1.9% | |
| India | 1.7% | |
| Other | 17.7% | |

Percentages are adjusted for the effect of futures contracts, if applicable. |
As of April 30, 2010 |
| United States of America | 50.2% | |
| United Kingdom | 9.8% | |
| Japan | 9.1% | |
| France | 4.7% | |
| Switzerland | 3.6% | |
| Germany | 3.3% | |
| Netherlands | 1.8% | |
| Australia | 1.5% | |
| Spain | 1.4% | |
| Other | 14.6% | |

Percentages are adjusted for the effect of futures contracts, if applicable. |
Asset Allocation |
| % of fund's
net assets | % of fund's net assets
6 months ago |
Stocks | 98.2 | 98.6 |
Bonds | 0.2 | 0.0 |
Short-Term Investments and Net Other Assets | 1.6 | 1.4 |
Top Ten Stocks as of October 31, 2010 |
| % of fund's
net assets | % of fund's net assets
6 months ago |
Union Pacific Corp. (United States of America, Road & Rail) | 2.7 | 2.7 |
Cummins, Inc. (United States of America, Machinery) | 2.3 | 2.2 |
Exxon Mobil Corp. (United States of America, Oil, Gas & Consumable Fuels) | 2.0 | 0.0 |
Estee Lauder Companies, Inc. Class A (United States of America, Personal Products) | 1.9 | 0.9 |
Google, Inc. Class A (United States of America, Internet Software & Services) | 1.8 | 0.0 |
Apple, Inc. (United States of America, Computers & Peripherals) | 1.8 | 2.3 |
Perrigo Co. (United States of America, Pharmaceuticals) | 1.5 | 0.4 |
Edwards Lifesciences Corp. (United States of America, Health Care Equipment & Supplies) | 1.3 | 0.6 |
eBay, Inc. (United States of America, Internet Software & Services) | 1.3 | 0.0 |
CSX Corp. (United States of America, Road & Rail) | 1.3 | 0.9 |
| 17.9 | |
Market Sectors as of October 31, 2010 |
| % of fund's
net assets | % of fund's net assets
6 months ago |
Industrials | 17.0 | 15.8 |
Consumer Discretionary | 17.1 | 16.7 |
Information Technology | 15.6 | 15.2 |
Financials | 13.5 | 18.9 |
Health Care | 10.3 | 10.3 |
Energy | 8.4 | 8.8 |
Consumer Staples | 7.0 | 5.6 |
Materials | 6.3 | 4.6 |
Telecommunication Services | 3.0 | 1.9 |
Utilities | 0.2 | 0.8 |
Annual Report
Fidelity Worldwide Fund
Investments October 31, 2010
Showing Percentage of Net Assets
Common Stocks - 96.8% |
| Shares | | Value |
Australia - 1.5% |
Australia & New Zealand Banking Group Ltd. | 244,941 | | $ 5,953,320 |
JB Hi-Fi Ltd. | 75,078 | | 1,462,177 |
Macquarie Group Ltd. | 78,951 | | 2,799,865 |
Newcrest Mining Ltd. | 70,629 | | 2,764,900 |
Wesfarmers Ltd. | 61,452 | | 1,995,076 |
Westfield Group unit | 128,519 | | 1,558,687 |
TOTAL AUSTRALIA | | 16,534,025 |
Bailiwick of Jersey - 0.3% |
Experian PLC | 201,300 | | 2,339,830 |
Informa PLC | 111,595 | | 779,533 |
TOTAL BAILIWICK OF JERSEY | | 3,119,363 |
Belgium - 0.6% |
Anheuser-Busch InBev SA NV | 98,425 | | 6,167,699 |
EVS Broadcast Equipment SA | 13,200 | | 828,358 |
TOTAL BELGIUM | | 6,996,057 |
Bermuda - 0.5% |
Huabao International Holdings Ltd. | 1,495,000 | | 2,252,746 |
Li & Fung Ltd. | 258,000 | | 1,363,019 |
Noble Group Ltd. | 1,474,363 | | 2,118,763 |
Sihuan Pharmaceutical Holdings Group Ltd. | 53,000 | | 38,496 |
TOTAL BERMUDA | | 5,773,024 |
Brazil - 1.0% |
Banco ABC Brasil SA | 60,000 | | 591,112 |
Banco Santander (Brasil) SA ADR | 102,900 | | 1,481,760 |
Cia Hering SA | 4,000 | | 196,920 |
Diagnosticos da America SA | 135,000 | | 1,666,471 |
Drogasil SA | 85,300 | | 2,157,571 |
Hypermarcas SA (a) | 13,000 | | 213,967 |
Lojas Renner SA | 7,000 | | 276,511 |
Natura Cosmeticos SA | 7,000 | | 200,388 |
Souza Cruz Industria Comerico | 85,300 | | 4,382,832 |
TOTAL BRAZIL | | 11,167,532 |
British Virgin Islands - 0.7% |
HLS Systems International Ltd. (a) | 67,343 | | 851,216 |
Playtech Ltd. | 200,359 | | 1,437,301 |
UTI Worldwide, Inc. | 303,000 | | 5,823,660 |
TOTAL BRITISH VIRGIN ISLANDS | | 8,112,177 |
Canada - 1.5% |
Agrium, Inc. | 20,000 | | 1,769,193 |
Dollarama, Inc. | 72,209 | | 1,903,106 |
First Quantum Minerals Ltd. | 13,800 | | 1,208,430 |
InterOil Corp. (a) | 13,400 | | 953,812 |
Keyera Facilities Income Fund | 99,000 | | 3,072,213 |
Niko Resources Ltd. | 26,700 | | 2,547,220 |
Open Text Corp. (a) | 41,800 | | 1,849,217 |
|
| Shares | | Value |
Pan American Silver Corp. | 45,500 | | $ 1,452,360 |
Petrobank Energy & Resources Ltd. (a) | 46,800 | | 1,862,547 |
TOTAL CANADA | | 16,618,098 |
Cayman Islands - 1.5% |
Belle International Holdings Ltd. | 505,000 | | 912,111 |
Bosideng International Holdings Ltd. | 4,572,000 | | 2,312,174 |
China Lodging Group Ltd. ADR | 36,400 | | 884,884 |
Ctrip.com International Ltd. sponsored ADR (a) | 27,200 | | 1,416,304 |
Eurasia Drilling Co. Ltd. GDR (d) | 27,400 | | 698,700 |
Evergreen International Holdings Ltd. (a) | 58,000 | | 34,420 |
Hengdeli Holdings Ltd. | 4,104,000 | | 2,276,691 |
Herbalife Ltd. | 26,000 | | 1,660,360 |
Mongolian Mining Corp. | 1,526,000 | | 1,651,752 |
Perfect World Co. Ltd. sponsored ADR Class B (a) | 50,200 | | 1,626,480 |
Shenguan Holdings Group Ltd. | 1,148,000 | | 1,495,862 |
TPK Holdings Co. | 3,000 | | 49,502 |
Want Want China Holdings Ltd. | 2,043,000 | | 1,884,528 |
TOTAL CAYMAN ISLANDS | | 16,903,768 |
China - 0.6% |
Baidu.com, Inc. sponsored ADR (a) | 17,900 | | 1,969,179 |
China Merchants Bank Co. Ltd. (H Shares) | 1,000,500 | | 2,839,671 |
Comba Telecom Systems Holdings Ltd. | 408,980 | | 464,315 |
Minth Group Ltd. | 238,000 | | 445,218 |
Zhaojin Mining Industry Co. Ltd. (H Shares) | 255,500 | | 794,394 |
ZTE Corp. (H Shares) | 128,376 | | 476,985 |
TOTAL CHINA | | 6,989,762 |
Cyprus - 0.0% |
Aisi Realty Public Ltd. (a) | 1,232,268 | | 34,550 |
Denmark - 1.9% |
Carlsberg AS Series B | 37,700 | | 4,122,371 |
Novo Nordisk AS Series B | 94,116 | | 9,880,512 |
Pandora A/S | 41,900 | | 2,032,804 |
William Demant Holding AS (a) | 58,200 | | 4,362,475 |
TOTAL DENMARK | | 20,398,162 |
Egypt - 0.1% |
Orascom Construction Industries SAE GDR | 24,600 | | 1,138,980 |
France - 4.4% |
Accor SA | 39,500 | | 1,619,463 |
Atos Origin SA (a) | 65,745 | | 3,039,452 |
AXA SA | 119,037 | | 2,166,493 |
BNP Paribas SA | 53,888 | | 3,940,328 |
Carrefour SA | 53,867 | | 2,906,687 |
Compagnie Generale de Geophysique SA (a) | 58,200 | | 1,359,134 |
Edenred (a) | 59,000 | | 1,235,538 |
Essilor International SA | 30,396 | | 2,029,291 |
Common Stocks - continued |
| Shares | | Value |
France - continued |
GDF Suez | 41,100 | | $ 1,640,169 |
Iliad Group SA | 27,158 | | 3,057,130 |
LVMH Moet Hennessy - Louis Vuitton | 42,788 | | 6,703,907 |
Pernod-Ricard SA | 21,114 | | 1,871,741 |
PPR SA | 36,550 | | 5,991,013 |
Sanofi-Aventis | 15,104 | | 1,057,944 |
Schneider Electric SA | 32,065 | | 4,550,918 |
Societe Generale Series A | 64,751 | | 3,876,457 |
Unibail-Rodamco | 6,389 | | 1,330,829 |
TOTAL FRANCE | | 48,376,494 |
Germany - 3.1% |
Bayerische Motoren Werke AG (BMW) | 121,009 | | 8,673,149 |
Fresenius Medical Care AG & Co. KGaA | 53,500 | | 3,407,237 |
GEA Group AG | 110,697 | | 2,894,211 |
HeidelbergCement AG | 11,766 | | 615,334 |
Kabel Deutschland Holding AG | 68,500 | | 3,083,895 |
MAN SE | 45,742 | | 5,028,169 |
Metro AG | 23,500 | | 1,646,725 |
PSI AG | 69,000 | | 1,515,999 |
Siemens AG | 59,514 | | 6,797,107 |
Software AG (Bearer) | 6,000 | | 840,714 |
TOTAL GERMANY | | 34,502,540 |
Greece - 0.1% |
Coca-Cola Hellenic Bottling Co. SA | 36,300 | | 939,479 |
Hong Kong - 0.9% |
AIA Group Ltd. | 543,200 | | 1,615,321 |
Henderson Land Development Co. Ltd. | 204,232 | | 1,450,472 |
I.T Ltd. | 1,134,000 | | 956,795 |
Techtronic Industries Co. Ltd. | 3,575,500 | | 3,621,051 |
Wharf Holdings Ltd. | 264,000 | | 1,733,604 |
TOTAL HONG KONG | | 9,377,243 |
India - 1.7% |
Adani Enterprises Ltd. | 108,277 | | 1,720,829 |
Gitanjali Gems Ltd. | 135,298 | | 904,886 |
Housing Development Finance Corp. Ltd. | 81,615 | | 1,266,252 |
IndusInd Bank Ltd. | 112,500 | | 669,036 |
INFO Edge India Ltd. | 36,696 | | 563,252 |
Infrastructure Development Finance Co. Ltd. | 329,354 | | 1,486,458 |
Larsen & Toubro Ltd. | 57,646 | | 2,637,215 |
LIC Housing Finance Ltd. | 108,161 | | 3,271,184 |
Reliance Industries Ltd. | 74,372 | | 1,839,375 |
Rural Electrification Corp. Ltd. | 149,130 | | 1,247,040 |
Shriram Transport Finance Co. Ltd. | 33,464 | | 665,430 |
State Bank of India | 11,744 | | 834,758 |
The Jammu & Kashmir Bank Ltd. | 30,114 | | 618,551 |
Titan Industries Ltd. | 8,771 | | 702,897 |
TOTAL INDIA | | 18,427,163 |
|
| Shares | | Value |
Indonesia - 0.4% |
PT Bank Rakyat Indonesia Tbk | 1,171,000 | | $ 1,493,638 |
PT Tower Bersama Infrastructure Tbk | 514,500 | | 146,794 |
PT XL Axiata Tbk (a) | 3,712,000 | | 2,388,137 |
TOTAL INDONESIA | | 4,028,569 |
Ireland - 0.3% |
Ingersoll-Rand Co. Ltd. | 39,200 | | 1,540,952 |
James Hardie Industries NV unit (a) | 206,041 | | 1,087,961 |
Ryanair Holdings PLC sponsored ADR | 17,000 | | 554,710 |
TOTAL IRELAND | | 3,183,623 |
Israel - 0.1% |
Israel Chemicals Ltd. | 81,400 | | 1,245,073 |
Italy - 0.7% |
Intesa Sanpaolo SpA | 304,069 | | 1,069,377 |
Intesa Sanpaolo SpA (Risparmio Shares) | 347,700 | | 952,616 |
Prysmian SpA | 75,500 | | 1,463,409 |
Saipem SpA | 102,206 | | 4,540,910 |
TOTAL ITALY | | 8,026,312 |
Japan - 6.1% |
ABC-Mart, Inc. | 84,500 | | 2,874,071 |
Asics Corp. | 155,000 | | 1,673,854 |
Canon, Inc. | 72,250 | | 3,325,904 |
Cosmos Pharmaceutical Corp. | 29,500 | | 928,588 |
Denso Corp. | 86,400 | | 2,686,876 |
Don Quijote Co. Ltd. | 53,400 | | 1,459,259 |
eAccess Ltd. | 1,324 | | 965,811 |
Fast Retailing Co. Ltd. | 4,800 | | 628,758 |
Goldcrest Co. Ltd. | 8,680 | | 187,364 |
Honda Motor Co. Ltd. | 94,600 | | 3,410,215 |
JSR Corp. | 126,300 | | 2,186,354 |
Keyence Corp. | 10,400 | | 2,578,352 |
Komatsu Ltd. | 99,000 | | 2,419,702 |
Mazda Motor Corp. | 807,000 | | 2,050,949 |
Misumi Group, Inc. | 46,300 | | 992,513 |
Mitsubishi Corp. | 107,700 | | 2,586,919 |
Mitsubishi UFJ Financial Group, Inc. | 691,500 | | 3,209,254 |
Mitsui & Co. Ltd. | 120,900 | | 1,901,444 |
Mizuho Financial Group, Inc. | 985,000 | | 1,428,564 |
Nichi-iko Pharmaceutical Co. Ltd. | 64,000 | | 2,257,139 |
Nintendo Co. Ltd. | 4,700 | | 1,217,783 |
Omron Corp. | 75,900 | | 1,761,914 |
ORIX Corp. | 66,920 | | 6,104,048 |
Osaka Securities Exchange Co. Ltd. | 101 | | 508,326 |
Rakuten, Inc. | 4,389 | | 3,381,608 |
Ricoh Co. Ltd. | 164,000 | | 2,294,133 |
Sawai Pharmaceutical Co. Ltd. | 9,100 | | 794,992 |
SOFTBANK CORP. | 220,500 | | 7,081,363 |
Sony Financial Holdings, Inc. | 381 | | 1,325,711 |
Common Stocks - continued |
| Shares | | Value |
Japan - continued |
Start Today Co. Ltd. | 392 | | $ 1,219,307 |
Sumitomo Mitsui Financial Group, Inc. | 63,100 | | 1,883,393 |
TOTAL JAPAN | | 67,324,468 |
Korea (South) - 0.8% |
Hyundai Motor Co. | 10,383 | | 1,569,684 |
Kia Motors Corp. | 57,390 | | 2,291,517 |
NCsoft Corp. | 5,052 | | 1,111,934 |
NHN Corp. (a) | 6,568 | | 1,165,243 |
Samsung Electronics Co. Ltd. | 1,927 | | 1,276,669 |
Shinhan Financial Group Co. Ltd. | 22,350 | | 865,578 |
TOTAL KOREA (SOUTH) | | 8,280,625 |
Luxembourg - 0.1% |
Millicom International Cellular SA | 15,000 | | 1,419,000 |
Mauritius - 0.2% |
MakeMyTrip Ltd. | 48,400 | | 1,749,660 |
Mexico - 0.2% |
Wal-Mart de Mexico SA de CV Series V | 831,200 | | 2,273,425 |
Netherlands - 1.5% |
AEGON NV (a) | 192,700 | | 1,220,981 |
CNH Global NV (a) | 29,000 | | 1,151,010 |
Gemalto NV | 38,267 | | 1,742,229 |
ING Groep NV (Certificaten Van Aandelen) unit (a) | 279,400 | | 2,988,464 |
Koninklijke Philips Electronics NV | 124,481 | | 3,796,006 |
LyondellBasell Industries NV Class A (a) | 203,000 | | 5,452,580 |
Randstad Holdings NV (a) | 10,195 | | 485,155 |
TOTAL NETHERLANDS | | 16,836,425 |
Norway - 0.8% |
Aker Solutions ASA | 102,200 | | 1,555,858 |
DnB NOR ASA | 278,200 | | 3,817,398 |
Telenor ASA | 83,600 | | 1,347,605 |
Yara International ASA | 33,200 | | 1,745,191 |
TOTAL NORWAY | | 8,466,052 |
Poland - 0.1% |
Eurocash SA | 106,300 | | 977,025 |
Qatar - 0.1% |
Commercial Bank of Qatar GDR (Reg. S) | 279,659 | | 1,281,444 |
Singapore - 0.2% |
Keppel Corp. Ltd. | 234,000 | | 1,804,311 |
South Africa - 1.1% |
African Rainbow Minerals Ltd. | 33,000 | | 841,883 |
AngloGold Ashanti Ltd. sponsored ADR | 44,700 | | 2,105,817 |
Clicks Group Ltd. | 425,706 | | 2,777,248 |
Mr Price Group Ltd. | 201,100 | | 1,827,542 |
Sanlam Ltd. | 389,600 | | 1,460,503 |
|
| Shares | | Value |
Standard Bank Group Ltd. | 72,700 | | $ 1,072,071 |
Woolworths Holdings Ltd. | 542,336 | | 2,125,199 |
TOTAL SOUTH AFRICA | | 12,210,263 |
Spain - 1.9% |
Antena 3 Television SA | 118,200 | | 1,207,205 |
Banco Bilbao Vizcaya Argentaria SA | 227,085 | | 2,990,962 |
Banco Santander SA | 477,562 | | 6,128,223 |
Gestevision Telecinco SA | 125,500 | | 1,600,631 |
Inditex SA (c) | 21,397 | | 1,786,669 |
Prosegur Compania de Seguridad SA (Reg.) | 25,800 | | 1,545,829 |
Telefonica SA | 197,595 | | 5,338,170 |
TOTAL SPAIN | | 20,597,689 |
Sweden - 0.9% |
Elekta AB (B Shares) | 119,900 | | 4,536,446 |
H&M Hennes & Mauritz AB (B Shares) | 72,098 | | 2,540,091 |
Modern Times Group MTG AB (B Shares) | 32,200 | | 2,308,881 |
TOTAL SWEDEN | | 9,385,418 |
Switzerland - 3.9% |
Adecco SA (Reg.) | 13,014 | | 727,150 |
Compagnie Financiere Richemont SA Series A | 38,215 | | 1,905,412 |
Credit Suisse Group | 34,493 | | 1,427,527 |
Kuehne & Nagel International AG | 10,620 | | 1,313,002 |
Lonza Group AG | 18,865 | | 1,651,059 |
Nestle SA | 155,400 | | 8,509,229 |
Novartis AG | 145,299 | | 8,416,456 |
Partners Group Holding | 9,538 | | 1,744,136 |
Schindler Holding AG (participation certificate) | 12,684 | | 1,359,437 |
Sonova Holding AG Class B | 11,956 | | 1,384,654 |
Syngenta AG sponsored ADR | 75,000 | | 4,153,500 |
The Swatch Group AG (Bearer) | 9,810 | | 3,748,200 |
UBS AG (a) | 192,640 | | 3,271,483 |
Zurich Financial Services AG | 13,722 | | 3,358,185 |
TOTAL SWITZERLAND | | 42,969,430 |
Taiwan - 0.3% |
HTC Corp. | 126,150 | | 2,848,216 |
Thailand - 0.2% |
Bangkok Bank Public Co. Ltd. (For. Reg.) | 467,000 | | 2,409,870 |
Turkey - 0.4% |
Boyner Buyuk Magazacilik AS (a) | 386,000 | | 898,864 |
Dogus Otomotiv Servis ve Ticaret AS (a) | 158,000 | | 1,189,709 |
Turkiye Garanti Bankasi AS | 371,000 | | 2,276,232 |
TOTAL TURKEY | | 4,364,805 |
United Kingdom - 10.6% |
Aberdeen Asset Management PLC | 653,342 | | 1,861,125 |
Aegis Group PLC | 684,232 | | 1,377,977 |
Anglo American PLC (United Kingdom) | 87,218 | | 4,063,532 |
AstraZeneca PLC (United Kingdom) | 98,174 | | 4,937,722 |
Common Stocks - continued |
| Shares | | Value |
United Kingdom - continued |
Barclays PLC | 1,108,831 | | $ 4,872,084 |
BG Group PLC | 45,448 | | 885,060 |
BHP Billiton PLC | 293,276 | | 10,388,003 |
BP PLC | 1,345,000 | | 9,141,048 |
British American Tobacco PLC (United Kingdom) | 17,600 | | 670,411 |
British Land Co. PLC | 128,755 | | 1,051,021 |
Britvic PLC | 295,400 | | 2,283,079 |
Burberry Group PLC | 132,500 | | 2,163,183 |
Carphone Warehouse Group PLC | 852,279 | | 4,157,883 |
Cookson Group PLC (a) | 82,570 | | 681,291 |
Dialog Semiconductor PLC (a) | 25,000 | | 456,048 |
GlaxoSmithKline PLC | 343,200 | | 6,701,011 |
HSBC Holdings PLC (United Kingdom) | 643,709 | | 6,698,656 |
IG Group Holdings PLC | 354,329 | | 3,000,232 |
InterContinental Hotel Group PLC | 115,278 | | 2,226,098 |
International Personal Finance PLC | 517,515 | | 2,578,615 |
International Power PLC | 213,071 | | 1,424,544 |
Legal & General Group PLC | 996,089 | | 1,602,268 |
Lloyds Banking Group PLC (a) | 2,775,954 | | 3,050,734 |
Micro Focus International PLC | 116,800 | | 714,467 |
Ocado Group PLC (a) | 898,900 | | 2,011,921 |
Reckitt Benckiser Group PLC | 77,341 | | 4,325,764 |
Rio Tinto PLC | 81,540 | | 5,295,383 |
Royal Dutch Shell PLC Class B | 323,756 | | 10,359,427 |
Schroders PLC | 85,800 | | 2,170,564 |
SuperGroup PLC | 11,000 | | 199,147 |
TalkTalk Telecom Group PLC (a) | 964,758 | | 2,038,761 |
Ultra Electronics Holdings PLC | 32,400 | | 966,039 |
Vodafone Group PLC | 1,916,500 | | 5,238,297 |
Vodafone Group PLC sponsored ADR | 47,212 | | 1,298,802 |
Wolseley PLC (a) | 75,760 | | 2,018,531 |
Xstrata PLC | 173,300 | | 3,358,208 |
TOTAL UNITED KINGDOM | | 116,266,936 |
United States of America - 45.5% |
Amazon.com, Inc. (a) | 47,800 | | 7,893,692 |
Ameriprise Financial, Inc. | 110,000 | | 5,685,900 |
AMETEK, Inc. | 85,000 | | 4,594,250 |
Anadarko Petroleum Corp. | 156,000 | | 9,604,920 |
AnnTaylor Stores Corp. (a) | 61,000 | | 1,421,300 |
Apple, Inc. (a) | 64,600 | | 19,436,202 |
Ardea Biosciences, Inc. (a) | 33,058 | | 704,797 |
AsiaInfo Holdings, Inc. (a) | 39,100 | | 868,802 |
Autoliv, Inc. | 38,000 | | 2,709,400 |
Berkshire Hathaway, Inc. Class B (a) | 134,000 | | 10,661,040 |
BioMarin Pharmaceutical, Inc. (a) | 124,000 | | 3,243,840 |
Broadcom Corp. Class A | 140,000 | | 5,703,600 |
C.H. Robinson Worldwide, Inc. | 66,000 | | 4,651,680 |
Caterpillar, Inc. | 86,000 | | 6,759,600 |
Celanese Corp. Class A | 18,000 | | 641,700 |
CF Industries Holdings, Inc. | 15,200 | | 1,862,456 |
Chevron Corp. | 102,000 | | 8,426,220 |
|
| Shares | | Value |
Citi Trends, Inc. (a) | 53,000 | | $ 1,111,940 |
Citrix Systems, Inc. (a) | 82,000 | | 5,253,740 |
Cloud Peak Energy, Inc. | 137,000 | | 2,379,690 |
Cognizant Technology Solutions Corp. Class A (a) | 161,000 | | 10,495,590 |
CSX Corp. | 224,000 | | 13,764,800 |
Cummins, Inc. | 287,000 | | 25,284,700 |
Danaher Corp. | 13,000 | | 563,680 |
Eaton Corp. | 83,000 | | 7,372,890 |
eBay, Inc. (a) | 476,000 | | 14,189,560 |
Echo Global Logistics, Inc. | 25,000 | | 355,000 |
Edwards Lifesciences Corp. (a) | 228,000 | | 14,571,480 |
Elizabeth Arden, Inc. (a) | 44,547 | | 910,986 |
Emerson Electric Co. | 169,000 | | 9,278,100 |
Endo Pharmaceuticals Holdings, Inc. (a) | 179,000 | | 6,576,460 |
EnerSys (a) | 30,000 | | 790,800 |
Estee Lauder Companies, Inc. Class A | 288,000 | | 20,496,960 |
Exxon Mobil Corp. | 331,000 | | 22,001,570 |
Ford Motor Co. (a) | 180,000 | | 2,543,400 |
Fossil, Inc. (a) | 105,900 | | 6,247,041 |
Freeport-McMoRan Copper & Gold, Inc. | 92,300 | | 8,738,964 |
G-III Apparel Group Ltd. (a) | 147,600 | | 3,896,640 |
Google, Inc. Class A (a) | 33,000 | | 20,228,670 |
Greenbrier Companies, Inc. (a) | 81,000 | | 1,474,200 |
Hess Corp. | 51,000 | | 3,214,530 |
HMS Holdings Corp. (a) | 30,000 | | 1,803,300 |
Holly Corp. | 33,000 | | 1,080,090 |
Illumina, Inc. (a) | 16,800 | | 912,408 |
ImmunoGen, Inc. (a) | 45,523 | | 374,199 |
Informatica Corp. (a) | 109,970 | | 4,474,679 |
iRobot Corp. (a) | 194,000 | | 4,050,720 |
Isilon Systems, Inc. (a) | 48,000 | | 1,366,560 |
Jos. A. Bank Clothiers, Inc. (a) | 190,500 | | 8,305,800 |
Juniper Networks, Inc. (a) | 69,000 | | 2,234,910 |
M.D.C. Holdings, Inc. | 25,000 | | 643,750 |
Mako Surgical Corp. (a)(c) | 155,300 | | 1,674,134 |
MasterCard, Inc. Class A | 5,000 | | 1,200,300 |
Micromet, Inc. (a) | 100,000 | | 749,000 |
MIPS Technologies, Inc. (a) | 330,000 | | 4,851,000 |
Molycorp, Inc. (c) | 34,000 | | 1,203,600 |
NetApp, Inc. (a) | 15,000 | | 798,750 |
Neurocrine Biosciences, Inc. (a) | 27,895 | | 227,065 |
NII Holdings, Inc. (a) | 101,200 | | 4,231,172 |
NIKE, Inc. Class B | 32,000 | | 2,606,080 |
Oil States International, Inc. (a) | 72,000 | | 3,680,640 |
OpenTable, Inc. (a) | 7,000 | | 429,450 |
Oracle Corp. | 291,000 | | 8,555,400 |
PACCAR, Inc. | 72,000 | | 3,690,720 |
Perrigo Co. | 252,000 | | 16,601,760 |
Phillips-Van Heusen Corp. | 149,900 | | 9,194,866 |
Precision Castparts Corp. | 27,000 | | 3,687,660 |
Prestige Brands Holdings, Inc. (a) | 179,000 | | 1,924,250 |
Public Storage | 32,000 | | 3,175,040 |
Common Stocks - continued |
| Shares | | Value |
United States of America - continued |
QUALCOMM, Inc. | 215,000 | | $ 9,702,950 |
Red Hat, Inc. (a) | 38,000 | | 1,605,880 |
Riverbed Technology, Inc. (a) | 42,000 | | 2,416,680 |
Roper Industries, Inc. | 20,000 | | 1,388,600 |
Ross Stores, Inc. | 15,000 | | 884,850 |
Salesforce.com, Inc. (a) | 31,055 | | 3,604,554 |
Sapient Corp. | 95,000 | | 1,250,200 |
Skyworks Solutions, Inc. (a) | 544,000 | | 12,463,040 |
Solera Holdings, Inc. | 20,000 | | 961,000 |
Southwest Airlines Co. | 549,000 | | 7,554,240 |
Stericycle, Inc. (a) | 28,000 | | 2,008,720 |
Steven Madden Ltd. (a) | 21,000 | | 888,300 |
Summer Infant, Inc. (a) | 50,000 | | 400,000 |
Susser Holdings Corp. (a) | 5,000 | | 68,350 |
SVB Financial Group (a) | 72,730 | | 3,152,118 |
Targacept, Inc. (a) | 53,000 | | 1,312,280 |
Tenneco, Inc. (a) | 37,000 | | 1,206,940 |
The Mosaic Co. | 20,900 | | 1,529,044 |
Theravance, Inc. (a) | 137,000 | | 2,792,060 |
Titan International, Inc. (c) | 119,000 | | 1,805,230 |
TJX Companies, Inc. | 20,000 | | 917,800 |
TRW Automotive Holdings Corp. (a) | 44,000 | | 2,010,360 |
Union Pacific Corp. | 337,600 | | 29,600,776 |
United Therapeutics Corp. (a) | 12,600 | | 756,000 |
Vera Bradley, Inc. (a) | 1,100 | | 30,085 |
VeriFone Holdings, Inc. (a) | 42,000 | | 1,420,860 |
Virgin Media, Inc. | 160,500 | | 4,081,515 |
VMware, Inc. Class A (a) | 6,000 | | 458,760 |
Volcano Corp. (a) | 123,000 | | 3,003,660 |
Walter Energy, Inc. | 15,900 | | 1,398,564 |
WebMD Health Corp. (a) | 71,726 | | 3,749,835 |
Whiting Petroleum Corp. (a) | 24,000 | | 2,410,560 |
WMS Industries, Inc. (a) | 20,000 | | 872,600 |
ZIOPHARM Oncology, Inc. (a) | 270,000 | | 1,163,700 |
Zix Corp. (a) | 100,000 | | 389,000 |
TOTAL UNITED STATES OF AMERICA | | 499,597,204 |
TOTAL COMMON STOCKS (Cost $913,622,525) | 1,062,954,260 |
Nonconvertible Preferred Stocks - 1.4% |
| | | |
Germany - 1.4% |
ProSiebenSat.1 Media AG | 41,900 | | 1,107,150 |
Volkswagen AG | 91,000 | | 13,675,171 |
TOTAL NONCONVERTIBLE PREFERRED STOCKS (Cost $11,953,393) | 14,782,321 |
Convertible Bonds - 0.2% |
| Principal Amount | | Value |
United States of America - 0.2% |
Newpark Resources, Inc. 4% 10/1/17 | | $ 750,000 | | $ 690,825 |
Volcano Corp. 2.875% 9/1/15 | | 860,000 | | 940,926 |
TOTAL CONVERTIBLE BONDS (Cost $1,610,000) | 1,631,751 |
Money Market Funds - 1.5% |
| Shares | | |
Fidelity Cash Central Fund, 0.23% (b) | 13,142,928 | | 13,142,928 |
Fidelity Securities Lending Cash Central Fund, 0.24% (b)(c) | 3,828,100 | | 3,828,100 |
TOTAL MONEY MARKET FUNDS (Cost $16,971,028) | 16,971,028 |
TOTAL INVESTMENT PORTFOLIO - 99.9% (Cost $944,156,946) | | 1,096,339,360 |
NET OTHER ASSETS (LIABILITIES) - 0.1% | | 1,588,761 |
NET ASSETS - 100% | $ 1,097,928,121 |
Legend |
(a) Non-income producing |
(b) Affiliated fund that is available only to investment companies and other accounts managed by Fidelity Investments. The rate quoted is the annualized seven-day yield of the fund at period end. A complete unaudited listing of the fund's holdings as of its most recent quarter end is available upon request. In addition, each Fidelity Central Fund's financial statements, which are not covered by the Fund's report of Independent Registered Public Accounting Firm, are available on the SEC's website or upon request. |
(c) Security or a portion of the security is on loan at period end. |
(d) Security exempt from registration under Rule 144A of the Securities Act of 1933. These securities may be resold in transactions exempt from registration, normally to qualified institutional buyers. At the end of the period, the value of these securities amounted to $698,700 or 0.1% of net assets. |
Affiliated Central Funds |
Information regarding fiscal year to date income earned by the Fund from investments in Fidelity Central Funds is as follows: |
Fund | Income earned |
Fidelity Cash Central Fund | $ 33,659 |
Fidelity Securities Lending Cash Central Fund | 257,400 |
Total | $ 291,059 |
Other Information |
The following is a summary of the inputs used, as of October 31, 2010, involving the Fund's assets and liabilities carried at fair value. The inputs or methodology used for valuing securities may not be an indication of the risk associated with investing in those securities. For more information on valuation inputs, and their aggregation into the levels used in the tables below, please refer to the Security Valuation section in the accompanying Notes to Financial Statements. |
Valuation Inputs at Reporting Date: |
Description | Total | Level 1 | Level 2 | Level 3 |
Investments in Securities: | | | | |
Equities: | | | | |
United States of America | $ 499,597,204 | $ 499,597,204 | $ - | $ - |
United Kingdom | 116,266,936 | 46,688,062 | 69,578,874 | - |
Japan | 67,324,468 | 32,416,994 | 34,907,474 | - |
Germany | 49,284,861 | 39,080,517 | 10,204,344 | - |
France | 48,376,494 | 45,959,416 | 2,417,078 | - |
Switzerland | 42,969,430 | 29,853,964 | 13,115,466 | - |
Spain | 20,597,689 | 6,140,334 | 14,457,355 | - |
Denmark | 20,398,162 | 10,517,650 | 9,880,512 | - |
India | 18,427,163 | 18,427,163 | - | - |
Cyprus | 34,550 | - | - | 34,550 |
Other | 194,459,624 | 186,419,753 | 8,039,871 | - |
Corporate Bonds | 1,631,751 | - | 1,631,751 | - |
Money Market Funds | 16,971,028 | 16,971,028 | - | - |
Total Investments in Securities: | $ 1,096,339,360 | $ 932,072,085 | $ 164,232,725 | $ 34,550 |
The following is a reconciliation of Investments in Securities for which Level 3 inputs were used in determining value: |
Investments in Securities: | |
Beginning Balance | $ - |
Total Realized Gain (Loss) | - |
Total Unrealized Gain (Loss) | (36,260) |
Cost of Purchases | - |
Proceeds of Sales | - |
Amortization/Accretion | - |
Transfers in to Level 3 | 70,810 |
Transfers out of Level 3 | - |
Ending Balance | $ 34,550 |
The change in unrealized gain (loss) for the period attributable to Level 3 securities held at October 31, 2010 | $ (36,260) |
The information used in the above reconciliation represents fiscal year to date activity for any Investments in Securities identified as using Level 3 inputs at either the beginning or the end of the current fiscal period. Transfers in or out of Level 3 represent the beginning value of any Security or Instrument where a change in the pricing level occurred from the beginning to the end of the period. The cost of purchases and the proceeds of sales may include securities received or delivered through corporate actions or exchanges. Realized and unrealized gains (losses) disclosed in the reconciliation are included in Net Gain (Loss) on the Fund's Statement of Operations. |
Income Tax Information |
At October 31, 2010, the Fund had a capital loss carryforward of approximately $165,341,843 of which $21,859,750 and $143,482,093 will expire on October 31, 2016 and 2017, respectively. Capital loss carryforwards are only available to offset future capital gains of the Fund to the extent provided by regulations and may be limited. |
See accompanying notes which are an integral part of the financial statements.
Annual Report
Fidelity Worldwide Fund
Financial Statements
Statement of Assets and Liabilities
| October 31, 2010 |
| | |
Assets | | |
Investment in securities, at value (including securities loaned of $3,745,161) - See accompanying schedule: Unaffiliated issuers (cost $927,185,918) | $ 1,079,368,332 | |
Fidelity Central Funds (cost $16,971,028) | 16,971,028 | |
Total Investments (cost $944,156,946) | | $ 1,096,339,360 |
Cash | | 1 |
Receivable for investments sold | | 28,129,502 |
Receivable for fund shares sold | | 823,725 |
Dividends receivable | | 1,062,804 |
Interest receivable | | 4,914 |
Distributions receivable from Fidelity Central Funds | | 6,115 |
Other receivables | | 273,028 |
Total assets | | 1,126,639,449 |
| | |
Liabilities | | |
Payable for investments purchased | $ 22,295,156 | |
Payable for fund shares redeemed | 1,004,722 | |
Accrued management fee | 654,093 | |
Distribution and service plan fees payable | 2,780 | |
Other affiliated payables | 259,457 | |
Other payables and accrued expenses | 667,020 | |
Collateral on securities loaned, at value | 3,828,100 | |
Total liabilities | | 28,711,328 |
| | |
Net Assets | | $ 1,097,928,121 |
Net Assets consist of: | | |
Paid in capital | | $ 1,119,079,477 |
Undistributed net investment income | | 4,480,160 |
Accumulated undistributed net realized gain (loss) on investments and foreign currency transactions | | (177,294,491) |
Net unrealized appreciation (depreciation) on investments and assets and liabilities in foreign currencies | | 151,662,975 |
Net Assets | | $ 1,097,928,121 |
Statement of Assets and Liabilities - continued
| October 31, 2010 |
| | |
Calculation of Maximum Offering Price Class A:
Net Asset Value and redemption price per share ($7,530,175 ÷ 430,387 shares) | | $ 17.50 |
| | |
Maximum offering price per share (100/94.25 of $17.50) | | $ 18.57 |
Class T:
Net Asset Value and redemption price per share ($1,120,118 ÷ 64,167 shares) | | $ 17.46 |
| | |
Maximum offering price per share (100/96.50 of $17.46) | | $ 18.09 |
Class B:
Net Asset Value and offering price per share ($305,259 ÷ 17,554 shares)A | | $ 17.39 |
| | |
Class C:
Net Asset Value and offering price per share ($709,608 ÷ 40,879 shares)A | | $ 17.36 |
| | |
| | |
Worldwide:
Net Asset Value, offering price and redemption price per share ($1,087,928,252 ÷ 61,872,662 shares) | | $ 17.58 |
| | |
Institutional Class:
Net Asset Value, offering price and redemption price per share ($334,709 ÷ 19,050 shares) | | $ 17.57 |
A Redemption price per share is equal to net asset value less any applicable contingent deferred sales charge.
See accompanying notes which are an integral part of the financial statements.
Annual Report
Fidelity Worldwide Fund
Financial Statements - continued
Statement of Operations
| Year ended October 31, 2010 |
Investment Income | | |
Dividends | | $ 17,385,889 |
Interest | | 56,807 |
Income from Fidelity Central Funds | | 291,059 |
Income before foreign taxes withheld | | 17,733,755 |
Less foreign taxes withheld | | (1,004,412) |
Total income | | 16,729,343 |
| | |
Expenses | | |
Management fee
Basic fee | $ 7,318,345 | |
Performance adjustment | 963,702 | |
Transfer agent fees | 2,662,400 | |
Distribution and service plan fees | 20,954 | |
Accounting and security lending fees | 482,070 | |
Custodian fees and expenses | 253,340 | |
Independent trustees' compensation | 5,982 | |
Registration fees | 81,815 | |
Audit | 77,918 | |
Legal | 5,594 | |
Miscellaneous | 14,254 | |
Total expenses before reductions | 11,886,374 | |
Expense reductions | (325,816) | 11,560,558 |
Net investment income (loss) | | 5,168,785 |
Realized and Unrealized Gain (Loss) Net realized gain (loss) on: | | |
Investment securities: | | |
Unaffiliated issuers (net of foreign taxes of $6,310) | 100,622,328 | |
Foreign currency transactions | (292,326) | |
Total net realized gain (loss) | | 100,330,002 |
Change in net unrealized appreciation (depreciation) on: Investment securities (net of increase in deferred foreign taxes of $504,850) | 67,000,721 | |
Assets and liabilities in foreign currencies | (9,475) | |
Total change in net unrealized appreciation (depreciation) | | 66,991,246 |
Net gain (loss) | | 167,321,248 |
Net increase (decrease) in net assets resulting from operations | | $ 172,490,033 |
Statement of Changes in Net Assets
| Year ended
October 31,
2010 | Year ended
October 31,
2009 |
Increase (Decrease) in Net Assets | | |
Operations | | |
Net investment income (loss) | $ 5,168,785 | $ 8,075,049 |
Net realized gain (loss) | 100,330,002 | (130,252,833) |
Change in net unrealized appreciation (depreciation) | 66,991,246 | 233,691,843 |
Net increase (decrease) in net assets resulting from operations | 172,490,033 | 111,514,059 |
Distributions to shareholders from net investment income | (6,419,967) | (11,746,083) |
Distributions to shareholders from net realized gain | (993,213) | - |
Total distributions | (7,413,180) | (11,746,083) |
Share transactions - net increase (decrease) | (61,476,980) | (40,383,349) |
Redemption fees | 31,293 | 26,981 |
Total increase (decrease) in net assets | 103,631,166 | 59,411,608 |
| | |
Net Assets | | |
Beginning of period | 994,296,955 | 934,885,347 |
End of period (including undistributed net investment income of $4,480,160 and undistributed net investment income of $5,696,383, respectively) | $ 1,097,928,121 | $ 994,296,955 |
See accompanying notes which are an integral part of the financial statements.
Annual Report
Financial Highlights - Class A
Years ended October 31, | 2010 | 2009H |
Selected Per-Share Data | | |
Net asset value, beginning of period | $ 14.96 | $ 10.88 |
Income from Investment Operations | | |
Net investment income (loss)E | .03 | (.01) |
Net realized and unrealized gain (loss) | 2.63 | 4.09 |
Total from investment operations | 2.66 | 4.08 |
Distributions from net investment income | (.10) | - |
Distributions from net realized gain | (.02) | - |
Total distributions | (.12) | - |
Redemption fees added to paid in capital E,J | - | - |
Net asset value, end of period | $ 17.50 | $ 14.96 |
Total ReturnB,C,D | 17.85% | 37.50% |
Ratios to Average Net AssetsF,I | | |
Expenses before reductions | 1.43% | 1.52%A |
Expenses net of fee waivers, if any | 1.43% | 1.52%A |
Expenses net of all reductions | 1.41% | 1.49%A |
Net investment income (loss) | .21% | (.06)%A |
Supplemental Data | | |
Net assets, end of period (000 omitted) | $ 7,530 | $ 993 |
Portfolio turnover rateG | 166% | 224% |
A Annualized
B Total returns for periods of less than one year are not annualized.
C Total returns would have been lower had certain expenses not been reduced during the periods shown.
D Total returns do not include the effect of the sales charges.
E Calculated based on average shares outstanding during the period.
F Fees and expenses of the underlying Fidelity Central Funds are not included in the Fund's expense ratio. The Fund indirectly bears its proportionate share of the expenses of any underlying Fidelity Central Funds.
G Amount does not include the portfolio activity of any underlying Fidelity Central Funds.
H For the period February 19, 2009 (commencement of sale of shares) to October 31, 2009.
I Expense ratios reflect operating expenses of the class. Expenses before reductions do not reflect amounts reimbursed by the investment adviser or reductions from brokerage service arrangements or reductions from other expense offset arrangements and do not represent the amount paid by the class during periods when reimbursements or reductions occur. Expense ratios before reductions for start-up periods may not be representative of longer-term operating periods. Expenses net of fee waivers reflect expenses after reimbursement by the investment adviser but prior to reductions from brokerage service arrangements or other expense offset arrangements. Expenses net of all reductions represent the net expenses paid by the class.
J Amount represents less than $.01 per share.
Financial Highlights - Class T
Years ended October 31, | 2010 | 2009H |
Selected Per-Share Data | | |
Net asset value, beginning of period | $ 14.94 | $ 10.88 |
Income from Investment Operations | | |
Net investment income (loss)E | (.01) | (.01) |
Net realized and unrealized gain (loss) | 2.62 | 4.07 |
Total from investment operations | 2.61 | 4.06 |
Distributions from net investment income | (.08) | - |
Distributions from net realized gain | (.02) | - |
Total distributions | (.09)K | - |
Redemption fees added to paid in capital E,J | - | - |
Net asset value, end of period | $ 17.46 | $ 14.94 |
Total ReturnB,C,D | 17.53% | 37.32% |
Ratios to Average Net AssetsF,I | | |
Expenses before reductions | 1.70% | 1.73%A |
Expenses net of fee waivers, if any | 1.70% | 1.73%A |
Expenses net of all reductions | 1.68% | 1.70%A |
Net investment income (loss) | (.05) % | (.08)%A |
Supplemental Data | | |
Net assets, end of period (000 omitted) | $ 1,120 | $ 458 |
Portfolio turnover rateG | 166% | 224% |
A Annualized
B Total returns for periods of less than one year are not annualized.
C Total returns would have been lower had certain expenses not been reduced during the periods shown.
D Total returns do not include the effect of the sales charges.
E Calculated based on average shares outstanding during the period.
F Fees and expenses of the underlying Fidelity Central Funds are not included in the Fund's expense ratio. The Fund indirectly bears its proportionate share of the expenses of any underlying Fidelity Central Funds.
G Amount does not include the portfolio activity of any underlying Fidelity Central Funds.
H For the period February 19, 2009 (commencement of sale of shares) to October 31, 2009.
I Expense ratios reflect operating expenses of the class. Expenses before reductions do not reflect amounts reimbursed by the investment adviser or reductions from brokerage service arrangements or reductions from other expense offset arrangements and do not represent the amount paid by the class during periods when reimbursements or reductions occur. Expense ratios before reductions for start-up periods may not be representative of longer-term operating periods. Expenses net of fee waivers reflect expenses after reimbursement by the investment adviser but prior to reductions from brokerage service arrangements or other expense offset arrangements. Expenses net of all reductions represent the net expenses paid by the class.
J Amount represents less than $.01 per share.
K Total distributions of $.09 per share is comprised of distributions from net investment income of $.075 and distributions from net realized gain of $.015 per share.
See accompanying notes which are an integral part of the financial statements.
Annual Report
Financial Highlights - Class B
Years ended October 31, | 2010 | 2009H |
Selected Per-Share Data | | |
Net asset value, beginning of period | $ 14.89 | $ 10.88 |
Income from Investment Operations | | |
Net investment income (loss)E | (.09) | (.03) |
Net realized and unrealized gain (loss) | 2.61 | 4.04 |
Total from investment operations | 2.52 | 4.01 |
Distributions from net investment income | (.01) | - |
Distributions from net realized gain | (.01) | - |
Total distributions | (.02) | - |
Redemption fees added to paid in capital E,J | - | - |
Net asset value, end of period | $ 17.39 | $ 14.89 |
Total ReturnB,C,D | 16.92% | 36.86% |
Ratios to Average Net AssetsF,I | | |
Expenses before reductions | 2.19% | 2.20%A |
Expenses net of fee waivers, if any | 2.19% | 2.20%A |
Expenses net of all reductions | 2.17% | 2.17%A |
Net investment income (loss) | (.55)% | (.30)%A |
Supplemental Data | | |
Net assets, end of period (000 omitted) | $ 305 | $ 224 |
Portfolio turnover rateG | 166% | 224% |
A Annualized
B Total returns for periods of less than one year are not annualized.
C Total returns would have been lower had certain expenses not been reduced during the periods shown.
D Total returns do not include the effect of the contingent deferred sales charge.
E Calculated based on average shares outstanding during the period.
F Fees and expenses of the underlying Fidelity Central Funds are not included in the Fund's expense ratio. The Fund indirectly bears its proportionate share of the expenses of any underlying Fidelity Central Funds.
G Amount does not include the portfolio activity of any underlying Fidelity Central Funds.
H For the period February 19, 2009 (commencement of sale of shares) to October 31, 2009.
I Expense ratios reflect operating expenses of the class. Expenses before reductions do not reflect amounts reimbursed by the investment adviser or reductions from brokerage service arrangements or reductions from other expense offset arrangements and do not represent the amount paid by the class during periods when reimbursements or reductions occur. Expense ratios before reductions for start-up periods may not be representative of longer-term operating periods. Expenses net of fee waivers reflect expenses after reimbursement by the investment adviser but prior to reductions from brokerage service arrangements or other expense offset arrangements. Expenses net of all reductions represent the net expenses paid by the class.
J Amount represents less than $.01 per share.
Financial Highlights - Class C
Years ended October 31, | 2010 | 2009H |
Selected Per-Share Data | | |
Net asset value, beginning of period | $ 14.89 | $ 10.88 |
Income from Investment Operations | | |
Net investment income (loss)E | (.09) | (.04) |
Net realized and unrealized gain (loss) | 2.61 | 4.05 |
Total from investment operations | 2.52 | 4.01 |
Distributions from net investment income | (.03) | - |
Distributions from net realized gain | (.02) | - |
Total distributions | (.05) | - |
Redemption fees added to paid in capital E,J | - | - |
Net asset value, end of period | $ 17.36 | $ 14.89 |
Total ReturnB,C,D | 16.94% | 36.86% |
Ratios to Average Net AssetsF,I | | |
Expenses before reductions | 2.19% | 2.18%A |
Expenses net of fee waivers, if any | 2.19% | 2.18%A |
Expenses net of all reductions | 2.16% | 2.15%A |
Net investment income (loss) | (.54)% | (.39)%A |
Supplemental Data | | |
Net assets, end of period (000 omitted) | $ 710 | $ 335 |
Portfolio turnover rateG | 166% | 224% |
A Annualized
B Total returns for periods of less than one year are not annualized.
C Total returns would have been lower had certain expenses not been reduced during the periods shown.
D Total returns do not include the effect of the contingent deferred sales charge.
E Calculated based on average shares outstanding during the period.
F Fees and expenses of the underlying Fidelity Central Funds are not included in the Fund's expense ratio. The Fund indirectly bears its proportionate share of the expenses of any underlying Fidelity Central Funds.
G Amount does not include the portfolio activity of any underlying Fidelity Central Funds.
H For the period February 19, 2009 (commencement of sale of shares) to October 31, 2009.
I Expense ratios reflect operating expenses of the class. Expenses before reductions do not reflect amounts reimbursed by the investment adviser or reductions from brokerage service arrangements or reductions from other expense offset arrangements and do not represent the amount paid by the class during periods when reimbursements or reductions occur. Expense ratios before reductions for start-up periods may not be representative of longer-term operating periods. Expenses net of fee waivers reflect expenses after reimbursement by the investment adviser but prior to reductions from brokerage service arrangements or other expense offset arrangements. Expenses net of all reductions represent the net expenses paid by the class.
J Amount represents less than $.01 per share.
See accompanying notes which are an integral part of the financial statements.
Annual Report
Financial Highlights - Worldwide
Years ended October 31, | 2010 | 2009 | 2008 | 2007 | 2006 |
Selected Per-Share Data | | | | | |
Net asset value, beginning of period | $ 14.98 | $ 13.40 | $ 25.18 | $ 21.82 | $ 19.05 |
Income from Investment Operations | | | | | |
Net investment income (loss)B | .08 | .12 | .16 | .14 | .17 |
Net realized and unrealized gain (loss) | 2.63 | 1.63 | (9.44) | 6.05 | 3.74 |
Total from investment operations | 2.71 | 1.75 | (9.28) | 6.19 | 3.91 |
Distributions from net investment income | (.10) | (.17) | (.12) | (.17) | (.10) |
Distributions from net realized gain | (.02) | - | (2.38) | (2.66) | (1.04) |
Total distributions | (.11)G | (.17) | (2.50) | (2.83) | (1.14) |
Redemption fees added to paid in capitalB,F | - | - | - | - | - |
Net asset value, end of period | $ 17.58 | $ 14.98 | $ 13.40 | $ 25.18 | $ 21.82 |
Total ReturnA | 18.18% | 13.39% | (40.66)% | 31.87% | 21.31% |
Ratios to Average Net AssetsC,E | | | | | |
Expenses before reductions | 1.15% | 1.27% | 1.21% | 1.04% | 1.08% |
Expenses net of fee waivers, if any | 1.15% | 1.27% | 1.21% | 1.04% | 1.08% |
Expenses net of all reductions | 1.12% | 1.24% | 1.19% | 1.02% | 1.02% |
Net investment income (loss) | .50% | .92% | .84% | .66% | .85% |
Supplemental Data | | | | | |
Net assets, end of period (000 omitted) | $ 1,087,928 | $ 991,996 | $ 934,885 | $ 1,773,603 | $ 1,328,219 |
Portfolio turnover rateD | 166% | 224% | 264% | 128% | 205% |
A Total returns would have been lower had certain expenses not been reduced during the periods shown.
B Calculated based on average shares outstanding during the period.
C Fees and expenses of the underlying Fidelity Central Funds are not included in the Fund's expense ratio. The Fund indirectly bears its proportionate share of the expenses of any underlying Fidelity Central Funds.
D Amount does not include the portfolio activity of any underlying Fidelity Central Funds.
E Expense ratios reflect operating expenses of the class. Expenses before reductions do not reflect amounts reimbursed by the investment adviser or reductions from brokerage service arrangements or reductions from other expense offset arrangements and do not represent the amount paid by the class during periods when reimbursements or reductions occur. Expenses net of fee waivers reflect expenses after reimbursement by the investment adviser but prior to reductions from brokerage service arrangements or other expense offset arrangements. Expenses net of all reductions represent the net expenses paid by the class.
F Amount represents less than $.01 per share.
G Total distributions of $.11 per share is comprised of distributions from net investment income of $.097 and distributions from net realized gain of $.015 per share.
Financial Highlights - Institutional Class
Years ended October 31, | 2010 | 2009G |
Selected Per-Share Data | | |
Net asset value, beginning of period | $ 15.00 | $ 10.88 |
Income from Investment Operations | | |
Net investment income (loss)D | .07 | .06 |
Net realized and unrealized gain (loss) | 2.63 | 4.06 |
Total from investment operations | 2.70 | 4.12 |
Distributions from net investment income | (.11) | - |
Distributions from net realized gain | (.02) | - |
Total distributions | (.13) | - |
Redemption fees added to paid in capital D,I | - | - |
Net asset value, end of period | $ 17.57 | $ 15.00 |
Total ReturnB,C | 18.08% | 37.87% |
Ratios to Average Net AssetsE,H | | |
Expenses before reductions | 1.21% | 1.17%A |
Expenses net of fee waivers, if any | 1.21% | 1.17%A |
Expenses net of all reductions | 1.19% | 1.15%A |
Net investment income (loss) | .44% | .62%A |
Supplemental Data | | |
Net assets, end of period (000 omitted) | $ 335 | $ 290 |
Portfolio turnover rateF | 166% | 224% |
A Annualized
B Total returns for periods of less than one year are not annualized.
C Total returns would have been lower had certain expenses not been reduced during the periods shown.
D Calculated based on average shares outstanding during the period.
E Fees and expenses of the underlying Fidelity Central Funds are not included in the Fund's expense ratio. The Fund indirectly bears its proportionate share of the expenses of any underlying Fidelity Central Funds.
F Amount does not include the portfolio activity of any underlying Fidelity Central Funds.
G For the period February 19, 2009 (commencement of sale of shares) to October 31, 2009.
H Expense ratios reflect operating expenses of the class. Expenses before reductions do not reflect amounts reimbursed by the investment adviser or reductions from brokerage service arrangements or reductions from other expense offset arrangements and do not represent the amount paid by the class during periods when reimbursements or reductions occur. Expense ratios before reductions for start-up periods may not be representative of longer-term operating periods. Expenses net of fee waivers reflect expenses after reimbursement by the investment adviser but prior to reductions from brokerage service arrangements or other expense offset arrangements. Expenses net of all reductions represent the net expenses paid by the class.
I Amount represents less than $.01 per share.
See accompanying notes which are an integral part of the financial statements.
Annual Report
Notes to Financial Statements
For the period ended October 31, 2010
1. Organization.
Fidelity Worldwide Fund (the Fund) is a fund of Fidelity Investment Trust (the Trust) and is authorized to issue an unlimited number of shares. The Trust is registered under the Investment Company Act of 1940, as amended (the 1940 Act), as an open-end management investment company organized as a Massachusetts business trust. The Fund offers Class A, Class T, Class C, Worldwide and Institutional Class shares, each of which has equal rights as to assets and voting privileges. Effective after the close of business on September 1, 2010, Class B shares were closed to new accounts and additional purchases by existing shareholders. Each class has exclusive voting rights with respect to matters that affect that class. Class B shares will automatically convert to Class A shares after a holding period of seven years from the initial date of purchase. Investment income, realized and unrealized capital gains and losses, the common expenses of the Fund, and certain fund-level expense reductions, if any, are allocated on a pro-rata basis to each class based on the relative net assets of each class to the total net assets of the Fund. Each class differs with respect to transfer agent and distribution and service plan fees incurred. Certain expense reductions also differ by class. The Fund's investments in emerging markets can be subject to social, economic, regulatory, and political uncertainties and can be extremely volatile.
2. Investments in Fidelity Central Funds.
The Fund may invest in Fidelity Central Funds, which are open-end investment companies available only to other investment companies and accounts managed by Fidelity Management & Research Company (FMR) and its affiliates. The Fund's Schedule of Investments lists each of the Fidelity Central Funds held as of period end, if any, as an investment of the Fund, but does not include the underlying holdings of each Fidelity Central Fund. As an Investing Fund, the Fund indirectly bears its proportionate share of the expenses of the underlying Fidelity Central Funds.
The Money Market Central Funds seek preservation of capital and current income and are managed by Fidelity Investments Money Management, Inc. (FIMM), an affiliate of FMR.
A complete unaudited list of holdings for each Fidelity Central Fund is available upon request or at the Securities and Exchange Commission (the SEC) web site at www.sec.gov. In addition, the financial statements of the Fidelity Central Funds which are not covered by the Fund's Report of Independent Registered Public Accounting Firm, are available on the SEC web site or upon request.
3. Significant Accounting Policies.
The financial statements have been prepared in conformity with accounting principles generally accepted in the United States of America (GAAP), which require management to make certain estimates and assumptions at the date of the financial statements. Actual results could differ from those estimates. The following summarizes the significant accounting policies of the Fund:
Security Valuation. Investments are valued as of 4:00 p.m. Eastern time on the last calendar day of the period. The Fund uses independent pricing services approved by the Board of Trustees to value its investments. When current market prices or quotations are not readily available or reliable, valuations may be determined in good faith in accordance with procedures adopted by the Board of Trustees. Factors used in determining value may include market or security specific events, changes in interest rates and credit quality. The frequency with which these procedures are used cannot be predicted and they may be utilized to a significant extent. The value used for net asset value (NAV) calculation under these procedures may differ from published prices for the same securities.
The Fund categorizes the inputs to valuation techniques used to value its investments into a disclosure hierarchy consisting of three levels as shown below.
Level 1 - quoted prices in active markets for identical investments
Level 2 - other significant observable inputs (including quoted prices for similar investments, interest rates, prepayment speeds, etc.)
Level 3 - unobservable inputs (including the fund's own assumptions based on the best information available)
Changes in valuation techniques may result in transfers in or out of an assigned level within the disclosure hierarchy. The aggregate value of investments by input level, as of October 31, 2010, as well as a roll forward of Level 3 securities, is included at the end of the Fund's Schedule of Investments. Valuation techniques used to value the Fund's investments by major category are as follows.
Equity securities, including restricted securities, for which market quotations are readily available, are valued at the last reported sale price or official closing price as reported by an independent pricing service on the primary market or exchange on which they are traded and are categorized as Level 1 in the hierarchy. In the event there were no sales during the day or closing prices are not available, securities are valued at the last quoted bid price or may be valued using the last available price and are generally categorized as Level 2 in the hierarchy. For foreign equity securities, when significant market or security specific events arise, comparisons to the valuation of American Depositary Receipts (ADRs), futures contracts, Exchange-traded funds (ETFs) and certain indexes as well as quoted prices for similar securities are used and are categorized as Level 2 in the hierarchy in these circumstances. Utilizing these techniques may result in transfers between Level 1 and Level 2. For restricted equity securities and private placements where observable inputs are limited, assumptions about market activity and risk are used and are categorized as Level 3 in the hierarchy.
Annual Report
3. Significant Accounting Policies - continued
Security Valuation - continued
Debt securities, including restricted securities, are valued based on evaluated prices received from independent pricing services or from dealers who make markets in such securities. For corporate bonds pricing services utilize matrix pricing which considers yield or price of bonds of comparable quality, coupon, maturity and type as well as dealer supplied prices and are generally categorized as Level 2 in the hierarchy.
Investments in open-end mutual funds, including Fidelity Central Funds, are valued at their closing net asset value each business day and are categorized as Level 1 in the hierarchy. Short-term securities with remaining maturities of sixty days or less for which quotations are not readily available are valued at amortized cost, which approximates fair value and are categorized as Level 2 in the hierarchy.
When independent prices are unavailable or unreliable, debt securities may be valued utilizing pricing matrices which consider similar factors that would be used by independent pricing services. These are generally categorized as Level 2 in the hierarchy but may be Level 3 depending on the circumstances.
Foreign Currency. The Fund uses foreign currency contracts to facilitate transactions in foreign-denominated securities. Gains and losses from these transactions may arise from changes in the value of the foreign currency or if the counterparties do not perform under the contracts' terms.
Foreign-denominated assets, including investment securities, and liabilities are translated into U.S. dollars at the exchange rate at period end. Purchases and sales of investment securities, income and dividends received and expenses denominated in foreign currencies are translated into U.S. dollars at the exchange rate in effect on the transaction date.
The effects of exchange rate fluctuations on investments are included with the net realized and unrealized gain (loss) on investment securities. Other foreign currency transactions resulting in realized and unrealized gain (loss) are disclosed separately.
Investment Transactions and Income. For financial reporting purposes, the Fund's investment holdings and NAV include trades executed through the end of the last business day of the period. The NAV per share for processing shareholder transactions is calculated as of the close of business of the New York Stock Exchange (NYSE), normally 4:00 p.m. Eastern time and includes trades executed through the end of the prior business day. Gains and losses on securities sold are determined on the basis of identified cost and may include proceeds received from litigation. Dividend income is recorded on the ex-dividend date, except for certain dividends from foreign securities where the ex-dividend date may have passed, which are recorded as soon as the Fund is informed of the ex-dividend date. Non-cash dividends included in dividend income, if any, are recorded at the fair market value of the securities received. Distributions received on securities that represent a return of capital or capital gain are recorded as a reduction of cost of investments and/or as a realized gain. The Fund estimates the components of distributions received that may be considered return of capital distributions or capital gain distributions. Interest income and distributions from the Fidelity Central Funds are accrued as earned. Interest income includes coupon interest and amortization of premium and accretion of discount on debt securities. Investment income is recorded net of foreign taxes withheld where recovery of such taxes is uncertain.
Expenses. Most expenses of the Trust can be directly attributed to a fund. Expenses which cannot be directly attributed are apportioned amongst each fund in the Trust. Expense estimates are accrued in the period to which they relate and adjustments are made when actual amounts are known.
Income Tax Information and Distributions to Shareholders. Each year the Fund intends to qualify as a regulated investment company, including distributing substantially all of its taxable income and realized gains under Subchapter M of the Internal Revenue Code and filing its U.S. federal tax return. As a result, no provision for income taxes is required. As of October 31, 2010, the Fund did not have any unrecognized tax benefits in the accompanying financial statements. A fund's federal tax return is subject to examination by the Internal Revenue Service (IRS) for a period of three years. Foreign taxes are provided for based on the Fund's understanding of the tax rules and rates that exist in the foreign markets in which it invests. The Fund is subject to a tax imposed on short term capital gains on securities of certain issuers domiciled in India. The Fund records an estimated deferred tax liability included in Other payables and accrued expenses in the accompanying Statement of Assets & Liabilities for net unrealized gains on these securities in an amount that would be payable if the securities were disposed of at period end.
Distributions are declared and recorded on the ex-dividend date. Income dividends and capital gain distributions are declared separately for each class. Income and capital gain distributions are determined in accordance with income tax regulations, which may differ from GAAP.
Capital accounts within the financial statements are adjusted for permanent book-tax differences. These adjustments have no impact on net assets or the results of operations. Temporary book-tax differences will reverse in a subsequent period.
Book-tax differences are primarily due to short-term capital gain distributions from the Fidelity Central Funds, foreign currency transactions, certain foreign taxes, passive foreign investment companies (PFIC), market discount, deferred trustees compensation, capital loss carryforwards and losses deferred due to wash sales.
Annual Report
Notes to Financial Statements - continued
3. Significant Accounting Policies - continued
Income Tax Information and Distributions to Shareholders - continued
The federal tax cost of investment securities and unrealized appreciation (depreciation) as of period end were as follows:
Gross unrealized appreciation | $ 169,802,860 |
Gross unrealized depreciation | (32,295,987) |
Net unrealized appreciation (depreciation) | $ 137,506,873 |
| |
Tax Cost | $ 958,832,487 |
The tax-based components of distributable earnings as of period end were as follows:
Undistributed ordinary income | $ 7,203,381 |
Capital loss carryforward | $ (165,341,843) |
Net unrealized appreciation (depreciation) | $ 137,543,936 |
The tax character of distributions paid was as follows:
| October 31, 2010 | October 31, 2009 |
Ordinary Income | $ 7,413,180 | $ 11,746,083 |
Short-Term Trading (Redemption) Fees. Shares held by investors in the Fund less than 30 days are subject to a redemption fee equal to 1.00% of the net asset value of shares redeemed. All redemption fees, which reduce the proceeds of the shareholder redemption, are retained by the Fund and accounted for as an addition to paid in capital.
4. Operating Policies.
Restricted Securities. The Fund may invest in securities that are subject to legal or contractual restrictions on resale. These securities generally may be resold in transactions exempt from registration or to the public if the securities are registered. Disposal of these securities may involve time-consuming negotiations and expense, and prompt sale at an acceptable price may be difficult. Information regarding restricted securities is included at the end of the Fund's Schedule of Investments.
5. Purchases and Sales of Investments.
Purchases and sales of securities, other than short-term securities, aggregated $1,661,853,880 and $1,707,033,315, respectively.
6. Fees and Other Transactions with Affiliates.
Management Fee. FMR and its affiliates provide the Fund with investment management related services for which the Fund pays a monthly management fee. The management fee is the sum of an individual fund fee rate that is based on an annual rate of .45% of the Fund's average net assets and a group fee rate that averaged .26% during the period. The group fee rate is based upon the average net assets of all the mutual funds advised by FMR. The group fee rate decreases as assets under management increase and increases as assets under management decrease. In addition, the management fee is subject to a performance adjustment (up to a maximum of ±.20% of the Fund's average net assets over a 36 month performance period). The upward or downward adjustment to the management fee is based on the relative investment performance of Worldwide as compared to an appropriate benchmark index. For the period, the total annual management fee rate, including the performance adjustment, was .80% of the Fund's average net assets.
Distribution and Service Plan Fees. In accordance with Rule 12b-1 of the 1940 Act, the Fund has adopted separate Distribution and Service Plans for each class of shares. Certain classes pay Fidelity Distributors Corporation (FDC), an affiliate of FMR, separate Distribution and Service Fees, each of which is based on an annual percentage of each class' average net assets. In addition, FDC may pay financial intermediaries for selling shares of the Fund and providing shareholder support services. For the period, the Distribution and Service Fee rates, total fees and amounts retained by FDC were as follows:
Annual Report
6. Fees and Other Transactions with Affiliates - continued
Distribution and Service Plan Fees - continued
| Distribution
Fee | Service
Fee | Total
Fees | Retained
by FDC |
Class A | -% | .25% | $ 8,876 | $ 1,881 |
Class T | .25% | .25% | 3,697 | 386 |
Class B | .75% | .25% | 2,689 | 2,305 |
Class C | .75% | .25% | 5,692 | 3,823 |
| | | $ 20,954 | $ 8,395 |
Sales Load. FDC receives a front-end sales charge of up to 5.75% for selling Class A shares, and 3.50% for selling Class T shares, some of which is paid to financial intermediaries for selling shares of the Fund. FDC receives the proceeds of contingent deferred sales charges levied on Class A, Class T, Class B, and Class C redemptions. These charges depend on the holding period. The deferred sales charges range from 5% to 1% for Class B, 1% for Class C, 1.00% for certain purchases of Class A shares (1.00% to .50% prior to July 12, 2010) and .25% for certain purchases of Class T shares.
For the period, sales charge amounts retained by FDC were as follows:
| Retained
by FDC |
Class A | $ 5,564 |
Class T | 943 |
Class B* | 250 |
Class C* | 11 |
| $ 6,768 |
* When Class B and Class C shares are initially sold, FDC pays commissions from its own resources to financial intermediaries through which the sales are made.
Transfer Agent Fees. Fidelity Investments Institutional Operations Company, Inc. (FIIOC), an affiliate of FMR, is the transfer, dividend disbursing and shareholder servicing agent for each class of the Fund. FIIOC receives account fees and asset-based fees that vary according to the account size and type of account of the shareholders of the respective classes of the Fund. FIIOC pays for typesetting, printing and mailing of shareholder reports, except proxy statements. For the period, transfer agent fees for each class were as follows:
| Amount | % of
Average
Net Assets |
Class A | $ 10,509 | .29 |
Class T | 2,317 | .31 |
Class B | 823 | .31 |
Class C | 1,715 | .30 |
Worldwide | 2,645,955 | .26 |
Institutional Class | 1,081 | .32 |
| $ 2,662,400 | |
Accounting and Security Lending Fees. Fidelity Service Company, Inc. (FSC), an affiliate of FMR, maintains the Fund's accounting records. The accounting fee is based on the level of average net assets for the month. Under a separate contract, FSC administers the security lending program. The security lending fee is based on the number and duration of lending transactions.
Brokerage Commissions. The Fund placed a portion of its portfolio transactions with brokerage firms which are affiliates of the investment adviser. The commissions paid to these affiliated firms were $34,964 for the period.
7. Committed Line of Credit.
The Fund participates with other funds managed by FMR or an affiliate in a $3.75 billion credit facility (the "line of credit") to be utilized for temporary or emergency purposes to fund shareholder redemptions or for other short-term liquidity purposes. The Fund has agreed to pay commitment fees on its pro-rata portion of the line of credit, which amounted to $4,054 and is reflected in Miscellaneous expenses on the Statement of Operations. During the period, there were no borrowings on this line of credit.
Annual Report
Notes to Financial Statements - continued
8. Security Lending.
The Fund lends portfolio securities through a lending agent from time to time in order to earn additional income. The lending agent may loan securities to certain qualified borrowers, including Fidelity Capital Markets (FCM), a broker-dealer affiliated with the Fund. On the settlement date of the loan, the Fund receives collateral (in the form of U.S. Treasury obligations, letters of credit and/or cash) against the loaned securities and maintains collateral in an amount not less than 100% of the market value of the loaned securities during the period of the loan. The market value of the loaned securities is determined at the close of business of the Fund and any additional required collateral is delivered to the Fund on the next business day. If the borrower defaults on its obligation to return the securities loaned because of insolvency or other reasons, a fund could experience delays and costs in recovering the securities loaned or in gaining access to the collateral. Any cash collateral received is invested in the Fidelity Securities Lending Cash Central Fund. The value of loaned securities and cash collateral at period end are disclosed on the Fund's Statement of Assets and Liabilities. Security lending income represents the income earned on investing cash collateral, less rebates paid to borrowers and lending agent fees associated with the loan, plus any premium payments received for lending certain types of securities. Security lending income is presented in the Statement of Operations as a component of income from Fidelity Central Funds. Total security lending income during the period amounted to $257,400.During the period, there were no securities loaned to FCM.
9. Expense Reductions.
FMR voluntarily agreed to reimburse a portion of Worldwide's operating expenses. During the period, this reimbursement reduced the class' expenses by $43,251.
Many of the brokers with whom FMR places trades on behalf of the Fund provided services to the Fund in addition to trade execution. These services included payments of certain expenses on behalf of the Fund totaling $282,565 for the period.
10. Distributions to Shareholders.
Distributions to shareholders of each class were as follows:
Years ended October 31, | 2010 | 2009A |
From net investment income | | |
Class A | $ 9,814 | $ - |
Class T | 2,409 | - |
Class B | 75 | - |
Class C | 827 | - |
Worldwide | 6,404,601 | 11,746,083 |
Institutional Class | 2,241 | - |
Total | $ 6,419,967 | $ 11,746,083 |
From net realized gain | | |
Class A | $ 1,404 | $ - |
Class T | 480 | - |
Class B | 191 | - |
Class C | 373 | - |
Worldwide | 990,471 | - |
Institutional Class | 294 | - |
Total | $ 993,213 | $ - |
A Distributions for Class A, Class T, Class B Class C and Institutional class are for the period February 19, 2009 (commencement of sale of shares) to October 31, 2009.
11. Share Transactions.
Transactions for each class of shares were as follows:
| Shares | Dollars |
Years ended October 31, | 2010 | 2009A | 2010 | 2009A |
Class A | | | | |
Shares sold | 404,777 | 68,262 | $ 6,463,954 | $ 954,848 |
Reinvestment of distributions | 589 | - | 9,399 | - |
Shares redeemed | (41,328) | (1,913) | (668,935) | (30,621) |
Net increase (decrease) | 364,038 | 66,349 | $ 5,804,418 | $ 924,227 |
Annual Report
11. Share Transactions - continued
| Shares | Dollars |
Years ended October 31, | 2010 | 2009A | 2010 | 2009A |
Class T | | | | |
Shares sold | 57,729 | 31,350 | $ 930,150 | $ 413,190 |
Reinvestment of distributions | 156 | - | 2,498 | - |
Shares redeemed | (24,377) | (691) | (385,540) | (10,728) |
Net increase (decrease) | 33,508 | 30,659 | $ 547,108 | $ 402,462 |
Class B | | | | |
Shares sold | 11,168 | 16,229 | $ 177,092 | $ 199,531 |
Reinvestment of distributions | 16 | - | 260 | - |
Shares redeemed | (8,709) | (1,150) | (138,098) | (18,389) |
Net increase (decrease) | 2,475 | 15,079 | $ 39,254 | $ 181,142 |
Class C | | | | |
Shares sold | 34,028 | 23,542 | $ 543,674 | $ 304,403 |
Reinvestment of distributions | 68 | - | 1,087 | - |
Shares redeemed | (15,747) | (1,012) | (246,126) | (14,575) |
Net increase (decrease) | 18,349 | 22,530 | $ 298,635 | $ 289,828 |
Worldwide | | | | |
Shares sold | 8,421,228 | 9,823,250 | $ 135,177,567 | $ 126,506,866 |
Reinvestment of distributions | 449,494 | 959,833 | 7,194,622 | 11,413,258 |
Shares redeemed | (13,209,138) | (14,319,175) | (210,537,866) | (180,350,310) |
Net increase (decrease) | (4,338,416) | (3,536,092) | $ (68,165,677) | $ (42,430,186) |
Institutional Class | | | | |
Shares sold | 9,920 | 19,375 | $ 162,697 | $ 249,261 |
Reinvestment of distributions | 158 | - | 2,535 | - |
Shares redeemed | (10,397) | (6) | (165,950) | (83) |
Net increase (decrease) | (319) | 19,369 | $ (718) | $ 249,178 |
A Share transactions for Class A, Class T, Class B Class C and Institutional class are for the period February 19, 2009 (commencement of sale of shares) to October 31, 2009.
12. Other.
The Fund's organizational documents provide former and current trustees and officers with a limited indemnification against liabilities arising in connection with the performance of their duties to the Fund. In the normal course of business, the Fund may also enter into contracts that provide general indemnifications. The Fund's maximum exposure under these arrangements is unknown as this would be dependent on future claims that may be made against the Fund. The risk of material loss from such claims is considered remote.
Annual Report
Report of Independent Registered Public Accounting Firm
To the Trustees of Fidelity Investment Trust and Shareholders of Fidelity Worldwide Fund:
We have audited the accompanying statement of assets and liabilities of Fidelity Worldwide Fund (the Fund), a fund of Fidelity Investment Trust, including the schedule of investments, as of October 31, 2010, and the related statement of operations for the year then ended, the statement of changes in net assets for each of the two years in the period then ended, and the financial highlights for each of the five years in the period then ended. These financial statements and financial highlights are the responsibility of the Fund's management. Our responsibility is to express an opinion on these financial statements and financial highlights based on our audits.
We conducted our audits in accordance with standards of the Public Company Accounting Oversight Board (United States). Those standards require that we plan and perform the audit to obtain reasonable assurance about whether the financial statements and financial highlights are free of material misstatement. The Fund is not required to have, nor were we engaged to perform, an audit of its internal control over financial reporting. Our audits included consideration of internal control over financial reporting as a basis for designing audit procedures that are appropriate in the circumstances, but not for the purpose of expressing an opinion on the effectiveness of the Fund's internal control over financial reporting. Accordingly, we express no such opinion. An audit also includes examining, on a test basis, evidence supporting the amounts and disclosures in the financial statements, assessing the accounting principles used and significant estimates made by management, as well as evaluating the overall financial statement presentation. Our procedures included confirmation of securities owned as of October 31, 2010, by correspondence with the custodians and brokers; where replies were not received from brokers, we performed other auditing procedures. We believe that our audits provide a reasonable basis for our opinion.
In our opinion, the financial statements and financial highlights referred to above present fairly, in all material respects, the financial position of Fidelity Worldwide Fund as of October 31, 2010, the results of its operations for the year then ended, the changes in its net assets for each of the two years in the period then ended, and its financial highlights for each of the five years in the period then ended, in conformity with accounting principles generally accepted in the United States of America.
/s/ Deloitte & Touche LLP
DELOITTE & TOUCHE LLP
Boston, Massachusetts
December 17, 2010
Annual Report
The Trustees, Member of the Advisory Board, and executive officers of the trust and fund, as applicable, are listed below. The Board of Trustees governs the fund and is responsible for protecting the interests of shareholders. The Trustees are experienced executives who meet periodically throughout the year to oversee the fund's activities, review contractual arrangements with companies that provide services to the fund, oversee management of the risks associated with such activities and contractual arrangements, and review the fund's performance. Except for James C. Curvey, each of the Trustees oversees 221 funds advised by FMR or an affiliate. Mr. Curvey oversees 410 funds advised by FMR or an affiliate.
The Trustees hold office without limit in time except that (a) any Trustee may resign; (b) any Trustee may be removed by written instrument, signed by at least two-thirds of the number of Trustees prior to such removal; (c) any Trustee who requests to be retired or who has become incapacitated by illness or injury may be retired by written instrument signed by a majority of the other Trustees; and (d) any Trustee may be removed at any special meeting of shareholders by a two-thirds vote of the outstanding voting securities of the trust. Each Trustee who is not an interested person (as defined in the 1940 Act) (Independent Trustee), shall retire not later than the last day of the calendar year in which his or her 72nd birthday occurs. The Independent Trustees may waive this mandatory retirement age policy with respect to individual Trustees. The executive officers and Advisory Board Member hold office without limit in time, except that any officer and Advisory Board Member may resign or may be removed by a vote of a majority of the Trustees at any regular meeting or any special meeting of the Trustees. Except as indicated, each individual has held the office shown or other offices in the same company for the past five years.
Experience, Skills, Attributes, and Qualifications of the Fund's Trustees. The Governance and Nominating Committee has adopted a statement of policy that describes the experience, qualifications, attributes, and skills that are necessary and desirable for potential Independent Trustee candidates (Statement of Policy). The Board believes that each Trustee satisfied at the time he or she was initially elected or appointed a Trustee, and continues to satisfy, the standards contemplated by the Statement of Policy. The Governance and Nominating Committee also engages professional search firms to help identify potential Independent Trustee candidates who have the experience, qualifications, attributes, and skills consistent with the Statement of Policy. From time to time, additional criteria based on the composition and skills of the current Independent Trustees, as well as experience or skills that may be appropriate in light of future changes to board composition, business conditions, and regulatory or other developments, have also been considered by the professional search firms and the Governance and Nominating Committee. In addition, the Board takes into account the Trustees' commitment and participation in Board and committee meetings, as well as their leadership of standing and ad hoc committees throughout their tenure.
In determining that a particular Trustee was and continues to be qualified to serve as a Trustee, the Board has considered a variety of criteria, none of which, in isolation, was controlling. The Board believes that, collectively, the Trustees have balanced and diverse experience, qualifications, attributes, and skills, which allow the Board to operate effectively in governing the fund and protecting the interests of shareholders. Information about the specific experience, skills, attributes, and qualifications of each Trustee, which in each case led to the Board's conclusion that the Trustee should serve (or continue to serve) as a trustee of the fund, is provided below.
Board Structure and Oversight Function. Edward C. Johnson 3d is an interested person (as defined in the 1940 Act) and currently serves as Chairman. The Trustees have determined that an interested Chairman is appropriate and benefits shareholders because an interested Chairman has a personal and professional stake in the quality and continuity of services provided to the fund. Independent Trustees exercise their informed business judgment to appoint an individual of their choosing to serve as Chairman, regardless of whether the Trustee happens to be independent or a member of management. The Independent Trustees have determined that they can act independently and effectively without having an Independent Trustee serve as Chairman and that a key structural component for assuring that they are in a position to do so is for the Independent Trustees to constitute a substantial majority for the Board. The Independent Trustees also regularly meet in executive session. Ned C. Lautenbach serves as Chairman of the Independent Trustees and as such (i) acts as a liaison between the Independent Trustees and management with respect to matters important to the Independent Trustees and (ii) with management prepares agendas for Board meetings.
Fidelity funds are overseen by different Boards of Trustees. The fund's Board oversees Fidelity's equity and high income funds and another Board oversees Fidelity's investment-grade bond, money market, and asset allocation funds. The asset allocation funds may invest in Fidelity funds overseen by the fund's Board. The use of separate Boards, each with its own committee structure, allows the Trustees of each group of Fidelity funds to focus on the unique issues of the funds they oversee, including common research, investment, and operational issues. On occasion, the separate Boards establish joint committees to address issues of overlapping consequences for the Fidelity funds overseen by each Board.
The Trustees operate using a system of committees to facilitate the timely and efficient consideration of all matters of importance to the Trustees, the fund, and fund shareholders and to facilitate compliance with legal and regulatory requirements and oversight of the fund's activities and associated risks. The Board, acting through its committees, has charged FMR and its affiliates with (i) identifying events or circumstances the occurrence of which could have demonstrably adverse effects on the fund's business and/or reputation; (ii) implementing processes and controls to lessen the possibility that such events or circumstances occur or to mitigate the effects of such events or circumstances if they do occur; and (iii) creating and maintaining a system designed to evaluate continuously business and market conditions in order to facilitate the identification and implementation processes described in (i) and (ii) above. Because the day-to-day operations and activities of the fund are carried out by or through FMR, its affiliates and other service providers, the fund's exposure to risks is mitigated but not eliminated by the processes overseen by the Trustees. While each of the Board's committees has responsibility for overseeing different aspects of the fund's activities, oversight is exercised primarily through the Operations, Audit, and Compliance Committees. Appropriate personnel, including but not limited to the fund's Chief Compliance Officer (CCO), FMR's internal auditor, the independent accountants, the fund's Treasurer and portfolio management personnel, make periodic reports to the Board's committees, as appropriate. The responsibilities of each committee, including their oversight responsibilities, are described further under "Standing Committees of the Fund's Trustees."
Annual Report
Trustees and Officers - continued
The fund's Statement of Additional Information (SAI) includes more information about the Trustees. To request a free copy, call Fidelity at 1-877-208-0098.
Interested Trustees*:
Correspondence intended for each Trustee who is an interested person may be sent to Fidelity Investments, 82 Devonshire Street, Boston, Massachusetts 02109.
Name, Age; Principal Occupations and Other Relevant Experience+ |
Edward C. Johnson 3d (80) |
| Year of Election or Appointment: 1984 Mr. Johnson is Trustee and Chairman of the Board of Trustees of certain Trusts. Mr. Johnson serves as Chief Executive Officer, Chairman, and a Director of FMR LLC; Chairman and a Director of FMR; Chairman and a Director of Fidelity Research & Analysis Company (FRAC); Chairman and a Director of Fidelity Investments Money Management, Inc.; and Chairman and a Director of FMR Co., Inc. In addition, Mr. Johnson serves as Chairman and Director of FIL Limited. Previously, Mr. Johnson served as President of FMR LLC (2006-2007). |
James C. Curvey (75) |
| Year of Election or Appointment: 2007 Mr. Curvey also serves as Trustee (2007-present) of other investment companies advised by FMR. Mr. Curvey is a Director of Fidelity Investments Money Management, Inc. (2009-present), Director of Fidelity Research & Analysis Co. (2009-present) and Director of FMR and FMR Co., Inc. (2007-present). Mr. Curvey is also Vice Chairman (2007-present) and Director of FMR LLC. In addition, Mr. Curvey serves as an Overseer for the Boston Symphony Orchestra and a member of the Trustees of Villanova University. Previously, Mr. Curvey was the Vice Chairman (2006-2007) and Director (2000-2007) of FMR Corp. |
* Trustees have been determined to be "Interested Trustees" by virtue of, among other things, their affiliation with the trust or various entities under common control with FMR.
+ The information above includes each Trustee's principal occupation during the last five years and other information relating to the experience, attributes, and skills relevant to each Trustee's qualifications to serve as a Trustee, which led to the conclusion that each Trustee should serve as a Trustee for the fund.
Independent Trustees:
Correspondence intended for each Independent Trustee (that is, the Trustees other than the Interested Trustees) may be sent to Fidelity Investments, P.O. Box 55235, Boston, Massachusetts 02205-5235.
Name, Age; Principal Occupations and Other Relevant Experience+ |
Dennis J. Dirks (62) |
| Year of Election or Appointment: 2005 Prior to his retirement in May 2003, Mr. Dirks was Chief Operating Officer and a member of the Board of The Depository Trust & Clearing Corporation (DTCC). He also served as President, Chief Operating Officer, and Board member of The Depository Trust Company (DTC) and President and Board member of the National Securities Clearing Corporation (NSCC). In addition, Mr. Dirks served as Chief Executive Officer and Board member of the Government Securities Clearing Corporation, Chief Executive Officer and Board member of the Mortgage-Backed Securities Clearing Corporation, as a Trustee and a member of the Finance Committee of Manhattan College (2005-2008), and as a Trustee and a member of the Finance Committee of AHRC of Nassau County (2006-2008). Mr. Dirks is a member of the Independent Directors Council (IDC) Governing Council (2010-Present) and Board of Directors for The Brookville Center for Children's Services, Inc. (2009-present). |
Alan J. Lacy (57) |
| Year of Election or Appointment: 2008 Mr. Lacy serves as Senior Adviser (2007-present) of Oak Hill Capital Partners, L.P. (private equity). Mr. Lacy also served as Chief Executive Officer (2000-2005) and Vice Chairman (2005-2006) of Sears Holdings Corporation and Sears, Roebuck and Co. (retail). In addition, Mr. Lacy serves as a member of the Board of Directors of The Western Union Company (global money transfer, 2006-present) and Bristol-Myers Squibb Company (global pharmaceuticals, 2007-present). Mr. Lacy is Chairman (2008-present) and a member (2006-present) of the Board of Trustees of The National Parks Conservation Association. |
Ned C. Lautenbach (66) |
| Year of Election or Appointment: 2000 Mr. Lautenbach is Chairman of the Independent Trustees of the Equity and High Income Funds (2006-present). Mr. Lautenbach currently serves as the Lead Director of the Eaton Corporation Board of Directors (diversified industrial, 1997-present). Mr. Lautenbach is also a member of the Board of Directors of the Philharmonic Center for the Arts in Naples, Florida (1999 -
present); a member of the Board of Trustees of Fairfield University (2005-present); and a member of the Council on Foreign Relations (1994 - present). Previously, Mr. Lautenbach was a Partner/Advisory Partner at Clayton, Dubilier & Rice, Inc. (private equity investment, 1998-2010), as well as a Director of Sony Corporation (2006-2007). |
Joseph Mauriello (66) |
| Year of Election or Appointment: 2008 Prior to his retirement in January 2006, Mr. Mauriello served in numerous senior management positions including Deputy Chairman and Chief Operating Officer (2004-2005), and Vice Chairman of Financial Services (2002-2004) of KPMG LLP US (professional services, 1965-2005). Mr. Mauriello currently serves as a member of the Board of Directors of XL Group plc. (global insurance and re-insurance, 2006-present) and of Arcadia Resources Inc. (health care services and products, 2007-present). Previously, Mr. Mauriello served as a Director of the Hamilton Funds of the Bank of New York (2006-2007). |
Cornelia M. Small (66) |
| Year of Election or Appointment: 2005 Ms. Small is a member of the Board of Directors of the Teagle Foundation (2009-present). Ms. Small is also a member of the Investment Committee, and Chair (2008-present) and a member of the Board of Trustees of Smith College. In addition, Ms. Small serves on the Investment Committee of the Berkshire Taconic Community Foundation (2008-present). Previously, Ms. Small served as Chairperson of the Investment Committee (2002-2008) of Smith College. In addition, Ms. Small served as Chief Investment Officer, Director of Global Equity Investments, and a member of the Board of Directors of Scudder, Stevens & Clark and Scudder Kemper Investments. |
William S. Stavropoulos (71) |
| Year of Election or Appointment: 2001 Mr. Stavropoulos is Vice Chairman of the Independent Trustees of the Equity and High Income Funds (2006-present). Mr. Stavropoulos serves as President and Founder of the Michigan Baseball Foundation, the Great Lakes Loons (2007-present). Mr. Stavropoulos is Chairman Emeritus of the Board of Directors of The Dow Chemical Company, where he previously served in numerous senior management positions, including President, CEO (1995-2000; 2002-2004), Chairman of the Executive Committee (2000-2006), and as a member of the Board of Directors (1990-2006). Currently, Mr. Stavropoulos is Chairman of Univar (global distributor of commodity and specialty chemicals, 2010-present), a Director of Teradata Corporation (data warehousing and technology solutions, 2008-present), Chemical Financial Corporation, Maersk Inc. (industrial conglomerate), Tyco International, Inc. (multinational manufacturing and services, 2007-present), and a member of the Advisory Board for Metalmark Capital (private equity investment, 2005-present). Mr. Stavropoulos is a special advisor to Clayton, Dubilier & Rice, Inc. (private equity investment). In addition, Mr. Stavropoulos is a member of the University of Notre Dame Advisory Council for the College of Science. |
David M. Thomas (61) |
| Year of Election or Appointment: 2008 Previously, Mr. Thomas served as Executive Chairman (2005-2006) and Chairman and Chief Executive Officer (2000-2005) of IMS Health, Inc. (pharmaceutical and healthcare information solutions). In addition, Mr. Thomas serves as a member of the Board of Directors of Fortune Brands, Inc. (consumer products), and Interpublic Group of Companies, Inc. (marketing communication, 2004-present). |
Michael E. Wiley (60) |
| Year of Election or Appointment: 2008 Mr. Wiley also serves as a Director of Asia Pacific Exploration Consolidated (international oil and gas exploration and production, 2008-present). Mr. Wiley serves as a Director of Tesoro Corporation (independent oil refiner and marketer, 2005-present), and a Director of Bill Barrett Corporation (exploration and production, 2005-present). In addition, Mr. Wiley also serves as a Director of Post Oak Bank (privately-held bank, 2004-present). Previously, Mr. Wiley served as a member of the Board of Trustees of the University of Tulsa (2000-2006; 2007-2010), as a Senior Energy Advisor of Katzenbach Partners, LLC (consulting, 2006-2007), as an Advisory Director of Riverstone Holdings (private investment), Chairman, President, and CEO of Baker Hughes, Inc. (oilfield services, 2000-2004), and as Director of Spinnaker Exploration Company (exploration and production, 2001-2005). |
+ The information above includes each Trustee's principal occupation during the last five years and other information relating to the experience, attributes, and skills relevant to each Trustee's qualifications to serve as a Trustee, which led to the conclusion that each Trustee should serve as a Trustee for the fund.
Annual Report
Trustees and Officers - continued
Advisory Board Member and Executive Officers:
Correspondence intended for each executive officer and Peter S. Lynch may be sent to Fidelity Investments, 82 Devonshire Street, Boston, Massachusetts 02109.
Name, Age; Principal Occupation |
Peter S. Lynch (66) |
| Year of Election or Appointment: 2003 Member of the Advisory Board of Fidelity's Equity and High Income Funds. Mr. Lynch is Vice Chairman and a Director of FMR and FMR Co., Inc. In addition, Mr. Lynch serves as a Trustee of Boston College and as the Chairman of the Inner-City Scholarship Fund. Previously, Mr. Lynch served on the Special Olympics International Board of Directors (1997-2006). |
Kenneth B. Robins (41) |
| Year of Election or Appointment: 2008 President and Treasurer of Fidelity's Equity and High Income Funds. Mr. Robins also serves as President and Treasurer (2010-
present) and Assistant Treasurer (2009-present) of other Fidelity funds and is an employee of Fidelity Investments (2004-present). Previously, Mr. Robins served as Deputy Treasurer of the Fidelity funds (2005-2008) and Treasurer and Chief Financial Officer of The North Carolina Capital Management Trust: Cash and Term Portfolios (2006-2008). |
Bruce T. Herring (45) |
| Year of Election or Appointment: 2006 Vice President of certain Equity Funds. Mr. Herring also serves as Chief Investment Officer and Director of Fidelity Management & Research (U.K.) Inc. (2010-present) and Group Chief Investments Officer of FMR. Previously, Mr. Herring served as Vice President (2005-2006) and Senior Vice President (2006-2007) of Fidelity Management & Research Company, Vice President of FMR Co., Inc. (2001-2007) and as a portfolio manager for Fidelity U.S. Equity Funds. |
Brian B. Hogan (46) |
| Year of Election or Appointment: 2009 Vice President of certain Equity Funds and Vice President of Sector Funds. Mr. Hogan also serves as President of FMR's Equity Division (2009-present). Previously, Mr. Hogan served as Senior Vice President, Equity Research of FMR (2006-2009) and as a portfolio manager. |
Scott C. Goebel (42) |
| Year of Election or Appointment: 2008 Secretary and Chief Legal Officer (CLO) of the Fidelity funds. Mr. Goebel also serves as Secretary and CLO of The North Carolina Capital Management Trust: Cash and Term Portfolio (2008-present); General Counsel, Secretary, and Senior Vice President of FMR (2008-present) and FMR Co., Inc. (2008-present); Deputy General Counsel of FMR LLC; Chief Legal Officer of Fidelity Management & Research (Hong Kong) Limited (2008-present) and Assistant Secretary of Fidelity Management & Research (Japan) Inc. (2008-present), Fidelity Investments Money Management, Inc. (2008-present), Fidelity Management & Research (U.K.) Inc. (2008-present), and Fidelity Research and Analysis Company (2008-present). Previously, Mr. Goebel served as Assistant Secretary of the Funds (2007-2008) and as Vice President and Secretary of Fidelity Distributors Corporation (FDC) (2005-2007). |
William C. Coffey (41) |
| Year of Election or Appointment: 2009 Assistant Secretary of Fidelity's Equity and High Income Funds. Mr. Coffey also serves as Senior Vice President and Deputy General Counsel of FMR LLC (2010-present), and is an employee of Fidelity Investments. Previously, Mr. Coffey served as Vice President and Associate General Counsel of FMR LLC (2005-2009). |
Holly C. Laurent (56) |
| Year of Election or Appointment: 2008 Anti-Money Laundering (AML) Officer of the Fidelity funds. Ms. Laurent also serves as AML Officer of The North Carolina Capital Management Trust: Cash and Term Portfolio (2008-present) and is an employee of Fidelity Investments. Previously, Ms. Laurent was Senior Vice President and Head of Legal for Fidelity Business Services India Pvt. Ltd. (2006-2008), and Senior Vice President, Deputy General Counsel and Group Head for FMR LLC (2005-2006). |
Christine Reynolds (52) |
| Year of Election or Appointment: 2008 Chief Financial Officer of the Fidelity funds. Ms. Reynolds became President of Fidelity Pricing and Cash Management Services (FPCMS) in August 2008. Ms. Reynolds served as Chief Operating Officer of FPCMS (2007-2008). Previously, Ms. Reynolds served as President, Treasurer, and Anti-Money Laundering officer of the Fidelity funds (2004-2007). |
Kenneth A. Rathgeber (63) |
| Year of Election or Appointment: 2004 Chief Compliance Officer of Fidelity's Equity and High Income Funds. Mr. Rathgeber is Chief Compliance Officer of Fidelity Management & Research (Hong Kong) Limited (2008-present), Fidelity Management & Research (Japan) Inc. (2008-present), FMR (2005-present), FMR Co., Inc. (2005-present), Fidelity Management & Research (U.K.) Inc. (2005-present), Fidelity Research & Analysis Company (2005-present), Fidelity Investments Money Management, Inc. (2005-present), Pyramis Global Advisors, LLC (2005-present), and Strategic Advisers, Inc. (2005-present). |
Jeffrey S. Christian (49) |
| Year of Election or Appointment: 2009 Deputy Treasurer of the Fidelity funds. Mr. Christian is an employee of Fidelity Investments. Previously, Mr. Christian served as Chief Financial Officer (2008-2009) of certain Fidelity funds and Senior Vice President of Fidelity Pricing and Cash Management Services (FPCMS) (2004-2009). |
Bryan A. Mehrmann (49) |
| Year of Election or Appointment: 2005 Deputy Treasurer of the Fidelity funds. Mr. Mehrmann is an employee of Fidelity Investments. |
Adrien E. Deberghes (43) |
| Year of Election or Appointment: 2008 Deputy Treasurer of Fidelity's Equity and High Income Funds. Mr. Deberghes also serves as Assistant Treasurer of other Fidelity funds (2010-present) and is an employee of Fidelity Investments (2008-present). Previously, Mr. Deberghes served as Senior Vice President of Mutual Fund Administration at State Street Corporation (2007-2008), Senior Director of Mutual Fund Administration at Investors Bank & Trust (2005-2007), and Director of Finance for Dunkin' Brands (2000-2005). |
Stephanie J. Dorsey (41) |
| Year of Election or Appointment: 2010 Assistant Treasurer of Fidelity's Equity and High Income Funds. Ms. Dorsey also serves as Deputy Treasurer of other Fidelity funds (2008-present) and is an employee of Fidelity Investments (2008-present). Previously, Ms. Dorsey served as Treasurer (2004-2008) of the JPMorgan Mutual Funds and Vice President (2004-2008) of JPMorgan Chase Bank. |
John R. Hebble (52) |
| Year of Election or Appointment: 2009 Assistant Treasurer of Fidelity's Equity and High Income Funds. Mr. Hebble also serves as Treasurer and Chief Financial Officer of The North Carolina Capital Management Trust: Cash and Term Portfolio (2008-present), President and Treasurer of other Fidelity funds (2008-present) and is an employee of Fidelity Investments. |
Gary W. Ryan (52) |
| Year of Election or Appointment: 2005 Assistant Treasurer of the Fidelity funds. Mr. Ryan is an employee of Fidelity Investments. Previously, Mr. Ryan served as Vice President of Fund Reporting in Fidelity Pricing and Cash Management Services (FPCMS) (1999-2005). |
Jonathan Davis (42) |
| Year of Election or Appointment: 2010 Assistant Treasurer of the Fidelity funds. Mr. Davis is an employee of Fidelity Investments. Previously, Mr. Davis served as Vice President and Associate General Counsel of FMR LLC (2003-2010). |
Annual Report
The Board of Trustees of Fidelity Worldwide Fund voted to pay on December 6, 2010 to shareholders of record at the opening of business on December 3, 2010, the following distributions per share derived from capital gains realized from sales of portfolio securities and dividends derived from net investment income:
| Pay Date | Record Date | Dividends | Capital Gains |
Institutional Class | 12/06/10 | 12/03/10 | $0.092 | $0.046 |
A percentage of the dividends distributed during the fiscal year for the following funds qualify for the dividends-received deduction for corporate shareholders:
| Ex Date | % |
Institutional Class | 12/04/2009 | 50% |
Institutional Class | 12/30/2009 | 100% |
A percentage of the dividends distributed during the fiscal year for the following fund may be taken into account as a dividend for purposes of the maximum rate under section 1(h)(11) of the Internal Revenue Code:
| Ex Date | % |
Institutional Class | 12/04/2009 | 100% |
Institutional Class | 12/30/2009 | 100% |
The amounts per share which represent income derived from sources within, and taxes paid to, foreign countries or possessions of the United States are as follows:
| Pay Date | Income | Taxes |
Institutional Class | 12/07/2009 | $0.111 | $0.0113 |
Institutional Class | 12/31/2009 | $0.004 | $0.000 |
The fund will notify shareholders in January 2011 of amounts for use in preparing 2010 income tax returns.
Annual Report
Board Approval of Investment Advisory Contracts and Management Fees
Fidelity Worldwide Fund
Each year, the Board of Trustees, including the Independent Trustees (together, the Board), votes on the renewal of the management contract and sub-advisory agreements (together, the Advisory Contracts) for the fund. The Board, assisted by the advice of fund counsel and Independent Trustees' counsel, requests and considers a broad range of information relevant to the renewal of the Advisory Contracts throughout the year.
The Board meets regularly and considers at each of its meetings factors that are relevant to its annual consideration of the renewal of the fund's Advisory Contracts, including the services and support provided to the fund and its shareholders. The Board has established various standing committees, each composed of Independent Trustees with varying backgrounds, to which the Board has assigned specific subject matter responsibilities in order to enhance effective decision-making by the Board. The Board, acting directly and through its Committees, requests and receives information concerning the annual consideration of the renewal of the fund's Advisory Contracts. The Board also meets as needed to consider matters specifically related to the Board's annual consideration of the renewal of Advisory Contracts. Members of the Board may also meet with trustees of other Fidelity funds through ad hoc joint committees to discuss certain matters relevant to the Fidelity funds.
At its July 2010 meeting, the Board of Trustees, including the Independent Trustees, unanimously determined to renew the fund's Advisory Contracts. In reaching its determination, the Board considered all factors it believed relevant, including (i) the nature, extent, and quality of the services to be provided to the fund and its shareholders (including the investment performance of the fund); (ii) the competitiveness of the fund's management fee and total expenses; (iii) the total costs of the services to be provided by and the profits to be realized by Fidelity from its relationship with the fund; (iv) the extent to which economies of scale would be realized as the fund grows; and (v) whether fee levels reflect these economies of scale, if any, for the benefit of fund shareholders.
In considering whether to renew the Advisory Contracts for the fund, the Board reached a determination, with the assistance of fund counsel and Independent Trustees' counsel and through the exercise of its business judgment, that the renewal of the Advisory Contracts is in the best interests of fund shareholders and that the compensation to be received by Fidelity under the management contract is fair and reasonable. The Board's decision to renew the Advisory Contracts was not based on any single factor noted above, but rather was based on a comprehensive consideration of all the information provided to the Board at its meetings throughout the year. The Board, in reaching its determination to renew the Advisory Contracts, is aware that shareholders in the fund have a broad range of investment choices available to them, including a wide choice among mutual funds offered by Fidelity's competitors, and that the fund's shareholders, with the opportunity to review and weigh the disclosure provided by the fund in its prospectus and other public disclosures, have chosen to invest in this fund, managed by Fidelity.
Nature, Extent, and Quality of Services Provided. The Board considered the staffing within the investment adviser, FMR, and the sub-advisers (together, the Investment Advisers), including the backgrounds of the fund's investment personnel and the fund's investment objective and discipline. The Independent Trustees also had discussions with senior management of Fidelity's investment operations and investment groups. The Board considered the structure of the portfolio manager compensation program and whether this structure provides appropriate incentives to act in the best interest of the fund.
Resources Dedicated to Investment Management and Support Services. The Board and the equity research subcommittee of the Board's Fund Oversight Committee reviewed the size, education, and experience of the Investment Advisers' investment staff, their use of technology, and the Investment Advisers' approach to recruiting, training, and retaining portfolio managers and other research, advisory, and management personnel. The Board noted that Fidelity's analysts have access to a variety of technological tools and market and securities data that enable them to perform both fundamental and quantitative analysis and to specialize in various disciplines. The Board considered Fidelity's extensive global research capabilities that enable the Investment Advisers to aggregate data from various sources in an effort to produce positive investment results. The Board also considered that Fidelity's portfolio managers and analysts have access to daily portfolio attribution that allows for monitoring of a fund's portfolio, as well as an electronic communication system that provides immediate real-time access to research concerning issuers and credit enhancers. The Board noted FMR's continued focus on strengthening the organization and discipline of equity portfolio management and research.
Shareholder and Administrative Services. The Board considered (i) the nature, extent, quality, and cost of advisory, administrative, and shareholder services performed by the Investment Advisers and their affiliates under the Advisory Contracts and under separate agreements covering transfer agency, pricing and bookkeeping, and securities lending services for the fund; (ii) the nature and extent of the investment adviser's supervision of third party service providers, principally custodians and subcustodians; and (iii) the resources devoted to, and the record of compliance with, the fund's compliance policies and procedures. The Board also reviewed the allocation of fund brokerage, including allocations to brokers affiliated with the Investment Advisers, the use of brokerage commissions to pay fund expenses, and the use of "soft" commission dollars to pay for research services.
The Board noted that the growth of fund assets over time across the complex allows Fidelity to reinvest in the development of services designed to enhance the value or convenience of the Fidelity funds as investment vehicles. These services include 24-hour access to account information and market information through phone representatives and over the Internet, and investor education materials and asset allocation tools.
Investment in a Large Fund Family. The Board considered the benefits to shareholders of investing in a Fidelity fund, including the benefits of investing in a fund that is part of a large family of funds offering a variety of investment disciplines and providing a large variety of mutual fund investor services. The Board noted that Fidelity had taken, or had made recommendations that resulted in the Fidelity funds taking, a number of actions over the previous year that benefited particular funds, including (i) dedicating additional resources to investment research and restructuring and broadening the focus of the investment research teams; (ii) bolstering the senior management team that oversees asset management; (iii) launching Class F of certain funds as a lower-fee class available to Freedom K and Freedom Index Funds; (iv) lowering the initial investment minimums and ongoing balance requirements for Real Estate High Income Fund; (v) eliminating subsequent purchase minimums for all funds and adding a waiver of the investment minimum requirement for new accounts opened with the proceeds of a systematic withdrawal plan; (vi) eliminating the withdrawal minimum and maximum limits for systematic withdrawals from Advisor funds; (vii) expanding sales load waivers on Class A shares for Destiny Planholders and expanding Institutional Class eligibility for Class O Destiny Planholders; and (viii) changing certain Class A and Class T sales charge structures to further align them with industry practices.
Annual Report
Board Approval of Investment Advisory Contracts and Management Fees - continued
Investment Performance. The Board considered whether the fund has operated in accordance with its investment objective, as well as its record of compliance with its investment restrictions. It reviewed the fund's absolute investment performance for the retail class, as well as the fund's relative investment performance for the retail class measured over multiple periods against (i) a broad-based securities market index, and (ii) a peer group of mutual funds deemed appropriate by Fidelity and reviewed by the Board. The following charts considered by the Board show, over the one-, three-, and five-year periods ended December 31, 2009, the cumulative total returns of the retail class of the fund, the cumulative total returns of a broad-based securities market index ("benchmark"), and a range of cumulative total returns of a peer group of mutual funds identified by Morningstar, Inc. as having an investment style similar to that of the fund based on underlying portfolio holdings. (The Advisor classes of the fund had less than one year of performance as of December 31, 2009.) The box within each chart shows the 25th percentile return (bottom of box) and the 75th percentile return (top of box) of the peer group. Returns shown above the box are in the first quartile and returns shown below the box are in the fourth quartile. The percentage beaten number noted below each chart corresponds to the percentile box and represents the percentage of funds in the peer group whose performance was equal to or lower than that of the retail class of the fund.
Fidelity Worldwide Fund
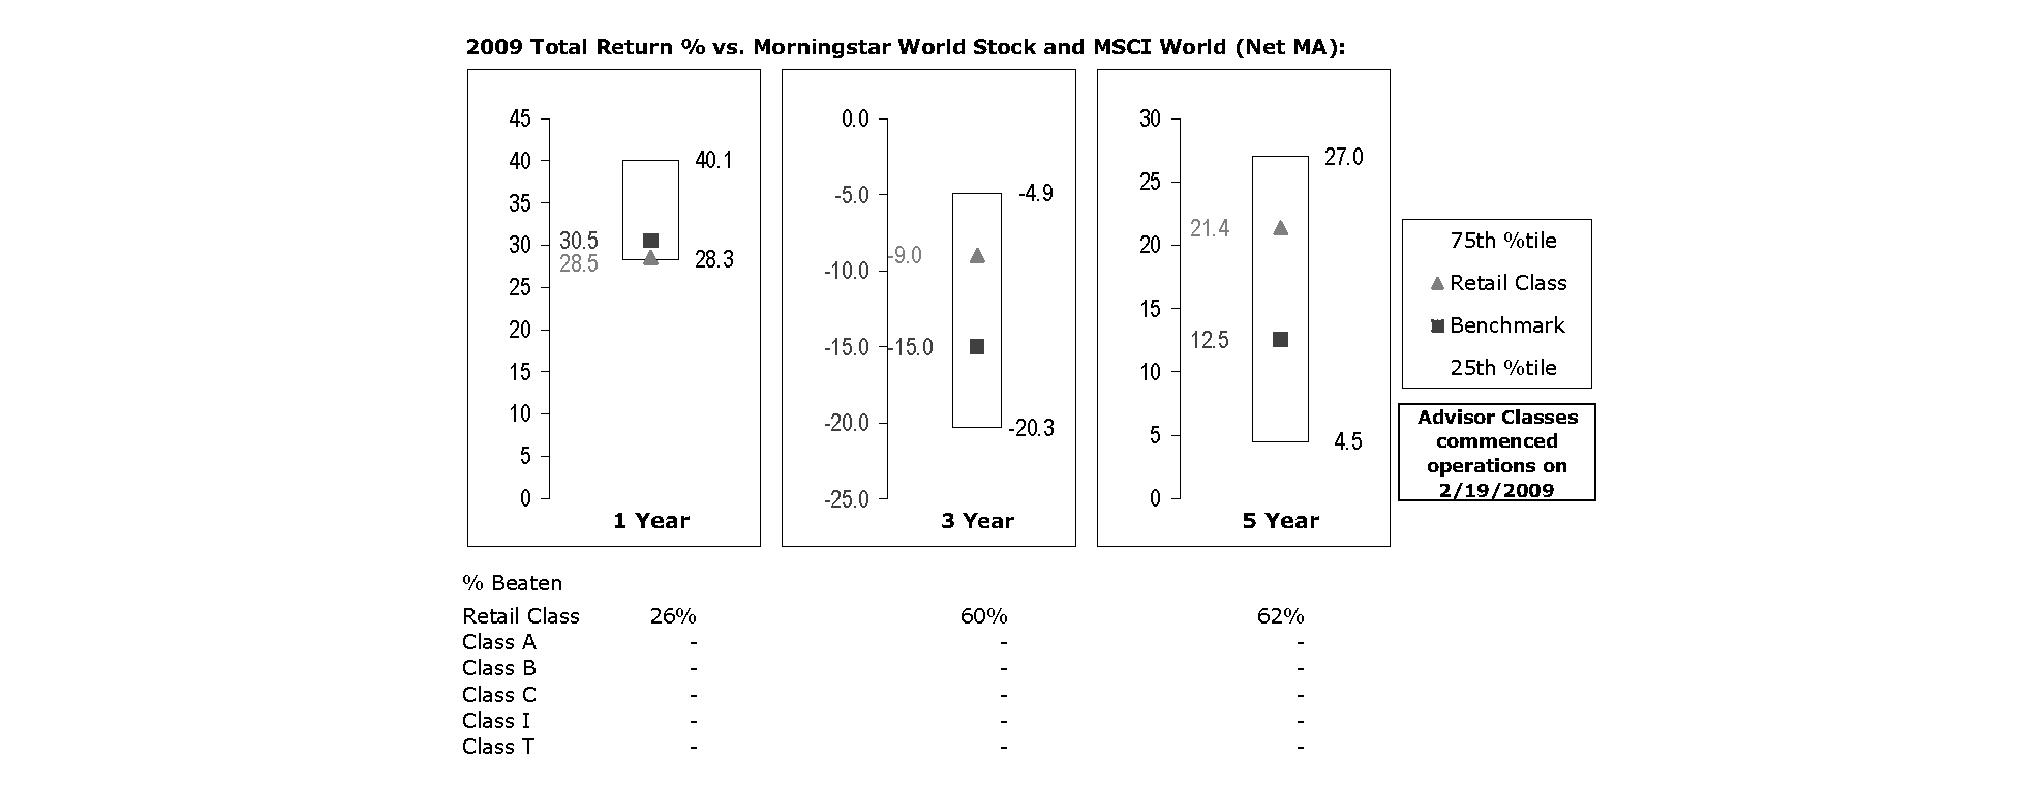
The Board reviewed the fund's relative investment performance against its peer group and noted that the performance of the retail class of the fund was in the third quartile for the one-year period and the second quartile for the three- and five-year periods. The Board also noted that the investment performance of the retail class of the fund compared favorably to its benchmark for the three- and five-year periods, although the fund's one-year cumulative total return was below its benchmark. The Board also reviewed the fund's performance since inception as well as performance in the current year.
The Board also considered that the fund's management fee is subject to upward or downward adjustment depending upon whether, and to what extent, the fund's investment performance for the performance period exceeds, or is exceeded by, the record (over the same period) of a Board-approved performance adjustment index. The Board realizes that the performance adjustment provides FMR with a strong economic incentive to seek to achieve superior performance for the fund's shareholders and helps to more closely align the interests of FMR and the fund's shareholders.
Based on its review, and giving particular weight to the nature and quality of the resources dedicated by the Investment Advisers to maintain and improve relative performance and factoring in the unprecedented market events in recent years, the Board concluded that the nature, extent, and quality of investment management and support services and of shareholder and administrative services provided to the fund will benefit the fund's shareholders, particularly in light of the Board's view that the fund's shareholders benefit from investing in a fund that is part of a large family of funds offering a variety of investment disciplines and services.
Annual Report
Competitiveness of Management Fee and Total Fund Expenses. The Board considered the fund's management fee and total expenses compared to "mapped groups" of competitive funds and classes. Fidelity creates "mapped groups" by combining similar Lipper investment objective categories that have comparable management fee characteristics. Combining Lipper investment objective categories aids the Board's management fee and total expense comparisons by broadening the competitive group used for comparison and by reducing the number of universes to which various Fidelity funds are compared.
Management Fee. The Board considered two proprietary management fee comparisons for the 12-month periods shown in the chart below. The group of Lipper funds used by the Board for management fee comparisons is referred to below as the "Total Mapped Group." The Total Mapped Group comparison focuses on a fund's standing relative to the total universe of comparable funds available to investors, in terms of gross management fees before expense reimbursements or caps, and without giving effect to the fund's performance adjustment. "TMG %" represents the percentage of funds in the Total Mapped Group that had management fees that were lower than the fund's. For example, a TMG % of 15% means that 85% of the funds in the Total Mapped Group had higher management fees than the fund. The "Asset-Size Peer Group" (ASPG) comparison focuses on a fund's standing relative to non-Fidelity funds similar in size to the fund within the Total Mapped Group. The ASPG represents at least 15% of the funds in the Total Mapped Group with comparable asset size and management fee characteristics, subject to a minimum of 50 funds (or all funds in the Total Mapped Group if fewer than 50). Additional information, such as the ASPG quartile in which the fund's management fee ranked and the impact of the fund's performance adjustment, is also included in the chart and considered by the Board.
Fidelity Worldwide Fund
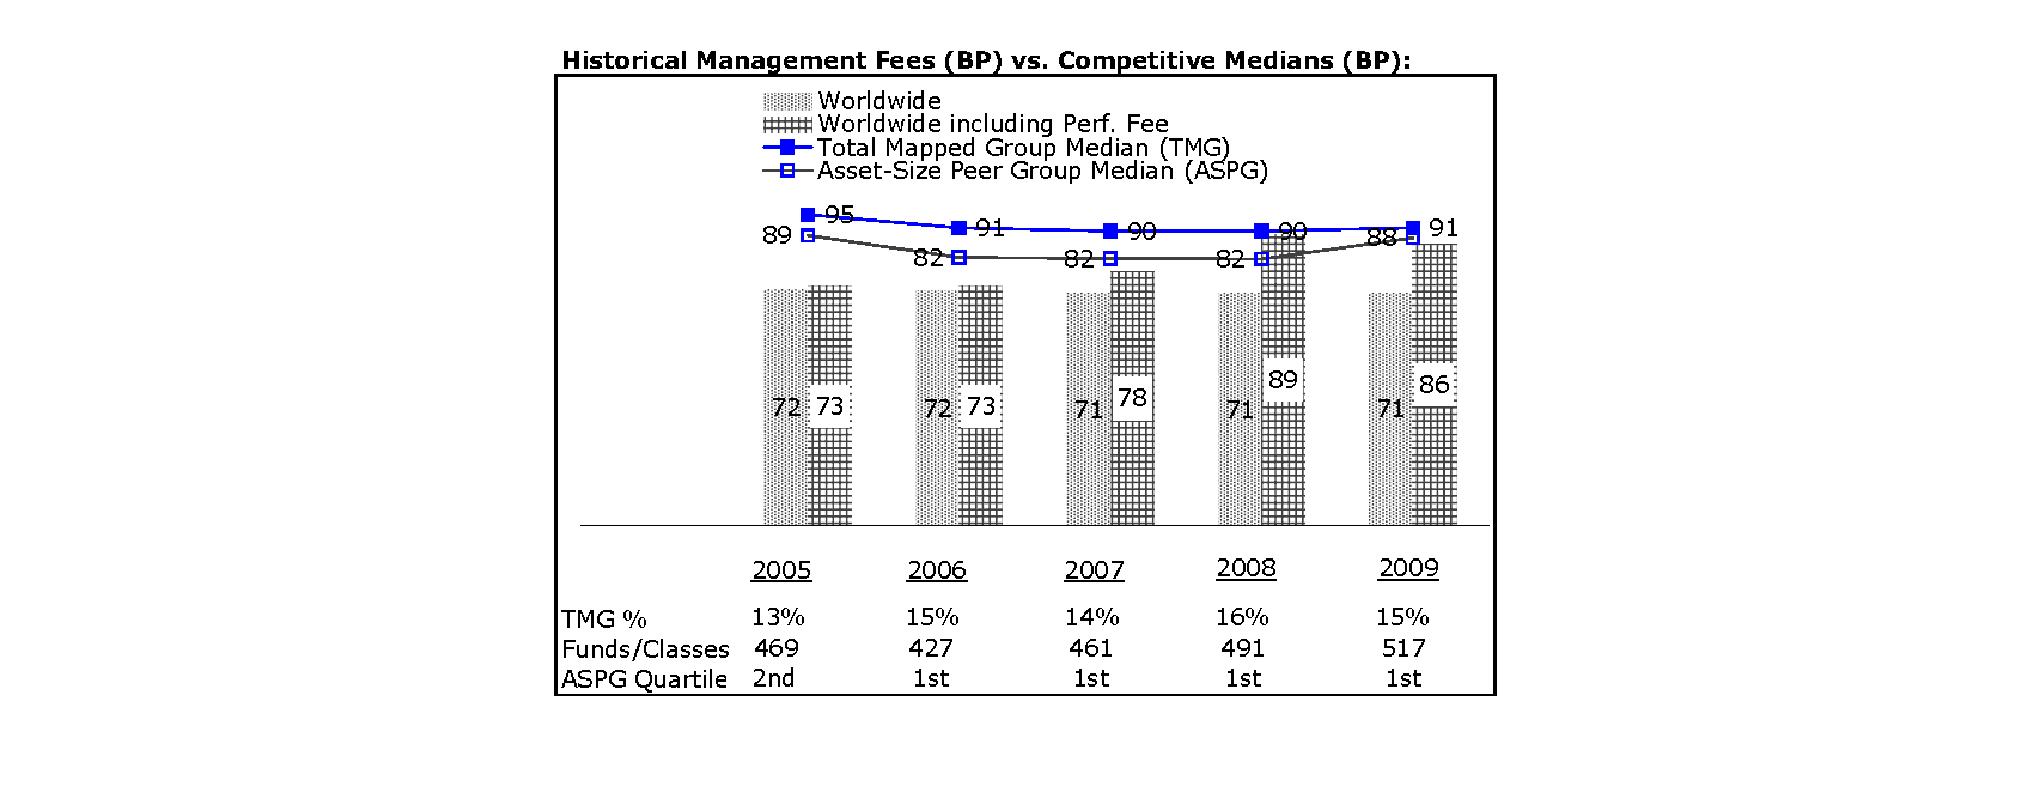
The Board noted that the fund's management fee ranked below the median of its Total Mapped Group and below the median of its ASPG for 2009. The Board also noted the effect of the fund's positive performance adjustment on the fund's management fee ranking. The Board noted that the performance adjustment for each year represents calculations for performance periods that differ from the periods shown in the performance charts above.
Based on its review, the Board concluded that the fund's management fee is fair and reasonable in light of the services that the fund receives and the other factors considered.
Total Expenses. In its review of each class's total expenses, the Board considered the fund's management fee as well as other fund or class expenses, as applicable, such as transfer agent fees, pricing and bookkeeping fees, fund-paid 12b-1 fees, and custodial, legal, and audit fees. The Board also noted the effects of any waivers and reimbursements on fees and expenses, as well as the impact of the fund's performance adjustment. As part of its review, the Board also considered current and historical total expenses of each class of the fund compared to competitive fund median expenses. Each class of the fund is compared to those funds and classes in the Total Mapped Group (used by the Board for management fee comparisons) that have a similar sales load structure.
The Board noted that the total expenses of each of Class B, Class C, and the retail class of Worldwide Fund ranked below its competitive median for 2009, the total expenses of Class A ranked equal to its competitive median for 2009, and the total expenses of each of Class T and Institutional Class ranked above its competitive median for 2009. The Board considered that the total expenses for Class T were above the median primarily because its 12b-1 fee is higher than the typical front-end load class. The Board noted that the fund offers multiple classes, each of which has a different sales load and 12b-1 fee structure, and that the multiple structures are intended to offer a range of pricing options for the intermediary market. The Board also noted that the total expenses of the classes vary primarily by the level of their 12b-1 fees, although differences in transfer agent fees may also cause expenses to vary from class to class.
Annual Report
Board Approval of Investment Advisory Contracts and Management Fees - continued
Fees Charged to Other Fidelity Clients. The Board also considered Fidelity fee structures and other information with respect to clients of FMR and its affiliates, such as other mutual funds advised or subadvised by FMR or its affiliates, pension plan clients, and other institutional clients. In March 2010, the Board created an ad hoc joint committee with the board of other Fidelity funds (the Committee) to review and compare Fidelity's institutional investment advisory business with its business of providing services to the Fidelity funds, including the differences in services provided, fees charged, and costs incurred, as well as competition in their respective marketplaces.
Based on its review of total expenses and fees charged to other Fidelity clients, the Board concluded that the total expenses of each class of the fund were reasonable in light of the services that the fund and its shareholders receive and the other factors considered, including the findings of the Committee.
Costs of the Services and Profitability. The Board considered the revenues earned and the expenses incurred by Fidelity in conducting the business of developing, marketing, distributing, managing, administering and servicing the fund and its shareholders. The Board also considered the level of Fidelity's profits in respect of all the Fidelity funds.
On an annual basis, FMR presents to the Board Fidelity's profitability for the fund. Fidelity calculates the profitability for each fund, as well as aggregate profitability for groups of Fidelity funds and all Fidelity funds, using a series of detailed revenue and cost allocation methodologies which originate with the audited books and records of Fidelity. The Audit Committee of the Board reviews any significant changes from the prior year's methodologies.
PricewaterhouseCoopers LLP (PwC), independent registered public accounting firm and auditor to Fidelity and certain Fidelity funds, has been engaged annually by the Board as part of the Board's assessment of Fidelity's profitability analysis. PwC's engagement includes the review and assessment of Fidelity's methodologies used in determining the revenues and expenses attributable to Fidelity's mutual fund business, and completion of agreed-upon procedures surrounding the mathematical accuracy of fund profitability and its conformity to allocation methodologies. After considering PwC's reports issued under the engagement and information provided by Fidelity, the Board believes that while other allocation methods may also be reasonable, Fidelity's profitability methodologies are reasonable in all material respects.
The Board has also reviewed Fidelity's non-fund businesses and fall-out benefits related to the mutual fund business as well as cases where Fidelity's affiliates may benefit from or be related to the fund's business.
The Board considered the costs of the services provided by and the profits realized by Fidelity in connection with the operation of the fund and were satisfied that the profitability was not excessive in the circumstances.
Economies of Scale. The Board considered whether there have been economies of scale in respect of the management of the Fidelity funds, whether the Fidelity funds (including the fund) have appropriately benefited from any such economies of scale, and whether there is potential for realization of any further economies of scale. The Board considered the extent to which the fund will benefit from economies of scale through increased services to the fund, through waivers or reimbursements, or through fee or expense reductions.
In February 2009, the Board and the board of other Fidelity funds created an ad hoc committee (the Economies of Scale Committee) to analyze whether FMR attains economies of scale in respect of the management and servicing of the Fidelity funds, whether the Fidelity funds have appropriately benefited from such economies of scale, and whether there is potential for realization of any further economies of scale.
The Board recognized that the fund's management contract incorporates a "group fee" structure, which provides for lower group fee rates as total fund assets under FMR's management increase, and for higher group fee rates as total fund assets under FMR's management decrease. FMR calculates the group fee rates based on a tiered asset "breakpoint" schedule that varies based on asset class. The Board considered that the group fee is designed to deliver the benefits of economies of scale to fund shareholders when total Fidelity fund assets increase, even if assets of any particular fund are unchanged or have declined, because some portion of Fidelity's costs are attributable to services provided to all Fidelity funds, and all funds benefit if those costs can be allocated among more assets. The Board concluded that, given the group fee structure, fund shareholders will benefit from lower management fees as assets under FMR's management increase at the fund complex level, regardless of whether Fidelity achieves any such economies of scale.
The Board concluded, considering the findings of the Economies of Scale Committee, that any potential economies of scale are being appropriately shared between fund shareholders and Fidelity.
Additional Information Requested by the Board. In order to develop fully the factual basis for consideration of the Fidelity funds' Advisory Contracts, the Board requested and received additional information on certain topics, including (i) fund performance trends, actions to be taken by FMR to improve certain funds' overall performance, and Fidelity's long-term strategies for certain funds; (ii) portfolio manager changes that have occurred during the past year and length of portfolio manager tenure for different categories of funds over time; (iii) Fidelity's compensation structure for portfolio managers, research analysts, and other key personnel, the rationale for the compensation structure, and how the compensation structure provides appropriate performance incentives; (iv) the amount of the investment that each portfolio manager has made in the Fidelity fund(s) that he or she manages; (v) management and other fees paid by FMR to affiliated sub-advisers on behalf of the Fidelity funds; (vi) Fidelity's fee structures and rationale for recommending different fees among different categories of funds; (vii) Fidelity's rationale for recommending which funds should have a performance adjustment component as part of their management fees; (viii) the rationale for any differences between fund fee structures and fee structures in place for other Fidelity clients; and (ix) explanations regarding the relative total expenses borne by certain funds and classes, total expense competitive trends, and actions that might be taken by FMR to reduce total expenses for certain funds and classes.
Annual Report
Based on its evaluation of all of the conclusions noted above, and after considering all factors it believed relevant, the Board ultimately concluded that the advisory fee structures are fair and reasonable, and that the fund's Advisory Contracts should be renewed.
Annual Report
Investment Adviser
Fidelity Management & Research Company
Boston, MA
Investment Sub-Advisers
FMR Co., Inc.
Fidelity Management & Research
(U.K.) Inc.
Fidelity Research & Analysis Company
FIL Investments (Japan) Limited
FIL Investment Advisors
FIL Investment Advisors
(U.K.) Ltd.
Fidelity Management & Research
(Hong Kong) Limited
Fidelity Management & Research
(Japan) Inc.
General Distributor
Fidelity Distributors Corporation
Boston, MA
Transfer and Service Agents
Fidelity Investments Institutional
Operations Company, Inc.
Boston, MA
Fidelity Service Company, Inc.
Boston, MA
Custodian
JPMorgan Chase Bank
New York, NY
AWLDI-UANN-1210
1.883436.101
Fidelity's
Targeted International Equity
Funds®
Fidelity® Canada Fund
Fidelity China Region Fund
Fidelity Emerging Asia Fund (formerly Fidelity Southeast Asia Fund)
Fidelity Emerging Markets Fund
Fidelity Europe Capital Appreciation Fund
Fidelity Europe Fund
Fidelity Japan Fund
Fidelity Japan Smaller Companies Fund
Fidelity Latin America Fund
Fidelity Nordic Fund
Fidelity Pacific Basin Fund
Annual Report
October 31, 2010
(2_fidelity_logos) (Registered_Trademark)
Contents
To view a fund's proxy voting guidelines and proxy voting record for the 12-month period ended June 30, visit http://www.fidelity.com/proxyvotingresults or visit the Securities and Exchange Commission's (SEC) web site at http://www.sec.gov. You may also call 1-800-544-8544 to request a free copy of the proxy voting guidelines.
Standard & Poor's, S&P and S&P 500 are registered service marks of The McGraw-Hill Companies, Inc. and have been licensed for use by Fidelity Distributors Corporation.
Other third party marks appearing herein are the property of their respective owners.
All other marks appearing herein are registered or unregistered trademarks or service marks of FMR LLC or an affiliated company.
Annual Report
This report and the financial statements contained herein are submitted for the general information of the shareholders of the funds. This report is not authorized for distribution to prospective investors in the funds unless preceded or accompanied by an effective prospectus.
A fund files its complete schedule of portfolio holdings with the SEC for the first and third quarters of each fiscal year on Form N-Q. Forms N-Q are available on the SEC's web site at http://www.sec.gov. A fund's Forms N-Q may be reviewed and copied at the SEC's Public Reference Room in Washington, DC. Information regarding the operation of the SEC's Public Reference Room may be obtained by calling 1-800-SEC-0330. For a complete list of a fund's portfolio holdings, view the most recent holdings listing, semiannual report, or annual report on Fidelity's web site at http://www.fidelity.com or http://www.advisor.fidelity.com, as applicable.
NOT FDIC INSURED • MAY LOSE VALUE • NO BANK GUARANTEE
Neither the funds nor Fidelity Distributors Corporation is a bank.
Annual Report
(photo_of_Edward_C_Johnson_3d)
Dear Shareholder:
Equities staged a rally during the third quarter of 2010, shaking off concerns about the European debt crisis and the possibility of a double-dip recession in the U.S. Although the short-term surge pushed major equity indexes back into positive territory for the year, several questions remained about the longer-term outlook, including lackluster economic growth and persistently high unemployment. Financial markets are always unpredictable, of course, but there also are several time-tested investment principles that can help put the odds in your favor.
One of the basic tenets is to invest for the long term. Over time, riding out the markets' inevitable ups and downs has proven much more effective than selling into panic or chasing the hottest trend. Even missing only a few of the markets' best days can significantly diminish investor returns. Patience also affords the benefits of compounding - of earning interest on additional income or reinvested dividends and capital gains. There can be tax advantages and cost benefits to consider as well. While staying the course doesn't eliminate risk, it can considerably lessen the effect of short-term declines.
You can further manage your investing risk through diversification. And today, more than ever, geographic diversification should be taken into account. Studies indicate that asset allocation is the single most important determinant of a portfolio's long-term success. The right mix of stocks, bonds and cash - aligned to your particular risk tolerance and investment objective - is very important. Age-appropriate rebalancing is also an essential aspect of asset allocation. For younger investors, an emphasis on equities - which historically have been the best-performing asset class over time - is encouraged. As investors near their specific goal, such as retirement or sending a child to college, consideration may be given to replacing volatile assets (e.g. common stocks) with more-stable fixed investments (bonds or saving plans).
A third principle - investing regularly - can help lower the average cost of your purchases. Investing a certain amount of money each month or quarter helps ensure you won't pay for all your shares at market highs. This strategy - known as dollar cost averaging - also reduces "emotion" from investing, helping shareholders avoid selling weak performers just prior to an upswing, or chasing a hot performer just before a correction.
We invite you to contact us via the Internet, through our Investor Centers or by phone. It is our privilege to provide you the information you need to make the investments that are right for you.
Sincerely,
(The chairman's signature appears here.)
Edward C. Johnson 3d
Annual Report
Note to shareholders
Fidelity® Emerging Asia Fund (formerly known as Fidelity Southeast Asia Fund)
In connection with shareholder approval on November 16, 2010, of an amended management contract, the fund's primary benchmark and performance fee adjustment index has changed to the MSCI® AC (All Country) Asia ex Japan Index from the MSCI AC (All Country) Far East ex Japan Index, and the fund has modified its investment strategy to include India. Additionally, the fund has changed its name to Fidelity Emerging Asia Fund to reflect its new investment strategy. The changes were effective on December 1, 2010.
Annual Report
Fidelity Canada Fund
Performance: The Bottom Line
Average annual total return reflects the change in the value of an investment, assuming reinvestment of the class' distributions from dividend income and capital gains (the profits earned upon the sale of securities that have grown in value, if any) and assuming a constant rate of performance each year. The $10,000 table and the fund's returns do not reflect the deduction of taxes that a shareholder would pay on fund distributions or the redemption of fund shares. During periods of reimbursement by Fidelity, a fund's total return will be greater than it would be had the reimbursement not occurred. How a fund did yesterday is no guarantee of how it will do tomorrow.
Average Annual Total Returns
Periods ended October 31, 2010 | Past 1
year | Past 5
years | Past 10
years |
Fidelity® Canada Fund | 22.97% | 8.98% | 11.10% |
$10,000 Over 10 Years
Let's say hypothetically that $10,000 was invested in Fidelity® Canada Fund, a class of the fund, on October 31, 2000. The chart shows how the value of your investment would have changed, and also shows how the S&P®/TSX Composite Index performed over the same period.
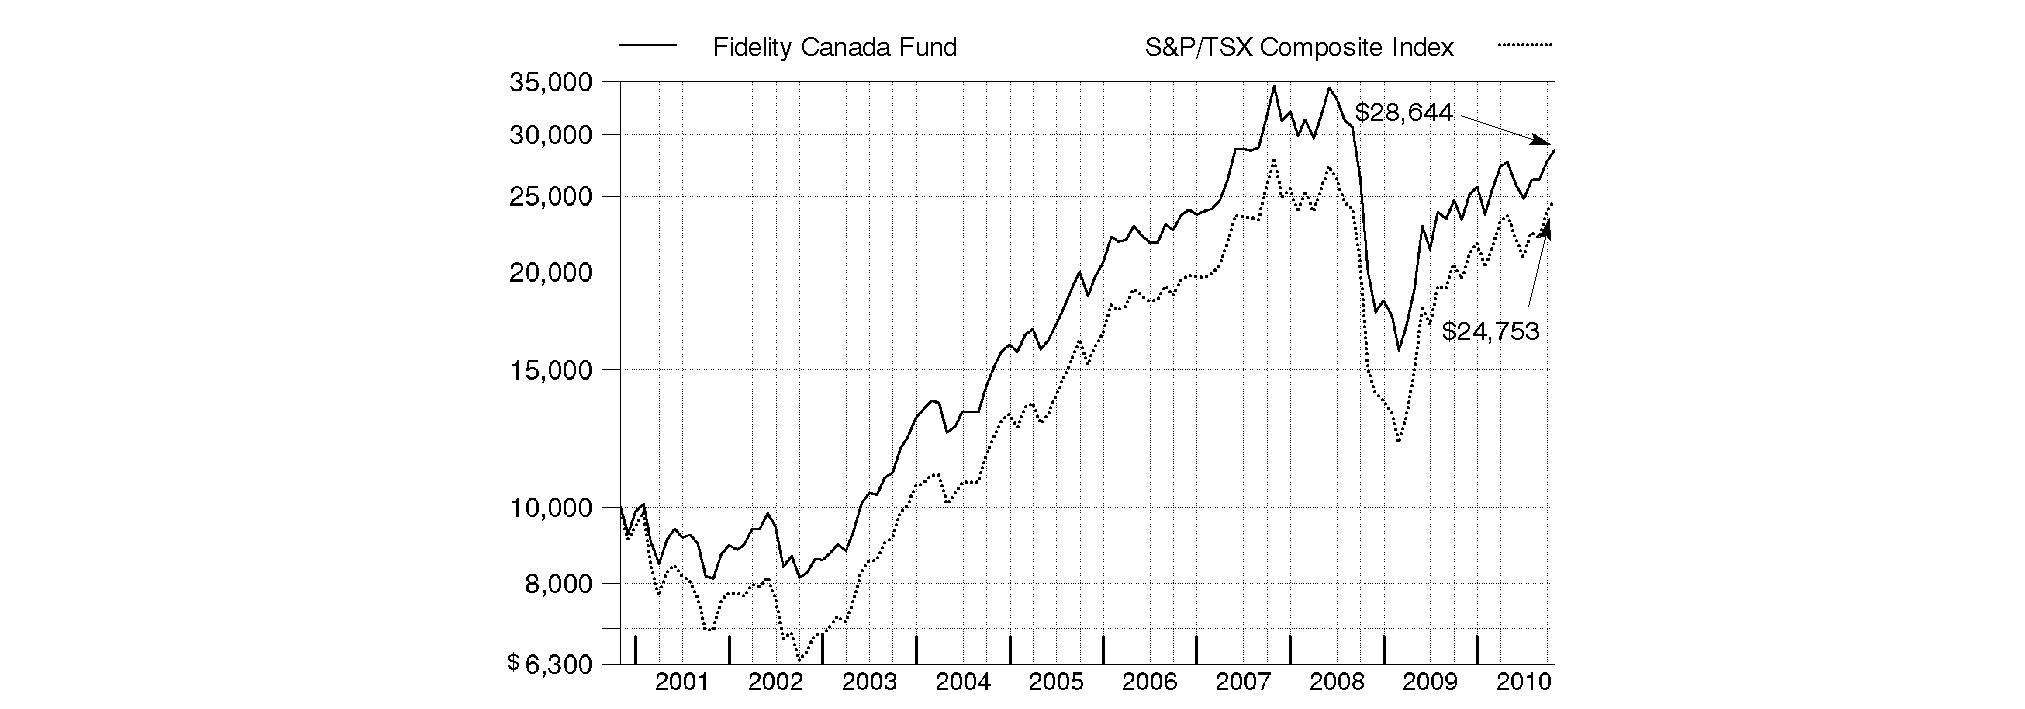
Annual Report
Fidelity Canada Fund
Market Recap: International stocks rode a wave of volatility similar to that of their U.S. counterparts during the 12 months ending October 31, 2010. Stocks gained modestly in the first half of the period, despite growing concerns about the European debt crisis. Sentiment turned decidedly negative in May and June, however, and the market suffered a precipitous decline. These losses were more than offset during the last four months of the period, when signs of economic growth and subsiding debt fears helped propel international stocks about 21%. For the full year, the MSCI® ACWI® (All Country World Index) ex USA Index gained 12.76%, boosted in part by a generally depreciating U.S. dollar. Within the index, Canada and emerging markets were standouts, returning 23% and 24%, respectively. Results in the latter group were led by strong-performing India, Mexico and South Africa, while China fell short of the MSCI benchmark due to cooling economic growth. The developed Asia ex Japan segment rose 16% for the period, lifted by solid results from Singapore and Hong Kong. Meanwhile, Europe rose just 9%, held back mainly by debt-riddled Spain and Italy, as well as lagging major constituent France. Japan returned only 5%, a result of that nation's continued weak economy.
Comments from Douglas Lober, Portfolio Manager of Fidelity® Canada Fund: For the 12 months ending October 31, 2010, the fund's Retail Class shares returned 22.97%, trailing the 26.45% gain of the S&P/TSX Composite Index. It was a solid period for Canadian equities, bolstered by a strengthening economy, surging global commodity prices and a strong Canadian dollar relative to the U.S. dollar. Versus the index, positioning in materials and technology hurt performance the most this period. Conversely, overweighting the top-performing health care sector, security selection in industrials and underweighting financials, especially insurance, supported results. The fund's biggest individual detractors were pairs of tech and materials stocks: enterprise software company Open Text, BlackBerry maker Research In Motion, base-metals producer Teck Resources and Barrick Gold. On the upside, underweighting Canadian life insurer Manulife Financial, which was sold from the fund, was the fund's largest contributor, followed by specialty pharmaceutical firm Biovail - which merged with Valeant Pharmaceuticals International - and crude oil and natural gas company Pacific Rubiales Energy.
Note to shareholders: Fidelity Canada Fund may invest up to 35% of its total assets in any industry that represents more than 20% of the Canadian market. As of October 31, 2010, the fund did not have more than 25% of its assets invested in any one industry.
The views expressed above reflect those of the portfolio manager(s) only through the end of the period as stated on the cover of this report and do not necessarily represent the views of Fidelity or any other person in the Fidelity organization. Any such views are subject to change at any time based upon market or other conditions and Fidelity disclaims any responsibility to update such views. These views may not be relied on as investment advice and, because investment decisions for a Fidelity fund are based on numerous factors, may not be relied on as an indication of trading intent on behalf of any Fidelity fund.
Annual Report
Fidelity Canada Fund
As a shareholder of the Fund, you incur two types of costs: (1) transaction costs, including sales charges (loads) on purchase payments or redemption proceeds, redemption fees, and (2) ongoing costs, including management fees, distribution and/or service (12b-1) fees and other Fund expenses. This Example is intended to help you understand your ongoing costs (in dollars) of investing in the Fund and to compare these costs with the ongoing costs of investing in other mutual funds.
The Example is based on an investment of $1,000 invested at the beginning of the period and held for the entire period (May 1, 2010 to October 31, 2010).
Actual Expenses
The first line of the accompanying table for each class of the Fund provides information about actual account values and actual expenses. You may use the information in this line, together with the amount you invested, to estimate the expenses that you paid over the period. Simply divide your account value by $1,000.00 (for example, an $8,600 account value divided by $1,000.00 = 8.6), then multiply the result by the number in the first line for a class of the Fund under the heading entitled "Expenses Paid During Period" to estimate the expenses you paid on your account during this period. A small balance maintenance fee of $12.00 that is charged once a year may apply for certain accounts with a value of less than $2,000. This fee is not included in the table below. If it was, the estimate of expenses you paid during the period would be higher, and your ending account value lower, by this amount. In addition, the Fund, as a shareholder in the underlying Fidelity Central Funds, will indirectly bear its pro-rata share of the fees and expenses incurred by the underlying Fidelity Central Funds. These fees and expenses are not included in the Fund's annualized expense ratio used to calculate the expense estimate in the table below.
Hypothetical Example for Comparison Purposes
The second line of the accompanying table for each class of the Fund provides information about hypothetical account values and hypothetical expenses based on a Class' actual expense ratio and an assumed rate of return of 5% per year before expenses, which is not the Class' actual return. The hypothetical account values and expenses may not be used to estimate the actual ending account balance or expenses you paid for the period. You may use this information to compare the ongoing costs of investing in the Fund and other funds. To do so, compare this 5% hypothetical example with the 5% hypothetical examples that appear in the shareholder reports of the other funds. A small balance maintenance fee of $12.00 that is charged once a year may apply for certain accounts with a value of less than $2,000. This fee is not included in the table below. If it was, the estimate of expenses you paid during the period would be higher, and your ending account value lower, by this amount. In addition, the Fund, as a shareholder in the underlying Fidelity Central Funds, will indirectly bear its pro-rata share of the fees and expenses incurred by the underlying Fidelity Central Funds. These fees and expenses are not included in the Fund's annualized expense ratio used to calculate the expense estimate in the table below.
Please note that the expenses shown in the table are meant to highlight your ongoing costs only and do not reflect any transaction costs. Therefore, the second line of the table is useful in comparing ongoing costs only, and will not help you determine the relative total costs of owning different funds. In addition, if these transactional costs were included, your costs would have been higher.
| Annualized
Expense Ratio | Beginning
Account Value
May 1, 2010 | Ending
Account Value
October 31, 2010 | Expenses Paid
During Period*
May 1, 2010 to
October 31, 2010 |
Class A | 1.24% | | | |
Actual | | $ 1,000.00 | $ 1,036.60 | $ 6.37 |
HypotheticalA | | $ 1,000.00 | $ 1,018.95 | $ 6.31 |
Class T | 1.50% | | | |
Actual | | $ 1,000.00 | $ 1,035.10 | $ 7.69 |
HypotheticalA | | $ 1,000.00 | $ 1,017.64 | $ 7.63 |
Class B | 2.00% | | | |
Actual | | $ 1,000.00 | $ 1,032.50 | $ 10.25 |
HypotheticalA | | $ 1,000.00 | $ 1,015.12 | $ 10.16 |
Class C | 1.98% | | | |
Actual | | $ 1,000.00 | $ 1,032.60 | $ 10.14 |
HypotheticalA | | $ 1,000.00 | $ 1,015.22 | $ 10.06 |
Canada | .92% | | | |
Actual | | $ 1,000.00 | $ 1,038.00 | $ 4.73 |
HypotheticalA | | $ 1,000.00 | $ 1,020.57 | $ 4.69 |
Institutional Class | .94% | | | |
Actual | | $ 1,000.00 | $ 1,038.00 | $ 4.83 |
HypotheticalA | | $ 1,000.00 | $ 1,020.47 | $ 4.79 |
A 5% return per year before expenses
* Expenses are equal to each Class' annualized expense ratio, multiplied by the average account value over the period, multiplied by 184/365 (to reflect the one-half year period).
Annual Report
Fidelity Canada Fund
Investment Changes (Unaudited)
Geographic Diversification (% of fund's net assets) |
As of October 31, 2010 |
| Canada | 98.4% | |
| United States of America | 1.6% | |

Percentages are adjusted for the effect of futures contracts, if applicable. |
As of April 30, 2010 |
| Canada | 98.2% | |
| United States of America | 1.8% | |

Percentages are adjusted for the effect of futures contracts, if applicable. |
Asset Allocation |
| % of fund's
net assets | % of fund's net assets
6 months ago |
Stocks | 99.1 | 99.3 |
Short-Term Investments and Net Other Assets | 0.9 | 0.7 |
Top Ten Stocks as of October 31, 2010 |
| % of fund's
net assets | % of fund's net assets
6 months ago |
Magna International, Inc. Class A (sub. vtg.) (Auto Components) | 5.1 | 1.3 |
Royal Bank of Canada (Commercial Banks) | 5.1 | 6.1 |
Toronto-Dominion Bank (Commercial Banks) | 4.5 | 5.3 |
Canadian National Railway Co. (Road & Rail) | 4.2 | 5.3 |
Bank of Nova Scotia (Commercial Banks) | 3.9 | 2.4 |
Valeant Pharmaceuticals International, Inc. (Pharmaceuticals) | 3.7 | 0.0 |
Barrick Gold Corp. (Metals & Mining) | 3.7 | 0.0 |
Talisman Energy, Inc. (Oil, Gas & Consumable Fuels) | 3.6 | 2.5 |
Goldcorp, Inc. (Metals & Mining) | 3.6 | 3.6 |
SXC Health Solutions Corp. (Health Care Technology) | 3.5 | 1.7 |
| 40.9 | |
Market Sectors as of October 31, 2010 |
| % of fund's
net assets | % of fund's net assets
6 months ago |
Materials | 24.0 | 18.1 |
Financials | 20.2 | 26.4 |
Energy | 15.6 | 20.9 |
Consumer Discretionary | 11.0 | 7.4 |
Industrials | 9.3 | 8.8 |
Health Care | 7.2 | 1.7 |
Information Technology | 5.8 | 9.6 |
Telecommunication Services | 4.5 | 3.7 |
Consumer Staples | 1.5 | 1.9 |
Utilities | 0.0 | 0.8 |
Annual Report
Fidelity Canada Fund
Investments October 31, 2010
Showing Percentage of Net Assets
Common Stocks - 99.1% |
| Shares | | Value |
CONSUMER DISCRETIONARY - 11.0% |
Auto Components - 5.1% |
Magna International, Inc. Class A (sub. vtg.) | 2,425,200 | | $ 219,335,670 |
Hotels, Restaurants & Leisure - 1.0% |
Tim Hortons, Inc. | 1,110,300 | | 41,738,310 |
Household Durables - 0.4% |
Dorel Industries, Inc. Class B (sub. vtg.) | 450,000 | | 15,169,134 |
Media - 1.3% |
Astral Media, Inc. Class A (non-vtg.) | 400,000 | | 16,040,788 |
Corus Entertainment, Inc. Class B (non-vtg.) | 600,000 | | 12,954,211 |
Groupe Aeroplan, Inc. | 100,000 | | 1,215,805 |
Quebecor, Inc. Class B (sub. vtg.) | 750,000 | | 27,054,123 |
| | 57,264,927 |
Multiline Retail - 1.0% |
Dollarama, Inc. | 1,678,775 | | 44,244,997 |
Textiles, Apparel & Luxury Goods - 2.2% |
Gildan Activewear, Inc. (a) | 3,269,100 | | 94,204,186 |
TOTAL CONSUMER DISCRETIONARY | | 471,957,224 |
CONSUMER STAPLES - 1.5% |
Food & Staples Retailing - 1.5% |
Alimentation Couche-Tard, Inc. Class B (sub. vtg.) | 1,290,200 | | 30,638,929 |
Metro, Inc. Class A (sub. vtg.) | 700,000 | | 32,120,796 |
| | 62,759,725 |
ENERGY - 15.6% |
Oil, Gas & Consumable Fuels - 15.6% |
Baytex Energy Trust | 850,000 | | 31,669,772 |
Cameco Corp. | 400,000 | | 12,373,762 |
Cenovus Energy, Inc. | 2,000,000 | | 55,652,515 |
Crescent Point Energy Corp. | 783,400 | | 31,031,827 |
Enbridge, Inc. | 2,508,900 | | 138,765,613 |
Gran Tierra Energy, Inc. (a) | 1,300,000 | | 9,687,224 |
Keyera Facilities Income Fund | 958,402 | | 29,741,566 |
Niko Resources Ltd. | 145,000 | | 13,833,219 |
Pacific Rubiales Energy Corp. (a) | 1,200,000 | | 38,250,809 |
Petrobank Energy & Resources Ltd. (a) | 350,000 | | 13,929,307 |
Suncor Energy, Inc. | 4,307,600 | | 138,025,657 |
Talisman Energy, Inc. | 8,500,000 | | 154,098,441 |
| | 667,059,712 |
FINANCIALS - 20.2% |
Commercial Banks - 17.4% |
Bank of Nova Scotia | 3,100,000 | | 166,170,213 |
Canadian Imperial Bank of Commerce | 1,344,600 | | 103,135,658 |
National Bank of Canada | 1,000,000 | | 65,820,178 |
Royal Bank of Canada | 4,040,000 | | 215,448,181 |
Toronto-Dominion Bank | 2,665,800 | | 191,982,557 |
| | 742,556,787 |
|
| Shares | | Value |
Insurance - 0.8% |
Intact Financial Corp. | 741,100 | | $ 33,563,495 |
Real Estate Investment Trusts - 0.0% |
RioCan (REIT) | 100,000 | | 2,260,025 |
Real Estate Management & Development - 2.0% |
Brookfield Asset Management, Inc. Class A | 1,750,000 | | 51,956,074 |
Brookfield Properties Corp. (d) | 1,900,000 | | 32,824,787 |
| | 84,780,861 |
TOTAL FINANCIALS | | 863,161,168 |
HEALTH CARE - 7.2% |
Health Care Technology - 3.5% |
SXC Health Solutions Corp. (a)(e) | 3,803,234 | | 148,489,830 |
Pharmaceuticals - 3.7% |
Valeant Pharmaceuticals International, Inc. | 5,688,351 | | 157,393,142 |
TOTAL HEALTH CARE | | 305,882,972 |
INDUSTRIALS - 9.3% |
Airlines - 0.8% |
Air Canada Class A (a)(d) | 9,475,000 | | 35,116,678 |
Commercial Services & Supplies - 2.1% |
IESI-BFC Ltd. | 3,750,000 | | 87,765,957 |
Construction & Engineering - 0.8% |
SNC-Lavalin Group, Inc. | 650,000 | | 33,204,236 |
Road & Rail - 4.5% |
Canadian National Railway Co. | 2,750,000 | | 178,120,404 |
Contrans Group, Inc. Class A | 878,500 | | 7,536,891 |
CSX Corp. | 100,000 | | 6,145,000 |
| | 191,802,295 |
Trading Companies & Distributors - 1.1% |
Finning International, Inc. | 2,050,000 | | 48,199,823 |
TOTAL INDUSTRIALS | | 396,088,989 |
INFORMATION TECHNOLOGY - 5.8% |
Communications Equipment - 2.0% |
Research In Motion Ltd. (a) | 1,530,000 | | 87,133,507 |
Internet Software & Services - 2.1% |
Open Text Corp. (a) | 1,993,740 | | 88,202,323 |
IT Services - 0.9% |
CGI Group, Inc. Class A (sub. vtg.) (a) | 2,590,000 | | 39,844,200 |
Software - 0.8% |
MacDonald Dettwiler & Associates Ltd. (a) | 650,000 | | 32,382,096 |
TOTAL INFORMATION TECHNOLOGY | | 247,562,126 |
Common Stocks - continued |
| Shares | | Value |
MATERIALS - 24.0% |
Chemicals - 5.2% |
Agrium, Inc. | 950,000 | | $ 84,036,670 |
Potash Corp. of Saskatchewan, Inc. | 950,000 | | 137,390,921 |
| | 221,427,591 |
Metals & Mining - 18.5% |
Barrick Gold Corp. | 3,250,000 | | 156,525,149 |
Consolidated Thompson Iron Mines Ltd. (a) | 2,250,000 | | 21,796,255 |
Detour Gold Corp. (a) | 1,280,000 | | 37,387,195 |
Eldorado Gold Corp. | 5,470,000 | | 92,623,689 |
European Goldfields Ltd. (a) | 600,000 | | 8,106,677 |
Goldcorp, Inc. | 3,400,000 | | 151,814,884 |
Grande Cache Coal Corp. (a) | 2,500,000 | | 17,158,545 |
IAMGOLD Corp. | 2,000,000 | | 36,493,774 |
Ivanhoe Mines Ltd. (a) | 800,000 | | 19,154,819 |
Kinross Gold Corp. | 300,000 | | 5,397,588 |
Osisko Mining Corp. (a) | 1,665,700 | | 23,093,439 |
Pan American Silver Corp. | 800,000 | | 25,536,002 |
Silver Wheaton Corp. (a) | 1,875,900 | | 53,928,216 |
Teck Resources Ltd. Class B (sub. vtg.) | 2,400,000 | | 107,304,638 |
Walter Energy, Inc. | 200,000 | | 17,592,000 |
Yamana Gold, Inc. | 1,500,000 | | 16,501,618 |
| | 790,414,488 |
Paper & Forest Products - 0.3% |
Sino-Forest Corp. (a) | 600,000 | | 11,859,986 |
TOTAL MATERIALS | | 1,023,702,065 |
TELECOMMUNICATION SERVICES - 4.5% |
Diversified Telecommunication Services - 2.8% |
BCE, Inc. (d) | 2,300,000 | | 77,147,760 |
TELUS Corp. (d) | 1,000,000 | | 44,318,070 |
| | 121,465,830 |
|
| Shares | | Value |
Wireless Telecommunication Services - 1.7% |
Rogers Communications, Inc. Class B (non-vtg.) | 2,000,000 | | $ 72,869,889 |
TOTAL TELECOMMUNICATION SERVICES | | 194,335,719 |
TOTAL COMMON STOCKS (Cost $3,395,319,218) | 4,232,509,700 |
Money Market Funds - 1.1% |
| | | |
Fidelity Cash Central Fund, 0.23% (b) | 16,109,355 | | 16,109,355 |
Fidelity Securities Lending Cash Central Fund, 0.24% (b)(c) | 31,292,644 | | 31,292,644 |
TOTAL MONEY MARKET FUNDS (Cost $47,401,999) | 47,401,999 |
TOTAL INVESTMENT PORTFOLIO - 100.2% (Cost $3,442,721,217) | | 4,279,911,699 |
NET OTHER ASSETS (LIABILITIES) - (0.2)% | | (9,998,244) |
NET ASSETS - 100% | $ 4,269,913,455 |
Legend |
(a) Non-income producing |
(b) Affiliated fund that is available only to investment companies and other accounts managed by Fidelity Investments. The rate quoted is the annualized seven-day yield of the fund at period end. A complete unaudited listing of the fund's holdings as of its most recent quarter end is available upon request. In addition, each Fidelity Central Fund's financial statements, which are not covered by the Fund's report of Independent Registered Public Accounting Firm, are available on the SEC's website or upon request. |
(c) Investment made with cash collateral received from securities on loan. |
(d) Security or a portion of the security is on loan at period end. |
(e) Affiliated company |
Affiliated Central Funds |
Information regarding fiscal year to date income earned by the Fund from investments in Fidelity Central Funds is as follows: |
Fund | Income earned |
Fidelity Cash Central Fund | $ 71,952 |
Fidelity Securities Lending Cash Central Fund | 3,863,210 |
Total | $ 3,935,162 |
Other Affiliated Issuers |
An affiliated company is a company in which the Fund has ownership of at least 5% of the voting securities. Fiscal year to date transactions with companies which are or were affiliates are as follows: |
Affiliate | Value,
beginning of period | Purchases | Sales
Proceeds | Dividend
Income | Value,
end of
period |
Air Canada Class A | $ - | $ 16,193,836 | $ - | $ - | $ - |
Grande Cache Coal Corp. | - | 40,052,532 | 26,878,041 | - | - |
SXC Health Solutions Corp. | 16,519,740 | 103,932,396 | - | - | 148,489,830 |
Total | $ 16,519,740 | $ 160,178,764 | $ 26,878,041 | $ - | $ 148,489,830 |
Other Information |
All investments are categorized as Level 1 under the Fair Value Hierarchy. The inputs or methodology used for valuing securities may not be an indication of the risk associated with investing in those securities. For more information on valuation inputs, please refer to the Security Valuation section in the accompanying Notes to Financial Statements. |
Income Tax Information |
At October 31, 2010, the Fund had a capital loss carryforward of approximately $243,313,729 of which $92,395,948 and $150,917,781 will expire on October 31, 2016 and 2017, respectively. Capital loss carryforwards are only available to offset future capital gains of the Fund to the extent provided by regulations and may be limited. |
See accompanying notes which are an integral part of the financial statements.
Annual Report
Fidelity Canada Fund
Statement of Assets and Liabilities
| October 31, 2010 |
| | |
Assets | | |
Investment in securities, at value (including securities loaned of $29,757,421) - See accompanying schedule: Unaffiliated issuers (cost $3,276,154,840) | $ 4,084,019,870 | |
Fidelity Central Funds (cost $47,401,999) | 47,401,999 | |
Other affiliated issuers (cost $119,164,378) | 148,489,830 | |
Total Investments (cost $3,442,721,217) | | $ 4,279,911,699 |
Foreign currency held at value (cost $1,389,752) | | 1,389,866 |
Receivable for investments sold | | 57,939,322 |
Receivable for fund shares sold | | 4,954,632 |
Dividends receivable | | 4,499,672 |
Distributions receivable from Fidelity Central Funds | | 9,305 |
Other receivables | | 318,991 |
Total assets | | 4,349,023,487 |
| | |
Liabilities | | |
Payable for investments purchased | $ 40,343,297 | |
Payable for fund shares redeemed | 4,151,509 | |
Accrued management fee | 2,176,024 | |
Distribution and service plan fees payable | 102,860 | |
Other affiliated payables | 915,239 | |
Other payables and accrued expenses | 128,459 | |
Collateral on securities loaned, at value | 31,292,644 | |
Total liabilities | | 79,110,032 |
| | |
Net Assets | | $ 4,269,913,455 |
Net Assets consist of: | | |
Paid in capital | | $ 3,663,079,350 |
Undistributed net investment income | | 26,745,120 |
Accumulated undistributed net realized gain (loss) on investments and foreign currency transactions | | (257,197,673) |
Net unrealized appreciation (depreciation) on investments and assets and liabilities in foreign currencies | | 837,286,658 |
Net Assets | | $ 4,269,913,455 |
Statement of Assets and Liabilities - continued
| October 31, 2010 |
| | |
Calculation of Maximum Offering Price Class A:
Net Asset Value and redemption price per share ($170,445,854 ÷ 3,167,830 shares) | | $ 53.81 |
| | |
Maximum offering price per share (100/94.25 of $53.81) | | $ 57.09 |
Class T:
Net Asset Value and redemption price per share ($31,521,786 ÷ 587,692 shares) | | $ 53.64 |
| | |
Maximum offering price per share (100/96.50 of $53.64) | | $ 55.59 |
Class B:
Net Asset Value and offering price per share ($13,463,848 ÷ 253,888 shares) A | | $ 53.03 |
| | |
Class C:
Net Asset Value and offering price per share ($54,052,232 ÷ 1,022,372 shares) A | | $ 52.87 |
| | |
Canada:
Net Asset Value, offering price and redemption price per share ($3,953,692,786 ÷ 73,023,771 shares) | | $ 54.14 |
| | |
Institutional Class:
Net Asset Value, offering price and redemption price per share ($46,736,949 ÷ 865,188 shares) | | $ 54.02 |
A Redemption price per share is equal to net asset value less any applicable contingent deferred sales charge.
See accompanying notes which are an integral part of the financial statements.
Annual Report
Statement of Operations
| Year ended October 31, 2010 |
| | |
Investment Income | | |
Dividends | | $ 77,463,667 |
Interest | | 460 |
Income from Fidelity Central Funds (including $3,863,210 from security lending) | | 3,935,162 |
Income before foreign taxes withheld | | 81,399,289 |
Less foreign taxes withheld | | (11,557,812) |
Total income | | 69,841,477 |
| | |
Expenses | | |
Management fee
Basic fee | $ 27,220,833 | |
Performance adjustment | (2,434,973) | |
Transfer agent fees | 9,229,104 | |
Distribution and service plan fees | 943,339 | |
Accounting and security lending fees | 1,532,504 | |
Custodian fees and expenses | 339,998 | |
Independent trustees' compensation | 21,432 | |
Registration fees | 169,539 | |
Audit | 70,900 | |
Legal | 18,293 | |
Interest | 1,574 | |
Miscellaneous | 50,594 | |
Total expenses before reductions | 37,163,137 | |
Expense reductions | (1,984,527) | 35,178,610 |
Net investment income (loss) | | 34,662,867 |
Realized and Unrealized Gain (Loss) Net realized gain (loss) on: | | |
Investment securities: | | |
Unaffiliated issuers | 86,472,773 | |
Other affiliated issuers | (2,411,623) | |
Investment not meeting investment restrictions | (275,664) | |
Foreign currency transactions | (295,766) | |
Payment from investment advisor for loss on investment not meeting investment restrictions | 275,664 | |
Capital gain distributions from Fidelity Central Funds | 1,133 | |
Total net realized gain (loss) | | 83,766,517 |
Change in net unrealized appreciation (depreciation) on: Investment securities | 640,635,315 | |
Assets and liabilities in foreign currencies | 411,031 | |
Total change in net unrealized appreciation (depreciation) | | 641,046,346 |
Net gain (loss) | | 724,812,863 |
Net increase (decrease) in net assets resulting from operations | | $ 759,475,730 |
Statement of Changes in Net Assets
| Year ended
October 31,
2010 | Year ended
October 31,
2009 |
Increase (Decrease) in Net Assets | | |
Operations | | |
Net investment income (loss) | $ 34,662,867 | $ 34,444,185 |
Net realized gain (loss) | 83,766,517 | (171,178,890) |
Change in net unrealized appreciation (depreciation) | 641,046,346 | 537,944,481 |
Net increase (decrease) in net assets resulting from operations | 759,475,730 | 401,209,776 |
Distributions to shareholders from net investment income | (34,208,293) | (10,179,804) |
Share transactions - net increase (decrease) | 243,266,632 | 30,108,212 |
Redemption fees | 759,127 | 779,120 |
Total increase (decrease) in net assets | 969,293,196 | 421,917,304 |
| | |
Net Assets | | |
Beginning of period | 3,300,620,259 | 2,878,702,955 |
End of period (including undistributed net investment income of $26,745,120 and undistributed net investment income of $26,298,051, respectively) | $ 4,269,913,455 | $ 3,300,620,259 |
See accompanying notes which are an integral part of the financial statements.
Annual Report
Financial Highlights - Class A
Years ended October 31, | 2010 | 2009 | 2008 | 2007 H |
Selected Per-Share Data | | | | |
Net asset value, beginning of period | $ 44.24 | $ 38.20 | $ 70.16 | $ 54.00 |
Income from Investment Operations | | | | |
Net investment income (loss) E | .31 | .38 | .39 | .19 |
Net realized and unrealized gain (loss) | 9.64 | 5.72 | (28.71) | 15.96 |
Total from investment operations | 9.95 | 6.10 | (28.32) | 16.15 |
Distributions from net investment income | (.39) | (.07) | (.41) | - |
Distributions from net realized gain | - | - | (3.27) | - |
Total distributions | (.39) | (.07) | (3.68) | - |
Redemption fees added to paid in capital E | .01 | .01 | .04 | .01 |
Net asset value, end of period | $ 53.81 | $ 44.24 | $ 38.20 | $ 70.16 |
Total Return B, C, D | 22.62% | 16.08% | (42.23)% | 29.93% |
Ratios to Average Net Assets F, I | | | | |
Expenses before reductions | 1.24% | 1.42% | 1.34% | 1.23% A |
Expenses net of fee waivers, if any | 1.24% | 1.42% | 1.34% | 1.23% A |
Expenses net of all reductions | 1.18% | 1.39% | 1.31% | 1.22% A |
Net investment income (loss) | .63% | .98% | .69% | .63% A |
Supplemental Data | | | | |
Net assets, end of period (000 omitted) | $ 170,446 | $ 83,015 | $ 56,242 | $ 20,912 |
Portfolio turnover rate G | 143% | 123% | 63% | 42% |
A Annualized
B Total returns for periods of less than one year are not annualized.
C Total returns would have been lower had certain expenses not been reduced during the periods shown.
D Total returns do not include the effect of the sales charges.
E Calculated based on average shares outstanding during the period.
F Fees and expenses of the underlying Fidelity Central Funds are not included in the Fund's expense ratio. The Fund indirectly bears its proportionate share of the expenses of any underlying Fidelity Central Funds.
G Amount does not include the portfolio activity of any underlying Fidelity Central Funds.
H For the period May 2, 2007 (commencement of sale of shares) to October 31, 2007.
I Expense ratios reflect operating expenses of the class. Expenses before reductions do not reflect amounts reimbursed by the investment adviser or reductions from brokerage service arrangements or reductions from other expense offset arrangements and do not represent the amount paid by the class during periods when reimbursements or reductions occur. Expense ratios before reductions for start-up periods may not be representative of longer-term operating periods. Expenses net of fee waivers reflect expenses after reimbursement by the investment adviser but prior to reductions from brokerage service arrangements or other expense offset arrangements. Expenses net of all reductions represent the net expenses paid by the class.
Financial Highlights - Class T
Years ended October 31, | 2010 | 2009 | 2008 | 2007 H |
Selected Per-Share Data | | | | |
Net asset value, beginning of period | $ 44.11 | $ 38.10 | $ 70.09 | $ 54.00 |
Income from Investment Operations | | | | |
Net investment income (loss) E | .18 | .27 | .23 | .09 |
Net realized and unrealized gain (loss) | 9.60 | 5.73 | (28.66) | 15.99 |
Total from investment operations | 9.78 | 6.00 | (28.43) | 16.08 |
Distributions from net investment income | (.26) | - | (.33) | - |
Distributions from net realized gain | - | - | (3.27) | - |
Total distributions | (.26) | - | (3.60) | - |
Redemption fees added to paid in capital E | .01 | .01 | .04 | .01 |
Net asset value, end of period | $ 53.64 | $ 44.11 | $ 38.10 | $ 70.09 |
Total Return B, C, D | 22.27% | 15.77% | (42.40)% | 29.80% |
Ratios to Average Net Assets F, I | | | | |
Expenses before reductions | 1.51% | 1.70% | 1.63% | 1.48% A |
Expenses net of fee waivers, if any | 1.51% | 1.70% | 1.63% | 1.48% A |
Expenses net of all reductions | 1.46% | 1.67% | 1.60% | 1.47% A |
Net investment income (loss) | .36% | .71% | .40% | .30% A |
Supplemental Data | | | | |
Net assets, end of period (000 omitted) | $ 31,522 | $ 17,727 | $ 14,963 | $ 14,522 |
Portfolio turnover rate G | 143% | 123% | 63% | 42% |
A Annualized
B Total returns for periods of less than one year are not annualized.
C Total returns would have been lower had certain expenses not been reduced during the periods shown.
D Total returns do not include the effect of the sales charges.
E Calculated based on average shares outstanding during the period.
F Fees and expenses of the underlying Fidelity Central Funds are not included in the Fund's expense ratio. The Fund indirectly bears its proportionate share of the expenses of any underlying Fidelity Central Funds.
G Amount does not include the portfolio activity of any underlying Fidelity Central Funds.
H For the period May 2, 2007 (commencement of sale of shares) to October 31, 2007.
I Expense ratios reflect operating expenses of the class. Expenses before reductions do not reflect amounts reimbursed by the investment adviser or reductions from brokerage service arrangements or reductions from other expense offset arrangements and do not represent the amount paid by the class during periods when reimbursements or reductions occur. Expense ratios before reductions for start-up periods may not be representative of longer-term operating periods. Expenses net of fee waivers reflect expenses after reimbursement by the investment adviser but prior to reductions from brokerage service arrangements or other expense offset arrangements. Expenses net of all reductions represent the net expenses paid by the class.
See accompanying notes which are an integral part of the financial statements.
Annual Report
Financial Highlights - Class B
Years ended October 31, | 2010 | 2009 | 2008 | 2007 H |
Selected Per-Share Data | | | | |
Net asset value, beginning of period | $ 43.68 | $ 37.91 | $ 69.88 | $ 54.00 |
Income from Investment Operations | | | | |
Net investment income (loss) E | (.07) | .08 | (.06) | (.06) |
Net realized and unrealized gain (loss) | 9.50 | 5.68 | (28.54) | 15.93 |
Total from investment operations | 9.43 | 5.76 | (28.60) | 15.87 |
Distributions from net investment income | (.09) | - | (.14) | - |
Distributions from net realized gain | - | - | (3.27) | - |
Total distributions | (.09) | - | (3.41) | - |
Redemption fees added to paid in capital E | .01 | .01 | .04 | .01 |
Net asset value, end of period | $ 53.03 | $ 43.68 | $ 37.91 | $ 69.88 |
Total Return B, C, D | 21.64% | 15.22% | (42.68)% | 29.41% |
Ratios to Average Net Assets F, I | | | | |
Expenses before reductions | 2.01% | 2.19% | 2.13% | 2.00% A |
Expenses net of fee waivers, if any | 2.01% | 2.19% | 2.13% | 2.00% A |
Expenses net of all reductions | 1.96% | 2.16% | 2.10% | 1.99% A |
Net investment income (loss) | (.14)% | .21% | (.10)% | (.21)% A |
Supplemental Data | | | | |
Net assets, end of period (000 omitted) | $ 13,464 | $ 7,283 | $ 5,615 | $ 4,078 |
Portfolio turnover rate G | 143% | 123% | 63% | 42% |
A Annualized
B Total returns for periods of less than one year are not annualized.
C Total returns would have been lower had certain expenses not been reduced during the periods shown.
D Total returns do not include the effect of the contingent deferred sales charge.
E Calculated based on average shares outstanding during the period.
F Fees and expenses of the underlying Fidelity Central Funds are not included in the Fund's expense ratio. The Fund indirectly bears its proportionate share of the expenses of any underlying Fidelity Central Funds.
G Amount does not include the portfolio activity of any underlying Fidelity Central Funds.
H For the period May 2, 2007 (commencement of sale of shares) to October 31, 2007.
I Expense ratios reflect operating expenses of the class. Expenses before reductions do not reflect amounts reimbursed by the investment adviser or reductions from brokerage service arrangements or reductions from other expense offset arrangements and do not represent the amount paid by the class during periods when reimbursements or reductions occur. Expense ratios before reductions for start-up periods may not be representative of longer-term operating periods. Expenses net of fee waivers reflect expenses after reimbursement by the investment adviser but prior to reductions from brokerage service arrangements or other expense offset arrangements. Expenses net of all reductions represent the net expenses paid by the class.
Financial Highlights - Class C
Years ended October 31, | 2010 | 2009 | 2008 | 2007 H |
Selected Per-Share Data | | | | |
Net asset value, beginning of period | $ 43.60 | $ 37.84 | $ 69.91 | $ 54.00 |
Income from Investment Operations | | | | |
Net investment income (loss) E | (.06) | .09 | (.05) | (.04) |
Net realized and unrealized gain (loss) | 9.48 | 5.66 | (28.52) | 15.94 |
Total from investment operations | 9.42 | 5.75 | (28.57) | 15.90 |
Distributions from net investment income | (.16) | - | (.27) | - |
Distributions from net realized gain | - | - | (3.27) | - |
Total distributions | (.16) | - | (3.54) | - |
Redemption fees added to paid in capital E | .01 | .01 | .04 | .01 |
Net asset value, end of period | $ 52.87 | $ 43.60 | $ 37.84 | $ 69.91 |
Total Return B, C, D | 21.68% | 15.22% | (42.69)% | 29.46% |
Ratios to Average Net Assets F, I | | | | |
Expenses before reductions | 1.99% | 2.18% | 2.13% | 1.99% A |
Expenses net of fee waivers, if any | 1.99% | 2.18% | 2.13% | 1.99% A |
Expenses net of all reductions | 1.94% | 2.15% | 2.10% | 1.97% A |
Net investment income (loss) | (.12)% | .22% | (.10)% | (.15)% A |
Supplemental Data | | | | |
Net assets, end of period (000 omitted) | $ 54,052 | $ 24,848 | $ 16,716 | $ 8,752 |
Portfolio turnover rate G | 143% | 123% | 63% | 42% |
A Annualized
B Total returns for periods of less than one year are not annualized.
C Total returns would have been lower had certain expenses not been reduced during the periods shown.
D Total returns do not include the effect of the contingent deferred sales charge.
E Calculated based on average shares outstanding during the period.
F Fees and expenses of the underlying Fidelity Central Funds are not included in the Fund's expense ratio. The Fund indirectly bears its proportionate share of the expenses of any underlying Fidelity Central Funds.
G Amount does not include the portfolio activity of any underlying Fidelity Central Funds.
H For the period May 2, 2007 (commencement of sale of shares) to October 31, 2007.
I Expense ratios reflect operating expenses of the class. Expenses before reductions do not reflect amounts reimbursed by the investment adviser or reductions from brokerage service arrangements or reductions from other expense offset arrangements and do not represent the amount paid by the class during periods when reimbursements or reductions occur. Expense ratios before reductions for start-up periods may not be representative of longer-term operating periods. Expenses net of fee waivers reflect expenses after reimbursement by the investment adviser but prior to reductions from brokerage service arrangements or other expense offset arrangements. Expenses net of all reductions represent the net expenses paid by the class.
See accompanying notes which are an integral part of the financial statements.
Annual Report
Financial Highlights - Canada
Years ended October 31, | 2010 | 2009 | 2008 | 2007 | 2006 |
Selected Per-Share Data | | | | | |
Net asset value, beginning of period | $ 44.46 | $ 38.37 | $ 70.25 | $ 49.48 | $ 39.14 |
Income from Investment Operations | | | | | |
Net investment income (loss) B | .46 | .48 | .58 | .52 | .34 |
Net realized and unrealized gain (loss) | 9.68 | 5.74 | (28.83) | 21.62 | 10.15 |
Total from investment operations | 10.14 | 6.22 | (28.25) | 22.14 | 10.49 |
Distributions from net investment income | (.47) | (.14) | (.40) | (.36) | (.16) |
Distributions from net realized gain | - | - | (3.27) | (1.03) | (.01) |
Total distributions | (.47) | (.14) | (3.67) | (1.39) | (.17) |
Redemption fees added to paid in capital B | .01 | .01 | .04 | .02 | .02 |
Net asset value, end of period | $ 54.14 | $ 44.46 | $ 38.37 | $ 70.25 | $ 49.48 |
Total Return A | 22.97% | 16.40% | (42.06)% | 46.03% | 26.93% |
Ratios to Average Net Assets C, E | | | | | |
Expenses before reductions | .94% | 1.17% | 1.03% | .96% | 1.00% |
Expenses net of fee waivers, if any | .94% | 1.17% | 1.03% | .96% | 1.00% |
Expenses net of all reductions | .89% | 1.13% | 1.00% | .94% | .97% |
Net investment income (loss) | .93% | 1.24% | 1.00% | .94% | .74% |
Supplemental Data | | | | | |
Net assets, end of period (000 omitted) | $ 3,953,693 | $ 3,149,791 | $ 2,776,298 | $ 4,890,617 | $ 3,136,927 |
Portfolio turnover rate D | 143% | 123% | 63% | 42% | 50% |
A Total returns would have been lower had certain expenses not been reduced during the periods shown.
B Calculated based on average shares outstanding during the period.
C Fees and expenses of the underlying Fidelity Central Funds are not included in the Fund's expense ratio. The Fund indirectly bears its proportionate share of the expenses of any underlying Fidelity Central Funds.
D Amount does not include the portfolio activity of any underlying Fidelity Central Funds.
E Expense ratios reflect operating expenses of the class. Expenses before reductions do not reflect amounts reimbursed by the investment adviser or reductions from brokerage service arrangements or reductions from other expense offset arrangements and do not represent the amount paid by the class during periods when reimbursements or reductions occur. Expenses net of fee waivers reflect expenses after reimbursement by the investment adviser but prior to reductions from brokerage service arrangements or other expense offset arrangements. Expenses net of all reductions represent the net expenses paid by the class.
Financial Highlights - Institutional Class
Years ended October 31, | 2010 | 2009 | 2008 | 2007 G |
Selected Per-Share Data | | | | |
Net asset value, beginning of period | $ 44.39 | $ 38.31 | $ 70.25 | $ 54.00 |
Income from Investment Operations | | | | |
Net investment income (loss) D | .46 | .49 | .52 | .25 |
Net realized and unrealized gain (loss) | 9.65 | 5.72 | (28.78) | 15.99 |
Total from investment operations | 10.11 | 6.21 | (28.26) | 16.24 |
Distributions from net investment income | (.49) | (.14) | (.45) | - |
Distributions from net realized gain | - | - | (3.27) | - |
Total distributions | (.49) | (.14) | (3.72) | - |
Redemption fees added to paid in capital D | .01 | .01 | .04 | .01 |
Net asset value, end of period | $ 54.02 | $ 44.39 | $ 38.31 | $ 70.25 |
Total Return B, C | 22.94% | 16.40% | (42.11)% | 30.09% |
Ratios to Average Net Assets E, H | | | | |
Expenses before reductions | .95% | 1.17% | 1.11% | 1.01% A |
Expenses net of fee waivers, if any | .95% | 1.17% | 1.11% | 1.01% A |
Expenses net of all reductions | .90% | 1.14% | 1.08% | .99% A |
Net investment income (loss) | .92% | 1.23% | .92% | .83% A |
Supplemental Data | | | | |
Net assets, end of period (000 omitted) | $ 46,737 | $ 17,956 | $ 8,870 | $ 4,064 |
Portfolio turnover rate F | 143% | 123% | 63% | 42% |
A Annualized
B Total returns for periods of less than one year are not annualized.
C Total returns would have been lower had certain expenses not been reduced during the periods shown.
D Calculated based on average shares outstanding during the period.
E Fees and expenses of the underlying Fidelity Central Funds are not included in the Fund's expense ratio. The Fund indirectly bears its proportionate share of the expenses of any underlying Fidelity Central Funds.
F Amount does not include the portfolio activity of any underlying Fidelity Central Funds.
G For the period May 2, 2007 (commencement of sale of shares) to October 31, 2007.
H Expense ratios reflect operating expenses of the class. Expenses before reductions do not reflect amounts reimbursed by the investment adviser or reductions from brokerage service arrangements or reductions from other expense offset arrangements and do not represent the amount paid by the class during periods when reimbursements or reductions occur. Expense ratios before reductions for start-up periods may not be representative of longer-term operating periods. Expenses net of fee waivers reflect expenses after reimbursement by the investment adviser but prior to reductions from brokerage service arrangements or other expense offset arrangements. Expenses net of all reductions represent the net expenses paid by the class.
See accompanying notes which are an integral part of the financial statements.
Annual Report
Notes to Financial Statements
For the period ended October 31, 2010
1. Organization.
Fidelity Canada Fund (the Fund) is a fund of Fidelity Investment Trust (the Trust) and is authorized to issue an unlimited number of shares. The Trust is registered under the Investment Company Act of 1940, as amended (the 1940 Act), as an open-end management investment company organized as a Massachusetts business trust. The Fund offers Class A, Class T, Class C, Canada and Institutional Class shares, each of which has equal rights as to assets and voting privileges. Effective after the close of business on September 1, 2010, Class B shares were closed to new accounts and additional purchases by existing shareholders. Each class has exclusive voting rights with respect to matters that affect that class. Class B shares will automatically convert to Class A shares after a holding period of seven years from the initial date of purchase. Investment income, realized and unrealized capital gains and losses, the common expenses of the Fund, and certain fund-level expense reductions, if any, are allocated on a pro-rata basis to each class based on the relative net assets of each class to the total net assets of the Fund. Each class differs with respect to transfer agent and distribution and service plan fees incurred. Certain expense reductions also differ by class.
2. Investments in Fidelity Central Funds.
The Fund may invest in Fidelity Central Funds, which are open-end investment companies available only to other investment companies and accounts managed by Fidelity Management & Research Company (FMR) and its affiliates. The Fund's Schedule of Investments lists each of the Fidelity Central Funds held as of period end, if any, as an investment of the Fund, but does not include the underlying holdings of each Fidelity Central Fund. As an Investing Fund, the Fund indirectly bears its proportionate share of the expenses of the underlying Fidelity Central Funds.
The Money Market Central Funds seek preservation of capital and current income and are managed by Fidelity Investments Money Management, Inc. (FIMM), an affiliate of FMR.
A complete unaudited list of holdings for each Fidelity Central Fund is available upon request or at the Securities and Exchange Commission (the SEC) web site at www.sec.gov. In addition, the financial statements of the Fidelity Central Funds, which are not covered by the Fund's Report of Independent Registered Public Accounting Firm, are available on the SEC web site or upon request.
3. Significant Accounting Policies.
The financial statements have been prepared in conformity with accounting principles generally accepted in the United States of America (GAAP), which require management to make certain estimates and assumptions at the date of the financial statements. Actual results could differ from those estimates. The following summarizes the significant accounting policies of the Fund:
Security Valuation. Investments are valued as of 4:00 p.m. Eastern time on the last calendar day of the period. The Fund uses independent pricing services approved by the Board of Trustees to value its investments. When current market prices or quotations are not readily available or reliable, valuations may be determined in good faith in accordance with procedures adopted by the Board of Trustees. Factors used in determining value may include market or security specific events. The frequency with which these procedures are used cannot be predicted and they may be utilized to a significant extent. The value used for net asset value (NAV) calculation under these procedures may differ from published prices for the same securities.
The Fund categorizes the inputs to valuation techniques used to value its investments into a disclosure hierarchy consisting of three levels as shown below.
Level 1 - quoted prices in active markets for identical investments
Level 2 - other significant observable inputs (including quoted prices for similar investments, interest rates, prepayment speeds, etc.)
Level 3 - unobservable inputs (including the fund's own assumptions based on the best information available)
Changes in valuation techniques may result in transfers in or out of an assigned level within the disclosure hierarchy. The aggregate value of investments by input level, as of October 31, 2010 is included at the end of the Fund's Schedule of Investments. Valuation techniques used to value the Fund's investments by major category are as follows.
Equity securities, including restricted securities, for which market quotations are readily available, are valued at the last reported sale price or official closing price as reported by an independent pricing service on the primary market or exchange on which they are traded and are categorized as Level 1 in the hierarchy. In the event there were no sales during the day or closing prices are not available, securities are valued at the last quoted bid price or may be valued using the last available price and are generally categorized as Level 2 in the hierarchy. For foreign equity securities, when significant market or security specific events arise, comparisons to the valuation of American Depositary Receipts (ADRs), futures contracts, Exchange-traded funds (ETFs) and certain indexes as well as quoted prices for similar securities are used and are categorized as Level 2 in the hierarchy in these circumstances. Utilizing these techniques may result in transfers between Level 1 and Level 2. For restricted equity securities and private placements where observable inputs are limited, assumptions about market activity and risk are used and are categorized as Level 3 in the hierarchy.
Annual Report
Notes to Financial Statements - continued
3. Significant Accounting Policies - continued
Security Valuation - continued
Investments in open-end mutual funds, including the Fidelity Central Funds, are valued at their closing net asset value each business day and are categorized as Level 1 in the hierarchy. Short-term securities with remaining maturities of sixty days or less for which quotations are not readily available are valued at amortized cost, which approximates fair value and are categorized as Level 2 in the hierarchy.
Foreign Currency. The Fund uses foreign currency contracts to facilitate transactions in foreign-denominated securities. Gains and losses from these transactions may arise from changes in the value of the foreign currency or if the counterparties do not perform under the contracts' terms.
Foreign-denominated assets, including investment securities, and liabilities are translated into U.S. dollars at the exchange rate at period end. Purchases and sales of investment securities, income and dividends received and expenses denominated in foreign currencies are translated into U.S. dollars at the exchange rate in effect on the transaction date.
The effects of exchange rate fluctuations on investments are included with the net realized and unrealized gain (loss) on investment securities. Other foreign currency transactions resulting in realized and unrealized gain (loss) are disclosed separately.
Investment Transactions and Income. For financial reporting purposes, the Fund's investment holdings and NAV include trades executed through the end of the last business day of the period. The NAV per share for processing shareholder transactions is calculated as of the close of business of the New York Stock Exchange (NYSE), normally 4:00 p.m. Eastern time and includes trades executed through the end of the prior business day. Gains and losses on securities sold are determined on the basis of identified cost and may include proceeds received from litigation. Dividend income is recorded on the ex-dividend date, except for certain dividends from foreign securities where the ex-dividend date may have passed, which are recorded as soon as the Fund is informed of the ex-dividend date. Non-cash dividends included in dividend income, if any, are recorded at the fair market value of the securities received. Distributions received on securities that represent a return of capital or capital gain are recorded as a reduction of cost of investments and/or as a realized gain. The Fund estimates the components of distributions received that may be considered return of capital distributions or capital gain distributions. Interest income and distributions from the Fidelity Central Funds are accrued as earned. Interest income includes coupon interest and amortization of premium and accretion of discount on debt securities. Investment income is recorded net of foreign taxes withheld where recovery of such taxes is uncertain.
Expenses. Most expenses of the Trust can be directly attributed to a fund. Expenses which cannot be directly attributed are apportioned amongst each fund in the Trust. Expense estimates are accrued in the period to which they relate and adjustments are made when actual amounts are known.
Income Tax Information and Distributions to Shareholders. Each year, the Fund intends to qualify as a regulated investment company, including distributing substantially all of its taxable income and realized gains under Subchapter M of the Internal Revenue Code and filing its U.S. federal tax return. As a result, no provision for income taxes is required. As of October 31, 2010, the Fund did not have any unrecognized tax benefits in the accompanying financial statements. A fund's federal tax return is subject to examination by the Internal Revenue Service (IRS) for a period of three years. Foreign taxes are provided for based on the Fund's understanding of the tax rules and rates that exist in the foreign markets in which it invests.
Distributions are declared and recorded on the ex-dividend date. Income dividends and capital gain distributions are declared separately for each class. Income and capital gain distributions are determined in accordance with income tax regulations, which may differ from GAAP.
Capital accounts within the financial statements are adjusted for permanent book-tax differences. These adjustments have no impact on net assets or the results of operations. Temporary book-tax differences will reverse in a subsequent period.
Book-tax differences are primarily due to short-term gain distributions from Fidelity Central Funds, foreign currency transactions, passive foreign investment companies (PFIC), deferred trustees compensation, capital loss carryforwards and losses deferred due to wash sales.
The federal tax cost of investment securities and unrealized appreciation (depreciation) as of period end were as follows:
Gross unrealized appreciation | $ 808,571,125 |
Gross unrealized depreciation | (20,169,137) |
Net unrealized appreciation (depreciation) | $ 788,401,988 |
| |
Tax Cost | $ 3,491,509,711 |
The tax-based components of distributable earnings as of period end were as follows:
Undistributed ordinary income | $ 61,650,009 |
Capital loss carryforward | $ (243,313,729) |
Net unrealized appreciation (depreciation) | $ 788,498,050 |
Annual Report
3. Significant Accounting Policies - continued
Income Tax Information and Distributions to Shareholders - continued
The tax character of distributions paid was as follows:
| October 31, 2010 | October 31, 2009 |
Ordinary Income | $ 34,208,293 | $ 10,179,804 |
Short-Term Trading (Redemption) Fees. Shares held by investors in the Fund less than 90 days are subject to a redemption fee equal to 1.50% of the net asset value of shares redeemed. All redemption fees, which reduce the proceeds of the shareholder redemption, are retained by the Fund and accounted for as an addition to paid in capital.
4. Purchases and Sales of Investments.
Purchases and sales of securities, other than short-term securities, aggregated $5,636,566,398 and $5,347,008,329, respectively.
The Fund realized a loss on the sale of an investment not meeting the investment restrictions of the Fund. The loss was fully reimbursed by the Fund's investment advisor.
5. Fees and Other Transactions with Affiliates.
Management Fee. FMR and its affiliates provide the Fund with investment management related services for which the Fund pays a monthly management fee. The management fee is the sum of an individual fund fee rate that is based on an annual rate of .45% of the Fund's average net assets and a group fee rate that averaged .26% during the period. The group fee rate is based upon the average net assets of all the mutual funds advised by FMR. The group fee rate decreases as assets under management increase and increases as assets under management decrease. In addition, the management fee is subject to a performance adjustment (up to a maximum of ± .20% of the Fund's average net assets over a 36 month performance period). The upward or downward adjustment to the management fee is based on the relative investment performance of Canada, as compared to an appropriate benchmark index. For the period, the total annual management fee rate, including the performance adjustment, was .64% of the Fund's average net assets.
Distribution and Service Plan Fees. In accordance with Rule 12b-1 of the 1940 Act, the Fund has adopted separate Distribution and Service Plans for each class of shares. Certain classes pay Fidelity Distributors Corporation (FDC), an affiliate of FMR, separate Distribution and Service Fees, each of which is based on an annual percentage of each class' average net assets. In addition, FDC may pay financial intermediaries for selling shares of the Fund and providing shareholder support services. For the period, the Distribution and Service Fee rates, total fees and amounts retained by FDC were as follows:
| Distribution
Fee | Service
Fee | Paid to FDC | Retained
by FDC |
Class A | -% | .25% | $ 312,428 | $ 11,816 |
Class T | .25% | .25% | 123,743 | - |
Class B | .75% | .25% | 105,189 | 78,891 |
Class C | .75% | .25% | 401,979 | 204,393 |
| | | $ 943,339 | $ 295,100 |
Sales Load. FDC receives a front-end sales charge of up to 5.75% for selling Class A shares, and 3.50% for selling Class T shares, some of which is paid to financial intermediaries for selling shares of the Fund. FDC receives the proceeds of contingent deferred sales charges levied on Class A, Class T, Class B, and Class C redemptions. These charges depend on the holding period. The deferred sales charges range from 5% to 1% for Class B, 1% for Class C, 1.00% for certain purchases of Class A shares (1.00% to .50% prior to July 12, 2010) and .25% for certain purchases of Class T shares.
Annual Report
Notes to Financial Statements - continued
5. Fees and Other Transactions with Affiliates - continued
Sales Load - continued
For the period, sales charge amounts retained by FDC were as follows:
| Retained
by FDC |
Class A | $ 169,728 |
Class T | 20,643 |
Class B* | 19,800 |
Class C* | 8,543 |
| $ 218,714 |
* When Class B and Class C shares are initially sold, FDC pays commissions from its own resources to financial intermediaries through which the sales are made.
Transfer Agent Fees. Fidelity Investments Institutional Operations Company, Inc. (FIIOC), an affiliate of FMR, is the transfer, dividend disbursing and shareholder servicing agent for each class of the Fund. FIIOC receives account fees and asset-based fees that vary according to the account size and type of account of the shareholders of the respective classes of the Fund. FIIOC pays for typesetting, printing and mailing of shareholder reports, except proxy statements. For the period, transfer agent fees for each class were as follows:
| Amount | % of
Average
Net Assets |
Class A | $ 357,370 | .28 |
Class T | 77,021 | .31 |
Class B | 32,593 | .31 |
Class C | 116,977 | .29 |
Canada | 8,568,457 | .24 |
Institutional Class | 76,686 | .25 |
| $ 9,229,104 | |
Accounting and Security Lending Fees. Fidelity Service Company, Inc. (FSC), an affiliate of FMR, maintains the Fund's accounting records. The accounting fee is based on the level of average net assets for the month. Under a separate contract, FSC administers the security lending program. The security lending fee is based on the number and duration of lending transactions.
Brokerage Commissions. The Fund placed a portion of its portfolio transactions with brokerage firms which are affiliates of the investment adviser. The commissions paid to these affiliated firms were $650 for the period.
Interfund Lending Program. Pursuant to an Exemptive Order issued by the SEC, the Fund, along with other registered investment companies having management contracts with FMR, may participate in an interfund lending program. This program provides an alternative credit facility allowing the funds to borrow from, or lend money to, other participating affiliated funds. At period end, there were no interfund loans outstanding. The Fund's activity in this program during the period for which loans were outstanding was as follows:
Borrower or Lender | Average Daily
Loan Balance | Weighted Average Interest Rate | Interest
Expense |
Borrower | $ 7,003,722 | .45% | $ 1,574 |
6. Committed Line of Credit.
The Fund participates with other funds managed by FMR or an affiliate in a $3.75 billion credit facility (the "line of credit") to be utilized for temporary or emergency purposes to fund shareholder redemptions or for other short-term liquidity purposes. The Fund has agreed to pay commitment fees on its pro-rata portion of the line of credit, which amounted to $14,854 and is reflected in Miscellaneous expenses on the Statement of Operations. During the period, there were no borrowings on this line of credit.
7. Security Lending.
The Fund lends portfolio securities through a lending agent from time to time in order to earn additional income. The lending agent may loan securities to certain qualified borrowers, including Fidelity Capital Markets (FCM), a broker-dealer affiliated with the Fund. On the settlement date of the loan, the Fund receives collateral (in the form of U.S. Treasury obligations, letters of credit and/or cash) against the loaned securities and maintains collateral in an amount not less than 100% of the market value of the loaned securities during the period of the loan. The market value of the loaned
Annual Report
7. Security Lending - continued
securities is determined at the close of business of the Fund and any additional required collateral is delivered to the Fund on the next business day. If the borrower defaults on its obligation to return the securities loaned because of insolvency or other reasons, a fund could experience delays and costs in recovering the securities loaned or in gaining access to the collateral. Any cash collateral received is invested in the Fidelity Securities Lending Cash Central Fund. The value of loaned securities and cash collateral at period end are disclosed on the Fund's Statement of Assets and Liabilities. Security lending income represents the income earned on investing cash collateral, less rebates paid to borrowers and lending agent fees associated with the loan, plus any premium payments received for lending certain types of securities. Security lending income is presented in the Statement of Operations as a component of income from Fidelity Central Funds. During the period, there were no securities loaned to FCM.
8. Expense Reductions.
Many of the brokers with whom FMR places trades on behalf of the Fund provided services to the Fund in addition to trade execution. These services included payments of certain expenses on behalf of the Fund totaling $1,984,527 for the period.
9. Distributions to Shareholders.
Distributions to shareholders of each class were as follows:
Years ended October 31, | 2010 | 2009 |
From net investment income | | |
Class A | $ 756,039 | $ 107,700 |
Class T | 106,904 | - |
Class B | 15,600 | - |
Class C | 97,752 | - |
Canada | 33,027,962 | 10,039,164 |
Institutional Class | 204,036 | 32,940 |
Total | $ 34,208,293 | $ 10,179,804 |
10. Share Transactions.
Transactions for each class of shares were as follows:
| Shares | Dollars |
Years ended October 31, | 2010 | 2009 | 2010 | 2009 |
Class A | | | | |
Shares sold | 2,050,255 | 894,135 | $ 102,518,373 | $ 37,345,647 |
Reinvestment of distributions | 14,622 | 3,241 | 696,013 | 102,525 |
Shares redeemed | (773,357) | (493,476) | (38,292,678) | (17,901,706) |
Net increase (decrease) | 1,291,520 | 403,900 | $ 64,921,708 | $ 19,546,466 |
Class T | | | | |
Shares sold | 296,633 | 153,535 | $ 14,818,898 | $ 6,072,136 |
Reinvestment of distributions | 2,182 | - | 103,790 | - |
Shares redeemed | (113,003) | (144,414) | (5,600,141) | (5,034,459) |
Net increase (decrease) | 185,812 | 9,121 | $ 9,322,547 | $ 1,037,677 |
Class B | | | | |
Shares sold | 134,473 | 68,778 | $ 6,579,801 | $ 2,732,178 |
Reinvestment of distributions | 263 | - | 12,424 | - |
Shares redeemed | (47,606) | (50,130) | (2,342,627) | (1,849,231) |
Net increase (decrease) | 87,130 | 18,648 | $ 4,249,598 | $ 882,947 |
Class C | | | | |
Shares sold | 647,123 | 311,799 | $ 31,812,568 | $ 13,003,041 |
Reinvestment of distributions | 1,580 | - | 74,410 | - |
Shares redeemed | (196,235) | (183,651) | (9,599,233) | (6,643,635) |
Net increase (decrease) | 452,468 | 128,148 | $ 22,287,745 | $ 6,359,406 |
Canada | | | | |
Shares sold | 20,151,337 | 19,139,057 | $ 1,010,632,290 | $ 774,158,834 |
Reinvestment of distributions | 659,119 | 306,492 | 31,486,105 | 9,628,844 |
Shares redeemed | (18,629,713) | (20,957,211) | (923,131,901) | (789,350,714) |
Net increase (decrease) | 2,180,743 | (1,511,662) | $ 118,986,494 | $ (5,563,036) |
Annual Report
Notes to Financial Statements - continued
10. Share Transactions - continued
| Shares | Dollars |
Years ended October 31, | 2010 | 2009 | 2010 | 2009 |
Institutional Class | | | | |
Shares sold | 717,543 | 280,690 | $ 36,118,321 | $ 11,718,786 |
Reinvestment of distributions | 2,830 | 737 | 134,893 | 23,131 |
Shares redeemed | (259,715) | (108,451) | (12,754,674) | (3,897,165) |
Net increase (decrease) | 460,658 | 172,976 | $ 23,498,540 | $ 7,844,752 |
11. Other.
The Fund's organizational documents provide former and current trustees and officers with a limited indemnification against liabilities arising in connection with the performance of their duties to the Fund. In the normal course of business, the Fund may also enter into contracts that provide general indemnifications. The Fund's maximum exposure under these arrangements is unknown as this would be dependent on future claims that may be made against the Fund. The risk of material loss from such claims is considered remote.
Annual Report
Fidelity China Region Fund
Performance: The Bottom Line
Average annual total return reflects the change in the value of an investment, assuming reinvestment of the class' distributions from dividend income and capital gains (the profits earned upon the sale of securities that have grown in value, if any) and assuming a constant rate of performance each year. The $10,000 table and the fund's returns do not reflect the deduction of taxes that a shareholder would pay on fund distributions or the redemption of fund shares. During periods of reimbursement by Fidelity, a fund's total return will be greater than it would be had the reimbursement not occurred. How a fund did yesterday is no guarantee of how it will do tomorrow.
Average Annual Total Returns
Periods ended October 31, 2010 | Past 1
year | Past 5
years | Past 10
years |
Fidelity China Region Fund | 20.97% | 16.80% | 11.02% |
$10,000 Over 10 Years
Let's say hypothetically that $10,000 was invested in Fidelity China Region Fund, a class of the fund, on October 31, 2000. The chart shows how the value of your investment would have changed, and also shows how the MSCI® Golden Dragon Index performed over the same period.
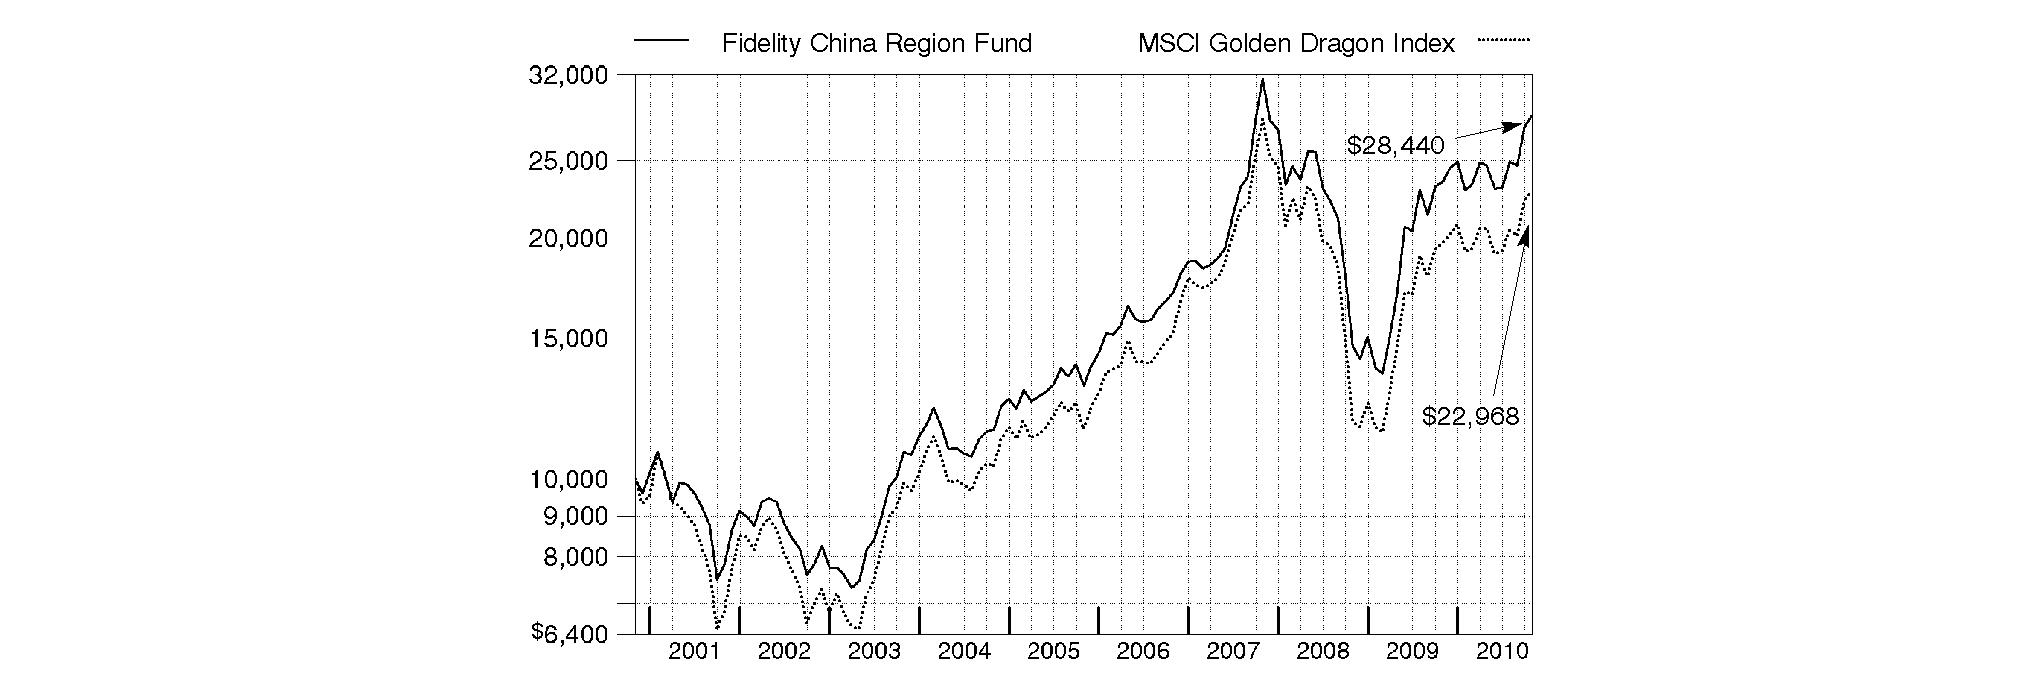
Annual Report
Fidelity China Region Fund
Market Recap: International stocks rode a wave of volatility similar to that of their U.S. counterparts during the 12 months ending October 31, 2010. Stocks gained modestly in the first half of the period, despite growing concerns about the European debt crisis. Sentiment turned decidedly negative in May and June, however, and the market suffered a precipitous decline. These losses were more than offset during the last four months of the period, when signs of economic growth and subsiding debt fears helped propel international stocks about 21%. For the full year, the MSCI® ACWI® (All Country World Index) ex USA Index gained 12.76%, boosted in part by a generally depreciating U.S. dollar. Within the index, Canada and emerging markets were standouts, returning 23% and 24%, respectively. Results in the latter group were led by strong-performing India, Mexico and South Africa, while China fell short of the MSCI benchmark due to cooling economic growth. The developed Asia ex Japan segment rose 16% for the period, lifted by solid results from Singapore and Hong Kong. Meanwhile, Europe rose just 9%, held back mainly by debt-riddled Spain and Italy, as well as lagging major constituent France. Japan returned only 5%, a result of that nation's continued weak economy.
Comments from Joseph Tse, who became Portfolio Manager of Fidelity® China Region Fund on January 19, 2010: During the past year, the fund's Retail Class shares returned 20.97%, versus 16.14% for the MSCI Golden Dragon Index. Stock picking and an overweighting in consumer discretionary aided relative performance, as did stock selection in information technology, industrials, health care and financials, among other sectors. Geographically, security selection in China and Hong Kong added value. The largest relative contributor was China Shineway Pharmaceutical Group, as better-than-expected sales lifted the stock, which was sold from the fund. Other contributors included BOC Hong Kong and Chinese online travel services provider Ctrip.com International, an out-of-benchmark holding. Underweighting and ultimately selling Hong Kong apparel wholesaler/retailer Esprit Holdings also added value. Conversely, underweighting Taiwan's Nan Ya Plastics detracted, as did not owning Taiwan-based index component Formosa Chemicals & Fibre. Underweighting Hong Kong shoe manufacturer/retailer Belle International Holdings also hurt.
Note to shareholders: Fidelity China Region Fund may invest up to 35% of its total assets in any industry that represents more than 20% of the Hong Kong, Taiwanese and Chinese market. As of October 31, 2010, the fund did not have more than 25% of its total assets invested in any one industry.
The views expressed above reflect those of the portfolio manager(s) only through the end of the period as stated on the cover of this report and do not necessarily represent the views of Fidelity or any other person in the Fidelity organization. Any such views are subject to change at any time based upon market or other conditions and Fidelity disclaims any responsibility to update such views. These views may not be relied on as investment advice and, because investment decisions for a Fidelity fund are based on numerous factors, may not be relied on as an indication of trading intent on behalf of any Fidelity fund.
Annual Report
Fidelity China Region Fund
As a shareholder of the Fund, you incur two types of costs: (1) transaction costs, including sales charges (loads) on purchase payments or redemption proceeds, redemption fees, and (2) ongoing costs, including management fees, distribution and/or service (12b-1) fees and other Fund expenses. This Example is intended to help you understand your ongoing costs (in dollars) of investing in the Fund and to compare these costs with the ongoing costs of investing in other mutual funds.
The Example is based on an investment of $1,000 invested at the beginning of the period and held for the entire period (May 1, 2010 to October 31, 2010).
Actual Expenses
The first line of the accompanying table for each class of the Fund provides information about actual account values and actual expenses. You may use the information in this line, together with the amount you invested, to estimate the expenses that you paid over the period. Simply divide your account value by $1,000.00 (for example, an $8,600 account value divided by $1,000.00 = 8.6), then multiply the result by the number in the first line for a class of the Fund under the heading entitled "Expenses Paid During Period" to estimate the expenses you paid on your account during this period. A small balance maintenance fee of $12.00 that is charged once a year may apply for certain accounts with a value of less than $2,000. This fee is not included in the table below. If it was, the estimate of expenses you paid during the period would be higher, and your ending account value lower, by this amount. In addition, the Fund, as a shareholder in the underlying Fidelity Central Funds, will indirectly bear its pro-rata share of the fees and expenses incurred by the underlying Fidelity Central Funds. These fees and expenses are not included in the Fund's annualized expense ratio used to calculate the expense estimate in the table below.
Hypothetical Example for Comparison Purposes
The second line of the accompanying table for each class of the Fund provides information about hypothetical account values and hypothetical expenses based on a Class' actual expense ratio and an assumed rate of return of 5% per year before expenses, which is not the Class' actual return. The hypothetical account values and expenses may not be used to estimate the actual ending account balance or expenses you paid for the period. You may use this information to compare the ongoing costs of investing in the Fund and other funds. To do so, compare this 5% hypothetical example with the 5% hypothetical examples that appear in the shareholder reports of the other funds. A small balance maintenance fee of $12.00 that is charged once a year may apply for certain accounts with a value of less than $2,000. This fee is not included in the table below. If it was, the estimate of expenses you paid during the period would be higher, and your ending account value lower, by this amount. In addition, the Fund, as a shareholder in the underlying Fidelity Central Funds, will indirectly bear its pro-rata share of the fees and expenses incurred by the underlying Fidelity Central Funds. These fees and expenses are not included in the Fund's annualized expense ratio used to calculate the expense estimate in the table below.
Please note that the expenses shown in the table are meant to highlight your ongoing costs only and do not reflect any transaction costs. Therefore, the second line of the table is useful in comparing ongoing costs only, and will not help you determine the relative total costs of owning different funds. In addition, if these transactional costs were included, your costs would have been higher.
| Annualized
Expense Ratio | Beginning
Account Value
May 1, 2010 | Ending
Account Value
October 31, 2010 | Expenses Paid
During Period*
May 1, 2010 to
October 31, 2010 |
Class A | 1.37% | | | |
Actual | | $ 1,000.00 | $ 1,152.80 | $ 7.43 |
HypotheticalA | | $ 1,000.00 | $ 1,018.30 | $ 6.97 |
Class T | 1.63% | | | |
Actual | | $ 1,000.00 | $ 1,151.40 | $ 8.84 |
HypotheticalA | | $ 1,000.00 | $ 1,016.99 | $ 8.29 |
Class B | 2.12% | | | |
Actual | | $ 1,000.00 | $ 1,148.60 | $ 11.48 |
HypotheticalA | | $ 1,000.00 | $ 1,014.52 | $ 10.76 |
Class C | 2.12% | | | |
Actual | | $ 1,000.00 | $ 1,148.80 | $ 11.48 |
HypotheticalA | | $ 1,000.00 | $ 1,014.52 | $ 10.76 |
China Region | 1.06% | | | |
Actual | | $ 1,000.00 | $ 1,154.60 | $ 5.76 |
HypotheticalA | | $ 1,000.00 | $ 1,019.86 | $ 5.40 |
Institutional Class | 1.08% | | | |
Actual | | $ 1,000.00 | $ 1,154.70 | $ 5.87 |
HypotheticalA | | $ 1,000.00 | $ 1,019.76 | $ 5.50 |
A 5% return per year before expenses
* Expenses are equal to each Class' annualized expense ratio, multiplied by the average account value over the period, multiplied by 184/365 (to reflect the one-half year period).
Annual Report
Fidelity China Region Fund
Investment Changes (Unaudited)
Geographic Diversification (% of fund's net assets) |
As of October 31, 2010 |
| Hong Kong | 32.0% | |
| China | 31.3% | |
| Taiwan | 18.3% | |
| Cayman Islands | 8.5% | |
| Bermuda | 4.3% | |
| United States of America | 3.5% | |
| Japan | 1.0% | |
| United Kingdom | 0.8% | |
| Singapore | 0.2% | |
| Other | 0.1% | |

Percentages are adjusted for the effect of futures contracts, if applicable. |
As of April 30, 2010 |
| China | 37.2% | |
| Hong Kong | 28.0% | |
| Taiwan | 18.7% | |
| Cayman Islands | 9.1% | |
| Bermuda | 5.2% | |
| United States of America | 1.2% | |
| Canada | 0.2% | |
| Japan | 0.2% | |
| British Virgin Islands | 0.2% | |

Percentages are adjusted for the effect of futures contracts, if applicable. |
Asset Allocation |
| % of fund's
net assets | % of fund's net assets
6 months ago |
Stocks | 96.6 | 99.1 |
Short-Term Investments and Net Other Assets | 3.4 | 0.9 |
Top Ten Stocks as of October 31, 2010 |
| % of fund's
net assets | % of fund's net assets
6 months ago |
CNOOC Ltd. (Oil, Gas & Consumable Fuels) | 3.6 | 3.2 |
China Construction Bank Corp. (H Shares) (Commercial Banks) | 3.4 | 3.9 |
Hong Kong Exchanges and Clearing Ltd. (Diversified Financial Services) | 3.3 | 2.7 |
Tencent Holdings Ltd. (Internet Software & Services) | 3.2 | 3.7 |
Industrial & Commercial Bank of China Ltd. (H Shares) (Commercial Banks) | 3.2 | 3.5 |
BOC Hong Kong (Holdings) Ltd. (Commercial Banks) | 3.1 | 2.4 |
Bank of China Ltd. (H Shares) (Commercial Banks) | 2.8 | 3.3 |
Hon Hai Precision Industry Co. Ltd. (Foxconn) (Electronic Equipment & Components) | 2.8 | 3.8 |
China Life Insurance Co. Ltd. (H Shares) (Insurance) | 2.7 | 3.4 |
China Mobile (Hong Kong) Ltd. (Wireless Telecommunication Services) | 2.5 | 2.7 |
| 30.6 | |
Market Sectors as of October 31, 2010 |
| % of fund's
net assets | % of fund's net assets
6 months ago |
Financials | 41.3 | 37.6 |
Information Technology | 15.0 | 20.1 |
Consumer Discretionary | 9.9 | 8.9 |
Industrials | 8.5 | 9.9 |
Energy | 7.3 | 8.2 |
Consumer Staples | 5.2 | 4.1 |
Materials | 4.7 | 3.6 |
Telecommunication Services | 4.3 | 4.2 |
Utilities | 0.2 | 0.9 |
Health Care | 0.2 | 1.6 |
Annual Report
Fidelity China Region Fund
Investments October 31, 2010
Showing Percentage of Net Assets
Common Stocks - 96.6% |
| Shares | | Value |
CONSUMER DISCRETIONARY - 9.9% |
Auto Components - 0.4% |
Minth Group Ltd. | 4,938,000 | | $ 9,237,349 |
Automobiles - 1.3% |
Brilliance China Automotive Holdings Ltd. (a) | 14,406,000 | | 12,638,065 |
BYD Co. Ltd. (H Shares) (d) | 1,725,800 | | 10,520,116 |
Dongfeng Motor Group Co. Ltd. (H Shares) | 2,470,000 | | 5,353,459 |
| | 28,511,640 |
Distributors - 2.0% |
Li & Fung Ltd. | 8,042,000 | | 42,486,038 |
Diversified Consumer Services - 0.1% |
New Oriental Education & Technology Group, Inc. sponsored ADR (a)(d) | 22,616 | | 2,428,280 |
Hotels, Restaurants & Leisure - 2.8% |
Country Style Cooking Restaurant Chain Co. Ltd. ADR | 3,600 | | 106,416 |
Ctrip.com International Ltd. sponsored ADR (a) | 477,500 | | 24,863,425 |
Las Vegas Sands Corp. (a) | 57,200 | | 2,624,336 |
Melco International Development Ltd. (a) | 5,970,000 | | 3,388,873 |
Melco PBL Entertainment (Macau) Ltd. sponsored ADR (a) | 370,000 | | 2,319,900 |
Sands China Ltd. | 2,808,800 | | 6,124,008 |
Shangri-La Asia Ltd. | 2,966,000 | | 6,673,380 |
SJM Holdings Ltd. | 9,928,000 | | 14,755,112 |
| | 60,855,450 |
Household Durables - 0.2% |
Techtronic Industries Co. Ltd. | 4,157,000 | | 4,209,960 |
Multiline Retail - 1.5% |
Far East Department Stores Co. Ltd. | 14,363,615 | | 17,834,255 |
Golden Eagle Retail Group Ltd. (H Shares) | 2,596,000 | | 6,899,223 |
Maoye International Holdings Ltd. | 18,043,000 | | 7,774,697 |
| | 32,508,175 |
Specialty Retail - 1.1% |
Belle International Holdings Ltd. | 5,574,000 | | 10,067,538 |
Chow Sang Sang Holdings International Ltd. | 2,746,000 | | 7,227,015 |
GOME Electrical Appliances Holdings Ltd. (a) | 6,666,000 | | 2,244,575 |
I.T Ltd. | 5,492,000 | | 4,633,792 |
| | 24,172,920 |
Textiles, Apparel & Luxury Goods - 0.5% |
Anta Sports Products Ltd. | 2,467,000 | | 5,092,340 |
Trinity Ltd. | 4,310,000 | | 4,309,305 |
| | 9,401,645 |
TOTAL CONSUMER DISCRETIONARY | | 213,811,457 |
|
| Shares | | Value |
CONSUMER STAPLES - 5.2% |
Beverages - 0.1% |
Wuliangye Yibin Co. Ltd. (BNP Paribas Warrant Program) warrants 5/5/15 (a) | 578,000 | | $ 3,162,589 |
Food & Staples Retailing - 1.7% |
Beijing Jingkelong Co. Ltd. (H Shares) | 1,226,000 | | 1,470,963 |
China Resources Enterprise Ltd. | 1,936,000 | | 8,179,842 |
Dairy Farm International Holdings Ltd. | 2,642,400 | | 20,610,720 |
Lianhua Supermarket Holdings Co. (H Shares) | 785,000 | | 3,342,042 |
Wumart Stores, Inc. (H Shares) | 1,338,000 | | 3,141,635 |
| | 36,745,202 |
Food Products - 2.4% |
Asian Citrus Holdings Ltd. | 5,805,803 | | 6,688,705 |
Besunyen Holdings Co. Ltd. | 25,440,000 | | 12,143,590 |
China Agri-Industries Holding Ltd. | 3,147,000 | | 4,579,669 |
China Huiyuan Juice Group Ltd. | 3,283,000 | | 2,202,432 |
China Mengniu Dairy Co. Ltd. | 2,326,000 | | 6,661,790 |
Tingyi (Cayman Islands) Holding Corp. | 3,536,000 | | 9,625,493 |
Want Want China Holdings Ltd. | 5,577,000 | | 5,144,403 |
Yashili International Holdings Ltd. | 8,021,000 | | 4,346,164 |
| | 51,392,246 |
Household Products - 0.3% |
NVC Lighting Holdings Ltd. | 10,667,000 | | 5,463,376 |
Personal Products - 0.7% |
Hengan International Group Co. Ltd. | 1,655,500 | | 15,591,227 |
TOTAL CONSUMER STAPLES | | 112,354,640 |
ENERGY - 7.3% |
Oil, Gas & Consumable Fuels - 7.3% |
China Coal Energy Co. Ltd. (H Shares) | 1,242,000 | | 2,147,112 |
China Petroleum & Chemical Corp. (H Shares) | 32,506,000 | | 30,928,266 |
CNOOC Ltd. | 37,343,000 | | 77,961,654 |
CNPC (Hong Kong) Ltd. | 9,330,000 | | 11,868,254 |
PetroChina Co. Ltd. (H Shares) | 24,580,000 | | 30,256,374 |
Sino Prosper State Gold Resources Holdings, Ltd. (a) | 79,350,000 | | 3,992,453 |
| | 157,154,113 |
FINANCIALS - 41.3% |
Capital Markets - 1.5% |
Citic Securities Co. Ltd. (UBS Warrant Programme) warrants 9/16/13 (a) | 3,008,600 | | 6,995,171 |
Wuliangye Yibin Co. Ltd. (UBS Warrant Programme) warrants 4/22/13 (a) | 345,100 | | 1,888,252 |
Yuanta Financial Holding Co. Ltd. | 38,078,000 | | 23,950,384 |
| | 32,833,807 |
Commercial Banks - 17.2% |
Bank of China Ltd. (H Shares) | 102,083,000 | | 61,108,224 |
BOC Hong Kong (Holdings) Ltd. | 21,653,500 | | 67,883,251 |
Common Stocks - continued |
| Shares | | Value |
FINANCIALS - continued |
Commercial Banks - continued |
China Construction Bank Corp. (H Shares) | 77,268,000 | | $ 73,666,895 |
China Merchants Bank Co. Ltd. (H Shares) | 7,761,464 | | 22,028,990 |
Chinatrust Financial Holding Co. Ltd. | 7,410,335 | | 4,624,650 |
E.Sun Financial Holdings Co. Ltd. | 9,287,652 | | 4,779,628 |
Hang Seng Bank Ltd. | 1,921,700 | | 28,114,276 |
HSBC Holdings PLC (Hong Kong) | 413,600 | | 4,311,132 |
Industrial & Commercial Bank of China (Asia) Ltd. | 2,163,000 | | 8,008,786 |
Industrial & Commercial Bank of China Ltd. (H Shares) | 84,726,000 | | 68,207,094 |
Mega Financial Holding Co. Ltd. | 8,480,000 | | 5,887,927 |
Standard Chartered PLC: | | | |
rights 11/5/10 (a) | 42,845 | | 360,725 |
(United Kingdom) | 432,898 | | 12,522,362 |
Wing Hang Bank Ltd. | 819,500 | | 9,578,674 |
| | 371,082,614 |
Diversified Financial Services - 4.7% |
China Everbright Ltd. | 5,418,000 | | 14,084,528 |
Fubon Financial Holding Co. Ltd. | 13,011,985 | | 15,943,455 |
Hong Kong Exchanges and Clearing Ltd. | 3,217,600 | | 70,817,295 |
| | 100,845,278 |
Insurance - 7.2% |
Cathay Financial Holding Co. Ltd. | 16,430,400 | | 25,151,585 |
China Life Insurance Co. Ltd. (H Shares) | 13,479,000 | | 59,257,545 |
PICC Property & Casualty Co. Ltd. (H Shares) (a) | 21,118,000 | | 31,167,866 |
Ping An Insurance Group Co. China Ltd. (H Shares) | 3,755,500 | | 40,431,734 |
| | 156,008,730 |
Real Estate Management & Development - 10.7% |
Cheung Kong Holdings Ltd. | 2,663,000 | | 40,539,784 |
China Overseas Land & Investment Ltd. | 5,487,920 | | 11,540,474 |
China Resources Land Ltd. | 4,232,000 | | 8,342,520 |
E-House China Holdings Ltd. ADR (d) | 249,600 | | 4,170,816 |
Hang Lung Properties Ltd. | 1,343,000 | | 6,575,307 |
Henderson Land Development Co. Ltd. | 2,500,076 | | 17,755,741 |
Huaku Development Co. Ltd. | 1,820,000 | | 5,048,783 |
Hung Poo Real Estate Development Co. Ltd. | 2,056,000 | | 3,059,984 |
Kerry Properties Ltd. | 3,480,000 | | 19,305,273 |
Midland Holdings Ltd. | 4,368,000 | | 4,384,201 |
New World Development Co. Ltd. | 7,024,000 | | 13,864,499 |
Poly (Hong Kong) Investments Ltd. | 3,144,000 | | 3,236,784 |
Shimao Property Holdings Ltd. | 7,417,500 | | 12,268,002 |
Sinyi Realty, Inc. | 1,179,370 | | 2,292,845 |
Sun Hung Kai Properties Ltd. | 2,983,000 | | 51,106,905 |
|
| Shares | | Value |
Wharf Holdings Ltd. | 3,853,000 | | $ 25,301,429 |
Yanlord Land Group Ltd. | 2,484,000 | | 3,300,997 |
| | 232,094,344 |
TOTAL FINANCIALS | | 892,864,773 |
HEALTH CARE - 0.2% |
Pharmaceuticals - 0.2% |
Coolpoint Energy Ltd. (a) | 45,452,000 | | 3,811,488 |
INDUSTRIALS - 8.5% |
Airlines - 1.2% |
Air China Ltd. (H Shares) (a) | 9,756,000 | | 13,114,984 |
Cathay Pacific Airways Ltd. | 3,341,000 | | 8,986,918 |
China Eastern Airlines Corp. Ltd. (a) | 6,770,000 | | 4,279,697 |
| | 26,381,599 |
Building Products - 0.5% |
China Liansu Group Holdgs Ltd. (a) | 18,523,000 | | 11,613,840 |
Electrical Equipment - 0.7% |
Dongfang Electric Corp. Ltd. | 1,674,800 | | 8,145,778 |
Zhuzhou CSR Times Electric Co. Ltd. (H Shares) | 2,036,000 | | 6,212,082 |
| | 14,357,860 |
Industrial Conglomerates - 2.9% |
Far Eastern Textile Ltd. | 19,334,228 | | 27,859,483 |
Hutchison Whampoa Ltd. | 2,121,000 | | 20,905,583 |
Shanghai Industrial Holdings Ltd. | 3,144,000 | | 14,480,348 |
| | 63,245,414 |
Machinery - 0.8% |
China International Marine Containers Co. Ltd. (B Shares) | 7,166,794 | | 14,516,196 |
Singamas Container Holdings Ltd. (a) | 13,180,000 | | 2,975,649 |
| | 17,491,845 |
Marine - 0.8% |
Orient Overseas International Ltd. | 619,000 | | 5,426,357 |
Shun Tak Holdings Ltd. | 19,152,000 | | 12,625,927 |
| | 18,052,284 |
Trading Companies & Distributors - 0.1% |
Hong Kong Resources Holdings
Co. Ltd. | 11,212,000 | | 1,923,814 |
Transportation Infrastructure - 1.5% |
China Merchant Holdings International Co. Ltd. | 1,228,000 | | 4,301,268 |
Cosco Pacific Ltd. | 7,606,000 | | 11,873,259 |
Zhejiang Expressway Co. Ltd. (H Shares) | 15,140,000 | | 15,254,752 |
| | 31,429,279 |
TOTAL INDUSTRIALS | | 184,495,935 |
INFORMATION TECHNOLOGY - 15.0% |
Communications Equipment - 2.1% |
China Wireless Technologies Ltd. | 3,964,000 | | 2,122,316 |
Common Stocks - continued |
| Shares | | Value |
INFORMATION TECHNOLOGY - continued |
Communications Equipment - continued |
HTC Corp. | 1,700,000 | | $ 38,382,618 |
Vtech Holdings Ltd. | 403,000 | | 4,193,124 |
| | 44,698,058 |
Computers & Peripherals - 0.3% |
Acer, Inc. | 2,301,108 | | 6,684,153 |
Electronic Equipment & Components - 6.4% |
AU Optronics Corp. (a) | 7,798,090 | | 7,784,283 |
Chroma ATE, Inc. | 3,350,000 | | 8,625,388 |
Delta Electronics, Inc. | 828,000 | | 3,422,382 |
Funtalk China Holdings Ltd. (a) | 497,100 | | 3,280,860 |
Hon Hai Precision Industry Co. Ltd. (Foxconn) | 15,763,172 | | 59,746,054 |
Kingboard Chemical Holdings Ltd. | 2,618,000 | | 12,733,249 |
Tripod Technology Corp. | 3,001,820 | | 11,524,713 |
Unimicron Technology Corp. | 14,255,000 | | 24,266,803 |
WPG Holding Co. Ltd. | 3,601,120 | | 6,695,106 |
| | 138,078,838 |
Internet Software & Services - 3.9% |
Sina Corp. (a) | 146,100 | | 8,225,430 |
SouFun Holdings Ltd. ADR (d) | 89,400 | | 6,570,900 |
Tencent Holdings Ltd. | 3,007,100 | | 68,861,184 |
TPK Holdings Co. | 11,000 | | 181,506 |
| | 83,839,020 |
Semiconductors & Semiconductor Equipment - 2.3% |
MediaTek, Inc. | 398,794 | | 5,016,687 |
Taiwan Semiconductor Manufacturing Co. Ltd. | 19,519,796 | | 40,179,972 |
Trony Solar Holdings Co. Ltd. | 8,494,000 | | 5,314,743 |
| | 50,511,402 |
TOTAL INFORMATION TECHNOLOGY | | 323,811,471 |
MATERIALS - 4.7% |
Chemicals - 2.7% |
China BlueChemical Ltd. (H shares) | 11,116,000 | | 8,790,980 |
DC Chemical Co. Ltd. | 7,519 | | 2,213,240 |
Formosa Plastics Corp. | 8,908,250 | | 25,556,097 |
Nan Ya Plastics Corp. | 3,518,000 | | 7,839,490 |
Taiwan Fertilizer Co. Ltd. | 3,804,000 | | 12,988,662 |
| | 57,388,469 |
Construction Materials - 0.5% |
Anhui Conch Cement Co. Ltd. (H Shares) | 2,810,000 | | 11,781,971 |
Metals & Mining - 1.5% |
Xingda International Holdings Ltd. | 13,453,000 | | 14,040,932 |
Zhaojin Mining Industry Co. Ltd. (H Shares) | 2,435,000 | | 7,570,843 |
Zijin Mining Group Co. Ltd. (H Shares) | 10,858,000 | | 10,239,894 |
| | 31,851,669 |
|
| Shares | | Value |
Paper & Forest Products - 0.0% |
China Forestry Holdings Co. Ltd. | 1,064,000 | | $ 505,147 |
TOTAL MATERIALS | | 101,527,256 |
TELECOMMUNICATION SERVICES - 4.3% |
Diversified Telecommunication Services - 0.8% |
China Unicom (Hong Kong) Ltd. | 12,910,000 | | 18,156,664 |
Wireless Telecommunication Services - 3.5% |
China Mobile (Hong Kong) Ltd. | 5,194,000 | | 53,042,759 |
SOFTBANK CORP. | 689,200 | | 22,133,677 |
| | 75,176,436 |
TOTAL TELECOMMUNICATION SERVICES | | 93,333,100 |
UTILITIES - 0.2% |
Gas Utilities - 0.2% |
Enn Energy Holdings Ltd. | 1,854,000 | | 5,573,062 |
TOTAL COMMON STOCKS (Cost $1,524,284,829) | 2,088,737,295 |
Money Market Funds - 4.0% |
| | | |
Fidelity Cash Central Fund, 0.23% (b) | 74,532,881 | | 74,532,881 |
Fidelity Securities Lending Cash Central Fund, 0.24% (b)(c) | 11,164,250 | | 11,164,250 |
TOTAL MONEY MARKET FUNDS (Cost $85,697,131) | 85,697,131 |
TOTAL INVESTMENT PORTFOLIO - 100.6% (Cost $1,609,981,960) | | 2,174,434,426 |
NET OTHER ASSETS (LIABILITIES) - (0.6)% | | (11,909,134) |
NET ASSETS - 100% | $ 2,162,525,292 |
Legend |
(a) Non-income producing |
(b) Affiliated fund that is available only to investment companies and other accounts managed by Fidelity Investments. The rate quoted is the annualized seven-day yield of the fund at period end. A complete unaudited listing of the fund's holdings as of its most recent quarter end is available upon request. In addition, each Fidelity Central Fund's financial statements, which are not covered by the Fund's report of Independent Registered Public Accounting Firm, are available on the SEC's website or upon request. |
(c) Investment made with cash collateral received from securities on loan. |
(d) Security or a portion of the security is on loan at period end. |
Affiliated Central Funds |
Information regarding fiscal year to date income earned by the Fund from investments in Fidelity Central Funds is as follows: |
Fund | Income earned |
Fidelity Cash Central Fund | $ 72,745 |
Fidelity Securities Lending Cash Central Fund | 439,269 |
Total | $ 512,014 |
Other Information |
The following is a summary of the inputs used, as of October 31, 2010, involving the Fund's assets and liabilities carried at fair value. The inputs or methodology used for valuing securities may not be an indication of the risk associated with investing in those securities. For more information on valuation inputs, and their aggregation into the levels used in the table below, please refer to the Security Valuation section in the accompanying Notes to Financial Statements. |
Valuation Inputs at Reporting Date: |
Description | Total | Level 1 | Level 2 | Level 3 |
Investments in Securities: | | | | |
Equities: | | | | |
Consumer Discretionary | $ 213,811,457 | $ 213,811,457 | $ - | $ - |
Consumer Staples | 112,354,640 | 104,845,887 | 7,508,753 | - |
Energy | 157,154,113 | 18,007,819 | 139,146,294 | - |
Financials | 892,864,773 | 820,412,673 | 72,452,100 | - |
Health Care | 3,811,488 | 3,811,488 | - | - |
Industrials | 184,495,935 | 184,495,935 | - | - |
Information Technology | 323,811,471 | 275,847,216 | 47,964,255 | - |
Materials | 101,527,256 | 101,527,256 | - | - |
Telecommunication Services | 93,333,100 | - | 93,333,100 | - |
Utilities | 5,573,062 | 5,573,062 | - | - |
Money Market Funds | 85,697,131 | 85,697,131 | - | - |
Total Investments in Securities: | $ 2,174,434,426 | $ 1,814,029,924 | $ 360,404,502 | $ - |
Income Tax Information |
At October 31, 2010, the Fund had a capital loss carryforward of approximately $98,628,962 of which $63,392,256 and $35,236,706 will expire on Octo-ber 31, 2016 and 2017, respectively. Capital loss carryforwards are only available to offset future capital gains of the Fund to the extent provided by regulations and may be limited. |
See accompanying notes which are an integral part of the financial statements.
Annual Report
Fidelity China Region Fund
Statement of Assets and Liabilities
| October 31, 2010 |
| | |
Assets | | |
Investment in securities, at value (including securities loaned of $10,904,815) - See accompanying schedule: Unaffiliated issuers (cost $1,524,284,829) | $ 2,088,737,295 | |
Fidelity Central Funds (cost $85,697,131) | 85,697,131 | |
Total Investments (cost $1,609,981,960) | | $ 2,174,434,426 |
Receivable for investments sold | | 6,262,368 |
Receivable for fund shares sold | | 4,252,327 |
Dividends receivable | | 316,915 |
Distributions receivable from Fidelity Central Funds | | 32,232 |
Other receivables | | 379,542 |
Total assets | | 2,185,677,810 |
| | |
Liabilities | | |
Payable for investments purchased | $ 8,676,527 | |
Payable for fund shares redeemed | 1,327,650 | |
Accrued management fee | 1,262,835 | |
Distribution and service plan fees payable | 12,629 | |
Other affiliated payables | 465,006 | |
Other payables and accrued expenses | 243,621 | |
Collateral on securities loaned, at value | 11,164,250 | |
Total liabilities | | 23,152,518 |
| | |
Net Assets | | $ 2,162,525,292 |
Net Assets consist of: | | |
Paid in capital | | $ 1,682,005,306 |
Undistributed net investment income | | 25,575,304 |
Accumulated undistributed net realized gain (loss) on investments and foreign currency transactions | | (109,507,734) |
Net unrealized appreciation (depreciation) on investments and assets and liabilities in foreign currencies | | 564,452,416 |
Net Assets | | $ 2,162,525,292 |
Statement of Assets and Liabilities - continued
| October 31, 2010 |
| | |
Calculation of Maximum Offering Price Class A:
Net Asset Value and redemption price per share ($16,047,242 ÷ 507,608 shares) | | $ 31.61 |
| | |
Maximum offering price per share (100/94.25 of $31.61) | | $ 33.54 |
Class T:
Net Asset Value and redemption price per share ($6,069,809 ÷ 192,817 shares) | | $ 31.48 |
| | |
Maximum offering price per share (100/96.50 of $31.48) | | $ 32.62 |
Class B:
Net Asset Value and offering price per share ($2,495,982 ÷ 79,921 shares) A | | $ 31.23 |
| | |
Class C:
Net Asset Value and offering price per share ($5,938,380 ÷ 190,411 shares) A | | $ 31.19 |
| | |
China Region:
Net Asset Value, offering price and redemption price per share ($2,130,070,228 ÷ 66,960,488 shares) | | $ 31.81 |
| | |
Institutional Class:
Net Asset Value, offering price and redemption price per share ($1,903,651 ÷ 59,886 shares) | | $ 31.79 |
A Redemption price per share is equal to net asset value less any applicable contingent deferred sales charge.
See accompanying notes which are an integral part of the financial statements.
Annual Report
Statement of Operations
| Year ended October 31, 2010 |
| | |
Investment Income | | |
Dividends | | $ 51,267,009 |
Interest | | 839 |
Income from Fidelity Central Funds | | 512,014 |
Income before foreign taxes withheld | | 51,779,862 |
Less foreign taxes withheld | | (4,706,256) |
Total income | | 47,073,606 |
| | |
Expenses | | |
Management fee | $ 15,034,894 | |
Transfer agent fees | 5,059,284 | |
Distribution and service plan fees | 128,222 | |
Accounting and security lending fees | 936,699 | |
Custodian fees and expenses | 1,216,014 | |
Independent trustees' compensation | 12,021 | |
Registration fees | 161,631 | |
Audit | 68,420 | |
Legal | 14,413 | |
Interest | 3,369 | |
Miscellaneous | 27,343 | |
Total expenses before reductions | 22,662,310 | |
Expense reductions | (1,286,872) | 21,375,438 |
Net investment income (loss) | | 25,698,168 |
Realized and Unrealized Gain (Loss) Net realized gain (loss) on: | | |
Investment securities: | | |
Unaffiliated issuers | 87,323,739 | |
Foreign currency transactions | (268,927) | |
Capital gain distributions from Fidelity Central Funds | 1,892 | |
Total net realized gain (loss) | | 87,056,704 |
Change in net unrealized appreciation (depreciation) on: Investment securities | 253,069,310 | |
Assets and liabilities in foreign currencies | 27 | |
Total change in net unrealized appreciation (depreciation) | | 253,069,337 |
Net gain (loss) | | 340,126,041 |
Net increase (decrease) in net assets resulting from operations | | $ 365,824,209 |
Statement of Changes in Net Assets
| Year ended
October 31,
2010 | Year ended
October 31,
2009 |
Increase (Decrease) in Net Assets | | |
Operations | | |
Net investment income (loss) | $ 25,698,168 | $ 19,321,348 |
Net realized gain (loss) | 87,056,704 | (37,545,495) |
Change in net unrealized appreciation (depreciation) | 253,069,337 | 584,945,489 |
Net increase (decrease) in net assets resulting from operations | 365,824,209 | 566,721,342 |
Distributions to shareholders from net investment income | (17,788,313) | (7,631,813) |
Distributions to shareholders from net realized gain | (5,540,851) | - |
Total distributions | (23,329,164) | (7,631,813) |
Share transactions - net increase (decrease) | (341,589,636) | 858,935,262 |
Redemption fees | 1,093,238 | 1,318,632 |
Total increase (decrease) in net assets | 1,998,647 | 1,419,343,423 |
| | |
Net Assets | | |
Beginning of period | 2,160,526,645 | 741,183,222 |
End of period (including undistributed net investment income of $25,575,304 and undistributed net investment income of $17,665,449, respectively) | $ 2,162,525,292 | $ 2,160,526,645 |
See accompanying notes which are an integral part of the financial statements.
Annual Report
Financial Highlights - Class A
Years ended October 31, | 2010 | 2009 | 2008 H |
Selected Per-Share Data | | | |
Net asset value, beginning of period | $ 26.47 | $ 16.67 | $ 29.28 |
Income from Investment Operations | | | |
Net investment income (loss) E | .25 | .30 | .28 |
Net realized and unrealized gain (loss) | 5.15 | 9.63 | (12.91) |
Total from investment operations | 5.40 | 9.93 | (12.63) |
Distributions from net investment income | (.20) | (.16) | - |
Distributions from net realized gain | (.07) | - | - |
Total distributions | (.27) | (.16) | - |
Redemption fees added to paid in capital E | .01 | .03 | .02 |
Net asset value, end of period | $ 31.61 | $ 26.47 | $ 16.67 |
Total Return B, C, D | 20.54% | 60.41% | (43.07)% |
Ratios to Average Net Assets F, I | | | |
Expenses before reductions | 1.38% | 1.39% | 1.44% A |
Expenses net of fee waivers, if any | 1.38% | 1.39% | 1.44% A |
Expenses net of all reductions | 1.31% | 1.31% | 1.30% A |
Net investment income (loss) | .91% | 1.27% | 2.63% A |
Supplemental Data | | | |
Net assets, end of period (000 omitted) | $ 16,047 | $ 11,842 | $ 340 |
Portfolio turnover rate G | 57% | 88% | 133% |
A Annualized
B Total returns for periods of less than one year are not annualized.
C Total returns would have been lower had certain expenses not been reduced during the periods shown.
D Total returns do not include the effect of the sales charges.
E Calculated based on average shares outstanding during the period.
F Fees and expenses of the underlying Fidelity Central Funds are not included in the Fund's expense ratio. The Fund indirectly bears its proportionate share of the expenses of any underlying Fidelity Central Funds.
G Amount does not include the portfolio activity of any underlying Fidelity Central Funds.
H For the period May 9, 2008 (commencement of sale of shares) to October 31, 2008.
I Expense ratios reflect operating expenses of the class. Expenses before reductions do not reflect amounts reimbursed by the investment adviser or reductions from brokerage service arrangements or reductions from other expense offset arrangements and do not represent the amount paid by the class during periods when reimbursements or reductions occur. Expense ratios before reductions for start-up periods may not be representative of longer-term operating periods. Expenses net of fee waivers reflect expenses after reimbursement by the investment adviser but prior to reductions from brokerage service arrangements or other expense offset arrangements. Expenses net of all reductions represent the net expenses paid by the class.
Financial Highlights - Class T
Years ended October 31, | 2010 | 2009 | 2008 H |
Selected Per-Share Data | | | |
Net asset value, beginning of period | $ 26.40 | $ 16.65 | $ 29.28 |
Income from Investment Operations | | | |
Net investment income (loss) E | .18 | .23 | .26 |
Net realized and unrealized gain (loss) | 5.13 | 9.64 | (12.91) |
Total from investment operations | 5.31 | 9.87 | (12.65) |
Distributions from net investment income | (.18) | (.14) | - |
Distributions from net realized gain | (.07) | - | - |
Total distributions | (.24) J | (.14) | - |
Redemption fees added to paid in capital E | .01 | .02 | .02 |
Net asset value, end of period | $ 31.48 | $ 26.40 | $ 16.65 |
Total Return B, C, D | 20.27% | 59.92% | (43.14)% |
Ratios to Average Net Assets F, I | | | |
Expenses before reductions | 1.64% | 1.66% | 1.68% A |
Expenses net of fee waivers, if any | 1.64% | 1.66% | 1.68% A |
Expenses net of all reductions | 1.58% | 1.58% | 1.53% A |
Net investment income (loss) | .64% | 1.00% | 2.40% A |
Supplemental Data | | | |
Net assets, end of period (000 omitted) | $ 6,070 | $ 3,139 | $ 107 |
Portfolio turnover rate G | 57% | 88% | 133% |
A Annualized
B Total returns for periods of less than one year are not annualized.
C Total returns would have been lower had certain expenses not been reduced during the periods shown.
D Total returns do not include the effect of the sales charges.
E Calculated based on average shares outstanding during the period.
F Fees and expenses of the underlying Fidelity Central Funds are not included in the Fund's expense ratio. The Fund indirectly bears its proportionate share of the expenses of any underlying Fidelity Central Funds.
G Amount does not include the portfolio activity of any underlying Fidelity Central Funds.
H For the period May 9, 2008 (commencement of sale of shares) to October 31, 2008.
I Expense ratios reflect operating expenses of the class. Expenses before reductions do not reflect amounts reimbursed by the investment adviser or reductions from brokerage service arrangements or reductions from other expense offset arrangements and do not represent the amount paid by the class during periods when reimbursements or reductions occur. Expense ratios before reductions for start-up periods may not be representative of longer-term operating periods. Expenses net of fee waivers reflect expenses after reimbursement by the investment adviser but prior to reductions from brokerage service arrangements or other expense offset arrangements. Expenses net of all reductions represent the net expenses paid by the class.
J Total distributions of $.24 per share is comprised of distributions from net investment income of $.177 and distributions from net realized gain of $.065 per share.
See accompanying notes which are an integral part of the financial statements.
Annual Report
Financial Highlights - Class B
Years ended October 31, | 2010 | 2009 | 2008 H |
Selected Per-Share Data | | | |
Net asset value, beginning of period | $ 26.28 | $ 16.61 | $ 29.28 |
Income from Investment Operations | | | |
Net investment income (loss) E | .04 | .12 | .20 |
Net realized and unrealized gain (loss) | 5.09 | 9.63 | (12.89) |
Total from investment operations | 5.13 | 9.75 | (12.69) |
Distributions from net investment income | (.12) | (.10) | - |
Distributions from net realized gain | (.07) | - | - |
Total distributions | (.19) | (.10) | - |
Redemption fees added to paid in capital E | .01 | .02 | .02 |
Net asset value, end of period | $ 31.23 | $ 26.28 | $ 16.61 |
Total Return B, C, D | 19.63% | 59.16% | (43.27)% |
Ratios to Average Net Assets F, I | | | |
Expenses before reductions | 2.14% | 2.15% | 2.17% A |
Expenses net of fee waivers, if any | 2.14% | 2.15% | 2.17% A |
Expenses net of all reductions | 2.08% | 2.06% | 2.02% A |
Net investment income (loss) | .14% | .51% | 1.91% A |
Supplemental Data | | | |
Net assets, end of period (000 omitted) | $ 2,496 | $ 1,915 | $ 155 |
Portfolio turnover rate G | 57% | 88% | 133% |
A Annualized
B Total returns for periods of less than one year are not annualized.
C Total returns would have been lower had certain expenses not been reduced during the periods shown.
D Total returns do not include the effect of the contingent deferred sales charge.
E Calculated based on average shares outstanding during the period.
F Fees and expenses of the underlying Fidelity Central Funds are not included in the Fund's expense ratio. The Fund indirectly bears its proportionate share of the expenses of any underlying Fidelity Central Funds.
G Amount does not include the portfolio activity of any underlying Fidelity Central Funds.
H For the period May 9, 2008 (commencement of sale of shares) to October 31, 2008.
I Expense ratios reflect operating expenses of the class. Expenses before reductions do not reflect amounts reimbursed by the investment adviser or reductions from brokerage service arrangements or reductions from other expense offset arrangements and do not represent the amount paid by the class during periods when reimbursements or reductions occur. Expense ratios before reductions for start-up periods may not be representative of longer-term operating periods. Expenses net of fee waivers reflect expenses after reimbursement by the investment adviser but prior to reductions from brokerage service arrangements or other expense offset arrangements. Expenses net of all reductions represent the net expenses paid by the class.
Financial Highlights - Class C
Years ended October 31, | 2010 | 2009 | 2008 H |
Selected Per-Share Data | | | |
Net asset value, beginning of period | $ 26.25 | $ 16.61 | $ 29.28 |
Income from Investment Operations | | | |
Net investment income (loss) E | .04 | .12 | .20 |
Net realized and unrealized gain (loss) | 5.09 | 9.62 | (12.89) |
Total from investment operations | 5.13 | 9.74 | (12.69) |
Distributions from net investment income | (.13) | (.12) | - |
Distributions from net realized gain | (.07) | - | - |
Total distributions | (.20) | (.12) | - |
Redemption fees added to paid in capital E | .01 | .02 | .02 |
Net asset value, end of period | $ 31.19 | $ 26.25 | $ 16.61 |
Total Return B, C, D | 19.66% | 59.18% | (43.27)% |
Ratios to Average Net Assets F, I | | | |
Expenses before reductions | 2.14% | 2.15% | 2.13% A |
Expenses net of fee waivers, if any | 2.14% | 2.15% | 2.13% A |
Expenses net of all reductions | 2.07% | 2.07% | 1.98% A |
Net investment income (loss) | .15% | .51% | 1.95% A |
Supplemental Data | | | |
Net assets, end of period (000 omitted) | $ 5,938 | $ 3,806 | $ 233 |
Portfolio turnover rate G | 57% | 88% | 133% |
A Annualized
B Total returns for periods of less than one year are not annualized.
C Total returns would have been lower had certain expenses not been reduced during the periods shown.
D Total returns do not include the effect of the contingent deferred sales charge.
E Calculated based on average shares outstanding during the period.
F Fees and expenses of the underlying Fidelity Central Funds are not included in the Fund's expense ratio. The Fund indirectly bears its proportionate share of the expenses of any underlying Fidelity Central Funds.
G Amount does not include the portfolio activity of any underlying Fidelity Central Funds.
H For the period May 9, 2008 (commencement of sale of shares) to October 31, 2008.
I Expense ratios reflect operating expenses of the class. Expenses before reductions do not reflect amounts reimbursed by the investment adviser or reductions from brokerage service arrangements or reductions from other expense offset arrangements and do not represent the amount paid by the class during periods when reimbursements or reductions occur. Expense ratios before reductions for start-up periods may not be representative of longer-term operating periods. Expenses net of fee waivers reflect expenses after reimbursement by the investment adviser but prior to reductions from brokerage service arrangements or other expense offset arrangements. Expenses net of all reductions represent the net expenses paid by the class.
See accompanying notes which are an integral part of the financial statements.
Annual Report
Financial Highlights - China Region
Years ended October 31, | 2010 | 2009 | 2008 | 2007 | 2006 |
Selected Per-Share Data | | | | | |
Net asset value, beginning of period | $ 26.55 | $ 16.69 | $ 41.52 | $ 22.94 | $ 17.74 |
Income from Investment Operations | | | | | |
Net investment income (loss) B | .34 | .33 | .39 | .46 | .42 |
Net realized and unrealized gain (loss) | 5.18 | 9.68 | (20.42) | 18.58 | 4.99 |
Total from investment operations | 5.52 | 10.01 | (20.03) | 19.04 | 5.41 |
Distributions from net investment income | (.21) | (.17) | (.32) | (.29) | (.22) |
Distributions from net realized gain | (.07) | - | (4.53) | (.20) | - |
Total distributions | (.27) F | (.17) | (4.85) | (.49) | (.22) |
Redemption fees added to paid in capital B | .01 | .02 | .05 | .03 | .01 |
Net asset value, end of period | $ 31.81 | $ 26.55 | $ 16.69 | $ 41.52 | $ 22.94 |
Total Return A | 20.97% | 60.77% | (53.75)% | 84.73% | 30.83% |
Ratios to Average Net Assets C, E | | | | | |
Expenses before reductions | 1.06% | 1.12% | 1.11% | 1.08% | 1.14% |
Expenses net of fee waivers, if any | 1.06% | 1.12% | 1.11% | 1.08% | 1.14% |
Expenses net of all reductions | 1.00% | 1.03% | .96% | .92% | 1.08% |
Net investment income (loss) | 1.22% | 1.54% | 1.45% | 1.64% | 1.99% |
Supplemental Data | | | | | |
Net assets, end of period (000 omitted) | $ 2,130,070 | $ 2,138,141 | $ 740,289 | $ 2,044,527 | $ 734,793 |
Portfolio turnover rate D | 57% | 88% | 133% | 173% | 36% |
A Total returns would have been lower had certain expenses not been reduced during the periods shown.
B Calculated based on average shares outstanding during the period.
C Fees and expenses of the underlying Fidelity Central Funds are not included in the Fund's expense ratio. The Fund indirectly bears its proportionate share of the expenses of any underlying Fidelity Central Funds.
D Amount does not include the portfolio activity of any underlying Fidelity Central Funds.
E Expense ratios reflect operating expenses of the class. Expenses before reductions do not reflect amounts reimbursed by the investment adviser or reductions from brokerage service arrangements or reductions from other expense offset arrangements and do not represent the amount paid by the class during periods when reimbursements or reductions occur. Expenses net of fee waivers reflect expenses after reimbursement by the investment adviser but prior to reductions from brokerage service arrangements or other expense offset arrangements. Expenses net of all reductions represent the net expenses paid by the class.
F Total distributions of $.27 per share is comprised of distributions from net investment income of $.209 and distributions from net realized gain of $.065 per share.
Financial Highlights - Institutional Class
Years ended October 31, | 2010 | 2009 | 2008 G |
Selected Per-Share Data | | | |
Net asset value, beginning of period | $ 26.55 | $ 16.70 | $ 29.28 |
Income from Investment Operations | | | |
Net investment income (loss) D | .33 | .37 | .34 |
Net realized and unrealized gain (loss) | 5.18 | 9.64 | (12.94) |
Total from investment operations | 5.51 | 10.01 | (12.60) |
Distributions from net investment income | (.22) | (.18) | - |
Distributions from net realized gain | (.07) | - | - |
Total distributions | (.28) I | (.18) | - |
Redemption fees added to paid in capital D | .01 | .02 | .02 |
Net asset value, end of period | $ 31.79 | $ 26.55 | $ 16.70 |
Total Return B, C | 20.92% | 60.78% | (42.96)% |
Ratios to Average Net Assets E, H | | | |
Expenses before reductions | 1.11% | 1.08% | 1.05% A |
Expenses net of fee waivers, if any | 1.11% | 1.08% | 1.05% A |
Expenses net of all reductions | 1.04% | 1.00% | .91% A |
Net investment income (loss) | 1.18% | 1.58% | 3.02% A |
Supplemental Data | | | |
Net assets, end of period (000 omitted) | $ 1,904 | $ 1,684 | $ 60 |
Portfolio turnover rate F | 57% | 88% | 133% |
A Annualized
B Total returns for periods of less than one year are not annualized.
C Total returns would have been lower had certain expenses not been reduced during the periods shown.
D Calculated based on average shares outstanding during the period.
E Fees and expenses of the underlying Fidelity Central Funds are not included in the Fund's expense ratio. The Fund indirectly bears its proportionate share of the expenses of any underlying Fidelity Central Funds.
F Amount does not include the portfolio activity of any underlying Fidelity Central Funds.
G For the period May 9, 2008 (commencement of sale of shares) to October 31, 2008.
H Expense ratios reflect operating expenses of the class. Expenses before reductions do not reflect amounts reimbursed by the investment adviser or reductions from brokerage service arrangements or reductions from other expense offset arrangements and do not represent the amount paid by the class during periods when reimbursements or reductions occur. Expense ratios before reductions for start-up periods may not be representative of longer-term operating periods. Expenses net of fee waivers reflect expenses after reimbursement by the investment adviser but prior to reductions from brokerage service arrangements or other expense offset arrangements. Expenses net of all reductions represent the net expenses paid by the class.
I Total distributions of $.28 per share is comprised of distributions from net investment income of $.216 and distributions from net realized gain of $.065 per share.
See accompanying notes which are an integral part of the financial statements.
Annual Report
Notes to Financial Statements
For the period ended October 31, 2010
1. Organization.
Fidelity China Region Fund (the Fund) is a fund of Fidelity Investment Trust (the Trust) and is authorized to issue an unlimited number of shares. The Trust is registered under the Investment Company Act of 1940, as amended (the 1940 Act), as an open-end management investment company organized as a Massachusetts business trust. The Fund offers Class A, Class T, Class C, China Region and Institutional Class shares, each of which has equal rights as to assets and voting privileges. Effective after the close of business on September 1, 2010, Class B shares were closed to new accounts and additional purchases by existing shareholders. Each class has exclusive voting rights with respect to matters that affect that class. Class B shares will automatically convert to Class A shares after a holding period of seven years from the initial date of purchase. Investment income, realized and unrealized capital gains and losses, the common expenses of the Fund, and certain fund-level expense reductions, if any, are allocated on a pro-rata basis to each class based on the relative net assets of each class to the total net assets of the Fund. Each class differs with respect to transfer agent and distribution and service plan fees incurred. Certain expense reductions also differ by class. The Fund's investments in emerging markets can be subject to social, economic, regulatory, and political uncertainties and can be extremely volatile.
2. Investments in Fidelity Central Funds.
The Fund may invest in Fidelity Central Funds, which are open-end investment companies available only to other investment companies and accounts managed by Fidelity Management & Research Company (FMR) and its affiliates. The Fund's Schedule of Investments lists each of the Fidelity Central Funds held as of period end, if any, as an investment of the Fund, but does not include the underlying holdings of each Fidelity Central Fund. As an Investing Fund, the Fund indirectly bears its proportionate share of the expenses of the underlying Fidelity Central Funds.
The Money Market Central Funds seek preservation of capital and current income and are managed by Fidelity Investments Money Management, Inc. (FIMM), an affiliate of FMR.
A complete unaudited list of holdings for each Fidelity Central Fund is available upon request or at the Securities and Exchange Commission (the SEC) web site at www.sec.gov. In addition, the financial statements of the Fidelity Central Funds, which are not covered by the Fund's Report of Independent Registered Public Accounting Firm, are available on the SEC web site or upon request.
3. Significant Accounting Policies.
The financial statements have been prepared in conformity with accounting principles generally accepted in the United States of America (GAAP), which require management to make certain estimates and assumptions at the date of the financial statements. Actual results could differ from those estimates. The following summarizes the significant accounting policies of the Fund:
Security Valuation. Investments are valued as of 4:00 p.m. Eastern time on the last calendar day of the period. The Fund uses independent pricing services approved by the Board of Trustees to value its investments. When current market prices or quotations are not readily available or reliable, valuations may be determined in good faith in accordance with procedures adopted by the Board of Trustees. Factors used in determining value may include market or security specific events. The frequency with which these procedures are used cannot be predicted and they may be utilized to a significant extent. The value used for net asset value (NAV) calculation under these procedures may differ from published prices for the same securities.
The Fund categorizes the inputs to valuation techniques used to value its investments into a disclosure hierarchy consisting of three levels as shown below.
Level 1 - quoted prices in active markets for identical investments
Level 2 - other significant observable inputs (including quoted prices for similar investments, interest rates, prepayment speeds, etc.)
Level 3 - unobservable inputs (including the fund's own assumptions based on the best information available)
Changes in valuation techniques may result in transfers in or out of an assigned level within the disclosure hierarchy. Valuation techniques used to value the Fund's investments by major category are as follows.
Equity securities, including restricted securities, for which market quotations are readily available, are valued at the last reported sale price or official closing price as reported by an independent pricing service on the primary market or exchange on which they are traded and are categorized as Level 1 in the hierarchy. In the event there were no sales during the day or closing prices are not available, securities are valued at the last quoted bid price or may be valued using the last available price and are generally categorized as Level 2 in the hierarchy. For foreign equity securities, when significant market or security specific events arise, comparisons to the valuation of American Depositary Receipts (ADRs), futures contracts, Exchange-traded funds (ETFs) and certain indexes as well as quoted prices for similar securities are used and are categorized as Level 2 in the hierarchy in these circumstances. Utilizing these techniques may result in significant transfers between Level 1 and Level 2. For restricted equity securities and private placements where observable inputs are limited, assumptions about market activity and risk are used and are categorized as Level 3 in the hierarchy.
Annual Report
3. Significant Accounting Policies - continued
Security Valuation - continued
Investments in open-end mutual funds, including the Fidelity Central Funds, are valued at their closing net asset value each business day and are categorized as Level 1 in the hierarchy. Short-term securities with remaining maturities of sixty days or less for which quotations are not readily available are valued at amortized cost, which approximates fair value and are categorized as Level 2 in the hierarchy.
Foreign Currency. The Fund uses foreign currency contracts to facilitate transactions in foreign-denominated securities. Gains and losses from these transactions may arise from changes in the value of the foreign currency or if the counterparties do not perform under the contracts' terms.
Foreign-denominated assets, including investment securities, and liabilities are translated into U.S. dollars at the exchange rate at period end. Purchases and sales of investment securities, income and dividends received and expenses denominated in foreign currencies are translated into U.S. dollars at the exchange rate in effect on the transaction date.
The effects of exchange rate fluctuations on investments are included with the net realized and unrealized gain (loss) on investment securities. Other foreign currency transactions resulting in realized and unrealized gain (loss) are disclosed separately.
Investment Transactions and Income. For financial reporting purposes, the Fund's investment holdings and NAV include trades executed through the end of the last business day of the period. The NAV per share for processing shareholder transactions is calculated as of the close of business of the New York Stock Exchange (NYSE), normally 4:00 p.m. Eastern time and includes trades executed through the end of the prior business day. Gains and losses on securities sold are determined on the basis of identified cost. Dividend income is recorded on the ex-dividend date, except for certain dividends from foreign securities where the ex-dividend date may have passed, which are recorded as soon as the Fund is informed of the ex-dividend date. Non-cash dividends included in dividend income, if any, are recorded at the fair market value of the securities received. Distributions received on securities that represent a return of capital or capital gain are recorded as a reduction of cost of investments and/or as a realized gain. The Fund estimates the components of distributions received that may be considered return of capital distributions or capital gain distributions. Interest income and distributions from the Fidelity Central Funds are accrued as earned. Interest income includes coupon interest and amortization of premium and accretion of discount on debt securities. Investment income is recorded net of foreign taxes withheld where recovery of such taxes is uncertain.
Expenses. Most expenses of the Trust can be directly attributed to a fund. Expenses which cannot be directly attributed are apportioned amongst each fund in the Trust. Expense estimates are accrued in the period to which they relate and adjustments are made when actual amounts are known.
Income Tax Information and Distributions to Shareholders. Each year, the Fund intends to qualify as a regulated investment company, including distributing substantially all of its taxable income and realized gains under Subchapter M of the Internal Revenue Code and filing its U.S. federal tax return. As a result, no provision for income taxes is required. As of October 31, 2010, the Fund did not have any unrecognized tax benefits in the accompanying financial statements. A fund's federal tax return is subject to examination by the Internal Revenue Service (IRS) for a period of three years. Foreign taxes are provided for based on the Fund's understanding of the tax rules and rates that exist in the foreign markets in which it invests.
Distributions are declared and recorded on the ex-dividend date. Income dividends and capital gain distributions are declared separately for each class. Income and capital gain distributions are determined in accordance with income tax regulations, which may differ from GAAP.
Capital accounts within the financial statements are adjusted for permanent book-tax differences. These adjustments have no impact on net assets or the results of operations. Temporary book-tax differences will reverse in a subsequent period.
Book-tax differences are primarily due to the short term gain distributions from Fidelity Central Funds, foreign currency transactions, passive foreign investment companies (PFIC), capital loss carryforwards, and losses deferred due to wash sales.
The federal tax cost of investment securities and unrealized appreciation (depreciation) as of period end were as follows:
Gross unrealized appreciation | $ 570,685,518 |
Gross unrealized depreciation | (18,690,935) |
Net unrealized appreciation (depreciation) | $ 551,994,583 |
| |
Tax Cost | $ 1,622,439,843 |
The tax-based components of distributable earnings as of period end were as follows:
Undistributed ordinary income | $ 27,154,415 |
Capital loss carryforward | $ (98,628,962) |
Net unrealized appreciation (depreciation) | $ 551,994,533 |
Annual Report
Notes to Financial Statements - continued
3. Significant Accounting Policies - continued
Income Tax Information and Distributions to Shareholders - continued
The tax character of distributions paid was as follows:
| October 31, 2010 | October 31, 2009 |
Ordinary Income | $ 23,329,164 | $ 7,631,813 |
Short-Term Trading (Redemption) Fees. Shares held by investors in the Fund less than 90 days are subject to a redemption fee equal to 1.50% of the net asset value of shares redeemed. All redemption fees, which reduce the proceeds of the shareholder redemption, are retained by the Fund and accounted for as an addition to paid in capital.
4. Purchases and Sales of Investments.
Purchases and sales of securities, other than short-term securities, aggregated $1,178,264,344 and $1,564,472,776, respectively.
5. Fees and Other Transactions with Affiliates.
Management Fee. FMR and its affiliates provide the Fund with investment management related services for which the Fund pays a monthly management fee. The management fee is the sum of an individual fund fee rate that is based on an annual rate of .45% of the Fund's average net assets and a group fee rate that averaged .26% during the period. The group fee rate is based upon the average net assets of all the mutual funds advised by FMR. The group fee rate decreases as assets under management increase and increases as assets under management decrease. For the period, the total annual management fee rate was .71% of the Fund's average net assets.
Distribution and Service Plan Fees. In accordance with Rule 12b-1 of the 1940 Act, the Fund has adopted separate Distribution and Service Plans for each class of shares. Certain classes pay Fidelity Distributors Corporation (FDC), an affiliate of FMR, separate Distribution and Service Fees, each of which is based on an annual percentage of each class' average net assets. In addition, FDC may pay financial intermediaries for selling shares of the Fund and providing shareholder support services. For the period, the Distribution and Service Fee rates, total fees and amounts retained by FDC were as follows:
| Distribution
Fee | Service
Fee | Paid to
FDC | Retained
by FDC |
Class A | 0% | .25% | $ 34,107 | $ 571 |
Class T | .25% | .25% | 23,236 | - |
Class B | .75% | .25% | 22,523 | 16,917 |
Class C | .75% | .25% | 48,356 | 25,041 |
| | | $ 128,222 | $ 42,529 |
Sales Load. FDC receives a front-end sales charge of up to 5.75% for selling Class A shares, and 3.50% for selling Class T shares, some of which is paid to financial intermediaries for selling shares of the Fund. FDC receives the proceeds of contingent deferred sales charges levied on Class A, Class T, Class B, and Class C redemptions. These charges depend on the holding period. The deferred sales charges range from 5% to 1% for Class B, 1% for Class C, 1.00% for certain purchases of Class A shares (1.00% to .50% prior to July 12, 2010) and .25% for certain purchases of Class T shares.
For the period, sales charge amounts retained by FDC were as follows:
| Retained
by FDC |
Class A | $ 26,257 |
Class T | 4,876 |
Class B* | 4,727 |
Class C* | 1,934 |
| $ 37,794 |
* When Class B and Class C shares are initially sold, FDC pays commissions from its own resources to financial intermediaries through which the sales are made.
Transfer Agent Fees. Fidelity Investments Institutional Operations Company, Inc. (FIIOC), an affiliate of FMR, is the transfer, dividend disbursing and shareholder servicing agent for each class of the Fund. FIIOC receives account fees and asset-based fees that vary according to the account size and type of account of the shareholders of the respective classes of the Fund. FIIOC pays for typesetting, printing and mailing of shareholder reports,
Annual Report
5. Fees and Other Transactions with Affiliates - continued
Transfer Agent Fees - continued
except proxy statements. For the period, transfer agent fees for each class were as follows:
| Amount | % of
Average
Net Assets |
Class A | $ 40,906 | .30 |
Class T | 14,660 | .31 |
Class B | 7,069 | .31 |
Class C | 15,003 | .31 |
China Region | 4,977,237 | .24 |
Institutional Class | 4,409 | .28 |
| $ 5,059,284 | |
Accounting and Security Lending Fees. Fidelity Service Company, Inc. (FSC), an affiliate of FMR, maintains the Fund's accounting records. The accounting fee is based on the level of average net assets for the month. Under a separate contract, FSC administers the security lending program. The security lending fee is based on the number and duration of lending transactions.
Brokerage Commissions. The fund placed a portion of its portfolio transactions with brokerage firms which are affiliates of the investment advisor. The commissions paid to these affiliated firms were $286 for the period.
Interfund Lending Program. Pursuant to an Exemptive Order issued by the SEC, the Fund, along with other registered investment companies having management contracts with FMR, may participate in an interfund lending program. This program provides an alternative credit facility allowing the funds to borrow from, or lend money to, other participating affiliated funds. At period end, there were no interfund loans outstanding. The Fund's activity in this program during the period for which loans were outstanding was as follows:
Borrower or Lender | Average Daily Loan Balance | Weighted Average Interest Rate | Interest
Expense |
Borrower | $ 12,377,773 | .45% | $ 3,369 |
6. Committed Line of Credit.
The Fund participates with other funds managed by FMR or an affiliate in a $3.75 billion credit facility (the "line of credit") to be utilized for temporary or emergency purposes to fund shareholder redemptions or for other short-term liquidity purposes. The Fund has agreed to pay commitment fees on its pro-rata portion of the line of credit, which amounted to $8,385 and is reflected in Miscellaneous expenses on the Statement of Operations. During the period, there were no borrowings on this line of credit.
7. Security Lending.
The Fund lends portfolio securities through a lending agent from time to time in order to earn additional income. The lending agent may loan securities to certain qualified borrowers, including Fidelity Capital Market (FCM), a broker-dealer affiliated with the Fund. On the settlement date of the loan, the Fund receives collateral (in the form of U.S. Treasury obligations, letters of credit and/or cash) against the loaned securities and maintains collateral in an amount not less than 100% of the market value of the loaned securities during the period of the loan. The market value of the loaned securities is determined at the close of business of the Fund and any additional required collateral is delivered to the Fund on the next business day. If the borrower defaults on its obligation to return the securities loaned because of insolvency or other reasons, a fund could experience delays and costs in recovering the securities loaned or in gaining access to the collateral. Any cash collateral received is invested in the Fidelity Securities Lending Cash Central Fund. The value of loaned securities and cash collateral at period end are disclosed on the Fund's Statement of Assets and Liabilities. Security lending income represents the income earned on investing cash collateral, less rebates paid to borrowers and lending agent fees associated with the loan, plus any premium payments received for lending certain types of securities. Security lending income is presented in the Statement of Operations as a component of income from Fidelity Central Funds. Total security lending income during the period amounted to $439,269. During the period, there were no securities loaned to FCM.
8. Expense Reductions.
Many of the brokers with whom FMR places trades on behalf of the Fund provided services to the Fund in addition to trade execution. These services included payments of certain expenses on behalf of the Fund totaling $1,286,872 for the period.
Annual Report
Notes to Financial Statements - continued
9. Distributions to Shareholders.
Distributions to shareholders of each class were as follows:
Years ended October 31, | 2010 | 2009 |
From net investment income | | |
Class A | $ 99,129 | $ 4,014 |
Class T | 24,223 | 973 |
Class B | 9,817 | 969 |
Class C | 22,748 | 1,793 |
China Region | 17,620,183 | 7,623,415 |
Institutional Class | 12,213 | 649 |
Total | $ 17,788,313 | $ 7,631,813 |
From net realized gain | | |
Class A | $ 32,057 | $ - |
Class T | 8,895 | - |
Class B | 5,146 | - |
Class C | 11,118 | - |
China Region | 5,479,960 | - |
Institutional Class | 3,675 | - |
Total | $ 5,540,851 | $ - |
10. Share Transactions.
Transactions for each class of shares were as follows:
| Shares | Dollars |
Years ended October 31, | 2010 | 2009 | 2010 | 2009 |
Class A | | | | |
Shares sold | 342,123 | 476,918 | $ 9,544,171 | $ 10,951,377 |
Reinvestment of distributions | 4,199 | 220 | 118,611 | 3,532 |
Shares redeemed | (286,153) | (50,111) | (7,654,399) | (1,196,308) |
Net increase (decrease) | 60,169 | 427,027 | $ 2,008,383 | $ 9,758,601 |
Class T | | | | |
Shares sold | 132,233 | 124,214 | $ 3,681,750 | $ 2,764,790 |
Reinvestment of distributions | 1,158 | 61 | 32,661 | 973 |
Shares redeemed | (59,475) | (11,807) | (1,609,136) | (289,925) |
Net increase (decrease) | 73,916 | 112,468 | $ 2,105,275 | $ 2,475,838 |
Class B | | | | |
Shares sold | 41,380 | 76,310 | $ 1,126,249 | $ 1,715,391 |
Reinvestment of distributions | 486 | 60 | 13,648 | 969 |
Shares redeemed | (34,810) | (12,815) | (913,219) | (303,220) |
Net increase (decrease) | 7,056 | 63,555 | $ 226,678 | $ 1,413,140 |
Class C | | | | |
Shares sold | 121,441 | 162,651 | $ 3,346,120 | $ 3,650,852 |
Reinvestment of distributions | 1,162 | 112 | 32,596 | 1,793 |
Shares redeemed | (77,220) | (31,751) | (2,041,365) | (779,443) |
Net increase (decrease) | 45,383 | 131,012 | $ 1,337,351 | $ 2,873,202 |
China Region | | | | |
Shares sold | 29,402,822 | 54,595,118 | $ 826,039,335 | $ 1,249,255,109 |
Reinvestment of distributions | 782,007 | 454,390 | 22,169,887 | 7,297,501 |
Shares redeemed | (43,745,336) | (18,885,174) | (1,195,393,614) | (415,361,909) |
Net increase (decrease) | (13,560,507) | 36,164,334 | $ (347,184,392) | $ 841,190,701 |
Institutional Class | | | | |
Shares sold | 53,076 | 72,363 | $ 1,486,647 | $ 1,546,935 |
Reinvestment of distributions | 500 | 40 | 14,160 | 649 |
Shares redeemed | (57,102) | (12,559) | (1,583,738) | (323,804) |
Net increase (decrease) | (3,526) | 59,844 | $ (82,931) | $ 1,223,780 |
Annual Report
11. Other.
The Fund's organizational documents provide former and current trustees and officers with a limited indemnification against liabilities arising in connection with the performance of their duties to the Fund. In the normal course of business, the Fund may also enter into contracts that provide general indemnifications. The Fund's maximum exposure under these arrangements is unknown as this would be dependent on future claims that may be made against the Fund. The risk of material loss from such claims is considered remote.
Annual Report
Fidelity Emerging Asia Fund
Performance: The Bottom Line
Average annual total return reflects the change in the value of an investment, assuming reinvestment of the fund's distributions from dividend income and capital gains (the profits earned upon the sale of securities that have grown in value, if any) and assuming a constant rate of performance each year. The $10,000 table and the fund's returns do not reflect the deduction of taxes that a shareholder would pay on fund distributions or the redemption of fund shares. During periods of reimbursement by Fidelity, a fund's total return will be greater than it would be had the reimbursement not occurred. How a fund did yesterday is no guarantee of how it will do tomorrow.
Average Annual Total Returns
Periods ended October 31, 2010 | Past 1
year | Past 5
years | Past 10
years |
Fidelity Emerging Asia Fund | 27.93% | 14.36% | 12.35% |
$10,000 Over 10 Years
Let's say hypothetically that $10,000 was invested in Fidelity Emerging Asia Fund on October 31, 2000. The chart shows how the value of your investment would have changed, and also shows how the MSCI AC (All Country) Far East ex Japan Index performed over the same period.
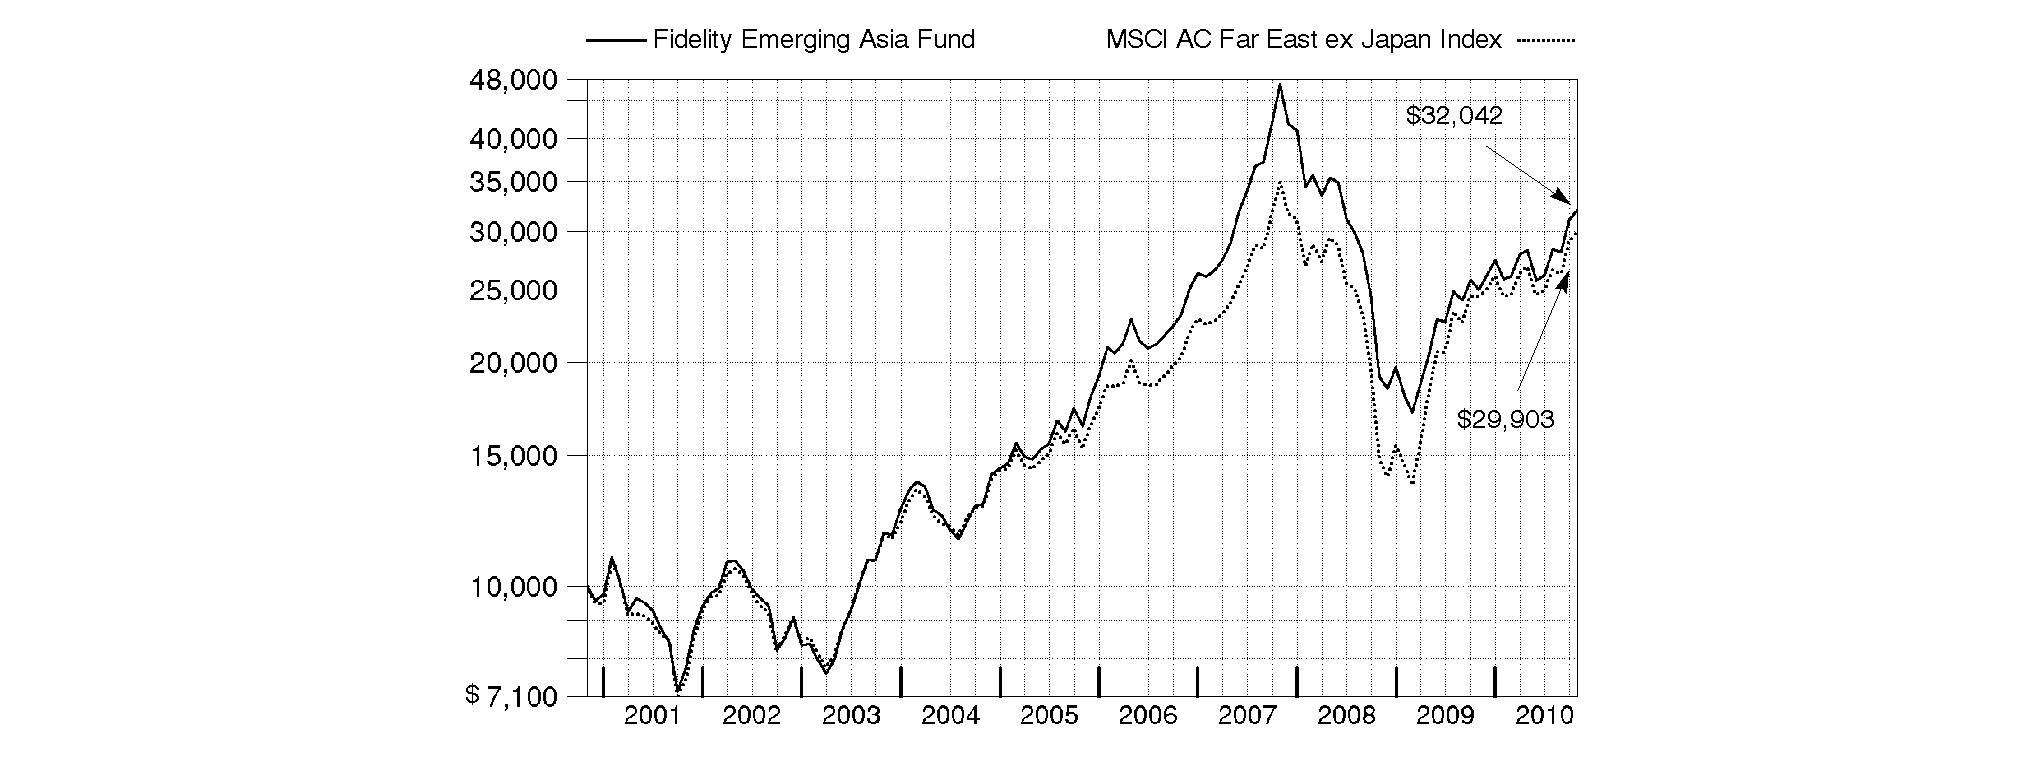
Annual Report
Fidelity Emerging Asia Fund
Management's Discussion of Fund Performance
Market Recap: International stocks rode a wave of volatility similar to that of their U.S. counterparts during the 12 months ending October 31, 2010. Stocks gained modestly in the first half of the period, despite growing concerns about the European debt crisis. Sentiment turned decidedly negative in May and June, however, and the market suffered a precipitous decline. These losses were more than offset during the last four months of the period, when signs of economic growth and subsiding debt fears helped propel international stocks about 21%. For the full year, the MSCI® ACWI® (All Country World Index) ex USA Index gained 12.76%, boosted in part by a generally depreciating U.S. dollar. Within the index, Canada and emerging markets were standouts, returning 23% and 24%, respectively. Results in the latter group were led by strong-performing India, Mexico and South Africa, while China fell short of the MSCI benchmark due to cooling economic growth. The developed Asia ex Japan segment rose 16% for the period, lifted by solid results from Singapore and Hong Kong. Meanwhile, Europe rose just 9%, held back mainly by debt-riddled Spain and Italy, as well as lagging major constituent France. Japan returned only 5%, a result of that nation's continued weak economy.
Comments from Colin Chickles, Portfolio Manager of Fidelity® Emerging Asia Fund: During the year, the fund returned 27.93%, versus 22.00% for the MSCI AC (All Country) Far East ex Japan Index. Positioning in financials and consumer discretionary helped drive the fund's outperformance. Geographically, my picks in China, Taiwan and Hong Kong stood out as positives. Thai coal miner Banpu benefited from robust demand for coal from China. Other contributors included CJ, a South Korean consumer products conglomerate, Korean automaker Kia Motors and Thai bank Thanachart Capital, the last of which I sold to lock in profits. Not owning index component KB Financial, Korea's largest bank, and timely ownership of Taiwan's MediaTek, a semiconductor company, also helped. Conversely, positioning in utilities modestly detracted, as did weak results from the fund's small stake in the United Kingdom - mostly accounted for by global bank HSBC Holdings, which originated in the Far East but now is based in London. Underweighting Korea's LG Chemical and not owning casino operator and benchmark constituent Genting Singapore also hurt, given their outperformance. In the case of Korea's Hyundai Engineering & Construction and shipbuilder Hyundai Heavy Industries, my timing was unrewarding, and I sold both stocks. Some stocks I've mentioned were out-of-index positions.
The views expressed above reflect those of the portfolio manager(s) only through the end of the period as stated on the cover of this report and do not necessarily represent the views of Fidelity or any other person in the Fidelity organization. Any such views are subject to change at any time based upon market or other conditions and Fidelity disclaims any responsibility to update such views. These views may not be relied on as investment advice and, because investment decisions for a Fidelity fund are based on numerous factors, may not be relied on as an indication of trading intent on behalf of any Fidelity fund.
Annual Report
Fidelity Emerging Asia Fund
Shareholder Expense Example
As a shareholder of the Fund, you incur two types of costs: (1) transaction costs, including redemption fees, and (2) ongoing costs, including management fees and other Fund expenses. This Example is intended to help you understand your ongoing costs (in dollars) of investing in the Fund and to compare these costs with the ongoing costs of investing in other mutual funds.
The Example is based on an investment of $1,000 invested at the beginning of the period and held for the entire period (May 1, 2010 to October 31, 2010).
Actual Expenses
The first line of the accompanying table provides information about actual account values and actual expenses. You may use the information in this line, together with the amount you invested, to estimate the expenses that you paid over the period. Simply divide your account value by $1,000.00 (for example, an $8,600 account value divided by $1,000.00 = 8.6), then multiply the result by the number in the first line under the heading entitled "Expenses Paid During Period" to estimate the expenses you paid on your account during this period. A small balance maintenance fee of $12.00 that is charged once a year may apply for certain accounts with a value of less than $2,000. This fee is not included in the table below. If it was, the estimate of expenses you paid during the period would be higher, and your ending account value lower, by this amount. In addition, the Fund, as a shareholder in the underlying Fidelity Central Funds, will indirectly bear its pro-rata share of the fees and expenses incurred by the underlying Fidelity Central Funds. These fees and expenses are not included in the Fund's annualized expense ratio used to calculate the expense estimate in the table below.
Hypothetical Example for Comparison Purposes
The second line of the accompanying table provides information about hypothetical account values and hypothetical expenses based on the Fund's actual expense ratio and an assumed rate of return of 5% per year before expenses, which is not the Fund's actual return. The hypothetical account values and expenses may not be used to estimate the actual ending account balance or expenses you paid for the period. You may use this information to compare the ongoing costs of investing in the Fund and other funds. To do so, compare this 5% hypothetical example with the 5% hypothetical examples that appear in the shareholder reports of the other funds. A small balance maintenance fee of $12.00 that is charged once a year may apply for certain accounts with a value of less than $2,000. This fee is not included in the table below. If it was, the estimate of expenses you paid during the period would be higher, and your ending account value lower, by this amount. In addition, the Fund, as a shareholder in the underlying Fidelity Central Funds, will indirectly bear its pro-rata share of the fees and expenses incurred by the underlying Fidelity Central Funds. These fees and expenses are not included in the Fund's annualized expense ratio used to calculate the expense estimate in the table below.
Please note that the expenses shown in the table are meant to highlight your ongoing costs only and do not reflect any transaction costs. Therefore, the second line of the table is useful in comparing ongoing costs only, and will not help you determine the relative total costs of owning different funds. In addition, if these transactional costs were included, your costs would have been higher.
| Annualized
Expense Ratio | Beginning
Account Value
May 1, 2010 | Ending
Account Value
October 31, 2010 | Expenses Paid
During Period*
May 1, 2010 to October 31, 2010 |
Actual | .79% | $ 1,000.00 | $ 1,131.90 | $ 4.25 |
Hypothetical (5% return per year before expenses) | | $ 1,000.00 | $ 1,021.22 | $ 4.02 |
* Expenses are equal to the Fund's annualized expense ratio, multiplied by the average account value over the period, multiplied by 184/365 (to reflect the one-half year period).
Annual Report
Fidelity Emerging Asia Fund
Investment Changes (Unaudited)
Geographic Diversification (% of fund's net assets) |
As of October 31, 2010 |
| Korea (South) | 21.9% | |
 | China | 16.3% | |
 | Hong Kong | 16.2% | |
 | Taiwan | 16.0% | |
 | Singapore | 6.3% | |
 | Thailand | 5.4% | |
 | Cayman Islands | 4.4% | |
 | India | 3.0% | |
 | Malaysia | 3.0% | |
| Other | 7.5% | |

Percentages are adjusted for the effect of futures contracts, if applicable. |
As of April 30, 2010 |
| Korea (South) | 23.3% | |
| China | 16.3% | |
| Taiwan | 15.8% | |
| Hong Kong | 15.2% | |
| Singapore | 8.7% | |
| Thailand | 4.2% | |
| Cayman Islands | 3.9% | |
| Malaysia | 3.2% | |
| Indonesia | 2.9% | |
| Other | 6.5% | |

Percentages are adjusted for the effect of futures contracts, if applicable. |
Asset Allocation |
| % of fund's
net assets | % of fund's net assets
6 months ago |
Stocks | 99.4 | 99.1 |
Short-Term Investments and Net Other Assets | 0.6 | 0.9 |
Top Ten Stocks as of October 31, 2010 |
| % of fund's
net assets | % of fund's net assets
6 months ago |
Samsung Electronics Co. Ltd. (Korea (South), Semiconductors & Semiconductor Equipment) | 4.3 | 4.3 |
China Mobile (Hong Kong) Ltd. (Hong Kong, Wireless Telecommunication Services) | 3.4 | 3.6 |
Taiwan Semiconductor Manufacturing Co. Ltd. (Taiwan, Semiconductors & Semiconductor Equipment) | 2.9 | 1.3 |
China Construction Bank Corp. (H Shares) (China, Commercial Banks) | 2.8 | 2.3 |
CNOOC Ltd. (Hong Kong, Oil, Gas & Consumable Fuels) | 2.2 | 2.1 |
Hon Hai Precision Industry Co. Ltd. (Foxconn) (Taiwan, Electronic Equipment & Components) | 1.5 | 2.4 |
Formosa Plastics Corp. (Taiwan, Chemicals) | 1.5 | 1.1 |
Keppel Corp. Ltd. (Singapore, Industrial Conglomerates) | 1.4 | 1.1 |
SK Telecom Co. Ltd. (Korea (South), Wireless Telecommunication Services) | 1.4 | 0.0 |
China Petroleum & Chemical Corp. (H Shares) (China, Oil, Gas & Consumable Fuels) | 1.4 | 0.0 |
| 22.8 | |
Market Sectors as of October 31, 2010 |
| % of fund's
net assets | % of fund's net assets
6 months ago |
Financials | 32.3 | 30.6 |
Information Technology | 16.7 | 22.2 |
Industrials | 10.8 | 10.4 |
Consumer Discretionary | 9.3 | 7.3 |
Materials | 8.8 | 8.0 |
Energy | 7.0 | 6.8 |
Telecommunication Services | 6.8 | 6.6 |
Consumer Staples | 3.8 | 3.6 |
Utilities | 3.6 | 2.8 |
Health Care | 0.3 | 0.8 |
Annual Report
Fidelity Emerging Asia Fund
Investments October 31, 2010
Showing Percentage of Net Assets
Common Stocks - 99.4% |
| Shares | | Value |
Bermuda - 2.2% |
Beijing Enterprises Water Group Ltd. (a) | 6,106,000 | | $ 2,134,786 |
China Green (Holdings) Ltd. | 2,424,000 | | 2,486,154 |
China Yurun Food Group Ltd. | 2,690,000 | | 10,463,280 |
Huabao International Holdings Ltd. | 3,970,000 | | 5,982,209 |
Jardine Matheson Holdings Ltd. | 180,800 | | 8,136,000 |
Jinhui Shipping & Transportation Ltd. (a)(d) | 364,500 | | 1,449,465 |
Noble Group Ltd. | 4,641,818 | | 6,670,618 |
TOTAL BERMUDA | | 37,322,512 |
British Virgin Islands - 0.1% |
ReneSola Ltd. sponsored ADR (a)(d) | 214,900 | | 2,572,353 |
Canada - 0.3% |
Niko Resources Ltd. | 48,800 | | 4,655,594 |
Cayman Islands - 4.4% |
Ausnutria Dairy Hunan Co. Ltd.
(H Shares) | 1,121,000 | | 516,300 |
Belle International Holdings Ltd. | 6,053,000 | | 10,932,688 |
Central China Real Estate Ltd. | 17,436,000 | | 3,959,021 |
Chaoda Modern Agriculture (Holdings) Ltd. | 9,662,000 | | 7,877,935 |
China Digital TV Holding Co. Ltd. ADR (a) | 187,600 | | 1,234,408 |
China Infrastructure Machinery Holdings Ltd. | 2,456,000 | | 1,318,105 |
China Lilang Ltd. | 3,326,000 | | 5,200,596 |
Country Garden Holdings Co. Ltd. | 11,748,000 | | 4,152,817 |
Enn Energy Holdings Ltd. | 1,510,000 | | 4,539,010 |
International Taifeng Holdings Ltd. | 2,022,000 | | 1,168,658 |
JA Solar Holdings Co. Ltd. ADR (a) | 969,090 | | 8,091,902 |
Kingboard Chemical Holdings Ltd. | 2,151,500 | | 10,464,319 |
Maoye International Holdings Ltd. | 3,653,000 | | 1,574,071 |
Mecox Lane Ltd. ADR | 5,500 | | 89,815 |
Peak Sport Products Co. Ltd. | 1,737,000 | | 1,384,894 |
Shenguan Holdings Group Ltd. | 2,600,000 | | 3,387,841 |
Shui On Land Ltd. | 12,176,000 | | 6,110,581 |
SouFun Holdings Ltd. ADR (d) | 2,600 | | 191,100 |
TPK Holdings Co. | 4,000 | | 66,002 |
Trina Solar Ltd. ADR (a) | 87,100 | | 2,330,796 |
Youyuan International Holdings Ltd. | 2,262,000 | | 1,012,629 |
TOTAL CAYMAN ISLANDS | | 75,603,488 |
China - 16.3% |
Air China Ltd. (H Shares) (a) | 7,192,000 | | 9,668,201 |
Bank of China Ltd. (H Shares) | 22,009,000 | | 13,174,876 |
Bank of Communications Co. Ltd.
(H Shares) | 9,975,000 | | 10,899,952 |
China Communications Construction Co. Ltd. (H Shares) | 6,436,000 | | 6,152,654 |
China Communications Services Corp. Ltd. (H Shares) | 4,300,000 | | 2,507,467 |
China Construction Bank Corp.
(H Shares) | 51,176,000 | | 48,790,923 |
China Life Insurance Co. Ltd. (H Shares) | 4,333,000 | | 19,049,109 |
|
| Shares | | Value |
China Merchants Bank Co. Ltd.
(H Shares) | 5,415,000 | | $ 15,369,134 |
China Metal Recycling (Holdings) Ltd. | 2,475,000 | | 2,755,588 |
China Minsheng Banking Corp. Ltd.
(H Shares) | 9,656,000 | | 8,981,746 |
China Petroleum & Chemical Corp.
(H Shares) | 25,060,000 | | 23,843,670 |
China Railway Group Ltd. | 6,442,000 | | 5,194,324 |
China Southern Airlines Ltd.
(H Shares) (a) | 2,338,000 | | 1,589,584 |
Dalian Port (PDA) Co. Ltd. (H Shares) | 2,740,000 | | 1,184,196 |
Digital China Holdings Ltd. (H Shares) | 4,245,000 | | 7,667,150 |
Dongfeng Motor Group Co. Ltd.
(H Shares) | 5,580,000 | | 12,094,049 |
Great Wall Motor Co. Ltd. (H Shares) | 1,180,000 | | 3,706,886 |
Harbin Power Equipment Co. Ltd.
(H Shares) | 3,898,000 | | 5,250,136 |
Huadian Power International Corp. Ltd. (H shares) (d) | 21,832,000 | | 5,013,509 |
Huaneng Power International, Inc.
(H Shares) | 18,040,000 | | 10,319,877 |
Industrial & Commercial Bank of China Ltd. (H Shares) | 20,848,000 | | 16,783,296 |
PICC Property & Casualty Co. Ltd.
(H Shares) (a) | 6,476,000 | | 9,557,870 |
Ping An Insurance Group Co. China Ltd. (H Shares) | 2,190,500 | | 23,582,935 |
Sina Corp. (a) | 9,300 | | 523,590 |
Sinotrans Ltd. (H Shares) | 18,135,000 | | 4,889,811 |
Tencent Holdings Ltd. | 189,600 | | 4,341,751 |
Weichai Power Co. Ltd. (H Shares) | 395,000 | | 5,187,679 |
Xinjiang Goldwind Science & Technology Co. Ltd. (H Shares) (a) | 286,600 | | 741,342 |
Zhongpin, Inc. (a)(d) | 87,500 | | 1,769,250 |
TOTAL CHINA | | 280,590,555 |
Hong Kong - 16.2% |
Cathay Pacific Airways Ltd. | 5,111,000 | | 13,748,021 |
Cheung Kong Holdings Ltd. | 1,554,000 | | 23,657,088 |
China Everbright Ltd. | 1,448,000 | | 3,764,193 |
China Mobile (Hong Kong) Ltd. | 5,772,800 | | 58,953,647 |
China Resources Power Holdings Co.
Ltd. | 4,867,116 | | 9,368,472 |
Citic Pacific Ltd. | 3,253,000 | | 8,666,273 |
CLP Holdings Ltd. | 2,709,500 | | 22,022,061 |
CNOOC Ltd. | 17,698,000 | | 36,948,436 |
First Pacific Co. Ltd. | 1,810,000 | | 1,674,272 |
Galaxy Entertainment Group Ltd. (a) | 1,596,000 | | 1,503,087 |
Hang Lung Group Ltd. | 1,758,000 | | 11,668,970 |
Hang Seng Bank Ltd. | 1,173,400 | | 17,166,723 |
Henderson Land Development Co. Ltd. | 7,068 | | 50,198 |
Hongkong Land Holdings Ltd. | 2,016,000 | | 13,910,400 |
Hysan Development Co. Ltd. | 2,819,000 | | 10,892,314 |
I.T Ltd. | 2,552,000 | | 2,153,211 |
PCCW Ltd. | 21,688,000 | | 8,282,081 |
Common Stocks - continued |
| Shares | | Value |
Hong Kong - continued |
Swire Pacific Ltd. (A Shares) | 878,500 | | $ 12,467,021 |
Wharf Holdings Ltd. | 3,297,000 | | 21,650,353 |
TOTAL HONG KONG | | 278,546,821 |
India - 3.0% |
Apollo Tyres Ltd. | 724,839 | | 1,170,045 |
Bank of Baroda | 163,411 | | 3,877,158 |
Bank of India | 127,620 | | 1,400,869 |
Cadila Healthcare Ltd. | 166,199 | | 2,618,126 |
Canara Bank | 129,405 | | 2,106,389 |
Ess Dee Aluminium Ltd. | 183,198 | | 1,961,758 |
Hindalco Industries Ltd. | 264,622 | | 1,256,693 |
ICSA (India) Ltd. | 286,636 | | 838,406 |
IFCI Ltd. | 1,483,790 | | 2,314,813 |
Indian Oil Corp. Ltd. | 588,420 | | 5,549,667 |
Indian Overseas Bank | 398,875 | | 1,438,020 |
Mahindra & Mahindra Ltd. | 190,568 | | 3,154,422 |
Oriental Bank of Commerce | 138,343 | | 1,557,120 |
Patni Computer Systems Ltd. | 627,299 | | 6,554,101 |
Rural Electrification Corp. Ltd. | 1,044,158 | | 8,731,352 |
State Bank of India | 43,819 | | 3,114,634 |
Tata Consultancy Services Ltd. | 10,296 | | 244,572 |
Tulip Telecom Ltd. | 287,815 | | 1,158,727 |
Union Bank of India | 221,395 | | 1,900,689 |
Voltas Ltd. | 195,405 | | 1,080,954 |
TOTAL INDIA | | 52,028,515 |
Indonesia - 2.8% |
PT Astra International Tbk | 2,062,500 | | 13,153,833 |
PT Bank Negara Indonesia (Persero) Tbk | 15,293,000 | | 6,673,302 |
PT Bank Rakyat Indonesia Tbk | 13,057,000 | | 16,654,506 |
PT BISI International Tbk (a) | 14,906,500 | | 3,919,467 |
PT Indofood Sukses Makmur Tbk | 7,933,500 | | 4,615,850 |
PT XL Axiata Tbk (a) | 4,462,500 | | 2,870,976 |
TOTAL INDONESIA | | 47,887,934 |
Korea (South) - 21.9% |
Asiana Airlines, Inc. (a) | 189,720 | | 1,543,742 |
Busan Bank | 842,710 | | 10,491,719 |
Cheil Worldwide, Inc. | 415,210 | | 4,523,185 |
CJ CheilJedang Corp. | 34,160 | | 6,576,824 |
CJ Corp. | 134,610 | | 9,492,727 |
CJ Home Shopping (a) | 16,807 | | 3,793,345 |
Daegu Bank Co. Ltd. | 460,360 | | 6,038,514 |
Daelim Industrial Co. | 57,815 | | 4,709,518 |
Dongbu Insurance Co. Ltd. | 107,600 | | 3,798,772 |
Doosan Co. Ltd. | 39,652 | | 5,342,176 |
Doosan Construction & Engineering Co. Ltd. | 525,840 | | 3,460,396 |
Duksan Hi-Metal Co. Ltd. (a) | 328,536 | | 6,807,370 |
GS Holdings Corp. | 354,040 | | 18,575,684 |
Halla Climate Control Co. | 205,780 | | 3,824,634 |
Hanmi Holdings Co. Ltd. | 17,489 | | 578,560 |
|
| Shares | | Value |
Hanwha Chemical Corp. | 177,250 | | $ 4,815,462 |
Hanwha Corp. | 172,520 | | 6,512,648 |
Honam Petrochemical Corp. | 40,696 | | 8,975,195 |
Hyosung Corp. | 29,582 | | 3,288,350 |
Hyundai Department Store Co. Ltd. | 24,010 | | 2,658,288 |
Hyundai Mipo Dockyard Co. Ltd. | 25,128 | | 4,201,035 |
Hyundai Mobis | 83,331 | | 20,749,379 |
Hyundai Motor Co. | 157,283 | | 23,777,773 |
Hyundai Steel Co. | 96,665 | | 9,369,928 |
Industrial Bank of Korea | 894,370 | | 12,844,885 |
Kia Motors Corp. | 323,860 | | 12,931,358 |
Korea Zinc Co. Ltd. | 25,584 | | 6,450,034 |
Kyeryong Construction Industrial Co. Ltd. | 60,160 | | 1,013,812 |
LG Chemical Ltd. | 58,866 | | 18,164,961 |
LG Corp. | 159,666 | | 11,430,068 |
LIG Non-Life Insurance Co. Ltd. | 242,390 | | 5,011,620 |
Lotte Shopping Co. Ltd. | 27,018 | | 11,064,284 |
Meritz Fire & Marine Insurance Co. Ltd. | 153,960 | | 1,056,977 |
POSCO | 57,442 | | 23,723,733 |
Samsung Electronics Co. Ltd. | 111,201 | | 73,672,509 |
SK Telecom Co. Ltd. | 159,879 | | 24,350,698 |
TOTAL KOREA (SOUTH) | | 375,620,163 |
Malaysia - 3.0% |
AMMB Holdings Bhd | 3,670,500 | | 7,456,625 |
Axiata Group Bhd (a) | 6,682,100 | | 9,644,047 |
Genting Malaysia Bhd | 6,954,400 | | 7,823,979 |
Glomac Bhd | 1,615,900 | | 831,064 |
Malayan Banking Bhd | 5,261,100 | | 15,220,154 |
Public Bank Bhd (For. Reg.) | 2,664,900 | | 10,930,287 |
TOTAL MALAYSIA | | 51,906,156 |
Mauritius - 0.5% |
Golden Agri-Resources Ltd. | 16,686,000 | | 8,379,742 |
Philippines - 0.2% |
Megaworld Corp. | 27,730,000 | | 1,654,751 |
Universal Robina Corp. | 1,787,000 | | 1,809,910 |
TOTAL PHILIPPINES | | 3,464,661 |
Singapore - 6.3% |
CapitaLand Ltd. | 3,090,000 | | 9,286,950 |
Ezra Holdings Ltd. | 1,584,800 | | 2,142,780 |
Keppel Corp. Ltd. | 3,169,000 | | 24,435,309 |
Keppel Land Ltd. | 2,206,000 | | 7,550,475 |
MobileOne Ltd. | 2,540,000 | | 4,356,641 |
Oversea-Chinese Banking Corp. Ltd. | 2,367,488 | | 16,480,775 |
Raffles Medical Group Ltd. | 1,622,000 | | 2,731,948 |
SembCorp Industries Ltd. | 3,904,000 | | 13,814,664 |
SembCorp Marine Ltd. | 2,620,000 | | 9,311,597 |
Singapore Exchange Ltd. | 1,398,000 | | 9,505,061 |
United Overseas Bank Ltd. | 15,745 | | 226,753 |
Common Stocks - continued |
| Shares | | Value |
Singapore - continued |
Yangzijiang Shipbuilding Holdings Ltd. | 2,634,000 | | $ 3,805,594 |
Yanlord Land Group Ltd. | 3,379,000 | | 4,490,365 |
TOTAL SINGAPORE | | 108,138,912 |
Taiwan - 16.0% |
Cando Corp. (a) | 1,153,956 | | 899,260 |
China Airlines Ltd. (a) | 4,700,000 | | 3,662,637 |
Chroma ATE, Inc. | 3,398,125 | | 8,749,298 |
Compal Electronics, Inc. | 10,728,453 | | 13,671,285 |
Delta Electronics, Inc. | 3,261,000 | | 13,478,729 |
Far East Department Stores Co. Ltd. | 4,020,800 | | 4,992,335 |
Farglory Land Development Co. Ltd. | 1,951,000 | | 4,844,829 |
Formosa Chemicals & Fibre Corp. | 6,046,000 | | 17,344,839 |
Formosa Plastics Corp. | 8,963,000 | | 25,713,165 |
Fubon Financial Holding Co. Ltd. | 16,555,034 | | 20,284,718 |
Hon Hai Precision Industry Co. Ltd. (Foxconn) | 6,791,000 | | 25,739,455 |
HTC Corp. | 697,250 | | 15,742,518 |
Huaku Development Co. Ltd. | 993,269 | | 2,755,384 |
Hung Poo Real Estate Development Co. Ltd. | 3,967,447 | | 5,904,826 |
Insyde Software Corp. | 616,928 | | 1,931,113 |
King Slide Works Co. Ltd. | 323,400 | | 1,495,216 |
Macronix International Co. Ltd. | 14,850,000 | | 9,146,300 |
Powertech Technology, Inc. | 2,114,000 | | 6,976,442 |
Taishin Financial Holdings Co. Ltd. | 36,698,820 | | 16,068,100 |
Taiwan Cement Corp. | 3,886,000 | | 4,139,311 |
Taiwan Semiconductor Manufacturing Co. Ltd. | 23,878,192 | | 49,151,389 |
Tripod Technology Corp. | 1,878,000 | | 7,210,096 |
U-Ming Marine Transport Corp. | 2,260,000 | | 4,652,181 |
Wistron Corp. | 4,858,000 | | 9,984,258 |
TOTAL TAIWAN | | 274,537,684 |
Thailand - 5.4% |
Advanced Info Service PCL (For. Reg.) | 999,700 | | 3,005,110 |
Asian Property Development PCL (For. Reg.) | 5,593,800 | | 1,233,102 |
Bangkok Bank Public Co. Ltd.: | | | |
(For. Reg.) | 842,700 | | 4,348,602 |
NVDR | 1,774,900 | | 8,833,003 |
Banpu PCL: | | | |
unit | 655,900 | | 16,956,132 |
(For. Reg.) | 75,400 | | 1,949,218 |
BEC World PCL (For. Reg.) | 4,536,300 | | 5,037,808 |
C.P. Seven Eleven PCL | 4,716,800 | | 7,010,608 |
|
| Shares | | Value |
Charoen Pokphand Foods PCL
(For. Reg.) | 7,048,500 | | $ 5,485,306 |
Electricity Generating PCL unit | 2,524,200 | | 8,093,627 |
LPN Development PCL unit | 3,002,900 | | 1,163,448 |
National Finance PCL (For. Reg.) | 4,943,200 | | 6,521,590 |
Preuksa Real Estate PCL (For. Reg.) | 4,485,300 | | 3,235,888 |
PTT Aromatics & Refining PLC unit | 8,537,100 | | 8,482,923 |
Quality Houses PCL | 24,855,700 | | 1,926,026 |
Siam Cement PCL (For. Reg.) | 788,200 | | 8,661,249 |
TOTAL THAILAND | | 91,943,640 |
United Kingdom - 0.7% |
HSBC Holdings PLC (Hong Kong) | 1,237,603 | | 12,900,071 |
United States of America - 0.1% |
China Natural Gas, Inc. (a)(d) | 84,700 | | 522,599 |
Cognizant Technology Solutions Corp. Class A (a) | 12,800 | | 834,432 |
TOTAL UNITED STATES OF AMERICA | | 1,357,031 |
TOTAL COMMON STOCKS (Cost $1,430,994,189) | 1,707,455,832 |
Money Market Funds - 0.7% |
| | | |
Fidelity Cash Central Fund, 0.23% (b) | 5,800,839 | | 5,800,839 |
Fidelity Securities Lending Cash Central Fund, 0.24% (b)(c) | 5,224,925 | | 5,224,925 |
TOTAL MONEY MARKET FUNDS (Cost $11,025,764) | 11,025,764 |
TOTAL INVESTMENT PORTFOLIO - 100.1% (Cost $1,442,019,953) | | 1,718,481,596 |
NET OTHER ASSETS (LIABILITIES) - (0.1)% | | (919,305) |
NET ASSETS - 100% | $ 1,717,562,291 |
Legend |
(a) Non-income producing |
(b) Affiliated fund that is available only to investment companies and other accounts managed by Fidelity Investments. The rate quoted is the annualized seven-day yield of the fund at period end. A complete unaudited listing of the fund's holdings as of its most recent quarter end is available upon request. In addition, each Fidelity Central Fund's financial statements, which are not covered by the Fund's report of Independent Registered Public Accounting Firm, are available on the SEC's website or upon request. |
(c) Investment made with cash collateral received from securities on loan. |
(d) Security or a portion of the security is on loan at period end. |
Affiliated Central Funds |
Information regarding fiscal year to date income earned by the Fund from investments in Fidelity Central Funds is as follows: |
Fund | Income earned |
Fidelity Cash Central Fund | $ 24,242 |
Fidelity Securities Lending Cash Central Fund | 148,486 |
Total | $ 172,728 |
Other Information |
The following is a summary of the inputs used, as of October 31, 2010, involving the Fund's assets and liabilities carried at fair value. The inputs or methodology used for valuing securities may not be an indication of the risk associated with investing in those securities. For more information on valuation inputs, and their aggregation into the levels used in the tables below, please refer to the Security Valuation section in the accompanying Notes to Financial Statements. |
Valuation Inputs at Reporting Date: |
Description | Total | Level 1 | Level 2 | Level 3 |
Investments in Securities: | | | | |
Equities: | | | | |
Korea (South) | $ 375,620,163 | $ 327,545,732 | $ 48,074,431 | $ - |
China | 280,590,555 | 227,377,899 | 53,212,656 | - |
Hong Kong | 278,546,821 | 182,644,738 | 95,902,083 | - |
Taiwan | 274,537,684 | 225,386,295 | 49,151,389 | - |
Singapore | 108,138,912 | 108,138,912 | - | - |
Thailand | 91,943,640 | 91,943,640 | - | - |
Cayman Islands | 75,603,488 | 75,603,488 | - | - |
India | 52,028,515 | 38,526,522 | 13,501,993 | - |
Malaysia | 51,906,156 | 51,906,156 | - | - |
Other | 118,539,898 | 105,639,827 | 12,900,071 | - |
Money Market Funds | 11,025,764 | 11,025,764 | - | - |
Total Investments in Securities: | $ 1,718,481,596 | $ 1,445,738,973 | $ 272,742,623 | $ - |
The following is a reconciliation of Investments in Securities for which Level 3 inputs were used in determining value: |
Investments in Securities: | |
Beginning Balance | $ 1,846,452 |
Total Realized Gain (Loss) | 1,124,820 |
Total Unrealized Gain (Loss) | (152,981) |
Cost of Purchases | - |
Proceeds of Sales | (2,818,291) |
Amortization/Accretion | - |
Transfers in to Level 3 | - |
Transfers out of Level 3 | - |
Ending Balance | $ - |
The change in unrealized gain (loss) for the period attributable to Level 3 securities held at October 31, 2010 | $ - |
The information used in the above reconciliation represents fiscal year to date activity for any Investments in Securities, identified as using Level 3 inputs at either the beginning or the end of the current fiscal period. Transfers in or out of Level 3 represent the beginning value of any Security or Instrument where a change in the pricing level occurred from the beginning to the end of the period. The cost of purchases and the proceeds of sales may include securities received or delivered through corporate actions or exchanges. Realized and unrealized gains (losses) disclosed in the reconciliation are included in Net Gain (Loss) on the Fund's Statement of Operations. |
Income Tax Information |
At October 31, 2010, the Fund had a capital loss carryforward of approximately $409,207,336 all of which will expire on October 31, 2017. Capital loss carryforwards are only available to offset future capital gains of the Fund to the extent provided by regulations and may be limited. |
See accompanying notes which are an integral part of the financial statements.
Annual Report
Fidelity Emerging Asia Fund
Statement of Assets and Liabilities
| October 31, 2010 |
| | |
Assets | | |
Investment in securities, at value (including securities loaned of $4,957,866) - See accompanying schedule: Unaffiliated issuers (cost $1,430,994,189) | $ 1,707,455,832 | |
Fidelity Central Funds (cost $11,025,764) | 11,025,764 | |
Total Investments (cost $1,442,019,953) | | $ 1,718,481,596 |
Foreign currency held at value (cost $316,512) | | 316,781 |
Receivable for investments sold | | 9,746,114 |
Receivable for fund shares sold | | 1,729,274 |
Dividends receivable | | 951,025 |
Distributions receivable from Fidelity Central Funds | | 30,314 |
Other receivables | | 187,514 |
Total assets | | 1,731,442,618 |
| | |
Liabilities | | |
Payable for investments purchased | $ 5,423,866 | |
Payable for fund shares redeemed | 1,209,502 | |
Accrued management fee | 621,575 | |
Other affiliated payables | 391,273 | |
Other payables and accrued expenses | 1,009,186 | |
Collateral on securities loaned, at value | 5,224,925 | |
Total liabilities | | 13,880,327 |
| | |
Net Assets | | $ 1,717,562,291 |
Net Assets consist of: | | |
Paid in capital | | $ 1,827,628,176 |
Undistributed net investment income | | 24,288,225 |
Accumulated undistributed net realized gain (loss) on investments and foreign currency transactions | | (410,275,928) |
Net unrealized appreciation (depreciation) on investments and assets and liabilities in foreign currencies | | 275,921,818 |
Net Assets, for 57,837,820 shares outstanding | | $ 1,717,562,291 |
Net Asset Value, offering price and redemption price per share ($1,717,562,291 / 57,837,820 shares) | | $ 29.70 |
Statement of Operations
| Year ended October 31, 2010 |
| | |
Investment Income | | |
Dividends | | $ 42,450,577 |
Interest | | 215 |
Income from Fidelity Central Funds | | 172,728 |
Income before foreign taxes withheld | | 42,623,520 |
Less foreign taxes withheld | | (4,802,324) |
Total income | | 37,821,196 |
| | |
Expenses | | |
Management fee
Basic fee | $ 11,972,661 | |
Performance adjustment | (5,350,363) | |
Transfer agent fees | 4,346,435 | |
Accounting and security lending fees | 753,755 | |
Custodian fees and expenses | 983,220 | |
Independent trustees' compensation | 9,733 | |
Registration fees | 39,301 | |
Audit | 73,953 | |
Legal | 8,868 | |
Interest | 8,975 | |
Miscellaneous | 344,501 | |
Total expenses before reductions | 13,191,039 | |
Expense reductions | (734,472) | 12,456,567 |
Net investment income (loss) | | 25,364,629 |
Realized and Unrealized Gain (Loss) Net realized gain (loss) on: | | |
Investment securities: | | |
Unaffiliated issuers (net of foreign taxes of $397,206) | 144,249,497 | |
Foreign currency transactions | (736,686) | |
Total net realized gain (loss) | | 143,512,811 |
Change in net unrealized appreciation (depreciation) on: Investment securities (net of increase in deferred foreign taxes of $490,151) | 237,416,441 | |
Assets and liabilities in foreign currencies | (32,428) | |
Total change in net unrealized appreciation (depreciation) | | 237,384,013 |
Net gain (loss) | | 380,896,824 |
Net increase (decrease) in net assets resulting from operations | | $ 406,261,453 |
See accompanying notes which are an integral part of the financial statements.
Annual Report
Fidelity Emerging Asia Fund
Financial Statements - continued
Statement of Changes in Net Assets
| Year ended
October 31,
2010 | Year ended
October 31,
2009 |
Increase (Decrease) in Net Assets | | |
Operations | | |
Net investment income (loss) | $ 25,364,629 | $ 45,857,260 |
Net realized gain (loss) | 143,512,811 | (445,100,148) |
Change in net unrealized appreciation (depreciation) | 237,384,013 | 826,965,729 |
Net increase (decrease) in net assets resulting from operations | 406,261,453 | 427,722,841 |
Distributions to shareholders from net investment income | (30,524,290) | (16,525,195) |
Distributions to shareholders from net realized gain | (28,589,443) | - |
Total distributions | (59,113,733) | (16,525,195) |
Share transactions - net increase (decrease) | (368,409,021) | (278,686,790) |
Redemption fees | 282,689 | 397,870 |
Total increase (decrease) in net assets | (20,978,612) | 132,908,726 |
| | |
Net Assets | | |
Beginning of period | 1,738,540,903 | 1,605,632,177 |
End of period (including undistributed net investment income of $24,288,225 and undistributed net investment income of $29,331,095, respectively) | $ 1,717,562,291 | $ 1,738,540,903 |
Financial Highlights
Years ended October 31, | 2010 | 2009 | 2008 | 2007 | 2006 |
Selected Per-Share Data | | | | | |
Net asset value, beginning of period | $ 23.98 | $ 18.50 | $ 49.39 | $ 25.59 | $ 18.70 |
Income from Investment Operations | | | | | |
Net investment income (loss) B | .39 | .58 E | .44 | .33 | .33 |
Net realized and unrealized gain (loss) | 6.16 | 5.09 | (28.21) | 24.95 | 7.23 |
Total from investment operations | 6.55 | 5.67 | (27.77) | 25.28 | 7.56 |
Distributions from net investment income | (.43) | (.20) | (.28) | (.23) | (.26) |
Distributions from net realized gain | (.40) | - | (2.89) | (1.29) | (.43) |
Total distributions | (.83) | (.20) | (3.17) | (1.52) | (.69) |
Redemption fees added to paid in capital B | - G | .01 | .05 | .04 | .02 |
Net asset value, end of period | $ 29.70 | $ 23.98 | $ 18.50 | $ 49.39 | $ 25.59 |
Total Return A | 27.93% | 31.08% | (59.64)% | 104.22% | 41.50% |
Ratios to Average Net Assets C,F | | | | | |
Expenses before reductions | .78% | 1.14% | 1.18% | 1.08% | 1.21% |
Expenses net of fee waivers, if any | .78% | 1.14% | 1.18% | 1.08% | 1.21% |
Expenses net of all reductions | .74% | .99% | 1.04% | .98% | 1.04% |
Net investment income (loss) | 1.50% | 2.86% E | 1.34% | .96% | 1.44% |
Supplemental Data | | | | | |
Net assets, end of period (000 omitted) | $ 1,717,562 | $ 1,736,852 | $ 1,605,632 | $ 6,293,936 | $ 1,592,948 |
Portfolio turnover rate D | 105% | 220% | 147% | 72% | 100% |
A Total returns would have been lower had certain expenses not been reduced during the periods shown.
B Calculated based on average shares outstanding during the period.
C Fees and expenses of the underlying Fidelity Central Funds are not included in the Fund's expense ratio. The Fund indirectly bears its proportionate share of the expenses of any underlying Fidelity Central Funds.
D Amount does not include the portfolio activity of any underlying Fidelity Central Funds.
E Investment income per share reflects a special dividend which amounted to $.16 per share. Excluding the special dividend, the ratio of net investment income (loss) to average net assets would have been 2.09%.
F Expense ratios reflect operating expenses of the Fund. Expenses before reductions do not reflect amounts reimbursed by the investment adviser or reductions from brokerage service arrangements or reductions from other expense offset arrangements and do not represent the amount paid by the Fund during periods when reimbursements or reductions occur. Expenses net of fee waivers reflect expenses after reimbursement by the investment adviser but prior to reductions from brokerage service arrangements or other expense offset arrangements. Expenses net of all reductions represent the net expenses paid by the Fund.
G Amount represents less than $.01 per share.
See accompanying notes which are an integral part of the financial statements.
Annual Report
Notes to Financial Statements
For the period ended October 31, 2010
1. Organization.
Fidelity Emerging Asia Fund (the Fund) (formerly Fidelity Southeast Asia Fund) is a fund of Fidelity Investment Trust (the Trust) and is authorized to issue an unlimited number of shares. The Trust is registered under the Investment Company Act of 1940, as amended (the 1940 Act), as an open-end management investment company organized as a Massachusetts business trust. In July 2010, the Board of Trustees approved a change in the name of Fidelity Southeast Asia Fund to Fidelity Emerging Asia Fund effective December 1, 2010. The Fund offered Class F shares during the period June 26, 2009 through June 11, 2010, and all outstanding shares were redeemed by period end. The Fund's investments in emerging markets can be subject to social, economic, regulatory, and political uncertainties and can be extremely volatile.
2. Investments in Fidelity Central Funds.
The Fund may invest in Fidelity Central Funds, which are open-end investment companies available only to other investment companies and accounts managed by Fidelity Management & Research Company (FMR) and its affiliates. The Fund's Schedule of Investments lists each of the Fidelity Central Funds held as of period end, if any, as an investment of the Fund, but does not include the underlying holdings of each Fidelity Central Fund. As an Investing Fund, the Fund indirectly bears its proportionate share of the expenses of the underlying Fidelity Central Funds.
The Money Market Central Funds seek preservation of capital and current income and are managed by Fidelity Investments Money Management, Inc. (FIMM), an affiliate of FMR.
A complete unaudited list of holdings for each Fidelity Central Fund is available upon request or at the Securities and Exchange Commission (the SEC) web site at www.sec.gov. In addition, the financial statements of the Fidelity Central Funds, which are not covered by the Fund's Report of Independent Registered Public Accounting Firm, are available on the SEC web site or upon request.
3. Significant Accounting Policies.
The financial statements have been prepared in conformity with accounting principles generally accepted in the United States of America (GAAP), which require management to make certain estimates and assumptions at the date of the financial statements. Actual results could differ from those estimates. The following summarizes the significant accounting policies of the Fund:
Security Valuation. Investments are valued as of 4:00 p.m. Eastern time on the last calendar day of the period. The Fund uses independent pricing services approved by the Board of Trustees to value its investments. When current market prices or quotations are not readily available or reliable, valuations may be determined in good faith in accordance with procedures adopted by the Board of Trustees. Factors used in determining. value may include market or security specific events. The frequency with which these procedures are used cannot be predicted and they may be utilized to a significant extent. The value used for net asset value (NAV) calculation under these procedures may differ from published prices for the same securities.
The Fund categorizes the inputs to valuation techniques used to value its investments into a disclosure hierarchy consisting of three levels as shown below.
Level 1 - quoted prices in active markets for identical investments
Level 2 - other significant observable inputs (including quoted prices for similar investments, interest rates, prepayment speeds, etc.)
Level 3 - unobservable inputs (including the fund's own assumptions based on the best information available)
Changes in valuation techniques may result in transfers in or out of an assigned level within the disclosure hierarchy. The aggregate value of investments by input level, as of October 31, 2010, as well as a roll forward of Level 3 securities, is included at the end of the Fund's Schedule of Investments. Valuation techniques used to value the Fund's investments by major category are as follows.
Equity securities, including restricted securities, for which market quotations are readily available, are valued at the last reported sale price or official closing price as reported by an independent pricing service on the primary market or exchange on which they are traded and are categorized as Level 1 in the hierarchy. In the event there were no sales during the day or closing prices are not available, securities are valued at the last quoted bid price or may be valued using the last available price and are generally categorized as Level 2 in the hierarchy. For foreign equity securities, when significant market or security specific events arise, comparisons to the valuation of American Depositary Receipts (ADRs), futures contracts, Exchange-traded funds (ETFs) and certain indexes as well as quoted prices for similar securities are used and are categorized as Level 2 in the hierarchy in these circumstances. Utilizing these techniques may result in significant transfers between Level 1 and Level 2. For restricted equity securities and private placements where observable inputs are limited, assumptions about market activity and risk are used and are categorized as Level 3 in the hierarchy.
Investments in open-end mutual funds, including the Fidelity Central Funds, are valued at their closing net asset value each business day and are categorized as Level 1 in the hierarchy. Short-term securities with remaining maturities of sixty days or less for which quotations are not readily available are valued at amortized cost, which approximates fair value and are categorized as Level 2 in the hierarchy.
Annual Report
3. Significant Accounting Policies - continued
Foreign Currency. The Fund uses foreign currency contracts to facilitate transactions in foreign-denominated securities. Gains and losses from these transactions may arise from changes in the value of the foreign currency or if the counterparties do not perform under the contracts' terms.
Foreign-denominated assets, including investment securities, and liabilities are translated into U.S. dollars at the exchange rate at period end. Purchases and sales of investment securities, income and dividends received and expenses denominated in foreign currencies are translated into U.S. dollars at the exchange rate in effect on the transaction date.
The effects of exchange rate fluctuations on investments are included with the net realized and unrealized gain (loss) on investment securities. Other foreign currency transactions resulting in realized and unrealized gain (loss) are disclosed separately.
Investment Transactions and Income. For financial reporting purposes, the Fund's investment holdings and NAV include trades executed through the end of the last business day of the period. The NAV per share for processing shareholder transactions is calculated as of the close of business of the New York Stock Exchange (NYSE), normally 4:00 p.m. Eastern time and includes trades executed through the end of the prior business day. Gains and losses on securities sold are determined on the basis of identified cost. Dividend income is recorded on the ex-dividend date, except for certain dividends from foreign securities where the ex-dividend date may have passed, which are recorded as soon as the Fund is informed of the ex-dividend date. Non-cash dividends included in dividend income, if any, are recorded at the fair market value of the securities received. Distributions received on securities that represent a return of capital or capital gain are recorded as a reduction of cost of investment and/or as a realized gain. The Fund estimates the components of distributions received that may be considered return of capital distributions or capital gain distributions. Interest income and distributions from the Fidelity Central Funds are accrued as earned. Interest income includes coupon interest and amortization of premium and accretion of discount on debt securities. Investment income is recorded net of foreign taxes withheld where recovery of such taxes is uncertain.
Expenses. Most expenses of the Trust can be directly attributed to a fund. Expenses which cannot be directly attributed are apportioned amongst each fund in the Trust. Expense estimates are accrued in the period to which they relate and adjustments are made when actual amounts are known.
Income Tax Information and Distributions to Shareholders. Each year the Fund intends to qualify as a regulated investment company, including distributing substantially all of its taxable income and realized gains under Subchapter M of the Internal Revenue Code and filing its U.S. federal tax return. As a result, no provision for income taxes is required. As of October 31, 2010, the Fund did not have any unrecognized tax benefits in the accompanying financial statements. A fund's federal tax return is subject to examination by the Internal Revenue Service (IRS) for a period of three years. Foreign taxes are provided for based on the Fund's understanding of the tax rules and rates that exist in the foreign markets in which it invests. The Fund is subject to a tax imposed on short term capital gains on securities of certain issuers domiciled in India. The Fund records an estimated deferred tax liability included in Other payables and accrued expenses in the accompanying Statement of Assets & Liabilities for net unrealized gains on these securities in an amount that would be payable if the securities were disposed of at period end.
Distributions are declared and recorded on the ex-dividend date. Income and capital gain distributions are determined in accordance with income tax regulations, which may differ from GAAP.
Capital accounts within the financial statements are adjusted for permanent book-tax differences. These adjustments have no impact on net assets or the results of operations. Temporary book-tax differences will reverse in a subsequent period.
Book-tax differences are primarily due to short-term gain distribution from the Fidelity Central Funds, foreign currency transactions, passive foreign investment companies (PFIC), certain foreign taxes, deferred trustee compensation, capital loss carry forward and losses deferred due to wash sale.
The federal tax cost of investment securities and unrealized appreciation (depreciation) as of period end were as follows:
Gross unrealized appreciation | $ 285,054,005 |
Gross unrealized depreciation | (15,705,483) |
Net unrealized appreciation (depreciation) | $ 269,348,522 |
| |
Tax Cost | $ 1,449,133,074 |
The tax-based components of distributable earnings as of period end were as follows:
Undistributed ordinary income | $ 30,333,127 |
Capital loss carryforward | $ (409,207,336) |
Net unrealized appreciation (depreciation) | $ 269,298,848 |
Annual Report
Notes to Financial Statements - continued
3. Significant Accounting Policies - continued
Income Tax Information and Distributions to Shareholders - continued
The tax character of distributions paid was as follows:
| October 31, 2010 | October 31, 2009 |
Ordinary Income | $ 59,113,733 | $ 16,525,195 |
Short-Term Trading (Redemption) Fees.
Shares held by investors in the Fund less than 90 days are subject to a redemption fee equal to 1.50% of the net asset value of shares redeemed. All redemption fees, which reduce the proceeds of the shareholder redemption, are retained by the Fund and accounted for as an addition to paid in capital.
4. Purchases and Sales of Investments.
Purchases and sales of securities, other than short-term securities, aggregated $1,735,474,010 and $2,127,549,617, respectively.
5. Fees and Other Transactions with Affiliates.
Management Fee. FMR and its affiliates provide the Fund with investment management related services for which the Fund pays a monthly management fee. The management fee is the sum of an individual fund fee rate that is based on an annual rate of .45% of the Fund's average net assets and a group fee rate that averaged .26% during the period. The group fee rate is based upon the average net assets of all the mutual funds advised by FMR. The group fee rate decreases as assets under management increase and increases as assets under management decrease. In addition, the management fee is subject to a performance adjustment (up to a maximum of ± .20% of the Fund's average net assets over a 36 month performance period). The upward or downward adjustment to the management fee is based on the relative investment performance of the retail Class of the Fund as compared to an appropriate benchmark index. For the period, the total annual management fee rate, including the performance adjustment, was .39% of the Fund's average net assets.
Transfer Agent Fees. Fidelity Investments Institutional Operations Company, Inc. (FIIOC), an affiliate of FMR, is the Fund's transfer, dividend disbursing and shareholder servicing agent. FIIOC receives account fees and asset-based fees that vary according to account size and type of account. FIIOC pays for typesetting, printing and mailing of shareholder reports, except proxy statements. For the period, the transfer agent fees were equivalent to an annual rate of .26% of average net assets.
Accounting and Security Lending Fees. Fidelity Service Company, Inc. (FSC), an affiliate of FMR, maintains the Fund's accounting records. The accounting fee is based on the level of average net assets for the month. Under a separate contract, FSC administers the security lending program. The security lending fee is based on the number and duration of lending transactions.
Brokerage Commissions. The Fund placed a portion of its portfolio transactions with brokerage firms which are affiliates of the investment adviser. The commissions paid to these affiliated firms were $249 for the period.
Interfund Lending Program. Pursuant to an Exemptive Order issued by the SEC, the Fund, along with other registered investment companies having management contracts with FMR, may participate in an interfund lending program. This program provides an alternative credit facility allowing the funds to borrow from, or lend money to, other participating affiliated funds. At period end, there were no interfund loans outstanding. The Fund's activity in this program during the period for which loans were outstanding was as follows:
Borrower or Lender | Average Daily
Loan Balance | Weighted Average Interest Rate | Interest
Expense |
Borrower | $ 17,107,119 | .45% | $ 8,975 |
6. Committed Line of Credit.
The Fund participates with other funds managed by FMR or an affiliate in a $3.75 billion credit facility (the "line of credit") to be utilized for temporary or emergency purposes to fund shareholder redemptions or for other short-term liquidity purposes. The Fund has agreed to pay commitment fees on its pro-rata portion of the line of credit, which amounted to $6,700 and is reflected in Miscellaneous expenses on the Statement of Operations. During the period, there were no borrowings on this line of credit.
Annual Report
7. Security Lending.
The Fund lends portfolio securities through a lending agent from time to time in order to earn additional income. The lending agent may loan securities to certain qualified borrowers, including Fidelity Capital Markets (FCM), a broker-dealer affiliated with the Fund. On the settlement date of the loan, the Fund receives collateral (in the form of U.S. Treasury obligations, letters of credit and/or cash) against the loaned securities and maintains collateral in an amount not less than 100% of the market value of the loaned securities during the period of the loan. The market value of the loaned securities is determined at the close of business of the Fund and any additional required collateral is delivered to the Fund on the next business day. If the borrower defaults on its obligation to return the securities loaned because of insolvency or other reasons, a fund could experience delays and costs in recovering the securities loaned or in gaining access to the collateral. Any cash collateral received is invested in the Fidelity Securities Lending Cash Central Fund. The value of loaned securities and cash collateral at period end are disclosed on the Fund's Statement of Assets and Liabilities. Security lending income represents the income earned on investing cash collateral, less rebates paid to borrowers and lending agent fees associated with the loan, plus any premium payments received for lending certain types of securities. Security lending income is presented in the Statement of Operations as a component of income from Fidelity Central Funds. Total security lending income during the period amounted to $148,486. During the period, there were no securities loaned to FCM.
8. Expense Reductions.
Many of the brokers with whom FMR places trades on behalf of the Fund provided services to the Fund in addition to trade execution. These services included payments of certain expenses on behalf of the Fund totaling $734,472 for the period.
9. Distributions to Shareholders.
Distributions to shareholders of each class were as follows:
Years ended October 31, | 2010 A | 2009 |
From net investment income | | |
Emerging Asia | $ 30,460,836 | $ 16,525,195 |
Class F | 63,454 | - |
Total | $ 30,524,290 | $ 16,525,195 |
From net realized gain | | |
Emerging Asia | $ 28,534,741 | $ - |
Class F | 54,702 | - |
Total | $ 28,589,443 | $ - |
A All Class F shares were redeemed on June 11, 2010.
10. Share Transactions.
Transactions for each class of shares were as follows:
| Shares | Dollars |
Years ended October 31, | 2010 A | 2009 B | 2010 A | 2009 B |
Emerging Asia | | | | |
Shares sold | 9,549,252 | 13,882,017 | $ 251,925,297 | $ 285,662,683 |
Reinvestment of distributions | 2,258,330 | 910,020 | 56,751,824 | 15,822,870 |
Shares redeemed | (26,400,169) | (29,172,062) | (675,382,094) | (581,908,544) |
Net increase (decrease) | (14,592,587) | (14,380,025) | $ (366,704,973) | $ (280,422,991) |
Class F | | | | |
Shares sold | 608,072 | 71,921 | $ 15,362,404 | $ 1,774,629 |
Reinvestment of distributions | 4,704 | - | 118,156 | - |
Shares redeemed | (683,167) | (1,530) | (17,184,608) | (38,428) |
Net increase (decrease) | (70,391) | 70,391 | $ (1,704,048) | $ 1,736,201 |
A All Class F shares were redeemed on June 11, 2010.
B Share transactions for Class F are for the period June 26, 2009 (commencement of sale of shares) to October 31, 2009.
Annual��Report
Notes to Financial Statements - continued
11. Other.
The Fund's organizational documents provide former and current trustees and officers with a limited indemnification against liabilities arising in connection with the performance of their duties to the Fund. In the normal course of business, the Fund may also enter into contracts that provide general indemnifications. The Fund's maximum exposure under these arrangements is unknown as this would be dependent on future claims that may be made against the Fund. The risk of material loss from such claims is considered remote.
Annual Report
Fidelity Emerging Markets Fund
Performance: The Bottom Line
Average annual total return reflects the change in the value of an investment, assuming reinvestment of the class' distributions from dividend income and capital gains (the profits earned upon the sale of securities that have grown in value, if any) and assuming a constant rate of performance each year. The $10,000 table and the fund's returns do not reflect the deduction of taxes that a shareholder would pay on fund distributions or the redemption of fund shares. During periods of reimbursement by Fidelity, a fund's total return will be greater than it would be had the reimbursement not occurred. How a fund did yesterday is no guarantee of how it will do tomorrow.
Average Annual Total Returns
Periods ended October 31, 2010 | Past 1
year | Past 5
years | Past 10
years |
Fidelity Emerging Markets Fund | 25.76% | 12.50% | 12.90% |
$10,000 Over 10 Years
Let's say hypothetically that $10,000 was invested in Fidelity Emerging Markets Fund, a class of the fund, on October 31, 2000. The chart shows how the value of your investment would have changed, and also shows how the MSCI Emerging Markets Index performed over the same period.
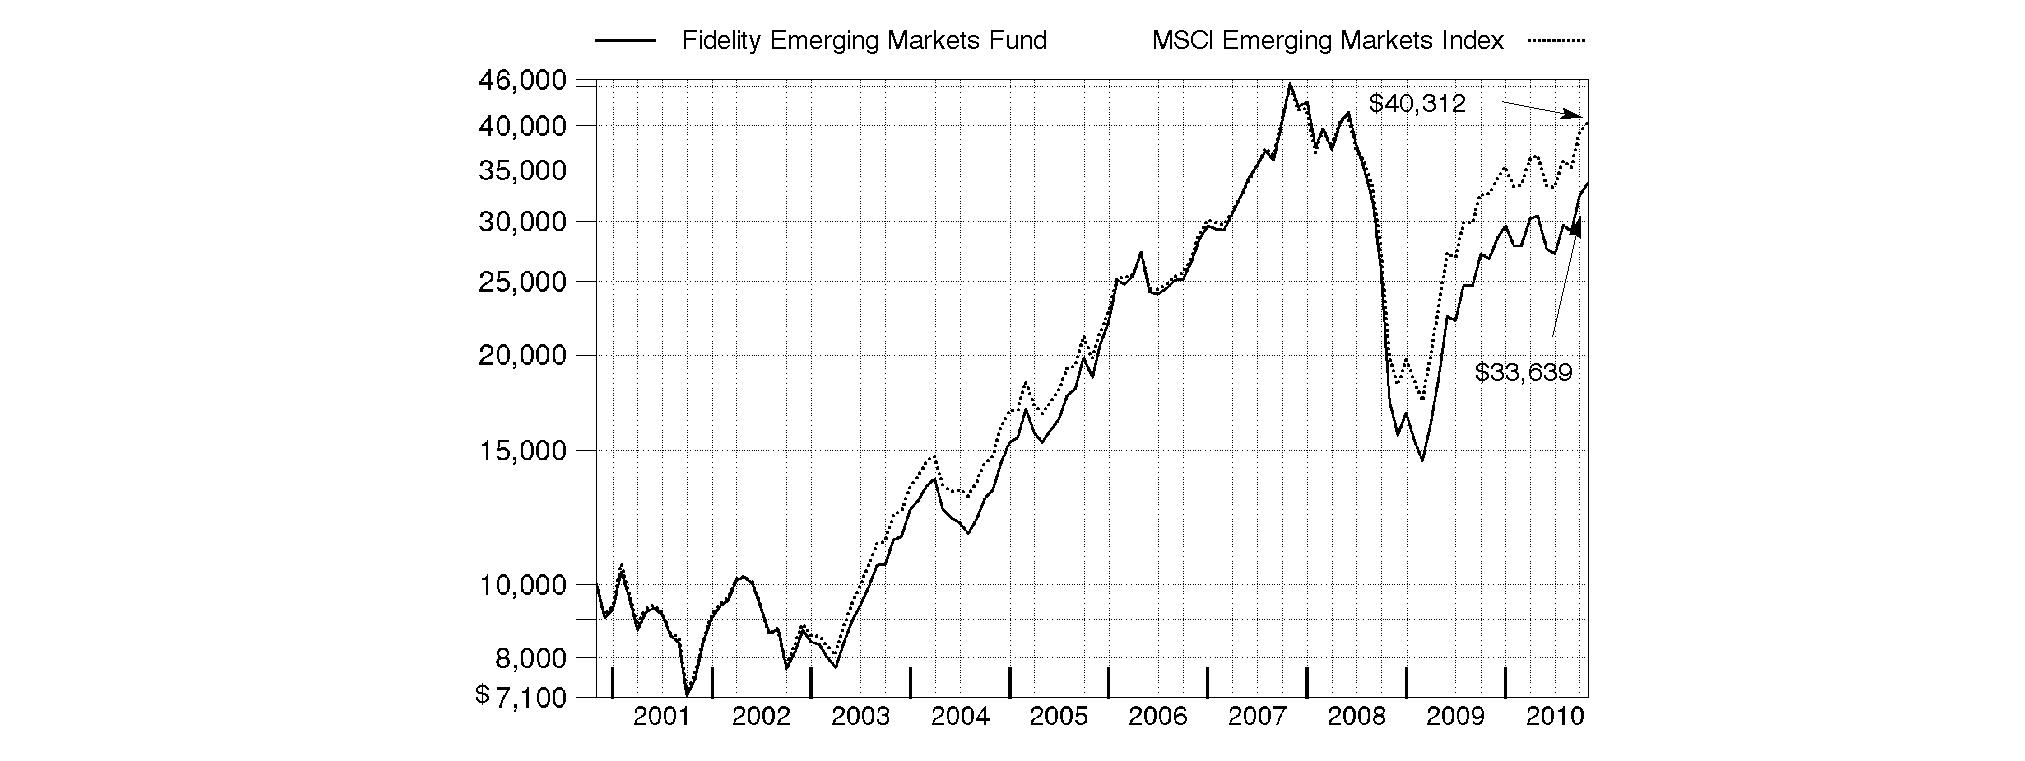
Annual Report
Fidelity Emerging Markets Fund
Management's Discussion of Fund Performance
Market Recap: International stocks rode a wave of volatility similar to that of their U.S. counterparts during the 12 months ending October 31, 2010. Stocks gained modestly in the first half of the period, despite growing concerns about the European debt crisis. Sentiment turned decidedly negative in May and June, however, and the market suffered a precipitous decline. These losses were more than offset during the last four months of the period, when signs of economic growth and subsiding debt fears helped propel international stocks about 21%. For the full year, the MSCI® ACWI® (All Country World Index) ex USA Index gained 12.76%, boosted in part by a generally depreciating U.S. dollar. Within the index, Canada and emerging markets were standouts, returning 23% and 24%, respectively. Results in the latter group were led by strong-performing India, Mexico and South Africa, while China fell short of the MSCI benchmark due to cooling economic growth. The developed Asia ex Japan segment rose 16% for the period, lifted by solid results from Singapore and Hong Kong. Meanwhile, Europe rose just 9%, held back mainly by debt-riddled Spain and Italy, as well as lagging major constituent France. Japan returned only 5%, a result of that nation's continued weak economy.
Comments from Robert von Rekowsky, Portfolio Manager of Fidelity® Emerging Markets Fund: During the past year, the fund's Retail Class shares gained 25.76%, topping the 23.89% gain of the MSCI Emerging Markets Index. Relative performance was aided by stock selection and an overweighting in consumer discretionary. Solid picks in information technology, energy and materials also bolstered our results, as did underweighting financials. From a country standpoint, security selection in Russia, China, India and South Korea aided performance, along with an overweighting and rewarding stock picking in Indonesia. Two Chinese stocks topped our list of relative contributors: an out-of-benchmark stake in Internet search/advertising Baidu and not owning weak-performing index component China Life Insurance. Indonesian tobacco producer/distributor Gudang Garam also bolstered results. On the negative side, a small cash position dampened the fund's gain in a rising market. Weak stock selection and an underweighting in industrials also hurt, as did lackluster picks in utilities and telecommunication services. Geographically, our selections in Brazil were weak, and underweighting Chile also hurt. Hungarian holding OTP Bank suffered from that nation's decision to impose a bank tax, and I liquidated the position. Russian oil producer Rosneft also detracted.
The views expressed above reflect those of the portfolio manager(s) only through the end of the period as stated on the cover of this report and do not necessarily represent the views of Fidelity or any other person in the Fidelity organization. Any such views are subject to change at any time based upon market or other conditions and Fidelity disclaims any responsibility to update such views. These views may not be relied on as investment advice and, because investment decisions for a Fidelity fund are based on numerous factors, may not be relied on as an indication of trading intent on behalf of any Fidelity fund.
Annual Report
Fidelity Emerging Markets Fund
As a shareholder of the Fund, you incur two types of costs: (1) transaction costs, including redemption fees, and (2) ongoing costs, including management fees and other Fund expenses. This Example is intended to help you understand your ongoing costs (in dollars) of investing in the Fund and to compare these costs with the ongoing costs of investing in other mutual funds.
The Example is based on an investment of $1,000 invested at the beginning of the period and held for the entire period (May 1, 2010 to October 31, 2010).
Actual Expenses
The first line of the accompanying table for each class of the Fund provides information about actual account values and actual expenses. You may use the information in this line, together with the amount you invested, to estimate the expenses that you paid over the period. Simply divide your account value by $1,000.00 (for example, an $8,600 account value divided by $1,000.00 = 8.6), then multiply the result by the number in the first line for a class of the Fund under the heading entitled "Expenses Paid During Period" to estimate the expenses you paid on your account during this period. A small balance maintenance fee of $12.00 that is charged once a year may apply for certain accounts with a value of less than $2,000. This fee is not included in the table below. If it was, the estimate of expenses you paid during the period would be higher, and your ending account value lower, by this amount. In addition, the Fund, as a shareholder in the underlying Fidelity Central Funds, will indirectly bear its pro-rata share of the fees and expenses incurred by the underlying Fidelity Central Funds. These fees and expenses are not included in the Fund's annualized expense ratio used to calculate the expense estimate in the table below.
Hypothetical Example for Comparison Purposes
The second line of the accompanying table for each class of the Fund provides information about hypothetical account values and hypothetical expenses based on a Class' actual expense ratio and an assumed rate of return of 5% per year before expenses, which is not the Class' actual return. The hypothetical account values and expenses may not be used to estimate the actual ending account balance or expenses you paid for the period. You may use this information to compare the ongoing costs of investing in the Fund and other funds. To do so, compare this 5% hypothetical example with the 5% hypothetical examples that appear in the shareholder reports of the other funds. A small balance maintenance fee of $12.00 that is charged once a year may apply for certain accounts with a value of less than $2,000. This fee is not included in the table below. If it was, the estimate of expenses you paid during the period would be higher, and your ending account value lower, by this amount. In addition, the Fund, as a shareholder in the underlying Fidelity Central Funds, will indirectly bear its pro-rata share of the fees and expenses incurred by the underlying Fidelity Central Funds. These fees and expenses are not included in the Fund's annualized expense ratio used to calculate the expense estimate in the table below.
Please note that the expenses shown in the table are meant to highlight your ongoing costs only and do not reflect any transaction costs. Therefore, the second line of the table is useful in comparing ongoing costs only, and will not help you determine the relative total costs of owning different funds. In addition, if these transactional costs were included, your costs would have been higher.
| Annualized
Expense Ratio | Beginning
Account Value
May 1, 2010 | Ending
Account Value
October 31, 2010 | Expenses Paid
During Period*
May 1, 2010 to October 31, 2010 |
Emerging Markets | 1.13% | | | |
Actual | | $ 1,000.00 | $ 1,105.80 | $ 6.00 |
Hypothetical A | | $ 1,000.00 | $ 1,019.51 | $ 5.75 |
Class K | .90% | | | |
Actual | | $ 1,000.00 | $ 1,107.10 | $ 4.78 |
Hypothetical A | | $ 1,000.00 | $ 1,020.67 | $ 4.58 |
A 5% return per year before expenses
* Expenses are equal to each Class' annualized expense ratio, multiplied by the average account value over the period, multiplied by 184/365 (to reflect the one-half year period).
Annual Report
Fidelity Emerging Markets Fund
Investment Changes (Unaudited)
Geographic Diversification (% of fund's net assets) |
As of October 31, 2010 |
| Brazil | 13.6% | |
| Korea (South) | 11.6% | |
| India | 8.7% | |
| Russia | 7.9% | |
| China | 7.8% | |
| Taiwan | 7.0% | |
| South Africa | 6.4% | |
| Indonesia | 6.0% | |
| Hong Kong | 4.0% | |
| Other | 27.0% | |

Percentages are adjusted for the effect of futures contracts, if applicable. |
As of April 30, 2010 |
| Brazil | 14.0% | |
| Korea (South) | 12.0% | |
| Russia | 8.5% | |
| China | 7.9% | |
| South Africa | 7.5% | |
| Taiwan | 6.8% | |
| India | 6.7% | |
| Indonesia | 4.4% | |
| Hong Kong | 4.0% | |
| Other | 28.2% | |

Percentages are adjusted for the effect of futures contracts, if applicable. |
Asset Allocation |
| % of fund's
net assets | % of fund's net assets
6 months ago |
Stocks | 98.2 | 97.2 |
Short-Term Investments and Net Other Assets | 1.8 | 2.8 |
Top Ten Stocks as of October 31, 2010 |
| % of fund's
net assets | % of fund's net assets
6 months ago |
America Movil SAB de CV Series L sponsored ADR (Mexico, Wireless Telecommunication Services) | 2.1 | 1.3 |
Petroleo Brasileiro SA - Petrobras (PN) (non-vtg.) (Brazil, Oil, Gas & Consumable Fuels) | 2.0 | 2.9 |
Vale SA (PN-A) sponsored ADR (Brazil, Metals & Mining) | 2.0 | 3.5 |
Samsung Electronics Co. Ltd. (Korea (South), Semiconductors & Semiconductor Equipment) | 1.9 | 2.5 |
Banco Bradesco SA (PN) sponsored ADR (Brazil, Commercial Banks) | 1.8 | 1.3 |
CNOOC Ltd. (Hong Kong, Oil, Gas & Consumable Fuels) | 1.8 | 1.5 |
Industrial & Commercial Bank of China Ltd. (H Shares) (China, Commercial Banks) | 1.8 | 1.6 |
China Mobile (Hong Kong) Ltd. (Hong Kong, Wireless Telecommunication Services) | 1.5 | 1.3 |
Hyundai Motor Co. (Korea (South), Automobiles) | 1.4 | 1.3 |
Sberbank (Savings Bank of the Russian Federation) (Russia, Commercial Banks) | 1.4 | 1.2 |
| 17.7 | |
Market Sectors as of October 31, 2010 |
| % of fund's
net assets | % of fund's net assets
6 months ago |
Financials | 26.0 | 22.0 |
Materials | 16.0 | 16.3 |
Energy | 13.3 | 13.1 |
Consumer Discretionary | 10.7 | 8.3 |
Information Technology | 9.4 | 14.6 |
Industrials | 7.2 | 5.5 |
Telecommunication Services | 6.9 | 7.5 |
Consumer Staples | 5.0 | 4.5 |
Utilities | 2.0 | 2.8 |
Health Care | 1.7 | 2.6 |
Annual Report
Fidelity Emerging Markets Fund
Investments October 31, 2010
Showing Percentage of Net Assets
Common Stocks - 98.2% |
| Shares | | Value |
Argentina - 0.4% |
Banco Macro SA sponsored ADR | 363,700 | | $ 18,130,445 |
Austria - 0.2% |
Erste Bank AG | 218,600 | | 9,864,265 |
Bahamas (Nassau) - 0.2% |
Petrominerales Ltd. | 290,000 | | 7,429,846 |
Bailiwick of Jersey - 0.7% |
Heritage Oil PLC | 1,647,993 | | 9,095,944 |
Randgold Resources Ltd. sponsored ADR | 199,700 | | 18,755,824 |
West China Cement Ltd. (a) | 14,412,000 | | 5,577,939 |
TOTAL BAILIWICK OF JERSEY | | 33,429,707 |
Bermuda - 2.4% |
Aquarius Platinum Ltd.: | | | |
(Australia) | 3,233,117 | | 18,592,187 |
(United Kingdom) | 1,080,422 | | 6,236,786 |
China Yurun Food Group Ltd. | 5,091,000 | | 19,802,438 |
CNPC (Hong Kong) Ltd. | 15,122,000 | | 19,235,984 |
Credicorp Ltd. (NY Shares) | 91,200 | | 11,480,256 |
Jinhui Shipping & Transportation Ltd. (a) | 476,400 | | 1,894,445 |
Orient Overseas International Ltd. | 2,771,000 | | 24,291,495 |
Sinofert Holdings Ltd. (a) | 14,732,000 | | 7,792,446 |
Texwinca Holdings Ltd. | 7,198,000 | | 7,856,163 |
TOTAL BERMUDA | | 117,182,200 |
Brazil - 13.6% |
AES Tiete SA (PN) (non-vtg.) | 659,800 | | 9,094,939 |
Banco Bradesco SA (PN) sponsored ADR (d) | 4,218,750 | | 87,750,000 |
Banco do Brasil SA | 1,781,300 | | 34,658,494 |
Banco do Estado do Rio Grande do Sul SA | 484,900 | | 5,327,287 |
Brascan Residential Properties SA | 806,600 | | 4,390,498 |
Brasil Insurance Participacoes e Administracao SA (a) | 6,400 | | 5,078,768 |
Companhia de Bebidas das Americas (AmBev) (PN) sponsored ADR | 238,200 | | 33,166,968 |
Companhia Energetica de Minas Gerais (CEMIG) (PN) sponsored ADR (non-vtg.) (d) | 9,515 | | 169,748 |
Companhia Siderurgica Nacional SA (CSN) sponsored ADR (d) | 2,292,396 | | 38,695,644 |
Confab Industrial SA (PN) (non-vtg.) | 791,900 | | 2,862,794 |
Drogasil SA | 317,000 | | 8,018,170 |
Eletropaulo Metropolitana SA (PN-B) | 360,900 | | 6,300,688 |
Estacio Participacoes SA | 351,400 | | 5,248,692 |
Even Construtora e Incorporadora SA | 598,400 | | 3,404,957 |
Fleury SA | 391,400 | | 5,061,604 |
Gafisa SA sponsored ADR (d) | 1,600,670 | | 26,875,249 |
Light SA | 657,200 | | 8,274,879 |
Localiza Rent A Car SA | 1,152,700 | | 19,073,892 |
Lojas Renner SA | 650,800 | | 25,707,595 |
Natura Cosmeticos SA | 718,900 | | 20,579,844 |
OGX Petroleo e Gas Participacoes SA (a) | 3,841,800 | | 50,404,994 |
|
| Shares | | Value |
OSX Brasil SA | 14,300 | | $ 4,597,990 |
PDG Realty SA Empreendimentos e Participacoes | 1,985,200 | | 24,820,835 |
Petroleo Brasileiro SA - Petrobras: | | | |
(ON) sponsored ADR | 435,500 | | 14,859,260 |
(PN) (non-vtg.) | 2,069,000 | | 31,438,778 |
(PN) sponsored ADR (non-vtg.) (d) | 2,159,621 | | 67,358,579 |
TIM Participacoes SA sponsored ADR (non-vtg.) | 543,200 | | 17,523,632 |
Vale SA (PN-A) sponsored ADR | 3,341,298 | | 95,995,492 |
Weg SA | 432,500 | | 5,585,484 |
TOTAL BRAZIL | | 662,325,754 |
Canada - 1.8% |
Eldorado Gold Corp. | 1,211,911 | | 20,521,329 |
First Quantum Minerals Ltd. | 307,000 | | 26,883,194 |
Niko Resources Ltd. | 113,600 | | 10,837,612 |
Pacific Rubiales Energy Corp. (a) | 175,400 | | 5,590,993 |
Sherritt International Corp. | 801,200 | | 6,229,548 |
Uranium One, Inc. (a) | 3,812,200 | | 15,586,699 |
TOTAL CANADA | | 85,649,375 |
Cayman Islands - 3.0% |
3SBio, Inc. sponsored ADR (a) | 475,177 | | 7,151,414 |
Alibaba.com Ltd. (a) | 2,150,000 | | 4,199,452 |
China Shanshui Cement Group Ltd. | 21,243,000 | | 15,128,058 |
Daphne International Holdings Ltd. | 13,592,000 | | 15,185,515 |
Eurasia Drilling Co. Ltd.: | | | |
GDR (e) | 118,300 | | 3,016,650 |
GDR (Reg. S) | 961,600 | | 24,520,800 |
Evergreen International Holdings Ltd. (a) | 260,000 | | 154,298 |
Geely Automobile Holdings Ltd. (d) | 26,870,000 | | 15,148,770 |
Global Education & Technology Group Ltd. ADR (a) | 18,900 | | 187,677 |
Hidili Industry International Development Ltd. | 14,040,000 | | 14,961,509 |
International Mining Machinery Holdings Ltd. | 10,358,500 | | 9,020,464 |
Kingboard Chemical Holdings Ltd. | 4,456,000 | | 21,672,788 |
Kingboard Chemical Holdings Ltd. warrants 10/31/12 (a) | 285,000 | | 163,251 |
Microport Scientific Corp. | 180,000 | | 183,454 |
Shenguan Holdings Group Ltd. | 4,400,000 | | 5,733,269 |
Trina Solar Ltd. ADR (a)(d) | 320,200 | | 8,568,552 |
TOTAL CAYMAN ISLANDS | | 144,995,921 |
China - 7.8% |
Anhui Expressway Co. Ltd. (H Shares) | 6,682,000 | | 5,086,122 |
Baidu.com, Inc. sponsored ADR (a) | 197,022 | | 21,674,390 |
China Communications Services Corp. Ltd. (H Shares) | 14,080,000 | | 8,210,495 |
China Construction Bank Corp.
(H Shares) | 60,060,000 | | 57,260,881 |
China Merchants Bank Co. Ltd.
(H Shares) | 14,225,805 | | 40,376,418 |
Common Stocks - continued |
| Shares | | Value |
China - continued |
China Minsheng Banking Corp. Ltd.
(H Shares) | 12,528,000 | | $ 11,653,202 |
China Suntien Green Energy Corp. Ltd.
(H Shares) | 928,000 | | 312,476 |
Digital China Holdings Ltd. (H Shares) | 4,110,000 | | 7,423,319 |
Golden Eagle Retail Group Ltd.
(H Shares) | 7,900,000 | | 20,995,323 |
Harbin Power Equipment Co. Ltd.
(H Shares) | 11,592,000 | | 15,613,028 |
Industrial & Commercial Bank of China Ltd. (H Shares) | 106,013,000 | | 85,343,799 |
Minth Group Ltd. | 10,024,000 | | 18,751,556 |
Ping An Insurance Group Co. China Ltd. (H Shares) | 4,712,500 | | 50,734,801 |
Weichai Power Co. Ltd. (H Shares) | 778,000 | | 10,217,758 |
Yantai Changyu Pioneer Wine Co.
(B Shares) | 1,957,146 | | 25,224,175 |
Zhaojin Mining Industry Co. Ltd.
(H Shares) | 792,500 | | 2,464,022 |
TOTAL CHINA | | 381,341,765 |
Colombia - 0.6% |
Ecopetrol SA ADR (d) | 573,525 | | 27,380,084 |
Czech Republic - 1.2% |
Ceske Energeticke Zavody AS | 568,800 | | 25,201,424 |
Komercni Banka AS | 137,400 | | 31,176,095 |
TOTAL CZECH REPUBLIC | | 56,377,519 |
Egypt - 0.8% |
Commercial International Bank Ltd. sponsored GDR | 5,117,374 | | 39,147,911 |
Georgia - 0.2% |
Bank of Georgia unit (a) | 448,188 | | 7,390,620 |
Hong Kong - 4.0% |
China Mobile (Hong Kong) Ltd. | 7,269,900 | | 74,242,502 |
Chow Sang Sang Holdings International Ltd. | 1,852,000 | | 4,874,156 |
CNOOC Ltd. | 30,682,000 | | 64,055,369 |
CNOOC Ltd. sponsored ADR (d) | 110,600 | | 23,106,552 |
I.T Ltd. | 4,784,000 | | 4,036,428 |
Shanghai Industrial Holdings Ltd. | 5,539,000 | | 25,511,021 |
TOTAL HONG KONG | | 195,826,028 |
Hungary - 0.2% |
Egis Rt. | 64,600 | | 7,589,391 |
India - 8.7% |
Bank of Baroda | 1,332,680 | | 31,619,725 |
Bharat Heavy Electricals Ltd. | 490,562 | | 27,065,853 |
Housing Development Finance Corp. Ltd. | 2,826,029 | | 43,845,689 |
Idea Cellular Ltd. (a) | 5,594,676 | | 8,513,500 |
Indian Oil Corp. Ltd. | 712,749 | | 6,722,272 |
Indian Overseas Bank | 2,111,333 | | 7,611,755 |
Infosys Technologies Ltd. sponsored ADR | 754,687 | | 50,896,091 |
Infotech Enterprises Ltd. | 635,785 | | 2,346,631 |
|
| Shares | | Value |
Infrastructure Development Finance Co. Ltd. | 5,973,371 | | $ 26,959,343 |
ITC Ltd. | 3,000 | | 11,587 |
Jain Irrigation Systems Ltd. | 3,891,395 | | 20,367,821 |
JSW Steel Ltd. | 1,009,390 | | 30,559,525 |
LIC Housing Finance Ltd. | 158,724 | | 4,800,394 |
Radico Khaitan Ltd. | 791,817 | | 3,194,064 |
Reliance Industries Ltd. | 2,424,858 | | 59,971,813 |
Rural Electrification Corp. Ltd. | 2,926,131 | | 24,468,595 |
Shriram Transport Finance Co. Ltd. | 521,712 | | 10,374,212 |
Tata Consultancy Services Ltd. | 1,723,966 | | 40,951,243 |
Tata Steel Ltd. | 469,734 | | 6,246,164 |
Ultratech Cement Ltd. | 694,085 | | 17,223,330 |
TOTAL INDIA | | 423,749,607 |
Indonesia - 6.0% |
Indofood Sukses Makmur Tbk PT (a) | 6,969,500 | | 4,444,879 |
PT Astra International Tbk | 5,823,000 | | 37,136,858 |
PT Bank Mandiri (Persero) Tbk | 12,596,500 | | 9,865,780 |
PT Bank Negara Indonesia (Persero) Tbk | 53,406,500 | | 23,304,631 |
PT Bank Rakyat Indonesia Tbk | 26,382,500 | | 33,651,491 |
PT Bank Tabungan Negara Tbk | 31,323,000 | | 6,974,289 |
PT Bumi Serpong Damai Tbk | 42,621,500 | | 4,005,821 |
PT Ciputra Development Tbk (a) | 98,853,500 | | 4,645,419 |
PT Delta Dunia Petroindo Tbk (a) | 61,669,500 | | 7,383,082 |
PT Gudang Garam Tbk | 4,659,000 | | 24,865,351 |
PT Indo Tambangraya Megah Tbk | 2,801,000 | | 14,165,603 |
PT Indocement Tunggal Prakarsa Tbk | 14,414,500 | | 29,514,415 |
PT Indofood Sukses Makmur Tbk | 49,381,000 | | 28,730,735 |
PT Kalbe Farma Tbk | 28,924,000 | | 8,656,965 |
PT Perusahaan Gas Negara Tbk Series B | 40,412,100 | | 18,312,598 |
PT Tambang Batubbara Bukit Asam Tbk | 2,894,500 | | 6,363,845 |
PT Tower Bersama Infrastructure Tbk | 40,320,000 | | 11,503,877 |
PT XL Axiata Tbk (a) | 30,148,500 | | 19,396,218 |
TOTAL INDONESIA | | 292,921,857 |
Kazakhstan - 0.3% |
KazMunaiGas Exploration & Production JSC (Reg. S) GDR | 765,611 | | 13,168,509 |
Korea (South) - 11.6% |
Busan Bank | 794,140 | | 9,887,024 |
CJ Corp. | 255,250 | | 18,000,286 |
Daegu Bank Co. Ltd. | 683,020 | | 8,959,132 |
Daelim Industrial Co. | 181,061 | | 14,748,942 |
Doosan Co. Ltd. | 79,510 | | 10,712,106 |
GS Holdings Corp. | 257,960 | | 13,534,582 |
Hanjin Heavy Industries & Consolidated Co. Ltd. | 432,990 | | 16,518,691 |
Honam Petrochemical Corp. | 118,963 | | 26,236,389 |
Hyundai Department Store Co. Ltd. | 60,727 | | 6,723,442 |
Hyundai Heavy Industries Co. Ltd. | 106,992 | | 34,871,109 |
Hyundai Mobis | 192,422 | | 47,912,986 |
Hyundai Motor Co. | 457,060 | | 69,097,545 |
Industrial Bank of Korea | 2,202,190 | | 31,627,713 |
Common Stocks - continued |
| Shares | | Value |
Korea (South) - continued |
Kia Motors Corp. | 986,550 | | $ 39,391,809 |
KT Corp. | 478,990 | | 18,884,825 |
LG Chemical Ltd. | 60,514 | | 18,673,504 |
Lumens Co. Ltd. (a) | 760,009 | | 6,758,638 |
NCsoft Corp. | 98,911 | | 21,770,092 |
Samsung Electronics Co. Ltd. | 136,619 | | 90,512,353 |
Shinhan Financial Group Co. Ltd. | 1,214,820 | | 47,047,935 |
Tong Yang Securities, Inc. | 966,660 | | 9,756,860 |
Young Poong Precision Corp. | 230,057 | | 2,690,306 |
TOTAL KOREA (SOUTH) | | 564,316,269 |
Lebanon - 0.0% |
BLOM Bank SAL GDR | 247,400 | | 2,276,080 |
Luxembourg - 0.8% |
Evraz Group SA GDR (a) | 791,949 | | 24,011,894 |
Millicom International Cellular SA | 182,500 | | 17,264,500 |
TOTAL LUXEMBOURG | | 41,276,394 |
Malaysia - 0.8% |
AirAsia Bhd (a) | 8,069,300 | | 6,406,677 |
Axiata Group Bhd (a) | 13,866,600 | | 20,013,190 |
RHB Capital BHD | 2,223,000 | | 5,737,927 |
Top Glove Corp. Bhd | 4,374,400 | | 7,733,590 |
TOTAL MALAYSIA | | 39,891,384 |
Mexico - 2.6% |
America Movil SAB de CV Series L sponsored ADR | 1,795,733 | | 102,823,666 |
Banco Compartamos SA de CV | 2,500,800 | | 17,715,477 |
Genomma Lab Internacional SA de CV (a) | 3,371,200 | | 7,323,533 |
TOTAL MEXICO | | 127,862,676 |
Nigeria - 0.3% |
Guaranty Trust Bank PLC GDR (Reg. S) | 2,221,301 | | 16,126,645 |
Norway - 0.1% |
Det Norske Oljeselskap ASA (DNO)
(A Shares) (a)(d) | 2,936,300 | | 4,610,442 |
Peru - 0.6% |
Compania de Minas Buenaventura SA sponsored ADR | 582,600 | | 30,901,104 |
Poland - 0.1% |
Bank Handlowy w Warszawie SA | 210,365 | | 6,641,824 |
Qatar - 0.3% |
Commercial Bank of Qatar GDR (Reg. S) | 2,702,839 | | 12,384,856 |
Russia - 7.9% |
Cherkizovo Group OJSC GDR (a) | 485,391 | | 9,888,943 |
LSR Group OJSC GDR (Reg. S) (a) | 722,900 | | 6,144,650 |
Magnit OJSC GDR (Reg. S) | 1,249,300 | | 33,406,282 |
Mechel Steel Group OAO sponsored ADR | 950,200 | | 22,377,210 |
OAO NOVATEK GDR | 515,958 | | 49,351,383 |
OAO Raspadskaya (a) | 844,900 | | 4,919,715 |
|
| Shares | | Value |
OAO Tatneft sponsored ADR | 947,500 | | $ 29,893,625 |
OJSC MMC Norilsk Nickel sponsored ADR | 1,822,141 | | 33,982,930 |
OJSC Oil Company Rosneft GDR
(Reg. S) | 6,190,100 | | 43,144,997 |
Polymetal JSC GDR (Reg. S) (a) | 1,636,564 | | 25,857,711 |
Protek (a) | 293,800 | | 533,347 |
RusHydro JSC: | | | |
rights 6/30/10 (a) | 3,096,263 | | 159,674 |
sponsored ADR (a) | 4,157,133 | | 21,513,163 |
Sberbank (Savings Bank of the Russian Federation) | 13,713,000 | | 45,064,903 |
Sberbank (Savings Bank of the Russian Federation) GDR | 60,933 | | 22,892,010 |
Severstal JSC (a) | 467,200 | | 6,376,102 |
Sistema JSFC sponsored GDR | 890,621 | | 22,978,022 |
TGK-1 OAO (a) | 6,882,675,325 | | 4,776,577 |
TOTAL RUSSIA | | 383,261,244 |
Singapore - 0.8% |
Keppel Corp. Ltd. | 2,227,000 | | 17,171,799 |
Straits Asia Resources Ltd. | 9,109,000 | | 16,116,519 |
Yanlord Land Group Ltd. | 3,704,000 | | 4,922,259 |
TOTAL SINGAPORE | | 38,210,577 |
South Africa - 6.4% |
African Bank Investments Ltd. | 5,509,999 | | 28,269,515 |
African Rainbow Minerals Ltd. | 994,398 | | 25,368,679 |
AngloGold Ashanti Ltd. | 589,300 | | 27,638,213 |
AngloGold Ashanti Ltd. sponsored ADR | 348,600 | | 16,422,546 |
Aspen Pharmacare Holdings Ltd. | 1,479,177 | | 19,743,335 |
Clicks Group Ltd. | 2,764,327 | | 18,034,096 |
Foschini Ltd. | 1,921,394 | | 23,322,622 |
Imperial Holdings Ltd. | 48,385 | | 789,143 |
Mr Price Group Ltd. | 3,052,145 | | 27,737,068 |
Mvelaphanda Resources Ltd. (a) | 3,358,378 | | 21,957,547 |
Shoprite Holdings Ltd. | 1,843,435 | | 26,057,906 |
Standard Bank Group Ltd. | 3,028,681 | | 44,662,457 |
Wilson Bayly Holmes-Ovcon Ltd. | 396,657 | | 7,665,816 |
Woolworths Holdings Ltd. | 6,307,716 | | 24,717,426 |
TOTAL SOUTH AFRICA | | 312,386,369 |
Spain - 0.3% |
Banco Bilbao Vizcaya Argentaria SA sponsored ADR | 658,724 | | 8,662,221 |
Banco Santander SA sponsored ADR | 343,700 | | 4,402,797 |
TOTAL SPAIN | | 13,065,018 |
Taiwan - 7.0% |
Advanced Semiconductor Engineering, Inc. | 5,698,605 | | 4,961,557 |
Advanced Semiconductor Engineering, Inc. sponsored ADR (d) | 4,129,481 | | 18,293,601 |
Alpha Networks, Inc. | 8,089,000 | | 7,189,048 |
Asia Cement Corp. | 19,796,301 | | 20,407,558 |
Common Stocks - continued |
| Shares | | Value |
Taiwan - continued |
Chroma ATE, Inc. | 3,913,256 | | $ 10,075,627 |
Farglory Land Development Co. Ltd. | 3,224,000 | | 8,006,012 |
Formosa Plastics Corp. | 14,818,000 | | 42,510,061 |
Fubon Financial Holding Co. Ltd. | 24,000,651 | | 29,407,758 |
HTC Corp. | 2,520,100 | | 56,898,844 |
Huaku Development Co. Ltd. | 2,551,000 | | 7,076,618 |
Macronix International Co. Ltd. | 39,999,113 | | 24,635,951 |
Pegatron Corp. (a) | 8,394,000 | | 11,368,446 |
Ruentex Development Co. Ltd. | 2,587,000 | | 4,294,057 |
Taishin Financial Holdings Co. Ltd. | 61,465,380 | | 26,911,815 |
Taiwan Cement Corp. | 10,256,000 | | 10,924,542 |
Taiwan Semiconductor Manufacturing Co. Ltd. | 10,725,447 | | 22,077,493 |
Unimicron Technology Corp. | 2,828,000 | | 4,814,207 |
Wistron Corp. | 14,414,635 | | 29,625,243 |
TOTAL TAIWAN | | 339,478,438 |
Thailand - 1.4% |
Advanced Info Service PCL (For. Reg.) | 5,978,900 | | 17,972,646 |
Banpu PCL (For. Reg.) | 523,000 | | 13,520,441 |
BEC World PCL (For. Reg.) | 8,241,200 | | 9,152,301 |
Siam Commercial Bank PCL (For. Reg.) | 8,516,300 | | 29,155,670 |
Total Access Communication PCL (For. Reg.) | 105,200 | | 147,575 |
TOTAL THAILAND | | 69,948,633 |
Turkey - 3.2% |
Enka Insaat ve Sanayi AS | 2,195,888 | | 10,027,934 |
Sinpas Gayrimenkul Yatirim Ortakligi AS (a) | 4,277,000 | | 6,500,634 |
Tofas Turk Otomobil Fabrikasi AS | 3,432,151 | | 19,023,636 |
Turk Hava Yollari AO | 8,176,571 | | 33,919,401 |
Turkiye Garanti Bankasi AS | 9,585,895 | | 58,813,272 |
Turkiye Halk Bankasi AS | 2,524,000 | | 25,516,280 |
TOTAL TURKEY | | 153,801,157 |
United Arab Emirates - 0.3% |
DP World Ltd. | 23,738,830 | | 14,219,559 |
United Kingdom - 0.8% |
Hikma Pharmaceuticals PLC | 1,378,718 | | 17,362,057 |
Xstrata PLC | 1,171,870 | | 22,708,502 |
TOTAL UNITED KINGDOM | | 40,070,559 |
|
| Shares | | Value |
United States of America - 0.8% |
CTC Media, Inc. | 620,100 | | $ 14,634,360 |
Freeport-McMoRan Copper & Gold, Inc. | 273,347 | | 25,880,494 |
TOTAL UNITED STATES OF AMERICA | | 40,514,854 |
TOTAL COMMON STOCKS (Cost $3,568,814,275) | 4,775,144,886 |
Money Market Funds - 3.8% |
| | | |
Fidelity Cash Central Fund, 0.23% (b) | 51,945,705 | | 51,945,705 |
Fidelity Securities Lending Cash Central Fund, 0.24% (b)(c) | 133,749,591 | | 133,749,591 |
TOTAL MONEY MARKET FUNDS (Cost $185,695,296) | 185,695,296 |
TOTAL INVESTMENT PORTFOLIO - 102.0% (Cost $3,754,509,571) | | 4,960,840,182 |
NET OTHER ASSETS (LIABILITIES) - (2.0)% | | (96,869,229) |
NET ASSETS - 100% | $ 4,863,970,953 |
Legend |
(a) Non-income producing |
(b) Affiliated fund that is available only to investment companies and other accounts managed by Fidelity Investments. The rate quoted is the annualized seven-day yield of the fund at period end. A complete unaudited listing of the fund's holdings as of its most recent quarter end is available upon request. In addition, each Fidelity Central Fund's financial statements, which are not covered by the Fund's report of Independent Registered Public Accounting Firm, are available on the SEC's website or upon request. |
(c) Investment made with cash collateral received from securities on loan. |
(d) Security or a portion of the security is on loan at period end. |
(e) Security exempt from registration under Rule 144A of the Securities Act of 1933. These securities may be resold in transactions exempt from registration, normally to qualified institutional buyers. At the end of the period, the value of these securities amounted to $3,016,650 or 0.1% of net assets. |
Affiliated Central Funds |
Information regarding fiscal year to date income earned by the Fund from investments in Fidelity Central Funds is as follows: |
Fund | Income earned |
Fidelity Cash Central Fund | $ 152,773 |
Fidelity Securities Lending Cash Central Fund | 695,966 |
Total | $ 848,739 |
Other Information |
The following is a summary of the inputs used, as of October 31, 2010, involving the Fund's assets and liabilities carried at fair value. The inputs or methodology used for valuing securities may not be an indication of the risk associated with investing in those securities. For more information on valuation inputs, and their aggregation into the levels used in the tables below, please refer to the Security Valuation section in the accompanying Notes to Financial Statements. |
Valuation Inputs at Reporting Date: |
Description | Total | Level 1 | Level 2 | Level 3 |
Investments in Securities: | | | | |
Equities: | | | | |
Brazil | $ 662,325,754 | $ 657,246,986 | $ 5,078,768 | $ - |
Korea (South) | 564,316,269 | 545,431,444 | 18,884,825 | - |
India | 423,749,607 | 392,129,882 | 31,619,725 | - |
Russia | 383,261,244 | 383,261,244 | - | - |
China | 381,341,765 | 381,341,765 | - | - |
Taiwan | 339,478,438 | 312,439,388 | 27,039,050 | - |
South Africa | 312,386,369 | 284,748,156 | 27,638,213 | - |
Indonesia | 292,921,857 | 292,921,857 | - | - |
Hong Kong | 195,826,028 | 57,528,157 | 138,297,871 | - |
Other | 1,219,537,555 | 1,219,383,257 | 154,298 | - |
Money Market Funds | 185,695,296 | 185,695,296 | - | - |
Total Investments in Securities: | $ 4,960,840,182 | $ 4,712,127,432 | $ 248,712,750 | $ - |
The following is a reconciliation of Investments in Securities for which Level 3 inputs were used in determining value: |
Investments in Securities: | |
Beginning Balance | $ 59,240 |
Total Realized Gain (Loss) | (3,687,175) |
Total Unrealized Gain (Loss) | 3,692,447 |
Cost of Purchases | - |
Proceeds of Sales | (64,512) |
Amortization/Accretion | - |
Transfers in to Level 3 | - |
Transfers out of Level 3 | - |
Ending Balance | $ - |
The change in unrealized gain (loss) for the period attributable to Level 3 securities held at October 31, 2010 | $ - |
The information used in the above reconciliation represents fiscal year to date activity for any Investments in Securities identified as using Level 3 inputs at either the beginning or the end of the current fiscal period. Transfers in or out of Level 3 represent the beginning value of any Security or Instrument where a change in the pricing level occurred from the beginning to the end of the period. The cost of purchases and the proceeds of sales may include securities received or delivered through corporate actions or exchanges. Realized and unrealized gains (losses) disclosed in the reconciliation are included in Net Gain (Loss) on the Fund's Statement of Operations. |
Income Tax Information |
At October 31, 2010, the Fund had a capital loss carryforward of approximately $581,445,081 of which $11,565,560 and $569,879,521 will expire on October 31, 2016 and 2017, respectively. Capital loss carryforwards are only available to offset future capital gains of the Fund to the extent provided by regulations and may be limited. |
See accompanying notes which are an integral part of the financial statements.
Annual Report
Fidelity Emerging Markets Fund
Statement of Assets and Liabilities
| October 31, 2010 |
| | |
Assets | | |
Investment in securities, at value (including securities loaned of $130,680,343) - See accompanying schedule: Unaffiliated issuers (cost $3,568,814,275) | $ 4,775,144,886 | |
Fidelity Central Funds (cost $185,695,296) | 185,695,296 | |
Total Investments (cost $3,754,509,571) | | $ 4,960,840,182 |
Foreign currency held at value (cost $1,301,907) | | 1,297,673 |
Receivable for investments sold | | 25,393,050 |
Receivable for fund shares sold | | 32,285,128 |
Dividends receivable | | 7,645,151 |
Distributions receivable from Fidelity Central Funds | | 60,063 |
Other receivables | | 1,818,612 |
Total assets | | 5,029,339,859 |
| | |
Liabilities | | |
Payable for investments purchased | $ 18,095,363 | |
Payable for fund shares redeemed | 4,146,034 | |
Accrued management fee | 2,825,240 | |
Other affiliated payables | 1,043,321 | |
Other payables and accrued expenses | 5,509,357 | |
Collateral on securities loaned, at value | 133,749,591 | |
Total liabilities | | 165,368,906 |
| | |
Net Assets | | $ 4,863,970,953 |
Net Assets consist of: | | |
Paid in capital | | $ 4,249,475,033 |
Undistributed net investment income | | 44,633,128 |
Accumulated undistributed net realized gain (loss) on investments and foreign currency transactions | | (632,028,917) |
Net unrealized appreciation (depreciation) on investments and assets and liabilities in foreign currencies | | 1,201,891,709 |
Net Assets | | $ 4,863,970,953 |
Emerging Markets:
Net Asset Value, offering price and redemption price per share ($3,975,341,962 ÷ 154,545,221 shares) | | $ 25.72 |
| | |
Class K:
Net Asset Value, offering price and redemption price per share ($888,628,991 ÷ 34,507,270 shares) | | $ 25.75 |
Statement of Operations
| Year ended October 31, 2010 |
| | |
Investment Income | | |
Dividends | | $ 101,300,180 |
Interest | | 2,008 |
Income from Fidelity Central Funds | | 848,739 |
Income before foreign taxes withheld | | 102,150,927 |
Less foreign taxes withheld | | (11,397,819) |
Total income | | 90,753,108 |
| | |
Expenses | | |
Management fee | $ 30,896,545 | |
Transfer agent fees | 11,669,686 | |
Accounting and security lending fees | 1,569,593 | |
Custodian fees and expenses | 3,986,795 | |
Independent trustees' compensation | 24,412 | |
Registration fees | 136,516 | |
Audit | 118,020 | |
Legal | 20,175 | |
Interest | 4,443 | |
Miscellaneous | 53,667 | |
Total expenses before reductions | 48,479,852 | |
Expense reductions | (2,360,269) | 46,119,583 |
Net investment income (loss) | | 44,633,525 |
Realized and Unrealized Gain (Loss) Net realized gain (loss) on: | | |
Investment securities: | | |
Unaffiliated issuers | 528,879,058 | |
Foreign currency transactions | (4,633,192) | |
Capital gain distributions from Fidelity Central Funds | 4,197 | |
Total net realized gain (loss) | | 524,250,063 |
Change in net unrealized appreciation (depreciation) on: Investment securities (net of decrease in deferred foreign taxes of $1,362,215) | 400,550,127 | |
Assets and liabilities in foreign currencies | 2,454 | |
Total change in net unrealized appreciation (depreciation) | | 400,552,581 |
Net gain (loss) | | 924,802,644 |
Net increase (decrease) in net assets resulting from operations | | $ 969,436,169 |
See accompanying notes which are an integral part of the financial statements.
Annual Report
Statement of Changes in Net Assets
| Year ended
October 31,
2010 | Year ended
October 31,
2009 |
Increase (Decrease) in Net Assets | | |
Operations | | |
Net investment income (loss) | $ 44,633,525 | $ 29,313,306 |
Net realized gain (loss) | 524,250,063 | (579,779,624) |
Change in net unrealized appreciation (depreciation) | 400,552,581 | 1,728,712,395 |
Net increase (decrease) in net assets resulting from operations | 969,436,169 | 1,178,246,077 |
Distributions to shareholders from net investment income | (23,159,233) | (37,630,187) |
Distributions to shareholders from net realized gain | (26,416,955) | - |
Total distributions | (49,576,188) | (37,630,187) |
Share transactions - net increase (decrease) | 23,065,054 | 603,896,717 |
Redemption fees | 1,389,036 | 1,520,594 |
Total increase (decrease) in net assets | 944,314,071 | 1,746,033,201 |
| | |
Net Assets | | |
Beginning of period | 3,919,656,882 | 2,173,623,681 |
End of period (including undistributed net investment income of $44,633,128 and undistributed net investment income of $23,182,142, respectively) | $ 4,863,970,953 | $ 3,919,656,882 |
Financial Highlights - Emerging Markets
Years ended October 31, | 2010 | 2009 | 2008 | 2007 | 2006 |
Selected Per-Share Data | | | | | |
Net asset value, beginning of period | $ 20.68 | $ 13.71 | $ 37.55 | $ 22.04 | $ 15.71 |
Income from Investment Operations | | | | | |
Net investment income (loss) B | .23 | .17 | .42 E | .25 | .21 |
Net realized and unrealized gain (loss) | 5.05 | 7.03 | (22.73) | 15.44 | 6.31 |
Total from investment operations | 5.28 | 7.20 | (22.31) | 15.69 | 6.52 |
Distributions from net investment income | (.12) | (.24) | (.19) | (.20) | (.21) |
Distributions from net realized gain | (.14) | - | (1.37) | - | - |
Total distributions | (.25) G | (.24) | (1.56) | (.20) | (.21) |
Redemption fees added to paid in capital B | .01 | .01 | .03 | .02 | .02 |
Net asset value, end of period | $ 25.72 | $ 20.68 | $ 13.71 | $ 37.55 | $ 22.04 |
Total Return A | 25.76% | 53.95% | (61.84)% | 71.81% | 41.96% |
Ratios to Average Net Assets C,F | | | | | |
Expenses before reductions | 1.14% | 1.16% | 1.07% | 1.05% | 1.11% |
Expenses net of fee waivers, if any | 1.14% | 1.16% | 1.07% | 1.05% | 1.11% |
Expenses net of all reductions | 1.09% | 1.10% | 1.02% | .99% | 1.01% |
Net investment income (loss) | 1.00% | 1.09% | 1.47% E | .89% | 1.04% |
Supplemental Data | | | | | |
Net assets, end of period (000 omitted) | $ 3,975,342 | $ 3,649,582 | $ 2,086,196 | $ 6,609,045 | $ 3,005,145 |
Portfolio turnover rate D | 85% | 88% | 63% | 52% | 66% |
A Total returns would have been lower had certain expenses not been reduced during the periods shown.
B Calculated based on average shares outstanding during the period.
C Fees and expenses of the underlying Fidelity Central Funds are not included in the Fund's expense ratio. The Fund indirectly bears its proportionate share of the expenses of any underlying Fidelity Central Funds.
D Amount does not include the portfolio activity of any underlying Fidelity Central Funds.
E Investment income per share reflects a special dividend which amounted to $.09 per share. Excluding the special dividend, the ratio of net investment income (loss) to average net assets would have been 1.17%.
F Expense ratios reflect operating expenses of the class. Expenses before reductions do not reflect amounts reimbursed by the investment adviser or reductions from brokerage service arrangements or reductions from other expense offset arrangements and do not represent the amount paid by the class during periods when reimbursements or reductions occur. Expenses net of fee waivers reflect expenses after reimbursement by the investment adviser but prior to reductions from brokerage service arrangements or other expense offset arrangements. Expenses net of all reductions represent the net expenses paid by the class.
G Total distributions of $.25 per share is comprised of distributions from net investment income of $.116 and distributions from net realized gain of $.135 per share.
See accompanying notes which are an integral part of the financial statements.
Annual Report
Financial Highlights - Class K
Years ended October 31, | 2010 | 2009 | 2008 H |
Selected Per-Share Data | | | |
Net asset value, beginning of period | $ 20.69 | $ 13.72 | $ 31.99 |
Income from Investment Operations | | | |
Net investment income (loss) D | .28 | .22 | .15 G |
Net realized and unrealized gain (loss) | 5.05 | 7.02 | (18.43) |
Total from investment operations | 5.33 | 7.24 | (18.28) |
Distributions from net investment income | (.15) | (.28) | - |
Distributions from net realized gain | (.14) | - | - |
Total distributions | (.28) J | (.28) | - |
Redemption fees added to paid in capital D | .01 | .01 | .01 |
Net asset value, end of period | $ 25.75 | $ 20.69 | $ 13.72 |
Total Return B,C | 26.03% | 54.44% | (57.11)% |
Ratios to Average Net Assets E,I | | | |
Expenses before reductions | .90% | .91% | .92% A |
Expenses net of fee waivers, if any | .90% | .91% | .92% A |
Expenses net of all reductions | .84% | .84% | .87% A |
Net investment income (loss) | 1.24% | 1.35% | 2.02% A,G |
Supplemental Data | | | |
Net assets, end of period (000 omitted) | $ 888,629 | $ 270,075 | $ 87,427 |
Portfolio turnover rate F | 85% | 88% | 63% |
A Annualized
B Total returns for periods of less than one year are not annualized.
C Total returns would have been lower had certain expenses not been reduced during the periods shown.
D Calculated based on average shares outstanding during the period.
E Fees and expenses of the underlying Fidelity Central Funds are not included in the Fund's expense ratio. The Fund indirectly bears its proportionate share of the expenses of any underlying Fidelity Central Funds.
F Amount does not include the portfolio activity of any underlying Fidelity Central Funds.
G Investment income per share reflects a special dividend which amounted to $.02 per share. Excluding the special dividend, the ratio of net investment income (loss) to average net assets would have been 1.71%.
H For the period May 9, 2008 (commencement of sale of shares) to October 31, 2008.
I Expense ratios reflect operating expenses of the class. Expenses before reductions do not reflect amounts reimbursed by the investment adviser or reductions from brokerage service arrangements or reductions from other expense offset arrangements and do not represent the amount paid by the class during periods when reimbursements or reductions occur. Expense ratios before reductions for start-up periods may not be representative of longer-term operating periods. Expenses net of fee waivers reflect expenses after reimbursement by the investment adviser but prior to reductions from brokerage service arrangements or other expense offset arrangements. Expenses net of all reductions represent the net expenses paid by the class.
J Total distributions of $.28 per share is comprised of distributions from net investment income of $.148 and distributions from net realized gain of $.135 per share.
See accompanying notes which are an integral part of the financial statements.
Annual Report
Notes to Financial Statements
For the period ended October 31, 2010
1. Organization.
Fidelity Emerging Markets Fund (the Fund) is a fund of Fidelity Investment Trust (the Trust) and is authorized to issue an unlimited number of shares. The Trust is registered under the Investment Company Act of 1940, as amended (the 1940 Act), as an open-end management investment company organized as a Massachusetts business trust. The Fund offers Emerging Markets and Class K shares, each of which has equal rights as to assets and voting privileges. Each class has exclusive voting rights with respect to matters that affect that class. Investment income, realized and unrealized capital gains and losses, the common expenses of the Fund, and certain fund-level expense reductions, if any, are allocated on a pro-rata basis to each class based on the relative net assets of each class to the total net assets of the Fund. Each class differs with respect to transfer agent fees incurred. Certain expense reductions also differ by class. The Fund's investments in emerging markets can be subject to social, economic, regulatory, and political uncertainties and can be extremely volatile.
2. Investments in Fidelity Central Funds.
The Fund may invest in Fidelity Central Funds, which are open-end investment companies available only to other investment companies and accounts managed by Fidelity Management & Research Company (FMR) and its affiliates. The Fund's Schedule of Investments lists each of the Fidelity Central Funds held as of period end, if any, as an investment of the Fund, but does not include the underlying holdings of each Fidelity Central Fund. As an Investing Fund, the Fund indirectly bears its proportionate share of the expenses of the underlying Fidelity Central Funds.
The Money Market Central Funds seek preservation of capital and current income and are managed by Fidelity Investments Money Management, Inc. (FIMM), an affiliate of FMR.
A complete unaudited list of holdings for each Fidelity Central Fund is available upon request or at the Securities and Exchange Commission (the SEC) web site at www.sec.gov. In addition, the financial statements of the Fidelity Central Funds, which are not covered by the Fund's Report of Independent Registered Public Accounting Firm, are available on the SEC web site or upon request.
3. Significant Accounting Policies.
The financial statements have been prepared in conformity with accounting principles generally accepted in the United States of America (GAAP), which require management to make certain estimates and assumptions at the date of the financial statements. Actual results could differ from those estimates. The following summarizes the significant accounting policies of the Fund:
Security Valuation. Investments are valued as of 4:00 p.m. Eastern time on the last calendar day of the period. The Fund uses independent pricing services approved by the Board of Trustees to value its investments. When current market prices or quotations are not readily available or reliable, valuations may be determined in good faith in accordance with procedures adopted by the Board of Trustees. Factors used in determining value may include market or security specific events. The frequency with which these procedures are used cannot be predicted and they may be utilized to a significant extent. The value used for net asset value (NAV) calculation under these procedures may differ from published prices for the same securities.
The Fund categorizes the inputs to valuation techniques used to value its investments into a disclosure hierarchy consisting of three levels as shown below.
Level 1 - quoted prices in active markets for identical investments
Level 2 - other significant observable inputs (including quoted prices for similar investments, interest rates, prepayment speeds, etc.)
Level 3 - unobservable inputs (including the fund's own assumptions based on the best information available)
Changes in valuation techniques may result in transfers in or out of an assigned level within the disclosure hierarchy. The aggregate value of investments by input level, as of October 31, 2010, as well as a roll forward of Level 3 securities, is included at the end of the Fund's Schedule of Investments. Valuation techniques used to value the Fund's investments by major category are as follows.
Equity securities, including restricted securities, for which market quotations are readily available, are valued at the last reported sale price or official closing price as reported by an independent pricing service on the primary market or exchange on which they are traded and are categorized as Level 1 in the hierarchy. In the event there were no sales during the day or closing prices are not available, securities are valued at the last quoted bid price or may be valued using the last available price and are generally categorized as Level 2 in the hierarchy. For foreign equity securities, when significant market or security specific events arise, comparisons to the valuation of American Depositary Receipts (ADRs), futures contracts, Exchange-traded funds (ETFs) and certain indexes as well as quoted prices for similar securities are used and are categorized as Level 2 in the hierarchy in these circumstances. Utilizing these techniques may result in significant transfers between Level 1 and Level 2. For restricted equity securities and private placements where observable inputs are limited, assumptions about market activity and risk are used and are categorized as Level 3 in the hierarchy.
Annual Report
3. Significant Accounting Policies - continued
Security Valuation - continued
Investments in open-end mutual funds, including the Fidelity Central Funds, are valued at their closing net asset value each business day and are categorized as Level 1 in the hierarchy. Short-term securities with remaining maturities of sixty days or less for which quotations are not readily available are valued at amortized cost, which approximates fair value and are categorized as Level 2 in the hierarchy.
Foreign Currency. The Fund uses foreign currency contracts to facilitate transactions in foreign-denominated securities. Gains and losses from these transactions may arise from changes in the value of the foreign currency or if the counterparties do not perform under the contracts' terms.
Foreign-denominated assets, including investment securities, and liabilities are translated into U.S. dollars at the exchange rate at period end. Purchases and sales of investment securities, income and dividends received and expenses denominated in foreign currencies are translated into U.S. dollars at the exchange rate in effect on the transaction date.
The effects of exchange rate fluctuations on investments are included with the net realized and unrealized gain (loss) on investment securities. Other foreign currency transactions resulting in realized and unrealized gain (loss) are disclosed separately.
Investment Transactions and Income. For financial reporting purposes, the Fund's investment holdings and NAV include trades executed through the end of the last business day of the period. The NAV per share for processing shareholder transactions is calculated as of the close of business of the New York Stock Exchange (NYSE), normally 4:00 p.m. Eastern time and includes trades executed through the end of the prior business day. Gains and losses on securities sold are determined on the basis of identified cost and may include proceeds received from litigation. Dividend income is recorded on the ex-dividend date, except for certain dividends from foreign securities where the ex-dividend date may have passed, which are recorded as soon as the Fund is informed of the ex-dividend date. Non-cash dividends included in dividend income, if any, are recorded at the fair market value of the securities received. Distributions received on securities that represent a return of capital or capital gain are recorded as a reduction of cost of investments and/or as a realized gain. The Fund estimates the components of distributions received that may be considered return of capital distributions or capital gain distributions. Interest income and distributions from the Fidelity Central Funds are accrued as earned. Interest income includes coupon interest and amortization of premium and accretion of discount on debt securities. Investment income is recorded net of foreign taxes withheld where recovery of such taxes is uncertain.
Expenses. Most expenses of the Trust can be directly attributed to a fund. Expenses which cannot be directly attributed are apportioned amongst each fund in the Trust. Expense estimates are accrued in the period to which they relate and adjustments are made when actual amounts are known.
Income Tax Information and Distributions to Shareholders. Each year the Fund intends to qualify as a regulated investment company, including distributing substantially all of its taxable income and realized gains under Subchapter M of the Internal Revenue Code and filing its U.S. federal tax return. As a result, no provision for income taxes is required. As of October 31, 2010, the Fund did not have any unrecognized tax benefits in the accompanying financial statements. A fund's federal tax return is subject to examination by the Internal Revenue Service (IRS) for a period of three years. Foreign taxes are provided for based on the Fund's understanding of the tax rules and rates that exist in the foreign markets in which it invests. The Fund is subject to a tax imposed on short term capital gains on securities of certain issuers domiciled in India. The Fund records an estimated deferred tax liability included in Other payables and accrued expenses in the accompanying Statement of Assets & Liabilities for net unrealized gains on these securities in an amount that would be payable if the securities were disposed of at period end.
Distributions are declared and recorded on the ex-dividend date. Income dividends and capital gain distributions are declared separately for each class. Income and capital gain distributions are determined in accordance with income tax regulations, which may differ from GAAP.
Capital accounts within the financial statements are adjusted for permanent book-tax differences. These adjustments have no impact on net assets or the results of operations. Temporary book-tax differences will reverse in a subsequent period.
Book-tax differences are primarily due to the short-term gain distributions from the Fidelity Central Funds, foreign currency transactions, passive foreign investment companies (PFIC), deferred trustees compensation, capital loss carryforwards and losses deferred due to wash sales.
The federal tax cost of investment securities and unrealized appreciation (depreciation) as of period end were as follows:
Gross unrealized appreciation | $ 1,205,006,815 |
Gross unrealized depreciation | (73,553,817) |
Net unrealized appreciation (depreciation) | $ 1,131,452,998 |
| |
Tax Cost | $ 3,829,387,184 |
Annual Report
Notes to Financial Statements - continued
3. Significant Accounting Policies - continued
Income Tax Information and Distributions to Shareholders - continued
The tax-based components of distributable earnings as of period end were as follows:
Undistributed ordinary income | $ 68,927,382 |
Capital loss carryforward | $ (581,445,081) |
Net unrealized appreciation (depreciation) | $ 1,131,567,331 |
The tax character of distributions paid was as follows:
| October 31, 2010 | October 31, 2009 |
Ordinary Income | $ 49,576,188 | $ 37,630,187 |
Short-Term Trading (Redemption) Fees. Shares held by investors in the Fund less than 90 days are subject to a redemption fee equal to 1.50% of the net asset value of shares redeemed. All redemption fees, which reduce the proceeds of the shareholder redemption, are retained by the Fund and accounted for as an addition to paid in capital.
4. Operating Policies.
Restricted Securities. The Fund may invest in securities that are subject to legal or contractual restrictions on resale. These securities generally may be resold in transactions exempt from registration or to the public if the securities are registered. Disposal of these securities may involve time-consuming negotiations and expense, and prompt sale at an acceptable price may be difficult. Information regarding restricted securities is included at the end of the Fund's Schedule of Investments.
5. Purchases and Sales of Investments.
Purchases and sales of securities, other than short-term securities, aggregated $3,595,488,192 and $3,633,115,797, respectively.
6. Fees and Other Transactions with Affiliates.
Management Fee. FMR and its affiliates provide the Fund with investment management related services for which the Fund pays a monthly management fee. The management fee is the sum of an individual fund fee rate that is based on an annual rate of .45% of the Fund's average net assets and a group fee rate that averaged .26% during the period. The group fee rate is based upon the average net assets of all the mutual funds advised by FMR. The group fee rate decreases as assets under management increase and increases as assets under management decrease. For the period, the total annual management fee rate was .71% of the Fund's average net assets.
Transfer Agent Fees. Fidelity Investments Institutional Operations Company, Inc. (FIIOC), an affiliate of FMR, is the transfer, dividend disbursing and shareholder servicing agent for each class of the Fund. FIIOC receives account fees and asset-based fees that vary according to the account size and type of account of the shareholders of Emerging Markets. FIIOC receives an asset-based fee of Class K's average net assets. FIIOC pays for typesetting, printing and mailing of shareholder reports, except proxy statements. For the period, transfer agent fees for each class were as follows:
| Amount | % of
Average
Net Assets |
Emerging Markets | $ 11,414,538 | .29 |
Class K | 255,148 | .05 |
| $ 11,669,686 | |
Accounting and Security Lending Fees. Fidelity Service Company, Inc. (FSC), an affiliate of FMR, maintains the Fund's accounting records. The accounting fee is based on the level of average net assets for the month. Under a separate contract, FSC administers the security lending program. The security lending fee is based on the number and duration of lending transactions.
Brokerage Commissions. The Fund placed a portion of its portfolio transactions with brokerage firms which are affiliates of the investment adviser. The commissions paid to these affiliated firms were $78 for the period.
Annual Report
6. Fees and Other Transactions with Affiliates - continued
Interfund Lending Program. Pursuant to an Exemptive Order issued by the SEC, the Fund, along with other registered investment companies having management contracts with FMR, may participate in an interfund lending program. This program provides an alternative credit facility allowing the funds to borrow from, or lend money to, other participating affiliated funds. At period end, there were no interfund loans outstanding. The Fund's activity in this program during the period for which loans were outstanding was as follows:
Borrower or Lender | Average Daily
Loan Balance | Weighted Average Interest Rate | Interest
Expense |
Borrower | $ 22,161,786 | .46% | $ 3,986 |
7. Committed Line of Credit.
The Fund participates with other funds managed by FMR or an affiliate in a $3.75 billion credit facility (the "line of credit") to be utilized for temporary or emergency purposes to fund shareholder redemptions or for other short-term liquidity purposes. The Fund has agreed to pay commitment fees on its pro-rata portion of the line of credit, which amounted to $16,938 and is reflected in Miscellaneous expenses on the Statement of Operations. During the period, there were no borrowings on this line of credit.
8. Security Lending.
The Fund lends portfolio securities through a lending agent from time to time in order to earn additional income. The lending agent may loan securities to certain qualified borrowers, including Fidelity Capital Markets (FCM), a broker-dealer affiliated with the Fund. On the settlement date of the loan, the Fund receives collateral (in the form of U.S. Treasury obligations, letters of credit and/or cash) against the loaned securities and maintains collateral in an amount not less than 100% of the market value of the loaned securities during the period of the loan. The market value of the loaned securities is determined at the close of business of the Fund and any additional required collateral is delivered to the Fund on the next business day. If the borrower defaults on its obligation to return the securities loaned because of insolvency or other reasons, a fund could experience delays and costs in recovering the securities loaned or in gaining access to the collateral. Any cash collateral received is invested in the Fidelity Securities Lending Cash Central Fund. The value of loaned securities and cash collateral at period end are disclosed on the Fund's Statement of Assets and Liabilities. Security lending income represents the income earned on investing cash collateral, less rebates paid to borrowers and lending agent fees associated with the loan, plus any premium payments received for lending certain types of securities. Security lending income is presented in the Statement of Operations as a component of income from Fidelity Central Funds. Total security lending income during the period amounted to $695,966. During the period, there were no securities loaned to FCM.
9. Bank Borrowings.
The Fund is permitted to have bank borrowings for temporary or emergency purposes to fund shareholder redemptions. The Fund has established borrowing arrangements with certain banks. The interest rate on the borrowings is the bank's base rate, as revised from time to time. The average daily loan balance during the period for which loans were outstanding amounted to $7,771,667. The weighted average interest rate was .71%. The interest expense amounted to $457 under the bank borrowing program. At period end, there were no bank borrowings outstanding.
10. Expense Reductions.
Many of the brokers with whom FMR places trades on behalf of the Fund provided services to the Fund in addition to trade execution. These services included payments of certain expenses on behalf of the Fund totaling $2,359,897 for the period. In addition, through arrangements with the Fund's custodian, credits realized as a result of uninvested cash balances were used to reduce the Fund's expenses. During the period, these credits reduced the Fund's custody expenses by $372.
Annual Report
Notes to Financial Statements - continued
11. Distributions to Shareholders.
Distributions to shareholders of each class were as follows:
Years ended October 31, | 2010 | 2009 |
From net investment income | | |
Emerging Markets | $ 21,030,807 | $ 35,658,169 |
Class K | 2,128,426 | 1,972,018 |
Total | $ 23,159,233 | $ 37,630,187 |
From net realized gain | | |
Emerging Markets | $ 24,475,486 | $ - |
Class K | 1,941,469 | - |
Total | $ 26,416,955 | $ - |
12. Share Transactions.
Transactions for each class of shares were as follows:
| Shares | Dollars |
Years ended October 31, | 2010 | 2009 A | 2010 | 2009 A |
Emerging Markets | | | | |
Shares sold | 69,154,267 | 77,986,934 | $ 1,590,197,264 | $ 1,325,781,409 |
Conversion to Class K | - | (2,616,204) | - | (34,095,539) |
Reinvestment of distributions | 1,952,719 | 2,953,728 | 43,877,566 | 34,381,402 |
Shares redeemed | (92,999,725) | (54,051,229) | (2,095,951,354) | (822,757,665) |
Net increase (decrease) | (21,892,739) | 24,273,229 | $ (461,876,524) | $ 503,309,607 |
Class K | | | | |
Shares sold | 28,708,422 | 7,005,118 | $ 648,209,971 | $ 114,260,792 |
Conversion from Emerging Markets | - | 2,618,157 | - | 34,095,539 |
Reinvestment of distributions | 181,368 | 169,855 | 4,069,895 | 1,972,018 |
Shares redeemed | (7,437,639) | (3,108,249) | (167,338,288) | (49,741,239) |
Net increase (decrease) | 21,452,151 | 6,684,881 | $ 484,941,578 | $ 100,587,110 |
A Conversion transactions for Class K and Emerging Markets are presented for the period November 1, 2008 through August 31, 2009.
13. Other.
The Fund's organizational documents provide former and current trustees and officers with a limited indemnification against liabilities arising in connection with the performance of their duties to the Fund. In the normal course of business, the Fund may also enter into contracts that provide general indemnifications. The Fund's maximum exposure under these arrangements is unknown as this would be dependent on future claims that may be made against the Fund. The risk of material loss from such claims is considered remote.
Annual Report
Fidelity Europe Capital Appreciation Fund
Performance: The Bottom Line
Average annual total return reflects the change in the value of an investment, assuming reinvestment of the fund's distributions from dividend income and capital gains (the profits earned upon the sale of securities that have grown in value, if any) and assuming a constant rate of performance each year. The $10,000 table and the fund's returns do not reflect the deduction of taxes that a shareholder would pay on fund distributions or the redemption of fund shares. During periods of reimbursement by Fidelity, a fund's total return will be greater than it would be had the reimbursement not occurred. How a fund did yesterday is no guarantee of how it will do tomorrow.
Average Annual Total Returns
Periods ended October 31, 2010 | Past 1
year | Past 5
years | Past 10
years |
Fidelity Europe Capital Appreciation Fund | 10.08% | 4.52% | 5.00% |
$10,000 Over 10 Years
Let's say hypothetically that $10,000 was invested in Fidelity Europe Capital Appreciation Fund on October 31, 2000. The chart shows how the value of your investment would have changed, and also shows how the MSCI Europe Index performed over the same period.
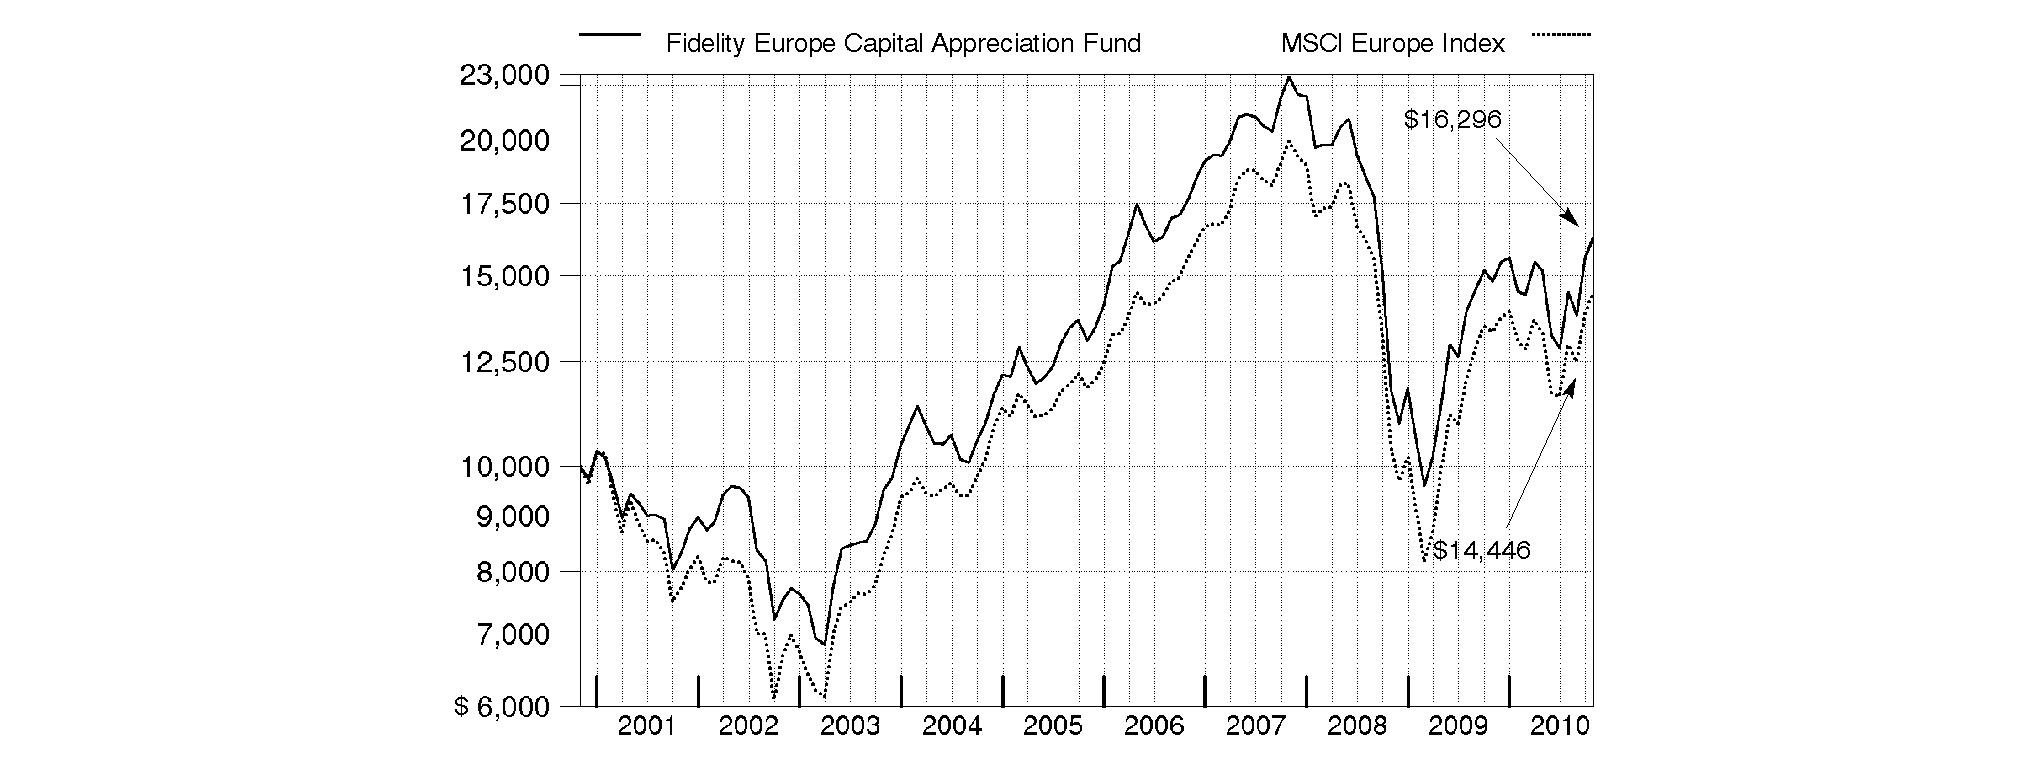
Annual Report
Fidelity Europe Capital Appreciation Fund
Market Recap: International stocks rode a wave of volatility similar to that of their U.S. counterparts during the 12 months ending October 31, 2010. Stocks gained modestly in the first half of the period, despite growing concerns about the European debt crisis. Sentiment turned decidedly negative in May and June, however, and the market suffered a precipitous decline. These losses were more than offset during the last four months of the period, when signs of economic growth and subsiding debt fears helped propel international stocks about 21%. For the full year, the MSCI® ACWI® (All Country World Index) ex USA Index gained 12.76%, boosted in part by a generally depreciating U.S. dollar. Within the index, Canada and emerging markets were standouts, returning 23% and 24%, respectively. Results in the latter group were led by strong-performing India, Mexico and South Africa, while China fell short of the MSCI benchmark due to cooling economic growth. The developed Asia ex Japan segment rose 16% for the period, lifted by solid results from Singapore and Hong Kong. Meanwhile, Europe rose just 9%, held back mainly by debt-riddled Spain and Italy, as well as lagging major constituent France. Japan returned only 5%, a result of that nation's continued weak economy.
Comments from Melissa Reilly, Portfolio Manager of Fidelity® Europe Capital Appreciation Fund: For the 12 months ending October 31, 2010, the fund advanced 10.08%, outpacing the 8.60% increase of the MSCI Europe Index. Stock selection and a significant overweighting in consumer discretionary contributed the most. The fund's media holdings - Germany's ProSiebenSat.1 Media, U.S.-based Virgin Media and Sweden's Modern Times Group - were beneficial, as advertising spending increased during the period. ProSiebenSat.1 Media and Virgin Media were out-of-index positions. The fund's positioning in industrials, particularly among capital goods names, and security selection in information technology helped. Danish pharmaceutical company Novo Nordisk and materials firm Umicore in Belgium also aided results. Geographically, the fund's holdings in Germany and Denmark notably contributed, as did out-of-index stakes in the U.S., China and South Africa. Stock selection in the U.K. detracted, followed by Spain and the Netherlands. Also hurting performance was the fund's positioning in telecommunication services, materials and consumer staples. On an individual security basis, British oil giant BP was the top detractor. Several underweightings also were harmful, including AstraZeneca, a British biopharmaceutical firm, and telecommunications companies Vodafone, based in the U.K., and Telefonica in Spain. I sold Telefonica by period end.
The views expressed above reflect those of the portfolio manager(s) only through the end of the period as stated on the cover of this report and do not necessarily represent the views of Fidelity or any other person in the Fidelity organization. Any such views are subject to change at any time based upon market or other conditions and Fidelity disclaims any responsibility to update such views. These views may not be relied on as investment advice and, because investment decisions for a Fidelity fund are based on numerous factors, may not be relied on as an indication of trading intent on behalf of any Fidelity fund.
Annual Report
Fidelity Europe Capital Appreciation Fund
As a shareholder of the Fund, you incur two types of costs: (1) transaction costs, including redemption fees, and (2) ongoing costs, including management fees and other Fund expenses. This Example is intended to help you understand your ongoing costs (in dollars) of investing in the Fund and to compare these costs with the ongoing costs of investing in other mutual funds.
The Example is based on an investment of $1,000 invested at the beginning of the period and held for the entire period (May 1, 2010 to October 31, 2010).
Actual Expenses
The first line of the accompanying table provides information about actual account values and actual expenses. You may use the information in this line, together with the amount you invested, to estimate the expenses that you paid over the period. Simply divide your account value by $1,000.00 (for example, an $8,600 account value divided by $1,000.00 = 8.6), then multiply the result by the number in the first line under the heading entitled "Expenses Paid During Period" to estimate the expenses you paid on your account during this period. A small balance maintenance fee of $12.00 that is charged once a year may apply for certain accounts with a value of less than $2,000. This fee is not included in the table below. If it was, the estimate of expenses you paid during the period would be higher, and your ending account value lower, by this amount. In addition, the Fund, as a shareholder in the underlying Fidelity Central Funds, will indirectly bear its pro-rata share of the fees and expenses incurred by the underlying Fidelity Central Funds. These fees and expenses are not included in the Fund's annualized expense ratio used to calculate the expense estimate in the table below.
Hypothetical Example for Comparison Purposes
The second line of the accompanying table provides information about hypothetical account values and hypothetical expenses based on the Fund's actual expense ratio and an assumed rate of return of 5% per year before expenses, which is not the Fund's actual return. The hypothetical account values and expenses may not be used to estimate the actual ending account balance or expenses you paid for the period. You may use this information to compare the ongoing costs of investing in the Fund and other funds. To do so, compare this 5% hypothetical example with the 5% hypothetical examples that appear in the shareholder reports of the other funds. A small balance maintenance fee of $12.00 that is charged once a year may apply for certain accounts with a value of less than $2,000. This fee is not included in the table below. If it was, the estimate of expenses you paid during the period would be higher, and your ending account value lower, by this amount. In addition, the Fund, as a shareholder in the underlying Fidelity Central Funds, will indirectly bear its pro-rata share of the fees and expenses incurred by the underlying Fidelity Central Funds. These fees and expenses are not included in the Fund's annualized expense ratio used to calculate the expense estimate in the table below.
Please note that the expenses shown in the table are meant to highlight your ongoing costs only and do not reflect any transaction costs. Therefore, the second line of the table is useful in comparing ongoing costs only, and will not help you determine the relative total costs of owning different funds. In addition, if these transactional costs were included, your costs would have been higher.
| Annualized
Expense Ratio | Beginning
Account Value
May 1, 2010 | Ending
Account Value
October 31, 2010 | Expenses Paid
During Period*
May 1, 2010 to
October 31, 2010 |
Actual | 1.06% | $ 1,000.00 | $ 1,074.70 | $ 5.54 |
Hypothetical (5% return per year before expenses) | | $ 1,000.00 | $ 1,019.86 | $ 5.40 |
* Expenses are equal to the Fund's annualized expense ratio, multiplied by the average account value over the period, multiplied by 184/365 (to reflect the one-half year period).
Annual Report
Fidelity Europe Capital Appreciation Fund
Investment Changes (Unaudited)
Geographic Diversification (% of fund's net assets) |
As of October 31, 2010 |
| United Kingdom | 29.7% | |
| France | 13.1% | |
| Germany | 10.2% | |
| Switzerland | 9.5% | |
| Spain | 4.9% | |
| Sweden | 4.0% | |
| United States of America | 3.5% | |
| Denmark | 3.1% | |
| Belgium | 3.1% | |
| Other | 18.9% | |

Percentages are adjusted for the effect of futures contracts, if applicable. |
As of April 30, 2010 |
| United Kingdom | 29.0% | |
| France | 12.2% | |
| Switzerland | 11.4% | |
| Germany | 10.0% | |
| Spain | 6.0% | |
| United States of America | 5.4% | |
| Sweden | 4.3% | |
| Netherlands | 3.7% | |
| Belgium | 2.8% | |
| Other | 15.2% | |

Percentages are adjusted for the effect of futures contracts, if applicable. |
Asset Allocation |
| % of fund's
net assets | % of fund's net assets
6 months ago |
Stocks | 99.6 | 99.3 |
Short-Term Investments and Net Other Assets | 0.4 | 0.7 |
Top Ten Stocks as of October 31, 2010 |
| % of fund's
net assets | % of fund's net assets
6 months ago |
BP PLC (United Kingdom, Oil, Gas & Consumable Fuels) | 3.3 | 0.4 |
Royal Dutch Shell PLC Class A (United Kingdom) (United Kingdom, Oil, Gas & Consumable Fuels) | 3.1 | 4.3 |
Vodafone Group PLC (United Kingdom, Wireless Telecommunication Services) | 2.6 | 0.3 |
Novartis AG (Switzerland, Pharmaceuticals) | 2.4 | 1.7 |
HSBC Holdings PLC sponsored ADR (United Kingdom, Commercial Banks) | 2.3 | 2.9 |
Banco Santander SA (Spain, Commercial Banks) | 2.3 | 1.9 |
Nestle SA (Switzerland, Food Products) | 2.0 | 1.9 |
GlaxoSmithKline PLC (United Kingdom, Pharmaceuticals) | 1.9 | 0.0 |
Siemens AG (Germany, Industrial Conglomerates) | 1.9 | 1.2 |
Volkswagen AG (Germany, Automobiles) | 1.8 | 0.0 |
| 23.6 | |
Market Sectors as of October 31, 2010 |
| % of fund's
net assets | % of fund's net assets
6 months ago |
Consumer Discretionary | 21.5 | 12.7 |
Financials | 18.9 | 23.7 |
Industrials | 11.4 | 14.1 |
Energy | 10.9 | 11.1 |
Materials | 9.4 | 9.4 |
Health Care | 8.8 | 9.7 |
Consumer Staples | 7.9 | 6.2 |
Information Technology | 6.6 | 6.2 |
Telecommunication Services | 4.2 | 4.3 |
Utilities | 0.0 | 1.9 |
Annual Report
Fidelity Europe Capital Appreciation Fund
Investments October 31, 2010
Showing Percentage of Net Assets
Common Stocks - 96.1% |
| Shares | | Value |
Austria - 0.7% |
Erste Bank AG | 69,000 | | $ 3,113,606 |
Bailiwick of Jersey - 2.3% |
Experian PLC | 299,700 | | 3,483,592 |
Randgold Resources Ltd. sponsored ADR | 35,700 | | 3,352,944 |
Shire PLC | 149,082 | | 3,498,085 |
TOTAL BAILIWICK OF JERSEY | | 10,334,621 |
Belgium - 3.1% |
Ageas | 1,014,700 | | 3,118,897 |
Anheuser-Busch InBev SA NV | 108,361 | | 6,790,328 |
Anheuser-Busch InBev SA NV (strip VVPR) (a) | 103,680 | | 433 |
Umicore SA | 93,961 | | 4,421,696 |
TOTAL BELGIUM | | 14,331,354 |
Bermuda - 0.4% |
Huabao International Holdings Ltd. | 1,184,000 | | 1,784,115 |
British Virgin Islands - 0.3% |
Playtech Ltd. | 193,767 | | 1,390,012 |
Canada - 1.6% |
First Quantum Minerals Ltd. | 27,500 | | 2,408,104 |
Niko Resources Ltd. | 10,200 | | 973,095 |
Petrobank Energy & Resources Ltd. (a) | 30,900 | | 1,229,759 |
Uranium One, Inc. (a) | 643,500 | | 2,631,037 |
TOTAL CANADA | | 7,241,995 |
Cayman Islands - 0.7% |
Hengdeli Holdings Ltd. | 5,428,000 | | 3,011,179 |
China - 1.3% |
Baidu.com, Inc. sponsored ADR (a) | 18,400 | | 2,024,184 |
China Merchants Bank Co. Ltd. (H Shares) | 956,500 | | 2,714,788 |
Home Inns & Hotels Management, Inc. sponsored ADR (a) | 26,100 | | 1,335,276 |
TOTAL CHINA | | 6,074,248 |
Denmark - 3.1% |
Carlsberg AS Series B | 34,400 | | 3,761,527 |
Novo Nordisk AS Series B | 62,438 | | 6,554,884 |
Novozymes AS Series B | 20,000 | | 2,664,627 |
Pandora A/S | 29,400 | | 1,426,359 |
TOTAL DENMARK | | 14,407,397 |
Finland - 1.1% |
Nokia Corp. | 464,700 | | 4,989,337 |
France - 13.1% |
Accor SA | 88,486 | | 3,627,844 |
Alstom SA | 43,461 | | 2,192,780 |
Atos Origin SA (a) | 61,420 | | 2,839,504 |
BNP Paribas SA | 100,458 | | 7,345,559 |
Essilor International SA | 27,454 | | 1,832,878 |
Iliad Group SA (d) | 32,534 | | 3,662,297 |
|
| Shares | | Value |
L'Oreal SA | 44,300 | | $ 5,200,055 |
LVMH Moet Hennessy - Louis Vuitton | 39,572 | | 6,200,033 |
Natixis SA (a) | 683,500 | | 4,191,304 |
PPR SA | 23,400 | | 3,835,560 |
Publicis Groupe SA | 66,100 | | 3,291,780 |
Remy Cointreau SA | 28,267 | | 1,984,699 |
Safran SA | 99,300 | | 3,147,535 |
Schneider Electric SA | 32,487 | | 4,610,812 |
Societe Generale Series A | 41,868 | | 2,506,517 |
Vallourec SA | 32,234 | | 3,344,614 |
TOTAL FRANCE | | 59,813,771 |
Germany - 6.7% |
Bayerische Motoren Werke AG (BMW) | 70,493 | | 5,052,486 |
Fresenius Medical Care AG & Co. KGaA | 44,300 | | 2,821,319 |
Linde AG | 23,367 | | 3,363,575 |
MAN SE | 44,993 | | 4,945,835 |
Rheinmetall AG | 39,700 | | 2,859,252 |
SAP AG | 57,849 | | 3,016,110 |
Siemens AG | 75,213 | | 8,590,093 |
TOTAL GERMANY | | 30,648,670 |
Italy - 1.5% |
Mediaset SpA | 445,200 | | 3,283,210 |
Saipem SpA | 76,758 | | 3,410,281 |
TOTAL ITALY | | 6,693,491 |
Netherlands - 2.5% |
AEGON NV (a) | 376,500 | | 2,385,569 |
ASML Holding NV (Netherlands) | 89,100 | | 2,952,911 |
ING Groep NV (Certificaten Van Aandelen) unit (a) | 291,100 | | 3,113,607 |
Randstad Holdings NV (a) | 62,457 | | 2,972,178 |
TOTAL NETHERLANDS | | 11,424,265 |
Norway - 2.4% |
Aker Solutions ASA | 105,400 | | 1,604,574 |
DnB NOR ASA | 231,400 | | 3,175,219 |
Storebrand ASA (A Shares) (a) | 567,000 | | 4,123,337 |
Telenor ASA | 124,800 | | 2,011,735 |
TOTAL NORWAY | | 10,914,865 |
Qatar - 0.3% |
Commercial Bank of Qatar GDR (Reg. S) | 353,630 | | 1,620,391 |
Russia - 2.1% |
Magnit OJSC GDR (Reg. S) | 97,800 | | 2,615,172 |
Mechel Steel Group OAO sponsored ADR | 98,300 | | 2,314,965 |
OJSC MMC Norilsk Nickel sponsored ADR | 126,500 | | 2,359,225 |
Uralkali JSC GDR (Reg. S) | 94,200 | | 2,331,450 |
TOTAL RUSSIA | | 9,620,812 |
South Africa - 0.9% |
Clicks Group Ltd. | 638,217 | | 4,163,642 |
Common Stocks - continued |
| Shares | | Value |
Spain - 4.9% |
Banco Santander SA | 817,130 | | $ 10,485,664 |
Gestevision Telecinco SA (d) | 551,500 | | 7,033,848 |
Inditex SA (d) | 56,639 | | 4,729,408 |
TOTAL SPAIN | | 22,248,920 |
Sweden - 4.0% |
Elekta AB (B Shares) | 36,700 | | 1,388,554 |
H&M Hennes & Mauritz AB (B Shares) | 146,452 | | 5,159,662 |
Modern Times Group MTG AB (B Shares) | 36,700 | | 2,631,551 |
Sandvik AB | 217,500 | | 3,277,995 |
SKF AB (B Shares) | 73,100 | | 1,887,235 |
Swedbank AB (A Shares) (a) | 296,058 | | 4,131,856 |
TOTAL SWEDEN | | 18,476,853 |
Switzerland - 9.5% |
Clariant AG (Reg.) (a) | 151,740 | | 2,565,097 |
Compagnie Financiere Richemont SA Series A | 91,089 | | 4,541,726 |
Julius Baer Group Ltd. | 43,130 | | 1,820,105 |
Nestle SA | 167,081 | | 9,148,845 |
Novartis AG | 188,812 | | 10,936,949 |
Schindler Holding AG (participation certificate) | 31,591 | | 3,385,839 |
The Swatch Group AG (Bearer) | 9,940 | | 3,797,871 |
Transocean Ltd. (a) | 20,700 | | 1,311,552 |
UBS AG (a) | 362,918 | | 6,163,206 |
TOTAL SWITZERLAND | | 43,671,190 |
Turkey - 0.8% |
Boyner Buyuk Magazacilik AS (a) | 490,000 | | 1,141,044 |
Turkiye Garanti Bankasi AS | 414,000 | | 2,540,054 |
TOTAL TURKEY | | 3,681,098 |
United Kingdom - 29.7% |
Aegis Group PLC | 609,250 | | 1,226,970 |
AstraZeneca PLC (United Kingdom) | 57,785 | | 2,906,332 |
BG Group PLC | 351,893 | | 6,852,811 |
BHP Billiton PLC | 107,071 | | 3,792,516 |
BP PLC | 814,000 | | 5,532,203 |
BP PLC sponsored ADR | 235,600 | | 9,619,548 |
British Airways PLC (a)(d) | 877,200 | | 3,804,434 |
Britvic PLC | 273,000 | | 2,109,955 |
Burberry Group PLC | 215,100 | | 3,511,703 |
Capita Group PLC | 169,900 | | 2,086,454 |
Carphone Warehouse Group PLC | 576,500 | | 2,812,482 |
Fresnillo PLC | 162,300 | | 3,250,362 |
GlaxoSmithKline PLC | 450,500 | | 8,796,054 |
HSBC Holdings PLC sponsored ADR (d) | 204,385 | | 10,650,502 |
ITV PLC (a) | 2,746,500 | | 3,003,208 |
Kazakhmys PLC | 81,800 | | 1,724,695 |
Kesa Electricals PLC | 617,700 | | 1,568,592 |
Lloyds Banking Group PLC (a) | 4,515,600 | | 4,962,580 |
|
| Shares | | Value |
Micro Focus International PLC | 366,800 | | $ 2,243,719 |
Misys PLC (a) | 518,900 | | 2,339,435 |
Morgan Crucible Co. PLC | 508,100 | | 1,864,180 |
Next PLC | 44,900 | | 1,643,750 |
Reckitt Benckiser Group PLC | 82,600 | | 4,619,905 |
Royal Dutch Shell PLC Class A (United Kingdom) | 430,766 | | 13,982,474 |
Sage Group PLC | 395,300 | | 1,706,191 |
Schroders PLC | 93,500 | | 2,365,358 |
Standard Chartered PLC (United Kingdom) | 211,881 | | 6,129,043 |
TalkTalk Telecom Group PLC (a) | 869,200 | | 1,836,825 |
Vodafone Group PLC | 4,320,200 | | 11,808,240 |
Wolfson Microelectronics PLC (a) | 514,500 | | 2,097,859 |
Xstrata PLC | 274,000 | | 5,309,573 |
TOTAL UNITED KINGDOM | | 136,157,953 |
United States of America - 3.1% |
Allergan, Inc. | 28,700 | | 2,078,167 |
Anadarko Petroleum Corp. | 39,000 | | 2,401,230 |
Apple, Inc. (a) | 8,530 | | 2,566,421 |
CF Industries Holdings, Inc. | 13,600 | | 1,666,408 |
Google, Inc. Class A (a) | 2,700 | | 1,655,073 |
Virgin Media, Inc. (d) | 142,900 | | 3,633,947 |
TOTAL UNITED STATES OF AMERICA | | 14,001,246 |
TOTAL COMMON STOCKS (Cost $385,379,146) | 439,815,031 |
Nonconvertible Preferred Stocks - 3.5% |
| | | |
Germany - 3.5% |
ProSiebenSat.1 Media AG | 284,100 | | 7,506,955 |
Volkswagen AG | 55,800 | | 8,385,434 |
TOTAL NONCONVERTIBLE PREFERRED STOCKS (Cost $10,015,350) | 15,892,389 |
Money Market Funds - 4.1% |
| | | |
Fidelity Cash Central Fund, 0.23% (b) | 3,694,483 | | 3,694,483 |
Fidelity Securities Lending Cash Central Fund, 0.24% (b)(c) | 15,304,514 | | 15,304,514 |
TOTAL MONEY MARKET FUNDS (Cost $18,998,997) | 18,998,997 |
TOTAL INVESTMENT PORTFOLIO - 103.7% (Cost $414,393,493) | | 474,706,417 |
NET OTHER ASSETS (LIABILITIES) - (3.7)% | | (16,857,161) |
NET ASSETS - 100% | $ 457,849,256 |
Legend |
(a) Non-income producing |
(b) Affiliated fund that is available only to investment companies and other accounts managed by Fidelity Investments. The rate quoted is the annualized seven-day yield of the fund at period end. A complete unaudited listing of the fund's holdings as of its most recent quarter end is available upon request. In addition, each Fidelity Central Fund's financial statements, which are not covered by the Fund's report of Independent Registered Public Accounting Firm, are available on the SEC's website or upon request. |
(c) Investment made with cash collateral received from securities on loan. |
(d) Security or a portion of the security is on loan at period end. |
Affiliated Central Funds |
Information regarding fiscal year to date income earned by the Fund from investments in Fidelity Central Funds is as follows: |
Fund | Income earned |
Fidelity Cash Central Fund | $ 6,254 |
Fidelity Securities Lending Cash Central Fund | 317,387 |
Total | $ 323,641 |
Other Information |
The following is a summary of the inputs used, as of October 31, 2010, involving the Fund's assets and liabilities carried at fair value. The inputs or methodology used for valuing securities may not be an indication of the risk associated with investing in those securities. For more information on valuation inputs, and their aggregation into the levels used in the table below, please refer to the Security Valuation section in the accompanying Notes to Financial Statements. |
Valuation Inputs at Reporting Date: |
Description | Total | Level 1 | Level 2 | Level 3 |
Investments in Securities: | | | | |
Equities: | | | | |
United Kingdom | $ 136,157,953 | $ 98,360,028 | $ 37,797,925 | $ - |
France | 59,813,771 | 59,813,771 | - | - |
Germany | 46,541,059 | 46,541,059 | - | - |
Switzerland | 43,671,190 | 26,571,035 | 17,100,155 | - |
Spain | 22,248,920 | 11,763,256 | 10,485,664 | - |
Sweden | 18,476,853 | 18,476,853 | - | - |
Denmark | 14,407,397 | 7,852,513 | 6,554,884 | - |
Belgium | 14,331,354 | 14,331,354 | - | - |
United States of America | 14,001,246 | 14,001,246 | - | - |
Other | 86,057,677 | 69,118,168 | 16,939,509 | - |
Money Market Funds | 18,998,997 | 18,998,997 | - | - |
Total Investments in Securities: | $ 474,706,417 | $ 385,828,280 | $ 88,878,137 | $ - |
Income Tax Information |
At October 31, 2010, the Fund had a capital loss carryforward of approximately $320,932,327 of which $183,788,858 and $137,143,469 will expire on October 31, 2016 and 2017, respectively. Capital loss carryforwards are only available to offset future capital gains of the Fund to the extent provided by regulations and may be limited. |
See accompanying notes which are an integral part of the financial statements.
Annual Report
Fidelity Europe Capital Appreciation Fund
Statement of Assets and Liabilities
| October 31, 2010 |
Assets | | |
Investment in securities, at value (including securities loaned of $14,728,234) - See accompanying schedule: Unaffiliated issuers (cost $395,394,496) | $ 455,707,420 | |
Fidelity Central Funds (cost $18,998,997) | 18,998,997 | |
Total Investments (cost $414,393,493) | | $ 474,706,417 |
Foreign currency held at value (cost $14,790) | | 14,790 |
Receivable for investments sold | | 1,104,528 |
Receivable for fund shares sold | | 96,066 |
Dividends receivable | | 2,343,733 |
Distributions receivable from Fidelity Central Funds | | 6,192 |
Other receivables | | 107,533 |
Total assets | | 478,379,259 |
| | |
Liabilities | | |
Payable for investments purchased | $ 3,881,966 | |
Payable for fund shares redeemed | 570,306 | |
Accrued management fee | 255,420 | |
Other affiliated payables | 115,969 | |
Other payables and accrued expenses | 401,828 | |
Collateral on securities loaned, at value | 15,304,514 | |
Total liabilities | | 20,530,003 |
| | |
Net Assets | | $ 457,849,256 |
Net Assets consist of: | | |
Paid in capital | | $ 723,188,544 |
Undistributed net investment income | | 4,108,694 |
Accumulated undistributed net realized gain (loss) on investments and foreign currency transactions | | (329,632,168) |
Net unrealized appreciation (depreciation) on investments and assets and liabilities in foreign currencies | | 60,184,186 |
Net Assets, for 24,668,068 shares outstanding | | $ 457,849,256 |
Net Asset Value, offering price and redemption price per share ($457,849,256 ÷ 24,668,068 shares) | | $ 18.56 |
Statement of Operations
| Year ended October 31, 2010 |
Investment Income | | |
Dividends | | $ 10,585,980 |
Interest | | 17 |
Income from Fidelity Central Funds | | 323,641 |
Income before foreign taxes withheld | | 10,909,638 |
Less foreign taxes withheld | | (1,133,157) |
Total income | | 9,776,481 |
| | |
Expenses | | |
Management fee
Basic fee | $ 3,323,938 | |
Performance adjustment | (215,573) | |
Transfer agent fees | 1,267,546 | |
Accounting and security lending fees | 246,986 | |
Custodian fees and expenses | 123,405 | |
Independent trustees' compensation | 2,760 | |
Registration fees | 22,541 | |
Audit | 55,850 | |
Legal | 2,607 | |
Interest | 380 | |
Miscellaneous | 6,968 | |
Total expenses before reductions | 4,837,408 | |
Expense reductions | (342,652) | 4,494,756 |
Net investment income (loss) | | 5,281,725 |
Realized and Unrealized Gain (Loss) Net realized gain (loss) on: | | |
Investment securities: | | |
Unaffiliated issuers | 7,937,777 | |
Foreign currency transactions | (207,869) | |
Capital gain distributions from Fidelity Central Funds | 1,004 | |
Total net realized gain (loss) | | 7,730,912 |
Change in net unrealized appreciation (depreciation) on: Investment securities | 29,147,677 | |
Assets and liabilities in foreign currencies | 99,325 | |
Total change in net unrealized appreciation (depreciation) | | 29,247,002 |
Net gain (loss) | | 36,977,914 |
Net increase (decrease) in net assets resulting from operations | | $ 42,259,639 |
See accompanying notes which are an integral part of the financial statements.
Annual Report
Statement of Changes in Net Assets
| Year ended
October 31,
2010 | Year ended
October 31,
2009 |
Increase (Decrease) in Net Assets | | |
Operations | | |
Net investment income (loss) | $ 5,281,725 | $ 9,901,244 |
Net realized gain (loss) | 7,730,912 | (134,505,738) |
Change in net unrealized appreciation (depreciation) | 29,247,002 | 228,258,256 |
Net increase (decrease) in net assets resulting from operations | 42,259,639 | 103,653,762 |
Distributions to shareholders from net investment income | (9,633,705) | (18,820,678) |
Share transactions
Proceeds from sales of shares | 36,382,856 | 35,731,816 |
Reinvestment of distributions | 9,217,350 | 17,852,290 |
Cost of shares redeemed | (141,374,658) | (111,090,785) |
Net increase (decrease) in net assets resulting from share transactions | (95,774,452) | (57,506,679) |
Redemption fees | 13,460 | 3,805 |
Total increase (decrease) in net assets | (63,135,058) | 27,330,210 |
| | |
Net Assets | | |
Beginning of period | 520,984,314 | 493,654,104 |
End of period (including undistributed net investment income of $4,108,694 and undistributed net investment income of $8,667,539, respectively) | $ 457,849,256 | $ 520,984,314 |
Other Information Shares | | |
Sold | 2,148,209 | 2,499,317 |
Issued in reinvestment of distributions | 511,223 | 1,466,910 |
Redeemed | (8,358,624) | (8,182,319) |
Net increase (decrease) | (5,699,192) | (4,216,092) |
Financial Highlights
Years ended October 31, | 2010 | 2009 | 2008 | 2007 | 2006 |
Selected Per-Share Data | | | | | |
Net asset value, beginning of period | $ 17.16 | $ 14.27 | $ 32.66 | $ 27.47 | $ 23.15 |
Income from Investment Operations | | | | | |
Net investment income (loss) B | .19 | .31 | .50 | .62 | .38 E |
Net realized and unrealized gain (loss) | 1.53 | 3.14 | (14.11) | 7.04 | 6.85 |
Total from investment operations | 1.72 | 3.45 | (13.61) | 7.66 | 7.23 |
Distributions from net investment income | (.32) | (.56) | (.56) | (.22) | (.30) |
Distributions from net realized gain | - | - | (4.22) | (2.25) | (2.62) |
Total distributions | (.32) | (.56) | (4.78) | (2.47) | (2.92) |
Redemption fees added to paid in capital B | - G | - G | - G | - G | .01 |
Net asset value, end of period | $ 18.56 | $ 17.16 | $ 14.27 | $ 32.66 | $ 27.47 |
Total Return A | 10.08% | 25.79% | (48.58) % | 29.95% | 34.81% |
Ratios to Average Net Assets C, F | | | | | |
Expenses before reductions | 1.03% | 1.10% | 1.16% | 1.05% | 1.09% |
Expenses net of fee waivers, if any | 1.03% | 1.10% | 1.16% | 1.05% | 1.09% |
Expenses net of all reductions | .96% | 1.07% | 1.12% | 1.01% | .99% |
Net investment income (loss) | 1.13% | 2.16% | 2.11% | 2.15% | 1.51% E |
Supplemental Data | | | | | |
Net assets, end of period (000 omitted) | $ 457,849 | $ 520,984 | $ 493,654 | $ 1,365,449 | $ 1,070,464 |
Portfolio turnover rate D | 133% | 111% | 112% | 161% | 143% |
A Total returns would have been lower had certain expenses not been reduced during the periods shown.
B Calculated based on average shares outstanding during the period.
C Fees and expenses of the underlying Fidelity Central Funds are not included in the Fund's expense ratio. The Fund indirectly bears its proportionate share of the expenses of any underlying Fidelity Central Funds.
D Amount does not include the portfolio activity of any underlying Fidelity Central Funds.
E Investment income per share reflects a special dividends which amounted to $.11 per share. Excluding the special dividends, the ratio of net investment income (loss) to average net assets would have been 1.06%.
F Expense ratios reflect operating expenses of the Fund. Expenses before reductions do not reflect amounts reimbursed by the investment adviser or reductions from brokerage service arrangements or reductions from other expense offset arrangements and do not represent the amount paid by the Fund during periods when reimbursements or reductions occur. Expenses net of fee waivers reflect expenses after reimbursement by the investment adviser but prior to reductions from brokerage service arrangements or other expense offset arrangements. Expenses net of all reductions represent the net expenses paid by the Fund.
G Amount represents less than $.01 per share.
See accompanying notes which are an integral part of the financial statements.
Annual Report
Notes to Financial Statements
For the period ended October 31, 2010
1. Organization.
Fidelity Europe Capital Appreciation Fund (the Fund) is a fund of Fidelity Investment Trust (the Trust) and is authorized to issue an unlimited number of shares. The Trust is registered under the Investment Company Act of 1940, as amended (the 1940 Act), as an open-end management investment company organized as a Massachusetts business trust.
2. Investments in Fidelity Central Funds.
The Fund may invest in Fidelity Central Funds, which are open-end investment companies available only to other investment companies and accounts managed by Fidelity Management & Research Company (FMR) and its affiliates. The Fund's Schedule of Investments lists each of the Fidelity Central Funds held as of period end, if any, as an investment of the Fund, but does not include the underlying holdings of each Fidelity Central Fund. As an Investing Fund, the Fund indirectly bears its proportionate share of the expenses of the underlying Fidelity Central Funds.
The Money Market Central Funds seek preservation of capital and current income and are managed by Fidelity Investments Money Management, Inc. (FIMM), an affiliate of FMR.
A complete unaudited list of holdings for each Fidelity Central Fund is available upon request or at the Securities and Exchange Commission (the SEC) web site at www.sec.gov. In addition, the financial statements of the Fidelity Central Funds, which are not covered by the Fund's Report of Independent Registered Public Accounting Firm, are available on the SEC web site or upon request.
3. Significant Accounting Policies.
The financial statements have been prepared in conformity with accounting principles generally accepted in the United States of America (GAAP), which require management to make certain estimates and assumptions at the date of the financial statements. Actual results could differ from those estimates. The following summarizes the significant accounting policies of the Fund:
Security Valuation. Investments are valued as of 4:00 p.m. Eastern time on the last calendar day of the period. The Fund uses independent pricing services approved by the Board of Trustees to value its investments. When current market prices or quotations are not readily available or reliable, valuations may be determined in good faith in accordance with procedures adopted by the Board of Trustees. Factors used in determining value may include market or security specific events. The frequency with which these procedures are used cannot be predicted and they may be utilized to a significant extent. The value used for net asset value (NAV) calculation under these procedures may differ from published prices for the same securities.
The Fund categorizes the inputs to valuation techniques used to value its investments into a disclosure hierarchy consisting of three levels as shown below.
Level 1 - quoted prices in active markets for identical investments
Level 2 - other significant observable inputs (including quoted prices for similar investments, interest rates, prepayment speeds, etc.)
Level 3 - unobservable inputs (including the fund's own assumptions based on the best information available)
Changes in valuation techniques may result in transfers in or out of an assigned level within the disclosure hierarchy. The aggregate value of investments by input level, as of October 31, 2010 is included at the end of the Fund's Schedule of Investments. Valuation techniques used to value the Fund's investments by major category are as follows.
Equity securities, including restricted securities, for which market quotations are readily available, are valued at the last reported sale price or official closing price as reported by an independent pricing service on the primary market or exchange on which they are traded and are categorized as Level 1 in the hierarchy. In the event there were no sales during the day or closing prices are not available, securities are valued at the last quoted bid price or may be valued using the last available price and are generally categorized as Level 2 in the hierarchy. For foreign equity securities, when significant market or security specific events arise, comparisons to the valuation of American Depositary Receipts (ADRs), futures contracts, Exchange-traded funds (ETFs) and certain indexes as well as quoted prices for similar securities are used and are categorized as Level 2 in the hierarchy in these circumstances. Utilizing these techniques may result in transfers between Level 1 and Level 2. For restricted equity securities and private placements where observable inputs are limited, assumptions about market activity and risk are used and are categorized as Level 3 in the hierarchy.
Investments in open-end mutual funds, including the Fidelity Central Funds, are valued at their closing net asset value each business day and are categorized as Level 1 in the hierarchy. Short-term securities with remaining maturities of sixty days or less for which quotations are not readily available are valued at amortized cost, which approximates fair value and are categorized as Level 2 in the hierarchy.
Foreign Currency. The Fund uses foreign currency contracts to facilitate transactions in foreign-denominated securities. Gains and losses from these transactions may arise from changes in the value of the foreign currency or if the counterparties do not perform under the contracts' terms.
Annual Report
Notes to Financial Statements - continued
3. Significant Accounting Policies - continued
Foreign Currency - continued
Foreign-denominated assets, including investment securities, and liabilities are translated into U.S. dollars at the exchange rate at period end. Purchases and sales of investment securities, income and dividends received and expenses denominated in foreign currencies are translated into U.S. dollars at the exchange rate in effect on the transaction date.
The effects of exchange rate fluctuations on investments are included with the net realized and unrealized gain (loss) on investment securities. Other foreign currency transactions resulting in realized and unrealized gain (loss) are disclosed separately.
Investment Transactions and Income. For financial reporting purposes, the Fund's investment holdings and NAV include trades executed through the end of the last business day of the period. The NAV per share for processing shareholder transactions is calculated as of the close of business of the New York Stock Exchange (NYSE), normally 4:00 p.m. Eastern time and includes trades executed through the end of the prior business day. Gains and losses on securities sold are determined on the basis of identified cost and may include proceeds received from litigation. Dividend income is recorded on the ex-dividend date, except for certain dividends from foreign securities where the ex-dividend date may have passed, which are recorded as soon as the Fund is informed of the ex-dividend date. Non-cash dividends included in dividend income, if any, are recorded at the fair market value of the securities received. Distributions received on securities that represent a return of capital or capital gain are recorded as a reduction of cost of investments and/or as a realized gain. The Fund estimates the components of distributions received that may be considered return of capital distributions or capital gain distributions. Interest income and distributions from the Fidelity Central Funds are accrued as earned. Interest income includes coupon interest and amortization of premium and accretion of discount on debt securities. Investment income is recorded net of foreign taxes withheld where recovery of such taxes is uncertain.
Expenses. Most expenses of the Trust can be directly attributed to a fund. Expenses which cannot be directly attributed are apportioned amongst each fund in the Trust. Expense estimates are accrued in the period to which they relate and adjustments are made when actual amounts are known.
Income Tax Information and Distributions to Shareholders. Each year the Fund intends to qualify as a regulated investment company, including distributing substantially all of its taxable income and realized gains under Subchapter M of the Internal Revenue Code and filing its U.S. federal tax return. As a result, no provision for income taxes is required. As of October 31, 2010, the Fund did not have any unrecognized tax benefits in the accompanying financial statements. A fund's federal tax return is subject to examination by the Internal Revenue Service (IRS) for a period of three years. Foreign taxes are provided for based on the Fund's understanding of the tax rules and rates that exist in the foreign markets in which it invests.
Distributions are declared and recorded on the ex-dividend date. Income and capital gain distributions are determined in accordance with income tax regulations, which may differ from GAAP.
Capital accounts within the financial statements are adjusted for permanent book-tax differences. These adjustments have no impact on net assets or the results of operations. Temporary book-tax differences will reverse in a subsequent period.
Book-tax differences are primarily due to the short-term gain distributions from the Fidelity Central Funds, deferred trustees compensation, capital loss carryforwards and losses deferred due to wash sales.
The federal tax cost of investment securities and unrealized appreciation (depreciation) as of period end were as follows:
Gross unrealized appreciation | $ 70,175,589 |
Gross unrealized depreciation | (18,562,506) |
Net unrealized appreciation (depreciation) | $ 51,613,083 |
| |
Tax Cost | $ 423,093,334 |
The tax-based components of distributable earnings as of period end were as follows:
Undistributed ordinary income | $ 4,108,805 |
Capital loss carryforward | $ (320,932,327) |
Net unrealized appreciation (depreciation) | $ 51,484,345 |
The tax character of distributions paid was as follows:
| October 31, 2010 | October 31, 2009 |
Ordinary Income | $ 9,633,705 | $ 18,820,678 |
Annual Report
3. Significant Accounting Policies - continued
Short-Term Trading (Redemption) Fees. Shares held by investors in the Fund less than 30 days are subject to a redemption fee equal to 1.00% of the net asset value of shares redeemed. All redemption fees, which reduce the proceeds of the shareholder redemption, are retained by the Fund and accounted for as an addition to paid in capital.
4. Purchases and Sales of Investments.
Purchases and sales of securities, other than short-term securities, aggregated $609,802,196 and $709,763,283, respectively.
5. Fees and Other Transactions with Affiliates.
Management Fee. FMR and its affiliates provide the Fund with investment management related services for which the Fund pays a monthly management fee. The management fee is the sum of an individual fund fee rate that is based on an annual rate of .45% of the Fund's average net assets and a group fee rate that averaged .26% during the period. The group fee rate is based upon the average net assets of all the mutual funds advised by FMR. The group fee rate decreases as assets under management increase and increases as assets under management decrease. In addition, the management fee is subject to a performance adjustment (up to a maximum of ± .20% of the Fund's average net assets over a 36 month performance period). The upward or downward adjustment to the management fee is based on the Fund's relative investment performance as compared to an appropriate benchmark index. For the period, the total annual management fee rate, including the performance adjustment, was .66% of the Fund's average net assets.
Transfer Agent Fees. Fidelity Investments Institutional Operations Company, Inc. (FIIOC), an affiliate of FMR, is the Fund's transfer, dividend disbursing and shareholder servicing agent. FIIOC receives account fees and asset-based fees that vary according to account size and type of account. FIIOC pays for typesetting, printing and mailing of shareholder reports, except proxy statements. For the period, the transfer agent fees were equivalent to an annual rate of .27% of average net assets.
Accounting and Security Lending Fees. Fidelity Service Company, Inc. (FSC), an affiliate of FMR, maintains the Fund's accounting records. The accounting fee is based on the level of average net assets for the month. Under a separate contract, FSC administers the security lending program. The security lending fee is based on the number and duration of lending transactions.
Brokerage Commissions. The fund placed a portion of its portfolio transactions with brokerage firms which are affiliates of the investment adviser. The commissions paid to these affiliated firms were $1,437 for the period.
Interfund Lending Program. Pursuant to an Exemptive Order issued by the SEC, the Fund, along with other registered investment companies having management contracts with FMR, may participate in an interfund lending program. This program provides an alternative credit facility allowing the funds to borrow from, or lend money to, other participating affiliated funds. At period end, there were no interfund loans outstanding. The Fund's activity in this program during the period for which loans were outstanding was as follows:
Borrower or Lender | Average Daily
Loan Balance | Weighted Average
Interest Rate | Interest
Expense |
Borrower | $ 9,273,000 | .37% | $ 380 |
6. Committed Line of Credit.
The Fund participates with other funds managed by FMR or an affiliate in a $3.75 billion credit facility (the "line of credit") to be utilized for temporary or emergency purposes to fund shareholder redemptions or for other short-term liquidity purposes. The Fund has agreed to pay commitment fees on its pro-rata portion of the line of credit, which amounted to $1,882 and is reflected in Miscellaneous expenses on the Statement of Operations. During the period, there were no borrowings on this line of credit.
7. Security Lending.
The Fund lends portfolio securities through a lending agent from time to time in order to earn additional income. The lending agent may loan securities to certain qualified borrowers, including Fidelity Capital Markets (FCM), a broker-dealer affiliated with the Fund. On the settlement date of the loan, the Fund receives collateral (in the form of U.S. Treasury obligations, letters of credit and/or cash) against the loaned securities and maintains collateral in an amount not less than 100% of the market value of the loaned securities during the period of the loan. The market value of the loaned securities is determined at the close of business of the Fund and any additional required collateral is delivered to the Fund on the next business day. If the borrower defaults on its obligation to return the securities loaned because of insolvency or other reasons, a fund could experience delays and costs in recovering the securities loaned or in gaining access to the collateral. Any cash collateral received is invested in the Fidelity Securities Lending Cash Central Fund. The value of loaned securities and cash collateral at period end are disclosed on the Fund's Statement of Assets and Liabilities. Security
Annual Report
Notes to Financial Statements - continued
7. Security Lending - continued
lending income represents the income earned on investing cash collateral, less rebates paid to borrowers and lending agent fees associated with the loan, plus any premium payments received for lending certain types of securities. Security lending income is presented in the Statement of Operations as a component of income from Fidelity Central Funds. Total security lending income during the period amounted to $317,387. During the period, there were no securities loaned to FCM.
8. Expense Reductions.
Many of the brokers with whom FMR places trades on behalf of the Fund provided services to the Fund in addition to trade execution. These services included payments of certain expenses on behalf of the Fund totaling $342,652 for the period.
9. Other.
The Fund's organizational documents provide former and current trustees and officers with a limited indemnification against liabilities arising in connection with the performance of their duties to the Fund. In the normal course of business, the Fund may also enter into contracts that provide general indemnifications. The Fund's maximum exposure under these arrangements is unknown as this would be dependent on future claims that may be made against the Fund. The risk of material loss from such claims is considered remote.
Annual Report
Fidelity Europe Fund
Performance: The Bottom Line
Average annual total return reflects the change in the value of an investment, assuming reinvestment of the fund's distributions from dividend income and capital gains (the profits earned upon the sale of securities that have grown in value, if any) and assuming a constant rate of performance each year. The $10,000 table and the fund's returns do not reflect the deduction of taxes that a shareholder would pay on fund distributions or the redemption of fund shares. During periods of reimbursement by Fidelity, a fund's total return will be greater than it would be had the reimbursement not occurred. How a fund did yesterday is no guarantee of how it will do tomorrow.
Average Annual Total Returns
Periods ended October 31, 2010 | Past 1
year | Past 5
years | Past 10
years |
Fidelity Europe Fund | 10.01% | 4.00% | 4.39% |
$10,000 Over 10 Years
Let's say hypothetically that $10,000 was invested in Fidelity Europe Fund on October 31, 2000. The chart shows how the value of your investment would have changed, and also shows how the MSCI Europe Index performed over the same period.
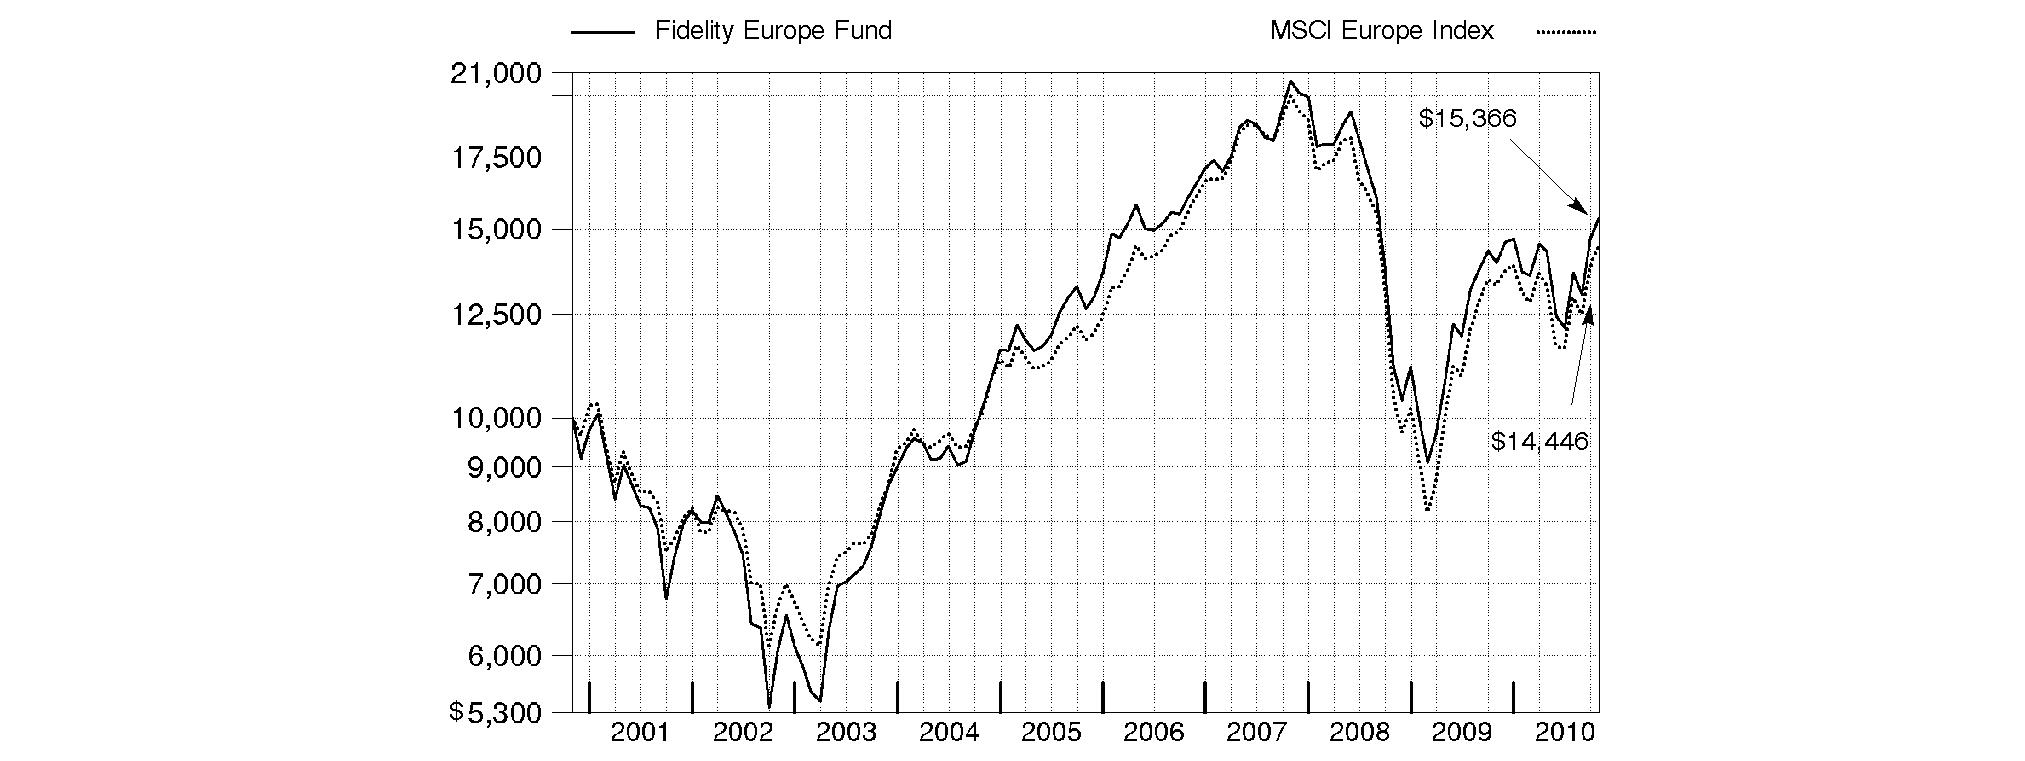
Annual Report
Fidelity Europe Fund
Market Recap: International stocks rode a wave of volatility similar to that of their U.S. counterparts during the 12 months ending October 31, 2010. Stocks gained modestly in the first half of the period, despite growing concerns about the European debt crisis. Sentiment turned decidedly negative in May and June, however, and the market suffered a precipitous decline. These losses were more than offset during the last four months of the period, when signs of economic growth and subsiding debt fears helped propel international stocks about 21%. For the full year, the MSCI® ACWI® (All Country World Index) ex USA Index gained 12.76%, boosted in part by a generally depreciating U.S. dollar. Within the index, Canada and emerging markets were standouts, returning 23% and 24%, respectively. Results in the latter group were led by strong-performing India, Mexico and South Africa, while China fell short of the MSCI benchmark due to cooling economic growth. The developed Asia ex Japan segment rose 16% for the period, lifted by solid results from Singapore and Hong Kong. Meanwhile, Europe rose just 9%, held back mainly by debt-riddled Spain and Italy, as well as lagging major constituent France. Japan returned only 5%, a result of that nation's continued weak economy.
Comments from Melissa Reilly, Portfolio Manager of Fidelity® Europe Fund: For the 12 months ending October 31, 2010, the fund advanced 10.01%, outpacing the 8.60% increase of the MSCI Europe Index. Positioning in consumer discretionary was very favorable. The fund's media holdings - - Germany's ProSiebenSat.1 Media, U.S.-based Virgin Media and Sweden's Modern Times Group - were beneficial, as advertising spending increased during the period. ProSiebenSat.1 Media and Virgin Media were out-of-index positions. The fund also benefited from its positioning in industrials, particularly among capital goods names. Danish health care company Novo Nordisk and Carphone Warehouse Group, a cell phone retailer in the U.K., were beneficial. Geographically, the fund's holdings in Germany and Denmark, as well as out-of-index stakes in the United States, China and South Africa were helpful, while security selection in the U.K., Spain and the Netherlands detracted. Also hurting performance was positioning in telecommunication services, materials and consumer staples. On an individual stock basis, the fund was hurt by underweighting AstraZeneca, a British biopharmaceutical firm and U.K. telecommunications company Vodafone. Untimely ownership of Spain's Telefonica detracted as well. I sold Telefonica by period end.
The views expressed above reflect those of the portfolio manager(s) only through the end of the period as stated on the cover of this report and do not necessarily represent the views of Fidelity or any other person in the Fidelity organization. Any such views are subject to change at any time based upon market or other conditions and Fidelity disclaims any responsibility to update such views. These views may not be relied on as investment advice and, because investment decisions for a Fidelity fund are based on numerous factors, may not be relied on as an indication of trading intent on behalf of any Fidelity fund.
Annual Report
Fidelity Europe Fund
As a shareholder of the Fund, you incur two types of costs: (1) transaction costs, including redemption fees, and (2) ongoing costs, including management fees and other Fund expenses. This Example is intended to help you understand your ongoing costs (in dollars) of investing in the Fund and to compare these costs with the ongoing costs of investing in other mutual funds.
The Example is based on an investment of $1,000 invested at the beginning of the period and held for the entire period (May 1, 2010 to October 31, 2010).
Actual Expenses
The first line of the accompanying table for the Fund provides information about actual account values and actual expenses. You may use the information in this line, together with the amount you invested, to estimate the expenses that you paid over the period. Simply divide your account value by $1,000.00 (for example, an $8,600 account value divided by $1,000.00 = 8.6), then multiply the result by the number in the first line under the heading entitled "Expenses Paid During Period" to estimate the expenses you paid on your account during this period. A small balance maintenance fee of $12.00 that is charged once a year may apply for certain accounts with a value of less than $2,000. This fee is not included in the table below. If it was, the estimate of expenses you paid during the period would be higher, and your ending account value lower, by this amount. In addition, the Fund, as a shareholder in the underlying Fidelity Central Funds, will indirectly bear its pro-rata share of the fees and expenses incurred by the underlying Fidelity Central Funds. These fees and expenses are not included in the Fund's annualized expense ratio used to calculate the expense estimate in the table below.
Hypothetical Example for Comparison Purposes
The second line of the accompanying table for the Fund provides information about hypothetical account values and hypothetical expenses based on the Fund's actual expense ratio and an assumed rate of return of 5% per year before expenses, which is not the Fund's actual return. The hypothetical account values and expenses may not be used to estimate the actual ending account balance or expenses you paid for the period. You may use this information to compare the ongoing costs of investing in the Fund and other funds. To do so, compare this 5% hypothetical example with the 5% hypothetical examples that appear in the shareholder reports of the other funds. A small balance maintenance fee of $12.00 that is charged once a year may apply for certain accounts with a value of less than $2,000. This fee is not included in the table below. If it was, the estimate of expenses you paid during the period would be higher, and your ending account value lower, by this amount. In addition, the Fund, as a shareholder in the underlying Fidelity Central Funds, will indirectly bear its pro-rata share of the fees and expenses incurred by the underlying Fidelity Central Funds. These fees and expenses are not included in the Fund's annualized expense ratio used to calculate the expense estimate in the table below.
Please note that the expenses shown in the table are meant to highlight your ongoing costs only and do not reflect any transaction costs. Therefore, the second line of the table is useful in comparing ongoing costs only, and will not help you determine the relative total costs of owning different funds. In addition, if these transactional costs were included, your costs would have been higher.
| Annualized
Expense Ratio | Beginning
Account Value
May 1, 2010 | Ending
Account Value
October 31, 2010 | Expenses Paid
During Period*
May 1, 2010 to
October 31, 2010 |
Actual | 1.14% | $ 1,000.00 | $ 1,076.10 | $ 5.97 |
HypotheticalA | | $ 1,000.00 | $ 1,019.46 | $ 5.80 |
A 5% return per year before expenses
* Expenses are equal to the Fund's annualized expense ratio, multiplied by the average account value over the period, multiplied by 184/365 (to reflect the one-half year period).
Annual Report
Fidelity Europe Fund
Investment Changes (Unaudited)
Geographic Diversification (% of fund's net assets) |
As of October 31, 2010 |
| United Kingdom | 30.3% | |
| France | 12.4% | |
| Germany | 9.9% | |
| Switzerland | 9.2% | |
| United States of America | 5.7% | |
| Spain | 4.9% | |
| Sweden | 3.9% | |
| Belgium | 3.1% | |
| Denmark | 3.0% | |
| Other | 17.6% | |

Percentages are adjusted for the effect of futures contracts, if applicable. |
As of April 30, 2010 |
| United Kingdom | 28.6% | |
| France | 11.8% | |
| Switzerland | 11.1% | |
| Germany | 9.8% | |
| Spain | 6.6% | |
| United States of America | 6.5% | |
| Sweden | 4.0% | |
| Netherlands | 3.6% | |
| Belgium | 2.7% | |
| Other | 15.3% | |

Percentages are adjusted for the effect of futures contracts, if applicable. |
Asset Allocation |
| % of fund's
net assets | % of fund's net assets
6 months ago |
Stocks | 97.2 | 98.0 |
Short-Term Investments and Net Other Assets | 2.8 | 2.0 |
Top Ten Stocks as of October 31, 2010 |
| % of fund's
net assets | % of fund's net assets
6 months ago |
BP PLC (United Kingdom, Oil, Gas & Consumable Fuels) | 3.3 | 1.7 |
Royal Dutch Shell PLC Class A (Netherlands) (United Kingdom, Oil, Gas & Consumable Fuels) | 3.1 | 4.3 |
Vodafone Group PLC (United Kingdom, Wireless Telecommunication Services) | 2.6 | 0.3 |
Novartis AG (Switzerland, Pharmaceuticals) | 2.4 | 1.7 |
HSBC Holdings PLC (United Kingdom) (United Kingdom, Commercial Banks) | 2.3 | 2.8 |
Banco Santander SA (Spain, Commercial Banks) | 2.3 | 2.1 |
Nestle SA (Switzerland, Food Products) | 2.0 | 1.9 |
GlaxoSmithKline PLC (United Kingdom, Pharmaceuticals) | 1.9 | 0.0 |
Siemens AG (Germany, Industrial Conglomerates) | 1.9 | 1.2 |
Volkswagen AG (Germany, Automobiles) | 1.9 | 0.0 |
| 23.7 | |
Market Sectors as of October 31, 2010 |
| % of fund's
net assets | % of fund's net assets
6 months ago |
Consumer Discretionary | 21.8 | 12.2 |
Financials | 17.9 | 23.4 |
Industrials | 10.8 | 13.4 |
Energy | 10.7 | 11.1 |
Materials | 9.1 | 9.7 |
Health Care | 8.7 | 9.5 |
Consumer Staples | 8.0 | 6.1 |
Information Technology | 6.1 | 6.1 |
Telecommunication Services | 4.1 | 4.6 |
Utilities | 0.0 | 1.9 |
Annual Report
Fidelity Europe Fund
Investments October 31, 2010
Showing Percentage of Net Assets
Common Stocks - 93.8% |
| Shares | | Value |
Austria - 0.6% |
Erste Bank AG | 112,900 | | $ 5,094,581 |
Bailiwick of Jersey - 2.1% |
Experian PLC | 464,100 | | 5,394,512 |
Randgold Resources Ltd. sponsored ADR | 57,900 | | 5,437,968 |
Shire PLC | 264,298 | | 6,201,533 |
TOTAL BAILIWICK OF JERSEY | | 17,034,013 |
Belgium - 3.1% |
Ageas | 1,573,200 | | 4,835,565 |
Anheuser-Busch InBev SA NV | 189,189 | | 11,855,330 |
Umicore SA | 165,059 | | 7,767,485 |
TOTAL BELGIUM | | 24,458,380 |
Bermuda - 0.4% |
Huabao International Holdings Ltd. | 1,977,000 | | 2,979,050 |
British Virgin Islands - 0.3% |
Playtech Ltd. | 338,801 | | 2,430,432 |
Canada - 1.5% |
First Quantum Minerals Ltd. | 45,100 | | 3,949,290 |
Niko Resources Ltd. | 15,800 | | 1,507,344 |
Petrobank Energy & Resources Ltd. (a) | 47,400 | | 1,886,426 |
Uranium One, Inc. (a) | 1,125,200 | | 4,600,533 |
TOTAL CANADA | | 11,943,593 |
Cayman Islands - 0.7% |
Hengdeli Holdings Ltd. | 9,476,000 | | 5,256,804 |
China - 1.2% |
Baidu.com, Inc. sponsored ADR (a) | 30,300 | | 3,333,303 |
China Merchants Bank Co. Ltd. (H Shares) | 1,556,500 | | 4,417,739 |
Home Inns & Hotels Management, Inc. sponsored ADR (a) | 42,600 | | 2,179,416 |
TOTAL CHINA | | 9,930,458 |
Denmark - 3.0% |
Carlsberg AS Series B | 61,400 | | 6,713,889 |
Novo Nordisk AS Series B | 100,939 | | 10,596,806 |
Novozymes AS Series B | 30,900 | | 4,116,848 |
Pandora A/S | 47,800 | | 2,319,046 |
TOTAL DENMARK | | 23,746,589 |
Finland - 1.0% |
Nokia Corp. | 757,356 | | 8,131,492 |
France - 12.4% |
Accor SA | 144,545 | | 5,926,211 |
Alstom SA | 70,254 | | 3,544,594 |
Atos Origin SA (a) | 101,961 | | 4,713,751 |
BNP Paribas SA | 164,961 | | 12,062,063 |
Essilor International SA | 43,019 | | 2,872,025 |
Iliad Group SA | 56,886 | | 6,403,561 |
L'Oreal SA | 77,300 | | 9,073,684 |
LVMH Moet Hennessy - Louis Vuitton | 69,825 | | 10,939,990 |
|
| Shares | | Value |
Natixis SA (a) | 1,091,400 | | $ 6,692,596 |
PPR SA | 40,000 | | 6,556,512 |
Publicis Groupe SA | 107,700 | | 5,363,460 |
Remy Cointreau SA | 43,824 | | 3,076,996 |
Safran SA | 156,000 | | 4,944,768 |
Schneider Electric SA | 51,993 | | 7,379,257 |
Societe Generale Series A | 67,552 | | 4,044,145 |
Vallourec SA | 55,160 | | 5,723,425 |
TOTAL FRANCE | | 99,317,038 |
Germany - 6.5% |
Bayerische Motoren Werke AG (BMW) | 125,473 | | 8,993,100 |
Fresenius Medical Care AG & Co. KGaA | 71,800 | | 4,572,703 |
Linde AG | 36,566 | | 5,263,511 |
MAN SE | 79,626 | | 8,752,852 |
Rheinmetall AG | 58,500 | | 4,213,255 |
SAP AG | 93,922 | | 4,896,871 |
Siemens AG | 131,852 | | 15,058,845 |
TOTAL GERMANY | | 51,751,137 |
Italy - 1.4% |
Mediaset SpA | 783,700 | | 5,779,541 |
Saipem SpA | 129,757 | | 5,764,974 |
TOTAL ITALY | | 11,544,515 |
Netherlands - 2.3% |
AEGON NV (a) | 609,800 | | 3,863,798 |
ASML Holding NV (Netherlands) | 144,300 | | 4,782,323 |
ING Groep NV (Certificaten Van Aandelen) unit (a) | 454,000 | | 4,855,986 |
Randstad Holdings NV (a) | 101,389 | | 4,824,858 |
TOTAL NETHERLANDS | | 18,326,965 |
Norway - 2.3% |
Aker Solutions ASA | 169,900 | | 2,586,500 |
DnB NOR ASA | 378,800 | | 5,197,809 |
Pronova BioPharma ASA (a) | 82,900 | | 138,655 |
Storebrand ASA (A Shares) (a) | 1,000,500 | | 7,275,836 |
Telenor ASA | 193,800 | | 3,123,993 |
TOTAL NORWAY | | 18,322,793 |
Qatar - 0.3% |
Commercial Bank of Qatar GDR (Reg. S) | 579,397 | | 2,654,893 |
Russia - 1.9% |
Magnit OJSC GDR (Reg. S) | 146,200 | | 3,909,388 |
Mechel Steel Group OAO sponsored ADR | 160,400 | | 3,777,420 |
OJSC MMC Norilsk Nickel sponsored ADR | 205,500 | | 3,832,575 |
Uralkali JSC GDR (Reg. S) | 164,900 | | 4,081,275 |
TOTAL RUSSIA | | 15,600,658 |
South Africa - 0.9% |
Clicks Group Ltd. | 1,110,519 | | 7,244,876 |
Common Stocks - continued |
| Shares | | Value |
Spain - 4.9% |
Banco Santander SA | 1,437,162 | | $ 18,442,106 |
Gestevision Telecinco SA | 990,200 | | 12,629,041 |
Inditex SA (d) | 98,823 | | 8,251,811 |
TOTAL SPAIN | | 39,322,958 |
Sweden - 3.9% |
Elekta AB (B Shares) | 59,600 | | 2,254,981 |
H&M Hennes & Mauritz AB (B Shares) | 259,149 | | 9,130,100 |
Modern Times Group MTG AB (B Shares) | 59,100 | | 4,237,729 |
Sandvik AB | 352,200 | | 5,308,091 |
SKF AB (B Shares) | 119,200 | | 3,077,407 |
Swedbank AB (A Shares) (a) | 518,917 | | 7,242,129 |
TOTAL SWEDEN | | 31,250,437 |
Switzerland - 9.2% |
Clariant AG (Reg.) (a) | 247,770 | | 4,188,442 |
Compagnie Financiere Richemont SA Series A | 147,990 | | 7,378,828 |
Julius Baer Group Ltd. | 69,450 | | 2,930,820 |
Nestle SA | 292,254 | | 16,002,937 |
Novartis AG | 330,012 | | 19,115,970 |
Schindler Holding AG (participation certificate) | 51,171 | | 5,484,371 |
The Swatch Group AG (Bearer) | 17,400 | | 6,648,184 |
Transocean Ltd. (a) | 33,700 | | 2,135,232 |
UBS AG (NY Shares) (a) | 583,200 | | 9,926,064 |
TOTAL SWITZERLAND | | 73,810,848 |
Turkey - 0.7% |
Boyner Buyuk Magazacilik AS (a) | 796,000 | | 1,853,615 |
Turkiye Garanti Bankasi AS | 674,000 | | 4,135,258 |
TOTAL TURKEY | | 5,988,873 |
United Kingdom - 30.3% |
Aegis Group PLC | 981,027 | | 1,975,693 |
AstraZeneca PLC (United Kingdom) | 101,136 | | 5,086,697 |
BG Group PLC | 617,193 | | 12,019,299 |
BHP Billiton PLC | 174,421 | | 6,178,091 |
BP PLC | 1,782,800 | | 12,116,477 |
BP PLC sponsored ADR | 351,900 | | 14,368,077 |
British Airways PLC (a)(d) | 1,535,100 | | 6,657,760 |
Britvic PLC | 444,705 | | 3,437,023 |
Burberry Group PLC | 350,400 | | 5,720,598 |
Capita Group PLC | 273,500 | | 3,358,711 |
Carphone Warehouse Group PLC | 2,917,789 | | 14,234,570 |
Fresnillo PLC | 266,100 | | 5,329,151 |
GlaxoSmithKline PLC | 791,000 | | 15,444,347 |
HSBC Holdings PLC: | | | |
(Hong Kong) | 755 | | 7,870 |
(United Kingdom) | 1,779,655 | | 18,519,699 |
ITV PLC (a) | 4,504,100 | | 4,925,086 |
Kazakhmys PLC | 132,900 | | 2,802,103 |
Kesa Electricals PLC | 1,004,700 | | 2,551,343 |
|
| Shares | | Value |
Lloyds Banking Group PLC (a) | 7,272,500 | | $ 7,992,374 |
Micro Focus International PLC | 594,600 | | 3,637,173 |
Misys PLC (a) | 840,400 | | 3,788,901 |
Morgan Crucible Co. PLC | 829,500 | | 3,043,372 |
Next PLC | 73,200 | | 2,679,788 |
Reckitt Benckiser Group PLC | 169,000 | | 9,452,349 |
Royal Dutch Shell PLC Class A (Netherlands) | 760,300 | | 24,655,717 |
Sage Group PLC | 636,400 | | 2,746,825 |
Schroders PLC | 164,300 | | 4,156,453 |
Standard Chartered PLC (United Kingdom) | 369,711 | | 10,694,563 |
TalkTalk Telecom Group PLC (a) | 1,255,000 | | 2,652,111 |
Vodafone Group PLC | 7,563,700 | | 20,673,576 |
Wolfson Microelectronics PLC (a) | 940,600 | | 3,835,270 |
Xstrata PLC | 448,200 | | 8,685,222 |
TOTAL UNITED KINGDOM | | 243,426,289 |
United States of America - 2.9% |
Allergan, Inc. | 46,000 | | 3,330,860 |
Anadarko Petroleum Corp. | 63,700 | | 3,922,009 |
Apple, Inc. (a) | 13,800 | | 4,152,006 |
CF Industries Holdings, Inc. | 23,500 | | 2,879,455 |
Google, Inc. Class A (a) | 4,300 | | 2,635,857 |
Virgin Media, Inc. (d) | 258,800 | | 6,581,284 |
TOTAL UNITED STATES OF AMERICA | | 23,501,471 |
TOTAL COMMON STOCKS (Cost $658,357,892) | 753,069,143 |
Nonconvertible Preferred Stocks - 3.4% |
| | | |
Germany - 3.4% |
ProSiebenSat.1 Media AG | 462,790 | | 12,228,594 |
Volkswagen AG | 98,000 | | 14,727,107 |
TOTAL NONCONVERTIBLE PREFERRED STOCKS (Cost $17,382,075) | 26,955,701 |
Money Market Funds - 5.5% |
| | | |
Fidelity Cash Central Fund, 0.23% (b) | 28,756,885 | | 28,756,885 |
Fidelity Securities Lending Cash Central Fund, 0.24% (b)(c) | 15,650,606 | | 15,650,606 |
TOTAL MONEY MARKET FUNDS (Cost $44,407,491) | 44,407,491 |
TOTAL INVESTMENT PORTFOLIO - 102.7% (Cost $720,147,458) | | 824,432,335 |
NET OTHER ASSETS (LIABILITIES) - (2.7)% | | (21,905,554) |
NET ASSETS - 100% | $ 802,526,781 |
Legend |
(a) Non-income producing |
(b) Affiliated fund that is available only to investment companies and other accounts managed by Fidelity Investments. The rate quoted is the annualized seven-day yield of the fund at period end. A complete unaudited listing of the fund's holdings as of its most recent quarter end is available upon request. In addition, each Fidelity Central Fund's financial statements, which are not covered by the Fund's report of Independent Registered Public Accounting Firm, are available on the SEC's website or upon request. |
(c) Investment made with cash collateral received from securities on loan. |
(d) Security or a portion of the security is on loan at period end. |
Affiliated Central Funds |
Information regarding fiscal year to date income earned by the Fund from investments in Fidelity Central Funds is as follows: |
Fund | Income earned |
Fidelity Cash Central Fund | $ 63,354 |
Fidelity Securities Lending Cash Central Fund | 1,415,116 |
Total | $ 1,478,470 |
Other Information |
The following is a summary of the inputs used, as of October 31, 2010, involving the Fund's assets and liabilities carried at fair value. The inputs or methodology used for valuing securities may not be an indication of the risk associated with investing in those securities. For more information on valuation inputs, and their aggregation into the levels used in the table below, please refer to the Security Valuation section in the accompanying Notes to Financial Statements. |
Valuation Inputs at Reporting Date: |
Description | Total | Level 1 | Level 2 | Level 3 |
Investments in Securities: | | | | |
Equities: | | | | |
United Kingdom | $ 243,426,289 | $ 132,751,441 | $ 110,674,848 | $ - |
France | 99,317,038 | 99,317,038 | - | - |
Germany | 78,706,838 | 78,706,838 | - | - |
Switzerland | 73,810,848 | 54,694,878 | 19,115,970 | - |
Spain | 39,322,958 | 20,880,852 | 18,442,106 | - |
Sweden | 31,250,437 | 31,250,437 | - | - |
Belgium | 24,458,380 | 24,458,380 | - | - |
Denmark | 23,746,589 | 13,149,783 | 10,596,806 | - |
United States of America | 23,501,471 | 23,501,471 | - | - |
Other | 142,483,996 | 114,648,864 | 27,835,132 | - |
Money Market Funds | 44,407,491 | 44,407,491 | - | - |
Total Investments in Securities: | $ 824,432,335 | $ 637,767,473 | $ 186,664,862 | $ - |
Income Tax Information |
At October 31, 2010, the Fund had a capital loss carryforward of approximately $327,080,153 of which $185,464,698 and $141,615,455 will expire on October 31, 2016 and 2017, respectively. Capital loss carryforwards have been reduced based on regulations applicable to shareholder redemptions by affiliated entities. To the extent not limited by regulations, the capital loss carryforwards are available to offset future capital gains. |
See accompanying notes which are an integral part of the financial statements.
Annual Report
Fidelity Europe Fund
Statement of Assets and Liabilities
| October 31, 2010 |
| | |
Assets | | |
Investment in securities, at value (including securities loaned of $14,847,723) - See accompanying schedule: Unaffiliated issuers (cost $675,739,967) | $ 780,024,844 | |
Fidelity Central Funds (cost $44,407,491) | 44,407,491 | |
Total Investments (cost $720,147,458) | | $ 824,432,335 |
Receivable for investments sold | | 5,034,853 |
Receivable for fund shares sold | | 260,222 |
Dividends receivable | | 2,465,628 |
Distributions receivable from Fidelity Central Funds | | 27,244 |
Other receivables | | 392,599 |
Total assets | | 832,612,881 |
| | |
Liabilities | | |
Payable to custodian bank | $ 57,438 | |
Payable for investments purchased | 12,433,586 | |
Payable for fund shares redeemed | 603,566 | |
Accrued management fee | 922,190 | |
Other affiliated payables | 318,030 | |
Other payables and accrued expenses | 100,684 | |
Collateral on securities loaned, at value | 15,650,606 | |
Total liabilities | | 30,086,100 |
| | |
Net Assets | | $ 802,526,781 |
Net Assets consist of: | | |
Paid in capital | | $ 1,608,185,610 |
Undistributed net investment income | | 16,788,219 |
Accumulated undistributed net realized gain (loss) on investments and foreign currency transactions | | (926,883,033) |
Net unrealized appreciation (depreciation) on investments and assets and liabilities in foreign currencies | | 104,435,985 |
Net Assets, for 26,033,558 shares outstanding | | $ 802,526,781 |
Net Asset Value, offering price and redemption price per share ($802,526,781 ÷ 26,033,558 shares) | | $ 30.83 |
Statement of Operations
| Year ended October 31, 2010 |
| | |
Investment Income | | |
Dividends | | $ 49,116,321 |
Interest | | 1,576 |
Income from Fidelity Central Funds | | 1,478,470 |
Income before foreign taxes withheld | | 50,596,367 |
Less foreign taxes withheld | | (5,266,814) |
Total income | | 45,329,553 |
| | |
Expenses | | |
Management fee
Basic fee | $ 14,730,995 | |
Performance adjustment | 2,063,185 | |
Transfer agent fees | 4,627,847 | |
Accounting and security lending fees | 924,031 | |
Custodian fees and expenses | 375,928 | |
Independent trustees' compensation | 12,733 | |
Registration fees | 22,937 | |
Audit | 77,380 | |
Legal | 14,153 | |
Interest | 1,242 | |
Miscellaneous | 35,344 | |
Total expenses before reductions | 22,885,775 | |
Expense reductions | (1,580,717) | 21,305,058 |
Net investment income (loss) | | 24,024,495 |
Realized and Unrealized Gain (Loss) Net realized gain (loss) on: | | |
Investment securities: | | |
Unaffiliated issuers | 183,066,482 | |
Foreign currency transactions | (1,136,579) | |
Redemption in-kind with affiliated entities | 217,485,210 | |
Capital gain distributions from Fidelity Central Funds | 3,663 | |
Total net realized gain (loss) | | 399,418,776 |
Change in net unrealized appreciation (depreciation) on: Investment securities | (270,021,187) | |
Assets and liabilities in foreign currencies | 24,338 | |
Total change in net unrealized appreciation (depreciation) | | (269,996,849) |
Net gain (loss) | | 129,421,927 |
Net increase (decrease) in net assets resulting from operations | | $ 153,446,422 |
See accompanying notes which are an integral part of the financial statements.
Annual Report
Fidelity Europe Fund
Financial Statements - continued
Statement of Changes in Net Assets
| Year ended
October 31,
2010 | Year ended
October 31,
2009 |
Increase (Decrease) in Net Assets | | |
Operations | | |
Net investment income (loss) | $ 24,024,495 | $ 56,325,730 |
Net realized gain (loss) | 399,418,776 | (724,651,734) |
Change in net unrealized appreciation (depreciation) | (269,996,849) | 1,226,123,892 |
Net increase (decrease) in net assets resulting from operations | 153,446,422 | 557,797,888 |
Distributions to shareholders from net investment income | (52,304,897) | (84,199,329) |
Share transactions - net increase (decrease) | (2,163,924,191) | (360,094,583) |
Redemption fees | 18,688 | 14,843 |
Total increase (decrease) in net assets | (2,062,763,978) | 113,518,819 |
| | |
Net Assets | | |
Beginning of period | 2,865,290,759 | 2,751,771,940 |
End of period (including undistributed net investment income of $16,788,219 and undistributed net investment income of $46,201,533, respectively) | $ 802,526,781 | $ 2,865,290,759 |
Financial Highlights
Years ended October 31, | 2010 | 2009 | 2008 | 2007 | 2006 |
Selected Per-Share Data | | | | | |
Net asset value, beginning of period | $ 28.52 | $ 23.57 | $ 47.46 | $ 42.31 | $ 37.26 |
Income from Investment Operations | | | | | |
Net investment income (loss) B | .33 | .52 | .68 | .69 | .58 |
Net realized and unrealized gain (loss) | 2.50 | 5.16 | (20.84) | 9.99 | 8.74 |
Total from investment operations | 2.83 | 5.68 | (20.16) | 10.68 | 9.32 |
Distributions from net investment income | (.52) | (.73) | (.65) | (.46) | (.30) |
Distributions from net realized gain | - | - | (3.08) | (5.07) | (3.97) |
Total distributions | (.52) | (.73) | (3.73) | (5.53) | (4.27) |
Redemption fees added to paid in capital B, F | - | - | - | - | - |
Net asset value, end of period | $ 30.83 | $ 28.52 | $ 23.57 | $ 47.46 | $ 42.31 |
Total Return A | 10.01% | 25.36% | (46.03)% | 28.33% | 27.40% |
Ratios to Average Net Assets C, E | | | | | |
Expenses before reductions | 1.12% | 1.09% | 1.00% | 1.06% | 1.16% |
Expenses net of fee waivers, if any | 1.12% | 1.09% | 1.00% | 1.06% | 1.16% |
Expenses net of all reductions | 1.04% | 1.04% | .95% | 1.01% | 1.05% |
Net investment income (loss) | 1.15% | 2.22% | 1.82% | 1.65% | 1.48% |
Supplemental Data | | | | | |
Net assets, end of period (000 omitted) | $ 802,527 | $ 2,845,423 | $ 2,751,772 | $ 5,464,623 | $ 4,033,263 |
Portfolio turnover rate D | 136% | 135% | 100% | 100% | 127% |
A Total returns would have been lower had certain expenses not been reduced during the periods shown.
B Calculated based on average shares outstanding during the period.
C Fees and expenses of the underlying Fidelity Central Funds are not included in the Fund's expense ratio. The Fund indirectly bears its proportionate share of the expenses of any underlying Fidelity Central Funds.
D Amount does not include the portfolio activity of any underlying Fidelity Central Funds.
E Expense ratios reflect operating expenses of the Fund. Expenses before reductions do not reflect amounts reimbursed by the investment adviser or reductions from brokerage service arrangements or reductions from other expense offset arrangements and do not represent the amount paid by the Fund during periods when reimbursements or reductions occur. Expenses net of fee waivers reflect expenses after reimbursement by the investment adviser but prior to reductions from brokerage service arrangements or other expense offset arrangements. Expenses net of all reductions represent the net expenses paid by the Fund.
F Amount represents less than $.01 per share.
See accompanying notes which are an integral part of the financial statements.
Annual Report
Notes to Financial Statements
For the period ended October 31, 2010
1. Organization.
Fidelity Europe Fund (the Fund) is a fund of Fidelity Investment Trust (the Trust) and is authorized to issue an unlimited number of shares. The Trust is registered under the Investment Company Act of 1940, as amended (the 1940 Act), as an open-end management investment company organized as a Massachusetts business trust. The Fund offered Class F shares during the period June 26, 2009 through October 22, 2010, and all outstanding shares were redeemed by period end.
2. Investments in Fidelity Central Funds.
The Fund may invest in Fidelity Central Funds, which are open-end investment companies available only to other investment companies and accounts managed by Fidelity Management & Research Company (FMR) and its affiliates. The Fund's Schedule of Investments lists each of the Fidelity Central Funds held as of period end, if any, as an investment of the Fund, but does not include the underlying holdings of each Fidelity Central Fund. As an Investing Fund, the Fund indirectly bears its proportionate share of the expenses of the underlying Fidelity Central Funds.
The Money Market Central Funds seek preservation of capital and current income and are managed by Fidelity Investments Money Management, Inc. (FIMM), an affiliate of FMR.
A complete unaudited list of holdings for each Fidelity Central Fund is available upon request or at the Securities and Exchange Commission (the SEC) web site at www.sec.gov. In addition, the financial statements of the Fidelity Central Funds, which are not covered by the Fund's Report of Independent Registered Public Accounting Firm, are available on the SEC web site or upon request.
3. Significant Accounting Policies.
The financial statements have been prepared in conformity with accounting principles generally accepted in the United States of America (GAAP), which require management to make certain estimates and assumptions at the date of the financial statements. Actual results could differ from those estimates. The following summarizes the significant accounting policies of the Fund:
Security Valuation. Investments are valued as of 4:00 p.m. Eastern time on the last calendar day of the period. The Fund uses independent pricing services approved by the Board of Trustees to value its investments. When current market prices or quotations are not readily available or reliable, valuations may be determined in good faith in accordance with procedures adopted by the Board of Trustees. Factors used in determining value may include market or security specific events. The frequency with which these procedures are used cannot be predicted and they may be utilized to a significant extent. The value used for net asset value (NAV) calculation under these procedures may differ from published prices for the same securities.
The Fund categorizes the inputs to valuation techniques used to value its investments into a disclosure hierarchy consisting of three levels as shown below.
Level 1 - quoted prices in active markets for identical investments
Level 2 - other significant observable inputs (including quoted prices for similar investments, interest rates, prepayment speeds, etc.)
Level 3 - unobservable inputs (including the fund's own assumptions based on the best information available)
Changes in valuation techniques may result in transfers in or out of an assigned level within the disclosure hierarchy. The aggregate value of investments by input level, as of October 31, 2010 is included at the end of the Fund's Schedule of Investments. Valuation techniques used to value the Fund's investments by major category are as follows.
Equity securities, including restricted securities, for which market quotations are readily available, are valued at the last reported sale price or official closing price as reported by an independent pricing service on the primary market or exchange on which they are traded and are categorized as Level 1 in the hierarchy. In the event there were no sales during the day or closing prices are not available, securities are valued at the last quoted bid price or may be valued using the last available price and are generally categorized as Level 2 in the hierarchy. For foreign equity securities, when significant market or security specific events arise, comparisons to the valuation of American Depositary Receipts (ADRs), futures contracts, Exchange-traded funds (ETFs) and certain indexes as well as quoted prices for similar securities are used and are categorized as Level 2 in the hierarchy in these circumstances. Utilizing these techniques may result in significant transfers between Level 1 and Level 2. For restricted equity securities and private placements where observable inputs are limited, assumptions about market activity and risk are used and are categorized as Level 3 in the hierarchy.
Investments in open-end mutual funds, including the Fidelity Central Funds, are valued at their closing net asset value each business day and are categorized as Level 1 in the hierarchy. Short-term securities with remaining maturities of sixty days or less for which quotations are not readily available are valued at amortized cost, which approximates fair value and are categorized as Level 2 in the hierarchy.
Annual Report
3. Significant Accounting Policies - continued
Foreign Currency. The Fund uses foreign currency contracts to facilitate transactions in foreign-denominated securities. Gains and losses from these transactions may arise from changes in the value of the foreign currency or if the counterparties do not perform under the contracts' terms.
Foreign-denominated assets, including investment securities, and liabilities are translated into U.S. dollars at the exchange rate at period end. Purchases and sales of investment securities, income and dividends received and expenses denominated in foreign currencies are translated into U.S. dollars at the exchange rate in effect on the transaction date.
The effects of exchange rate fluctuations on investments are included with the net realized and unrealized gain (loss) on investment securities. Other foreign currency transactions resulting in realized and unrealized gain (loss) are disclosed separately.
Investment Transactions and Income. For financial reporting purposes, the Fund's investment holdings and NAV include trades executed through the end of the last business day of the period. The NAV per share for processing shareholder transactions is calculated as of the close of business of the New York Stock Exchange (NYSE), normally 4:00 p.m. Eastern time and includes trades executed through the end of the prior business day. Gains and losses on securities sold are determined on the basis of identified cost and may include proceeds received from litigation. Dividend income is recorded on the ex-dividend date, except for certain dividends from foreign securities where the ex-dividend date may have passed, which are recorded as soon as the Fund is informed of the ex-dividend date. Non-cash dividends included in dividend income, if any, are recorded at the fair market value of the securities received. Distributions received on securities that represent a return of capital or capital gain are recorded as a reduction of cost of investments and/or as a realized gain. The Fund estimates the components of distributions received that may be considered return of capital distributions or capital gain distributions. Interest income and distributions from the Fidelity Central Funds are accrued as earned. Interest income includes coupon interest and amortization of premium and accretion of discount on debt securities. Investment income is recorded net of foreign taxes withheld where recovery of such taxes is uncertain.
Expenses. Most expenses of the Trust can be directly attributed to a fund. Expenses which cannot be directly attributed are apportioned amongst each fund in the Trust. Expense estimates are accrued in the period to which they relate and adjustments are made when actual amounts are known.
Income Tax Information and Distributions to Shareholders. Each year the Fund intends to qualify as a regulated investment company, including distributing substantially all of its taxable income and realized gains under Subchapter M of the Internal Revenue Code and filing its U.S. federal tax return. As a result, no provision for income taxes is required. As of October 31, 2010, the Fund did not have any unrecognized tax benefits in the accompanying financial statements. A fund's federal tax return is subject to examination by the Internal Revenue Service (IRS) for a period of three years. Foreign taxes are provided for based on the Fund's understanding of the tax rules and rates that exist in the foreign markets in which it invests.
Distributions are declared and recorded on the ex-dividend date. Income and capital gain distributions are determined in accordance with income tax regulations, which may differ from GAAP.
Capital accounts within the financial statements are adjusted for permanent book-tax differences. These adjustments have no impact on net assets or the results of operations. Temporary book-tax differences will reverse in a subsequent period.
Book-tax differences are primarily due to the short-term gain distributions from the Fidelity Central Funds, foreign currency transactions, deferred trustees compensation, capital loss carryforwards and losses deferred due to wash sales.
The federal tax cost of investment securities and unrealized appreciation (depreciation) as of period end were as follows:
Gross unrealized appreciation | $ 122,752,200 |
Gross unrealized depreciation | (32,667,701) |
Net unrealized appreciation (depreciation) | $ 90,084,499 |
| |
Tax Cost | $ 734,347,836 |
The tax-based components of distributable earnings as of period end were as follows:
Undistributed ordinary income | $ 16,788,903 |
Capital loss carryforward | $ (327,080,153) |
Net unrealized appreciation (depreciation) | $ 90,235,607 |
The tax character of distributions paid was as follows:
| October 31, 2010 | October 31, 2009 |
Ordinary Income | $ 52,304,897 | $ 84,199,329 |
Annual Report
Notes to Financial Statements - continued
3. Significant Accounting Policies - continued
Short-Term Trading (Redemption) Fees. Shares held by investors in the Fund less than 30 days are subject to a redemption fee equal to 1.00% of the net asset value of shares redeemed. All redemption fees, which reduce the proceeds of the shareholder redemption, are retained by the Fund and accounted for as an addition to paid in capital.
4. Purchases and Sales of Investments.
Purchases and sales of securities, other than short-term securities, aggregated $2,697,645,799 and $4,865,986,732, respectively.
5. Fees and Other Transactions with Affiliates.
Management Fee. FMR and its affiliates provide the Fund with investment management related services for which the Fund pays a monthly management fee. The management fee is the sum of an individual fund fee rate that is based on an annual rate of .45% of the Fund's average net assets and a group fee rate that averaged .26% during the period. The group fee rate is based upon the average net assets of all the mutual funds advised by FMR. The group fee rate decreases as assets under management increase and increases as assets under management decrease. In addition, the management fee is subject to a performance adjustment (up to a maximum of ± .20% of the Fund's average net assets over a 36 month performance period). The upward or downward adjustment to the management fee is based on the Fund's (the Europe Class of shares during the period June 26, 2009 through October 22, 2010) relative investment performance as compared to an appropriate benchmark index. For the period, the total annual management fee rate, including the performance adjustment, was .81% of the Fund's average net assets.
Transfer Agent Fees. Fidelity Investments Institutional Operations Company, Inc. (FIIOC), an affiliate of FMR, is the Fund's transfer, dividend disbursing and shareholder servicing agent. FIIOC receives account fees and asset-based fees that vary according to account size and type of account. FIIOC pays for typesetting, printing and mailing of shareholder reports, except proxy statements. For the period, the transfer agent fees were equivalent to an annual rate of .22% of average net assets.
Accounting and Security Lending Fees. Fidelity Service Company, Inc. (FSC), an affiliate of FMR, maintains the Fund's accounting records. The accounting fee is based on the level of average net assets for the month. Under a separate contract, FSC administers the security lending program. The security lending fee is based on the number and duration of lending transactions.
Brokerage Commissions. The Fund placed a portion of its portfolio transactions with brokerage firms which are affiliates of the investment adviser. The commissions paid to these affiliated firms were $6,448 for the period.
Interfund Lending Program. Pursuant to an Exemptive Order issued by the SEC, the Fund, along with other registered investment companies having management contracts with FMR, may participate in an interfund lending program. This program provides an alternative credit facility allowing the funds to borrow from, or lend money to, other participating affiliated funds. At period end, there were no interfund loans outstanding. The Fund's activity in this program during the period for which loans were outstanding was as follows:
Borrower or Lender | Average Daily
Loan Balance | Weighted Average
Interest Rate | Interest
Expense |
Borrower | $ 22,648,200 | .39% | $ 1,242 |
Redemptions in kind. During the period, 70,602,253 shares of the Fund held by affiliated entities were redeemed in kind for cash and securities with a value of $2,063,447,602. The net realized gain of $217,485,210 on securities delivered through in-kind redemptions is included in the accompanying Statement of Operations. The amount of in-kind redemptions is included in share transactions in the accompanying Statement of Changes in Net Assets as well as Note 10: Share Transactions. The Fund recognized no gain or loss for federal income tax purposes.
6. Committed Line of Credit.
The Fund participates with other funds managed by FMR or an affiliate in a $3.75 billion credit facility (the "line of credit") to be utilized for temporary or emergency purposes to fund shareholder redemptions or for other short-term liquidity purposes. The Fund has agreed to pay commitment fees on its pro-rata portion of the line of credit, which amounted to $8,759 and is reflected in Miscellaneous expenses on the Statement of Operations. During the period, there were no borrowings on this line of credit.
7. Security Lending.
The Fund lends portfolio securities through a lending agent from time to time in order to earn additional income. The lending agent may loan securities to certain qualified borrowers, including Fidelity Capital Markets (FCM), a broker-dealer affiliated with the Fund. On the settlement date of the loan, the Fund receives collateral (in the form of U.S. Treasury obligations, letters of credit and/or cash) against the loaned securities and maintains collateral in an amount not less than 100% of the market value of the loaned securities during the period of the loan. The market value of the loaned securities is determined at the close of business of the Fund and any additional required collateral is delivered to the Fund on the next business day. If the
Annual Report
7. Security Lending - continued
borrower defaults on its obligation to return the securities loaned because of insolvency or other reasons, a fund could experience delays and costs in recovering the securities loaned or in gaining access to the collateral. Any cash collateral received is invested in the Fidelity Securities Lending Cash Central Fund. The value of loaned securities and cash collateral at period end are disclosed on the Fund's Statement of Assets and Liabilities. Security lending income represents the income earned on investing cash collateral, less rebates paid to borrowers and lending agent fees associated with the loan, plus any premium payments received for lending certain types of securities. Security lending income is presented in the Statement of Operations as a component of income from Fidelity Central Funds. Total security lending income during the period amounted to $1,415,116. During the period, there were no securities loaned to FCM.
8. Expense Reductions.
Many of the brokers with whom FMR places trades on behalf of the Fund provided services to the Fund in addition to trade execution. These services included payments of certain expenses on behalf of the Fund totaling $1,580,662 for the period. In addition, through arrangements with the Fund's custodian, credits realized as a result of uninvested cash balances were used to reduce the Fund's expenses. During the period, these credits reduced the Fund's custody expenses by $55.
9. Distributions to Shareholders.
Distributions to shareholders of each class were as follows:
Years ended October 31, | 2010 A | 2009 |
From net investment income | | |
Europe | $ 51,533,641 | $ 84,199,329 |
Class F | 771,256 | - |
Total | $ 52,304,897 | $ 84,199,329 |
A All Class F shares were redeemed on October 22, 2010.
10. Share Transactions.
Transactions for each class of shares were as follows:
| Shares | Dollars |
Years ended October 31, | 2010 A | 2009 B | 2010 A | 2009 B |
Europe | | | | |
Shares sold | 3,055,065 | 8,157,697 | $ 87,101,342 | $ 210,132,130 |
Reinvestment of distributions | 1,727,950 | 4,111,918 | 50,888,132 | 83,348,583 |
Shares redeemed | (78,531,608)C | (29,232,967) | (2,273,191,951)C | (674,156,102) |
Net increase (decrease) | (73,748,593) | (16,963,352) | $ (2,135,202,477) | $ (380,675,389) |
Class F | | | | |
Shares sold | 7,673,061 | 703,795 | $ 215,895,954 | $ 20,808,216 |
Reinvestment of distributions | 26,189 | - | 771,256 | - |
Shares redeemed | (8,395,464)C | (7,581) | (245,388,924)C | (227,410) |
Net increase (decrease) | (696,214) | 696,214 | $ (28,721,714) | $ 20,580,806 |
A All Class F shares were redeemed on October 22, 2010.
B Share transactions for Class F are for the period June 26, 2009 (commencement of sale of shares) to October 31, 2009.
C Amount includes in-kind redemptions (see Note 5: Redemptions in kind).
11. Other.
The Fund's organizational documents provide former and current trustees and officers with a limited indemnification against liabilities arising in connection with the performance of their duties to the Fund. In the normal course of business, the Fund may also enter into contracts that provide general indemnifications. The Fund's maximum exposure under these arrangements is unknown as this would be dependent on future claims that may be made against the Fund. The risk of material loss from such claims is considered remote.
Annual Report
Fidelity Japan Fund
Performance: The Bottom Line
Average annual total return reflects the change in the value of an investment, assuming reinvestment of the class' distributions from dividend income and capital gains (the profits earned upon the sale of securities that have grown in value, if any) and assuming a constant rate of performance each year. The $10,000 table and the fund's returns do not reflect the deduction of taxes that a shareholder would pay on fund distributions or the redemption of fund shares. During periods of reimbursement by Fidelity, a fund's total return will be greater than it would be had the reimbursement not occurred. How a fund did yesterday is no guarantee of how it will do tomorrow.
Average Annual Total Returns
Periods ended October 31, 2010 | Past 1
year | Past 5
years | Past 10
years |
Fidelity Japan Fund | 7.12% | -3.05% | -2.29% |
$10,000 Over 10 Years
Let's say hypothetically that $10,000 was invested in Fidelity Japan Fund, a class of the fund, on October 31, 2000. The chart shows how the value of your investment would have changed, and also shows how the Tokyo Stock Price Index (TOPIX) performed over the same period.
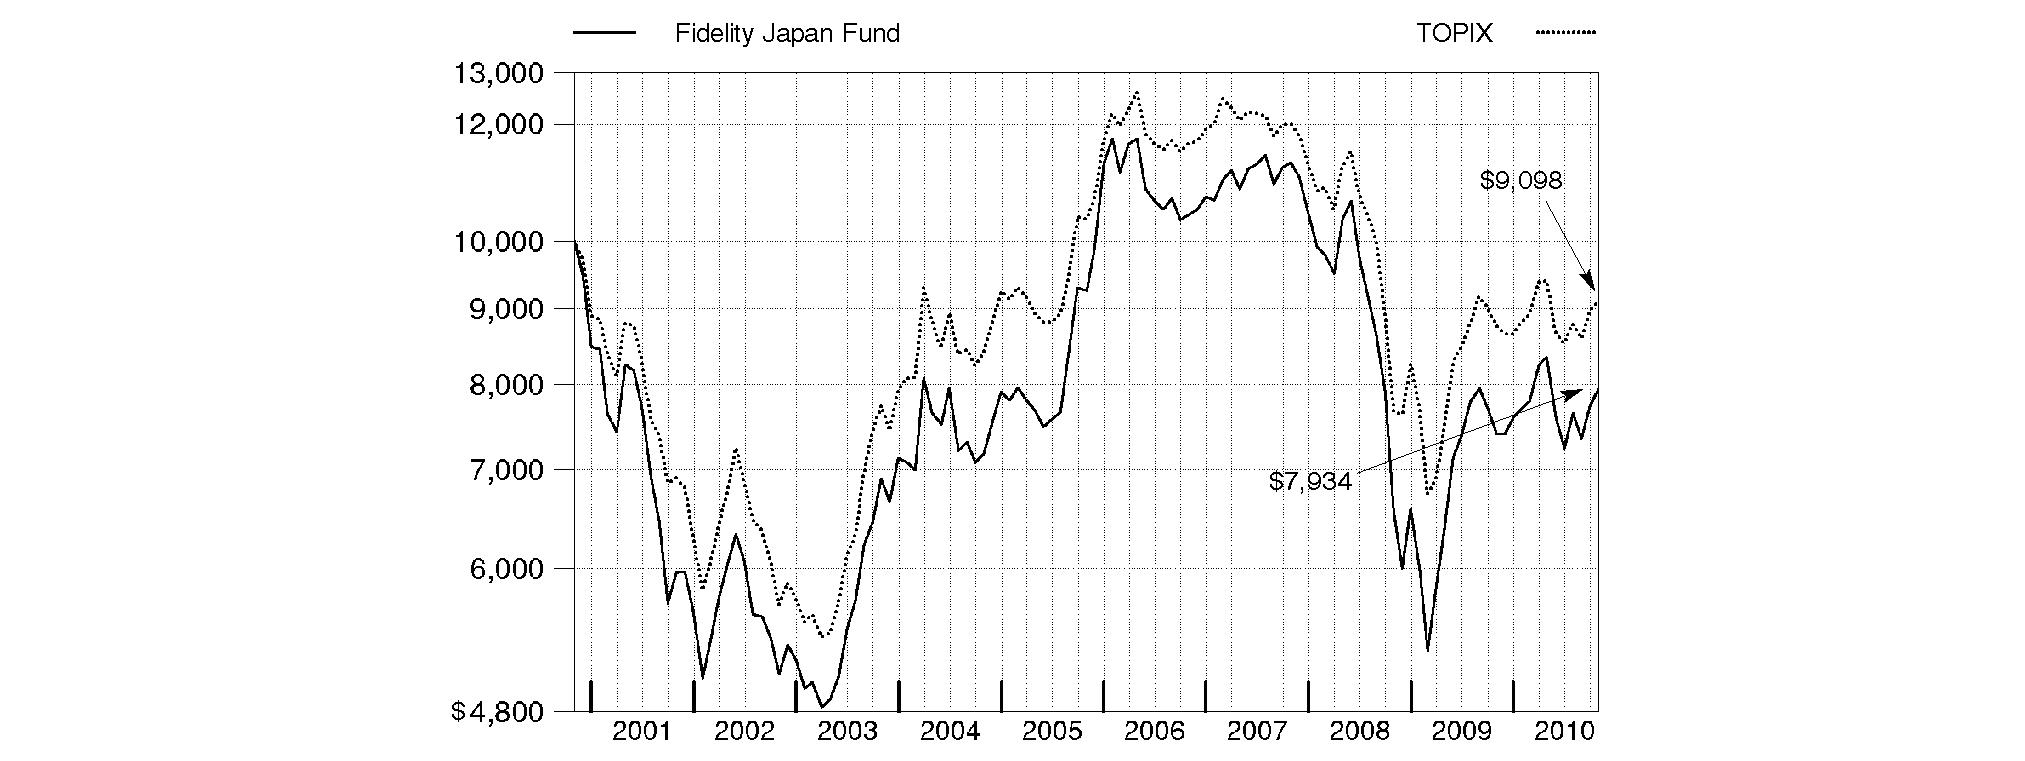
Annual Report
Fidelity Japan Fund
Market Recap: International stocks rode a wave of volatility similar to that of their U.S. counterparts during the 12 months ending October 31, 2010. Stocks gained modestly in the first half of the period, despite growing concerns about the European debt crisis. Sentiment turned decidedly negative in May and June, however, and the market suffered a precipitous decline. These losses were more than offset during the last four months of the period, when signs of economic growth and subsiding debt fears helped propel international stocks about 21%. For the full year, the MSCI® ACWI® (All Country World Index) ex USA Index gained 12.76%, boosted in part by a generally depreciating U.S. dollar. Within the index, Canada and emerging markets were standouts, returning 23% and 24%, respectively. Results in the latter group were led by strong-performing India, Mexico and South Africa, while China fell short of the MSCI benchmark due to cooling economic growth. The developed Asia ex Japan segment rose 16% for the period, lifted by solid results from Singapore and Hong Kong. Meanwhile, Europe rose just 9%, held back mainly by debt-riddled Spain and Italy, as well as lagging major constituent France. Japan returned only 5%, a result of that nation's continued weak economy.
Comments from Robert Rowland, Portfolio Manager of Fidelity® Japan Fund: During the past year, the fund's Retail Class shares returned 7.12%, handily beating the 3.70% gain of the Tokyo Stock Price Index (TOPIX). Strong stock picking in financials - particularly the diversified financials group - lifted the fund's results, as did favorable stock selection in industrials, consumer discretionary and information technology. Against a backdrop of improved credit conditions and a rebound in global equity markets, our holdings in non-bank financials, including Orix, Sompo Japan Insurance - which merged with NipponKoa Insurance to form NKSJ Holdings during the period - and Credit Saison, were among the leading contributors to performance. Other contributors included imaging and optical products manufacturer Canon, automaker Honda Motor, LCD (liquid-crystal display) component suppliers Nippon Electric Glass and Nitto Denko, and wireless telecommunication services and hardware provider NTT DoCoMo. Conversely, a large overweighting in financials, the benchmark's weakest-performing sector, undercut the benefit of favorable security selection in that group. Life insurer T&D Holdings detracted from performance, as did synthetic rubber/resin producer JSR and printed circuit board manufacturer Ibiden. Stanley Electric and Toyoda Gosei, makers of LED (light-emitting-diode) auto parts, also hurt.
The views expressed above reflect those of the portfolio manager(s) only through the end of the period as stated on the cover of this report and do not necessarily represent the views of Fidelity or any other person in the Fidelity organization. Any such views are subject to change at any time based upon market or other conditions and Fidelity disclaims any responsibility to update such views. These views may not be relied on as investment advice and, because investment decisions for a Fidelity fund are based on numerous factors, may not be relied on as an indication of trading intent on behalf of any Fidelity fund.
Annual Report
Fidelity Japan Fund
As a shareholder of the Fund, you incur two types of costs: (1) transaction costs, including redemption fees, and (2) ongoing costs, including management fees and other Fund expenses. This Example is intended to help you understand your ongoing costs (in dollars) of investing in the Fund and to compare these costs with the ongoing costs of investing in other mutual funds.
The Example is based on an investment of $1,000 invested at the beginning of the period and held for the entire period (May 1, 2010 to October 31, 2010).
Actual Expenses
The first line of the accompanying table for each class of the Fund provides information about actual account values and actual expenses. You may use the information in this line, together with the amount you invested, to estimate the expenses that you paid over the period. Simply divide your account value by $1,000.00 (for example, an $8,600 account value divided by $1,000.00 = 8.6), then multiply the result by the number in the first line for a class of the Fund under the heading entitled "Expenses Paid During Period" to estimate the expenses you paid on your account during this period. A small balance maintenance fee of $12.00 that is charged once a year may apply for certain accounts with a value of less than $2,000. This fee is not included in the table below. If it was, the estimate of expenses you paid during the period would be higher, and your ending account value lower, by this amount. In addition, the Fund, as a shareholder in the underlying Fidelity Central Funds, will indirectly bear its pro-rata share of the fees and expenses incurred by the underlying Fidelity Central Funds. These fees and expenses are not included in the Fund's annualized expense ratio used to calculate the expense estimate in the table below.
Hypothetical Example for Comparison Purposes
The second line of the accompanying table for each class of the Fund provides information about hypothetical account values and hypothetical expenses based on a Class' actual expense ratio and an assumed rate of return of 5% per year before expenses, which is not the Class' actual return. The hypothetical account values and expenses may not be used to estimate the actual ending account balance or expenses you paid for the period. You may use this information to compare the ongoing costs of investing in the Fund and other funds. To do so, compare this 5% hypothetical example with the 5% hypothetical examples that appear in the shareholder reports of the other funds. A small balance maintenance fee of $12.00 that is charged once a year may apply for certain accounts with a value of less than $2,000. This fee is not included in the table below. If it was, the estimate of expenses you paid during the period would be higher, and your ending account value lower, by this amount. In addition, the Fund, as a shareholder in the underlying Fidelity Central Funds, will indirectly bear its pro-rata share of the fees and expenses incurred by the underlying Fidelity Central Funds. These fees and expenses are not included in the Fund's annualized expense ratio used to calculate the expense estimate in the table below.
Please note that the expenses shown in the table are meant to highlight your ongoing costs only and do not reflect any transaction costs. Therefore, the second line of the table is useful in comparing ongoing costs only, and will not help you determine the relative total costs of owning different funds. In addition, if these transactional costs were included, your costs would have been higher.
| Annualized
Expense Ratio | Beginning
Account Value
May 1, 2010 | Ending
Account Value
October 31, 2010 | Expenses Paid
During Period*
May 1, 2010 to
October 31, 2010 |
Japan | .88% | | | |
Actual | | $ 1,000.00 | $ 950.50 | $ 4.33 |
HypotheticalA | | $ 1,000.00 | $ 1,020.77 | $ 4.48 |
Class F | .68% | | | |
Actual | | $ 1,000.00 | $ 952.40 | $ 3.35 |
HypotheticalA | | $ 1,000.00 | $ 1,021.78 | $ 3.47 |
A 5% return per year before expenses
* Expenses are equal to each Class' annualized expense ratio, multiplied by the average account value over the period, multiplied by 184/365 (to reflect the one-half year period).
Annual Report
Fidelity Japan Fund
Investment Changes (Unaudited)
Geographic Diversification (% of fund's net assets) |
As of October 31, 2010 |
| Japan | 94.5% | |
| United States of America | 5.5% | |

Percentages are adjusted for the effect of futures contracts, if applicable. |
As of April 30, 2010 |
| Japan | 92.7% | |
| United States of America | 7.3% | |

Percentages are adjusted for the effect of futures contracts, if applicable. |
Asset Allocation |
| % of fund's
net assets | % of fund's net assets
6 months ago |
Stocks | 94.5 | 92.7 |
Short-Term Investments and Net Other Assets | 5.5 | 7.3 |
Top Ten Stocks as of October 31, 2010 |
| % of fund's
net assets | % of fund's net assets
6 months ago |
Mitsubishi UFJ Financial Group, Inc. (Commercial Banks) | 3.7 | 3.8 |
Sumitomo Mitsui Financial Group, Inc. (Commercial Banks) | 3.6 | 4.0 |
ORIX Corp. (Consumer Finance) | 3.5 | 2.5 |
Canon, Inc. (Office Electronics) | 3.3 | 3.4 |
Sumitomo Trust & Banking Co. Ltd. (Commercial Banks) | 3.1 | 2.5 |
Honda Motor Co. Ltd. (Automobiles) | 2.7 | 2.8 |
Denso Corp. (Auto Components) | 2.6 | 1.8 |
The Sumitomo Warehouse Co. Ltd. (Transportation Infrastructure) | 2.2 | 1.6 |
Mitsubishi Estate Co. Ltd. (Real Estate Management & Development) | 2.2 | 2.3 |
Mitsui & Co. Ltd. (Trading Companies & Distributors) | 2.1 | 1.9 |
| 29.0 | |
Market Sectors as of October 31, 2010 |
| % of fund's
net assets | % of fund's net assets
6 months ago |
Financials | 32.4 | 31.1 |
Consumer Discretionary | 18.9 | 17.7 |
Industrials | 18.1 | 14.9 |
Information Technology | 11.6 | 13.3 |
Materials | 6.7 | 6.8 |
Consumer Staples | 3.9 | 2.3 |
Telecommunication Services | 2.0 | 5.5 |
Health Care | 0.9 | 1.1 |
Annual Report
Fidelity Japan Fund
Investments October 31, 2010
Showing Percentage of Net Assets
Common Stocks - 94.5% |
| Shares | | Value |
CONSUMER DISCRETIONARY - 18.9% |
Auto Components - 6.8% |
Denso Corp. | 571,000 | | $ 17,757,013 |
NOK Corp. | 444,700 | | 7,941,269 |
Stanley Electric Co. Ltd. | 713,500 | | 11,978,855 |
Toyoda Gosei Co. Ltd. | 420,600 | | 9,063,258 |
| | 46,740,395 |
Automobiles - 3.6% |
Honda Motor Co. Ltd. | 505,600 | | 18,226,266 |
Toyota Motor Corp. | 181,900 | | 6,442,946 |
| | 24,669,212 |
Household Durables - 1.6% |
Sekisui House Ltd. | 1,131,000 | | 10,629,570 |
Leisure Equipment & Products - 1.9% |
Nikon Corp. | 361,900 | | 6,834,764 |
Sega Sammy Holdings, Inc. | 393,300 | | 6,422,222 |
| | 13,256,986 |
Media - 1.2% |
Fuji Media Holdings, Inc. | 6,020 | | 7,974,798 |
Multiline Retail - 1.6% |
Isetan Mitsukoshi Holdings Ltd. | 418,540 | | 4,618,087 |
Ryohin Keikaku Co. Ltd. | 52,100 | | 1,849,106 |
Takashimaya Co. Ltd. | 611,000 | | 4,599,403 |
| | 11,066,596 |
Specialty Retail - 2.2% |
Nishimatsuya Chain Co. Ltd. | 544,600 | | 5,244,998 |
Shimachu Co. Ltd. | 136,300 | | 2,799,850 |
Xebio Co. Ltd. | 129,400 | | 2,540,723 |
Yamada Denki Co. Ltd. | 65,090 | | 4,230,405 |
| | 14,815,976 |
TOTAL CONSUMER DISCRETIONARY | | 129,153,533 |
CONSUMER STAPLES - 3.9% |
Beverages - 1.2% |
Coca-Cola West Co. Ltd. | 92,300 | | 1,411,971 |
Kirin Holdings Co. Ltd. | 524,000 | | 7,180,735 |
| | 8,592,706 |
Food & Staples Retailing - 1.7% |
FamilyMart Co. Ltd. | 162,000 | | 5,749,621 |
Lawson, Inc. | 128,600 | | 5,849,086 |
| | 11,598,707 |
Personal Products - 1.0% |
Kao Corp. | 171,800 | | 4,366,634 |
Kose Corp. | 92,000 | | 2,205,393 |
| | 6,572,027 |
TOTAL CONSUMER STAPLES | | 26,763,440 |
|
| Shares | | Value |
FINANCIALS - 32.4% |
Capital Markets - 1.1% |
Matsui Securities Co. Ltd. | 762,300 | | $ 4,311,562 |
Nomura Holdings, Inc. | 654,500 | | 3,363,335 |
| | 7,674,897 |
Commercial Banks - 13.8% |
Chiba Bank Ltd. | 1,415,000 | | 8,735,989 |
Mitsubishi UFJ Financial Group, Inc. | 5,428,400 | | 25,193,229 |
Mizuho Financial Group, Inc. | 5,627,500 | | 8,161,669 |
Seven Bank Ltd. | 3,403 | | 6,127,683 |
Sumitomo Mitsui Financial Group, Inc. | 836,600 | | 24,970,624 |
Sumitomo Trust & Banking Co. Ltd. | 3,891,000 | | 21,244,095 |
| | 94,433,289 |
Consumer Finance - 5.0% |
Credit Saison Co. Ltd. | 718,000 | | 10,183,897 |
ORIX Corp. | 264,690 | | 24,143,464 |
| | 34,327,361 |
Insurance - 5.9% |
MS&AD Insurance Group Holdings, Inc. | 248,900 | | 5,962,872 |
NKSJ Holdings, Inc. | 1,971,000 | | 13,544,960 |
Sony Financial Holdings, Inc. | 2,047 | | 7,122,654 |
T&D Holdings, Inc. | 661,000 | | 13,497,219 |
| | 40,127,705 |
Real Estate Investment Trusts - 3.0% |
Japan Prime Realty Investment Corp. | 1,808 | | 4,491,353 |
Japan Real Estate Investment Corp. | 873 | | 8,407,791 |
Nomura Real Estate Office Fund, Inc. | 1,283 | | 7,884,224 |
| | 20,783,368 |
Real Estate Management & Development - 3.6% |
Mitsubishi Estate Co. Ltd. | 829,000 | | 14,522,786 |
Mitsui Fudosan Co. Ltd. | 513,000 | | 9,700,967 |
| | 24,223,753 |
TOTAL FINANCIALS | | 221,570,373 |
HEALTH CARE - 0.9% |
Health Care Providers & Services - 0.9% |
Alfresa Holdings Corp. | 145,100 | | 6,103,684 |
INDUSTRIALS - 18.1% |
Air Freight & Logistics - 0.7% |
Yamato Holdings Co. Ltd. | 381,300 | | 4,807,002 |
Building Products - 0.8% |
Daikin Industries Ltd. | 145,300 | | 5,055,161 |
Construction & Engineering - 0.3% |
Kandenko Co. Ltd. | 365,000 | | 2,127,314 |
Electrical Equipment - 2.4% |
Mitsubishi Electric Corp. | 984,000 | | 9,222,202 |
Sumitomo Electric Industries Ltd. | 585,600 | | 7,451,617 |
| | 16,673,819 |
Common Stocks - continued |
| Shares | | Value |
INDUSTRIALS - continued |
Machinery - 2.8% |
Fanuc Ltd. | 53,100 | | $ 7,687,269 |
Kubota Corp. | 686,000 | | 6,083,491 |
NSK Ltd. | 700,000 | | 5,292,312 |
| | 19,063,072 |
Marine - 0.5% |
Iino Kaiun Kaisha Ltd. | 313,500 | | 1,402,510 |
Mitsui OSK Lines Ltd. | 337,000 | | 2,155,233 |
| | 3,557,743 |
Road & Rail - 1.9% |
East Japan Railway Co. | 207,300 | | 12,801,508 |
Trading Companies & Distributors - 6.5% |
Itochu Corp. | 1,207,800 | | 10,585,501 |
Mitsubishi Corp. | 535,700 | | 12,867,342 |
Mitsui & Co. Ltd. | 906,700 | | 14,260,042 |
Sumitomo Corp. | 499,200 | | 6,320,275 |
| | 44,033,160 |
Transportation Infrastructure - 2.2% |
The Sumitomo Warehouse Co. Ltd. | 2,943,000 | | 15,287,361 |
TOTAL INDUSTRIALS | | 123,406,140 |
INFORMATION TECHNOLOGY - 11.6% |
Computers & Peripherals - 0.9% |
Fujitsu Ltd. | 913,000 | | 6,227,988 |
Electronic Equipment & Components - 4.6% |
Ibiden Co. Ltd. | 312,700 | | 7,701,894 |
Nippon Electric Glass Co. Ltd. | 357,000 | | 4,588,812 |
Yamatake Corp. | 525,700 | | 12,797,891 |
Yaskawa Electric Corp. | 787,000 | | 6,151,646 |
| | 31,240,243 |
Office Electronics - 4.0% |
Canon, Inc. | 489,300 | | 22,524,082 |
Konica Minolta Holdings, Inc. | 531,000 | | 5,131,023 |
| | 27,655,105 |
Semiconductors & Semiconductor Equipment - 1.5% |
ROHM Co. Ltd. | 75,800 | | 4,728,669 |
Tokyo Electron Ltd. | 92,700 | | 5,230,445 |
| | 9,959,114 |
Software - 0.6% |
Nintendo Co. Ltd. | 16,100 | | 4,171,554 |
TOTAL INFORMATION TECHNOLOGY | | 79,254,004 |
|
| Shares | | Value |
MATERIALS - 6.7% |
Chemicals - 5.5% |
JSR Corp. | 608,200 | | $ 10,528,428 |
Mitsubishi Chemical Holdings Corp. | 632,000 | | 3,250,741 |
Nissan Chemical Industries Co. Ltd. | 533,800 | | 6,129,366 |
Nitto Denko Corp. | 148,100 | | 5,539,716 |
Shin-Etsu Chemical Co., Ltd. | 155,000 | | 7,837,731 |
Tokai Carbon Co. Ltd. | 766,000 | | 4,516,573 |
| | 37,802,555 |
Containers & Packaging - 0.1% |
Toyo Seikan Kaisha Ltd. | 38,600 | | 658,661 |
Metals & Mining - 1.1% |
Nippon Steel Corp. | 524,000 | | 1,646,997 |
Sumitomo Metal Industries Ltd. | 2,522,000 | | 5,853,519 |
| | 7,500,516 |
TOTAL MATERIALS | | 45,961,732 |
TELECOMMUNICATION SERVICES - 2.0% |
Wireless Telecommunication Services - 2.0% |
NTT DoCoMo, Inc. | 8,265 | | 13,932,109 |
TOTAL COMMON STOCKS (Cost $752,409,896) | 646,145,015 |
Money Market Funds - 2.0% |
| | | |
Fidelity Cash Central Fund, 0.23% (b)
(Cost $13,390,434) | 13,390,434 | | 13,390,434 |
TOTAL INVESTMENT PORTFOLIO - 96.5% (Cost $765,800,330) | | 659,535,449 |
NET OTHER ASSETS (LIABILITIES) - 3.5% | | 24,061,859 |
NET ASSETS - 100% | $ 683,597,308 |
Legend |
(a) Non-income producing |
(b) Affiliated fund that is available only to investment companies and other accounts managed by Fidelity Investments. The rate quoted is the annualized seven-day yield of the fund at period end. A complete unaudited listing of the fund's holdings as of its most recent quarter end is available upon request. In addition, each Fidelity Central Fund's financial statements, which are not covered by the Fund's report of Independent Registered Public Accounting Firm, are available on the SEC's website or upon request. |
Affiliated Central Funds |
Information regarding fiscal year to date income earned by the Fund from investments in Fidelity Central Funds is as follows: |
Fund | Income earned |
Fidelity Cash Central Fund | $ 117,234 |
Fidelity Securities Lending Cash Central Fund | 20,227 |
Total | $ 137,461 |
Other Information |
The following is a summary of the inputs used, as of October 31, 2010, involving the Fund's assets and liabilities carried at fair value. The inputs or methodology used for valuing securities may not be an indication of the risk associated with investing in those securities. For more information on valuation inputs, and their aggregation into the levels used in the table below, please refer to the Security Valuation section in the accompanying Notes to Financial Statements. |
Valuation Inputs at Reporting Date: |
Description | Total | Level 1 | Level 2 | Level 3 |
Investments in Securities: | | | | |
Equities: | | | | |
Consumer Discretionary | $ 129,153,533 | $ 60,045,484 | $ 69,108,049 | $ - |
Consumer Staples | 26,763,440 | 15,216,071 | 11,547,369 | - |
Financials | 221,570,373 | 71,722,129 | 149,848,244 | - |
Health Care | 6,103,684 | 6,103,684 | - | - |
Industrials | 123,406,140 | 18,817,185 | 104,588,955 | - |
Information Technology | 79,254,004 | 35,551,654 | 43,702,350 | - |
Materials | 45,961,732 | 16,068,144 | 29,893,588 | - |
Telecommunication Services | 13,932,109 | - | 13,932,109 | - |
Money Market Funds | 13,390,434 | 13,390,434 | - | - |
Total Investments in Securities: | $ 659,535,449 | $ 236,914,785 | $ 422,620,664 | $ - |
Income Tax Information |
At October 31, 2010, the Fund had a capital loss carryforward of approximately $415,906,874 of which $151,185,501, $237,833,510 and $26,887,863 will expire on October 31, 2016, 2017 and 2018, respectively. Capital loss carryforwards are only available to offset future capital gains of the Fund to the extent provided by regulations and may be limited. |
See accompanying notes which are an integral part of the financial statements.
Annual Report
Fidelity Japan Fund
Statement of Assets and Liabilities
| October 31, 2010 |
Assets | | |
Investment in securities, at value - See accompanying schedule: Unaffiliated issuers (cost $752,409,896) | $ 646,145,015 | |
Fidelity Central Funds (cost $13,390,434) | 13,390,434 | |
Total Investments (cost $765,800,330) | | $ 659,535,449 |
Receivable for investments sold | | 18,050,540 |
Receivable for fund shares sold | | 180,832 |
Dividends receivable | | 6,802,286 |
Distributions receivable from Fidelity Central Funds | | 2,255 |
Other receivables | | 23 |
Total assets | | 684,571,385 |
| | |
Liabilities | | |
Payable for investments purchased | $ 51,037 | |
Payable for fund shares redeemed | 319,944 | |
Accrued management fee | 333,392 | |
Transfer agent fee payable | 144,298 | |
Other affiliated payables | 30,310 | |
Other payables and accrued expenses | 95,096 | |
Total liabilities | | 974,077 |
| | |
Net Assets | | $ 683,597,308 |
Net Assets consist of: | | |
Paid in capital | | $ 1,220,369,826 |
Undistributed net investment income | | 9,735,869 |
Accumulated undistributed net realized gain (loss) on investments and foreign currency transactions | | (440,538,383) |
Net unrealized appreciation (depreciation) on investments and assets and liabilities in foreign currencies | | (105,970,004) |
Net Assets | | $ 683,597,308 |
Japan:
Net Asset Value, offering price and redemption price per share ($649,315,663 ÷ 61,440,930 shares) | | $ 10.57 |
| | |
Class F:
Net Asset Value, offering price and redemption price per share ($34,281,645 ÷ 3,235,101 shares) | | $ 10.60 |
Statement of Operations
| Year ended October 31, 2010 |
| | |
Investment Income | | |
Dividends | | $ 20,417,362 |
Income from Fidelity Central Funds | | 137,461 |
Income before foreign taxes withheld | | 20,554,823 |
Less foreign taxes withheld | | (1,429,215) |
Total income | | 19,125,608 |
| | |
Expenses | | |
Management fee
Basic fee | $ 7,147,725 | |
Performance adjustment | (919,668) | |
Transfer agent fees | 2,272,841 | |
Accounting and security lending fees | 471,081 | |
Custodian fees and expenses | 156,426 | |
Independent trustees' compensation | 5,908 | |
Registration fees | 23,820 | |
Audit | 65,356 | |
Legal | 5,260 | |
Miscellaneous | 14,669 | |
Total expenses before reductions | 9,243,418 | |
Expense reductions | (28) | 9,243,390 |
Net investment income (loss) | | 9,882,218 |
Realized and Unrealized Gain (Loss) Net realized gain (loss) on: | | |
Investment securities: | | |
Unaffiliated issuers | (10,754,900) | |
Foreign currency transactions | 550,668 | |
Total net realized gain (loss) | | (10,204,232) |
Change in net unrealized appreciation (depreciation) on: Investment securities | 55,315,671 | |
Assets and liabilities in foreign currencies | 251,854 | |
Total change in net unrealized appreciation (depreciation) | | 55,567,525 |
Net gain (loss) | | 45,363,293 |
Net increase (decrease) in net assets resulting from operations | | $ 55,245,511 |
See accompanying notes which are an integral part of the financial statements.
Annual Report
Statement of Changes in Net Assets
| Year ended
October 31,
2010 | Year ended
October 31,
2009 |
Increase (Decrease) in Net Assets | | |
Operations | | |
Net investment income (loss) | $ 9,882,218 | $ 8,504,736 |
Net realized gain (loss) | (10,204,232) | (243,143,523) |
Change in net unrealized appreciation (depreciation) | 55,567,525 | 346,812,316 |
Net increase (decrease) in net assets resulting from operations | 55,245,511 | 112,173,529 |
Distributions to shareholders from net investment income | (6,665,780) | (12,255,123) |
Distributions to shareholders from net realized gain | (9,507,465) | (1,114,103) |
Total distributions | (16,173,245) | (13,369,226) |
Share transactions - net increase (decrease) | (305,864,432) | (173,975,850) |
Redemption fees | 107,736 | 118,891 |
Total increase (decrease) in net assets | (266,684,430) | (75,052,656) |
| | |
Net Assets | | |
Beginning of period | 950,281,738 | 1,025,334,394 |
End of period (including undistributed net investment income of $9,735,869 and undistributed net investment income of $6,519,430, respectively) | $ 683,597,308 | $ 950,281,738 |
Financial Highlights - Japan
Years ended October 31, | 2010 | 2009 | 2008 | 2007 | 2006 |
Selected Per-Share Data | | | | | |
Net asset value, beginning of period | $ 10.03 | $ 9.03 | $ 18.00 | $ 16.85 | $ 15.00 |
Income from Investment Operations | | | | | |
Net investment income (loss) B | .10 | .08 | .10 | .04 | .01 |
Net realized and unrealized gain (loss) | .61 | 1.04 | (6.64) | 1.35 | 1.85 |
Total from investment operations | .71 | 1.12 | (6.54) | 1.39 | 1.86 |
Distributions from net investment income | (.07) | (.11) | (.04) | (.01) | (.02) |
Distributions from net realized gain | (.10) | (.01) | (2.39) | (.23) | (.01) |
Total distributions | (.17) | (.12) | (2.43) | (.24) | (.03) |
Redemption fees added to paid in capital B | - F | - F | - F | - F | .02 |
Net asset value, end of period | $ 10.57 | $ 10.03 | $ 9.03 | $ 18.00 | $ 16.85 |
Total Return A | 7.12% | 12.84% | (41.88)% | 8.36% | 12.54% |
Ratios to Average Net Assets C, E | | | | | |
Expenses before reductions | .93% | .90% | 1.12% | 1.08% | 1.08% |
Expenses net of fee waivers, if any | .93% | .90% | 1.12% | 1.08% | 1.08% |
Expenses net of all reductions | .93% | .89% | 1.10% | 1.06% | 1.05% |
Net investment income (loss) | .97% | .90% | .72% | .24% | .08% |
Supplemental Data | | | | | |
Net assets, end of period (000 omitted) | $ 649,316 | $ 944,902 | $ 1,025,334 | $ 1,779,451 | $ 1,763,387 |
Portfolio turnover rate D | 43% | 73% | 78% | 158% | 78% |
A Total returns would have been lower had certain expenses not been reduced during the periods shown.
B Calculated based on average shares outstanding during the period.
C Fees and expenses of the underlying Fidelity Central Funds are not included in the Fund's expense ratio. The Fund indirectly bears its proportionate share of the expenses of any underlying Fidelity Central Funds.
D Amount does not include the portfolio activity of any underlying Fidelity Central Funds.
E Expense ratios reflect operating expenses of the class. Expenses before reductions do not reflect amounts reimbursed by the investment adviser or reductions from brokerage service arrangements or reductions from other expense offset arrangements and do not represent the amount paid by the class during periods when reimbursements or reductions occur. Expenses net of fee waivers reflect expenses after reimbursement by the investment adviser but prior to reductions from brokerage service arrangements or other expense offset arrangements. Expenses net of all reductions represent the net expenses paid by the class.
F Amount represents less than $.01 per share.
See accompanying notes which are an integral part of the financial statements.
Annual Report
Financial Highlights - Class F
Years ended October 31, | 2010 | 2009 G |
Selected Per-Share Data | | |
Net asset value, beginning of period | $ 10.04 | $ 10.06 |
Income from Investment Operations | | |
Net investment income (loss) D | .12 | - I |
Net realized and unrealized gain (loss) | .62 | (.02) |
Total from investment operations | .74 | (.02) |
Distributions from net investment income | (.08) | - |
Distributions from net realized gain | (.10) | - |
Total distributions | (.18) | - |
Redemption fees added to paid in capital D, I | - | - |
Net asset value, end of period | $ 10.60 | $ 10.04 |
Total Return B, C | 7.42% | (.20)% |
Ratios to Average Net Assets E, H | | |
Expenses before reductions | .69% | .69% A |
Expenses net of fee waivers, if any | .69% | .69% A |
Expenses net of all reductions | .69% | .68% A |
Net investment income (loss) | 1.21% | .07% A |
Supplemental Data | | |
Net assets, end of period (000 omitted) | $ 34,282 | $ 5,380 |
Portfolio turnover rate F | 43% | 73% |
A Annualized
B Total returns for periods of less than one year are not annualized.
C Total returns would have been lower had certain expenses not been reduced during the periods shown.
D Calculated based on average shares outstanding during the period.
E Fees and expenses of the underlying Fidelity Central Funds are not included in the Fund's expense ratio. The Fund indirectly bears its proportionate share of the expenses of any underlying Fidelity Central Funds.
F Amount does not include the portfolio activity of any underlying Fidelity Central Funds.
G For the period June 26, 2009 (commencement of sale of shares) to October 31, 2009.
H Expense ratios reflect operating expenses of the class. Expenses before reductions do not reflect amounts reimbursed by the investment adviser or reductions from brokerage service arrangements or reductions from other expense offset arrangements and do not represent the amount paid by the class during periods when reimbursements or reductions occur. Expenses net of fee waivers reflect expenses after reimbursement by the investment adviser but prior to reductions from brokerage service arrangements or other expense offset arrangements. Expenses net of all reductions represent the net expenses paid by the class.
I Amount represents less than $.01 per share.
See accompanying notes which are an integral part of the financial statements.
Annual Report
Notes to Financial Statements
For the period ended October 31, 2010
1. Organization.
Fidelity Japan Fund (the Fund) is a fund of Fidelity Investment Trust (the Trust) and is authorized to issue an unlimited number of shares. The Trust is registered under the Investment Company Act of 1940, as amended (the 1940 Act), as an open-end management investment company organized as a Massachusetts business trust. The Fund offers Japan and Class F shares, each of which has equal rights as to assets and voting privileges. Each class has exclusive voting rights with respect to matters that affect that class. Class F shares of the Fund are only available for purchase by mutual funds for which Fidelity Management & Research Company (FMR) or an affiliate serves as investment manager. Investment income, realized and unrealized capital gains and losses, the common expenses of the Fund, and certain fund-level expense reductions, if any, are allocated on a pro-rata basis to each class based on the relative net assets of each class to the total net assets of the Fund. Each class differs with respect to transfer agent fees incurred. Certain expense reductions also differ by class. Subsequent to period end, all Class F shares were redeemed and the Fund no longer offers Class F shares to investors.
2. Investments in Fidelity Central Funds.
The Fund may invest in Fidelity Central Funds, which are open-end investment companies available only to other investment companies and accounts managed by Fidelity Management & Research Company (FMR) and its affiliates. The Fund's Schedule of Investments lists each of the Fidelity Central Funds held as of period end, if any, as an investment of the Fund, but does not include the underlying holdings of each Fidelity Central Fund. As an Investing Fund, the Fund indirectly bears its proportionate share of the expenses of the underlying Fidelity Central Funds.
The Money Market Central Funds seek preservation of capital and current income and are managed by Fidelity Investments Money Management, Inc. (FIMM), an affiliate of FMR.
A complete unaudited list of holdings for each Fidelity Central Fund is available upon request or at the Securities and Exchange Commission (the SEC) web site at www.sec.gov. In addition, the financial statements of the Fidelity Central Funds, which are not covered by the Fund's Report of Independent Registered Public Accounting Firm, are available on the SEC web site or upon request.
3. Significant Accounting Policies.
The financial statements have been prepared in conformity with accounting principles generally accepted in the United States of America (GAAP), which require management to make certain estimates and assumptions at the date of the financial statements. Actual results could differ from those estimates. The following summarizes the significant accounting policies of the Fund:
Security Valuation. Investments are valued as of 4:00 p.m. Eastern time on the last calendar day of the period. The Fund uses independent pricing services approved by the Board of Trustees to value its investments. When current market prices or quotations are not readily available or reliable, valuations may be determined in good faith in accordance with procedures adopted by the Board of Trustees. Factors used in determining value may include market or security specific events. The frequency with which these procedures are used cannot be predicted and they may be utilized to a significant extent. The value used for net asset value (NAV) calculation under these procedures may differ from published prices for the same securities.
The Fund categorizes the inputs to valuation techniques used to value its investments into a disclosure hierarchy consisting of three levels as shown below.
Level 1 - quoted prices in active markets for identical investments
Level 2 - other significant observable inputs (including quoted prices for similar investments, interest rates, prepayment speeds, etc.)
Level 3 - unobservable inputs (including the fund's own assumptions based on the best information available)
Changes in valuation techniques may result in transfers in or out of an assigned level within the disclosure hierarchy. The aggregate value of investments by input level, as of October 31, 2010, is included at the end of the Fund's Schedule of Investments. Valuation techniques used to value the Fund's investments by major category are as follows.
Equity securities, including restricted securities, for which market quotations are readily available, are valued at the last reported sale price or official closing price as reported by an independent pricing service on the primary market or exchange on which they are traded and are categorized as Level 1 in the hierarchy. In the event there were no sales during the day or closing prices are not available, securities are valued at the last quoted bid price or may be valued using the last available price and are generally categorized as Level 2 in the hierarchy. For foreign equity securities, when significant market or security specific events arise, comparisons to the valuation of American Depositary Receipts (ADRs), futures contracts, Exchange-traded funds (ETFs) and certain indexes as well as quoted prices for similar securities are used and are categorized as Level 2 in the hierarchy in these circumstances. Utilizing these techniques may result in significant transfers between Level 1 and Level 2. For restricted equity securities and private placements where observable inputs are limited, assumptions about market activity and risk are used and are categorized as Level 3 in the hierarchy.
Annual Report
3. Significant Accounting Policies - continued
Security Valuation - continued
Investments in open-end mutual funds, including the Fidelity Central Funds, are valued at their closing net asset value each business day and are categorized as Level 1 in the hierarchy. Short-term securities with remaining maturities of sixty days or less for which quotations are not readily available are valued at amortized cost, which approximates fair value and are categorized as Level 2 in the hierarchy.
Foreign Currency. The Fund uses foreign currency contracts to facilitate transactions in foreign-denominated securities. Gains and losses from these transactions may arise from changes in the value of the foreign currency or if the counterparties do not perform under the contracts' terms.
Foreign-denominated assets, including investment securities, and liabilities are translated into U.S. dollars at the exchange rate at period end. Purchases and sales of investment securities, income and dividends received and expenses denominated in foreign currencies are translated into U.S. dollars at the exchange rate in effect on the transaction date.
The effects of exchange rate fluctuations on investments are included with the net realized and unrealized gain (loss) on investment securities. Other foreign currency transactions resulting in realized and unrealized gain (loss) are disclosed separately.
Investment Transactions and Income. For financial reporting purposes, the Fund's investment holdings and NAV include trades executed through the end of the last business day of the period. The NAV per share for processing shareholder transactions is calculated as of the close of business of the New York Stock Exchange (NYSE), normally 4:00 p.m. Eastern time and includes trades executed through the end of the prior business day. Gains and losses on securities sold are determined on the basis of identified cost. Dividend income is recorded on the ex-dividend date, except for certain dividends from foreign securities where the ex-dividend date may have passed, which are recorded as soon as the Fund is informed of the ex-dividend date. Non-cash dividends included in dividend income, if any, are recorded at the fair market value of the securities received. Distributions received on securities that represent a return of capital or capital gain are recorded as a reduction of cost of investments and/or as a realized gain. The Fund estimates the components of distributions received that may be considered return of capital distributions or capital gain distributions. Interest income and distributions from the Fidelity Central Funds are accrued as earned. Interest income includes coupon interest and amortization of premium and accretion of discount on debt securities. Investment income is recorded net of foreign taxes withheld where recovery of such taxes is uncertain.
Expenses. Most expenses of the Trust can be directly attributed to a fund. Expenses which cannot be directly attributed are apportioned amongst each fund in the Trust. Expense estimates are accrued in the period to which they relate and adjustments are made when actual amounts are known.
Income Tax Information and Distributions to Shareholders. Each year the Fund intends to qualify as a regulated investment company, including distributing substantially all of its taxable income and realized gains under Subchapter M of the Internal Revenue Code and filing its U.S. federal tax return. As a result, no provision for income taxes is required. As of October 31, 2010, the Fund did not have any unrecognized tax benefits in the accompanying financial statements. A fund's federal tax return is subject to examination by the Internal Revenue Service (IRS) for a period of three years. Foreign taxes are provided for based on the Fund's understanding of the tax rules and rates that exist in the foreign markets in which it invests.
Distributions are declared and recorded on the ex-dividend date. Income dividends and capital gain distributions are declared separately for each class. Income and capital gain distributions are determined in accordance with income tax regulations, which may differ from GAAP.
Capital accounts within the financial statements are adjusted for permanent book-tax differences. These adjustments have no impact on net assets or the results of operations. Temporary book-tax differences will reverse in a subsequent period.
Book-tax differences are primarily due to the short-term gain distributions from the Fidelity Central Funds, foreign currency transactions, passive foreign investment companies (PFIC), deferred trustees compensation, capital loss carryforwards and losses deferred due to wash sales.
The federal tax cost of investment securities and unrealized appreciation (depreciation) as of period end were as follows:
Gross unrealized appreciation | $ 29,099,097 |
Gross unrealized depreciation | (170,403,023) |
Net unrealized appreciation (depreciation) | $ (141,303,926) |
| |
Tax Cost | $ 800,839,375 |
The tax-based components of distributable earnings as of period end were as follows:
Undistributed ordinary income | $ 20,143,517 |
Capital loss carryforward | $ (415,906,874) |
Net unrealized appreciation (depreciation) | $ (141,009,049) |
Annual Report
Notes to Financial Statements - continued
3. Significant Accounting Policies - continued
Income Tax Information and Distributions to Shareholders - continued
The tax character of distributions paid was as follows:
| October 31, 2010 | October 31, 2009 |
Ordinary Income | $ 16,173,245 | $ 13,369,226 |
Short-Term Trading (Redemption) Fees. Shares held by investors in the Fund less than 90 days are subject to a redemption fee equal to 1.50% of the net asset value of shares redeemed. All redemption fees, which reduce the proceeds of the shareholder redemption, are retained by the Fund and accounted for as an addition to paid in capital.
4. Purchases and Sales of Investments.
Purchases and sales of securities, other than short-term securities, aggregated $399,130,044 and $697,219,555, respectively.
5. Fees and Other Transactions with Affiliates.
Management Fee. FMR and its affiliates provide the Fund with investment management related services for which the Fund pays a monthly management fee. The management fee is the sum of an individual fund fee rate that is based on an annual rate of .45% of the Fund's average net assets and a group fee rate that averaged .26% during the period. The group fee rate is based upon the average net assets of all the mutual funds advised by FMR. The group fee rate decreases as assets under management increase and increases as assets under management decrease. In addition, the management fee is subject to a performance adjustment (up to a maximum of ± .20% of the Fund's average net assets over a 36 month performance period). The upward or downward adjustment to the management fee is based on the relative investment performance of Japan as compared to an appropriate benchmark index. For the period, the total annual management fee rate, including the performance adjustment, was .62% of the Fund's average net assets.
Transfer Agent Fees. Fidelity Investments Institutional Operations Company, Inc. (FIIOC), an affiliate of FMR, is the transfer, dividend disbursing and shareholder servicing agent for each class of the Fund. FIIOC receives account fees and asset-based fees that vary according to the account size and type of account of the shareholders of Japan. FIIOC receives no fees for providing transfer agency services to Class F. FIIOC pays for typesetting, printing and mailing of shareholder reports, except proxy statements. For the period, transfer agent fees for each applicable class were as follows:
| Amount | % of
Average
Net Assets |
Japan | $ 2,272,841 | .24 |
Accounting and Security Lending Fees. Fidelity Service Company, Inc. (FSC), an affiliate of FMR, maintains the Fund's accounting records. The accounting fee is based on the level of average net assets for the month. Under a separate contract, FSC administers the security lending program. The security lending fee is based on the number and duration of lending transactions.
6. Committed Line of Credit.
The Fund participates with other funds managed by FMR or an affiliate in a $3.75 billion credit facility (the "line of credit") to be utilized for temporary or emergency purposes to fund shareholder redemptions or for other short-term liquidity purposes. The Fund has agreed to pay commitment fees on its pro-rata portion of the line of credit, which amounted to $4,048 and is reflected in Miscellaneous expenses on the Statement of Operations. During the period, there were no borrowings on this line of credit.
7. Security Lending.
The Fund lends portfolio securities through a lending agent from time to time in order to earn additional income. The lending agent may loan securities to certain qualified borrowers, including Fidelity Capital Markets (FCM), a broker-dealer affiliated with the Fund. On the settlement date of the loan, the Fund receives collateral (in the form of U.S. Treasury obligations, letters of credit and/or cash) against the loaned securities and maintains collateral in an amount not less than 100% of the market value of the loaned securities during the period of the loan. The market value of the loaned securities is determined at the close of business of the Fund and any additional required collateral is delivered to the Fund on the next business day. If the borrower defaults on its obligation to return the securities loaned because of insolvency or other reasons, a fund could experience delays and costs in
Annual Report
7. Security Lending - continued
recovering the securities loaned or in gaining access to the collateral. Any cash collateral received is invested in the Fidelity Securities Lending Cash Central Fund. At period end, there were no security loans outstanding. Security lending income represents the income earned on investing cash collateral, less rebates paid to borrowers and lending agent fees associated with the loan, plus any premium payments received for lending certain types of securities. Security lending income is presented in the Statement of Operations as a component of income from Fidelity Central Funds. Total security lending income during the period amounted to $20,227. During the period, there were no securities loaned to FCM.
8. Expense Reductions.
Through arrangements with the Fund's custodian, credits realized as a result of uninvested cash balances were used to reduce the Fund's expenses. During the period, these credits reduced the Fund's custody expenses by $28.
9. Distributions to Shareholders.
Distributions to shareholders of each class were as follows:
Years ended October 31, | 2010 | 2009 |
From net investment income | | |
Japan | $ 6,581,344 | $ 12,255,123 |
Class F | 84,436 | - |
Total | $ 6,665,780 | $ 12,255,123 |
From net realized gain | | |
Japan | $ 9,401,920 | $ 1,114,103 |
Class F | 105,545 | - |
Total | $ 9,507,465 | $ 1,114,103 |
10. Share Transactions.
Transactions for each class of shares were as follows:
| Shares | Dollars |
Years ended October 31, | 2010 | 2009 A | 2010 | 2009 A |
Japan | | | | |
Shares sold | 20,810,343 | 14,149,369 | $ 217,088,312 | $ 138,053,275 |
Reinvestment of distributions | 1,440,939 | 1,672,325 | 14,827,260 | 12,626,051 |
Shares redeemed | (55,048,520) | (35,103,846) | (565,865,726) | (330,281,121) |
Net increase (decrease) | (32,797,238) | (19,282,152) | $ (333,950,154) | $ (179,601,795) |
Class F | | | | |
Shares sold | 8,109,487 | 547,276 | $ 83,695,320 | $ 5,744,073 |
Reinvestment of distributions | 18,463 | - | 189,982 | - |
Shares redeemed | (5,428,702) | (11,423) | (55,799,580) | (118,128) |
Net increase (decrease) | 2,699,248 | 535,853 | $ 28,085,722 | $ 5,625,945 |
A Share transactions for Class F are for the period June 26, 2009 (commencement of sale of shares) to October 31, 2009.
11. Other.
The Fund's organizational documents provide former and current trustees and officers with a limited indemnification against liabilities arising in connection with the performance of their duties to the Fund. In the normal course of business, the Fund may also enter into contracts that provide general indemnifications. The Fund's maximum exposure under these arrangements is unknown as this would be dependent on future claims that may be made against the Fund. The risk of material loss from such claims is considered remote.
At the end of the period, the Fidelity Freedom Funds and Fidelity Freedom K Funds were the owners of record, in aggregate, of approximately 29% of the total outstanding shares of the Fund.
12. Proposed Reorganization.
The Board of Trustees of the Fund has approved an Agreement and Plan of Reorganization between the Fund and Fidelity Advisor Japan Fund. The agreement provides for the transfer of all the assets and the assumption of all the liabilities of Fidelity Advisor Japan Fund in exchange solely for the
Annual Report
Notes to Financial Statements - continued
12. Proposed Reorganization - continued
number of equivalent shares of the Fund having the same aggregate net asset value as the outstanding shares of the corresponding classes of the Fidelity Advisor Japan Fund on the day the reorganization is effective.
The reorganization was approved by the Fidelity Advisor Japan Fund shareholders and is expected to become effective on or about December 17, 2010. The reorganization is expected to qualify as a tax-free transaction with no gain or loss recognized by the Funds or their shareholders. In addition, the Board of Trustees of the Fund approved the creation of additional classes of shares. The Fund commenced operations of Class A, T, B, C and Institutional Class on December 14, 2010.
Annual Report
Fidelity Japan Smaller Companies Fund
Performance: The Bottom Line
Average annual total return reflects the change in the value of an investment, assuming reinvestment of the fund's distributions from dividend income and capital gains (the profits earned upon the sale of securities that have grown in value, if any) and assuming a constant rate of performance each year. The $10,000 table and the fund's returns do not reflect the deduction of taxes that a shareholder would pay on fund distributions or the redemption of fund shares. During periods of reimbursement by Fidelity, a fund's total return will be greater than it would be had the reimbursement not occurred. How a fund did yesterday is no guarantee of how it will do tomorrow.
Average Annual Total Returns
Periods ended October 31, 2010 | Past 1
year | Past 5
years | Past 10
years |
Fidelity Japan Smaller Companies Fund | -2.50% | -8.07% | 0.01% |
$10,000 Over 10 years
Let's say hypothetically that $10,000 was invested in Fidelity Japan Smaller Companies Fund on October 31, 2000. The chart shows how the value of your investment would have changed, and also shows how the Russell/Nomura Mid-Small Cap Index performed over the same period.
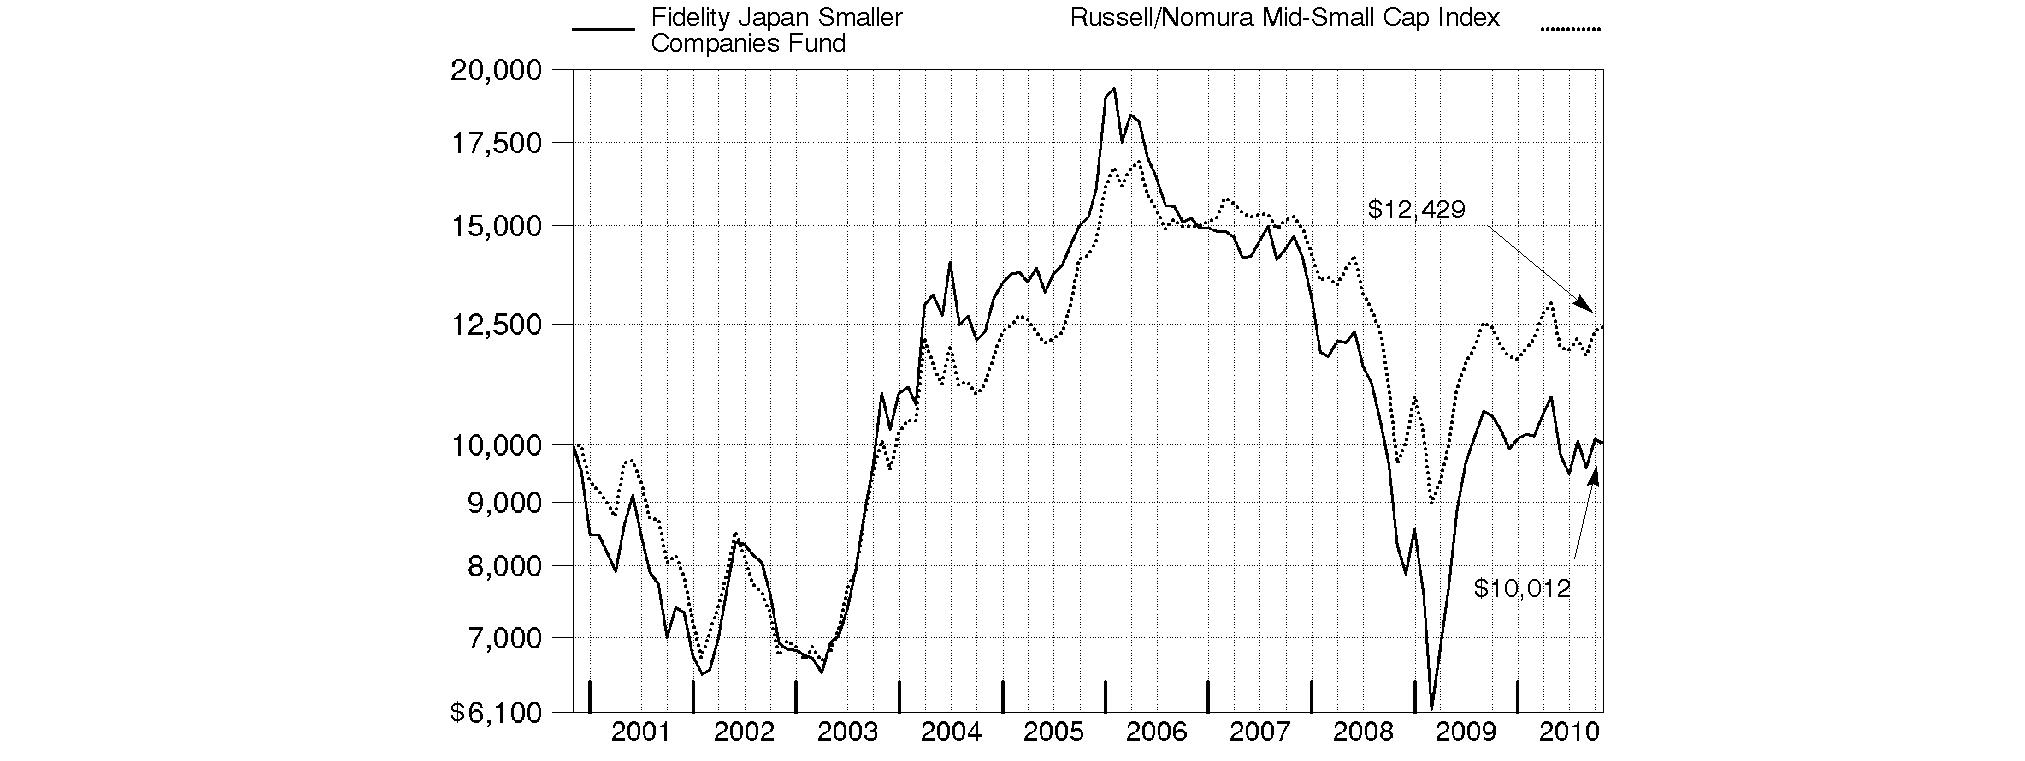
Annual Report
Fidelity Japan Smaller Companies Fund
Market Recap: International stocks rode a wave of volatility similar to that of their U.S. counterparts during the 12 months ending October 31, 2010. Stocks gained modestly in the first half of the period, despite growing concerns about the European debt crisis. Sentiment turned decidedly negative in May and June, however, and the market suffered a precipitous decline. These losses were more than offset during the last four months of the period, when signs of economic growth and subsiding debt fears helped propel international stocks about 21%. For the full year, the MSCI® ACWI® (All Country World Index) ex USA Index gained 12.76%, boosted in part by a generally depreciating U.S. dollar. Within the index, Canada and emerging markets were standouts, returning 23% and 24%, respectively. Results in the latter group were led by strong-performing India, Mexico and South Africa, while China fell short of the MSCI benchmark due to cooling economic growth. The developed Asia ex Japan segment rose 16% for the period, lifted by solid results from Singapore and Hong Kong. Meanwhile, Europe rose just 9%, held back mainly by debt-riddled Spain and Italy, as well as lagging major constituent France. Japan returned only 5%, a result of that nation's continued weak economy.
Comments from Nicholas Price, Portfolio Manager of Fidelity® Japan Smaller Companies Fund: For the year, the fund fell 2.50%, trailing the 3.24% return of the Russell/Nomura Mid-Small Cap Index. Unsuccessful stock selection in the consumer discretionary, materials and consumer staples sectors was the principal source of the fund's underperformance. In particular, holdings in retailers and non-bank financials were major detractors. During the second half of the period, underweightings in defensive segments of the market - most notably utilities - and overweightings in more-economically sensitive sectors, such as financials and information technology, proved costly. Individual detractors included MEGANE TOP, operator of low-cost eyewear stores, which fell sharply in autumn 2009, when monthly sales started to show signs of weakness due to intensifying price competition. Also in retailing, Point (casual apparel) and Ryohin Keikaku (household items and apparel under the Muji brand) struggled as earnings weakened amid unseasonable weather and intensifying competition. Elsewhere, condo development and leasing company Leopalace21, baby goods maker/distributor Pigeon and financials firm Promise also hampered results. In contrast, security selection in diversified financials added value. Within the segment, a significant stake in large-cap leasing company ORIX was the fund's leading contributor to relative performance. DeNA (social game developer), Start Today (online apparel retailer) and Kakaku.com (price-comparison site) also lifted results, as did the fund's exposure to some blue-chip exporters, most notably Sony. Leopalace21 and Sony were sold from the fund by period end.
The views expressed above reflect those of the portfolio manager(s) only through the end of the period as stated on the cover of this report and do not necessarily represent the views of Fidelity or any other person in the Fidelity organization. Any such views are subject to change at any time based upon market or other conditions and Fidelity disclaims any responsibility to update such views. These views may not be relied on as investment advice and, because investment decisions for a Fidelity fund are based on numerous factors, may not be relied on as an indication of trading intent on behalf of any Fidelity fund.
Annual Report
Fidelity Japan Smaller Companies Fund
As a shareholder of the Fund, you incur two types of costs: (1) transaction costs, including redemption fees, and (2) ongoing costs, including management fees and other Fund expenses. This Example is intended to help you understand your ongoing costs (in dollars) of investing in the Fund and to compare these costs with the ongoing costs of investing in other mutual funds.
The Example is based on an investment of $1,000 invested at the beginning of the period and held for the entire period (May 1, 2010 to October 31, 2010).
Actual Expenses
The first line of the accompanying table provides information about actual account values and actual expenses. You may use the information in this line, together with the amount you invested, to estimate the expenses that you paid over the period. Simply divide your account value by $1,000.00 (for example, an $8,600 account value divided by $1,000.00 = 8.6), then multiply the result by the number in the first line under the heading entitled "Expenses Paid During Period" to estimate the expenses you paid on your account during this period. A small balance maintenance fee of $12.00 that is charged once a year may apply for certain accounts with a value of less than $2,000. This fee is not included in the table below. If it was, the estimate of expenses you paid during the period would be higher, and your ending account value lower, by this amount. In addition, the Fund, as a shareholder in the underlying Fidelity Central Funds, will indirectly bear its pro-rata share of the fees and expenses incurred by the underlying Fidelity Central Funds. These fees and expenses are not included in the Fund's annualized expense ratio used to calculate the expense estimate in the table below.
Hypothetical Example for Comparison Purposes
The second line of the accompanying table provides information about hypothetical account values and hypothetical expenses based on the Fund's actual expense ratio and an assumed rate of return of 5% per year before expenses, which is not the Fund's actual return. The hypothetical account values and expenses may not be used to estimate the actual ending account balance or expenses you paid for the period. You may use this information to compare the ongoing costs of investing in the Fund and other funds. To do so, compare this 5% hypothetical example with the 5% hypothetical examples that appear in the shareholder reports of the other funds. A small balance maintenance fee of $12.00 that is charged once a year may apply for certain accounts with a value of less than $2,000. This fee is not included in the table below. If it was, the estimate of expenses you paid during the period would be higher, and your ending account value lower, by this amount. In addition, the Fund, as a shareholder in the underlying Fidelity Central Funds, will indirectly bear its pro-rata share of the fees and expenses incurred by the underlying Fidelity Central Funds. These fees and expenses are not included in the Fund's annualized expense ratio used to calculate the expense estimate in the table below.
Please note that the expenses shown in the table are meant to highlight your ongoing costs only and do not reflect any transaction costs. Therefore, the second line of the table is useful in comparing ongoing costs only, and will not help you determine the relative total costs of owning different funds. In addition, if these transactional costs were included, your costs would have been higher.
| Annualized
Expense Ratio | Beginning
Account Value
May 1, 2010 | Ending
Account Value
October 31, 2010 | Expenses Paid
During Period*
May 1, 2010 to
October 31, 2010 |
Actual | 1.09% | $ 1,000.00 | $ 916.50 | $ 5.27 |
Hypothetical (5% return per year before expenses) | | $ 1,000.00 | $ 1,019.71 | $ 5.55 |
* Expenses are equal to the Fund's annualized expense ratio, multiplied by the average account value over the period, multiplied by 184/365 (to reflect the one-half year period).
Annual Report
Fidelity Japan Smaller Companies Fund
Investment Changes (Unaudited)
Geographic Diversification (% of fund's net assets) |
As of October 31, 2010 |
| Japan | 99.0% | |
| United States of America | 1.0% | |

Percentages are adjusted for the effect of futures contracts, if applicable. |
As of April 30, 2010 |
| Japan | 98.8% | |
| United States of America | 1.2% | |

Percentages are adjusted for the effect of futures contracts, if applicable. |
Asset Allocation |
| % of fund's
net assets | % of fund's net assets
6 months ago |
Stocks | 99.0 | 98.8 |
Short-Term Investments and Net Other Assets | 1.0 | 1.2 |
Top Ten Stocks as of October 31, 2010 |
| % of fund's
net assets | % of fund's net assets
6 months ago |
Stanley Electric Co. Ltd. (Auto Components) | 5.9 | 5.7 |
ORIX Corp. (Consumer Finance) | 5.7 | 5.5 |
Daikin Industries Ltd. (Building Products) | 4.4 | 4.6 |
GREE, Inc. (Internet Software & Services) | 4.3 | 1.4 |
Osaka Securities Exchange Co. Ltd. (Diversified Financial Services) | 4.2 | 3.7 |
Honda Motor Co. Ltd. (Automobiles) | 3.9 | 2.9 |
DeNA Co. Ltd. (Internet & Catalog Retail) | 3.6 | 3.5 |
Sumitomo Mitsui Financial Group, Inc. (Commercial Banks) | 3.4 | 3.5 |
Pigeon Corp. (Household Products) | 3.3 | 3.3 |
Canon, Inc. (Office Electronics) | 3.1 | 1.0 |
| 41.8 | |
Market Sectors as of October 31, 2010 |
| % of fund's
net assets | % of fund's net assets
6 months ago |
Consumer Discretionary | 25.8 | 24.7 |
Financials | 24.8 | 25.3 |
Information Technology | 17.4 | 19.5 |
Industrials | 13.3 | 14.5 |
Materials | 10.4 | 6.2 |
Consumer Staples | 4.6 | 6.3 |
Health Care | 2.7 | 2.3 |
Annual Report
Fidelity Japan Smaller Companies Fund
Investments October 31, 2010
Showing Percentage of Net Assets
Common Stocks - 99.0% |
| Shares | | Value |
CONSUMER DISCRETIONARY - 25.8% |
Auto Components - 6.5% |
Nippon Seiki Co. Ltd. | 46,000 | | $ 465,888 |
Sanden Corp. | 148,000 | | 597,738 |
Stanley Electric Co. Ltd. | 1,005,000 | | 16,872,812 |
Yachiyo Industry Co. Ltd. | 85,200 | | 606,681 |
| | 18,543,119 |
Automobiles - 4.7% |
Honda Motor Co. Ltd. | 309,300 | | 11,149,889 |
Mazda Motor Corp. | 864,000 | | 2,195,811 |
| | 13,345,700 |
Household Durables - 3.5% |
Arnest One Corp. | 569,000 | | 6,017,385 |
Haseko Corp. (a) | 2,558,000 | | 2,193,389 |
Hitachi Koki Co. Ltd. | 205,900 | | 1,752,721 |
| | 9,963,495 |
Internet & Catalog Retail - 6.3% |
DeNA Co. Ltd. | 397,800 | | 10,292,278 |
Start Today Co. Ltd. | 2,490 | | 7,745,085 |
| | 18,037,363 |
Media - 0.3% |
Opt, Inc. | 562 | | 649,509 |
Proto Corp. | 2,400 | | 97,676 |
| | 747,185 |
Multiline Retail - 0.1% |
Ryohin Keikaku Co. Ltd. | 9,900 | | 351,366 |
Specialty Retail - 4.2% |
ABC-Mart, Inc. | 9,700 | | 329,923 |
Bals Corp. (d) | 823 | | 836,602 |
Bell-Park Co., Ltd. | 344 | | 445,016 |
MEGANE TOP CO. LTD. (d) | 212,990 | | 2,355,674 |
Pal Co. Ltd. | 41,500 | | 1,211,942 |
Point, Inc. | 161,400 | | 6,749,235 |
| | 11,928,392 |
Textiles, Apparel & Luxury Goods - 0.2% |
Japan Vilene Co. Ltd. | 142,000 | | 688,207 |
TOTAL CONSUMER DISCRETIONARY | | 73,604,827 |
CONSUMER STAPLES - 4.6% |
Household Products - 4.6% |
Pigeon Corp. | 319,600 | | 9,516,113 |
Uni-Charm Corp. (d) | 98,300 | | 3,756,338 |
| | 13,272,451 |
FINANCIALS - 24.8% |
Commercial Banks - 6.8% |
Mitsubishi UFJ Financial Group, Inc. | 399,000 | | 1,851,761 |
|
| Shares | | Value |
Mizuho Financial Group, Inc. | 5,503,400 | | $ 7,981,685 |
Sumitomo Mitsui Financial Group, Inc. | 321,900 | | 9,607,989 |
| | 19,441,435 |
Consumer Finance - 6.8% |
Aeon Credit Service Co. Ltd. | 222,900 | | 2,564,998 |
ORIX Corp. | 179,020 | | 16,329,151 |
Promise Co. Ltd. (d) | 127,950 | | 535,841 |
| | 19,429,990 |
Diversified Financial Services - 5.0% |
Japan Securities Finance Co. Ltd. | 391,200 | | 2,396,689 |
Osaka Securities Exchange Co. Ltd. | 2,371 | | 11,933,080 |
| | 14,329,769 |
Insurance - 2.1% |
Fuji Fire & Marine Insurance Co. Ltd. (a) | 2,579,000 | | 3,204,921 |
T&D Holdings, Inc. | 130,050 | | 2,655,542 |
| | 5,860,463 |
Real Estate Management & Development - 4.1% |
Airport Facilities Co. Ltd. | 158,400 | | 623,994 |
Mitsui Fudosan Co. Ltd. | 76,000 | | 1,437,180 |
Nisshin Fudosan Co. Ltd. | 37,700 | | 266,575 |
Takara Leben Co. Ltd. (d) | 899,700 | | 6,428,824 |
Toc Co. Ltd. | 100,400 | | 414,226 |
Toho Real Estate Co. Ltd. | 31,900 | | 183,147 |
Tokyo Tatemono Co. Ltd. | 410,000 | | 1,652,053 |
Tokyu Land Corp. | 152,000 | | 692,692 |
| | 11,698,691 |
TOTAL FINANCIALS | | 70,760,348 |
HEALTH CARE - 2.7% |
Biotechnology - 1.4% |
Sosei Group Corp. (a) | 3,541 | | 4,092,370 |
Health Care Equipment & Supplies - 1.0% |
Sysmex Corp. | 39,200 | | 2,689,002 |
Terumo Corp. | 4,000 | | 203,134 |
| | 2,892,136 |
Pharmaceuticals - 0.3% |
Rohto Pharmaceutical Co. Ltd. | 55,000 | | 681,434 |
TOTAL HEALTH CARE | | 7,665,940 |
INDUSTRIALS - 13.3% |
Airlines - 0.3% |
Skymark Airlines, Inc. (a) | 90,300 | | 972,910 |
Building Products - 7.2% |
Central Glass Co. Ltd. | 170,000 | | 733,068 |
Daikin Industries Ltd. | 365,100 | | 12,702,267 |
Nichias Corp. | 910,000 | | 3,924,071 |
Noritz Corp. | 137,400 | | 2,520,224 |
Shinko Kogyo Co. Ltd. | 203,000 | | 618,056 |
| | 20,497,686 |
Common Stocks - continued |
| Shares | | Value |
INDUSTRIALS - continued |
Commercial Services & Supplies - 0.1% |
Aeon Delight Co. Ltd. | 18,700 | | $ 347,648 |
Construction & Engineering - 0.1% |
Yahagi Construction Co. Ltd. | 48,000 | | 272,598 |
Electrical Equipment - 0.5% |
Nidec Corp. | 3,500 | | 345,630 |
Nippon Carbon Co. Ltd. | 300,000 | | 958,121 |
| | 1,303,751 |
Machinery - 4.3% |
HIRANO TECSEED Co. Ltd. | 174,000 | | 1,933,093 |
Hoshizaki Electric Co. Ltd. | 80,700 | | 1,590,533 |
Komatsu Ltd. | 10,000 | | 244,414 |
Kubota Corp. | 249,000 | | 2,208,148 |
Makita Corp. | 61,900 | | 2,176,923 |
Miura Co. Ltd. | 45,400 | | 1,028,510 |
Nitta Corp. | 197,700 | | 3,129,984 |
| | 12,311,605 |
Marine - 0.0% |
Japan Transcity Corp. | 53,000 | | 156,754 |
Professional Services - 0.0% |
Outsourcing, Inc. | 350 | | 118,783 |
Trading Companies & Distributors - 0.8% |
Mitsui & Co. Ltd. | 137,800 | | 2,167,237 |
TOTAL INDUSTRIALS | | 38,148,972 |
INFORMATION TECHNOLOGY - 17.4% |
Computers & Peripherals - 0.2% |
Mutoh Holdings Co. Ltd. (a) | 236,000 | | 498,571 |
Electronic Equipment & Components - 2.5% |
Mitsumi Electric Co. Ltd. | 44,600 | | 758,342 |
Murata Manufacturing Co. Ltd. | 12,800 | | 719,771 |
Nippon Electric Glass Co. Ltd. | 45,000 | | 578,422 |
Origin Electric Co. Ltd. (a) | 555,000 | | 1,931,154 |
Shimadzu Corp. | 52,000 | | 390,953 |
Shinko Shoji Co. Ltd. | 64,300 | | 476,237 |
TDK Corp. | 39,800 | | 2,270,785 |
| | 7,125,664 |
Internet Software & Services - 5.4% |
GREE, Inc. (d) | 979,700 | | 12,369,519 |
Kakaku.com, Inc. | 673 | | 3,253,349 |
| | 15,622,868 |
IT Services - 1.2% |
CAC Corp. | 63,300 | | 442,085 |
ITOCHU Techno-Solutions Corp. | 22,900 | | 781,167 |
NEC Fielding Ltd. | 32,700 | | 351,910 |
|
| Shares | | Value |
Net One Systems Co. Ltd. | 1,185 | | $ 1,653,728 |
SBI VeriTrans Co., Ltd. | 215 | | 113,284 |
| | 3,342,174 |
Office Electronics - 5.3% |
Canon, Inc. | 192,700 | | 8,870,612 |
Ricoh Co. Ltd. | 454,000 | | 6,350,833 |
| | 15,221,445 |
Semiconductors & Semiconductor Equipment - 2.8% |
Ferrotec Corp. | 238,500 | | 2,649,671 |
NPC, Inc. (d) | 101,100 | | 2,336,846 |
Samco, Inc. | 32,200 | | 350,130 |
Tokyo Electron Ltd. | 46,400 | | 2,618,044 |
| | 7,954,691 |
TOTAL INFORMATION TECHNOLOGY | | 49,765,413 |
MATERIALS - 10.4% |
Chemicals - 5.6% |
JSR Corp. | 47,300 | | 818,801 |
Kanto Denka Kogyo Co. Ltd. (d) | 659,000 | | 4,954,579 |
Shin-Etsu Chemical Co., Ltd. | 29,700 | | 1,501,810 |
Stella Chemifa Corp. (d) | 111,100 | | 4,790,816 |
Tanaka Chemical Corp. (d) | 80,000 | | 1,425,624 |
Toda Kogyo Corp. (d) | 290,000 | | 2,558,717 |
| | 16,050,347 |
Metals & Mining - 4.8% |
Chuo Denki Kogyo Co. Ltd. | 135,000 | | 771,716 |
Hitachi Metals Ltd. | 168,000 | | 1,914,453 |
Sumitomo Metal Mining Co. Ltd. | 464,000 | | 7,383,778 |
Toyo Kohan Co. Ltd. | 351,000 | | 1,775,283 |
Yamato Kogyo Co. Ltd. | 69,400 | | 1,780,062 |
| | 13,625,292 |
TOTAL MATERIALS | | 29,675,639 |
TOTAL COMMON STOCKS (Cost $269,033,474) | 282,893,590 |
Money Market Funds - 6.0% |
| | | |
Fidelity Cash Central Fund, 0.23% (b) | 2,137,709 | | 2,137,709 |
Fidelity Securities Lending Cash Central Fund, 0.24% (b)(c) | 14,924,706 | | 14,924,706 |
TOTAL MONEY MARKET FUNDS (Cost $17,062,415) | 17,062,415 |
TOTAL INVESTMENT PORTFOLIO - 105.0% (Cost $286,095,889) | | 299,956,005 |
NET OTHER ASSETS (LIABILITIES) - (5.0)% | | (14,352,905) |
NET ASSETS - 100% | $ 285,603,100 |
Legend |
(a) Non-income producing |
(b) Affiliated fund that is available only to investment companies and other accounts managed by Fidelity Investments. The rate quoted is the annualized seven-day yield of the fund at period end. A complete unaudited listing of the fund's holdings as of its most recent quarter end is available upon request. In addition, each Fidelity Central Fund's financial statements, which are not covered by the Fund's report of Independent Registered Public Accounting Firm, are available on the SEC's website or upon request. |
(c) Investment made with cash collateral received from securities on loan. |
(d) Security or a portion of the security is on loan at period end. |
Affiliated Central Funds |
Information regarding fiscal year to date income earned by the Fund from investments in Fidelity Central Funds is as follows: |
Fund | Income earned |
Fidelity Cash Central Fund | $ 2,140 |
Fidelity Securities Lending Cash Central Fund | 551,158 |
Total | $ 553,298 |
Other Information |
The following is a summary of the inputs used, as of October 31, 2010, involving the Fund's assets and liabilities carried at fair value. The inputs or methodology used for valuing securities may not be an indication of the risk associated with investing in those securities. For more information on valuation inputs, and their aggregation into the levels used in the table below, please refer to the Security Valuation section in the accompanying Notes to Financial Statements. |
Valuation Inputs at Reporting Date: |
Description | Total | Level 1 | Level 2 | Level 3 |
Investments in Securities: | | | | |
Equities: | | | | |
Consumer Discretionary | $ 73,604,827 | $ 60,259,127 | $ 13,345,700 | $ - |
Consumer Staples | 13,272,451 | 13,272,451 | - | - |
Financials | 70,760,348 | 44,881,446 | 25,878,902 | - |
Health Care | 7,665,940 | 7,462,806 | 203,134 | - |
Industrials | 38,148,972 | 20,481,276 | 17,667,696 | - |
Information Technology | 49,765,413 | 28,318,375 | 21,447,038 | - |
Materials | 29,675,639 | 20,790,051 | 8,885,588 | - |
Money Market Funds | 17,062,415 | 17,062,415 | - | - |
Total Investments in Securities: | $ 299,956,005 | $ 212,527,947 | $ 87,428,058 | $ - |
Income Tax Information |
At October 31, 2010, the Fund had a capital loss carryforward of approximately $99,728,958 of which $34,348,914 and $65,380,044 will expire on October 31, 2016 and 2017, respectively. Capital loss carryforwards are only available to offset future capital gains of the Fund to the extent provided by regulations and may be limited. |
See accompanying notes which are an integral part of the financial statements.
Annual Report
Fidelity Japan Smaller Companies Fund
Statement of Assets and Liabilities
| October 31, 2010 |
Assets | | |
Investment in securities, at value (including securities loaned of $14,195,983) - See accompanying schedule: Unaffiliated issuers (cost $269,033,474) | $ 282,893,590 | |
Fidelity Central Funds (cost $17,062,415) | 17,062,415 | |
Total Investments (cost $286,095,889) | | $ 299,956,005 |
Foreign currency held at value (cost $1,843) | | 1,843 |
Receivable for investments sold | | 1,236,262 |
Receivable for fund shares sold | | 61,303 |
Dividends receivable | | 1,494,684 |
Distributions receivable from Fidelity Central Funds | | 32,284 |
Other receivables | | 7 |
Total assets | | 302,782,388 |
| | |
Liabilities | | |
Payable for investments purchased | $ 1,679,236 | |
Payable for fund shares redeemed | 266,985 | |
Accrued management fee | 176,083 | |
Other affiliated payables | 75,075 | |
Other payables and accrued expenses | 57,203 | |
Collateral on securities loaned, at value | 14,924,706 | |
Total liabilities | | 17,179,288 |
| | |
Net Assets | | $ 285,603,100 |
Net Assets consist of: | | |
Paid in capital | | $ 377,093,650 |
Undistributed net investment income | | 1,379,701 |
Accumulated undistributed net realized gain (loss) on investments and foreign currency transactions | | (106,797,062) |
Net unrealized appreciation (depreciation) on investments and assets and liabilities in foreign currencies | | 13,926,811 |
Net Assets, for 34,691,270 shares outstanding | | $ 285,603,100 |
Net Asset Value, offering price and redemption price per share ($285,603,100 ÷ 34,691,270 shares) | | $ 8.23 |
Statement of Operations
| Year ended October 31, 2010 |
Investment Income | | |
Dividends | | $ 4,828,583 |
Income from Fidelity Central Funds (including $551,158 from security lending) | | 553,298 |
Income before foreign taxes withheld | | 5,381,881 |
Less foreign taxes withheld | | (338,001) |
Total income | | 5,043,880 |
| | |
Expenses | | |
Management fee | $ 2,368,149 | |
Transfer agent fees | 875,527 | |
Accounting and security lending fees | 179,303 | |
Custodian fees and expenses | 118,476 | |
Independent trustees' compensation | 2,080 | |
Registration fees | 19,506 | |
Audit | 53,759 | |
Legal | 1,860 | |
Interest | 593 | |
Miscellaneous | 5,432 | |
Total expenses | | 3,624,685 |
Net investment income (loss) | | 1,419,195 |
Realized and Unrealized Gain (Loss) Net realized gain (loss) on: | | |
Investment securities: | | |
Unaffiliated issuers | 28,461,341 | |
Foreign currency transactions | 23,065 | |
Capital gain distributions from Fidelity Central Funds | 1,744 | |
Total net realized gain (loss) | | 28,486,150 |
Change in net unrealized appreciation (depreciation) on: Investment securities | (38,323,146) | |
Assets and liabilities in foreign currencies | 45,626 | |
Total change in net unrealized appreciation (depreciation) | | (38,277,520) |
Net gain (loss) | | (9,791,370) |
Net increase (decrease) in net assets resulting from operations | | $ (8,372,175) |
See accompanying notes which are an integral part of the financial statements.
Annual Report
Fidelity Japan Smaller Companies Fund
Financial Statements - continued
Statement of Changes in Net Assets
| Year ended
October 31,
2010 | Year ended
October 31,
2009 |
Increase (Decrease) in Net Assets | | |
Operations | | |
Net investment income (loss) | $ 1,419,195 | $ 1,165,882 |
Net realized gain (loss) | 28,486,150 | (66,300,010) |
Change in net unrealized appreciation (depreciation) | (38,277,520) | 136,778,267 |
Net increase (decrease) in net assets resulting from operations | (8,372,175) | 71,644,139 |
Distributions to shareholders from net investment income | (1,348,099) | (2,197,996) |
Distributions to shareholders from net realized gain | (5,392,393) | (549,498) |
Total distributions | (6,740,492) | (2,747,494) |
Share transactions
Proceeds from sales of shares | 50,767,825 | 69,815,224 |
Reinvestment of distributions | 4,237,697 | 1,683,605 |
Cost of shares redeemed | (150,075,480) | (138,732,098) |
Net increase (decrease) in net assets resulting from share transactions | (95,069,958) | (67,233,269) |
Redemption fees | 71,634 | 116,866 |
Total increase (decrease) in net assets | (110,110,991) | 1,780,242 |
| | |
Net Assets | | |
Beginning of period | 395,714,091 | 393,933,849 |
End of period (including undistributed net investment income of $1,379,701 and undistributed net investment income of $1,101,593, respectively) | $ 285,603,100 | $ 395,714,091 |
Other Information Shares | | |
Sold | 5,995,088 | 9,049,354 |
Issued in reinvestment of distributions | 497,382 | 259,816 |
Redeemed | (17,876,316) | (19,628,461) |
Net increase (decrease) | (11,383,846) | (10,319,291) |
Financial Highlights
Years ended October 31, | 2010 | 2009 | 2008 | 2007 | 2006 |
Selected Per-Share Data | | | | | |
Net asset value, beginning of period | $ 8.59 | $ 6.99 | $ 12.63 | $ 13.43 | $ 14.25 |
Income from Investment Operations | | | | | |
Net investment income (loss) B | .04 | .02 | .04 | .03 | .01 |
Net realized and unrealized gain (loss) | (.25) | 1.63 | (5.45) | (.46) | - F |
Total from investment operations | (.21) | 1.65 | (5.41) | (.43) | .01 |
Distributions from net investment income | (.03) | (.04) | (.02) | (.01) | (.02) |
Distributions from net realized gain | (.12) | (.01) | (.21) | (.36) | (.83) |
Total distributions | (.15) | (.05) | (.23) | (.37) | (.85) |
Redemption fees added to paid in capital B | - F | - F | - F | - F | .02 |
Net asset value, end of period | $ 8.23 | $ 8.59 | $ 6.99 | $ 12.63 | $ 13.43 |
Total Return A | (2.50)% | 23.84% | (43.58)% | (3.27)% | (.36)% |
Ratios to Average Net Assets C, E | | | | | |
Expenses before reductions | 1.09% | 1.16% | 1.05% | 1.02% | 1.02% |
Expenses net of fee waivers, if any | 1.09% | 1.16% | 1.05% | 1.02% | 1.02% |
Expenses net of all reductions | 1.09% | 1.14% | 1.03% | 1.00% | 1.01% |
Net investment income (loss) | .43% | .33% | .44% | .23% | .09% |
Supplemental Data | | | | | |
Net assets, end of period (000 omitted) | $ 285,603 | $ 395,714 | $ 393,934 | $ 811,653 | $ 1,217,239 |
Portfolio turnover rate D | 78% | 183% | 86% | 76% | 98% |
A Total returns would have been lower had certain expenses not been reduced during the periods shown.
B Calculated based on average shares outstanding during the period.
C Fees and expenses of the underlying Fidelity Central Funds are not included in the Fund's expense ratio. The Fund indirectly bears its proportionate share of the expenses of any underlying Fidelity Central Funds.
D Amount does not include the portfolio activity of any underlying Fidelity Central Funds.
E Expense ratios reflect operating expenses of the Fund. Expenses before reductions do not reflect amounts reimbursed by the investment adviser or reductions from brokerage service arrangements or reductions from other expense offset arrangements and do not represent the amount paid by the Fund during periods when reimbursements or reductions occur. Expenses net of fee waivers reflect expenses after reimbursement by the investment adviser but prior to reductions from brokerage service arrangements or other expense offset arrangements. Expenses net of all reductions represent the net expenses paid by the Fund.
F Amount represents less than $.01 per share.
See accompanying notes which are an integral part of the financial statements.
Annual Report
Notes to Financial Statements
For the period ended October 31, 2010
1. Organization.
Fidelity Japan Smaller Companies Fund (the Fund) is a fund of Fidelity Investment Trust (the Trust) and is authorized to issue an unlimited number of shares. The Trust is registered under the Investment Company Act of 1940, as amended (the 1940 Act), as an open-end management investment company organized as a Massachusetts business trust.
2. Investments in Fidelity Central Funds.
The Fund may invest in Fidelity Central Funds, which are open-end investment companies available only to other investment companies and accounts managed by Fidelity Management & Research Company (FMR) and its affiliates. The Fund's Schedule of Investments lists each of the Fidelity Central Funds held as of period end, if any, as an investment of the Fund, but does not include the underlying holdings of each Fidelity Central Fund. As an Investing Fund, the Fund indirectly bears its proportionate share of the expenses of the underlying Fidelity Central Funds.
The Money Market Central Funds seek preservation of capital and current income and are managed by Fidelity Investments Money Management, Inc. (FIMM), an affiliate of FMR.
A complete unaudited list of holdings for each Fidelity Central Fund is available upon request or at the Securities and Exchange Commission (the SEC) web site at www.sec.gov. In addition, the financial statements of the Fidelity Central Funds, which are not covered by the Fund's Report of Independent Registered Public Accounting Firm, are available on the SEC web site or upon request.
3. Significant Accounting Policies.
The financial statements have been prepared in conformity with accounting principles generally accepted in the United States of America (GAAP), which require management to make certain estimates and assumptions at the date of the financial statements. Actual results could differ from those estimates. The following summarizes the significant accounting policies of the Fund:
Security Valuation. Investments are valued as of 4:00 p.m. Eastern time on the last calendar day of the period. The Fund uses independent pricing services approved by the Board of Trustees to value its investments. When current market prices or quotations are not readily available or reliable, valuations may be determined in good faith in accordance with procedures adopted by the Board of Trustees. Factors used in determining value may include market or security specific events. The frequency with which these procedures are used cannot be predicted and they may be utilized to a significant extent. The value used for net asset value (NAV) calculation under these procedures may differ from published prices for the same securities.
The Fund categorizes the inputs to valuation techniques used to value its investments into a disclosure hierarchy consisting of three levels as shown below.
Level 1 - quoted prices in active markets for identical investments
Level 2 - other significant observable inputs (including quoted prices for similar investments, interest rates, prepayment speeds, etc.)
Level 3 - unobservable inputs (including the fund's own assumptions based on the best information available)
Changes in valuation techniques may result in transfers in or out of an assigned level within the disclosure hierarchy. The aggregate value of investments by input level, as of October 31, 2010 is included at the end of the Fund's Schedule of Investments. Valuation techniques used to value the Fund's investments by major category are as follows.
Equity securities, including restricted securities, for which market quotations are readily available, are valued at the last reported sale price or official closing price as reported by an independent pricing service on the primary market or exchange on which they are traded and are categorized as Level 1 in the hierarchy. In the event there were no sales during the day or closing prices are not available, securities are valued at the last quoted bid price or may be valued using the last available price and are generally categorized as Level 2 in the hierarchy. For foreign equity securities, when significant market or security specific events arise, comparisons to the valuation of American Depositary Receipts (ADRs), futures contracts, Exchange-traded funds (ETFs) and certain indexes as well as quoted prices for similar securities are used and are categorized as Level 2 in the hierarchy in these circumstances. Utilizing these techniques may result in significant transfers between Level 1 and Level 2. For restricted equity securities and private placements where observable inputs are limited, assumptions about market activity and risk are used and are categorized as Level 3 in the hierarchy.
Investments in open-end mutual funds, including the Fidelity Central Funds, are valued at their closing net asset value each business day and are categorized as Level 1 in the hierarchy. Short-term securities with remaining maturities of sixty days or less for which quotations are not readily available are valued at amortized cost, which approximates fair value and are categorized as Level 2 in the hierarchy.
Annual Report
Notes to Financial Statements - continued
3. Significant Accounting Policies - continued
Foreign Currency. The Fund uses foreign currency contracts to facilitate transactions in foreign-denominated securities. Gains and losses from these transactions may arise from changes in the value of the foreign currency or if the counterparties do not perform under the contracts' terms.
Foreign-denominated assets, including investment securities, and liabilities are translated into U.S. dollars at the exchange rate at period end. Purchases and sales of investment securities, income and dividends received and expenses denominated in foreign currencies are translated into U.S. dollars at the exchange rate in effect on the transaction date.
The effects of exchange rate fluctuations on investments are included with the net realized and unrealized gain (loss) on investment securities. Other foreign currency transactions resulting in realized and unrealized gain (loss) are disclosed separately.
Investment Transactions and Income. For financial reporting purposes, the Fund's investment holdings and NAV include trades executed through the end of the last business day of the period. The NAV per share for processing shareholder transactions is calculated as of the close of business of the New York Stock Exchange (NYSE), normally 4:00 p.m. Eastern time and includes trades executed through the end of the prior business day. Gains and losses on securities sold are determined on the basis of identified cost. Dividend income is recorded on the ex-dividend date, except for certain dividends from foreign securities where the ex-dividend date may have passed, which are recorded as soon as the Fund is informed of the ex-dividend date. Non-cash dividends included in dividend income, if any, are recorded at the fair market value of the securities received. Distributions received on securities that represent a return of capital or capital gain are recorded as a reduction of cost of investments and/or as a realized gain. The Fund estimates the components of distributions received that may be considered return of capital distributions or capital gain distributions. Interest income and distributions from the Fidelity Central Funds are accrued as earned. Interest income includes coupon interest and amortization of premium and accretion of discount on debt securities. Investment income is recorded net of foreign taxes withheld where recovery of such taxes is uncertain.
Expenses. Most expenses of the Trust can be directly attributed to a fund. Expenses which cannot be directly attributed are apportioned amongst each fund in the Trust. Expense estimates are accrued in the period to which they relate and adjustments are made when actual amounts are known.
Income Tax Information and Distributions to Shareholders. Each year the Fund intends to qualify as a regulated investment company, including distributing substantially all of its taxable income and realized gains under Subchapter M of the Internal Revenue Code and filing its U.S. federal tax return. As a result, no provision for income taxes is required. As of October 31, 2010, the Fund did not have any unrecognized tax benefits in the accompanying financial statements. A fund's federal tax return is subject to examination by the Internal Revenue Service (IRS) for a period of three years. Foreign taxes are provided for based on the Fund's understanding of the tax rules and rates that exist in the foreign markets in which it invests.
Distributions are declared and recorded on the ex-dividend date. Income and capital gain distributions are determined in accordance with income tax regulations, which may differ from GAAP.
Capital accounts within the financial statements are adjusted for permanent book-tax differences. These adjustments have no impact on net assets or the results of operations. Temporary book-tax differences will reverse in a subsequent period.
Book-tax differences are primarily due to the short-term gain distributions from the Fidelity Central Funds, foreign currency transactions, passive foreign investment companies (PFIC), capital loss carryforwards and losses deferred due to wash sales.
The federal tax cost of investment securities and unrealized appreciation (depreciation) as of period end were as follows:
Gross unrealized appreciation | $ 28,701,159 |
Gross unrealized depreciation | (25,078,348) |
Net unrealized appreciation (depreciation) | $ 3,622,811 |
| |
Tax Cost | $ 296,333,194 |
The tax-based components of distributable earnings as of period end were as follows:
Undistributed ordinary income | $ 4,548,902 |
Capital loss carryforward | $ (99,728,958) |
Net unrealized appreciation (depreciation) | $ 3,689,506 |
The tax character of distributions paid was as follows:
| October 31, 2010 | October 31, 2009 |
Ordinary Income | $ 6,740,492 | $ 2,747,494 |
Annual Report
3. Significant Accounting Policies - continued
Short-Term Trading (Redemption) Fees. Shares held by investors in the Fund less than 90 days are subject to a redemption fee equal to 1.50% of the net asset value of shares redeemed. All redemption fees, which reduce the proceeds of the shareholder redemption, are retained by the Fund and accounted for as an addition to paid in capital.
4. Purchases and Sales of Investments.
Purchases and sales of securities, other than short-term securities, aggregated $258,361,348 and $360,284,410, respectively.
5. Fees and Other Transactions with Affiliates.
Management Fee. FMR and its affiliates provide the Fund with investment management related services for which the Fund pays a monthly management fee. The management fee is the sum of an individual fund fee rate that is based on an annual rate of .45% of the Fund's average net assets and a group fee rate that averaged .26% during the period. The group fee rate is based upon the average net assets of all the mutual funds advised by FMR. The group fee rate decreases as assets under management increase and increases as assets under management decrease. For the period, the total annual management fee rate was .71% of the Fund's average net assets.
Transfer Agent Fees. Fidelity Investments Institutional Operations Company, Inc. (FIIOC), an affiliate of FMR, is the Fund's transfer, dividend disbursing and shareholder servicing agent. FIIOC receives account fees and asset-based fees that vary according to account size and type of account. FIIOC pays for typesetting, printing and mailing of shareholder reports, except proxy statements. For the period, the transfer agent fees were equivalent to an annual rate of .26% of average net assets.
Accounting and Security Lending Fees. Fidelity Service Company, Inc. (FSC), an affiliate of FMR, maintains the Fund's accounting records. The accounting fee is based on the level of average net assets for the month. Under a separate contract, FSC administers the security lending program. The security lending fee is based on the number and duration of lending transactions.
Interfund Lending Program. Pursuant to an Exemptive Order issued by the SEC, the Fund, along with other registered investment companies having management contracts with FMR, may participate in an interfund lending program. This program provides an alternative credit facility allowing the funds to borrow from, or lend money to, other participating affiliated funds. At period end, there were no interfund loans outstanding. The Fund's activity in this program during the period for which loans were outstanding was as follows:
Borrower or Lender | Average Daily
Loan Balance | Weighted Average
Interest Rate | Interest
Expense |
Borrower | $ 5,991,000 | .40% | $ 593 |
6. Committed Line of Credit.
The Fund participates with other funds managed by FMR or an affiliate in a $3.75 billion credit facility (the "line of credit") to be utilized for temporary or emergency purposes to fund shareholder redemptions or for other short-term liquidity purposes. The Fund has agreed to pay commitment fees on its pro-rata portion of the line of credit, which amounted to $1,357 and is reflected in Miscellaneous expenses on the Statement of Operations. During the period, there were no borrowings on this line of credit.
7. Security Lending.
The Fund lends portfolio securities through a lending agent from time to time in order to earn additional income. The lending agent may loan securities to certain qualified borrowers, including Fidelity Capital Markets (FCM), a broker-dealer affiliated with the Fund. On the settlement date of the loan, the Fund receives collateral (in the form of U.S. Treasury obligations, letters of credit and/or cash) against the loaned securities and maintains collateral in an amount not less than 100% of the market value of the loaned securities during the period of the loan. The market value of the loaned securities is determined at the close of business of the Fund and any additional required collateral is delivered to the Fund on the next business day. If the borrower defaults on its obligation to return the securities loaned because of insolvency or other reasons, a fund could experience delays and costs in recovering the securities loaned or in gaining access to the collateral. Any cash collateral received is invested in the Fidelity Securities Lending Cash Central Fund. The value of loaned securities and cash collateral at period end are disclosed on the Fund's Statement of Assets and Liabilities. Security lending income represents the income earned on investing cash collateral, less rebates paid to borrowers and lending agent fees associated with the loan, plus any premium payments received for lending certain types of securities. Security lending income is presented in the Statement of Operations as a component of income from Fidelity Central Funds.
Annual Report
Notes to Financial Statements - continued
8. Other.
The Fund's organizational documents provide former and current trustees and officers with a limited indemnification against liabilities arising in connection with the performance of their duties to the Fund. In the normal course of business, the Fund may also enter into contracts that provide general indemnifications. The Fund's maximum exposure under these arrangements is unknown as this would be dependent on future claims that may be made against the Fund. The risk of material loss from such claims is considered remote.
Annual Report
Fidelity Latin America Fund
Performance: The Bottom Line
Average annual total return reflects the change in the value of an investment, assuming reinvestment of the class' distributions from dividend income and capital gains (the profits earned upon the sale of securities that have grown in value, if any) and assuming a constant rate of performance each year. The $10,000 table and the fund's returns do not reflect the deduction of taxes that a shareholder would pay on fund distributions or the redemption of fund shares. During periods of reimbursement by Fidelity, a fund's total return will be greater than it would be had the reimbursement not occurred. How a fund did yesterday is no guarantee of how it will do tomorrow.
Average Annual Total Returns
Periods ended October 31, 2010 | Past 1
year | Past 5
years | Past 10
years |
Fidelity Latin America Fund | 25.91% | 17.76% | 17.89% |
$10,000 Over 10 Years
Let's say hypothetically that $10,000 was invested in Fidelity Latin America Fund, a class of the fund, on October 31, 2000. The chart shows how the value of your investment would have changed, and also shows how the MSCI EM (Emerging Markets) Latin America Index performed over the same period.
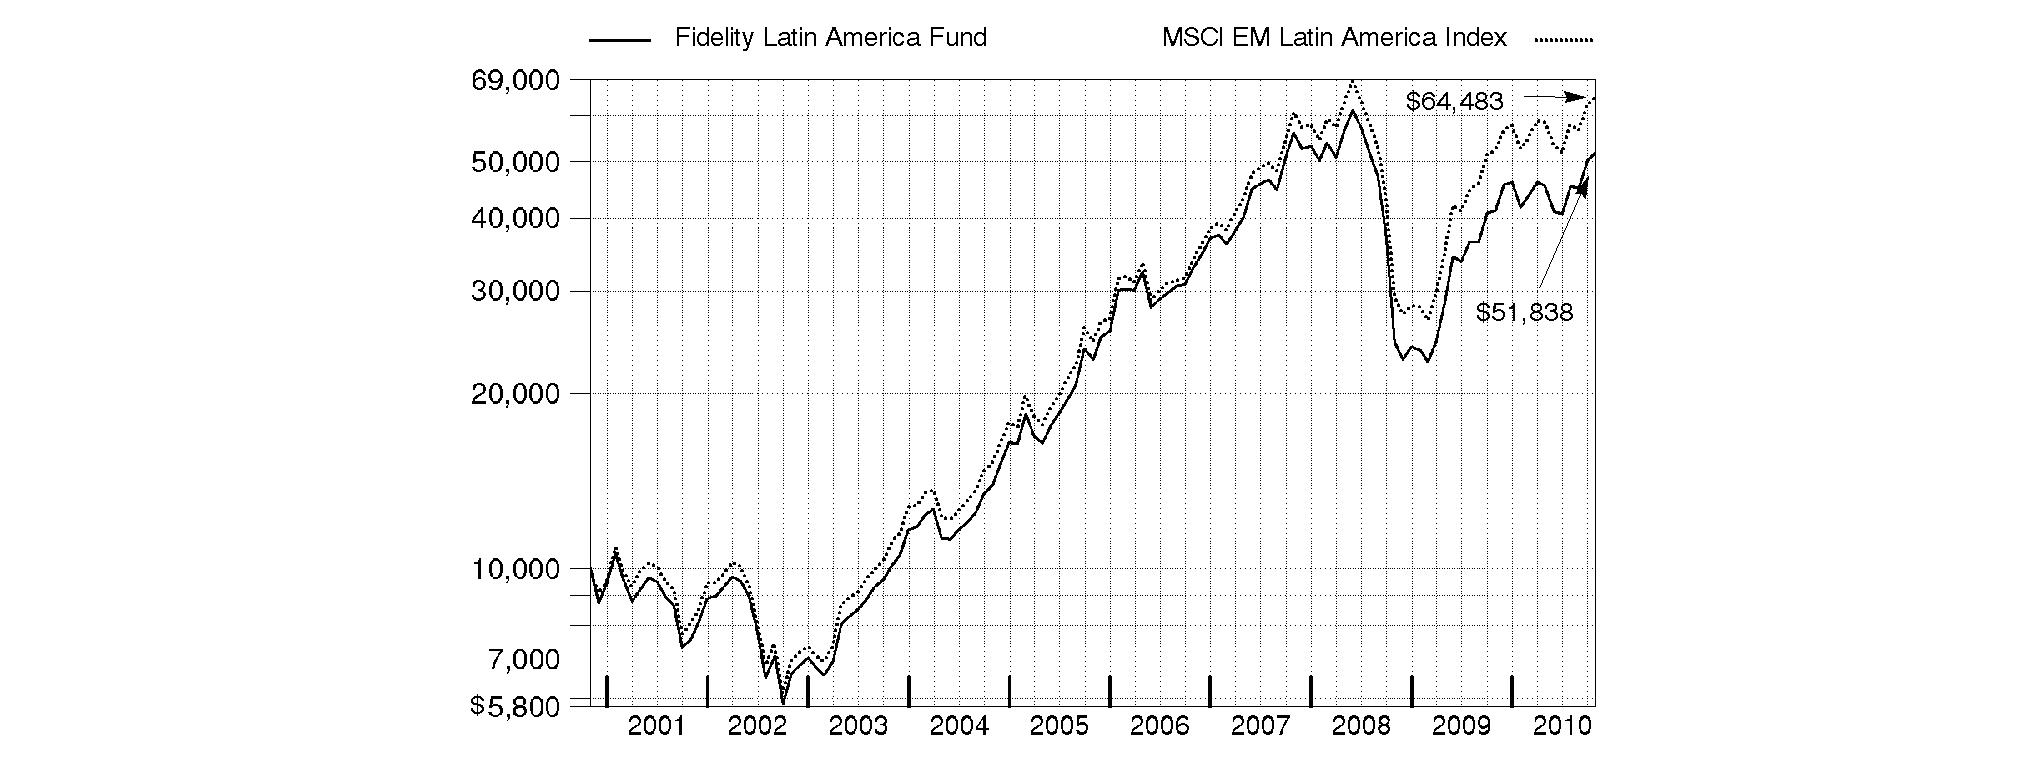
Annual Report
Fidelity Latin America Fund
Management's Discussion of Fund Performance
Market Recap: International stocks rode a wave of volatility similar to that of their U.S. counterparts during the 12 months ending October 31, 2010. Stocks gained modestly in the first half of the period, despite growing concerns about the European debt crisis. Sentiment turned decidedly negative in May and June, however, and the market suffered a precipitous decline. These losses were more than offset during the last four months of the period, when signs of economic growth and subsiding debt fears helped propel international stocks about 21%. For the full year, the MSCI® ACWI® (All Country World Index) ex USA Index gained 12.76%, boosted in part by a generally depreciating U.S. dollar. Within the index, Canada and emerging markets were standouts, returning 23% and 24%, respectively. Results in the latter group were led by strong-performing India, Mexico and South Africa, while China fell short of the MSCI benchmark due to cooling economic growth. The developed Asia ex Japan segment rose 16% for the period, lifted by solid results from Singapore and Hong Kong. Meanwhile, Europe rose just 9%, held back mainly by debt-riddled Spain and Italy, as well as lagging major constituent France. Japan returned only 5%, a result of that nation's continued weak economy.
Comments from Adam Kutas, Portfolio Manager of Fidelity® Latin America Fund: For the year, the fund's Retail Class shares returned 25.91%, outperforming the MSCI EM (Emerging Markets) Latin America Index, which returned 23.75%. Stock selection in materials, consumer staples and health care contributed, as did underweighting the poor-performing energy sector. Conversely, unfavorable stock selection in utilities and underweighting financials hurt. Geographically, the fund benefited from solid picks in Brazil and its positioning in Chile. Underweighting Colombia and weak stock selection in Mexico dampened performance. Overweighting Chilean steel and iron producer CAP and underweighting Brazilian oil giant and major index component Petroleo Brasilerio (Petrobras) boosted performance. Banco Santander Chile also helped, as did four Brazilian companies: airline TAM, dental insurance company and out-of-benchmark holding Odontoprev, and food/beverage/tobacco firms Souza Cruz Industria Comerico and Companhia de Bebidas das Americas. The fund's modest cash position also held back performance amid a strong market. Not owning Mexican copper company and index component Grupo Mexico detracted, as did an investment in Brazilian cable TV company Net Servicos de Comunicacao. Untimely ownership of several firms also curtailed results: Brazilian electric utility Eletrobras, Brazilian brokerage Itausa and Peruvian bank Credicorp. Underweighting Chile's LAN Airlines detracted further. Some stocks I've mentioned were not held at period end.
Note to shareholders: Fidelity Latin America Fund may invest up to 35% of its total assets in any industry that represents more than 20% of the Latin American market. As of October 31, 2010, the fund did not have more than 25% of its total assets invested in any one industry.
The views expressed above reflect those of the portfolio manager(s) only through the end of the period as stated on the cover of this report and do not necessarily represent the views of Fidelity or any other person in the Fidelity organization. Any such views are subject to change at any time based upon market or other conditions and Fidelity disclaims any responsibility to update such views. These views may not be relied on as investment advice and, because investment decisions for a Fidelity fund are based on numerous factors, may not be relied on as an indication of trading intent on behalf of any Fidelity fund.
Annual Report
Fidelity Latin America Fund
As a shareholder of the Fund, you incur two types of costs: (1) transaction costs, including sales charges (loads) on purchase payments or redemption proceeds, redemption fees, and (2) ongoing costs, including management fees, distribution and/or service (12b-1) fees and other Fund expenses. This Example is intended to help you understand your ongoing costs (in dollars) of investing in the Fund and to compare these costs with the ongoing costs of investing in other mutual funds.
The Example is based on an investment of $1,000 invested at the beginning of the period and held for the entire period (May 1, 2010 to October 31, 2010) for Latin America and for the entire period (September 28, 2010 to October 31, 2010) for Class A,T,B,C and Institutional Class of Latin America.
Actual Expenses
The first line of the accompanying table for each class of the Fund provides information about actual account values and actual expenses. You may use the information in this line, together with the amount you invested, to estimate the expenses that you paid over the period. Simply divide your account value by $1,000.00 (for example, an $8,600 account value divided by $1,000.00 = 8.6), then multiply the result by the number in the first line for a class of the Fund under the heading entitled "Expenses Paid During Period" to estimate the expenses you paid on your account during this period. A small balance maintenance fee of $12.00 that is charged once a year may apply for certain accounts with a value of less than $2,000. This fee is not included in the table below. If it was, the estimate of expenses you paid during the period would be higher, and your ending account value lower, by this amount. In addition, the Fund, as a shareholder in the underlying Fidelity Central Funds, will indirectly bear its pro-rata share of the fees and expenses incurred by the underlying Fidelity Central Funds. These fees and expenses are not included in the Fund's annualized expense ratio used to calculate the expense estimate in the table below.
Hypothetical Example for Comparison Purposes
The second line of the accompanying table for each class of the Fund provides information about hypothetical account values and hypothetical expenses based on a Class' actual expense ratio and an assumed rate of return of 5% per year before expenses, which is not the Class' actual return. The hypothetical account values and expenses may not be used to estimate the actual ending account balance or expenses you paid for the period. You may use this information to compare the ongoing costs of investing in the Fund and other funds. To do so, compare this 5% hypothetical example with the 5% hypothetical examples that appear in the shareholder reports of the other funds. A small balance maintenance fee of $12.00 that is charged once a year may apply for certain accounts with a value of less than $2,000. This fee is not included in the table below. If it was, the estimate of expenses you paid during the period would be higher, and your ending account value lower, by this amount. In addition, the Fund, as a shareholder in the underlying Fidelity Central Funds, will indirectly bear its pro-rata share of the fees and expenses incurred by the underlying Fidelity Central Funds. These fees and expenses are not included in the Fund's annualized expense ratio used to calculate the expense estimate in the table below.
Please note that the expenses shown in the table are meant to highlight your ongoing costs only and do not reflect any transaction costs. Therefore, the second line of the table is useful in comparing ongoing costs only, and will not help you determine the relative total costs of owning different funds. In addition, if these transactional costs were included, your costs would have been higher.
| Annualized
Expense Ratio | Beginning
Account Value | Ending
Account Value
October 31, 2010 | Expenses Paid
During Period |
Class A | 1.37% | | | |
Actual | | $ 1,000.00 | $ 1,051.40 | $ 1.31 B |
Hypothetical A | | $ 1,000.00 | $ 1,018.30 | $ 6.97 C |
Class T | 1.63% | | | |
Actual | | $ 1,000.00 | $ 1,051.20 | $ 1.56 B |
Hypothetical A | | $ 1,000.00 | $ 1,016.99 | $ 8.29 C |
Class B | 2.12% | | | |
Actual | | $ 1,000.00 | $ 1,050.60 | $ 2.02 B |
Hypothetical A | | $ 1,000.00 | $ 1,014.52 | $ 10.76 C |
Class C | 2.09% | | | |
Actual | | $ 1,000.00 | $ 1,050.60 | $ 2.00 B |
Hypothetical A | | $ 1,000.00 | $ 1,014.67 | $ 10.61 C |
Latin America | 1.04% | | | |
Actual | | $ 1,000.00 | $ 1,141.90 | $ 5.61 B |
Hypothetical A | | $ 1,000.00 | $ 1,019.96 | $ 5.30 C |
Institutional Class | 1.08% | | | |
Actual | | $ 1,000.00 | $ 1,051.50 | $ 1.03 B |
Hypothetical A | | $ 1,000.00 | $ 1,019.76 | $ 5.50 C |
A 5% return per year before expenses
B Actual expenses are equal to each Class' annualized expense ratio, multiplied by the average account value over the period, multiplied by 184/365 (to reflect the one-half year period) for Latin America and multiplied by 34/365 (to reflect the period September 28, 2010 to October 31, 2010) for Class A,T,B,C and Institutional Class of Latin America.
C Hypothetical expenses are equal to each Class' annualized expense ratio, multiplied by the average account value over the period, multiplied by 184/365 (to reflect the one-half year period).
Annual Report
Fidelity Latin America Fund
Investment Changes (Unaudited)
Geographic Diversification (% of fund's net assets) |
As of October 31, 2010 |
| Brazil | 59.9% | |
| Mexico | 15.9% | |
| Chile | 11.9% | |
| United States of America | 3.7% | |
| Colombia | 3.3% | |
| Peru | 2.0% | |
| Luxembourg | 1.3% | |
| Bermuda | 1.1% | |
| Bahamas (Nassau) | 0.5% | |
| Other | 0.4% | |

Percentages are adjusted for the effect of futures contracts, if applicable. |
As of April 30, 2010 |
| Brazil | 62.4% | |
| Mexico | 19.3% | |
| Chile | 9.5% | |
| United States of America | 3.9% | |
| Luxembourg | 1.6% | |
| Peru | 1.6% | |
 | Panama | 0.9% | |
| Colombia | 0.3% | |
| Bahamas (Nassau) | 0.2% | |
| Other | 0.3% | |

Percentages are adjusted for the effect of futures contracts, if applicable. |
Asset Allocation |
| % of fund's
net assets | % of fund's net assets
6 months ago |
Stocks | 98.2 | 97.6 |
Short-Term Investments and Net Other Assets | 1.8 | 2.4 |
Top Ten Stocks as of October 31, 2010 |
| % of fund's
net assets | % of fund's net assets
6 months ago |
Itau Unibanco Banco Multiplo SA ADR (Brazil, Commercial Banks) | 8.6 | 8.5 |
America Movil SAB de CV Series L sponsored ADR (Mexico, Wireless Telecommunication Services) | 7.6 | 7.8 |
Vale SA (PN-A) sponsored ADR (Brazil, Metals & Mining) | 6.0 | 9.5 |
Petroleo Brasileiro SA - Petrobras (PN) (non-vtg.) (Brazil, Oil, Gas & Consumable Fuels) | 5.6 | 7.5 |
Petroleo Brasileiro SA - Petrobras (ON) sponsored ADR (Brazil, Oil, Gas & Consumable Fuels) | 4.2 | 5.9 |
Companhia de Bebidas das Americas (AmBev) (PN) sponsored ADR (Brazil, Beverages) | 4.1 | 2.6 |
Wal-Mart de Mexico SA de CV Series V (Mexico, Food & Staples Retailing) | 3.7 | 3.3 |
Vale SA sponsored ADR (Brazil, Metals & Mining) | 3.5 | 3.5 |
CAP SA (Chile, Metals & Mining) | 3.3 | 2.7 |
Banco Santander Chile sponsored ADR (Chile, Commercial Banks) | 2.7 | 2.0 |
| 49.3 | |
Market Sectors as of October 31, 2010 |
| % of fund's
net assets | % of fund's net assets
6 months ago |
Financials | 21.2 | 15.5 |
Materials | 19.3 | 22.5 |
Consumer Staples | 16.6 | 13.0 |
Energy | 13.2 | 14.9 |
Telecommunication Services | 11.3 | 12.1 |
Utilities | 6.0 | 7.2 |
Consumer Discretionary | 5.7 | 5.7 |
Industrials | 3.5 | 6.1 |
Health Care | 1.0 | 0.6 |
Information Technology | 0.4 | 0.0 |
Annual Report
Fidelity Latin America Fund
Investments October 31, 2010
Showing Percentage of Net Assets
Common Stocks - 98.2% |
| Shares | | Value |
Bahamas (Nassau) - 0.5% |
Petrominerales Ltd. (d) | 868,800 | | $ 22,258,794 |
Bermuda - 1.1% |
Credicorp Ltd. (NY Shares) | 384,100 | | 48,350,508 |
Brazil - 59.9% |
AES Tiete SA (PN) (non-vtg.) | 6,083,145 | | 83,852,428 |
Banco Bradesco SA: | | | |
(PN) | 3,290,316 | | 67,790,722 |
(PN) sponsored ADR (d) | 5,543,722 | | 115,309,418 |
BR Malls Participacoes SA | 1,736,800 | | 16,590,054 |
Brascan Residential Properties SA | 7,648,900 | | 41,634,619 |
Brasil Foods SA | 1,630,700 | | 23,657,228 |
Brasil Insurance Participacoes e Administracao SA (a) | 7,700 | | 6,110,393 |
Centrais Eletricas Brasileiras SA (Electrobras): | | | |
(PN-B) sponsored ADR (d) | 986,165 | | 16,123,798 |
sponsored ADR | 843,700 | | 11,786,489 |
Companhia de Bebidas das Americas (AmBev): | | | |
(PN) sponsored ADR (d) | 1,320,026 | | 183,800,420 |
sponsored ADR (d) | 70,505 | | 7,984,691 |
Companhia de Concessoes Rodoviarias | 1,974,700 | | 53,395,368 |
Companhia de Saneamento de Minas Gerais | 63,876 | | 979,993 |
CPFL Energia SA sponsored ADR (d) | 420,967 | | 30,238,060 |
Drogasil SA | 441,000 | | 11,154,614 |
Eletropaulo Metropolitana SA (PN-B) | 802,120 | | 14,003,623 |
Gerdau SA | 390,500 | | 3,879,291 |
Gerdau SA sponsored ADR (d) | 682,800 | | 8,903,712 |
Itau Unibanco Banco Multiplo SA | 3,585,931 | | 87,477,155 |
Itau Unibanco Banco Multiplo SA: | | | |
ADR | 11,649,603 | | 286,114,250 |
ADR (a)(e) | 590,300 | | 14,497,768 |
Itausa-Investimentos Itau SA (PN) | 4,987,700 | | 39,550,948 |
Light SA | 695,700 | | 8,759,637 |
Lojas Americanas SA (PN) | 6,847,300 | | 73,616,927 |
Lojas Renner SA | 453,600 | | 17,917,893 |
Multiplan Empreendimentos Imobiliarios SA | 848,000 | | 19,440,395 |
Multiplus SA | 1,836,300 | | 31,195,080 |
Net Servicos de Comunicacao SA (PN) (a) | 5,225,440 | | 70,278,666 |
Odontoprev SA | 3,079,600 | | 45,256,290 |
OGX Petroleo e Gas Participacoes SA (a) | 4,974,700 | | 65,268,813 |
Petroleo Brasileiro SA - Petrobras: | | | |
(ON) | 938,228 | | 15,745,597 |
(ON) sponsored ADR | 5,079,420 | | 173,309,810 |
(PN) (non-vtg.) | 9,078,671 | | 137,951,825 |
(PN) sponsored ADR (non-vtg.) (d) | 3,646,533 | | 113,735,364 |
Souza Cruz Industria Comerico | 2,115,100 | | 108,676,752 |
TAM SA (PN) sponsored ADR (ltd. vtg.) | 2,776,336 | | 68,492,209 |
TIM Participacoes SA | 6,855,400 | | 22,445,672 |
|
| Shares | | Value |
TIM Participacoes SA sponsored ADR (non-vtg.) (d) | 1,621,511 | | $ 52,309,945 |
Usinas Siderurgicas de Minas Gerais SA - Usiminas | 1,195,650 | | 17,430,120 |
Usinas Siderurgicas de Minas Gerais SA - Usiminas (PN-A) (non-vtg.) | 3,663,500 | | 45,718,378 |
Vale SA: | | | |
(PN-A) | 1,813,500 | | 50,902,084 |
(PN-A) sponsored ADR | 7,709,345 | | 221,489,482 |
sponsored ADR | 4,963,500 | | 159,526,890 |
Vivo Participacoes SA: | | | |
(PN) | 806,938 | | 23,242,395 |
sponsored ADR | 1,310,041 | | 37,519,574 |
TOTAL BRAZIL | | 2,705,064,840 |
Canada - 0.3% |
Silver Standard Resources, Inc. (a) | 506,800 | | 12,305,108 |
Chile - 11.9% |
Banco Santander Chile sponsored ADR | 1,323,100 | | 122,571,984 |
CAP SA | 2,940,288 | | 149,674,298 |
Cencosud SA | 6,940,914 | | 54,190,647 |
Compania Cervecerias Unidas SA | 3,869,596 | | 43,114,181 |
Compania Cervecerias Unidas SA sponsored ADR | 241,700 | | 13,595,625 |
Empresa Nacional de Electricidad SA | 7,518,537 | | 13,234,103 |
Empresas La Polar SA | 1,801,860 | | 12,851,907 |
Enersis SA | 45,750,203 | | 20,903,025 |
Enersis SA sponsored ADR | 2,878,372 | | 65,655,665 |
SACI Falabella | 4,206,229 | | 42,135,389 |
TOTAL CHILE | | 537,926,824 |
Colombia - 3.3% |
BanColombia SA sponsored ADR | 1,090,000 | | 73,520,500 |
Bolsa de Valores de Colombia | 385,727,359 | | 9,479,081 |
Ecopetrol SA | 27,756,465 | | 66,550,312 |
Ecopetrol SA ADR | 29,300 | | 1,398,782 |
TOTAL COLOMBIA | | 150,948,675 |
Luxembourg - 1.3% |
Millicom International Cellular SA | 322,113 | | 30,471,890 |
Ternium SA sponsored ADR | 867,307 | | 29,731,284 |
TOTAL LUXEMBOURG | | 60,203,174 |
Mexico - 15.9% |
America Movil SAB de CV: | | | |
Series L | 2,590,600 | | 7,425,387 |
Series L sponsored ADR | 5,867,205 | | 335,956,158 |
Banco Compartamos SA de CV | 1,219,100 | | 8,636,011 |
Bolsa Mexicana de Valores SA de CV (d) | 14,054,300 | | 25,558,445 |
Coca-Cola FEMSA SAB de CV sponsored ADR | 449,000 | | 35,682,030 |
Fomento Economico Mexicano SAB de CV sponsored ADR | 225,258 | | 12,368,917 |
Common Stocks - continued |
| Shares | | Value |
Mexico - continued |
Grupo Bimbo Sab de CV Series A | 659,600 | | $ 5,084,322 |
Grupo Comercial Chedraui de CV (a) | 5,790,100 | | 18,729,160 |
Grupo Modelo SAB de CV Series C | 5,980,200 | | 33,487,764 |
Industrias Penoles SA de CV | 1,201,630 | | 34,040,265 |
Kimberly-Clark de Mexico SA de CV Series A | 5,066,800 | | 31,794,421 |
Wal-Mart de Mexico SA de CV
Series V | 61,686,670 | | 168,719,948 |
TOTAL MEXICO | | 717,482,828 |
Panama - 0.1% |
Copa Holdings SA Class A | 79,300 | | 4,022,889 |
Peru - 2.0% |
Compania de Minas Buenaventura SA sponsored ADR | 1,710,200 | | 90,709,008 |
United States of America - 1.9% |
First Cash Financial Services, Inc. (a) | 664,608 | | 19,320,155 |
Mercadolibre, Inc. (a)(d) | 269,000 | | 17,788,970 |
Southern Copper Corp. | 1,155,100 | | 49,438,280 |
TOTAL UNITED STATES OF AMERICA | | 86,547,405 |
TOTAL COMMON STOCKS (Cost $2,312,779,474) | 4,435,820,053 |
Money Market Funds - 3.5% |
| Shares | | Value |
Fidelity Cash Central Fund, 0.23% (b) | 53,737,385 | | $ 53,737,385 |
Fidelity Securities Lending Cash Central Fund, 0.24% (b)(c) | 102,683,905 | | 102,683,905 |
TOTAL MONEY MARKET FUNDS (Cost $156,421,290) | 156,421,290 |
TOTAL INVESTMENT PORTFOLIO - 101.7% (Cost $2,469,200,764) | | 4,592,241,343 |
NET OTHER ASSETS (LIABILITIES) - (1.7)% | | (74,745,375) |
NET ASSETS - 100% | $ 4,517,495,968 |
Legend |
(a) Non-income producing |
(b) Affiliated fund that is available only to investment companies and other accounts managed by Fidelity Investments. The rate quoted is the annualized seven-day yield of the fund at period end. A complete unaudited listing of the fund's holdings as of its most recent quarter end is available upon request. In addition, each Fidelity Central Fund's financial statements, which are not covered by the Fund's report of Independent Registered Public Accounting Firm, are available on the SEC's website or upon request. |
(c) Investment made with cash collateral received from securities on loan. |
(d) Security or a portion of the security is on loan at period end. |
(e) Security exempt from registration under Rule 144A of the Securities Act of 1933. These securities may be resold in transactions exempt from registration, normally to qualified institutional buyers. At the end of the period, the value of these securities amounted to $14,497,768 or 0.3% of net assets. |
Affiliated Central Funds |
Information regarding fiscal year to date income earned by the Fund from investments in Fidelity Central Funds is as follows: |
Fund | Income earned |
Fidelity Cash Central Fund | $ 84,184 |
Fidelity Securities Lending Cash Central Fund | 586,004 |
Total | $ 670,188 |
Other Information |
The following is a summary of the inputs used, as of October 31, 2010, involving the Fund's assets and liabilities carried at fair value. The inputs or methodology used for valuing securities may not be an indication of the risk associated with investing in those securities. For more information on valuation inputs, and their aggregation into the levels used in the table below, please refer to the Security Valuation section in the accompanying Notes to Financial Statements. |
Valuation Inputs at Reporting Date: |
Description | Total | Level 1 | Level 2 | Level 3 |
Investments in Securities: | | | | |
Equities: | | | | |
Brazil | $ 2,705,064,840 | $ 2,698,954,447 | $ 6,110,393 | $ - |
Mexico | 717,482,828 | 717,482,828 | - | - |
Chile | 537,926,824 | 537,926,824 | - | - |
Colombia | 150,948,675 | 150,948,675 | - | - |
Peru | 90,709,008 | 90,709,008 | - | - |
United States of America | 86,547,405 | 86,547,405 | - | - |
Luxembourg | 60,203,174 | 60,203,174 | - | - |
Bermuda | 48,350,508 | 48,350,508 | - | - |
Bahamas (Nassau) | 22,258,794 | 22,258,794 | - | - |
Other | 16,327,997 | 16,327,997 | - | - |
Money Market Funds | 156,421,290 | 156,421,290 | - | - |
Total Investments in Securities: | $ 4,592,241,343 | $ 4,586,130,950 | $ 6,110,393 | $ - |
Income Tax Information |
At October 31, 2010, the Fund had a capital loss carryforward of approximately $425,993,249 of which $18,806,576, $31,200,847 and $375,985,826 will expire on October 31, 2015, 2016 and 2017, respectively. Capital loss carryforwards are only available to offset future capital gains of the Fund to the extent provided by regulations and may be limited. |
The capital loss carryforward expiring October 31, 2015 and October 31, 2016 were acquired from Fidelity Advisor Latin America Fund. |
See accompanying notes which are an integral part of the financial statements.
Annual Report
Fidelity Latin America Fund
Statement of Assets and Liabilities
| October 31, 2010 |
| | |
Assets | | |
Investment in securities, at value (including securities loaned of $101,291,620) - See accompanying schedule: Unaffiliated issuers (cost $2,312,779,474) | $ 4,435,820,053 | |
Fidelity Central Funds (cost $156,421,290) | 156,421,290 | |
Total Investments (cost $2,469,200,764) | | $ 4,592,241,343 |
Foreign currency held at value (cost $10,492,341) | | 10,469,243 |
Receivable for investments sold | | 17,239,484 |
Receivable for fund shares sold | | 4,585,338 |
Dividends receivable | | 14,057,987 |
Distributions receivable from Fidelity Central Funds | | 53,766 |
Other receivables | | 570,099 |
Total assets | | 4,639,217,260 |
| | |
Liabilities | | |
Payable for investments purchased | $ 10,996,858 | |
Payable for fund shares redeemed | 3,880,116 | |
Accrued management fee | 2,634,325 | |
Distribution and service plan fees payable | 91,638 | |
Other affiliated payables | 877,009 | |
Other payables and accrued expenses | 557,441 | |
Collateral on securities loaned, at value | 102,683,905 | |
Total liabilities | | 121,721,292 |
| | |
Net Assets | | $ 4,517,495,968 |
Net Assets consist of: | | |
Paid in capital | | $ 2,836,057,819 |
Undistributed net investment income | | 12,014,368 |
Accumulated undistributed net realized gain (loss) on investments and foreign currency transactions | | (453,630,606) |
Net unrealized appreciation (depreciation) on investments and assets and liabilities in foreign currencies | | 2,123,054,387 |
Net Assets | | $ 4,517,495,968 |
Statement of Assets and Liabilities - continued
| October 31, 2010 |
| | |
Calculation of Maximum Offering Price Class A:
Net Asset Value and redemption price per share ($115,625,689 ÷ 2,011,628 shares) | | $ 57.48 |
| | |
Maximum offering price per share (100/94.25 of $57.48) | | $ 60.99 |
Class T:
Net Asset Value and redemption price per share ($36,820,312 ÷ 640,743 shares) | | $ 57.47 |
| | |
Maximum offering price per share (100/96.50 of $57.47) | | $ 59.55 |
Class B:
Net Asset Value and offering price per share ($20,391,715 ÷ 355,023 shares)A | | $ 57.44 |
| | |
Class C:
Net Asset Value and offering price per share ($48,328,614 ÷ 841,390 shares)A | | $ 57.44 |
| | |
Latin America:
Net Asset Value, offering price and redemption price per share ($4,283,461,984 ÷ 74,497,448 shares) | | $ 57.50 |
| | |
Institutional Class:
Net Asset Value, offering price and redemption price per share ($12,867,654 ÷ 223,808 shares) | | $ 57.49 |
A Redemption price per share is equal to net asset value less any applicable contingent deferred sales charge.
See accompanying notes which are an integral part of the financial statements.
Annual Report
Fidelity Latin America Fund
Financial Statements - continued
Statement of Operations
| Year ended October 31, 2010 |
| | |
Investment Income | | |
Dividends | | $ 140,582,424 |
Interest | | 616 |
Income from Fidelity Central Funds | | 670,188 |
Income before foreign taxes withheld | | 141,253,228 |
Less foreign taxes withheld | | (11,229,284) |
Total income | | 130,023,944 |
| | |
Expenses | | |
Management fee | $ 29,682,512 | |
Transfer agent fees | 9,142,613 | |
Distribution and service plan fees | 91,835 | |
Accounting and security lending fees | 1,584,130 | |
Custodian fees and expenses | 2,502,166 | |
Independent trustees' compensation | 23,783 | |
Registration fees | 191,852 | |
Audit | 73,353 | |
Legal | 20,416 | |
Interest | 8,537 | |
Miscellaneous | 54,353 | |
Total expenses before reductions | 43,375,550 | |
Expense reductions | (1,043,771) | 42,331,779 |
Net investment income (loss) | | 87,692,165 |
Realized and Unrealized Gain (Loss) Net realized gain (loss) on: | | |
Investment securities: | | |
Unaffiliated issuers | 297,443,270 | |
Capital gain distributions from Fidelity Central Funds | 16,900 | |
Foreign currency transactions | (3,949,502) | |
Total net realized gain (loss) | | 293,510,668 |
Change in net unrealized appreciation (depreciation) on: Investment securities | 519,646,669 | |
Assets and liabilities in foreign currencies | (463,211) | |
Total change in net unrealized appreciation (depreciation) | | 519,183,458 |
Net gain (loss) | | 812,694,126 |
Net increase (decrease) in net assets resulting from operations | | $ 900,386,291 |
Statement of Changes in Net Assets
| Year ended
October 31,
2010 | Year ended
October 31,
2009 |
Increase (Decrease) in Net Assets | | |
Operations | | |
Net investment income (loss) | $ 87,692,165 | $ 57,543,805 |
Net realized gain (loss) | 293,510,668 | (469,604,930) |
Change in net unrealized appreciation (depreciation) | 519,183,458 | 1,902,747,452 |
Net increase (decrease) in net assets resulting from operations | 900,386,291 | 1,490,686,327 |
Distributions to shareholders from net investment income | (118,560,409) | (34,726,095) |
Distributions to shareholders from net realized gain | (33,986,366) | - |
Total distributions | (152,546,775) | (34,726,095) |
Share transactions - net increase (decrease) | (275,675,234) | 360,846,005 |
Redemption fees | 1,583,234 | 1,335,831 |
Total increase (decrease) in net assets | 473,747,516 | 1,818,142,068 |
| | |
Net Assets | | |
Beginning of period | 4,043,748,452 | 2,225,606,384 |
End of period (including undistributed net investment income of $12,014,368 and undistributed net investment income of $42,882,612, respectively) | $ 4,517,495,968 | $ 4,043,748,452 |
See accompanying notes which are an integral part of the financial statements.
Annual Report
Financial Highlights - Class A
Period ended October 31, | 2010 H |
Selected Per-Share Data | |
Net asset value, beginning of period | $ 55.47 |
Income from Investment Operations | |
Net investment income (loss) E | .02 |
Net realized and unrealized gain (loss) | 2.79 |
Total from investment operations | 2.81 |
Distributions from net investment income | (.80) |
Redemption fees added to paid in capital E,K | - |
Net asset value, end of period | $ 57.48 |
Total Return B,C,D | 5.14% |
Ratios to Average Net Assets F,I | |
Expenses before reductions | 1.37% A |
Expenses net of fee waivers, if any | 1.37% A |
Expenses net of all reductions | 1.34% A |
Net investment income (loss) | .39% A |
Supplemental Data | |
Net assets, end of period (000 omitted) | $ 115,626 |
Portfolio turnover rate G | 56% J |
A Annualized
B Total returns for periods of less than one year are not annualized.
C Total returns would have been lower had certain expenses not been reduced during the periods shown.
D Total returns do not include the effect of the sales charges.
E Calculated based on average shares outstanding during the period.
F Fees and expenses of the underlying Fidelity Central Funds are not included in the Fund's expense ratio. The Fund indirectly bears its proportionate share of the expenses of any underlying Fidelity Central Funds.
G Amount does not include the portfolio activity of any underlying Fidelity Central Funds.
H For the period September 28, 2010 (commencement of sale of shares) to October 31, 2010.
I Expense ratios reflect operating expenses of the class. Expenses before reductions do not reflect amounts reimbursed by the investment adviser or reductions from brokerage service arrangements or reductions from other expense offset arrangements and do not represent the amount paid by the class during periods when reimbursements or reductions occur. Expense ratios before reductions for start-up periods may not be representative of longer-term operating periods. Expenses net of fee waivers reflect expenses after reimbursement by the investment adviser but prior to reductions from brokerage service arrangements or other expense offset arrangements. Expenses net of all reductions represent the net expenses paid by the class.
J The portfolio turnover rate does not include the assets acquired in the merger.
K Amount represents less than $.01 per share.
Financial Highlights - Class T
Period ended October 31, | 2010 H |
Selected Per-Share Data | |
Net asset value, beginning of period | $ 55.47 |
Income from Investment Operations | |
Net investment income (loss) E | .01 |
Net realized and unrealized gain (loss) | 2.79 |
Total from investment operations | 2.80 |
Distributions from net investment income | (.80) |
Redemption fees added to paid in capital E,K | - |
Net asset value, end of period | $ 57.47 |
Total Return B,C,D | 5.12% |
Ratios to Average Net Assets F,I | |
Expenses before reductions | 1.63% A |
Expenses net of fee waivers, if any | 1.63% A |
Expenses net of all reductions | 1.60% A |
Net investment income (loss) | .13% A |
Supplemental Data | |
Net assets, end of period (000 omitted) | $ 36,820 |
Portfolio turnover rate G | 56% J |
A Annualized
B Total returns for periods of less than one year are not annualized.
C Total returns would have been lower had certain expenses not been reduced during the periods shown.
D Total returns do not include the effect of the sales charges.
E Calculated based on average shares outstanding during the period.
F Fees and expenses of the underlying Fidelity Central Funds are not included in the Fund's expense ratio. The Fund indirectly bears its proportionate share of the expenses of any underlying Fidelity Central Funds.
G Amount does not include the portfolio activity of any underlying Fidelity Central Funds.
H For the period September 28, 2010 (commencement of sale of shares) to October 31, 2010.
I Expense ratios reflect operating expenses of the class. Expenses before reductions do not reflect amounts reimbursed by the investment adviser or reductions from brokerage service arrangements or reductions from other expense offset arrangements and do not represent the amount paid by the class during periods when reimbursements or reductions occur. Expense ratios before reductions for start-up periods may not be representative of longer-term operating periods. Expenses net of fee waivers reflect expenses after reimbursement by the investment adviser but prior to reductions from brokerage service arrangements or other expense offset arrangements. Expenses net of all reductions represent the net expenses paid by the class.
J The portfolio turnover rate does not include the assets acquired in the merger.
K Amount represents less than $.01 per share.
See accompanying notes which are an integral part of the financial statements.
Annual Report
Financial Highlights - Class B
Period ended October 31, | 2010 H |
Selected Per-Share Data | |
Net asset value, beginning of period | $ 55.47 |
Income from Investment Operations | |
Net investment income (loss) E | (.02) |
Net realized and unrealized gain (loss) | 2.79 |
Total from investment operations | 2.77 |
Distributions from net investment income | (.80) |
Redemption fees added to paid in capital E,K | - |
Net asset value, end of period | $ 57.44 |
Total Return B,C,D | 5.06% |
Ratios to Average Net Assets F,I | |
Expenses before reductions | 2.12% A |
Expenses net of fee waivers, if any | 2.12% A |
Expenses net of all reductions | 2.10% A |
Net investment income (loss) | (.36)% A |
Supplemental Data | |
Net assets, end of period (000 omitted) | $ 20,392 |
Portfolio turnover rate G | 56% J |
A Annualized
B Total returns for periods of less than one year are not annualized.
C Total returns would have been lower had certain expenses not been reduced during the periods shown.
D Total returns do not include the effect of the contingent deferred sales charge.
E Calculated based on average shares outstanding during the period.
F Fees and expenses of the underlying Fidelity Central Funds are not included in the Fund's expense ratio. The Fund indirectly bears its proportionate share of the expenses of any underlying Fidelity Central Funds.
G Amount does not include the portfolio activity of any underlying Fidelity Central Funds.
H For the period September 28, 2010 (commencement of sale of shares) to October 31, 2010.
I Expense ratios reflect operating expenses of the class. Expenses before reductions do not reflect amounts reimbursed by the investment adviser or reductions from brokerage service arrangements or reductions from other expense offset arrangements and do not represent the amount paid by the class during periods when reimbursements or reductions occur. Expense ratios before reductions for start-up periods may not be representative of longer-term operating periods. Expenses net of fee waivers reflect expenses after reimbursement by the investment adviser but prior to reductions from brokerage service arrangements or other expense offset arrangements. Expenses net of all reductions represent the net expenses paid by the class.
J The portfolio turnover rate does not include the assets acquired in the merger.
K Amount represents less than $.01 per share.
Financial Highlights - Class C
Period ended October 31, | 2010 H |
Selected Per-Share Data | |
Net asset value, beginning of period | $ 55.47 |
Income from Investment Operations | |
Net investment income (loss) E | (.02) |
Net realized and unrealized gain (loss) | 2.79 |
Total from investment operations | 2.77 |
Distributions from net investment income | (.80) |
Redemption fees added to paid in capital E,K | - |
Net asset value, end of period | $ 57.44 |
Total Return B,C,D | 5.06% |
Ratios to Average Net Assets F,I | |
Expenses before reductions | 2.09% A |
Expenses net of fee waivers, if any | 2.09% A |
Expenses net of all reductions | 2.07% A |
Net investment income (loss) | (.34)% A |
Supplemental Data | |
Net assets, end of period (000 omitted) | $ 48,329 |
Portfolio turnover rate G | 56% J |
A Annualized
B Total returns for periods of less than one year are not annualized.
C Total returns would have been lower had certain expenses not been reduced during the periods shown.
D Total returns do not include the effect of the contingent deferred sales charge.
E Calculated based on average shares outstanding during the period.
F Fees and expenses of the underlying Fidelity Central Funds are not included in the Fund's expense ratio. The Fund indirectly bears its proportionate share of the expenses of any underlying Fidelity Central Funds.
G Amount does not include the portfolio activity of any underlying Fidelity Central Funds.
H For the period September 28, 2010 (commencement of sale of shares) to October 31, 2010.
I Expense ratios reflect operating expenses of the class. Expenses before reductions do not reflect amounts reimbursed by the investment adviser or reductions from brokerage service arrangements or reductions from other expense offset arrangements and do not represent the amount paid by the class during periods when reimbursements or reductions occur. Expense ratios before reductions for start-up periods may not be representative of longer-term operating periods. Expenses net of fee waivers reflect expenses after reimbursement by the investment adviser but prior to reductions from brokerage service arrangements or other expense offset arrangements. Expenses net of all reductions represent the net expenses paid by the class.
J The portfolio turnover rate does not include the assets acquired in the merger.
K Amount represents less than $.01 per share.
See accompanying notes which are an integral part of the financial statements.
Annual Report
Financial Highlights - Latin America
Years ended October 31, | 2010 | 2009 | 2008 | 2007 | 2006 |
Selected Per-Share Data | | | | | |
Net asset value, beginning of period | $ 47.29 | $ 28.69 | $ 67.90 | $ 41.13 | $ 29.40 |
Income from Investment Operations | | | | | |
Net investment income (loss) B | 1.07 | .72 | .83 | .68 | .82 |
Net realized and unrealized gain (loss) | 11.00 | 18.32 | (37.74) | 27.43 | 11.68 |
Total from investment operations | 12.07 | 19.04 | (36.91) | 28.11 | 12.50 |
Distributions from net investment income | (1.49) | (.46) | (.65) | (.61) | (.46) |
Distributions from net realized gain | (.39) | - | (1.72) | (.77) | (.38) |
Total distributions | (1.88) | (.46) | (2.37) | (1.38) | (.84) |
Redemption fees added to paid in capital B | .02 | .02 | .07 | .04 | .07 |
Net asset value, end of period | $ 57.50 | $ 47.29 | $ 28.69 | $ 67.90 | $ 41.13 |
Total Return A | 25.91% | 67.88% | (56.20)% | 70.35% | 43.57% |
Ratios to Average Net Assets C,E | | | | | |
Expenses before reductions | 1.03% | 1.07% | 1.02% | 1.00% | 1.05% |
Expenses net of fee waivers, if any | 1.03% | 1.07% | 1.02% | 1.00% | 1.05% |
Expenses net of all reductions | 1.01% | 1.05% | 1.00% | .98% | 1.02% |
Net investment income (loss) | 2.10% | 2.04% | 1.41% | 1.33% | 2.23% |
Supplemental Data | | | | | |
Net assets, end of period (000 omitted) | $ 4,283,462 | $ 4,043,748 | $ 2,225,606 | $ 6,219,690 | $ 3,122,473 |
Portfolio turnover rate D | 56% F | 52% | 51% | 52% | 60% |
A Total returns would have been lower had certain expenses not been reduced during the periods shown.
B Calculated based on average shares outstanding during the period.
C Fees and expenses of the underlying Fidelity Central Funds are not included in the Fund's expense ratio. The Fund indirectly bears its proportionate share of the expenses of any underlying Fidelity Central Funds.
D Amount does not include the portfolio activity of any underlying Fidelity Central Funds.
E Expense ratios reflect operating expenses of the class. Expenses before reductions do not reflect amounts reimbursed by the investment adviser or reductions from brokerage service arrangements or reductions from other expense offset arrangements and do not represent the amount paid by the class during periods when reimbursements or reductions occur. Expenses net of fee waivers reflect expenses after reimbursement by the investment adviser but prior to reductions from brokerage service arrangements or other expense offset arrangements. Expenses net of all reductions represent the net expenses paid by the class.
F The portfolio turnover rate does not include the assets acquired in the merger.
Financial Highlights - Institutional Class
Period ended October 31, | 2010 G |
Selected Per-Share Data | |
Net asset value, beginning of period | $ 55.47 |
Income from Investment Operations | |
Net investment income (loss) D | .03 |
Net realized and unrealized gain (loss) | 2.79 |
Total from investment operations | 2.82 |
Distributions from net investment income | (.80) |
Redemption fees added to paid in capital D,J | - |
Net asset value, end of period | $ 57.49 |
Total Return B,C | 5.15% |
Ratios to Average Net Assets E,H | |
Expenses before reductions | 1.08% A |
Expenses net of fee waivers, if any | 1.08% A |
Expenses net of all reductions | 1.06% A |
Net investment income (loss) | .68% A |
Supplemental Data | |
Net assets, end of period (000 omitted) | $ 12,868 |
Portfolio turnover rate F | 56% I |
A Annualized
B Total returns for periods of less than one year are not annualized.
C Total returns would have been lower had certain expenses not been reduced during the periods shown.
D Calculated based on average shares outstanding during the period.
E Fees and expenses of the underlying Fidelity Central Funds are not included in the Fund's expense ratio. The Fund indirectly bears its proportionate share of the expenses of any underlying Fidelity Central Funds.
F Amount does not include the portfolio activity of any underlying Fidelity Central Funds.
G For the period September 28, 2010 (commencement of sale of shares) to October 31, 2010.
H Expense ratios reflect operating expenses of the class. Expenses before reductions do not reflect amounts reimbursed by the investment adviser or reductions from brokerage service arrangements or reductions from other expense offset arrangements and do not represent the amount paid by the class during periods when reimbursements or reductions occur. Expense ratios before reductions for start-up periods may not be representative of longer-term operating periods. Expenses net of fee waivers reflect expenses after reimbursement by the investment adviser but prior to reductions from brokerage service arrangements or other expense offset arrangements. Expenses net of all reductions represent the net expenses paid by the class.
I The portfolio turnover rate does not include the assets acquired in the merger.
J Amount represents less than $.01 per share.
See accompanying notes which are an integral part of the financial statements.
Annual Report
Notes to Financial Statements
For the period ended October 31, 2010
1. Organization.
Fidelity Latin America Fund (the Fund) is a fund of Fidelity Investment Trust (the Trust) and is authorized to issue an unlimited number of shares. The Trust is registered under the Investment Company Act of 1940, as amended (the 1940 Act), as an open-end management investment company organized as a Massachusetts business trust. The Fund launched shares of Class A, Class T, Class B, Class C, and Institutional Class and the existing class was designated Latin America on September 28, 2010. Each class has equal rights as to assets and voting privileges. Class B shares are closed to new accounts and additional purchases by existing shareholders. Each class has exclusive voting rights with respect to matters that affect that class. Class B shares automatically convert to Class A shares after a holding period of seven years from the initial date of purchase. Investment income, realized and unrealized capital gains and losses, the common expenses of the Fund, and certain fund-level expense reductions, if any, are allocated on a pro-rata basis to each class based on the relative net assets of each class to the total net assets of the Fund. Each class differs with respect to transfer agent and distribution and service plan fees incurred. Certain expense reductions also differ by class. The Fund's investments in emerging markets can be subject to social, economic, regulatory, and political uncertainties and can be extremely volatile.
2. Investments in Fidelity Central Funds.
The Fund may invest in Fidelity Central Funds, which are open-end investment companies available only to other investment companies and accounts managed by Fidelity Management & Research Company (FMR) and its affiliates. The Fund's Schedule of Investments lists each of the Fidelity Central Funds held as of period end, if any, as an investment of the Fund, but does not include the underlying holdings of each Fidelity Central Fund. As an Investing Fund, the Fund indirectly bears its proportionate share of the expenses of the underlying Fidelity Central Funds.
The Money Market Central Funds seek preservation of capital and current income and are managed by Fidelity Investments Money Management, Inc. (FIMM), an affiliate of FMR.
A complete unaudited list of holdings for each Fidelity Central Fund is available upon request or at the Securities and Exchange Commission (the SEC) web site at www.sec.gov. In addition, the financial statements of the Fidelity Central Funds, which are not covered by the Fund's Report of Independent Registered Public Accounting Firm, are available on the SEC web site or upon request.
3. Significant Accounting Policies.
The financial statements have been prepared in conformity with accounting principles generally accepted in the United States of America (GAAP), which require management to make certain estimates and assumptions at the date of the financial statements. Actual results could differ from those estimates. The following summarizes the significant accounting policies of the Fund:
Security Valuation. Investments are valued as of 4:00 p.m. Eastern time on the last calendar day of the period. The Fund uses independent pricing services approved by the Board of Trustees to value its investments. When current market prices or quotations are not readily available or reliable, valuations may be determined in good faith in accordance with procedures adopted by the Board of Trustees. Factors used in determining value may include market or security specific events. The frequency with which these procedures are used cannot be predicted and they may be utilized to a significant extent. The value used for net asset value (NAV) calculation under these procedures may differ from published prices for the same securities.
The Fund categorizes the inputs to valuation techniques used to value its investments into a disclosure hierarchy consisting of three levels as shown below.
Level 1 - quoted prices in active markets for identical investments
Level 2 - other significant observable inputs (including quoted prices for similar investments, interest rates, prepayment speeds, etc.)
Level 3 - unobservable inputs (including the fund's own assumptions based on the best information available)
Changes in valuation techniques may result in transfers in or out of an assigned level within the disclosure hierarchy. The aggregate value of investments by input level, as of October 31, 2010, is included at the end of the Fund's Schedule of Investments. Valuation techniques used to value the Fund's investments by major category are as follows.
Equity securities, including restricted securities, for which market quotations are readily available, are valued at the last reported sale price or official closing price as reported by an independent pricing service on the primary market or exchange on which they are traded and are categorized as Level 1 in the hierarchy. In the event there were no sales during the day or closing prices are not available, securities are valued at the last quoted bid price or may be valued using the last available price and are generally categorized as Level 2 in the hierarchy. For foreign equity securities, when significant market or security specific events arise, comparisons to the valuation of American Depositary Receipts (ADRs), futures contracts, Exchange-traded
Annual Report
3. Significant Accounting Policies - continued
Security Valuation - continued
funds (ETFs) and certain indexes as well as quoted prices for similar securities are used and are categorized as Level 2 in the hierarchy in these circumstances. Utilizing these techniques may result in transfers between Level 1 and Level 2. For restricted equity securities and private placements where observable inputs are limited, assumptions about market activity and risk are used and are categorized as Level 3 in the hierarchy.
Investments in open-end mutual funds, including the Fidelity Central Funds, are valued at their closing net asset value each business day and are categorized as Level 1 in the hierarchy. Short-term securities with remaining maturities of sixty days or less for which quotations are not readily available are valued at amortized cost, which approximates fair value and are categorized as Level 2 in the hierarchy.
Foreign Currency. The Fund uses foreign currency contracts to facilitate transactions in foreign-denominated securities. Gains and losses from these transactions may arise from changes in the value of the foreign currency or if the counterparties do not perform under the contracts' terms.
Foreign-denominated assets, including investment securities, and liabilities are translated into U.S. dollars at the exchange rate at period end. Purchases and sales of investment securities, income and dividends received and expenses denominated in foreign currencies are translated into U.S. dollars at the exchange rate in effect on the transaction date.
The effects of exchange rate fluctuations on investments are included with the net realized and unrealized gain (loss) on investment securities. Other foreign currency transactions resulting in realized and unrealized gain (loss) are disclosed separately.
Investment Transactions and Income. For financial reporting purposes, the Fund's investment holdings and NAV include trades executed through the end of the last business day of the period. The NAV per share for processing shareholder transactions is calculated as of the close of business of the New York Stock Exchange (NYSE), normally 4:00 p.m. Eastern time and includes trades executed through the end of the prior business day. Gains and losses on securities sold are determined on the basis of identified cost. Dividend income is recorded on the ex-dividend date, except for certain dividends from foreign securities where the ex-dividend date may have passed, which are recorded as soon as the Fund is informed of the ex-dividend date. Non-cash dividends included in dividend income, if any, are recorded at the fair market value of the securities received. Distributions received on securities that represent a return of capital or capital gain are recorded as a reduction of cost of investments and/or as a realized gain. The Fund estimates the components of distributions received that may be considered return of capital distributions or capital gain distributions. Interest income and distributions from the Fidelity Central Funds are accrued as earned. Interest income includes coupon interest and amortization of premium and accretion of discount on debt securities. Investment income is recorded net of foreign taxes withheld where recovery of such taxes is uncertain.
Expenses. Most expenses of the Trust can be directly attributed to a fund. Expenses which cannot be directly attributed are apportioned amongst each fund in the Trust. Expense estimates are accrued in the period to which they relate and adjustments are made when actual amounts are known.
Income Tax Information and Distributions to Shareholders. Each year the Fund intends to qualify as a regulated investment company, including distributing substantially all of its taxable income and realized gains under Subchapter M of the Internal Revenue Code and filing its U.S. federal tax return. As a result, no provision for income taxes is required. As of October 31, 2010, the Fund did not have any unrecognized tax benefits in the accompanying financial statements. A fund's federal tax return is subject to examination by the Internal Revenue Service (IRS) for a period of three years. Foreign taxes are provided for based on the Fund's understanding of the tax rules and rates that exist in the foreign markets in which it invests.
Distributions are declared and recorded on the ex-dividend date. Income dividends and capital gain distributions are declared separately for each class. Income and capital gain distributions are determined in accordance with income tax regulations, which may differ from GAAP.
Capital accounts within the financial statements are adjusted for permanent book-tax differences. These adjustments have no impact on net assets or the results of operations. Temporary book-tax differences will reverse in a subsequent period.
Book-tax differences are primarily due to short-term gain distributions from the Fidelity Central Funds, foreign currency transactions, passive foreign investment companies (PFIC), deferred trustees compensation, capital loss carryforwards and losses deferred due to wash sales.
The federal tax cost of investment securities and unrealized appreciation (depreciation) as of period end were as follows:
Gross unrealized appreciation | $ 2,104,075,629 |
Gross unrealized depreciation | (24,006,376) |
Net unrealized appreciation (depreciation) | $ 2,080,069,253 |
| |
Tax Cost | $ 2,512,172,090 |
Annual Report
Notes to Financial Statements - continued
3. Significant Accounting Policies - continued
Income Tax Information and Distributions to Shareholders - continued
The tax-based components of distributable earnings as of period end were as follows:
Undistributed ordinary income | $ 27,349,071 |
Capital loss carryforward | $ (425,993,249) |
Net unrealized appreciation (depreciation) | $ 2,080,083,061 |
The tax character of distributions paid was as follows:
| October 31, 2010 | October 31, 2009 |
Ordinary Income | $ 152,546,775 | $ 34,726,095 |
Short-Term Trading (Redemption) Fees. Shares purchased by investors and held in the Fund less than 90 days are subject to a redemption fee equal to 1.50% of the net asset value of shares redeemed. All redemption fees, which reduce the proceeds of the shareholder redemption, are retained by the Fund and accounted for as an addition to paid in capital.
4. Operating Policies.
Restricted Securities. The Fund may invest in securities that are subject to legal or contractual restrictions on resale. These securities generally may be resold in transactions exempt from registration or to the public if the securities are registered. Disposal of these securities may involve time-consuming negotiations and expense, and prompt sale at an acceptable price may be difficult. Information regarding restricted securities is included at the end of the Fund's Schedule of Investments.
5. Purchases and Sales of Investments.
Purchases and sales of securities, other than short-term securities, aggregated $2,260,960,609 and $2,764,008,467, respectively.
6. Fees and Other Transactions with Affiliates.
Management Fee. FMR and its affiliates provide the Fund with investment management related services for which the Fund pays a monthly management fee. The management fee is the sum of an individual fund fee rate that is based on an annual rate of .45% of the Fund's average net assets and a group fee rate that averaged .26% during the period. The group fee rate is based upon the average net assets of all the mutual funds advised by FMR. The group fee rate decreases as assets under management increase and increases as assets under management decrease. For the period, the total annual management fee rate was .71% of the Fund's average net assets.
Distribution and Service Plan Fees. In accordance with Rule 12b-1 of the 1940 Act, the Fund has adopted separate Distribution and Service Plans for each class of shares. Certain classes pay Fidelity Distributors Corporation (FDC), an affiliate of FMR, separate Distribution and Service Fees, each of which is based on an annual percentage of each class' average net assets. In addition, FDC may pay financial intermediaries for selling shares of the Fund and providing shareholder support services. For the period, the Distribution and Service Fee rates, total fees and amounts retained by FDC were as follows:
| Distribution
Fee | Service
Fee | Paid
to FDC | Retained
by FDC |
Class A | -% | .25% | $ 22,839 | $ - |
Class T | .25% | .25% | 14,535 | - |
Class B | .75% | .25% | 16,306 | 11,638 |
Class C | .75% | .25% | 38,155 | 2,577 |
| | | $ 91,835 | $ 14,215 |
Sales Load. FDC receives a front-end sales charge of up to 5.75% for selling Class A shares, and 3.50% for selling Class T shares, some of which is paid to financial intermediaries for selling shares of the Fund. FDC receives the proceeds of contingent deferred sales charges levied on Class A, Class T, Class B, and Class C redemptions. These charges depend on the holding period. The deferred sales charges range from 5% to 1% for Class B, 1% for Class C, 1.00% for certain purchases of Class A shares and .25% for certain purchases of Class T shares.
Annual Report
6. Fees and Other Transactions with Affiliates - continued
Sales Load - continued
For the period, sales charge amounts retained by FDC were as follows:
| Retained
by FDC |
Class A | $ 6,464 |
Class T | 880 |
Class B | 2,206 |
Class C | 400 |
| $ 9,950 |
Transfer Agent Fees. Fidelity Investments Institutional Operations Company, Inc. (FIIOC), an affiliate of FMR, is the transfer, dividend disbursing and shareholder servicing agent for each class of the Fund. FIIOC receives account fees and asset-based fees that vary according to the account size and type of account of the shareholders of the respective classes of the Fund. FIIOC pays for typesetting, printing and mailing of shareholder reports, except proxy statements. For the period, transfer agent fees for each class were as follows:
| Amount | % of
Average
Net Assets |
Class A | $ 27,211 | .30* |
Class T | 8,883 | .31* |
Class B | 4,861 | .30* |
Class C | 10,426 | .27* |
Latin America | 9,088,528 | .22 |
Institutional Class | 2,704 | .26* |
| $ 9,142,613 | |
* Annualized
Accounting and Security Lending Fees. Fidelity Service Company, Inc. (FSC), an affiliate of FMR, maintains the Fund's accounting records. The accounting fee is based on the level of average net assets for the month. Under a separate contract, FSC administers the security lending program. The security lending fee is based on the number and duration of lending transactions.
Brokerage Commissions. The Fund placed a portion of its portfolio transactions with brokerage firms which are affiliates of the investment adviser. The commissions paid to these affiliated firms were $6,632 for the period.
Interfund Lending Program. Pursuant to an Exemptive Order issued by the SEC, the Fund, along with other registered investment companies having management contracts with FMR, may participate in an interfund lending program. This program provides an alternative credit facility allowing the funds to borrow from, or lend money to, other participating affiliated funds. At period end, there were no interfund loans outstanding. The Fund's activity in this program during the period for which loans were outstanding was as follows:
Borrower or Lender | Average Daily
Loan Balance | Weighted Average Interest Rate | Interest
Expense |
Borrower | $ 12,527,535 | .44% | $ 6,510 |
7. Committed Line of Credit.
The Fund participates with other funds managed by FMR or an affiliate in a $3.75 billion credit facility (the "line of credit") to be utilized for temporary or emergency purposes to fund shareholder redemptions or for other short-term liquidity purposes. The Fund has agreed to pay commitment fees on its pro-rata portion of the line of credit, which amounted to $16,647 and is reflected in Miscellaneous expenses on the Statement of Operations. During the period, there were no borrowings on this line of credit.
8. Security Lending.
The Fund lends portfolio securities through a lending agent from time to time in order to earn additional income. The lending agent may loan securities to certain qualified borrowers, including Fidelity Capital Markets (FCM), a broker-dealer affiliated with the Fund. On the settlement date of the loan, the Fund receives collateral (in the form of U.S. Treasury obligations, letters of credit and/or cash) against the loaned securities and maintains collateral in an amount not less than 100% of the market value of the loaned securities during the period of the loan. The market value of the loaned securities is determined at the close of business of the Fund and any additional required collateral is delivered to the Fund on the next business day. If the borrower defaults on its obligation to return the securities loaned because of insolvency or other reasons, a fund could experience delays and costs in recovering the securities loaned or in gaining access to the collateral. Any cash collateral received is invested in the Fidelity Securities Lending Cash
Annual Report
Notes to Financial Statements - continued
8. Security Lending - continued
Central Fund. The value of loaned securities and cash collateral at period end are disclosed on the Fund's Statement of Assets and Liabilities. Security lending income represents the income earned on investing cash collateral, less rebates paid to borrowers and lending agent fees associated with the loan, plus any premium payments received for lending certain types of securities. Security lending income is presented in the Statement of Operations as a component of income from Fidelity Central Funds. Total security lending income during the period amounted to $586,004. During the period, there were no securities loaned to FCM.
9. Bank Borrowings.
The Fund is permitted to have bank borrowings for temporary or emergency purposes to fund shareholder redemptions. The Fund has established borrowing arrangements with certain banks. The interest rate on the borrowings is the bank's base rate, as revised from time to time. The average daily loan balance during the period for which loans were outstanding amounted to $14,799,857. The weighted average interest rate was .70%. The interest expense amounted to $2,027 under the bank borrowing program. At period end, there were no bank borrowings outstanding.
10. Expense Reductions.
FMR voluntarily agreed to reimburse a portion of Latin America's operating expenses. During the period, this reimbursement reduced the class' expenses by $62,575.
Many of the brokers with whom FMR places trades on behalf of the Fund provided services to the Fund in addition to trade execution. These services included payments of certain expenses on behalf of the Fund totaling $980,935 for the period. In addition, through arrangements with the Fund's custodian, credits realized as a result of uninvested cash balances were used to reduce the Fund's expenses. During the period, these credits reduced the Fund's custody expenses by $261.
11. Distributions to Shareholders.
Distributions to shareholders of each class were as follows:
Years ended October 31, | 2010 A | 2009 |
From net investment income | | |
Class A | $ 1,442 | $ - |
Class T | 1,442 | - |
Class B | 1,442 | - |
Class C | 1,442 | - |
Latin America | 118,553,199 | 34,726,095 |
Institutional Class | 1,442 | - |
Total | $ 118,560,409 | $ 34,726,095 |
From net realized gain | | |
Latin America | $ 33,986,366 | $ - |
A Distributions for Class A, Class T, Class B, Class C and Institutional Class are for the period September 28, 2010 (commencement of sale of shares) to October 31, 2010.
12. Share Transactions.
Transactions for each class of shares were as follows:
| Shares | Dollars |
Years ended October 31, | 2010 A | 2009 | 2010 A | 2009 |
Class A | | | | |
Shares sold | 41,687 | - | $ 2,369,263 | $ - |
Issued in exchange of shares of Fidelity Advisor Latin America Fund | 2,023,866 | | 113,640,086 | |
Reinvestment of distributions | 26 | - | 1,442 | - |
Shares redeemed | (53,951) | - | (3,076,408) | - |
Net increase (decrease) | 2,011,628 | - | $ 112,934,383 | $ - |
Class T | | | | |
Shares sold | 18,758 | - | $ 1,058,068 | $ - |
Issued in exchange of shares of Fidelity Advisor Latin America Fund | 637,585 | | 35,800,407 | |
Reinvestment of distributions | 26 | - | 1,442 | - |
Shares redeemed | (15,626) | - | (885,588) | - |
Net increase (decrease) | 640,743 | - | $ 35,974,329 | $ - |
Annual Report
12. Share Transactions - continued
| Shares | Dollars |
Years ended October 31, | 2010 A | 2009 | 2010 A | 2009 |
Class B | | | | |
Shares sold | 3,456 | - | $ 192,197 | $ - |
Issued in exchange of shares of Fidelity Advisor Latin America Fund | 359,402 | | 20,176,816 | |
Reinvestment of distributions | 26 | - | 1,442 | - |
Shares redeemed | (7,861) | - | (450,086) | - |
Net increase (decrease) | 355,023 | - | $ 19,920,369 | $ - |
Class C | | | | |
Shares sold | 17,327 | - | $ 976,205 | $ - |
Issued in exchange of shares of Fidelity Advisor Latin America Fund | 840,828 | | 47,204,057 | |
Reinvestment of distributions | 26 | - | 1,442 | - |
Shares redeemed | (16,791) | - | (947,712) | - |
Net increase (decrease) | 841,390 | - | $ 47,233,992 | $ - |
Latin America | | | | |
Shares sold | 22,062,249 | 31,352,380 | $ 1,142,552,819 | $ 1,172,903,800 |
Reinvestment of distributions | 2,770,809 | 1,344,639 | 147,652,381 | 33,594,867 |
Shares redeemed | (35,850,914) | (24,759,791) | (1,794,503,952) | (845,652,662) |
Net increase (decrease) | (11,017,856) | 7,937,228 | $ (504,298,752) | $ 360,846,005 |
Institutional Class | | | | |
Shares sold | 3,784 | - | $ 212,699 | $ - |
Issued in exchange of shares of Fidelity Advisor Latin America Fund | 228,366 | | 12,822,761 | |
Reinvestment of distributions | 26 | - | 1,442 | - |
Shares redeemed | (8,368) | - | (476,457) | - |
Net increase (decrease) | 223,808 | - | $ 12,560,445 | $ - |
A Share transactions for Class A, Class T, Class B, Class C and Institutional are for the period September 28, 2010 (commencement of sale of shares) to October 31, 2010.
13. Other.
The Fund's organizational documents provide former and current trustees and officers with a limited indemnification against liabilities arising in connection with the performance of their duties to the Fund. In the normal course of business, the Fund may also enter into contracts that provide general indemnifications. The Fund's maximum exposure under these arrangements is unknown as this would be dependent on future claims that may be made against the Fund. The risk of material loss from such claims is considered remote.
14. Merger Information.
On October 1, 2010 the Fund acquired all of the assets and assumed all of the liabilities of the Fidelity Advisor Latin America Fund ("Target Fund") pursuant to an agreement and plan of reorganization approved by the Board of Trustees ("The Board") on July 6, 2010. The reorganization provides shareholders of the Target Fund access to a larger portfolio with the same investment objectives and lower expenses. The acquisition was accomplished by an exchange of 2,023,866 Class A shares, 637,585 Class T shares, 359,402 Class B shares, 840,828 Class C shares, and 228,366 Institutional class shares of the Fund, respectively, for 2,219,330 Class A shares, 700,912 Class T shares, 400,205 Class B shares, 940,861 Class C shares, and 245,559 Institutional class shares then outstanding (valued at $51.20, $51.08, $50.42, $50.17 and $52.22 per share for Class A, Class T, Class B, Class C, and Institutional class, respectively) of the Target Fund. The reorganization qualified as a tax-free reorganization for federal income tax purposes with no gain or loss recognized to the funds or their shareholders. The Target Fund's net assets, including securities of $229,225,487, unrealized appreciation of $95,358,358, and net other assets of $418,642, were combined with the Fund's net assets of $4,149,781,255 for total net assets after the acquisition of $4,379,425,384.
Pro forma results of operations of the combined entity for the entire year ended October 31, 2010, as though the acquisition had occurred as of the beginning of the year (rather than on the actual acquisition date), are as follows:
Net investment income (loss) | $ 90,969,628 |
Total net realized gain (loss) | 302,327,523 |
Total change in net unrealized appreciation (depreciation) | 548,871,563 |
Net increase (decrease) in net assets resulting from operations | 942,168,714 |
Because the combined investment portfolios have been managed as a single portfolio since the acquisition was completed, it is not practicable to separate the amounts of revenue and earnings of the acquired fund that have been included in the Fund's accompanying Statement of Operations since October 1, 2010.
Annual Report
Fidelity Nordic Fund
Performance: The Bottom Line
Average annual total return reflects the change in the value of an investment, assuming reinvestment of the fund's distributions from dividend income and capital gains (the profits earned upon the sale of securities that have grown in value, if any) and assuming a constant rate of performance each year. The $10,000 table and the fund's returns do not reflect the deduction of taxes that a shareholder would pay on fund distributions or the redemption of fund shares. During periods of reimbursement by Fidelity, a fund's total return will be greater than it would be had the reimbursement not occurred. How a fund did yesterday is no guarantee of how it will do tomorrow.
Average Annual Total Returns
Periods ended October 31, 2010 | Past 1
year | Past 5
years | Past 10
years |
Fidelity Nordic Fund | 24.05% | 6.42% | 4.87% |
$10,000 Over 10 Years
Let's say hypothetically that $10,000 was invested in Fidelity Nordic Fund on October 31, 2000. The chart shows how the value of your investment would have changed, and also shows how the FTSE Capped Nordic Index performed over the same period. Returns shown for the FTSE Capped Nordic Index for periods prior to October 1, 2009 (its inception date) are returns of the uncapped FTSE Nordic Index.
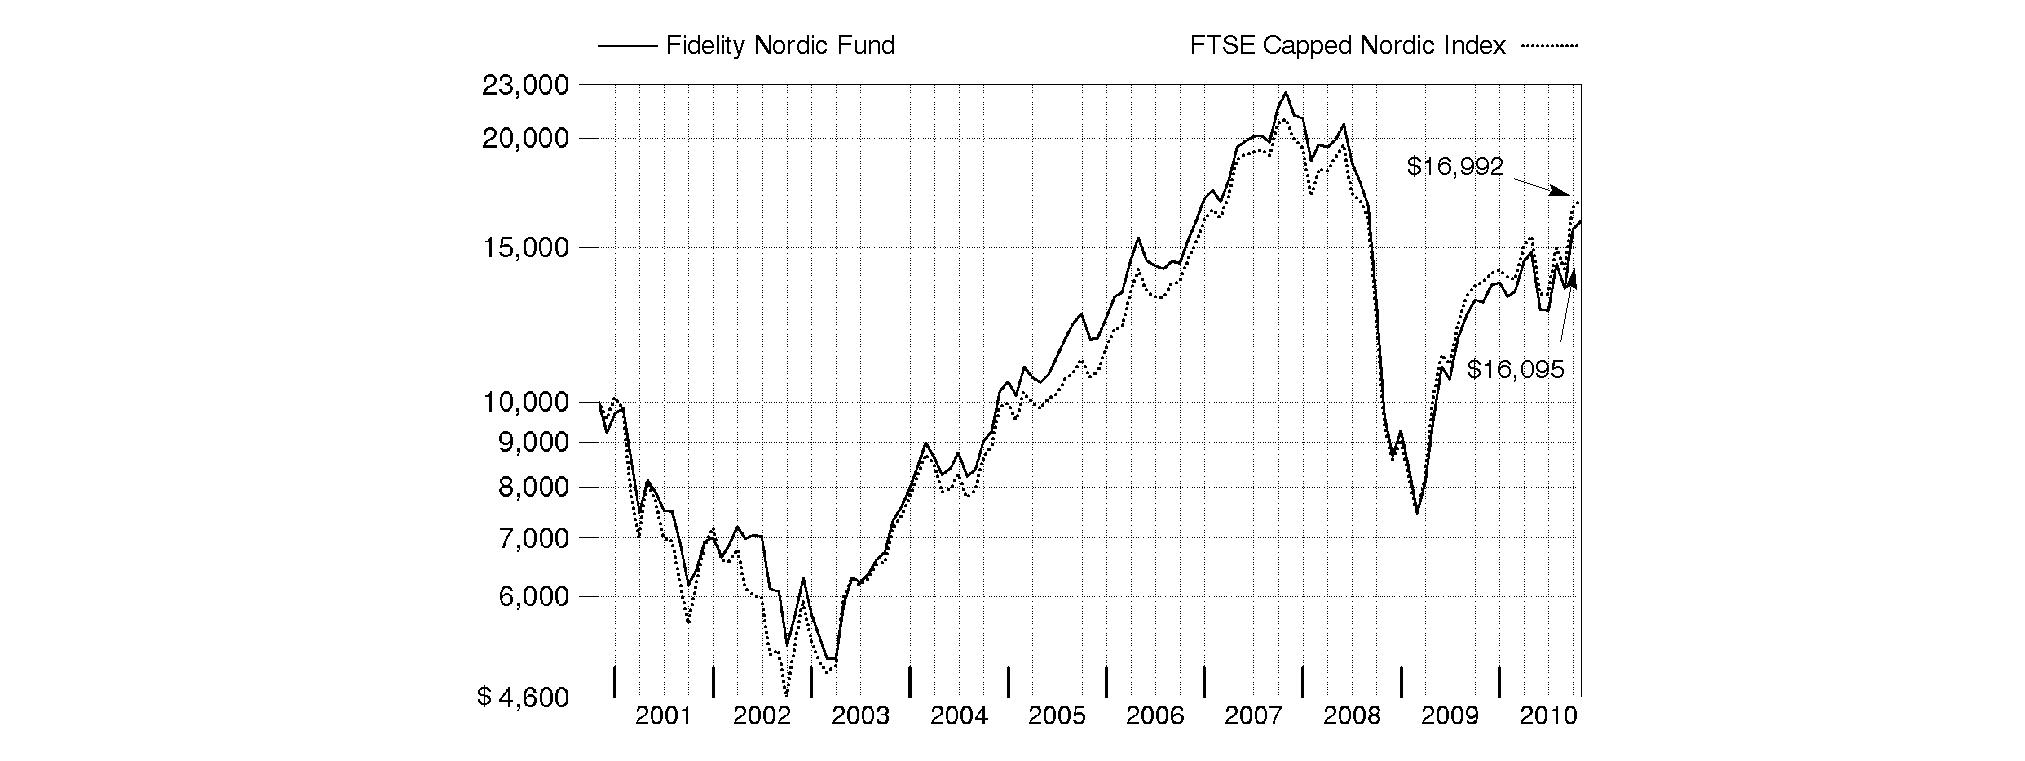
Annual Report
Fidelity Nordic Fund
Market Recap: International stocks rode a wave of volatility similar to that of their U.S. counterparts during the 12 months ending October 31, 2010. Stocks gained modestly in the first half of the period, despite growing concerns about the European debt crisis. Sentiment turned decidedly negative in May and June, however, and the market suffered a precipitous decline. These losses were more than offset during the last four months of the period, when signs of economic growth and subsiding debt fears helped propel international stocks about 21%. For the full year, the MSCI® ACWI® (All Country World Index) ex USA Index gained 12.76%, boosted in part by a generally depreciating U.S. dollar. Within the index, Canada and emerging markets were standouts, returning 23% and 24%, respectively. Results in the latter group were led by strong-performing India, Mexico and South Africa, while China fell short of the MSCI benchmark due to cooling economic growth. The developed Asia ex Japan segment rose 16% for the period, lifted by solid results from Singapore and Hong Kong. Meanwhile, Europe rose just 9%, held back mainly by debt-riddled Spain and Italy, as well as lagging major constituent France. Japan returned only 5%, a result of that nation's continued weak economy.
Comments from Melissa Reilly, Portfolio Manager of Fidelity® Nordic Fund: For the 12 months ending October 31, 2010, the fund advanced 24.05%, falling short of the 24.38% return of the FTSE Capped Nordic Index. The fund's stock selection in consumer discretionary - especially within the retailing, media and automobiles segments - helped, as was stock selection among banks within the financials sector. On the downside, overall positioning in energy and telecommunication services was detrimental. Geographically, stock picking in Sweden and Denmark was most helpful, while positioning in Norway and Finland dragged on performance. On an individual stock basis, the fund lost ground due to its positioning in Bermuda-based offshore deepwater drilling company Seadrill, Swedish telecom equipment and service provider Ericsson, Finnish industrials firm Metso and two telecommunications companies, Sweden's Tele2 and Norway's Telenor. On the upside, the fund was buoyed by owning several Swedish companies: Swedbank, one of Sweden's largest banks, radiation therapy equipment company Elekta, media firm Modern Times Group and truck maker Scania. Elekta was an out-of-index holding. An underweighting in Danish wind turbine manufacturer Vestas Wind Systems also was positive. I sold Vestas and Tele2 by period end.
Note to shareholders: Fidelity Nordic Fund may invest up to 35% of its total assets in any industry that represents more than 20% of the Nordic market. As of October 31, 2010, the fund did not have more than 25% of its assets invested in any one industry.
The views expressed above reflect those of the portfolio manager(s) only through the end of the period as stated on the cover of this report and do not necessarily represent the views of Fidelity or any other person in the Fidelity organization. Any such views are subject to change at any time based upon market or other conditions and Fidelity disclaims any responsibility to update such views. These views may not be relied on as investment advice and, because investment decisions for a Fidelity fund are based on numerous factors, may not be relied on as an indication of trading intent on behalf of any Fidelity fund.
Annual Report
Fidelity Nordic Fund
As a shareholder of the Fund, you incur two types of costs: (1) transaction costs, including redemption fees, and (2) ongoing costs, including management fees and other Fund expenses. This Example is intended to help you understand your ongoing costs (in dollars) of investing in the Fund and to compare these costs with the ongoing costs of investing in other mutual funds.
The Example is based on an investment of $1,000 invested at the beginning of the period and held for the entire period (May 1, 2010 to October 31, 2010).
Actual Expenses
The first line of the accompanying table provides information about actual account values and actual expenses. You may use the information in this line, together with the amount you invested, to estimate the expenses that you paid over the period. Simply divide your account value by $1,000.00 (for example, an $8,600 account value divided by $1,000.00 = 8.6), then multiply the result by the number in the first line under the heading entitled "Expenses Paid During Period" to estimate the expenses you paid on your account during this period. A small balance maintenance fee of $12.00 that is charged once a year may apply for certain accounts with a value of less than $2,000. This fee is not included in the table below. If it was, the estimate of expenses you paid during the period would be higher, and your ending account value lower, by this amount. In addition, the Fund, as a shareholder in the underlying Fidelity Central Funds, will indirectly bear its pro-rata share of the fees and expenses incurred by the underlying Fidelity Central Funds. These fees and expenses are not included in the Fund's annualized expense ratio used to calculate the expense estimate in the table below.
Hypothetical Example for Comparison Purposes
The second line of the accompanying table provides information about hypothetical account values and hypothetical expenses based on the Fund's actual expense ratio and an assumed rate of return of 5% per year before expenses, which is not the Fund's actual return. The hypothetical account values and expenses may not be used to estimate the actual ending account balance or expenses you paid for the period. You may use this information to compare the ongoing costs of investing in the Fund and other funds. To do so, compare this 5% hypothetical example with the 5% hypothetical examples that appear in the shareholder reports of the other funds. A small balance maintenance fee of $12.00 that is charged once a year may apply for certain accounts with a value of less than $2,000. This fee is not included in the table below. If it was, the estimate of expenses you paid during the period would be higher, and your ending account value lower, by this amount. In addition, the Fund, as a shareholder in the underlying Fidelity Central Funds, will indirectly bear its pro-rata share of the fees and expenses incurred by the underlying Fidelity Central Funds. These fees and expenses are not included in the Fund's annualized expense ratio used to calculate the expense estimate in the table below.
Please note that the expenses shown in the table are meant to highlight your ongoing costs only and do not reflect any transaction costs. Therefore, the second line of the table is useful in comparing ongoing costs only, and will not help you determine the relative total costs of owning different funds. In addition, if these transactional costs were included, your costs would have been higher.
| Annualized
Expense Ratio | Beginning
Account Value
May 1, 2010 | Ending
Account Value
October 31, 2010 | Expenses Paid
During Period*
May 1, 2010 to October 31, 2010 |
Actual | 1.12% | $ 1,000.00 | $ 1,087.30 | $ 5.89 |
Hypothetical (5% return per year before expenses) | | $ 1,000.00 | $ 1,019.56 | $ 5.70 |
* Expenses are equal to the Fund's annualized expense ratio, multiplied by the average account value over the period, multiplied by 184/365 (to reflect the one-half year period).
Annual Report
Fidelity Nordic Fund
Investment Changes (Unaudited)
Geographic Diversification (% of fund's net assets) |
As of October 31, 2010 |
| Sweden | 39.7% | |
| Norway | 21.3% | |
| Finland | 18.2% | |
| Denmark | 15.9% | |
| United States of America | 2.5% | |
| Bermuda | 2.0% | |
| Iceland | 0.4% | |

Percentages are adjusted for the effect of futures contracts, if applicable. |
As of April 30, 2010 |
| Sweden | 44.7% | |
| Denmark | 19.8% | |
| Finland | 15.9% | |
| Norway | 15.6% | |
| Bermuda | 2.2% | |
| United States of America | 1.4% | |
| Iceland | 0.4% | |

Percentages are adjusted for the effect of futures contracts, if applicable. |
Asset Allocation |
| % of fund's
net assets | % of fund's net assets
6 months ago |
Stocks | 98.5 | 98.6 |
Short-Term Investments and Net Other Assets | 1.5 | 1.4 |
Top Ten Stocks as of October 31, 2010 |
| % of fund's
net assets | % of fund's net assets
6 months ago |
Novo Nordisk AS Series B (Denmark, Pharmaceuticals) | 6.7 | 6.5 |
Nokia Corp. (Finland, Communications Equipment) | 5.6 | 3.8 |
H&M Hennes & Mauritz AB (B Shares) (Sweden, Specialty Retail) | 4.2 | 4.0 |
Swedbank AB (A Shares) (Sweden, Commercial Banks) | 4.0 | 2.7 |
Volvo AB (B Shares) (Sweden, Machinery) | 3.9 | 4.2 |
Yara International ASA (Norway, Chemicals) | 3.9 | 0.0 |
Sandvik AB (Sweden, Machinery) | 3.7 | 3.9 |
Kone Oyj (B Shares) (Finland, Machinery) | 3.6 | 1.8 |
DnB NOR ASA (Norway, Commercial Banks) | 3.6 | 2.8 |
Norsk Hydro ASA (Norway, Metals & Mining) | 3.4 | 1.6 |
| 42.6 | |
Market Sectors as of October 31, 2010 |
| % of fund's
net assets | % of fund's net assets
6 months ago |
Industrials | 26.8 | 27.6 |
Financials | 14.0 | 21.1 |
Consumer Discretionary | 13.0 | 7.1 |
Materials | 10.3 | 10.0 |
Health Care | 9.4 | 8.5 |
Information Technology | 8.0 | 7.9 |
Energy | 7.6 | 8.2 |
Telecommunication Services | 5.5 | 4.1 |
Consumer Staples | 3.9 | 2.0 |
Utilities | 0.0 | 2.1 |
Annual Report
Fidelity Nordic Fund
Investments October 31, 2010
Showing Percentage of Net Assets
Common Stocks - 98.5% |
| Shares | | Value |
Bermuda - 2.0% |
Seadrill Ltd. | 302,100 | | $ 9,146,577 |
Denmark - 15.9% |
A.P. Moller - Maersk AS Series A | 372 | | 3,125,740 |
Carlsberg AS Series B | 119,400 | | 13,055,998 |
Danske Bank AS (a) | 148,578 | | 3,950,731 |
DSV de Sammensluttede Vognmaend AS | 174,400 | | 3,573,197 |
Novo Nordisk AS Series B | 293,922 | | 30,856,602 |
Novozymes AS Series B | 64,400 | | 8,580,097 |
Pandora A/S | 97,500 | | 4,730,272 |
William Demant Holding AS (a) | 66,000 | | 4,947,137 |
TOTAL DENMARK | | 72,819,774 |
Finland - 18.2% |
Kone Oyj (B Shares) | 307,260 | | 16,460,172 |
Metso Corp. | 230,400 | | 10,922,504 |
Nokia Corp. | 2,388,136 | | 25,640,662 |
Nokian Tyres PLC | 246,400 | | 8,537,047 |
Outotec OYJ | 71,200 | | 3,322,849 |
Sampo OYJ (A Shares) | 189,700 | | 5,313,476 |
UPM-Kymmene Corp. | 294,200 | | 4,891,907 |
Wartsila Corp. | 117,000 | | 8,205,102 |
TOTAL FINLAND | | 83,293,719 |
Iceland - 0.4% |
Ossur hf (a) | 1,080,470 | | 2,036,302 |
Norway - 21.3% |
Aker Solutions ASA | 470,900 | | 7,168,821 |
DnB NOR ASA | 1,198,100 | | 16,440,059 |
Norsk Hydro ASA | 2,524,800 | | 15,452,243 |
Schibsted ASA (B Shares) | 192,600 | | 5,292,202 |
StatoilHydro ASA | 669,596 | | 14,618,470 |
Storebrand ASA (A Shares) (a) | 1,169,500 | | 8,504,838 |
Telenor ASA | 742,500 | | 11,968,857 |
Yara International ASA | 339,800 | | 17,861,929 |
TOTAL NORWAY | | 97,307,419 |
Sweden - 39.7% |
ASSA ABLOY AB (B Shares) | 433,400 | | 11,104,837 |
Atlas Copco AB (A Shares) | 607,800 | | 12,698,887 |
Bilia AB (A Shares) | 349,400 | | 6,209,778 |
BYGGmax Group AB | 492,700 | | 3,963,515 |
Elekta AB (B Shares) | 148,100 | | 5,603,402 |
|
| Shares | | Value |
H&M Hennes & Mauritz AB
(B Shares) | 546,429 | | $ 19,251,285 |
Lundin Petroleum AB (a) | 374,200 | | 3,539,488 |
Modern Times Group MTG AB
(B Shares) | 57,650 | | 4,133,758 |
Nordea Bank AB | 247,500 | | 2,724,441 |
Rezidor Hotel Group AB (a) | 500,000 | | 2,881,046 |
Sandvik AB | 1,113,000 | | 16,774,291 |
Scania AB (B Shares) | 508,000 | | 10,796,216 |
Skandinaviska Enskilda Banken AB
(A Shares) | 1,123,900 | | 8,704,777 |
SKF AB (B Shares) | 293,500 | | 7,577,339 |
Swedbank AB (A Shares) (a) | 1,320,858 | | 18,434,209 |
Swedish Match Co. | 179,000 | | 5,001,691 |
Telefonaktiebolaget LM Ericsson
(B Shares) | 984,416 | | 10,823,052 |
TeliaSonera AB | 1,619,800 | | 13,515,303 |
Volvo AB (B Shares) (a) | 1,323,200 | | 17,912,392 |
TOTAL SWEDEN | | 181,649,707 |
United States of America - 1.0% |
Autoliv, Inc. | 65,700 | | 4,684,410 |
TOTAL COMMON STOCKS (Cost $368,837,371) | 450,937,908 |
Money Market Funds - 1.5% |
| | | |
Fidelity Cash Central Fund, 0.23% (b)
(Cost $6,641,162) | 6,641,162 | | 6,641,162 |
TOTAL INVESTMENT PORTFOLIO - 100.0% (Cost $375,478,533) | | 457,579,070 |
NET OTHER ASSETS (LIABILITIES) - 0.0% | | 195,498 |
NET ASSETS - 100% | $ 457,774,568 |
Legend |
(a) Non-income producing |
(b) Affiliated fund that is available only to investment companies and other accounts managed by Fidelity Investments. The rate quoted is the annualized seven-day yield of the fund at period end. A complete unaudited listing of the fund's holdings as of its most recent quarter end is available upon request. In addition, each Fidelity Central Fund's financial statements, which are not covered by the Fund's report of Independent Registered Public Accounting Firm, are available on the SEC's website or upon request. |
Affiliated Central Funds |
Information regarding fiscal year to date income earned by the Fund from investments in Fidelity Central Funds is as follows: |
Fund | Income earned |
Fidelity Cash Central Fund | $ 9,639 |
Fidelity Securities Lending Cash Central Fund | 573,540 |
Total | $ 583,179 |
Other Information |
The following is a summary of the inputs used, as of October 31, 2010, involving the Fund's assets and liabilities carried at fair value. The inputs or methodology used for valuing securities may not be an indication of the risk associated with investing in those securities. For more information on valuation inputs, and their aggregation into the levels used in the table below, please refer to the Security Valuation section in the accompanying Notes to Financial Statements. |
Valuation Inputs at Reporting Date: |
Description | Total | Level 1 | Level 2 | Level 3 |
Investments in Securities: | | | | |
Equities: | | | | |
Sweden | $ 181,649,707 | $ 170,826,655 | $ 10,823,052 | $ - |
Norway | 97,307,419 | 82,688,949 | 14,618,470 | - |
Finland | 83,293,719 | 57,653,057 | 25,640,662 | - |
Denmark | 72,819,774 | 41,963,172 | 30,856,602 | - |
Bermuda | 9,146,577 | 9,146,577 | - | - |
United States of America | 4,684,410 | 4,684,410 | - | - |
Iceland | 2,036,302 | 2,036,302 | - | - |
Money Market Funds | 6,641,162 | 6,641,162 | - | - |
Total Investments in Securities: | $ 457,579,070 | $ 375,640,284 | $ 81,938,786 | $ - |
Income Tax Information |
At October 31, 2010, the Fund had a capital loss carryforward of approximately $182,736,647 of which $49,861,789 and $132,874,858 will expire on October 31, 2016 and 2017, respectively. Capital loss carryforwards are only available to offset future capital gains of the Fund to the extent provided by regulations and may be limited. |
See accompanying notes which are an integral part of the financial statements.
Annual Report
Fidelity Nordic Fund
Statement of Assets and Liabilities
| October 31, 2010 |
| | |
Assets | | |
Investment in securities, at value - See accompanying schedule: Unaffiliated issuers (cost $368,837,371) | $ 450,937,908 | |
Fidelity Central Funds (cost $6,641,162) | 6,641,162 | |
Total Investments (cost $375,478,533) | | $ 457,579,070 |
Receivable for investments sold | | 701,635 |
Receivable for fund shares sold | | 1,285,191 |
Dividends receivable | | 40,236 |
Distributions receivable from Fidelity Central Funds | | 3,750 |
Other receivables | | 47,388 |
Total assets | | 459,657,270 |
| | |
Liabilities | | |
Payable for fund shares redeemed | 1,434,940 | |
Accrued management fee | 264,605 | |
Other affiliated payables | 112,551 | |
Other payables and accrued expenses | 70,606 | |
Total liabilities | | 1,882,702 |
| | |
Net Assets | | $ 457,774,568 |
Net Assets consist of: | | |
Paid in capital | | $ 558,024,127 |
Undistributed net investment income | | 4,074,601 |
Accumulated undistributed net realized gain (loss) on investments and foreign currency transactions | | (186,427,547) |
Net unrealized appreciation (depreciation) on investments and assets and liabilities in foreign currencies | | 82,103,387 |
Net Assets, for 14,186,829 shares outstanding | | $ 457,774,568 |
Net Asset Value, offering price and redemption price per share ($457,774,568 ÷ 14,186,829 shares) | | $ 32.27 |
Statement of Operations
| Year ended October 31, 2010 |
| | |
Investment Income | | |
Dividends | | $ 8,933,654 |
Income from Fidelity Central Funds (including $573,540 from security lending) | | 583,179 |
Income before foreign taxes withheld | | 9,516,833 |
Less foreign taxes withheld | | (1,361,961) |
Total income | | 8,154,872 |
| | |
Expenses | | |
Management fee | $ 2,553,797 | |
Transfer agent fees | 1,076,123 | |
Accounting and security lending fees | 190,566 | |
Custodian fees and expenses | 138,565 | |
Independent trustees' compensation | 2,000 | |
Registration fees | 32,278 | |
Audit | 54,838 | |
Legal | 1,718 | |
Miscellaneous | 4,772 | |
Total expenses before reductions | 4,054,657 | |
Expense reductions | (78,827) | 3,975,830 |
Net investment income (loss) | | 4,179,042 |
Realized and Unrealized Gain (Loss) Net realized gain (loss) on: | | |
Investment securities: | | |
Unaffiliated issuers | 41,512,013 | |
Foreign currency transactions | (78,600) | |
Total net realized gain (loss) | | 41,433,413 |
Change in net unrealized appreciation (depreciation) on: Investment securities | 33,475,660 | |
Assets and liabilities in foreign currencies | 3,230 | |
Total change in net unrealized appreciation (depreciation) | | 33,478,890 |
Net gain (loss) | | 74,912,303 |
Net increase (decrease) in net assets resulting from operations | | $ 79,091,345 |
See accompanying notes which are an integral part of the financial statements.
Annual Report
Statement of Changes in Net Assets
| Year ended
October 31,
2010 | Year ended
October 31,
2009 |
Increase (Decrease) in Net Assets | | |
Operations | | |
Net investment income (loss) | $ 4,179,042 | $ 4,754,672 |
Net realized gain (loss) | 41,433,413 | (131,472,851) |
Change in net unrealized appreciation (depreciation) | 33,478,890 | 210,415,767 |
Net increase (decrease) in net assets resulting from operations | 79,091,345 | 83,697,588 |
Distributions to shareholders from net investment income | (4,315,648) | (14,502,155) |
Share transactions
Proceeds from sales of shares | 163,155,616 | 56,737,784 |
Reinvestment of distributions | 4,158,861 | 13,861,510 |
Cost of shares redeemed | (118,821,372) | (95,836,661) |
Net increase (decrease) in net assets resulting from share transactions | 48,493,105 | (25,237,367) |
Redemption fees | 91,663 | 55,319 |
Total increase (decrease) in net assets | 123,360,465 | 44,013,385 |
| | |
Net Assets | | |
Beginning of period | 334,414,103 | 290,400,718 |
End of period (including undistributed net investment income of $4,074,601 and undistributed net investment income of $4,288,893, respectively) | $ 457,774,568 | $ 334,414,103 |
Other Information Shares | | |
Sold | 5,576,785 | 2,623,183 |
Issued in reinvestment of distributions | 148,584 | 825,090 |
Redeemed | (4,240,424) | (4,743,235) |
Net increase (decrease) | 1,484,945 | (1,294,962) |
Financial Highlights
Years ended October 31, | 2010 | 2009 | 2008 | 2007 | 2006 |
Selected Per-Share Data | | | | | |
Net asset value, beginning of period | $ 26.33 | $ 20.75 | $ 52.81 | $ 36.58 | $ 30.92 |
Income from Investment Operations | | | | | |
Net investment income (loss) B | .33 | .35 | .85 | 2.39 E | .50 |
Net realized and unrealized gain (loss) | 5.94 | 6.29 | (28.93) | 14.60 | 7.94 |
Total from investment operations | 6.27 | 6.64 | (28.08) | 16.99 | 8.44 |
Distributions from net investment income | (.34) | (1.06) | (1.73) | (.29) | (.35) |
Distributions from net realized gain | - | - | (2.28) | (.51) | (2.49) |
Total distributions | (.34) | (1.06) | (4.01) | (.80) | (2.84) |
Redemption fees added to paid in capital B | .01 | - G | .03 | .04 | .06 |
Net asset value, end of period | $ 32.27 | $ 26.33 | $ 20.75 | $ 52.81 | $ 36.58 |
Total Return A | 24.05% | 34.90% | (57.32)% | 47.38% | 29.68% |
Ratios to Average Net Assets C,F | | | | | |
Expenses before reductions | 1.12% | 1.15% | 1.09% | 1.06% | 1.14% |
Expenses net of fee waivers, if any | 1.12% | 1.15% | 1.09% | 1.06% | 1.14% |
Expenses net of all reductions | 1.10% | 1.12% | 1.07% | 1.03% | 1.10% |
Net investment income (loss) | 1.16% | 1.71% | 2.10% | 5.37% E | 1.49% |
Supplemental Data | | | | | |
Net assets, end of period (000 omitted) | $ 457,775 | $ 334,414 | $ 290,401 | $ 997,726 | $ 348,482 |
Portfolio turnover rate D | 80% | 107% | 72% | 62% | 67% |
A Total returns would have been lower had certain expenses not been reduced during the periods shown.
B Calculated based on average shares outstanding during the period.
C Fees and expenses of the underlying Fidelity Central Funds are not included in the Fund's expense ratio. The Fund indirectly bears its proportionate share of the expenses of any underlying Fidelity Central Funds.
D Amount does not include the portfolio activity of any underlying Fidelity Central Funds.
E Investment income per share reflects a special dividend which amounted to $1.62 per share. Excluding the special dividend, the ratio of net investment income (loss) to average net assets would have been 1.72%.
F Expense ratios reflect operating expenses of the Fund. Expenses before reductions do not reflect amounts reimbursed by the investment adviser or reductions from brokerage service arrangements or reductions from other expense offset arrangements and do not represent the amount paid by the Fund during periods when reimbursements or reductions occur. Expenses net of fee waivers reflect expenses after reimbursement by the investment adviser but prior to reductions from brokerage service arrangements or other expense offset arrangements. Expenses net of all reductions represent the net expenses paid by the Fund.
G Amount represents less than $.01 per share.
See accompanying notes which are an integral part of the financial statements.
Annual Report
Notes to Financial Statements
For the period ended October 31, 2010
1. Organization.
Fidelity Nordic Fund (the Fund) is a fund of Fidelity Investment Trust (the Trust) and is authorized to issue an unlimited number of shares. The Trust is registered under the Investment Company Act of 1940, as amended (the 1940 Act), as an open-end management investment company organized as a Massachusetts business trust.
2. Investments in Fidelity Central Funds.
The Fund may invest in Fidelity Central Funds, which are open-end investment companies available only to other investment companies and accounts managed by Fidelity Management & Research Company (FMR) and its affiliates. The Fund's Schedule of Investments lists each of the Fidelity Central Funds held as of period end, if any, as an investment of the Fund, but does not include the underlying holdings of each Fidelity Central Fund. As an Investing Fund, the Fund indirectly bears its proportionate share of the expenses of the underlying Fidelity Central Funds.
The Money Market Central Funds seek preservation of capital and current income and are managed by Fidelity Investments Money Management, Inc. (FIMM), an affiliate of FMR.
A complete unaudited list of holdings for each Fidelity Central Fund is available upon request or at the Securities and Exchange Commission (the SEC) web site at www.sec.gov. In addition, the financial statements of the Fidelity Central Funds which are not covered by the Fund's Report of Independent Registered Public Accounting Firm, are available on the SEC web site or upon request.
3. Significant Accounting Policies.
The financial statements have been prepared in conformity with accounting principles generally accepted in the United States of America (GAAP), which require management to make certain estimates and assumptions at the date of the financial statements. Actual results could differ from those estimates. The following summarizes the significant accounting policies of the Fund:
Security Valuation. Investments are valued as of 4:00 p.m. Eastern time on the last calendar day of the period. The Fund uses independent pricing services approved by the Board of Trustees to value its investments. When current market prices or quotations are not readily available or reliable, valuations may be determined in good faith in accordance with procedures adopted by the Board of Trustees. Factors used in determining value may include market or security specific events. The frequency with which these procedures are used cannot be predicted and they may be utilized to a significant extent. The value used for net asset value (NAV) calculation under these procedures may differ from published prices for the same securities.
The Fund categorizes the inputs to valuation techniques used to value its investments into a disclosure hierarchy consisting of three levels as shown below.
Level 1 - quoted prices in active markets for identical investments
Level 2 - other significant observable inputs (including quoted prices for similar investments, interest rates, prepayment speeds, etc.)
Level 3 - unobservable inputs (including the fund's own assumptions based on the best information available)
Changes in valuation techniques may result in transfers in or out of an assigned level within the disclosure hierarchy. The aggregate value of investments by input level, as of October 31, 2010, is included at the end of the Fund's Schedule of Investments. Valuation techniques used to value the Fund's investments by major category are as follows.
Equity securities, including restricted securities, for which market quotations are readily available, are valued at the last reported sale price or official closing price as reported by an independent pricing service on the primary market or exchange on which they are traded and are categorized as Level 1 in the hierarchy. In the event there were no sales during the day or closing prices are not available, securities are valued at the last quoted bid price or may be valued using the last available price and are generally categorized as Level 2 in the hierarchy. For foreign equity securities, when significant market or security specific events arise, comparisons to the valuation of American Depositary Receipts (ADRs), futures contracts, Exchange-traded funds (ETFs) and certain indexes as well as quoted prices for similar securities are used and are categorized as Level 2 in the hierarchy in these circumstances. Utilizing these techniques may result in significant transfers between Level 1 and Level 2. For restricted equity securities and private placements where observable inputs are limited, assumptions about market activity and risk are used and are categorized as Level 3 in the hierarchy.
Investments in open-end mutual funds are valued at their closing net asset value each business day and are categorized as Level 1 in the hierarchy. Short-term securities with remaining maturities of sixty days or less for which quotations are not readily available are valued at amortized cost, which approximates fair value and are categorized as Level 2 in the hierarchy.
Foreign Currency. The Fund uses foreign currency contracts to facilitate transactions in foreign-denominated securities. Gains and losses from these transactions may arise from changes in the value of the foreign currency or if the counterparties do not perform under the contracts' terms.
Annual Report
Notes to Financial Statements - continued
3. Significant Accounting Policies - continued
Foreign Currency - continued
Foreign-denominated assets, including investment securities, and liabilities are translated into U.S. dollars at the exchange rate at period end. Purchases and sales of investment securities, income and dividends received and expenses denominated in foreign currencies are translated into U.S. dollars at the exchange rate in effect on the transaction date.
The effects of exchange rate fluctuations on investments are included with the net realized and unrealized gain (loss) on investment securities. Other foreign currency transactions resulting in realized and unrealized gain (loss) are disclosed separately.
Investment Transactions and Income. For financial reporting purposes, the Fund's investment holdings and NAV include trades executed through the end of the last business day of the period. The NAV per share for processing shareholder transactions is calculated as of the close of business of the New York Stock Exchange (NYSE) normally 4:00 p.m. Eastern time and includes trades executed through the end of the prior business day. Gains and losses on securities sold are determined on the basis of identified cost. Dividend income is recorded on the ex-dividend date, except for certain dividends from foreign securities where the ex-dividend date may have passed, which are recorded as soon as the Fund is informed of the ex-dividend date. Non-cash dividends included in dividend income, if any, are recorded at the fair market value of the securities received. Distributions received on securities that represent a return of capital or capital gain are recorded as reduction of cost of investments and/or as a realized gain. The Fund estimates the components of distributions received that may be considered return of capital distributions or capital gain distributions. Interest income and distributions from the Fidelity Central Funds are accrued as earned. Interest income includes coupon interest and amortization of premium and accretion of discount on debt securities. Investment income is recorded net of foreign taxes withheld where recovery of such taxes is uncertain.
Expenses. Most expenses of the Trust can be directly attributed to a fund. Expenses which cannot be directly attributed are apportioned amongst each fund in the Trust. Expense estimates are accrued in the period to which they relate and adjustments are made when actual amounts are known.
Income Tax Information and Distributions to Shareholders. Each year the Fund intends to qualify as a regulated investment company, including distributing substantially all of its taxable income and realized gains under Subchapter M of the Internal Revenue Code and filing its U.S. federal tax return. As a result, no provision for income taxes is required. As of October 31, 2010, the Fund did not have any unrecognized tax benefits in the accompanying financial statements. A fund's federal tax return is subject to examination by the Internal Revenue Service (IRS) for a period of three years. Foreign taxes are provided for based on the Fund's understanding of the tax rules and rates that exist in the foreign markets in which it invests.
Distributions are declared and recorded on the ex-dividend date. Income and capital gain distributions are determined in accordance with income tax regulations, which may differ from GAAP.
Capital accounts within the financial statements are adjusted for permanent book-tax differences. These adjustments have no impact on net assets or the results of operations. Temporary book-tax differences will reverse in a subsequent period.
Book-tax differences are primarily due to the short-term gain distributions from the Fidelity Central Funds, foreign currency transactions, capital loss carryforwards, and losses deferred due to wash sales.
The federal tax cost of investment securities and unrealized appreciation (depreciation) as of period end were as follows:
Gross unrealized appreciation | $ 96,205,180 |
Gross unrealized depreciation | (17,795,542) |
Net unrealized appreciation (depreciation) | $ 78,409,638 |
| |
Tax Cost | $ 379,169,432 |
The tax-based components of distributable earnings as of period end were as follows:
Undistributed ordinary income | $ 4,074,599 |
Capital loss carryforward | $ (182,736,647) |
Net unrealized appreciation (depreciation) | $ 78,412,488 |
The tax character of distributions paid was as follows:
| October 31, 2010 | October 31, 2009 |
Ordinary Income | $ 4,315,648 | $ 14,502,155 |
Annual Report
3. Significant Accounting Policies - continued
Short-Term Trading (Redemption) Fees. Shares held by investors in the Fund less than 90 days are subject to a redemption fee equal to 1.50% of the net asset value of shares redeemed. All redemption fees, which reduce the proceeds of the shareholder redemption, are retained by the Fund and accounted for as an addition to paid in capital.
4. Purchases and Sales of Investments.
Purchases and sales of securities, other than short-term securities, aggregated $325,956,575 and $283,635,582, respectively.
5. Fees and Other Transactions with Affiliates.
Management Fee. FMR and its affiliates provide the Fund with investment management related services for which the Fund pays a monthly management fee. The management fee is the sum of an individual fund fee rate that is based on an annual rate of .45% of the Fund's average net assets and a group fee rate that averaged .26% during the period. The group fee rate is based upon the average net assets of all the mutual funds advised by FMR. The group fee rate decreases as assets under management increase and increases as assets under management decrease. For the period, the total annual management fee rate was .71% of the Fund's average net assets.
Transfer Agent Fees. Fidelity Investments Institutional Operations Company, Inc. (FIIOC), an affiliate of FMR, is the Fund's transfer, dividend disbursing and shareholder servicing agent. FIIOC receives account fees and asset-based fees that vary according to account size and type of account. FIIOC pays for typesetting, printing and mailing of shareholder reports, except proxy statements. For the period, the transfer agent fees were equivalent to an annual rate of .30% of average net assets.
Accounting and Security Lending Fees. Fidelity Service Company, Inc. (FSC), an affiliate of FMR, maintains the Fund's accounting records. The accounting fee is based on the level of average net assets for the month. Under a separate contract, FSC administers the security lending program. The security lending fee is based on the number and duration of lending transactions.
6. Committed Line of Credit.
The Fund participates with other funds managed by FMR or an affiliate in a $3.75 billion credit facility (the "line of credit") to be utilized for temporary or emergency purposes to fund shareholder redemptions or for other short-term liquidity purposes. The Fund has agreed to pay commitment fees on its pro-rata portion of the line of credit, which amounted to $1,384 and is reflected in Miscellaneous expenses on the Statement of Operations. During the period, there were no borrowings on this line of credit.
7. Security Lending.
The Fund lends portfolio securities through a lending agent from time to time in order to earn additional income. The Lending agent may loan securities to certain qualified borrowers, including Fidelity Capital Markets (FCM), a broker-dealer affiliated with the Fund. On the settlement date of the loan, the Fund receives collateral (in the form of U.S. Treasury obligations, letters of credit and/or cash) against the loaned securities and maintains collateral in an amount not less than 100% of the market value of the loaned securities during the period of the loan. The market value of the loaned securities is determined at the close of business of the Fund and any additional required collateral is delivered to the Fund on the next business day. If the borrower defaults on its obligation to return the securities loaned because of insolvency or other reasons, a fund could experience delays and costs in recovering the securities loaned or in gaining access to the collateral. Any cash collateral received is invested in the Fidelity Securities Lending Cash Central Fund. At period end, there were no security loans outstanding. Security lending income represents the income earned on investing cash collateral, less rebates paid to borrowers and lending agent fees associated with the loan, plus any premium payments received for lending certain types of securities. Security lending income is presented in the Statement of Operations as a component of income from Fidelity Central Funds.
8. Expense Reductions.
Many of the brokers with whom FMR places trades on behalf of the Fund provided services to the Fund in addition to trade execution. These services included payments of certain expenses on behalf of the Fund totaling $78,656 for the period. In addition, through arrangements with the Fund's custodian, credits realized as a result of uninvested cash balances were used to reduce the Fund's expenses. During the period, these credits reduced the Fund's custody expense by $171.
Annual Report
Notes to Financial Statements - continued
9. Other.
The Fund's organizational documents provide former and current trustees and officers with a limited indemnification against liabilities arising in connection with the performance of their duties to the Fund. In the normal course of business, the Fund may also enter into contracts that provide general indemnifications. The Fund's maximum exposure under these arrangements is unknown as this would be dependent on future claims that may be made against the Fund. The risk of material loss from such claims is considered remote.
At the end of the period, Fidelity VIP Funds Manager 60% was the owner of record of approximately 10% of the total outstanding share of the Fund.
Annual Report
Fidelity Pacific Basin Fund
Performance: The Bottom Line
Average annual total return reflects the change in the value of an investment, assuming reinvestment of the fund's distributions from dividend income and capital gains (the profits earned upon the sale of securities that have grown in value, if any) and assuming a constant rate of performance each year. The $10,000 table and the fund's returns do not reflect the deduction of taxes that a shareholder would pay on fund distributions or the redemption of fund shares. During periods of reimbursement by Fidelity, a fund's total return will be greater than it would be had the reimbursement not occurred. How a fund did yesterday is no guarantee of how it will do tomorrow.
Average Annual Total Returns
Periods ended October 31, 2010 | Past 1
year | Past 5
years | Past 10
years |
Fidelity Pacific Basin Fund | 31.65% | 8.19% | 6.02% |
$10,000 Over 10 Years
Let's say hypothetically that $10,000 was invested in Fidelity Pacific Basin Fund on October 31, 2000. The chart shows how the value of your investment would have changed, and also shows how the MSCI AC (All Country) Pacific Index performed over the same period.
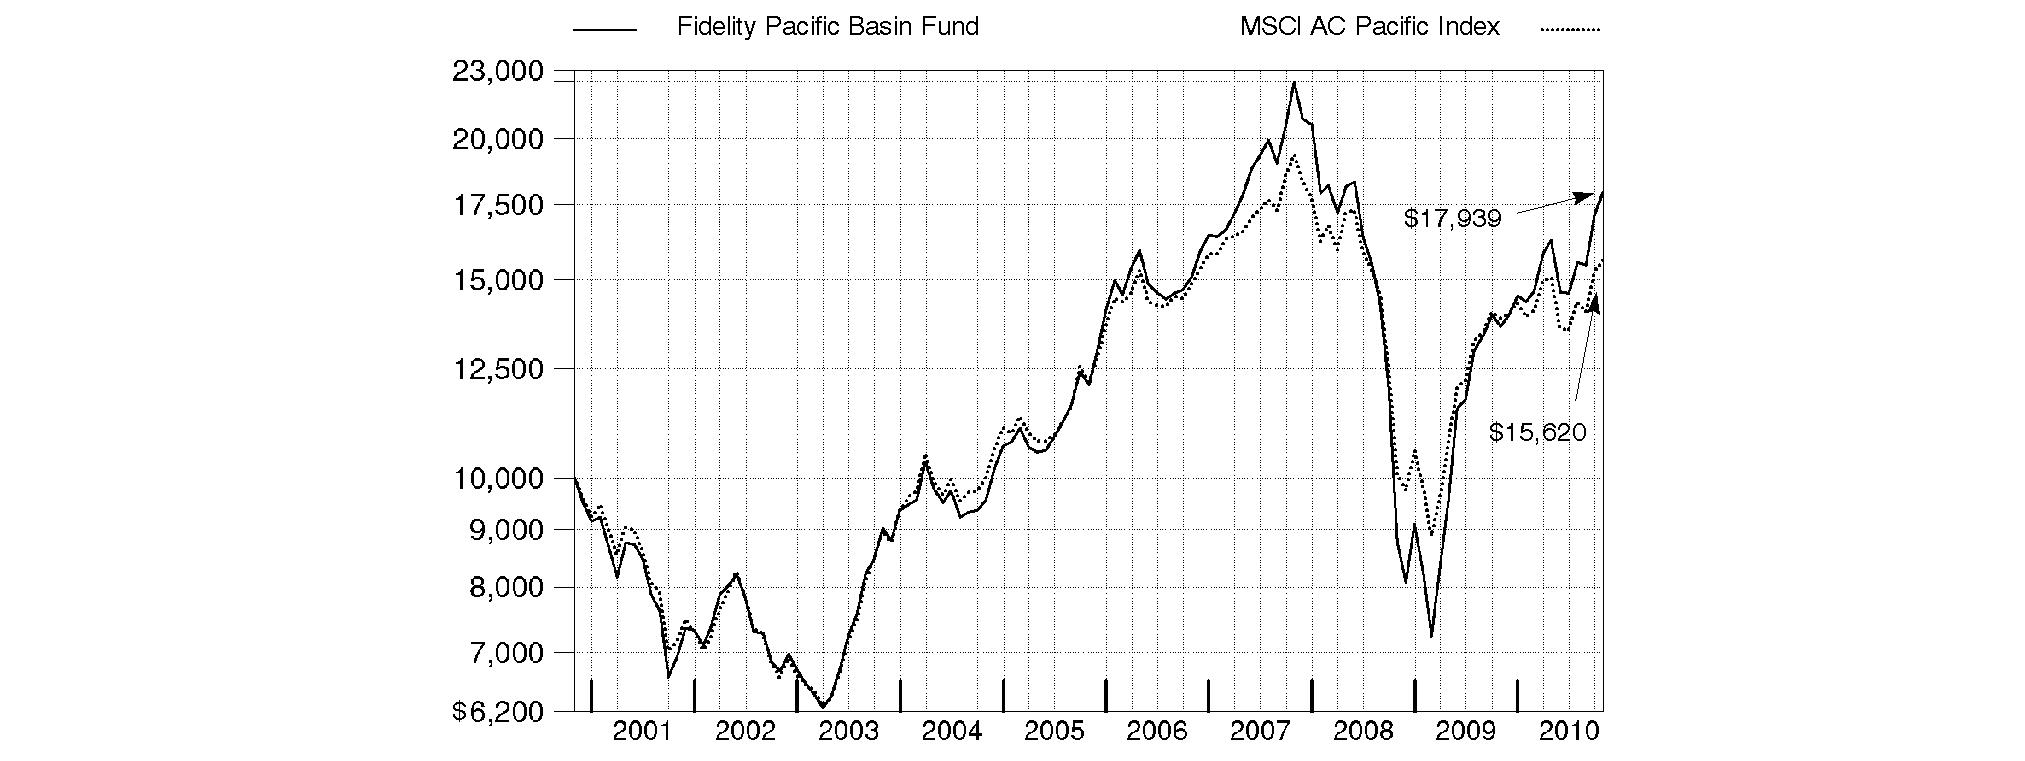
Annual Report
Fidelity Pacific Basin Fund
Market Recap: International stocks rode a wave of volatility similar to that of their U.S. counterparts during the 12 months ending October 31, 2010. Stocks gained modestly in the first half of the period, despite growing concerns about the European debt crisis. Sentiment turned decidedly negative in May and June, however, and the market suffered a precipitous decline. These losses were more than offset during the last four months of the period, when signs of economic growth and subsiding debt fears helped propel international stocks about 21%. For the full year, the MSCI® ACWI® (All Country World Index) ex USA Index gained 12.76%, boosted in part by a generally depreciating U.S. dollar. Within the index, Canada and emerging markets were standouts, returning 23% and 24%, respectively. Results in the latter group were led by strong-performing India, Mexico and South Africa, while China fell short of the MSCI benchmark due to cooling economic growth. The developed Asia ex Japan segment rose 16% for the period, lifted by solid results from Singapore and Hong Kong. Meanwhile, Europe rose just 9%, held back mainly by debt-riddled Spain and Italy, as well as lagging major constituent France. Japan returned only 5%, a result of that nation's continued weak economy.
Comments from Dale Nicholls, Portfolio Manager of Fidelity® Pacific Basin Fund: During the year, the fund gained 31.65%, more than double the 12.65% mark of the MSCI AC (All Country) Pacific Index. Relative performance was boosted by strong stock picking in a variety of sectors, led by industrials, financials, consumer discretionary and information technology, and by overweighting consumer discretionary. Geographically, the fund received a large performance boost from stock selection in China, followed by South Korea, Japan, Australia and Singapore. My focus on small- and mid-cap stocks also was beneficial. The Basic House, a South Korea-based retailer of casual clothing, was the fund's largest relative contributor, owing to its rapidly expanding business in China. Other contributors included Singapore-based Goodpack, which is engaged in leasing intermediate bulk containers, Japanese finance company ORIX - the fund's largest holding at period end and also its biggest absolute contributor - and Chinese online search engine Baidu. Conversely, energy was the only sector that detracted from performance, mostly due to weak stock picks. The largest individual detractor was Perfect World, a Chinese online game company. The stock came under pressure following conservative earnings guidance issued by the company. Japanese provider of house weddings Take And Give Needs also hurt. Most of the stocks I've mentioned were out-of-benchmark holdings.
The views expressed above reflect those of the portfolio manager(s) only through the end of the period as stated on the cover of this report and do not necessarily represent the views of Fidelity or any other person in the Fidelity organization. Any such views are subject to change at any time based upon market or other conditions and Fidelity disclaims any responsibility to update such views. These views may not be relied on as investment advice and, because investment decisions for a Fidelity fund are based on numerous factors, may not be relied on as an indication of trading intent on behalf of any Fidelity fund.
Annual Report
Fidelity Pacific Basin Fund
As a shareholder of the Fund, you incur two types of costs: (1) transaction costs, including redemption fees, and (2) ongoing costs, including management fees and other Fund expenses. This Example is intended to help you understand your ongoing costs (in dollars) of investing in the Fund and to compare these costs with the ongoing costs of investing in other mutual funds.
The Example is based on an investment of $1,000 invested at the beginning of the period and held for the entire period (May 1, 2010 to October 31, 2010).
Actual Expenses
The first line of the accompanying table provides information about actual account values and actual expenses. You may use the information in this line, together with the amount you invested, to estimate the expenses that you paid over the period. Simply divide your account value by $1,000.00 (for example, an $8,600 account value divided by $1,000.00 = 8.6), then multiply the result by the number in the first line under the heading entitled "Expenses Paid During Period" to estimate the expenses you paid on your account during this period. A small balance maintenance fee of $12.00 that is charged once a year may apply for certain accounts with a value of less than $2,000. This fee is not included in the table below. If it was, the estimate of expenses you paid during the period would be higher, and your ending account value lower, by this amount. In addition, the Fund, as a shareholder in the underlying Fidelity Central Funds, will indirectly bear its pro-rata share of the fees and expenses incurred by the underlying Fidelity Central Funds. These fees and expenses are not included in the Fund's annualized expense ratio used to calculate the expense estimate in the table below.
Hypothetical Example for Comparison Purposes
The second line of the accompanying table provides information about hypothetical account values and hypothetical expenses based on the Fund's actual expense ratio and an assumed rate of return of 5% per year before expenses, which is not the Fund's actual return. The hypothetical account values and expenses may not be used to estimate the actual ending account balance or expenses you paid for the period. You may use this information to compare the ongoing costs of investing in the Fund and other funds. To do so, compare this 5% hypothetical example with the 5% hypothetical examples that appear in the shareholder reports of the other funds. A small balance maintenance fee of $12.00 that is charged once a year may apply for certain accounts with a value of less than $2,000. This fee is not included in the table below. If it was, the estimate of expenses you paid during the period would be higher, and your ending account value lower, by this amount. In addition, the Fund, as a shareholder in the underlying Fidelity Central Funds, will indirectly bear its pro-rata share of the fees and expenses incurred by the underlying Fidelity Central Funds. These fees and expenses are not included in the Fund's annualized expense ratio used to calculate the expense estimate in the table below.
Please note that the expenses shown in the table are meant to highlight your ongoing costs only and do not reflect any transaction costs. Therefore, the second line of the table is useful in comparing ongoing costs only, and will not help you determine the relative total costs of owning different funds. In addition, if these transactional costs were included, your costs would have been higher.
| Annualized
Expense Ratio | Beginning
Account Value
May 1, 2010 | Ending
Account Value
October 31, 2010 | Expenses Paid
During Period*
May 1, 2010 to
October 31, 2010 |
Actual | 1.05% | $ 1,000.00 | $ 1,104.20 | $ 5.57 |
Hypothetical (5% return per year before expenses) | | $ 1,000.00 | $ 1,019.91 | $ 5.35 |
* Expenses are equal to the Fund's annualized expense ratio, multiplied by the average account value over the period, multiplied by 184/365 (to reflect the one-half year period).
Annual Report
Fidelity Pacific Basin Fund
Investment Changes (Unaudited)
Geographic Diversification (% of fund's net assets) |
As of October 31, 2010 |
| Japan | 33.0% | |
| Cayman Islands | 11.9% | |
| China | 10.4% | |
| Korea (South) | 9.2% | |
| Australia | 8.5% | |
| Bermuda | 6.3% | |
| India | 3.9% | |
| Singapore | 3.6% | |
| Hong Kong | 3.4% | |
| Other | 9.8% | |

Percentages are adjusted for the effect of futures contracts, if applicable. |
As of April 30, 2010 |
| Japan | 27.7% | |
| Korea (South) | 12.9% | |
| Australia | 10.6% | |
| China | 10.0% | |
| United States of America | 8.1% | |
| Cayman Islands | 7.6% | |
| Bermuda | 4.3% | |
| Hong Kong | 4.1% | |
| India | 3.1% | |
| Other | 11.6% | |

Percentages are adjusted for the effect of futures contracts, if applicable. |
Asset Allocation |
| % of fund's
net assets | % of fund's net assets
6 months ago |
Stocks | 98.5 | 91.9 |
Short-Term Investments and Net Other Assets | 1.5 | 8.1 |
Top Ten Stocks as of October 31, 2010 |
| % of fund's
net assets | % of fund's net assets
6 months ago |
ORIX Corp. (Japan, Consumer Finance) | 3.7 | 3.6 |
Ping An Insurance Group Co. China Ltd. (H Shares) (China, Insurance) | 2.2 | 2.5 |
SOFTBANK CORP. (Japan, Wireless Telecommunication Services) | 2.2 | 1.7 |
Goodpack Ltd. (Singapore, Air Freight & Logistics) | 2.0 | 1.6 |
EVA Precision Industrial Holdings Ltd. (Cayman Islands, Machinery) | 1.9 | 0.0 |
Ctrip.com International Ltd. sponsored ADR (Cayman Islands, Hotels, Restaurants & Leisure) | 1.6 | 1.6 |
Goodman Group unit (Australia, Real Estate Investment Trusts) | 1.5 | 2.0 |
Biosensors International Group Ltd. (Bermuda, Health Care Equipment & Supplies) | 1.4 | 0.2 |
Kenedix Realty Investment Corp. (Japan, Real Estate Investment Trusts) | 1.3 | 1.2 |
Tencent Holdings Ltd. (China, Internet Software & Services) | 1.3 | 1.3 |
| 19.1 | |
Market Sectors as of October 31, 2010 |
| % of fund's
net assets | % of fund's net assets
6 months ago |
Financials | 21.0 | 19.7 |
Industrials | 19.3 | 15.0 |
Information Technology | 18.4 | 23.0 |
Consumer Discretionary | 17.0 | 14.4 |
Materials | 9.8 | 8.2 |
Health Care | 4.4 | 3.3 |
Consumer Staples | 3.1 | 2.0 |
Energy | 2.5 | 2.7 |
Telecommunication Services | 2.4 | 1.9 |
Utilities | 0.6 | 1.7 |
Annual Report
Fidelity Pacific Basin Fund
Investments October 31, 2010
Showing Percentage of Net Assets
Common Stocks - 98.5% |
| Shares | | Value |
Australia - 8.5% |
Ausenco Ltd. (d) | 1,739,609 | | $ 4,345,730 |
Austal Ltd. | 2,568,947 | | 6,165,839 |
Australian Worldwide Exploration Ltd. (a) | 2,270,671 | | 3,347,817 |
Goodman Group unit | 20,234,391 | | 12,488,251 |
Iress Market Technology Ltd. | 239,290 | | 2,051,179 |
Lynas Corp. Ltd. (a) | 4,303,572 | | 6,176,432 |
Macquarie Group Ltd. | 109,776 | | 3,893,023 |
MAp Group unit | 3,035,768 | | 9,070,670 |
Navitas Ltd. | 1,755,729 | | 6,587,600 |
Newcrest Mining Ltd. | 133,131 | | 5,211,655 |
Origin Energy Ltd. | 536,729 | | 8,381,357 |
realestate.com.au Ltd. | 294,913 | | 3,114,466 |
TOTAL AUSTRALIA | | 70,834,019 |
Bermuda - 6.3% |
Asian Citrus Holdings Ltd. | 3,377,000 | | 3,890,548 |
Biosensors International Group Ltd. (a) | 13,351,000 | | 11,553,056 |
China Animal Healthcare Ltd. | 13,770,000 | | 3,617,245 |
China LotSynergy Holdings Ltd. (a) | 21,764,000 | | 842,342 |
China Water Affairs Group Ltd. | 6,846,000 | | 2,623,141 |
Huabao International Holdings Ltd. | 1,873,000 | | 2,822,337 |
Man Wah Holdings Ltd. | 1,762,400 | | 2,473,783 |
Mingyuan Medicare Development Co. Ltd. | 27,510,000 | | 3,833,033 |
Noble Group Ltd. | 4,825,527 | | 6,934,621 |
Sihuan Pharmaceutical Holdings Group Ltd. | 41,000 | | 29,780 |
Texwinca Holdings Ltd. | 2,906,000 | | 3,171,716 |
Vtech Holdings Ltd. (d) | 1,056,200 | | 10,989,522 |
TOTAL BERMUDA | | 52,781,124 |
Cayman Islands - 11.9% |
AirMedia Group, Inc. ADR (a) | 63,000 | | 435,330 |
China Automation Group Ltd. | 2,466,000 | | 1,927,942 |
China Dongxiang Group Co. Ltd. | 4,351,000 | | 2,436,167 |
China Forestry Holdings Co. Ltd. | 5,562,000 | | 2,640,627 |
China Haidian Holdings Ltd. | 10,116,000 | | 1,683,553 |
China High Precision Automation Group Ltd. | 4,875,000 | | 3,106,918 |
China Lilang Ltd. (d) | 2,280,000 | | 3,565,051 |
China Real Estate Information Corp. ADR (d) | 384,000 | | 3,805,440 |
CNinsure, Inc. ADR (d) | 178,700 | | 4,592,590 |
Ctrip.com International Ltd. sponsored ADR (a) | 252,800 | | 13,163,296 |
Daphne International Holdings Ltd. | 3,308,000 | | 3,695,827 |
EVA Precision Industrial Holdings Ltd. | 19,128,000 | | 15,867,510 |
Fook Woo Group Holdings Ltd. (d) | 7,678,000 | | 2,714,107 |
Global Dairy Holdings Ltd. | 1,223,000 | | 607,457 |
Global Education & Technology Group Ltd. ADR (a) | 3,200 | | 31,776 |
Hengan International Group Co. Ltd. | 301,000 | | 2,834,769 |
Hengdeli Holdings Ltd. | 5,846,000 | | 3,243,064 |
|
| Shares | | Value |
Kingdee International Software Group Co. Ltd. | 8,270,928 | | $ 4,364,212 |
Little Sheep Group Ltd. | 4,223,000 | | 2,751,318 |
Maoye International Holdings Ltd. | 6,182,000 | | 2,663,813 |
Neo-Neon Holdings Ltd. (d) | 3,506,000 | | 2,134,923 |
PCD Stores Group Ltd. | 7,878,000 | | 2,540,881 |
Perfect World Co. Ltd. sponsored ADR Class B (a)(d) | 242,375 | | 7,852,950 |
SinoCom Software Group Ltd. | 14,382,000 | | 1,688,453 |
TAL Education Group ADR (a) | 6,400 | | 113,920 |
TPK Holdings Co. | 2,000 | | 33,001 |
VST Holdings Ltd. (a) | 3,660,000 | | 934,920 |
Wasion Group Holdings Ltd. (d) | 2,788,000 | | 2,028,617 |
Xingda International Holdings Ltd. | 6,024,000 | | 6,287,265 |
TOTAL CAYMAN ISLANDS | | 99,745,697 |
China - 10.4% |
51job, Inc. sponsored ADR (a)(d) | 80,900 | | 3,646,972 |
AMVIG Holdings Ltd. | 6,142,000 | | 4,992,046 |
Baidu.com, Inc. sponsored ADR (a) | 75,100 | | 8,261,751 |
China Metal Recycling (Holdings) Ltd. | 2,797,800 | | 3,114,983 |
Dalian Port (PDA) Co. Ltd. (H Shares) | 5,974,000 | | 2,581,893 |
Digital China Holdings Ltd. (H Shares) | 1,403,000 | | 2,534,043 |
Focus Media Holding Ltd. ADR (a)(d) | 103,500 | | 2,561,625 |
Global Bio-Chem Technology Group Co. Ltd. (a) | 16,175,600 | | 2,629,415 |
Harbin Power Equipment Co. Ltd. (H Shares) | 3,194,000 | | 4,301,933 |
Minth Group Ltd. (d) | 3,866,000 | | 7,231,995 |
People's Food Holdings Ltd. | 4,855,000 | | 2,625,744 |
Ping An Insurance Group Co. China Ltd. (H Shares) | 1,731,500 | | 18,641,339 |
Royale Furniture Holdings Ltd. | 12,517,962 | | 4,570,338 |
Sinotrans Ltd. (H Shares) | 7,103,000 | | 1,915,210 |
Tencent Holdings Ltd. | 480,600 | | 11,005,515 |
Yantai Changyu Pioneer Wine Co. (B Shares) | 312,700 | | 4,030,154 |
Zhaojin Mining Industry Co. Ltd. (H Shares) | 173,500 | | 539,442 |
Zhejiang Expressway Co. Ltd. (H Shares) | 1,654,000 | | 1,666,536 |
TOTAL CHINA | | 86,850,934 |
Hong Kong - 3.4% |
China State Construction International Holdings Ltd. | 5,110,752 | | 3,890,139 |
PCCW Ltd. | 2,816,000 | | 1,075,357 |
PYI Corp. Ltd. (a) | 28,483,617 | | 1,065,667 |
REXCAPITAL Financial Holdings Ltd. | 33,086,967 | | 3,073,390 |
Singamas Container Holdings Ltd. (a) | 9,972,000 | | 2,251,379 |
Techtronic Industries Co. Ltd. | 9,222,000 | | 9,339,487 |
Television Broadcasts Ltd. | 764,000 | | 4,070,724 |
Tian An China Investments Co. Ltd. | 4,934,800 | | 3,813,508 |
TOTAL HONG KONG | | 28,579,651 |
Common Stocks - continued |
| Shares | | Value |
India - 3.9% |
Educomp Solutions Ltd. | 158,035 | | $ 1,962,558 |
Financial Technologies India Ltd. | 75,761 | | 1,679,048 |
Gateway Distriparks Ltd. | 797,796 | | 2,002,365 |
Geodesic Ltd. | 1,605,385 | | 4,233,943 |
Grasim Industries Ltd. | 19,757 | | 1,038,772 |
Indian Overseas Bank | 1,251,645 | | 4,512,417 |
INFO Edge India Ltd. | 175,376 | | 2,691,868 |
Jindal Steel & Power Ltd. | 143,040 | | 2,251,045 |
NIIT Ltd. | 1,948,036 | | 2,889,642 |
Reliance Industries Ltd. | 87,888 | | 2,173,654 |
Rural Electrification Corp. Ltd. | 335,366 | | 2,804,363 |
Shriram Transport Finance Co. Ltd. | 230,211 | | 4,577,732 |
TOTAL INDIA | | 32,817,407 |
Indonesia - 2.6% |
AKR Corporindo Tbk PT | 38,007,000 | | 6,421,316 |
PT Ciputra Development Tbk (a) | 124,171,000 | | 5,835,163 |
PT Lippo Karawaci Tbk | 60,762,000 | | 4,215,094 |
PT Perusahaan Gas Negara Tbk Series B | 6,647,740 | | 3,012,399 |
PT Tambang Batubbara Bukit Asam Tbk | 1,077,500 | | 2,368,991 |
PT Tower Bersama Infrastructure Tbk | 391,500 | | 111,701 |
TOTAL INDONESIA | | 21,964,664 |
Ireland - 0.4% |
James Hardie Industries NV unit (a) | 570,644 | | 3,013,179 |
Japan - 33.0% |
ABC-Mart, Inc. | 114,500 | | 3,894,451 |
Adeka Corp. | 271,900 | | 2,905,853 |
Aeon Credit Service Co. Ltd. | 451,600 | | 5,196,739 |
BLife Investment Corp. (d) | 406 | | 2,467,180 |
Chiyoda Corp. | 440,000 | | 3,644,769 |
Credit Saison Co. Ltd. | 289,200 | | 4,101,926 |
Digital Garage, Inc. (d) | 4,353 | | 7,584,076 |
eAccess Ltd. | 7,052 | | 5,144,183 |
FreeBit Co., Ltd. (d) | 440 | | 913,135 |
Fuji Fire & Marine Insurance Co. Ltd. (a) | 4,294,000 | | 5,336,150 |
Fuji Heavy Industries Ltd. (a) | 394,000 | | 2,715,247 |
Fuji Spinning Co. Ltd. | 2,274,000 | | 3,221,523 |
Fujifilm Holdings Corp. | 230,500 | | 7,689,850 |
Fujitsu Ltd. | 639,000 | | 4,358,910 |
GMO Internet, Inc. | 800,500 | | 2,864,968 |
H.I.S. Co. Ltd. | 133,800 | | 2,849,922 |
Hamakyorex Co. Ltd. | 91,100 | | 2,160,045 |
Haseko Corp. (a) | 3,748,500 | | 3,214,198 |
Hikari Tsushin, Inc. | 207,400 | | 3,917,584 |
Internet Initiative Japan, Inc. | 1,332 | | 2,871,902 |
ISE Chemical Corp. (d) | 456,000 | | 2,918,354 |
Kenedix Realty Investment Corp. | 2,783 | | 11,049,689 |
Mandom Corp. | 83,600 | | 2,278,300 |
Micronics Japan Co. Ltd. (d) | 339,900 | | 2,745,557 |
Mitsui & Co. Ltd. | 460,400 | | 7,240,899 |
|
| Shares | | Value |
MS&AD Insurance Group Holdings, Inc. | 408,200 | | $ 9,779,206 |
Nippon Seiki Co. Ltd. | 635,000 | | 6,431,279 |
Nishimatsu Construction Co. Ltd. | 1,899,000 | | 2,029,502 |
Nitta Corp. | 497,400 | | 7,874,830 |
Nittoku Engineering Co. Ltd. | 421,600 | | 3,662,214 |
NTT Urban Development Co. | 4,724 | | 4,332,437 |
ORIX Corp. | 339,120 | | 30,932,526 |
Promise Co. Ltd. (d) | 806,400 | | 3,377,119 |
Rakuten, Inc. | 7,323 | | 5,642,177 |
Risa Partners, Inc. (d) | 7,307 | | 2,633,317 |
Rohto Pharmaceutical Co. Ltd. | 591,000 | | 7,322,319 |
Saizeriya Co. Ltd. | 311,200 | | 5,886,000 |
Sankyo Seiko Co. Ltd. | 820,200 | | 2,486,999 |
SHO-BOND Holdings Co. Ltd. | 128,800 | | 2,756,227 |
So-Net Entertainment Corp. | 3,949 | | 10,231,968 |
SOFTBANK CORP. | 567,800 | | 18,234,912 |
Sony Financial Holdings, Inc. | 1,902 | | 6,618,118 |
Sumitomo Mitsui Financial Group, Inc. | 358,200 | | 10,691,462 |
Sumitomo Trust & Banking Co. Ltd. | 1,615,000 | | 8,817,583 |
TDK Corp. | 76,000 | | 4,336,172 |
Tokyo Ohka Kogyo Co. Ltd. | 139,700 | | 2,583,243 |
Toridoll Corp. | 1,164 | | 1,588,259 |
Tosoh Corp. | 1,376,000 | | 3,680,336 |
Toyo Tanso Co. Ltd. (d) | 91,700 | | 5,259,047 |
Yamato Kogyo Co. Ltd. | 234,600 | | 6,017,328 |
TOTAL JAPAN | | 276,489,990 |
Korea (South) - 9.2% |
Daou Technology, Inc. | 1,117,860 | | 8,946,855 |
eSang Networks Co. Ltd. (a) | 104,037 | | 637,452 |
Halla Climate Control Co. | 139,500 | | 2,592,752 |
Hyosung Corp. | 50,081 | | 5,567,029 |
Infopia Co. Ltd. (a) | 195,412 | | 3,041,093 |
Interpark Corp. (a) | 467,633 | | 1,854,729 |
Jinsung T.E.C. Co. Ltd. (a) | 445,561 | | 4,180,229 |
Jusung Engineering Co. Ltd. (a) | 87,852 | | 1,539,070 |
KC Tech Co. Ltd. | 833,860 | | 4,508,553 |
LG Chemical Ltd. | 23,832 | | 7,354,115 |
Lock & Lock Co. Ltd. | 102,580 | | 3,393,486 |
MNTECH Co. Ltd. | 467,070 | | 4,589,705 |
NHN Corp. (a) | 32,970 | | 5,849,279 |
Power Logics Co. Ltd. (a) | 343,039 | | 2,660,115 |
Samsung C&T Corp. | 68,153 | | 4,000,087 |
Sodiff Advanced Materials Co. Ltd. | 28,261 | | 2,573,522 |
The Basic House Co. Ltd. (a) | 438,471 | | 8,851,303 |
TK Corp. (a) | 195,708 | | 4,516,338 |
TOTAL KOREA (SOUTH) | | 76,655,712 |
Malaysia - 1.5% |
IJM Corp. Bhd | 1,572,980 | | 2,846,634 |
IJM Land Bhd warrants 9/11/13 (a) | 116,970 | | 53,766 |
JobStreet Corp. Bhd | 6,159,050 | | 5,266,176 |
Common Stocks - continued |
| Shares | | Value |
Malaysia - continued |
Lion Industries Corp. Bhd | 2,603,200 | | $ 1,656,810 |
Top Glove Corp. Bhd | 1,492,300 | | 2,638,267 |
TOTAL MALAYSIA | | 12,461,653 |
Philippines - 1.3% |
Alliance Global Group, Inc. | 25,222,542 | | 6,667,217 |
DMCI Holdings, Inc. | 4,424,500 | | 3,939,765 |
TOTAL PHILIPPINES | | 10,606,982 |
Singapore - 3.6% |
CSE Global Ltd. | 7,480,500 | | 6,126,346 |
Global Logistic Properties Ltd. | 632,000 | | 1,132,844 |
Goodpack Ltd. | 10,618,000 | | 16,735,471 |
Goodpack Ltd. warrants 11/30/12 (a) | 2,233,800 | | 2,329,931 |
Mapletree Industrial (REIT) (a) | 201,000 | | 166,167 |
Straits Asia Resources Ltd. | 2,284,000 | | 4,041,072 |
Tat Hong Holdings Ltd. warrants 8/2/13 (a) | 125,700 | | 4,856 |
TOTAL SINGAPORE | | 30,536,687 |
Taiwan - 2.5% |
104 Corp. | 479,000 | | 1,885,950 |
Hon Hai Precision Industry Co. Ltd. (Foxconn) | 1,580,592 | | 5,990,808 |
Lite-On Technology Corp. | 3,034,163 | | 4,010,191 |
St. Shine Optical Co. Ltd. | 352,000 | | 3,956,478 |
Tatung Co. Ltd. (a) | 22,335,000 | | 5,269,031 |
TOTAL TAIWAN | | 21,112,458 |
TOTAL COMMON STOCKS (Cost $655,908,756) | 824,450,157 |
Money Market Funds - 4.5% |
| Shares | | Value |
Fidelity Cash Central Fund, 0.23% (b) | 8,464,287 | | $ 8,464,287 |
Fidelity Securities Lending Cash Central Fund, 0.24% (b)(c) | 29,127,774 | | 29,127,774 |
TOTAL MONEY MARKET FUNDS (Cost $37,592,061) | 37,592,061 |
TOTAL INVESTMENT PORTFOLIO - 103.0% (Cost $693,500,817) | | 862,042,218 |
NET OTHER ASSETS (LIABILITIES) - (3.0)% | | (25,129,507) |
NET ASSETS - 100% | $ 836,912,711 |
Legend |
(a) Non-income producing |
(b) Affiliated fund that is available only to investment companies and other accounts managed by Fidelity Investments. The rate quoted is the annualized seven-day yield of the fund at period end. A complete unaudited listing of the fund's holdings as of its most recent quarter end is available upon request. In addition, each Fidelity Central Fund's financial statements, which are not covered by the Fund's report of Independent Registered Public Accounting Firm, are available on the SEC's website or upon request. |
(c) Investment made with cash collateral received from securities on loan. |
(d) Security or a portion of the security is on loan at period end. |
Affiliated Central Funds |
Information regarding fiscal year to date income earned by the Fund from investments in Fidelity Central Funds is as follows: |
Fund | Income earned |
Fidelity Cash Central Fund | $ 36,962 |
Fidelity Securities Lending Cash Central Fund | 366,616 |
Total | $ 403,578 |
Other Information |
The following is a summary of the inputs used, as of October 31, 2010, involving the Fund's assets and liabilities carried at fair value. The inputs or methodology used for valuing securities may not be an indication of the risk associated with investing in those securities. For more information on valuation inputs, and their aggregation into the levels used in the tables below, please refer to the Security Valuation section in the accompanying Notes to Financial Statements. |
Valuation Inputs at Reporting Date: |
Description | Total | Level 1 | Level 2 | Level 3 |
Investments in Securities: | | | | |
Equities: | | | | |
Japan | $ 276,489,990 | $ 191,198,718 | $ 85,291,272 | $ - |
Cayman Islands | 99,745,697 | 99,745,697 | - | - |
China | 86,850,934 | 86,850,934 | - | - |
Korea (South) | 76,655,712 | 76,655,712 | - | - |
Australia | 70,834,019 | 70,834,019 | - | - |
Bermuda | 52,781,124 | 52,781,124 | - | - |
India | 32,817,407 | 31,778,635 | 1,038,772 | - |
Singapore | 30,536,687 | 30,536,687 | - | - |
Hong Kong | 28,579,651 | 28,579,651 | - | - |
Other | 69,158,936 | 69,158,936 | - | - |
Money Market Funds | 37,592,061 | 37,592,061 | - | - |
Total Investments in Securities: | $ 862,042,218 | $ 775,712,174 | $ 86,330,044 | $ - |
The following is a reconciliation of Investments in Securities for which Level 3 inputs were used in determining value: |
Investments in Securities: | |
Beginning Balance | $ 3,415,954 |
Total Realized Gain (Loss) | (8,340,368) |
Total Unrealized Gain (Loss) | 9,423,694 |
Cost of Purchases | - |
Proceeds of Sales | (4,499,280) |
Amortization/Accretion | - |
Transfers in to Level 3 | - |
Transfers out of Level 3 | - |
Ending Balance | $ - |
The change in unrealized gain (loss) for the period attributable to Level 3 securities held at October 31, 2010 | $ - |
The information used in the above reconciliation represents fiscal year to date activity for any Investments in Securities identified as using Level 3 inputs at either the beginning or the end of the current fiscal period. Transfers in or out of Level 3 represent the beginning value of any Security or Instrument where a change in the pricing level occurred from the beginning to the end of the period. The cost of purchases and the proceeds of sales may include securities received or delivered through corporate actions or exchanges. Realized and unrealized gains (losses) disclosed in the reconciliation are included in Net Gain (Loss) on the Fund's Statement of Operations. |
Income Tax Information |
At October 31, 2010, the Fund had a capital loss carryforward of approximately $73,673,831 which will expire on October 31, 2017. Capital loss carryforwards are only available to offset future capital gains of the Fund to the extent provided by regulations and may be limited. |
See accompanying notes which are an integral part of the financial statements.
Annual Report
Fidelity Pacific Basin Fund
Statement of Assets and Liabilities
| October 31, 2010 |
Assets | | |
Investment in securities, at value (including securities loaned of $27,865,021) - See accompanying schedule: Unaffiliated issuers (cost $655,908,756) | $ 824,450,157 | |
Fidelity Central Funds (cost $37,592,061) | 37,592,061 | |
Total Investments (cost $693,500,817) | | $ 862,042,218 |
Foreign currency held at value (cost $15) | | 15 |
Receivable for investments sold | | 5,413,652 |
Receivable for fund shares sold | | 1,202,260 |
Dividends receivable | | 1,890,259 |
Distributions receivable from Fidelity Central Funds | | 52,104 |
Other receivables | | 114,358 |
Total assets | | 870,714,866 |
| | |
Liabilities | | |
Payable for investments purchased | $ 2,729,785 | |
Payable for fund shares redeemed | 568,781 | |
Accrued management fee | 472,666 | |
Other affiliated payables | 180,314 | |
Other payables and accrued expenses | 722,835 | |
Collateral on securities loaned, at value | 29,127,774 | |
Total liabilities | | 33,802,155 |
| | |
Net Assets | | $ 836,912,711 |
Net Assets consist of: | | |
Paid in capital | | $ 750,053,488 |
Undistributed net investment income | | 6,000,914 |
Accumulated undistributed net realized gain (loss) on investments and foreign currency transactions | | (87,171,430) |
Net unrealized appreciation (depreciation) on investments and assets and liabilities in foreign currencies | | 168,029,739 |
Net Assets, for 33,325,024 shares outstanding | | $ 836,912,711 |
Net Asset Value, offering price and redemption price per share ($836,912,711 ÷ 33,325,024 shares) | | $ 25.11 |
Statement of Operations
| Year ended October 31, 2010 |
Investment Income | | |
Dividends | | $ 14,126,573 |
Interest | | 31 |
Income from Fidelity Central Funds | | 403,578 |
Income before foreign taxes withheld | | 14,530,182 |
Less foreign taxes withheld | | (732,967) |
Total income | | 13,797,215 |
| | |
Expenses | | |
Management fee
Basic fee | $ 4,925,603 | |
Performance adjustment | (135,706) | |
Transfer agent fees | 1,750,165 | |
Accounting and security lending fees | 343,861 | |
Custodian fees and expenses | 403,306 | |
Independent trustees' compensation | 3,975 | |
Registration fees | 41,960 | |
Audit | 79,772 | |
Legal | 3,700 | |
Interest | 294 | |
Miscellaneous | 8,804 | |
Total expenses before reductions | 7,425,734 | |
Expense reductions | (231,784) | 7,193,950 |
Net investment income (loss) | | 6,603,265 |
Realized and Unrealized Gain (Loss) Net realized gain (loss) on: | | |
Investment securities: | | |
Unaffiliated issuers | 58,845,097 | |
Foreign currency transactions | 282,778 | |
Total net realized gain (loss) | | 59,127,875 |
Change in net unrealized appreciation (depreciation) on: Investment securities (net of increase in deferred foreign taxes of $343,380) | 122,318,458 | |
Assets and liabilities in foreign currencies | 10,124 | |
Total change in net unrealized appreciation (depreciation) | | 122,328,582 |
Net gain (loss) | | 181,456,457 |
Net increase (decrease) in net assets resulting from operations | | $ 188,059,722 |
See accompanying notes which are an integral part of the financial statements.
Annual Report
Fidelity Pacific Basin Fund
Financial Statements - continued
Statement of Changes in Net Assets
| Year ended
October 31,
2010 | Year ended
October 31,
2009 |
Increase (Decrease) in Net Assets | | |
Operations | | |
Net investment income (loss) | $ 6,603,265 | $ 5,957,906 |
Net realized gain (loss) | 59,127,875 | (115,340,761) |
Change in net unrealized appreciation (depreciation) | 122,328,582 | 316,800,168 |
Net increase (decrease) in net assets resulting from operations | 188,059,722 | 207,417,313 |
Distributions to shareholders from net investment income | (4,570,702) | (2,101,108) |
Distributions to shareholders from net realized gain | (21,329,936) | - |
Total distributions | (25,900,638) | (2,101,108) |
Share transactions
Proceeds from sales of shares | 278,700,546 | 122,196,818 |
Reinvestment of distributions | 23,912,533 | 1,925,373 |
Cost of shares redeemed | (237,343,251) | (112,858,887) |
Net increase (decrease) in net assets resulting from share transactions | 65,269,828 | 11,263,304 |
Redemption fees | 274,534 | 236,555 |
Total increase (decrease) in net assets | 227,703,446 | 216,816,064 |
| | |
Net Assets | | |
Beginning of period | 609,209,265 | 392,393,201 |
End of period (including undistributed net investment income of $6,000,914 and undistributed net investment income of $3,855,931, respectively) | $ 836,912,711 | $ 609,209,265 |
Other Information Shares | | |
Sold | 12,592,586 | 7,310,963 |
Issued in reinvestment of distributions | 1,189,087 | 166,843 |
Redeemed | (11,097,905) | (7,402,907) |
Net increase (decrease) | 2,683,768 | 74,899 |
Financial Highlights
Years ended October 31, | 2010 | 2009 | 2008 | 2007 | 2006 |
Selected Per-Share Data | | | | | |
Net asset value, beginning of period | $ 19.88 | $ 12.84 | $ 37.32 | $ 27.36 | $ 22.42 |
Income from Investment Operations | | | | | |
Net investment income (loss) B | .21 | .20 | .22 | .22 | .16 |
Net realized and unrealized gain (loss) | 5.86 | 6.90 | (20.61) | 12.16 | 5.26 |
Total from investment operations | 6.07 | 7.10 | (20.39) | 12.38 | 5.42 |
Distributions from net investment income | (.15) | (.07) | (.22) | (.16) | (.18) |
Distributions from net realized gain | (.70) | - | (3.88) | (2.27) | (.32) |
Total distributions | (.85) | (.07) | (4.10) | (2.43) | (.50) |
Redemption fees added to paid in capital B | .01 | .01 | .01 | .01 | .02 |
Net asset value, end of period | $ 25.11 | $ 19.88 | $ 12.84 | $ 37.32 | $ 27.36 |
Total Return A | 31.65% | 55.77% | (61.02)% | 48.86% | 24.55% |
Ratios to Average Net Assets C, E | | | | | |
Expenses before reductions | 1.07% | .90% | 1.22% | 1.19% | 1.14% |
Expenses net of fee waivers, if any | 1.07% | .90% | 1.22% | 1.19% | 1.14% |
Expenses net of all reductions | 1.03% | .85% | 1.17% | 1.13% | 1.08% |
Net investment income (loss) | .95% | 1.30% | .89% | .71% | .60% |
Supplemental Data | | | | | |
Net assets, end of period (000 omitted) | $ 836,913 | $ 609,209 | $ 392,393 | $ 1,266,514 | $ 972,805 |
Portfolio turnover rate D | 66% | 91% | 73% | 91% | 75% |
A Total returns would have been lower had certain expenses not been reduced during the periods shown.
B Calculated based on average shares outstanding during the period.
C Fees and expenses of the underlying Fidelity Central Funds are not included in the Fund's expense ratio. The Fund indirectly bears its proportionate share of the expenses of any underlying Fidelity Central Funds.
D Amount does not include the portfolio activity of any underlying Fidelity Central Funds.
E Expense ratios reflect operating expenses of the Fund. Expenses before reductions do not reflect amounts reimbursed by the investment adviser or reductions from brokerage service arrangements or reductions from other expense offset arrangements and do not represent the amount paid by the Fund during periods when reimbursements or reductions occur. Expenses net of fee waivers reflect expenses after reimbursement by the investment adviser but prior to reductions from brokerage service arrangements or other expense offset arrangements. Expenses net of all reductions represent the net expenses paid by the Fund.
See accompanying notes which are an integral part of the financial statements.
Annual Report
Notes to Financial Statements
For the period ended October 31, 2010
1. Organization.
Fidelity Pacific Basin Fund (the Fund) is a fund of Fidelity Investment Trust (the Trust) and is authorized to issue an unlimited number of shares. The Trust is registered under the Investment Company Act of 1940, as amended (the 1940 Act), as an open-end management investment company organized as a Massachusetts business trust. The Fund's investments in emerging markets can be subject to social, economic, regulatory, and political uncertainties and can be extremely volatile.
2. Investments in Fidelity Central Funds.
The Fund may invest in Fidelity Central Funds, which are open-end investment companies available only to other investment companies and accounts managed by Fidelity Management & Research Company (FMR) and its affiliates. The Fund's Schedule of Investments lists each of the Fidelity Central Funds held as of period end, if any, as an investment of the Fund, but does not include the underlying holdings of each Fidelity Central Fund. As an Investing Fund, the Fund indirectly bears its proportionate share of the expenses of the underlying Fidelity Central Funds.
The Money Market Central Funds seek preservation of capital and current income and are managed by Fidelity Investments Money Management, Inc. (FIMM), an affiliate of FMR.
A complete unaudited list of holdings for each Fidelity Central Fund is available upon request or at the Securities and Exchange Commission (the SEC) web site at www.sec.gov. In addition, the financial statements of the Fidelity Central Funds, which are not covered by the Fund's Report of Independent Registered Public Accounting Firm, are available on the SEC web site or upon request.
3. Significant Accounting Policies.
The financial statements have been prepared in conformity with accounting principles generally accepted in the United States of America (GAAP), which require management to make certain estimates and assumptions at the date of the financial statements. Actual results could differ from those estimates. The following summarizes the significant accounting policies of the Fund:
Security Valuation. Investments are valued as of 4:00 p.m. Eastern time on the last calendar day of the period. The Fund uses independent pricing services approved by the Board of Trustees to value its investments. When current market prices or quotations are not readily available or reliable, valuations may be determined in good faith in accordance with procedures adopted by the Board of Trustees. Factors used in determining value may include market or security specific events. The frequency with which these procedures are used cannot be predicted and they may be utilized to a significant extent. The value used for net asset value (NAV) calculation under these procedures may differ from published prices for the same securities.
The Fund categorizes the inputs to valuation techniques used to value its investments into a disclosure hierarchy consisting of three levels as shown below.
Level 1 - quoted prices in active markets for identical investments
Level 2 - other significant observable inputs (including quoted prices for similar investments, interest rates, prepayment speeds, etc.)
Level 3 - unobservable inputs (including the fund's own assumptions based on the best information available)
Changes in valuation techniques may result in transfers in or out of an assigned level within the disclosure hierarchy. The aggregate value of investments by input level, as of October 31, 2010, as well as a roll forward of Level 3 securities, is included at the end of the Fund's Schedule of Investments. Valuation techniques used to value the Fund's investments by major category are as follows.
Equity securities, including restricted securities, for which market quotations are readily available, are valued at the last reported sale price or official closing price as reported by an independent pricing service on the primary market or exchange on which they are traded and are categorized as Level 1 in the hierarchy. In the event there were no sales during the day or closing prices are not available, securities are valued at the last quoted bid price or may be valued using the last available price and are generally categorized as Level 2 in the hierarchy. For foreign equity securities, when significant market or security specific events arise, comparisons to the valuation of American Depositary Receipts (ADRs), futures contracts, Exchange-traded funds (ETFs) and certain indexes as well as quoted prices for similar securities are used and are categorized as Level 2 in the hierarchy in these circumstances. Utilizing these techniques may result in significant transfers between Level 1 and Level 2. For restricted equity securities and private placements where observable inputs are limited, assumptions about market activity and risk are used and are categorized as Level 3 in the hierarchy.
Investments in open-end mutual funds, including the Fidelity Central Funds, are valued at their closing net asset value each business day and are categorized as Level 1 in the hierarchy. Short-term securities with remaining maturities of sixty days or less for which quotations are not readily available are valued at amortized cost, which approximates fair value and are categorized as Level 2 in the hierarchy.
Annual Report
3. Significant Accounting Policies - continued
Foreign Currency. The Fund uses foreign currency contracts to facilitate transactions in foreign-denominated securities. Gains and losses from these transactions may arise from changes in the value of the foreign currency or if the counterparties do not perform under the contracts' terms.
Foreign-denominated assets, including investment securities, and liabilities are translated into U.S. dollars at the exchange rate at period end. Purchases and sales of investment securities, income and dividends received and expenses denominated in foreign currencies are translated into U.S. dollars at the exchange rate in effect on the transaction date.
The effects of exchange rate fluctuations on investments are included with the net realized and unrealized gain (loss) on investment securities. Other foreign currency transactions resulting in realized and unrealized gain (loss) are disclosed separately.
Investment Transactions and Income. For financial reporting purposes, the Fund's investment holdings and NAV include trades executed through the end of the last business day of the period. The NAV per share for processing shareholder transactions is calculated as of the close of business of the New York Stock Exchange (NYSE), normally 4:00 p.m. Eastern time and includes trades executed through the end of the prior business day. Gains and losses on securities sold are determined on the basis of identified cost. Dividend income is recorded on the ex-dividend date, except for certain dividends from foreign securities where the ex-dividend date may have passed, which are recorded as soon as the Fund is informed of the ex-dividend date. Non-cash dividends included in dividend income, if any, are recorded at the fair market value of the securities received. Distributions received on securities that represent a return of capital or capital gain are recorded as a reduction of cost of investments and/or as a realized gain. The Fund estimates the components of distributions received that may be considered return of capital distributions or capital gain distributions. Interest income and distributions from the Fidelity Central Funds are accrued as earned. Interest income includes coupon interest and amortization of premium and accretion of discount on debt securities. Investment income is recorded net of foreign taxes withheld where recovery of such taxes is uncertain.
Expenses. Most expenses of the Trust can be directly attributed to a fund. Expenses which cannot be directly attributed are apportioned amongst each fund in the Trust. Expense estimates are accrued in the period to which they relate and adjustments are made when actual amounts are known.
Income Tax Information and Distributions to Shareholders. Each year the Fund intends to qualify as a regulated investment company, including distributing substantially all of its taxable income and realized gains under Subchapter M of the Internal Revenue Code and filing its U.S. federal tax return. As a result, no provision for income taxes is required. As of October 31, 2010, the Fund did not have any unrecognized tax benefits in the accompanying financial statements. A fund's federal tax return is subject to examination by the Internal Revenue Service (IRS) for a period of three years. Foreign taxes are provided for based on the Fund's understanding of the tax rules and rates that exist in the foreign markets in which it invests. The Fund is subject to a tax imposed on short term capital gains on securities of certain issuers domiciled in India. The Fund records an estimated deferred tax liability included in Other payables and accrued expenses in the accompanying Statement of Assets & Liabilities for net unrealized gains on these securities in an amount that would be payable if the securities were disposed of at period end.
Distributions are declared and recorded on the ex-dividend date. Income and capital gain distributions are determined in accordance with income tax regulations, which may differ from GAAP.
Capital accounts within the financial statements are adjusted for permanent book-tax differences. These adjustments have no impact on net assets or the results of operations. Temporary book-tax differences will reverse in a subsequent period.
Book-tax differences are primarily due to short-term gain distributions from the Fidelity Central Funds, foreign currency transactions, passive foreign investment companies (PFIC), deferred trustees compensation, capital loss carryforwards and losses deferred due to wash sales.
The federal tax cost of investment securities and unrealized appreciation (depreciation) as of period end were as follows:
Gross unrealized appreciation | $ 189,952,599 |
Gross unrealized depreciation | (57,302,608) |
Net unrealized appreciation (depreciation) | $ 132,649,991 |
| |
Tax Cost | $ 729,392,227 |
The tax-based components of distributable earnings as of period end were as follows:
Undistributed ordinary income | $ 28,395,099 |
Capital loss carryforward | $ (73,673,831) |
Net unrealized appreciation (depreciation) | $ 132,710,115 |
Annual Report
Notes to Financial Statements - continued
3. Significant Accounting Policies - continued
Income Tax Information and Distributions to Shareholders - continued
The tax character of distributions paid was as follows:
| October 31, 2010 | October 31, 2009 |
Ordinary Income | $ 25,900,638 | $ 2,101,108 |
Short-Term Trading (Redemption) Fees. Shares held by investors in the Fund less than 90 days are subject to a redemption fee equal to 1.50% of the net asset value of shares redeemed. All redemption fees, which reduce the proceeds of the shareholder redemption, are retained by the Fund and accounted for as an addition to paid in capital.
4. Purchases and Sales of Investments.
Purchases and sales of securities, other than short-term securities, aggregated $481,596,892 and $444,842,877, respectively.
5. Fees and Other Transactions with Affiliates.
Management Fee. FMR and its affiliates provide the Fund with investment management related services for which the Fund pays a monthly management fee. The management fee is the sum of an individual fund fee rate that is based on an annual rate of .45% of the Fund's average net assets and a group fee rate that averaged .26% during the period. The group fee rate is based upon the average net assets of all the mutual funds advised by FMR. The group fee rate decreases as assets under management increase and increases as assets under management decrease. In addition, the management fee is subject to a performance adjustment (up to a maximum of ± .20% of the Fund's average net assets over a 36 month performance period). The upward or downward adjustment to the management fee is based on the Fund's relative investment performance as compared to an appropriate benchmark index. For the period, the total annual management fee rate, including the performance adjustment, was .69% of the Fund's average net assets.
Transfer Agent Fees. Fidelity Investments Institutional Operations Company, Inc. (FIIOC), an affiliate of FMR, is the Fund's transfer, dividend disbursing and shareholder servicing agent. FIIOC receives account fees and asset-based fees that vary according to account size and type of account. FIIOC pays for typesetting, printing and mailing of shareholder reports, except proxy statements. For the period, the transfer agent fees were equivalent to an annual rate of .25% of average net assets.
Accounting and Security Lending Fees. Fidelity Service Company, Inc. (FSC), an affiliate of FMR, maintains the Fund's accounting records. The accounting fee is based on the level of average net assets for the month. Under a separate contract, FSC administers the security lending program. The security lending fee is based on the number and duration of lending transactions.
Brokerage Commissions. The Fund placed a portion of its portfolio transactions with brokerage firms which are affiliates of the investment adviser. The commissions paid to these affiliated firms were $203 for the period.
Interfund Lending Program. Pursuant to an Exemptive Order issued by the SEC, the Fund, along with other registered investment companies having management contracts with FMR, may participate in an interfund lending program. This program provides an alternative credit facility allowing the funds to borrow from, or lend money to, other participating affiliated funds. At period end, there were no interfund loans outstanding. The Fund's activity in this program during the period for which loans were outstanding was as follows:
Borrower or Lender | Average Daily
Loan Balance | Weighted Average
Interest Rate | Interest
Expense |
Borrower | $ 5,835,250 | .45% | $ 294 |
6. Committed Line of Credit.
The Fund participates with other funds managed by FMR or an affiliate in a $3.75 billion credit facility (the "line of credit") to be utilized for temporary or emergency purposes to fund shareholder redemptions or for other short-term liquidity purposes. The Fund has agreed to pay commitment fees on its pro-rata portion of the line of credit, which amounted to $2,665 and is reflected in Miscellaneous expenses on the Statement of Operations. During the period, there were no borrowings on this line of credit.
7. Security Lending.
The Fund lends portfolio securities through a lending agent from time to time in order to earn additional income. The lending agent may loan securities to certain qualified borrowers, including Fidelity Capital Markets (FCM), a broker-dealer affiliated with the Fund. On the settlement date of the loan,
Annual Report
7. Security Lending - continued
the Fund receives collateral (in the form of U.S. Treasury obligations, letters of credit and/or cash) against the loaned securities and maintains collateral in an amount not less than 100% of the market value of the loaned securities during the period of the loan. The market value of the loaned securities is determined at the close of business of the Fund and any additional required collateral is delivered to the Fund on the next business day. If the borrower defaults on its obligation to return the securities loaned because of insolvency or other reasons, a fund could experience delays and costs in recovering the securities loaned or in gaining access to the collateral. Any cash collateral received is invested in the Fidelity Securities Lending Cash Central Fund. The value of loaned securities and cash collateral at period end are disclosed on the Fund's Statement of Assets and Liabilities. Security lending income represents the income earned on investing cash collateral, less rebates paid to borrowers and lending agent fees associated with the loan, plus any premium payments received for lending certain types of securities. Security lending income is presented in the Statement of Operations as a component of income from Fidelity Central Funds. Total security lending income during the period amounted to $366,616. During the period, there were no securities loaned to FCM.
8. Expense Reductions.
Many of the brokers with whom FMR places trades on behalf of the Fund provided services to the Fund in addition to trade execution. These services included payments of certain expenses on behalf of the Fund totaling $231,784 for the period.
9. Other.
The Fund's organizational documents provide former and current trustees and officers with a limited indemnification against liabilities arising in connection with the performance of their duties to the Fund. In the normal course of business, the Fund may also enter into contracts that provide general indemnifications. The Fund's maximum exposure under these arrangements is unknown as this would be dependent on future claims that may be made against the Fund. The risk of material loss from such claims is considered remote.
Annual Report
Report of Independent Registered Public Accounting Firm
To the Trustees of Fidelity Investment Trust and the Shareholders of:
Fidelity Canada Fund,
Fidelity China Region Fund,
Fidelity Emerging Asia Fund (formerly Fidelity Southeast Asia Fund),
Fidelity Emerging Markets Fund,
Fidelity Europe Fund,
Fidelity Japan Fund,
Fidelity Japan Smaller Companies Fund,
Fidelity Latin America Fund,
Fidelity Nordic Fund,
Fidelity Pacific Basin Fund
In our opinion, the accompanying statement of assets and liabilities, including the schedule of investments, and the related statements of operations and of changes in net assets and the financial highlights present fairly, in all material respects, the financial position of Fidelity Canada Fund, Fidelity China Region Fund, Fidelity Emerging Asia Fund (formerly Fidelity Southeast Asia Fund), Fidelity Emerging Markets Fund, Fidelity Europe Fund, Fidelity Japan Fund, Fidelity Japan Smaller Companies Fund, Fidelity Latin America Fund, Fidelity Nordic Fund, and Fidelity Pacific Basin Fund, (funds of Fidelity Investment Trust) at October 31, 2010, the results of each of their operations for the year then ended, the changes in each of their net assets for each of the two years in the period then ended and the financial highlights for each of the periods indicated, in conformity with accounting principles generally accepted in the United States of America. These financial statements and financial highlights (hereafter referred to as "financial statements") are the responsibility of the Fidelity Investment Trust's management. Our responsibility is to express an opinion on these financial statements based on our audits. We conducted our audits of these financial statements in accordance with the standards of the Public Company Accounting Oversight Board (United States). Those standards require that we plan and perform the audit to obtain reasonable assurance about whether the financial statements are free of material misstatement. An audit includes examining, on a test basis, evidence supporting the amounts and disclosures in the financial statements, assessing the accounting principles used and significant estimates made by management, and evaluating the overall financial statement presentation. We believe that our audits, which included confirmation of securities at October 31, 2010 by correspondence with the custodian and brokers, provide a reasonable basis for our opinion.
/s/ PricewaterhouseCoopers LLP
PricewaterhouseCoopers LLP
Boston, Massachusetts
December 17, 2010
Annual Report
Report of Independent Registered Public Accounting Firm
To the Trustees of Fidelity Investment Trust and Shareholders of Fidelity Europe Capital Appreciation Fund:
We have audited the accompanying statement of assets and liabilities of Fidelity Europe Capital Appreciation Fund (the Fund), a fund of Fidelity Investment Trust, including the schedule of investments, as of October 31, 2010, and the related statement of operations for the year then ended, the statement of changes in net assets for each of the two years in the period then ended, and the financial highlights for each of the five years in the period then ended. These financial statements and financial highlights are the responsibility of the Fund's management. Our responsibility is to express an opinion on these financial statements and financial highlights based on our audits.
We conducted our audits in accordance with standards of the Public Company Accounting Oversight Board (United States). Those standards require that we plan and perform the audit to obtain reasonable assurance about whether the financial statements and financial highlights are free of material misstatement. The Fund is not required to have, nor were we engaged to perform, an audit of its internal control over financial reporting. Our audits included consideration of internal control over financial reporting as a basis for designing audit procedures that are appropriate in the circumstances, but not for the purpose of expressing an opinion on the effectiveness of the Fund's internal control over financial reporting. Accordingly, we express no such opinion. An audit also includes examining, on a test basis, evidence supporting the amounts and disclosures in the financial statements, assessing the accounting principles used and significant estimates made by management, as well as evaluating the overall financial statement presentation. Our procedures included confirmation of securities owned as of October 31, 2010, by correspondence with the custodians and brokers; where replies were not received from brokers, we performed other auditing procedures. We believe that our audits provide a reasonable basis for our opinion.
In our opinion, the financial statements and financial highlights referred to above present fairly, in all material respects, the financial position of Fidelity Europe Capital Appreciation Fund as of October 31, 2010, the results of its operations for the year then ended, the changes in its net assets for each of the two years in the period then ended, and the financial highlights for each of the five years in the period then ended, in conformity with accounting principles generally accepted in the United States of America.
/s/ Deloitte & Touche LLP
DELOITTE & TOUCHE LLP
Boston, Massachusetts
December 17, 2010
Annual Report
The Trustees, Member of the Advisory Board, and executive officers of the trust and funds, as applicable, are listed below. The Board of Trustees governs each fund and is responsible for protecting the interests of shareholders. The Trustees are experienced executives who meet periodically throughout the year to oversee each fund's activities, review contractual arrangements with companies that provide services to each fund, oversee management of the risks associated with such activities and contractual arrangements, and review each fund's performance. Except for James C. Curvey, each of the Trustees oversees 221 funds advised by FMR or an affiliate. Mr. Curvey oversees 410 funds advised by FMR or an affiliate.
The Trustees hold office without limit in time except that (a) any Trustee may resign; (b) any Trustee may be removed by written instrument, signed by at least two-thirds of the number of Trustees prior to such removal; (c) any Trustee who requests to be retired or who has become incapacitated by illness or injury may be retired by written instrument signed by a majority of the other Trustees; and (d) any Trustee may be removed at any special meeting of shareholders by a two-thirds vote of the outstanding voting securities of the trust. Each Trustee who is not an interested person (as defined in the 1940 Act) (Independent Trustee), shall retire not later than the last day of the calendar year in which his or her 72nd birthday occurs. The Independent Trustees may waive this mandatory retirement age policy with respect to individual Trustees. The executive officers and Advisory Board Member hold office without limit in time, except that any officer and Advisory Board Member may resign or may be removed by a vote of a majority of the Trustees at any regular meeting or any special meeting of the Trustees. Except as indicated, each individual has held the office shown or other offices in the same company for the past five years.
Experience, Skills, Attributes, and Qualifications of the Funds' Trustees. The Governance and Nominating Committee has adopted a statement of policy that describes the experience, qualifications, attributes, and skills that are necessary and desirable for potential Independent Trustee candidates (Statement of Policy). The Board believes that each Trustee satisfied at the time he or she was initially elected or appointed a Trustee, and continues to satisfy, the standards contemplated by the Statement of Policy. The Governance and Nominating Committee also engages professional search firms to help identify potential Independent Trustee candidates who have the experience, qualifications, attributes, and skills consistent with the Statement of Policy. From time to time, additional criteria based on the composition and skills of the current Independent Trustees, as well as experience or skills that may be appropriate in light of future changes to board composition, business conditions, and regulatory or other developments, have also been considered by the professional search firms and the Governance and Nominating Committee. In addition, the Board takes into account the Trustees' commitment and participation in Board and committee meetings, as well as their leadership of standing and ad hoc committees throughout their tenure.
In determining that a particular Trustee was and continues to be qualified to serve as a Trustee, the Board has considered a variety of criteria, none of which, in isolation, was controlling. The Board believes that, collectively, the Trustees have balanced and diverse experience, qualifications, attributes, and skills, which allow the Board to operate effectively in governing each fund and protecting the interests of shareholders. Information about the specific experience, skills, attributes, and qualifications of each Trustee, which in each case led to the Board's conclusion that the Trustee should serve (or continue to serve) as a trustee of the funds, is provided below.
Board Structure and Oversight Function. Edward C. Johnson 3d is an interested person (as defined in the 1940 Act) and currently serves as Chairman. The Trustees have determined that an interested Chairman is appropriate and benefits shareholders because an interested Chairman has a personal and professional stake in the quality and continuity of services provided to the funds. Independent Trustees exercise their informed business judgment to appoint an individual of their choosing to serve as Chairman, regardless of whether the Trustee happens to be independent or a member of management. The Independent Trustees have determined that they can act independently and effectively without having an Independent Trustee serve as Chairman and that a key structural component for assuring that they are in a position to do so is for the Independent Trustees to constitute a substantial majority for the Board. The Independent Trustees also regularly meet in executive session. Ned C. Lautenbach serves as Chairman of the Independent Trustees and as such (i) acts as a liaison between the Independent Trustees and management with respect to matters important to the Independent Trustees and (ii) with management prepares agendas for Board meetings.
Fidelity funds are overseen by different Boards of Trustees. The funds' Board oversees Fidelity's equity and high income funds and another Board oversees Fidelity's investment-grade bond, money market, and asset allocation funds. The asset allocation funds may invest in Fidelity funds overseen by the funds' Board. The use of separate Boards, each with its own committee structure, allows the Trustees of each group of Fidelity funds to focus on the unique issues of the funds they oversee, including common research, investment, and operational issues. On occasion, the separate Boards establish joint committees to address issues of overlapping consequences for the Fidelity funds overseen by each Board.
The Trustees operate using a system of committees to facilitate the timely and efficient consideration of all matters of importance to the Trustees, each fund, and fund shareholders and to facilitate compliance with legal and regulatory requirements and oversight of the funds' activities and associated risks. The Board, acting through its committees, has charged FMR and its affiliates with (i) identifying events or circumstances the occurrence of which could have demonstrably adverse effects on the funds' business and/or reputation; (ii) implementing processes and controls to lessen the possibility that such events or circumstances occur or to mitigate the effects of such events or circumstances if they do occur; and (iii) creating and maintaining a system designed to evaluate continuously business and market conditions in order to facilitate the identification and implementation processes described in (i) and (ii) above. Because the day-to-day operations and activities of the funds are carried out by or through FMR, its affiliates and other service providers, the funds' exposure to risks is mitigated but not eliminated by the processes overseen by the Trustees. While each of the Board's committees has responsibility for overseeing different aspects of the funds' activities, oversight is exercised primarily through the Operations, Audit, and Compliance Committees. Appropriate personnel, including but not limited to the funds' Chief Compliance Officer (CCO), FMR's internal auditor, the independent accountants, the funds' Treasurer and portfolio management personnel, make periodic reports to the Board's committees, as appropriate. The responsibilities of each committee, including their oversight responsibilities, are described further under "Standing Committees of the Funds' Trustees."
Annual Report
The funds' Statements of Additional Information (SAIs) include more information about the Trustees. To request a free copy, call Fidelity at 1-800-544-8544.
Interested Trustees*:
Correspondence intended for each Trustee who is an interested person may be sent to Fidelity Investments, 82 Devonshire Street, Boston, Massachusetts 02109.
Name, Age; Principal Occupations and Other Relevant Experience+ |
Edward C. Johnson 3d (80) |
| Year of Election or Appointment: 1984 Mr. Johnson is Trustee and Chairman of the Board of Trustees of certain Trusts. Mr. Johnson serves as Chief Executive Officer, Chairman, and a Director of FMR LLC; Chairman and a Director of FMR; Chairman and a Director of Fidelity Research & Analysis Company (FRAC); Chairman and a Director of Fidelity Investments Money Management, Inc.; and Chairman and a Director of FMR Co., Inc. In addition, Mr. Johnson serves as Chairman and Director of FIL Limited. Previously, Mr. Johnson served as President of FMR LLC (2006-2007). |
James C. Curvey (75) |
| Year of Election or Appointment: 2007 Mr. Curvey also serves as Trustee (2007-present) of other investment companies advised by FMR. Mr. Curvey is a Director of Fidelity Investments Money Management, Inc. (2009-present), Director of Fidelity Research & Analysis Co. (2009-present) and Director of FMR and FMR Co., Inc. (2007-present). Mr. Curvey is also Vice Chairman (2007-present) and Director of FMR LLC. In addition, Mr. Curvey serves as an Overseer for the Boston Symphony Orchestra and a member of the Trustees of Villanova University. Previously, Mr. Curvey was the Vice Chairman (2006-2007) and Director (2000-2007) of FMR Corp. |
* Trustees have been determined to be "Interested Trustees" by virtue of, among other things, their affiliation with the trust or various entities under common control with FMR.
+ The information above includes each Trustee's principal occupation during the last five years and other information relating to the experience, attributes, and skills relevant to each Trustee's qualifications to serve as a Trustee, which led to the conclusion that each Trustee should serve as a Trustee for each fund.
Independent Trustees:
Correspondence intended for each Independent Trustee (that is, the Trustees other than the Interested Trustees) may be sent to Fidelity Investments, P.O. Box 55235, Boston, Massachusetts 02205-5235.
Name, Age; Principal Occupations and Other Relevant Experience+ |
Dennis J. Dirks (62) |
| Year of Election or Appointment: 2005 Prior to his retirement in May 2003, Mr. Dirks was Chief Operating Officer and a member of the Board of The Depository Trust & Clearing Corporation (DTCC). He also served as President, Chief Operating Officer, and Board member of The Depository Trust Company (DTC) and President and Board member of the National Securities Clearing Corporation (NSCC). In addition, Mr. Dirks served as Chief Executive Officer and Board member of the Government Securities Clearing Corporation, Chief Executive Officer and Board member of the Mortgage-Backed Securities Clearing Corporation, as a Trustee and a member of the Finance Committee of Manhattan College (2005-2008), and as a Trustee and a member of the Finance Committee of AHRC of Nassau County (2006-2008). Mr. Dirks is a member of the Independent Directors Council (IDC) Governing Council (2010-Present) and Board of Directors for The Brookville Center for Children's Services, Inc. (2009-present). |
Alan J. Lacy (57) |
| Year of Election or Appointment: 2008 Mr. Lacy serves as Senior Adviser (2007-present) of Oak Hill Capital Partners, L.P. (private equity). Mr. Lacy also served as Chief Executive Officer (2000-2005) and Vice Chairman (2005-2006) of Sears Holdings Corporation and Sears, Roebuck and Co. (retail). In addition, Mr. Lacy serves as a member of the Board of Directors of The Western Union Company (global money transfer, 2006-present) and Bristol-Myers Squibb Company (global pharmaceuticals, 2007-present). Mr. Lacy is Chairman (2008-present) and a member (2006-present) of the Board of Trustees of The National Parks Conservation Association. |
Ned C. Lautenbach (66) |
| Year of Election or Appointment: 2000 Mr. Lautenbach is Chairman of the Independent Trustees of the Equity and High Income Funds (2006-present). Mr. Lautenbach currently serves as the Lead Director of the Eaton Corporation Board of Directors (diversified industrial, 1997-present). Mr. Lautenbach is also a member of the Board of Directors of the Philharmonic Center for the Arts in Naples, Florida (1999-present); a member of the Board of Trustees of Fairfield University (2005-present); and a member of the Council on Foreign Relations (1994-present). Previously, Mr. Lautenbach was a Partner/Advisory Partner at Clayton, Dubilier & Rice, Inc. (private equity investment, 1998-2010), as well as a Director of Sony Corporation (2006-2007). |
Joseph Mauriello (66) |
| Year of Election or Appointment: 2008 Prior to his retirement in January 2006, Mr. Mauriello served in numerous senior management positions including Deputy Chairman and Chief Operating Officer (2004-2005), and Vice Chairman of Financial Services (2002-2004) of KPMG LLP US (professional services, 1965-2005). Mr. Mauriello currently serves as a member of the Board of Directors of XL Group plc. (global insurance and re-insurance, 2006-present) and of Arcadia Resources Inc. (health care services and products, 2007-present). Previously, Mr. Mauriello served as a Director of the Hamilton Funds of the Bank of New York (2006-2007). |
Cornelia M. Small (66) |
| Year of Election or Appointment: 2005 Ms. Small is a member of the Board of Directors of the Teagle Foundation (2009-present). Ms. Small is also a member of the Investment Committee, and Chair (2008-present) and a member of the Board of Trustees of Smith College. In addition, Ms. Small serves on the Investment Committee of the Berkshire Taconic Community Foundation (2008-present). Previously, Ms. Small served as Chairperson of the Investment Committee (2002-2008) of Smith College. In addition, Ms. Small served as Chief Investment Officer, Director of Global Equity Investments, and a member of the Board of Directors of Scudder, Stevens & Clark and Scudder Kemper Investments. |
William S. Stavropoulos (71) |
| Year of Election or Appointment: 2001 Mr. Stavropoulos is Vice Chairman of the Independent Trustees of the Equity and High Income Funds (2006-present). Mr. Stavropoulos serves as President and Founder of the Michigan Baseball Foundation, the Great Lakes Loons (2007-present). Mr. Stavropoulos is Chairman Emeritus of the Board of Directors of The Dow Chemical Company, where he previously served in numerous senior management positions, including President, CEO (1995-2000; 2002-2004), Chairman of the Executive Committee (2000-2006), and as a member of the Board of Directors (1990-2006). Currently, Mr. Stavropoulos is Chairman of Univar (global distributor of commodity and specialty chemicals, 2010-present), a Director of Teradata Corporation (data warehousing and technology solutions, 2008-present), Chemical Financial Corporation, Maersk Inc. (industrial conglomerate), Tyco International, Inc. (multinational manufacturing and services, 2007-present), and a member of the Advisory Board for Metalmark Capital (private equity investment, 2005-present). Mr. Stavropoulos is a special advisor to Clayton, Dubilier & Rice, Inc. (private equity investment). In addition, Mr. Stavropoulos is a member of the University of Notre Dame Advisory Council for the College of Science. |
David M. Thomas (61) |
| Year of Election or Appointment: 2008 Previously, Mr. Thomas served as Executive Chairman (2005-2006) and Chairman and Chief Executive Officer (2000-2005) of IMS Health, Inc. (pharmaceutical and healthcare information solutions). In addition, Mr. Thomas serves as a member of the Board of Directors of Fortune Brands, Inc. (consumer products), and Interpublic Group of Companies, Inc. (marketing communication, 2004-present). |
Michael E. Wiley (60) |
| Year of Election or Appointment: 2008 Mr. Wiley also serves as a Director of Asia Pacific Exploration Consolidated (international oil and gas exploration and production, 2008-present). Mr. Wiley serves as a Director of Tesoro Corporation (independent oil refiner and marketer, 2005-present), and a Director of Bill Barrett Corporation (exploration and production, 2005-present). In addition, Mr. Wiley also serves as a Director of Post Oak Bank (privately-held bank, 2004-present). Previously, Mr. Wiley served as a member of the Board of Trustees of the University of Tulsa (2000-2006; 2007-2010), as a Senior Energy Advisor of Katzenbach Partners, LLC (consulting, 2006-2007), as an Advisory Director of Riverstone Holdings (private investment), Chairman, President, and CEO of Baker Hughes, Inc. (oilfield services, 2000-2004), and as Director of Spinnaker Exploration Company (exploration and production, 2001-2005). |
+ The information above includes each Trustee's principal occupation during the last five years and other information relating to the experience, attributes, and skills relevant to each Trustee's qualifications to serve as a Trustee, which led to the conclusion that each Trustee should serve as a Trustee for each fund.
Annual Report
Advisory Board Member and Executive Officers:
Correspondence intended for each executive officer and Peter S. Lynch may be sent to Fidelity Investments, 82 Devonshire Street, Boston, Massachusetts 02109.
Name, Age; Principal Occupation |
Peter S. Lynch (66) |
| Year of Election or Appointment: 2003 Member of the Advisory Board of Fidelity's Equity and High Income Funds. Mr. Lynch is Vice Chairman and a Director of FMR and FMR Co., Inc. In addition, Mr. Lynch serves as a Trustee of Boston College and as the Chairman of the Inner-City Scholarship Fund. Previously, Mr. Lynch served on the Special Olympics International Board of Directors (1997-2006). |
Kenneth B. Robins (41) |
| Year of Election or Appointment: 2008 President and Treasurer of Fidelity's Equity and High Income Funds. Mr. Robins also serves as President and Treasurer (2010-present) and Assistant Treasurer (2009-present) of other Fidelity funds and is an employee of Fidelity Investments (2004-present). Previously, Mr. Robins served as Deputy Treasurer of the Fidelity funds (2005-2008) and Treasurer and Chief Financial Officer of The North Carolina Capital Management Trust: Cash and Term Portfolios (2006-2008). |
Bruce T. Herring (45) |
| Year of Election or Appointment: 2006 Vice President of certain Equity Funds. Mr. Herring also serves as Chief Investment Officer and Director of Fidelity Management & Research (U.K.) Inc. (2010-present) and Group Chief Investments Officer of FMR. Previously, Mr. Herring served as Vice President (2005-2006) and Senior Vice President (2006-2007) of Fidelity Management & Research Company, Vice President of FMR Co., Inc. (2001-2007) and as a portfolio manager for Fidelity U.S. Equity Funds. |
Brian B. Hogan (46) |
| Year of Election or Appointment: 2009 Vice President of certain Equity Funds and Vice President of Sector Funds. Mr. Hogan also serves as President of FMR's Equity Division (2009-present). Previously, Mr. Hogan served as Senior Vice President, Equity Research of FMR (2006-2009) and as a portfolio manager. |
Thomas C. Hense (46) |
| Year of Election or Appointment: 2008 or 2010 Vice President of Fidelity's High Income (2008), Small Cap (2008), and Value (2010) Funds. Previously, Mr. Hense served as a portfolio manager for Fidelity's Institutional Money Management Group (Pyramis) (2003-2008). |
Scott C. Goebel (42) |
| Year of Election or Appointment: 2008 Secretary and Chief Legal Officer (CLO) of the Fidelity funds. Mr. Goebel also serves as Secretary and CLO of The North Carolina Capital Management Trust: Cash and Term Portfolio (2008-present); General Counsel, Secretary, and Senior Vice President of FMR (2008-present) and FMR Co., Inc. (2008-present); Deputy General Counsel of FMR LLC; Chief Legal Officer of Fidelity Management & Research (Hong Kong) Limited (2008-present) and Assistant Secretary of Fidelity Management & Research (Japan) Inc. (2008-present), Fidelity Investments Money Management, Inc. (2008-present), Fidelity Management & Research (U.K.) Inc. (2008-present), and Fidelity Research and Analysis Company (2008-present). Previously, Mr. Goebel served as Assistant Secretary of the Funds (2007-2008) and as Vice President and Secretary of Fidelity Distributors Corporation (FDC) (2005-2007). |
William C. Coffey (41) |
| Year of Election or Appointment: 2009 Assistant Secretary of Fidelity's Equity and High Income Funds. Mr. Coffey also serves as Senior Vice President and Deputy General Counsel of FMR LLC (2010-present), and is an employee of Fidelity Investments. Previously, Mr. Coffey served as Vice President and Associate General Counsel of FMR LLC (2005-2009). |
Holly C. Laurent (56) |
| Year of Election or Appointment: 2008 Anti-Money Laundering (AML) Officer of the Fidelity funds. Ms. Laurent also serves as AML Officer of The North Carolina Capital Management Trust: Cash and Term Portfolio (2008-present) and is an employee of Fidelity Investments. Previously, Ms. Laurent was Senior Vice President and Head of Legal for Fidelity Business Services India Pvt. Ltd. (2006-2008), and Senior Vice President, Deputy General Counsel and Group Head for FMR LLC (2005-2006). |
Christine Reynolds (52) |
| Year of Election or Appointment: 2008 Chief Financial Officer of the Fidelity funds. Ms. Reynolds became President of Fidelity Pricing and Cash Management Services (FPCMS) in August 2008. Ms. Reynolds served as Chief Operating Officer of FPCMS (2007-2008). Previously, Ms. Reynolds served as President, Treasurer, and Anti-Money Laundering officer of the Fidelity funds (2004-2007). |
Kenneth A. Rathgeber (63) |
| Year of Election or Appointment: 2004 Chief Compliance Officer of Fidelity's Equity and High Income Funds. Mr. Rathgeber is Chief Compliance Officer of Fidelity Management & Research (Hong Kong) Limited (2008-present), Fidelity Management & Research (Japan) Inc. (2008-present), FMR (2005-present), FMR Co., Inc. (2005-present), Fidelity Management & Research (U.K.) Inc. (2005-present), Fidelity Research & Analysis Company (2005-present), Fidelity Investments Money Management, Inc. (2005-present), Pyramis Global Advisors, LLC (2005-present), and Strategic Advisers, Inc. (2005-present). |
Jeffrey S. Christian (49) |
| Year of Election or Appointment: 2009 Deputy Treasurer of the Fidelity funds. Mr. Christian is an employee of Fidelity Investments. Previously, Mr. Christian served as Chief Financial Officer (2008-2009) of certain Fidelity funds and Senior Vice President of Fidelity Pricing and Cash Management Services (FPCMS) (2004-2009). |
Bryan A. Mehrmann (49) |
| Year of Election or Appointment: 2005 Deputy Treasurer of the Fidelity funds. Mr. Mehrmann is an employee of Fidelity Investments. |
Adrien E. Deberghes (43) |
| Year of Election or Appointment: 2008 Deputy Treasurer of Fidelity's Equity and High Income Funds. Mr. Deberghes also serves as Assistant Treasurer of other Fidelity funds (2010-present) and is an employee of Fidelity Investments (2008-present). Previously, Mr. Deberghes served as Senior Vice President of Mutual Fund Administration at State Street Corporation (2007-2008), Senior Director of Mutual Fund Administration at Investors Bank & Trust (2005-2007), and Director of Finance for Dunkin' Brands (2000-2005). |
Stephanie J. Dorsey (41) |
| Year of Election or Appointment: 2010 Assistant Treasurer of Fidelity's Equity and High Income Funds. Ms. Dorsey also serves as Deputy Treasurer of other Fidelity funds (2008-present) and is an employee of Fidelity Investments (2008-present). Previously, Ms. Dorsey served as Treasurer (2004-2008) of the JPMorgan Mutual Funds and Vice President (2004-2008) of JPMorgan Chase Bank. |
John R. Hebble (52) |
| Year of Election or Appointment: 2009 Assistant Treasurer of Fidelity's Equity and High Income Funds. Mr. Hebble also serves as Treasurer and Chief Financial Officer of The North Carolina Capital Management Trust: Cash and Term Portfolio (2008-present), President and Treasurer of other Fidelity funds (2008-present) and is an employee of Fidelity Investments. |
Gary W. Ryan (52) |
| Year of Election or Appointment: 2005 Assistant Treasurer of the Fidelity funds. Mr. Ryan is an employee of Fidelity Investments. Previously, Mr. Ryan served as Vice President of Fund Reporting in Fidelity Pricing and Cash Management Services (FPCMS) (1999-2005). |
Jonathan Davis (42) |
| Year of Election or Appointment: 2010 Assistant Treasurer of the Fidelity funds. Mr. Davis is an employee of Fidelity Investments. Previously, Mr. Davis served as Vice President and Associate General Counsel of FMR LLC (2003-2010). |
Annual Report
The Board of Trustees of each fund voted to pay to shareholders of record at the opening of business on record date, the following distributions per share derived from capital gains realized from sales of portfolio securities, and dividends derived from net investment income:
| Pay Date | Record Date | Dividends | Capital Gains |
Fidelity Canada Fund | 12/06/10 | 12/03/10 | $0.447 | $0.441 |
Fidelity China Region Fund | 12/06/10 | 12/03/10 | $0.376 | $0.025 |
Fidelity Emerging Markets Fund | 12/06/10 | 12/03/10 | $0.244 | $0.129 |
Fidelity Europe Fund | 12/06/10 | 12/03/10 | $0.665 | - |
Fidelity Europe Capital Appreciation Fund | 12/06/10 | 12/03/10 | $0.175 | - |
Fidelity Japan Fund | 12/13/10 | 12/10/10 | $0.195 | $0.211 |
Fidelity Japan Smaller Companies Fund | 12/06/10 | 12/03/10 | $0.045 | $0.095 |
Fidelity Latin America Fund | 12/06/10 | 12/03/10 | $0.261 | $0.200 |
Fidelity Nordic Fund | 12/06/10 | 12/03/10 | $0.285 | - |
Fidelity Pacific Basin Fund | 12/06/10 | 12/03/10 | $0.200 | $0.660 |
Fidelity Emerging Asia Fund | 12/06/10 | 12/03/10 | $0.485 | $0.105 |
A percentage of the dividends distributed during the fiscal year for the following funds may be taken into account as a dividend for purposes of the maximum rate under section 1(h)(11) of the Internal Revenue Code.
| November 27, 2009 | December 4, 2009 | December 30, 2009 | September 29, 2010 |
Fidelity Canada Fund | - | 100% | - | - |
Fidelity China Region Fund | - | 39% | - | - |
Fidelity Emerging Markets Fund | - | 71% | - | - |
Fidelity Europe Fund | 96% | 96% | - | - |
Fidelity Europe Fund: Class F | 92% | - | - | - |
Fidelity Europe Capital Appreciation Fund | - | 95% | - | - |
Fidelity Japan Fund | - | 79% | - | - |
Fidelity Japan Smaller Companies Fund | - | 56% | - | - |
Fidelity Latin America Fund | - | 65% | 83% | 100% |
Fidelity Emerging Asia Fund | - | 22% | - | - |
Fidelity Emerging Asia Fund: Class F | - | 21% | - | - |
Fidelity Nordic Fund | - | 86% | - | - |
Fidelity Pacific Basin Fund | - | 20% | - | - |
The amounts per share which represent income derived from sources within, and taxes paid to, foreign countries or possessions of the United States are as follows:
Fund | Pay Date | Income | Taxes |
Fidelity Canada Fund | 12/07/09 | $0.555 | $0.0866 |
Fidelity China Region Fund | 12/07/09 | $0.305 | $0.0314 |
Fidelity Emerging Markets Fund | 12/07/09 | $0.167 | $0.0258 |
Fidelity Europe Fund | 11/30/09 | $0.508 | $0.0427 |
Fidelity Europe Fund: Class F | 11/30/09 | $0.535 | $0.0427 |
Fidelity Europe Capital Appreciation Fund | 12/07/09 | $0.294 | $0.0282 |
Fidelity Japan Fund | 12/07/09 | $0.076 | $0.0127 |
Fidelity Japan Smaller Companies Fund | 12/07/09 | $0.052 | $0.0070 |
Fidelity Latin America Fund | 12/07/09 | $0.564 | $0.0791 |
Fidelity Latin America Fund | 12/31/09 | $0.048 | $0.0000 |
Fidelity Latin America Fund | 09/30/10 | $0.686 | $0.0948 |
Fidelity Nordic Fund | 12/07/09 | $0.393 | $0.0533 |
Fidelity Pacific Basin Fund | 12/07/09 | $0.233 | $0.0184 |
Fidelity Emerging Asia Fund | 12/07/09 | $0.876 | $0.0612 |
Fidelity Emerging Asia Fund: Class F | 12/07/09 | $0.912 | $0.0612 |
The fund will notify shareholders in January 2011 of amounts for use in preparing 2010 income tax returns.
Annual Report
A special meeting of Fidelity Emerging Asia Fund (formerly Fidelity Southeast Asia Fund) shareholders was held on November 16, 2010. The results of votes taken among shareholders on the proposals before them are reported below. Each vote reported represents one dollar of net asset value held on the record date for the meeting.
PROPOSAL 1 |
To approve a change in the performance adjustment index for the fund. |
| # of
Votes | % of
Votes |
Affirmative | 762,743,251.15 | 89.962 |
Against | 54,698,229.87 | 6.451 |
Abstain | 24,743,409.13 | 2.919 |
Uninstructed | 5,663,975.59 | 0.668 |
TOTAL | 847,848,865.74 | 100.000 |
PROPOSAL 2 |
To authorize the Trustees to change the performance adjustment index for the fund in the future without a shareholder vote. |
| # of
Votes | % of
Votes |
Affirmative | 604,723,907.38 | 71.324 |
Against | 207,016,787.49 | 24.417 |
Abstain | 30,444,195.28 | 3.591 |
Uninstructed | 5,663,975.59 | 0.668 |
TOTAL | 847,848,865.74 | 100.000 |
Annual Report
Board Approval of Investment Advisory Contracts and Management Fees
Fidelity Emerging Asia Fund (formerly known as Fidelity Southeast Asia Fund)
On July 14, 2010, the Board of Trustees, including the Independent Trustees (together, the Board), voted to approve an amended management contract (the Amended Contract) for the fund and to submit the Amended Contract to shareholders for their approval. If approved by shareholders, the Amended Contract will prospectively change the index used to calculate the fund's performance adjustment from the MSCI AC (All Country) Far East ex Japan Index (the Current Index) to the MSCI AC (All Country) Asia ex Japan Index (the Proposed Index). The Amended Contract also will allow the Board to change the fund's performance adjustment index in the future without a shareholder vote, if applicable law permits the Board to do so. The Board, assisted by the advice of fund counsel and Independent Trustees' counsel, considered a broad range of information.
In considering whether to approve the Amended Contract for the fund, the Board reached a determination, with the assistance of fund counsel and Independent Trustees' counsel and through the exercise of its business judgment, that the approval of the Amended Contract and the compensation to be received by Fidelity under the management contract is in the best interest of fund shareholders and consistent with Fidelity's fiduciary duty under applicable law. The Board, in reaching its determination to approve the Amended Contract, was aware that shareholders in the fund have a broad range of investment choices available to them, including a wide choice among mutual funds offered by Fidelity's competitors, and that the fund's shareholders, with the opportunity to review and weigh the disclosure provided by the fund in its prospectus and other public disclosures, have chosen to invest in this fund, managed by Fidelity.
Nature, Extent, and Quality of Services Provided. The Board considered the nature, extent, quality, and cost of advisory, administrative, distribution, and shareholder services performed by the investment adviser, FMR, and the sub-advisers, and by affiliated companies.
Shareholder and Administrative Services. The Board noted that the growth of fund assets over time across the complex allows Fidelity to reinvest in the development of services designed to enhance the value or convenience of the Fidelity funds as investment vehicles. These services include 24-hour access to account information and market information through phone representatives and over the Internet, and investor education materials and asset allocation tools.
Investment in a Large Fund Family. The Board considered the benefits to shareholders of investing in a Fidelity fund, including the benefits of investing in a fund that is part of a large family of funds offering a variety of investment disciplines and providing a large variety of mutual fund investor services.
Investment Performance. In determining whether the Proposed Index is an appropriate index against which to measure the fund's investment performance, the Board considered that, consistent with the fund's proposed new name and modified investment policies, FMR would allocate the fund's investments across different Asian countries with emerging markets. The Board also considered that because the Proposed Index includes securities of issuers from India in addition to those of the same countries included in the Current Index, it will provide a more meaningful performance comparison for the fund under its new investment strategy.
The Board considered the rolling 36-month returns of the fund's retail class compared to the rolling 36-month returns of the Current Index and the Proposed Index over the last three years ended April 30, 2010. The Board noted that the fund outperformed and underperformed the Current Index and the Proposed Index at different times over the rolling 36-month period ended April 30, 2010.
The Board considered the performance of the Current Index compared to the performance of the Proposed Index over the past ten calendar years and for the five months ended May 31, 2010. The Board noted that the two indices have performed differently at times over the period, with the Proposed Index outperforming the Current Index in eight of the past ten calendar years. The Board also noted that the Proposed Index outperformed the Current Index over the 10-year period ended May 31, 2010 and that the fund's retail class outperformed the Current Index in five of the past ten calendar years, and outperformed the Proposed Index in seven of the past ten calendar years. The Board recognized that past performance would have no impact on performance in the future. The Board recognized that, in connection with its annual renewal of the fund's current management contract and sub-advisory agreements at its July 2010 meeting, the Board had reviewed the fund's retail class returns and the returns of the Current Index over the one-, three-, and five-year periods ended December 31, 2009, and had noted that the relative investment performance of the fund's retail class was higher than the Current Index for the five-year period, although the fund's one-year and three-year cumulative returns were lower than the Current Index.
The Board also noted that the Amended Contract would give the Board the ability to designate an alternative appropriate index for the fund without the delay and expense of having first to conduct a proxy solicitation, if applicable law would permit the Board to do so.
Based on its review, the Board concluded that the nature, extent, and quality of the services provided to the fund will benefit the fund's shareholders, particularly in light of the Board's view that the fund's shareholders benefit from investing in a fund that is part of a large family of funds offering a variety of investment disciplines and services.
Competitiveness of Management Fee and Total Fund Expenses. The Board considered that, because the change in the index used to calculate the fund's performance adjustment will be implemented prospectively, the future impact on management fees will depend solely on the fund's future performance relative to the Proposed Index.
Annual Report
Nonetheless, the Board considered the management fee that the fund incurred under the current management contract (with the Current Index) for the fund's fiscal year-ended October 31, 2009 and the 12-month period ended April 30, 2010, compared to the hypothetical management fee that the fund would have incurred if the Amended Contract (with the Proposed Index) had been in effect during those periods.
The Board noted that, under the current management contract, the fund's basic fee was increased by a slightly positive performance adjustment of approximately one basis point and that, if the Amended Contract had been in effect during the fiscal year-ended October 31, 2009, the fund's basic fee would have been decreased by a negative performance adjustment of 2.3 basis points. As a result, the fund's hypothetical management fee would have been 3.3 basis points ($522,302) lower if the Amended Contract had been in effect during that period. The Board noted that the fund outperformed the Current Index and underperformed the Proposed Index over that period.
The Board noted that, under the current management contract, the fund's basic fee was decreased by a negative performance adjustment of 25.6 basis points and that, if the Amended Contract had been in effect during the 12-month period ended April 30, 2010, the fund's basic fee would have been decreased by a negative performance adjustment of 28.6 basis points. As a result, the fund's hypothetical management fee would have been 3.0 basis points ($524,908) lower if the Amended Contract had been in effect during that period. The Board noted that the fund underperformed both the Current Index and the Proposed Index over that period.
Based on its review, the Board concluded that the fund's management fee was in the best interest of fund shareholders and consistent with Fidelity's fiduciary duty under applicable law in light of the services that the fund receives and the other factors considered.
Because the fund's management fee impacts the fund's total expenses - and because the future impact on management fees will depend solely on the fund's future performance relative to the Proposed Index - the Board will review the fund's total expenses compared to competitive fund median expenses in connection with its future renewal of the fund's management contract and sub-advisory agreements.
In its review, the Board also noted that at its July meeting it received and considered materials relating to its review of total expenses for the fund in connection with its renewal of the fund's current management contract. This information included Fidelity fee structures and other information on clients that FMR and its affiliates service in other competitive markets, such as other mutual funds advised or subadvised by FMR or its affiliates, pension plan clients, and other institutional clients.
Costs of the Services and Profitability. Because the Board was approving an arrangement under which the management fee that the fund pays FMR will depend solely on the fund's future performance relative to the Proposed Index, it did not consider data regarding the impact on Fidelity's costs of services, revenues, or profitability from the new arrangement to be a significant factor in its decision.
In connection with its future renewal of the fund's management contract and sub-advisory agreements, the Board will consider the revenues earned and the expenses incurred by Fidelity in conducting the business of developing, marketing, distributing, managing, administering and servicing the fund and its shareholders.
Economies of Scale. The Board recognized that the fund's Amended Contract, like the current contract, incorporates a "group fee" structure, which provides for lower group fee rates as total fund assets under FMR's management increase, and for higher group fee rates as total fund assets under FMR's management decrease. FMR calculates the group fee rates based on a tiered asset "breakpoint" schedule that varies based on asset class. The Board considered that the group fee is designed to deliver the benefits of economies of scale to fund shareholders when total fund assets increase, even if assets of any particular fund are unchanged or have declined, because some portion of Fidelity's costs are attributable to services provided to all Fidelity funds, and all funds benefit if those costs can be allocated among more assets. The Board concluded that, given the group fee structure, fund shareholders will benefit from lower management fees as assets under FMR's management increase at the fund complex level, regardless of whether Fidelity achieves any such economies of scale.
In connection with its future renewal of the fund's management contract and sub-advisory agreements, the Board will consider whether there have been economies of scale in respect of the management of the Fidelity funds, whether the Fidelity funds (including the fund) have appropriately benefited from any such economies of scale, and whether there is potential for realization of any further economies of scale.
Based on its evaluation of all of the conclusions noted above, and after considering all factors it believed relevant, the Board ultimately concluded that the Amended Contract is in the best interest of fund shareholders and consistent with Fidelity's fiduciary duty under applicable law, and that the Amended Contract should be approved and submitted to shareholders for their approval.
Annual Report
Board Approval of Investment Advisory Contracts and Management Fees
Targeted International Equity Funds
Each year, the Board of Trustees, including the Independent Trustees (together, the Board), votes on the renewal of the management contract and sub-advisory agreements (together, the Advisory Contracts) for each fund. The Board, assisted by the advice of fund counsel and Independent Trustees' counsel, requests and considers a broad range of information relevant to the renewal of the Advisory Contracts throughout the year.
The Board meets regularly and considers at each of its meetings factors that are relevant to its annual consideration of the renewal of each fund's Advisory Contracts, including the services and support provided to each fund and its shareholders. The Board has established various standing committees, each composed of Independent Trustees with varying backgrounds, to which the Board has assigned specific subject matter responsibilities in order to enhance effective decision-making by the Board. The Board, acting directly and through its Committees, requests and receives information concerning the annual consideration of the renewal of each fund's Advisory Contracts. The Board also meets as needed to consider matters specifically related to the Board's annual consideration of the renewal of Advisory Contracts. Members of the Board may also meet with trustees of other Fidelity funds through ad hoc joint committees to discuss certain matters relevant to the Fidelity funds.
At its July 2010 meeting, the Board of Trustees, including the Independent Trustees, unanimously determined to renew each fund's Advisory Contracts. In reaching its determination, the Board considered all factors it believed relevant, including (i) the nature, extent, and quality of the services to be provided to each fund and its shareholders (including the investment performance of each fund); (ii) the competitiveness of each fund's management fee and total expenses; (iii) the total costs of the services to be provided by and the profits to be realized by Fidelity from its relationship with each fund; (iv) the extent to which economies of scale would be realized as each fund grows; and (v) whether fee levels reflect these economies of scale, if any, for the benefit of fund shareholders.
In considering whether to renew the Advisory Contracts for each fund, the Board reached a determination, with the assistance of fund counsel and Independent Trustees' counsel and through the exercise of its business judgment, that the renewal of the Advisory Contracts is in the best interests of fund shareholders and that the compensation to be received by Fidelity under the management contracts is fair and reasonable. The Board's decision to renew the Advisory Contracts was not based on any single factor noted above, but rather was based on a comprehensive consideration of all the information provided to the Board at its meetings throughout the year. The Board, in reaching its determination to renew the Advisory Contracts, is aware that shareholders in each fund have a broad range of investment choices available to them, including a wide choice among mutual funds offered by Fidelity's competitors, and that each fund's shareholders, with the opportunity to review and weigh the disclosure provided by the fund in its prospectus and other public disclosures, have chosen to invest in that fund, managed by Fidelity.
Nature, Extent, and Quality of Services Provided. The Board considered the staffing within the investment adviser, FMR, and the sub-advisers (together, the Investment Advisers), including the backgrounds of the funds' investment personnel and the funds' investment objectives and disciplines. The Independent Trustees also had discussions with senior management of Fidelity's investment operations and investment groups. The Board considered the structure of the portfolio manager compensation program and whether this structure provides appropriate incentives to act in the best interest of each fund.
Resources Dedicated to Investment Management and Support Services. The Board and the equity research subcommittee of the Board's Fund Oversight Committee reviewed the size, education, and experience of the Investment Advisers' investment staff, their use of technology, and the Investment Advisers' approach to recruiting, training, and retaining portfolio managers and other research, advisory, and management personnel. The Board noted that Fidelity's analysts have access to a variety of technological tools and market and securities data that enable them to perform both fundamental and quantitative analysis and to specialize in various disciplines. The Board considered Fidelity's extensive global research capabilities that enable the Investment Advisers to aggregate data from various sources in an effort to produce positive investment results. The Board also considered that Fidelity's portfolio managers and analysts have access to daily portfolio attribution that allows for monitoring of a fund's portfolio, as well as an electronic communication system that provides immediate real-time access to research concerning issuers and credit enhancers. The Board noted FMR's continued focus on strengthening the organization and discipline of equity portfolio management and research.
Shareholder and Administrative Services. The Board considered (i) the nature, extent, quality, and cost of advisory, administrative, and shareholder services performed by the Investment Advisers and their affiliates under the Advisory Contracts and under separate agreements covering transfer agency, pricing and bookkeeping, and securities lending services for each fund; (ii) the nature and extent of the investment adviser's supervision of third party service providers, principally custodians and subcustodians; and (iii) the resources devoted to, and the record of compliance with, each fund's compliance policies and procedures. The Board also reviewed the allocation of fund brokerage, including allocations to brokers affiliated with the Investment Advisers, the use of brokerage commissions to pay fund expenses, and the use of "soft" commission dollars to pay for research services.
The Board noted that the growth of fund assets over time across the complex allows Fidelity to reinvest in the development of services designed to enhance the value or convenience of the Fidelity funds as investment vehicles. These services include 24-hour access to account information and market information through phone representatives and over the Internet, and investor education materials and asset allocation tools.
Investment in a Large Fund Family. The Board considered the benefits to shareholders of investing in a Fidelity fund, including the benefits of investing in a fund that is part of a large family of funds offering a variety of investment disciplines and providing a large variety of mutual fund investor services. The Board noted that Fidelity had taken, or had made recommendations that resulted in the Fidelity funds taking, a number of actions over the previous year that benefited particular funds, including (i) dedicating additional resources to investment research and restructuring and broadening the focus of the investment research teams; (ii) bolstering the senior management team that oversees asset management; (iii) launching Class F of certain funds as a lower-fee class available to Freedom K and Freedom Index Funds; (iv) lowering the initial investment minimums and ongoing balance requirements for Real Estate High Income Fund; (v) eliminating subsequent purchase minimums for all funds and adding a waiver of the investment minimum requirement for new accounts opened with the proceeds of a systematic withdrawal plan; (vi) eliminating the withdrawal minimum and maximum limits for systematic withdrawals from Advisor funds; (vii) expanding sales load waivers on Class A shares for Destiny Planholders and expanding Institutional Class eligibility for Class O Destiny Planholders; and (viii) changing certain Class A and Class T sales charge structures to further align them with industry practices.
Annual Report
Investment Performance (Canada Fund and China Region Fund). The Board considered whether each fund has operated in accordance with its investment objective, as well as its record of compliance with its investment restrictions. It also reviewed each fund's absolute investment performance for each class, as well as each fund's relative investment performance for each class measured over multiple periods against a broad-based securities market index. The Board noted that FMR does not believe that a meaningful peer group exists against which to compare either fund's performance. For each fund, the following charts considered by the Board show, over the one-, three-, and five-year periods ended December 31, 2009, as available, the cumulative total returns of the retail class and Class B of the fund and the cumulative total returns of a broad-based securities market index ("benchmark"). The returns of the retail class and Class B show the performance of the highest performing class (based on five-year performance) and the lowest performing class (based on one-year performance), respectively.
Fidelity Canada Fund
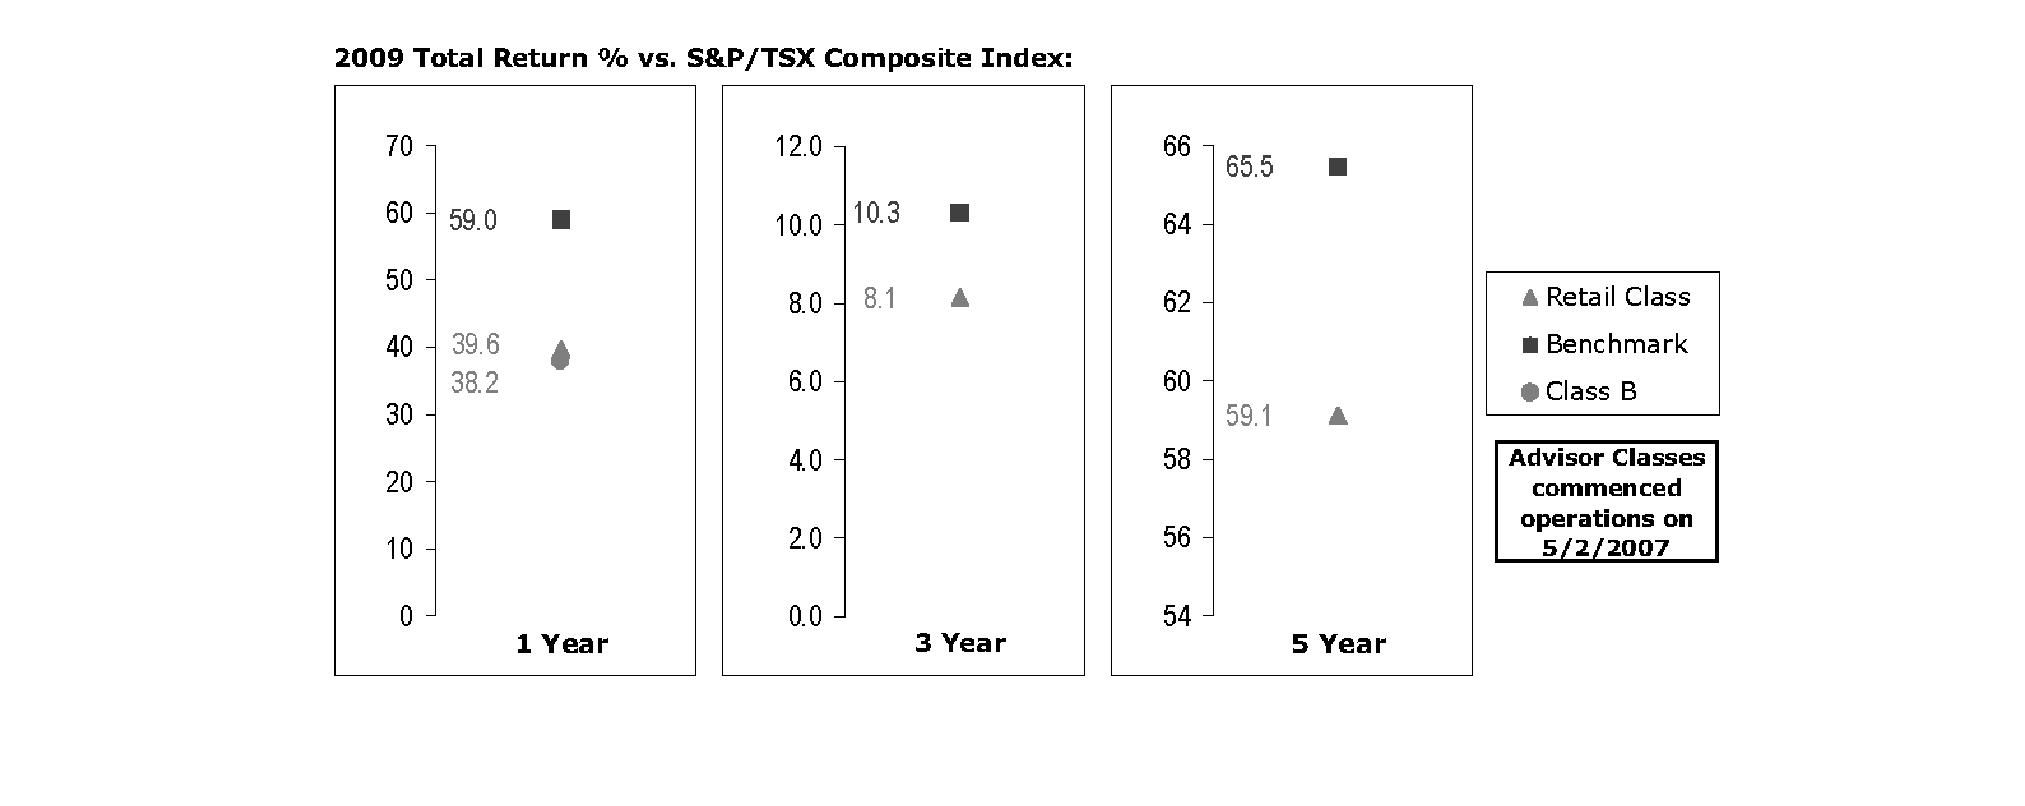
The Board noted that the investment performance of the fund was lower than its benchmark for all the periods shown. The Board considered that the variations in performance among the fund's classes reflect the variations in class expenses, which result in lower performance for higher expense classes. The Board discussed with FMR actions that have been taken by FMR to improve the fund's below-benchmark performance. The Board also reviewed the fund's performance since inception as well as performance in the current year. The Board will continue to closely monitor the performance of the fund in the coming year and discuss with FMR other appropriate actions to address the performance of the fund.
Annual Report
Board Approval of Investment Advisory Contracts and Management Fees - continued
Fidelity China Region Fund

The Board noted that the investment performance of the retail class of the fund compared favorably to its benchmark for the three- and five-year periods, although the fund's one-year cumulative total return was lower than its benchmark. The Board considered that the variations in performance among the fund's classes reflect the variations in class expenses, which result in lower performance for higher expense classes. The Board also reviewed the fund's performance since inception as well as performance in the current year.
The Board also considered that Canada Fund's management fee is subject to upward or downward adjustment depending upon whether, and to what extent, the fund's investment performance for the performance period exceeds, or is exceeded by, the record (over the same period) of a Board-approved performance adjustment index. The Board realizes that the performance adjustment provides FMR with a strong economic incentive to seek to achieve superior performance for the fund's shareholders and helps to more closely align the interests of FMR and the fund's shareholders.
Based on its review, and giving particular weight to the nature and quality of the resources dedicated by the Investment Advisers to maintain and improve relative performance and factoring in the unprecedented market events in recent years, the Board concluded that the nature, extent, and quality of investment management and support services and of shareholder and administrative services provided to each fund will benefit each fund's shareholders, particularly in light of the Board's view that each fund's shareholders benefit from investing in a fund that is part of a large family of funds offering a variety of investment disciplines and services.
Investment Performance (Emerging Markets Fund). The Board considered whether the fund has operated in accordance with its investment objective, as well as its record of compliance with its investment restrictions. It also reviewed the fund's absolute investment performance for each class, as well as the fund's relative investment performance for each class measured over multiple periods against (i) a broad-based securities market index, and (ii) a peer group of mutual funds deemed appropriate by Fidelity and reviewed by the Board. The following charts considered by the Board show, over the one-, three-, and five-year periods ended December 31, 2009, as available, the cumulative total returns of Class K and the retail class of the fund, the cumulative total returns of a broad-based securities market index ("benchmark"), and a range of cumulative total returns of a peer group of mutual funds identified by Morningstar, Inc. as having an investment style similar to that of the fund based on underlying portfolio holdings. The box within each chart shows the 25th percentile return (bottom of box) and the 75th percentile return (top of box) of the peer group. Returns shown above the box are in the first quartile and returns shown below the box are in the fourth quartile. The percentage beaten numbers noted below each chart correspond to the percentile box and represent the percentage of funds in the peer group whose performance was equal to or lower than that of the class indicated.
Annual Report
Fidelity Emerging Markets Fund
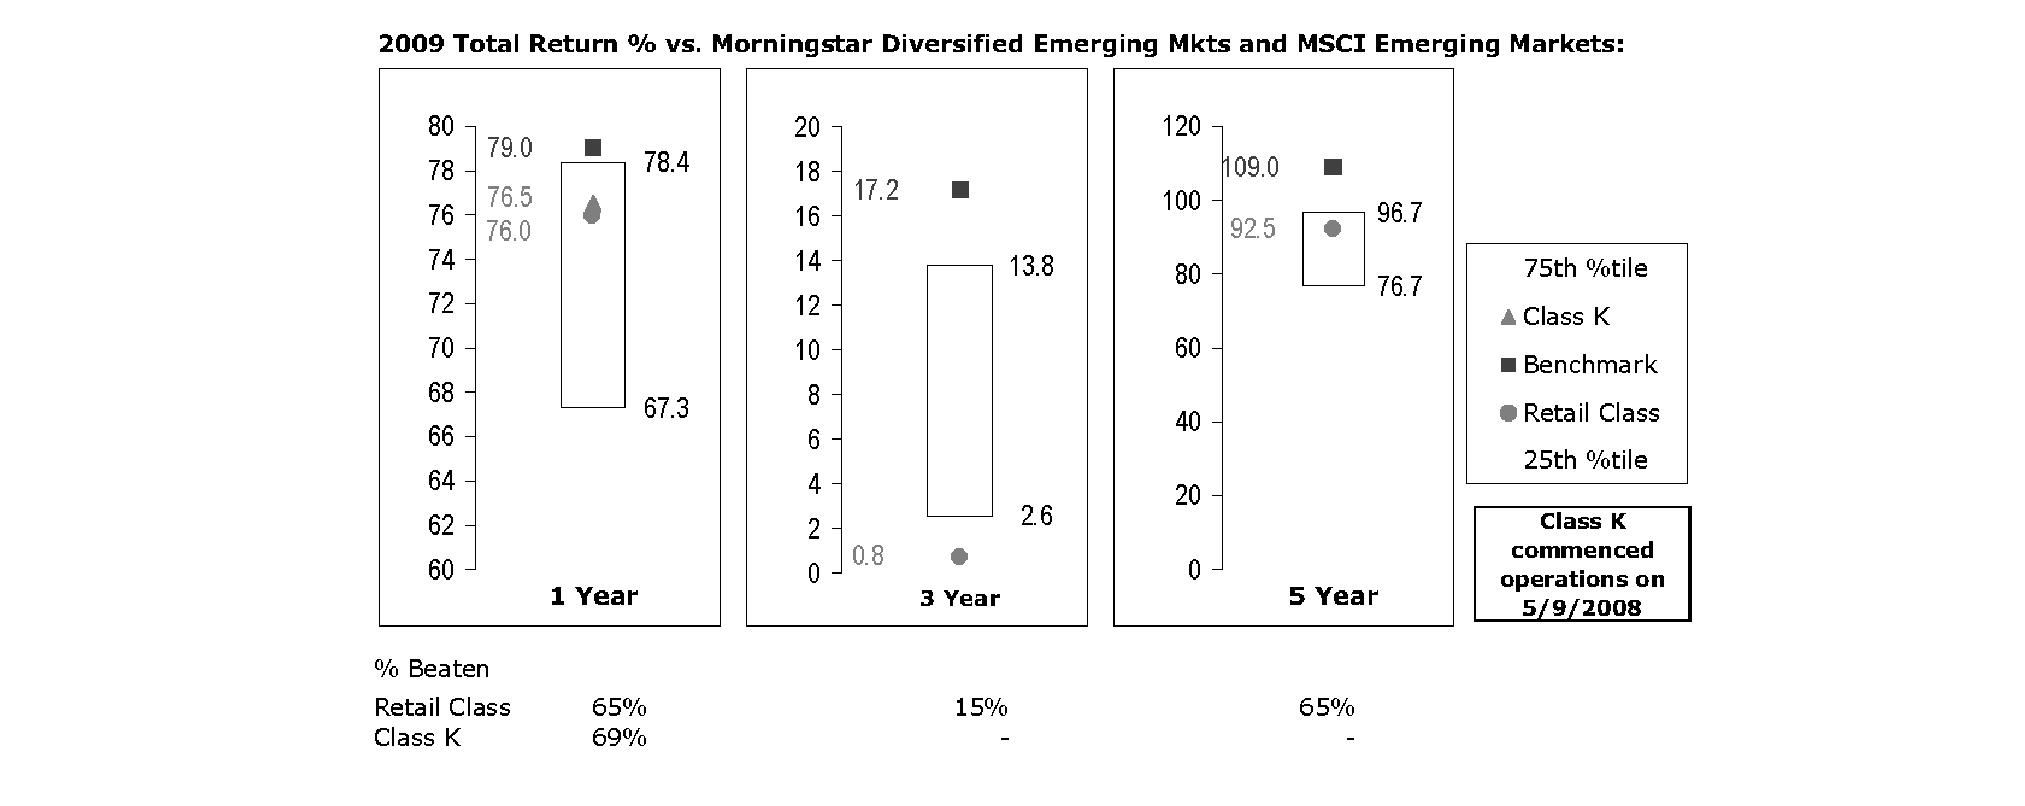
The Board reviewed the fund's relative investment performance against its peer group and noted that the performance of the retail class of the fund (the class with the longer performance record) was in the second quartile for the one- and five-year periods and the fourth quartile for the three-year period. The Board also noted that the investment performance of the fund was lower than its benchmark for all the periods shown. The Board considered that the variations in performance between the fund's classes reflect the variations in class expenses, which result in lower performance for the higher expense class. The Board also reviewed the fund's performance since inception as well as performance in the current year.
Based on its review, and giving particular weight to the nature and quality of the resources dedicated by the Investment Advisers to maintain and improve relative performance and factoring in the unprecedented market events in recent years, the Board concluded that the nature, extent, and quality of investment management and support services and of shareholder and administrative services provided to the fund will benefit the fund's shareholders, particularly in light of the Board's view that the fund's shareholders benefit from investing in a fund that is part of a large family of funds offering a variety of investment disciplines and services.
Investment Performance (Europe Fund and Europe Capital Appreciation Fund). The Board considered whether each fund has operated in accordance with its investment objective, as well as its record of compliance with its investment restrictions. It also reviewed each fund's absolute investment performance (for the retail class, in the case of Europe Fund), as well as each fund's relative investment performance (for the retail class, in the case of Europe Fund) measured over multiple periods against (i) a broad-based securities market index, and (ii) a peer group of mutual funds deemed appropriate by Fidelity and reviewed by the Board. For each fund, the following charts considered by the Board show, over the one-, three-, and five-year periods ended December 31, 2009, the fund's cumulative total returns (for the retail class, in the case of Europe Fund), the cumulative total returns of a broad-based securities market index ("benchmark"), and a range of cumulative total returns of a peer group of mutual funds identified by Morningstar, Inc. as having an investment style similar to that of the fund based on underlying portfolio holdings. (Class F of Europe Fund had less than one year of performance as of December 31, 2009.) The box within each chart shows the 25th percentile return (bottom of box) and the 75th percentile return (top of box) of the peer group. Returns shown above the box are in the first quartile and returns shown below the box are in the fourth quartile. The percentage beaten number noted below each chart corresponds to the percentile box and represents the percentage of funds in the peer group whose performance was equal to or lower than that of the fund (or the retail class, in the case of Europe Fund).
Annual Report
Board Approval of Investment Advisory Contracts and Management Fees - continued
Fidelity Europe Fund
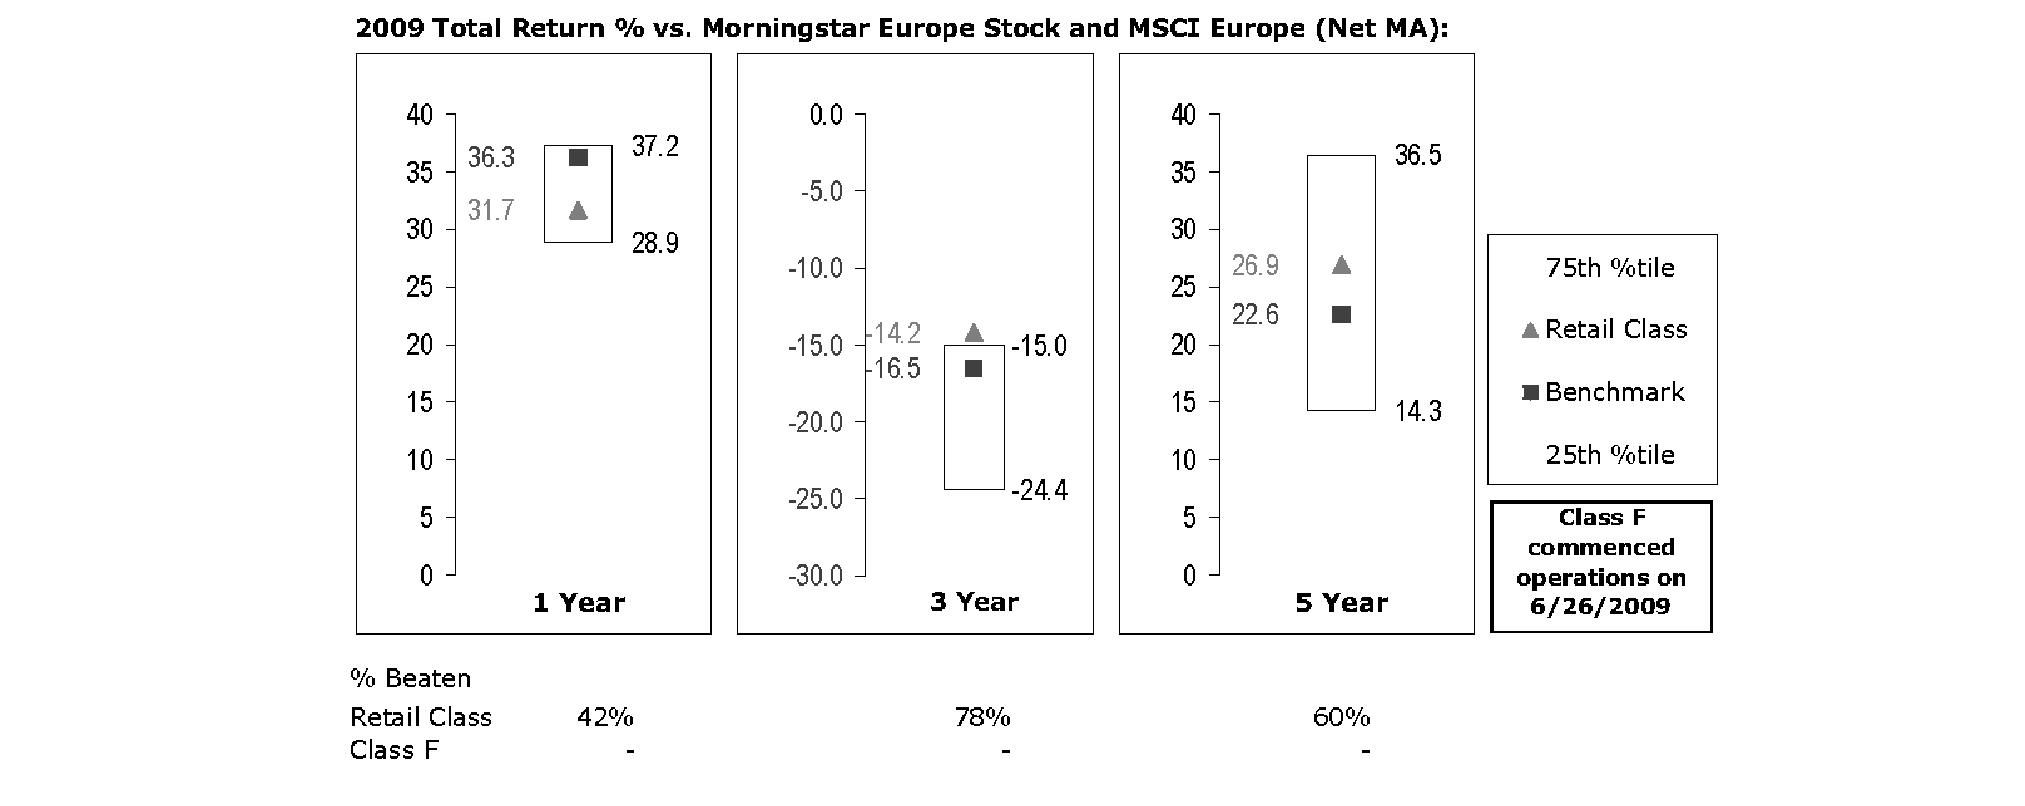
The Board reviewed the fund's relative investment performance against its peer group and noted that the performance of the retail class of the fund was in the third quartile for the one-year period, the first quartile for the three-year period, and the second quartile for the five-year period. The Board also noted that the investment performance of the retail class of the fund compared favorably to its benchmark for the three- and five-year periods, although the fund's one-year cumulative total return was lower than its benchmark. The Board also reviewed the fund's performance since inception as well as performance in the current year.
Fidelity Europe Capital Appreciation Fund
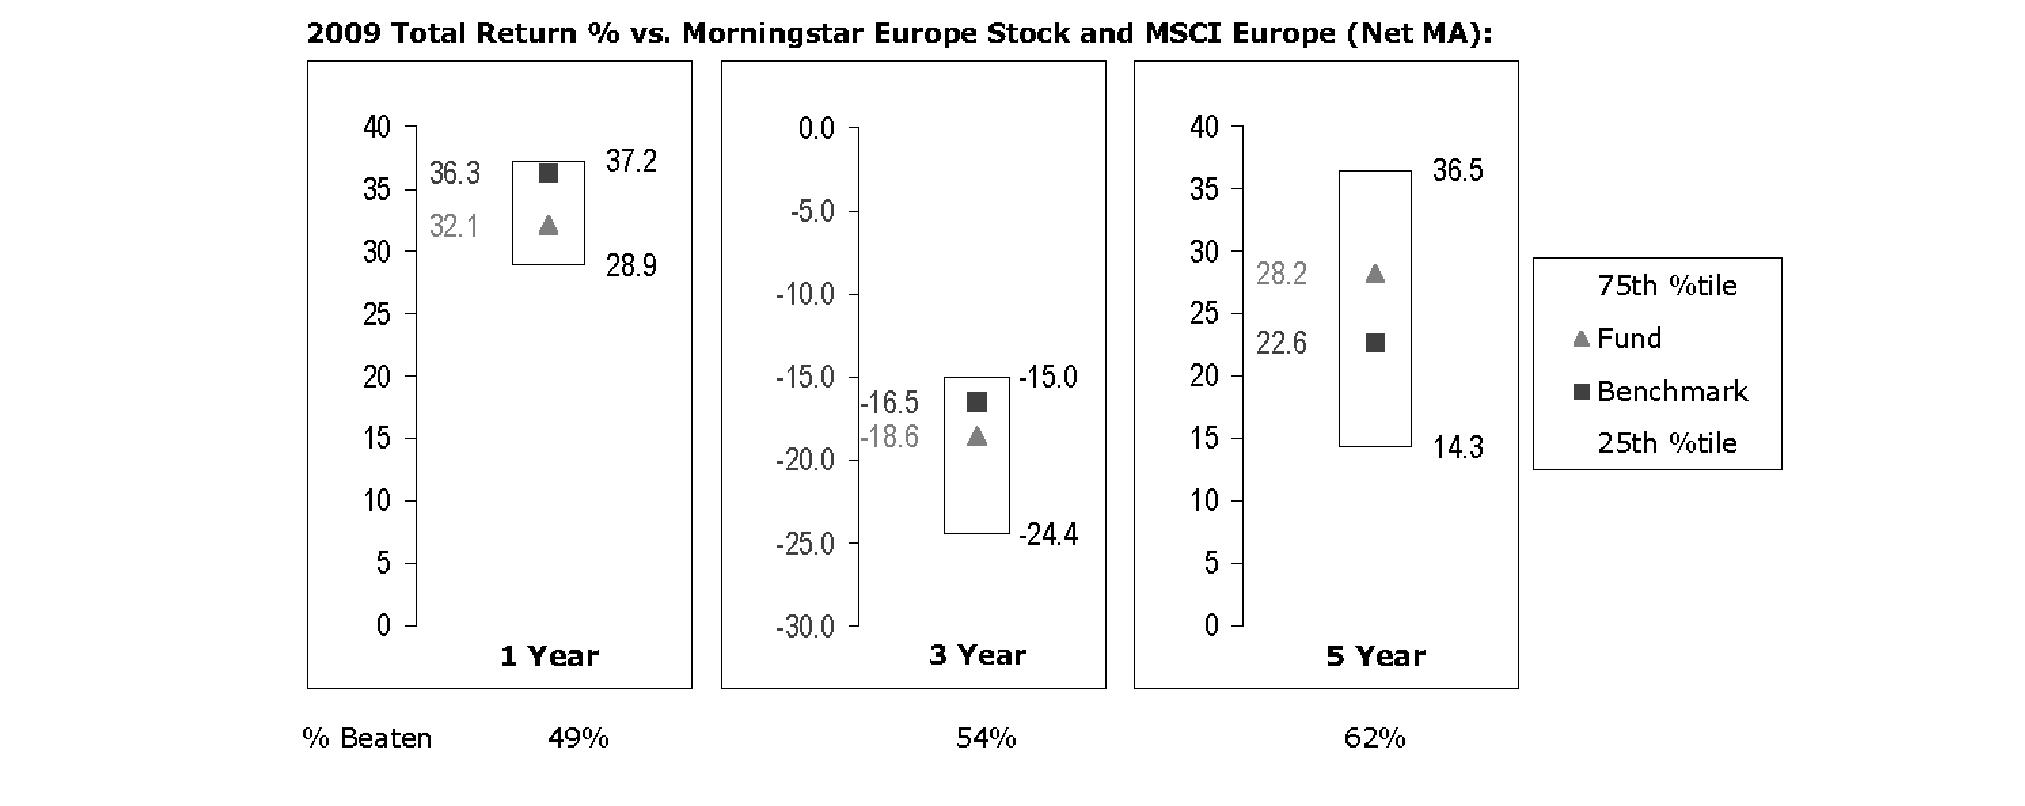
The Board reviewed the fund's relative investment performance against its peer group and noted that the performance of the fund was in the third quartile for the one-year period and the second quartile for the three- and five-year periods. The Board also noted that the investment performance of the fund was lower than its benchmark for the one- and three-year periods, although the fund's five-year cumulative total return compared favorably to its benchmark. The Board also reviewed the fund's performance since inception as well as performance in the current year.
The Board also considered that each fund's management fee is subject to upward or downward adjustment depending upon whether, and to what extent, the fund's investment performance for the performance period exceeds, or is exceeded by, the record (over the same period) of a Board-approved performance adjustment index. The Board realizes that the performance adjustment provides FMR with a strong economic incentive to seek to achieve superior performance for each fund's shareholders and helps to more closely align the interests of FMR and each fund's shareholders.
Annual Report
Based on its review, and giving particular weight to the nature and quality of the resources dedicated by the Investment Advisers to maintain and improve relative performance and factoring in the unprecedented market events in recent years, the Board concluded that the nature, extent, and quality of investment management and support services and of shareholder and administrative services provided to each fund will benefit each fund's shareholders, particularly in light of the Board's view that each fund's shareholders benefit from investing in a fund that is part of a large family of funds offering a variety of investment disciplines and services.
Investment Performance (Japan Fund). The Board considered whether the fund has operated in accordance with its investment objective, as well as its record of compliance with its investment restrictions. It also reviewed the fund's absolute investment performance for the retail class, as well as the fund's relative investment performance for the retail class measured over multiple periods against (i) a broad-based securities market index, and (ii) a peer group of mutual funds deemed appropriate by Fidelity and reviewed by the Board. The following charts considered by the Board show, over the one-, three-, and five-year periods ended December 31, 2009, the cumulative total returns of the retail class of the fund, the cumulative total returns of a broad-based securities market index ("benchmark"), and a range of cumulative total returns of a peer group of mutual funds identified by Lipper Inc. as having an investment objective similar to that of the fund. (Class F of the fund had less than one year of performance as of December 31, 2009.) The box within each chart shows the 25th percentile return (bottom of box) and the 75th percentile return (top of box) of the peer group. Returns shown above the box are in the first quartile and returns shown below the box are in the fourth quartile. The percentage beaten number noted below each chart corresponds to the percentile box and represents the percentage of funds in the peer group whose performance was equal to or lower than that of the retail class of the fund.
Fidelity Japan Fund

The Board reviewed the fund's relative investment performance against its peer group and noted that the performance of the retail class of the fund was in the first quartile for all the periods shown. The Board also noted that the investment performance of the retail class of the fund compared favorably to its benchmark for the one- and five-year periods, although the fund's three-year cumulative total return was lower than its benchmark. The Board also reviewed the fund's performance since inception as well as performance in the current year.
The Board also considered that the fund's management fee is subject to upward or downward adjustment depending upon whether, and to what extent, the fund's investment performance for the performance period exceeds, or is exceeded by, the record (over the same period) of a Board-approved performance adjustment index. The Board realizes that the performance adjustment provides FMR with a strong economic incentive to seek to achieve superior performance for the fund's shareholders and helps to more closely align the interests of FMR and the fund's shareholders.
Based on its review, and giving particular weight to the nature and quality of the resources dedicated by the Investment Advisers to maintain and improve relative performance and factoring in the unprecedented market events in recent years, the Board concluded that the nature, extent, and quality of investment management and support services and of shareholder and administrative services provided to the fund will benefit the fund's shareholders, particularly in light of the Board's view that the fund's shareholders benefit from investing in a fund that is part of a large family of funds offering a variety of investment disciplines and services.
Investment Performance (Japan Smaller Companies Fund, Latin America Fund, Nordic Fund, Pacific Basin Fund, and Southeast Asia Fund). The Board considered whether each fund has operated in accordance with its investment objective, as well as its record of compliance with its investment restrictions. It also reviewed each fund's absolute investment performance (for the retail class, in the case of Southeast Asia Fund), as well as each fund's relative investment performance (for the retail class, in the case of Southeast Asia Fund) measured over multiple periods against a broad-based securities market index. The Board noted that FMR does not believe that a meaningful peer group exists against which to compare any of the funds' performance. For each fund, the following charts considered by the Board show, over the one-, three-, and five-year periods ended December 31, 2009, the fund's cumulative total returns and the cumulative total returns of a broad-based securities market index ("benchmark"). (Class F of Southeast Asia Fund had less than one year of performance as of December 31, 2009.)
Annual Report
Board Approval of Investment Advisory Contracts and Management Fees - continued
Fidelity Japan Smaller Companies Fund
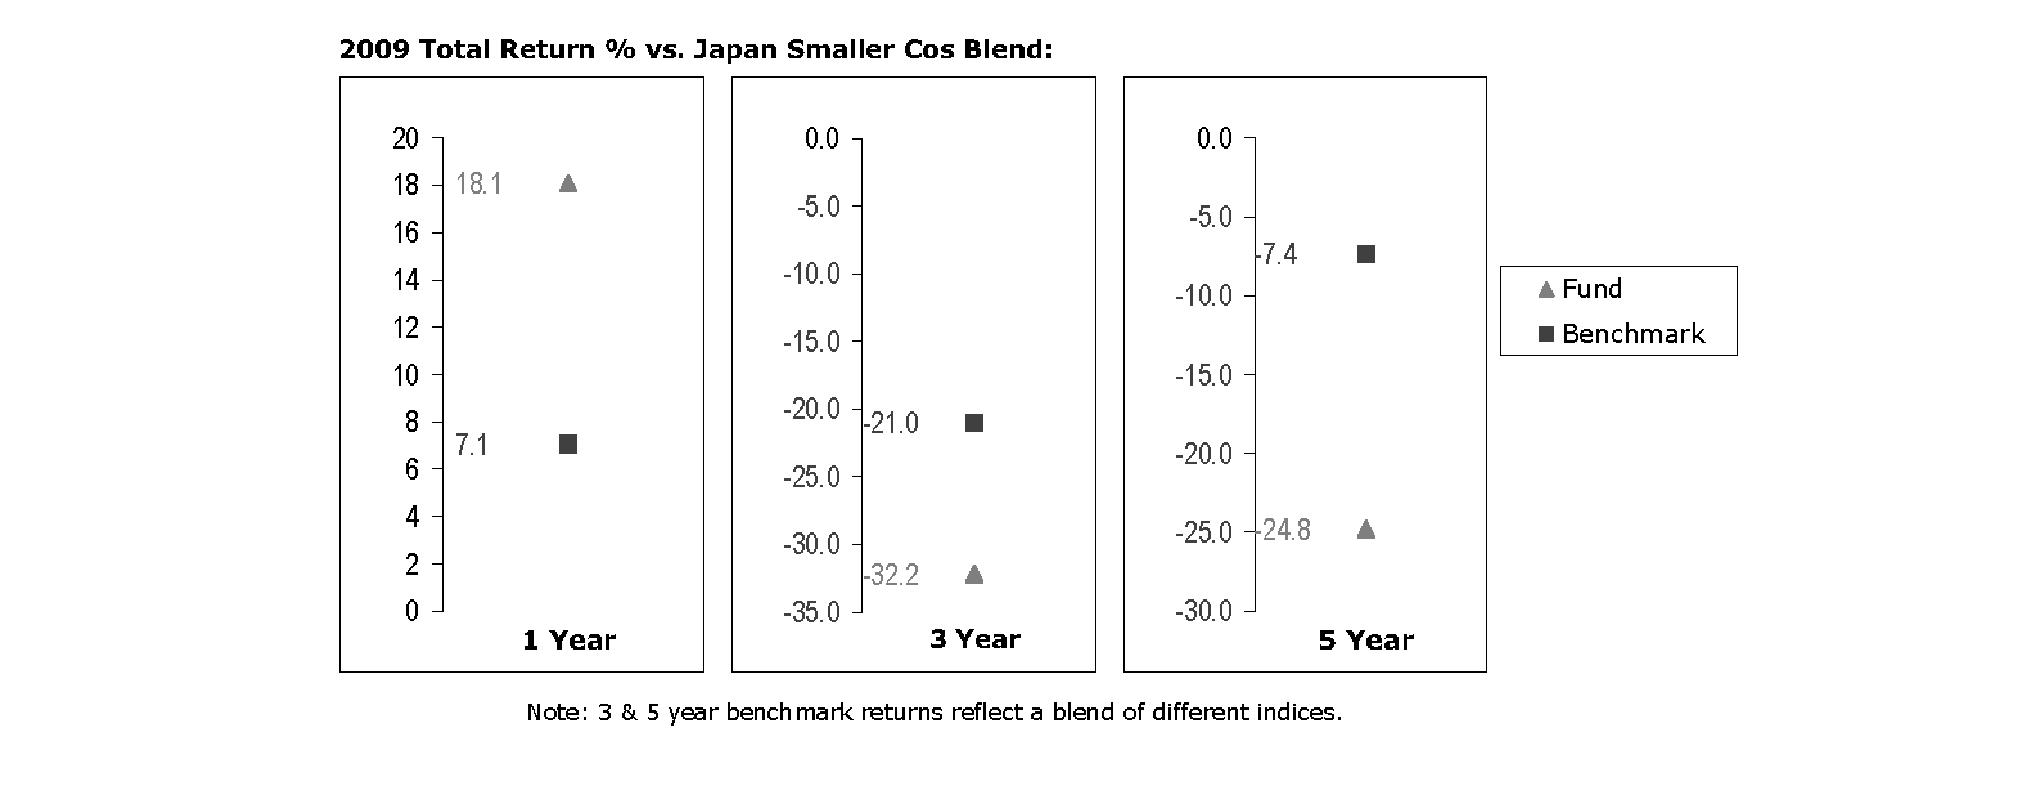
The Board noted that the investment performance of the fund was lower than its benchmark for the three- and five-year periods, although the fund's one-year cumulative total return compared favorably to its benchmark. The Board also reviewed the fund's performance since inception as well as performance in the current year.
Fidelity Latin America Fund
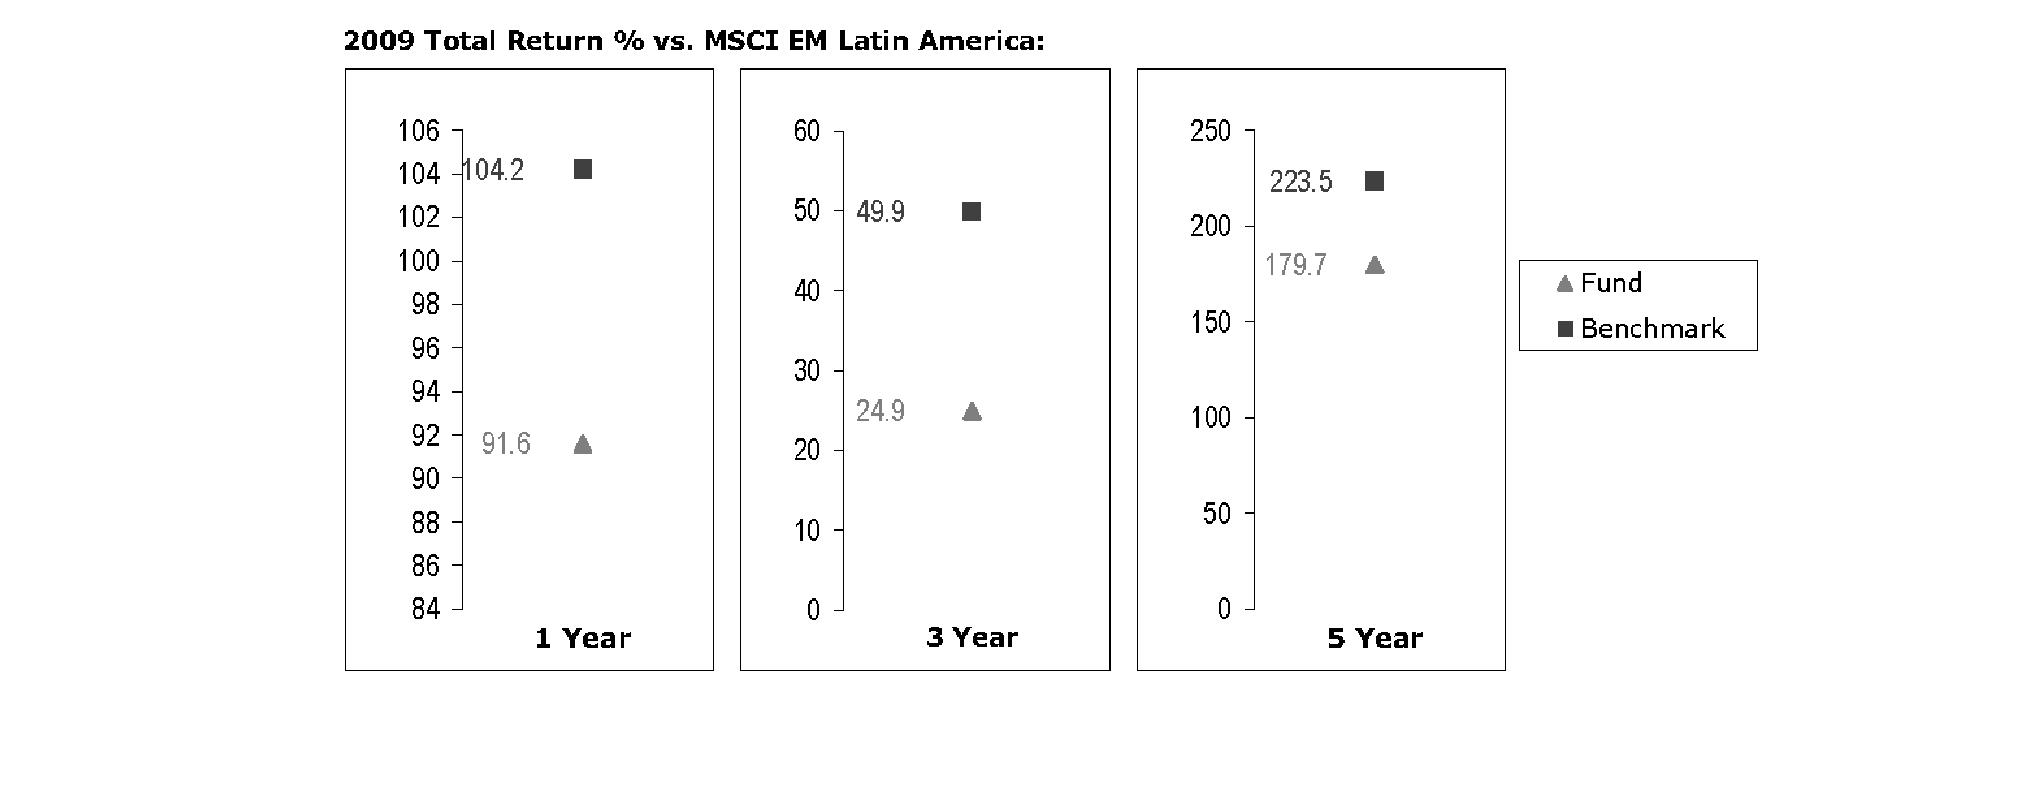
The Board noted that the investment performance of the fund was lower than its benchmark for all the periods shown. The Board discussed with FMR actions that have been taken by FMR to improve the fund's below-benchmark performance. The Board noted that this fund had underperformed in the previous year and discussed with FMR its disappointment with the continued underperformance of the fund. The Board also reviewed the fund's performance since inception as well as performance in the current year. The Board will continue to closely monitor the performance of the fund in the coming year and discuss with FMR other appropriate actions to address the performance of the fund.
Annual Report
Fidelity Nordic Fund
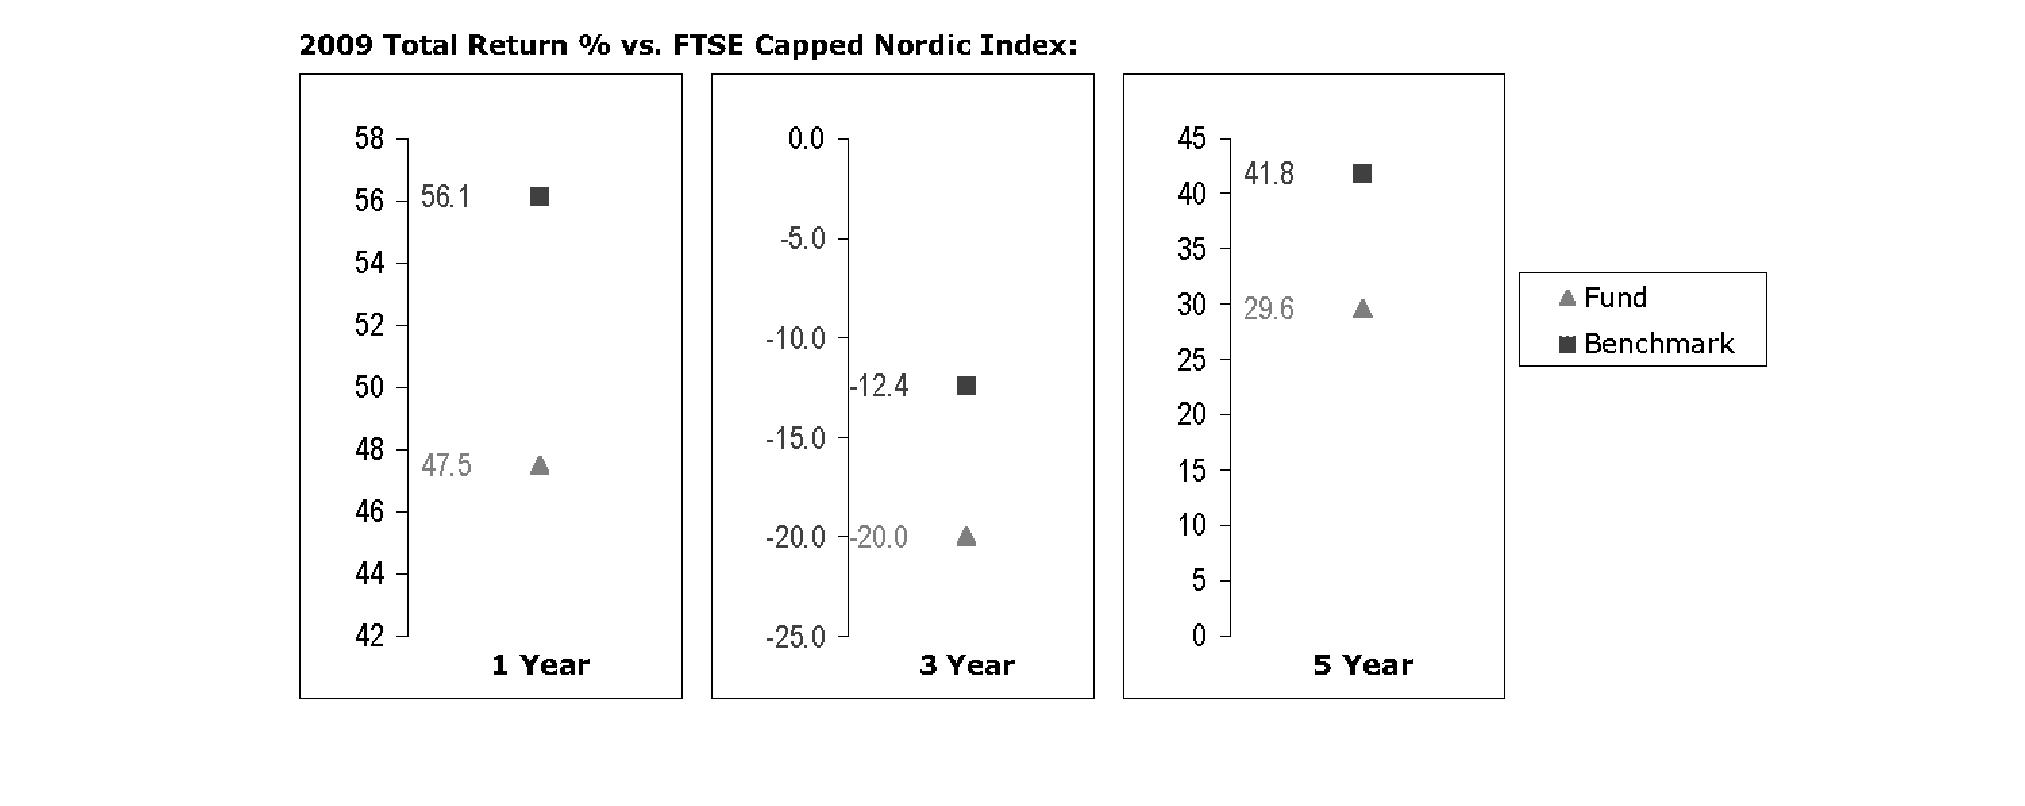
The Board noted that the investment performance of the fund was lower than its benchmark for all the periods shown. The Board discussed with FMR actions that have been taken by FMR to improve the fund's below-benchmark performance. The Board noted that this fund had underperformed in the previous year and discussed with FMR its disappointment with the continued underperformance of the fund. The Board also reviewed the fund's performance since inception as well as performance in the current year. The Board will continue to closely monitor the performance of the fund in the coming year and discuss with FMR other appropriate actions to address the performance of the fund.
Fidelity Pacific Basin Fund
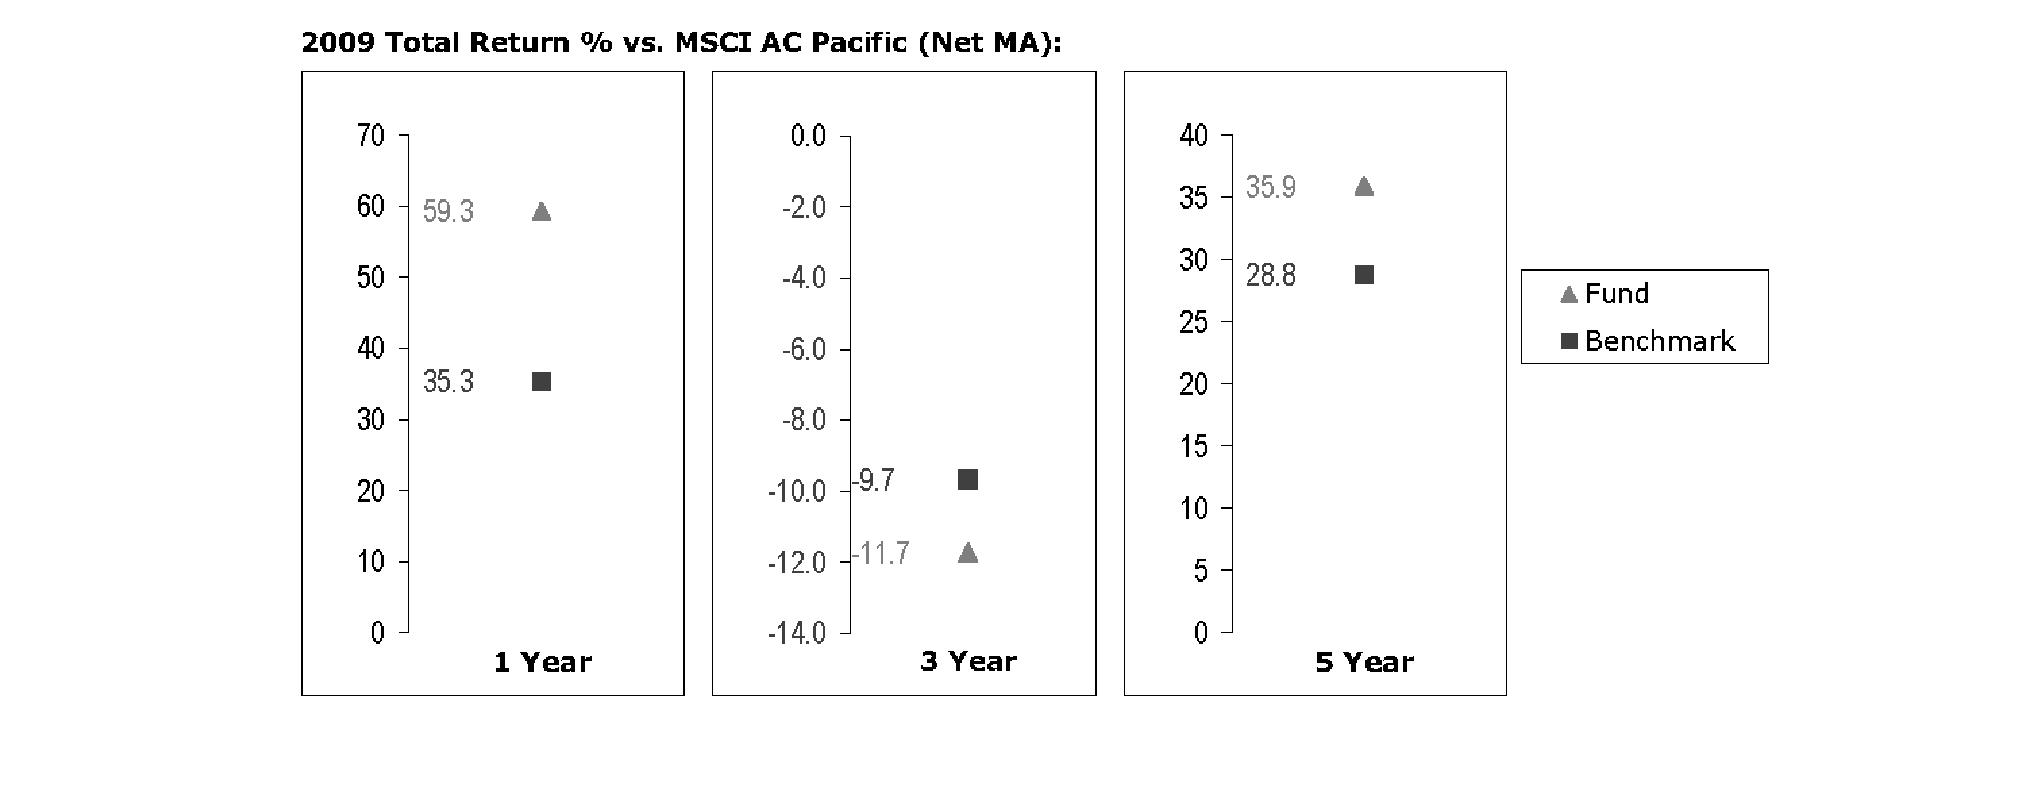
The Board noted that the investment performance of the fund compared favorably to its benchmark for the one- and five-year periods, although the fund's three-year cumulative total return was lower than its benchmark. The Board also reviewed the fund's performance since inception as well as performance in the current year.
Annual Report
Board Approval of Investment Advisory Contracts and Management Fees - continued
Fidelity Southeast Asia Fund
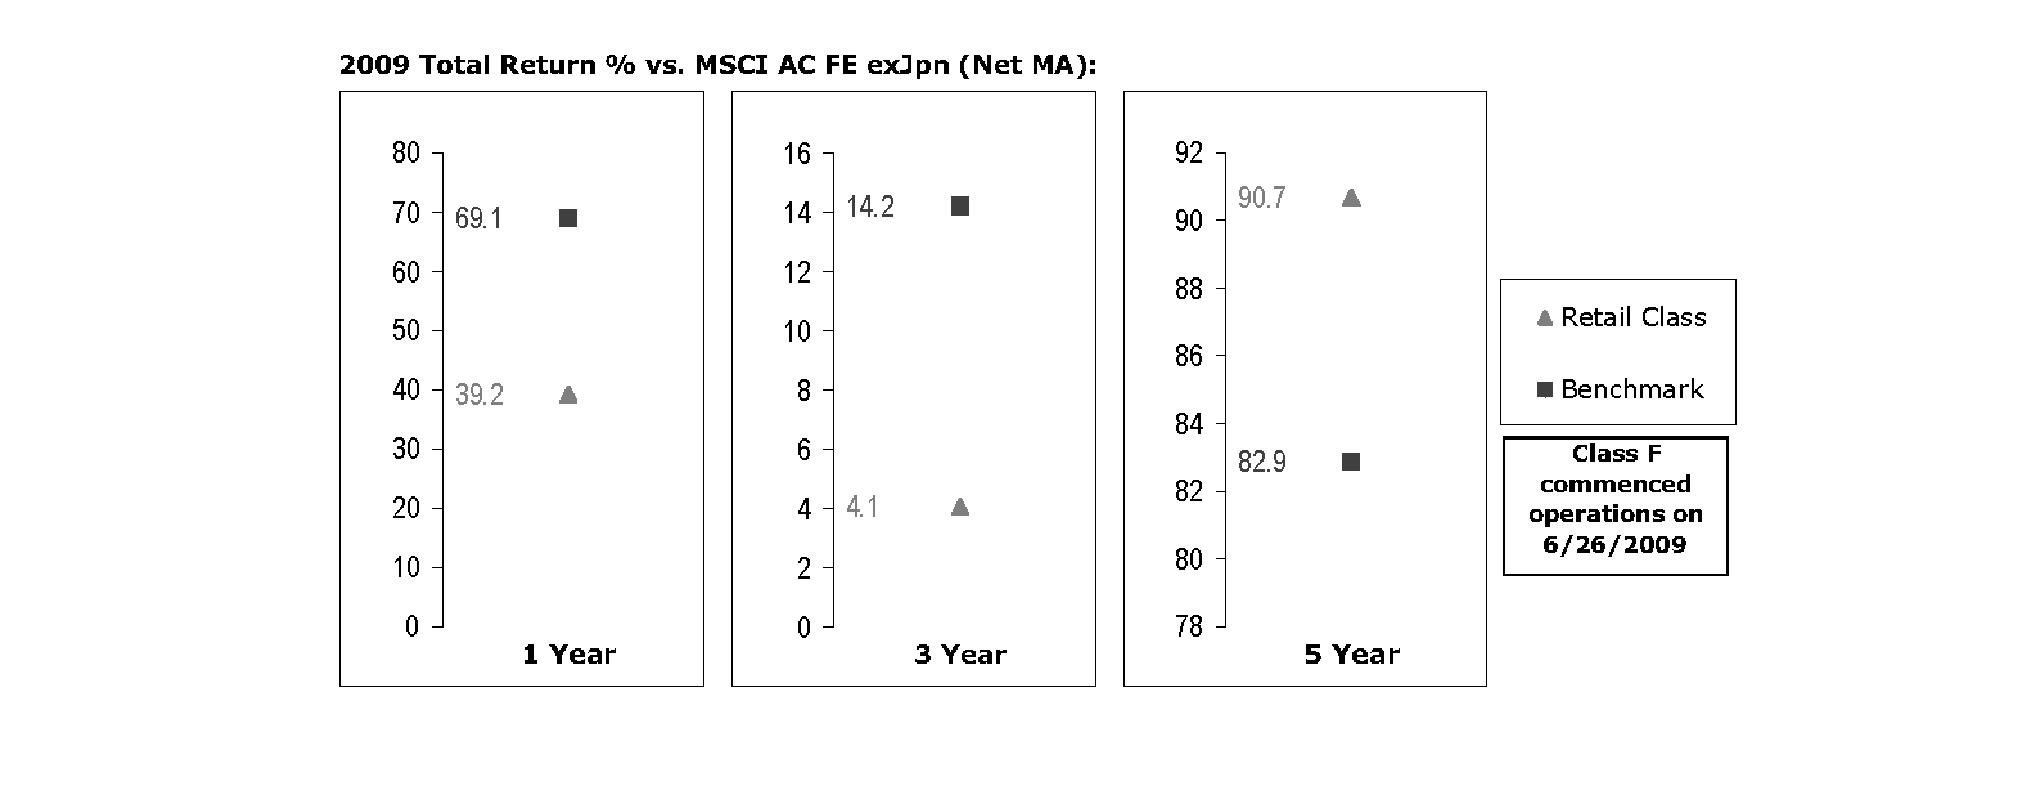
The Board noted that the investment performance of the fund was lower than its benchmark for the one- and three-year periods, although the five-year cumulative total return of the retail class compared favorably to its benchmark. The Board discussed with FMR actions that have been taken by FMR to improve the fund's below-benchmark performance. The Board also reviewed the fund's performance since inception as well as performance in the current year. The Board will continue to closely monitor the performance of the fund in the coming year and discuss with FMR other appropriate actions to address the performance of the fund.
The Board also considered that each of Pacific Basin Fund's and Southeast Asia Fund's management fee is subject to upward or downward adjustment depending upon whether, and to what extent, the fund's investment performance for the performance period exceeds, or is exceeded by, the record (over the same period) of a Board-approved performance adjustment index. The Board realizes that the performance adjustment provides FMR with a strong economic incentive to seek to achieve superior performance for each fund's shareholders and helps to more closely align the interests of FMR and each fund's shareholders.
Based on its review, and giving particular weight to the nature and quality of the resources dedicated by the Investment Advisers to maintain and improve relative performance and factoring in the unprecedented market events in recent years, the Board concluded that the nature, extent, and quality of investment management and support services and of shareholder and administrative services provided to each fund will benefit each fund's shareholders, particularly in light of the Board's view that each fund's shareholders benefit from investing in a fund that is part of a large family of funds offering a variety of investment disciplines and services.
Competitiveness of Management Fee and Total Fund Expenses. The Board considered each fund's management fee and total expenses compared to "mapped groups" of competitive funds and classes. Fidelity creates "mapped groups" by combining similar Lipper investment objective categories that have comparable management fee characteristics. Combining Lipper investment objective categories aids the Board's management fee and total expense comparisons by broadening the competitive group used for comparison and by reducing the number of universes to which various Fidelity funds are compared.
Management Fee. The Board considered two proprietary management fee comparisons for the 12-month periods shown in the charts below. The group of Lipper funds used by the Board for management fee comparisons is referred to below as the "Total Mapped Group". For Japan Fund, the Total Mapped Group is broader than the Lipper peer group used by the Board for performance comparisons because the Total Mapped Group combines several Lipper investment objective categories while the Lipper peer group does not. The Total Mapped Group comparison focuses on a fund's standing relative to the total universe of comparable funds available to investors, in terms of gross management fees before expense reimbursements or caps, and without giving effect to a fund's performance adjustment (if applicable). "TMG %" represents the percentage of funds in the Total Mapped Group that had management fees that were lower than a fund's. For example, a TMG % of 15% would mean that 85% of the funds in the Total Mapped Group had higher management fees than a fund. The "Asset-Size Peer Group" (ASPG) comparison focuses on a fund's standing relative to non-Fidelity funds similar in size to the fund within the Total Mapped Group. The ASPG represents at least 15% of the funds in the Total Mapped Group with comparable asset size and management fee characteristics, subject to a minimum of 50 funds (or all funds in the Total Mapped Group if fewer than 50). Additional information, such as the ASPG quartile in which a fund's management fee ranked and the impact of a fund's performance adjustment (if applicable), is also included in the charts and considered by the Board.
Annual Report
Fidelity Canada Fund

The Board noted that the fund's management fee ranked below the median of its Total Mapped Group and below the median of its ASPG for 2009. The Board also noted the effect of the fund's positive performance adjustment on the fund's management fee ranking. The Board noted that the performance adjustment for each year represents calculations for performance periods that differ from the periods shown in the performance charts above.
Fidelity China Region Fund
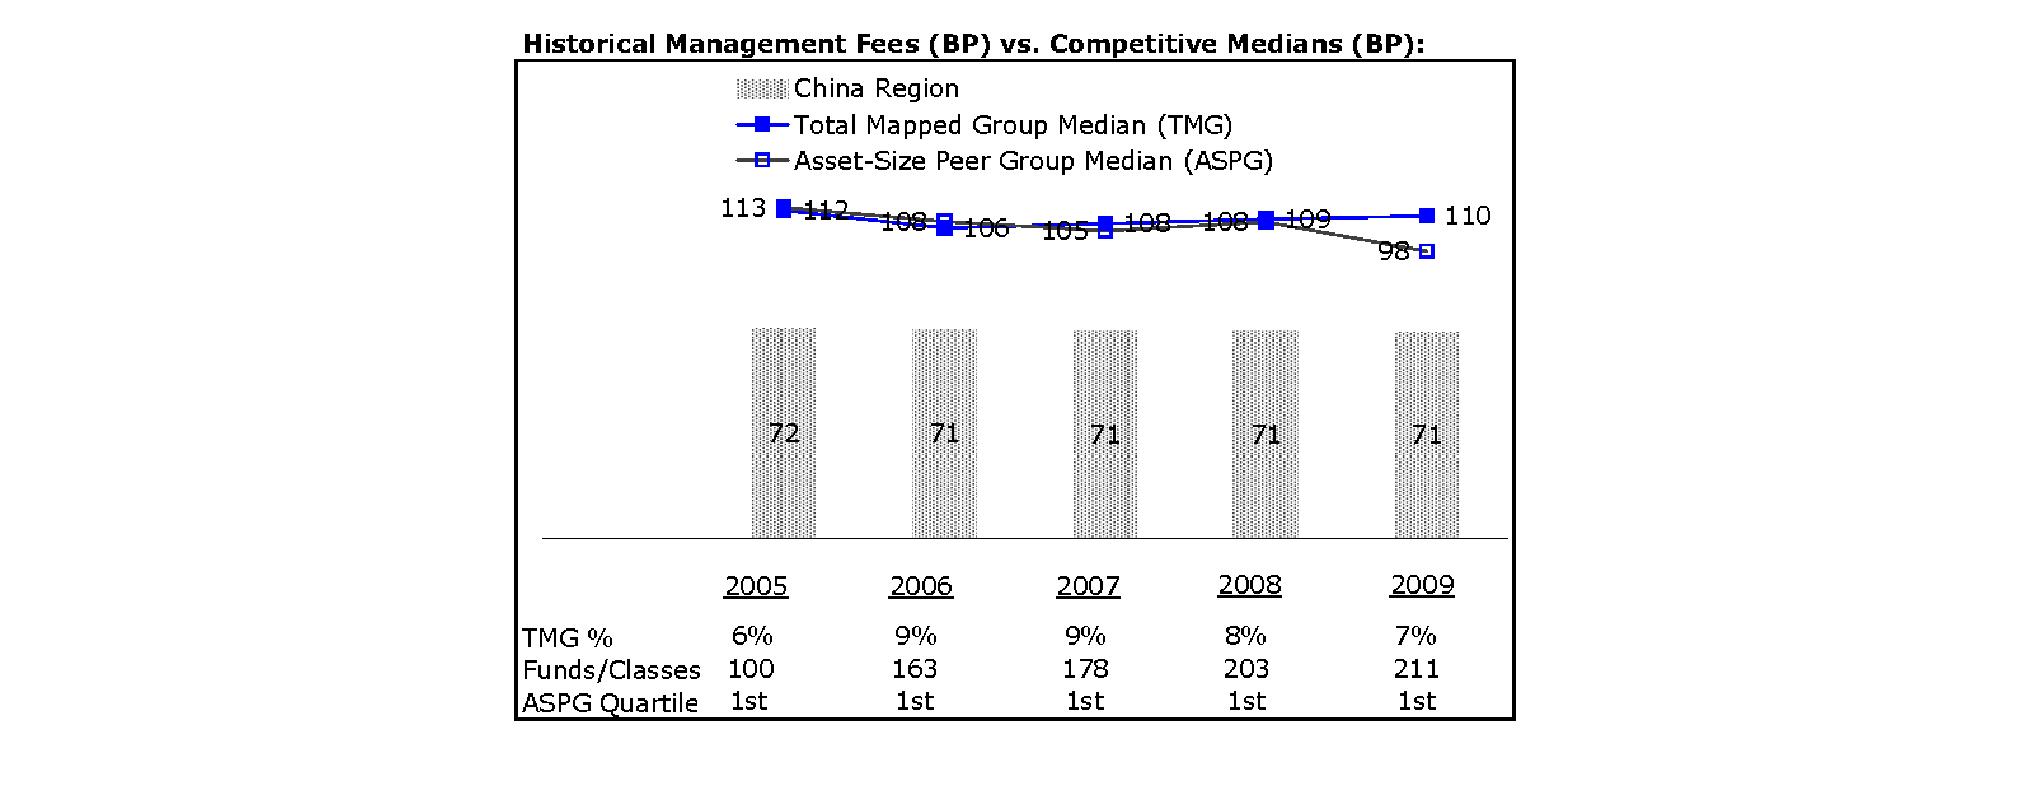
The Board noted that the fund's management fee ranked below the median of its Total Mapped Group and below the median of its ASPG for 2009.
Annual Report
Board Approval of Investment Advisory Contracts and Management Fees - continued
Fidelity Emerging Markets Fund
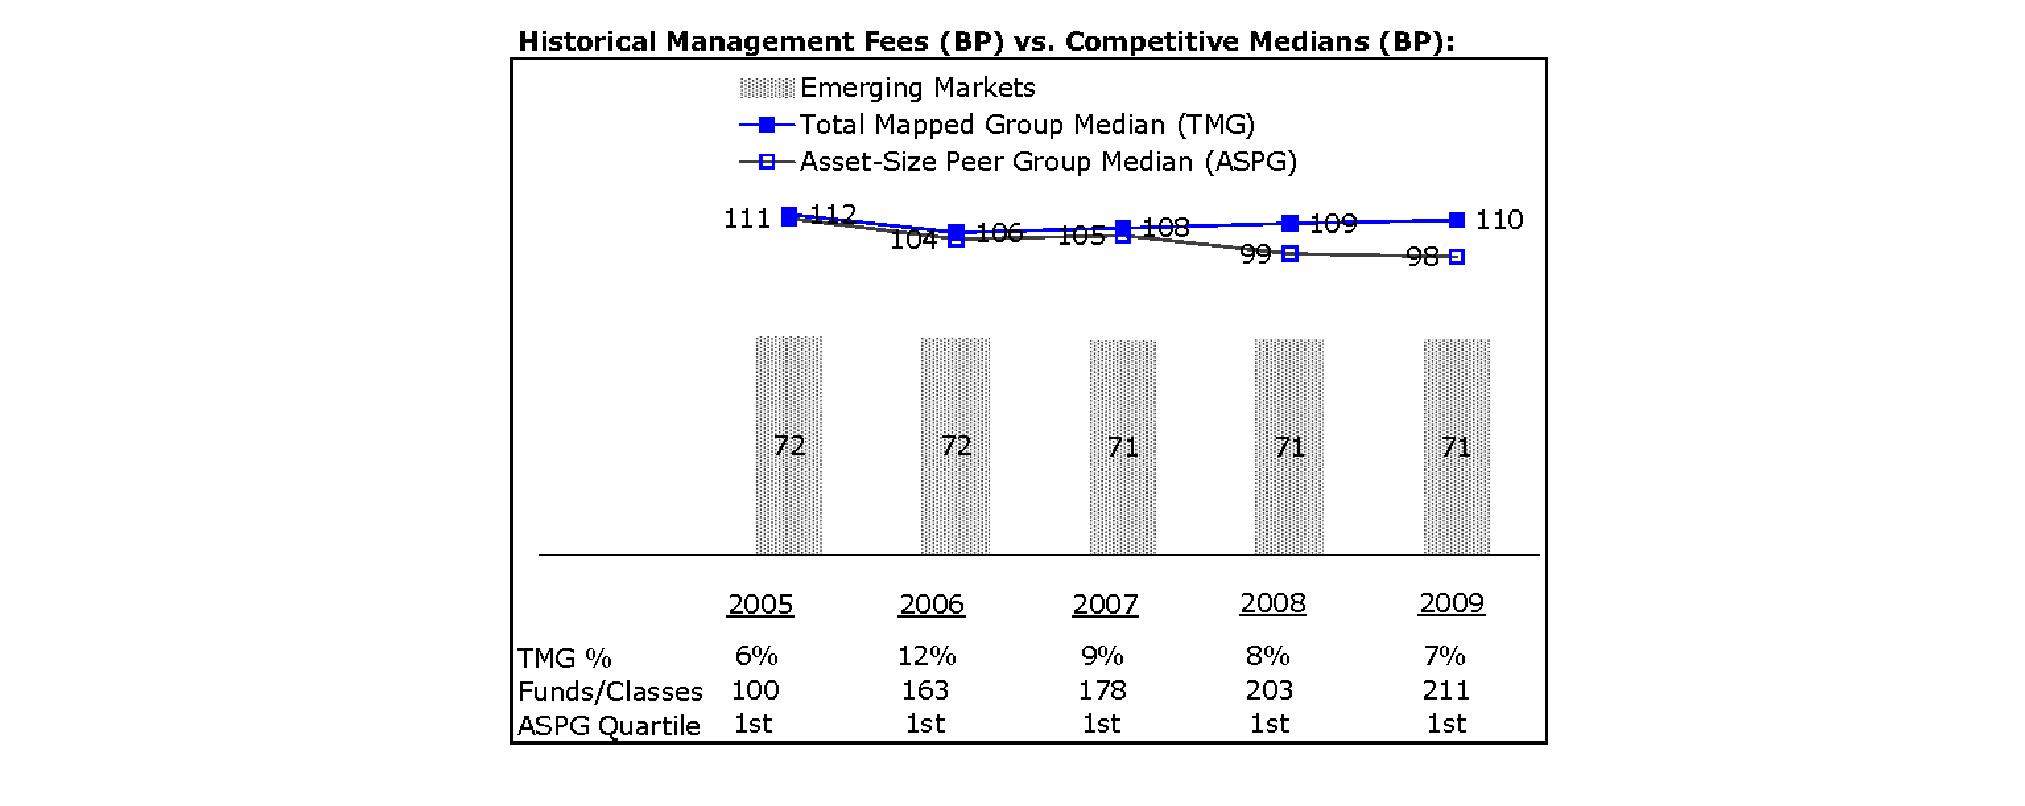
The Board noted that the fund's management fee ranked below the median of its Total Mapped Group and below the median of its ASPG for 2009.
Fidelity Europe Fund
The Board noted that the fund's management fee ranked below the median of its Total Mapped Group and below the median of its ASPG for 2009. The Board also noted the effect of the fund's positive performance adjustment on the fund's management fee ranking. The Board noted that the performance adjustment for each year represents calculations for performance periods that differ from the periods shown in the performance charts above.
Annual Report
Fidelity Europe Capital Appreciation Fund

The Board noted that the fund's management fee ranked below the median of its Total Mapped Group and below the median of its ASPG for 2009. The Board also noted the effect of the fund's negative performance adjustment on the fund's management fee ranking. The Board noted that the performance adjustment for each year represents calculations for performance periods that differ from the periods shown in the performance charts above.
Fidelity Japan Fund
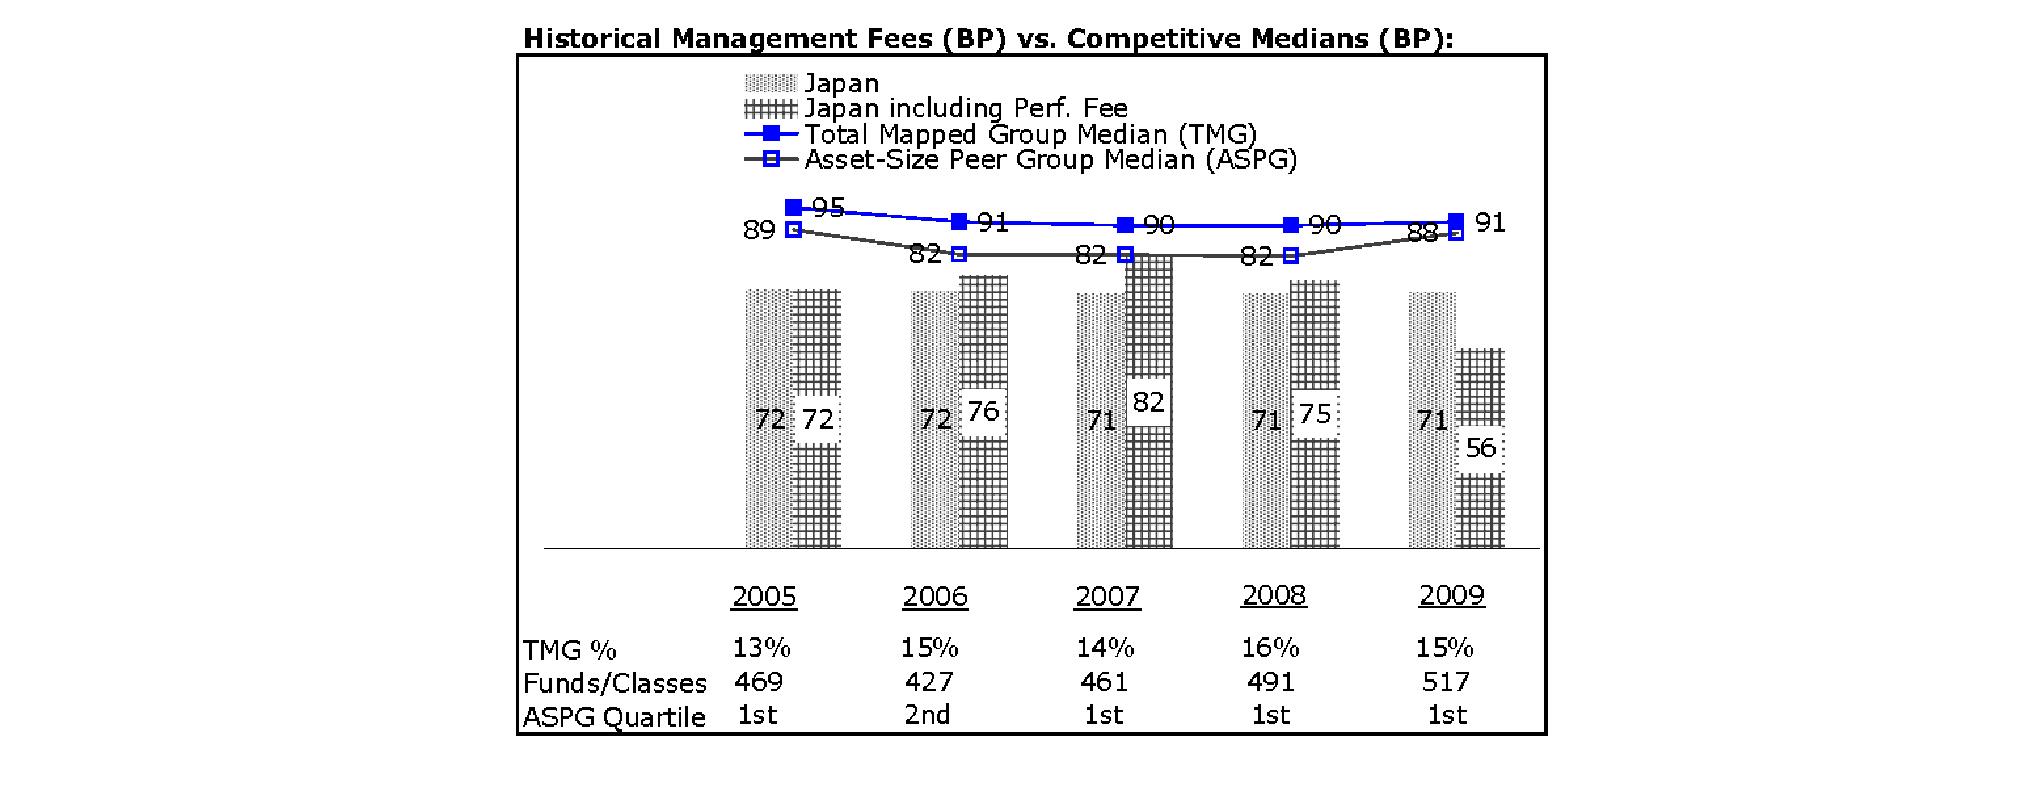
The Board noted that the fund's management fee ranked below the median of its Total Mapped Group and below the median of its ASPG for 2009. The Board also noted the effect of the fund's negative performance adjustment on the fund's management fee ranking. The Board noted that the performance adjustment for each year represents calculations for performance periods that differ from the periods shown in the performance charts above.
Annual Report
Board Approval of Investment Advisory Contracts and Management Fees - continued
Fidelity Japan Smaller Companies Fund
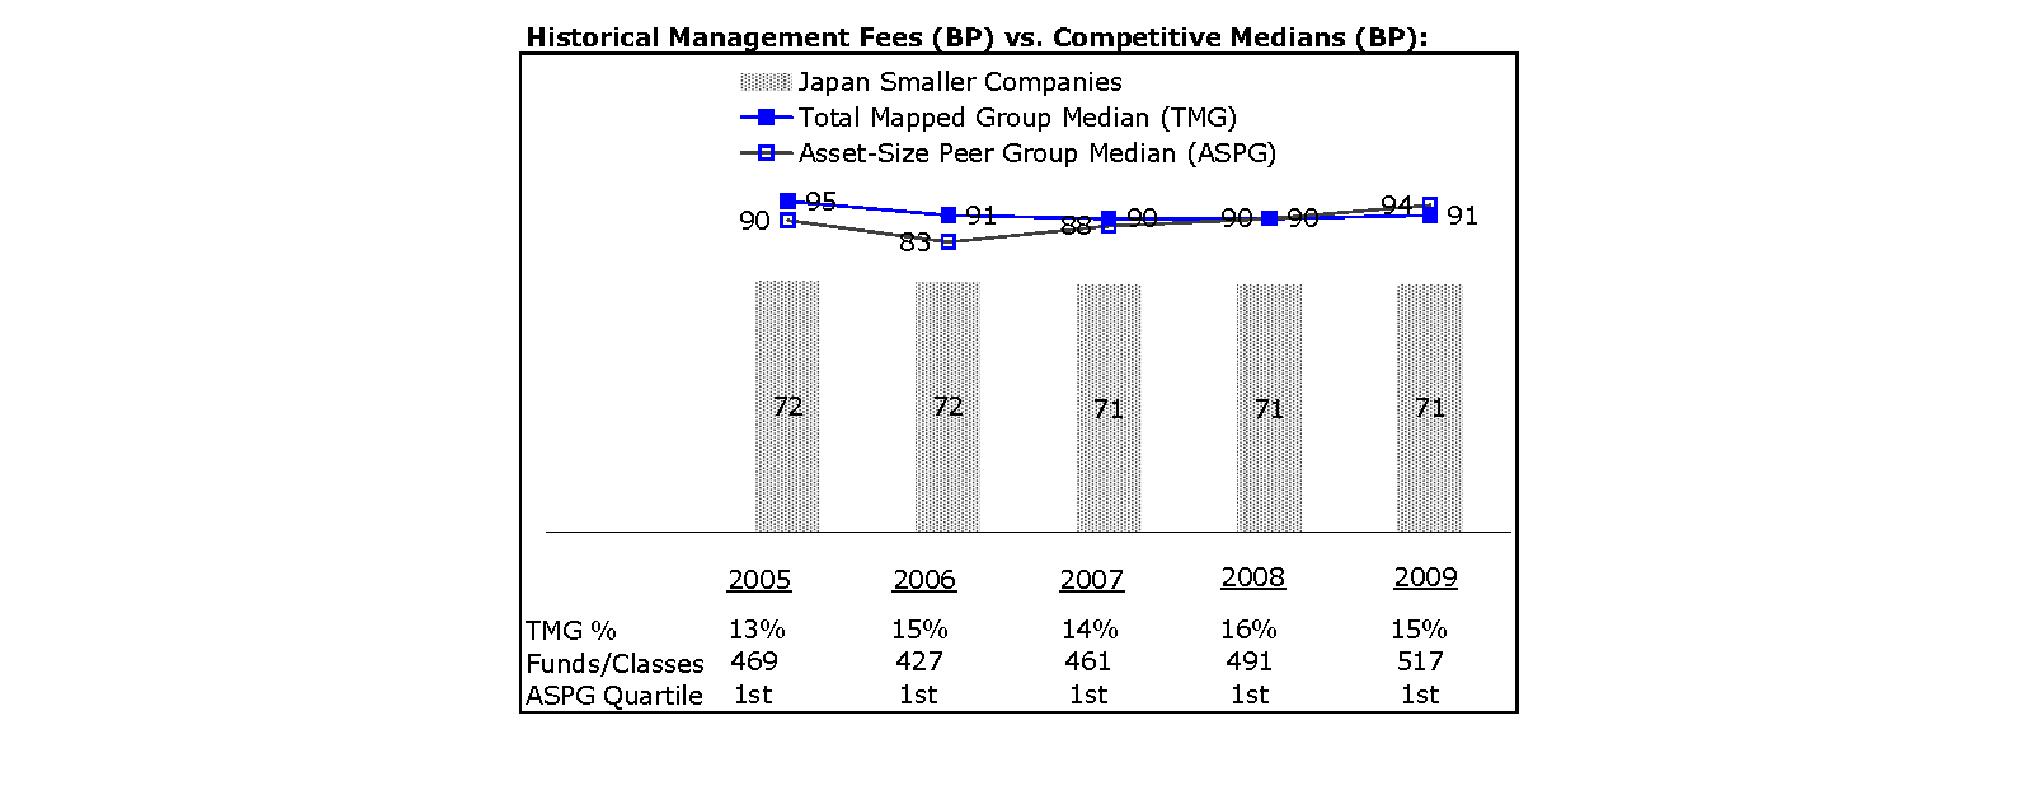
The Board noted that the fund's management fee ranked below the median of its Total Mapped Group and below the median of its ASPG for 2009.
Fidelity Latin America Fund

The Board noted that the fund's management fee ranked below the median of its Total Mapped Group and below the median of its ASPG for 2009.
Annual Report
Fidelity Nordic Fund
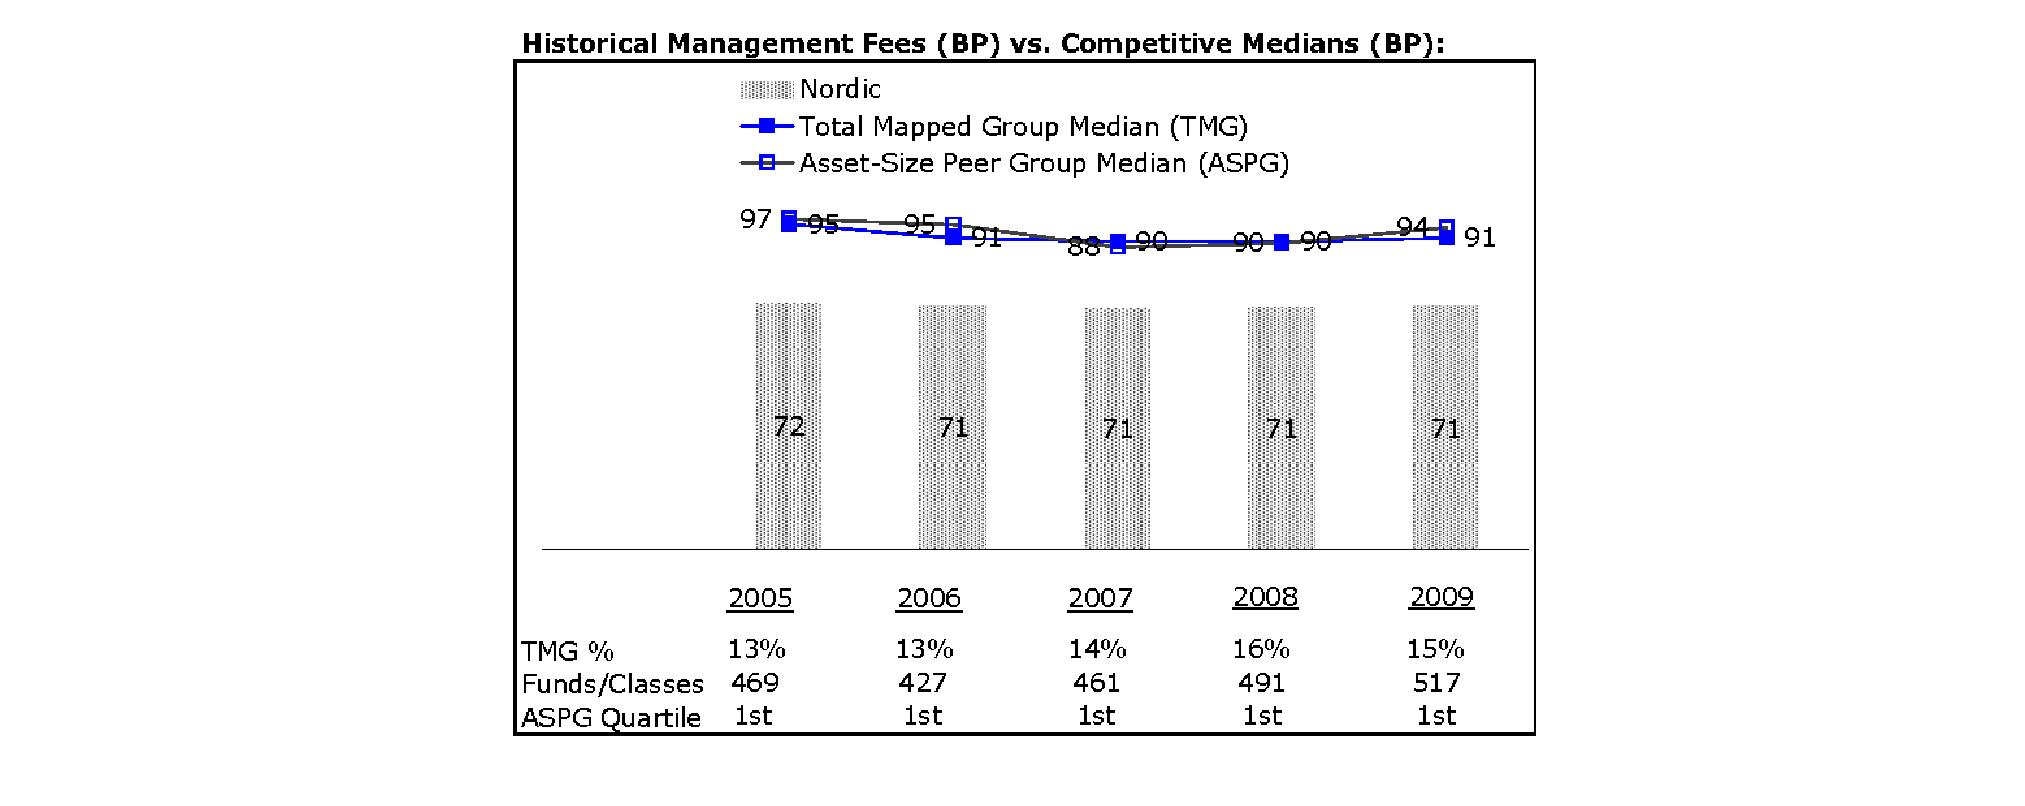
The Board noted that the fund's management fee ranked below the median of its Total Mapped Group and below the median of its ASPG for 2009.
Fidelity Pacific Basin Fund
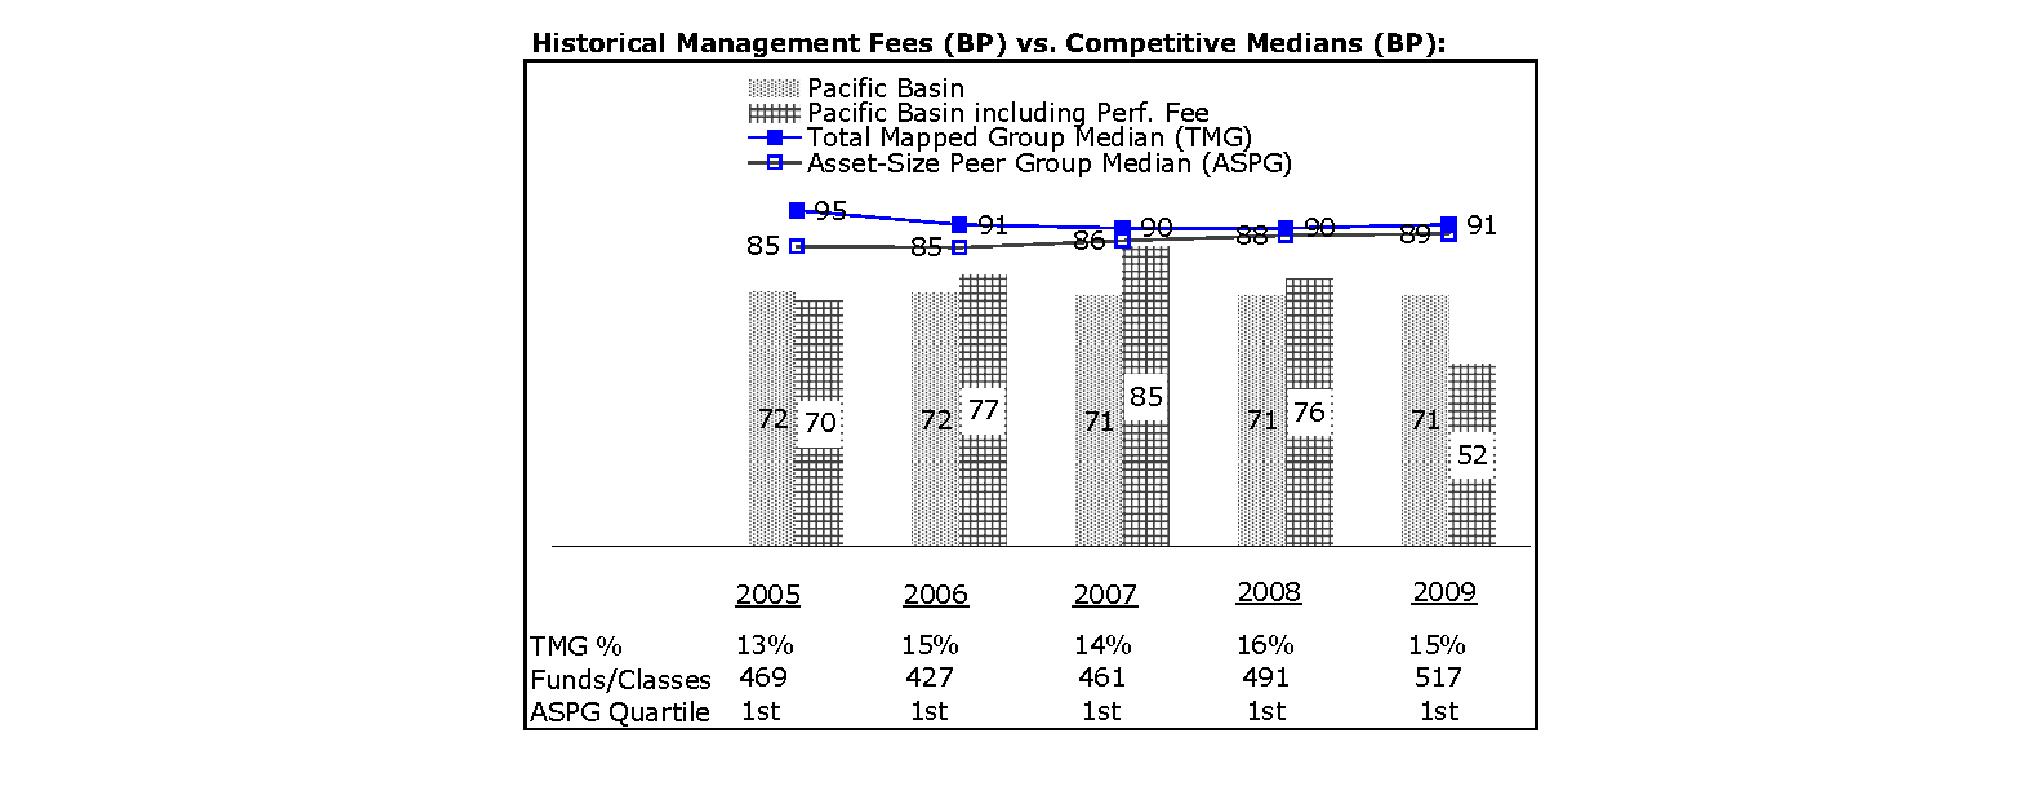
The Board noted that the fund's management fee ranked below the median of its Total Mapped Group and below the median of its ASPG for 2009. The Board also noted the effect of the fund's negative performance adjustment on the fund's management fee ranking. The Board noted that the performance adjustment for each year represents calculations for performance periods that differ from the periods shown in the performance charts above.
Annual Report
Board Approval of Investment Advisory Contracts and Management Fees - continued
Fidelity Southeast Asia Fund
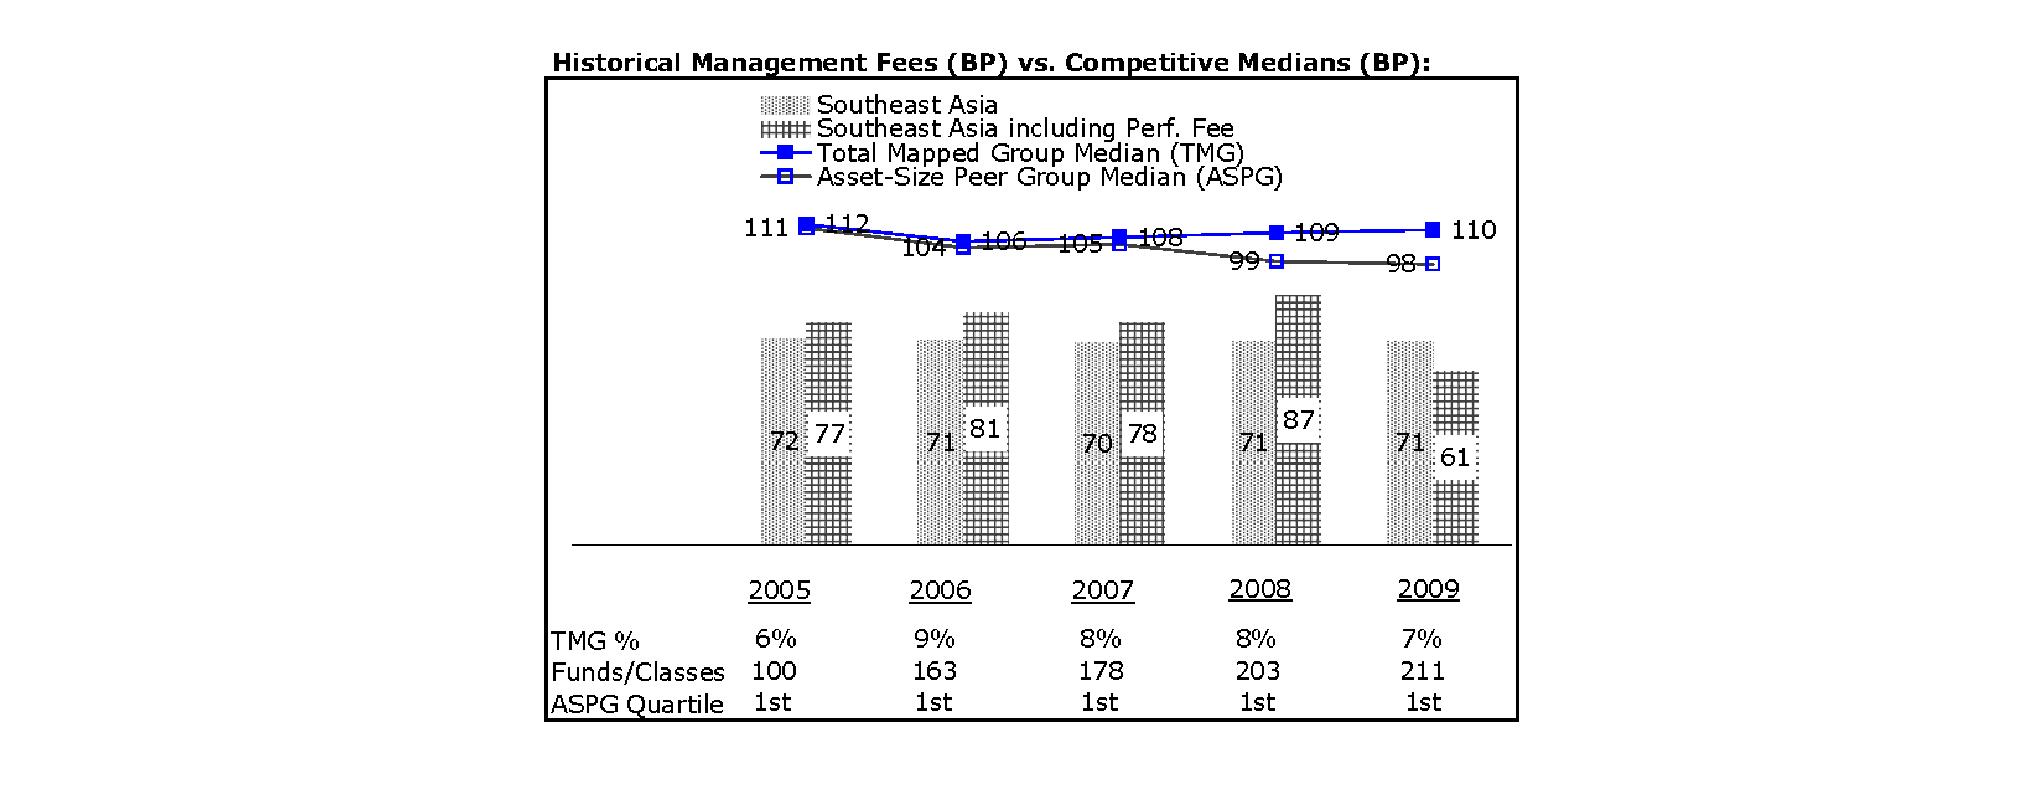
The Board noted that the fund's management fee ranked below the median of its Total Mapped Group and below the median of its ASPG for 2009. The Board also noted the effect of the fund's negative performance adjustment on the fund's management fee ranking. The Board noted that the performance adjustment for each year represents calculations for performance periods that differ from the periods shown in the performance charts above.
Furthermore, the Board considered that, on July 14, 2010, it had approved a proposal, subject to shareholder approval, to, among other things, change the index used to calculate Southeast Asia Fund's performance adjustment. The Board also considered that, if shareholders approve the change at a special meeting scheduled to be held in November 2010, because the performance adjustment is based on a rolling 36-month measurement period, during a transition period the fund's performance is compared to a blended index return that reflects the performance of the former index for the portion of the measurement period prior to the effective date of the change and the performance of the current index for the remainder of the measurement period.
Based on its review, the Board concluded that each fund's management fee is fair and reasonable in light of the services that the fund receives and the other factors considered.
Total Expenses (Canada Fund, China Region Fund, Emerging Markets Fund, Europe Fund, Japan Fund, and Southeast Asia Fund). In its review of the total expenses of each class of each fund, the Board considered the fund's management fee as well as other fund expenses, such as transfer agent fees, pricing and bookkeeping fees, fund-paid 12b-1 fees, and custodial, legal, and audit fees. The Board also noted the effects of any waivers and reimbursements on fees and expenses, as well as the impact of Canada Fund's, Europe Fund's, Japan Fund's, and Southeast Asia Fund's performance adjustment. As part of its review, the Board also considered current and historical total expenses of each class of each fund compared to competitive fund median expenses. Each class of each fund is compared to those funds and classes in the Total Mapped Group (used by the Board for management fee comparisons) that have a similar sales load structure.
The Board noted that the total expenses of each of Class A, Class B, Class C, Institutional Class, and the retail class of Canada Fund ranked below its competitive median for 2009 and the total expenses of Class T ranked above its competitive median for 2009. The Board considered that the total expenses for Class T were above the median primarily because its 12b-1 fee is higher than the typical front-end load class. The Board noted that the fund offers multiple classes, each of which has a different sales load and 12b-1 fee structure, and that the multiple structures are intended to offer a range of pricing options for the intermediary market. The Board also noted that the total expenses of the classes vary primarily by the level of their 12b-1 fees, although differences in transfer agent fees may also cause expenses to vary from class to class.
The Board noted that the total expenses of each class of China Region Fund, Emerging Markets Fund, Europe Fund, Japan Fund, and Southeast Asia Fund ranked below its competitive median for 2009.
Total Expenses (Europe Capital Appreciation Fund, Japan Smaller Companies Fund, Latin America Fund, Nordic Fund, and Pacific Basin Fund). In its review of each fund's total expenses, the Board considered the fund's management fee as well as other fund expenses, such as transfer agent fees, pricing and bookkeeping fees, and custodial, legal, and audit fees. The Board also noted the effects of any waivers and reimbursements on fees and expenses, as well as the impact of Europe Capital Appreciation Fund's and Pacific Basin Fund's performance adjustment. As part of its review, the Board also considered current and historical total expenses of each fund compared to competitive fund median expenses. Each fund is compared to those funds and classes in the Total Mapped Group (used by the Board for management fee comparisons) that have a similar sales load structure.
Annual Report
The Board noted that each fund's total expenses ranked below its competitive median for 2009.
Fees Charged to Other Fidelity Clients. The Board also considered Fidelity fee structures and other information with respect to clients of FMR and its affiliates, such as other mutual funds advised or subadvised by FMR or its affiliates, pension plan clients, and other institutional clients. In March 2010, the Board created an ad hoc joint committee with the board of other Fidelity funds (the Committee) to review and compare Fidelity's institutional investment advisory business with its business of providing services to the Fidelity funds, including the differences in services provided, fees charged, and costs incurred, as well as competition in their respective marketplaces.
Based on its review of total expenses and fees charged to other Fidelity clients, the Board concluded that the total expenses of each class of each fund were reasonable, although in one case above the median of the universe presented for comparison, in light of the services that the fund and its shareholders receive and the other factors considered, including the findings of the Committee.
Costs of the Services and Profitability. The Board considered the revenues earned and the expenses incurred by Fidelity in conducting the business of developing, marketing, distributing, managing, administering and servicing each fund and its shareholders. The Board also considered the level of Fidelity's profits in respect of all the Fidelity funds.
On an annual basis, FMR presents to the Board Fidelity's profitability for each fund. Fidelity calculates the profitability for each fund, as well as aggregate profitability for groups of Fidelity funds and all Fidelity funds, using a series of detailed revenue and cost allocation methodologies which originate with the audited books and records of Fidelity. The Audit Committee of the Board reviews any significant changes from the prior year's methodologies.
PricewaterhouseCoopers LLP (PwC), independent registered public accounting firm and auditor to Fidelity and certain Fidelity funds, has been engaged annually by the Board as part of the Board's assessment of Fidelity's profitability analysis. PwC's engagement includes the review and assessment of Fidelity's methodologies used in determining the revenues and expenses attributable to Fidelity's mutual fund business, and completion of agreed-upon procedures surrounding the mathematical accuracy of fund profitability and its conformity to allocation methodologies. After considering PwC's reports issued under the engagement and information provided by Fidelity, the Board believes that while other allocation methods may also be reasonable, Fidelity's profitability methodologies are reasonable in all material respects.
The Board has also reviewed Fidelity's non-fund businesses and fall-out benefits related to the mutual fund business as well as cases where Fidelity's affiliates may benefit from or be related to the funds' business.
The Board considered the costs of the services provided by and the profits realized by Fidelity in connection with the operation of each fund and were satisfied that the profitability was not excessive in the circumstances.
Economies of Scale. The Board considered whether there have been economies of scale in respect of the management of the Fidelity funds, whether the Fidelity funds (including each fund) have appropriately benefited from any such economies of scale, and whether there is potential for realization of any further economies of scale. The Board considered the extent to which each fund will benefit from economies of scale through increased services to the fund, through waivers or reimbursements, or through fee or expense reductions.
In February 2009, the Board and the board of other Fidelity funds created an ad hoc committee (the Economies of Scale Committee) to analyze whether FMR attains economies of scale in respect of the management and servicing of the Fidelity funds, whether the Fidelity funds have appropriately benefited from such economies of scale, and whether there is potential for realization of any further economies of scale.
The Board recognized that each fund's management contract incorporates a "group fee" structure, which provides for lower group fee rates as total fund assets under FMR's management increase, and for higher group fee rates as total fund assets under FMR's management decrease. FMR calculates the group fee rates based on a tiered asset "breakpoint" schedule that varies based on asset class. The Board considered that the group fee is designed to deliver the benefits of economies of scale to fund shareholders when total Fidelity fund assets increase, even if assets of any particular fund are unchanged or have declined, because some portion of Fidelity's costs are attributable to services provided to all Fidelity funds, and all funds benefit if those costs can be allocated among more assets. The Board concluded that, given the group fee structure, fund shareholders will benefit from lower management fees as assets under FMR's management increase at the fund complex level, regardless of whether Fidelity achieves any such economies of scale.
The Board concluded, considering the findings of the Economies of Scale Committee, that any potential economies of scale are being appropriately shared between fund shareholders and Fidelity.
Additional Information Requested by the Board. In order to develop fully the factual basis for consideration of the Fidelity funds' Advisory Contracts, the Board requested and received additional information on certain topics, including (i) fund performance trends, actions to be taken by FMR to improve certain funds' overall performance, and Fidelity's long-term strategies for certain funds; (ii) portfolio manager changes that have occurred during the past year and length of portfolio manager tenure for different categories of funds over time; (iii) Fidelity's compensation structure for portfolio managers, research analysts, and other key personnel, the rationale for the compensation structure, and how the compensation structure provides appropriate performance incentives; (iv) the amount of the investment that each portfolio manager has made in the Fidelity fund(s) that he or she manages; (v) management and other fees paid by FMR to affiliated sub-advisers on behalf of the Fidelity funds; (vi) Fidelity's fee structures and rationale for recommending different fees among different categories of funds; (vii) Fidelity's rationale for recommending which funds should have a performance adjustment component as part of their management fees; (viii) the rationale for any differences between fund fee structures and fee structures in place for other Fidelity clients; and (ix) explanations regarding the relative total expenses borne by certain funds and classes, total expense competitive trends, and actions that might be taken by FMR to reduce total expenses for certain funds and classes.
Annual Report
Board Approval of Investment Advisory Contracts and Management Fees - continued
Based on its evaluation of all of the conclusions noted above, and after considering all factors it believed relevant, the Board ultimately concluded that the advisory fee structures are fair and reasonable, and that each fund's Advisory Contracts should be renewed.
Annual Report
Investment Adviser
Fidelity Management & Research Company
Boston, MA
Investment Sub-Advisers
FMR Co., Inc.
Fidelity Management & Research
(U.K.) Inc.
Fidelity Management & Research
(Hong Kong) Limited
Fidelity Management & Research
(Japan) Inc.
Fidelity Research & Analysis Company
FIL Investments (Japan) Limited
FIL Investment Advisors
FIL Investment Advisors
(UK) Limited
General Distributor
Fidelity Distributors Corporation
Boston, MA
Transfer and Service Agents
Fidelity Investments Institutional
Operations Company, Inc.
Boston, MA
Fidelity Service Company, Inc.
Boston, MA
Custodians
JPMorgan Chase Bank
New York, NY
Fidelity Emerging Markets Fund, Fidelity Japan Fund,
Fidelity Pacific Basin Fund
Brown Brothers Harriman & Co.
Boston, MA
Fidelity China Region Fund, Fidelity Latin America Fund,
Fidelity Nordic Fund
The Bank of New York Mellon
New York, NY
Fidelity Canada Fund, Fidelity Europe Fund
The Northern Trust Company
Chicago, IL
Fidelity Emerging Asia Fund,
Fidelity Europe Capital Appreciation Fund,
Fidelity Japan Smaller Companies Fund
Fidelity's International Equity Funds
Fidelity Canada Fund
Fidelity China Region Fund
Fidelity Diversified International Fund
Fidelity Emerging Asia Fund
Fidelity Emerging Europe, Middle East, Africa (EMEA) Fund
Fidelity Emerging Markets Fund
Fidelity Europe Capital Appreciation Fund
Fidelity Europe Fund
Fidelity Global Balanced Fund
Fidelity Global Commodity Stock Fund
Fidelity International Capital Appreciation Fund
Fidelity International Discovery Fund
Fidelity International Growth Fund
Fidelity International Small Cap Fund
Fidelity International Small Cap Opportunities Fund
Fidelity International Value Fund
Fidelity Japan Fund
Fidelity Japan Smaller Companies Fund
Fidelity Latin America Fund
Fidelity Nordic Fund
Fidelity Overseas Fund
Fidelity Pacific Basin Fund
Fidelity Total International Equity Fund
Fidelity Worldwide Fund
Corporate Headquarters
82 Devonshire Street
Boston, MA 02109
www.fidelity.com
The Fidelity Telephone Connection
Mutual Fund 24-Hour Service
Exchanges/Redemptions
and Account Assistance 1-800-544-6666
Product Information 1-800-544-6666
Retirement Accounts 1-800-544-4774
(8 a.m. - 9 p.m.)
TDD Service 1-800-544-0118
for the deaf and hearing impaired
(9 a.m. - 9 p.m. Eastern time)
Fidelity Automated Service
Telephone (FAST®)
1-800-544-5555
Automated line for quickest service
TIF-UANNPRO-1210
1.784781.107
Fidelity AdvisorSM
Canada Fund -
Class A, Class T, Class B, and Class C
Annual Report
October 31, 2010
Class A, Class T, Class B, and Class C are
classes of Fidelity® Canada Fund
(2_fidelity_logos) (Registered_Trademark)
Contents
Chairman's Message | <Click Here> | The Chairman's message to shareholders. |
Performance | <Click Here> | How the fund has done over time. |
Management's Discussion of Fund Performance | <Click Here> | The Portfolio Manager's review of fund performance and strategy. |
Shareholder Expense Example | <Click Here> | An example of shareholder expenses. |
Investment Changes | <Click Here> | A summary of major shifts in the fund's investments over the past six months. |
Investments | <Click Here> | A complete list of the fund's investments with their market values. |
Financial Statements | <Click Here> | Statements of assets and liabilities, operations, and changes in net assets, as well as financial highlights. |
Notes | <Click Here> | Notes to the financial statements. |
Report of Independent Registered Public Accounting Firm | <Click Here> | |
Trustees and Officers | <Click Here> | |
Distributions | <Click Here> | |
Board Approval of Investment Advisory Contracts and Management Fees | <Click Here> | |
To view a fund's proxy voting guidelines and proxy voting record for the 12-month period ended June 30, visit http://www.fidelity.com/proxyvotingresults or visit the Securities and Exchange Commission's (SEC) web site at http://www.sec.gov. You may also call 1-877-208-0098 to request a free copy of the proxy voting guidelines.
Standard & Poor's, S&P and S&P 500 are registered service marks of The McGraw-Hill Companies, Inc. and have been licensed for use by Fidelity Distributors Corporation.
Other third party marks appearing herein are the property of their respective owners.
All other marks appearing herein are registered or unregistered trademarks or service marks of FMR LLC or an affiliated company.
This report and the financial statements contained herein are submitted for the general information of the shareholders of the fund. This report is not authorized for distribution to prospective investors in the fund unless preceded or accompanied by an effective prospectus.
A fund files its complete schedule of portfolio holdings with the SEC for the first and third quarters of each fiscal year on Form N-Q. Forms N-Q are available on the SEC's web site at http://www.sec.gov. A fund's Forms N-Q may be reviewed and copied at the SEC's Public Reference Room in Washington, DC. Information regarding the operation of the SEC's Public Reference Room may be obtained by calling 1-800-SEC-0330. For a complete list of a fund's portfolio holdings, view the most recent holdings listing, semiannual report, or annual report on Fidelity's web site at http://www.fidelity.com or http://www.advisor.fidelity.com, as applicable.
NOT FDIC INSURED • MAY LOSE VALUE • NO BANK GUARANTEE
Neither the fund nor Fidelity Distributors Corporation is a bank.
Annual Report
(photo_of_Edward_C_Johnson_3d)
Dear Shareholder:
Equities have staged a rally in the second half of 2010, shaking off concerns about the European debt crisis and the possibility of a double-dip recession in the U.S. Although the short-term surge pushed major equity indexes back into positive territory for the year, several questions remain about the longer-term outlook, including lackluster economic growth and persistently high unemployment. Financial markets are always unpredictable, of course, but there also are several time-tested investment principles that can help put the odds in your favor.
One of the basic tenets is to invest for the long term. Over time, riding out the markets' inevitable ups and downs has proven much more effective than selling into panic or chasing the hottest trend. Even missing only a few of the markets' best days can significantly diminish investor returns. Patience also affords the benefits of compounding - of earning interest on additional income or reinvested dividends and capital gains. There can be tax advantages and cost benefits to consider as well. While staying the course doesn't eliminate risk, it can considerably lessen the effect of short-term declines.
You can further manage your investing risk through diversification. And today, more than ever, geographic diversification should be taken into account. Studies indicate that asset allocation is the single most important determinant of a portfolio's long-term success. The right mix of stocks, bonds and cash - aligned to your particular risk tolerance and investment objective - is very important. Age-appropriate rebalancing is also an essential aspect of asset allocation. For younger investors, an emphasis on equities - which historically have been the best-performing asset class over time - is encouraged. As investors near their specific goal, such as retirement or sending a child to college, consideration may be given to replacing volatile assets (e.g. common stocks) with more-stable fixed investments (bonds or savings plans).
A third principle - investing regularly - can help lower the average cost of your purchases. Investing a certain amount of money each month or quarter helps ensure you won't pay for all your shares at market highs. This strategy - known as dollar cost averaging - also reduces "emotion" from investing, helping shareholders avoid selling weak performers just prior to an upswing, or chasing a hot performer just before a correction.
We invite you to contact us via the Internet, through our Investor Centers or by phone. It is our privilege to provide you the information you need to make the investments that are right for you.
Sincerely,
(The chairman's signature appears here.)
Edward C. Johnson 3d
Annual Report
Average annual total return reflects the change in the value of an investment, assuming reinvestment of the class' distributions from dividend income and capital gains (the profits earned upon the sale of securities that have grown in value, if any) and assuming a constant rate of performance each year. The $10,000 table and the fund's returns do not reflect the deduction of taxes that a shareholder would pay on fund distributions or the redemption of fund shares. During periods of reimbursement by Fidelity, a fund's total return will be greater than it would be had the reimbursement not occurred. How a fund did yesterday is no guarantee of how it will do tomorrow.
Average Annual Total Returns
Periods ended October 31, 2010 | Past 1
year | Past 5
years | Past 10
years |
Class A (incl. 5.75% sales charge)A | 15.57% | 7.49% | 10.33% |
Class T (incl. 3.50% sales charge) B | 17.99% | 7.79% | 10.49% |
Class B (incl. contingent deferred sales charge) C | 16.64% | 7.88% | 10.69% |
Class C (incl. contingent deferred sales charge) D | 20.68% | 8.19% | 10.69% |
A Class A shares bear a 0.25% 12b-1 fee. The initial offering of Class A shares took place on May 2, 2007. Returns prior to May 2, 2007 are those of Fidelity Canada Fund, the original class of the fund, which has no 12b-1 fee. Had Class A shares' 12b-1 fee been reflected, returns prior to May 2, 2007 would have been lower.
B Class T shares bear a 0.50% 12b-1 fee. The initial offering of Class T shares took place on May 2, 2007. Returns prior to May 2, 2007 are those of Fidelity Canada Fund, the original class of the fund, which has no 12b-1 fee. Had Class T shares' 12b-1 fee been reflected, returns prior to May 2, 2007 would have been lower.
C Class B shares bear a 1.00% 12b-1 fee. The initial offering of Class B shares took place on May 2, 2007. Returns prior to May 2, 2007 are those of Fidelity Canada Fund, the original class of the fund, which has no 12b-1 fee. Had Class B shares' 12b-1 fee been reflected, returns prior to May 2, 2007 would have been lower. Class B shares' contingent deferred sales charge included in the past one year, past five years, and past 10 years total return figures are 5%, 2%, and 0% respectively.
D Class C shares bear a 1.00% 12b-1 fee. The initial offering of Class C shares took place on May 2, 2007. Returns prior to May 2, 2007 are those of Fidelity Canada Fund, the original class of the fund, which has no 12b-1 fee. Had Class C shares' 12b-1 fee been reflected, returns prior to May 2, 2007 would have been lower. Class C shares' contingent deferred sales charge included in the past one year, past five years, and past 10 years total return figures are 1%, 0%, and 0%, respectively.
$10,000 Over 10 Years
Let's say hypothetically that $10,000 was invested in Fidelity AdvisorSM Canada Fund - Class A on October 31, 2000, and the current 5.75% sales charge was paid. The chart shows how the value of your investment would have changed, and also shows how the S&P®/TSX Composite Index performed over the same period. The initial offering of Class A took place on May 2, 2007. See above for additional information regarding the performance of Class A.
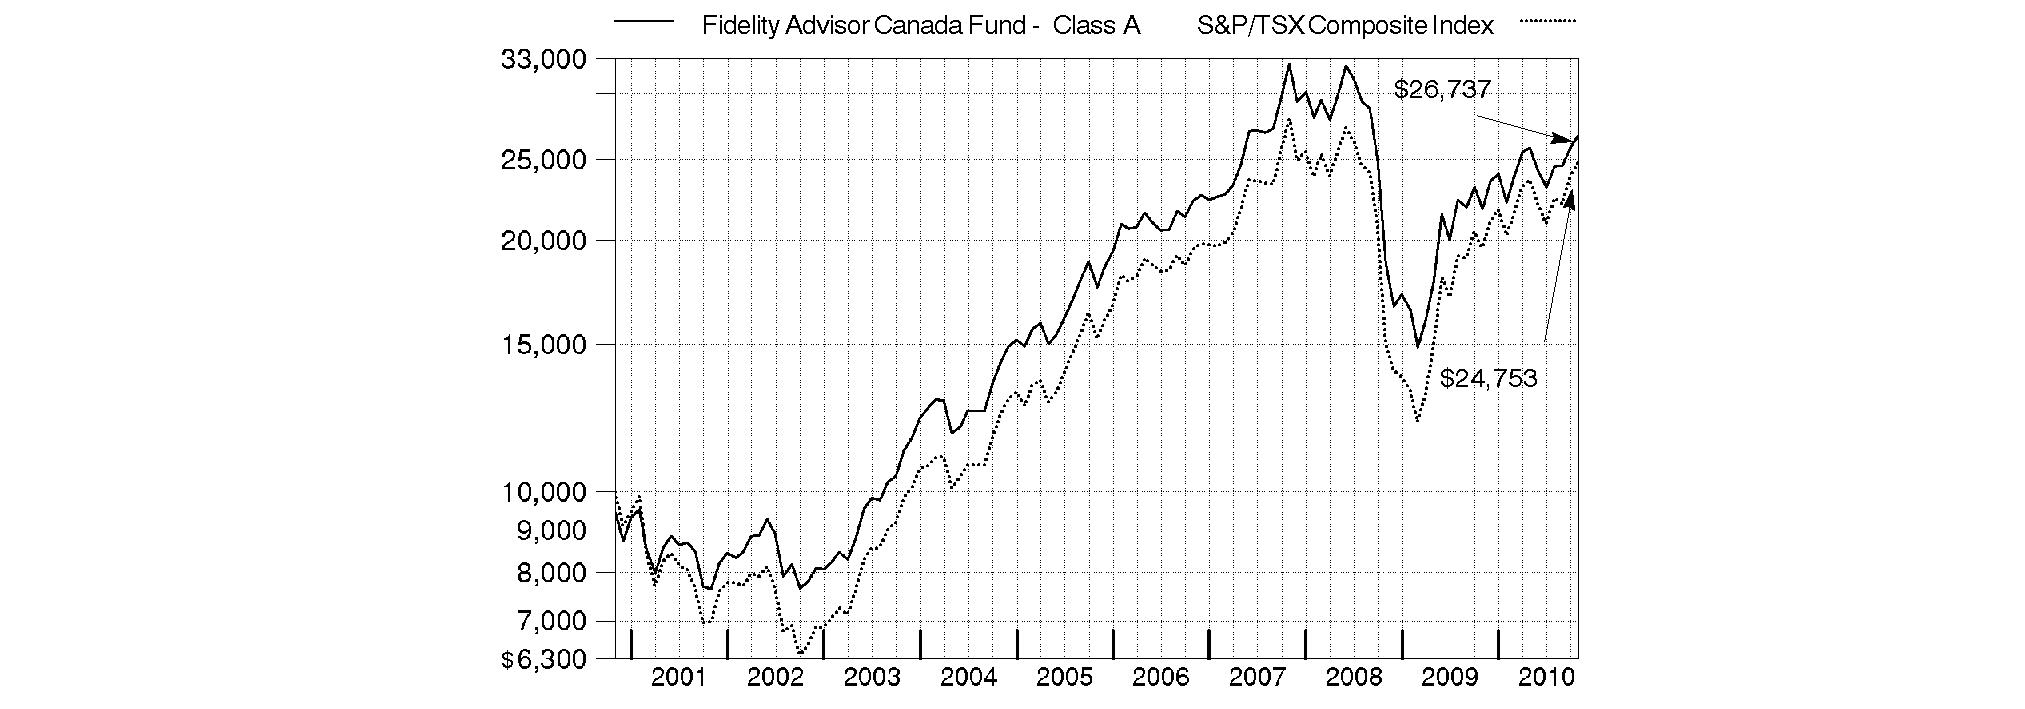
Annual Report
Market Recap: International stocks rode a wave of volatility similar to that of their U.S. counterparts during the 12 months ending October 31, 2010. Stocks gained modestly in the first half of the period, despite growing concerns about the European debt crisis. Sentiment turned decidedly negative in May and June, however, and the market suffered a precipitous decline. These losses were more than offset during the last four months of the period, when signs of economic growth and subsiding debt fears helped propel international stocks about 21%. For the full year, the MSCI® ACWI® (All Country World Index) ex USA Index gained 12.76%, boosted in part by a generally depreciating U.S. dollar. Within the index, Canada and emerging markets were standouts, returning 23% and 24%, respectively. Results in the latter group were led by strong-performing India, Mexico and South Africa, while China fell short of the MSCI benchmark due to cooling economic growth. The developed Asia ex Japan segment rose 16% for the period, lifted by solid results from Singapore and Hong Kong. Meanwhile, Europe rose just 9%, held back mainly by debt-riddled Spain and Italy, as well as lagging major constituent France. Japan returned only 5%, a result of that nation's continued weak economy.
Comments from Douglas Lober, Portfolio Manager of Fidelity AdvisorSM Canada Fund: For the 12 months ending October 31, 2010, the fund's Class A, Class T, Class B and Class C shares returned 22.62%, 22.27%, 21.64% and 21.68%, respectively (excluding sales charges), trailing the 26.45% gain of the S&P/TSX Composite Index. It was a solid period for Canadian equities, bolstered by a strengthening economy, surging global commodity prices and a strong Canadian dollar relative to the U.S. dollar. Versus the index, positioning in materials and technology hurt performance the most this period. Conversely, overweighting the top-performing health care sector, security selection in industrials and underweighting financials, especially insurance, supported results. The fund's biggest individual detractors were pairs of tech and materials stocks: enterprise software company Open Text, BlackBerry maker Research In Motion, base-metals producer Teck Resources and Barrick Gold. On the upside, underweighting Canadian life insurer Manulife Financial, which was sold from the fund, was the fund's largest contributor, followed by specialty pharmaceutical firm Biovail - which merged with Valeant Pharmaceuticals International - and crude oil and natural gas company Pacific Rubiales Energy.
Note to shareholders: Fidelity Advisor Canada Fund may invest up to 35% of its total assets in any industry that represents more than 20% of the Canadian market. As of October 31, 2010, the fund did not have more than 25% of its assets invested in any one industry.
The views expressed above reflect those of the portfolio manager(s) only through the end of the period as stated on the cover of this report and do not necessarily represent the views of Fidelity or any other person in the Fidelity organization. Any such views are subject to change at any time based upon market or other conditions and Fidelity disclaims any responsibility to update such views. These views may not be relied on as investment advice and, because investment decisions for a Fidelity fund are based on numerous factors, may not be relied on as an indication of trading intent on behalf of any Fidelity fund.
Annual Report
Fidelity Canada Fund
As a shareholder of the Fund, you incur two types of costs: (1) transaction costs, including sales charges (loads) on purchase payments or redemption proceeds, redemption fees, and (2) ongoing costs, including management fees, distribution and/or service (12b-1) fees and other Fund expenses. This Example is intended to help you understand your ongoing costs (in dollars) of investing in the Fund and to compare these costs with the ongoing costs of investing in other mutual funds.
The Example is based on an investment of $1,000 invested at the beginning of the period and held for the entire period (May 1, 2010 to October 31, 2010).
Actual Expenses
The first line of the accompanying table for each class of the Fund provides information about actual account values and actual expenses. You may use the information in this line, together with the amount you invested, to estimate the expenses that you paid over the period. Simply divide your account value by $1,000.00 (for example, an $8,600 account value divided by $1,000.00 = 8.6), then multiply the result by the number in the first line for a class of the Fund under the heading entitled "Expenses Paid During Period" to estimate the expenses you paid on your account during this period. A small balance maintenance fee of $12.00 that is charged once a year may apply for certain accounts with a value of less than $2,000. This fee is not included in the table below. If it was, the estimate of expenses you paid during the period would be higher, and your ending account value lower, by this amount. In addition, the Fund, as a shareholder in the underlying Fidelity Central Funds, will indirectly bear its pro-rata share of the fees and expenses incurred by the underlying Fidelity Central Funds. These fees and expenses are not included in the Fund's annualized expense ratio used to calculate the expense estimate in the table below.
Hypothetical Example for Comparison Purposes
The second line of the accompanying table for each class of the Fund provides information about hypothetical account values and hypothetical expenses based on a Class' actual expense ratio and an assumed rate of return of 5% per year before expenses, which is not the Class' actual return. The hypothetical account values and expenses may not be used to estimate the actual ending account balance or expenses you paid for the period. You may use this information to compare the ongoing costs of investing in the Fund and other funds. To do so, compare this 5% hypothetical example with the 5% hypothetical examples that appear in the shareholder reports of the other funds. A small balance maintenance fee of $12.00 that is charged once a year may apply for certain accounts with a value of less than $2,000. This fee is not included in the table below. If it was, the estimate of expenses you paid during the period would be higher, and your ending account value lower, by this amount. In addition, the Fund, as a shareholder in the underlying Fidelity Central Funds, will indirectly bear its pro-rata share of the fees and expenses incurred by the underlying Fidelity Central Funds. These fees and expenses are not included in the Fund's annualized expense ratio used to calculate the expense estimate in the table below.
Please note that the expenses shown in the table are meant to highlight your ongoing costs only and do not reflect any transaction costs. Therefore, the second line of the table is useful in comparing ongoing costs only, and will not help you determine the relative total costs of owning different funds. In addition, if these transactional costs were included, your costs would have been higher.
| Annualized
Expense Ratio | Beginning
Account Value
May 1, 2010 | Ending
Account Value
October 31, 2010 | Expenses Paid
During Period*
May 1, 2010 to
October 31, 2010 |
Class A | 1.24% | | | |
Actual | | $ 1,000.00 | $ 1,036.60 | $ 6.37 |
HypotheticalA | | $ 1,000.00 | $ 1,018.95 | $ 6.31 |
Class T | 1.50% | | | |
Actual | | $ 1,000.00 | $ 1,035.10 | $ 7.69 |
HypotheticalA | | $ 1,000.00 | $ 1,017.64 | $ 7.63 |
Class B | 2.00% | | | |
Actual | | $ 1,000.00 | $ 1,032.50 | $ 10.25 |
HypotheticalA | | $ 1,000.00 | $ 1,015.12 | $ 10.16 |
Class C | 1.98% | | | |
Actual | | $ 1,000.00 | $ 1,032.60 | $ 10.14 |
HypotheticalA | | $ 1,000.00 | $ 1,015.22 | $ 10.06 |
Canada | .92% | | | |
Actual | | $ 1,000.00 | $ 1,038.00 | $ 4.73 |
HypotheticalA | | $ 1,000.00 | $ 1,020.57 | $ 4.69 |
Institutional Class | .94% | | | |
Actual | | $ 1,000.00 | $ 1,038.00 | $ 4.83 |
HypotheticalA | | $ 1,000.00 | $ 1,020.47 | $ 4.79 |
A 5% return per year before expenses
* Expenses are equal to each Class' annualized expense ratio, multiplied by the average account value over the period, multiplied by 184/365 (to reflect the one-half year period).
Annual Report
Fidelity Canada Fund
Investment Changes (Unaudited)
Geographic Diversification (% of fund's net assets) |
As of October 31, 2010 |
| Canada | 98.4% | |
| United States of America | 1.6% | |

Percentages are adjusted for the effect of futures contracts, if applicable. |
As of April 30, 2010 |
| Canada | 98.2% | |
| United States of America | 1.8% | |

Percentages are adjusted for the effect of futures contracts, if applicable. |
Asset Allocation |
| % of fund's
net assets | % of fund's net assets
6 months ago |
Stocks | 99.1 | 99.3 |
Short-Term Investments and Net Other Assets | 0.9 | 0.7 |
Top Ten Stocks as of October 31, 2010 |
| % of fund's
net assets | % of fund's net assets
6 months ago |
Magna International, Inc. Class A (sub. vtg.) (Auto Components) | 5.1 | 1.3 |
Royal Bank of Canada (Commercial Banks) | 5.1 | 6.1 |
Toronto-Dominion Bank (Commercial Banks) | 4.5 | 5.3 |
Canadian National Railway Co. (Road & Rail) | 4.2 | 5.3 |
Bank of Nova Scotia (Commercial Banks) | 3.9 | 2.4 |
Valeant Pharmaceuticals International, Inc. (Pharmaceuticals) | 3.7 | 0.0 |
Barrick Gold Corp. (Metals & Mining) | 3.7 | 0.0 |
Talisman Energy, Inc. (Oil, Gas & Consumable Fuels) | 3.6 | 2.5 |
Goldcorp, Inc. (Metals & Mining) | 3.6 | 3.6 |
SXC Health Solutions Corp. (Health Care Technology) | 3.5 | 1.7 |
| 40.9 | |
Market Sectors as of October 31, 2010 |
| % of fund's
net assets | % of fund's net assets
6 months ago |
Materials | 24.0 | 18.1 |
Financials | 20.2 | 26.4 |
Energy | 15.6 | 20.9 |
Consumer Discretionary | 11.0 | 7.4 |
Industrials | 9.3 | 8.8 |
Health Care | 7.2 | 1.7 |
Information Technology | 5.8 | 9.6 |
Telecommunication Services | 4.5 | 3.7 |
Consumer Staples | 1.5 | 1.9 |
Utilities | 0.0 | 0.8 |
Annual Report
Fidelity Canada Fund
Investments October 31, 2010
Showing Percentage of Net Assets
Common Stocks - 99.1% |
| Shares | | Value |
CONSUMER DISCRETIONARY - 11.0% |
Auto Components - 5.1% |
Magna International, Inc. Class A (sub. vtg.) | 2,425,200 | | $ 219,335,670 |
Hotels, Restaurants & Leisure - 1.0% |
Tim Hortons, Inc. | 1,110,300 | | 41,738,310 |
Household Durables - 0.4% |
Dorel Industries, Inc. Class B (sub. vtg.) | 450,000 | | 15,169,134 |
Media - 1.3% |
Astral Media, Inc. Class A (non-vtg.) | 400,000 | | 16,040,788 |
Corus Entertainment, Inc. Class B (non-vtg.) | 600,000 | | 12,954,211 |
Groupe Aeroplan, Inc. | 100,000 | | 1,215,805 |
Quebecor, Inc. Class B (sub. vtg.) | 750,000 | | 27,054,123 |
| | 57,264,927 |
Multiline Retail - 1.0% |
Dollarama, Inc. | 1,678,775 | | 44,244,997 |
Textiles, Apparel & Luxury Goods - 2.2% |
Gildan Activewear, Inc. (a) | 3,269,100 | | 94,204,186 |
TOTAL CONSUMER DISCRETIONARY | | 471,957,224 |
CONSUMER STAPLES - 1.5% |
Food & Staples Retailing - 1.5% |
Alimentation Couche-Tard, Inc. Class B (sub. vtg.) | 1,290,200 | | 30,638,929 |
Metro, Inc. Class A (sub. vtg.) | 700,000 | | 32,120,796 |
| | 62,759,725 |
ENERGY - 15.6% |
Oil, Gas & Consumable Fuels - 15.6% |
Baytex Energy Trust | 850,000 | | 31,669,772 |
Cameco Corp. | 400,000 | | 12,373,762 |
Cenovus Energy, Inc. | 2,000,000 | | 55,652,515 |
Crescent Point Energy Corp. | 783,400 | | 31,031,827 |
Enbridge, Inc. | 2,508,900 | | 138,765,613 |
Gran Tierra Energy, Inc. (a) | 1,300,000 | | 9,687,224 |
Keyera Facilities Income Fund | 958,402 | | 29,741,566 |
Niko Resources Ltd. | 145,000 | | 13,833,219 |
Pacific Rubiales Energy Corp. (a) | 1,200,000 | | 38,250,809 |
Petrobank Energy & Resources Ltd. (a) | 350,000 | | 13,929,307 |
Suncor Energy, Inc. | 4,307,600 | | 138,025,657 |
Talisman Energy, Inc. | 8,500,000 | | 154,098,441 |
| | 667,059,712 |
FINANCIALS - 20.2% |
Commercial Banks - 17.4% |
Bank of Nova Scotia | 3,100,000 | | 166,170,213 |
Canadian Imperial Bank of Commerce | 1,344,600 | | 103,135,658 |
National Bank of Canada | 1,000,000 | | 65,820,178 |
Royal Bank of Canada | 4,040,000 | | 215,448,181 |
Toronto-Dominion Bank | 2,665,800 | | 191,982,557 |
| | 742,556,787 |
|
| Shares | | Value |
Insurance - 0.8% |
Intact Financial Corp. | 741,100 | | $ 33,563,495 |
Real Estate Investment Trusts - 0.0% |
RioCan (REIT) | 100,000 | | 2,260,025 |
Real Estate Management & Development - 2.0% |
Brookfield Asset Management, Inc. Class A | 1,750,000 | | 51,956,074 |
Brookfield Properties Corp. (d) | 1,900,000 | | 32,824,787 |
| | 84,780,861 |
TOTAL FINANCIALS | | 863,161,168 |
HEALTH CARE - 7.2% |
Health Care Technology - 3.5% |
SXC Health Solutions Corp. (a)(e) | 3,803,234 | | 148,489,830 |
Pharmaceuticals - 3.7% |
Valeant Pharmaceuticals International, Inc. | 5,688,351 | | 157,393,142 |
TOTAL HEALTH CARE | | 305,882,972 |
INDUSTRIALS - 9.3% |
Airlines - 0.8% |
Air Canada Class A (a)(d) | 9,475,000 | | 35,116,678 |
Commercial Services & Supplies - 2.1% |
IESI-BFC Ltd. | 3,750,000 | | 87,765,957 |
Construction & Engineering - 0.8% |
SNC-Lavalin Group, Inc. | 650,000 | | 33,204,236 |
Road & Rail - 4.5% |
Canadian National Railway Co. | 2,750,000 | | 178,120,404 |
Contrans Group, Inc. Class A | 878,500 | | 7,536,891 |
CSX Corp. | 100,000 | | 6,145,000 |
| | 191,802,295 |
Trading Companies & Distributors - 1.1% |
Finning International, Inc. | 2,050,000 | | 48,199,823 |
TOTAL INDUSTRIALS | | 396,088,989 |
INFORMATION TECHNOLOGY - 5.8% |
Communications Equipment - 2.0% |
Research In Motion Ltd. (a) | 1,530,000 | | 87,133,507 |
Internet Software & Services - 2.1% |
Open Text Corp. (a) | 1,993,740 | | 88,202,323 |
IT Services - 0.9% |
CGI Group, Inc. Class A (sub. vtg.) (a) | 2,590,000 | | 39,844,200 |
Software - 0.8% |
MacDonald Dettwiler & Associates Ltd. (a) | 650,000 | | 32,382,096 |
TOTAL INFORMATION TECHNOLOGY | | 247,562,126 |
Common Stocks - continued |
| Shares | | Value |
MATERIALS - 24.0% |
Chemicals - 5.2% |
Agrium, Inc. | 950,000 | | $ 84,036,670 |
Potash Corp. of Saskatchewan, Inc. | 950,000 | | 137,390,921 |
| | 221,427,591 |
Metals & Mining - 18.5% |
Barrick Gold Corp. | 3,250,000 | | 156,525,149 |
Consolidated Thompson Iron Mines Ltd. (a) | 2,250,000 | | 21,796,255 |
Detour Gold Corp. (a) | 1,280,000 | | 37,387,195 |
Eldorado Gold Corp. | 5,470,000 | | 92,623,689 |
European Goldfields Ltd. (a) | 600,000 | | 8,106,677 |
Goldcorp, Inc. | 3,400,000 | | 151,814,884 |
Grande Cache Coal Corp. (a) | 2,500,000 | | 17,158,545 |
IAMGOLD Corp. | 2,000,000 | | 36,493,774 |
Ivanhoe Mines Ltd. (a) | 800,000 | | 19,154,819 |
Kinross Gold Corp. | 300,000 | | 5,397,588 |
Osisko Mining Corp. (a) | 1,665,700 | | 23,093,439 |
Pan American Silver Corp. | 800,000 | | 25,536,002 |
Silver Wheaton Corp. (a) | 1,875,900 | | 53,928,216 |
Teck Resources Ltd. Class B (sub. vtg.) | 2,400,000 | | 107,304,638 |
Walter Energy, Inc. | 200,000 | | 17,592,000 |
Yamana Gold, Inc. | 1,500,000 | | 16,501,618 |
| | 790,414,488 |
Paper & Forest Products - 0.3% |
Sino-Forest Corp. (a) | 600,000 | | 11,859,986 |
TOTAL MATERIALS | | 1,023,702,065 |
TELECOMMUNICATION SERVICES - 4.5% |
Diversified Telecommunication Services - 2.8% |
BCE, Inc. (d) | 2,300,000 | | 77,147,760 |
TELUS Corp. (d) | 1,000,000 | | 44,318,070 |
| | 121,465,830 |
|
| Shares | | Value |
Wireless Telecommunication Services - 1.7% |
Rogers Communications, Inc. Class B (non-vtg.) | 2,000,000 | | $ 72,869,889 |
TOTAL TELECOMMUNICATION SERVICES | | 194,335,719 |
TOTAL COMMON STOCKS (Cost $3,395,319,218) | 4,232,509,700 |
Money Market Funds - 1.1% |
| | | |
Fidelity Cash Central Fund, 0.23% (b) | 16,109,355 | | 16,109,355 |
Fidelity Securities Lending Cash Central Fund, 0.24% (b)(c) | 31,292,644 | | 31,292,644 |
TOTAL MONEY MARKET FUNDS (Cost $47,401,999) | 47,401,999 |
TOTAL INVESTMENT PORTFOLIO - 100.2% (Cost $3,442,721,217) | | 4,279,911,699 |
NET OTHER ASSETS (LIABILITIES) - (0.2)% | | (9,998,244) |
NET ASSETS - 100% | $ 4,269,913,455 |
Legend |
(a) Non-income producing |
(b) Affiliated fund that is available only to investment companies and other accounts managed by Fidelity Investments. The rate quoted is the annualized seven-day yield of the fund at period end. A complete unaudited listing of the fund's holdings as of its most recent quarter end is available upon request. In addition, each Fidelity Central Fund's financial statements, which are not covered by the Fund's report of Independent Registered Public Accounting Firm, are available on the SEC's website or upon request. |
(c) Investment made with cash collateral received from securities on loan. |
(d) Security or a portion of the security is on loan at period end. |
(e) Affiliated company |
Affiliated Central Funds |
Information regarding fiscal year to date income earned by the Fund from investments in Fidelity Central Funds is as follows: |
Fund | Income earned |
Fidelity Cash Central Fund | $ 71,952 |
Fidelity Securities Lending Cash Central Fund | 3,863,210 |
Total | $ 3,935,162 |
Other Affiliated Issuers |
An affiliated company is a company in which the Fund has ownership of at least 5% of the voting securities. Fiscal year to date transactions with companies which are or were affiliates are as follows: |
Affiliate | Value,
beginning of period | Purchases | Sales
Proceeds | Dividend
Income | Value,
end of
period |
Air Canada Class A | $ - | $ 16,193,836 | $ - | $ - | $ - |
Grande Cache Coal Corp. | - | 40,052,532 | 26,878,041 | - | - |
SXC Health Solutions Corp. | 16,519,740 | 103,932,396 | - | - | 148,489,830 |
Total | $ 16,519,740 | $ 160,178,764 | $ 26,878,041 | $ - | $ 148,489,830 |
Other Information |
All investments are categorized as Level 1 under the Fair Value Hierarchy. The inputs or methodology used for valuing securities may not be an indication of the risk associated with investing in those securities. For more information on valuation inputs, please refer to the Security Valuation section in the accompanying Notes to Financial Statements. |
Income Tax Information |
At October 31, 2010, the Fund had a capital loss carryforward of approximately $243,313,729 of which $92,395,948 and $150,917,781 will expire on October 31, 2016 and 2017, respectively. Capital loss carryforwards are only available to offset future capital gains of the Fund to the extent provided by regulations and may be limited. |
See accompanying notes which are an integral part of the financial statements.
Annual Report
Fidelity Canada Fund
Statement of Assets and Liabilities
| October 31, 2010 |
| | |
Assets | | |
Investment in securities, at value (including securities loaned of $29,757,421) - See accompanying schedule: Unaffiliated issuers (cost $3,276,154,840) | $ 4,084,019,870 | |
Fidelity Central Funds (cost $47,401,999) | 47,401,999 | |
Other affiliated issuers (cost $119,164,378) | 148,489,830 | |
Total Investments (cost $3,442,721,217) | | $ 4,279,911,699 |
Foreign currency held at value (cost $1,389,752) | | 1,389,866 |
Receivable for investments sold | | 57,939,322 |
Receivable for fund shares sold | | 4,954,632 |
Dividends receivable | | 4,499,672 |
Distributions receivable from Fidelity Central Funds | | 9,305 |
Other receivables | | 318,991 |
Total assets | | 4,349,023,487 |
| | |
Liabilities | | |
Payable for investments purchased | $ 40,343,297 | |
Payable for fund shares redeemed | 4,151,509 | |
Accrued management fee | 2,176,024 | |
Distribution and service plan fees payable | 102,860 | |
Other affiliated payables | 915,239 | |
Other payables and accrued expenses | 128,459 | |
Collateral on securities loaned, at value | 31,292,644 | |
Total liabilities | | 79,110,032 |
| | |
Net Assets | | $ 4,269,913,455 |
Net Assets consist of: | | |
Paid in capital | | $ 3,663,079,350 |
Undistributed net investment income | | 26,745,120 |
Accumulated undistributed net realized gain (loss) on investments and foreign currency transactions | | (257,197,673) |
Net unrealized appreciation (depreciation) on investments and assets and liabilities in foreign currencies | | 837,286,658 |
Net Assets | | $ 4,269,913,455 |
Statement of Assets and Liabilities - continued
| October 31, 2010 |
| | |
Calculation of Maximum Offering Price Class A:
Net Asset Value and redemption price per share ($170,445,854 ÷ 3,167,830 shares) | | $ 53.81 |
| | |
Maximum offering price per share (100/94.25 of $53.81) | | $ 57.09 |
Class T:
Net Asset Value and redemption price per share ($31,521,786 ÷ 587,692 shares) | | $ 53.64 |
| | |
Maximum offering price per share (100/96.50 of $53.64) | | $ 55.59 |
Class B:
Net Asset Value and offering price per share ($13,463,848 ÷ 253,888 shares) A | | $ 53.03 |
| | |
Class C:
Net Asset Value and offering price per share ($54,052,232 ÷ 1,022,372 shares) A | | $ 52.87 |
| | |
Canada:
Net Asset Value, offering price and redemption price per share ($3,953,692,786 ÷ 73,023,771 shares) | | $ 54.14 |
| | |
Institutional Class:
Net Asset Value, offering price and redemption price per share ($46,736,949 ÷ 865,188 shares) | | $ 54.02 |
A Redemption price per share is equal to net asset value less any applicable contingent deferred sales charge.
See accompanying notes which are an integral part of the financial statements.
Annual Report
Fidelity Canada Fund
Financial Statements - continued
Statement of Operations
| Year ended October 31, 2010 |
| | |
Investment Income | | |
Dividends | | $ 77,463,667 |
Interest | | 460 |
Income from Fidelity Central Funds (including $3,863,210 from security lending) | | 3,935,162 |
Income before foreign taxes withheld | | 81,399,289 |
Less foreign taxes withheld | | (11,557,812) |
Total income | | 69,841,477 |
| | |
Expenses | | |
Management fee
Basic fee | $ 27,220,833 | |
Performance adjustment | (2,434,973) | |
Transfer agent fees | 9,229,104 | |
Distribution and service plan fees | 943,339 | |
Accounting and security lending fees | 1,532,504 | |
Custodian fees and expenses | 339,998 | |
Independent trustees' compensation | 21,432 | |
Registration fees | 169,539 | |
Audit | 70,900 | |
Legal | 18,293 | |
Interest | 1,574 | |
Miscellaneous | 50,594 | |
Total expenses before reductions | 37,163,137 | |
Expense reductions | (1,984,527) | 35,178,610 |
Net investment income (loss) | | 34,662,867 |
Realized and Unrealized Gain (Loss) Net realized gain (loss) on: | | |
Investment securities: | | |
Unaffiliated issuers | 86,472,773 | |
Other affiliated issuers | (2,411,623) | |
Investment not meeting investment restrictions | (275,664) | |
Foreign currency transactions | (295,766) | |
Payment from investment advisor for loss on investment not meeting investment restrictions | 275,664 | |
Capital gain distributions from Fidelity Central Funds | 1,133 | |
Total net realized gain (loss) | | 83,766,517 |
Change in net unrealized appreciation (depreciation) on: Investment securities | 640,635,315 | |
Assets and liabilities in foreign currencies | 411,031 | |
Total change in net unrealized appreciation (depreciation) | | 641,046,346 |
Net gain (loss) | | 724,812,863 |
Net increase (decrease) in net assets resulting from operations | | $ 759,475,730 |
Statement of Changes in Net Assets
| Year ended
October 31,
2010 | Year ended
October 31,
2009 |
Increase (Decrease) in Net Assets | | |
Operations | | |
Net investment income (loss) | $ 34,662,867 | $ 34,444,185 |
Net realized gain (loss) | 83,766,517 | (171,178,890) |
Change in net unrealized appreciation (depreciation) | 641,046,346 | 537,944,481 |
Net increase (decrease) in net assets resulting from operations | 759,475,730 | 401,209,776 |
Distributions to shareholders from net investment income | (34,208,293) | (10,179,804) |
Share transactions - net increase (decrease) | 243,266,632 | 30,108,212 |
Redemption fees | 759,127 | 779,120 |
Total increase (decrease) in net assets | 969,293,196 | 421,917,304 |
| | |
Net Assets | | |
Beginning of period | 3,300,620,259 | 2,878,702,955 |
End of period (including undistributed net investment income of $26,745,120 and undistributed net investment income of $26,298,051, respectively) | $ 4,269,913,455 | $ 3,300,620,259 |
See accompanying notes which are an integral part of the financial statements.
Annual Report
Financial Highlights - Class A
Years ended October 31, | 2010 | 2009 | 2008 | 2007 H |
Selected Per-Share Data | | | | |
Net asset value, beginning of period | $ 44.24 | $ 38.20 | $ 70.16 | $ 54.00 |
Income from Investment Operations | | | | |
Net investment income (loss) E | .31 | .38 | .39 | .19 |
Net realized and unrealized gain (loss) | 9.64 | 5.72 | (28.71) | 15.96 |
Total from investment operations | 9.95 | 6.10 | (28.32) | 16.15 |
Distributions from net investment income | (.39) | (.07) | (.41) | - |
Distributions from net realized gain | - | - | (3.27) | - |
Total distributions | (.39) | (.07) | (3.68) | - |
Redemption fees added to paid in capital E | .01 | .01 | .04 | .01 |
Net asset value, end of period | $ 53.81 | $ 44.24 | $ 38.20 | $ 70.16 |
Total Return B, C, D | 22.62% | 16.08% | (42.23)% | 29.93% |
Ratios to Average Net Assets F, I | | | | |
Expenses before reductions | 1.24% | 1.42% | 1.34% | 1.23% A |
Expenses net of fee waivers, if any | 1.24% | 1.42% | 1.34% | 1.23% A |
Expenses net of all reductions | 1.18% | 1.39% | 1.31% | 1.22% A |
Net investment income (loss) | .63% | .98% | .69% | .63% A |
Supplemental Data | | | | |
Net assets, end of period (000 omitted) | $ 170,446 | $ 83,015 | $ 56,242 | $ 20,912 |
Portfolio turnover rate G | 143% | 123% | 63% | 42% |
A Annualized
B Total returns for periods of less than one year are not annualized.
C Total returns would have been lower had certain expenses not been reduced during the periods shown.
D Total returns do not include the effect of the sales charges.
E Calculated based on average shares outstanding during the period.
F Fees and expenses of the underlying Fidelity Central Funds are not included in the Fund's expense ratio. The Fund indirectly bears its proportionate share of the expenses of any underlying Fidelity Central Funds.
G Amount does not include the portfolio activity of any underlying Fidelity Central Funds.
H For the period May 2, 2007 (commencement of sale of shares) to October 31, 2007.
I Expense ratios reflect operating expenses of the class. Expenses before reductions do not reflect amounts reimbursed by the investment adviser or reductions from brokerage service arrangements or reductions from other expense offset arrangements and do not represent the amount paid by the class during periods when reimbursements or reductions occur. Expense ratios before reductions for start-up periods may not be representative of longer-term operating periods. Expenses net of fee waivers reflect expenses after reimbursement by the investment adviser but prior to reductions from brokerage service arrangements or other expense offset arrangements. Expenses net of all reductions represent the net expenses paid by the class.
Financial Highlights - Class T
Years ended October 31, | 2010 | 2009 | 2008 | 2007 H |
Selected Per-Share Data | | | | |
Net asset value, beginning of period | $ 44.11 | $ 38.10 | $ 70.09 | $ 54.00 |
Income from Investment Operations | | | | |
Net investment income (loss) E | .18 | .27 | .23 | .09 |
Net realized and unrealized gain (loss) | 9.60 | 5.73 | (28.66) | 15.99 |
Total from investment operations | 9.78 | 6.00 | (28.43) | 16.08 |
Distributions from net investment income | (.26) | - | (.33) | - |
Distributions from net realized gain | - | - | (3.27) | - |
Total distributions | (.26) | - | (3.60) | - |
Redemption fees added to paid in capital E | .01 | .01 | .04 | .01 |
Net asset value, end of period | $ 53.64 | $ 44.11 | $ 38.10 | $ 70.09 |
Total Return B, C, D | 22.27% | 15.77% | (42.40)% | 29.80% |
Ratios to Average Net Assets F, I | | | | |
Expenses before reductions | 1.51% | 1.70% | 1.63% | 1.48% A |
Expenses net of fee waivers, if any | 1.51% | 1.70% | 1.63% | 1.48% A |
Expenses net of all reductions | 1.46% | 1.67% | 1.60% | 1.47% A |
Net investment income (loss) | .36% | .71% | .40% | .30% A |
Supplemental Data | | | | |
Net assets, end of period (000 omitted) | $ 31,522 | $ 17,727 | $ 14,963 | $ 14,522 |
Portfolio turnover rate G | 143% | 123% | 63% | 42% |
A Annualized
B Total returns for periods of less than one year are not annualized.
C Total returns would have been lower had certain expenses not been reduced during the periods shown.
D Total returns do not include the effect of the sales charges.
E Calculated based on average shares outstanding during the period.
F Fees and expenses of the underlying Fidelity Central Funds are not included in the Fund's expense ratio. The Fund indirectly bears its proportionate share of the expenses of any underlying Fidelity Central Funds.
G Amount does not include the portfolio activity of any underlying Fidelity Central Funds.
H For the period May 2, 2007 (commencement of sale of shares) to October 31, 2007.
I Expense ratios reflect operating expenses of the class. Expenses before reductions do not reflect amounts reimbursed by the investment adviser or reductions from brokerage service arrangements or reductions from other expense offset arrangements and do not represent the amount paid by the class during periods when reimbursements or reductions occur. Expense ratios before reductions for start-up periods may not be representative of longer-term operating periods. Expenses net of fee waivers reflect expenses after reimbursement by the investment adviser but prior to reductions from brokerage service arrangements or other expense offset arrangements. Expenses net of all reductions represent the net expenses paid by the class.
See accompanying notes which are an integral part of the financial statements.
Annual Report
Financial Highlights - Class B
Years ended October 31, | 2010 | 2009 | 2008 | 2007 H |
Selected Per-Share Data | | | | |
Net asset value, beginning of period | $ 43.68 | $ 37.91 | $ 69.88 | $ 54.00 |
Income from Investment Operations | | | | |
Net investment income (loss) E | (.07) | .08 | (.06) | (.06) |
Net realized and unrealized gain (loss) | 9.50 | 5.68 | (28.54) | 15.93 |
Total from investment operations | 9.43 | 5.76 | (28.60) | 15.87 |
Distributions from net investment income | (.09) | - | (.14) | - |
Distributions from net realized gain | - | - | (3.27) | - |
Total distributions | (.09) | - | (3.41) | - |
Redemption fees added to paid in capital E | .01 | .01 | .04 | .01 |
Net asset value, end of period | $ 53.03 | $ 43.68 | $ 37.91 | $ 69.88 |
Total Return B, C, D | 21.64% | 15.22% | (42.68)% | 29.41% |
Ratios to Average Net Assets F, I | | | | |
Expenses before reductions | 2.01% | 2.19% | 2.13% | 2.00% A |
Expenses net of fee waivers, if any | 2.01% | 2.19% | 2.13% | 2.00% A |
Expenses net of all reductions | 1.96% | 2.16% | 2.10% | 1.99% A |
Net investment income (loss) | (.14)% | .21% | (.10)% | (.21)% A |
Supplemental Data | | | | |
Net assets, end of period (000 omitted) | $ 13,464 | $ 7,283 | $ 5,615 | $ 4,078 |
Portfolio turnover rate G | 143% | 123% | 63% | 42% |
A Annualized
B Total returns for periods of less than one year are not annualized.
C Total returns would have been lower had certain expenses not been reduced during the periods shown.
D Total returns do not include the effect of the contingent deferred sales charge.
E Calculated based on average shares outstanding during the period.
F Fees and expenses of the underlying Fidelity Central Funds are not included in the Fund's expense ratio. The Fund indirectly bears its proportionate share of the expenses of any underlying Fidelity Central Funds.
G Amount does not include the portfolio activity of any underlying Fidelity Central Funds.
H For the period May 2, 2007 (commencement of sale of shares) to October 31, 2007.
I Expense ratios reflect operating expenses of the class. Expenses before reductions do not reflect amounts reimbursed by the investment adviser or reductions from brokerage service arrangements or reductions from other expense offset arrangements and do not represent the amount paid by the class during periods when reimbursements or reductions occur. Expense ratios before reductions for start-up periods may not be representative of longer-term operating periods. Expenses net of fee waivers reflect expenses after reimbursement by the investment adviser but prior to reductions from brokerage service arrangements or other expense offset arrangements. Expenses net of all reductions represent the net expenses paid by the class.
Financial Highlights - Class C
Years ended October 31, | 2010 | 2009 | 2008 | 2007 H |
Selected Per-Share Data | | | | |
Net asset value, beginning of period | $ 43.60 | $ 37.84 | $ 69.91 | $ 54.00 |
Income from Investment Operations | | | | |
Net investment income (loss) E | (.06) | .09 | (.05) | (.04) |
Net realized and unrealized gain (loss) | 9.48 | 5.66 | (28.52) | 15.94 |
Total from investment operations | 9.42 | 5.75 | (28.57) | 15.90 |
Distributions from net investment income | (.16) | - | (.27) | - |
Distributions from net realized gain | - | - | (3.27) | - |
Total distributions | (.16) | - | (3.54) | - |
Redemption fees added to paid in capital E | .01 | .01 | .04 | .01 |
Net asset value, end of period | $ 52.87 | $ 43.60 | $ 37.84 | $ 69.91 |
Total Return B, C, D | 21.68% | 15.22% | (42.69)% | 29.46% |
Ratios to Average Net Assets F, I | | | | |
Expenses before reductions | 1.99% | 2.18% | 2.13% | 1.99% A |
Expenses net of fee waivers, if any | 1.99% | 2.18% | 2.13% | 1.99% A |
Expenses net of all reductions | 1.94% | 2.15% | 2.10% | 1.97% A |
Net investment income (loss) | (.12)% | .22% | (.10)% | (.15)% A |
Supplemental Data | | | | |
Net assets, end of period (000 omitted) | $ 54,052 | $ 24,848 | $ 16,716 | $ 8,752 |
Portfolio turnover rate G | 143% | 123% | 63% | 42% |
A Annualized
B Total returns for periods of less than one year are not annualized.
C Total returns would have been lower had certain expenses not been reduced during the periods shown.
D Total returns do not include the effect of the contingent deferred sales charge.
E Calculated based on average shares outstanding during the period.
F Fees and expenses of the underlying Fidelity Central Funds are not included in the Fund's expense ratio. The Fund indirectly bears its proportionate share of the expenses of any underlying Fidelity Central Funds.
G Amount does not include the portfolio activity of any underlying Fidelity Central Funds.
H For the period May 2, 2007 (commencement of sale of shares) to October 31, 2007.
I Expense ratios reflect operating expenses of the class. Expenses before reductions do not reflect amounts reimbursed by the investment adviser or reductions from brokerage service arrangements or reductions from other expense offset arrangements and do not represent the amount paid by the class during periods when reimbursements or reductions occur. Expense ratios before reductions for start-up periods may not be representative of longer-term operating periods. Expenses net of fee waivers reflect expenses after reimbursement by the investment adviser but prior to reductions from brokerage service arrangements or other expense offset arrangements. Expenses net of all reductions represent the net expenses paid by the class.
See accompanying notes which are an integral part of the financial statements.
Annual Report
Financial Highlights - Canada
Years ended October 31, | 2010 | 2009 | 2008 | 2007 | 2006 |
Selected Per-Share Data | | | | | |
Net asset value, beginning of period | $ 44.46 | $ 38.37 | $ 70.25 | $ 49.48 | $ 39.14 |
Income from Investment Operations | | | | | |
Net investment income (loss) B | .46 | .48 | .58 | .52 | .34 |
Net realized and unrealized gain (loss) | 9.68 | 5.74 | (28.83) | 21.62 | 10.15 |
Total from investment operations | 10.14 | 6.22 | (28.25) | 22.14 | 10.49 |
Distributions from net investment income | (.47) | (.14) | (.40) | (.36) | (.16) |
Distributions from net realized gain | - | - | (3.27) | (1.03) | (.01) |
Total distributions | (.47) | (.14) | (3.67) | (1.39) | (.17) |
Redemption fees added to paid in capital B | .01 | .01 | .04 | .02 | .02 |
Net asset value, end of period | $ 54.14 | $ 44.46 | $ 38.37 | $ 70.25 | $ 49.48 |
Total Return A | 22.97% | 16.40% | (42.06)% | 46.03% | 26.93% |
Ratios to Average Net Assets C, E | | | | | |
Expenses before reductions | .94% | 1.17% | 1.03% | .96% | 1.00% |
Expenses net of fee waivers, if any | .94% | 1.17% | 1.03% | .96% | 1.00% |
Expenses net of all reductions | .89% | 1.13% | 1.00% | .94% | .97% |
Net investment income (loss) | .93% | 1.24% | 1.00% | .94% | .74% |
Supplemental Data | | | | | |
Net assets, end of period (000 omitted) | $ 3,953,693 | $ 3,149,791 | $ 2,776,298 | $ 4,890,617 | $ 3,136,927 |
Portfolio turnover rate D | 143% | 123% | 63% | 42% | 50% |
A Total returns would have been lower had certain expenses not been reduced during the periods shown.
B Calculated based on average shares outstanding during the period.
C Fees and expenses of the underlying Fidelity Central Funds are not included in the Fund's expense ratio. The Fund indirectly bears its proportionate share of the expenses of any underlying Fidelity Central Funds.
D Amount does not include the portfolio activity of any underlying Fidelity Central Funds.
E Expense ratios reflect operating expenses of the class. Expenses before reductions do not reflect amounts reimbursed by the investment adviser or reductions from brokerage service arrangements or reductions from other expense offset arrangements and do not represent the amount paid by the class during periods when reimbursements or reductions occur. Expenses net of fee waivers reflect expenses after reimbursement by the investment adviser but prior to reductions from brokerage service arrangements or other expense offset arrangements. Expenses net of all reductions represent the net expenses paid by the class.
Financial Highlights - Institutional Class
Years ended October 31, | 2010 | 2009 | 2008 | 2007 G |
Selected Per-Share Data | | | | |
Net asset value, beginning of period | $ 44.39 | $ 38.31 | $ 70.25 | $ 54.00 |
Income from Investment Operations | | | | |
Net investment income (loss) D | .46 | .49 | .52 | .25 |
Net realized and unrealized gain (loss) | 9.65 | 5.72 | (28.78) | 15.99 |
Total from investment operations | 10.11 | 6.21 | (28.26) | 16.24 |
Distributions from net investment income | (.49) | (.14) | (.45) | - |
Distributions from net realized gain | - | - | (3.27) | - |
Total distributions | (.49) | (.14) | (3.72) | - |
Redemption fees added to paid in capital D | .01 | .01 | .04 | .01 |
Net asset value, end of period | $ 54.02 | $ 44.39 | $ 38.31 | $ 70.25 |
Total Return B, C | 22.94% | 16.40% | (42.11)% | 30.09% |
Ratios to Average Net Assets E, H | | | | |
Expenses before reductions | .95% | 1.17% | 1.11% | 1.01% A |
Expenses net of fee waivers, if any | .95% | 1.17% | 1.11% | 1.01% A |
Expenses net of all reductions | .90% | 1.14% | 1.08% | .99% A |
Net investment income (loss) | .92% | 1.23% | .92% | .83% A |
Supplemental Data | | | | |
Net assets, end of period (000 omitted) | $ 46,737 | $ 17,956 | $ 8,870 | $ 4,064 |
Portfolio turnover rate F | 143% | 123% | 63% | 42% |
A Annualized
B Total returns for periods of less than one year are not annualized.
C Total returns would have been lower had certain expenses not been reduced during the periods shown.
D Calculated based on average shares outstanding during the period.
E Fees and expenses of the underlying Fidelity Central Funds are not included in the Fund's expense ratio. The Fund indirectly bears its proportionate share of the expenses of any underlying Fidelity Central Funds.
F Amount does not include the portfolio activity of any underlying Fidelity Central Funds.
G For the period May 2, 2007 (commencement of sale of shares) to October 31, 2007.
H Expense ratios reflect operating expenses of the class. Expenses before reductions do not reflect amounts reimbursed by the investment adviser or reductions from brokerage service arrangements or reductions from other expense offset arrangements and do not represent the amount paid by the class during periods when reimbursements or reductions occur. Expense ratios before reductions for start-up periods may not be representative of longer-term operating periods. Expenses net of fee waivers reflect expenses after reimbursement by the investment adviser but prior to reductions from brokerage service arrangements or other expense offset arrangements. Expenses net of all reductions represent the net expenses paid by the class.
See accompanying notes which are an integral part of the financial statements.
Annual Report
Notes to Financial Statements
For the period ended October 31, 2010
1. Organization.
Fidelity Canada Fund (the Fund) is a fund of Fidelity Investment Trust (the Trust) and is authorized to issue an unlimited number of shares. The Trust is registered under the Investment Company Act of 1940, as amended (the 1940 Act), as an open-end management investment company organized as a Massachusetts business trust. The Fund offers Class A, Class T, Class C, Canada and Institutional Class shares, each of which has equal rights as to assets and voting privileges. Effective after the close of business on September 1, 2010, Class B shares were closed to new accounts and additional purchases by existing shareholders. Each class has exclusive voting rights with respect to matters that affect that class. Class B shares will automatically convert to Class A shares after a holding period of seven years from the initial date of purchase. Investment income, realized and unrealized capital gains and losses, the common expenses of the Fund, and certain fund-level expense reductions, if any, are allocated on a pro-rata basis to each class based on the relative net assets of each class to the total net assets of the Fund. Each class differs with respect to transfer agent and distribution and service plan fees incurred. Certain expense reductions also differ by class.
2. Investments in Fidelity Central Funds.
The Fund may invest in Fidelity Central Funds, which are open-end investment companies available only to other investment companies and accounts managed by Fidelity Management & Research Company (FMR) and its affiliates. The Fund's Schedule of Investments lists each of the Fidelity Central Funds held as of period end, if any, as an investment of the Fund, but does not include the underlying holdings of each Fidelity Central Fund. As an Investing Fund, the Fund indirectly bears its proportionate share of the expenses of the underlying Fidelity Central Funds.
The Money Market Central Funds seek preservation of capital and current income and are managed by Fidelity Investments Money Management, Inc. (FIMM), an affiliate of FMR.
A complete unaudited list of holdings for each Fidelity Central Fund is available upon request or at the Securities and Exchange Commission (the SEC) web site at www.sec.gov. In addition, the financial statements of the Fidelity Central Funds, which are not covered by the Fund's Report of Independent Registered Public Accounting Firm, are available on the SEC web site or upon request.
3. Significant Accounting Policies.
The financial statements have been prepared in conformity with accounting principles generally accepted in the United States of America (GAAP), which require management to make certain estimates and assumptions at the date of the financial statements. Actual results could differ from those estimates. The following summarizes the significant accounting policies of the Fund:
Security Valuation. Investments are valued as of 4:00 p.m. Eastern time on the last calendar day of the period. The Fund uses independent pricing services approved by the Board of Trustees to value its investments. When current market prices or quotations are not readily available or reliable, valuations may be determined in good faith in accordance with procedures adopted by the Board of Trustees. Factors used in determining value may include market or security specific events. The frequency with which these procedures are used cannot be predicted and they may be utilized to a significant extent. The value used for net asset value (NAV) calculation under these procedures may differ from published prices for the same securities.
The Fund categorizes the inputs to valuation techniques used to value its investments into a disclosure hierarchy consisting of three levels as shown below.
Level 1 - quoted prices in active markets for identical investments
Level 2 - other significant observable inputs (including quoted prices for similar investments, interest rates, prepayment speeds, etc.)
Level 3 - unobservable inputs (including the fund's own assumptions based on the best information available)
Changes in valuation techniques may result in transfers in or out of an assigned level within the disclosure hierarchy. The aggregate value of investments by input level, as of October 31, 2010 is included at the end of the Fund's Schedule of Investments. Valuation techniques used to value the Fund's investments by major category are as follows.
Equity securities, including restricted securities, for which market quotations are readily available, are valued at the last reported sale price or official closing price as reported by an independent pricing service on the primary market or exchange on which they are traded and are categorized as Level 1 in the hierarchy. In the event there were no sales during the day or closing prices are not available, securities are valued at the last quoted bid price or may be valued using the last available price and are generally categorized as Level 2 in the hierarchy. For foreign equity securities, when significant market or security specific events arise, comparisons to the valuation of American Depositary Receipts (ADRs), futures contracts, Exchange-traded funds (ETFs) and certain indexes as well as quoted prices for similar securities are used and are categorized as Level 2 in the hierarchy in these circumstances. Utilizing these techniques may result in transfers between Level 1 and Level 2. For restricted equity securities and private placements where observable inputs are limited, assumptions about market activity and risk are used and are categorized as Level 3 in the hierarchy.
Annual Report
3. Significant Accounting Policies - continued
Security Valuation - continued
Investments in open-end mutual funds, including the Fidelity Central Funds, are valued at their closing net asset value each business day and are categorized as Level 1 in the hierarchy. Short-term securities with remaining maturities of sixty days or less for which quotations are not readily available are valued at amortized cost, which approximates fair value and are categorized as Level 2 in the hierarchy.
Foreign Currency. The Fund uses foreign currency contracts to facilitate transactions in foreign-denominated securities. Gains and losses from these transactions may arise from changes in the value of the foreign currency or if the counterparties do not perform under the contracts' terms.
Foreign-denominated assets, including investment securities, and liabilities are translated into U.S. dollars at the exchange rate at period end. Purchases and sales of investment securities, income and dividends received and expenses denominated in foreign currencies are translated into U.S. dollars at the exchange rate in effect on the transaction date.
The effects of exchange rate fluctuations on investments are included with the net realized and unrealized gain (loss) on investment securities. Other foreign currency transactions resulting in realized and unrealized gain (loss) are disclosed separately.
Investment Transactions and Income. For financial reporting purposes, the Fund's investment holdings and NAV include trades executed through the end of the last business day of the period. The NAV per share for processing shareholder transactions is calculated as of the close of business of the New York Stock Exchange (NYSE), normally 4:00 p.m. Eastern time and includes trades executed through the end of the prior business day. Gains and losses on securities sold are determined on the basis of identified cost and may include proceeds received from litigation. Dividend income is recorded on the ex-dividend date, except for certain dividends from foreign securities where the ex-dividend date may have passed, which are recorded as soon as the Fund is informed of the ex-dividend date. Non-cash dividends included in dividend income, if any, are recorded at the fair market value of the securities received. Distributions received on securities that represent a return of capital or capital gain are recorded as a reduction of cost of investments and/or as a realized gain. The Fund estimates the components of distributions received that may be considered return of capital distributions or capital gain distributions. Interest income and distributions from the Fidelity Central Funds are accrued as earned. Interest income includes coupon interest and amortization of premium and accretion of discount on debt securities. Investment income is recorded net of foreign taxes withheld where recovery of such taxes is uncertain.
Expenses. Most expenses of the Trust can be directly attributed to a fund. Expenses which cannot be directly attributed are apportioned amongst each fund in the Trust. Expense estimates are accrued in the period to which they relate and adjustments are made when actual amounts are known.
Income Tax Information and Distributions to Shareholders. Each year, the Fund intends to qualify as a regulated investment company, including distributing substantially all of its taxable income and realized gains under Subchapter M of the Internal Revenue Code and filing its U.S. federal tax return. As a result, no provision for income taxes is required. As of October 31, 2010, the Fund did not have any unrecognized tax benefits in the accompanying financial statements. A fund's federal tax return is subject to examination by the Internal Revenue Service (IRS) for a period of three years. Foreign taxes are provided for based on the Fund's understanding of the tax rules and rates that exist in the foreign markets in which it invests.
Distributions are declared and recorded on the ex-dividend date. Income dividends and capital gain distributions are declared separately for each class. Income and capital gain distributions are determined in accordance with income tax regulations, which may differ from GAAP.
Capital accounts within the financial statements are adjusted for permanent book-tax differences. These adjustments have no impact on net assets or the results of operations. Temporary book-tax differences will reverse in a subsequent period.
Book-tax differences are primarily due to short-term gain distributions from Fidelity Central Funds, foreign currency transactions, passive foreign investment companies (PFIC), deferred trustees compensation, capital loss carryforwards and losses deferred due to wash sales.
The federal tax cost of investment securities and unrealized appreciation (depreciation) as of period end were as follows:
Gross unrealized appreciation | $ 808,571,125 |
Gross unrealized depreciation | (20,169,137) |
Net unrealized appreciation (depreciation) | $ 788,401,988 |
| |
Tax Cost | $ 3,491,509,711 |
The tax-based components of distributable earnings as of period end were as follows:
Undistributed ordinary income | $ 61,650,009 |
Capital loss carryforward | $ (243,313,729) |
Net unrealized appreciation (depreciation) | $ 788,498,050 |
Annual Report
Notes to Financial Statements - continued
3. Significant Accounting Policies - continued
Income Tax Information and Distributions to Shareholders - continued
The tax character of distributions paid was as follows:
| October 31, 2010 | October 31, 2009 |
Ordinary Income | $ 34,208,293 | $ 10,179,804 |
Short-Term Trading (Redemption) Fees. Shares held by investors in the Fund less than 90 days are subject to a redemption fee equal to 1.50% of the net asset value of shares redeemed. All redemption fees, which reduce the proceeds of the shareholder redemption, are retained by the Fund and accounted for as an addition to paid in capital.
4. Purchases and Sales of Investments.
Purchases and sales of securities, other than short-term securities, aggregated $5,636,566,398 and $5,347,008,329, respectively.
The Fund realized a loss on the sale of an investment not meeting the investment restrictions of the Fund. The loss was fully reimbursed by the Fund's investment advisor.
5. Fees and Other Transactions with Affiliates.
Management Fee. FMR and its affiliates provide the Fund with investment management related services for which the Fund pays a monthly management fee. The management fee is the sum of an individual fund fee rate that is based on an annual rate of .45% of the Fund's average net assets and a group fee rate that averaged .26% during the period. The group fee rate is based upon the average net assets of all the mutual funds advised by FMR. The group fee rate decreases as assets under management increase and increases as assets under management decrease. In addition, the management fee is subject to a performance adjustment (up to a maximum of ± .20% of the Fund's average net assets over a 36 month performance period). The upward or downward adjustment to the management fee is based on the relative investment performance of Canada, as compared to an appropriate benchmark index. For the period, the total annual management fee rate, including the performance adjustment, was .64% of the Fund's average net assets.
Distribution and Service Plan Fees. In accordance with Rule 12b-1 of the 1940 Act, the Fund has adopted separate Distribution and Service Plans for each class of shares. Certain classes pay Fidelity Distributors Corporation (FDC), an affiliate of FMR, separate Distribution and Service Fees, each of which is based on an annual percentage of each class' average net assets. In addition, FDC may pay financial intermediaries for selling shares of the Fund and providing shareholder support services. For the period, the Distribution and Service Fee rates, total fees and amounts retained by FDC were as follows:
| Distribution
Fee | Service
Fee | Paid to FDC | Retained
by FDC |
Class A | -% | .25% | $ 312,428 | $ 11,816 |
Class T | .25% | .25% | 123,743 | - |
Class B | .75% | .25% | 105,189 | 78,891 |
Class C | .75% | .25% | 401,979 | 204,393 |
| | | $ 943,339 | $ 295,100 |
Sales Load. FDC receives a front-end sales charge of up to 5.75% for selling Class A shares, and 3.50% for selling Class T shares, some of which is paid to financial intermediaries for selling shares of the Fund. FDC receives the proceeds of contingent deferred sales charges levied on Class A, Class T, Class B, and Class C redemptions. These charges depend on the holding period. The deferred sales charges range from 5% to 1% for Class B, 1% for Class C, 1.00% for certain purchases of Class A shares (1.00% to .50% prior to July 12, 2010) and .25% for certain purchases of Class T shares.
Annual Report
5. Fees and Other Transactions with Affiliates - continued
Sales Load - continued
For the period, sales charge amounts retained by FDC were as follows:
| Retained
by FDC |
Class A | $ 169,728 |
Class T | 20,643 |
Class B* | 19,800 |
Class C* | 8,543 |
| $ 218,714 |
* When Class B and Class C shares are initially sold, FDC pays commissions from its own resources to financial intermediaries through which the sales are made.
Transfer Agent Fees. Fidelity Investments Institutional Operations Company, Inc. (FIIOC), an affiliate of FMR, is the transfer, dividend disbursing and shareholder servicing agent for each class of the Fund. FIIOC receives account fees and asset-based fees that vary according to the account size and type of account of the shareholders of the respective classes of the Fund. FIIOC pays for typesetting, printing and mailing of shareholder reports, except proxy statements. For the period, transfer agent fees for each class were as follows:
| Amount | % of
Average
Net Assets |
Class A | $ 357,370 | .28 |
Class T | 77,021 | .31 |
Class B | 32,593 | .31 |
Class C | 116,977 | .29 |
Canada | 8,568,457 | .24 |
Institutional Class | 76,686 | .25 |
| $ 9,229,104 | |
Accounting and Security Lending Fees. Fidelity Service Company, Inc. (FSC), an affiliate of FMR, maintains the Fund's accounting records. The accounting fee is based on the level of average net assets for the month. Under a separate contract, FSC administers the security lending program. The security lending fee is based on the number and duration of lending transactions.
Brokerage Commissions. The Fund placed a portion of its portfolio transactions with brokerage firms which are affiliates of the investment adviser. The commissions paid to these affiliated firms were $650 for the period.
Interfund Lending Program. Pursuant to an Exemptive Order issued by the SEC, the Fund, along with other registered investment companies having management contracts with FMR, may participate in an interfund lending program. This program provides an alternative credit facility allowing the funds to borrow from, or lend money to, other participating affiliated funds. At period end, there were no interfund loans outstanding. The Fund's activity in this program during the period for which loans were outstanding was as follows:
Borrower or Lender | Average Daily
Loan Balance | Weighted Average Interest Rate | Interest
Expense |
Borrower | $ 7,003,722 | .45% | $ 1,574 |
6. Committed Line of Credit.
The Fund participates with other funds managed by FMR or an affiliate in a $3.75 billion credit facility (the "line of credit") to be utilized for temporary or emergency purposes to fund shareholder redemptions or for other short-term liquidity purposes. The Fund has agreed to pay commitment fees on its pro-rata portion of the line of credit, which amounted to $14,854 and is reflected in Miscellaneous expenses on the Statement of Operations. During the period, there were no borrowings on this line of credit.
7. Security Lending.
The Fund lends portfolio securities through a lending agent from time to time in order to earn additional income. The lending agent may loan securities to certain qualified borrowers, including Fidelity Capital Markets (FCM), a broker-dealer affiliated with the Fund. On the settlement date of the loan, the Fund receives collateral (in the form of U.S. Treasury obligations, letters of credit and/or cash) against the loaned securities and maintains collateral in an amount not less than 100% of the market value of the loaned securities during the period of the loan. The market value of the loaned
Annual Report
Notes to Financial Statements - continued
7. Security Lending - continued
securities is determined at the close of business of the Fund and any additional required collateral is delivered to the Fund on the next business day. If the borrower defaults on its obligation to return the securities loaned because of insolvency or other reasons, a fund could experience delays and costs in recovering the securities loaned or in gaining access to the collateral. Any cash collateral received is invested in the Fidelity Securities Lending Cash Central Fund. The value of loaned securities and cash collateral at period end are disclosed on the Fund's Statement of Assets and Liabilities. Security lending income represents the income earned on investing cash collateral, less rebates paid to borrowers and lending agent fees associated with the loan, plus any premium payments received for lending certain types of securities. Security lending income is presented in the Statement of Operations as a component of income from Fidelity Central Funds. During the period, there were no securities loaned to FCM.
8. Expense Reductions.
Many of the brokers with whom FMR places trades on behalf of the Fund provided services to the Fund in addition to trade execution. These services included payments of certain expenses on behalf of the Fund totaling $1,984,527 for the period.
9. Distributions to Shareholders.
Distributions to shareholders of each class were as follows:
Years ended October 31, | 2010 | 2009 |
From net investment income | | |
Class A | $ 756,039 | $ 107,700 |
Class T | 106,904 | - |
Class B | 15,600 | - |
Class C | 97,752 | - |
Canada | 33,027,962 | 10,039,164 |
Institutional Class | 204,036 | 32,940 |
Total | $ 34,208,293 | $ 10,179,804 |
10. Share Transactions.
Transactions for each class of shares were as follows:
| Shares | Dollars |
Years ended October 31, | 2010 | 2009 | 2010 | 2009 |
Class A | | | | |
Shares sold | 2,050,255 | 894,135 | $ 102,518,373 | $ 37,345,647 |
Reinvestment of distributions | 14,622 | 3,241 | 696,013 | 102,525 |
Shares redeemed | (773,357) | (493,476) | (38,292,678) | (17,901,706) |
Net increase (decrease) | 1,291,520 | 403,900 | $ 64,921,708 | $ 19,546,466 |
Class T | | | | |
Shares sold | 296,633 | 153,535 | $ 14,818,898 | $ 6,072,136 |
Reinvestment of distributions | 2,182 | - | 103,790 | - |
Shares redeemed | (113,003) | (144,414) | (5,600,141) | (5,034,459) |
Net increase (decrease) | 185,812 | 9,121 | $ 9,322,547 | $ 1,037,677 |
Class B | | | | |
Shares sold | 134,473 | 68,778 | $ 6,579,801 | $ 2,732,178 |
Reinvestment of distributions | 263 | - | 12,424 | - |
Shares redeemed | (47,606) | (50,130) | (2,342,627) | (1,849,231) |
Net increase (decrease) | 87,130 | 18,648 | $ 4,249,598 | $ 882,947 |
Class C | | | | |
Shares sold | 647,123 | 311,799 | $ 31,812,568 | $ 13,003,041 |
Reinvestment of distributions | 1,580 | - | 74,410 | - |
Shares redeemed | (196,235) | (183,651) | (9,599,233) | (6,643,635) |
Net increase (decrease) | 452,468 | 128,148 | $ 22,287,745 | $ 6,359,406 |
Canada | | | | |
Shares sold | 20,151,337 | 19,139,057 | $ 1,010,632,290 | $ 774,158,834 |
Reinvestment of distributions | 659,119 | 306,492 | 31,486,105 | 9,628,844 |
Shares redeemed | (18,629,713) | (20,957,211) | (923,131,901) | (789,350,714) |
Net increase (decrease) | 2,180,743 | (1,511,662) | $ 118,986,494 | $ (5,563,036) |
Annual Report
10. Share Transactions - continued
| Shares | Dollars |
Years ended October 31, | 2010 | 2009 | 2010 | 2009 |
Institutional Class | | | | |
Shares sold | 717,543 | 280,690 | $ 36,118,321 | $ 11,718,786 |
Reinvestment of distributions | 2,830 | 737 | 134,893 | 23,131 |
Shares redeemed | (259,715) | (108,451) | (12,754,674) | (3,897,165) |
Net increase (decrease) | 460,658 | 172,976 | $ 23,498,540 | $ 7,844,752 |
11. Other.
The Fund's organizational documents provide former and current trustees and officers with a limited indemnification against liabilities arising in connection with the performance of their duties to the Fund. In the normal course of business, the Fund may also enter into contracts that provide general indemnifications. The Fund's maximum exposure under these arrangements is unknown as this would be dependent on future claims that may be made against the Fund. The risk of material loss from such claims is considered remote.
Annual Report
Report of Independent Registered Public Accounting Firm
To the Trustees of Fidelity Investment Trust and the Shareholders of Fidelity Canada Fund:
In our opinion, the accompanying statement of assets and liabilities, including the schedule of investments, and the related statements of operations and of changes in net assets and the financial highlights present fairly, in all material respects, the financial position of Fidelity Canada Fund (a fund of Fidelity Investment Trust) at October 31, 2010, the results of its operations for the year then ended, the changes in its net assets for each of the two years in the period then ended and the financial highlights for each of the periods indicated, in conformity with accounting principles generally accepted in the United States of America. These financial statements and financial highlights (hereafter referred to as "financial statements") are the responsibility of the Fidelity Canada Fund's management. Our responsibility is to express an opinion on these financial statements based on our audits. We conducted our audits of these financial statements in accordance with the standards of the Public Company Accounting Oversight Board (United States). Those standards require that we plan and perform the audit to obtain reasonable assurance about whether the financial statements are free of material misstatement. An audit includes examining, on a test basis, evidence supporting the amounts and disclosures in the financial statements, assessing the accounting principles used and significant estimates made by management, and evaluating the overall financial statement presentation. We believe that our audits, which included confirmation of securities at October 31, 2010 by correspondence with the custodian and brokers, provide a reasonable basis for our opinion.
/s/ PricewaterhouseCoopers LLP
PricewaterhouseCoopers LLP
Boston, Massachusetts
December 17, 2010
Annual Report
The Trustees, Member of the Advisory Board, and executive officers of the trust and fund, as applicable, are listed below. The Board of Trustees governs the fund and is responsible for protecting the interests of shareholders. The Trustees are experienced executives who meet periodically throughout the year to oversee the fund's activities, review contractual arrangements with companies that provide services to the fund, oversee management of the risks associated with such activities and contractual arrangements, and review the fund's performance. Except for James C. Curvey, each of the Trustees oversees 221 funds advised by FMR or an affiliate. Mr. Curvey oversees 410 funds advised by FMR or an affiliate.
The Trustees hold office without limit in time except that (a) any Trustee may resign; (b) any Trustee may be removed by written instrument, signed by at least two-thirds of the number of Trustees prior to such removal; (c) any Trustee who requests to be retired or who has become incapacitated by illness or injury may be retired by written instrument signed by a majority of the other Trustees; and (d) any Trustee may be removed at any special meeting of shareholders by a two-thirds vote of the outstanding voting securities of the trust. Each Trustee who is not an interested person (as defined in the 1940 Act) (Independent Trustee), shall retire not later than the last day of the calendar year in which his or her 72nd birthday occurs. The Independent Trustees may waive this mandatory retirement age policy with respect to individual Trustees. The executive officers and Advisory Board Member hold office without limit in time, except that any officer and Advisory Board Member may resign or may be removed by a vote of a majority of the Trustees at any regular meeting or any special meeting of the Trustees. Except as indicated, each individual has held the office shown or other offices in the same company for the past five years.
Experience, Skills, Attributes, and Qualifications of the Fund's Trustees. The Governance and Nominating Committee has adopted a statement of policy that describes the experience, qualifications, attributes, and skills that are necessary and desirable for potential Independent Trustee candidates (Statement of Policy). The Board believes that each Trustee satisfied at the time he or she was initially elected or appointed a Trustee, and continues to satisfy, the standards contemplated by the Statement of Policy. The Governance and Nominating Committee also engages professional search firms to help identify potential Independent Trustee candidates who have the experience, qualifications, attributes, and skills consistent with the Statement of Policy. From time to time, additional criteria based on the composition and skills of the current Independent Trustees, as well as experience or skills that may be appropriate in light of future changes to board composition, business conditions, and regulatory or other developments, have also been considered by the professional search firms and the Governance and Nominating Committee. In addition, the Board takes into account the Trustees' commitment and participation in Board and committee meetings, as well as their leadership of standing and ad hoc committees throughout their tenure.
In determining that a particular Trustee was and continues to be qualified to serve as a Trustee, the Board has considered a variety of criteria, none of which, in isolation, was controlling. The Board believes that, collectively, the Trustees have balanced and diverse experience, qualifications, attributes, and skills, which allow the Board to operate effectively in governing the fund and protecting the interests of shareholders. Information about the specific experience, skills, attributes, and qualifications of each Trustee, which in each case led to the Board's conclusion that the Trustee should serve (or continue to serve) as a trustee of the fund, is provided below.
Board Structure and Oversight Function. Edward C. Johnson 3d is an interested person (as defined in the 1940 Act) and currently serves as Chairman. The Trustees have determined that an interested Chairman is appropriate and benefits shareholders because an interested Chairman has a personal and professional stake in the quality and continuity of services provided to the fund. Independent Trustees exercise their informed business judgment to appoint an individual of their choosing to serve as Chairman, regardless of whether the Trustee happens to be independent or a member of management. The Independent Trustees have determined that they can act independently and effectively without having an Independent Trustee serve as Chairman and that a key structural component for assuring that they are in a position to do so is for the Independent Trustees to constitute a substantial majority for the Board. The Independent Trustees also regularly meet in executive session. Ned C. Lautenbach serves as Chairman of the Independent Trustees and as such (i) acts as a liaison between the Independent Trustees and management with respect to matters important to the Independent Trustees and (ii) with management prepares agendas for Board meetings.
Fidelity funds are overseen by different Boards of Trustees. The fund's Board oversees Fidelity's equity and high income funds and another Board oversees Fidelity's investment-grade bond, money market, and asset allocation funds. The asset allocation funds may invest in Fidelity funds overseen by the fund's Board. The use of separate Boards, each with its own committee structure, allows the Trustees of each group of Fidelity funds to focus on the unique issues of the funds they oversee, including common research, investment, and operational issues. On occasion, the separate Boards establish joint committees to address issues of overlapping consequences for the Fidelity funds overseen by each Board.
The Trustees operate using a system of committees to facilitate the timely and efficient consideration of all matters of importance to the Trustees, the fund, and fund shareholders and to facilitate compliance with legal and regulatory requirements and oversight of the fund's activities and associated risks. The Board, acting through its committees, has charged FMR and its affiliates with (i) identifying events or circumstances the occurrence of which could have demonstrably adverse effects on the fund's business and/or reputation; (ii) implementing processes and controls to lessen the possibility that such events or circumstances occur or to mitigate the effects of such events or circumstances if they do occur; and (iii) creating and maintaining a system designed to evaluate continuously business and market conditions in order to facilitate the identification and implementation processes described in (i) and (ii) above. Because the day-to-day operations and activities of the fund are carried out by or through FMR, its affiliates and other service providers, the fund's exposure to risks is mitigated but not eliminated by the processes overseen by the Trustees. While each of the Board's committees has responsibility for overseeing different aspects of the fund's activities, oversight is exercised primarily through the Operations, Audit, and Compliance Committees. Appropriate personnel, including but not limited to the fund's Chief Compliance Officer (CCO), FMR's internal auditor, the independent accountants, the fund's Treasurer and portfolio management personnel, make periodic reports to the Board's committees, as appropriate. The responsibilities of each committee, including their oversight responsibilities, are described further under "Standing Committees of the Fund's Trustees."
Annual Report
Trustees and Officers - continued
The fund's Statement of Additional Information (SAI) includes more information about the Trustees. To request a free copy, call Fidelity at 1-877-208-0098.
Interested Trustees*:
Correspondence intended for each Trustee who is an interested person may be sent to Fidelity Investments, 82 Devonshire Street, Boston, Massachusetts 02109.
Name, Age; Principal Occupations and Other Relevant Experience+ |
Edward C. Johnson 3d (80) |
| Year of Election or Appointment: 1984 Mr. Johnson is Trustee and Chairman of the Board of Trustees of certain Trusts. Mr. Johnson serves as Chief Executive Officer, Chairman, and a Director of FMR LLC; Chairman and a Director of FMR; Chairman and a Director of Fidelity Research & Analysis Company (FRAC); Chairman and a Director of Fidelity Investments Money Management, Inc.; and Chairman and a Director of FMR Co., Inc. In addition, Mr. Johnson serves as Chairman and Director of FIL Limited. Previously, Mr. Johnson served as President of FMR LLC (2006-2007). |
James C. Curvey (75) |
| Year of Election or Appointment: 2007 Mr. Curvey also serves as Trustee (2007-present) of other investment companies advised by FMR. Mr. Curvey is a Director of Fidelity Investments Money Management, Inc. (2009-present), Director of Fidelity Research & Analysis Co. (2009-present) and Director of FMR and FMR Co., Inc. (2007-present). Mr. Curvey is also Vice Chairman (2007-present) and Director of FMR LLC. In addition, Mr. Curvey serves as an Overseer for the Boston Symphony Orchestra and a member of the Trustees of Villanova University. Previously, Mr. Curvey was the Vice Chairman (2006-2007) and Director (2000-2007) of FMR Corp. |
* Trustees have been determined to be "Interested Trustees" by virtue of, among other things, their affiliation with the trust or various entities under common control with FMR.
+ The information above includes each Trustee's principal occupation during the last five years and other information relating to the experience, attributes, and skills relevant to each Trustee's qualifications to serve as a Trustee, which led to the conclusion that each Trustee should serve as a Trustee for the fund.
Independent Trustees:
Correspondence intended for each Independent Trustee (that is, the Trustees other than the Interested Trustees) may be sent to Fidelity Investments, P.O. Box 55235, Boston, Massachusetts 02205-5235.
Name, Age; Principal Occupations and Other Relevant Experience+ |
Dennis J. Dirks (62) |
| Year of Election or Appointment: 2005 Prior to his retirement in May 2003, Mr. Dirks was Chief Operating Officer and a member of the Board of The Depository Trust & Clearing Corporation (DTCC). He also served as President, Chief Operating Officer, and Board member of The Depository Trust Company (DTC) and President and Board member of the National Securities Clearing Corporation (NSCC). In addition, Mr. Dirks served as Chief Executive Officer and Board member of the Government Securities Clearing Corporation, Chief Executive Officer and Board member of the Mortgage-Backed Securities Clearing Corporation, as a Trustee and a member of the Finance Committee of Manhattan College (2005-2008), and as a Trustee and a member of the Finance Committee of AHRC of Nassau County (2006-2008). Mr. Dirks is a member of the Independent Directors Council (IDC) Governing Council (2010-Present) and Board of Directors for The Brookville Center for Children's Services, Inc. (2009-present). |
Alan J. Lacy (57) |
| Year of Election or Appointment: 2008 Mr. Lacy serves as Senior Adviser (2007-present) of Oak Hill Capital Partners, L.P. (private equity). Mr. Lacy also served as Chief Executive Officer (2000-2005) and Vice Chairman (2005-2006) of Sears Holdings Corporation and Sears, Roebuck and Co. (retail). In addition, Mr. Lacy serves as a member of the Board of Directors of The Western Union Company (global money transfer, 2006-present) and Bristol-Myers Squibb Company (global pharmaceuticals, 2007-present). Mr. Lacy is Chairman (2008-present) and a member (2006-present) of the Board of Trustees of The National Parks Conservation Association. |
Ned C. Lautenbach (66) |
| Year of Election or Appointment: 2000 Mr. Lautenbach is Chairman of the Independent Trustees of the Equity and High Income Funds (2006-present). Mr. Lautenbach currently serves as the Lead Director of the Eaton Corporation Board of Directors (diversified industrial, 1997-present). Mr. Lautenbach is also a member of the Board of Directors of the Philharmonic Center for the Arts in Naples, Florida (1999-
present); a member of the Board of Trustees of Fairfield University (2005-present); and a member of the Council on Foreign Relations (1994-present). Previously, Mr. Lautenbach was a Partner/Advisory Partner at Clayton, Dubilier & Rice, Inc. (private equity investment, 1998-2010), as well as a Director of Sony Corporation (2006-2007). |
Joseph Mauriello (66) |
| Year of Election or Appointment: 2008 Prior to his retirement in January 2006, Mr. Mauriello served in numerous senior management positions including Deputy Chairman and Chief Operating Officer (2004-2005), and Vice Chairman of Financial Services (2002-2004) of KPMG LLP US (professional services, 1965-2005). Mr. Mauriello currently serves as a member of the Board of Directors of XL Group plc. (global insurance and re-insurance, 2006-present) and of Arcadia Resources Inc. (health care services and products, 2007-present).
Previously, Mr. Mauriello served as a Director of the Hamilton Funds of the Bank of New York (2006-2007). |
Cornelia M. Small (66) |
| Year of Election or Appointment: 2005 Ms. Small is a member of the Board of Directors of the Teagle Foundation (2009-present). Ms. Small is also a member of the Investment Committee, and Chair (2008-present) and a member of the Board of Trustees of Smith College. In addition, Ms. Small serves on the Investment Committee of the Berkshire Taconic Community Foundation (2008-present). Previously, Ms. Small served as Chairperson of the Investment Committee (2002-2008) of Smith College. In addition, Ms. Small served as Chief Investment Officer, Director of Global Equity Investments, and a member of the Board of Directors of Scudder, Stevens & Clark and Scudder Kemper Investments. |
William S. Stavropoulos (71) |
| Year of Election or Appointment: 2001 Mr. Stavropoulos is Vice Chairman of the Independent Trustees of the Equity and High Income Funds (2006-present). Mr. Stavropoulos serves as President and Founder of the Michigan Baseball Foundation, the Great Lakes Loons (2007-present). Mr. Stavropoulos is Chairman Emeritus of the Board of Directors of The Dow Chemical Company, where he previously served in numerous senior management positions, including President, CEO (1995-2000; 2002-2004), Chairman of the Executive Committee (2000-2006), and as a member of the Board of Directors (1990-2006). Currently, Mr. Stavropoulos is Chairman of Univar (global distributor of commodity and specialty chemicals, 2010-present), a Director of Teradata Corporation (data warehousing and technology solutions, 2008-present), Chemical Financial Corporation, Maersk Inc. (industrial conglomerate), Tyco International, Inc. (multinational manufacturing and services, 2007-present), and a member of the Advisory Board for Metalmark Capital (private equity investment, 2005-present). Mr. Stavropoulos is a special advisor to Clayton, Dubilier & Rice, Inc. (private equity investment). In addition, Mr. Stavropoulos is a member of the University of Notre Dame Advisory Council for the College of Science. |
David M. Thomas (61) |
| Year of Election or Appointment: 2008 Previously, Mr. Thomas served as Executive Chairman (2005-2006) and Chairman and Chief Executive Officer (2000-2005) of IMS Health, Inc. (pharmaceutical and healthcare information solutions). In addition, Mr. Thomas serves as a member of the Board of Directors of Fortune Brands, Inc. (consumer products), and Interpublic Group of Companies, Inc. (marketing communication, 2004-present). |
Michael E. Wiley (60) |
| Year of Election or Appointment: 2008 Mr. Wiley also serves as a Director of Asia Pacific Exploration Consolidated (international oil and gas exploration and production, 2008-present). Mr. Wiley serves as a Director of Tesoro Corporation (independent oil refiner and marketer, 2005-present), and a Director of Bill Barrett Corporation (exploration and production, 2005-present). In addition, Mr. Wiley also serves as a Director of Post Oak Bank (privately-held bank, 2004-present). Previously, Mr. Wiley served as a member of the Board of Trustees of the University of Tulsa (2000-2006; 2007-2010), as a Senior Energy Advisor of Katzenbach Partners, LLC (consulting, 2006-2007), as an Advisory Director of Riverstone Holdings (private investment), Chairman, President, and CEO of Baker Hughes, Inc. (oilfield services, 2000-2004), and as Director of Spinnaker Exploration Company (exploration and production, 2001-2005). |
+ The information above includes each Trustee's principal occupation during the last five years and other information relating to the experience, attributes, and skills relevant to each Trustee's qualifications to serve as a Trustee, which led to the conclusion that each Trustee should serve as a Trustee for the fund.
Annual Report
Trustees and Officers - continued
Advisory Board Members and Executive Officers:
Correspondence intended for each executive officer and Peter S. Lynch may be sent to Fidelity Investments, 82 Devonshire Street, Boston, Massachusetts 02109.
Name, Age; Principal Occupation |
Peter S. Lynch (66) |
| Year of Election or Appointment: 2003 Member of the Advisory Board of Fidelity's Equity and High Income Funds. Mr. Lynch is Vice Chairman and a Director of FMR and FMR Co., Inc. In addition, Mr. Lynch serves as a Trustee of Boston College and as the Chairman of the Inner-City Scholarship Fund. Previously, Mr. Lynch served on the Special Olympics International Board of Directors (1997-2006). |
Kenneth B. Robins (41) |
| Year of Election or Appointment: 2008 President and Treasurer of Fidelity's Equity and High Income Funds. Mr. Robins also serves as President and Treasurer (2010-
present) and Assistant Treasurer (2009-present) of other Fidelity funds and is an employee of Fidelity Investments (2004-present). Previously, Mr. Robins served as Deputy Treasurer of the Fidelity funds (2005-2008) and Treasurer and Chief Financial Officer of The North Carolina Capital Management Trust: Cash and Term Portfolios (2006-2008). |
Bruce T. Herring (45) |
| Year of Election or Appointment: 2006 Vice President of certain Equity Funds. Mr. Herring also serves as Chief Investment Officer and Director of Fidelity Management & Research (U.K.) Inc. (2010-present) and Group Chief Investments Officer of FMR. Previously, Mr. Herring served as Vice President (2005-2006) and Senior Vice President (2006-2007) of Fidelity Management & Research Company, Vice President of FMR Co., Inc. (2001-2007) and as a portfolio manager for Fidelity U.S. Equity Funds. |
Brian B. Hogan (46) |
| Year of Election or Appointment: 2009 Vice President of certain Equity Funds and Vice President of Sector Funds. Mr. Hogan also serves as President of FMR's Equity Division (2009-present). Previously, Mr. Hogan served as Senior Vice President, Equity Research of FMR (2006-2009) and as a portfolio manager. |
Scott C. Goebel (42) |
| Year of Election or Appointment: 2008 Secretary and Chief Legal Officer (CLO) of the Fidelity funds. Mr. Goebel also serves as Secretary and CLO of The North Carolina Capital Management Trust: Cash and Term Portfolio (2008-present); General Counsel, Secretary, and Senior Vice President of FMR (2008-present) and FMR Co., Inc. (2008-present); Deputy General Counsel of FMR LLC; Chief Legal Officer of Fidelity Management & Research (Hong Kong) Limited (2008-present) and Assistant Secretary of Fidelity Management & Research (Japan) Inc. (2008-present), Fidelity Investments Money Management, Inc. (2008-present), Fidelity Management & Research (U.K.) Inc. (2008-present), and Fidelity Research and Analysis Company (2008-present). Previously, Mr. Goebel served as Assistant Secretary of the Funds (2007-2008) and as Vice President and Secretary of Fidelity Distributors Corporation (FDC) (2005-2007). |
William C. Coffey (41) |
| Year of Election or Appointment: 2009 Assistant Secretary of Fidelity's Equity and High Income Funds. Mr. Coffey also serves as Senior Vice President and Deputy General Counsel of FMR LLC (2010-present), and is an employee of Fidelity Investments. Previously, Mr. Coffey served as Vice President and Associate General Counsel of FMR LLC (2005-2009). |
Holly C. Laurent (56) |
| Year of Election or Appointment: 2008 Anti-Money Laundering (AML) Officer of the Fidelity funds. Ms. Laurent also serves as AML Officer of The North Carolina Capital Management Trust: Cash and Term Portfolio (2008-present) and is an employee of Fidelity Investments. Previously, Ms. Laurent was Senior Vice President and Head of Legal for Fidelity Business Services India Pvt. Ltd. (2006-2008), and Senior Vice President, Deputy General Counsel and Group Head for FMR LLC (2005-2006). |
Christine Reynolds (52) |
| Year of Election or Appointment: 2008 Chief Financial Officer of the Fidelity funds. Ms. Reynolds became President of Fidelity Pricing and Cash Management Services (FPCMS) in August 2008. Ms. Reynolds served as Chief Operating Officer of FPCMS (2007-2008). Previously, Ms. Reynolds served as President, Treasurer, and Anti-Money Laundering officer of the Fidelity funds (2004-2007). |
Kenneth A. Rathgeber (63) |
| Year of Election or Appointment: 2004 Chief Compliance Officer of Fidelity's Equity and High Income Funds. Mr. Rathgeber is Chief Compliance Officer of Fidelity Management & Research (Hong Kong) Limited (2008-present), Fidelity Management & Research (Japan) Inc. (2008-present), FMR (2005-present), FMR Co., Inc. (2005-present), Fidelity Management & Research (U.K.) Inc. (2005-present), Fidelity Research & Analysis Company (2005-present), Fidelity Investments Money Management, Inc. (2005-present), Pyramis Global Advisors, LLC (2005-present), and Strategic Advisers, Inc. (2005-present). |
Jeffrey S. Christian (49) |
| Year of Election or Appointment: 2009 Deputy Treasurer of the Fidelity funds. Mr. Christian is an employee of Fidelity Investments. Previously, Mr. Christian served as Chief Financial Officer (2008-2009) of certain Fidelity funds and Senior Vice President of Fidelity Pricing and Cash Management Services (FPCMS) (2004-2009). |
Bryan A. Mehrmann (43) |
| Year of Election or Appointment: 2005 Deputy Treasurer of the Fidelity funds. Mr. Mehrmann is an employee of Fidelity Investments. |
Adrien E. Deberghes (43) |
| Year of Election or Appointment: 2008 Deputy Treasurer of Fidelity's Equity and High Income Funds. Mr. Deberghes also serves as Assistant Treasurer of other Fidelity funds (2010-present) and is an employee of Fidelity Investments (2008-present). Previously, Mr. Deberghes served as Senior Vice President of Mutual Fund Administration at State Street Corporation (2007-2008), Senior Director of Mutual Fund Administration at Investors Bank & Trust (2005-2007), and Director of Finance for Dunkin' Brands (2000-2005). |
Stephanie J. Dorsey (41) |
| Year of Election or Appointment: 2010 Assistant Treasurer of Fidelity's Equity and High Income Funds. Ms. Dorsey also serves as Deputy Treasurer of other Fidelity funds (2008-present) and is an employee of Fidelity Investments (2008-present). Previously, Ms. Dorsey served as Treasurer (2004-2008) of the JPMorgan Mutual Funds and Vice President (2004-2008) of JPMorgan Chase Bank. |
John R. Hebble (52) |
| Year of Election or Appointment: 2009 Assistant Treasurer of Fidelity's Equity and High Income Funds. Mr. Hebble also serves as Treasurer and Chief Financial Officer of The North Carolina Capital Management Trust: Cash and Term Portfolio (2008-present), President and Treasurer of other Fidelity funds (2008-present) and is an employee of Fidelity Investments. |
Gary W. Ryan (52) |
| Year of Election or Appointment: 2005 Assistant Treasurer of the Fidelity funds. Mr. Ryan is an employee of Fidelity Investments. Previously, Mr. Ryan served as Vice President of Fund Reporting in Fidelity Pricing and Cash Management Services (FPCMS) (1999-2005). |
Jonathan Davis (42) |
| Year of Election or Appointment: 2010 Assistant Treasurer of the Fidelity funds. Mr. Davis is an employee of Fidelity Investments. Previously, Mr. Davis served as Vice President and Associate General Counsel of FMR LLC (2003-2010). |
Annual Report
The Board of Trustees of Fidelity Canada Fund voted to pay to shareholders of record at the opening of business on record date, the following distributions per share derived from capital gains realized from sales of portfolio securities, and dividends derived from net investment income:
| Pay Date | Record Date | Dividends | Capital Gains |
Class A | 12/06/10 | 12/03/10 | $0.338 | $0.441 |
Class T | 12/06/10 | 12/03/10 | $0.198 | $0.441 |
Class B | 12/06/10 | 12/03/10 | $0.000 | $0.407 |
Class C | 12/06/10 | 12/03/10 | $0.023 | $0.441 |
Class A, Class T, Class B, and Class C designates 100% of the, dividends distributed during the fiscal year as amounts which may be taken into account as a dividend for purposes of the maximum rate under section 1(h)(11) of the Internal Revenue Code.
The amounts per share which represent income derived from sources within, and taxes paid to, foreign countries or possessions of the United States are as follows:
| Pay Date | Income | Taxes |
Class A | 12/07/2009 | $0.475 | $0.0866 |
Class T | 12/07/2009 | $0.348 | $0.0866 |
Class B | 12/07/2009 | $0.178 | $0.0866 |
Class C | 12/07/2009 | $0.249 | $0.0866 |
The fund will notify shareholders in January 2011 of amounts for use in preparing 2010 income tax returns.
Annual Report
Board Approval of Investment Advisory Contracts and Management Fees
Fidelity Canada Fund
Each year, the Board of Trustees, including the Independent Trustees (together, the Board), votes on the renewal of the management contract and sub-advisory agreements (together, the Advisory Contracts) for the fund. The Board, assisted by the advice of fund counsel and Independent Trustees' counsel, requests and considers a broad range of information relevant to the renewal of the Advisory Contracts throughout the year.
The Board meets regularly and considers at each of its meetings factors that are relevant to its annual consideration of the renewal of the fund's Advisory Contracts, including the services and support provided to the fund and its shareholders. The Board has established various standing committees, each composed of Independent Trustees with varying backgrounds, to which the Board has assigned specific subject matter responsibilities in order to enhance effective decision-making by the Board. The Board, acting directly and through its Committees, requests and receives information concerning the annual consideration of the renewal of the fund's Advisory Contracts. The Board also meets as needed to consider matters specifically related to the Board's annual consideration of the renewal of Advisory Contracts. Members of the Board may also meet with trustees of other Fidelity funds through ad hoc joint committees to discuss certain matters relevant to the Fidelity funds.
At its July 2010 meeting, the Board of Trustees, including the Independent Trustees, unanimously determined to renew the fund's Advisory Contracts. In reaching its determination, the Board considered all factors it believed relevant, including (i) the nature, extent, and quality of the services to be provided to the fund and its shareholders (including the investment performance of the fund); (ii) the competitiveness of the fund's management fee and total expenses; (iii) the total costs of the services to be provided by and the profits to be realized by Fidelity from its relationship with the fund; (iv) the extent to which economies of scale would be realized as the fund grows; and (v) whether fee levels reflect these economies of scale, if any, for the benefit of fund shareholders.
In considering whether to renew the Advisory Contracts for the fund, the Board reached a determination, with the assistance of fund counsel and Independent Trustees' counsel and through the exercise of its business judgment, that the renewal of the Advisory Contracts is in the best interests of fund shareholders and that the compensation to be received by Fidelity under the management contract is fair and reasonable. The Board's decision to renew the Advisory Contracts was not based on any single factor noted above, but rather was based on a comprehensive consideration of all the information provided to the Board at its meetings throughout the year. The Board, in reaching its determination to renew the Advisory Contracts, is aware that shareholders in the fund have a broad range of investment choices available to them, including a wide choice among mutual funds offered by Fidelity's competitors, and that the fund's shareholders, with the opportunity to review and weigh the disclosure provided by the fund in its prospectus and other public disclosures, have chosen to invest in this fund, managed by Fidelity.
Nature, Extent, and Quality of Services Provided. The Board considered the staffing within the investment adviser, FMR, and the sub-advisers (together, the Investment Advisers), including the backgrounds of the fund's investment personnel and the fund's investment objective and discipline. The Independent Trustees also had discussions with senior management of Fidelity's investment operations and investment groups. The Board considered the structure of the portfolio manager compensation program and whether this structure provides appropriate incentives to act in the best interest of the fund.
Resources Dedicated to Investment Management and Support Services. The Board and the equity research subcommittee of the Board's Fund Oversight Committee reviewed the size, education, and experience of the Investment Advisers' investment staff, their use of technology, and the Investment Advisers' approach to recruiting, training, and retaining portfolio managers and other research, advisory, and management personnel. The Board noted that Fidelity's analysts have access to a variety of technological tools and market and securities data that enable them to perform both fundamental and quantitative analysis and to specialize in various disciplines. The Board considered Fidelity's extensive global research capabilities that enable the Investment Advisers to aggregate data from various sources in an effort to produce positive investment results. The Board also considered that Fidelity's portfolio managers and analysts have access to daily portfolio attribution that allows for monitoring of a fund's portfolio, as well as an electronic communication system that provides immediate real-time access to research concerning issuers and credit enhancers. The Board noted FMR's continued focus on strengthening the organization and discipline of equity portfolio management and research.
Shareholder and Administrative Services. The Board considered (i) the nature, extent, quality, and cost of advisory, administrative, and shareholder services performed by the Investment Advisers and their affiliates under the Advisory Contracts and under separate agreements covering transfer agency, pricing and bookkeeping, and securities lending services for the fund; (ii) the nature and extent of the investment adviser's supervision of third party service providers, principally custodians and subcustodians; and (iii) the resources devoted to, and the record of compliance with, the fund's compliance policies and procedures. The Board also reviewed the allocation of fund brokerage, including allocations to brokers affiliated with the Investment Advisers, the use of brokerage commissions to pay fund expenses, and the use of "soft" commission dollars to pay for research services.
The Board noted that the growth of fund assets over time across the complex allows Fidelity to reinvest in the development of services designed to enhance the value or convenience of the Fidelity funds as investment vehicles. These services include 24-hour access to account information and market information through phone representatives and over the Internet, and investor education materials and asset allocation tools.
Investment in a Large Fund Family. The Board considered the benefits to shareholders of investing in a Fidelity fund, including the benefits of investing in a fund that is part of a large family of funds offering a variety of investment disciplines and providing a large variety of mutual fund investor services. The Board noted that Fidelity had taken, or had made recommendations that resulted in the Fidelity funds taking, a number of actions over the previous year that benefited particular funds, including (i) dedicating additional resources to investment research and restructuring and broadening the focus of the investment research teams; (ii) bolstering the senior management team that oversees asset management; (iii) launching Class F of certain funds as a lower-fee class available to Freedom K and Freedom Index Funds; (iv) lowering the initial investment minimums and ongoing balance requirements for Real Estate High Income Fund; (v) eliminating subsequent purchase minimums for all funds and adding a waiver of the investment minimum requirement for new accounts opened with the proceeds of a systematic withdrawal plan; (vi) eliminating the withdrawal minimum and maximum limits for systematic withdrawals from Advisor funds; (vii) expanding sales load waivers on Class A shares for Destiny Planholders and expanding Institutional Class eligibility for Class O Destiny Planholders; and (viii) changing certain Class A and Class T sales charge structures to further align them with industry practices.
Annual Report
Board Approval of Investment Advisory Contracts and Management Fees - continued
Investment Performance. The Board considered whether the fund has operated in accordance with its investment objective, as well as its record of compliance with its investment restrictions. It also reviewed the fund's absolute investment performance for each class, as well as the fund's relative investment performance for each class measured over multiple periods against a broad-based securities market index. The Board noted that FMR does not believe that a meaningful peer group exists against which to compare the fund's performance. The following charts considered by the Board show, over the one-, three-, and five-year periods ended December 31, 2009, as available, the cumulative total returns of the retail class and Class B of the fund and the cumulative total returns of a broad-based securities market index ("benchmark"). The returns of the retail class and Class B show the performance of the highest performing class (based on five-year performance) and the lowest performing class (based on one-year performance), respectively.
Fidelity Canada Fund

The Board noted that the investment performance of the fund was lower than its benchmark for all the periods shown. The Board considered that the variations in performance among the fund's classes reflect the variations in class expenses, which result in lower performance for higher expense classes. The Board discussed with FMR actions that have been taken by FMR to improve the fund's below-benchmark performance. The Board also reviewed the fund's performance since inception as well as performance in the current year. The Board will continue to closely monitor the performance of the fund in the coming year and discuss with FMR other appropriate actions to address the performance of the fund.
The Board also considered that the fund's management fee is subject to upward or downward adjustment depending upon whether, and to what extent, the fund's investment performance for the performance period exceeds, or is exceeded by, the record (over the same period) of a Board-approved performance adjustment index. The Board realizes that the performance adjustment provides FMR with a strong economic incentive to seek to achieve superior performance for the fund's shareholders and helps to more closely align the interests of FMR and the fund's shareholders.
Based on its review, and giving particular weight to the nature and quality of the resources dedicated by the Investment Advisers to maintain and improve relative performance and factoring in the unprecedented market events in recent years, the Board concluded that the nature, extent, and quality of investment management and support services and of shareholder and administrative services provided to the fund will benefit the fund's shareholders, particularly in light of the Board's view that the fund's shareholders benefit from investing in a fund that is part of a large family of funds offering a variety of investment disciplines and services.
Annual Report
Competitiveness of Management Fee and Total Fund Expenses. The Board considered the fund's management fee and total expenses compared to "mapped groups" of competitive funds and classes. Fidelity creates "mapped groups" by combining similar Lipper investment objective categories that have comparable management fee characteristics. Combining Lipper investment objective categories aids the Board's management fee and total expense comparisons by broadening the competitive group used for comparison and by reducing the number of universes to which various Fidelity funds are compared.
Management Fee. The Board considered two proprietary management fee comparisons for the 12-month periods shown in the chart below. The group of Lipper funds used by the Board for management fee comparisons is referred to below as the "Total Mapped Group." The Total Mapped Group comparison focuses on a fund's standing relative to the total universe of comparable funds available to investors, in terms of gross management fees before expense reimbursements or caps, and without giving effect to the fund's performance adjustment. "TMG %" represents the percentage of funds in the Total Mapped Group that had management fees that were lower than the fund's. For example, a TMG % of 15% means that 85% of the funds in the Total Mapped Group had higher management fees than the fund. The "Asset-Size Peer Group" (ASPG) comparison focuses on a fund's standing relative to non-Fidelity funds similar in size to the fund within the Total Mapped Group. The ASPG represents at least 15% of the funds in the Total Mapped Group with comparable asset size and management fee characteristics, subject to a minimum of 50 funds (or all funds in the Total Mapped Group if fewer than 50). Additional information, such as the ASPG quartile in which the fund's management fee ranked and the impact of the fund's performance adjustment, is also included in the chart and considered by the Board.
Fidelity Canada Fund

The Board noted that the fund's management fee ranked below the median of its Total Mapped Group and below the median of its ASPG for 2009. The Board also noted the effect of the fund's positive performance adjustment on the fund's management fee ranking. The Board noted that the performance adjustment for each year represents calculations for performance periods that differ from the periods shown in the performance charts above.
Based on its review, the Board concluded that the fund's management fee is fair and reasonable in light of the services that the fund receives and the other factors considered.
Total Expenses. In its review of each class's total expenses, the Board considered the fund's management fee as well as other fund or class expenses, as applicable, such as transfer agent fees, pricing and bookkeeping fees, fund-paid 12b-1 fees, and custodial, legal, and audit fees. The Board also noted the effects of any waivers and reimbursements on fees and expenses, as well as the impact of the fund's performance adjustment. As part of its review, the Board also considered current and historical total expenses of each class of the fund compared to competitive fund median expenses. Each class of the fund is compared to those funds and classes in the Total Mapped Group (used by the Board for management fee comparisons) that have a similar sales load structure.
The Board noted that the total expenses of each of Class A, Class B, Class C, Institutional Class, and the retail class of the fund ranked below its competitive median for 2009 and the total expenses of Class T ranked above its competitive median for 2009. The Board considered that the total expenses for Class T were above the median primarily because its 12b-1 fee is higher than the typical front-end load class. The Board noted that the fund offers multiple classes, each of which has a different sales load and 12b-1 fee structure, and that the multiple structures are intended to offer a range of pricing options for the intermediary market. The Board also noted that the total expenses of the classes vary primarily by the level of their 12b-1 fees, although differences in transfer agent fees may also cause expenses to vary from class to class.
Annual Report
Board Approval of Investment Advisory Contracts and Management Fees - continued
Fees Charged to Other Fidelity Clients. The Board also considered Fidelity fee structures and other information with respect to clients of FMR and its affiliates, such as other mutual funds advised or subadvised by FMR or its affiliates, pension plan clients, and other institutional clients. In March 2010, the Board created an ad hoc joint committee with the board of other Fidelity funds (the Committee) to review and compare Fidelity's institutional investment advisory business with its business of providing services to the Fidelity funds, including the differences in services provided, fees charged, and costs incurred, as well as competition in their respective marketplaces.
Based on its review of total expenses and fees charged to other Fidelity clients, the Board concluded that the total expenses of each class of the fund were reasonable, although in one case above the median of the universe presented for comparison, in light of the services that the fund and its shareholders receive and the other factors considered, including the findings of the Committee.
Costs of the Services and Profitability. The Board considered the revenues earned and the expenses incurred by Fidelity in conducting the business of developing, marketing, distributing, managing, administering and servicing the fund and its shareholders. The Board also considered the level of Fidelity's profits in respect of all the Fidelity funds.
On an annual basis, FMR presents to the Board Fidelity's profitability for the fund. Fidelity calculates the profitability for each fund, as well as aggregate profitability for groups of Fidelity funds and all Fidelity funds, using a series of detailed revenue and cost allocation methodologies which originate with the audited books and records of Fidelity. The Audit Committee of the Board reviews any significant changes from the prior year's methodologies.
PricewaterhouseCoopers LLP (PwC), independent registered public accounting firm and auditor to Fidelity and certain Fidelity funds, has been engaged annually by the Board as part of the Board's assessment of Fidelity's profitability analysis. PwC's engagement includes the review and assessment of Fidelity's methodologies used in determining the revenues and expenses attributable to Fidelity's mutual fund business, and completion of agreed-upon procedures surrounding the mathematical accuracy of fund profitability and its conformity to allocation methodologies. After considering PwC's reports issued under the engagement and information provided by Fidelity, the Board believes that while other allocation methods may also be reasonable, Fidelity's profitability methodologies are reasonable in all material respects.
The Board has also reviewed Fidelity's non-fund businesses and fall-out benefits related to the mutual fund business as well as cases where Fidelity's affiliates may benefit from or be related to the fund's business.
The Board considered the costs of the services provided by and the profits realized by Fidelity in connection with the operation of the fund and were satisfied that the profitability was not excessive in the circumstances.
Economies of Scale. The Board considered whether there have been economies of scale in respect of the management of the Fidelity funds, whether the Fidelity funds (including the fund) have appropriately benefited from any such economies of scale, and whether there is potential for realization of any further economies of scale. The Board considered the extent to which the fund will benefit from economies of scale through increased services to the fund, through waivers or reimbursements, or through fee or expense reductions.
In February 2009, the Board and the board of other Fidelity funds created an ad hoc committee (the Economies of Scale Committee) to analyze whether FMR attains economies of scale in respect of the management and servicing of the Fidelity funds, whether the Fidelity funds have appropriately benefited from such economies of scale, and whether there is potential for realization of any further economies of scale.
The Board recognized that the fund's management contract incorporates a "group fee" structure, which provides for lower group fee rates as total fund assets under FMR's management increase, and for higher group fee rates as total fund assets under FMR's management decrease. FMR calculates the group fee rates based on a tiered asset "breakpoint" schedule that varies based on asset class. The Board considered that the group fee is designed to deliver the benefits of economies of scale to fund shareholders when total Fidelity fund assets increase, even if assets of any particular fund are unchanged or have declined, because some portion of Fidelity's costs are attributable to services provided to all Fidelity funds, and all funds benefit if those costs can be allocated among more assets. The Board concluded that, given the group fee structure, fund shareholders will benefit from lower management fees as assets under FMR's management increase at the fund complex level, regardless of whether Fidelity achieves any such economies of scale.
The Board concluded, considering the findings of the Economies of Scale Committee, that any potential economies of scale are being appropriately shared between fund shareholders and Fidelity.
Additional Information Requested by the Board. In order to develop fully the factual basis for consideration of the Fidelity funds' Advisory Contracts, the Board requested and received additional information on certain topics, including (i) fund performance trends, actions to be taken by FMR to improve certain funds' overall performance, and Fidelity's long-term strategies for certain funds; (ii) portfolio manager changes that have occurred during the past year and length of portfolio manager tenure for different categories of funds over time; (iii) Fidelity's compensation structure for portfolio managers, research analysts, and other key personnel, the rationale for the compensation structure, and how the compensation structure provides appropriate performance incentives; (iv) the amount of the investment that each portfolio manager has made in the Fidelity fund(s) that he or she manages; (v) management and other fees paid by FMR to affiliated sub-advisers on behalf of the Fidelity funds; (vi) Fidelity's fee structures and rationale for recommending different fees among different categories of funds; (vii) Fidelity's rationale for recommending which funds should have a performance adjustment component as part of their management fees; (viii) the rationale for any differences between fund fee structures and fee structures in place for other Fidelity clients; and (ix) explanations regarding the relative total expenses borne by certain funds and classes, total expense competitive trends, and actions that might be taken by FMR to reduce total expenses for certain funds and classes.
Annual Report
Based on its evaluation of all of the conclusions noted above, and after considering all factors it believed relevant, the Board ultimately concluded that the advisory fee structures are fair and reasonable, and that the fund's Advisory Contracts should be renewed.
Annual Report
Investment Adviser
Fidelity Management & Research Company
Boston, MA
Investment Sub-Advisers
FMR Co., Inc.
Fidelity Management & Research
(U.K.) Inc.
Fidelity Research & Analysis Company
FIL Investment Advisors
FIL Investment Advisors
(U.K.) Ltd.
Fidelity Management & Research
(Hong Kong) Limited
Fidelity Management & Research
(Japan) Inc.
General Distributor
Fidelity Distributors Corporation
Boston, MA
Transfer and Service Agents
Fidelity Investments Institutional
Operations Company, Inc.
Boston, MA
Fidelity Service Company, Inc.
Boston, MA
Custodian
The Bank of New York Mellon
New York, New York
ACAN-UANN-1210
1.843164.103
Fidelity AdvisorSM
Canada Fund -
Institutional Class
Annual Report
October 31, 2010
Institutional Class is a class of
Fidelity® Canada Fund
(2_fidelity_logos) (Registered_Trademark)
Contents
Chairman's Message | <Click Here> | The Chairman's message to shareholders. |
Performance | <Click Here> | How the fund has done over time. |
Management's Discussion of Fund Performance | <Click Here> | The Portfolio Manager's review of fund performance and strategy. |
Shareholder Expense Example | <Click Here> | An example of shareholder expenses. |
Investment Changes | <Click Here> | A summary of major shifts in the fund's investments over the past six months. |
Investments | <Click Here> | A complete list of the fund's investments with their market values. |
Financial Statements | <Click Here> | Statements of assets and liabilities, operations, and changes in net assets, as well as financial highlights. |
Notes | <Click Here> | Notes to the financial statements. |
Report of Independent Registered Public Accounting Firm | <Click Here> | |
Trustees and Officers | <Click Here> | |
Distributions | <Click Here> | |
Board Approval of Investment Advisory Contracts and Management Fees | <Click Here> | |
To view a fund's proxy voting guidelines and proxy voting record for the 12-month period ended June 30, visit http://www.fidelity.com/proxyvotingresults or visit the Securities and Exchange Commission's (SEC) web site at http://www.sec.gov. You may also call 1-877-208-0098 to request a free copy of the proxy voting guidelines.
Standard & Poor's, S&P and S&P 500 are registered service marks of The McGraw-Hill Companies, Inc. and have been licensed for use by Fidelity Distributors Corporation.
Other third party marks appearing herein are the property of their respective owners.
All other marks appearing herein are registered or unregistered trademarks or service marks of FMR LLC or an affiliated company.
This report and the financial statements contained herein are submitted for the general information of the shareholders of the fund. This report is not authorized for distribution to prospective investors in the fund unless preceded or accompanied by an effective prospectus.
A fund files its complete schedule of portfolio holdings with the SEC for the first and third quarters of each fiscal year on Form N-Q. Forms N-Q are available on the SEC's web site at http://www.sec.gov. A fund's Forms N-Q may be reviewed and copied at the SEC's Public Reference Room in Washington, DC. Information regarding the operation of the SEC's Public Reference Room may be obtained by calling 1-800-SEC-0330. For a complete list of a fund's portfolio holdings, view the most recent holdings listing, semiannual report, or annual report on Fidelity's web site at http://www.fidelity.com or http://www.advisor.fidelity.com, as applicable.
NOT FDIC INSURED • MAY LOSE VALUE • NO BANK GUARANTEE
Neither the fund nor Fidelity Distributors Corporation is a bank.
Annual Report
(photo_of_Edward_C_Johnson_3d)
Dear Shareholder:
Equities have staged a rally in the second half of 2010, shaking off concerns about the European debt crisis and the possibility of a double-dip recession in the U.S. Although the short-term surge pushed major equity indexes back into positive territory for the year, several questions remain about the longer-term outlook, including lackluster economic growth and persistently high unemployment. Financial markets are always unpredictable, of course, but there also are several time-tested investment principles that can help put the odds in your favor.
One of the basic tenets is to invest for the long term. Over time, riding out the markets' inevitable ups and downs has proven much more effective than selling into panic or chasing the hottest trend. Even missing only a few of the markets' best days can significantly diminish investor returns. Patience also affords the benefits of compounding - of earning interest on additional income or reinvested dividends and capital gains. There can be tax advantages and cost benefits to consider as well. While staying the course doesn't eliminate risk, it can considerably lessen the effect of short-term declines.
You can further manage your investing risk through diversification. And today, more than ever, geographic diversification should be taken into account. Studies indicate that asset allocation is the single most important determinant of a portfolio's long-term success. The right mix of stocks, bonds and cash - aligned to your particular risk tolerance and investment objective - is very important. Age-appropriate rebalancing is also an essential aspect of asset allocation. For younger investors, an emphasis on equities - which historically have been the best-performing asset class over time - is encouraged. As investors near their specific goal, such as retirement or sending a child to college, consideration may be given to replacing volatile assets (e.g. common stocks) with more-stable fixed investments (bonds or savings plans).
A third principle - investing regularly - can help lower the average cost of your purchases. Investing a certain amount of money each month or quarter helps ensure you won't pay for all your shares at market highs. This strategy - known as dollar cost averaging - also reduces "emotion" from investing, helping shareholders avoid selling weak performers just prior to an upswing, or chasing a hot performer just before a correction.
We invite you to contact us via the Internet, through our Investor Centers or by phone. It is our privilege to provide you the information you need to make the investments that are right for you.
Sincerely,
(The chairman's signature appears here.)
Edward C. Johnson 3d
Annual Report
Average annual total return reflects the change in the value of an investment, assuming reinvestment of the class' distributions from dividend income and capital gains (the profits earned upon the sale of securities that have grown in value, if any) and assuming a constant rate of performance each year. The $10,000 table and the fund's returns do not reflect the deduction of taxes that a shareholder would pay on fund distributions or the redemption of fund shares. During periods of reimbursement by Fidelity, a fund's total return will be greater than it would be had the reimbursement not occurred. How a fund did yesterday is no guarantee of how it will do tomorrow.
Average Annual Total Returns
Periods ended October 31, 2010 | Past 1
year | Past 5
years | Past 10
years |
Institutional ClassA | 22.94% | 8.96% | 11.09% |
A The initial offering of Institutional Class shares took place on May 2, 2007. Returns prior to May 2, 2007 are those of Fidelity Canada Fund, the original class of the fund.
$10,000 Over 10 Years
Let's say hypothetically that $10,000 was invested in Fidelity AdvisorSM Canada Fund - Institutional Class on October 31, 2000. The chart shows how the value of your investment would have changed, and also shows how the S&P®/TSX Composite Index performed over the same period. The inital offering of Institutional Class took place on May 2, 2007. See above for additional information regarding the performance of Institutional Class.
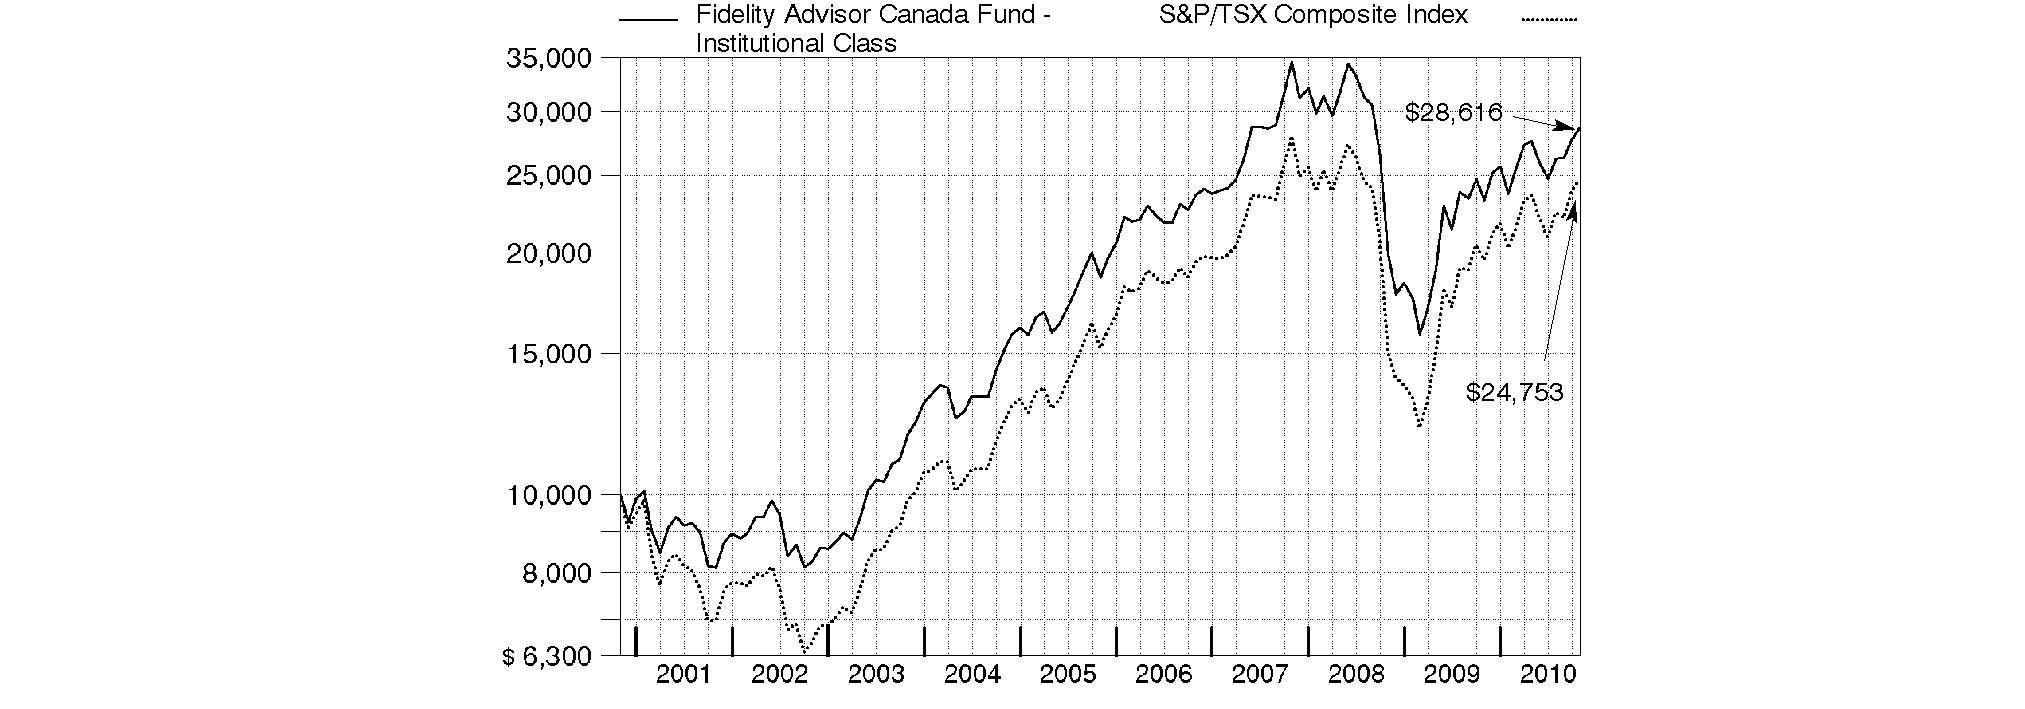
Annual Report
Market Recap: International stocks rode a wave of volatility similar to that of their U.S. counterparts during the 12 months ending October 31, 2010. Stocks gained modestly in the first half of the period, despite growing concerns about the European debt crisis. Sentiment turned decidedly negative in May and June, however, and the market suffered a precipitous decline. These losses were more than offset during the last four months of the period, when signs of economic growth and subsiding debt fears helped propel international stocks about 21%. For the full year, the MSCI® ACWI® (All Country World Index) ex USA Index gained 12.76%, boosted in part by a generally depreciating U.S. dollar. Within the index, Canada and emerging markets were standouts, returning 23% and 24%, respectively. Results in the latter group were led by strong-performing India, Mexico and South Africa, while China fell short of the MSCI benchmark due to cooling economic growth. The developed Asia ex Japan segment rose 16% for the period, lifted by solid results from Singapore and Hong Kong. Meanwhile, Europe rose just 9%, held back mainly by debt-riddled Spain and Italy, as well as lagging major constituent France. Japan returned only 5%, a result of that nation's continued weak economy.
Comments from Douglas Lober, Portfolio Manager of Fidelity AdvisorSM Canada Fund: For the 12 months ending October 31, 2010, the fund's Institutional Class shares returned 22.94%, trailing the 26.45% gain of the S&P/TSX Composite Index. It was a solid period for Canadian equities, bolstered by a strengthening economy, surging global commodity prices and a strong Canadian dollar relative to the U.S. dollar. Versus the index, positioning in materials and technology hurt performance the most this period. Conversely, overweighting the top-performing health care sector, security selection in industrials and underweighting financials, especially insurance, bolstered results. The fund's biggest individual detractors were pairs of tech and materials stocks: enterprise software company Open Text, BlackBerry maker Research In Motion, base-metals producer Teck Resources and Barrick Gold. On the upside, underweighting Canadian life insurer Manulife Financial, which was sold from the fund, was the fund's largest contributor, followed by specialty pharmaceutical firm Biovail - which merged with Valeant Pharmaceuticals International - and crude oil and natural gas company Pacific Rubiales Energy.
Note to shareholders: Fidelity Advisor Canada Fund may invest up to 35% of its total assets in any industry that represents more than 20% of the Canadian market. As of October 31, 2010, the fund did not have more than 25% of its assets invested in any one industry.
The views expressed above reflect those of the portfolio manager(s) only through the end of the period as stated on the cover of this report and do not necessarily represent the views of Fidelity or any other person in the Fidelity organization. Any such views are subject to change at any time based upon market or other conditions and Fidelity disclaims any responsibility to update such views. These views may not be relied on as investment advice and, because investment decisions for a Fidelity fund are based on numerous factors, may not be relied on as an indication of trading intent on behalf of any Fidelity fund.
Annual Report
Fidelity Canada Fund
As a shareholder of the Fund, you incur two types of costs: (1) transaction costs, including sales charges (loads) on purchase payments or redemption proceeds, redemption fees, and (2) ongoing costs, including management fees, distribution and/or service (12b-1) fees and other Fund expenses. This Example is intended to help you understand your ongoing costs (in dollars) of investing in the Fund and to compare these costs with the ongoing costs of investing in other mutual funds.
The Example is based on an investment of $1,000 invested at the beginning of the period and held for the entire period (May 1, 2010 to October 31, 2010).
Actual Expenses
The first line of the accompanying table for each class of the Fund provides information about actual account values and actual expenses. You may use the information in this line, together with the amount you invested, to estimate the expenses that you paid over the period. Simply divide your account value by $1,000.00 (for example, an $8,600 account value divided by $1,000.00 = 8.6), then multiply the result by the number in the first line for a class of the Fund under the heading entitled "Expenses Paid During Period" to estimate the expenses you paid on your account during this period. A small balance maintenance fee of $12.00 that is charged once a year may apply for certain accounts with a value of less than $2,000. This fee is not included in the table below. If it was, the estimate of expenses you paid during the period would be higher, and your ending account value lower, by this amount. In addition, the Fund, as a shareholder in the underlying Fidelity Central Funds, will indirectly bear its pro-rata share of the fees and expenses incurred by the underlying Fidelity Central Funds. These fees and expenses are not included in the Fund's annualized expense ratio used to calculate the expense estimate in the table below.
Hypothetical Example for Comparison Purposes
The second line of the accompanying table for each class of the Fund provides information about hypothetical account values and hypothetical expenses based on a Class' actual expense ratio and an assumed rate of return of 5% per year before expenses, which is not the Class' actual return. The hypothetical account values and expenses may not be used to estimate the actual ending account balance or expenses you paid for the period. You may use this information to compare the ongoing costs of investing in the Fund and other funds. To do so, compare this 5% hypothetical example with the 5% hypothetical examples that appear in the shareholder reports of the other funds. A small balance maintenance fee of $12.00 that is charged once a year may apply for certain accounts with a value of less than $2,000. This fee is not included in the table below. If it was, the estimate of expenses you paid during the period would be higher, and your ending account value lower, by this amount. In addition, the Fund, as a shareholder in the underlying Fidelity Central Funds, will indirectly bear its pro-rata share of the fees and expenses incurred by the underlying Fidelity Central Funds. These fees and expenses are not included in the Fund's annualized expense ratio used to calculate the expense estimate in the table below.
Please note that the expenses shown in the table are meant to highlight your ongoing costs only and do not reflect any transaction costs. Therefore, the second line of the table is useful in comparing ongoing costs only, and will not help you determine the relative total costs of owning different funds. In addition, if these transactional costs were included, your costs would have been higher.
| Annualized
Expense Ratio | Beginning
Account Value
May 1, 2010 | Ending
Account Value
October 31, 2010 | Expenses Paid
During Period*
May 1, 2010 to
October 31, 2010 |
Class A | 1.24% | | | |
Actual | | $ 1,000.00 | $ 1,036.60 | $ 6.37 |
HypotheticalA | | $ 1,000.00 | $ 1,018.95 | $ 6.31 |
Class T | 1.50% | | | |
Actual | | $ 1,000.00 | $ 1,035.10 | $ 7.69 |
HypotheticalA | | $ 1,000.00 | $ 1,017.64 | $ 7.63 |
Class B | 2.00% | | | |
Actual | | $ 1,000.00 | $ 1,032.50 | $ 10.25 |
HypotheticalA | | $ 1,000.00 | $ 1,015.12 | $ 10.16 |
Class C | 1.98% | | | |
Actual | | $ 1,000.00 | $ 1,032.60 | $ 10.14 |
HypotheticalA | | $ 1,000.00 | $ 1,015.22 | $ 10.06 |
Canada | .92% | | | |
Actual | | $ 1,000.00 | $ 1,038.00 | $ 4.73 |
HypotheticalA | | $ 1,000.00 | $ 1,020.57 | $ 4.69 |
Institutional Class | .94% | | | |
Actual | | $ 1,000.00 | $ 1,038.00 | $ 4.83 |
HypotheticalA | | $ 1,000.00 | $ 1,020.47 | $ 4.79 |
A 5% return per year before expenses
* Expenses are equal to each Class' annualized expense ratio, multiplied by the average account value over the period, multiplied by 184/365 (to reflect the one-half year period).
Annual Report
Fidelity Canada Fund
Investment Changes (Unaudited)
Geographic Diversification (% of fund's net assets) |
As of October 31, 2010 |
| Canada | 98.4% | |
| United States of America | 1.6% | |

Percentages are adjusted for the effect of futures contracts, if applicable. |
As of April 30, 2010 |
| Canada | 98.2% | |
| United States of America | 1.8% | |

Percentages are adjusted for the effect of futures contracts, if applicable. |
Asset Allocation |
| % of fund's
net assets | % of fund's net assets
6 months ago |
Stocks | 99.1 | 99.3 |
Short-Term Investments and Net Other Assets | 0.9 | 0.7 |
Top Ten Stocks as of October 31, 2010 |
| % of fund's
net assets | % of fund's net assets
6 months ago |
Magna International, Inc. Class A (sub. vtg.) (Auto Components) | 5.1 | 1.3 |
Royal Bank of Canada (Commercial Banks) | 5.1 | 6.1 |
Toronto-Dominion Bank (Commercial Banks) | 4.5 | 5.3 |
Canadian National Railway Co. (Road & Rail) | 4.2 | 5.3 |
Bank of Nova Scotia (Commercial Banks) | 3.9 | 2.4 |
Valeant Pharmaceuticals International, Inc. (Pharmaceuticals) | 3.7 | 0.0 |
Barrick Gold Corp. (Metals & Mining) | 3.7 | 0.0 |
Talisman Energy, Inc. (Oil, Gas & Consumable Fuels) | 3.6 | 2.5 |
Goldcorp, Inc. (Metals & Mining) | 3.6 | 3.6 |
SXC Health Solutions Corp. (Health Care Technology) | 3.5 | 1.7 |
| 40.9 | |
Market Sectors as of October 31, 2010 |
| % of fund's
net assets | % of fund's net assets
6 months ago |
Materials | 24.0 | 18.1 |
Financials | 20.2 | 26.4 |
Energy | 15.6 | 20.9 |
Consumer Discretionary | 11.0 | 7.4 |
Industrials | 9.3 | 8.8 |
Health Care | 7.2 | 1.7 |
Information Technology | 5.8 | 9.6 |
Telecommunication Services | 4.5 | 3.7 |
Consumer Staples | 1.5 | 1.9 |
Utilities | 0.0 | 0.8 |
Annual Report
Fidelity Canada Fund
Investments October 31, 2010
Showing Percentage of Net Assets
Common Stocks - 99.1% |
| Shares | | Value |
CONSUMER DISCRETIONARY - 11.0% |
Auto Components - 5.1% |
Magna International, Inc. Class A (sub. vtg.) | 2,425,200 | | $ 219,335,670 |
Hotels, Restaurants & Leisure - 1.0% |
Tim Hortons, Inc. | 1,110,300 | | 41,738,310 |
Household Durables - 0.4% |
Dorel Industries, Inc. Class B (sub. vtg.) | 450,000 | | 15,169,134 |
Media - 1.3% |
Astral Media, Inc. Class A (non-vtg.) | 400,000 | | 16,040,788 |
Corus Entertainment, Inc. Class B (non-vtg.) | 600,000 | | 12,954,211 |
Groupe Aeroplan, Inc. | 100,000 | | 1,215,805 |
Quebecor, Inc. Class B (sub. vtg.) | 750,000 | | 27,054,123 |
| | 57,264,927 |
Multiline Retail - 1.0% |
Dollarama, Inc. | 1,678,775 | | 44,244,997 |
Textiles, Apparel & Luxury Goods - 2.2% |
Gildan Activewear, Inc. (a) | 3,269,100 | | 94,204,186 |
TOTAL CONSUMER DISCRETIONARY | | 471,957,224 |
CONSUMER STAPLES - 1.5% |
Food & Staples Retailing - 1.5% |
Alimentation Couche-Tard, Inc. Class B (sub. vtg.) | 1,290,200 | | 30,638,929 |
Metro, Inc. Class A (sub. vtg.) | 700,000 | | 32,120,796 |
| | 62,759,725 |
ENERGY - 15.6% |
Oil, Gas & Consumable Fuels - 15.6% |
Baytex Energy Trust | 850,000 | | 31,669,772 |
Cameco Corp. | 400,000 | | 12,373,762 |
Cenovus Energy, Inc. | 2,000,000 | | 55,652,515 |
Crescent Point Energy Corp. | 783,400 | | 31,031,827 |
Enbridge, Inc. | 2,508,900 | | 138,765,613 |
Gran Tierra Energy, Inc. (a) | 1,300,000 | | 9,687,224 |
Keyera Facilities Income Fund | 958,402 | | 29,741,566 |
Niko Resources Ltd. | 145,000 | | 13,833,219 |
Pacific Rubiales Energy Corp. (a) | 1,200,000 | | 38,250,809 |
Petrobank Energy & Resources Ltd. (a) | 350,000 | | 13,929,307 |
Suncor Energy, Inc. | 4,307,600 | | 138,025,657 |
Talisman Energy, Inc. | 8,500,000 | | 154,098,441 |
| | 667,059,712 |
FINANCIALS - 20.2% |
Commercial Banks - 17.4% |
Bank of Nova Scotia | 3,100,000 | | 166,170,213 |
Canadian Imperial Bank of Commerce | 1,344,600 | | 103,135,658 |
National Bank of Canada | 1,000,000 | | 65,820,178 |
Royal Bank of Canada | 4,040,000 | | 215,448,181 |
Toronto-Dominion Bank | 2,665,800 | | 191,982,557 |
| | 742,556,787 |
|
| Shares | | Value |
Insurance - 0.8% |
Intact Financial Corp. | 741,100 | | $ 33,563,495 |
Real Estate Investment Trusts - 0.0% |
RioCan (REIT) | 100,000 | | 2,260,025 |
Real Estate Management & Development - 2.0% |
Brookfield Asset Management, Inc. Class A | 1,750,000 | | 51,956,074 |
Brookfield Properties Corp. (d) | 1,900,000 | | 32,824,787 |
| | 84,780,861 |
TOTAL FINANCIALS | | 863,161,168 |
HEALTH CARE - 7.2% |
Health Care Technology - 3.5% |
SXC Health Solutions Corp. (a)(e) | 3,803,234 | | 148,489,830 |
Pharmaceuticals - 3.7% |
Valeant Pharmaceuticals International, Inc. | 5,688,351 | | 157,393,142 |
TOTAL HEALTH CARE | | 305,882,972 |
INDUSTRIALS - 9.3% |
Airlines - 0.8% |
Air Canada Class A (a)(d) | 9,475,000 | | 35,116,678 |
Commercial Services & Supplies - 2.1% |
IESI-BFC Ltd. | 3,750,000 | | 87,765,957 |
Construction & Engineering - 0.8% |
SNC-Lavalin Group, Inc. | 650,000 | | 33,204,236 |
Road & Rail - 4.5% |
Canadian National Railway Co. | 2,750,000 | | 178,120,404 |
Contrans Group, Inc. Class A | 878,500 | | 7,536,891 |
CSX Corp. | 100,000 | | 6,145,000 |
| | 191,802,295 |
Trading Companies & Distributors - 1.1% |
Finning International, Inc. | 2,050,000 | | 48,199,823 |
TOTAL INDUSTRIALS | | 396,088,989 |
INFORMATION TECHNOLOGY - 5.8% |
Communications Equipment - 2.0% |
Research In Motion Ltd. (a) | 1,530,000 | | 87,133,507 |
Internet Software & Services - 2.1% |
Open Text Corp. (a) | 1,993,740 | | 88,202,323 |
IT Services - 0.9% |
CGI Group, Inc. Class A (sub. vtg.) (a) | 2,590,000 | | 39,844,200 |
Software - 0.8% |
MacDonald Dettwiler & Associates Ltd. (a) | 650,000 | | 32,382,096 |
TOTAL INFORMATION TECHNOLOGY | | 247,562,126 |
Common Stocks - continued |
| Shares | | Value |
MATERIALS - 24.0% |
Chemicals - 5.2% |
Agrium, Inc. | 950,000 | | $ 84,036,670 |
Potash Corp. of Saskatchewan, Inc. | 950,000 | | 137,390,921 |
| | 221,427,591 |
Metals & Mining - 18.5% |
Barrick Gold Corp. | 3,250,000 | | 156,525,149 |
Consolidated Thompson Iron Mines Ltd. (a) | 2,250,000 | | 21,796,255 |
Detour Gold Corp. (a) | 1,280,000 | | 37,387,195 |
Eldorado Gold Corp. | 5,470,000 | | 92,623,689 |
European Goldfields Ltd. (a) | 600,000 | | 8,106,677 |
Goldcorp, Inc. | 3,400,000 | | 151,814,884 |
Grande Cache Coal Corp. (a) | 2,500,000 | | 17,158,545 |
IAMGOLD Corp. | 2,000,000 | | 36,493,774 |
Ivanhoe Mines Ltd. (a) | 800,000 | | 19,154,819 |
Kinross Gold Corp. | 300,000 | | 5,397,588 |
Osisko Mining Corp. (a) | 1,665,700 | | 23,093,439 |
Pan American Silver Corp. | 800,000 | | 25,536,002 |
Silver Wheaton Corp. (a) | 1,875,900 | | 53,928,216 |
Teck Resources Ltd. Class B (sub. vtg.) | 2,400,000 | | 107,304,638 |
Walter Energy, Inc. | 200,000 | | 17,592,000 |
Yamana Gold, Inc. | 1,500,000 | | 16,501,618 |
| | 790,414,488 |
Paper & Forest Products - 0.3% |
Sino-Forest Corp. (a) | 600,000 | | 11,859,986 |
TOTAL MATERIALS | | 1,023,702,065 |
TELECOMMUNICATION SERVICES - 4.5% |
Diversified Telecommunication Services - 2.8% |
BCE, Inc. (d) | 2,300,000 | | 77,147,760 |
TELUS Corp. (d) | 1,000,000 | | 44,318,070 |
| | 121,465,830 |
|
| Shares | | Value |
Wireless Telecommunication Services - 1.7% |
Rogers Communications, Inc. Class B (non-vtg.) | 2,000,000 | | $ 72,869,889 |
TOTAL TELECOMMUNICATION SERVICES | | 194,335,719 |
TOTAL COMMON STOCKS (Cost $3,395,319,218) | 4,232,509,700 |
Money Market Funds - 1.1% |
| | | |
Fidelity Cash Central Fund, 0.23% (b) | 16,109,355 | | 16,109,355 |
Fidelity Securities Lending Cash Central Fund, 0.24% (b)(c) | 31,292,644 | | 31,292,644 |
TOTAL MONEY MARKET FUNDS (Cost $47,401,999) | 47,401,999 |
TOTAL INVESTMENT PORTFOLIO - 100.2% (Cost $3,442,721,217) | | 4,279,911,699 |
NET OTHER ASSETS (LIABILITIES) - (0.2)% | | (9,998,244) |
NET ASSETS - 100% | $ 4,269,913,455 |
Legend |
(a) Non-income producing |
(b) Affiliated fund that is available only to investment companies and other accounts managed by Fidelity Investments. The rate quoted is the annualized seven-day yield of the fund at period end. A complete unaudited listing of the fund's holdings as of its most recent quarter end is available upon request. In addition, each Fidelity Central Fund's financial statements, which are not covered by the Fund's report of Independent Registered Public Accounting Firm, are available on the SEC's website or upon request. |
(c) Investment made with cash collateral received from securities on loan. |
(d) Security or a portion of the security is on loan at period end. |
(e) Affiliated company |
Affiliated Central Funds |
Information regarding fiscal year to date income earned by the Fund from investments in Fidelity Central Funds is as follows: |
Fund | Income earned |
Fidelity Cash Central Fund | $ 71,952 |
Fidelity Securities Lending Cash Central Fund | 3,863,210 |
Total | $ 3,935,162 |
Other Affiliated Issuers |
An affiliated company is a company in which the Fund has ownership of at least 5% of the voting securities. Fiscal year to date transactions with companies which are or were affiliates are as follows: |
Affiliate | Value,
beginning of period | Purchases | Sales
Proceeds | Dividend
Income | Value,
end of
period |
Air Canada Class A | $ - | $ 16,193,836 | $ - | $ - | $ - |
Grande Cache Coal Corp. | - | 40,052,532 | 26,878,041 | - | - |
SXC Health Solutions Corp. | 16,519,740 | 103,932,396 | - | - | 148,489,830 |
Total | $ 16,519,740 | $ 160,178,764 | $ 26,878,041 | $ - | $ 148,489,830 |
Other Information |
All investments are categorized as Level 1 under the Fair Value Hierarchy. The inputs or methodology used for valuing securities may not be an indication of the risk associated with investing in those securities. For more information on valuation inputs, please refer to the Security Valuation section in the accompanying Notes to Financial Statements. |
Income Tax Information |
At October 31, 2010, the Fund had a capital loss carryforward of approximately $243,313,729 of which $92,395,948 and $150,917,781 will expire on October 31, 2016 and 2017, respectively. Capital loss carryforwards are only available to offset future capital gains of the Fund to the extent provided by regulations and may be limited. |
See accompanying notes which are an integral part of the financial statements.
Annual Report
Fidelity Canada Fund
Statement of Assets and Liabilities
| October 31, 2010 |
| | |
Assets | | |
Investment in securities, at value (including securities loaned of $29,757,421) - See accompanying schedule: Unaffiliated issuers (cost $3,276,154,840) | $ 4,084,019,870 | |
Fidelity Central Funds (cost $47,401,999) | 47,401,999 | |
Other affiliated issuers (cost $119,164,378) | 148,489,830 | |
Total Investments (cost $3,442,721,217) | | $ 4,279,911,699 |
Foreign currency held at value (cost $1,389,752) | | 1,389,866 |
Receivable for investments sold | | 57,939,322 |
Receivable for fund shares sold | | 4,954,632 |
Dividends receivable | | 4,499,672 |
Distributions receivable from Fidelity Central Funds | | 9,305 |
Other receivables | | 318,991 |
Total assets | | 4,349,023,487 |
| | |
Liabilities | | |
Payable for investments purchased | $ 40,343,297 | |
Payable for fund shares redeemed | 4,151,509 | |
Accrued management fee | 2,176,024 | |
Distribution and service plan fees payable | 102,860 | |
Other affiliated payables | 915,239 | |
Other payables and accrued expenses | 128,459 | |
Collateral on securities loaned, at value | 31,292,644 | |
Total liabilities | | 79,110,032 |
| | |
Net Assets | | $ 4,269,913,455 |
Net Assets consist of: | | |
Paid in capital | | $ 3,663,079,350 |
Undistributed net investment income | | 26,745,120 |
Accumulated undistributed net realized gain (loss) on investments and foreign currency transactions | | (257,197,673) |
Net unrealized appreciation (depreciation) on investments and assets and liabilities in foreign currencies | | 837,286,658 |
Net Assets | | $ 4,269,913,455 |
Statement of Assets and Liabilities - continued
| October 31, 2010 |
| | |
Calculation of Maximum Offering Price Class A:
Net Asset Value and redemption price per share ($170,445,854 ÷ 3,167,830 shares) | | $ 53.81 |
| | |
Maximum offering price per share (100/94.25 of $53.81) | | $ 57.09 |
Class T:
Net Asset Value and redemption price per share ($31,521,786 ÷ 587,692 shares) | | $ 53.64 |
| | |
Maximum offering price per share (100/96.50 of $53.64) | | $ 55.59 |
Class B:
Net Asset Value and offering price per share ($13,463,848 ÷ 253,888 shares) A | | $ 53.03 |
| | |
Class C:
Net Asset Value and offering price per share ($54,052,232 ÷ 1,022,372 shares) A | | $ 52.87 |
| | |
Canada:
Net Asset Value, offering price and redemption price per share ($3,953,692,786 ÷ 73,023,771 shares) | | $ 54.14 |
| | |
Institutional Class:
Net Asset Value, offering price and redemption price per share ($46,736,949 ÷ 865,188 shares) | | $ 54.02 |
A Redemption price per share is equal to net asset value less any applicable contingent deferred sales charge.
See accompanying notes which are an integral part of the financial statements.
Annual Report
Fidelity Canada Fund
Financial Statements - continued
Statement of Operations
| Year ended October 31, 2010 |
| | |
Investment Income | | |
Dividends | | $ 77,463,667 |
Interest | | 460 |
Income from Fidelity Central Funds (including $3,863,210 from security lending) | | 3,935,162 |
Income before foreign taxes withheld | | 81,399,289 |
Less foreign taxes withheld | | (11,557,812) |
Total income | | 69,841,477 |
| | |
Expenses | | |
Management fee
Basic fee | $ 27,220,833 | |
Performance adjustment | (2,434,973) | |
Transfer agent fees | 9,229,104 | |
Distribution and service plan fees | 943,339 | |
Accounting and security lending fees | 1,532,504 | |
Custodian fees and expenses | 339,998 | |
Independent trustees' compensation | 21,432 | |
Registration fees | 169,539 | |
Audit | 70,900 | |
Legal | 18,293 | |
Interest | 1,574 | |
Miscellaneous | 50,594 | |
Total expenses before reductions | 37,163,137 | |
Expense reductions | (1,984,527) | 35,178,610 |
Net investment income (loss) | | 34,662,867 |
Realized and Unrealized Gain (Loss) Net realized gain (loss) on: | | |
Investment securities: | | |
Unaffiliated issuers | 86,472,773 | |
Other affiliated issuers | (2,411,623) | |
Investment not meeting investment restrictions | (275,664) | |
Foreign currency transactions | (295,766) | |
Payment from investment advisor for loss on investment not meeting investment restrictions | 275,664 | |
Capital gain distributions from Fidelity Central Funds | 1,133 | |
Total net realized gain (loss) | | 83,766,517 |
Change in net unrealized appreciation (depreciation) on: Investment securities | 640,635,315 | |
Assets and liabilities in foreign currencies | 411,031 | |
Total change in net unrealized appreciation (depreciation) | | 641,046,346 |
Net gain (loss) | | 724,812,863 |
Net increase (decrease) in net assets resulting from operations | | $ 759,475,730 |
Statement of Changes in Net Assets
| Year ended
October 31,
2010 | Year ended
October 31,
2009 |
Increase (Decrease) in Net Assets | | |
Operations | | |
Net investment income (loss) | $ 34,662,867 | $ 34,444,185 |
Net realized gain (loss) | 83,766,517 | (171,178,890) |
Change in net unrealized appreciation (depreciation) | 641,046,346 | 537,944,481 |
Net increase (decrease) in net assets resulting from operations | 759,475,730 | 401,209,776 |
Distributions to shareholders from net investment income | (34,208,293) | (10,179,804) |
Share transactions - net increase (decrease) | 243,266,632 | 30,108,212 |
Redemption fees | 759,127 | 779,120 |
Total increase (decrease) in net assets | 969,293,196 | 421,917,304 |
| | |
Net Assets | | |
Beginning of period | 3,300,620,259 | 2,878,702,955 |
End of period (including undistributed net investment income of $26,745,120 and undistributed net investment income of $26,298,051, respectively) | $ 4,269,913,455 | $ 3,300,620,259 |
See accompanying notes which are an integral part of the financial statements.
Annual Report
Financial Highlights - Class A
Years ended October 31, | 2010 | 2009 | 2008 | 2007 H |
Selected Per-Share Data | | | | |
Net asset value, beginning of period | $ 44.24 | $ 38.20 | $ 70.16 | $ 54.00 |
Income from Investment Operations | | | | |
Net investment income (loss) E | .31 | .38 | .39 | .19 |
Net realized and unrealized gain (loss) | 9.64 | 5.72 | (28.71) | 15.96 |
Total from investment operations | 9.95 | 6.10 | (28.32) | 16.15 |
Distributions from net investment income | (.39) | (.07) | (.41) | - |
Distributions from net realized gain | - | - | (3.27) | - |
Total distributions | (.39) | (.07) | (3.68) | - |
Redemption fees added to paid in capital E | .01 | .01 | .04 | .01 |
Net asset value, end of period | $ 53.81 | $ 44.24 | $ 38.20 | $ 70.16 |
Total Return B, C, D | 22.62% | 16.08% | (42.23)% | 29.93% |
Ratios to Average Net Assets F, I | | | | |
Expenses before reductions | 1.24% | 1.42% | 1.34% | 1.23% A |
Expenses net of fee waivers, if any | 1.24% | 1.42% | 1.34% | 1.23% A |
Expenses net of all reductions | 1.18% | 1.39% | 1.31% | 1.22% A |
Net investment income (loss) | .63% | .98% | .69% | .63% A |
Supplemental Data | | | | |
Net assets, end of period (000 omitted) | $ 170,446 | $ 83,015 | $ 56,242 | $ 20,912 |
Portfolio turnover rate G | 143% | 123% | 63% | 42% |
A Annualized
B Total returns for periods of less than one year are not annualized.
C Total returns would have been lower had certain expenses not been reduced during the periods shown.
D Total returns do not include the effect of the sales charges.
E Calculated based on average shares outstanding during the period.
F Fees and expenses of the underlying Fidelity Central Funds are not included in the Fund's expense ratio. The Fund indirectly bears its proportionate share of the expenses of any underlying Fidelity Central Funds.
G Amount does not include the portfolio activity of any underlying Fidelity Central Funds.
H For the period May 2, 2007 (commencement of sale of shares) to October 31, 2007.
I Expense ratios reflect operating expenses of the class. Expenses before reductions do not reflect amounts reimbursed by the investment adviser or reductions from brokerage service arrangements or reductions from other expense offset arrangements and do not represent the amount paid by the class during periods when reimbursements or reductions occur. Expense ratios before reductions for start-up periods may not be representative of longer-term operating periods. Expenses net of fee waivers reflect expenses after reimbursement by the investment adviser but prior to reductions from brokerage service arrangements or other expense offset arrangements. Expenses net of all reductions represent the net expenses paid by the class.
Financial Highlights - Class T
Years ended October 31, | 2010 | 2009 | 2008 | 2007 H |
Selected Per-Share Data | | | | |
Net asset value, beginning of period | $ 44.11 | $ 38.10 | $ 70.09 | $ 54.00 |
Income from Investment Operations | | | | |
Net investment income (loss) E | .18 | .27 | .23 | .09 |
Net realized and unrealized gain (loss) | 9.60 | 5.73 | (28.66) | 15.99 |
Total from investment operations | 9.78 | 6.00 | (28.43) | 16.08 |
Distributions from net investment income | (.26) | - | (.33) | - |
Distributions from net realized gain | - | - | (3.27) | - |
Total distributions | (.26) | - | (3.60) | - |
Redemption fees added to paid in capital E | .01 | .01 | .04 | .01 |
Net asset value, end of period | $ 53.64 | $ 44.11 | $ 38.10 | $ 70.09 |
Total Return B, C, D | 22.27% | 15.77% | (42.40)% | 29.80% |
Ratios to Average Net Assets F, I | | | | |
Expenses before reductions | 1.51% | 1.70% | 1.63% | 1.48% A |
Expenses net of fee waivers, if any | 1.51% | 1.70% | 1.63% | 1.48% A |
Expenses net of all reductions | 1.46% | 1.67% | 1.60% | 1.47% A |
Net investment income (loss) | .36% | .71% | .40% | .30% A |
Supplemental Data | | | | |
Net assets, end of period (000 omitted) | $ 31,522 | $ 17,727 | $ 14,963 | $ 14,522 |
Portfolio turnover rate G | 143% | 123% | 63% | 42% |
A Annualized
B Total returns for periods of less than one year are not annualized.
C Total returns would have been lower had certain expenses not been reduced during the periods shown.
D Total returns do not include the effect of the sales charges.
E Calculated based on average shares outstanding during the period.
F Fees and expenses of the underlying Fidelity Central Funds are not included in the Fund's expense ratio. The Fund indirectly bears its proportionate share of the expenses of any underlying Fidelity Central Funds.
G Amount does not include the portfolio activity of any underlying Fidelity Central Funds.
H For the period May 2, 2007 (commencement of sale of shares) to October 31, 2007.
I Expense ratios reflect operating expenses of the class. Expenses before reductions do not reflect amounts reimbursed by the investment adviser or reductions from brokerage service arrangements or reductions from other expense offset arrangements and do not represent the amount paid by the class during periods when reimbursements or reductions occur. Expense ratios before reductions for start-up periods may not be representative of longer-term operating periods. Expenses net of fee waivers reflect expenses after reimbursement by the investment adviser but prior to reductions from brokerage service arrangements or other expense offset arrangements. Expenses net of all reductions represent the net expenses paid by the class.
See accompanying notes which are an integral part of the financial statements.
Annual Report
Financial Highlights - Class B
Years ended October 31, | 2010 | 2009 | 2008 | 2007 H |
Selected Per-Share Data | | | | |
Net asset value, beginning of period | $ 43.68 | $ 37.91 | $ 69.88 | $ 54.00 |
Income from Investment Operations | | | | |
Net investment income (loss) E | (.07) | .08 | (.06) | (.06) |
Net realized and unrealized gain (loss) | 9.50 | 5.68 | (28.54) | 15.93 |
Total from investment operations | 9.43 | 5.76 | (28.60) | 15.87 |
Distributions from net investment income | (.09) | - | (.14) | - |
Distributions from net realized gain | - | - | (3.27) | - |
Total distributions | (.09) | - | (3.41) | - |
Redemption fees added to paid in capital E | .01 | .01 | .04 | .01 |
Net asset value, end of period | $ 53.03 | $ 43.68 | $ 37.91 | $ 69.88 |
Total Return B, C, D | 21.64% | 15.22% | (42.68)% | 29.41% |
Ratios to Average Net Assets F, I | | | | |
Expenses before reductions | 2.01% | 2.19% | 2.13% | 2.00% A |
Expenses net of fee waivers, if any | 2.01% | 2.19% | 2.13% | 2.00% A |
Expenses net of all reductions | 1.96% | 2.16% | 2.10% | 1.99% A |
Net investment income (loss) | (.14)% | .21% | (.10)% | (.21)% A |
Supplemental Data | | | | |
Net assets, end of period (000 omitted) | $ 13,464 | $ 7,283 | $ 5,615 | $ 4,078 |
Portfolio turnover rate G | 143% | 123% | 63% | 42% |
A Annualized
B Total returns for periods of less than one year are not annualized.
C Total returns would have been lower had certain expenses not been reduced during the periods shown.
D Total returns do not include the effect of the contingent deferred sales charge.
E Calculated based on average shares outstanding during the period.
F Fees and expenses of the underlying Fidelity Central Funds are not included in the Fund's expense ratio. The Fund indirectly bears its proportionate share of the expenses of any underlying Fidelity Central Funds.
G Amount does not include the portfolio activity of any underlying Fidelity Central Funds.
H For the period May 2, 2007 (commencement of sale of shares) to October 31, 2007.
I Expense ratios reflect operating expenses of the class. Expenses before reductions do not reflect amounts reimbursed by the investment adviser or reductions from brokerage service arrangements or reductions from other expense offset arrangements and do not represent the amount paid by the class during periods when reimbursements or reductions occur. Expense ratios before reductions for start-up periods may not be representative of longer-term operating periods. Expenses net of fee waivers reflect expenses after reimbursement by the investment adviser but prior to reductions from brokerage service arrangements or other expense offset arrangements. Expenses net of all reductions represent the net expenses paid by the class.
Financial Highlights - Class C
Years ended October 31, | 2010 | 2009 | 2008 | 2007 H |
Selected Per-Share Data | | | | |
Net asset value, beginning of period | $ 43.60 | $ 37.84 | $ 69.91 | $ 54.00 |
Income from Investment Operations | | | | |
Net investment income (loss) E | (.06) | .09 | (.05) | (.04) |
Net realized and unrealized gain (loss) | 9.48 | 5.66 | (28.52) | 15.94 |
Total from investment operations | 9.42 | 5.75 | (28.57) | 15.90 |
Distributions from net investment income | (.16) | - | (.27) | - |
Distributions from net realized gain | - | - | (3.27) | - |
Total distributions | (.16) | - | (3.54) | - |
Redemption fees added to paid in capital E | .01 | .01 | .04 | .01 |
Net asset value, end of period | $ 52.87 | $ 43.60 | $ 37.84 | $ 69.91 |
Total Return B, C, D | 21.68% | 15.22% | (42.69)% | 29.46% |
Ratios to Average Net Assets F, I | | | | |
Expenses before reductions | 1.99% | 2.18% | 2.13% | 1.99% A |
Expenses net of fee waivers, if any | 1.99% | 2.18% | 2.13% | 1.99% A |
Expenses net of all reductions | 1.94% | 2.15% | 2.10% | 1.97% A |
Net investment income (loss) | (.12)% | .22% | (.10)% | (.15)% A |
Supplemental Data | | | | |
Net assets, end of period (000 omitted) | $ 54,052 | $ 24,848 | $ 16,716 | $ 8,752 |
Portfolio turnover rate G | 143% | 123% | 63% | 42% |
A Annualized
B Total returns for periods of less than one year are not annualized.
C Total returns would have been lower had certain expenses not been reduced during the periods shown.
D Total returns do not include the effect of the contingent deferred sales charge.
E Calculated based on average shares outstanding during the period.
F Fees and expenses of the underlying Fidelity Central Funds are not included in the Fund's expense ratio. The Fund indirectly bears its proportionate share of the expenses of any underlying Fidelity Central Funds.
G Amount does not include the portfolio activity of any underlying Fidelity Central Funds.
H For the period May 2, 2007 (commencement of sale of shares) to October 31, 2007.
I Expense ratios reflect operating expenses of the class. Expenses before reductions do not reflect amounts reimbursed by the investment adviser or reductions from brokerage service arrangements or reductions from other expense offset arrangements and do not represent the amount paid by the class during periods when reimbursements or reductions occur. Expense ratios before reductions for start-up periods may not be representative of longer-term operating periods. Expenses net of fee waivers reflect expenses after reimbursement by the investment adviser but prior to reductions from brokerage service arrangements or other expense offset arrangements. Expenses net of all reductions represent the net expenses paid by the class.
See accompanying notes which are an integral part of the financial statements.
Annual Report
Financial Highlights - Canada
Years ended October 31, | 2010 | 2009 | 2008 | 2007 | 2006 |
Selected Per-Share Data | | | | | |
Net asset value, beginning of period | $ 44.46 | $ 38.37 | $ 70.25 | $ 49.48 | $ 39.14 |
Income from Investment Operations | | | | | |
Net investment income (loss) B | .46 | .48 | .58 | .52 | .34 |
Net realized and unrealized gain (loss) | 9.68 | 5.74 | (28.83) | 21.62 | 10.15 |
Total from investment operations | 10.14 | 6.22 | (28.25) | 22.14 | 10.49 |
Distributions from net investment income | (.47) | (.14) | (.40) | (.36) | (.16) |
Distributions from net realized gain | - | - | (3.27) | (1.03) | (.01) |
Total distributions | (.47) | (.14) | (3.67) | (1.39) | (.17) |
Redemption fees added to paid in capital B | .01 | .01 | .04 | .02 | .02 |
Net asset value, end of period | $ 54.14 | $ 44.46 | $ 38.37 | $ 70.25 | $ 49.48 |
Total Return A | 22.97% | 16.40% | (42.06)% | 46.03% | 26.93% |
Ratios to Average Net Assets C, E | | | | | |
Expenses before reductions | .94% | 1.17% | 1.03% | .96% | 1.00% |
Expenses net of fee waivers, if any | .94% | 1.17% | 1.03% | .96% | 1.00% |
Expenses net of all reductions | .89% | 1.13% | 1.00% | .94% | .97% |
Net investment income (loss) | .93% | 1.24% | 1.00% | .94% | .74% |
Supplemental Data | | | | | |
Net assets, end of period (000 omitted) | $ 3,953,693 | $ 3,149,791 | $ 2,776,298 | $ 4,890,617 | $ 3,136,927 |
Portfolio turnover rate D | 143% | 123% | 63% | 42% | 50% |
A Total returns would have been lower had certain expenses not been reduced during the periods shown.
B Calculated based on average shares outstanding during the period.
C Fees and expenses of the underlying Fidelity Central Funds are not included in the Fund's expense ratio. The Fund indirectly bears its proportionate share of the expenses of any underlying Fidelity Central Funds.
D Amount does not include the portfolio activity of any underlying Fidelity Central Funds.
E Expense ratios reflect operating expenses of the class. Expenses before reductions do not reflect amounts reimbursed by the investment adviser or reductions from brokerage service arrangements or reductions from other expense offset arrangements and do not represent the amount paid by the class during periods when reimbursements or reductions occur. Expenses net of fee waivers reflect expenses after reimbursement by the investment adviser but prior to reductions from brokerage service arrangements or other expense offset arrangements. Expenses net of all reductions represent the net expenses paid by the class.
Financial Highlights - Institutional Class
Years ended October 31, | 2010 | 2009 | 2008 | 2007 G |
Selected Per-Share Data | | | | |
Net asset value, beginning of period | $ 44.39 | $ 38.31 | $ 70.25 | $ 54.00 |
Income from Investment Operations | | | | |
Net investment income (loss) D | .46 | .49 | .52 | .25 |
Net realized and unrealized gain (loss) | 9.65 | 5.72 | (28.78) | 15.99 |
Total from investment operations | 10.11 | 6.21 | (28.26) | 16.24 |
Distributions from net investment income | (.49) | (.14) | (.45) | - |
Distributions from net realized gain | - | - | (3.27) | - |
Total distributions | (.49) | (.14) | (3.72) | - |
Redemption fees added to paid in capital D | .01 | .01 | .04 | .01 |
Net asset value, end of period | $ 54.02 | $ 44.39 | $ 38.31 | $ 70.25 |
Total Return B, C | 22.94% | 16.40% | (42.11)% | 30.09% |
Ratios to Average Net Assets E, H | | | | |
Expenses before reductions | .95% | 1.17% | 1.11% | 1.01% A |
Expenses net of fee waivers, if any | .95% | 1.17% | 1.11% | 1.01% A |
Expenses net of all reductions | .90% | 1.14% | 1.08% | .99% A |
Net investment income (loss) | .92% | 1.23% | .92% | .83% A |
Supplemental Data | | | | |
Net assets, end of period (000 omitted) | $ 46,737 | $ 17,956 | $ 8,870 | $ 4,064 |
Portfolio turnover rate F | 143% | 123% | 63% | 42% |
A Annualized
B Total returns for periods of less than one year are not annualized.
C Total returns would have been lower had certain expenses not been reduced during the periods shown.
D Calculated based on average shares outstanding during the period.
E Fees and expenses of the underlying Fidelity Central Funds are not included in the Fund's expense ratio. The Fund indirectly bears its proportionate share of the expenses of any underlying Fidelity Central Funds.
F Amount does not include the portfolio activity of any underlying Fidelity Central Funds.
G For the period May 2, 2007 (commencement of sale of shares) to October 31, 2007.
H Expense ratios reflect operating expenses of the class. Expenses before reductions do not reflect amounts reimbursed by the investment adviser or reductions from brokerage service arrangements or reductions from other expense offset arrangements and do not represent the amount paid by the class during periods when reimbursements or reductions occur. Expense ratios before reductions for start-up periods may not be representative of longer-term operating periods. Expenses net of fee waivers reflect expenses after reimbursement by the investment adviser but prior to reductions from brokerage service arrangements or other expense offset arrangements. Expenses net of all reductions represent the net expenses paid by the class.
See accompanying notes which are an integral part of the financial statements.
Annual Report
Notes to Financial Statements
For the period ended October 31, 2010
1. Organization.
Fidelity Canada Fund (the Fund) is a fund of Fidelity Investment Trust (the Trust) and is authorized to issue an unlimited number of shares. The Trust is registered under the Investment Company Act of 1940, as amended (the 1940 Act), as an open-end management investment company organized as a Massachusetts business trust. The Fund offers Class A, Class T, Class C, Canada and Institutional Class shares, each of which has equal rights as to assets and voting privileges. Effective after the close of business on September 1, 2010, Class B shares were closed to new accounts and additional purchases by existing shareholders. Each class has exclusive voting rights with respect to matters that affect that class. Class B shares will automatically convert to Class A shares after a holding period of seven years from the initial date of purchase. Investment income, realized and unrealized capital gains and losses, the common expenses of the Fund, and certain fund-level expense reductions, if any, are allocated on a pro-rata basis to each class based on the relative net assets of each class to the total net assets of the Fund. Each class differs with respect to transfer agent and distribution and service plan fees incurred. Certain expense reductions also differ by class.
2. Investments in Fidelity Central Funds.
The Fund may invest in Fidelity Central Funds, which are open-end investment companies available only to other investment companies and accounts managed by Fidelity Management & Research Company (FMR) and its affiliates. The Fund's Schedule of Investments lists each of the Fidelity Central Funds held as of period end, if any, as an investment of the Fund, but does not include the underlying holdings of each Fidelity Central Fund. As an Investing Fund, the Fund indirectly bears its proportionate share of the expenses of the underlying Fidelity Central Funds.
The Money Market Central Funds seek preservation of capital and current income and are managed by Fidelity Investments Money Management, Inc. (FIMM), an affiliate of FMR.
A complete unaudited list of holdings for each Fidelity Central Fund is available upon request or at the Securities and Exchange Commission (the SEC) web site at www.sec.gov. In addition, the financial statements of the Fidelity Central Funds, which are not covered by the Fund's Report of Independent Registered Public Accounting Firm, are available on the SEC web site or upon request.
3. Significant Accounting Policies.
The financial statements have been prepared in conformity with accounting principles generally accepted in the United States of America (GAAP), which require management to make certain estimates and assumptions at the date of the financial statements. Actual results could differ from those estimates. The following summarizes the significant accounting policies of the Fund:
Security Valuation. Investments are valued as of 4:00 p.m. Eastern time on the last calendar day of the period. The Fund uses independent pricing services approved by the Board of Trustees to value its investments. When current market prices or quotations are not readily available or reliable, valuations may be determined in good faith in accordance with procedures adopted by the Board of Trustees. Factors used in determining value may include market or security specific events. The frequency with which these procedures are used cannot be predicted and they may be utilized to a significant extent. The value used for net asset value (NAV) calculation under these procedures may differ from published prices for the same securities.
The Fund categorizes the inputs to valuation techniques used to value its investments into a disclosure hierarchy consisting of three levels as shown below.
Level 1 - quoted prices in active markets for identical investments
Level 2 - other significant observable inputs (including quoted prices for similar investments, interest rates, prepayment speeds, etc.)
Level 3 - unobservable inputs (including the fund's own assumptions based on the best information available)
Changes in valuation techniques may result in transfers in or out of an assigned level within the disclosure hierarchy. The aggregate value of investments by input level, as of October 31, 2010 is included at the end of the Fund's Schedule of Investments. Valuation techniques used to value the Fund's investments by major category are as follows.
Equity securities, including restricted securities, for which market quotations are readily available, are valued at the last reported sale price or official closing price as reported by an independent pricing service on the primary market or exchange on which they are traded and are categorized as Level 1 in the hierarchy. In the event there were no sales during the day or closing prices are not available, securities are valued at the last quoted bid price or may be valued using the last available price and are generally categorized as Level 2 in the hierarchy. For foreign equity securities, when significant market or security specific events arise, comparisons to the valuation of American Depositary Receipts (ADRs), futures contracts, Exchange-traded funds (ETFs) and certain indexes as well as quoted prices for similar securities are used and are categorized as Level 2 in the hierarchy in these circumstances. Utilizing these techniques may result in transfers between Level 1 and Level 2. For restricted equity securities and private placements where observable inputs are limited, assumptions about market activity and risk are used and are categorized as Level 3 in the hierarchy.
Annual Report
3. Significant Accounting Policies - continued
Security Valuation - continued
Investments in open-end mutual funds, including the Fidelity Central Funds, are valued at their closing net asset value each business day and are categorized as Level 1 in the hierarchy. Short-term securities with remaining maturities of sixty days or less for which quotations are not readily available are valued at amortized cost, which approximates fair value and are categorized as Level 2 in the hierarchy.
Foreign Currency. The Fund uses foreign currency contracts to facilitate transactions in foreign-denominated securities. Gains and losses from these transactions may arise from changes in the value of the foreign currency or if the counterparties do not perform under the contracts' terms.
Foreign-denominated assets, including investment securities, and liabilities are translated into U.S. dollars at the exchange rate at period end. Purchases and sales of investment securities, income and dividends received and expenses denominated in foreign currencies are translated into U.S. dollars at the exchange rate in effect on the transaction date.
The effects of exchange rate fluctuations on investments are included with the net realized and unrealized gain (loss) on investment securities. Other foreign currency transactions resulting in realized and unrealized gain (loss) are disclosed separately.
Investment Transactions and Income. For financial reporting purposes, the Fund's investment holdings and NAV include trades executed through the end of the last business day of the period. The NAV per share for processing shareholder transactions is calculated as of the close of business of the New York Stock Exchange (NYSE), normally 4:00 p.m. Eastern time and includes trades executed through the end of the prior business day. Gains and losses on securities sold are determined on the basis of identified cost and may include proceeds received from litigation. Dividend income is recorded on the ex-dividend date, except for certain dividends from foreign securities where the ex-dividend date may have passed, which are recorded as soon as the Fund is informed of the ex-dividend date. Non-cash dividends included in dividend income, if any, are recorded at the fair market value of the securities received. Distributions received on securities that represent a return of capital or capital gain are recorded as a reduction of cost of investments and/or as a realized gain. The Fund estimates the components of distributions received that may be considered return of capital distributions or capital gain distributions. Interest income and distributions from the Fidelity Central Funds are accrued as earned. Interest income includes coupon interest and amortization of premium and accretion of discount on debt securities. Investment income is recorded net of foreign taxes withheld where recovery of such taxes is uncertain.
Expenses. Most expenses of the Trust can be directly attributed to a fund. Expenses which cannot be directly attributed are apportioned amongst each fund in the Trust. Expense estimates are accrued in the period to which they relate and adjustments are made when actual amounts are known.
Income Tax Information and Distributions to Shareholders. Each year, the Fund intends to qualify as a regulated investment company, including distributing substantially all of its taxable income and realized gains under Subchapter M of the Internal Revenue Code and filing its U.S. federal tax return. As a result, no provision for income taxes is required. As of October 31, 2010, the Fund did not have any unrecognized tax benefits in the accompanying financial statements. A fund's federal tax return is subject to examination by the Internal Revenue Service (IRS) for a period of three years. Foreign taxes are provided for based on the Fund's understanding of the tax rules and rates that exist in the foreign markets in which it invests.
Distributions are declared and recorded on the ex-dividend date. Income dividends and capital gain distributions are declared separately for each class. Income and capital gain distributions are determined in accordance with income tax regulations, which may differ from GAAP.
Capital accounts within the financial statements are adjusted for permanent book-tax differences. These adjustments have no impact on net assets or the results of operations. Temporary book-tax differences will reverse in a subsequent period.
Book-tax differences are primarily due to short-term gain distributions from Fidelity Central Funds, foreign currency transactions, passive foreign investment companies (PFIC), deferred trustees compensation, capital loss carryforwards and losses deferred due to wash sales.
The federal tax cost of investment securities and unrealized appreciation (depreciation) as of period end were as follows:
Gross unrealized appreciation | $ 808,571,125 |
Gross unrealized depreciation | (20,169,137) |
Net unrealized appreciation (depreciation) | $ 788,401,988 |
| |
Tax Cost | $ 3,491,509,711 |
The tax-based components of distributable earnings as of period end were as follows:
Undistributed ordinary income | $ 61,650,009 |
Capital loss carryforward | $ (243,313,729) |
Net unrealized appreciation (depreciation) | $ 788,498,050 |
Annual Report
Notes to Financial Statements - continued
3. Significant Accounting Policies - continued
Income Tax Information and Distributions to Shareholders - continued
The tax character of distributions paid was as follows:
| October 31, 2010 | October 31, 2009 |
Ordinary Income | $ 34,208,293 | $ 10,179,804 |
Short-Term Trading (Redemption) Fees. Shares held by investors in the Fund less than 90 days are subject to a redemption fee equal to 1.50% of the net asset value of shares redeemed. All redemption fees, which reduce the proceeds of the shareholder redemption, are retained by the Fund and accounted for as an addition to paid in capital.
4. Purchases and Sales of Investments.
Purchases and sales of securities, other than short-term securities, aggregated $5,636,566,398 and $5,347,008,329, respectively.
The Fund realized a loss on the sale of an investment not meeting the investment restrictions of the Fund. The loss was fully reimbursed by the Fund's investment advisor.
5. Fees and Other Transactions with Affiliates.
Management Fee. FMR and its affiliates provide the Fund with investment management related services for which the Fund pays a monthly management fee. The management fee is the sum of an individual fund fee rate that is based on an annual rate of .45% of the Fund's average net assets and a group fee rate that averaged .26% during the period. The group fee rate is based upon the average net assets of all the mutual funds advised by FMR. The group fee rate decreases as assets under management increase and increases as assets under management decrease. In addition, the management fee is subject to a performance adjustment (up to a maximum of ± .20% of the Fund's average net assets over a 36 month performance period). The upward or downward adjustment to the management fee is based on the relative investment performance of Canada, as compared to an appropriate benchmark index. For the period, the total annual management fee rate, including the performance adjustment, was .64% of the Fund's average net assets.
Distribution and Service Plan Fees. In accordance with Rule 12b-1 of the 1940 Act, the Fund has adopted separate Distribution and Service Plans for each class of shares. Certain classes pay Fidelity Distributors Corporation (FDC), an affiliate of FMR, separate Distribution and Service Fees, each of which is based on an annual percentage of each class' average net assets. In addition, FDC may pay financial intermediaries for selling shares of the Fund and providing shareholder support services. For the period, the Distribution and Service Fee rates, total fees and amounts retained by FDC were as follows:
| Distribution
Fee | Service
Fee | Paid to FDC | Retained
by FDC |
Class A | -% | .25% | $ 312,428 | $ 11,816 |
Class T | .25% | .25% | 123,743 | - |
Class B | .75% | .25% | 105,189 | 78,891 |
Class C | .75% | .25% | 401,979 | 204,393 |
| | | $ 943,339 | $ 295,100 |
Sales Load. FDC receives a front-end sales charge of up to 5.75% for selling Class A shares, and 3.50% for selling Class T shares, some of which is paid to financial intermediaries for selling shares of the Fund. FDC receives the proceeds of contingent deferred sales charges levied on Class A, Class T, Class B, and Class C redemptions. These charges depend on the holding period. The deferred sales charges range from 5% to 1% for Class B, 1% for Class C, 1.00% for certain purchases of Class A shares (1.00% to .50% prior to July 12, 2010) and .25% for certain purchases of Class T shares.
Annual Report
5. Fees and Other Transactions with Affiliates - continued
Sales Load - continued
For the period, sales charge amounts retained by FDC were as follows:
| Retained
by FDC |
Class A | $ 169,728 |
Class T | 20,643 |
Class B* | 19,800 |
Class C* | 8,543 |
| $ 218,714 |
* When Class B and Class C shares are initially sold, FDC pays commissions from its own resources to financial intermediaries through which the sales are made.
Transfer Agent Fees. Fidelity Investments Institutional Operations Company, Inc. (FIIOC), an affiliate of FMR, is the transfer, dividend disbursing and shareholder servicing agent for each class of the Fund. FIIOC receives account fees and asset-based fees that vary according to the account size and type of account of the shareholders of the respective classes of the Fund. FIIOC pays for typesetting, printing and mailing of shareholder reports, except proxy statements. For the period, transfer agent fees for each class were as follows:
| Amount | % of
Average
Net Assets |
Class A | $ 357,370 | .28 |
Class T | 77,021 | .31 |
Class B | 32,593 | .31 |
Class C | 116,977 | .29 |
Canada | 8,568,457 | .24 |
Institutional Class | 76,686 | .25 |
| $ 9,229,104 | |
Accounting and Security Lending Fees. Fidelity Service Company, Inc. (FSC), an affiliate of FMR, maintains the Fund's accounting records. The accounting fee is based on the level of average net assets for the month. Under a separate contract, FSC administers the security lending program. The security lending fee is based on the number and duration of lending transactions.
Brokerage Commissions. The Fund placed a portion of its portfolio transactions with brokerage firms which are affiliates of the investment adviser. The commissions paid to these affiliated firms were $650 for the period.
Interfund Lending Program. Pursuant to an Exemptive Order issued by the SEC, the Fund, along with other registered investment companies having management contracts with FMR, may participate in an interfund lending program. This program provides an alternative credit facility allowing the funds to borrow from, or lend money to, other participating affiliated funds. At period end, there were no interfund loans outstanding. The Fund's activity in this program during the period for which loans were outstanding was as follows:
Borrower or Lender | Average Daily
Loan Balance | Weighted Average Interest Rate | Interest
Expense |
Borrower | $ 7,003,722 | .45% | $ 1,574 |
6. Committed Line of Credit.
The Fund participates with other funds managed by FMR or an affiliate in a $3.75 billion credit facility (the "line of credit") to be utilized for temporary or emergency purposes to fund shareholder redemptions or for other short-term liquidity purposes. The Fund has agreed to pay commitment fees on its pro-rata portion of the line of credit, which amounted to $14,854 and is reflected in Miscellaneous expenses on the Statement of Operations. During the period, there were no borrowings on this line of credit.
7. Security Lending.
The Fund lends portfolio securities through a lending agent from time to time in order to earn additional income. The lending agent may loan securities to certain qualified borrowers, including Fidelity Capital Markets (FCM), a broker-dealer affiliated with the Fund. On the settlement date of the loan, the Fund receives collateral (in the form of U.S. Treasury obligations, letters of credit and/or cash) against the loaned securities and maintains collateral in an amount not less than 100% of the market value of the loaned securities during the period of the loan. The market value of the loaned
Annual Report
Notes to Financial Statements - continued
7. Security Lending - continued
securities is determined at the close of business of the Fund and any additional required collateral is delivered to the Fund on the next business day. If the borrower defaults on its obligation to return the securities loaned because of insolvency or other reasons, a fund could experience delays and costs in recovering the securities loaned or in gaining access to the collateral. Any cash collateral received is invested in the Fidelity Securities Lending Cash Central Fund. The value of loaned securities and cash collateral at period end are disclosed on the Fund's Statement of Assets and Liabilities. Security lending income represents the income earned on investing cash collateral, less rebates paid to borrowers and lending agent fees associated with the loan, plus any premium payments received for lending certain types of securities. Security lending income is presented in the Statement of Operations as a component of income from Fidelity Central Funds. During the period, there were no securities loaned to FCM.
8. Expense Reductions.
Many of the brokers with whom FMR places trades on behalf of the Fund provided services to the Fund in addition to trade execution. These services included payments of certain expenses on behalf of the Fund totaling $1,984,527 for the period.
9. Distributions to Shareholders.
Distributions to shareholders of each class were as follows:
Years ended October 31, | 2010 | 2009 |
From net investment income | | |
Class A | $ 756,039 | $ 107,700 |
Class T | 106,904 | - |
Class B | 15,600 | - |
Class C | 97,752 | - |
Canada | 33,027,962 | 10,039,164 |
Institutional Class | 204,036 | 32,940 |
Total | $ 34,208,293 | $ 10,179,804 |
10. Share Transactions.
Transactions for each class of shares were as follows:
| Shares | Dollars |
Years ended October 31, | 2010 | 2009 | 2010 | 2009 |
Class A | | | | |
Shares sold | 2,050,255 | 894,135 | $ 102,518,373 | $ 37,345,647 |
Reinvestment of distributions | 14,622 | 3,241 | 696,013 | 102,525 |
Shares redeemed | (773,357) | (493,476) | (38,292,678) | (17,901,706) |
Net increase (decrease) | 1,291,520 | 403,900 | $ 64,921,708 | $ 19,546,466 |
Class T | | | | |
Shares sold | 296,633 | 153,535 | $ 14,818,898 | $ 6,072,136 |
Reinvestment of distributions | 2,182 | - | 103,790 | - |
Shares redeemed | (113,003) | (144,414) | (5,600,141) | (5,034,459) |
Net increase (decrease) | 185,812 | 9,121 | $ 9,322,547 | $ 1,037,677 |
Class B | | | | |
Shares sold | 134,473 | 68,778 | $ 6,579,801 | $ 2,732,178 |
Reinvestment of distributions | 263 | - | 12,424 | - |
Shares redeemed | (47,606) | (50,130) | (2,342,627) | (1,849,231) |
Net increase (decrease) | 87,130 | 18,648 | $ 4,249,598 | $ 882,947 |
Class C | | | | |
Shares sold | 647,123 | 311,799 | $ 31,812,568 | $ 13,003,041 |
Reinvestment of distributions | 1,580 | - | 74,410 | - |
Shares redeemed | (196,235) | (183,651) | (9,599,233) | (6,643,635) |
Net increase (decrease) | 452,468 | 128,148 | $ 22,287,745 | $ 6,359,406 |
Canada | | | | |
Shares sold | 20,151,337 | 19,139,057 | $ 1,010,632,290 | $ 774,158,834 |
Reinvestment of distributions | 659,119 | 306,492 | 31,486,105 | 9,628,844 |
Shares redeemed | (18,629,713) | (20,957,211) | (923,131,901) | (789,350,714) |
Net increase (decrease) | 2,180,743 | (1,511,662) | $ 118,986,494 | $ (5,563,036) |
Annual Report
10. Share Transactions - continued
| Shares | Dollars |
Years ended October 31, | 2010 | 2009 | 2010 | 2009 |
Institutional Class | | | | |
Shares sold | 717,543 | 280,690 | $ 36,118,321 | $ 11,718,786 |
Reinvestment of distributions | 2,830 | 737 | 134,893 | 23,131 |
Shares redeemed | (259,715) | (108,451) | (12,754,674) | (3,897,165) |
Net increase (decrease) | 460,658 | 172,976 | $ 23,498,540 | $ 7,844,752 |
11. Other.
The Fund's organizational documents provide former and current trustees and officers with a limited indemnification against liabilities arising in connection with the performance of their duties to the Fund. In the normal course of business, the Fund may also enter into contracts that provide general indemnifications. The Fund's maximum exposure under these arrangements is unknown as this would be dependent on future claims that may be made against the Fund. The risk of material loss from such claims is considered remote.
Annual Report
Report of Independent Registered Public Accounting Firm
To the Trustees of Fidelity Investment Trust and the Shareholders of Fidelity Canada Fund:
In our opinion, the accompanying statement of assets and liabilities, including the schedule of investments, and the related statements of operations and of changes in net assets and the financial highlights present fairly, in all material respects, the financial position of Fidelity Canada Fund (a fund of Fidelity Investment Trust) at October 31, 2010, the results of its operations for the year then ended, the changes in its net assets for each of the two years in the period then ended and the financial highlights for each of the periods indicated, in conformity with accounting principles generally accepted in the United States of America. These financial statements and financial highlights (hereafter referred to as "financial statements") are the responsibility of the Fidelity Canada Fund's management. Our responsibility is to express an opinion on these financial statements based on our audits. We conducted our audits of these financial statements in accordance with the standards of the Public Company Accounting Oversight Board (United States). Those standards require that we plan and perform the audit to obtain reasonable assurance about whether the financial statements are free of material misstatement. An audit includes examining, on a test basis, evidence supporting the amounts and disclosures in the financial statements, assessing the accounting principles used and significant estimates made by management, and evaluating the overall financial statement presentation. We believe that our audits, which included confirmation of securities at October 31, 2010 by correspondence with the custodian and brokers, provide a reasonable basis for our opinion.
/s/ PricewaterhouseCoopers LLP
PricewaterhouseCoopers LLP
Boston, Massachusetts
December 17, 2010
Annual Report
The Trustees, Member of the Advisory Board, and executive officers of the trust and fund, as applicable, are listed below. The Board of Trustees governs the fund and is responsible for protecting the interests of shareholders. The Trustees are experienced executives who meet periodically throughout the year to oversee the fund's activities, review contractual arrangements with companies that provide services to the fund, oversee management of the risks associated with such activities and contractual arrangements, and review the fund's performance. Except for James C. Curvey, each of the Trustees oversees 221 funds advised by FMR or an affiliate. Mr. Curvey oversees 410 funds advised by FMR or an affiliate.
The Trustees hold office without limit in time except that (a) any Trustee may resign; (b) any Trustee may be removed by written instrument, signed by at least two-thirds of the number of Trustees prior to such removal; (c) any Trustee who requests to be retired or who has become incapacitated by illness or injury may be retired by written instrument signed by a majority of the other Trustees; and (d) any Trustee may be removed at any special meeting of shareholders by a two-thirds vote of the outstanding voting securities of the trust. Each Trustee who is not an interested person (as defined in the 1940 Act) (Independent Trustee), shall retire not later than the last day of the calendar year in which his or her 72nd birthday occurs. The Independent Trustees may waive this mandatory retirement age policy with respect to individual Trustees. The executive officers and Advisory Board Member hold office without limit in time, except that any officer and Advisory Board Member may resign or may be removed by a vote of a majority of the Trustees at any regular meeting or any special meeting of the Trustees. Except as indicated, each individual has held the office shown or other offices in the same company for the past five years.
Experience, Skills, Attributes, and Qualifications of the Fund's Trustees. The Governance and Nominating Committee has adopted a statement of policy that describes the experience, qualifications, attributes, and skills that are necessary and desirable for potential Independent Trustee candidates (Statement of Policy). The Board believes that each Trustee satisfied at the time he or she was initially elected or appointed a Trustee, and continues to satisfy, the standards contemplated by the Statement of Policy. The Governance and Nominating Committee also engages professional search firms to help identify potential Independent Trustee candidates who have the experience, qualifications, attributes, and skills consistent with the Statement of Policy. From time to time, additional criteria based on the composition and skills of the current Independent Trustees, as well as experience or skills that may be appropriate in light of future changes to board composition, business conditions, and regulatory or other developments, have also been considered by the professional search firms and the Governance and Nominating Committee. In addition, the Board takes into account the Trustees' commitment and participation in Board and committee meetings, as well as their leadership of standing and ad hoc committees throughout their tenure.
In determining that a particular Trustee was and continues to be qualified to serve as a Trustee, the Board has considered a variety of criteria, none of which, in isolation, was controlling. The Board believes that, collectively, the Trustees have balanced and diverse experience, qualifications, attributes, and skills, which allow the Board to operate effectively in governing the fund and protecting the interests of shareholders. Information about the specific experience, skills, attributes, and qualifications of each Trustee, which in each case led to the Board's conclusion that the Trustee should serve (or continue to serve) as a trustee of the fund, is provided below.
Board Structure and Oversight Function. Edward C. Johnson 3d is an interested person (as defined in the 1940 Act) and currently serves as Chairman. The Trustees have determined that an interested Chairman is appropriate and benefits shareholders because an interested Chairman has a personal and professional stake in the quality and continuity of services provided to the fund. Independent Trustees exercise their informed business judgment to appoint an individual of their choosing to serve as Chairman, regardless of whether the Trustee happens to be independent or a member of management. The Independent Trustees have determined that they can act independently and effectively without having an Independent Trustee serve as Chairman and that a key structural component for assuring that they are in a position to do so is for the Independent Trustees to constitute a substantial majority for the Board. The Independent Trustees also regularly meet in executive session. Ned C. Lautenbach serves as Chairman of the Independent Trustees and as such (i) acts as a liaison between the Independent Trustees and management with respect to matters important to the Independent Trustees and (ii) with management prepares agendas for Board meetings.
Fidelity funds are overseen by different Boards of Trustees. The fund's Board oversees Fidelity's equity and high income funds and another Board oversees Fidelity's investment-grade bond, money market, and asset allocation funds. The asset allocation funds may invest in Fidelity funds overseen by the fund's Board. The use of separate Boards, each with its own committee structure, allows the Trustees of each group of Fidelity funds to focus on the unique issues of the funds they oversee, including common research, investment, and operational issues. On occasion, the separate Boards establish joint committees to address issues of overlapping consequences for the Fidelity funds overseen by each Board.
The Trustees operate using a system of committees to facilitate the timely and efficient consideration of all matters of importance to the Trustees, the fund, and fund shareholders and to facilitate compliance with legal and regulatory requirements and oversight of the fund's activities and associated risks. The Board, acting through its committees, has charged FMR and its affiliates with (i) identifying events or circumstances the occurrence of which could have demonstrably adverse effects on the fund's business and/or reputation; (ii) implementing processes and controls to lessen the possibility that such events or circumstances occur or to mitigate the effects of such events or circumstances if they do occur; and (iii) creating and maintaining a system designed to evaluate continuously business and market conditions in order to facilitate the identification and implementation processes described in (i) and (ii) above. Because the day-to-day operations and activities of the fund are carried out by or through FMR, its affiliates and other service providers, the fund's exposure to risks is mitigated but not eliminated by the processes overseen by the Trustees. While each of the Board's committees has responsibility for overseeing different aspects of the fund's activities, oversight is exercised primarily through the Operations, Audit, and Compliance Committees. Appropriate personnel, including but not limited to the fund's Chief Compliance Officer (CCO), FMR's internal auditor, the independent accountants, the fund's Treasurer and portfolio management personnel, make periodic reports to the Board's committees, as appropriate. The responsibilities of each committee, including their oversight responsibilities, are described further under "Standing Committees of the Fund's Trustees."
Annual Report
Trustees and Officers - continued
The fund's Statement of Additional Information (SAI) includes more information about the Trustees. To request a free copy, call Fidelity at 1-877-208-0098.
Interested Trustees*:
Correspondence intended for each Trustee who is an interested person may be sent to Fidelity Investments, 82 Devonshire Street, Boston, Massachusetts 02109.
Name, Age; Principal Occupations and Other Relevant Experience+ |
Edward C. Johnson 3d (80) |
| Year of Election or Appointment: 1984 Mr. Johnson is Trustee and Chairman of the Board of Trustees of certain Trusts. Mr. Johnson serves as Chief Executive Officer, Chairman, and a Director of FMR LLC; Chairman and a Director of FMR; Chairman and a Director of Fidelity Research & Analysis Company (FRAC); Chairman and a Director of Fidelity Investments Money Management, Inc.; and Chairman and a Director of FMR Co., Inc. In addition, Mr. Johnson serves as Chairman and Director of FIL Limited. Previously, Mr. Johnson served as President of FMR LLC (2006-2007). |
James C. Curvey (75) |
| Year of Election or Appointment: 2007 Mr. Curvey also serves as Trustee (2007-present) of other investment companies advised by FMR. Mr. Curvey is a Director of Fidelity Investments Money Management, Inc. (2009-present), Director of Fidelity Research & Analysis Co. (2009-present) and Director of FMR and FMR Co., Inc. (2007-present). Mr. Curvey is also Vice Chairman (2007-present) and Director of FMR LLC. In addition, Mr. Curvey serves as an Overseer for the Boston Symphony Orchestra and a member of the Trustees of Villanova University. Previously, Mr. Curvey was the Vice Chairman (2006-2007) and Director (2000-2007) of FMR Corp. |
* Trustees have been determined to be "Interested Trustees" by virtue of, among other things, their affiliation with the trust or various entities under common control with FMR.
+ The information above includes each Trustee's principal occupation during the last five years and other information relating to the experience, attributes, and skills relevant to each Trustee's qualifications to serve as a Trustee, which led to the conclusion that each Trustee should serve as a Trustee for the fund.
Independent Trustees:
Correspondence intended for each Independent Trustee (that is, the Trustees other than the Interested Trustees) may be sent to Fidelity Investments, P.O. Box 55235, Boston, Massachusetts 02205-5235.
Name, Age; Principal Occupations and Other Relevant Experience+ |
Dennis J. Dirks (62) |
| Year of Election or Appointment: 2005 Prior to his retirement in May 2003, Mr. Dirks was Chief Operating Officer and a member of the Board of The Depository Trust & Clearing Corporation (DTCC). He also served as President, Chief Operating Officer, and Board member of The Depository Trust Company (DTC) and President and Board member of the National Securities Clearing Corporation (NSCC). In addition, Mr. Dirks served as Chief Executive Officer and Board member of the Government Securities Clearing Corporation, Chief Executive Officer and Board member of the Mortgage-Backed Securities Clearing Corporation, as a Trustee and a member of the Finance Committee of Manhattan College (2005-2008), and as a Trustee and a member of the Finance Committee of AHRC of Nassau County (2006-2008). Mr. Dirks is a member of the Independent Directors Council (IDC) Governing Council (2010-Present) and Board of Directors for The Brookville Center for Children's Services, Inc. (2009-present). |
Alan J. Lacy (57) |
| Year of Election or Appointment: 2008 Mr. Lacy serves as Senior Adviser (2007-present) of Oak Hill Capital Partners, L.P. (private equity). Mr. Lacy also served as Chief Executive Officer (2000-2005) and Vice Chairman (2005-2006) of Sears Holdings Corporation and Sears, Roebuck and Co. (retail). In addition, Mr. Lacy serves as a member of the Board of Directors of The Western Union Company (global money transfer, 2006-present) and Bristol-Myers Squibb Company (global pharmaceuticals, 2007-present). Mr. Lacy is Chairman (2008-present) and a member (2006-present) of the Board of Trustees of The National Parks Conservation Association. |
Ned C. Lautenbach (66) |
| Year of Election or Appointment: 2000 Mr. Lautenbach is Chairman of the Independent Trustees of the Equity and High Income Funds (2006-present). Mr. Lautenbach currently serves as the Lead Director of the Eaton Corporation Board of Directors (diversified industrial, 1997-present). Mr. Lautenbach is also a member of the Board of Directors of the Philharmonic Center for the Arts in Naples, Florida (1999-
present); a member of the Board of Trustees of Fairfield University (2005-present); and a member of the Council on Foreign Relations (1994-present). Previously, Mr. Lautenbach was a Partner/Advisory Partner at Clayton, Dubilier & Rice, Inc. (private equity investment, 1998-2010), as well as a Director of Sony Corporation (2006-2007). |
Joseph Mauriello (66) |
| Year of Election or Appointment: 2008 Prior to his retirement in January 2006, Mr. Mauriello served in numerous senior management positions including Deputy Chairman and Chief Operating Officer (2004-2005), and Vice Chairman of Financial Services (2002-2004) of KPMG LLP US (professional services, 1965-2005). Mr. Mauriello currently serves as a member of the Board of Directors of XL Group plc. (global insurance and re-insurance, 2006-present) and of Arcadia Resources Inc. (health care services and products, 2007-present).
Previously, Mr. Mauriello served as a Director of the Hamilton Funds of the Bank of New York (2006-2007). |
Cornelia M. Small (66) |
| Year of Election or Appointment: 2005 Ms. Small is a member of the Board of Directors of the Teagle Foundation (2009-present). Ms. Small is also a member of the Investment Committee, and Chair (2008-present) and a member of the Board of Trustees of Smith College. In addition, Ms. Small serves on the Investment Committee of the Berkshire Taconic Community Foundation (2008-present). Previously, Ms. Small served as Chairperson of the Investment Committee (2002-2008) of Smith College. In addition, Ms. Small served as Chief Investment Officer, Director of Global Equity Investments, and a member of the Board of Directors of Scudder, Stevens & Clark and Scudder Kemper Investments. |
William S. Stavropoulos (71) |
| Year of Election or Appointment: 2001 Mr. Stavropoulos is Vice Chairman of the Independent Trustees of the Equity and High Income Funds (2006-present). Mr. Stavropoulos serves as President and Founder of the Michigan Baseball Foundation, the Great Lakes Loons (2007-present). Mr. Stavropoulos is Chairman Emeritus of the Board of Directors of The Dow Chemical Company, where he previously served in numerous senior management positions, including President, CEO (1995-2000; 2002-2004), Chairman of the Executive Committee (2000-2006), and as a member of the Board of Directors (1990-2006). Currently, Mr. Stavropoulos is Chairman of Univar (global distributor of commodity and specialty chemicals, 2010-present), a Director of Teradata Corporation (data warehousing and technology solutions, 2008-present), Chemical Financial Corporation, Maersk Inc. (industrial conglomerate), Tyco International, Inc. (multinational manufacturing and services, 2007-present), and a member of the Advisory Board for Metalmark Capital (private equity investment, 2005-present). Mr. Stavropoulos is a special advisor to Clayton, Dubilier & Rice, Inc. (private equity investment). In addition, Mr. Stavropoulos is a member of the University of Notre Dame Advisory Council for the College of Science. |
David M. Thomas (61) |
| Year of Election or Appointment: 2008 Previously, Mr. Thomas served as Executive Chairman (2005-2006) and Chairman and Chief Executive Officer (2000-2005) of IMS Health, Inc. (pharmaceutical and healthcare information solutions). In addition, Mr. Thomas serves as a member of the Board of Directors of Fortune Brands, Inc. (consumer products), and Interpublic Group of Companies, Inc. (marketing communication, 2004-present). |
Michael E. Wiley (60) |
| Year of Election or Appointment: 2008 Mr. Wiley also serves as a Director of Asia Pacific Exploration Consolidated (international oil and gas exploration and production, 2008-present). Mr. Wiley serves as a Director of Tesoro Corporation (independent oil refiner and marketer, 2005-present), and a Director of Bill Barrett Corporation (exploration and production, 2005-present). In addition, Mr. Wiley also serves as a Director of Post Oak Bank (privately-held bank, 2004-present). Previously, Mr. Wiley served as a member of the Board of Trustees of the University of Tulsa (2000-2006; 2007-2010), as a Senior Energy Advisor of Katzenbach Partners, LLC (consulting, 2006-2007), as an Advisory Director of Riverstone Holdings (private investment), Chairman, President, and CEO of Baker Hughes, Inc. (oilfield services, 2000-2004), and as Director of Spinnaker Exploration Company (exploration and production, 2001-2005). |
+ The information above includes each Trustee's principal occupation during the last five years and other information relating to the experience, attributes, and skills relevant to each Trustee's qualifications to serve as a Trustee, which led to the conclusion that each Trustee should serve as a Trustee for the fund.
Annual Report
Trustees and Officers - continued
Advisory Board Members and Executive Officers:
Correspondence intended for each executive officer and Peter S. Lynch may be sent to Fidelity Investments, 82 Devonshire Street, Boston, Massachusetts 02109.
Name, Age; Principal Occupation |
Peter S. Lynch (66) |
| Year of Election or Appointment: 2003 Member of the Advisory Board of Fidelity's Equity and High Income Funds. Mr. Lynch is Vice Chairman and a Director of FMR and FMR Co., Inc. In addition, Mr. Lynch serves as a Trustee of Boston College and as the Chairman of the Inner-City Scholarship Fund. Previously, Mr. Lynch served on the Special Olympics International Board of Directors (1997-2006). |
Kenneth B. Robins (41) |
| Year of Election or Appointment: 2008 President and Treasurer of Fidelity's Equity and High Income Funds. Mr. Robins also serves as President and Treasurer (2010-
present) and Assistant Treasurer (2009-present) of other Fidelity funds and is an employee of Fidelity Investments (2004-present). Previously, Mr. Robins served as Deputy Treasurer of the Fidelity funds (2005-2008) and Treasurer and Chief Financial Officer of The North Carolina Capital Management Trust: Cash and Term Portfolios (2006-2008). |
Bruce T. Herring (45) |
| Year of Election or Appointment: 2006 Vice President of certain Equity Funds. Mr. Herring also serves as Chief Investment Officer and Director of Fidelity Management & Research (U.K.) Inc. (2010-present) and Group Chief Investments Officer of FMR. Previously, Mr. Herring served as Vice President (2005-2006) and Senior Vice President (2006-2007) of Fidelity Management & Research Company, Vice President of FMR Co., Inc. (2001-2007) and as a portfolio manager for Fidelity U.S. Equity Funds. |
Brian B. Hogan (46) |
| Year of Election or Appointment: 2009 Vice President of certain Equity Funds and Vice President of Sector Funds. Mr. Hogan also serves as President of FMR's Equity Division (2009-present). Previously, Mr. Hogan served as Senior Vice President, Equity Research of FMR (2006-2009) and as a portfolio manager. |
Scott C. Goebel (42) |
| Year of Election or Appointment: 2008 Secretary and Chief Legal Officer (CLO) of the Fidelity funds. Mr. Goebel also serves as Secretary and CLO of The North Carolina Capital Management Trust: Cash and Term Portfolio (2008-present); General Counsel, Secretary, and Senior Vice President of FMR (2008-present) and FMR Co., Inc. (2008-present); Deputy General Counsel of FMR LLC; Chief Legal Officer of Fidelity Management & Research (Hong Kong) Limited (2008-present) and Assistant Secretary of Fidelity Management & Research (Japan) Inc. (2008-present), Fidelity Investments Money Management, Inc. (2008-present), Fidelity Management & Research (U.K.) Inc. (2008-present), and Fidelity Research and Analysis Company (2008-present). Previously, Mr. Goebel served as Assistant Secretary of the Funds (2007-2008) and as Vice President and Secretary of Fidelity Distributors Corporation (FDC) (2005-2007). |
William C. Coffey (41) |
| Year of Election or Appointment: 2009 Assistant Secretary of Fidelity's Equity and High Income Funds. Mr. Coffey also serves as Senior Vice President and Deputy General Counsel of FMR LLC (2010-present), and is an employee of Fidelity Investments. Previously, Mr. Coffey served as Vice President and Associate General Counsel of FMR LLC (2005-2009). |
Holly C. Laurent (56) |
| Year of Election or Appointment: 2008 Anti-Money Laundering (AML) Officer of the Fidelity funds. Ms. Laurent also serves as AML Officer of The North Carolina Capital Management Trust: Cash and Term Portfolio (2008-present) and is an employee of Fidelity Investments. Previously, Ms. Laurent was Senior Vice President and Head of Legal for Fidelity Business Services India Pvt. Ltd. (2006-2008), and Senior Vice President, Deputy General Counsel and Group Head for FMR LLC (2005-2006). |
Christine Reynolds (52) |
| Year of Election or Appointment: 2008 Chief Financial Officer of the Fidelity funds. Ms. Reynolds became President of Fidelity Pricing and Cash Management Services (FPCMS) in August 2008. Ms. Reynolds served as Chief Operating Officer of FPCMS (2007-2008). Previously, Ms. Reynolds served as President, Treasurer, and Anti-Money Laundering officer of the Fidelity funds (2004-2007). |
Kenneth A. Rathgeber (63) |
| Year of Election or Appointment: 2004 Chief Compliance Officer of Fidelity's Equity and High Income Funds. Mr. Rathgeber is Chief Compliance Officer of Fidelity Management & Research (Hong Kong) Limited (2008-present), Fidelity Management & Research (Japan) Inc. (2008-present), FMR (2005-present), FMR Co., Inc. (2005-present), Fidelity Management & Research (U.K.) Inc. (2005-present), Fidelity Research & Analysis Company (2005-present), Fidelity Investments Money Management, Inc. (2005-present), Pyramis Global Advisors, LLC (2005-present), and Strategic Advisers, Inc. (2005-present). |
Jeffrey S. Christian (49) |
| Year of Election or Appointment: 2009 Deputy Treasurer of the Fidelity funds. Mr. Christian is an employee of Fidelity Investments. Previously, Mr. Christian served as Chief Financial Officer (2008-2009) of certain Fidelity funds and Senior Vice President of Fidelity Pricing and Cash Management Services (FPCMS) (2004-2009). |
Bryan A. Mehrmann (43) |
| Year of Election or Appointment: 2005 Deputy Treasurer of the Fidelity funds. Mr. Mehrmann is an employee of Fidelity Investments. |
Adrien E. Deberghes (43) |
| Year of Election or Appointment: 2008 Deputy Treasurer of Fidelity's Equity and High Income Funds. Mr. Deberghes also serves as Assistant Treasurer of other Fidelity funds (2010-present) and is an employee of Fidelity Investments (2008-present). Previously, Mr. Deberghes served as Senior Vice President of Mutual Fund Administration at State Street Corporation (2007-2008), Senior Director of Mutual Fund Administration at Investors Bank & Trust (2005-2007), and Director of Finance for Dunkin' Brands (2000-2005). |
Stephanie J. Dorsey (41) |
| Year of Election or Appointment: 2010 Assistant Treasurer of Fidelity's Equity and High Income Funds. Ms. Dorsey also serves as Deputy Treasurer of other Fidelity funds (2008-present) and is an employee of Fidelity Investments (2008-present). Previously, Ms. Dorsey served as Treasurer (2004-2008) of the JPMorgan Mutual Funds and Vice President (2004-2008) of JPMorgan Chase Bank. |
John R. Hebble (52) |
| Year of Election or Appointment: 2009 Assistant Treasurer of Fidelity's Equity and High Income Funds. Mr. Hebble also serves as Treasurer and Chief Financial Officer of The North Carolina Capital Management Trust: Cash and Term Portfolio (2008-present), President and Treasurer of other Fidelity funds (2008-present) and is an employee of Fidelity Investments. |
Gary W. Ryan (52) |
| Year of Election or Appointment: 2005 Assistant Treasurer of the Fidelity funds. Mr. Ryan is an employee of Fidelity Investments. Previously, Mr. Ryan served as Vice President of Fund Reporting in Fidelity Pricing and Cash Management Services (FPCMS) (1999-2005). |
Jonathan Davis (42) |
| Year of Election or Appointment: 2010 Assistant Treasurer of the Fidelity funds. Mr. Davis is an employee of Fidelity Investments. Previously, Mr. Davis served as Vice President and Associate General Counsel of FMR LLC (2003-2010). |
Annual Report
The Board of Trustees of Fidelity Canada Fund voted to pay to shareholders of record at the opening of business on record date, the following distributions per share derived from capital gains realized from sales of portfolio securities, and dividends derived from net investment income:
| Pay Date | Record Date | Dividends | Capital Gains |
Institutional Class | 12/06/10 | 12/03/10 | $0.47 | $0.441 |
The Institutional Class designates 96%, of the dividends distributed during the fiscal year as amounts which may be taken into account as a dividend for the purposes of the maximum rate under section 1(h)(11) of the Internal Revenue Code.
The amounts per share which represent income derived from sources within, and taxes paid to, foreign countries or possessions of the United States are as follows:
| Pay Date | Income | Taxes |
Institutional Class | 12/07/2009 | $.575 | $.0866 |
The fund will notify shareholders in January 2011 of amounts for use in preparing 2010 income tax returns.
Annual Report
Board Approval of Investment Advisory Contracts and Management Fees
Fidelity Canada Fund
Each year, the Board of Trustees, including the Independent Trustees (together, the Board), votes on the renewal of the management contract and sub-advisory agreements (together, the Advisory Contracts) for the fund. The Board, assisted by the advice of fund counsel and Independent Trustees' counsel, requests and considers a broad range of information relevant to the renewal of the Advisory Contracts throughout the year.
The Board meets regularly and considers at each of its meetings factors that are relevant to its annual consideration of the renewal of the fund's Advisory Contracts, including the services and support provided to the fund and its shareholders. The Board has established various standing committees, each composed of Independent Trustees with varying backgrounds, to which the Board has assigned specific subject matter responsibilities in order to enhance effective decision-making by the Board. The Board, acting directly and through its Committees, requests and receives information concerning the annual consideration of the renewal of the fund's Advisory Contracts. The Board also meets as needed to consider matters specifically related to the Board's annual consideration of the renewal of Advisory Contracts. Members of the Board may also meet with trustees of other Fidelity funds through ad hoc joint committees to discuss certain matters relevant to the Fidelity funds.
At its July 2010 meeting, the Board of Trustees, including the Independent Trustees, unanimously determined to renew the fund's Advisory Contracts. In reaching its determination, the Board considered all factors it believed relevant, including (i) the nature, extent, and quality of the services to be provided to the fund and its shareholders (including the investment performance of the fund); (ii) the competitiveness of the fund's management fee and total expenses; (iii) the total costs of the services to be provided by and the profits to be realized by Fidelity from its relationship with the fund; (iv) the extent to which economies of scale would be realized as the fund grows; and (v) whether fee levels reflect these economies of scale, if any, for the benefit of fund shareholders.
In considering whether to renew the Advisory Contracts for the fund, the Board reached a determination, with the assistance of fund counsel and Independent Trustees' counsel and through the exercise of its business judgment, that the renewal of the Advisory Contracts is in the best interests of fund shareholders and that the compensation to be received by Fidelity under the management contract is fair and reasonable. The Board's decision to renew the Advisory Contracts was not based on any single factor noted above, but rather was based on a comprehensive consideration of all the information provided to the Board at its meetings throughout the year. The Board, in reaching its determination to renew the Advisory Contracts, is aware that shareholders in the fund have a broad range of investment choices available to them, including a wide choice among mutual funds offered by Fidelity's competitors, and that the fund's shareholders, with the opportunity to review and weigh the disclosure provided by the fund in its prospectus and other public disclosures, have chosen to invest in this fund, managed by Fidelity.
Nature, Extent, and Quality of Services Provided. The Board considered the staffing within the investment adviser, FMR, and the sub-advisers (together, the Investment Advisers), including the backgrounds of the fund's investment personnel and the fund's investment objective and discipline. The Independent Trustees also had discussions with senior management of Fidelity's investment operations and investment groups. The Board considered the structure of the portfolio manager compensation program and whether this structure provides appropriate incentives to act in the best interest of the fund.
Resources Dedicated to Investment Management and Support Services. The Board and the equity research subcommittee of the Board's Fund Oversight Committee reviewed the size, education, and experience of the Investment Advisers' investment staff, their use of technology, and the Investment Advisers' approach to recruiting, training, and retaining portfolio managers and other research, advisory, and management personnel. The Board noted that Fidelity's analysts have access to a variety of technological tools and market and securities data that enable them to perform both fundamental and quantitative analysis and to specialize in various disciplines. The Board considered Fidelity's extensive global research capabilities that enable the Investment Advisers to aggregate data from various sources in an effort to produce positive investment results. The Board also considered that Fidelity's portfolio managers and analysts have access to daily portfolio attribution that allows for monitoring of a fund's portfolio, as well as an electronic communication system that provides immediate real-time access to research concerning issuers and credit enhancers. The Board noted FMR's continued focus on strengthening the organization and discipline of equity portfolio management and research.
Shareholder and Administrative Services. The Board considered (i) the nature, extent, quality, and cost of advisory, administrative, and shareholder services performed by the Investment Advisers and their affiliates under the Advisory Contracts and under separate agreements covering transfer agency, pricing and bookkeeping, and securities lending services for the fund; (ii) the nature and extent of the investment adviser's supervision of third party service providers, principally custodians and subcustodians; and (iii) the resources devoted to, and the record of compliance with, the fund's compliance policies and procedures. The Board also reviewed the allocation of fund brokerage, including allocations to brokers affiliated with the Investment Advisers, the use of brokerage commissions to pay fund expenses, and the use of "soft" commission dollars to pay for research services.
The Board noted that the growth of fund assets over time across the complex allows Fidelity to reinvest in the development of services designed to enhance the value or convenience of the Fidelity funds as investment vehicles. These services include 24-hour access to account information and market information through phone representatives and over the Internet, and investor education materials and asset allocation tools.
Investment in a Large Fund Family. The Board considered the benefits to shareholders of investing in a Fidelity fund, including the benefits of investing in a fund that is part of a large family of funds offering a variety of investment disciplines and providing a large variety of mutual fund investor services. The Board noted that Fidelity had taken, or had made recommendations that resulted in the Fidelity funds taking, a number of actions over the previous year that benefited particular funds, including (i) dedicating additional resources to investment research and restructuring and broadening the focus of the investment research teams; (ii) bolstering the senior management team that oversees asset management; (iii) launching Class F of certain funds as a lower-fee class available to Freedom K and Freedom Index Funds; (iv) lowering the initial investment minimums and ongoing balance requirements for Real Estate High Income Fund; (v) eliminating subsequent purchase minimums for all funds and adding a waiver of the investment minimum requirement for new accounts opened with the proceeds of a systematic withdrawal plan; (vi) eliminating the withdrawal minimum and maximum limits for systematic withdrawals from Advisor funds; (vii) expanding sales load waivers on Class A shares for Destiny Planholders and expanding Institutional Class eligibility for Class O Destiny Planholders; and (viii) changing certain Class A and Class T sales charge structures to further align them with industry practices.
Annual Report
Board Approval of Investment Advisory Contracts and Management Fees - continued
Investment Performance. The Board considered whether the fund has operated in accordance with its investment objective, as well as its record of compliance with its investment restrictions. It also reviewed the fund's absolute investment performance for each class, as well as the fund's relative investment performance for each class measured over multiple periods against a broad-based securities market index. The Board noted that FMR does not believe that a meaningful peer group exists against which to compare the fund's performance. The following charts considered by the Board show, over the one-, three-, and five-year periods ended December 31, 2009, as available, the cumulative total returns of the retail class and Class B of the fund and the cumulative total returns of a broad-based securities market index ("benchmark"). The returns of the retail class and Class B show the performance of the highest performing class (based on five-year performance) and the lowest performing class (based on one-year performance), respectively.
Fidelity Canada Fund

The Board noted that the investment performance of the fund was lower than its benchmark for all the periods shown. The Board considered that the variations in performance among the fund's classes reflect the variations in class expenses, which result in lower performance for higher expense classes. The Board discussed with FMR actions that have been taken by FMR to improve the fund's below-benchmark performance. The Board also reviewed the fund's performance since inception as well as performance in the current year. The Board will continue to closely monitor the performance of the fund in the coming year and discuss with FMR other appropriate actions to address the performance of the fund.
The Board also considered that the fund's management fee is subject to upward or downward adjustment depending upon whether, and to what extent, the fund's investment performance for the performance period exceeds, or is exceeded by, the record (over the same period) of a Board-approved performance adjustment index. The Board realizes that the performance adjustment provides FMR with a strong economic incentive to seek to achieve superior performance for the fund's shareholders and helps to more closely align the interests of FMR and the fund's shareholders.
Based on its review, and giving particular weight to the nature and quality of the resources dedicated by the Investment Advisers to maintain and improve relative performance and factoring in the unprecedented market events in recent years, the Board concluded that the nature, extent, and quality of investment management and support services and of shareholder and administrative services provided to the fund will benefit the fund's shareholders, particularly in light of the Board's view that the fund's shareholders benefit from investing in a fund that is part of a large family of funds offering a variety of investment disciplines and services.
Annual Report
Competitiveness of Management Fee and Total Fund Expenses. The Board considered the fund's management fee and total expenses compared to "mapped groups" of competitive funds and classes. Fidelity creates "mapped groups" by combining similar Lipper investment objective categories that have comparable management fee characteristics. Combining Lipper investment objective categories aids the Board's management fee and total expense comparisons by broadening the competitive group used for comparison and by reducing the number of universes to which various Fidelity funds are compared.
Management Fee. The Board considered two proprietary management fee comparisons for the 12-month periods shown in the chart below. The group of Lipper funds used by the Board for management fee comparisons is referred to below as the "Total Mapped Group." The Total Mapped Group comparison focuses on a fund's standing relative to the total universe of comparable funds available to investors, in terms of gross management fees before expense reimbursements or caps, and without giving effect to the fund's performance adjustment. "TMG %" represents the percentage of funds in the Total Mapped Group that had management fees that were lower than the fund's. For example, a TMG % of 15% means that 85% of the funds in the Total Mapped Group had higher management fees than the fund. The "Asset-Size Peer Group" (ASPG) comparison focuses on a fund's standing relative to non-Fidelity funds similar in size to the fund within the Total Mapped Group. The ASPG represents at least 15% of the funds in the Total Mapped Group with comparable asset size and management fee characteristics, subject to a minimum of 50 funds (or all funds in the Total Mapped Group if fewer than 50). Additional information, such as the ASPG quartile in which the fund's management fee ranked and the impact of the fund's performance adjustment, is also included in the chart and considered by the Board.
Fidelity Canada Fund
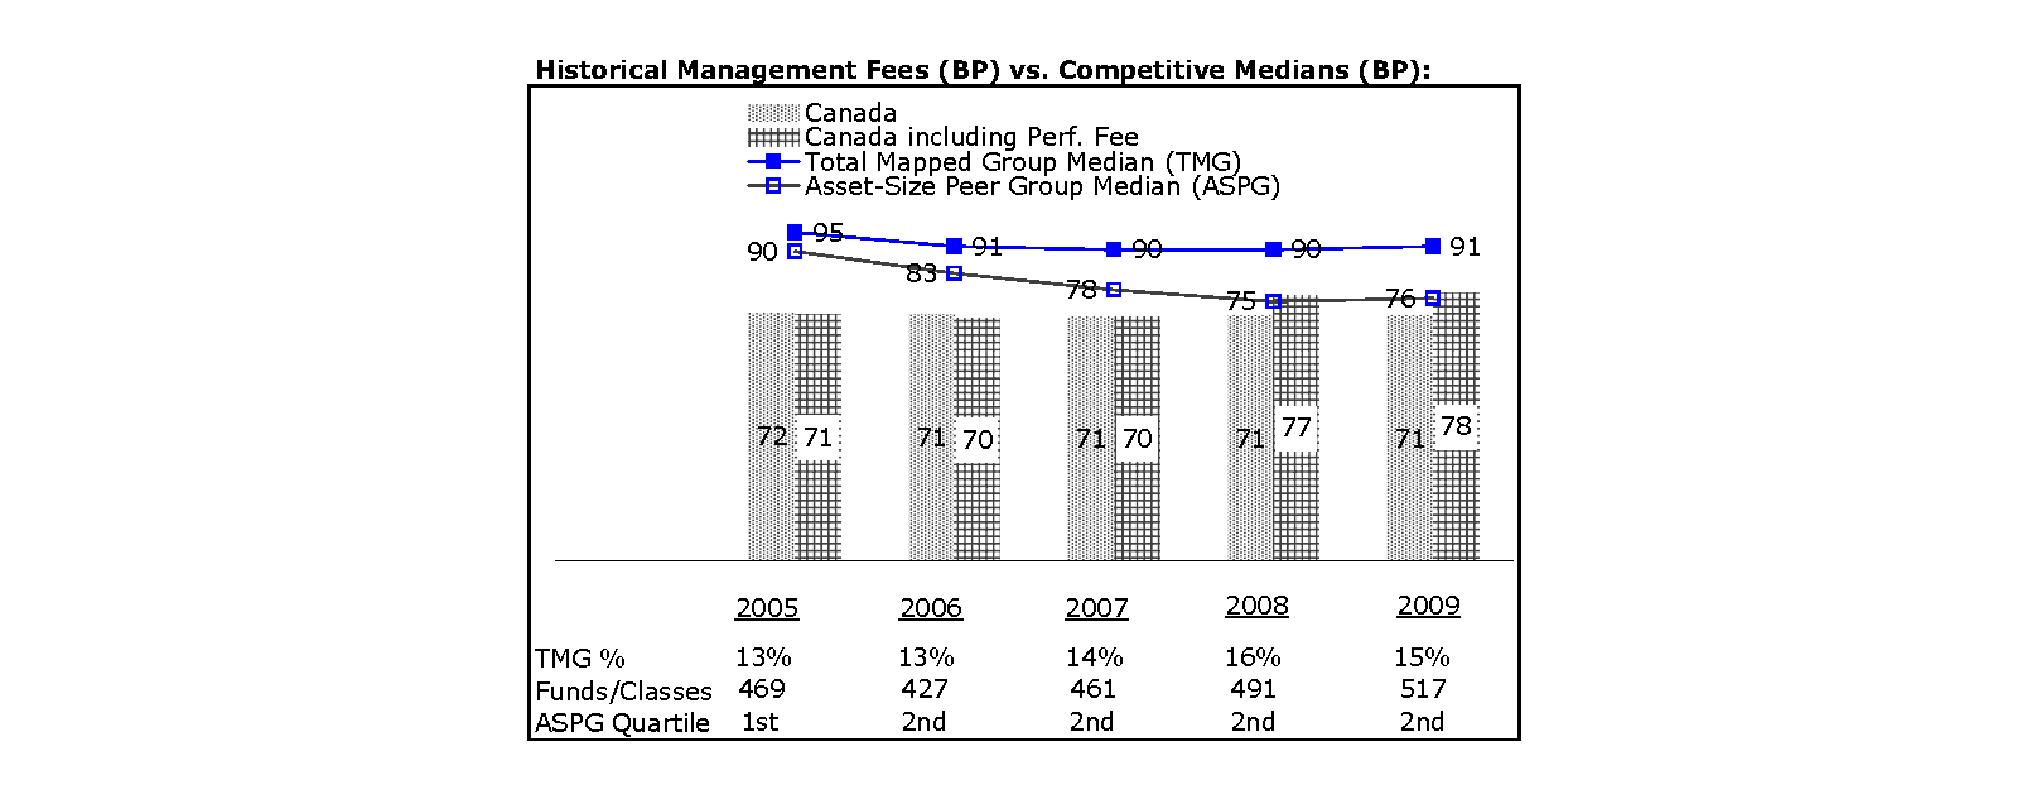
The Board noted that the fund's management fee ranked below the median of its Total Mapped Group and below the median of its ASPG for 2009. The Board also noted the effect of the fund's positive performance adjustment on the fund's management fee ranking. The Board noted that the performance adjustment for each year represents calculations for performance periods that differ from the periods shown in the performance charts above.
Based on its review, the Board concluded that the fund's management fee is fair and reasonable in light of the services that the fund receives and the other factors considered.
Total Expenses. In its review of each class's total expenses, the Board considered the fund's management fee as well as other fund or class expenses, as applicable, such as transfer agent fees, pricing and bookkeeping fees, fund-paid 12b-1 fees, and custodial, legal, and audit fees. The Board also noted the effects of any waivers and reimbursements on fees and expenses, as well as the impact of the fund's performance adjustment. As part of its review, the Board also considered current and historical total expenses of each class of the fund compared to competitive fund median expenses. Each class of the fund is compared to those funds and classes in the Total Mapped Group (used by the Board for management fee comparisons) that have a similar sales load structure.
The Board noted that the total expenses of each of Class A, Class B, Class C, Institutional Class, and the retail class of the fund ranked below its competitive median for 2009 and the total expenses of Class T ranked above its competitive median for 2009. The Board considered that the total expenses for Class T were above the median primarily because its 12b-1 fee is higher than the typical front-end load class. The Board noted that the fund offers multiple classes, each of which has a different sales load and 12b-1 fee structure, and that the multiple structures are intended to offer a range of pricing options for the intermediary market. The Board also noted that the total expenses of the classes vary primarily by the level of their 12b-1 fees, although differences in transfer agent fees may also cause expenses to vary from class to class.
Annual Report
Board Approval of Investment Advisory Contracts and Management Fees - continued
Fees Charged to Other Fidelity Clients. The Board also considered Fidelity fee structures and other information with respect to clients of FMR and its affiliates, such as other mutual funds advised or subadvised by FMR or its affiliates, pension plan clients, and other institutional clients. In March 2010, the Board created an ad hoc joint committee with the board of other Fidelity funds (the Committee) to review and compare Fidelity's institutional investment advisory business with its business of providing services to the Fidelity funds, including the differences in services provided, fees charged, and costs incurred, as well as competition in their respective marketplaces.
Based on its review of total expenses and fees charged to other Fidelity clients, the Board concluded that the total expenses of each class of the fund were reasonable, although in one case above the median of the universe presented for comparison, in light of the services that the fund and its shareholders receive and the other factors considered, including the findings of the Committee.
Costs of the Services and Profitability. The Board considered the revenues earned and the expenses incurred by Fidelity in conducting the business of developing, marketing, distributing, managing, administering and servicing the fund and its shareholders. The Board also considered the level of Fidelity's profits in respect of all the Fidelity funds.
On an annual basis, FMR presents to the Board Fidelity's profitability for the fund. Fidelity calculates the profitability for each fund, as well as aggregate profitability for groups of Fidelity funds and all Fidelity funds, using a series of detailed revenue and cost allocation methodologies which originate with the audited books and records of Fidelity. The Audit Committee of the Board reviews any significant changes from the prior year's methodologies.
PricewaterhouseCoopers LLP (PwC), independent registered public accounting firm and auditor to Fidelity and certain Fidelity funds, has been engaged annually by the Board as part of the Board's assessment of Fidelity's profitability analysis. PwC's engagement includes the review and assessment of Fidelity's methodologies used in determining the revenues and expenses attributable to Fidelity's mutual fund business, and completion of agreed-upon procedures surrounding the mathematical accuracy of fund profitability and its conformity to allocation methodologies. After considering PwC's reports issued under the engagement and information provided by Fidelity, the Board believes that while other allocation methods may also be reasonable, Fidelity's profitability methodologies are reasonable in all material respects.
The Board has also reviewed Fidelity's non-fund businesses and fall-out benefits related to the mutual fund business as well as cases where Fidelity's affiliates may benefit from or be related to the fund's business.
The Board considered the costs of the services provided by and the profits realized by Fidelity in connection with the operation of the fund and were satisfied that the profitability was not excessive in the circumstances.
Economies of Scale. The Board considered whether there have been economies of scale in respect of the management of the Fidelity funds, whether the Fidelity funds (including the fund) have appropriately benefited from any such economies of scale, and whether there is potential for realization of any further economies of scale. The Board considered the extent to which the fund will benefit from economies of scale through increased services to the fund, through waivers or reimbursements, or through fee or expense reductions.
In February 2009, the Board and the board of other Fidelity funds created an ad hoc committee (the Economies of Scale Committee) to analyze whether FMR attains economies of scale in respect of the management and servicing of the Fidelity funds, whether the Fidelity funds have appropriately benefited from such economies of scale, and whether there is potential for realization of any further economies of scale.
The Board recognized that the fund's management contract incorporates a "group fee" structure, which provides for lower group fee rates as total fund assets under FMR's management increase, and for higher group fee rates as total fund assets under FMR's management decrease. FMR calculates the group fee rates based on a tiered asset "breakpoint" schedule that varies based on asset class. The Board considered that the group fee is designed to deliver the benefits of economies of scale to fund shareholders when total Fidelity fund assets increase, even if assets of any particular fund are unchanged or have declined, because some portion of Fidelity's costs are attributable to services provided to all Fidelity funds, and all funds benefit if those costs can be allocated among more assets. The Board concluded that, given the group fee structure, fund shareholders will benefit from lower management fees as assets under FMR's management increase at the fund complex level, regardless of whether Fidelity achieves any such economies of scale.
The Board concluded, considering the findings of the Economies of Scale Committee, that any potential economies of scale are being appropriately shared between fund shareholders and Fidelity.
Additional Information Requested by the Board. In order to develop fully the factual basis for consideration of the Fidelity funds' Advisory Contracts, the Board requested and received additional information on certain topics, including (i) fund performance trends, actions to be taken by FMR to improve certain funds' overall performance, and Fidelity's long-term strategies for certain funds; (ii) portfolio manager changes that have occurred during the past year and length of portfolio manager tenure for different categories of funds over time; (iii) Fidelity's compensation structure for portfolio managers, research analysts, and other key personnel, the rationale for the compensation structure, and how the compensation structure provides appropriate performance incentives; (iv) the amount of the investment that each portfolio manager has made in the Fidelity fund(s) that he or she manages; (v) management and other fees paid by FMR to affiliated sub-advisers on behalf of the Fidelity funds; (vi) Fidelity's fee structures and rationale for recommending different fees among different categories of funds; (vii) Fidelity's rationale for recommending which funds should have a performance adjustment component as part of their management fees; (viii) the rationale for any differences between fund fee structures and fee structures in place for other Fidelity clients; and (ix) explanations regarding the relative total expenses borne by certain funds and classes, total expense competitive trends, and actions that might be taken by FMR to reduce total expenses for certain funds and classes.
Annual Report
Based on its evaluation of all of the conclusions noted above, and after considering all factors it believed relevant, the Board ultimately concluded that the advisory fee structures are fair and reasonable, and that the fund's Advisory Contracts should be renewed.
Annual Report
Investment Adviser
Fidelity Management & Research Company
Boston, MA
Investment Sub-Advisers
FMR Co., Inc.
Fidelity Management & Research
(U.K.) Inc.
Fidelity Research & Analysis Company
FIL Investment Advisors
FIL Investment Advisors
(U.K.) Ltd.
Fidelity Management & Research
(Hong Kong) Limited
Fidelity Management & Research
(Japan) Inc.
General Distributor
Fidelity Distributors Corporation
Boston, MA
Transfer and Service Agents
Fidelity Investments Institutional
Operations Company, Inc.
Boston, MA
Fidelity Service Company, Inc.
Boston, MA
Custodian
The Bank of New York Mellon
New York, New York
ACANI-UANN-1210
1.843157.103
Fidelity Advisor SM
China Region Fund -
Class A, Class T, Class B, and Class C
Annual Report
October 31, 2010
Class A, Class T, Class B, and Class C are
classes of Fidelity® China Region Fund
(2_fidelity_logos) (Registered_Trademark)
Contents
Chairman's Message | <Click Here> | The Chairman's message to shareholders. |
Performance | <Click Here> | How the fund has done over time. |
Management's Discussion of Fund Performance | <Click Here> | The Portfolio Manager's review of fund performance and strategy. |
Shareholder Expense Example | <Click Here> | An example of shareholder expenses. |
Investment Changes | <Click Here> | A summary of major shifts in the fund's investments over the past six months. |
Investments | <Click Here> | A complete list of the fund's investments with their market values. |
Financial Statements | <Click Here> | Statements of assets and liabilities, operations, and changes in net assets, as well as financial highlights. |
Notes | <Click Here> | Notes to the financial statements. |
Report of Independent Registered Public Accounting Firm | <Click Here> | |
Trustees and Officers | <Click Here> | |
Distributions | <Click Here> | |
Board Approval of Investment Advisory Contracts and Management Fees | <Click Here> | |
To view a fund's proxy voting guidelines and proxy voting record for the 12-month period ended June 30, visit http://www.fidelity.com/proxyvotingresults or visit the Securities and Exchange Commission's (SEC) web site at http://www.sec.gov. You may also call 1-877-208-0098 to request a free copy of the proxy voting guidelines.
Standard & Poor's, S&P and S&P 500 are registered service marks of The McGraw-Hill Companies, Inc. and have been licensed for use by Fidelity Distributors Corporation.
Other third party marks appearing herein are the property of their respective owners.
All other marks appearing herein are registered or unregistered trademarks or service marks of FMR LLC or an affiliated company.
This report and the financial statements contained herein are submitted for the general information of the shareholders of the fund. This report is not authorized for distribution to prospective investors in the fund unless preceded or accompanied by an effective prospectus.
A fund files its complete schedule of portfolio holdings with the SEC for the first and third quarters of each fiscal year on Form N-Q. Forms N-Q are available on the SEC's web site at http://www.sec.gov. A fund's Forms N-Q may be reviewed and copied at the SEC's Public Reference Room in Washington, DC. Information regarding the operation of the SEC's Public Reference Room may be obtained by calling 1-800-SEC-0330. For a complete list of a fund's portfolio holdings, view the most recent holdings listing, semiannual report, or annual report on Fidelity's web site at http://www.fidelity.com or http://www.advisor.fidelity.com, as applicable.
NOT FDIC INSURED • MAY LOSE VALUE • NO BANK GUARANTEE
Neither the fund nor Fidelity Distributors Corporation is a bank.
Annual Report
(photo_of_Edward_C_Johnson_3d)
Dear Shareholder:
Equities have staged a rally in the second half of 2010, shaking off concerns about the European debt crisis and the possibility of a double-dip recession in the U.S. Although the short-term surge pushed major equity indexes back into positive territory for the year, several questions remain about the longer-term outlook, including lackluster economic growth and persistently high unemployment. Financial markets are always unpredictable, of course, but there also are several time-tested investment principles that can help put the odds in your favor.
One of the basic tenets is to invest for the long term. Over time, riding out the markets' inevitable ups and downs has proven much more effective than selling into panic or chasing the hottest trend. Even missing only a few of the markets' best days can significantly diminish investor returns. Patience also affords the benefits of compounding - of earning interest on additional income or reinvested dividends and capital gains. There can be tax advantages and cost benefits to consider as well. While staying the course doesn't eliminate risk, it can considerably lessen the effect of short-term declines.
You can further manage your investing risk through diversification. And today, more than ever, geographic diversification should be taken into account. Studies indicate that asset allocation is the single most important determinant of a portfolio's long-term success. The right mix of stocks, bonds and cash - aligned to your particular risk tolerance and investment objective - is very important. Age-appropriate rebalancing is also an essential aspect of asset allocation. For younger investors, an emphasis on equities - which historically have been the best-performing asset class over time - is encouraged. As investors near their specific goal, such as retirement or sending a child to college, consideration may be given to replacing volatile assets (e.g. common stocks) with more-stable fixed investments (bonds or savings plans).
A third principle - investing regularly - can help lower the average cost of your purchases. Investing a certain amount of money each month or quarter helps ensure you won't pay for all your shares at market highs. This strategy - known as dollar cost averaging - also reduces "emotion" from investing, helping shareholders avoid selling weak performers just prior to an upswing, or chasing a hot performer just before a correction.
We invite you to contact us via the Internet, through our Investor Centers or by phone. It is our privilege to provide you the information you need to make the investments that are right for you.
Sincerely,
(The chairman's signature appears here.)
Edward C. Johnson 3d
Annual Report
Performance: The Bottom Line
Average annual total return reflects the change in the value of an investment, assuming reinvestment of the class' distributions from dividend income and capital gains (the profits earned upon the sale of securities that have grown in value, if any) and assuming a constant rate of performance each year. The $10,000 table and the fund's returns do not reflect the deduction of taxes that a shareholder would pay on fund distributions or the redemption of fund shares. During periods of reimbursement by Fidelity, a fund's total return will be greater than it would be had the reimbursement not occurred. How a fund did yesterday is no guarantee of how it will do tomorrow.
Average Annual Total Returns
Periods ended October 31, 2010 | Past 1
year | Past 5
years | Past 10 years |
Class A (incl. 5.75% sales charge) A | 13.61% | 15.27% | 10.29% |
Class T (incl. 3.50% sales charge) B | 16.06% | 15.66% | 10.47% |
Class B (incl. contingent deferred sales charge) C | 14.63% | 15.98% | 10.73% |
Class C (incl. contingent deferred sales charge) D | 18.66% | 16.20% | 10.73% |
A Class A shares bear a 0.25% 12b-1 fee. The initial offering of Class A shares took place on May 9, 2008. Returns prior to May 9, 2008 are those of Fidelity® China Region Fund, the original class of the fund, which has no 12b-1 fee. Had Class A shares' 12b-1 fee been reflected, returns prior to May 9, 2008 would have been lower.
B Class T shares bear a 0.50% 12b-1 fee. The initial offering of Class T shares took place on May 9, 2008. Returns prior to May 9, 2008 are those of Fidelity China Region Fund, the original class of the fund, which has no 12b-1 fee. Had Class T shares' 12b-1 fee been reflected, returns prior to May 9, 2008 would have been lower.
C Class B shares bear a 1.00% 12b-1 fee. The initial offering of Class B shares took place on May 9, 2008. Returns prior to May 9, 2008 are those of Fidelity China Region Fund, the original class of the fund, which has no 12b-1 fee. Had Class B shares' 12b-1 fee been reflected, returns prior to May 9, 2008 would have been lower. Class B shares' contingent deferred sales charge included in the past one year, past five years, and past 10 years total return figures are 5%, 2%, and 0% respectively.
D Class C shares bear a 1.00% 12b-1 fee. The initial offering of Class C shares took place on May 9, 2008. Returns prior to May 9, 2008 are those of Fidelity China Region Fund, the original class of the fund, which has no 12b-1 fee. Had Class C shares' 12b-1 fee been reflected, returns prior to May 9, 2008 would have been lower. Class C shares' contingent deferred sales charge included in the past one year, past five years, and past 10 years total return figures are 1%, 0%, and 0%, respectively.
$10,000 Over 10 Years
Let's say hypothetically that $10,000 was invested in Fidelity Advisor SM China Region Fund - Class A on October 31, 2000, and the current 5.75% sales charge was paid. The chart shows how the value of your investment would have changed, and also shows how the MSCI® Golden Dragon Index performed over the same period. The initial offering of Class A took place on May 9, 2008. See above for additional information regarding the performance of Class A.
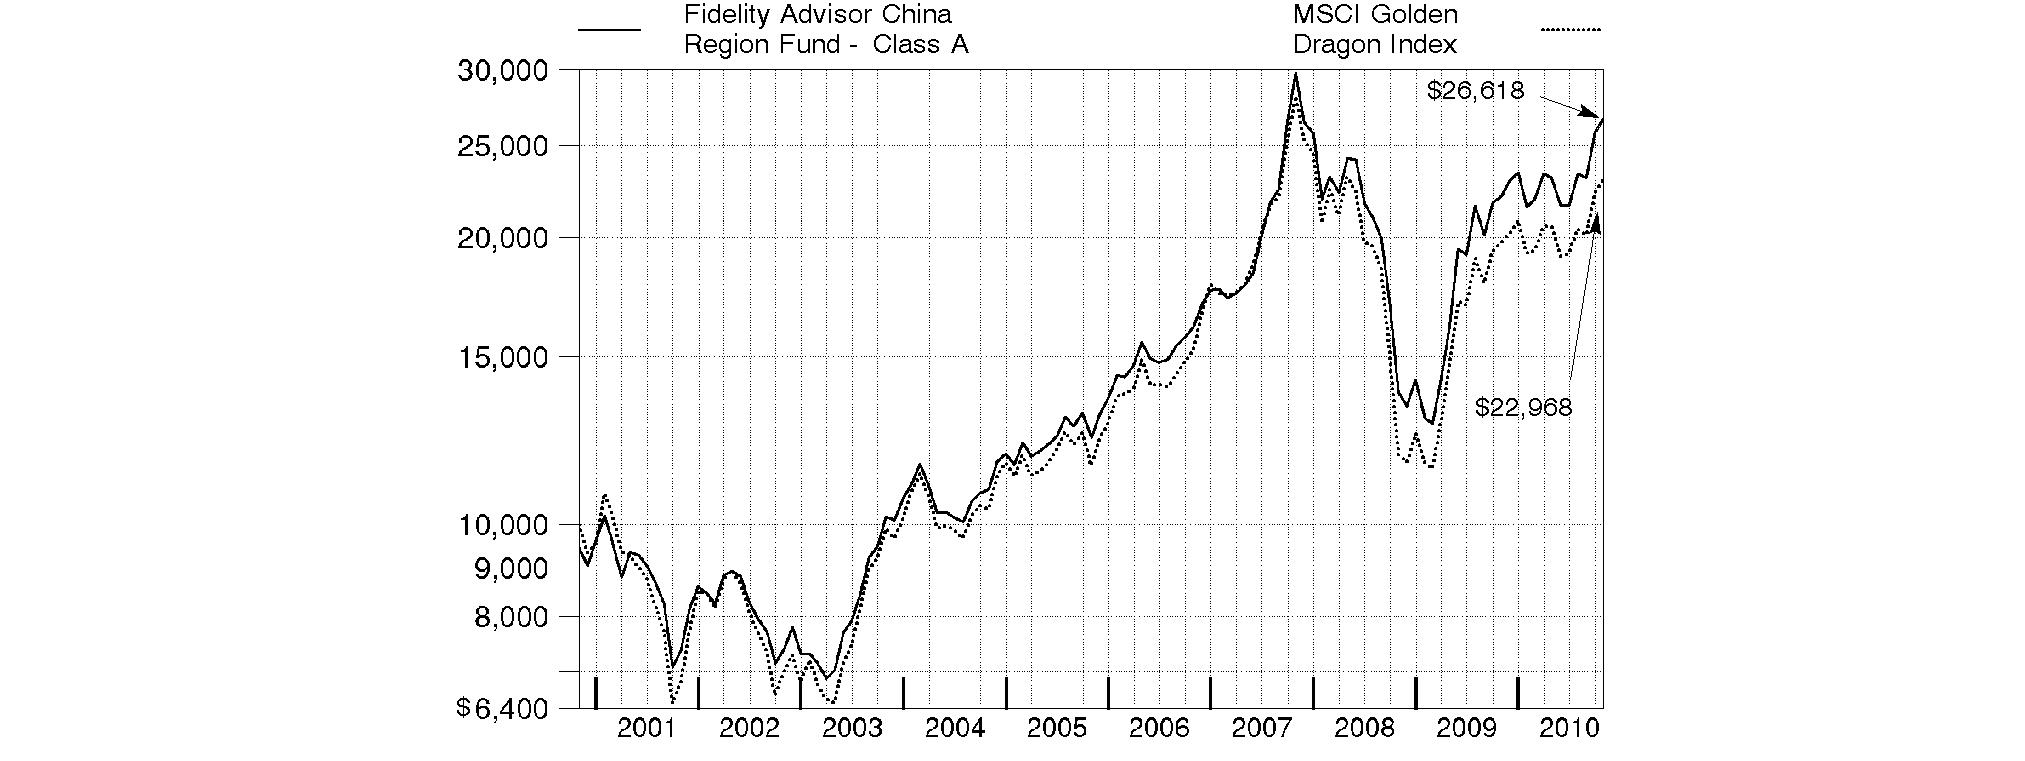
Annual Report
Market Recap: International stocks rode a wave of volatility similar to that of their U.S. counterparts during the 12 months ending October 31, 2010. Stocks gained modestly in the first half of the period, despite growing concerns about the European debt crisis. Sentiment turned decidedly negative in May and June, however, and the market suffered a precipitous decline. These losses were more than offset during the last four months of the period, when signs of economic growth and subsiding debt fears helped propel international stocks about 21%. For the full year, the MSCI® ACWI® (All Country World Index) ex USA Index gained 12.76%, boosted in part by a generally depreciating U.S. dollar. Within the index, Canada and emerging markets were standouts, returning 23% and 24%, respectively. Results in the latter group were led by strong-performing India, Mexico and South Africa, while China fell short of the MSCI benchmark due to cooling economic growth. The developed Asia ex Japan segment rose 16% for the period, lifted by solid results from Singapore and Hong Kong. Meanwhile, Europe rose just 9%, held back mainly by debt-riddled Spain and Italy, as well as lagging major constituent France. Japan returned only 5%, a result of that nation's continued weak economy.
Comments from Joseph Tse, who became Portfolio Manager of Fidelity AdvisorSM China Region Fund on January 19, 2010: During the past year, the fund's Class A, Class T, Class B and Class C shares returned 20.54%, 20.27%, 19.63% and 19.66%, respectively (excluding sales charges), versus 16.14% for the MSCI Golden Dragon Index. Stock picking and an overweighting in consumer discretionary aided relative performance, as did stock selection in information technology, industrials, health care and financials, among other sectors. Geographically, security selection in China and Hong Kong added value. The largest relative contributor was China Shineway Pharmaceutical Group, as better-than-expected sales lifted the stock, which was sold from the fund. Other contributors included BOC Hong Kong and Chinese online travel services provider Ctrip.com International, an out-of-benchmark holding. Underweighting and ultimately selling Hong Kong apparel wholesaler/retailer Esprit Holdings also added value. Conversely, underweighting Taiwan's Nan Ya Plastics detracted, as did not owning Taiwan-based index component Formosa Chemicals & Fibre. Underweighting Hong Kong shoe manufacturer/retailer Belle International Holdings also hurt.
Note to shareholders: Fidelity Advisor China Region Fund may invest up to 35% of its total assets in any industry that represents more than 20% of the Hong Kong, Taiwanese and Chinese market. As of October 31, 2010, the fund did not have more than 25% of its total assets invested in any one industry.
The views expressed above reflect those of the portfolio manager(s) only through the end of the period as stated on the cover of this report and do not necessarily represent the views of Fidelity or any other person in the Fidelity organization. Any such views are subject to change at any time based upon market or other conditions and Fidelity disclaims any responsibility to update such views. These views may not be relied on as investment advice and, because investment decisions for a Fidelity fund are based on numerous factors, may not be relied on as an indication of trading intent on behalf of any Fidelity fund.
Annual Report
Fidelity China Region Fund
As a shareholder of the Fund, you incur two types of costs: (1) transaction costs, including sales charges (loads) on purchase payments or redemption proceeds, redemption fees, and (2) ongoing costs, including management fees, distribution and/or service (12b-1) fees and other Fund expenses. This Example is intended to help you understand your ongoing costs (in dollars) of investing in the Fund and to compare these costs with the ongoing costs of investing in other mutual funds.
The Example is based on an investment of $1,000 invested at the beginning of the period and held for the entire period (May 1, 2010 to October 31, 2010).
Actual Expenses
The first line of the accompanying table for each class of the Fund provides information about actual account values and actual expenses. You may use the information in this line, together with the amount you invested, to estimate the expenses that you paid over the period. Simply divide your account value by $1,000.00 (for example, an $8,600 account value divided by $1,000.00 = 8.6), then multiply the result by the number in the first line for a class of the Fund under the heading entitled "Expenses Paid During Period" to estimate the expenses you paid on your account during this period. A small balance maintenance fee of $12.00 that is charged once a year may apply for certain accounts with a value of less than $2,000. This fee is not included in the table below. If it was, the estimate of expenses you paid during the period would be higher, and your ending account value lower, by this amount. In addition, the Fund, as a shareholder in the underlying Fidelity Central Funds, will indirectly bear its pro-rata share of the fees and expenses incurred by the underlying Fidelity Central Funds. These fees and expenses are not included in the Fund's annualized expense ratio used to calculate the expense estimate in the table below.
Hypothetical Example for Comparison Purposes
The second line of the accompanying table for each class of the Fund provides information about hypothetical account values and hypothetical expenses based on a Class' actual expense ratio and an assumed rate of return of 5% per year before expenses, which is not the Class' actual return. The hypothetical account values and expenses may not be used to estimate the actual ending account balance or expenses you paid for the period. You may use this information to compare the ongoing costs of investing in the Fund and other funds. To do so, compare this 5% hypothetical example with the 5% hypothetical examples that appear in the shareholder reports of the other funds. A small balance maintenance fee of $12.00 that is charged once a year may apply for certain accounts with a value of less than $2,000. This fee is not included in the table below. If it was, the estimate of expenses you paid during the period would be higher, and your ending account value lower, by this amount. In addition, the Fund, as a shareholder in the underlying Fidelity Central Funds, will indirectly bear its pro-rata share of the fees and expenses incurred by the underlying Fidelity Central Funds. These fees and expenses are not included in the Fund's annualized expense ratio used to calculate the expense estimate in the table below.
Please note that the expenses shown in the table are meant to highlight your ongoing costs only and do not reflect any transaction costs. Therefore, the second line of the table is useful in comparing ongoing costs only, and will not help you determine the relative total costs of owning different funds. In addition, if these transactional costs were included, your costs would have been higher.
| Annualized
Expense Ratio | Beginning
Account Value
May 1, 2010 | Ending
Account Value
October 31, 2010 | Expenses Paid
During Period*
May 1, 2010 to
October 31, 2010 |
Class A | 1.37% | | | |
Actual | | $ 1,000.00 | $ 1,152.80 | $ 7.43 |
HypotheticalA | | $ 1,000.00 | $ 1,018.30 | $ 6.97 |
Class T | 1.63% | | | |
Actual | | $ 1,000.00 | $ 1,151.40 | $ 8.84 |
HypotheticalA | | $ 1,000.00 | $ 1,016.99 | $ 8.29 |
Class B | 2.12% | | | |
Actual | | $ 1,000.00 | $ 1,148.60 | $ 11.48 |
HypotheticalA | | $ 1,000.00 | $ 1,014.52 | $ 10.76 |
Class C | 2.12% | | | |
Actual | | $ 1,000.00 | $ 1,148.80 | $ 11.48 |
HypotheticalA | | $ 1,000.00 | $ 1,014.52 | $ 10.76 |
China Region | 1.06% | | | |
Actual | | $ 1,000.00 | $ 1,154.60 | $ 5.76 |
HypotheticalA | | $ 1,000.00 | $ 1,019.86 | $ 5.40 |
Institutional Class | 1.08% | | | |
Actual | | $ 1,000.00 | $ 1,154.70 | $ 5.87 |
HypotheticalA | | $ 1,000.00 | $ 1,019.76 | $ 5.50 |
A 5% return per year before expenses
* Expenses are equal to each Class' annualized expense ratio, multiplied by the average account value over the period, multiplied by 184/365 (to reflect the one-half year period).
Annual Report
Fidelity China Region Fund
Investment Changes (Unaudited)
Geographic Diversification (% of fund's net assets) |
As of October 31, 2010 |
 | Hong Kong | 32.0% | |
 | China | 31.3% | |
 | Taiwan | 18.3% | |
 | Cayman Islands | 8.5% | |
 | Bermuda | 4.3% | |
 | United States of America | 3.5% | |
 | Japan | 1.0% | |
 | United Kingdom | 0.8% | |
 | Singapore | 0.2% | |
 | Other | 0.1% | |

Percentages are adjusted for the effect of futures contracts, if applicable. |
As of April 30, 2010 |
| China | 37.2% | |
| Hong Kong | 28.0% | |
| Taiwan | 18.7% | |
| Cayman Islands | 9.1% | |
| Bermuda | 5.2% | |
| United States of America | 1.2% | |
| Canada | 0.2% | |
| Japan | 0.2% | |
| British Virgin Islands | 0.2% | |

Percentages are adjusted for the effect of futures contracts, if applicable. |
Asset Allocation |
| % of fund's
net assets | % of fund's net assets
6 months ago |
Stocks | 96.6 | 99.1 |
Short-Term Investments and Net Other Assets | 3.4 | 0.9 |
Top Ten Stocks as of October 31, 2010 |
| % of fund's
net assets | % of fund's net assets
6 months ago |
CNOOC Ltd. (Oil, Gas & Consumable Fuels) | 3.6 | 3.2 |
China Construction Bank Corp. (H Shares) (Commercial Banks) | 3.4 | 3.9 |
Hong Kong Exchanges and Clearing Ltd. (Diversified Financial Services) | 3.3 | 2.7 |
Tencent Holdings Ltd. (Internet Software & Services) | 3.2 | 3.7 |
Industrial & Commercial Bank of China Ltd. (H Shares) (Commercial Banks) | 3.2 | 3.5 |
BOC Hong Kong (Holdings) Ltd. (Commercial Banks) | 3.1 | 2.4 |
Bank of China Ltd. (H Shares) (Commercial Banks) | 2.8 | 3.3 |
Hon Hai Precision Industry Co. Ltd. (Foxconn) (Electronic Equipment & Components) | 2.8 | 3.8 |
China Life Insurance Co. Ltd. (H Shares) (Insurance) | 2.7 | 3.4 |
China Mobile (Hong Kong) Ltd. (Wireless Telecommunication Services) | 2.5 | 2.7 |
| 30.6 | |
Market Sectors as of October 31, 2010 |
| % of fund's
net assets | % of fund's net assets
6 months ago |
Financials | 41.3 | 37.6 |
Information Technology | 15.0 | 20.1 |
Consumer Discretionary | 9.9 | 8.9 |
Industrials | 8.5 | 9.9 |
Energy | 7.3 | 8.2 |
Consumer Staples | 5.2 | 4.1 |
Materials | 4.7 | 3.6 |
Telecommunication Services | 4.3 | 4.2 |
Utilities | 0.2 | 0.9 |
Health Care | 0.2 | 1.6 |
Annual Report
Fidelity China Region Fund
Investments October 31, 2010
Showing Percentage of Net Assets
Common Stocks - 96.6% |
| Shares | | Value |
CONSUMER DISCRETIONARY - 9.9% |
Auto Components - 0.4% |
Minth Group Ltd. | 4,938,000 | | $ 9,237,349 |
Automobiles - 1.3% |
Brilliance China Automotive Holdings Ltd. (a) | 14,406,000 | | 12,638,065 |
BYD Co. Ltd. (H Shares) (d) | 1,725,800 | | 10,520,116 |
Dongfeng Motor Group Co. Ltd. (H Shares) | 2,470,000 | | 5,353,459 |
| | 28,511,640 |
Distributors - 2.0% |
Li & Fung Ltd. | 8,042,000 | | 42,486,038 |
Diversified Consumer Services - 0.1% |
New Oriental Education & Technology Group, Inc. sponsored ADR (a)(d) | 22,616 | | 2,428,280 |
Hotels, Restaurants & Leisure - 2.8% |
Country Style Cooking Restaurant Chain Co. Ltd. ADR | 3,600 | | 106,416 |
Ctrip.com International Ltd. sponsored ADR (a) | 477,500 | | 24,863,425 |
Las Vegas Sands Corp. (a) | 57,200 | | 2,624,336 |
Melco International Development Ltd. (a) | 5,970,000 | | 3,388,873 |
Melco PBL Entertainment (Macau) Ltd. sponsored ADR (a) | 370,000 | | 2,319,900 |
Sands China Ltd. | 2,808,800 | | 6,124,008 |
Shangri-La Asia Ltd. | 2,966,000 | | 6,673,380 |
SJM Holdings Ltd. | 9,928,000 | | 14,755,112 |
| | 60,855,450 |
Household Durables - 0.2% |
Techtronic Industries Co. Ltd. | 4,157,000 | | 4,209,960 |
Multiline Retail - 1.5% |
Far East Department Stores Co. Ltd. | 14,363,615 | | 17,834,255 |
Golden Eagle Retail Group Ltd. (H Shares) | 2,596,000 | | 6,899,223 |
Maoye International Holdings Ltd. | 18,043,000 | | 7,774,697 |
| | 32,508,175 |
Specialty Retail - 1.1% |
Belle International Holdings Ltd. | 5,574,000 | | 10,067,538 |
Chow Sang Sang Holdings International Ltd. | 2,746,000 | | 7,227,015 |
GOME Electrical Appliances Holdings Ltd. (a) | 6,666,000 | | 2,244,575 |
I.T Ltd. | 5,492,000 | | 4,633,792 |
| | 24,172,920 |
Textiles, Apparel & Luxury Goods - 0.5% |
Anta Sports Products Ltd. | 2,467,000 | | 5,092,340 |
Trinity Ltd. | 4,310,000 | | 4,309,305 |
| | 9,401,645 |
TOTAL CONSUMER DISCRETIONARY | | 213,811,457 |
|
| Shares | | Value |
CONSUMER STAPLES - 5.2% |
Beverages - 0.1% |
Wuliangye Yibin Co. Ltd. (BNP Paribas Warrant Program) warrants 5/5/15 (a) | 578,000 | | $ 3,162,589 |
Food & Staples Retailing - 1.7% |
Beijing Jingkelong Co. Ltd. (H Shares) | 1,226,000 | | 1,470,963 |
China Resources Enterprise Ltd. | 1,936,000 | | 8,179,842 |
Dairy Farm International Holdings Ltd. | 2,642,400 | | 20,610,720 |
Lianhua Supermarket Holdings Co. (H Shares) | 785,000 | | 3,342,042 |
Wumart Stores, Inc. (H Shares) | 1,338,000 | | 3,141,635 |
| | 36,745,202 |
Food Products - 2.4% |
Asian Citrus Holdings Ltd. | 5,805,803 | | 6,688,705 |
Besunyen Holdings Co. Ltd. | 25,440,000 | | 12,143,590 |
China Agri-Industries Holding Ltd. | 3,147,000 | | 4,579,669 |
China Huiyuan Juice Group Ltd. | 3,283,000 | | 2,202,432 |
China Mengniu Dairy Co. Ltd. | 2,326,000 | | 6,661,790 |
Tingyi (Cayman Islands) Holding Corp. | 3,536,000 | | 9,625,493 |
Want Want China Holdings Ltd. | 5,577,000 | | 5,144,403 |
Yashili International Holdings Ltd. | 8,021,000 | | 4,346,164 |
| | 51,392,246 |
Household Products - 0.3% |
NVC Lighting Holdings Ltd. | 10,667,000 | | 5,463,376 |
Personal Products - 0.7% |
Hengan International Group Co. Ltd. | 1,655,500 | | 15,591,227 |
TOTAL CONSUMER STAPLES | | 112,354,640 |
ENERGY - 7.3% |
Oil, Gas & Consumable Fuels - 7.3% |
China Coal Energy Co. Ltd. (H Shares) | 1,242,000 | | 2,147,112 |
China Petroleum & Chemical Corp. (H Shares) | 32,506,000 | | 30,928,266 |
CNOOC Ltd. | 37,343,000 | | 77,961,654 |
CNPC (Hong Kong) Ltd. | 9,330,000 | | 11,868,254 |
PetroChina Co. Ltd. (H Shares) | 24,580,000 | | 30,256,374 |
Sino Prosper State Gold Resources Holdings, Ltd. (a) | 79,350,000 | | 3,992,453 |
| | 157,154,113 |
FINANCIALS - 41.3% |
Capital Markets - 1.5% |
Citic Securities Co. Ltd. (UBS Warrant Programme) warrants 9/16/13 (a) | 3,008,600 | | 6,995,171 |
Wuliangye Yibin Co. Ltd. (UBS Warrant Programme) warrants 4/22/13 (a) | 345,100 | | 1,888,252 |
Yuanta Financial Holding Co. Ltd. | 38,078,000 | | 23,950,384 |
| | 32,833,807 |
Commercial Banks - 17.2% |
Bank of China Ltd. (H Shares) | 102,083,000 | | 61,108,224 |
BOC Hong Kong (Holdings) Ltd. | 21,653,500 | | 67,883,251 |
Common Stocks - continued |
| Shares | | Value |
FINANCIALS - continued |
Commercial Banks - continued |
China Construction Bank Corp. (H Shares) | 77,268,000 | | $ 73,666,895 |
China Merchants Bank Co. Ltd. (H Shares) | 7,761,464 | | 22,028,990 |
Chinatrust Financial Holding Co. Ltd. | 7,410,335 | | 4,624,650 |
E.Sun Financial Holdings Co. Ltd. | 9,287,652 | | 4,779,628 |
Hang Seng Bank Ltd. | 1,921,700 | | 28,114,276 |
HSBC Holdings PLC (Hong Kong) | 413,600 | | 4,311,132 |
Industrial & Commercial Bank of China (Asia) Ltd. | 2,163,000 | | 8,008,786 |
Industrial & Commercial Bank of China Ltd. (H Shares) | 84,726,000 | | 68,207,094 |
Mega Financial Holding Co. Ltd. | 8,480,000 | | 5,887,927 |
Standard Chartered PLC: | | | |
rights 11/5/10 (a) | 42,845 | | 360,725 |
(United Kingdom) | 432,898 | | 12,522,362 |
Wing Hang Bank Ltd. | 819,500 | | 9,578,674 |
| | 371,082,614 |
Diversified Financial Services - 4.7% |
China Everbright Ltd. | 5,418,000 | | 14,084,528 |
Fubon Financial Holding Co. Ltd. | 13,011,985 | | 15,943,455 |
Hong Kong Exchanges and Clearing Ltd. | 3,217,600 | | 70,817,295 |
| | 100,845,278 |
Insurance - 7.2% |
Cathay Financial Holding Co. Ltd. | 16,430,400 | | 25,151,585 |
China Life Insurance Co. Ltd. (H Shares) | 13,479,000 | | 59,257,545 |
PICC Property & Casualty Co. Ltd. (H Shares) (a) | 21,118,000 | | 31,167,866 |
Ping An Insurance Group Co. China Ltd. (H Shares) | 3,755,500 | | 40,431,734 |
| | 156,008,730 |
Real Estate Management & Development - 10.7% |
Cheung Kong Holdings Ltd. | 2,663,000 | | 40,539,784 |
China Overseas Land & Investment Ltd. | 5,487,920 | | 11,540,474 |
China Resources Land Ltd. | 4,232,000 | | 8,342,520 |
E-House China Holdings Ltd. ADR (d) | 249,600 | | 4,170,816 |
Hang Lung Properties Ltd. | 1,343,000 | | 6,575,307 |
Henderson Land Development Co. Ltd. | 2,500,076 | | 17,755,741 |
Huaku Development Co. Ltd. | 1,820,000 | | 5,048,783 |
Hung Poo Real Estate Development Co. Ltd. | 2,056,000 | | 3,059,984 |
Kerry Properties Ltd. | 3,480,000 | | 19,305,273 |
Midland Holdings Ltd. | 4,368,000 | | 4,384,201 |
New World Development Co. Ltd. | 7,024,000 | | 13,864,499 |
Poly (Hong Kong) Investments Ltd. | 3,144,000 | | 3,236,784 |
Shimao Property Holdings Ltd. | 7,417,500 | | 12,268,002 |
Sinyi Realty, Inc. | 1,179,370 | | 2,292,845 |
Sun Hung Kai Properties Ltd. | 2,983,000 | | 51,106,905 |
|
| Shares | | Value |
Wharf Holdings Ltd. | 3,853,000 | | $ 25,301,429 |
Yanlord Land Group Ltd. | 2,484,000 | | 3,300,997 |
| | 232,094,344 |
TOTAL FINANCIALS | | 892,864,773 |
HEALTH CARE - 0.2% |
Pharmaceuticals - 0.2% |
Coolpoint Energy Ltd. (a) | 45,452,000 | | 3,811,488 |
INDUSTRIALS - 8.5% |
Airlines - 1.2% |
Air China Ltd. (H Shares) (a) | 9,756,000 | | 13,114,984 |
Cathay Pacific Airways Ltd. | 3,341,000 | | 8,986,918 |
China Eastern Airlines Corp. Ltd. (a) | 6,770,000 | | 4,279,697 |
| | 26,381,599 |
Building Products - 0.5% |
China Liansu Group Holdgs Ltd. (a) | 18,523,000 | | 11,613,840 |
Electrical Equipment - 0.7% |
Dongfang Electric Corp. Ltd. | 1,674,800 | | 8,145,778 |
Zhuzhou CSR Times Electric Co. Ltd. (H Shares) | 2,036,000 | | 6,212,082 |
| | 14,357,860 |
Industrial Conglomerates - 2.9% |
Far Eastern Textile Ltd. | 19,334,228 | | 27,859,483 |
Hutchison Whampoa Ltd. | 2,121,000 | | 20,905,583 |
Shanghai Industrial Holdings Ltd. | 3,144,000 | | 14,480,348 |
| | 63,245,414 |
Machinery - 0.8% |
China International Marine Containers Co. Ltd. (B Shares) | 7,166,794 | | 14,516,196 |
Singamas Container Holdings Ltd. (a) | 13,180,000 | | 2,975,649 |
| | 17,491,845 |
Marine - 0.8% |
Orient Overseas International Ltd. | 619,000 | | 5,426,357 |
Shun Tak Holdings Ltd. | 19,152,000 | | 12,625,927 |
| | 18,052,284 |
Trading Companies & Distributors - 0.1% |
Hong Kong Resources Holdings
Co. Ltd. | 11,212,000 | | 1,923,814 |
Transportation Infrastructure - 1.5% |
China Merchant Holdings International Co. Ltd. | 1,228,000 | | 4,301,268 |
Cosco Pacific Ltd. | 7,606,000 | | 11,873,259 |
Zhejiang Expressway Co. Ltd. (H Shares) | 15,140,000 | | 15,254,752 |
| | 31,429,279 |
TOTAL INDUSTRIALS | | 184,495,935 |
INFORMATION TECHNOLOGY - 15.0% |
Communications Equipment - 2.1% |
China Wireless Technologies Ltd. | 3,964,000 | | 2,122,316 |
Common Stocks - continued |
| Shares | | Value |
INFORMATION TECHNOLOGY - continued |
Communications Equipment - continued |
HTC Corp. | 1,700,000 | | $ 38,382,618 |
Vtech Holdings Ltd. | 403,000 | | 4,193,124 |
| | 44,698,058 |
Computers & Peripherals - 0.3% |
Acer, Inc. | 2,301,108 | | 6,684,153 |
Electronic Equipment & Components - 6.4% |
AU Optronics Corp. (a) | 7,798,090 | | 7,784,283 |
Chroma ATE, Inc. | 3,350,000 | | 8,625,388 |
Delta Electronics, Inc. | 828,000 | | 3,422,382 |
Funtalk China Holdings Ltd. (a) | 497,100 | | 3,280,860 |
Hon Hai Precision Industry Co. Ltd. (Foxconn) | 15,763,172 | | 59,746,054 |
Kingboard Chemical Holdings Ltd. | 2,618,000 | | 12,733,249 |
Tripod Technology Corp. | 3,001,820 | | 11,524,713 |
Unimicron Technology Corp. | 14,255,000 | | 24,266,803 |
WPG Holding Co. Ltd. | 3,601,120 | | 6,695,106 |
| | 138,078,838 |
Internet Software & Services - 3.9% |
Sina Corp. (a) | 146,100 | | 8,225,430 |
SouFun Holdings Ltd. ADR (d) | 89,400 | | 6,570,900 |
Tencent Holdings Ltd. | 3,007,100 | | 68,861,184 |
TPK Holdings Co. | 11,000 | | 181,506 |
| | 83,839,020 |
Semiconductors & Semiconductor Equipment - 2.3% |
MediaTek, Inc. | 398,794 | | 5,016,687 |
Taiwan Semiconductor Manufacturing Co. Ltd. | 19,519,796 | | 40,179,972 |
Trony Solar Holdings Co. Ltd. | 8,494,000 | | 5,314,743 |
| | 50,511,402 |
TOTAL INFORMATION TECHNOLOGY | | 323,811,471 |
MATERIALS - 4.7% |
Chemicals - 2.7% |
China BlueChemical Ltd. (H shares) | 11,116,000 | | 8,790,980 |
DC Chemical Co. Ltd. | 7,519 | | 2,213,240 |
Formosa Plastics Corp. | 8,908,250 | | 25,556,097 |
Nan Ya Plastics Corp. | 3,518,000 | | 7,839,490 |
Taiwan Fertilizer Co. Ltd. | 3,804,000 | | 12,988,662 |
| | 57,388,469 |
Construction Materials - 0.5% |
Anhui Conch Cement Co. Ltd. (H Shares) | 2,810,000 | | 11,781,971 |
Metals & Mining - 1.5% |
Xingda International Holdings Ltd. | 13,453,000 | | 14,040,932 |
Zhaojin Mining Industry Co. Ltd. (H Shares) | 2,435,000 | | 7,570,843 |
Zijin Mining Group Co. Ltd. (H Shares) | 10,858,000 | | 10,239,894 |
| | 31,851,669 |
|
| Shares | | Value |
Paper & Forest Products - 0.0% |
China Forestry Holdings Co. Ltd. | 1,064,000 | | $ 505,147 |
TOTAL MATERIALS | | 101,527,256 |
TELECOMMUNICATION SERVICES - 4.3% |
Diversified Telecommunication Services - 0.8% |
China Unicom (Hong Kong) Ltd. | 12,910,000 | | 18,156,664 |
Wireless Telecommunication Services - 3.5% |
China Mobile (Hong Kong) Ltd. | 5,194,000 | | 53,042,759 |
SOFTBANK CORP. | 689,200 | | 22,133,677 |
| | 75,176,436 |
TOTAL TELECOMMUNICATION SERVICES | | 93,333,100 |
UTILITIES - 0.2% |
Gas Utilities - 0.2% |
Enn Energy Holdings Ltd. | 1,854,000 | | 5,573,062 |
TOTAL COMMON STOCKS (Cost $1,524,284,829) | 2,088,737,295 |
Money Market Funds - 4.0% |
| | | |
Fidelity Cash Central Fund, 0.23% (b) | 74,532,881 | | 74,532,881 |
Fidelity Securities Lending Cash Central Fund, 0.24% (b)(c) | 11,164,250 | | 11,164,250 |
TOTAL MONEY MARKET FUNDS (Cost $85,697,131) | 85,697,131 |
TOTAL INVESTMENT PORTFOLIO - 100.6% (Cost $1,609,981,960) | | 2,174,434,426 |
NET OTHER ASSETS (LIABILITIES) - (0.6)% | | (11,909,134) |
NET ASSETS - 100% | $ 2,162,525,292 |
Legend |
(a) Non-income producing |
(b) Affiliated fund that is available only to investment companies and other accounts managed by Fidelity Investments. The rate quoted is the annualized seven-day yield of the fund at period end. A complete unaudited listing of the fund's holdings as of its most recent quarter end is available upon request. In addition, each Fidelity Central Fund's financial statements, which are not covered by the Fund's report of Independent Registered Public Accounting Firm, are available on the SEC's website or upon request. |
(c) Investment made with cash collateral received from securities on loan. |
(d) Security or a portion of the security is on loan at period end. |
Affiliated Central Funds |
Information regarding fiscal year to date income earned by the Fund from investments in Fidelity Central Funds is as follows: |
Fund | Income earned |
Fidelity Cash Central Fund | $ 72,745 |
Fidelity Securities Lending Cash Central Fund | 439,269 |
Total | $ 512,014 |
Other Information |
The following is a summary of the inputs used, as of October 31, 2010, involving the Fund's assets and liabilities carried at fair value. The inputs or methodology used for valuing securities may not be an indication of the risk associated with investing in those securities. For more information on valuation inputs, and their aggregation into the levels used in the table below, please refer to the Security Valuation section in the accompanying Notes to Financial Statements. |
Valuation Inputs at Reporting Date: |
Description | Total | Level 1 | Level 2 | Level 3 |
Investments in Securities: | | | | |
Equities: | | | | |
Consumer Discretionary | $ 213,811,457 | $ 213,811,457 | $ - | $ - |
Consumer Staples | 112,354,640 | 104,845,887 | 7,508,753 | - |
Energy | 157,154,113 | 18,007,819 | 139,146,294 | - |
Financials | 892,864,773 | 820,412,673 | 72,452,100 | - |
Health Care | 3,811,488 | 3,811,488 | - | - |
Industrials | 184,495,935 | 184,495,935 | - | - |
Information Technology | 323,811,471 | 275,847,216 | 47,964,255 | - |
Materials | 101,527,256 | 101,527,256 | - | - |
Telecommunication Services | 93,333,100 | - | 93,333,100 | - |
Utilities | 5,573,062 | 5,573,062 | - | - |
Money Market Funds | 85,697,131 | 85,697,131 | - | - |
Total Investments in Securities: | $ 2,174,434,426 | $ 1,814,029,924 | $ 360,404,502 | $ - |
Income Tax Information |
At October 31, 2010, the Fund had a capital loss carryforward of approximately $98,628,962 of which $63,392,256 and $35,236,706 will expire on Octo-ber 31, 2016 and 2017, respectively. Capital loss carryforwards are only available to offset future capital gains of the Fund to the extent provided by regulations and may be limited. |
See accompanying notes which are an integral part of the financial statements.
Annual Report
Fidelity China Region Fund
Statement of Assets and Liabilities
| October 31, 2010 |
| | |
Assets | | |
Investment in securities, at value (including securities loaned of $10,904,815) - See accompanying schedule: Unaffiliated issuers (cost $1,524,284,829) | $ 2,088,737,295 | |
Fidelity Central Funds (cost $85,697,131) | 85,697,131 | |
Total Investments (cost $1,609,981,960) | | $ 2,174,434,426 |
Receivable for investments sold | | 6,262,368 |
Receivable for fund shares sold | | 4,252,327 |
Dividends receivable | | 316,915 |
Distributions receivable from Fidelity Central Funds | | 32,232 |
Other receivables | | 379,542 |
Total assets | | 2,185,677,810 |
| | |
Liabilities | | |
Payable for investments purchased | $ 8,676,527 | |
Payable for fund shares redeemed | 1,327,650 | |
Accrued management fee | 1,262,835 | |
Distribution and service plan fees payable | 12,629 | |
Other affiliated payables | 465,006 | |
Other payables and accrued expenses | 243,621 | |
Collateral on securities loaned, at value | 11,164,250 | |
Total liabilities | | 23,152,518 |
| | |
Net Assets | | $ 2,162,525,292 |
Net Assets consist of: | | |
Paid in capital | | $ 1,682,005,306 |
Undistributed net investment income | | 25,575,304 |
Accumulated undistributed net realized gain (loss) on investments and foreign currency transactions | | (109,507,734) |
Net unrealized appreciation (depreciation) on investments and assets and liabilities in foreign currencies | | 564,452,416 |
Net Assets | | $ 2,162,525,292 |
Statement of Assets and Liabilities - continued
| October 31, 2010 |
| | |
Calculation of Maximum Offering Price Class A:
Net Asset Value and redemption price per share ($16,047,242 ÷ 507,608 shares) | | $ 31.61 |
| | |
Maximum offering price per share (100/94.25 of $31.61) | | $ 33.54 |
Class T:
Net Asset Value and redemption price per share ($6,069,809 ÷ 192,817 shares) | | $ 31.48 |
| | |
Maximum offering price per share (100/96.50 of $31.48) | | $ 32.62 |
Class B:
Net Asset Value and offering price per share ($2,495,982 ÷ 79,921 shares) A | | $ 31.23 |
| | |
Class C:
Net Asset Value and offering price per share ($5,938,380 ÷ 190,411 shares) A | | $ 31.19 |
| | |
China Region:
Net Asset Value, offering price and redemption price per share ($2,130,070,228 ÷ 66,960,488 shares) | | $ 31.81 |
| | |
Institutional Class:
Net Asset Value, offering price and redemption price per share ($1,903,651 ÷ 59,886 shares) | | $ 31.79 |
A Redemption price per share is equal to net asset value less any applicable contingent deferred sales charge.
See accompanying notes which are an integral part of the financial statements.
Annual Report
Fidelity China Region Fund
Financial Statements - continued
Statement of Operations
| Year ended October 31, 2010 |
| | |
Investment Income | | |
Dividends | | $ 51,267,009 |
Interest | | 839 |
Income from Fidelity Central Funds | | 512,014 |
Income before foreign taxes withheld | | 51,779,862 |
Less foreign taxes withheld | | (4,706,256) |
Total income | | 47,073,606 |
| | |
Expenses | | |
Management fee | $ 15,034,894 | |
Transfer agent fees | 5,059,284 | |
Distribution and service plan fees | 128,222 | |
Accounting and security lending fees | 936,699 | |
Custodian fees and expenses | 1,216,014 | |
Independent trustees' compensation | 12,021 | |
Registration fees | 161,631 | |
Audit | 68,420 | |
Legal | 14,413 | |
Interest | 3,369 | |
Miscellaneous | 27,343 | |
Total expenses before reductions | 22,662,310 | |
Expense reductions | (1,286,872) | 21,375,438 |
Net investment income (loss) | | 25,698,168 |
Realized and Unrealized Gain (Loss) Net realized gain (loss) on: | | |
Investment securities: | | |
Unaffiliated issuers | 87,323,739 | |
Foreign currency transactions | (268,927) | |
Capital gain distributions from Fidelity Central Funds | 1,892 | |
Total net realized gain (loss) | | 87,056,704 |
Change in net unrealized appreciation (depreciation) on: Investment securities | 253,069,310 | |
Assets and liabilities in foreign currencies | 27 | |
Total change in net unrealized appreciation (depreciation) | | 253,069,337 |
Net gain (loss) | | 340,126,041 |
Net increase (decrease) in net assets resulting from operations | | $ 365,824,209 |
Statement of Changes in Net Assets
| Year ended
October 31,
2010 | Year ended
October 31,
2009 |
Increase (Decrease) in Net Assets | | |
Operations | | |
Net investment income (loss) | $ 25,698,168 | $ 19,321,348 |
Net realized gain (loss) | 87,056,704 | (37,545,495) |
Change in net unrealized appreciation (depreciation) | 253,069,337 | 584,945,489 |
Net increase (decrease) in net assets resulting from operations | 365,824,209 | 566,721,342 |
Distributions to shareholders from net investment income | (17,788,313) | (7,631,813) |
Distributions to shareholders from net realized gain | (5,540,851) | - |
Total distributions | (23,329,164) | (7,631,813) |
Share transactions - net increase (decrease) | (341,589,636) | 858,935,262 |
Redemption fees | 1,093,238 | 1,318,632 |
Total increase (decrease) in net assets | 1,998,647 | 1,419,343,423 |
| | |
Net Assets | | |
Beginning of period | 2,160,526,645 | 741,183,222 |
End of period (including undistributed net investment income of $25,575,304 and undistributed net investment income of $17,665,449, respectively) | $ 2,162,525,292 | $ 2,160,526,645 |
See accompanying notes which are an integral part of the financial statements.
Annual Report
Financial Highlights - Class A
Years ended October 31, | 2010 | 2009 | 2008 H |
Selected Per-Share Data | | | |
Net asset value, beginning of period | $ 26.47 | $ 16.67 | $ 29.28 |
Income from Investment Operations | | | |
Net investment income (loss) E | .25 | .30 | .28 |
Net realized and unrealized gain (loss) | 5.15 | 9.63 | (12.91) |
Total from investment operations | 5.40 | 9.93 | (12.63) |
Distributions from net investment income | (.20) | (.16) | - |
Distributions from net realized gain | (.07) | - | - |
Total distributions | (.27) | (.16) | - |
Redemption fees added to paid in capital E | .01 | .03 | .02 |
Net asset value, end of period | $ 31.61 | $ 26.47 | $ 16.67 |
Total Return B, C, D | 20.54% | 60.41% | (43.07)% |
Ratios to Average Net Assets F, I | | | |
Expenses before reductions | 1.38% | 1.39% | 1.44% A |
Expenses net of fee waivers, if any | 1.38% | 1.39% | 1.44% A |
Expenses net of all reductions | 1.31% | 1.31% | 1.30% A |
Net investment income (loss) | .91% | 1.27% | 2.63% A |
Supplemental Data | | | |
Net assets, end of period (000 omitted) | $ 16,047 | $ 11,842 | $ 340 |
Portfolio turnover rate G | 57% | 88% | 133% |
A Annualized
B Total returns for periods of less than one year are not annualized.
C Total returns would have been lower had certain expenses not been reduced during the periods shown.
D Total returns do not include the effect of the sales charges.
E Calculated based on average shares outstanding during the period.
F Fees and expenses of the underlying Fidelity Central Funds are not included in the Fund's expense ratio. The Fund indirectly bears its proportionate share of the expenses of any underlying Fidelity Central Funds.
G Amount does not include the portfolio activity of any underlying Fidelity Central Funds.
H For the period May 9, 2008 (commencement of sale of shares) to October 31, 2008.
I Expense ratios reflect operating expenses of the class. Expenses before reductions do not reflect amounts reimbursed by the investment adviser or reductions from brokerage service arrangements or reductions from other expense offset arrangements and do not represent the amount paid by the class during periods when reimbursements or reductions occur. Expense ratios before reductions for start-up periods may not be representative of longer-term operating periods. Expenses net of fee waivers reflect expenses after reimbursement by the investment adviser but prior to reductions from brokerage service arrangements or other expense offset arrangements. Expenses net of all reductions represent the net expenses paid by the class.
Financial Highlights - Class T
Years ended October 31, | 2010 | 2009 | 2008 H |
Selected Per-Share Data | | | |
Net asset value, beginning of period | $ 26.40 | $ 16.65 | $ 29.28 |
Income from Investment Operations | | | |
Net investment income (loss) E | .18 | .23 | .26 |
Net realized and unrealized gain (loss) | 5.13 | 9.64 | (12.91) |
Total from investment operations | 5.31 | 9.87 | (12.65) |
Distributions from net investment income | (.18) | (.14) | - |
Distributions from net realized gain | (.07) | - | - |
Total distributions | (.24) J | (.14) | - |
Redemption fees added to paid in capital E | .01 | .02 | .02 |
Net asset value, end of period | $ 31.48 | $ 26.40 | $ 16.65 |
Total Return B, C, D | 20.27% | 59.92% | (43.14)% |
Ratios to Average Net Assets F, I | | | |
Expenses before reductions | 1.64% | 1.66% | 1.68% A |
Expenses net of fee waivers, if any | 1.64% | 1.66% | 1.68% A |
Expenses net of all reductions | 1.58% | 1.58% | 1.53% A |
Net investment income (loss) | .64% | 1.00% | 2.40% A |
Supplemental Data | | | |
Net assets, end of period (000 omitted) | $ 6,070 | $ 3,139 | $ 107 |
Portfolio turnover rate G | 57% | 88% | 133% |
A Annualized
B Total returns for periods of less than one year are not annualized.
C Total returns would have been lower had certain expenses not been reduced during the periods shown.
D Total returns do not include the effect of the sales charges.
E Calculated based on average shares outstanding during the period.
F Fees and expenses of the underlying Fidelity Central Funds are not included in the Fund's expense ratio. The Fund indirectly bears its proportionate share of the expenses of any underlying Fidelity Central Funds.
G Amount does not include the portfolio activity of any underlying Fidelity Central Funds.
H For the period May 9, 2008 (commencement of sale of shares) to October 31, 2008.
I Expense ratios reflect operating expenses of the class. Expenses before reductions do not reflect amounts reimbursed by the investment adviser or reductions from brokerage service arrangements or reductions from other expense offset arrangements and do not represent the amount paid by the class during periods when reimbursements or reductions occur. Expense ratios before reductions for start-up periods may not be representative of longer-term operating periods. Expenses net of fee waivers reflect expenses after reimbursement by the investment adviser but prior to reductions from brokerage service arrangements or other expense offset arrangements. Expenses net of all reductions represent the net expenses paid by the class.
J Total distributions of $.24 per share is comprised of distributions from net investment income of $.177 and distributions from net realized gain of $.065 per share.
See accompanying notes which are an integral part of the financial statements.
Annual Report
Financial Highlights - Class B
Years ended October 31, | 2010 | 2009 | 2008 H |
Selected Per-Share Data | | | |
Net asset value, beginning of period | $ 26.28 | $ 16.61 | $ 29.28 |
Income from Investment Operations | | | |
Net investment income (loss) E | .04 | .12 | .20 |
Net realized and unrealized gain (loss) | 5.09 | 9.63 | (12.89) |
Total from investment operations | 5.13 | 9.75 | (12.69) |
Distributions from net investment income | (.12) | (.10) | - |
Distributions from net realized gain | (.07) | - | - |
Total distributions | (.19) | (.10) | - |
Redemption fees added to paid in capital E | .01 | .02 | .02 |
Net asset value, end of period | $ 31.23 | $ 26.28 | $ 16.61 |
Total Return B, C, D | 19.63% | 59.16% | (43.27)% |
Ratios to Average Net Assets F, I | | | |
Expenses before reductions | 2.14% | 2.15% | 2.17% A |
Expenses net of fee waivers, if any | 2.14% | 2.15% | 2.17% A |
Expenses net of all reductions | 2.08% | 2.06% | 2.02% A |
Net investment income (loss) | .14% | .51% | 1.91% A |
Supplemental Data | | | |
Net assets, end of period (000 omitted) | $ 2,496 | $ 1,915 | $ 155 |
Portfolio turnover rate G | 57% | 88% | 133% |
A Annualized
B Total returns for periods of less than one year are not annualized.
C Total returns would have been lower had certain expenses not been reduced during the periods shown.
D Total returns do not include the effect of the contingent deferred sales charge.
E Calculated based on average shares outstanding during the period.
F Fees and expenses of the underlying Fidelity Central Funds are not included in the Fund's expense ratio. The Fund indirectly bears its proportionate share of the expenses of any underlying Fidelity Central Funds.
G Amount does not include the portfolio activity of any underlying Fidelity Central Funds.
H For the period May 9, 2008 (commencement of sale of shares) to October 31, 2008.
I Expense ratios reflect operating expenses of the class. Expenses before reductions do not reflect amounts reimbursed by the investment adviser or reductions from brokerage service arrangements or reductions from other expense offset arrangements and do not represent the amount paid by the class during periods when reimbursements or reductions occur. Expense ratios before reductions for start-up periods may not be representative of longer-term operating periods. Expenses net of fee waivers reflect expenses after reimbursement by the investment adviser but prior to reductions from brokerage service arrangements or other expense offset arrangements. Expenses net of all reductions represent the net expenses paid by the class.
Financial Highlights - Class C
Years ended October 31, | 2010 | 2009 | 2008 H |
Selected Per-Share Data | | | |
Net asset value, beginning of period | $ 26.25 | $ 16.61 | $ 29.28 |
Income from Investment Operations | | | |
Net investment income (loss) E | .04 | .12 | .20 |
Net realized and unrealized gain (loss) | 5.09 | 9.62 | (12.89) |
Total from investment operations | 5.13 | 9.74 | (12.69) |
Distributions from net investment income | (.13) | (.12) | - |
Distributions from net realized gain | (.07) | - | - |
Total distributions | (.20) | (.12) | - |
Redemption fees added to paid in capital E | .01 | .02 | .02 |
Net asset value, end of period | $ 31.19 | $ 26.25 | $ 16.61 |
Total Return B, C, D | 19.66% | 59.18% | (43.27)% |
Ratios to Average Net Assets F, I | | | |
Expenses before reductions | 2.14% | 2.15% | 2.13% A |
Expenses net of fee waivers, if any | 2.14% | 2.15% | 2.13% A |
Expenses net of all reductions | 2.07% | 2.07% | 1.98% A |
Net investment income (loss) | .15% | .51% | 1.95% A |
Supplemental Data | | | |
Net assets, end of period (000 omitted) | $ 5,938 | $ 3,806 | $ 233 |
Portfolio turnover rate G | 57% | 88% | 133% |
A Annualized
B Total returns for periods of less than one year are not annualized.
C Total returns would have been lower had certain expenses not been reduced during the periods shown.
D Total returns do not include the effect of the contingent deferred sales charge.
E Calculated based on average shares outstanding during the period.
F Fees and expenses of the underlying Fidelity Central Funds are not included in the Fund's expense ratio. The Fund indirectly bears its proportionate share of the expenses of any underlying Fidelity Central Funds.
G Amount does not include the portfolio activity of any underlying Fidelity Central Funds.
H For the period May 9, 2008 (commencement of sale of shares) to October 31, 2008.
I Expense ratios reflect operating expenses of the class. Expenses before reductions do not reflect amounts reimbursed by the investment adviser or reductions from brokerage service arrangements or reductions from other expense offset arrangements and do not represent the amount paid by the class during periods when reimbursements or reductions occur. Expense ratios before reductions for start-up periods may not be representative of longer-term operating periods. Expenses net of fee waivers reflect expenses after reimbursement by the investment adviser but prior to reductions from brokerage service arrangements or other expense offset arrangements. Expenses net of all reductions represent the net expenses paid by the class.
See accompanying notes which are an integral part of the financial statements.
Annual Report
Financial Highlights - China Region
Years ended October 31, | 2010 | 2009 | 2008 | 2007 | 2006 |
Selected Per-Share Data | | | | | |
Net asset value, beginning of period | $ 26.55 | $ 16.69 | $ 41.52 | $ 22.94 | $ 17.74 |
Income from Investment Operations | | | | | |
Net investment income (loss) B | .34 | .33 | .39 | .46 | .42 |
Net realized and unrealized gain (loss) | 5.18 | 9.68 | (20.42) | 18.58 | 4.99 |
Total from investment operations | 5.52 | 10.01 | (20.03) | 19.04 | 5.41 |
Distributions from net investment income | (.21) | (.17) | (.32) | (.29) | (.22) |
Distributions from net realized gain | (.07) | - | (4.53) | (.20) | - |
Total distributions | (.27) F | (.17) | (4.85) | (.49) | (.22) |
Redemption fees added to paid in capital B | .01 | .02 | .05 | .03 | .01 |
Net asset value, end of period | $ 31.81 | $ 26.55 | $ 16.69 | $ 41.52 | $ 22.94 |
Total Return A | 20.97% | 60.77% | (53.75)% | 84.73% | 30.83% |
Ratios to Average Net Assets C, E | | | | | |
Expenses before reductions | 1.06% | 1.12% | 1.11% | 1.08% | 1.14% |
Expenses net of fee waivers, if any | 1.06% | 1.12% | 1.11% | 1.08% | 1.14% |
Expenses net of all reductions | 1.00% | 1.03% | .96% | .92% | 1.08% |
Net investment income (loss) | 1.22% | 1.54% | 1.45% | 1.64% | 1.99% |
Supplemental Data | | | | | |
Net assets, end of period (000 omitted) | $ 2,130,070 | $ 2,138,141 | $ 740,289 | $ 2,044,527 | $ 734,793 |
Portfolio turnover rate D | 57% | 88% | 133% | 173% | 36% |
A Total returns would have been lower had certain expenses not been reduced during the periods shown.
B Calculated based on average shares outstanding during the period.
C Fees and expenses of the underlying Fidelity Central Funds are not included in the Fund's expense ratio. The Fund indirectly bears its proportionate share of the expenses of any underlying Fidelity Central Funds.
D Amount does not include the portfolio activity of any underlying Fidelity Central Funds.
E Expense ratios reflect operating expenses of the class. Expenses before reductions do not reflect amounts reimbursed by the investment adviser or reductions from brokerage service arrangements or reductions from other expense offset arrangements and do not represent the amount paid by the class during periods when reimbursements or reductions occur. Expenses net of fee waivers reflect expenses after reimbursement by the investment adviser but prior to reductions from brokerage service arrangements or other expense offset arrangements. Expenses net of all reductions represent the net expenses paid by the class.
F Total distributions of $.27 per share is comprised of distributions from net investment income of $.209 and distributions from net realized gain of $.065 per share.
Financial Highlights - Institutional Class
Years ended October 31, | 2010 | 2009 | 2008 G |
Selected Per-Share Data | | | |
Net asset value, beginning of period | $ 26.55 | $ 16.70 | $ 29.28 |
Income from Investment Operations | | | |
Net investment income (loss) D | .33 | .37 | .34 |
Net realized and unrealized gain (loss) | 5.18 | 9.64 | (12.94) |
Total from investment operations | 5.51 | 10.01 | (12.60) |
Distributions from net investment income | (.22) | (.18) | - |
Distributions from net realized gain | (.07) | - | - |
Total distributions | (.28) I | (.18) | - |
Redemption fees added to paid in capital D | .01 | .02 | .02 |
Net asset value, end of period | $ 31.79 | $ 26.55 | $ 16.70 |
Total Return B, C | 20.92% | 60.78% | (42.96)% |
Ratios to Average Net Assets E, H | | | |
Expenses before reductions | 1.11% | 1.08% | 1.05% A |
Expenses net of fee waivers, if any | 1.11% | 1.08% | 1.05% A |
Expenses net of all reductions | 1.04% | 1.00% | .91% A |
Net investment income (loss) | 1.18% | 1.58% | 3.02% A |
Supplemental Data | | | |
Net assets, end of period (000 omitted) | $ 1,904 | $ 1,684 | $ 60 |
Portfolio turnover rate F | 57% | 88% | 133% |
A Annualized
B Total returns for periods of less than one year are not annualized.
C Total returns would have been lower had certain expenses not been reduced during the periods shown.
D Calculated based on average shares outstanding during the period.
E Fees and expenses of the underlying Fidelity Central Funds are not included in the Fund's expense ratio. The Fund indirectly bears its proportionate share of the expenses of any underlying Fidelity Central Funds.
F Amount does not include the portfolio activity of any underlying Fidelity Central Funds.
G For the period May 9, 2008 (commencement of sale of shares) to October 31, 2008.
H Expense ratios reflect operating expenses of the class. Expenses before reductions do not reflect amounts reimbursed by the investment adviser or reductions from brokerage service arrangements or reductions from other expense offset arrangements and do not represent the amount paid by the class during periods when reimbursements or reductions occur. Expense ratios before reductions for start-up periods may not be representative of longer-term operating periods. Expenses net of fee waivers reflect expenses after reimbursement by the investment adviser but prior to reductions from brokerage service arrangements or other expense offset arrangements. Expenses net of all reductions represent the net expenses paid by the class.
I Total distributions of $.28 per share is comprised of distributions from net investment income of $.216 and distributions from net realized gain of $.065 per share.
See accompanying notes which are an integral part of the financial statements.
Annual Report
Notes to Financial Statements
For the period ended October 31, 2010
1. Organization.
Fidelity China Region Fund (the Fund) is a fund of Fidelity Investment Trust (the Trust) and is authorized to issue an unlimited number of shares. The Trust is registered under the Investment Company Act of 1940, as amended (the 1940 Act), as an open-end management investment company organized as a Massachusetts business trust. The Fund offers Class A, Class T, Class C, China Region and Institutional Class shares, each of which has equal rights as to assets and voting privileges. Effective after the close of business on September 1, 2010, Class B shares were closed to new accounts and additional purchases by existing shareholders. Each class has exclusive voting rights with respect to matters that affect that class. Class B shares will automatically convert to Class A shares after a holding period of seven years from the initial date of purchase. Investment income, realized and unrealized capital gains and losses, the common expenses of the Fund, and certain fund-level expense reductions, if any, are allocated on a pro-rata basis to each class based on the relative net assets of each class to the total net assets of the Fund. Each class differs with respect to transfer agent and distribution and service plan fees incurred. Certain expense reductions also differ by class. The Fund's investments in emerging markets can be subject to social, economic, regulatory, and political uncertainties and can be extremely volatile.
2. Investments in Fidelity Central Funds.
The Fund may invest in Fidelity Central Funds, which are open-end investment companies available only to other investment companies and accounts managed by Fidelity Management & Research Company (FMR) and its affiliates. The Fund's Schedule of Investments lists each of the Fidelity Central Funds held as of period end, if any, as an investment of the Fund, but does not include the underlying holdings of each Fidelity Central Fund. As an Investing Fund, the Fund indirectly bears its proportionate share of the expenses of the underlying Fidelity Central Funds.
The Money Market Central Funds seek preservation of capital and current income and are managed by Fidelity Investments Money Management, Inc. (FIMM), an affiliate of FMR.
A complete unaudited list of holdings for each Fidelity Central Fund is available upon request or at the Securities and Exchange Commission (the SEC) web site at www.sec.gov. In addition, the financial statements of the Fidelity Central Funds, which are not covered by the Fund's Report of Independent Registered Public Accounting Firm, are available on the SEC web site or upon request.
3. Significant Accounting Policies.
The financial statements have been prepared in conformity with accounting principles generally accepted in the United States of America (GAAP), which require management to make certain estimates and assumptions at the date of the financial statements. Actual results could differ from those estimates. The following summarizes the significant accounting policies of the Fund:
Security Valuation. Investments are valued as of 4:00 p.m. Eastern time on the last calendar day of the period. The Fund uses independent pricing services approved by the Board of Trustees to value its investments. When current market prices or quotations are not readily available or reliable, valuations may be determined in good faith in accordance with procedures adopted by the Board of Trustees. Factors used in determining value may include market or security specific events. The frequency with which these procedures are used cannot be predicted and they may be utilized to a significant extent. The value used for net asset value (NAV) calculation under these procedures may differ from published prices for the same securities.
The Fund categorizes the inputs to valuation techniques used to value its investments into a disclosure hierarchy consisting of three levels as shown below.
Level 1 - quoted prices in active markets for identical investments
Level 2 - other significant observable inputs (including quoted prices for similar investments, interest rates, prepayment speeds, etc.)
Level 3 - unobservable inputs (including the fund's own assumptions based on the best information available)
Changes in valuation techniques may result in transfers in or out of an assigned level within the disclosure hierarchy. Valuation techniques used to value the Fund's investments by major category are as follows.
Equity securities, including restricted securities, for which market quotations are readily available, are valued at the last reported sale price or official closing price as reported by an independent pricing service on the primary market or exchange on which they are traded and are categorized as Level 1 in the hierarchy. In the event there were no sales during the day or closing prices are not available, securities are valued at the last quoted bid price or may be valued using the last available price and are generally categorized as Level 2 in the hierarchy. For foreign equity securities, when significant market or security specific events arise, comparisons to the valuation of American Depositary Receipts (ADRs), futures contracts, Exchange-traded funds (ETFs) and certain indexes as well as quoted prices for similar securities are used and are categorized as Level 2 in the hierarchy in these circumstances. Utilizing these techniques may result in significant transfers between Level 1 and Level 2. For restricted equity securities and private placements where observable inputs are limited, assumptions about market activity and risk are used and are categorized as Level 3 in the hierarchy.
Annual Report
Notes to Financial Statements - continued
3. Significant Accounting Policies - continued
Security Valuation - continued
Investments in open-end mutual funds, including the Fidelity Central Funds, are valued at their closing net asset value each business day and are categorized as Level 1 in the hierarchy. Short-term securities with remaining maturities of sixty days or less for which quotations are not readily available are valued at amortized cost, which approximates fair value and are categorized as Level 2 in the hierarchy.
Foreign Currency. The Fund uses foreign currency contracts to facilitate transactions in foreign-denominated securities. Gains and losses from these transactions may arise from changes in the value of the foreign currency or if the counterparties do not perform under the contracts' terms.
Foreign-denominated assets, including investment securities, and liabilities are translated into U.S. dollars at the exchange rate at period end. Purchases and sales of investment securities, income and dividends received and expenses denominated in foreign currencies are translated into U.S. dollars at the exchange rate in effect on the transaction date.
The effects of exchange rate fluctuations on investments are included with the net realized and unrealized gain (loss) on investment securities. Other foreign currency transactions resulting in realized and unrealized gain (loss) are disclosed separately.
Investment Transactions and Income. For financial reporting purposes, the Fund's investment holdings and NAV include trades executed through the end of the last business day of the period. The NAV per share for processing shareholder transactions is calculated as of the close of business of the New York Stock Exchange (NYSE), normally 4:00 p.m. Eastern time and includes trades executed through the end of the prior business day. Gains and losses on securities sold are determined on the basis of identified cost. Dividend income is recorded on the ex-dividend date, except for certain dividends from foreign securities where the ex-dividend date may have passed, which are recorded as soon as the Fund is informed of the ex-dividend date. Non-cash dividends included in dividend income, if any, are recorded at the fair market value of the securities received. Distributions received on securities that represent a return of capital or capital gain are recorded as a reduction of cost of investments and/or as a realized gain. The Fund estimates the components of distributions received that may be considered return of capital distributions or capital gain distributions. Interest income and distributions from the Fidelity Central Funds are accrued as earned. Interest income includes coupon interest and amortization of premium and accretion of discount on debt securities. Investment income is recorded net of foreign taxes withheld where recovery of such taxes is uncertain.
Expenses. Most expenses of the Trust can be directly attributed to a fund. Expenses which cannot be directly attributed are apportioned amongst each fund in the Trust. Expense estimates are accrued in the period to which they relate and adjustments are made when actual amounts are known.
Income Tax Information and Distributions to Shareholders. Each year, the Fund intends to qualify as a regulated investment company, including distributing substantially all of its taxable income and realized gains under Subchapter M of the Internal Revenue Code and filing its U.S. federal tax return. As a result, no provision for income taxes is required. As of October 31, 2010, the Fund did not have any unrecognized tax benefits in the accompanying financial statements. A fund's federal tax return is subject to examination by the Internal Revenue Service (IRS) for a period of three years. Foreign taxes are provided for based on the Fund's understanding of the tax rules and rates that exist in the foreign markets in which it invests.
Distributions are declared and recorded on the ex-dividend date. Income dividends and capital gain distributions are declared separately for each class. Income and capital gain distributions are determined in accordance with income tax regulations, which may differ from GAAP.
Capital accounts within the financial statements are adjusted for permanent book-tax differences. These adjustments have no impact on net assets or the results of operations. Temporary book-tax differences will reverse in a subsequent period.
Book-tax differences are primarily due to the short term gain distributions from Fidelity Central Funds, foreign currency transactions, passive foreign investment companies (PFIC), capital loss carryforwards, and losses deferred due to wash sales.
The federal tax cost of investment securities and unrealized appreciation (depreciation) as of period end were as follows:
Gross unrealized appreciation | $ 570,685,518 |
Gross unrealized depreciation | (18,690,935) |
Net unrealized appreciation (depreciation) | $ 551,994,583 |
| |
Tax Cost | $ 1,622,439,843 |
The tax-based components of distributable earnings as of period end were as follows:
Undistributed ordinary income | $ 27,154,415 |
Capital loss carryforward | $ (98,628,962) |
Net unrealized appreciation (depreciation) | $ 551,994,533 |
Annual Report
3. Significant Accounting Policies - continued
Income Tax Information and Distributions to Shareholders - continued
The tax character of distributions paid was as follows:
| October 31, 2010 | October 31, 2009 |
Ordinary Income | $ 23,329,164 | $ 7,631,813 |
Short-Term Trading (Redemption) Fees. Shares held by investors in the Fund less than 90 days are subject to a redemption fee equal to 1.50% of the net asset value of shares redeemed. All redemption fees, which reduce the proceeds of the shareholder redemption, are retained by the Fund and accounted for as an addition to paid in capital.
4. Purchases and Sales of Investments.
Purchases and sales of securities, other than short-term securities, aggregated $1,178,264,344 and $1,564,472,776, respectively.
5. Fees and Other Transactions with Affiliates.
Management Fee. FMR and its affiliates provide the Fund with investment management related services for which the Fund pays a monthly management fee. The management fee is the sum of an individual fund fee rate that is based on an annual rate of .45% of the Fund's average net assets and a group fee rate that averaged .26% during the period. The group fee rate is based upon the average net assets of all the mutual funds advised by FMR. The group fee rate decreases as assets under management increase and increases as assets under management decrease. For the period, the total annual management fee rate was .71% of the Fund's average net assets.
Distribution and Service Plan Fees. In accordance with Rule 12b-1 of the 1940 Act, the Fund has adopted separate Distribution and Service Plans for each class of shares. Certain classes pay Fidelity Distributors Corporation (FDC), an affiliate of FMR, separate Distribution and Service Fees, each of which is based on an annual percentage of each class' average net assets. In addition, FDC may pay financial intermediaries for selling shares of the Fund and providing shareholder support services. For the period, the Distribution and Service Fee rates, total fees and amounts retained by FDC were as follows:
| Distribution
Fee | Service
Fee | Paid to
FDC | Retained
by FDC |
Class A | 0% | .25% | $ 34,107 | $ 571 |
Class T | .25% | .25% | 23,236 | - |
Class B | .75% | .25% | 22,523 | 16,917 |
Class C | .75% | .25% | 48,356 | 25,041 |
| | | $ 128,222 | $ 42,529 |
Sales Load. FDC receives a front-end sales charge of up to 5.75% for selling Class A shares, and 3.50% for selling Class T shares, some of which is paid to financial intermediaries for selling shares of the Fund. FDC receives the proceeds of contingent deferred sales charges levied on Class A, Class T, Class B, and Class C redemptions. These charges depend on the holding period. The deferred sales charges range from 5% to 1% for Class B, 1% for Class C, 1.00% for certain purchases of Class A shares (1.00% to .50% prior to July 12, 2010) and .25% for certain purchases of Class T shares.
For the period, sales charge amounts retained by FDC were as follows:
| Retained
by FDC |
Class A | $ 26,257 |
Class T | 4,876 |
Class B* | 4,727 |
Class C* | 1,934 |
| $ 37,794 |
* When Class B and Class C shares are initially sold, FDC pays commissions from its own resources to financial intermediaries through which the sales are made.
Transfer Agent Fees. Fidelity Investments Institutional Operations Company, Inc. (FIIOC), an affiliate of FMR, is the transfer, dividend disbursing and shareholder servicing agent for each class of the Fund. FIIOC receives account fees and asset-based fees that vary according to the account size and type of account of the shareholders of the respective classes of the Fund. FIIOC pays for typesetting, printing and mailing of shareholder reports,
Annual Report
Notes to Financial Statements - continued
5. Fees and Other Transactions with Affiliates - continued
Transfer Agent Fees - continued
except proxy statements. For the period, transfer agent fees for each class were as follows:
| Amount | % of
Average
Net Assets |
Class A | $ 40,906 | .30 |
Class T | 14,660 | .31 |
Class B | 7,069 | .31 |
Class C | 15,003 | .31 |
China Region | 4,977,237 | .24 |
Institutional Class | 4,409 | .28 |
| $ 5,059,284 | |
Accounting and Security Lending Fees. Fidelity Service Company, Inc. (FSC), an affiliate of FMR, maintains the Fund's accounting records. The accounting fee is based on the level of average net assets for the month. Under a separate contract, FSC administers the security lending program. The security lending fee is based on the number and duration of lending transactions.
Brokerage Commissions. The fund placed a portion of its portfolio transactions with brokerage firms which are affiliates of the investment advisor. The commissions paid to these affiliated firms were $286 for the period.
Interfund Lending Program. Pursuant to an Exemptive Order issued by the SEC, the Fund, along with other registered investment companies having management contracts with FMR, may participate in an interfund lending program. This program provides an alternative credit facility allowing the funds to borrow from, or lend money to, other participating affiliated funds. At period end, there were no interfund loans outstanding. The Fund's activity in this program during the period for which loans were outstanding was as follows:
Borrower or Lender | Average Daily Loan Balance | Weighted Average Interest Rate | Interest
Expense |
Borrower | $ 12,377,773 | .45% | $ 3,369 |
6. Committed Line of Credit.
The Fund participates with other funds managed by FMR or an affiliate in a $3.75 billion credit facility (the "line of credit") to be utilized for temporary or emergency purposes to fund shareholder redemptions or for other short-term liquidity purposes. The Fund has agreed to pay commitment fees on its pro-rata portion of the line of credit, which amounted to $8,385 and is reflected in Miscellaneous expenses on the Statement of Operations. During the period, there were no borrowings on this line of credit.
7. Security Lending.
The Fund lends portfolio securities through a lending agent from time to time in order to earn additional income. The lending agent may loan securities to certain qualified borrowers, including Fidelity Capital Market (FCM), a broker-dealer affiliated with the Fund. On the settlement date of the loan, the Fund receives collateral (in the form of U.S. Treasury obligations, letters of credit and/or cash) against the loaned securities and maintains collateral in an amount not less than 100% of the market value of the loaned securities during the period of the loan. The market value of the loaned securities is determined at the close of business of the Fund and any additional required collateral is delivered to the Fund on the next business day. If the borrower defaults on its obligation to return the securities loaned because of insolvency or other reasons, a fund could experience delays and costs in recovering the securities loaned or in gaining access to the collateral. Any cash collateral received is invested in the Fidelity Securities Lending Cash Central Fund. The value of loaned securities and cash collateral at period end are disclosed on the Fund's Statement of Assets and Liabilities. Security lending income represents the income earned on investing cash collateral, less rebates paid to borrowers and lending agent fees associated with the loan, plus any premium payments received for lending certain types of securities. Security lending income is presented in the Statement of Operations as a component of income from Fidelity Central Funds. Total security lending income during the period amounted to $439,269. During the period, there were no securities loaned to FCM.
8. Expense Reductions.
Many of the brokers with whom FMR places trades on behalf of the Fund provided services to the Fund in addition to trade execution. These services included payments of certain expenses on behalf of the Fund totaling $1,286,872 for the period.
Annual Report
9. Distributions to Shareholders.
Distributions to shareholders of each class were as follows:
Years ended October 31, | 2010 | 2009 |
From net investment income | | |
Class A | $ 99,129 | $ 4,014 |
Class T | 24,223 | 973 |
Class B | 9,817 | 969 |
Class C | 22,748 | 1,793 |
China Region | 17,620,183 | 7,623,415 |
Institutional Class | 12,213 | 649 |
Total | $ 17,788,313 | $ 7,631,813 |
From net realized gain | | |
Class A | $ 32,057 | $ - |
Class T | 8,895 | - |
Class B | 5,146 | - |
Class C | 11,118 | - |
China Region | 5,479,960 | - |
Institutional Class | 3,675 | - |
Total | $ 5,540,851 | $ - |
10. Share Transactions.
Transactions for each class of shares were as follows:
| Shares | Dollars |
Years ended October 31, | 2010 | 2009 | 2010 | 2009 |
Class A | | | | |
Shares sold | 342,123 | 476,918 | $ 9,544,171 | $ 10,951,377 |
Reinvestment of distributions | 4,199 | 220 | 118,611 | 3,532 |
Shares redeemed | (286,153) | (50,111) | (7,654,399) | (1,196,308) |
Net increase (decrease) | 60,169 | 427,027 | $ 2,008,383 | $ 9,758,601 |
Class T | | | | |
Shares sold | 132,233 | 124,214 | $ 3,681,750 | $ 2,764,790 |
Reinvestment of distributions | 1,158 | 61 | 32,661 | 973 |
Shares redeemed | (59,475) | (11,807) | (1,609,136) | (289,925) |
Net increase (decrease) | 73,916 | 112,468 | $ 2,105,275 | $ 2,475,838 |
Class B | | | | |
Shares sold | 41,380 | 76,310 | $ 1,126,249 | $ 1,715,391 |
Reinvestment of distributions | 486 | 60 | 13,648 | 969 |
Shares redeemed | (34,810) | (12,815) | (913,219) | (303,220) |
Net increase (decrease) | 7,056 | 63,555 | $ 226,678 | $ 1,413,140 |
Class C | | | | |
Shares sold | 121,441 | 162,651 | $ 3,346,120 | $ 3,650,852 |
Reinvestment of distributions | 1,162 | 112 | 32,596 | 1,793 |
Shares redeemed | (77,220) | (31,751) | (2,041,365) | (779,443) |
Net increase (decrease) | 45,383 | 131,012 | $ 1,337,351 | $ 2,873,202 |
China Region | | | | |
Shares sold | 29,402,822 | 54,595,118 | $ 826,039,335 | $ 1,249,255,109 |
Reinvestment of distributions | 782,007 | 454,390 | 22,169,887 | 7,297,501 |
Shares redeemed | (43,745,336) | (18,885,174) | (1,195,393,614) | (415,361,909) |
Net increase (decrease) | (13,560,507) | 36,164,334 | $ (347,184,392) | $ 841,190,701 |
Institutional Class | | | | |
Shares sold | 53,076 | 72,363 | $ 1,486,647 | $ 1,546,935 |
Reinvestment of distributions | 500 | 40 | 14,160 | 649 |
Shares redeemed | (57,102) | (12,559) | (1,583,738) | (323,804) |
Net increase (decrease) | (3,526) | 59,844 | $ (82,931) | $ 1,223,780 |
Annual Report
Notes to Financial Statements - continued
11. Other.
The Fund's organizational documents provide former and current trustees and officers with a limited indemnification against liabilities arising in connection with the performance of their duties to the Fund. In the normal course of business, the Fund may also enter into contracts that provide general indemnifications. The Fund's maximum exposure under these arrangements is unknown as this would be dependent on future claims that may be made against the Fund. The risk of material loss from such claims is considered remote.
Annual Report
Report of Independent Registered Public Accounting Firm
To the Trustees of Fidelity Investment Trust and the Shareholders of Fidelity China Region Fund:
In our opinion, the accompanying statement of assets and liabilities, including the schedule of investments, and the related statements of operations and of changes in net assets and the financial highlights present fairly, in all material respects, the financial position of Fidelity China Region Fund (a fund of Fidelity Investment Trust) at October 31, 2010, the results of its operations for the year then ended, the changes in its net assets for each of the two years in the period then ended and the financial highlights for each of the five years in the period then ended, in conformity with accounting principles generally accepted in the United States of America. These financial statements and financial highlights (hereafter referred to as "financial statements") are the responsibility of the Fidelity China Region Fund's management. Our responsibility is to express an opinion on these financial statements based on our audits. We conducted our audits of these financial statements in accordance with the standards of the Public Company Accounting Oversight Board (United States). Those standards require that we plan and perform the audit to obtain reasonable assurance about whether the financial statements are free of material misstatement. An audit includes examining, on a test basis, evidence supporting the amounts and disclosures in the financial statements, assessing the accounting principles used and significant estimates made by management, and evaluating the overall financial statement presentation. We believe that our audits, which included confirmation of securities at October 31, 2010 by correspondence with the custodian and brokers, provide a reasonable basis for our opinion.
/s/ PricewaterhouseCoopers LLP
PricewaterhouseCoopers LLP
Boston, Massachusetts
December 17, 2010
Annual Report
The Trustees, Member of the Advisory Board, and executive officers of the trust and fund, as applicable, are listed below. The Board of Trustees governs the fund and is responsible for protecting the interests of shareholders. The Trustees are experienced executives who meet periodically throughout the year to oversee the fund's activities, review contractual arrangements with companies that provide services to the fund, oversee management of the risks associated with such activities and contractual arrangements, and review the fund's performance. Except for James C. Curvey, each of the Trustees oversees 221 funds advised by FMR or an affiliate. Mr. Curvey oversees 410 funds advised by FMR or an affiliate.
The Trustees hold office without limit in time except that (a) any Trustee may resign; (b) any Trustee may be removed by written instrument, signed by at least two-thirds of the number of Trustees prior to such removal; (c) any Trustee who requests to be retired or who has become incapacitated by illness or injury may be retired by written instrument signed by a majority of the other Trustees; and (d) any Trustee may be removed at any special meeting of shareholders by a two-thirds vote of the outstanding voting securities of the trust. Each Trustee who is not an interested person (as defined in the 1940 Act) (Independent Trustee), shall retire not later than the last day of the calendar year in which his or her 72nd birthday occurs. The Independent Trustees may waive this mandatory retirement age policy with respect to individual Trustees. The executive officers and Advisory Board Member hold office without limit in time, except that any officer and Advisory Board Member may resign or may be removed by a vote of a majority of the Trustees at any regular meeting or any special meeting of the Trustees. Except as indicated, each individual has held the office shown or other offices in the same company for the past five years.
Experience, Skills, Attributes, and Qualifications of the Fund's Trustees. The Governance and Nominating Committee has adopted a statement of policy that describes the experience, qualifications, attributes, and skills that are necessary and desirable for potential Independent Trustee candidates (Statement of Policy). The Board believes that each Trustee satisfied at the time he or she was initially elected or appointed a Trustee, and continues to satisfy, the standards contemplated by the Statement of Policy. The Governance and Nominating Committee also engages professional search firms to help identify potential Independent Trustee candidates who have the experience, qualifications, attributes, and skills consistent with the Statement of Policy. From time to time, additional criteria based on the composition and skills of the current Independent Trustees, as well as experience or skills that may be appropriate in light of future changes to board composition, business conditions, and regulatory or other developments, have also been considered by the professional search firms and the Governance and Nominating Committee. In addition, the Board takes into account the Trustees' commitment and participation in Board and committee meetings, as well as their leadership of standing and ad hoc committees throughout their tenure.
In determining that a particular Trustee was and continues to be qualified to serve as a Trustee, the Board has considered a variety of criteria, none of which, in isolation, was controlling. The Board believes that, collectively, the Trustees have balanced and diverse experience, qualifications, attributes, and skills, which allow the Board to operate effectively in governing the fund and protecting the interests of shareholders. Information about the specific experience, skills, attributes, and qualifications of each Trustee, which in each case led to the Board's conclusion that the Trustee should serve (or continue to serve) as a trustee of the fund, is provided below.
Board Structure and Oversight Function. Edward C. Johnson 3d is an interested person (as defined in the 1940 Act) and currently serves as Chairman. The Trustees have determined that an interested Chairman is appropriate and benefits shareholders because an interested Chairman has a personal and professional stake in the quality and continuity of services provided to the fund. Independent Trustees exercise their informed business judgment to appoint an individual of their choosing to serve as Chairman, regardless of whether the Trustee happens to be independent or a member of management. The Independent Trustees have determined that they can act independently and effectively without having an Independent Trustee serve as Chairman and that a key structural component for assuring that they are in a position to do so is for the Independent Trustees to constitute a substantial majority for the Board. The Independent Trustees also regularly meet in executive session. Ned C. Lautenbach serves as Chairman of the Independent Trustees and as such (i) acts as a liaison between the Independent Trustees and management with respect to matters important to the Independent Trustees and (ii) with management prepares agendas for Board meetings.
Fidelity funds are overseen by different Boards of Trustees. The fund's Board oversees Fidelity's equity and high income funds and another Board oversees Fidelity's investment-grade bond, money market, and asset allocation funds. The asset allocation funds may invest in Fidelity funds overseen by the fund's Board. The use of separate Boards, each with its own committee structure, allows the Trustees of each group of Fidelity funds to focus on the unique issues of the funds they oversee, including common research, investment, and operational issues. On occasion, the separate Boards establish joint committees to address issues of overlapping consequences for the Fidelity funds overseen by each Board.
The Trustees operate using a system of committees to facilitate the timely and efficient consideration of all matters of importance to the Trustees, the fund, and fund shareholders and to facilitate compliance with legal and regulatory requirements and oversight of the fund's activities and associated risks. The Board, acting through its committees, has charged FMR and its affiliates with (i) identifying events or circumstances the occurrence of which could have demonstrably adverse effects on the fund's business and/or reputation; (ii) implementing processes and controls to lessen the possibility that such events or circumstances occur or to mitigate the effects of such events or circumstances if they do occur; and (iii) creating and maintaining a system designed to evaluate continuously business and market conditions in order to facilitate the identification and implementation processes described in (i) and (ii) above. Because the day-to-day operations and activities of the fund are carried out by or through FMR, its affiliates and other service providers, the fund's exposure to risks is mitigated but not eliminated by the processes overseen by the Trustees. While each of the Board's committees has responsibility for overseeing different aspects of the fund's activities, oversight is exercised primarily through the Operations, Audit, and Compliance Committees. Appropriate personnel, including but not limited to the fund's Chief Compliance Officer (CCO), FMR's internal auditor, the independent accountants, the fund's Treasurer and portfolio management personnel, make periodic reports to the Board's committees, as appropriate. The responsibilities of each committee, including their oversight responsibilities, are described further under "Standing Committees of the Fund's Trustees."
Annual Report
Trustees and Officers - continued
The fund's Statement of Additional Information (SAI) includes more information about the Trustees. To request a free copy, call Fidelity at 1-877-208-0098.
Interested Trustees*:
Correspondence intended for each Trustee who is an interested person may be sent to Fidelity Investments, 82 Devonshire Street, Boston, Massachusetts 02109.
Name, Age; Principal Occupations and Other Relevant Experience+ |
Edward C. Johnson 3d (80) |
| Year of Election or Appointment: 1984 Mr. Johnson is Trustee and Chairman of the Board of Trustees of certain Trusts. Mr. Johnson serves as Chief Executive Officer, Chairman, and a Director of FMR LLC; Chairman and a Director of FMR; Chairman and a Director of Fidelity Research & Analysis Company (FRAC); Chairman and a Director of Fidelity Investments Money Management, Inc.; and Chairman and a Director of FMR Co., Inc. In addition, Mr. Johnson serves as Chairman and Director of FIL Limited. Previously, Mr. Johnson served as President of FMR LLC (2006-2007). |
Name, Age; Principal Occupations and Other Relevant Experience+ |
James C. Curvey (75) |
| Year of Election or Appointment: 2007 Mr. Curvey also serves as Trustee (2007-present) of other investment companies advised by FMR. Mr. Curvey is a Director of Fidelity Investments Money Management, Inc. (2009-present), Director of Fidelity Research & Analysis Co. (2009-present) and Director of FMR and FMR Co., Inc. (2007-present). Mr. Curvey is also Vice Chairman (2007-present) and Director of FMR LLC. In addition, Mr. Curvey serves as an Overseer for the Boston Symphony Orchestra and a member of the Trustees of Villanova University. Previously, Mr. Curvey was the Vice Chairman (2006-2007) and Director (2000-2007) of FMR Corp. |
* Trustees have been determined to be "Interested Trustees" by virtue of, among other things, their affiliation with the trust or various entities under common control with FMR.
+ The information above includes each Trustee's principal occupation during the last five years and other information relating to the experience, attributes, and skills relevant to each Trustee's qualifications to serve as a Trustee, which led to the conclusion that each Trustee should serve as a Trustee for the fund.
Independent Trustees:
Correspondence intended for each Independent Trustee (that is, the Trustees other than the Interested Trustees) may be sent to Fidelity Investments, P.O. Box 55235, Boston, Massachusetts 02205-5235.
Name, Age; Principal Occupations and Other Relevant Experience+ |
Dennis J. Dirks (62) |
| Year of Election or Appointment: 2005 Prior to his retirement in May 2003, Mr. Dirks was Chief Operating Officer and a member of the Board of The Depository Trust & Clearing Corporation (DTCC). He also served as President, Chief Operating Officer, and Board member of The Depository Trust Company (DTC) and President and Board member of the National Securities Clearing Corporation (NSCC). In addition, Mr. Dirks served as Chief Executive Officer and Board member of the Government Securities Clearing Corporation, Chief Executive Officer and Board member of the Mortgage-Backed Securities Clearing Corporation, as a Trustee and a member of the Finance Committee of Manhattan College (2005-2008), and as a Trustee and a member of the Finance Committee of AHRC of Nassau County (2006-2008). Mr. Dirks is a member of the Independent Directors Council (IDC) Governing Council (2010-Present) and Board of Directors for The Brookville Center for Children's Services, Inc. (2009-present). |
Alan J. Lacy (57) |
| Year of Election or Appointment: 2008 Mr. Lacy serves as Senior Adviser (2007-present) of Oak Hill Capital Partners, L.P. (private equity). Mr. Lacy also served as Chief Executive Officer (2000-2005) and Vice Chairman (2005-2006) of Sears Holdings Corporation and Sears, Roebuck and Co. (retail). In addition, Mr. Lacy serves as a member of the Board of Directors of The Western Union Company (global money transfer, 2006-present) and Bristol-Myers Squibb Company (global pharmaceuticals, 2007-present). Mr. Lacy is Chairman (2008-present) and a member (2006-present) of the Board of Trustees of The National Parks Conservation Association. |
Ned C. Lautenbach (66) |
| Year of Election or Appointment: 2000 Mr. Lautenbach is Chairman of the Independent Trustees of the Equity and High Income Funds (2006-present). Mr. Lautenbach currently serves as the Lead Director of the Eaton Corporation Board of Directors (diversified industrial, 1997-present). Mr. Lautenbach is also a member of the Board of Directors of the Philharmonic Center for the Arts in Naples, Florida (1999-
present); a member of the Board of Trustees of Fairfield University (2005-present); and a member of the Council on Foreign Relations (1994-present). Previously, Mr. Lautenbach was a Partner/Advisory Partner at Clayton, Dubilier & Rice, Inc. (private equity investment, 1998-2010), as well as a Director of Sony Corporation (2006-2007). |
Joseph Mauriello (66) |
| Year of Election or Appointment: 2008 Prior to his retirement in January 2006, Mr. Mauriello served in numerous senior management positions including Deputy Chairman and Chief Operating Officer (2004-2005), and Vice Chairman of Financial Services (2002-2004) of KPMG LLP US (professional services, 1965-2005). Mr. Mauriello currently serves as a member of the Board of Directors of XL Group plc. (global insurance and re-insurance, 2006-present) and of Arcadia Resources Inc. (health care services and products, 2007-present). Previously, Mr. Mauriello served as a Director of the Hamilton Funds of the Bank of New York (2006-2007). |
Cornelia M. Small (66) |
| Year of Election or Appointment: 2005 Ms. Small is a member of the Board of Directors of the Teagle Foundation (2009-present). Ms. Small is also a member of the Investment Committee, and Chair (2008-present) and a member of the Board of Trustees of Smith College. In addition, Ms. Small serves on the Investment Committee of the Berkshire Taconic Community Foundation (2008-present). Previously, Ms. Small served as Chairperson of the Investment Committee (2002-2008) of Smith College. In addition, Ms. Small served as Chief Investment Officer, Director of Global Equity Investments, and a member of the Board of Directors of Scudder, Stevens & Clark and Scudder Kemper Investments. |
William S. Stavropoulos (71) |
| Year of Election or Appointment: 2001 Mr. Stavropoulos is Vice Chairman of the Independent Trustees of the Equity and High Income Funds (2006-present). Mr. Stavropoulos serves as President and Founder of the Michigan Baseball Foundation, the Great Lakes Loons (2007-present). Mr. Stavropoulos is Chairman Emeritus of the Board of Directors of The Dow Chemical Company, where he previously served in numerous senior management positions, including President, CEO (1995-2000; 2002-2004), Chairman of the Executive Committee (2000-2006), and as a member of the Board of Directors (1990-2006). Currently, Mr. Stavropoulos is Chairman of Univar (global distributor of commodity specialty chemicals, 2010-present), a Director of Teradata Corporation (data warehousing and technology solutions, 2008-present), Chemical Financial Corporation, Maersk Inc. (industrial conglomerate), Tyco International, Inc. (multinational manufacturing and services, 2007-present), and a member of the Advisory Board for Metalmark Capital (private equity investment, 2005-present). Mr. Stavropoulos is a special advisor to Clayton, Dubilier & Rice, Inc. (private equity investment). In addition, Mr. Stavropoulos is a member of the University of Notre Dame Advisory Council for the College of Science. |
David M. Thomas (61) |
| Year of Election or Appointment: 2008 Previously, Mr. Thomas served as Executive Chairman (2005-2006) and Chairman and Chief Executive Officer (2000-2005) of IMS Health, Inc. (pharmaceutical and healthcare information solutions). In addition, Mr. Thomas serves as a member of the Board of Directors of Fortune Brands, Inc. (consumer products), and Interpublic Group of Companies, Inc. (marketing communication, 2004-present). |
Michael E. Wiley (60) |
| Year of Election or Appointment: 2008 Mr. Wiley also serves as a Director of Asia Pacific Exploration Consolidated (international oil and gas exploration and production, 2008-present). Mr. Wiley serves as a Director of Tesoro Corporation (independent oil refiner and marketer, 2005-present), and a Director of Bill Barrett Corporation (exploration and production, 2005-present). In addition, Mr. Wiley also serves as a Director of Post Oak Bank (privately-held bank, 2004-present). Previously, Mr. Wiley served as a member of the Board of Trustees of the University of Tulsa (2000-2006; 2007-2010), as a Senior Energy Advisor of Katzenbach Partners, LLC (consulting, 2006-2007), as an Advisory Director of Riverstone Holdings (private investment), Chairman, President, and CEO of Baker Hughes, Inc. (oilfield services, 2000-2004), and as Director of Spinnaker Exploration Company (exploration and production, 2001-2005). |
+ The information above includes each Trustee's principal occupation during the last five years and other information relating to the experience, attributes, and skills relevant to each Trustee's qualifications to serve as a Trustee, which led to the conclusion that each Trustee should serve as a Trustee for the fund.
Annual Report
Trustees and Officers - continued
Advisory Board Member and Executive Officers:
Correspondence intended for each executive officer and Peter S. Lynch may be sent to Fidelity Investments, 82 Devonshire Street, Boston, Massachusetts 02109.
Name, Age; Principal Occupation |
Peter S. Lynch (66) |
| Year of Election or Appointment: 2003 Member of the Advisory Board of Fidelity's Equity and High Income Funds. Mr. Lynch is Vice Chairman and a Director of FMR and FMR Co., Inc. In addition, Mr. Lynch serves as a Trustee of Boston College and as the Chairman of the Inner-City Scholarship Fund. Previously, Mr. Lynch served on the Special Olympics International Board of Directors (1997-2006). |
Kenneth B. Robins (41) |
| Year of Election or Appointment: 2008 President and Treasurer of Fidelity's Equity and High Income Funds. Mr. Robins also serves as President and Treasurer (2010-
present) and Assistant Treasurer (2009-present) of other Fidelity funds and is an employee of Fidelity Investments (2004-present). Previously, Mr. Robins served as Deputy Treasurer of the Fidelity funds (2005-2008) and Treasurer and Chief Financial Officer of The North Carolina Capital Management Trust: Cash and Term Portfolios (2006-2008). |
Bruce T. Herring (45) |
| Year of Election or Appointment: 2006 Vice President of certain Equity Funds. Mr. Herring also serves as Chief Investment Officer and Director of Fidelity Management & Research (U.K.) Inc. (2010-present) and Group Chief Investments Officer of FMR. Previously, Mr. Herring served as Vice President (2005-2006) and Senior Vice President (2006-2007) of Fidelity Management & Research Company, Vice President of FMR Co., Inc. (2001-2007) and as a portfolio manager for Fidelity U.S. Equity Funds. |
Brian B. Hogan (46) |
| Year of Election or Appointment: 2009 Vice President of certain Equity Funds and Vice President of Sector Funds. Mr. Hogan also serves as President of FMR's Equity Division (2009-present). Previously, Mr. Hogan served as Senior Vice President, Equity Research of FMR (2006-2009) and as a portfolio manager. |
Scott C. Goebel (42) |
| Year of Election or Appointment: 2008 Secretary and Chief Legal Officer (CLO) of the Fidelity funds. Mr. Goebel also serves as Secretary and CLO of The North Carolina Capital Management Trust: Cash and Term Portfolio (2008-present); General Counsel, Secretary, and Senior Vice President of FMR (2008-present) and FMR Co., Inc. (2008-present); Deputy General Counsel of FMR LLC; Chief Legal Officer of Fidelity Management & Research (Hong Kong) Limited (2008-present) and Assistant Secretary of Fidelity Management & Research (Japan) Inc. (2008-present), Fidelity Investments Money Management, Inc. (2008-present), Fidelity Management & Research (U.K.) Inc. (2008-present), and Fidelity Research and Analysis Company (2008-present). Previously, Mr. Goebel served as Assistant Secretary of the Funds (2007-2008) and as Vice President and Secretary of Fidelity Distributors Corporation (FDC) (2005-2007). |
William C. Coffey (41) |
| Year of Election or Appointment: 2009 Assistant Secretary of Fidelity's Equity and High Income Funds. Mr. Coffey also serves as Senior Vice President and Deputy General Counsel of FMR LLC (2010-present), and is an employee of Fidelity Investments. Previously, Mr. Coffey served as Vice President and Associate General Counsel of FMR LLC (2005-2009). |
Holly C. Laurent (56) |
| Year of Election or Appointment: 2008 Anti-Money Laundering (AML) Officer of the Fidelity funds. Ms. Laurent also serves as AML Officer of The North Carolina Capital Management Trust: Cash and Term Portfolio (2008-present) and is an employee of Fidelity Investments. Previously, Ms. Laurent was Senior Vice President and Head of Legal for Fidelity Business Services India Pvt. Ltd. (2006-2008), and Senior Vice President, Deputy General Counsel and Group Head for FMR LLC (2005-2006). |
Christine Reynolds (52) |
| Year of Election or Appointment: 2008 Chief Financial Officer of the Fidelity funds. Ms. Reynolds became President of Fidelity Pricing and Cash Management Services (FPCMS) in August 2008. Ms. Reynolds served as Chief Operating Officer of FPCMS (2007-2008). Previously, Ms. Reynolds served as President, Treasurer, and Anti-Money Laundering officer of the Fidelity funds (2004-2007). |
Kenneth A. Rathgeber (63) |
| Year of Election or Appointment: 2004 Chief Compliance Officer of Fidelity's Equity and High Income Funds. Mr. Rathgeber is Chief Compliance Officer of Fidelity Management & Research (Hong Kong) Limited (2008-present), Fidelity Management & Research (Japan) Inc. (2008-present), FMR (2005-present), FMR Co., Inc. (2005-present), Fidelity Management & Research (U.K.) Inc. (2005-present), Fidelity Research & Analysis Company (2005-present), Fidelity Investments Money Management, Inc. (2005-present), Pyramis Global Advisors, LLC (2005-present), and Strategic Advisers, Inc. (2005-present). |
Jeffrey S. Christian (49) |
| Year of Election or Appointment: 2009 Deputy Treasurer of the Fidelity funds. Mr. Christian is an employee of Fidelity Investments. Previously, Mr. Christian served as Chief Financial Officer (2008-2009) of certain Fidelity funds and Senior Vice President of Fidelity Pricing and Cash Management Services (FPCMS) (2004-2009). |
Bryan A. Mehrmann (49) |
| Year of Election or Appointment: 2005 Deputy Treasurer of the Fidelity funds. Mr. Mehrmann is an employee of Fidelity Investments. |
Adrien E. Deberghes (43) |
| Year of Election or Appointment: 2008 Deputy Treasurer of Fidelity's Equity and High Income Funds. Mr. Deberghes also serves as Assistant Treasurer of other Fidelity funds (2010-present) and is an employee of Fidelity Investments (2008-present). Previously, Mr. Deberghes served as Senior Vice President of Mutual Fund Administration at State Street Corporation (2007-2008), Senior Director of Mutual Fund Administration at Investors Bank & Trust (2005-2007), and Director of Finance for Dunkin' Brands (2000-2005). |
Stephanie J. Dorsey (41) |
| Year of Election or Appointment: 2010 Assistant Treasurer of Fidelity's Equity and High Income Funds. Ms. Dorsey also serves as Deputy Treasurer of other Fidelity funds (2008-present) and is an employee of Fidelity Investments (2008-present). Previously, Ms. Dorsey served as Treasurer (2004-2008) of the JPMorgan Mutual Funds and Vice President (2004-2008) of JPMorgan Chase Bank. |
John R. Hebble (52) |
| Year of Election or Appointment: 2009 Assistant Treasurer of Fidelity's Equity and High Income Funds. Mr. Hebble also serves as Treasurer and Chief Financial Officer of The North Carolina Capital Management Trust: Cash and Term Portfolio (2008-present), President and Treasurer of other Fidelity funds (2008-present) and is an employee of Fidelity Investments. |
Gary W. Ryan (52) |
| Year of Election or Appointment: 2005 Assistant Treasurer of the Fidelity funds. Mr. Ryan is an employee of Fidelity Investments. Previously, Mr. Ryan served as Vice President of Fund Reporting in Fidelity Pricing and Cash Management Services (FPCMS) (1999-2005). |
Jonathan Davis (42) |
| Year of Election or Appointment: 2010 Assistant Treasurer of the Fidelity funds. Mr. Davis is an employee of Fidelity Investments. Previously, Mr. Davis served as Vice President and Associate General Counsel of FMR LLC (2003-2010). |
Annual Report
The Board of Trustees of Fidelity Advisor China Region Fund voted to pay to shareholders of record at the opening of business on record date, the following distributions per share derived from capital gains realized from sales of portfolio securities, and dividends derived from net investment income:
| Pay Date | Record Date | Dividends | Capital Gains |
Class A | 12/06/10 | 12/03/10 | $0.314 | $0.025 |
Class T | 12/06/10 | 12/03/10 | $0.268 | $0.025 |
Class B | 12/06/10 | 12/03/10 | $0.082 | $0.025 |
Class C | 12/06/10 | 12/03/10 | $0.131 | $0.025 |
Class A designates 40%; Class T designates 43%; Class B designates 53%; and Class C designates 51%; of the dividends distributed during the fiscal year as amounts which may be taken into account as a dividend for purposes of the maximum rate under section 1(h)(11) of the Internal Revenue Code.
The amounts per share which represent income derived from sources within, and taxes paid to, foreign countries or possessions of the United States are as follows:
| Pay Date | Income | Taxes |
Class A | 12/07/09 | $0.297 | $0.0314 |
Class T | 12/07/09 | $0.273 | $0.0314 |
Class B | 12/07/09 | $0.220 | $0.0314 |
Class C | 12/07/09 | $0.229 | $0.0314 |
The fund will notify shareholders in January 2011 of amounts for use in preparing 2010 income tax returns.
Annual Report
Board Approval of Investment Advisory Contracts and Management Fees
Fidelity China Region Fund
Each year, the Board of Trustees, including the Independent Trustees (together, the Board), votes on the renewal of the management contract and sub-advisory agreements (together, the Advisory Contracts) for the fund. The Board, assisted by the advice of fund counsel and Independent Trustees' counsel, requests and considers a broad range of information relevant to the renewal of the Advisory Contracts throughout the year.
The Board meets regularly and considers at each of its meetings factors that are relevant to its annual consideration of the renewal of the fund's Advisory Contracts, including the services and support provided to the fund and its shareholders. The Board has established various standing committees, each composed of Independent Trustees with varying backgrounds, to which the Board has assigned specific subject matter responsibilities in order to enhance effective decision-making by the Board. The Board, acting directly and through its Committees, requests and receives information concerning the annual consideration of the renewal of the fund's Advisory Contracts. The Board also meets as needed to consider matters specifically related to the Board's annual consideration of the renewal of Advisory Contracts. Members of the Board may also meet with trustees of other Fidelity funds through ad hoc joint committees to discuss certain matters relevant to the Fidelity funds.
At its July 2010 meeting, the Board of Trustees, including the Independent Trustees, unanimously determined to renew the fund's Advisory Contracts. In reaching its determination, the Board considered all factors it believed relevant, including (i) the nature, extent, and quality of the services to be provided to the fund and its shareholders (including the investment performance of the fund); (ii) the competitiveness of the fund's management fee and total expenses; (iii) the total costs of the services to be provided by and the profits to be realized by Fidelity from its relationship with the fund; (iv) the extent to which economies of scale would be realized as the fund grows; and (v) whether fee levels reflect these economies of scale, if any, for the benefit of fund shareholders.
In considering whether to renew the Advisory Contracts for the fund, the Board reached a determination, with the assistance of fund counsel and Independent Trustees' counsel and through the exercise of its business judgment, that the renewal of the Advisory Contracts is in the best interests of fund shareholders and that the compensation to be received by Fidelity under the management contract is fair and reasonable. The Board's decision to renew the Advisory Contracts was not based on any single factor noted above, but rather was based on a comprehensive consideration of all the information provided to the Board at its meetings throughout the year. The Board, in reaching its determination to renew the Advisory Contracts, is aware that shareholders in the fund have a broad range of investment choices available to them, including a wide choice among mutual funds offered by Fidelity's competitors, and that the fund's shareholders, with the opportunity to review and weigh the disclosure provided by the fund in its prospectus and other public disclosures, have chosen to invest in this fund, managed by Fidelity.
Nature, Extent, and Quality of Services Provided. The Board considered the staffing within the investment adviser, FMR, and the sub-advisers (together, the Investment Advisers), including the backgrounds of the fund's investment personnel and the fund's investment objective and discipline. The Independent Trustees also had discussions with senior management of Fidelity's investment operations and investment groups. The Board considered the structure of the portfolio manager compensation program and whether this structure provides appropriate incentives to act in the best interest of the fund.
Resources Dedicated to Investment Management and Support Services. The Board and the equity research subcommittee of the Board's Fund Oversight Committee reviewed the size, education, and experience of the Investment Advisers' investment staff, their use of technology, and the Investment Advisers' approach to recruiting, training, and retaining portfolio managers and other research, advisory, and management personnel. The Board noted that Fidelity's analysts have access to a variety of technological tools and market and securities data that enable them to perform both fundamental and quantitative analysis and to specialize in various disciplines. The Board considered Fidelity's extensive global research capabilities that enable the Investment Advisers to aggregate data from various sources in an effort to produce positive investment results. The Board also considered that Fidelity's portfolio managers and analysts have access to daily portfolio attribution that allows for monitoring of a fund's portfolio, as well as an electronic communication system that provides immediate real-time access to research concerning issuers and credit enhancers. The Board noted FMR's continued focus on strengthening the organization and discipline of equity portfolio management and research.
Shareholder and Administrative Services. The Board considered (i) the nature, extent, quality, and cost of advisory, administrative, and shareholder services performed by the Investment Advisers and their affiliates under the Advisory Contracts and under separate agreements covering transfer agency, pricing and bookkeeping, and securities lending services for the fund; (ii) the nature and extent of the investment adviser's supervision of third party service providers, principally custodians and subcustodians; and (iii) the resources devoted to, and the record of compliance with, the fund's compliance policies and procedures. The Board also reviewed the allocation of fund brokerage, including allocations to brokers affiliated with the Investment Advisers, the use of brokerage commissions to pay fund expenses, and the use of "soft" commission dollars to pay for research services.
The Board noted that the growth of fund assets over time across the complex allows Fidelity to reinvest in the development of services designed to enhance the value or convenience of the Fidelity funds as investment vehicles. These services include 24-hour access to account information and market information through phone representatives and over the Internet, and investor education materials and asset allocation tools.
Investment in a Large Fund Family. The Board considered the benefits to shareholders of investing in a Fidelity fund, including the benefits of investing in a fund that is part of a large family of funds offering a variety of investment disciplines and providing a large variety of mutual fund investor services. The Board noted that Fidelity had taken, or had made recommendations that resulted in the Fidelity funds taking, a number of actions over the previous year that benefited particular funds, including (i) dedicating additional resources to investment research and restructuring and broadening the focus of the investment research teams; (ii) bolstering the senior management team that oversees asset management; (iii) launching Class F of certain funds as a lower-fee class available to Freedom K and Freedom Index Funds; (iv) lowering the initial investment minimums and ongoing balance requirements for Real Estate High Income Fund; (v) eliminating subsequent purchase minimums for all funds and adding a waiver of the investment minimum requirement for new accounts opened with the proceeds of a systematic withdrawal plan; (vi) eliminating the withdrawal minimum and maximum limits for systematic withdrawals from Advisor funds; (vii) expanding sales load waivers on Class A shares for Destiny Planholders and expanding Institutional Class eligibility for Class O Destiny Planholders; and (viii) changing certain Class A and Class T sales charge structures to further align them with industry practices.
Annual Report
Board Approval of Investment Advisory Contracts and Management Fees - continued
Investment Performance. The Board considered whether the fund has operated in accordance with its investment objective, as well as its record of compliance with its investment restrictions. It also reviewed the fund's absolute investment performance for each class, as well as the fund's relative investment performance for each class measured over multiple periods against a broad-based securities market index. The Board noted that FMR does not believe that a meaningful peer group exists against which to compare the fund's performance. The following charts considered by the Board show, over the one-, three-, and five-year periods ended December 31, 2009, as available, the cumulative total returns of the retail class and Class B of the fund and the cumulative total returns of a broad-based securities market index ("benchmark"). The returns of the retail class and Class B show the performance of the highest performing class (based on five-year performance) and the lowest performing class (based on one-year performance), respectively.
Fidelity China Region Fund

The Board noted that the investment performance of the retail class of the fund compared favorably to its benchmark for the three- and five-year periods, although the fund's one-year cumulative total return was lower than its benchmark. The Board considered that the variations in performance among the fund's classes reflect the variations in class expenses, which result in lower performance for higher expense classes. The Board also reviewed the fund's performance since inception as well as performance in the current year.
Based on its review, and giving particular weight to the nature and quality of the resources dedicated by the Investment Advisers to maintain and improve relative performance and factoring in the unprecedented market events in recent years, the Board concluded that the nature, extent, and quality of investment management and support services and of shareholder and administrative services provided to the fund will benefit the fund's shareholders, particularly in light of the Board's view that the fund's shareholders benefit from investing in a fund that is part of a large family of funds offering a variety of investment disciplines and services.
Competitiveness of Management Fee and Total Fund Expenses. The Board considered the fund's management fee and total expenses compared to "mapped groups" of competitive funds and classes. Fidelity creates "mapped groups" by combining similar Lipper investment objective categories that have comparable management fee characteristics. Combining Lipper investment objective categories aids the Board's management fee and total expense comparisons by broadening the competitive group used for comparison and by reducing the number of universes to which various Fidelity funds are compared.
Annual Report
Management Fee. The Board considered two proprietary management fee comparisons for the 12-month periods shown in the chart below. The group of Lipper funds used by the Board for management fee comparisons is referred to below as the "Total Mapped Group." The Total Mapped Group comparison focuses on a fund's standing relative to the total universe of comparable funds available to investors, in terms of gross management fees before expense reimbursements or caps. "TMG %" represents the percentage of funds in the Total Mapped Group that had management fees that were lower than the fund's. For example, a TMG % of 7% means that 93% of the funds in the Total Mapped Group had higher management fees than the fund. The "Asset-Size Peer Group" (ASPG) comparison focuses on a fund's standing relative to non-Fidelity funds similar in size to the fund within the Total Mapped Group. The ASPG represents at least 15% of the funds in the Total Mapped Group with comparable asset size and management fee characteristics, subject to a minimum of 50 funds (or all funds in the Total Mapped Group if fewer than 50). Additional information, such as the ASPG quartile in which the fund's management fee ranked, is also included in the chart and considered by the Board.
Fidelity China Region Fund

The Board noted that the fund's management fee ranked below the median of its Total Mapped Group and below the median of its ASPG for 2009.
Based on its review, the Board concluded that the fund's management fee is fair and reasonable in light of the services that the fund receives and the other factors considered.
Total Expenses. In its review of each class's total expenses, the Board considered the fund's management fee as well as other fund or class expenses, as applicable, such as transfer agent fees, pricing and bookkeeping fees, fund-paid 12b-1 fees, and custodial, legal, and audit fees. The Board also noted the effects of any waivers and reimbursements on fees and expenses. As part of its review, the Board also considered current and historical total expenses of each class of the fund compared to competitive fund median expenses. Each class of the fund is compared to those funds and classes in the Total Mapped Group (used by the Board for management fee comparisons) that have a similar sales load structure.
The Board noted that the total expenses of each class ranked below its competitive median for 2009.
Fees Charged to Other Fidelity Clients. The Board also considered Fidelity fee structures and other information with respect to clients of FMR and its affiliates, such as other mutual funds advised or subadvised by FMR or its affiliates, pension plan clients, and other institutional clients. In March 2010, the Board created an ad hoc joint committee with the board of other Fidelity funds (the Committee) to review and compare Fidelity's institutional investment advisory business with its business of providing services to the Fidelity funds, including the differences in services provided, fees charged, and costs incurred, as well as competition in their respective marketplaces.
Based on its review of total expenses and fees charged to other Fidelity clients, the Board concluded that the total expenses of each class of the fund were reasonable in light of the services that the fund and its shareholders receive and the other factors considered, including the findings of the Committee.
Costs of the Services and Profitability. The Board considered the revenues earned and the expenses incurred by Fidelity in conducting the business of developing, marketing, distributing, managing, administering and servicing the fund and its shareholders. The Board also considered the level of Fidelity's profits in respect of all the Fidelity funds.
Annual Report
Board Approval of Investment Advisory Contracts and Management Fees - continued
On an annual basis, FMR presents to the Board Fidelity's profitability for the fund. Fidelity calculates the profitability for each fund, as well as aggregate profitability for groups of Fidelity funds and all Fidelity funds, using a series of detailed revenue and cost allocation methodologies which originate with the audited books and records of Fidelity. The Audit Committee of the Board reviews any significant changes from the prior year's methodologies.
PricewaterhouseCoopers LLP (PwC), independent registered public accounting firm and auditor to Fidelity and certain Fidelity funds, has been engaged annually by the Board as part of the Board's assessment of Fidelity's profitability analysis. PwC's engagement includes the review and assessment of Fidelity's methodologies used in determining the revenues and expenses attributable to Fidelity's mutual fund business, and completion of agreed-upon procedures surrounding the mathematical accuracy of fund profitability and its conformity to allocation methodologies. After considering PwC's reports issued under the engagement and information provided by Fidelity, the Board believes that while other allocation methods may also be reasonable, Fidelity's profitability methodologies are reasonable in all material respects.
The Board has also reviewed Fidelity's non-fund businesses and fall-out benefits related to the mutual fund business as well as cases where Fidelity's affiliates may benefit from or be related to the fund's business.
The Board considered the costs of the services provided by and the profits realized by Fidelity in connection with the operation of the fund and were satisfied that the profitability was not excessive in the circumstances.
Economies of Scale. The Board considered whether there have been economies of scale in respect of the management of the Fidelity funds, whether the Fidelity funds (including the fund) have appropriately benefited from any such economies of scale, and whether there is potential for realization of any further economies of scale. The Board considered the extent to which the fund will benefit from economies of scale through increased services to the fund, through waivers or reimbursements, or through fee or expense reductions.
In February 2009, the Board and the board of other Fidelity funds created an ad hoc committee (the Economies of Scale Committee) to analyze whether FMR attains economies of scale in respect of the management and servicing of the Fidelity funds, whether the Fidelity funds have appropriately benefited from such economies of scale, and whether there is potential for realization of any further economies of scale.
The Board recognized that the fund's management contract incorporates a "group fee" structure, which provides for lower group fee rates as total fund assets under FMR's management increase, and for higher group fee rates as total fund assets under FMR's management decrease. FMR calculates the group fee rates based on a tiered asset "breakpoint" schedule that varies based on asset class. The Board considered that the group fee is designed to deliver the benefits of economies of scale to fund shareholders when total Fidelity fund assets increase, even if assets of any particular fund are unchanged or have declined, because some portion of Fidelity's costs are attributable to services provided to all Fidelity funds, and all funds benefit if those costs can be allocated among more assets. The Board concluded that, given the group fee structure, fund shareholders will benefit from lower management fees as assets under FMR's management increase at the fund complex level, regardless of whether Fidelity achieves any such economies of scale.
The Board concluded, considering the findings of the Economies of Scale Committee, that any potential economies of scale are being appropriately shared between fund shareholders and Fidelity.
Additional Information Requested by the Board. In order to develop fully the factual basis for consideration of the Fidelity funds' Advisory Contracts, the Board requested and received additional information on certain topics, including (i) fund performance trends, actions to be taken by FMR to improve certain funds' overall performance, and Fidelity's long-term strategies for certain funds; (ii) portfolio manager changes that have occurred during the past year and length of portfolio manager tenure for different categories of funds over time; (iii) Fidelity's compensation structure for portfolio managers, research analysts, and other key personnel, the rationale for the compensation structure, and how the compensation structure provides appropriate performance incentives; (iv) the amount of the investment that each portfolio manager has made in the Fidelity fund(s) that he or she manages; (v) management and other fees paid by FMR to affiliated sub-advisers on behalf of the Fidelity funds; (vi) Fidelity's fee structures and rationale for recommending different fees among different categories of funds; (vii) Fidelity's rationale for recommending which funds should have a performance adjustment component as part of their management fees; (viii) the rationale for any differences between fund fee structures and fee structures in place for other Fidelity clients; and (ix) explanations regarding the relative total expenses borne by certain funds and classes, total expense competitive trends, and actions that might be taken by FMR to reduce total expenses for certain funds and classes.
Based on its evaluation of all of the conclusions noted above, and after considering all factors it believed relevant, the Board ultimately concluded that the advisory fee structures are fair and reasonable, and that the fund's Advisory Contracts should be renewed.
Annual Report
Investment Adviser
Fidelity Management & Research Company
Boston, MA
Investment Sub-Advisers
FMR Co., Inc.
Fidelity Management & Research
(U.K.) Inc.
Fidelity Research & Analysis Company
FIL Investments (Japan) Limited
FIL Investment Advisors
FIL Investment Advisors
(U.K.) Ltd.
Fidelity Management & Research
(Japan) Inc.
Fidelity Management & Research
(Hong Kong) Limited
General Distributor
Fidelity Distributors Corporation
Boston, MA
Transfer and Service Agents
Fidelity Investments Institutional
Operations Company, Inc.
Boston, MA
Fidelity Service Company, Inc.
Boston, MA
Custodian
Brown Brothers Harriman & Co.,
Boston, MA
AHKC-UANN-1210
1.861458.102
Fidelity AdvisorSM
China Region Fund -
Institutional Class
Annual Report
October 31, 2010
Institutional Class is a class of
Fidelity® China Region Fund
(2_fidelity_logos) (Registered_Trademark)
Contents
Chairman's Message | <Click Here> | The Chairman's message to shareholders. |
Performance | <Click Here> | How the fund has done over time. |
Management's Discussion of Fund Performance | <Click Here> | The Portfolio Manager's review of fund performance and strategy. |
Shareholder Expense Example | <Click Here> | An example of shareholder expenses. |
Investment Changes | <Click Here> | A summary of major shifts in the fund's investments over the past six months. |
Investments | <Click Here> | A complete list of the fund's investments with their market values. |
Financial Statements | <Click Here> | Statements of assets and liabilities, operations, and changes in net assets, as well as financial highlights. |
Notes | <Click Here> | Notes to the financial statements. |
Report of Independent Registered Public Accounting Firm | <Click Here> | |
Trustees and Officers | <Click Here> | |
Distributions | <Click Here> | |
Board Approval of Investment Advisory Contracts and Management Fees | <Click Here> | |
To view a fund's proxy voting guidelines and proxy voting record for the 12-month period ended June 30, visit http://www.fidelity.com/proxyvotingresults or visit the Securities and Exchange Commission's (SEC) web site at http://www.sec.gov. You may also call 1-877-208-0098 to request a free copy of the proxy voting guidelines.
Standard & Poor's, S&P and S&P 500 are registered service marks of The McGraw-Hill Companies, Inc. and have been licensed for use by Fidelity Distributors Corporation.
Other third party marks appearing herein are the property of their respective owners.
All other marks appearing herein are registered or unregistered trademarks or service marks of FMR LLC or an affiliated company.
This report and the financial statements contained herein are submitted for the general information of the shareholders of the fund. This report is not authorized for distribution to prospective investors in the fund unless preceded or accompanied by an effective prospectus.
A fund files its complete schedule of portfolio holdings with the SEC for the first and third quarters of each fiscal year on Form N-Q. Forms N-Q are available on the SEC's web site at http://www.sec.gov. A fund's Forms N-Q may be reviewed and copied at the SEC's Public Reference Room in Washington, DC. Information regarding the operation of the SEC's Public Reference Room may be obtained by calling 1-800-SEC-0330. For a complete list of a fund's portfolio holdings, view the most recent holdings listing, semiannual report, or annual report on Fidelity's web site at http://www.fidelity.com or http://www.advisor.fidelity.com, as applicable.
NOT FDIC INSURED • MAY LOSE VALUE • NO BANK GUARANTEE
Neither the fund nor Fidelity Distributors Corporation is a bank.
Annual Report
(photo_of_Edward_C_Johnson_3d)
Dear Shareholder:
Equities have staged a rally in the second half of 2010, shaking off concerns about the European debt crisis and the possibility of a double-dip recession in the U.S. Although the short-term surge pushed major equity indexes back into positive territory for the year, several questions remain about the longer-term outlook, including lackluster economic growth and persistently high unemployment. Financial markets are always unpredictable, of course, but there also are several time-tested investment principles that can help put the odds in your favor.
One of the basic tenets is to invest for the long term. Over time, riding out the markets' inevitable ups and downs has proven much more effective than selling into panic or chasing the hottest trend. Even missing only a few of the markets' best days can significantly diminish investor returns. Patience also affords the benefits of compounding - of earning interest on additional income or reinvested dividends and capital gains. There can be tax advantages and cost benefits to consider as well. While staying the course doesn't eliminate risk, it can considerably lessen the effect of short-term declines.
You can further manage your investing risk through diversification. And today, more than ever, geographic diversification should be taken into account. Studies indicate that asset allocation is the single most important determinant of a portfolio's long-term success. The right mix of stocks, bonds and cash - aligned to your particular risk tolerance and investment objective - is very important. Age-appropriate rebalancing is also an essential aspect of asset allocation. For younger investors, an emphasis on equities - which historically have been the best-performing asset class over time - is encouraged. As investors near their specific goal, such as retirement or sending a child to college, consideration may be given to replacing volatile assets (e.g. common stocks) with more-stable fixed investments (bonds or savings plans).
A third principle - investing regularly - can help lower the average cost of your purchases. Investing a certain amount of money each month or quarter helps ensure you won't pay for all your shares at market highs. This strategy - known as dollar cost averaging - also reduces "emotion" from investing, helping shareholders avoid selling weak performers just prior to an upswing, or chasing a hot performer just before a correction.
We invite you to contact us via the Internet, through our Investor Centers or by phone. It is our privilege to provide you the information you need to make the investments that are right for you.
Sincerely,
(The chairman's signature appears here.)
Edward C. Johnson 3d
Annual Report
Average annual total return reflects the change in the value of an investment, assuming reinvestment of the class' distributions from dividend income and capital gains (the profits earned upon the sale of securities that have grown in value, if any) and assuming a constant rate of performance each year. The $10,000 table and the fund's returns do not reflect the deduction of taxes that a shareholder would pay on fund distributions or the redemption of fund shares. During periods of reimbursement by Fidelity, a fund's total return will be greater than it would be had the reimbursement not occurred. How a fund did yesterday is no guarantee of how it will do tomorrow.
Average Annual Total Returns
Periods ended October 31, 2010 | Past 1
year | Past 5
years | Past 10
years |
Institutional Class A | 20.92% | 16.81% | 11.02% |
A The initial offering of Institutional Class shares took place on May 9, 2008. Returns prior to May 9, 2008 are those of Fidelity® China Region Fund, the original class of the fund.
$10,000 Over 10 Years
Let's say hypothetically that $10,000 was invested in Fidelity AdvisorSM China Region Fund - Institutional Class on October 31, 2000. The chart shows how the value of your investment would have changed, and also shows how the MSCI® Golden Dragon Index performed over the same period. The initial offering of Institutional Class took place on May 9, 2008. See above for additional information regarding the performance of Institutional Class.
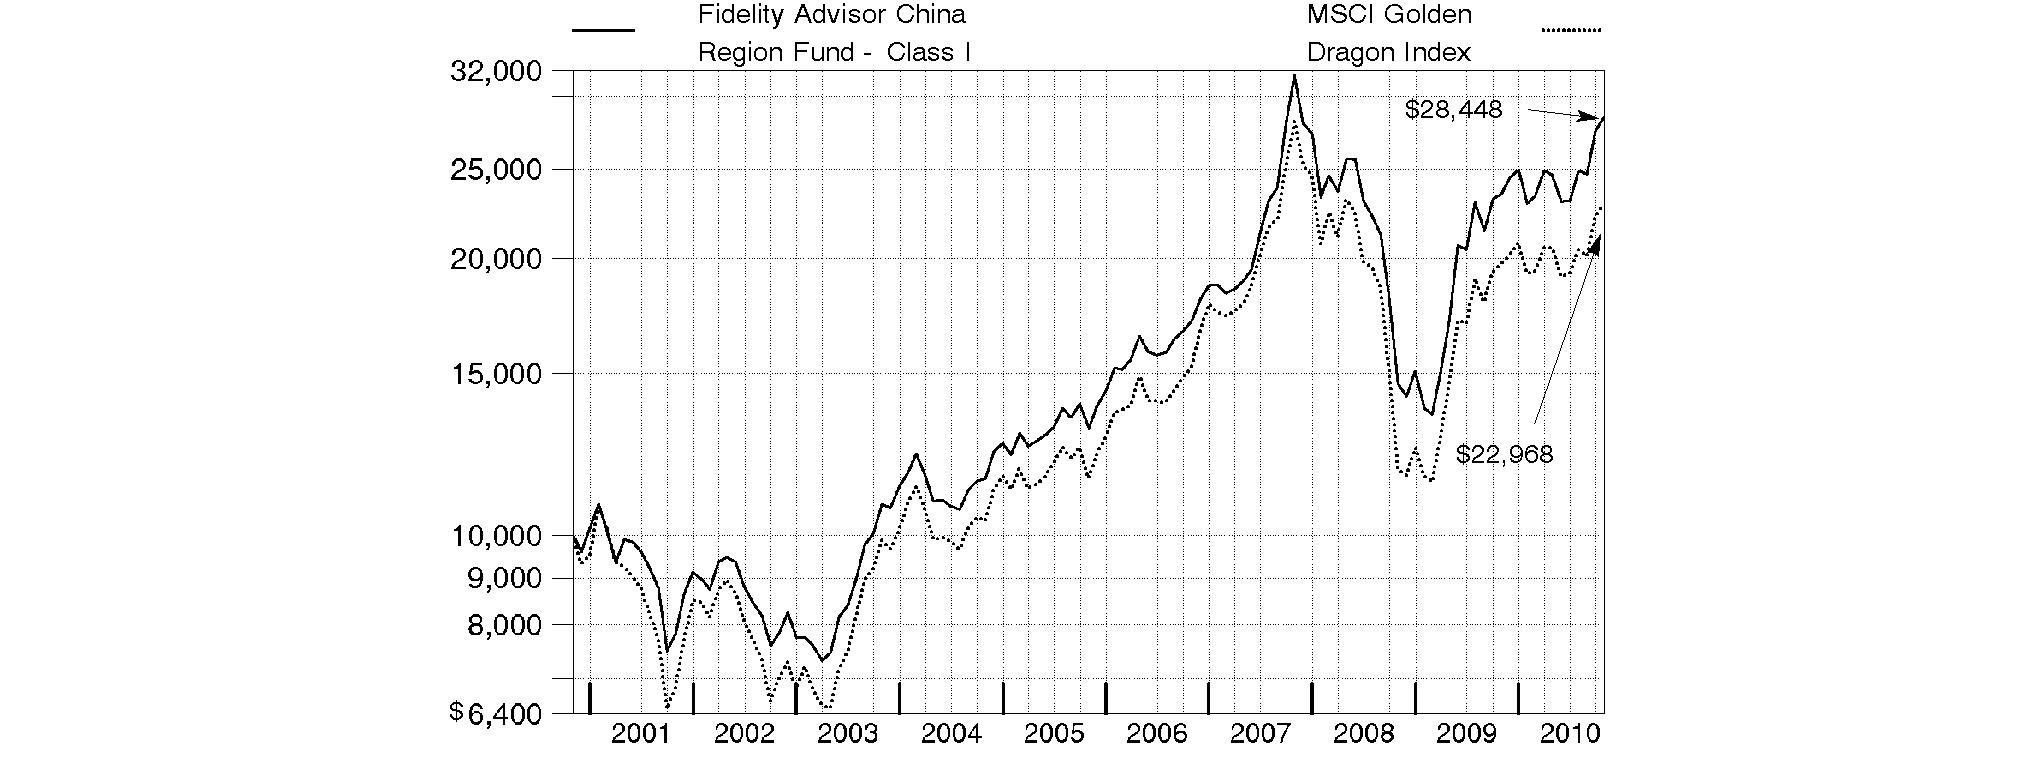
Annual Report
Market Recap: International stocks rode a wave of volatility similar to that of their U.S. counterparts during the 12 months ending October 31, 2010. Stocks gained modestly in the first half of the period, despite growing concerns about the European debt crisis. Sentiment turned decidedly negative in May and June, however, and the market suffered a precipitous decline. These losses were more than offset during the last four months of the period, when signs of economic growth and subsiding debt fears helped propel international stocks about 21%. For the full year, the MSCI® ACWI® (All Country World Index) ex USA Index gained 12.76%, boosted in part by a generally depreciating U.S. dollar. Within the index, Canada and emerging markets were standouts, returning 23% and 24%, respectively. Results in the latter group were led by strong-performing India, Mexico and South Africa, while China fell short of the MSCI benchmark due to cooling economic growth. The developed Asia ex Japan segment rose 16% for the period, lifted by solid results from Singapore and Hong Kong. Meanwhile, Europe rose just 9%, held back mainly by debt-riddled Spain and Italy, as well as lagging major constituent France. Japan returned only 5%, a result of that nation's continued weak economy.
Comments from Joseph Tse, who became Portfolio Manager of Fidelity AdvisorSM China Region Fund on January 19, 2010: During the past year, the fund's Institutional Class shares returned 20.92%, versus 16.14% for the MSCI Golden Dragon Index. Stock picking and an overweighting in consumer discretionary aided relative performance, as did stock selection in information technology, industrials, health care and financials, among other sectors. Geographically, security selection in China and Hong Kong added value. The largest relative contributor was China Shineway Pharmaceutical Group, as better-than-expected sales lifted the stock, which was sold from the fund. Other contributors included BOC Hong Kong and Chinese online travel services provider Ctrip.com International, an out-of-benchmark holding. Underweighting and ultimately selling Hong Kong apparel wholesaler/retailer Esprit Holdings also added value. Conversely, underweighting Taiwan's Nan Ya Plastics detracted, as did not owning Taiwan-based index component Formosa Chemicals & Fibre. Underweighting Hong Kong shoe manufacturer/retailer Belle International Holdings also hurt.
Note to shareholders: Fidelity Advisor China Region Fund may invest up to 35% of its total assets in any industry that represents more than 20% of the Hong Kong, Taiwanese and Chinese market. As of October 31, 2010, the fund did not have more than 25% of its total assets invested in any one industry.
The views expressed above reflect those of the portfolio manager(s) only through the end of the period as stated on the cover of this report and do not necessarily represent the views of Fidelity or any other person in the Fidelity organization. Any such views are subject to change at any time based upon market or other conditions and Fidelity disclaims any responsibility to update such views. These views may not be relied on as investment advice and, because investment decisions for a Fidelity fund are based on numerous factors, may not be relied on as an indication of trading intent on behalf of any Fidelity fund.
Annual Report
Fidelity China Region Fund
Shareholder Expense Example
As a shareholder of the Fund, you incur two types of costs: (1) transaction costs, including sales charges (loads) on purchase payments or redemption proceeds, redemption fees, and (2) ongoing costs, including management fees, distribution and/or service (12b-1) fees and other Fund expenses. This Example is intended to help you understand your ongoing costs (in dollars) of investing in the Fund and to compare these costs with the ongoing costs of investing in other mutual funds.
The Example is based on an investment of $1,000 invested at the beginning of the period and held for the entire period (May 1, 2010 to October 31, 2010).
Actual Expenses
The first line of the accompanying table for each class of the Fund provides information about actual account values and actual expenses. You may use the information in this line, together with the amount you invested, to estimate the expenses that you paid over the period. Simply divide your account value by $1,000.00 (for example, an $8,600 account value divided by $1,000.00 = 8.6), then multiply the result by the number in the first line for a class of the Fund under the heading entitled "Expenses Paid During Period" to estimate the expenses you paid on your account during this period. A small balance maintenance fee of $12.00 that is charged once a year may apply for certain accounts with a value of less than $2,000. This fee is not included in the table below. If it was, the estimate of expenses you paid during the period would be higher, and your ending account value lower, by this amount. In addition, the Fund, as a shareholder in the underlying Fidelity Central Funds, will indirectly bear its pro-rata share of the fees and expenses incurred by the underlying Fidelity Central Funds. These fees and expenses are not included in the Fund's annualized expense ratio used to calculate the expense estimate in the table below.
Hypothetical Example for Comparison Purposes
The second line of the accompanying table for each class of the Fund provides information about hypothetical account values and hypothetical expenses based on a Class' actual expense ratio and an assumed rate of return of 5% per year before expenses, which is not the Class' actual return. The hypothetical account values and expenses may not be used to estimate the actual ending account balance or expenses you paid for the period. You may use this information to compare the ongoing costs of investing in the Fund and other funds. To do so, compare this 5% hypothetical example with the 5% hypothetical examples that appear in the shareholder reports of the other funds. A small balance maintenance fee of $12.00 that is charged once a year may apply for certain accounts with a value of less than $2,000. This fee is not included in the table below. If it was, the estimate of expenses you paid during the period would be higher, and your ending account value lower, by this amount. In addition, the Fund, as a shareholder in the underlying Fidelity Central Funds, will indirectly bear its pro-rata share of the fees and expenses incurred by the underlying Fidelity Central Funds. These fees and expenses are not included in the Fund's annualized expense ratio used to calculate the expense estimate in the table below.
Please note that the expenses shown in the table are meant to highlight your ongoing costs only and do not reflect any transaction costs. Therefore, the second line of the table is useful in comparing ongoing costs only, and will not help you determine the relative total costs of owning different funds. In addition, if these transactional costs were included, your costs would have been higher.
| Annualized
Expense Ratio | Beginning
Account Value
May 1, 2010 | Ending
Account Value
October 31, 2010 | Expenses Paid
During Period*
May 1, 2010 to
October 31, 2010 |
Class A | 1.37% | | | |
Actual | | $ 1,000.00 | $ 1,152.80 | $ 7.43 |
HypotheticalA | | $ 1,000.00 | $ 1,018.30 | $ 6.97 |
Class T | 1.63% | | | |
Actual | | $ 1,000.00 | $ 1,151.40 | $ 8.84 |
HypotheticalA | | $ 1,000.00 | $ 1,016.99 | $ 8.29 |
Class B | 2.12% | | | |
Actual | | $ 1,000.00 | $ 1,148.60 | $ 11.48 |
HypotheticalA | | $ 1,000.00 | $ 1,014.52 | $ 10.76 |
Class C | 2.12% | | | |
Actual | | $ 1,000.00 | $ 1,148.80 | $ 11.48 |
HypotheticalA | | $ 1,000.00 | $ 1,014.52 | $ 10.76 |
China Region | 1.06% | | | |
Actual | | $ 1,000.00 | $ 1,154.60 | $ 5.76 |
HypotheticalA | | $ 1,000.00 | $ 1,019.86 | $ 5.40 |
Institutional Class | 1.08% | | | |
Actual | | $ 1,000.00 | $ 1,154.70 | $ 5.87 |
HypotheticalA | | $ 1,000.00 | $ 1,019.76 | $ 5.50 |
A 5% return per year before expenses
* Expenses are equal to each Class' annualized expense ratio, multiplied by the average account value over the period, multiplied by 184/365 (to reflect the one-half year period).
Annual Report
Fidelity China Region Fund
Investment Changes (Unaudited)
Geographic Diversification (% of fund's net assets) |
As of October 31, 2010 |
| Hong Kong | 32.0% | |
| China | 31.3% | |
| Taiwan | 18.3% | |
| Cayman Islands | 8.5% | |
| Bermuda | 4.3% | |
| United States of America | 3.5% | |
| Japan | 1.0% | |
| United Kingdom | 0.8% | |
| Singapore | 0.2% | |
| Other | 0.1% | |

Percentages are adjusted for the effect of futures contracts, if applicable. |
As of April 30, 2010 |
| China | 37.2% | |
| Hong Kong | 28.0% | |
| Taiwan | 18.7% | |
| Cayman Islands | 9.1% | |
| Bermuda | 5.2% | |
| United States of America | 1.2% | |
| Canada | 0.2% | |
| Japan | 0.2% | |
| British Virgin Islands | 0.2% | |

Percentages are adjusted for the effect of futures contracts, if applicable. |
Asset Allocation |
| % of fund's
net assets | % of fund's net assets
6 months ago |
Stocks | 96.6 | 99.1 |
Short-Term Investments and Net Other Assets | 3.4 | 0.9 |
Top Ten Stocks as of October 31, 2010 |
| % of fund's
net assets | % of fund's net assets
6 months ago |
CNOOC Ltd. (Oil, Gas & Consumable Fuels) | 3.6 | 3.2 |
China Construction Bank Corp. (H Shares) (Commercial Banks) | 3.4 | 3.9 |
Hong Kong Exchanges and Clearing Ltd. (Diversified Financial Services) | 3.3 | 2.7 |
Tencent Holdings Ltd. (Internet Software & Services) | 3.2 | 3.7 |
Industrial & Commercial Bank of China Ltd. (H Shares) (Commercial Banks) | 3.2 | 3.5 |
BOC Hong Kong (Holdings) Ltd. (Commercial Banks) | 3.1 | 2.4 |
Bank of China Ltd. (H Shares) (Commercial Banks) | 2.8 | 3.3 |
Hon Hai Precision Industry Co. Ltd. (Foxconn) (Electronic Equipment & Components) | 2.8 | 3.8 |
China Life Insurance Co. Ltd. (H Shares) (Insurance) | 2.7 | 3.4 |
China Mobile (Hong Kong) Ltd. (Wireless Telecommunication Services) | 2.5 | 2.7 |
| 30.6 | |
Market Sectors as of October 31, 2010 |
| % of fund's
net assets | % of fund's net assets
6 months ago |
Financials | 41.3 | 37.6 |
Information Technology | 15.0 | 20.1 |
Consumer Discretionary | 9.9 | 8.9 |
Industrials | 8.5 | 9.9 |
Energy | 7.3 | 8.2 |
Consumer Staples | 5.2 | 4.1 |
Materials | 4.7 | 3.6 |
Telecommunication Services | 4.3 | 4.2 |
Utilities | 0.2 | 0.9 |
Health Care | 0.2 | 1.6 |
Annual Report
Fidelity China Region Fund
Investments October 31, 2010
Showing Percentage of Net Assets
Common Stocks - 96.6% |
| Shares | | Value |
CONSUMER DISCRETIONARY - 9.9% |
Auto Components - 0.4% |
Minth Group Ltd. | 4,938,000 | | $ 9,237,349 |
Automobiles - 1.3% |
Brilliance China Automotive Holdings Ltd. (a) | 14,406,000 | | 12,638,065 |
BYD Co. Ltd. (H Shares) (d) | 1,725,800 | | 10,520,116 |
Dongfeng Motor Group Co. Ltd. (H Shares) | 2,470,000 | | 5,353,459 |
| | 28,511,640 |
Distributors - 2.0% |
Li & Fung Ltd. | 8,042,000 | | 42,486,038 |
Diversified Consumer Services - 0.1% |
New Oriental Education & Technology Group, Inc. sponsored ADR (a)(d) | 22,616 | | 2,428,280 |
Hotels, Restaurants & Leisure - 2.8% |
Country Style Cooking Restaurant Chain Co. Ltd. ADR | 3,600 | | 106,416 |
Ctrip.com International Ltd. sponsored ADR (a) | 477,500 | | 24,863,425 |
Las Vegas Sands Corp. (a) | 57,200 | | 2,624,336 |
Melco International Development Ltd. (a) | 5,970,000 | | 3,388,873 |
Melco PBL Entertainment (Macau) Ltd. sponsored ADR (a) | 370,000 | | 2,319,900 |
Sands China Ltd. | 2,808,800 | | 6,124,008 |
Shangri-La Asia Ltd. | 2,966,000 | | 6,673,380 |
SJM Holdings Ltd. | 9,928,000 | | 14,755,112 |
| | 60,855,450 |
Household Durables - 0.2% |
Techtronic Industries Co. Ltd. | 4,157,000 | | 4,209,960 |
Multiline Retail - 1.5% |
Far East Department Stores Co. Ltd. | 14,363,615 | | 17,834,255 |
Golden Eagle Retail Group Ltd. (H Shares) | 2,596,000 | | 6,899,223 |
Maoye International Holdings Ltd. | 18,043,000 | | 7,774,697 |
| | 32,508,175 |
Specialty Retail - 1.1% |
Belle International Holdings Ltd. | 5,574,000 | | 10,067,538 |
Chow Sang Sang Holdings International Ltd. | 2,746,000 | | 7,227,015 |
GOME Electrical Appliances Holdings Ltd. (a) | 6,666,000 | | 2,244,575 |
I.T Ltd. | 5,492,000 | | 4,633,792 |
| | 24,172,920 |
Textiles, Apparel & Luxury Goods - 0.5% |
Anta Sports Products Ltd. | 2,467,000 | | 5,092,340 |
Trinity Ltd. | 4,310,000 | | 4,309,305 |
| | 9,401,645 |
TOTAL CONSUMER DISCRETIONARY | | 213,811,457 |
|
| Shares | | Value |
CONSUMER STAPLES - 5.2% |
Beverages - 0.1% |
Wuliangye Yibin Co. Ltd. (BNP Paribas Warrant Program) warrants 5/5/15 (a) | 578,000 | | $ 3,162,589 |
Food & Staples Retailing - 1.7% |
Beijing Jingkelong Co. Ltd. (H Shares) | 1,226,000 | | 1,470,963 |
China Resources Enterprise Ltd. | 1,936,000 | | 8,179,842 |
Dairy Farm International Holdings Ltd. | 2,642,400 | | 20,610,720 |
Lianhua Supermarket Holdings Co. (H Shares) | 785,000 | | 3,342,042 |
Wumart Stores, Inc. (H Shares) | 1,338,000 | | 3,141,635 |
| | 36,745,202 |
Food Products - 2.4% |
Asian Citrus Holdings Ltd. | 5,805,803 | | 6,688,705 |
Besunyen Holdings Co. Ltd. | 25,440,000 | | 12,143,590 |
China Agri-Industries Holding Ltd. | 3,147,000 | | 4,579,669 |
China Huiyuan Juice Group Ltd. | 3,283,000 | | 2,202,432 |
China Mengniu Dairy Co. Ltd. | 2,326,000 | | 6,661,790 |
Tingyi (Cayman Islands) Holding Corp. | 3,536,000 | | 9,625,493 |
Want Want China Holdings Ltd. | 5,577,000 | | 5,144,403 |
Yashili International Holdings Ltd. | 8,021,000 | | 4,346,164 |
| | 51,392,246 |
Household Products - 0.3% |
NVC Lighting Holdings Ltd. | 10,667,000 | | 5,463,376 |
Personal Products - 0.7% |
Hengan International Group Co. Ltd. | 1,655,500 | | 15,591,227 |
TOTAL CONSUMER STAPLES | | 112,354,640 |
ENERGY - 7.3% |
Oil, Gas & Consumable Fuels - 7.3% |
China Coal Energy Co. Ltd. (H Shares) | 1,242,000 | | 2,147,112 |
China Petroleum & Chemical Corp. (H Shares) | 32,506,000 | | 30,928,266 |
CNOOC Ltd. | 37,343,000 | | 77,961,654 |
CNPC (Hong Kong) Ltd. | 9,330,000 | | 11,868,254 |
PetroChina Co. Ltd. (H Shares) | 24,580,000 | | 30,256,374 |
Sino Prosper State Gold Resources Holdings, Ltd. (a) | 79,350,000 | | 3,992,453 |
| | 157,154,113 |
FINANCIALS - 41.3% |
Capital Markets - 1.5% |
Citic Securities Co. Ltd. (UBS Warrant Programme) warrants 9/16/13 (a) | 3,008,600 | | 6,995,171 |
Wuliangye Yibin Co. Ltd. (UBS Warrant Programme) warrants 4/22/13 (a) | 345,100 | | 1,888,252 |
Yuanta Financial Holding Co. Ltd. | 38,078,000 | | 23,950,384 |
| | 32,833,807 |
Commercial Banks - 17.2% |
Bank of China Ltd. (H Shares) | 102,083,000 | | 61,108,224 |
BOC Hong Kong (Holdings) Ltd. | 21,653,500 | | 67,883,251 |
Common Stocks - continued |
| Shares | | Value |
FINANCIALS - continued |
Commercial Banks - continued |
China Construction Bank Corp. (H Shares) | 77,268,000 | | $ 73,666,895 |
China Merchants Bank Co. Ltd. (H Shares) | 7,761,464 | | 22,028,990 |
Chinatrust Financial Holding Co. Ltd. | 7,410,335 | | 4,624,650 |
E.Sun Financial Holdings Co. Ltd. | 9,287,652 | | 4,779,628 |
Hang Seng Bank Ltd. | 1,921,700 | | 28,114,276 |
HSBC Holdings PLC (Hong Kong) | 413,600 | | 4,311,132 |
Industrial & Commercial Bank of China (Asia) Ltd. | 2,163,000 | | 8,008,786 |
Industrial & Commercial Bank of China Ltd. (H Shares) | 84,726,000 | | 68,207,094 |
Mega Financial Holding Co. Ltd. | 8,480,000 | | 5,887,927 |
Standard Chartered PLC: | | | |
rights 11/5/10 (a) | 42,845 | | 360,725 |
(United Kingdom) | 432,898 | | 12,522,362 |
Wing Hang Bank Ltd. | 819,500 | | 9,578,674 |
| | 371,082,614 |
Diversified Financial Services - 4.7% |
China Everbright Ltd. | 5,418,000 | | 14,084,528 |
Fubon Financial Holding Co. Ltd. | 13,011,985 | | 15,943,455 |
Hong Kong Exchanges and Clearing Ltd. | 3,217,600 | | 70,817,295 |
| | 100,845,278 |
Insurance - 7.2% |
Cathay Financial Holding Co. Ltd. | 16,430,400 | | 25,151,585 |
China Life Insurance Co. Ltd. (H Shares) | 13,479,000 | | 59,257,545 |
PICC Property & Casualty Co. Ltd. (H Shares) (a) | 21,118,000 | | 31,167,866 |
Ping An Insurance Group Co. China Ltd. (H Shares) | 3,755,500 | | 40,431,734 |
| | 156,008,730 |
Real Estate Management & Development - 10.7% |
Cheung Kong Holdings Ltd. | 2,663,000 | | 40,539,784 |
China Overseas Land & Investment Ltd. | 5,487,920 | | 11,540,474 |
China Resources Land Ltd. | 4,232,000 | | 8,342,520 |
E-House China Holdings Ltd. ADR (d) | 249,600 | | 4,170,816 |
Hang Lung Properties Ltd. | 1,343,000 | | 6,575,307 |
Henderson Land Development Co. Ltd. | 2,500,076 | | 17,755,741 |
Huaku Development Co. Ltd. | 1,820,000 | | 5,048,783 |
Hung Poo Real Estate Development Co. Ltd. | 2,056,000 | | 3,059,984 |
Kerry Properties Ltd. | 3,480,000 | | 19,305,273 |
Midland Holdings Ltd. | 4,368,000 | | 4,384,201 |
New World Development Co. Ltd. | 7,024,000 | | 13,864,499 |
Poly (Hong Kong) Investments Ltd. | 3,144,000 | | 3,236,784 |
Shimao Property Holdings Ltd. | 7,417,500 | | 12,268,002 |
Sinyi Realty, Inc. | 1,179,370 | | 2,292,845 |
Sun Hung Kai Properties Ltd. | 2,983,000 | | 51,106,905 |
|
| Shares | | Value |
Wharf Holdings Ltd. | 3,853,000 | | $ 25,301,429 |
Yanlord Land Group Ltd. | 2,484,000 | | 3,300,997 |
| | 232,094,344 |
TOTAL FINANCIALS | | 892,864,773 |
HEALTH CARE - 0.2% |
Pharmaceuticals - 0.2% |
Coolpoint Energy Ltd. (a) | 45,452,000 | | 3,811,488 |
INDUSTRIALS - 8.5% |
Airlines - 1.2% |
Air China Ltd. (H Shares) (a) | 9,756,000 | | 13,114,984 |
Cathay Pacific Airways Ltd. | 3,341,000 | | 8,986,918 |
China Eastern Airlines Corp. Ltd. (a) | 6,770,000 | | 4,279,697 |
| | 26,381,599 |
Building Products - 0.5% |
China Liansu Group Holdgs Ltd. (a) | 18,523,000 | | 11,613,840 |
Electrical Equipment - 0.7% |
Dongfang Electric Corp. Ltd. | 1,674,800 | | 8,145,778 |
Zhuzhou CSR Times Electric Co. Ltd. (H Shares) | 2,036,000 | | 6,212,082 |
| | 14,357,860 |
Industrial Conglomerates - 2.9% |
Far Eastern Textile Ltd. | 19,334,228 | | 27,859,483 |
Hutchison Whampoa Ltd. | 2,121,000 | | 20,905,583 |
Shanghai Industrial Holdings Ltd. | 3,144,000 | | 14,480,348 |
| | 63,245,414 |
Machinery - 0.8% |
China International Marine Containers Co. Ltd. (B Shares) | 7,166,794 | | 14,516,196 |
Singamas Container Holdings Ltd. (a) | 13,180,000 | | 2,975,649 |
| | 17,491,845 |
Marine - 0.8% |
Orient Overseas International Ltd. | 619,000 | | 5,426,357 |
Shun Tak Holdings Ltd. | 19,152,000 | | 12,625,927 |
| | 18,052,284 |
Trading Companies & Distributors - 0.1% |
Hong Kong Resources Holdings
Co. Ltd. | 11,212,000 | | 1,923,814 |
Transportation Infrastructure - 1.5% |
China Merchant Holdings International Co. Ltd. | 1,228,000 | | 4,301,268 |
Cosco Pacific Ltd. | 7,606,000 | | 11,873,259 |
Zhejiang Expressway Co. Ltd. (H Shares) | 15,140,000 | | 15,254,752 |
| | 31,429,279 |
TOTAL INDUSTRIALS | | 184,495,935 |
INFORMATION TECHNOLOGY - 15.0% |
Communications Equipment - 2.1% |
China Wireless Technologies Ltd. | 3,964,000 | | 2,122,316 |
Common Stocks - continued |
| Shares | | Value |
INFORMATION TECHNOLOGY - continued |
Communications Equipment - continued |
HTC Corp. | 1,700,000 | | $ 38,382,618 |
Vtech Holdings Ltd. | 403,000 | | 4,193,124 |
| | 44,698,058 |
Computers & Peripherals - 0.3% |
Acer, Inc. | 2,301,108 | | 6,684,153 |
Electronic Equipment & Components - 6.4% |
AU Optronics Corp. (a) | 7,798,090 | | 7,784,283 |
Chroma ATE, Inc. | 3,350,000 | | 8,625,388 |
Delta Electronics, Inc. | 828,000 | | 3,422,382 |
Funtalk China Holdings Ltd. (a) | 497,100 | | 3,280,860 |
Hon Hai Precision Industry Co. Ltd. (Foxconn) | 15,763,172 | | 59,746,054 |
Kingboard Chemical Holdings Ltd. | 2,618,000 | | 12,733,249 |
Tripod Technology Corp. | 3,001,820 | | 11,524,713 |
Unimicron Technology Corp. | 14,255,000 | | 24,266,803 |
WPG Holding Co. Ltd. | 3,601,120 | | 6,695,106 |
| | 138,078,838 |
Internet Software & Services - 3.9% |
Sina Corp. (a) | 146,100 | | 8,225,430 |
SouFun Holdings Ltd. ADR (d) | 89,400 | | 6,570,900 |
Tencent Holdings Ltd. | 3,007,100 | | 68,861,184 |
TPK Holdings Co. | 11,000 | | 181,506 |
| | 83,839,020 |
Semiconductors & Semiconductor Equipment - 2.3% |
MediaTek, Inc. | 398,794 | | 5,016,687 |
Taiwan Semiconductor Manufacturing Co. Ltd. | 19,519,796 | | 40,179,972 |
Trony Solar Holdings Co. Ltd. | 8,494,000 | | 5,314,743 |
| | 50,511,402 |
TOTAL INFORMATION TECHNOLOGY | | 323,811,471 |
MATERIALS - 4.7% |
Chemicals - 2.7% |
China BlueChemical Ltd. (H shares) | 11,116,000 | | 8,790,980 |
DC Chemical Co. Ltd. | 7,519 | | 2,213,240 |
Formosa Plastics Corp. | 8,908,250 | | 25,556,097 |
Nan Ya Plastics Corp. | 3,518,000 | | 7,839,490 |
Taiwan Fertilizer Co. Ltd. | 3,804,000 | | 12,988,662 |
| | 57,388,469 |
Construction Materials - 0.5% |
Anhui Conch Cement Co. Ltd. (H Shares) | 2,810,000 | | 11,781,971 |
Metals & Mining - 1.5% |
Xingda International Holdings Ltd. | 13,453,000 | | 14,040,932 |
Zhaojin Mining Industry Co. Ltd. (H Shares) | 2,435,000 | | 7,570,843 |
Zijin Mining Group Co. Ltd. (H Shares) | 10,858,000 | | 10,239,894 |
| | 31,851,669 |
|
| Shares | | Value |
Paper & Forest Products - 0.0% |
China Forestry Holdings Co. Ltd. | 1,064,000 | | $ 505,147 |
TOTAL MATERIALS | | 101,527,256 |
TELECOMMUNICATION SERVICES - 4.3% |
Diversified Telecommunication Services - 0.8% |
China Unicom (Hong Kong) Ltd. | 12,910,000 | | 18,156,664 |
Wireless Telecommunication Services - 3.5% |
China Mobile (Hong Kong) Ltd. | 5,194,000 | | 53,042,759 |
SOFTBANK CORP. | 689,200 | | 22,133,677 |
| | 75,176,436 |
TOTAL TELECOMMUNICATION SERVICES | | 93,333,100 |
UTILITIES - 0.2% |
Gas Utilities - 0.2% |
Enn Energy Holdings Ltd. | 1,854,000 | | 5,573,062 |
TOTAL COMMON STOCKS (Cost $1,524,284,829) | 2,088,737,295 |
Money Market Funds - 4.0% |
| | | |
Fidelity Cash Central Fund, 0.23% (b) | 74,532,881 | | 74,532,881 |
Fidelity Securities Lending Cash Central Fund, 0.24% (b)(c) | 11,164,250 | | 11,164,250 |
TOTAL MONEY MARKET FUNDS (Cost $85,697,131) | 85,697,131 |
TOTAL INVESTMENT PORTFOLIO - 100.6% (Cost $1,609,981,960) | | 2,174,434,426 |
NET OTHER ASSETS (LIABILITIES) - (0.6)% | | (11,909,134) |
NET ASSETS - 100% | $ 2,162,525,292 |
Legend |
(a) Non-income producing |
(b) Affiliated fund that is available only to investment companies and other accounts managed by Fidelity Investments. The rate quoted is the annualized seven-day yield of the fund at period end. A complete unaudited listing of the fund's holdings as of its most recent quarter end is available upon request. In addition, each Fidelity Central Fund's financial statements, which are not covered by the Fund's report of Independent Registered Public Accounting Firm, are available on the SEC's website or upon request. |
(c) Investment made with cash collateral received from securities on loan. |
(d) Security or a portion of the security is on loan at period end. |
Affiliated Central Funds |
Information regarding fiscal year to date income earned by the Fund from investments in Fidelity Central Funds is as follows: |
Fund | Income earned |
Fidelity Cash Central Fund | $ 72,745 |
Fidelity Securities Lending Cash Central Fund | 439,269 |
Total | $ 512,014 |
Other Information |
The following is a summary of the inputs used, as of October 31, 2010, involving the Fund's assets and liabilities carried at fair value. The inputs or methodology used for valuing securities may not be an indication of the risk associated with investing in those securities. For more information on valuation inputs, and their aggregation into the levels used in the table below, please refer to the Security Valuation section in the accompanying Notes to Financial Statements. |
Valuation Inputs at Reporting Date: |
Description | Total | Level 1 | Level 2 | Level 3 |
Investments in Securities: | | | | |
Equities: | | | | |
Consumer Discretionary | $ 213,811,457 | $ 213,811,457 | $ - | $ - |
Consumer Staples | 112,354,640 | 104,845,887 | 7,508,753 | - |
Energy | 157,154,113 | 18,007,819 | 139,146,294 | - |
Financials | 892,864,773 | 820,412,673 | 72,452,100 | - |
Health Care | 3,811,488 | 3,811,488 | - | - |
Industrials | 184,495,935 | 184,495,935 | - | - |
Information Technology | 323,811,471 | 275,847,216 | 47,964,255 | - |
Materials | 101,527,256 | 101,527,256 | - | - |
Telecommunication Services | 93,333,100 | - | 93,333,100 | - |
Utilities | 5,573,062 | 5,573,062 | - | - |
Money Market Funds | 85,697,131 | 85,697,131 | - | - |
Total Investments in Securities: | $ 2,174,434,426 | $ 1,814,029,924 | $ 360,404,502 | $ - |
Income Tax Information |
At October 31, 2010, the Fund had a capital loss carryforward of approximately $98,628,962 of which $63,392,256 and $35,236,706 will expire on Octo-ber 31, 2016 and 2017, respectively. Capital loss carryforwards are only available to offset future capital gains of the Fund to the extent provided by regulations and may be limited. |
See accompanying notes which are an integral part of the financial statements.
Annual Report
Fidelity China Region Fund
Financial Statements
Statement of Assets and Liabilities
| October 31, 2010 |
| | |
Assets | | |
Investment in securities, at value (including securities loaned of $10,904,815) - See accompanying schedule: Unaffiliated issuers (cost $1,524,284,829) | $ 2,088,737,295 | |
Fidelity Central Funds (cost $85,697,131) | 85,697,131 | |
Total Investments (cost $1,609,981,960) | | $ 2,174,434,426 |
Receivable for investments sold | | 6,262,368 |
Receivable for fund shares sold | | 4,252,327 |
Dividends receivable | | 316,915 |
Distributions receivable from Fidelity Central Funds | | 32,232 |
Other receivables | | 379,542 |
Total assets | | 2,185,677,810 |
| | |
Liabilities | | |
Payable for investments purchased | $ 8,676,527 | |
Payable for fund shares redeemed | 1,327,650 | |
Accrued management fee | 1,262,835 | |
Distribution and service plan fees payable | 12,629 | |
Other affiliated payables | 465,006 | |
Other payables and accrued expenses | 243,621 | |
Collateral on securities loaned, at value | 11,164,250 | |
Total liabilities | | 23,152,518 |
| | |
Net Assets | | $ 2,162,525,292 |
Net Assets consist of: | | |
Paid in capital | | $ 1,682,005,306 |
Undistributed net investment income | | 25,575,304 |
Accumulated undistributed net realized gain (loss) on investments and foreign currency transactions | | (109,507,734) |
Net unrealized appreciation (depreciation) on investments and assets and liabilities in foreign currencies | | 564,452,416 |
Net Assets | | $ 2,162,525,292 |
Statement of Assets and Liabilities - continued
| October 31, 2010 |
| | |
Calculation of Maximum Offering Price Class A:
Net Asset Value and redemption price per share ($16,047,242 ÷ 507,608 shares) | | $ 31.61 |
| | |
Maximum offering price per share (100/94.25 of $31.61) | | $ 33.54 |
Class T:
Net Asset Value and redemption price per share ($6,069,809 ÷ 192,817 shares) | | $ 31.48 |
| | |
Maximum offering price per share (100/96.50 of $31.48) | | $ 32.62 |
Class B:
Net Asset Value and offering price per share ($2,495,982 ÷ 79,921 shares) A | | $ 31.23 |
| | |
Class C:
Net Asset Value and offering price per share ($5,938,380 ÷ 190,411 shares) A | | $ 31.19 |
| | |
China Region:
Net Asset Value, offering price and redemption price per share ($2,130,070,228 ÷ 66,960,488 shares) | | $ 31.81 |
| | |
Institutional Class:
Net Asset Value, offering price and redemption price per share ($1,903,651 ÷ 59,886 shares) | | $ 31.79 |
A Redemption price per share is equal to net asset value less any applicable contingent deferred sales charge.
See accompanying notes which are an integral part of the financial statements.
Annual Report
Fidelity China Region Fund
Financial Statements - continued
Statement of Operations
| Year ended October 31, 2010 |
| | |
Investment Income | | |
Dividends | | $ 51,267,009 |
Interest | | 839 |
Income from Fidelity Central Funds | | 512,014 |
Income before foreign taxes withheld | | 51,779,862 |
Less foreign taxes withheld | | (4,706,256) |
Total income | | 47,073,606 |
| | |
Expenses | | |
Management fee | $ 15,034,894 | |
Transfer agent fees | 5,059,284 | |
Distribution and service plan fees | 128,222 | |
Accounting and security lending fees | 936,699 | |
Custodian fees and expenses | 1,216,014 | |
Independent trustees' compensation | 12,021 | |
Registration fees | 161,631 | |
Audit | 68,420 | |
Legal | 14,413 | |
Interest | 3,369 | |
Miscellaneous | 27,343 | |
Total expenses before reductions | 22,662,310 | |
Expense reductions | (1,286,872) | 21,375,438 |
Net investment income (loss) | | 25,698,168 |
Realized and Unrealized Gain (Loss) Net realized gain (loss) on: | | |
Investment securities: | | |
Unaffiliated issuers | 87,323,739 | |
Foreign currency transactions | (268,927) | |
Capital gain distributions from Fidelity Central Funds | 1,892 | |
Total net realized gain (loss) | | 87,056,704 |
Change in net unrealized appreciation (depreciation) on: Investment securities | 253,069,310 | |
Assets and liabilities in foreign currencies | 27 | |
Total change in net unrealized appreciation (depreciation) | | 253,069,337 |
Net gain (loss) | | 340,126,041 |
Net increase (decrease) in net assets resulting from operations | | $ 365,824,209 |
Statement of Changes in Net Assets
| Year ended
October 31,
2010 | Year ended
October 31,
2009 |
Increase (Decrease) in Net Assets | | |
Operations | | |
Net investment income (loss) | $ 25,698,168 | $ 19,321,348 |
Net realized gain (loss) | 87,056,704 | (37,545,495) |
Change in net unrealized appreciation (depreciation) | 253,069,337 | 584,945,489 |
Net increase (decrease) in net assets resulting from operations | 365,824,209 | 566,721,342 |
Distributions to shareholders from net investment income | (17,788,313) | (7,631,813) |
Distributions to shareholders from net realized gain | (5,540,851) | - |
Total distributions | (23,329,164) | (7,631,813) |
Share transactions - net increase (decrease) | (341,589,636) | 858,935,262 |
Redemption fees | 1,093,238 | 1,318,632 |
Total increase (decrease) in net assets | 1,998,647 | 1,419,343,423 |
| | |
Net Assets | | |
Beginning of period | 2,160,526,645 | 741,183,222 |
End of period (including undistributed net investment income of $25,575,304 and undistributed net investment income of $17,665,449, respectively) | $ 2,162,525,292 | $ 2,160,526,645 |
See accompanying notes which are an integral part of the financial statements.
Annual Report
Financial Highlights - Class A
Years ended October 31, | 2010 | 2009 | 2008 H |
Selected Per-Share Data | | | |
Net asset value, beginning of period | $ 26.47 | $ 16.67 | $ 29.28 |
Income from Investment Operations | | | |
Net investment income (loss) E | .25 | .30 | .28 |
Net realized and unrealized gain (loss) | 5.15 | 9.63 | (12.91) |
Total from investment operations | 5.40 | 9.93 | (12.63) |
Distributions from net investment income | (.20) | (.16) | - |
Distributions from net realized gain | (.07) | - | - |
Total distributions | (.27) | (.16) | - |
Redemption fees added to paid in capital E | .01 | .03 | .02 |
Net asset value, end of period | $ 31.61 | $ 26.47 | $ 16.67 |
Total Return B, C, D | 20.54% | 60.41% | (43.07)% |
Ratios to Average Net Assets F, I | | | |
Expenses before reductions | 1.38% | 1.39% | 1.44% A |
Expenses net of fee waivers, if any | 1.38% | 1.39% | 1.44% A |
Expenses net of all reductions | 1.31% | 1.31% | 1.30% A |
Net investment income (loss) | .91% | 1.27% | 2.63% A |
Supplemental Data | | | |
Net assets, end of period (000 omitted) | $ 16,047 | $ 11,842 | $ 340 |
Portfolio turnover rate G | 57% | 88% | 133% |
A Annualized
B Total returns for periods of less than one year are not annualized.
C Total returns would have been lower had certain expenses not been reduced during the periods shown.
D Total returns do not include the effect of the sales charges.
E Calculated based on average shares outstanding during the period.
F Fees and expenses of the underlying Fidelity Central Funds are not included in the Fund's expense ratio. The Fund indirectly bears its proportionate share of the expenses of any underlying Fidelity Central Funds.
G Amount does not include the portfolio activity of any underlying Fidelity Central Funds.
H For the period May 9, 2008 (commencement of sale of shares) to October 31, 2008.
I Expense ratios reflect operating expenses of the class. Expenses before reductions do not reflect amounts reimbursed by the investment adviser or reductions from brokerage service arrangements or reductions from other expense offset arrangements and do not represent the amount paid by the class during periods when reimbursements or reductions occur. Expense ratios before reductions for start-up periods may not be representative of longer-term operating periods. Expenses net of fee waivers reflect expenses after reimbursement by the investment adviser but prior to reductions from brokerage service arrangements or other expense offset arrangements. Expenses net of all reductions represent the net expenses paid by the class.
Financial Highlights - Class T
Years ended October 31, | 2010 | 2009 | 2008 H |
Selected Per-Share Data | | | |
Net asset value, beginning of period | $ 26.40 | $ 16.65 | $ 29.28 |
Income from Investment Operations | | | |
Net investment income (loss) E | .18 | .23 | .26 |
Net realized and unrealized gain (loss) | 5.13 | 9.64 | (12.91) |
Total from investment operations | 5.31 | 9.87 | (12.65) |
Distributions from net investment income | (.18) | (.14) | - |
Distributions from net realized gain | (.07) | - | - |
Total distributions | (.24) J | (.14) | - |
Redemption fees added to paid in capital E | .01 | .02 | .02 |
Net asset value, end of period | $ 31.48 | $ 26.40 | $ 16.65 |
Total Return B, C, D | 20.27% | 59.92% | (43.14)% |
Ratios to Average Net Assets F, I | | | |
Expenses before reductions | 1.64% | 1.66% | 1.68% A |
Expenses net of fee waivers, if any | 1.64% | 1.66% | 1.68% A |
Expenses net of all reductions | 1.58% | 1.58% | 1.53% A |
Net investment income (loss) | .64% | 1.00% | 2.40% A |
Supplemental Data | | | |
Net assets, end of period (000 omitted) | $ 6,070 | $ 3,139 | $ 107 |
Portfolio turnover rate G | 57% | 88% | 133% |
A Annualized
B Total returns for periods of less than one year are not annualized.
C Total returns would have been lower had certain expenses not been reduced during the periods shown.
D Total returns do not include the effect of the sales charges.
E Calculated based on average shares outstanding during the period.
F Fees and expenses of the underlying Fidelity Central Funds are not included in the Fund's expense ratio. The Fund indirectly bears its proportionate share of the expenses of any underlying Fidelity Central Funds.
G Amount does not include the portfolio activity of any underlying Fidelity Central Funds.
H For the period May 9, 2008 (commencement of sale of shares) to October 31, 2008.
I Expense ratios reflect operating expenses of the class. Expenses before reductions do not reflect amounts reimbursed by the investment adviser or reductions from brokerage service arrangements or reductions from other expense offset arrangements and do not represent the amount paid by the class during periods when reimbursements or reductions occur. Expense ratios before reductions for start-up periods may not be representative of longer-term operating periods. Expenses net of fee waivers reflect expenses after reimbursement by the investment adviser but prior to reductions from brokerage service arrangements or other expense offset arrangements. Expenses net of all reductions represent the net expenses paid by the class.
J Total distributions of $.24 per share is comprised of distributions from net investment income of $.177 and distributions from net realized gain of $.065 per share.
See accompanying notes which are an integral part of the financial statements.
Annual Report
Financial Highlights - Class B
Years ended October 31, | 2010 | 2009 | 2008 H |
Selected Per-Share Data | | | |
Net asset value, beginning of period | $ 26.28 | $ 16.61 | $ 29.28 |
Income from Investment Operations | | | |
Net investment income (loss) E | .04 | .12 | .20 |
Net realized and unrealized gain (loss) | 5.09 | 9.63 | (12.89) |
Total from investment operations | 5.13 | 9.75 | (12.69) |
Distributions from net investment income | (.12) | (.10) | - |
Distributions from net realized gain | (.07) | - | - |
Total distributions | (.19) | (.10) | - |
Redemption fees added to paid in capital E | .01 | .02 | .02 |
Net asset value, end of period | $ 31.23 | $ 26.28 | $ 16.61 |
Total Return B, C, D | 19.63% | 59.16% | (43.27)% |
Ratios to Average Net Assets F, I | | | |
Expenses before reductions | 2.14% | 2.15% | 2.17% A |
Expenses net of fee waivers, if any | 2.14% | 2.15% | 2.17% A |
Expenses net of all reductions | 2.08% | 2.06% | 2.02% A |
Net investment income (loss) | .14% | .51% | 1.91% A |
Supplemental Data | | | |
Net assets, end of period (000 omitted) | $ 2,496 | $ 1,915 | $ 155 |
Portfolio turnover rate G | 57% | 88% | 133% |
A Annualized
B Total returns for periods of less than one year are not annualized.
C Total returns would have been lower had certain expenses not been reduced during the periods shown.
D Total returns do not include the effect of the contingent deferred sales charge.
E Calculated based on average shares outstanding during the period.
F Fees and expenses of the underlying Fidelity Central Funds are not included in the Fund's expense ratio. The Fund indirectly bears its proportionate share of the expenses of any underlying Fidelity Central Funds.
G Amount does not include the portfolio activity of any underlying Fidelity Central Funds.
H For the period May 9, 2008 (commencement of sale of shares) to October 31, 2008.
I Expense ratios reflect operating expenses of the class. Expenses before reductions do not reflect amounts reimbursed by the investment adviser or reductions from brokerage service arrangements or reductions from other expense offset arrangements and do not represent the amount paid by the class during periods when reimbursements or reductions occur. Expense ratios before reductions for start-up periods may not be representative of longer-term operating periods. Expenses net of fee waivers reflect expenses after reimbursement by the investment adviser but prior to reductions from brokerage service arrangements or other expense offset arrangements. Expenses net of all reductions represent the net expenses paid by the class.
Financial Highlights - Class C
Years ended October 31, | 2010 | 2009 | 2008 H |
Selected Per-Share Data | | | |
Net asset value, beginning of period | $ 26.25 | $ 16.61 | $ 29.28 |
Income from Investment Operations | | | |
Net investment income (loss) E | .04 | .12 | .20 |
Net realized and unrealized gain (loss) | 5.09 | 9.62 | (12.89) |
Total from investment operations | 5.13 | 9.74 | (12.69) |
Distributions from net investment income | (.13) | (.12) | - |
Distributions from net realized gain | (.07) | - | - |
Total distributions | (.20) | (.12) | - |
Redemption fees added to paid in capital E | .01 | .02 | .02 |
Net asset value, end of period | $ 31.19 | $ 26.25 | $ 16.61 |
Total Return B, C, D | 19.66% | 59.18% | (43.27)% |
Ratios to Average Net Assets F, I | | | |
Expenses before reductions | 2.14% | 2.15% | 2.13% A |
Expenses net of fee waivers, if any | 2.14% | 2.15% | 2.13% A |
Expenses net of all reductions | 2.07% | 2.07% | 1.98% A |
Net investment income (loss) | .15% | .51% | 1.95% A |
Supplemental Data | | | |
Net assets, end of period (000 omitted) | $ 5,938 | $ 3,806 | $ 233 |
Portfolio turnover rate G | 57% | 88% | 133% |
A Annualized
B Total returns for periods of less than one year are not annualized.
C Total returns would have been lower had certain expenses not been reduced during the periods shown.
D Total returns do not include the effect of the contingent deferred sales charge.
E Calculated based on average shares outstanding during the period.
F Fees and expenses of the underlying Fidelity Central Funds are not included in the Fund's expense ratio. The Fund indirectly bears its proportionate share of the expenses of any underlying Fidelity Central Funds.
G Amount does not include the portfolio activity of any underlying Fidelity Central Funds.
H For the period May 9, 2008 (commencement of sale of shares) to October 31, 2008.
I Expense ratios reflect operating expenses of the class. Expenses before reductions do not reflect amounts reimbursed by the investment adviser or reductions from brokerage service arrangements or reductions from other expense offset arrangements and do not represent the amount paid by the class during periods when reimbursements or reductions occur. Expense ratios before reductions for start-up periods may not be representative of longer-term operating periods. Expenses net of fee waivers reflect expenses after reimbursement by the investment adviser but prior to reductions from brokerage service arrangements or other expense offset arrangements. Expenses net of all reductions represent the net expenses paid by the class.
See accompanying notes which are an integral part of the financial statements.
Annual Report
Financial Highlights - China Region
Years ended October 31, | 2010 | 2009 | 2008 | 2007 | 2006 |
Selected Per-Share Data | | | | | |
Net asset value, beginning of period | $ 26.55 | $ 16.69 | $ 41.52 | $ 22.94 | $ 17.74 |
Income from Investment Operations | | | | | |
Net investment income (loss) B | .34 | .33 | .39 | .46 | .42 |
Net realized and unrealized gain (loss) | 5.18 | 9.68 | (20.42) | 18.58 | 4.99 |
Total from investment operations | 5.52 | 10.01 | (20.03) | 19.04 | 5.41 |
Distributions from net investment income | (.21) | (.17) | (.32) | (.29) | (.22) |
Distributions from net realized gain | (.07) | - | (4.53) | (.20) | - |
Total distributions | (.27) F | (.17) | (4.85) | (.49) | (.22) |
Redemption fees added to paid in capital B | .01 | .02 | .05 | .03 | .01 |
Net asset value, end of period | $ 31.81 | $ 26.55 | $ 16.69 | $ 41.52 | $ 22.94 |
Total Return A | 20.97% | 60.77% | (53.75)% | 84.73% | 30.83% |
Ratios to Average Net Assets C, E | | | | | |
Expenses before reductions | 1.06% | 1.12% | 1.11% | 1.08% | 1.14% |
Expenses net of fee waivers, if any | 1.06% | 1.12% | 1.11% | 1.08% | 1.14% |
Expenses net of all reductions | 1.00% | 1.03% | .96% | .92% | 1.08% |
Net investment income (loss) | 1.22% | 1.54% | 1.45% | 1.64% | 1.99% |
Supplemental Data | | | | | |
Net assets, end of period (000 omitted) | $ 2,130,070 | $ 2,138,141 | $ 740,289 | $ 2,044,527 | $ 734,793 |
Portfolio turnover rate D | 57% | 88% | 133% | 173% | 36% |
A Total returns would have been lower had certain expenses not been reduced during the periods shown.
B Calculated based on average shares outstanding during the period.
C Fees and expenses of the underlying Fidelity Central Funds are not included in the Fund's expense ratio. The Fund indirectly bears its proportionate share of the expenses of any underlying Fidelity Central Funds.
D Amount does not include the portfolio activity of any underlying Fidelity Central Funds.
E Expense ratios reflect operating expenses of the class. Expenses before reductions do not reflect amounts reimbursed by the investment adviser or reductions from brokerage service arrangements or reductions from other expense offset arrangements and do not represent the amount paid by the class during periods when reimbursements or reductions occur. Expenses net of fee waivers reflect expenses after reimbursement by the investment adviser but prior to reductions from brokerage service arrangements or other expense offset arrangements. Expenses net of all reductions represent the net expenses paid by the class.
F Total distributions of $.27 per share is comprised of distributions from net investment income of $.209 and distributions from net realized gain of $.065 per share.
Financial Highlights - Institutional Class
Years ended October 31, | 2010 | 2009 | 2008 G |
Selected Per-Share Data | | | |
Net asset value, beginning of period | $ 26.55 | $ 16.70 | $ 29.28 |
Income from Investment Operations | | | |
Net investment income (loss) D | .33 | .37 | .34 |
Net realized and unrealized gain (loss) | 5.18 | 9.64 | (12.94) |
Total from investment operations | 5.51 | 10.01 | (12.60) |
Distributions from net investment income | (.22) | (.18) | - |
Distributions from net realized gain | (.07) | - | - |
Total distributions | (.28) I | (.18) | - |
Redemption fees added to paid in capital D | .01 | .02 | .02 |
Net asset value, end of period | $ 31.79 | $ 26.55 | $ 16.70 |
Total Return B, C | 20.92% | 60.78% | (42.96)% |
Ratios to Average Net Assets E, H | | | |
Expenses before reductions | 1.11% | 1.08% | 1.05% A |
Expenses net of fee waivers, if any | 1.11% | 1.08% | 1.05% A |
Expenses net of all reductions | 1.04% | 1.00% | .91% A |
Net investment income (loss) | 1.18% | 1.58% | 3.02% A |
Supplemental Data | | | |
Net assets, end of period (000 omitted) | $ 1,904 | $ 1,684 | $ 60 |
Portfolio turnover rate F | 57% | 88% | 133% |
A Annualized
B Total returns for periods of less than one year are not annualized.
C Total returns would have been lower had certain expenses not been reduced during the periods shown.
D Calculated based on average shares outstanding during the period.
E Fees and expenses of the underlying Fidelity Central Funds are not included in the Fund's expense ratio. The Fund indirectly bears its proportionate share of the expenses of any underlying Fidelity Central Funds.
F Amount does not include the portfolio activity of any underlying Fidelity Central Funds.
G For the period May 9, 2008 (commencement of sale of shares) to October 31, 2008.
H Expense ratios reflect operating expenses of the class. Expenses before reductions do not reflect amounts reimbursed by the investment adviser or reductions from brokerage service arrangements or reductions from other expense offset arrangements and do not represent the amount paid by the class during periods when reimbursements or reductions occur. Expense ratios before reductions for start-up periods may not be representative of longer-term operating periods. Expenses net of fee waivers reflect expenses after reimbursement by the investment adviser but prior to reductions from brokerage service arrangements or other expense offset arrangements. Expenses net of all reductions represent the net expenses paid by the class.
I Total distributions of $.28 per share is comprised of distributions from net investment income of $.216 and distributions from net realized gain of $.065 per share.
See accompanying notes which are an integral part of the financial statements.
Annual Report
Notes to Financial Statements
For the period ended October 31, 2010
1. Organization.
Fidelity China Region Fund (the Fund) is a fund of Fidelity Investment Trust (the Trust) and is authorized to issue an unlimited number of shares. The Trust is registered under the Investment Company Act of 1940, as amended (the 1940 Act), as an open-end management investment company organized as a Massachusetts business trust. The Fund offers Class A, Class T, Class C, China Region and Institutional Class shares, each of which has equal rights as to assets and voting privileges. Effective after the close of business on September 1, 2010, Class B shares were closed to new accounts and additional purchases by existing shareholders. Each class has exclusive voting rights with respect to matters that affect that class. Class B shares will automatically convert to Class A shares after a holding period of seven years from the initial date of purchase. Investment income, realized and unrealized capital gains and losses, the common expenses of the Fund, and certain fund-level expense reductions, if any, are allocated on a pro-rata basis to each class based on the relative net assets of each class to the total net assets of the Fund. Each class differs with respect to transfer agent and distribution and service plan fees incurred. Certain expense reductions also differ by class. The Fund's investments in emerging markets can be subject to social, economic, regulatory, and political uncertainties and can be extremely volatile.
2. Investments in Fidelity Central Funds.
The Fund may invest in Fidelity Central Funds, which are open-end investment companies available only to other investment companies and accounts managed by Fidelity Management & Research Company (FMR) and its affiliates. The Fund's Schedule of Investments lists each of the Fidelity Central Funds held as of period end, if any, as an investment of the Fund, but does not include the underlying holdings of each Fidelity Central Fund. As an Investing Fund, the Fund indirectly bears its proportionate share of the expenses of the underlying Fidelity Central Funds.
The Money Market Central Funds seek preservation of capital and current income and are managed by Fidelity Investments Money Management, Inc. (FIMM), an affiliate of FMR.
A complete unaudited list of holdings for each Fidelity Central Fund is available upon request or at the Securities and Exchange Commission (the SEC) web site at www.sec.gov. In addition, the financial statements of the Fidelity Central Funds, which are not covered by the Fund's Report of Independent Registered Public Accounting Firm, are available on the SEC web site or upon request.
3. Significant Accounting Policies.
The financial statements have been prepared in conformity with accounting principles generally accepted in the United States of America (GAAP), which require management to make certain estimates and assumptions at the date of the financial statements. Actual results could differ from those estimates. The following summarizes the significant accounting policies of the Fund:
Security Valuation. Investments are valued as of 4:00 p.m. Eastern time on the last calendar day of the period. The Fund uses independent pricing services approved by the Board of Trustees to value its investments. When current market prices or quotations are not readily available or reliable, valuations may be determined in good faith in accordance with procedures adopted by the Board of Trustees. Factors used in determining value may include market or security specific events. The frequency with which these procedures are used cannot be predicted and they may be utilized to a significant extent. The value used for net asset value (NAV) calculation under these procedures may differ from published prices for the same securities.
The Fund categorizes the inputs to valuation techniques used to value its investments into a disclosure hierarchy consisting of three levels as shown below.
Level 1 - quoted prices in active markets for identical investments
Level 2 - other significant observable inputs (including quoted prices for similar investments, interest rates, prepayment speeds, etc.)
Level 3 - unobservable inputs (including the fund's own assumptions based on the best information available)
Changes in valuation techniques may result in transfers in or out of an assigned level within the disclosure hierarchy. Valuation techniques used to value the Fund's investments by major category are as follows.
Equity securities, including restricted securities, for which market quotations are readily available, are valued at the last reported sale price or official closing price as reported by an independent pricing service on the primary market or exchange on which they are traded and are categorized as Level 1 in the hierarchy. In the event there were no sales during the day or closing prices are not available, securities are valued at the last quoted bid price or may be valued using the last available price and are generally categorized as Level 2 in the hierarchy. For foreign equity securities, when significant market or security specific events arise, comparisons to the valuation of American Depositary Receipts (ADRs), futures contracts, Exchange-traded funds (ETFs) and certain indexes as well as quoted prices for similar securities are used and are categorized as Level 2 in the hierarchy in these circumstances. Utilizing these techniques may result in significant transfers between Level 1 and Level 2. For restricted equity securities and private placements where observable inputs are limited, assumptions about market activity and risk are used and are categorized as Level 3 in the hierarchy.
Annual Report
Notes to Financial Statements - continued
3. Significant Accounting Policies - continued
Security Valuation - continued
Investments in open-end mutual funds, including the Fidelity Central Funds, are valued at their closing net asset value each business day and are categorized as Level 1 in the hierarchy. Short-term securities with remaining maturities of sixty days or less for which quotations are not readily available are valued at amortized cost, which approximates fair value and are categorized as Level 2 in the hierarchy.
Foreign Currency. The Fund uses foreign currency contracts to facilitate transactions in foreign-denominated securities. Gains and losses from these transactions may arise from changes in the value of the foreign currency or if the counterparties do not perform under the contracts' terms.
Foreign-denominated assets, including investment securities, and liabilities are translated into U.S. dollars at the exchange rate at period end. Purchases and sales of investment securities, income and dividends received and expenses denominated in foreign currencies are translated into U.S. dollars at the exchange rate in effect on the transaction date.
The effects of exchange rate fluctuations on investments are included with the net realized and unrealized gain (loss) on investment securities. Other foreign currency transactions resulting in realized and unrealized gain (loss) are disclosed separately.
Investment Transactions and Income. For financial reporting purposes, the Fund's investment holdings and NAV include trades executed through the end of the last business day of the period. The NAV per share for processing shareholder transactions is calculated as of the close of business of the New York Stock Exchange (NYSE), normally 4:00 p.m. Eastern time and includes trades executed through the end of the prior business day. Gains and losses on securities sold are determined on the basis of identified cost. Dividend income is recorded on the ex-dividend date, except for certain dividends from foreign securities where the ex-dividend date may have passed, which are recorded as soon as the Fund is informed of the ex-dividend date. Non-cash dividends included in dividend income, if any, are recorded at the fair market value of the securities received. Distributions received on securities that represent a return of capital or capital gain are recorded as a reduction of cost of investments and/or as a realized gain. The Fund estimates the components of distributions received that may be considered return of capital distributions or capital gain distributions. Interest income and distributions from the Fidelity Central Funds are accrued as earned. Interest income includes coupon interest and amortization of premium and accretion of discount on debt securities. Investment income is recorded net of foreign taxes withheld where recovery of such taxes is uncertain.
Expenses. Most expenses of the Trust can be directly attributed to a fund. Expenses which cannot be directly attributed are apportioned amongst each fund in the Trust. Expense estimates are accrued in the period to which they relate and adjustments are made when actual amounts are known.
Income Tax Information and Distributions to Shareholders. Each year, the Fund intends to qualify as a regulated investment company, including distributing substantially all of its taxable income and realized gains under Subchapter M of the Internal Revenue Code and filing its U.S. federal tax return. As a result, no provision for income taxes is required. As of October 31, 2010, the Fund did not have any unrecognized tax benefits in the accompanying financial statements. A fund's federal tax return is subject to examination by the Internal Revenue Service (IRS) for a period of three years. Foreign taxes are provided for based on the Fund's understanding of the tax rules and rates that exist in the foreign markets in which it invests.
Distributions are declared and recorded on the ex-dividend date. Income dividends and capital gain distributions are declared separately for each class. Income and capital gain distributions are determined in accordance with income tax regulations, which may differ from GAAP.
Capital accounts within the financial statements are adjusted for permanent book-tax differences. These adjustments have no impact on net assets or the results of operations. Temporary book-tax differences will reverse in a subsequent period.
Book-tax differences are primarily due to the short term gain distributions from Fidelity Central Funds, foreign currency transactions, passive foreign investment companies (PFIC), capital loss carryforwards, and losses deferred due to wash sales.
The federal tax cost of investment securities and unrealized appreciation (depreciation) as of period end were as follows:
Gross unrealized appreciation | $ 570,685,518 |
Gross unrealized depreciation | (18,690,935) |
Net unrealized appreciation (depreciation) | $ 551,994,583 |
| |
Tax Cost | $ 1,622,439,843 |
The tax-based components of distributable earnings as of period end were as follows:
Undistributed ordinary income | $ 27,154,415 |
Capital loss carryforward | $ (98,628,962) |
Net unrealized appreciation (depreciation) | $ 551,994,533 |
Annual Report
3. Significant Accounting Policies - continued
Income Tax Information and Distributions to Shareholders - continued
The tax character of distributions paid was as follows:
| October 31, 2010 | October 31, 2009 |
Ordinary Income | $ 23,329,164 | $ 7,631,813 |
Short-Term Trading (Redemption) Fees. Shares held by investors in the Fund less than 90 days are subject to a redemption fee equal to 1.50% of the net asset value of shares redeemed. All redemption fees, which reduce the proceeds of the shareholder redemption, are retained by the Fund and accounted for as an addition to paid in capital.
4. Purchases and Sales of Investments.
Purchases and sales of securities, other than short-term securities, aggregated $1,178,264,344 and $1,564,472,776, respectively.
5. Fees and Other Transactions with Affiliates.
Management Fee. FMR and its affiliates provide the Fund with investment management related services for which the Fund pays a monthly management fee. The management fee is the sum of an individual fund fee rate that is based on an annual rate of .45% of the Fund's average net assets and a group fee rate that averaged .26% during the period. The group fee rate is based upon the average net assets of all the mutual funds advised by FMR. The group fee rate decreases as assets under management increase and increases as assets under management decrease. For the period, the total annual management fee rate was .71% of the Fund's average net assets.
Distribution and Service Plan Fees. In accordance with Rule 12b-1 of the 1940 Act, the Fund has adopted separate Distribution and Service Plans for each class of shares. Certain classes pay Fidelity Distributors Corporation (FDC), an affiliate of FMR, separate Distribution and Service Fees, each of which is based on an annual percentage of each class' average net assets. In addition, FDC may pay financial intermediaries for selling shares of the Fund and providing shareholder support services. For the period, the Distribution and Service Fee rates, total fees and amounts retained by FDC were as follows:
| Distribution
Fee | Service
Fee | Paid to
FDC | Retained
by FDC |
Class A | 0% | .25% | $ 34,107 | $ 571 |
Class T | .25% | .25% | 23,236 | - |
Class B | .75% | .25% | 22,523 | 16,917 |
Class C | .75% | .25% | 48,356 | 25,041 |
| | | $ 128,222 | $ 42,529 |
Sales Load. FDC receives a front-end sales charge of up to 5.75% for selling Class A shares, and 3.50% for selling Class T shares, some of which is paid to financial intermediaries for selling shares of the Fund. FDC receives the proceeds of contingent deferred sales charges levied on Class A, Class T, Class B, and Class C redemptions. These charges depend on the holding period. The deferred sales charges range from 5% to 1% for Class B, 1% for Class C, 1.00% for certain purchases of Class A shares (1.00% to .50% prior to July 12, 2010) and .25% for certain purchases of Class T shares.
For the period, sales charge amounts retained by FDC were as follows:
| Retained
by FDC |
Class A | $ 26,257 |
Class T | 4,876 |
Class B* | 4,727 |
Class C* | 1,934 |
| $ 37,794 |
* When Class B and Class C shares are initially sold, FDC pays commissions from its own resources to financial intermediaries through which the sales are made.
Transfer Agent Fees. Fidelity Investments Institutional Operations Company, Inc. (FIIOC), an affiliate of FMR, is the transfer, dividend disbursing and shareholder servicing agent for each class of the Fund. FIIOC receives account fees and asset-based fees that vary according to the account size and type of account of the shareholders of the respective classes of the Fund. FIIOC pays for typesetting, printing and mailing of shareholder reports,
Annual Report
Notes to Financial Statements - continued
5. Fees and Other Transactions with Affiliates - continued
Transfer Agent Fees - continued
except proxy statements. For the period, transfer agent fees for each class were as follows:
| Amount | % of
Average
Net Assets |
Class A | $ 40,906 | .30 |
Class T | 14,660 | .31 |
Class B | 7,069 | .31 |
Class C | 15,003 | .31 |
China Region | 4,977,237 | .24 |
Institutional Class | 4,409 | .28 |
| $ 5,059,284 | |
Accounting and Security Lending Fees. Fidelity Service Company, Inc. (FSC), an affiliate of FMR, maintains the Fund's accounting records. The accounting fee is based on the level of average net assets for the month. Under a separate contract, FSC administers the security lending program. The security lending fee is based on the number and duration of lending transactions.
Brokerage Commissions. The fund placed a portion of its portfolio transactions with brokerage firms which are affiliates of the investment advisor. The commissions paid to these affiliated firms were $286 for the period.
Interfund Lending Program. Pursuant to an Exemptive Order issued by the SEC, the Fund, along with other registered investment companies having management contracts with FMR, may participate in an interfund lending program. This program provides an alternative credit facility allowing the funds to borrow from, or lend money to, other participating affiliated funds. At period end, there were no interfund loans outstanding. The Fund's activity in this program during the period for which loans were outstanding was as follows:
Borrower or Lender | Average Daily Loan Balance | Weighted Average Interest Rate | Interest
Expense |
Borrower | $ 12,377,773 | .45% | $ 3,369 |
6. Committed Line of Credit.
The Fund participates with other funds managed by FMR or an affiliate in a $3.75 billion credit facility (the "line of credit") to be utilized for temporary or emergency purposes to fund shareholder redemptions or for other short-term liquidity purposes. The Fund has agreed to pay commitment fees on its pro-rata portion of the line of credit, which amounted to $8,385 and is reflected in Miscellaneous expenses on the Statement of Operations. During the period, there were no borrowings on this line of credit.
7. Security Lending.
The Fund lends portfolio securities through a lending agent from time to time in order to earn additional income. The lending agent may loan securities to certain qualified borrowers, including Fidelity Capital Market (FCM), a broker-dealer affiliated with the Fund. On the settlement date of the loan, the Fund receives collateral (in the form of U.S. Treasury obligations, letters of credit and/or cash) against the loaned securities and maintains collateral in an amount not less than 100% of the market value of the loaned securities during the period of the loan. The market value of the loaned securities is determined at the close of business of the Fund and any additional required collateral is delivered to the Fund on the next business day. If the borrower defaults on its obligation to return the securities loaned because of insolvency or other reasons, a fund could experience delays and costs in recovering the securities loaned or in gaining access to the collateral. Any cash collateral received is invested in the Fidelity Securities Lending Cash Central Fund. The value of loaned securities and cash collateral at period end are disclosed on the Fund's Statement of Assets and Liabilities. Security lending income represents the income earned on investing cash collateral, less rebates paid to borrowers and lending agent fees associated with the loan, plus any premium payments received for lending certain types of securities. Security lending income is presented in the Statement of Operations as a component of income from Fidelity Central Funds. Total security lending income during the period amounted to $439,269. During the period, there were no securities loaned to FCM.
8. Expense Reductions.
Many of the brokers with whom FMR places trades on behalf of the Fund provided services to the Fund in addition to trade execution. These services included payments of certain expenses on behalf of the Fund totaling $1,286,872 for the period.
Annual Report
9. Distributions to Shareholders.
Distributions to shareholders of each class were as follows:
Years ended October 31, | 2010 | 2009 |
From net investment income | | |
Class A | $ 99,129 | $ 4,014 |
Class T | 24,223 | 973 |
Class B | 9,817 | 969 |
Class C | 22,748 | 1,793 |
China Region | 17,620,183 | 7,623,415 |
Institutional Class | 12,213 | 649 |
Total | $ 17,788,313 | $ 7,631,813 |
From net realized gain | | |
Class A | $ 32,057 | $ - |
Class T | 8,895 | - |
Class B | 5,146 | - |
Class C | 11,118 | - |
China Region | 5,479,960 | - |
Institutional Class | 3,675 | - |
Total | $ 5,540,851 | $ - |
10. Share Transactions.
Transactions for each class of shares were as follows:
| Shares | Dollars |
Years ended October 31, | 2010 | 2009 | 2010 | 2009 |
Class A | | | | |
Shares sold | 342,123 | 476,918 | $ 9,544,171 | $ 10,951,377 |
Reinvestment of distributions | 4,199 | 220 | 118,611 | 3,532 |
Shares redeemed | (286,153) | (50,111) | (7,654,399) | (1,196,308) |
Net increase (decrease) | 60,169 | 427,027 | $ 2,008,383 | $ 9,758,601 |
Class T | | | | |
Shares sold | 132,233 | 124,214 | $ 3,681,750 | $ 2,764,790 |
Reinvestment of distributions | 1,158 | 61 | 32,661 | 973 |
Shares redeemed | (59,475) | (11,807) | (1,609,136) | (289,925) |
Net increase (decrease) | 73,916 | 112,468 | $ 2,105,275 | $ 2,475,838 |
Class B | | | | |
Shares sold | 41,380 | 76,310 | $ 1,126,249 | $ 1,715,391 |
Reinvestment of distributions | 486 | 60 | 13,648 | 969 |
Shares redeemed | (34,810) | (12,815) | (913,219) | (303,220) |
Net increase (decrease) | 7,056 | 63,555 | $ 226,678 | $ 1,413,140 |
Class C | | | | |
Shares sold | 121,441 | 162,651 | $ 3,346,120 | $ 3,650,852 |
Reinvestment of distributions | 1,162 | 112 | 32,596 | 1,793 |
Shares redeemed | (77,220) | (31,751) | (2,041,365) | (779,443) |
Net increase (decrease) | 45,383 | 131,012 | $ 1,337,351 | $ 2,873,202 |
China Region | | | | |
Shares sold | 29,402,822 | 54,595,118 | $ 826,039,335 | $ 1,249,255,109 |
Reinvestment of distributions | 782,007 | 454,390 | 22,169,887 | 7,297,501 |
Shares redeemed | (43,745,336) | (18,885,174) | (1,195,393,614) | (415,361,909) |
Net increase (decrease) | (13,560,507) | 36,164,334 | $ (347,184,392) | $ 841,190,701 |
Institutional Class | | | | |
Shares sold | 53,076 | 72,363 | $ 1,486,647 | $ 1,546,935 |
Reinvestment of distributions | 500 | 40 | 14,160 | 649 |
Shares redeemed | (57,102) | (12,559) | (1,583,738) | (323,804) |
Net increase (decrease) | (3,526) | 59,844 | $ (82,931) | $ 1,223,780 |
Annual Report
Notes to Financial Statements - continued
11. Other.
The Fund's organizational documents provide former and current trustees and officers with a limited indemnification against liabilities arising in connection with the performance of their duties to the Fund. In the normal course of business, the Fund may also enter into contracts that provide general indemnifications. The Fund's maximum exposure under these arrangements is unknown as this would be dependent on future claims that may be made against the Fund. The risk of material loss from such claims is considered remote.
Annual Report
Report of Independent Registered Public Accounting Firm
To the Trustees of Fidelity Investment Trust and the Shareholders of Fidelity China Region Fund:
In our opinion, the accompanying statement of assets and liabilities, including the schedule of investments, and the related statements of operations and of changes in net assets and the financial highlights present fairly, in all material respects, the financial position of Fidelity China Region Fund (a fund of Fidelity Investment Trust) at October 31, 2010, the results of its operations for the year then ended, the changes in its net assets for each of the two years in the period then ended and the financial highlights for each of the five years in the period then ended, in conformity with accounting principles generally accepted in the United States of America. These financial statements and financial highlights (hereafter referred to as "financial statements") are the responsibility of the Fidelity China Region Fund's management. Our responsibility is to express an opinion on these financial statements based on our audits. We conducted our audits of these financial statements in accordance with the standards of the Public Company Accounting Oversight Board (United States). Those standards require that we plan and perform the audit to obtain reasonable assurance about whether the financial statements are free of material misstatement. An audit includes examining, on a test basis, evidence supporting the amounts and disclosures in the financial statements, assessing the accounting principles used and significant estimates made by management, and evaluating the overall financial statement presentation. We believe that our audits, which included confirmation of securities at October 31, 2010 by correspondence with the custodian and brokers, provide a reasonable basis for our opinion.
/s/ PricewaterhouseCoopers LLP
PricewaterhouseCoopers LLP
Boston, Massachusetts
December 17, 2010
Annual Report
The Trustees, Member of the Advisory Board, and executive officers of the trust and fund, as applicable, are listed below. The Board of Trustees governs the fund and is responsible for protecting the interests of shareholders. The Trustees are experienced executives who meet periodically throughout the year to oversee the fund's activities, review contractual arrangements with companies that provide services to the fund, oversee management of the risks associated with such activities and contractual arrangements, and review the fund's performance. Except for James C. Curvey, each of the Trustees oversees 221 funds advised by FMR or an affiliate. Mr. Curvey oversees 410 funds advised by FMR or an affiliate.
The Trustees hold office without limit in time except that (a) any Trustee may resign; (b) any Trustee may be removed by written instrument, signed by at least two-thirds of the number of Trustees prior to such removal; (c) any Trustee who requests to be retired or who has become incapacitated by illness or injury may be retired by written instrument signed by a majority of the other Trustees; and (d) any Trustee may be removed at any special meeting of shareholders by a two-thirds vote of the outstanding voting securities of the trust. Each Trustee who is not an interested person (as defined in the 1940 Act) (Independent Trustee), shall retire not later than the last day of the calendar year in which his or her 72nd birthday occurs. The Independent Trustees may waive this mandatory retirement age policy with respect to individual Trustees. The executive officers and Advisory Board Member hold office without limit in time, except that any officer and Advisory Board Member may resign or may be removed by a vote of a majority of the Trustees at any regular meeting or any special meeting of the Trustees. Except as indicated, each individual has held the office shown or other offices in the same company for the past five years.
Experience, Skills, Attributes, and Qualifications of the Fund's Trustees. The Governance and Nominating Committee has adopted a statement of policy that describes the experience, qualifications, attributes, and skills that are necessary and desirable for potential Independent Trustee candidates (Statement of Policy). The Board believes that each Trustee satisfied at the time he or she was initially elected or appointed a Trustee, and continues to satisfy, the standards contemplated by the Statement of Policy. The Governance and Nominating Committee also engages professional search firms to help identify potential Independent Trustee candidates who have the experience, qualifications, attributes, and skills consistent with the Statement of Policy. From time to time, additional criteria based on the composition and skills of the current Independent Trustees, as well as experience or skills that may be appropriate in light of future changes to board composition, business conditions, and regulatory or other developments, have also been considered by the professional search firms and the Governance and Nominating Committee. In addition, the Board takes into account the Trustees' commitment and participation in Board and committee meetings, as well as their leadership of standing and ad hoc committees throughout their tenure.
In determining that a particular Trustee was and continues to be qualified to serve as a Trustee, the Board has considered a variety of criteria, none of which, in isolation, was controlling. The Board believes that, collectively, the Trustees have balanced and diverse experience, qualifications, attributes, and skills, which allow the Board to operate effectively in governing the fund and protecting the interests of shareholders. Information about the specific experience, skills, attributes, and qualifications of each Trustee, which in each case led to the Board's conclusion that the Trustee should serve (or continue to serve) as a trustee of the fund, is provided below.
Board Structure and Oversight Function. Edward C. Johnson 3d is an interested person (as defined in the 1940 Act) and currently serves as Chairman. The Trustees have determined that an interested Chairman is appropriate and benefits shareholders because an interested Chairman has a personal and professional stake in the quality and continuity of services provided to the fund. Independent Trustees exercise their informed business judgment to appoint an individual of their choosing to serve as Chairman, regardless of whether the Trustee happens to be independent or a member of management. The Independent Trustees have determined that they can act independently and effectively without having an Independent Trustee serve as Chairman and that a key structural component for assuring that they are in a position to do so is for the Independent Trustees to constitute a substantial majority for the Board. The Independent Trustees also regularly meet in executive session. Ned C. Lautenbach serves as Chairman of the Independent Trustees and as such (i) acts as a liaison between the Independent Trustees and management with respect to matters important to the Independent Trustees and (ii) with management prepares agendas for Board meetings.
Fidelity funds are overseen by different Boards of Trustees. The fund's Board oversees Fidelity's equity and high income funds and another Board oversees Fidelity's investment-grade bond, money market, and asset allocation funds. The asset allocation funds may invest in Fidelity funds overseen by the fund's Board. The use of separate Boards, each with its own committee structure, allows the Trustees of each group of Fidelity funds to focus on the unique issues of the funds they oversee, including common research, investment, and operational issues. On occasion, the separate Boards establish joint committees to address issues of overlapping consequences for the Fidelity funds overseen by each Board.
The Trustees operate using a system of committees to facilitate the timely and efficient consideration of all matters of importance to the Trustees, the fund, and fund shareholders and to facilitate compliance with legal and regulatory requirements and oversight of the fund's activities and associated risks. The Board, acting through its committees, has charged FMR and its affiliates with (i) identifying events or circumstances the occurrence of which could have demonstrably adverse effects on the fund's business and/or reputation; (ii) implementing processes and controls to lessen the possibility that such events or circumstances occur or to mitigate the effects of such events or circumstances if they do occur; and (iii) creating and maintaining a system designed to evaluate continuously business and market conditions in order to facilitate the identification and implementation processes described in (i) and (ii) above. Because the day-to-day operations and activities of the fund are carried out by or through FMR, its affiliates and other service providers, the fund's exposure to risks is mitigated but not eliminated by the processes overseen by the Trustees. While each of the Board's committees has responsibility for overseeing different aspects of the fund's activities, oversight is exercised primarily through the Operations, Audit, and Compliance Committees. Appropriate personnel, including but not limited to the fund's Chief Compliance Officer (CCO), FMR's internal auditor, the independent accountants, the fund's Treasurer and portfolio management personnel, make periodic reports to the Board's committees, as appropriate. The responsibilities of each committee, including their oversight responsibilities, are described further under "Standing Committees of the Fund's Trustees."
Annual Report
Trustees and Officers - continued
The fund's Statement of Additional Information (SAI) includes more information about the Trustees. To request a free copy, call Fidelity at 1-877-208-0098.
Interested Trustees*:
Correspondence intended for each Trustee who is an interested person may be sent to Fidelity Investments, 82 Devonshire Street, Boston, Massachusetts 02109.
Name, Age; Principal Occupations and Other Relevant Experience+ |
Edward C. Johnson 3d (80) |
| Year of Election or Appointment: 1984 Mr. Johnson is Trustee and Chairman of the Board of Trustees of certain Trusts. Mr. Johnson serves as Chief Executive Officer, Chairman, and a Director of FMR LLC; Chairman and a Director of FMR; Chairman and a Director of Fidelity Research & Analysis Company (FRAC); Chairman and a Director of Fidelity Investments Money Management, Inc.; and Chairman and a Director of FMR Co., Inc. In addition, Mr. Johnson serves as Chairman and Director of FIL Limited. Previously, Mr. Johnson served as President of FMR LLC (2006-2007). |
Name, Age; Principal Occupations and Other Relevant Experience+ |
James C. Curvey (75) |
| Year of Election or Appointment: 2007 Mr. Curvey also serves as Trustee (2007-present) of other investment companies advised by FMR. Mr. Curvey is a Director of Fidelity Investments Money Management, Inc. (2009-present), Director of Fidelity Research & Analysis Co. (2009-present) and Director of FMR and FMR Co., Inc. (2007-present). Mr. Curvey is also Vice Chairman (2007-present) and Director of FMR LLC. In addition, Mr. Curvey serves as an Overseer for the Boston Symphony Orchestra and a member of the Trustees of Villanova University. Previously, Mr. Curvey was the Vice Chairman (2006-2007) and Director (2000-2007) of FMR Corp. |
* Trustees have been determined to be "Interested Trustees" by virtue of, among other things, their affiliation with the trust or various entities under common control with FMR.
+ The information above includes each Trustee's principal occupation during the last five years and other information relating to the experience, attributes, and skills relevant to each Trustee's qualifications to serve as a Trustee, which led to the conclusion that each Trustee should serve as a Trustee for the fund.
Independent Trustees:
Correspondence intended for each Independent Trustee (that is, the Trustees other than the Interested Trustees) may be sent to Fidelity Investments, P.O. Box 55235, Boston, Massachusetts 02205-5235.
Name, Age; Principal Occupations and Other Relevant Experience+ |
Dennis J. Dirks (62) |
| Year of Election or Appointment: 2005 Prior to his retirement in May 2003, Mr. Dirks was Chief Operating Officer and a member of the Board of The Depository Trust & Clearing Corporation (DTCC). He also served as President, Chief Operating Officer, and Board member of The Depository Trust Company (DTC) and President and Board member of the National Securities Clearing Corporation (NSCC). In addition, Mr. Dirks served as Chief Executive Officer and Board member of the Government Securities Clearing Corporation, Chief Executive Officer and Board member of the Mortgage-Backed Securities Clearing Corporation, as a Trustee and a member of the Finance Committee of Manhattan College (2005-2008), and as a Trustee and a member of the Finance Committee of AHRC of Nassau County (2006-2008). Mr. Dirks is a member of the Independent Directors Council (IDC) Governing Council (2010-Present) and Board of Directors for The Brookville Center for Children's Services, Inc. (2009-present). |
Alan J. Lacy (57) |
| Year of Election or Appointment: 2008 Mr. Lacy serves as Senior Adviser (2007-present) of Oak Hill Capital Partners, L.P. (private equity). Mr. Lacy also served as Chief Executive Officer (2000-2005) and Vice Chairman (2005-2006) of Sears Holdings Corporation and Sears, Roebuck and Co. (retail). In addition, Mr. Lacy serves as a member of the Board of Directors of The Western Union Company (global money transfer, 2006-present) and Bristol-Myers Squibb Company (global pharmaceuticals, 2007-present). Mr. Lacy is Chairman (2008-present) and a member (2006-present) of the Board of Trustees of The National Parks Conservation Association. |
Ned C. Lautenbach (66) |
| Year of Election or Appointment: 2000 Mr. Lautenbach is Chairman of the Independent Trustees of the Equity and High Income Funds (2006-present). Mr. Lautenbach currently serves as the Lead Director of the Eaton Corporation Board of Directors (diversified industrial, 1997-present). Mr. Lautenbach is also a member of the Board of Directors of the Philharmonic Center for the Arts in Naples, Florida (1999-
present); a member of the Board of Trustees of Fairfield University (2005-present); and a member of the Council on Foreign Relations (1994-present). Previously, Mr. Lautenbach was a Partner/Advisory Partner at Clayton, Dubilier & Rice, Inc. (private equity investment, 1998-2010), as well as a Director of Sony Corporation (2006-2007). |
Joseph Mauriello (66) |
| Year of Election or Appointment: 2008 Prior to his retirement in January 2006, Mr. Mauriello served in numerous senior management positions including Deputy Chairman and Chief Operating Officer (2004-2005), and Vice Chairman of Financial Services (2002-2004) of KPMG LLP US (professional services, 1965-2005). Mr. Mauriello currently serves as a member of the Board of Directors of XL Group plc. (global insurance and re-insurance, 2006-present) and of Arcadia Resources Inc. (health care services and products, 2007-present). Previously, Mr. Mauriello served as a Director of the Hamilton Funds of the Bank of New York (2006-2007). |
Cornelia M. Small (66) |
| Year of Election or Appointment: 2005 Ms. Small is a member of the Board of Directors of the Teagle Foundation (2009-present). Ms. Small is also a member of the Investment Committee, and Chair (2008-present) and a member of the Board of Trustees of Smith College. In addition, Ms. Small serves on the Investment Committee of the Berkshire Taconic Community Foundation (2008-present). Previously, Ms. Small served as Chairperson of the Investment Committee (2002-2008) of Smith College. In addition, Ms. Small served as Chief Investment Officer, Director of Global Equity Investments, and a member of the Board of Directors of Scudder, Stevens & Clark and Scudder Kemper Investments. |
William S. Stavropoulos (71) |
| Year of Election or Appointment: 2001 Mr. Stavropoulos is Vice Chairman of the Independent Trustees of the Equity and High Income Funds (2006-present). Mr. Stavropoulos serves as President and Founder of the Michigan Baseball Foundation, the Great Lakes Loons (2007-present). Mr. Stavropoulos is Chairman Emeritus of the Board of Directors of The Dow Chemical Company, where he previously served in numerous senior management positions, including President, CEO (1995-2000; 2002-2004), Chairman of the Executive Committee (2000-2006), and as a member of the Board of Directors (1990-2006). Currently, Mr. Stavropoulos is Chairman of Univar (global distributor of commodity specialty chemicals, 2010-present), a Director of Teradata Corporation (data warehousing and technology solutions, 2008-present), Chemical Financial Corporation, Maersk Inc. (industrial conglomerate), Tyco International, Inc. (multinational manufacturing and services, 2007-present), and a member of the Advisory Board for Metalmark Capital (private equity investment, 2005-present). Mr. Stavropoulos is a special advisor to Clayton, Dubilier & Rice, Inc. (private equity investment). In addition, Mr. Stavropoulos is a member of the University of Notre Dame Advisory Council for the College of Science. |
David M. Thomas (61) |
| Year of Election or Appointment: 2008 Previously, Mr. Thomas served as Executive Chairman (2005-2006) and Chairman and Chief Executive Officer (2000-2005) of IMS Health, Inc. (pharmaceutical and healthcare information solutions). In addition, Mr. Thomas serves as a member of the Board of Directors of Fortune Brands, Inc. (consumer products), and Interpublic Group of Companies, Inc. (marketing communication, 2004-present). |
Michael E. Wiley (60) |
| Year of Election or Appointment: 2008 Mr. Wiley also serves as a Director of Asia Pacific Exploration Consolidated (international oil and gas exploration and production, 2008-present). Mr. Wiley serves as a Director of Tesoro Corporation (independent oil refiner and marketer, 2005-present), and a Director of Bill Barrett Corporation (exploration and production, 2005-present). In addition, Mr. Wiley also serves as a Director of Post Oak Bank (privately-held bank, 2004-present). Previously, Mr. Wiley served as a member of the Board of Trustees of the University of Tulsa (2000-2006; 2007-2010), as a Senior Energy Advisor of Katzenbach Partners, LLC (consulting, 2006-2007), as an Advisory Director of Riverstone Holdings (private investment), Chairman, President, and CEO of Baker Hughes, Inc. (oilfield services, 2000-2004), and as Director of Spinnaker Exploration Company (exploration and production, 2001-2005). |
+ The information above includes each Trustee's principal occupation during the last five years and other information relating to the experience, attributes, and skills relevant to each Trustee's qualifications to serve as a Trustee, which led to the conclusion that each Trustee should serve as a Trustee for the fund.
Annual Report
Trustees and Officers - continued
Advisory Board Member and Executive Officers:
Correspondence intended for each executive officer and Peter S. Lynch may be sent to Fidelity Investments, 82 Devonshire Street, Boston, Massachusetts 02109.
Name, Age; Principal Occupation |
Peter S. Lynch (66) |
| Year of Election or Appointment: 2003 Member of the Advisory Board of Fidelity's Equity and High Income Funds. Mr. Lynch is Vice Chairman and a Director of FMR and FMR Co., Inc. In addition, Mr. Lynch serves as a Trustee of Boston College and as the Chairman of the Inner-City Scholarship Fund. Previously, Mr. Lynch served on the Special Olympics International Board of Directors (1997-2006). |
Kenneth B. Robins (41) |
| Year of Election or Appointment: 2008 President and Treasurer of Fidelity's Equity and High Income Funds. Mr. Robins also serves as President and Treasurer (2010-
present) and Assistant Treasurer (2009-present) of other Fidelity funds and is an employee of Fidelity Investments (2004-present). Previously, Mr. Robins served as Deputy Treasurer of the Fidelity funds (2005-2008) and Treasurer and Chief Financial Officer of The North Carolina Capital Management Trust: Cash and Term Portfolios (2006-2008). |
Bruce T. Herring (45) |
| Year of Election or Appointment: 2006 Vice President of certain Equity Funds. Mr. Herring also serves as Chief Investment Officer and Director of Fidelity Management & Research (U.K.) Inc. (2010-present) and Group Chief Investments Officer of FMR. Previously, Mr. Herring served as Vice President (2005-2006) and Senior Vice President (2006-2007) of Fidelity Management & Research Company, Vice President of FMR Co., Inc. (2001-2007) and as a portfolio manager for Fidelity U.S. Equity Funds. |
Brian B. Hogan (46) |
| Year of Election or Appointment: 2009 Vice President of certain Equity Funds and Vice President of Sector Funds. Mr. Hogan also serves as President of FMR's Equity Division (2009-present). Previously, Mr. Hogan served as Senior Vice President, Equity Research of FMR (2006-2009) and as a portfolio manager. |
Scott C. Goebel (42) |
| Year of Election or Appointment: 2008 Secretary and Chief Legal Officer (CLO) of the Fidelity funds. Mr. Goebel also serves as Secretary and CLO of The North Carolina Capital Management Trust: Cash and Term Portfolio (2008-present); General Counsel, Secretary, and Senior Vice President of FMR (2008-present) and FMR Co., Inc. (2008-present); Deputy General Counsel of FMR LLC; Chief Legal Officer of Fidelity Management & Research (Hong Kong) Limited (2008-present) and Assistant Secretary of Fidelity Management & Research (Japan) Inc. (2008-present), Fidelity Investments Money Management, Inc. (2008-present), Fidelity Management & Research (U.K.) Inc. (2008-present), and Fidelity Research and Analysis Company (2008-present). Previously, Mr. Goebel served as Assistant Secretary of the Funds (2007-2008) and as Vice President and Secretary of Fidelity Distributors Corporation (FDC) (2005-2007). |
William C. Coffey (41) |
| Year of Election or Appointment: 2009 Assistant Secretary of Fidelity's Equity and High Income Funds. Mr. Coffey also serves as Senior Vice President and Deputy General Counsel of FMR LLC (2010-present), and is an employee of Fidelity Investments. Previously, Mr. Coffey served as Vice President and Associate General Counsel of FMR LLC (2005-2009). |
Holly C. Laurent (56) |
| Year of Election or Appointment: 2008 Anti-Money Laundering (AML) Officer of the Fidelity funds. Ms. Laurent also serves as AML Officer of The North Carolina Capital Management Trust: Cash and Term Portfolio (2008-present) and is an employee of Fidelity Investments. Previously, Ms. Laurent was Senior Vice President and Head of Legal for Fidelity Business Services India Pvt. Ltd. (2006-2008), and Senior Vice President, Deputy General Counsel and Group Head for FMR LLC (2005-2006). |
Christine Reynolds (52) |
| Year of Election or Appointment: 2008 Chief Financial Officer of the Fidelity funds. Ms. Reynolds became President of Fidelity Pricing and Cash Management Services (FPCMS) in August 2008. Ms. Reynolds served as Chief Operating Officer of FPCMS (2007-2008). Previously, Ms. Reynolds served as President, Treasurer, and Anti-Money Laundering officer of the Fidelity funds (2004-2007). |
Kenneth A. Rathgeber (63) |
| Year of Election or Appointment: 2004 Chief Compliance Officer of Fidelity's Equity and High Income Funds. Mr. Rathgeber is Chief Compliance Officer of Fidelity Management & Research (Hong Kong) Limited (2008-present), Fidelity Management & Research (Japan) Inc. (2008-present), FMR (2005-present), FMR Co., Inc. (2005-present), Fidelity Management & Research (U.K.) Inc. (2005-present), Fidelity Research & Analysis Company (2005-present), Fidelity Investments Money Management, Inc. (2005-present), Pyramis Global Advisors, LLC (2005-present), and Strategic Advisers, Inc. (2005-present). |
Jeffrey S. Christian (49) |
| Year of Election or Appointment: 2009 Deputy Treasurer of the Fidelity funds. Mr. Christian is an employee of Fidelity Investments. Previously, Mr. Christian served as Chief Financial Officer (2008-2009) of certain Fidelity funds and Senior Vice President of Fidelity Pricing and Cash Management Services (FPCMS) (2004-2009). |
Bryan A. Mehrmann (49) |
| Year of Election or Appointment: 2005 Deputy Treasurer of the Fidelity funds. Mr. Mehrmann is an employee of Fidelity Investments. |
Adrien E. Deberghes (43) |
| Year of Election or Appointment: 2008 Deputy Treasurer of Fidelity's Equity and High Income Funds. Mr. Deberghes also serves as Assistant Treasurer of other Fidelity funds (2010-present) and is an employee of Fidelity Investments (2008-present). Previously, Mr. Deberghes served as Senior Vice President of Mutual Fund Administration at State Street Corporation (2007-2008), Senior Director of Mutual Fund Administration at Investors Bank & Trust (2005-2007), and Director of Finance for Dunkin' Brands (2000-2005). |
Stephanie J. Dorsey (41) |
| Year of Election or Appointment: 2010 Assistant Treasurer of Fidelity's Equity and High Income Funds. Ms. Dorsey also serves as Deputy Treasurer of other Fidelity funds (2008-present) and is an employee of Fidelity Investments (2008-present). Previously, Ms. Dorsey served as Treasurer (2004-2008) of the JPMorgan Mutual Funds and Vice President (2004-2008) of JPMorgan Chase Bank. |
John R. Hebble (52) |
| Year of Election or Appointment: 2009 Assistant Treasurer of Fidelity's Equity and High Income Funds. Mr. Hebble also serves as Treasurer and Chief Financial Officer of The North Carolina Capital Management Trust: Cash and Term Portfolio (2008-present), President and Treasurer of other Fidelity funds (2008-present) and is an employee of Fidelity Investments. |
Gary W. Ryan (52) |
| Year of Election or Appointment: 2005 Assistant Treasurer of the Fidelity funds. Mr. Ryan is an employee of Fidelity Investments. Previously, Mr. Ryan served as Vice President of Fund Reporting in Fidelity Pricing and Cash Management Services (FPCMS) (1999-2005). |
Jonathan Davis (42) |
| Year of Election or Appointment: 2010 Assistant Treasurer of the Fidelity funds. Mr. Davis is an employee of Fidelity Investments. Previously, Mr. Davis served as Vice President and Associate General Counsel of FMR LLC (2003-2010). |
Annual Report
The Board of Trustees of Fidelity Advisor China Region Fund voted to pay to shareholders of record at the opening of business on record date, the following distributions per share derived from capital gains realized from sales of portfolio securities, and dividends derived from net investment income:
| Pay Date | Record Date | Dividends | Capital Gains |
Institutional Class | 12/06/10 | 12/03/10 | $0.373 | $0.025 |
The fund designates 38% of the dividend distributed during the fiscal year as amounts which may be taken into account as a dividend for the purposes of the maximum rate under section 1(h)(11) of the Internal Revenue Code.
The amounts per share which represent income derived from sources within, and taxes paid to, foreign countries or possessions of the United States are as follows:
| Pay Date | Income | Taxes |
Institutional Class | 12/07/09 | $0.312 | $0.0314 |
The fund will notify shareholders in January 2011 of amounts for use in preparing 2010 income tax returns.
Annual Report
Board Approval of Investment Advisory Contracts and Management Fees
Fidelity China Region Fund
Each year, the Board of Trustees, including the Independent Trustees (together, the Board), votes on the renewal of the management contract and sub-advisory agreements (together, the Advisory Contracts) for the fund. The Board, assisted by the advice of fund counsel and Independent Trustees' counsel, requests and considers a broad range of information relevant to the renewal of the Advisory Contracts throughout the year.
The Board meets regularly and considers at each of its meetings factors that are relevant to its annual consideration of the renewal of the fund's Advisory Contracts, including the services and support provided to the fund and its shareholders. The Board has established various standing committees, each composed of Independent Trustees with varying backgrounds, to which the Board has assigned specific subject matter responsibilities in order to enhance effective decision-making by the Board. The Board, acting directly and through its Committees, requests and receives information concerning the annual consideration of the renewal of the fund's Advisory Contracts. The Board also meets as needed to consider matters specifically related to the Board's annual consideration of the renewal of Advisory Contracts. Members of the Board may also meet with trustees of other Fidelity funds through ad hoc joint committees to discuss certain matters relevant to the Fidelity funds.
At its July 2010 meeting, the Board of Trustees, including the Independent Trustees, unanimously determined to renew the fund's Advisory Contracts. In reaching its determination, the Board considered all factors it believed relevant, including (i) the nature, extent, and quality of the services to be provided to the fund and its shareholders (including the investment performance of the fund); (ii) the competitiveness of the fund's management fee and total expenses; (iii) the total costs of the services to be provided by and the profits to be realized by Fidelity from its relationship with the fund; (iv) the extent to which economies of scale would be realized as the fund grows; and (v) whether fee levels reflect these economies of scale, if any, for the benefit of fund shareholders.
In considering whether to renew the Advisory Contracts for the fund, the Board reached a determination, with the assistance of fund counsel and Independent Trustees' counsel and through the exercise of its business judgment, that the renewal of the Advisory Contracts is in the best interests of fund shareholders and that the compensation to be received by Fidelity under the management contract is fair and reasonable. The Board's decision to renew the Advisory Contracts was not based on any single factor noted above, but rather was based on a comprehensive consideration of all the information provided to the Board at its meetings throughout the year. The Board, in reaching its determination to renew the Advisory Contracts, is aware that shareholders in the fund have a broad range of investment choices available to them, including a wide choice among mutual funds offered by Fidelity's competitors, and that the fund's shareholders, with the opportunity to review and weigh the disclosure provided by the fund in its prospectus and other public disclosures, have chosen to invest in this fund, managed by Fidelity.
Nature, Extent, and Quality of Services Provided. The Board considered the staffing within the investment adviser, FMR, and the sub-advisers (together, the Investment Advisers), including the backgrounds of the fund's investment personnel and the fund's investment objective and discipline. The Independent Trustees also had discussions with senior management of Fidelity's investment operations and investment groups. The Board considered the structure of the portfolio manager compensation program and whether this structure provides appropriate incentives to act in the best interest of the fund.
Resources Dedicated to Investment Management and Support Services. The Board and the equity research subcommittee of the Board's Fund Oversight Committee reviewed the size, education, and experience of the Investment Advisers' investment staff, their use of technology, and the Investment Advisers' approach to recruiting, training, and retaining portfolio managers and other research, advisory, and management personnel. The Board noted that Fidelity's analysts have access to a variety of technological tools and market and securities data that enable them to perform both fundamental and quantitative analysis and to specialize in various disciplines. The Board considered Fidelity's extensive global research capabilities that enable the Investment Advisers to aggregate data from various sources in an effort to produce positive investment results. The Board also considered that Fidelity's portfolio managers and analysts have access to daily portfolio attribution that allows for monitoring of a fund's portfolio, as well as an electronic communication system that provides immediate real-time access to research concerning issuers and credit enhancers. The Board noted FMR's continued focus on strengthening the organization and discipline of equity portfolio management and research.
Shareholder and Administrative Services. The Board considered (i) the nature, extent, quality, and cost of advisory, administrative, and shareholder services performed by the Investment Advisers and their affiliates under the Advisory Contracts and under separate agreements covering transfer agency, pricing and bookkeeping, and securities lending services for the fund; (ii) the nature and extent of the investment adviser's supervision of third party service providers, principally custodians and subcustodians; and (iii) the resources devoted to, and the record of compliance with, the fund's compliance policies and procedures. The Board also reviewed the allocation of fund brokerage, including allocations to brokers affiliated with the Investment Advisers, the use of brokerage commissions to pay fund expenses, and the use of "soft" commission dollars to pay for research services.
The Board noted that the growth of fund assets over time across the complex allows Fidelity to reinvest in the development of services designed to enhance the value or convenience of the Fidelity funds as investment vehicles. These services include 24-hour access to account information and market information through phone representatives and over the Internet, and investor education materials and asset allocation tools.
Investment in a Large Fund Family. The Board considered the benefits to shareholders of investing in a Fidelity fund, including the benefits of investing in a fund that is part of a large family of funds offering a variety of investment disciplines and providing a large variety of mutual fund investor services. The Board noted that Fidelity had taken, or had made recommendations that resulted in the Fidelity funds taking, a number of actions over the previous year that benefited particular funds, including (i) dedicating additional resources to investment research and restructuring and broadening the focus of the investment research teams; (ii) bolstering the senior management team that oversees asset management; (iii) launching Class F of certain funds as a lower-fee class available to Freedom K and Freedom Index Funds; (iv) lowering the initial investment minimums and ongoing balance requirements for Real Estate High Income Fund; (v) eliminating subsequent purchase minimums for all funds and adding a waiver of the investment minimum requirement for new accounts opened with the proceeds of a systematic withdrawal plan; (vi) eliminating the withdrawal minimum and maximum limits for systematic withdrawals from Advisor funds; (vii) expanding sales load waivers on Class A shares for Destiny Planholders and expanding Institutional Class eligibility for Class O Destiny Planholders; and (viii) changing certain Class A and Class T sales charge structures to further align them with industry practices.
Annual Report
Board Approval of Investment Advisory Contracts and Management Fees - continued
Investment Performance. The Board considered whether the fund has operated in accordance with its investment objective, as well as its record of compliance with its investment restrictions. It also reviewed the fund's absolute investment performance for each class, as well as the fund's relative investment performance for each class measured over multiple periods against a broad-based securities market index. The Board noted that FMR does not believe that a meaningful peer group exists against which to compare the fund's performance. The following charts considered by the Board show, over the one-, three-, and five-year periods ended December 31, 2009, as available, the cumulative total returns of the retail class and Class B of the fund and the cumulative total returns of a broad-based securities market index ("benchmark"). The returns of the retail class and Class B show the performance of the highest performing class (based on five-year performance) and the lowest performing class (based on one-year performance), respectively.
Fidelity China Region Fund
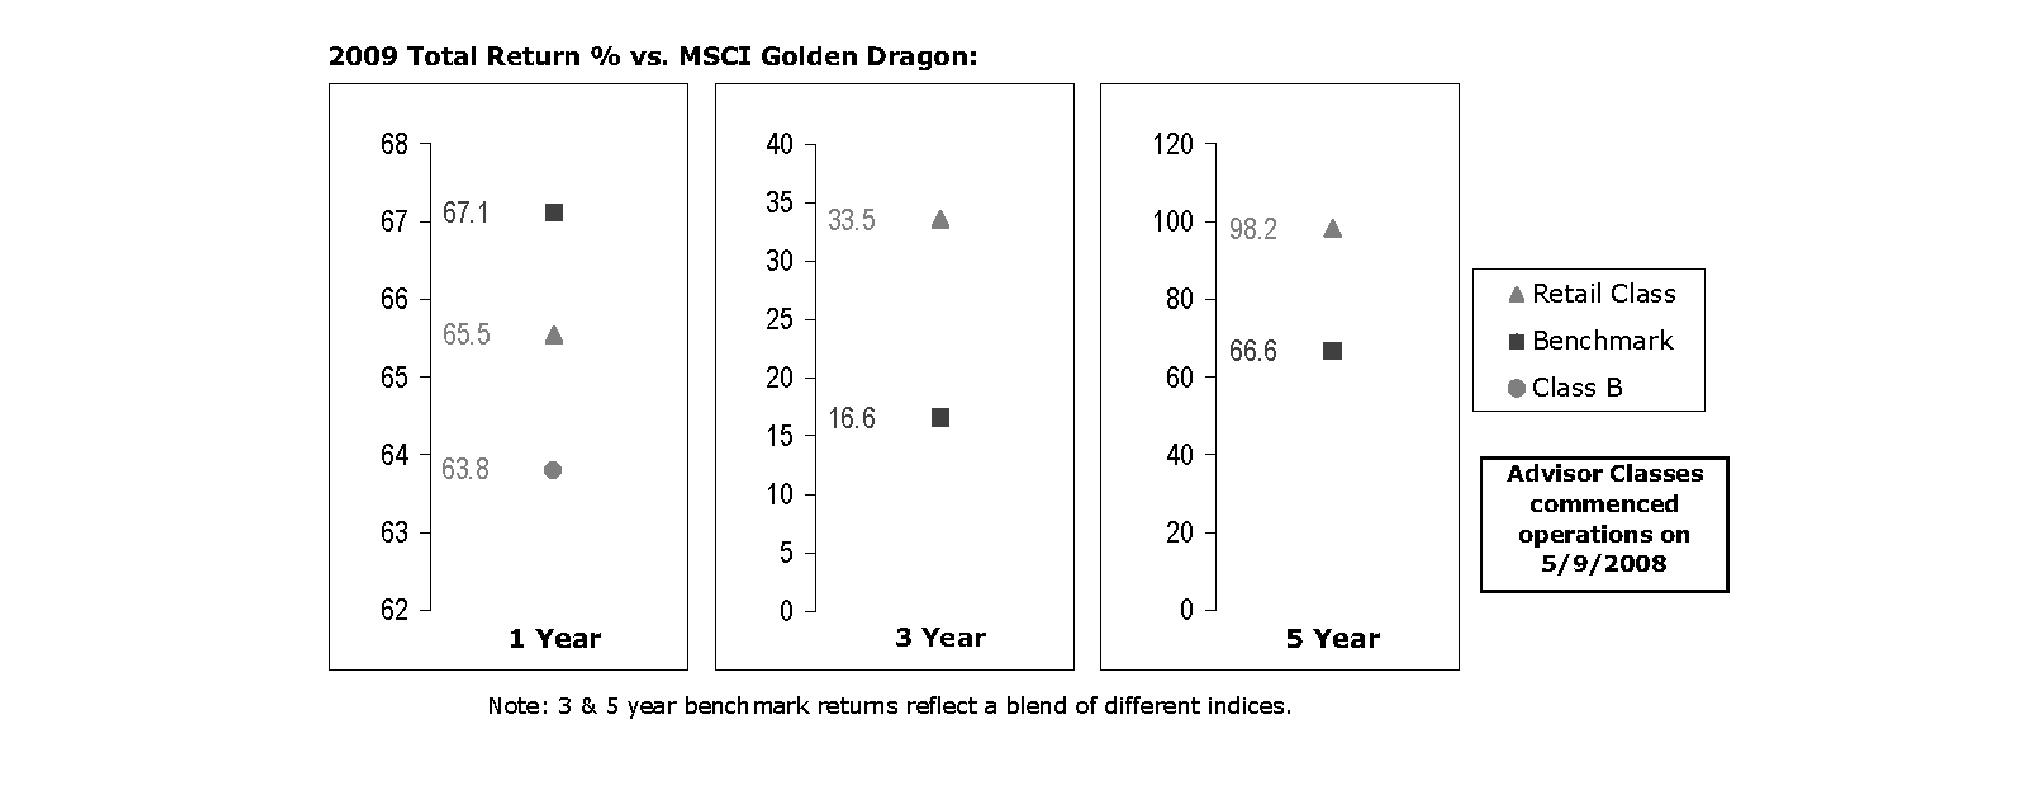
The Board noted that the investment performance of the retail class of the fund compared favorably to its benchmark for the three- and five-year periods, although the fund's one-year cumulative total return was lower than its benchmark. The Board considered that the variations in performance among the fund's classes reflect the variations in class expenses, which result in lower performance for higher expense classes. The Board also reviewed the fund's performance since inception as well as performance in the current year.
Based on its review, and giving particular weight to the nature and quality of the resources dedicated by the Investment Advisers to maintain and improve relative performance and factoring in the unprecedented market events in recent years, the Board concluded that the nature, extent, and quality of investment management and support services and of shareholder and administrative services provided to the fund will benefit the fund's shareholders, particularly in light of the Board's view that the fund's shareholders benefit from investing in a fund that is part of a large family of funds offering a variety of investment disciplines and services.
Competitiveness of Management Fee and Total Fund Expenses. The Board considered the fund's management fee and total expenses compared to "mapped groups" of competitive funds and classes. Fidelity creates "mapped groups" by combining similar Lipper investment objective categories that have comparable management fee characteristics. Combining Lipper investment objective categories aids the Board's management fee and total expense comparisons by broadening the competitive group used for comparison and by reducing the number of universes to which various Fidelity funds are compared.
Annual Report
Management Fee. The Board considered two proprietary management fee comparisons for the 12-month periods shown in the chart below. The group of Lipper funds used by the Board for management fee comparisons is referred to below as the "Total Mapped Group." The Total Mapped Group comparison focuses on a fund's standing relative to the total universe of comparable funds available to investors, in terms of gross management fees before expense reimbursements or caps. "TMG %" represents the percentage of funds in the Total Mapped Group that had management fees that were lower than the fund's. For example, a TMG % of 7% means that 93% of the funds in the Total Mapped Group had higher management fees than the fund. The "Asset-Size Peer Group" (ASPG) comparison focuses on a fund's standing relative to non-Fidelity funds similar in size to the fund within the Total Mapped Group. The ASPG represents at least 15% of the funds in the Total Mapped Group with comparable asset size and management fee characteristics, subject to a minimum of 50 funds (or all funds in the Total Mapped Group if fewer than 50). Additional information, such as the ASPG quartile in which the fund's management fee ranked, is also included in the chart and considered by the Board.
Fidelity China Region Fund

The Board noted that the fund's management fee ranked below the median of its Total Mapped Group and below the median of its ASPG for 2009.
Based on its review, the Board concluded that the fund's management fee is fair and reasonable in light of the services that the fund receives and the other factors considered.
Total Expenses. In its review of each class's total expenses, the Board considered the fund's management fee as well as other fund or class expenses, as applicable, such as transfer agent fees, pricing and bookkeeping fees, fund-paid 12b-1 fees, and custodial, legal, and audit fees. The Board also noted the effects of any waivers and reimbursements on fees and expenses. As part of its review, the Board also considered current and historical total expenses of each class of the fund compared to competitive fund median expenses. Each class of the fund is compared to those funds and classes in the Total Mapped Group (used by the Board for management fee comparisons) that have a similar sales load structure.
The Board noted that the total expenses of each class ranked below its competitive median for 2009.
Fees Charged to Other Fidelity Clients. The Board also considered Fidelity fee structures and other information with respect to clients of FMR and its affiliates, such as other mutual funds advised or subadvised by FMR or its affiliates, pension plan clients, and other institutional clients. In March 2010, the Board created an ad hoc joint committee with the board of other Fidelity funds (the Committee) to review and compare Fidelity's institutional investment advisory business with its business of providing services to the Fidelity funds, including the differences in services provided, fees charged, and costs incurred, as well as competition in their respective marketplaces.
Based on its review of total expenses and fees charged to other Fidelity clients, the Board concluded that the total expenses of each class of the fund were reasonable in light of the services that the fund and its shareholders receive and the other factors considered, including the findings of the Committee.
Costs of the Services and Profitability. The Board considered the revenues earned and the expenses incurred by Fidelity in conducting the business of developing, marketing, distributing, managing, administering and servicing the fund and its shareholders. The Board also considered the level of Fidelity's profits in respect of all the Fidelity funds.
Annual Report
Board Approval of Investment Advisory Contracts and Management Fees - continued
On an annual basis, FMR presents to the Board Fidelity's profitability for the fund. Fidelity calculates the profitability for each fund, as well as aggregate profitability for groups of Fidelity funds and all Fidelity funds, using a series of detailed revenue and cost allocation methodologies which originate with the audited books and records of Fidelity. The Audit Committee of the Board reviews any significant changes from the prior year's methodologies.
PricewaterhouseCoopers LLP (PwC), independent registered public accounting firm and auditor to Fidelity and certain Fidelity funds, has been engaged annually by the Board as part of the Board's assessment of Fidelity's profitability analysis. PwC's engagement includes the review and assessment of Fidelity's methodologies used in determining the revenues and expenses attributable to Fidelity's mutual fund business, and completion of agreed-upon procedures surrounding the mathematical accuracy of fund profitability and its conformity to allocation methodologies. After considering PwC's reports issued under the engagement and information provided by Fidelity, the Board believes that while other allocation methods may also be reasonable, Fidelity's profitability methodologies are reasonable in all material respects.
The Board has also reviewed Fidelity's non-fund businesses and fall-out benefits related to the mutual fund business as well as cases where Fidelity's affiliates may benefit from or be related to the fund's business.
The Board considered the costs of the services provided by and the profits realized by Fidelity in connection with the operation of the fund and were satisfied that the profitability was not excessive in the circumstances.
Economies of Scale. The Board considered whether there have been economies of scale in respect of the management of the Fidelity funds, whether the Fidelity funds (including the fund) have appropriately benefited from any such economies of scale, and whether there is potential for realization of any further economies of scale. The Board considered the extent to which the fund will benefit from economies of scale through increased services to the fund, through waivers or reimbursements, or through fee or expense reductions.
In February 2009, the Board and the board of other Fidelity funds created an ad hoc committee (the Economies of Scale Committee) to analyze whether FMR attains economies of scale in respect of the management and servicing of the Fidelity funds, whether the Fidelity funds have appropriately benefited from such economies of scale, and whether there is potential for realization of any further economies of scale.
The Board recognized that the fund's management contract incorporates a "group fee" structure, which provides for lower group fee rates as total fund assets under FMR's management increase, and for higher group fee rates as total fund assets under FMR's management decrease. FMR calculates the group fee rates based on a tiered asset "breakpoint" schedule that varies based on asset class. The Board considered that the group fee is designed to deliver the benefits of economies of scale to fund shareholders when total Fidelity fund assets increase, even if assets of any particular fund are unchanged or have declined, because some portion of Fidelity's costs are attributable to services provided to all Fidelity funds, and all funds benefit if those costs can be allocated among more assets. The Board concluded that, given the group fee structure, fund shareholders will benefit from lower management fees as assets under FMR's management increase at the fund complex level, regardless of whether Fidelity achieves any such economies of scale.
The Board concluded, considering the findings of the Economies of Scale Committee, that any potential economies of scale are being appropriately shared between fund shareholders and Fidelity.
Additional Information Requested by the Board. In order to develop fully the factual basis for consideration of the Fidelity funds' Advisory Contracts, the Board requested and received additional information on certain topics, including (i) fund performance trends, actions to be taken by FMR to improve certain funds' overall performance, and Fidelity's long-term strategies for certain funds; (ii) portfolio manager changes that have occurred during the past year and length of portfolio manager tenure for different categories of funds over time; (iii) Fidelity's compensation structure for portfolio managers, research analysts, and other key personnel, the rationale for the compensation structure, and how the compensation structure provides appropriate performance incentives; (iv) the amount of the investment that each portfolio manager has made in the Fidelity fund(s) that he or she manages; (v) management and other fees paid by FMR to affiliated sub-advisers on behalf of the Fidelity funds; (vi) Fidelity's fee structures and rationale for recommending different fees among different categories of funds; (vii) Fidelity's rationale for recommending which funds should have a performance adjustment component as part of their management fees; (viii) the rationale for any differences between fund fee structures and fee structures in place for other Fidelity clients; and (ix) explanations regarding the relative total expenses borne by certain funds and classes, total expense competitive trends, and actions that might be taken by FMR to reduce total expenses for certain funds and classes.
Based on its evaluation of all of the conclusions noted above, and after considering all factors it believed relevant, the Board ultimately concluded that the advisory fee structures are fair and reasonable, and that the fund's Advisory Contracts should be renewed.
Annual Report
Investment Adviser
Fidelity Management & Research Company
Boston, MA
Investment Sub-Advisers
FMR Co., Inc.
Fidelity Management & Research
(U.K.) Inc.
Fidelity Research & Analysis Company
FIL Investments (Japan) Limited
FIL Investment Advisors
FIL Investment Advisors
(U.K.) Ltd.
Fidelity Management & Research
(Hong Kong) Limited
Fidelity Management & Research
(Japan) Inc.
General Distributor
Fidelity Distributors Corporation
Boston, MA
Transfer and Service Agents
Fidelity Investments Institutional
Operations Company, Inc.
Boston, MA
Fidelity Service Company, Inc.
Boston, MA
Custodian
Brown Brothers Harriman & Co.,
Boston, MA
AHKCI-UANN-1210
1.861450.102
Fidelity®
Emerging Markets
Fund -
Class K
Annual Report
October 31, 2010
(2_fidelity_logos) (Registered_Trademark)
Contents
Chairman's Message | <Click Here> | The Chairman's message to shareholders. |
Performance | <Click Here> | How the fund has done over time. |
Management's Discussion of Fund Performance | <Click Here> | The Portfolio Manager's review of fund performance and strategy. |
Shareholder Expense Example | <Click Here> | An example of shareholder expenses. |
Investment Changes | <Click Here> | A summary of major shifts in the fund's investments over the past six months. |
Investments | <Click Here> | A complete list of the fund's investments with their market values. |
Financial Statements | <Click Here> | Statements of assets and liabilities, operations, and changes in net assets, as well as financial highlights. |
Notes | <Click Here> | Notes to the financial statements. |
Report of Independent Registered Public Accounting Firm | <Click Here> | |
Trustees and Officers | <Click Here> | |
Distributions | <Click Here> | |
Board Approval of Investment Advisory Contracts and Management Fees | <Click Here> | |
To view a fund's proxy voting guidelines and proxy voting record for the 12-month period ended June 30, visit http://www.fidelity.com/proxyvotingresults or visit the Securities and Exchange Commission's (SEC) web site at http://www.sec.gov. You may also call 1-800-835-5092 to request a free copy of the proxy voting guidelines.
Standard & Poor's, S&P and S&P 500 are registered service marks of The McGraw-Hill Companies, Inc. and have been licensed for use by Fidelity Distributors Corporation.
Other third party marks appearing herein are the property of their respective owners.
All other marks appearing herein are registered or unregistered trademarks or service marks of FMR LLC or an affiliated company.
This report and the financial statements contained herein are submitted for the general information of the shareholders of the fund. This report is not authorized for distribution to prospective investors in the fund unless preceded or accompanied by an effective prospectus.
A fund files its complete schedule of portfolio holdings with the SEC for the first and third quarters of each fiscal year on Form N-Q. Forms N-Q are available on the SEC's web site at http://www.sec.gov. A fund's Forms N-Q may be reviewed and copied at the SEC's Public Reference Room in Washington, DC. Information regarding the operation of the SEC's Public Reference Room may be obtained by calling 1-800-SEC-0330. For a complete list of a fund's portfolio holdings, view the most recent holdings listing, semiannual report, or annual report on Fidelity's web site at http://www.fidelity.com or http://www.advisor.fidelity.com, as applicable.
NOT FDIC INSURED • MAY LOSE VALUE • NO BANK GUARANTEE
Neither the fund nor Fidelity Distributors Corporation is a bank.
Annual Report
(photo_of_Edward_C_Johnson_3d)
Dear Shareholder:
Equities have staged a rally in the second half of 2010, shaking off concerns about the European debt crisis and the possibility of a double-dip recession in the U.S. Although the short-term surge pushed major equity indexes back into positive territory for the year, several questions remain about the longer-term outlook, including lackluster economic growth and persistently high unemployment. Financial markets are always unpredictable, of course, but there also are several time-tested investment principles that can help put the odds in your favor.
One of the basic tenets is to invest for the long term. Over time, riding out the markets' inevitable ups and downs has proven much more effective than selling into panic or chasing the hottest trend. Even missing only a few of the markets' best days can significantly diminish investor returns. Patience also affords the benefits of compounding - of earning interest on additional income or reinvested dividends and capital gains. There can be tax advantages and cost benefits to consider as well. While staying the course doesn't eliminate risk, it can considerably lessen the effect of short-term declines.
You can further manage your investing risk through diversification. And today, more than ever, geographic diversification should be taken into account. Studies indicate that asset allocation is the single most important determinant of a portfolio's long-term success. The right mix of stocks, bonds and cash - aligned to your particular risk tolerance and investment objective - is very important. Age-appropriate rebalancing is also an essential aspect of asset allocation. For younger investors, an emphasis on equities - which historically have been the best-performing asset class over time - is encouraged. As investors near their specific goal, such as retirement or sending a child to college, consideration may be given to replacing volatile assets (e.g. common stocks) with more-stable fixed investments (bonds or savings plans).
A third principle - investing regularly - can help lower the average cost of your purchases. Investing a certain amount of money each month or quarter helps ensure you won't pay for all your shares at market highs. This strategy - known as dollar cost averaging - also reduces "emotion" from investing, helping shareholders avoid selling weak performers just prior to an upswing, or chasing a hot performer just before a correction.
We invite you to contact us via the Internet, through our Investor Centers or by phone. It is our privilege to provide you the information you need to make the investments that are right for you.
Sincerely,
(The chairman's signature appears here.)
Edward C. Johnson 3d
Annual Report
Average annual total return reflects the change in the value of an investment, assuming reinvestment of the class' distributions from dividend income and capital gains (the profits earned upon the sale of securities that have grown in value, if any) and assuming a constant rate of performance each year. The $10,000 table and the fund's returns do not reflect the deduction of taxes that a shareholder would pay on fund distributions or the redemption of fund shares. During periods of reimbursement by Fidelity, a fund's total returns will be greater than it would be had the reimbursement not occurred. How a fund did yesterday is no guarantee of how it will do tomorrow.
Average Annual Total Returns
Periods ended October 31, 2010 | Past 1
year | Past 5
years | Past 10
years |
Class K A | 26.03% | 12.64% | 12.97% |
A The initial offering of Class K shares took place on May 9, 2008. Returns prior to May 9, 2008 are those of Fidelity Emerging Markets Fund, the original class of the fund.
$10,000 Over 10 Years
Let's say hypothetically that $10,000 was invested in Fidelity Emerging Markets Fund - Class K on October 31, 2000. The chart shows how the value of your investment would have changed, and also shows how the MSCI® Emerging Markets (EM) Index performed over the same period. The initial offering of Class K took place on May 9, 2008. See above for additional information regarding the performance of Class K.
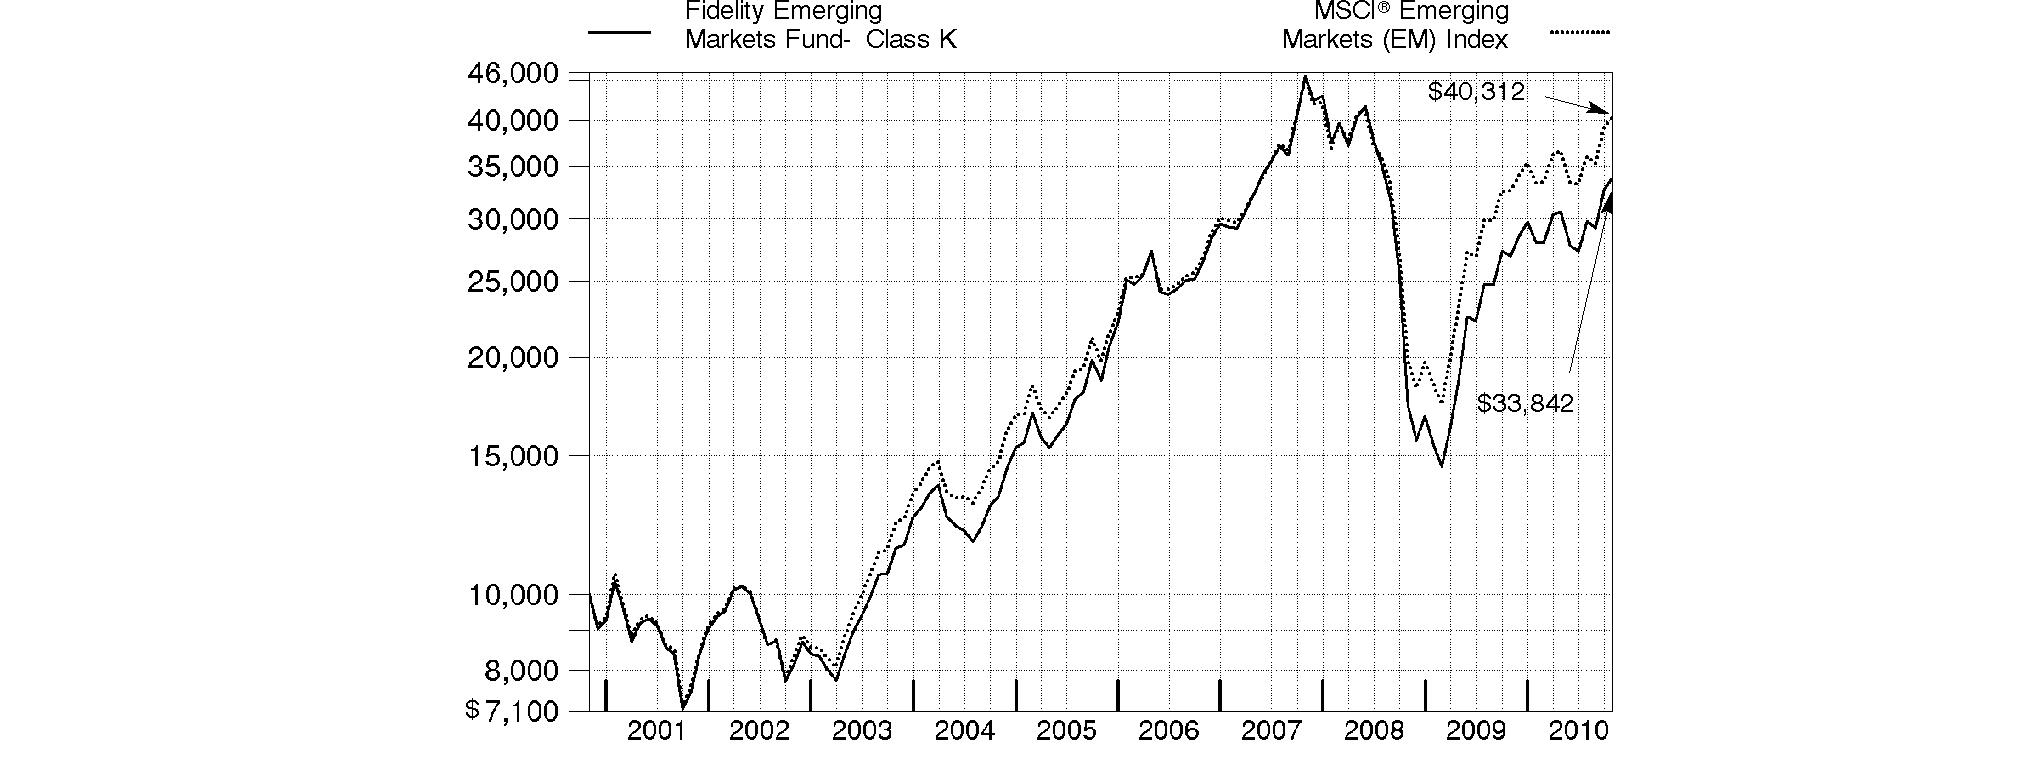
Annual Report
Market Recap: International stocks rode a wave of volatility similar to that of their U.S. counterparts during the 12 months ending October 31, 2010. Stocks gained modestly in the first half of the period, despite growing concerns about the European debt crisis. Sentiment turned decidedly negative in May and June, however, and the market suffered a precipitous decline. These losses were more than offset during the last four months of the period, when signs of economic growth and subsiding debt fears helped propel international stocks about 21%. For the full year, the MSCI® ACWI® (All Country World Index) ex USA Index gained 12.76%, boosted in part by a generally depreciating U.S. dollar. Within the index, Canada and emerging markets were standouts, returning 23% and 24%, respectively. Results in the latter group were led by strong-performing India, Mexico and South Africa, while China fell short of the MSCI benchmark due to cooling economic growth. The developed Asia ex Japan segment rose 16% for the period, lifted by solid results from Singapore and Hong Kong. Meanwhile, Europe rose just 9%, held back mainly by debt-riddled Spain and Italy, as well as lagging major constituent France. Japan returned only 5%, a result of that nation's continued weak economy.
Comments from Robert von Rekowsky, Portfolio Manager of Fidelity® Emerging Markets Fund: During the past year, the fund's Class K shares gained 26.03%, topping the 23.89% gain return of the MSCI Emerging Markets Index. Relative performance was aided by stock selection and an overweighting in consumer discretionary. Solid picks in information technology, energy and materials also bolstered our results, as did underweighting financials. From a country standpoint, security selection in Russia, China, India and South Korea aided performance, along with an overweighting and rewarding stock picking in Indonesia. Two Chinese stocks topped our list of relative contributors: an out-of-benchmark stake in Internet search/advertising Baidu and not owning weak-performing index component China Life Insurance. Indonesian tobacco producer/distributor Gudang Garam also bolstered results. On the negative side, a small cash position dampened the fund's gain in a rising market. Weak stock selection and an underweighting in industrials also hurt, as did lackluster picks in utilities and telecommunication services. Geographically, our selections in Brazil were weak, and underweighting Chile also hurt. Hungarian holding OTP Bank suffered from that nation's decision to impose a bank tax, and I liquidated the position. Russian oil producer Rosneft also detracted.
The views expressed above reflect those of the portfolio manager(s) only through the end of the period as stated on the cover of this report and do not necessarily represent the views of Fidelity or any other person in the Fidelity organization. Any such views are subject to change at any time based upon market or other conditions and Fidelity disclaims any responsibility to update such views. These views may not be relied on as investment advice and, because investment decisions for a Fidelity fund are based on numerous factors, may not be relied on as an indication of trading intent on behalf of any Fidelity fund.
Annual Report
Fidelity Emerging Markets Fund
As a shareholder of the Fund, you incur two types of costs: (1) transaction costs, including redemption fees, and (2) ongoing costs, including management fees and other Fund expenses. This Example is intended to help you understand your ongoing costs (in dollars) of investing in the Fund and to compare these costs with the ongoing costs of investing in other mutual funds.
The Example is based on an investment of $1,000 invested at the beginning of the period and held for the entire period (May 1, 2010 to October 31, 2010).
Actual Expenses
The first line of the accompanying table for each class of the Fund provides information about actual account values and actual expenses. You may use the information in this line, together with the amount you invested, to estimate the expenses that you paid over the period. Simply divide your account value by $1,000.00 (for example, an $8,600 account value divided by $1,000.00 = 8.6), then multiply the result by the number in the first line for a class of the Fund under the heading entitled "Expenses Paid During Period" to estimate the expenses you paid on your account during this period. A small balance maintenance fee of $12.00 that is charged once a year may apply for certain accounts with a value of less than $2,000. This fee is not included in the table below. If it was, the estimate of expenses you paid during the period would be higher, and your ending account value lower, by this amount. In addition, the Fund, as a shareholder in the underlying Fidelity Central Funds, will indirectly bear its pro-rata share of the fees and expenses incurred by the underlying Fidelity Central Funds. These fees and expenses are not included in the Fund's annualized expense ratio used to calculate the expense estimate in the table below.
Hypothetical Example for Comparison Purposes
The second line of the accompanying table for each class of the Fund provides information about hypothetical account values and hypothetical expenses based on a Class' actual expense ratio and an assumed rate of return of 5% per year before expenses, which is not the Class' actual return. The hypothetical account values and expenses may not be used to estimate the actual ending account balance or expenses you paid for the period. You may use this information to compare the ongoing costs of investing in the Fund and other funds. To do so, compare this 5% hypothetical example with the 5% hypothetical examples that appear in the shareholder reports of the other funds. A small balance maintenance fee of $12.00 that is charged once a year may apply for certain accounts with a value of less than $2,000. This fee is not included in the table below. If it was, the estimate of expenses you paid during the period would be higher, and your ending account value lower, by this amount. In addition, the Fund, as a shareholder in the underlying Fidelity Central Funds, will indirectly bear its pro-rata share of the fees and expenses incurred by the underlying Fidelity Central Funds. These fees and expenses are not included in the Fund's annualized expense ratio used to calculate the expense estimate in the table below.
Please note that the expenses shown in the table are meant to highlight your ongoing costs only and do not reflect any transaction costs. Therefore, the second line of the table is useful in comparing ongoing costs only, and will not help you determine the relative total costs of owning different funds. In addition, if these transactional costs were included, your costs would have been higher.
| Annualized
Expense Ratio | Beginning
Account Value
May 1, 2010 | Ending
Account Value
October 31, 2010 | Expenses Paid
During Period*
May 1, 2010 to October 31, 2010 |
Emerging Markets | 1.13% | | | |
Actual | | $ 1,000.00 | $ 1,105.80 | $ 6.00 |
Hypothetical A | | $ 1,000.00 | $ 1,019.51 | $ 5.75 |
Class K | .90% | | | |
Actual | | $ 1,000.00 | $ 1,107.10 | $ 4.78 |
Hypothetical A | | $ 1,000.00 | $ 1,020.67 | $ 4.58 |
A 5% return per year before expenses
* Expenses are equal to each Class' annualized expense ratio, multiplied by the average account value over the period, multiplied by 184/365 (to reflect the one-half year period).
Annual Report
Fidelity Emerging Markets Fund
Investment Changes (Unaudited)
Geographic Diversification (% of fund's net assets) |
As of October 31, 2010 |
| Brazil | 13.6% | |
| Korea (South) | 11.6% | |
| India | 8.7% | |
| Russia | 7.9% | |
| China | 7.8% | |
| Taiwan | 7.0% | |
| South Africa | 6.4% | |
| Indonesia | 6.0% | |
| Hong Kong | 4.0% | |
| Other | 27.0% | |

Percentages are adjusted for the effect of futures contracts, if applicable. |
As of April 30, 2010 |
| Brazil | 14.0% | |
| Korea (South) | 12.0% | |
| Russia | 8.5% | |
| China | 7.9% | |
| South Africa | 7.5% | |
| Taiwan | 6.8% | |
| India | 6.7% | |
| Indonesia | 4.4% | |
| Hong Kong | 4.0% | |
| Other | 28.2% | |

Percentages are adjusted for the effect of futures contracts, if applicable. |
Asset Allocation |
| % of fund's
net assets | % of fund's net assets
6 months ago |
Stocks | 98.2 | 97.2 |
Short-Term Investments and Net Other Assets | 1.8 | 2.8 |
Top Ten Stocks as of October 31, 2010 |
| % of fund's
net assets | % of fund's net assets
6 months ago |
America Movil SAB de CV Series L sponsored ADR (Mexico, Wireless Telecommunication Services) | 2.1 | 1.3 |
Petroleo Brasileiro SA - Petrobras (PN) (non-vtg.) (Brazil, Oil, Gas & Consumable Fuels) | 2.0 | 2.9 |
Vale SA (PN-A) sponsored ADR (Brazil, Metals & Mining) | 2.0 | 3.5 |
Samsung Electronics Co. Ltd. (Korea (South), Semiconductors & Semiconductor Equipment) | 1.9 | 2.5 |
Banco Bradesco SA (PN) sponsored ADR (Brazil, Commercial Banks) | 1.8 | 1.3 |
CNOOC Ltd. (Hong Kong, Oil, Gas & Consumable Fuels) | 1.8 | 1.5 |
Industrial & Commercial Bank of China Ltd. (H Shares) (China, Commercial Banks) | 1.8 | 1.6 |
China Mobile (Hong Kong) Ltd. (Hong Kong, Wireless Telecommunication Services) | 1.5 | 1.3 |
Hyundai Motor Co. (Korea (South), Automobiles) | 1.4 | 1.3 |
Sberbank (Savings Bank of the Russian Federation) (Russia, Commercial Banks) | 1.4 | 1.2 |
| 17.7 | |
Market Sectors as of October 31, 2010 |
| % of fund's
net assets | % of fund's net assets
6 months ago |
Financials | 26.0 | 22.0 |
Materials | 16.0 | 16.3 |
Energy | 13.3 | 13.1 |
Consumer Discretionary | 10.7 | 8.3 |
Information Technology | 9.4 | 14.6 |
Industrials | 7.2 | 5.5 |
Telecommunication Services | 6.9 | 7.5 |
Consumer Staples | 5.0 | 4.5 |
Utilities | 2.0 | 2.8 |
Health Care | 1.7 | 2.6 |
Annual Report
Fidelity Emerging Markets Fund
Investments October 31, 2010
Showing Percentage of Net Assets
Common Stocks - 98.2% |
| Shares | | Value |
Argentina - 0.4% |
Banco Macro SA sponsored ADR | 363,700 | | $ 18,130,445 |
Austria - 0.2% |
Erste Bank AG | 218,600 | | 9,864,265 |
Bahamas (Nassau) - 0.2% |
Petrominerales Ltd. | 290,000 | | 7,429,846 |
Bailiwick of Jersey - 0.7% |
Heritage Oil PLC | 1,647,993 | | 9,095,944 |
Randgold Resources Ltd. sponsored ADR | 199,700 | | 18,755,824 |
West China Cement Ltd. (a) | 14,412,000 | | 5,577,939 |
TOTAL BAILIWICK OF JERSEY | | 33,429,707 |
Bermuda - 2.4% |
Aquarius Platinum Ltd.: | | | |
(Australia) | 3,233,117 | | 18,592,187 |
(United Kingdom) | 1,080,422 | | 6,236,786 |
China Yurun Food Group Ltd. | 5,091,000 | | 19,802,438 |
CNPC (Hong Kong) Ltd. | 15,122,000 | | 19,235,984 |
Credicorp Ltd. (NY Shares) | 91,200 | | 11,480,256 |
Jinhui Shipping & Transportation Ltd. (a) | 476,400 | | 1,894,445 |
Orient Overseas International Ltd. | 2,771,000 | | 24,291,495 |
Sinofert Holdings Ltd. (a) | 14,732,000 | | 7,792,446 |
Texwinca Holdings Ltd. | 7,198,000 | | 7,856,163 |
TOTAL BERMUDA | | 117,182,200 |
Brazil - 13.6% |
AES Tiete SA (PN) (non-vtg.) | 659,800 | | 9,094,939 |
Banco Bradesco SA (PN) sponsored ADR (d) | 4,218,750 | | 87,750,000 |
Banco do Brasil SA | 1,781,300 | | 34,658,494 |
Banco do Estado do Rio Grande do Sul SA | 484,900 | | 5,327,287 |
Brascan Residential Properties SA | 806,600 | | 4,390,498 |
Brasil Insurance Participacoes e Administracao SA (a) | 6,400 | | 5,078,768 |
Companhia de Bebidas das Americas (AmBev) (PN) sponsored ADR | 238,200 | | 33,166,968 |
Companhia Energetica de Minas Gerais (CEMIG) (PN) sponsored ADR (non-vtg.) (d) | 9,515 | | 169,748 |
Companhia Siderurgica Nacional SA (CSN) sponsored ADR (d) | 2,292,396 | | 38,695,644 |
Confab Industrial SA (PN) (non-vtg.) | 791,900 | | 2,862,794 |
Drogasil SA | 317,000 | | 8,018,170 |
Eletropaulo Metropolitana SA (PN-B) | 360,900 | | 6,300,688 |
Estacio Participacoes SA | 351,400 | | 5,248,692 |
Even Construtora e Incorporadora SA | 598,400 | | 3,404,957 |
Fleury SA | 391,400 | | 5,061,604 |
Gafisa SA sponsored ADR (d) | 1,600,670 | | 26,875,249 |
Light SA | 657,200 | | 8,274,879 |
Localiza Rent A Car SA | 1,152,700 | | 19,073,892 |
Lojas Renner SA | 650,800 | | 25,707,595 |
Natura Cosmeticos SA | 718,900 | | 20,579,844 |
OGX Petroleo e Gas Participacoes SA (a) | 3,841,800 | | 50,404,994 |
|
| Shares | | Value |
OSX Brasil SA | 14,300 | | $ 4,597,990 |
PDG Realty SA Empreendimentos e Participacoes | 1,985,200 | | 24,820,835 |
Petroleo Brasileiro SA - Petrobras: | | | |
(ON) sponsored ADR | 435,500 | | 14,859,260 |
(PN) (non-vtg.) | 2,069,000 | | 31,438,778 |
(PN) sponsored ADR (non-vtg.) (d) | 2,159,621 | | 67,358,579 |
TIM Participacoes SA sponsored ADR (non-vtg.) | 543,200 | | 17,523,632 |
Vale SA (PN-A) sponsored ADR | 3,341,298 | | 95,995,492 |
Weg SA | 432,500 | | 5,585,484 |
TOTAL BRAZIL | | 662,325,754 |
Canada - 1.8% |
Eldorado Gold Corp. | 1,211,911 | | 20,521,329 |
First Quantum Minerals Ltd. | 307,000 | | 26,883,194 |
Niko Resources Ltd. | 113,600 | | 10,837,612 |
Pacific Rubiales Energy Corp. (a) | 175,400 | | 5,590,993 |
Sherritt International Corp. | 801,200 | | 6,229,548 |
Uranium One, Inc. (a) | 3,812,200 | | 15,586,699 |
TOTAL CANADA | | 85,649,375 |
Cayman Islands - 3.0% |
3SBio, Inc. sponsored ADR (a) | 475,177 | | 7,151,414 |
Alibaba.com Ltd. (a) | 2,150,000 | | 4,199,452 |
China Shanshui Cement Group Ltd. | 21,243,000 | | 15,128,058 |
Daphne International Holdings Ltd. | 13,592,000 | | 15,185,515 |
Eurasia Drilling Co. Ltd.: | | | |
GDR (e) | 118,300 | | 3,016,650 |
GDR (Reg. S) | 961,600 | | 24,520,800 |
Evergreen International Holdings Ltd. (a) | 260,000 | | 154,298 |
Geely Automobile Holdings Ltd. (d) | 26,870,000 | | 15,148,770 |
Global Education & Technology Group Ltd. ADR (a) | 18,900 | | 187,677 |
Hidili Industry International Development Ltd. | 14,040,000 | | 14,961,509 |
International Mining Machinery Holdings Ltd. | 10,358,500 | | 9,020,464 |
Kingboard Chemical Holdings Ltd. | 4,456,000 | | 21,672,788 |
Kingboard Chemical Holdings Ltd. warrants 10/31/12 (a) | 285,000 | | 163,251 |
Microport Scientific Corp. | 180,000 | | 183,454 |
Shenguan Holdings Group Ltd. | 4,400,000 | | 5,733,269 |
Trina Solar Ltd. ADR (a)(d) | 320,200 | | 8,568,552 |
TOTAL CAYMAN ISLANDS | | 144,995,921 |
China - 7.8% |
Anhui Expressway Co. Ltd. (H Shares) | 6,682,000 | | 5,086,122 |
Baidu.com, Inc. sponsored ADR (a) | 197,022 | | 21,674,390 |
China Communications Services Corp. Ltd. (H Shares) | 14,080,000 | | 8,210,495 |
China Construction Bank Corp.
(H Shares) | 60,060,000 | | 57,260,881 |
China Merchants Bank Co. Ltd.
(H Shares) | 14,225,805 | | 40,376,418 |
Common Stocks - continued |
| Shares | | Value |
China - continued |
China Minsheng Banking Corp. Ltd.
(H Shares) | 12,528,000 | | $ 11,653,202 |
China Suntien Green Energy Corp. Ltd.
(H Shares) | 928,000 | | 312,476 |
Digital China Holdings Ltd. (H Shares) | 4,110,000 | | 7,423,319 |
Golden Eagle Retail Group Ltd.
(H Shares) | 7,900,000 | | 20,995,323 |
Harbin Power Equipment Co. Ltd.
(H Shares) | 11,592,000 | | 15,613,028 |
Industrial & Commercial Bank of China Ltd. (H Shares) | 106,013,000 | | 85,343,799 |
Minth Group Ltd. | 10,024,000 | | 18,751,556 |
Ping An Insurance Group Co. China Ltd. (H Shares) | 4,712,500 | | 50,734,801 |
Weichai Power Co. Ltd. (H Shares) | 778,000 | | 10,217,758 |
Yantai Changyu Pioneer Wine Co.
(B Shares) | 1,957,146 | | 25,224,175 |
Zhaojin Mining Industry Co. Ltd.
(H Shares) | 792,500 | | 2,464,022 |
TOTAL CHINA | | 381,341,765 |
Colombia - 0.6% |
Ecopetrol SA ADR (d) | 573,525 | | 27,380,084 |
Czech Republic - 1.2% |
Ceske Energeticke Zavody AS | 568,800 | | 25,201,424 |
Komercni Banka AS | 137,400 | | 31,176,095 |
TOTAL CZECH REPUBLIC | | 56,377,519 |
Egypt - 0.8% |
Commercial International Bank Ltd. sponsored GDR | 5,117,374 | | 39,147,911 |
Georgia - 0.2% |
Bank of Georgia unit (a) | 448,188 | | 7,390,620 |
Hong Kong - 4.0% |
China Mobile (Hong Kong) Ltd. | 7,269,900 | | 74,242,502 |
Chow Sang Sang Holdings International Ltd. | 1,852,000 | | 4,874,156 |
CNOOC Ltd. | 30,682,000 | | 64,055,369 |
CNOOC Ltd. sponsored ADR (d) | 110,600 | | 23,106,552 |
I.T Ltd. | 4,784,000 | | 4,036,428 |
Shanghai Industrial Holdings Ltd. | 5,539,000 | | 25,511,021 |
TOTAL HONG KONG | | 195,826,028 |
Hungary - 0.2% |
Egis Rt. | 64,600 | | 7,589,391 |
India - 8.7% |
Bank of Baroda | 1,332,680 | | 31,619,725 |
Bharat Heavy Electricals Ltd. | 490,562 | | 27,065,853 |
Housing Development Finance Corp. Ltd. | 2,826,029 | | 43,845,689 |
Idea Cellular Ltd. (a) | 5,594,676 | | 8,513,500 |
Indian Oil Corp. Ltd. | 712,749 | | 6,722,272 |
Indian Overseas Bank | 2,111,333 | | 7,611,755 |
Infosys Technologies Ltd. sponsored ADR | 754,687 | | 50,896,091 |
Infotech Enterprises Ltd. | 635,785 | | 2,346,631 |
|
| Shares | | Value |
Infrastructure Development Finance Co. Ltd. | 5,973,371 | | $ 26,959,343 |
ITC Ltd. | 3,000 | | 11,587 |
Jain Irrigation Systems Ltd. | 3,891,395 | | 20,367,821 |
JSW Steel Ltd. | 1,009,390 | | 30,559,525 |
LIC Housing Finance Ltd. | 158,724 | | 4,800,394 |
Radico Khaitan Ltd. | 791,817 | | 3,194,064 |
Reliance Industries Ltd. | 2,424,858 | | 59,971,813 |
Rural Electrification Corp. Ltd. | 2,926,131 | | 24,468,595 |
Shriram Transport Finance Co. Ltd. | 521,712 | | 10,374,212 |
Tata Consultancy Services Ltd. | 1,723,966 | | 40,951,243 |
Tata Steel Ltd. | 469,734 | | 6,246,164 |
Ultratech Cement Ltd. | 694,085 | | 17,223,330 |
TOTAL INDIA | | 423,749,607 |
Indonesia - 6.0% |
Indofood Sukses Makmur Tbk PT (a) | 6,969,500 | | 4,444,879 |
PT Astra International Tbk | 5,823,000 | | 37,136,858 |
PT Bank Mandiri (Persero) Tbk | 12,596,500 | | 9,865,780 |
PT Bank Negara Indonesia (Persero) Tbk | 53,406,500 | | 23,304,631 |
PT Bank Rakyat Indonesia Tbk | 26,382,500 | | 33,651,491 |
PT Bank Tabungan Negara Tbk | 31,323,000 | | 6,974,289 |
PT Bumi Serpong Damai Tbk | 42,621,500 | | 4,005,821 |
PT Ciputra Development Tbk (a) | 98,853,500 | | 4,645,419 |
PT Delta Dunia Petroindo Tbk (a) | 61,669,500 | | 7,383,082 |
PT Gudang Garam Tbk | 4,659,000 | | 24,865,351 |
PT Indo Tambangraya Megah Tbk | 2,801,000 | | 14,165,603 |
PT Indocement Tunggal Prakarsa Tbk | 14,414,500 | | 29,514,415 |
PT Indofood Sukses Makmur Tbk | 49,381,000 | | 28,730,735 |
PT Kalbe Farma Tbk | 28,924,000 | | 8,656,965 |
PT Perusahaan Gas Negara Tbk Series B | 40,412,100 | | 18,312,598 |
PT Tambang Batubbara Bukit Asam Tbk | 2,894,500 | | 6,363,845 |
PT Tower Bersama Infrastructure Tbk | 40,320,000 | | 11,503,877 |
PT XL Axiata Tbk (a) | 30,148,500 | | 19,396,218 |
TOTAL INDONESIA | | 292,921,857 |
Kazakhstan - 0.3% |
KazMunaiGas Exploration & Production JSC (Reg. S) GDR | 765,611 | | 13,168,509 |
Korea (South) - 11.6% |
Busan Bank | 794,140 | | 9,887,024 |
CJ Corp. | 255,250 | | 18,000,286 |
Daegu Bank Co. Ltd. | 683,020 | | 8,959,132 |
Daelim Industrial Co. | 181,061 | | 14,748,942 |
Doosan Co. Ltd. | 79,510 | | 10,712,106 |
GS Holdings Corp. | 257,960 | | 13,534,582 |
Hanjin Heavy Industries & Consolidated Co. Ltd. | 432,990 | | 16,518,691 |
Honam Petrochemical Corp. | 118,963 | | 26,236,389 |
Hyundai Department Store Co. Ltd. | 60,727 | | 6,723,442 |
Hyundai Heavy Industries Co. Ltd. | 106,992 | | 34,871,109 |
Hyundai Mobis | 192,422 | | 47,912,986 |
Hyundai Motor Co. | 457,060 | | 69,097,545 |
Industrial Bank of Korea | 2,202,190 | | 31,627,713 |
Common Stocks - continued |
| Shares | | Value |
Korea (South) - continued |
Kia Motors Corp. | 986,550 | | $ 39,391,809 |
KT Corp. | 478,990 | | 18,884,825 |
LG Chemical Ltd. | 60,514 | | 18,673,504 |
Lumens Co. Ltd. (a) | 760,009 | | 6,758,638 |
NCsoft Corp. | 98,911 | | 21,770,092 |
Samsung Electronics Co. Ltd. | 136,619 | | 90,512,353 |
Shinhan Financial Group Co. Ltd. | 1,214,820 | | 47,047,935 |
Tong Yang Securities, Inc. | 966,660 | | 9,756,860 |
Young Poong Precision Corp. | 230,057 | | 2,690,306 |
TOTAL KOREA (SOUTH) | | 564,316,269 |
Lebanon - 0.0% |
BLOM Bank SAL GDR | 247,400 | | 2,276,080 |
Luxembourg - 0.8% |
Evraz Group SA GDR (a) | 791,949 | | 24,011,894 |
Millicom International Cellular SA | 182,500 | | 17,264,500 |
TOTAL LUXEMBOURG | | 41,276,394 |
Malaysia - 0.8% |
AirAsia Bhd (a) | 8,069,300 | | 6,406,677 |
Axiata Group Bhd (a) | 13,866,600 | | 20,013,190 |
RHB Capital BHD | 2,223,000 | | 5,737,927 |
Top Glove Corp. Bhd | 4,374,400 | | 7,733,590 |
TOTAL MALAYSIA | | 39,891,384 |
Mexico - 2.6% |
America Movil SAB de CV Series L sponsored ADR | 1,795,733 | | 102,823,666 |
Banco Compartamos SA de CV | 2,500,800 | | 17,715,477 |
Genomma Lab Internacional SA de CV (a) | 3,371,200 | | 7,323,533 |
TOTAL MEXICO | | 127,862,676 |
Nigeria - 0.3% |
Guaranty Trust Bank PLC GDR (Reg. S) | 2,221,301 | | 16,126,645 |
Norway - 0.1% |
Det Norske Oljeselskap ASA (DNO)
(A Shares) (a)(d) | 2,936,300 | | 4,610,442 |
Peru - 0.6% |
Compania de Minas Buenaventura SA sponsored ADR | 582,600 | | 30,901,104 |
Poland - 0.1% |
Bank Handlowy w Warszawie SA | 210,365 | | 6,641,824 |
Qatar - 0.3% |
Commercial Bank of Qatar GDR (Reg. S) | 2,702,839 | | 12,384,856 |
Russia - 7.9% |
Cherkizovo Group OJSC GDR (a) | 485,391 | | 9,888,943 |
LSR Group OJSC GDR (Reg. S) (a) | 722,900 | | 6,144,650 |
Magnit OJSC GDR (Reg. S) | 1,249,300 | | 33,406,282 |
Mechel Steel Group OAO sponsored ADR | 950,200 | | 22,377,210 |
OAO NOVATEK GDR | 515,958 | | 49,351,383 |
OAO Raspadskaya (a) | 844,900 | | 4,919,715 |
|
| Shares | | Value |
OAO Tatneft sponsored ADR | 947,500 | | $ 29,893,625 |
OJSC MMC Norilsk Nickel sponsored ADR | 1,822,141 | | 33,982,930 |
OJSC Oil Company Rosneft GDR
(Reg. S) | 6,190,100 | | 43,144,997 |
Polymetal JSC GDR (Reg. S) (a) | 1,636,564 | | 25,857,711 |
Protek (a) | 293,800 | | 533,347 |
RusHydro JSC: | | | |
rights 6/30/10 (a) | 3,096,263 | | 159,674 |
sponsored ADR (a) | 4,157,133 | | 21,513,163 |
Sberbank (Savings Bank of the Russian Federation) | 13,713,000 | | 45,064,903 |
Sberbank (Savings Bank of the Russian Federation) GDR | 60,933 | | 22,892,010 |
Severstal JSC (a) | 467,200 | | 6,376,102 |
Sistema JSFC sponsored GDR | 890,621 | | 22,978,022 |
TGK-1 OAO (a) | 6,882,675,325 | | 4,776,577 |
TOTAL RUSSIA | | 383,261,244 |
Singapore - 0.8% |
Keppel Corp. Ltd. | 2,227,000 | | 17,171,799 |
Straits Asia Resources Ltd. | 9,109,000 | | 16,116,519 |
Yanlord Land Group Ltd. | 3,704,000 | | 4,922,259 |
TOTAL SINGAPORE | | 38,210,577 |
South Africa - 6.4% |
African Bank Investments Ltd. | 5,509,999 | | 28,269,515 |
African Rainbow Minerals Ltd. | 994,398 | | 25,368,679 |
AngloGold Ashanti Ltd. | 589,300 | | 27,638,213 |
AngloGold Ashanti Ltd. sponsored ADR | 348,600 | | 16,422,546 |
Aspen Pharmacare Holdings Ltd. | 1,479,177 | | 19,743,335 |
Clicks Group Ltd. | 2,764,327 | | 18,034,096 |
Foschini Ltd. | 1,921,394 | | 23,322,622 |
Imperial Holdings Ltd. | 48,385 | | 789,143 |
Mr Price Group Ltd. | 3,052,145 | | 27,737,068 |
Mvelaphanda Resources Ltd. (a) | 3,358,378 | | 21,957,547 |
Shoprite Holdings Ltd. | 1,843,435 | | 26,057,906 |
Standard Bank Group Ltd. | 3,028,681 | | 44,662,457 |
Wilson Bayly Holmes-Ovcon Ltd. | 396,657 | | 7,665,816 |
Woolworths Holdings Ltd. | 6,307,716 | | 24,717,426 |
TOTAL SOUTH AFRICA | | 312,386,369 |
Spain - 0.3% |
Banco Bilbao Vizcaya Argentaria SA sponsored ADR | 658,724 | | 8,662,221 |
Banco Santander SA sponsored ADR | 343,700 | | 4,402,797 |
TOTAL SPAIN | | 13,065,018 |
Taiwan - 7.0% |
Advanced Semiconductor Engineering, Inc. | 5,698,605 | | 4,961,557 |
Advanced Semiconductor Engineering, Inc. sponsored ADR (d) | 4,129,481 | | 18,293,601 |
Alpha Networks, Inc. | 8,089,000 | | 7,189,048 |
Asia Cement Corp. | 19,796,301 | | 20,407,558 |
Common Stocks - continued |
| Shares | | Value |
Taiwan - continued |
Chroma ATE, Inc. | 3,913,256 | | $ 10,075,627 |
Farglory Land Development Co. Ltd. | 3,224,000 | | 8,006,012 |
Formosa Plastics Corp. | 14,818,000 | | 42,510,061 |
Fubon Financial Holding Co. Ltd. | 24,000,651 | | 29,407,758 |
HTC Corp. | 2,520,100 | | 56,898,844 |
Huaku Development Co. Ltd. | 2,551,000 | | 7,076,618 |
Macronix International Co. Ltd. | 39,999,113 | | 24,635,951 |
Pegatron Corp. (a) | 8,394,000 | | 11,368,446 |
Ruentex Development Co. Ltd. | 2,587,000 | | 4,294,057 |
Taishin Financial Holdings Co. Ltd. | 61,465,380 | | 26,911,815 |
Taiwan Cement Corp. | 10,256,000 | | 10,924,542 |
Taiwan Semiconductor Manufacturing Co. Ltd. | 10,725,447 | | 22,077,493 |
Unimicron Technology Corp. | 2,828,000 | | 4,814,207 |
Wistron Corp. | 14,414,635 | | 29,625,243 |
TOTAL TAIWAN | | 339,478,438 |
Thailand - 1.4% |
Advanced Info Service PCL (For. Reg.) | 5,978,900 | | 17,972,646 |
Banpu PCL (For. Reg.) | 523,000 | | 13,520,441 |
BEC World PCL (For. Reg.) | 8,241,200 | | 9,152,301 |
Siam Commercial Bank PCL (For. Reg.) | 8,516,300 | | 29,155,670 |
Total Access Communication PCL (For. Reg.) | 105,200 | | 147,575 |
TOTAL THAILAND | | 69,948,633 |
Turkey - 3.2% |
Enka Insaat ve Sanayi AS | 2,195,888 | | 10,027,934 |
Sinpas Gayrimenkul Yatirim Ortakligi AS (a) | 4,277,000 | | 6,500,634 |
Tofas Turk Otomobil Fabrikasi AS | 3,432,151 | | 19,023,636 |
Turk Hava Yollari AO | 8,176,571 | | 33,919,401 |
Turkiye Garanti Bankasi AS | 9,585,895 | | 58,813,272 |
Turkiye Halk Bankasi AS | 2,524,000 | | 25,516,280 |
TOTAL TURKEY | | 153,801,157 |
United Arab Emirates - 0.3% |
DP World Ltd. | 23,738,830 | | 14,219,559 |
United Kingdom - 0.8% |
Hikma Pharmaceuticals PLC | 1,378,718 | | 17,362,057 |
Xstrata PLC | 1,171,870 | | 22,708,502 |
TOTAL UNITED KINGDOM | | 40,070,559 |
|
| Shares | | Value |
United States of America - 0.8% |
CTC Media, Inc. | 620,100 | | $ 14,634,360 |
Freeport-McMoRan Copper & Gold, Inc. | 273,347 | | 25,880,494 |
TOTAL UNITED STATES OF AMERICA | | 40,514,854 |
TOTAL COMMON STOCKS (Cost $3,568,814,275) | 4,775,144,886 |
Money Market Funds - 3.8% |
| | | |
Fidelity Cash Central Fund, 0.23% (b) | 51,945,705 | | 51,945,705 |
Fidelity Securities Lending Cash Central Fund, 0.24% (b)(c) | 133,749,591 | | 133,749,591 |
TOTAL MONEY MARKET FUNDS (Cost $185,695,296) | 185,695,296 |
TOTAL INVESTMENT PORTFOLIO - 102.0% (Cost $3,754,509,571) | | 4,960,840,182 |
NET OTHER ASSETS (LIABILITIES) - (2.0)% | | (96,869,229) |
NET ASSETS - 100% | $ 4,863,970,953 |
Legend |
(a) Non-income producing |
(b) Affiliated fund that is available only to investment companies and other accounts managed by Fidelity Investments. The rate quoted is the annualized seven-day yield of the fund at period end. A complete unaudited listing of the fund's holdings as of its most recent quarter end is available upon request. In addition, each Fidelity Central Fund's financial statements, which are not covered by the Fund's report of Independent Registered Public Accounting Firm, are available on the SEC's website or upon request. |
(c) Investment made with cash collateral received from securities on loan. |
(d) Security or a portion of the security is on loan at period end. |
(e) Security exempt from registration under Rule 144A of the Securities Act of 1933. These securities may be resold in transactions exempt from registration, normally to qualified institutional buyers. At the end of the period, the value of these securities amounted to $3,016,650 or 0.1% of net assets. |
Affiliated Central Funds |
Information regarding fiscal year to date income earned by the Fund from investments in Fidelity Central Funds is as follows: |
Fund | Income earned |
Fidelity Cash Central Fund | $ 152,773 |
Fidelity Securities Lending Cash Central Fund | 695,966 |
Total | $ 848,739 |
Other Information |
The following is a summary of the inputs used, as of October 31, 2010, involving the Fund's assets and liabilities carried at fair value. The inputs or methodology used for valuing securities may not be an indication of the risk associated with investing in those securities. For more information on valuation inputs, and their aggregation into the levels used in the tables below, please refer to the Security Valuation section in the accompanying Notes to Financial Statements. |
Valuation Inputs at Reporting Date: |
Description | Total | Level 1 | Level 2 | Level 3 |
Investments in Securities: | | | | |
Equities: | | | | |
Brazil | $ 662,325,754 | $ 657,246,986 | $ 5,078,768 | $ - |
Korea (South) | 564,316,269 | 545,431,444 | 18,884,825 | - |
India | 423,749,607 | 392,129,882 | 31,619,725 | - |
Russia | 383,261,244 | 383,261,244 | - | - |
China | 381,341,765 | 381,341,765 | - | - |
Taiwan | 339,478,438 | 312,439,388 | 27,039,050 | - |
South Africa | 312,386,369 | 284,748,156 | 27,638,213 | - |
Indonesia | 292,921,857 | 292,921,857 | - | - |
Hong Kong | 195,826,028 | 57,528,157 | 138,297,871 | - |
Other | 1,219,537,555 | 1,219,383,257 | 154,298 | - |
Money Market Funds | 185,695,296 | 185,695,296 | - | - |
Total Investments in Securities: | $ 4,960,840,182 | $ 4,712,127,432 | $ 248,712,750 | $ - |
The following is a reconciliation of Investments in Securities for which Level 3 inputs were used in determining value: |
Investments in Securities: | |
Beginning Balance | $ 59,240 |
Total Realized Gain (Loss) | (3,687,175) |
Total Unrealized Gain (Loss) | 3,692,447 |
Cost of Purchases | - |
Proceeds of Sales | (64,512) |
Amortization/Accretion | - |
Transfers in to Level 3 | - |
Transfers out of Level 3 | - |
Ending Balance | $ - |
The change in unrealized gain (loss) for the period attributable to Level 3 securities held at October 31, 2010 | $ - |
The information used in the above reconciliation represents fiscal year to date activity for any Investments in Securities identified as using Level 3 inputs at either the beginning or the end of the current fiscal period. Transfers in or out of Level 3 represent the beginning value of any Security or Instrument where a change in the pricing level occurred from the beginning to the end of the period. The cost of purchases and the proceeds of sales may include securities received or delivered through corporate actions or exchanges. Realized and unrealized gains (losses) disclosed in the reconciliation are included in Net Gain (Loss) on the Fund's Statement of Operations. |
Income Tax Information |
At October 31, 2010, the Fund had a capital loss carryforward of approximately $581,445,081 of which $11,565,560 and $569,879,521 will expire on October 31, 2016 and 2017, respectively. Capital loss carryforwards are only available to offset future capital gains of the Fund to the extent provided by regulations and may be limited. |
See accompanying notes which are an integral part of the financial statements.
Annual Report
Fidelity Emerging Markets Fund
Financial Statements
Statement of Assets and Liabilities
| October 31, 2010 |
| | |
Assets | | |
Investment in securities, at value (including securities loaned of $130,680,343) - See accompanying schedule: Unaffiliated issuers (cost $3,568,814,275) | $ 4,775,144,886 | |
Fidelity Central Funds (cost $185,695,296) | 185,695,296 | |
Total Investments (cost $3,754,509,571) | | $ 4,960,840,182 |
Foreign currency held at value (cost $1,301,907) | | 1,297,673 |
Receivable for investments sold | | 25,393,050 |
Receivable for fund shares sold | | 32,285,128 |
Dividends receivable | | 7,645,151 |
Distributions receivable from Fidelity Central Funds | | 60,063 |
Other receivables | | 1,818,612 |
Total assets | | 5,029,339,859 |
| | |
Liabilities | | |
Payable for investments purchased | $ 18,095,363 | |
Payable for fund shares redeemed | 4,146,034 | |
Accrued management fee | 2,825,240 | |
Other affiliated payables | 1,043,321 | |
Other payables and accrued expenses | 5,509,357 | |
Collateral on securities loaned, at value | 133,749,591 | |
Total liabilities | | 165,368,906 |
| | |
Net Assets | | $ 4,863,970,953 |
Net Assets consist of: | | |
Paid in capital | | $ 4,249,475,033 |
Undistributed net investment income | | 44,633,128 |
Accumulated undistributed net realized gain (loss) on investments and foreign currency transactions | | (632,028,917) |
Net unrealized appreciation (depreciation) on investments and assets and liabilities in foreign currencies | | 1,201,891,709 |
Net Assets | | $ 4,863,970,953 |
Emerging Markets:
Net Asset Value, offering price and redemption price per share ($3,975,341,962 ÷ 154,545,221 shares) | | $ 25.72 |
| | |
Class K:
Net Asset Value, offering price and redemption price per share ($888,628,991 ÷ 34,507,270 shares) | | $ 25.75 |
Statement of Operations
| Year ended October 31, 2010 |
| | |
Investment Income | | |
Dividends | | $ 101,300,180 |
Interest | | 2,008 |
Income from Fidelity Central Funds | | 848,739 |
Income before foreign taxes withheld | | 102,150,927 |
Less foreign taxes withheld | | (11,397,819) |
Total income | | 90,753,108 |
| | |
Expenses | | |
Management fee | $ 30,896,545 | |
Transfer agent fees | 11,669,686 | |
Accounting and security lending fees | 1,569,593 | |
Custodian fees and expenses | 3,986,795 | |
Independent trustees' compensation | 24,412 | |
Registration fees | 136,516 | |
Audit | 118,020 | |
Legal | 20,175 | |
Interest | 4,443 | |
Miscellaneous | 53,667 | |
Total expenses before reductions | 48,479,852 | |
Expense reductions | (2,360,269) | 46,119,583 |
Net investment income (loss) | | 44,633,525 |
Realized and Unrealized Gain (Loss) Net realized gain (loss) on: | | |
Investment securities: | | |
Unaffiliated issuers | 528,879,058 | |
Foreign currency transactions | (4,633,192) | |
Capital gain distributions from Fidelity Central Funds | 4,197 | |
Total net realized gain (loss) | | 524,250,063 |
Change in net unrealized appreciation (depreciation) on: Investment securities (net of decrease in deferred foreign taxes of $1,362,215) | 400,550,127 | |
Assets and liabilities in foreign currencies | 2,454 | |
Total change in net unrealized appreciation (depreciation) | | 400,552,581 |
Net gain (loss) | | 924,802,644 |
Net increase (decrease) in net assets resulting from operations | | $ 969,436,169 |
See accompanying notes which are an integral part of the financial statements.
Annual Report
Statement of Changes in Net Assets
| Year ended
October 31,
2010 | Year ended
October 31,
2009 |
Increase (Decrease) in Net Assets | | |
Operations | | |
Net investment income (loss) | $ 44,633,525 | $ 29,313,306 |
Net realized gain (loss) | 524,250,063 | (579,779,624) |
Change in net unrealized appreciation (depreciation) | 400,552,581 | 1,728,712,395 |
Net increase (decrease) in net assets resulting from operations | 969,436,169 | 1,178,246,077 |
Distributions to shareholders from net investment income | (23,159,233) | (37,630,187) |
Distributions to shareholders from net realized gain | (26,416,955) | - |
Total distributions | (49,576,188) | (37,630,187) |
Share transactions - net increase (decrease) | 23,065,054 | 603,896,717 |
Redemption fees | 1,389,036 | 1,520,594 |
Total increase (decrease) in net assets | 944,314,071 | 1,746,033,201 |
| | |
Net Assets | | |
Beginning of period | 3,919,656,882 | 2,173,623,681 |
End of period (including undistributed net investment income of $44,633,128 and undistributed net investment income of $23,182,142, respectively) | $ 4,863,970,953 | $ 3,919,656,882 |
Financial Highlights - Emerging Markets
Years ended October 31, | 2010 | 2009 | 2008 | 2007 | 2006 |
Selected Per-Share Data | | | | | |
Net asset value, beginning of period | $ 20.68 | $ 13.71 | $ 37.55 | $ 22.04 | $ 15.71 |
Income from Investment Operations | | | | | |
Net investment income (loss) B | .23 | .17 | .42 E | .25 | .21 |
Net realized and unrealized gain (loss) | 5.05 | 7.03 | (22.73) | 15.44 | 6.31 |
Total from investment operations | 5.28 | 7.20 | (22.31) | 15.69 | 6.52 |
Distributions from net investment income | (.12) | (.24) | (.19) | (.20) | (.21) |
Distributions from net realized gain | (.14) | - | (1.37) | - | - |
Total distributions | (.25) G | (.24) | (1.56) | (.20) | (.21) |
Redemption fees added to paid in capital B | .01 | .01 | .03 | .02 | .02 |
Net asset value, end of period | $ 25.72 | $ 20.68 | $ 13.71 | $ 37.55 | $ 22.04 |
Total Return A | 25.76% | 53.95% | (61.84)% | 71.81% | 41.96% |
Ratios to Average Net Assets C,F | | | | | |
Expenses before reductions | 1.14% | 1.16% | 1.07% | 1.05% | 1.11% |
Expenses net of fee waivers, if any | 1.14% | 1.16% | 1.07% | 1.05% | 1.11% |
Expenses net of all reductions | 1.09% | 1.10% | 1.02% | .99% | 1.01% |
Net investment income (loss) | 1.00% | 1.09% | 1.47% E | .89% | 1.04% |
Supplemental Data | | | | | |
Net assets, end of period (000 omitted) | $ 3,975,342 | $ 3,649,582 | $ 2,086,196 | $ 6,609,045 | $ 3,005,145 |
Portfolio turnover rate D | 85% | 88% | 63% | 52% | 66% |
A Total returns would have been lower had certain expenses not been reduced during the periods shown.
B Calculated based on average shares outstanding during the period.
C Fees and expenses of the underlying Fidelity Central Funds are not included in the Fund's expense ratio. The Fund indirectly bears its proportionate share of the expenses of any underlying Fidelity Central Funds.
D Amount does not include the portfolio activity of any underlying Fidelity Central Funds.
E Investment income per share reflects a special dividend which amounted to $.09 per share. Excluding the special dividend, the ratio of net investment income (loss) to average net assets would have been 1.17%.
F Expense ratios reflect operating expenses of the class. Expenses before reductions do not reflect amounts reimbursed by the investment adviser or reductions from brokerage service arrangements or reductions from other expense offset arrangements and do not represent the amount paid by the class during periods when reimbursements or reductions occur. Expenses net of fee waivers reflect expenses after reimbursement by the investment adviser but prior to reductions from brokerage service arrangements or other expense offset arrangements. Expenses net of all reductions represent the net expenses paid by the class.
G Total distributions of $.25 per share is comprised of distributions from net investment income of $.116 and distributions from net realized gain of $.135 per share.
See accompanying notes which are an integral part of the financial statements.
Annual Report
Financial Highlights - Class K
Years ended October 31, | 2010 | 2009 | 2008 H |
Selected Per-Share Data | | | |
Net asset value, beginning of period | $ 20.69 | $ 13.72 | $ 31.99 |
Income from Investment Operations | | | |
Net investment income (loss) D | .28 | .22 | .15 G |
Net realized and unrealized gain (loss) | 5.05 | 7.02 | (18.43) |
Total from investment operations | 5.33 | 7.24 | (18.28) |
Distributions from net investment income | (.15) | (.28) | - |
Distributions from net realized gain | (.14) | - | - |
Total distributions | (.28) J | (.28) | - |
Redemption fees added to paid in capital D | .01 | .01 | .01 |
Net asset value, end of period | $ 25.75 | $ 20.69 | $ 13.72 |
Total Return B,C | 26.03% | 54.44% | (57.11)% |
Ratios to Average Net Assets E,I | | | |
Expenses before reductions | .90% | .91% | .92% A |
Expenses net of fee waivers, if any | .90% | .91% | .92% A |
Expenses net of all reductions | .84% | .84% | .87% A |
Net investment income (loss) | 1.24% | 1.35% | 2.02% A,G |
Supplemental Data | | | |
Net assets, end of period (000 omitted) | $ 888,629 | $ 270,075 | $ 87,427 |
Portfolio turnover rate F | 85% | 88% | 63% |
A Annualized
B Total returns for periods of less than one year are not annualized.
C Total returns would have been lower had certain expenses not been reduced during the periods shown.
D Calculated based on average shares outstanding during the period.
E Fees and expenses of the underlying Fidelity Central Funds are not included in the Fund's expense ratio. The Fund indirectly bears its proportionate share of the expenses of any underlying Fidelity Central Funds.
F Amount does not include the portfolio activity of any underlying Fidelity Central Funds.
G Investment income per share reflects a special dividend which amounted to $.02 per share. Excluding the special dividend, the ratio of net investment income (loss) to average net assets would have been 1.71%.
H For the period May 9, 2008 (commencement of sale of shares) to October 31, 2008.
I Expense ratios reflect operating expenses of the class. Expenses before reductions do not reflect amounts reimbursed by the investment adviser or reductions from brokerage service arrangements or reductions from other expense offset arrangements and do not represent the amount paid by the class during periods when reimbursements or reductions occur. Expense ratios before reductions for start-up periods may not be representative of longer-term operating periods. Expenses net of fee waivers reflect expenses after reimbursement by the investment adviser but prior to reductions from brokerage service arrangements or other expense offset arrangements. Expenses net of all reductions represent the net expenses paid by the class.
J Total distributions of $.28 per share is comprised of distributions from net investment income of $.148 and distributions from net realized gain of $.135 per share.
See accompanying notes which are an integral part of the financial statements.
Annual Report
Notes to Financial Statements
For the period ended October 31, 2010
1. Organization.
Fidelity Emerging Markets Fund (the Fund) is a fund of Fidelity Investment Trust (the Trust) and is authorized to issue an unlimited number of shares. The Trust is registered under the Investment Company Act of 1940, as amended (the 1940 Act), as an open-end management investment company organized as a Massachusetts business trust. The Fund offers Emerging Markets and Class K shares, each of which has equal rights as to assets and voting privileges. Each class has exclusive voting rights with respect to matters that affect that class. Investment income, realized and unrealized capital gains and losses, the common expenses of the Fund, and certain fund-level expense reductions, if any, are allocated on a pro-rata basis to each class based on the relative net assets of each class to the total net assets of the Fund. Each class differs with respect to transfer agent fees incurred. Certain expense reductions also differ by class. The Fund's investments in emerging markets can be subject to social, economic, regulatory, and political uncertainties and can be extremely volatile.
2. Investments in Fidelity Central Funds.
The Fund may invest in Fidelity Central Funds, which are open-end investment companies available only to other investment companies and accounts managed by Fidelity Management & Research Company (FMR) and its affiliates. The Fund's Schedule of Investments lists each of the Fidelity Central Funds held as of period end, if any, as an investment of the Fund, but does not include the underlying holdings of each Fidelity Central Fund. As an Investing Fund, the Fund indirectly bears its proportionate share of the expenses of the underlying Fidelity Central Funds.
The Money Market Central Funds seek preservation of capital and current income and are managed by Fidelity Investments Money Management, Inc. (FIMM), an affiliate of FMR.
A complete unaudited list of holdings for each Fidelity Central Fund is available upon request or at the Securities and Exchange Commission (the SEC) web site at www.sec.gov. In addition, the financial statements of the Fidelity Central Funds, which are not covered by the Fund's Report of Independent Registered Public Accounting Firm, are available on the SEC web site or upon request.
3. Significant Accounting Policies.
The financial statements have been prepared in conformity with accounting principles generally accepted in the United States of America (GAAP), which require management to make certain estimates and assumptions at the date of the financial statements. Actual results could differ from those estimates. The following summarizes the significant accounting policies of the Fund:
Security Valuation. Investments are valued as of 4:00 p.m. Eastern time on the last calendar day of the period. The Fund uses independent pricing services approved by the Board of Trustees to value its investments. When current market prices or quotations are not readily available or reliable, valuations may be determined in good faith in accordance with procedures adopted by the Board of Trustees. Factors used in determining value may include market or security specific events. The frequency with which these procedures are used cannot be predicted and they may be utilized to a significant extent. The value used for net asset value (NAV) calculation under these procedures may differ from published prices for the same securities.
The Fund categorizes the inputs to valuation techniques used to value its investments into a disclosure hierarchy consisting of three levels as shown below.
Level 1 - quoted prices in active markets for identical investments
Level 2 - other significant observable inputs (including quoted prices for similar investments, interest rates, prepayment speeds, etc.)
Level 3 - unobservable inputs (including the fund's own assumptions based on the best information available)
Changes in valuation techniques may result in transfers in or out of an assigned level within the disclosure hierarchy. The aggregate value of investments by input level, as of October 31, 2010, as well as a roll forward of Level 3 securities, is included at the end of the Fund's Schedule of Investments. Valuation techniques used to value the Fund's investments by major category are as follows.
Equity securities, including restricted securities, for which market quotations are readily available, are valued at the last reported sale price or official closing price as reported by an independent pricing service on the primary market or exchange on which they are traded and are categorized as Level 1 in the hierarchy. In the event there were no sales during the day or closing prices are not available, securities are valued at the last quoted bid price or may be valued using the last available price and are generally categorized as Level 2 in the hierarchy. For foreign equity securities, when significant market or security specific events arise, comparisons to the valuation of American Depositary Receipts (ADRs), futures contracts, Exchange-traded funds (ETFs) and certain indexes as well as quoted prices for similar securities are used and are categorized as Level 2 in the hierarchy in these circumstances. Utilizing these techniques may result in significant transfers between Level 1 and Level 2. For restricted equity securities and private placements where observable inputs are limited, assumptions about market activity and risk are used and are categorized as Level 3 in the hierarchy.
Annual Report
3. Significant Accounting Policies - continued
Security Valuation - continued
Investments in open-end mutual funds, including the Fidelity Central Funds, are valued at their closing net asset value each business day and are categorized as Level 1 in the hierarchy. Short-term securities with remaining maturities of sixty days or less for which quotations are not readily available are valued at amortized cost, which approximates fair value and are categorized as Level 2 in the hierarchy.
Foreign Currency. The Fund uses foreign currency contracts to facilitate transactions in foreign-denominated securities. Gains and losses from these transactions may arise from changes in the value of the foreign currency or if the counterparties do not perform under the contracts' terms.
Foreign-denominated assets, including investment securities, and liabilities are translated into U.S. dollars at the exchange rate at period end. Purchases and sales of investment securities, income and dividends received and expenses denominated in foreign currencies are translated into U.S. dollars at the exchange rate in effect on the transaction date.
The effects of exchange rate fluctuations on investments are included with the net realized and unrealized gain (loss) on investment securities. Other foreign currency transactions resulting in realized and unrealized gain (loss) are disclosed separately.
Investment Transactions and Income. For financial reporting purposes, the Fund's investment holdings and NAV include trades executed through the end of the last business day of the period. The NAV per share for processing shareholder transactions is calculated as of the close of business of the New York Stock Exchange (NYSE), normally 4:00 p.m. Eastern time and includes trades executed through the end of the prior business day. Gains and losses on securities sold are determined on the basis of identified cost and may include proceeds received from litigation. Dividend income is recorded on the ex-dividend date, except for certain dividends from foreign securities where the ex-dividend date may have passed, which are recorded as soon as the Fund is informed of the ex-dividend date. Non-cash dividends included in dividend income, if any, are recorded at the fair market value of the securities received. Distributions received on securities that represent a return of capital or capital gain are recorded as a reduction of cost of investments and/or as a realized gain. The Fund estimates the components of distributions received that may be considered return of capital distributions or capital gain distributions. Interest income and distributions from the Fidelity Central Funds are accrued as earned. Interest income includes coupon interest and amortization of premium and accretion of discount on debt securities. Investment income is recorded net of foreign taxes withheld where recovery of such taxes is uncertain.
Expenses. Most expenses of the Trust can be directly attributed to a fund. Expenses which cannot be directly attributed are apportioned amongst each fund in the Trust. Expense estimates are accrued in the period to which they relate and adjustments are made when actual amounts are known.
Income Tax Information and Distributions to Shareholders. Each year the Fund intends to qualify as a regulated investment company, including distributing substantially all of its taxable income and realized gains under Subchapter M of the Internal Revenue Code and filing its U.S. federal tax return. As a result, no provision for income taxes is required. As of October 31, 2010, the Fund did not have any unrecognized tax benefits in the accompanying financial statements. A fund's federal tax return is subject to examination by the Internal Revenue Service (IRS) for a period of three years. Foreign taxes are provided for based on the Fund's understanding of the tax rules and rates that exist in the foreign markets in which it invests. The Fund is subject to a tax imposed on short term capital gains on securities of certain issuers domiciled in India. The Fund records an estimated deferred tax liability included in Other payables and accrued expenses in the accompanying Statement of Assets & Liabilities for net unrealized gains on these securities in an amount that would be payable if the securities were disposed of at period end.
Distributions are declared and recorded on the ex-dividend date. Income dividends and capital gain distributions are declared separately for each class. Income and capital gain distributions are determined in accordance with income tax regulations, which may differ from GAAP.
Capital accounts within the financial statements are adjusted for permanent book-tax differences. These adjustments have no impact on net assets or the results of operations. Temporary book-tax differences will reverse in a subsequent period.
Book-tax differences are primarily due to the short-term gain distributions from the Fidelity Central Funds, foreign currency transactions, passive foreign investment companies (PFIC), deferred trustees compensation, capital loss carryforwards and losses deferred due to wash sales.
The federal tax cost of investment securities and unrealized appreciation (depreciation) as of period end were as follows:
Gross unrealized appreciation | $ 1,205,006,815 |
Gross unrealized depreciation | (73,553,817) |
Net unrealized appreciation (depreciation) | $ 1,131,452,998 |
| |
Tax Cost | $ 3,829,387,184 |
Annual Report
Notes to Financial Statements - continued
3. Significant Accounting Policies - continued
Income Tax Information and Distributions to Shareholders - continued
The tax-based components of distributable earnings as of period end were as follows:
Undistributed ordinary income | $ 68,927,382 |
Capital loss carryforward | $ (581,445,081) |
Net unrealized appreciation (depreciation) | $ 1,131,567,331 |
The tax character of distributions paid was as follows:
| October 31, 2010 | October 31, 2009 |
Ordinary Income | $ 49,576,188 | $ 37,630,187 |
Short-Term Trading (Redemption) Fees. Shares held by investors in the Fund less than 90 days are subject to a redemption fee equal to 1.50% of the net asset value of shares redeemed. All redemption fees, which reduce the proceeds of the shareholder redemption, are retained by the Fund and accounted for as an addition to paid in capital.
4. Operating Policies.
Restricted Securities. The Fund may invest in securities that are subject to legal or contractual restrictions on resale. These securities generally may be resold in transactions exempt from registration or to the public if the securities are registered. Disposal of these securities may involve time-consuming negotiations and expense, and prompt sale at an acceptable price may be difficult. Information regarding restricted securities is included at the end of the Fund's Schedule of Investments.
5. Purchases and Sales of Investments.
Purchases and sales of securities, other than short-term securities, aggregated $3,595,488,192 and $3,633,115,797, respectively.
6. Fees and Other Transactions with Affiliates.
Management Fee. FMR and its affiliates provide the Fund with investment management related services for which the Fund pays a monthly management fee. The management fee is the sum of an individual fund fee rate that is based on an annual rate of .45% of the Fund's average net assets and a group fee rate that averaged .26% during the period. The group fee rate is based upon the average net assets of all the mutual funds advised by FMR. The group fee rate decreases as assets under management increase and increases as assets under management decrease. For the period, the total annual management fee rate was .71% of the Fund's average net assets.
Transfer Agent Fees. Fidelity Investments Institutional Operations Company, Inc. (FIIOC), an affiliate of FMR, is the transfer, dividend disbursing and shareholder servicing agent for each class of the Fund. FIIOC receives account fees and asset-based fees that vary according to the account size and type of account of the shareholders of Emerging Markets. FIIOC receives an asset-based fee of Class K's average net assets. FIIOC pays for typesetting, printing and mailing of shareholder reports, except proxy statements. For the period, transfer agent fees for each class were as follows:
| Amount | % of
Average
Net Assets |
Emerging Markets | $ 11,414,538 | .29 |
Class K | 255,148 | .05 |
| $ 11,669,686 | |
Accounting and Security Lending Fees. Fidelity Service Company, Inc. (FSC), an affiliate of FMR, maintains the Fund's accounting records. The accounting fee is based on the level of average net assets for the month. Under a separate contract, FSC administers the security lending program. The security lending fee is based on the number and duration of lending transactions.
Brokerage Commissions. The Fund placed a portion of its portfolio transactions with brokerage firms which are affiliates of the investment adviser. The commissions paid to these affiliated firms were $78 for the period.
Annual Report
6. Fees and Other Transactions with Affiliates - continued
Interfund Lending Program. Pursuant to an Exemptive Order issued by the SEC, the Fund, along with other registered investment companies having management contracts with FMR, may participate in an interfund lending program. This program provides an alternative credit facility allowing the funds to borrow from, or lend money to, other participating affiliated funds. At period end, there were no interfund loans outstanding. The Fund's activity in this program during the period for which loans were outstanding was as follows:
Borrower or Lender | Average Daily
Loan Balance | Weighted Average Interest Rate | Interest
Expense |
Borrower | $ 22,161,786 | .46% | $ 3,986 |
7. Committed Line of Credit.
The Fund participates with other funds managed by FMR or an affiliate in a $3.75 billion credit facility (the "line of credit") to be utilized for temporary or emergency purposes to fund shareholder redemptions or for other short-term liquidity purposes. The Fund has agreed to pay commitment fees on its pro-rata portion of the line of credit, which amounted to $16,938 and is reflected in Miscellaneous expenses on the Statement of Operations. During the period, there were no borrowings on this line of credit.
8. Security Lending.
The Fund lends portfolio securities through a lending agent from time to time in order to earn additional income. The lending agent may loan securities to certain qualified borrowers, including Fidelity Capital Markets (FCM), a broker-dealer affiliated with the Fund. On the settlement date of the loan, the Fund receives collateral (in the form of U.S. Treasury obligations, letters of credit and/or cash) against the loaned securities and maintains collateral in an amount not less than 100% of the market value of the loaned securities during the period of the loan. The market value of the loaned securities is determined at the close of business of the Fund and any additional required collateral is delivered to the Fund on the next business day. If the borrower defaults on its obligation to return the securities loaned because of insolvency or other reasons, a fund could experience delays and costs in recovering the securities loaned or in gaining access to the collateral. Any cash collateral received is invested in the Fidelity Securities Lending Cash Central Fund. The value of loaned securities and cash collateral at period end are disclosed on the Fund's Statement of Assets and Liabilities. Security lending income represents the income earned on investing cash collateral, less rebates paid to borrowers and lending agent fees associated with the loan, plus any premium payments received for lending certain types of securities. Security lending income is presented in the Statement of Operations as a component of income from Fidelity Central Funds. Total security lending income during the period amounted to $695,966. During the period, there were no securities loaned to FCM.
9. Bank Borrowings.
The Fund is permitted to have bank borrowings for temporary or emergency purposes to fund shareholder redemptions. The Fund has established borrowing arrangements with certain banks. The interest rate on the borrowings is the bank's base rate, as revised from time to time. The average daily loan balance during the period for which loans were outstanding amounted to $7,771,667. The weighted average interest rate was .71%. The interest expense amounted to $457 under the bank borrowing program. At period end, there were no bank borrowings outstanding.
10. Expense Reductions.
Many of the brokers with whom FMR places trades on behalf of the Fund provided services to the Fund in addition to trade execution. These services included payments of certain expenses on behalf of the Fund totaling $2,359,897 for the period. In addition, through arrangements with the Fund's custodian, credits realized as a result of uninvested cash balances were used to reduce the Fund's expenses. During the period, these credits reduced the Fund's custody expenses by $372.
Annual Report
Notes to Financial Statements - continued
11. Distributions to Shareholders.
Distributions to shareholders of each class were as follows:
Years ended October 31, | 2010 | 2009 |
From net investment income | | |
Emerging Markets | $ 21,030,807 | $ 35,658,169 |
Class K | 2,128,426 | 1,972,018 |
Total | $ 23,159,233 | $ 37,630,187 |
From net realized gain | | |
Emerging Markets | $ 24,475,486 | $ - |
Class K | 1,941,469 | - |
Total | $ 26,416,955 | $ - |
12. Share Transactions.
Transactions for each class of shares were as follows:
| Shares | Dollars |
Years ended October 31, | 2010 | 2009 A | 2010 | 2009 A |
Emerging Markets | | | | |
Shares sold | 69,154,267 | 77,986,934 | $ 1,590,197,264 | $ 1,325,781,409 |
Conversion to Class K | - | (2,616,204) | - | (34,095,539) |
Reinvestment of distributions | 1,952,719 | 2,953,728 | 43,877,566 | 34,381,402 |
Shares redeemed | (92,999,725) | (54,051,229) | (2,095,951,354) | (822,757,665) |
Net increase (decrease) | (21,892,739) | 24,273,229 | $ (461,876,524) | $ 503,309,607 |
Class K | | | | |
Shares sold | 28,708,422 | 7,005,118 | $ 648,209,971 | $ 114,260,792 |
Conversion from Emerging Markets | - | 2,618,157 | - | 34,095,539 |
Reinvestment of distributions | 181,368 | 169,855 | 4,069,895 | 1,972,018 |
Shares redeemed | (7,437,639) | (3,108,249) | (167,338,288) | (49,741,239) |
Net increase (decrease) | 21,452,151 | 6,684,881 | $ 484,941,578 | $ 100,587,110 |
A Conversion transactions for Class K and Emerging Markets are presented for the period November 1, 2008 through August 31, 2009.
13. Other.
The Fund's organizational documents provide former and current trustees and officers with a limited indemnification against liabilities arising in connection with the performance of their duties to the Fund. In the normal course of business, the Fund may also enter into contracts that provide general indemnifications. The Fund's maximum exposure under these arrangements is unknown as this would be dependent on future claims that may be made against the Fund. The risk of material loss from such claims is considered remote.
Annual Report
Report of Independent Registered Public Accounting Firm
To the Trustees of Fidelity Investment Trust and the Shareholders of Fidelity Emerging Markets Fund:
In our opinion, the accompanying statement of assets and liabilities, including the schedule of investments, and the related statements of operations and of changes in net assets and the financial highlights present fairly, in all material respects, the financial position of Fidelity Emerging Markets Fund (a fund of Fidelity Investment Trust) at October 31, 2010, the results of its operations for the year then ended, the changes in its net assets for each of the two years in the period then ended and the financial highlights for each of the five years in the period then ended, in conformity with accounting principles generally accepted in the United States of America. These financial statements and financial highlights (hereafter referred to as "financial statements") are the responsibility of the Fidelity Emerging Markets Fund's management. Our responsibility is to express an opinion on these financial statements based on our audits. We conducted our audits of these financial statements in accordance with the standards of the Public Company Accounting Oversight Board (United States). Those standards require that we plan and perform the audit to obtain reasonable assurance about whether the financial statements are free of material misstatement. An audit includes examining, on a test basis, evidence supporting the amounts and disclosures in the financial statements, assessing the accounting principles used and significant estimates made by management, and evaluating the overall financial statement presentation. We believe that our audits, which included confirmation of securities at October 31, 2010 by correspondence with the custodian and brokers, provide a reasonable basis for our opinion.
/s/ PricewaterhouseCoopers LLP
PricewaterhouseCoopers LLP
Boston, Massachusetts
December 17, 2010
Annual Report
The Trustees Member of the Advisory Board, and executive officers of the trust and fund, as applicable, are listed below. The Board of Trustees governs the fund and is responsible for protecting the interests of shareholders. The Trustees are experienced executives who meet periodically throughout the year to oversee the fund's activities, review contractual arrangements with companies that provide services to the fund, oversee management of the risks associated with such activities and contractual arrangements, and review the fund's performance. Except for James C. Curvey, each of the Trustees oversees 221 funds advised by FMR or an affiliate. Mr. Curvey oversees 410 funds advised by FMR or an affiliate.
The Trustees hold office without limit in time except that (a) any Trustee may resign; (b) any Trustee may be removed by written instrument, signed by at least two-thirds of the number of Trustees prior to such removal; (c) any Trustee who requests to be retired or who has become incapacitated by illness or injury may be retired by written instrument signed by a majority of the other Trustees; and (d) any Trustee may be removed at any special meeting of shareholders by a two-thirds vote of the outstanding voting securities of the trust. Each Trustee who is not an interested person (as defined in the 1940 Act) (Independent Trustee), shall retire not later than the last day of the calendar year in which his or her 72nd birthday occurs. The Independent Trustees may waive this mandatory retirement age policy with respect to individual Trustees. The executive officers and Advisory Board Member hold office without limit in time, except that any officer and Advisory Board Member may resign or may be removed by a vote of a majority of the Trustees at any regular meeting or any special meeting of the Trustees. Except as indicated, each individual has held the office shown or other offices in the same company for the past five years.
Experience, Skills, Attributes, and Qualifications of the Fund's Trustees. The Governance and Nominating Committee has adopted a statement of policy that describes the experience, qualifications, attributes, and skills that are necessary and desirable for potential Independent Trustee candidates (Statement of Policy). The Board believes that each Trustee satisfied at the time he or she was initially elected or appointed a Trustee, and continues to satisfy, the standards contemplated by the Statement of Policy. The Governance and Nominating Committee also engages professional search firms to help identify potential Independent Trustee candidates who have the experience, qualifications, attributes, and skills consistent with the Statement of Policy. From time to time, additional criteria based on the composition and skills of the current Independent Trustees, as well as experience or skills that may be appropriate in light of future changes to board composition, business conditions, and regulatory or other developments, have also been considered by the professional search firms and the Governance and Nominating Committee. In addition, the Board takes into account the Trustees' commitment and participation in Board and committee meetings, as well as their leadership of standing and ad hoc committees throughout their tenure.
In determining that a particular Trustee was and continues to be qualified to serve as a Trustee, the Board has considered a variety of criteria, none of which, in isolation, was controlling. The Board believes that, collectively, the Trustees have balanced and diverse experience, qualifications, attributes, and skills, which allow the Board to operate effectively in governing the fund and protecting the interests of shareholders. Information about the specific experience, skills, attributes, and qualifications of each Trustee, which in each case led to the Board's conclusion that the Trustee should serve (or continue to serve) as a trustee of the fund, is provided below.
Board Structure and Oversight Function. Edward C. Johnson 3d is an interested person (as defined in the 1940 Act) and currently serves as Chairman. The Trustees have determined that an interested Chairman is appropriate and benefits shareholders because an interested Chairman has a personal and professional stake in the quality and continuity of services provided to the fund. Independent Trustees exercise their informed business judgment to appoint an individual of their choosing to serve as Chairman, regardless of whether the Trustee happens to be independent or a member of management. The Independent Trustees have determined that they can act independently and effectively without having an Independent Trustee serve as Chairman and that a key structural component for assuring that they are in a position to do so is for the Independent Trustees to constitute a substantial majority for the Board. The Independent Trustees also regularly meet in executive session. Ned C. Lautenbach serves as Chairman of the Independent Trustees and as such (i) acts as a liaison between the Independent Trustees and management with respect to matters important to the Independent Trustees and (ii) with management prepares agendas for Board meetings.
Fidelity funds are overseen by different Boards of Trustees. The fund's Board oversees Fidelity's equity and high income funds and another Board oversees Fidelity's investment-grade bond, money market, and asset allocation funds. The asset allocation funds may invest in Fidelity funds overseen by the fund's Board. The use of separate Boards, each with its own committee structure, allows the Trustees of each group of Fidelity funds to focus on the unique issues of the funds they oversee, including common research, investment, and operational issues. On occasion, the separate Boards establish joint committees to address issues of overlapping consequences for the Fidelity funds overseen by each Board.
The Trustees operate using a system of committees to facilitate the timely and efficient consideration of all matters of importance to the Trustees, the fund, and fund shareholders and to facilitate compliance with legal and regulatory requirements and oversight of the fund's activities and associated risks. The Board, acting through its committees, has charged FMR and its affiliates with (i) identifying events or circumstances the occurrence of which could have demonstrably adverse effects on the fund's business and/or reputation; (ii) implementing processes and controls to lessen the possibility that such events or circumstances occur or to mitigate the effects of such events or circumstances if they do occur; and (iii) creating and maintaining a system designed to evaluate continuously business and market conditions in order to facilitate the identification and implementation processes described in (i) and (ii) above. Because the day-to-day operations and activities of the fund are carried out by or through FMR, its affiliates and other service providers, the fund's exposure to risks is mitigated but not eliminated by the processes overseen by the Trustees. While each of the Board's committees has responsibility for overseeing different aspects of the fund's activities, oversight is exercised primarily through the Operations, Audit, and Compliance Committees. Appropriate personnel, including but not limited to the fund's Chief Compliance Officer (CCO), FMR's internal auditor, the independent accountants, the fund's Treasurer and portfolio management personnel, make periodic reports to the Board's committees, as appropriate. The responsibilities of each committee, including their oversight responsibilities, are described further under "Standing Committees of the Fund's Trustees."
Annual Report
Trustees and Officers - continued
The fund's Statement of Additional Information (SAI) includes more information about the Trustees. To request a free copy, call Fidelity at 1-800-835-5092.
Interested Trustees*:
Correspondence intended for each Trustee who is an interested person may be sent to Fidelity Investments, 82 Devonshire Street, Boston, Massachusetts 02109.
Name, Age; Principal Occupations and Other Relevant Experience+ |
Edward C. Johnson 3d (80) |
| Year of Election or Appointment: 1984 Mr. Johnson is Trustee and Chairman of the Board of Trustees of certain Trusts. Mr. Johnson serves as Chief Executive Officer, Chairman, and a Director of FMR LLC; Chairman and a Director of FMR; Chairman and a Director of Fidelity Research & Analysis Company (FRAC); Chairman and a Director of Fidelity Investments Money Management, Inc.; and Chairman and a Director of FMR Co., Inc. In addition, Mr. Johnson serves as Chairman and Director of FIL Limited. Previously, Mr. Johnson served as President of FMR LLC (2006-2007). |
James C. Curvey (75) |
| Year of Election or Appointment: 2007 Mr. Curvey also serves as Trustee (2007-present) of other investment companies advised by FMR. Mr. Curvey is a Director of Fidelity Investments Money Management, Inc. (2009-present), Director of Fidelity Research & Analysis Co. (2009-present) and Director of FMR and FMR Co., Inc. (2007-present). Mr. Curvey is also Vice Chairman (2007-present) and Director of FMR LLC. In addition, Mr. Curvey serves as an Overseer for the Boston Symphony Orchestra and a member of the Trustees of Villanova University. Previously, Mr. Curvey was the Vice Chairman (2006-2007) and Director (2000-2007) of FMR Corp. |
* Trustees have been determined to be "Interested Trustees" by virtue of, among other things, their affiliation with the trust or various entities under common control with FMR.
+ The information above includes each Trustee's principal occupation during the last five years and other information relating to the experience, attributes, and skills relevant to each Trustee's qualifications to serve as a Trustee, which led to the conclusion that each Trustee should serve as a Trustee for each fund.
Independent Trustees:
Correspondence intended for each Independent Trustee (that is, the Trustees other than the Interested Trustees) may be sent to Fidelity Investments, P.O. Box 55235, Boston, Massachusetts 02205-5235.
Name, Age; Principal Occupations and Other Relevant Experience+ |
Dennis J. Dirks (62) |
| Year of Election or Appointment: 2005 Prior to his retirement in May 2003, Mr. Dirks was Chief Operating Officer and a member of the Board of The Depository Trust & Clearing Corporation (DTCC). He also served as President, Chief Operating Officer, and Board member of The Depository Trust Company (DTC) and President and Board member of the National Securities Clearing Corporation (NSCC). In addition, Mr. Dirks served as Chief Executive Officer and Board member of the Government Securities Clearing Corporation, Chief Executive Officer and Board member of the Mortgage-Backed Securities Clearing Corporation, as a Trustee and a member of the Finance Committee of Manhattan College (2005-2008), and as a Trustee and a member of the Finance Committee of AHRC of Nassau County (2006-2008). Mr. Dirks is a member of the Independent Directors Council (IDC) Governing Council (2010-Present) and Board of Directors for The Brookville Center for Children's Services, Inc. (2009-present). |
Alan J. Lacy (57) |
| Year of Election or Appointment: 2008 Mr. Lacy serves as Senior Adviser (2007-present) of Oak Hill Capital Partners, L.P. (private equity). Mr. Lacy also served as Chief Executive Officer (2000-2005) and Vice Chairman (2005-2006) of Sears Holdings Corporation and Sears, Roebuck and Co. (retail). In addition, Mr. Lacy serves as a member of the Board of Directors of The Western Union Company (global money transfer, 2006-present) and Bristol-Myers Squibb Company (global pharmaceuticals, 2007-present). Mr. Lacy is Chairman (2008-present) and a member (2006-present) of the Board of Trustees of The National Parks Conservation Association. |
Ned C. Lautenbach (66) |
| Year of Election or Appointment: 2000 Mr. Lautenbach is Chairman of the Independent Trustees of the Equity and High Income Funds (2006-present). Mr. Lautenbach currently serves as the Lead Director of the Eaton Corporation Board of Directors (diversified industrial, 1997-present). Mr. Lautenbach is also a member of the Board of Directors of the Philharmonic Center for the Arts in Naples, Florida (1999-
present); a member of the Board of Trustees of Fairfield University (2005-present); and a member of the Council on Foreign Relations (1994-present). Previously, Mr. Lautenbach was a Partner/Advisory Partner at Clayton, Dubilier & Rice, Inc. (private equity investment, 1998-2010), as well as a Director of Sony Corporation (2006-2007). |
Joseph Mauriello (66) |
| Year of Election or Appointment: 2008 Prior to his retirement in January 2006, Mr. Mauriello served in numerous senior management positions including Deputy Chairman and Chief Operating Officer (2004-2005), and Vice Chairman of Financial Services (2002-2004) of KPMG LLP US (professional services, 1965-2005). Mr. Mauriello currently serves as a member of the Board of Directors of XL Group plc. (global insurance and re-insurance, 2006-present) and of Arcadia Resources Inc. (health care services and products, 2007-present). Previously, Mr. Mauriello served as a Director of the Hamilton Funds of the Bank of New York (2006-2007). |
Cornelia M. Small (66) |
| Year of Election or Appointment: 2005 Ms. Small is a member of the Board of Directors of the Teagle Foundation (2009-present). Ms. Small is also a member of the Investment Committee, and Chair (2008-present) and a member of the Board of Trustees of Smith College. In addition, Ms. Small serves on the Investment Committee of the Berkshire Taconic Community Foundation (2008-present). Previously, Ms. Small served as Chairperson of the Investment Committee (2002-2008) of Smith College. In addition, Ms. Small served as Chief Investment Officer, Director of Global Equity Investments, and a member of the Board of Directors of Scudder, Stevens & Clark and Scudder Kemper Investments. |
William S. Stavropoulos (71) |
| Year of Election or Appointment: 2001 Mr. Stavropoulos is Vice Chairman of the Independent Trustees of the Equity and High Income Funds (2006-present). Mr. Stavropoulos serves as President and Founder of the Michigan Baseball Foundation, the Great Lakes Loons (2007-present). Mr. Stavropoulos is Chairman Emeritus of the Board of Directors of The Dow Chemical Company, where he previously served in numerous senior management positions, including President, CEO (1995-2000; 2002-2004), Chairman of the Executive Committee (2000-2006), and as a member of the Board of Directors (1990-2006). Currently, Mr. Stavropoulos is Chairman of Univar (global distributor of commodity and specialty chemicals, 2010-present), a Director of Teradata Corporation (data warehousing and technology solutions, 2008-present), Chemical Financial Corporation, Maersk Inc. (industrial conglomerate), Tyco International, Inc. (multinational manufacturing and services, 2007-present), and a member of the Advisory Board for Metalmark Capital (private equity investment, 2005-present). Mr. Stavropoulos is a special advisor to Clayton, Dubilier & Rice, Inc. (private equity investment). In addition, Mr. Stavropoulos is a member of the University of Notre Dame Advisory Council for the College of Science. |
David M. Thomas (61) |
| Year of Election or Appointment: 2008 Previously, Mr. Thomas served as Executive Chairman (2005-2006) and Chairman and Chief Executive Officer (2000-2005) of IMS Health, Inc. (pharmaceutical and healthcare information solutions). In addition, Mr. Thomas serves as a member of the Board of Directors of Fortune Brands, Inc. (consumer products), and Interpublic Group of Companies, Inc. (marketing communication, 2004-present). |
Michael E. Wiley (60) |
| Year of Election or Appointment: 2008 Mr. Wiley also serves as a Director of Asia Pacific Exploration Consolidated (international oil and gas exploration and production, 2008-present). Mr. Wiley serves as a Director of Tesoro Corporation (independent oil refiner and marketer, 2005-present), and a Director of Bill Barrett Corporation (exploration and production, 2005-present). In addition, Mr. Wiley also serves as a Director of Post Oak Bank (privately-held bank, 2004-present). Previously, Mr. Wiley served as a member of the Board of Trustees of the University of Tulsa (2000-2006; 2007-2010), as a Senior Energy Advisor of Katzenbach Partners, LLC (consulting, 2006-2007), as an Advisory Director of Riverstone Holdings (private investment), Chairman, President, and CEO of Baker Hughes, Inc. (oilfield services, 2000-2004), and as Director of Spinnaker Exploration Company (exploration and production, 2001-2005). |
+ The information above includes each Trustee's principal occupation during the last five years and other information relating to the experience, attributes, and skills relevant to each Trustee's qualifications to serve as a Trustee, which led to the conclusion that each Trustee should serve as a Trustee for each fund.
Annual Report
Trustees and Officers - continued
Advisory Board Member and Executive Officers:
Correspondence intended for each executive officer, and Peter S. Lynch may be sent to Fidelity Investments, 82 Devonshire Street, Boston, Massachusetts 02109.
Name, Age; Principal Occupation |
Peter S. Lynch (66) |
| Year of Election or Appointment: 2003 Member of the Advisory Board of Fidelity's Equity and High Income Funds. Mr. Lynch is Vice Chairman and a Director of FMR and FMR Co., Inc. In addition, Mr. Lynch serves as a Trustee of Boston College and as the Chairman of the Inner-City Scholarship Fund. Previously, Mr. Lynch served on the Special Olympics International Board of Directors (1997-2006). |
Kenneth B. Robins (41) |
| Year of Election or Appointment: 2008 President and Treasurer of Fidelity's Equity and High Income Funds. Mr. Robins also serves as President and Treasurer (2010-
present) and Assistant Treasurer (2009-present) of other Fidelity funds and is an employee of Fidelity Investments (2004-present). Previously, Mr. Robins served as Deputy Treasurer of the Fidelity funds (2005-2008) and Treasurer and Chief Financial Officer of The North Carolina Capital Management Trust: Cash and Term Portfolios (2006-2008). |
Bruce T. Herring (45) |
| Year of Election or Appointment: 2006 Vice President of certain Equity Funds. Mr. Herring also serves as Chief Investment Officer and Director of Fidelity Management & Research (U.K.) Inc. (2010-present) and Group Chief Investments Officer of FMR. Previously, Mr. Herring served as Vice President (2005-2006) and Senior Vice President (2006-2007) of Fidelity Management & Research Company, Vice President of FMR Co., Inc. (2001-2007) and as a portfolio manager for Fidelity U.S. Equity Funds. |
Brian B. Hogan (46) |
| Year of Election or Appointment: 2009 Vice President of certain Equity Funds and Vice President of Sector Funds. Mr. Hogan also serves as President of FMR's Equity Division (2009-present). Previously, Mr. Hogan served as Senior Vice President, Equity Research of FMR (2006-2009) and as a portfolio manager. |
Scott C. Goebel (42) |
| Year of Election or Appointment: 2008 Secretary and Chief Legal Officer (CLO) of the Fidelity funds. Mr. Goebel also serves as Secretary and CLO of The North Carolina Capital Management Trust: Cash and Term Portfolio (2008-present); General Counsel, Secretary, and Senior Vice President of FMR (2008-present) and FMR Co., Inc. (2008-present); Deputy General Counsel of FMR LLC; Chief Legal Officer of Fidelity Management & Research (Hong Kong) Limited (2008-present) and Assistant Secretary of Fidelity Management & Research (Japan) Inc. (2008-present), Fidelity Investments Money Management, Inc. (2008-present), Fidelity Management & Research (U.K.) Inc. (2008-present), and Fidelity Research and Analysis Company (2008-present). Previously, Mr. Goebel served as Assistant Secretary of the Funds (2007-2008) and as Vice President and Secretary of Fidelity Distributors Corporation (FDC) (2005-2007). |
William C. Coffey (41) |
| Year of Election or Appointment: 2009 Assistant Secretary of Fidelity's Equity and High Income Funds. Mr. Coffey also serves as Senior Vice President and Deputy General Counsel of FMR LLC (2010-present), and is an employee of Fidelity Investments. Previously, Mr. Coffey served as Vice President and Associate General Counsel of FMR LLC (2005-2009). |
Holly C. Laurent (56) |
| Year of Election or Appointment: 2008 Anti-Money Laundering (AML) Officer of the Fidelity funds. Ms. Laurent also serves as AML Officer of The North Carolina Capital Management Trust: Cash and Term Portfolio (2008-present) and is an employee of Fidelity Investments. Previously, Ms. Laurent was Senior Vice President and Head of Legal for Fidelity Business Services India Pvt. Ltd. (2006-2008), and Senior Vice President, Deputy General Counsel and Group Head for FMR LLC (2005-2006). |
Christine Reynolds (52) |
| Year of Election or Appointment: 2008 Chief Financial Officer of the Fidelity funds. Ms. Reynolds became President of Fidelity Pricing and Cash Management Services (FPCMS) in August 2008. Ms. Reynolds served as Chief Operating Officer of FPCMS (2007-2008). Previously, Ms. Reynolds served as President, Treasurer, and Anti-Money Laundering officer of the Fidelity funds (2004-2007). |
Kenneth A. Rathgeber (63) |
| Year of Election or Appointment: 2004 Chief Compliance Officer of Fidelity's Equity and High Income Funds. Mr. Rathgeber is Chief Compliance Officer of Fidelity Management & Research (Hong Kong) Limited (2008-present), Fidelity Management & Research (Japan) Inc. (2008-present), FMR (2005-present), FMR Co., Inc. (2005-present), Fidelity Management & Research (U.K.) Inc. (2005-present), Fidelity Research & Analysis Company (2005-present), Fidelity Investments Money Management, Inc. (2005-present), Pyramis Global Advisors, LLC (2005-present), and Strategic Advisers, Inc. (2005-present). |
Jeffrey S. Christian (49) |
| Year of Election or Appointment: 2009 Deputy Treasurer of the Fidelity funds. Mr. Christian is an employee of Fidelity Investments. Previously, Mr. Christian served as Chief Financial Officer (2008-2009) of certain Fidelity funds and Senior Vice President of Fidelity Pricing and Cash Management Services (FPCMS) (2004-2009). |
Bryan A. Mehrmann (49) |
| Year of Election or Appointment: 2005 Deputy Treasurer of the Fidelity funds. Mr. Mehrmann is an employee of Fidelity Investments. |
Adrien E. Deberghes (43) |
| Year of Election or Appointment: 2008 Deputy Treasurer of Fidelity's Equity and High Income Funds. Mr. Deberghes also serves as Assistant Treasurer of other Fidelity funds (2010-present) and is an employee of Fidelity Investments (2008-present). Previously, Mr. Deberghes served as Senior Vice President of Mutual Fund Administration at State Street Corporation (2007-2008), Senior Director of Mutual Fund Administration at Investors Bank & Trust (2005-2007), and Director of Finance for Dunkin' Brands (2000-2005). |
Stephanie J. Dorsey (41) |
| Year of Election or Appointment: 2010 Assistant Treasurer of Fidelity's Equity and High Income Funds. Ms. Dorsey also serves as Deputy Treasurer of other Fidelity funds (2008-present) and is an employee of Fidelity Investments (2008-present). Previously, Ms. Dorsey served as Treasurer (2004-2008) of the JPMorgan Mutual Funds and Vice President (2004-2008) of JPMorgan Chase Bank. |
John R. Hebble (52) |
| Year of Election or Appointment: 2009 Assistant Treasurer of Fidelity's Equity and High Income Funds. Mr. Hebble also serves as Treasurer and Chief Financial Officer of The North Carolina Capital Management Trust: Cash and Term Portfolio (2008-present), President and Treasurer of other Fidelity funds (2008-present) and is an employee of Fidelity Investments. |
Gary W. Ryan (52) |
| Year of Election or Appointment: 2005 Assistant Treasurer of the Fidelity funds. Mr. Ryan is an employee of Fidelity Investments. Previously, Mr. Ryan served as Vice President of Fund Reporting in Fidelity Pricing and Cash Management Services (FPCMS) (1999-2005). |
Jonathan Davis (42) |
| Year of Election or Appointment: 2010 Assistant Treasurer of the Fidelity funds. Mr. Davis is an employee of Fidelity Investments. Previously, Mr. Davis served as Vice President and Associate General Counsel of FMR LLC (2003-2010). |
Annual Report
The Board of Trustees of Fidelity Emerging Markets Fund voted to pay shareholders of record at the opening of business on record date, the following distributions per share derived from capital gains realized from sales of portfolio securities, and dividends derived from net investment income:
| Pay Date | Record Date | Dividends | Capital Gains |
Class K | 12/06/10 | 12/03/10 | $0.322 | $0.129 |
Class K designates 63% of the dividend distributed in December 2009 as amounts which may be taken into account as a dividend for the purposes of the maximum rate under section 1(h)(11) of the Internal Revenue Code.
The amounts per share which represent income derived from sources within, and taxes paid to, foreign countries or possessions of the United States are as follows:
| Pay Date | Income | Taxes |
Class K | 12/07/09 | $0.187 | $0.0258 |
The fund will notify shareholders in January 2011 of amounts for use in preparing 2010 income tax returns.
Annual Report
Board Approval of Investment Advisory Contracts and Management Fees
Fidelity Emerging Markets Fund
Each year, the Board of Trustees, including the Independent Trustees (together, the Board), votes on the renewal of the management contract and sub-advisory agreements (together, the Advisory Contracts) for the fund. The Board, assisted by the advice of fund counsel and Independent Trustees' counsel, requests and considers a broad range of information relevant to the renewal of the Advisory Contracts throughout the year.
The Board meets regularly and considers at each of its meetings factors that are relevant to its annual consideration of the renewal of the fund's Advisory Contracts, including the services and support provided to the fund and its shareholders. The Board has established various standing committees, each composed of Independent Trustees with varying backgrounds, to which the Board has assigned specific subject matter responsibilities in order to enhance effective decision-making by the Board. The Board, acting directly and through its Committees, requests and receives information concerning the annual consideration of the renewal of the fund's Advisory Contracts. The Board also meets as needed to consider matters specifically related to the Board's annual consideration of the renewal of Advisory Contracts. Members of the Board may also meet with trustees of other Fidelity funds through ad hoc joint committees to discuss certain matters relevant to the Fidelity funds.
At its July 2010 meeting, the Board of Trustees, including the Independent Trustees, unanimously determined to renew the fund's Advisory Contracts. In reaching its determination, the Board considered all factors it believed relevant, including (i) the nature, extent, and quality of the services to be provided to the fund and its shareholders (including the investment performance of the fund); (ii) the competitiveness of the fund's management fee and total expenses; (iii) the total costs of the services to be provided by and the profits to be realized by Fidelity from its relationship with the fund; (iv) the extent to which economies of scale would be realized as the fund grows; and (v) whether fee levels reflect these economies of scale, if any, for the benefit of fund shareholders.
In considering whether to renew the Advisory Contracts for the fund, the Board reached a determination, with the assistance of fund counsel and Independent Trustees' counsel and through the exercise of its business judgment, that the renewal of the Advisory Contracts is in the best interests of fund shareholders and that the compensation to be received by Fidelity under the management contract is fair and reasonable. The Board's decision to renew the Advisory Contracts was not based on any single factor noted above, but rather was based on a comprehensive consideration of all the information provided to the Board at its meetings throughout the year. The Board, in reaching its determination to renew the Advisory Contracts, is aware that shareholders in the fund have a broad range of investment choices available to them, including a wide choice among mutual funds offered by Fidelity's competitors, and that the fund's shareholders, with the opportunity to review and weigh the disclosure provided by the fund in its prospectus and other public disclosures, have chosen to invest in this fund, managed by Fidelity.
Nature, Extent, and Quality of Services Provided. The Board considered the staffing within the investment adviser, FMR, and the sub-advisers (together, the Investment Advisers), including the backgrounds of the fund's investment personnel and the fund's investment objective and discipline. The Independent Trustees also had discussions with senior management of Fidelity's investment operations and investment groups. The Board considered the structure of the portfolio manager compensation program and whether this structure provides appropriate incentives to act in the best interest of the fund.
Resources Dedicated to Investment Management and Support Services. The Board and the equity research subcommittee of the Board's Fund Oversight Committee reviewed the size, education, and experience of the Investment Advisers' investment staff, their use of technology, and the Investment Advisers' approach to recruiting, training, and retaining portfolio managers and other research, advisory, and management personnel. The Board noted that Fidelity's analysts have access to a variety of technological tools and market and securities data that enable them to perform both fundamental and quantitative analysis and to specialize in various disciplines. The Board considered Fidelity's extensive global research capabilities that enable the Investment Advisers to aggregate data from various sources in an effort to produce positive investment results. The Board also considered that Fidelity's portfolio managers and analysts have access to daily portfolio attribution that allows for monitoring of a fund's portfolio, as well as an electronic communication system that provides immediate real-time access to research concerning issuers and credit enhancers. The Board noted FMR's continued focus on strengthening the organization and discipline of equity portfolio management and research.
Shareholder and Administrative Services. The Board considered (i) the nature, extent, quality, and cost of advisory, administrative, and shareholder services performed by the Investment Advisers and their affiliates under the Advisory Contracts and under separate agreements covering transfer agency, pricing and bookkeeping, and securities lending services for the fund; (ii) the nature and extent of the investment adviser's supervision of third party service providers, principally custodians and subcustodians; and (iii) the resources devoted to, and the record of compliance with, the fund's compliance policies and procedures. The Board also reviewed the allocation of fund brokerage, including allocations to brokers affiliated with the Investment Advisers, the use of brokerage commissions to pay fund expenses, and the use of "soft" commission dollars to pay for research services.
The Board noted that the growth of fund assets over time across the complex allows Fidelity to reinvest in the development of services designed to enhance the value or convenience of the Fidelity funds as investment vehicles. These services include 24-hour access to account information and market information through phone representatives and over the Internet, and investor education materials and asset allocation tools.
Investment in a Large Fund Family. The Board considered the benefits to shareholders of investing in a Fidelity fund, including the benefits of investing in a fund that is part of a large family of funds offering a variety of investment disciplines and providing a large variety of mutual fund investor services. The Board noted that Fidelity had taken, or had made recommendations that resulted in the Fidelity funds taking, a number of actions over the previous year that benefited particular funds, including (i) dedicating additional resources to investment research and restructuring and broadening the focus of the investment research teams; (ii) bolstering the senior management team that oversees asset management; (iii) launching Class F of certain funds as a lower-fee class available to Freedom K and Freedom Index Funds; (iv) lowering the initial investment minimums and ongoing balance requirements for Real Estate High Income Fund; (v) eliminating subsequent purchase minimums for all funds and adding a waiver of the investment minimum requirement for new accounts opened with the proceeds of a systematic withdrawal plan; (vi) eliminating the withdrawal minimum and maximum limits for systematic withdrawals from Advisor funds; (vii) expanding sales load waivers on Class A shares for Destiny Planholders and expanding Institutional Class eligibility for Class O Destiny Planholders; and (viii) changing certain Class A and Class T sales charge structures to further align them with industry practices.
Annual Report
Board Approval of Investment Advisory Contracts and Management Fees - continued
Investment Performance. The Board considered whether the fund has operated in accordance with its investment objective, as well as its record of compliance with its investment restrictions. It also reviewed the fund's absolute investment performance for each class, as well as the fund's relative investment performance for each class measured over multiple periods against (i) a broad-based securities market index, and (ii) a peer group of mutual funds deemed appropriate by Fidelity and reviewed by the Board. The following charts considered by the Board show, over the one-, three-, and five-year periods ended December 31, 2009, as available, the cumulative total returns of Class K and the retail class of the fund, the cumulative total returns of a broad-based securities market index ("benchmark"), and a range of cumulative total returns of a peer group of mutual funds identified by Morningstar, Inc. as having an investment style similar to that of the fund based on underlying portfolio holdings. The box within each chart shows the 25th percentile return (bottom of box) and the 75th percentile return (top of box) of the peer group. Returns shown above the box are in the first quartile and returns shown below the box are in the fourth quartile. The percentage beaten numbers noted below each chart correspond to the percentile box and represent the percentage of funds in the peer group whose performance was equal to or lower than that of the class indicated.
Fidelity Emerging Markets Fund

The Board reviewed the fund's relative investment performance against its peer group and noted that the performance of the retail class of the fund (the class with the longer performance record) was in the second quartile for the one- and five-year periods and the fourth quartile for the three-year period. The Board also noted that the investment performance of the fund was lower than its benchmark for all the periods shown. The Board considered that the variations in performance between the fund's classes reflect the variations in class expenses, which result in lower performance for the higher expense class. The Board also reviewed the fund's performance since inception as well as performance in the current year.
Based on its review, and giving particular weight to the nature and quality of the resources dedicated by the Investment Advisers to maintain and improve relative performance and factoring in the unprecedented market events in recent years, the Board concluded that the nature, extent, and quality of investment management and support services and of shareholder and administrative services provided to the fund will benefit the fund's shareholders, particularly in light of the Board's view that the fund's shareholders benefit from investing in a fund that is part of a large family of funds offering a variety of investment disciplines and services.
Competitiveness of Management Fee and Total Fund Expenses. The Board considered the fund's management fee and total expenses compared to "mapped groups" of competitive funds and classes. Fidelity creates "mapped groups" by combining similar Lipper investment objective categories that have comparable management fee characteristics. Combining Lipper investment objective categories aids the Board's management fee and total expense comparisons by broadening the competitive group used for comparison and by reducing the number of universes to which various Fidelity funds are compared.
Annual Report
Management Fee. The Board considered two proprietary management fee comparisons for the 12-month periods shown in the chart below. The group of Lipper funds used by the Board for management fee comparisons is referred to below as the "Total Mapped Group." The Total Mapped Group comparison focuses on a fund's standing relative to the total universe of comparable funds available to investors, in terms of gross management fees before expense reimbursements or caps. "TMG %" represents the percentage of funds in the Total Mapped Group that had management fees that were lower than the fund's. For example, a TMG % of 7% means that 93% of the funds in the Total Mapped Group had higher management fees than the fund. The "Asset-Size Peer Group" (ASPG) comparison focuses on a fund's standing relative to non-Fidelity funds similar in size to the fund within the Total Mapped Group. The ASPG represents at least 15% of the funds in the Total Mapped Group with comparable asset size and management fee characteristics, subject to a minimum of 50 funds (or all funds in the Total Mapped Group if fewer than 50). Additional information, such as the ASPG quartile in which the fund's management fee ranked, is also included in the chart and considered by the Board.
Fidelity Emerging Markets Fund

The Board noted that the fund's management fee ranked below the median of its Total Mapped Group and below the median of its ASPG for 2009.
Based on its review, the Board concluded that the fund's management fee is fair and reasonable in light of the services that the fund receives and the other factors considered.
Total Expenses. In its review of each class's total expenses, the Board considered the fund's management fee as well as other fund or class expenses, as applicable, such as transfer agent fees, pricing and bookkeeping fees, and custodial, legal, and audit fees. The Board also noted the effects of any waivers and reimbursements on fees and expenses. As part of its review, the Board also considered current and historical total expenses of each class of the fund compared to competitive fund median expenses. Each class of the fund is compared to those funds and classes in the Total Mapped Group (used by the Board for management fee comparisons) that have a similar sales load structure.
The Board noted that the total expenses of each class ranked below its competitive median for 2009.
Fees Charged to Other Fidelity Clients. The Board also considered Fidelity fee structures and other information with respect to clients of FMR and its affiliates, such as other mutual funds advised or subadvised by FMR or its affiliates, pension plan clients, and other institutional clients. In March 2010, the Board created an ad hoc joint committee with the board of other Fidelity funds (the Committee) to review and compare Fidelity's institutional investment advisory business with its business of providing services to the Fidelity funds, including the differences in services provided, fees charged, and costs incurred, as well as competition in their respective marketplaces.
Based on its review of total expenses and fees charged to other Fidelity clients, the Board concluded that the total expenses of each class of the fund were reasonable in light of the services that the fund and its shareholders receive and the other factors considered, including the findings of the Committee.
Costs of the Services and Profitability. The Board considered the revenues earned and the expenses incurred by Fidelity in conducting the business of developing, marketing, distributing, managing, administering and servicing the fund and its shareholders. The Board also considered the level of Fidelity's profits in respect of all the Fidelity funds.
Annual Report
Board Approval of Investment Advisory Contracts and Management Fees - continued
On an annual basis, FMR presents to the Board Fidelity's profitability for the fund. Fidelity calculates the profitability for each fund, as well as aggregate profitability for groups of Fidelity funds and all Fidelity funds, using a series of detailed revenue and cost allocation methodologies which originate with the audited books and records of Fidelity. The Audit Committee of the Board reviews any significant changes from the prior year's methodologies.
PricewaterhouseCoopers LLP (PwC), independent registered public accounting firm and auditor to Fidelity and certain Fidelity funds, has been engaged annually by the Board as part of the Board's assessment of Fidelity's profitability analysis. PwC's engagement includes the review and assessment of Fidelity's methodologies used in determining the revenues and expenses attributable to Fidelity's mutual fund business, and completion of agreed-upon procedures surrounding the mathematical accuracy of fund profitability and its conformity to allocation methodologies. After considering PwC's reports issued under the engagement and information provided by Fidelity, the Board believes that while other allocation methods may also be reasonable, Fidelity's profitability methodologies are reasonable in all material respects.
The Board has also reviewed Fidelity's non-fund businesses and fall-out benefits related to the mutual fund business as well as cases where Fidelity's affiliates may benefit from or be related to the fund's business.
The Board considered the costs of the services provided by and the profits realized by Fidelity in connection with the operation of the fund and were satisfied that the profitability was not excessive in the circumstances.
Economies of Scale. The Board considered whether there have been economies of scale in respect of the management of the Fidelity funds, whether the Fidelity funds (including the fund) have appropriately benefited from any such economies of scale, and whether there is potential for realization of any further economies of scale. The Board considered the extent to which the fund will benefit from economies of scale through increased services to the fund, through waivers or reimbursements, or through fee or expense reductions.
In February 2009, the Board and the board of other Fidelity funds created an ad hoc committee (the Economies of Scale Committee) to analyze whether FMR attains economies of scale in respect of the management and servicing of the Fidelity funds, whether the Fidelity funds have appropriately benefited from such economies of scale, and whether there is potential for realization of any further economies of scale.
The Board recognized that the fund's management contract incorporates a "group fee" structure, which provides for lower group fee rates as total fund assets under FMR's management increase, and for higher group fee rates as total fund assets under FMR's management decrease. FMR calculates the group fee rates based on a tiered asset "breakpoint" schedule that varies based on asset class. The Board considered that the group fee is designed to deliver the benefits of economies of scale to fund shareholders when total Fidelity fund assets increase, even if assets of any particular fund are unchanged or have declined, because some portion of Fidelity's costs are attributable to services provided to all Fidelity funds, and all funds benefit if those costs can be allocated among more assets. The Board concluded that, given the group fee structure, fund shareholders will benefit from lower management fees as assets under FMR's management increase at the fund complex level, regardless of whether Fidelity achieves any such economies of scale.
The Board concluded, considering the findings of the Economies of Scale Committee, that any potential economies of scale are being appropriately shared between fund shareholders and Fidelity.
Additional Information Requested by the Board. In order to develop fully the factual basis for consideration of the Fidelity funds' Advisory Contracts, the Board requested and received additional information on certain topics, including (i) fund performance trends, actions to be taken by FMR to improve certain funds' overall performance, and Fidelity's long-term strategies for certain funds; (ii) portfolio manager changes that have occurred during the past year and length of portfolio manager tenure for different categories of funds over time; (iii) Fidelity's compensation structure for portfolio managers, research analysts, and other key personnel, the rationale for the compensation structure, and how the compensation structure provides appropriate performance incentives; (iv) the amount of the investment that each portfolio manager has made in the Fidelity fund(s) that he or she manages; (v) management and other fees paid by FMR to affiliated sub-advisers on behalf of the Fidelity funds; (vi) Fidelity's fee structures and rationale for recommending different fees among different categories of funds; (vii) Fidelity's rationale for recommending which funds should have a performance adjustment component as part of their management fees; (viii) the rationale for any differences between fund fee structures and fee structures in place for other Fidelity clients; and (ix) explanations regarding the relative total expenses borne by certain funds and classes, total expense competitive trends, and actions that might be taken by FMR to reduce total expenses for certain funds and classes.
Based on its evaluation of all of the conclusions noted above, and after considering all factors it believed relevant, the Board ultimately concluded that the advisory fee structures are fair and reasonable, and that the fund's Advisory Contracts should be renewed.
Annual Report
Managing Your Investments
Fidelity offers several ways to conveniently manage your workplace benefits (including your workplace savings plan, investments, and additional services) via your telephone or PC. You can access your plan and account information and research your investments 24 hours a day.
By Phone
Fidelity provides a single toll-free number to access plan information, account balances, positions, and quotes*. It's easy to navigate the service, and on your first call, the system will help you create a personal identification number (PIN) for security.
(phone_graphic)
Fidelity Workplace Investing
1-800-835-5092
By PC
Fidelity's web site on the Internet provides a wide range of information, including plan information, daily financial news, fund performance, interactive planning tools, and news about Fidelity products and services.
(computer_graphic)
Fidelity's Web Site
www.401k.com
* When you call the quotes line, please remember that a fund's yield and return will vary and, except for money market funds, share price will also vary. This means that you may have a gain or loss when you sell your shares. There is no assurance that money market funds will be able to maintain a stable $1 share price; an investment in a money market fund is not insured or guaranteed by the U.S. government. Total returns are historical and include changes in share price, reinvestment of dividends and capital gains, and the effects of any sales charges.
Annual Report
To Write Fidelity
We'll give your correspondence immediate attention and send you written confirmation upon completion of your request.
(letter_graphic)
For Non-Retirement
Accounts
Buying shares
Fidelity Investments
P.O. Box 770001
Cincinnati, OH 45277-0003
Overnight Express
Fidelity Investments
Attn: Distribution Services
100 Crosby Parkway - KC1H
Covington, KY 41015
Selling shares
Fidelity Investments
P.O. Box 770001
Cincinnati, OH 45277-0035
Overnight Express
Fidelity Investments
Attn: Distribution Services
100 Crosby Parkway - KC1H
Covington, KY 41015
General Correspondence
Fidelity Investments
P.O. Box 500
Merrimack, NH 03054-0500
(letter_graphic)
For Retirement
Accounts
Buying shares
Fidelity Investments
P.O. Box 770001
Cincinnati, OH 45277-0003
Selling shares
Fidelity Investments
P.O. Box 770001
Cincinnati, OH 45277-0035
Overnight Express
Fidelity Investments
Attn: Distribution Services
100 Crosby Parkway - KC1H
Covington, KY 41015
General Correspondence
Fidelity Investments
P.O. Box 500
Merrimack, NH 03054-0500
Annual Report
Investment Adviser
Fidelity Management & Research Company
Boston, MA
Investment Sub-Advisers
FMR Co., Inc.
Fidelity Management & Research (U.K.) Inc.
Fidelity Research & Analysis Company
FIL Investments (Japan) Limited
FIL Investment Advisors
FIL Investment Advisors
(U.K.) Limited
Fidelity Management & Research
(Hong Kong) Limited
Fidelity Management & Research
(Japan) Inc.
General Distributor
Fidelity Distributors Corporation
Boston, MA
Transfer and Service Agents
Fidelity Investments Institutional
Operations Company, Inc.
Boston, MA
Fidelity Service Company, Inc.
Boston, MA
Custodians
JPMorgan Chase Bank
New York, NY
Fidelity's International Equity Funds
Fidelity Canada Fund
Fidelity China Region Fund
Fidelity Diversified International Fund
Fidelity Emerging Asia Fund
Fidelity Emerging Europe, Middle East, Africa (EMEA) Fund
Fidelity Emerging Markets Fund
Fidelity Europe Capital Appreciation Fund
Fidelity Europe Fund
Fidelity Global Balanced Fund
Fidelity Global Commodity Stock Fund
Fidelity International Capital Appreciation Fund
Fidelity International Discovery Fund
Fidelity International Growth Fund
Fidelity International Small Cap Fund
Fidelity International Small Cap Opportunities Fund
Fidelity International Value Fund
Fidelity Japan Fund
Fidelity Japan Smaller Companies Fund
Fidelity Latin America Fund
Fidelity Nordic Fund
Fidelity Overseas Fund
Fidelity Pacific Basin Fund
Fidelity Total International Equity Fund
Fidelity Worldwide Fund
Corporate Headquarters
82 Devonshire Street
Boston, MA 02109
www.fidelity.com
EMF-K-UANN-1210
1.863014.102
Fidelity®
Japan
Fund -
Class F
Annual Report
October 31, 2010
(2_fidelity_logos) (Registered_Trademark)
Contents
Performance | <Click Here> | How the fund has done over time. |
Management's Discussion of Fund Performance | <Click Here> | The Portfolio Manager's review of fund performance and strategy. |
Shareholder Expense Example | <Click Here> | An example of shareholder expenses. |
Investment Changes | <Click Here> | A summary of major shifts in the fund's investments over the past six months. |
Investments | <Click Here> | A complete list of the fund's investments with their market values. |
Financial Statements | <Click Here> | Statements of assets and liabilities, operations, and changes in net assets, as well as financial highlights. |
Notes | <Click Here> | Notes to the financial statements. |
Report of Independent Registered Public Accounting Firm | <Click Here> | |
Trustees and Officers | <Click Here> | |
Distributions | <Click Here> | |
Board Approval of Investment Advisory Contracts and Management Fees | <Click Here> | |
To view a fund's proxy voting guidelines and proxy voting record for the 12-month period ended June 30, visit http://www.fidelity.com/proxyvotingresults or visit the Securities and Exchange Commission's (SEC) web site at http://www.sec.gov. You may also call 1-800-835-5092 to request a free copy of the proxy voting guidelines.
Standard & Poor's, S&P and S&P 500 are registered service marks of The McGraw-Hill Companies, Inc. and have been licensed for use by Fidelity Distributors Corporation.
Other third party marks appearing herein are the property of their respective owners.
All other marks appearing herein are registered or unregistered trademarks or service marks of FMR LLC or an affiliated company.
This report and the financial statements contained herein are submitted for the general information of the shareholders of the fund. This report is not authorized for distribution to prospective investors in the fund unless preceded or accompanied by an effective prospectus.
A fund files its complete schedule of portfolio holdings with the SEC for the first and third quarters of each fiscal year on Form N-Q. Forms N-Q are available on the SEC's web site at http://www.sec.gov. A fund's Forms N-Q may be reviewed and copied at the SEC's Public Reference Room in Washington, DC. Information regarding the operation of the SEC's Public Reference Room may be obtained by calling 1-800-SEC-0330. For a complete list of a fund's portfolio holdings, view the most recent holdings listing, semiannual report, or annual report on Fidelity's web site at http://www.fidelity.com or http://www.advisor.fidelity.com, as applicable.
NOT FDIC INSURED • MAY LOSE VALUE • NO BANK GUARANTEE
Neither the fund nor Fidelity Distributors Corporation is a bank.
Annual Report
Average annual total return reflects the change in the value of an investment, assuming reinvestment of the class' distributions from dividend income and capital gains (the profits earned upon the sale of securities that have grown in value, if any) and assuming a constant rate of performance each year. The $10,000 table and the fund's returns do not reflect the deduction of taxes that a shareholder would pay on fund distributions or the redemption of fund shares. During periods of reimbursement by Fidelity, a fund's total return will be greater than it would be had the reimbursement not occurred. How a fund did yesterday is no guarantee of how it will do tomorrow.
Average Annual Total Returns
Periods ended October 31, 2010 | Past 1
year | Past 5
years | Past 10
years |
Class F A | 7.42% | -2.97% | -2.25% |
A The initial offering of Class F shares took place on June 26, 2009. Returns prior to June 26, 2009 are those of Fidelity® Japan Fund, the original class of the fund.
$10,000 Over 10 Years
Let's say hypothetically that $10,000 was invested in Fidelity® Japan Fund - Class F on October 31, 2000. The chart shows how the value of your investment would have changed, and also shows how the Tokyo Stock Price Index (TOPIX) performed over the same period. The initial offering of Class F took place on June 26, 2009. See above for additional information regarding the performance of Class F.
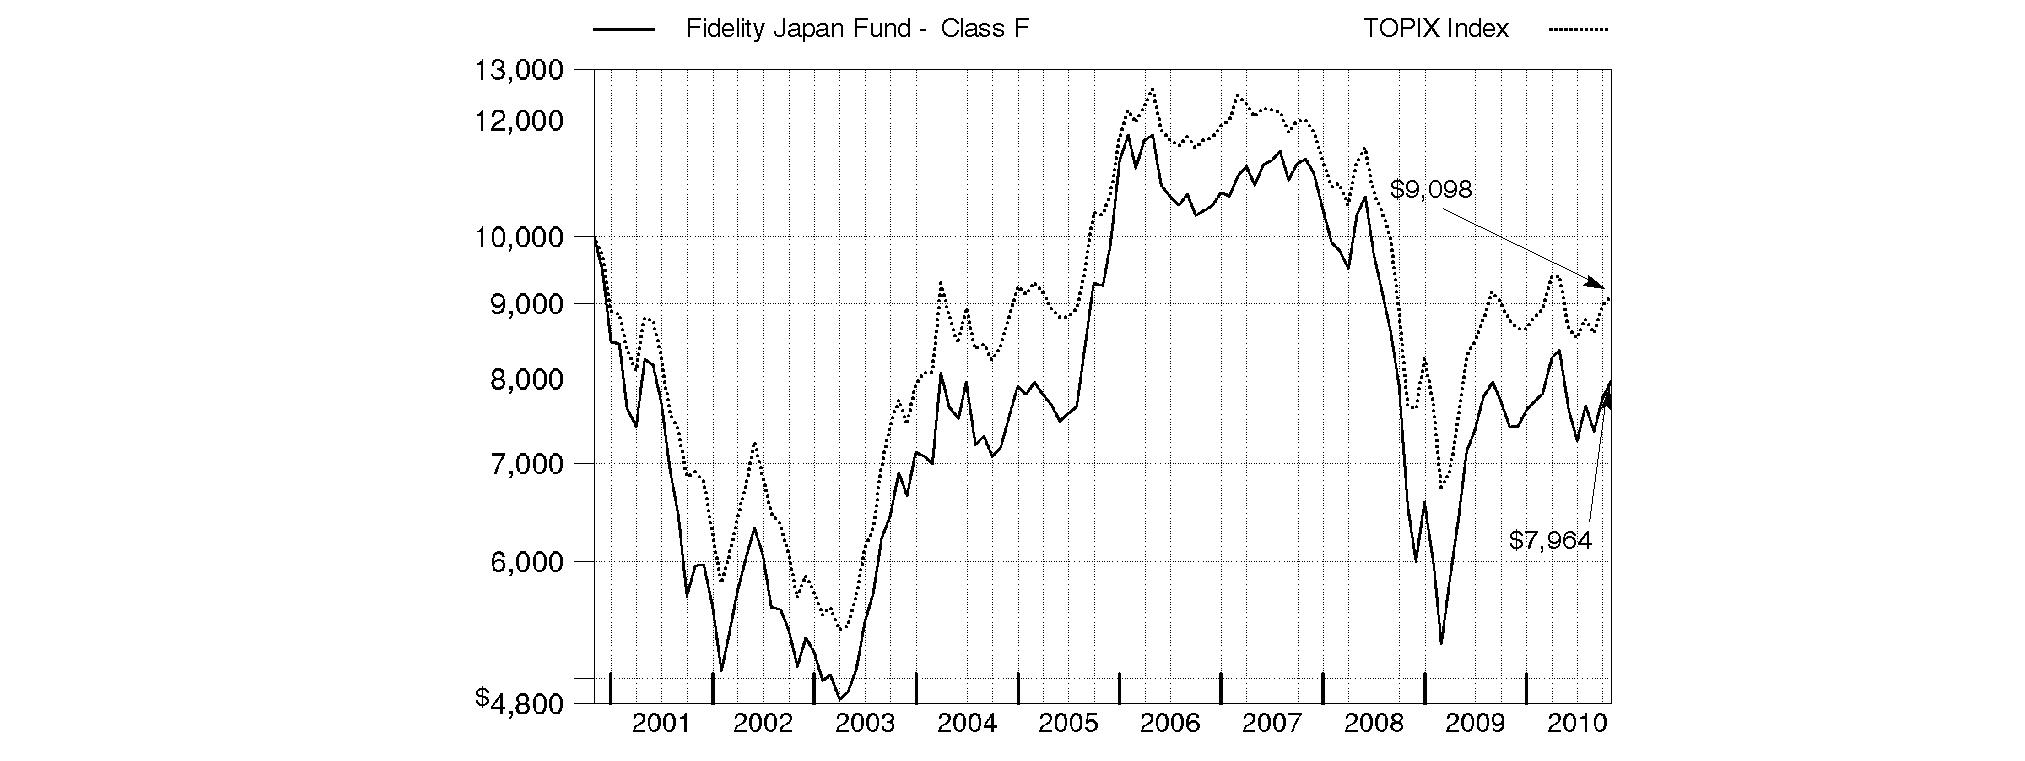
Annual Report
Market Recap: International stocks rode a wave of volatility similar to that of their U.S. counterparts during the 12 months ending October 31, 2010. Stocks gained modestly in the first half of the period, despite growing concerns about the European debt crisis. Sentiment turned decidedly negative in May and June, however, and the market suffered a precipitous decline. These losses were more than offset during the last four months of the period, when signs of economic growth and subsiding debt fears helped propel international stocks about 21%. For the full year, the MSCI ® ACWI® (All Country World Index) ex USA Index gained 12.76%, boosted in part by a generally depreciating U.S. dollar. Within the index, Canada and emerging markets were standouts, returning 23% and 24%, respectively. Results in the latter group were led by strong-performing India, Mexico and South Africa, while China fell short of the MSCI benchmark due to cooling economic growth. The developed Asia ex Japan segment rose 16% for the period, lifted by solid results from Singapore and Hong Kong. Meanwhile, Europe rose just 9%, held back mainly by debt-riddled Spain and Italy, as well as lagging major constituent France. Japan returned only 5%, a result of that nation's continued weak economy.
Comments from Robert Rowland, Portfolio Manager of Fidelity® Japan Fund: During the past year, the fund's Class F shares returned 7.42%, handily beating the 3.70% gain of the Tokyo Stock Price Index (TOPIX). Strong stock picking in financials - particularly the diversified financials group - lifted the fund's results, as did favorable stock selection in industrials, consumer discretionary and information technology. Against a backdrop of improved credit conditions and a rebound in global equity markets, our holdings in non-bank financials, including Orix, Sompo Japan Insurance - which merged with NipponKoa Insurance to form NKSJ Holdings during the period - and Credit Saison, were among the leading contributors to performance. Other contributors included imaging and optical products manufacturer Canon, automaker Honda Motor, LCD (liquid-crystal display) component suppliers Nippon Electric Glass and Nitto Denko, and wireless telecommunication services and hardware provider NTT DoCoMo. Conversely, a large overweighting in financials, the benchmark's weakest-performing sector, undercut the benefit of favorable security selection in that group. Life insurer T&D Holdings detracted from performance, as did synthetic rubber/resin producer JSR and printed circuit board manufacturer Ibiden. Stanley Electric and Toyoda Gosei, makers of LED (light-emitting-diode) auto parts, also hurt.
The views expressed above reflect those of the portfolio manager(s) only through the end of the period as stated on the cover of this report and do not necessarily represent the views of Fidelity or any other person in the Fidelity organization. Any such views are subject to change at any time based upon market or other conditions and Fidelity disclaims any responsibility to update such views. These views may not be relied on as investment advice and, because investment decisions for a Fidelity fund are based on numerous factors, may not be relied on as an indication of trading intent on behalf of any Fidelity fund.
Annual Report
Fidelity Japan Fund
Shareholder Expense Example
As a shareholder of the Fund, you incur two types of costs: (1) transaction costs, including redemption fees, and (2) ongoing costs, including management fees and other Fund expenses. This Example is intended to help you understand your ongoing costs (in dollars) of investing in the Fund and to compare these costs with the ongoing costs of investing in other mutual funds.
The Example is based on an investment of $1,000 invested at the beginning of the period and held for the entire period (May 1, 2010 to October 31, 2010).
Actual Expenses
The first line of the accompanying table for each class of the Fund provides information about actual account values and actual expenses. You may use the information in this line, together with the amount you invested, to estimate the expenses that you paid over the period. Simply divide your account value by $1,000.00 (for example, an $8,600 account value divided by $1,000.00 = 8.6), then multiply the result by the number in the first line for a class of the Fund under the heading entitled "Expenses Paid During Period" to estimate the expenses you paid on your account during this period. A small balance maintenance fee of $12.00 that is charged once a year may apply for certain accounts with a value of less than $2,000. This fee is not included in the table below. If it was, the estimate of expenses you paid during the period would be higher, and your ending account value lower, by this amount. In addition, the Fund, as a shareholder in the underlying Fidelity Central Funds, will indirectly bear its pro-rata share of the fees and expenses incurred by the underlying Fidelity Central Funds. These fees and expenses are not included in the Fund's annualized expense ratio used to calculate the expense estimate in the table below.
Hypothetical Example for Comparison Purposes
The second line of the accompanying table for each class of the Fund provides information about hypothetical account values and hypothetical expenses based on a Class' actual expense ratio and an assumed rate of return of 5% per year before expenses, which is not the Class' actual return. The hypothetical account values and expenses may not be used to estimate the actual ending account balance or expenses you paid for the period. You may use this information to compare the ongoing costs of investing in the Fund and other funds. To do so, compare this 5% hypothetical example with the 5% hypothetical examples that appear in the shareholder reports of the other funds. A small balance maintenance fee of $12.00 that is charged once a year may apply for certain accounts with a value of less than $2,000. This fee is not included in the table below. If it was, the estimate of expenses you paid during the period would be higher, and your ending account value lower, by this amount. In addition, the Fund, as a shareholder in the underlying Fidelity Central Funds, will indirectly bear its pro-rata share of the fees and expenses incurred by the underlying Fidelity Central Funds. These fees and expenses are not included in the Fund's annualized expense ratio used to calculate the expense estimate in the table below.
Please note that the expenses shown in the table are meant to highlight your ongoing costs only and do not reflect any transaction costs. Therefore, the second line of the table is useful in comparing ongoing costs only, and will not help you determine the relative total costs of owning different funds. In addition, if these transactional costs were included, your costs would have been higher.
| Annualized
Expense Ratio | Beginning
Account Value
May 1, 2010 | Ending
Account Value
October 31, 2010 | Expenses Paid
During Period*
May 1, 2010 to
October 31, 2010 |
Japan | .88% | | | |
Actual | | $ 1,000.00 | $ 950.50 | $ 4.33 |
HypotheticalA | | $ 1,000.00 | $ 1,020.77 | $ 4.48 |
Class F | .68% | | | |
Actual | | $ 1,000.00 | $ 952.40 | $ 3.35 |
HypotheticalA | | $ 1,000.00 | $ 1,021.78 | $ 3.47 |
A 5% return per year before expenses
* Expenses are equal to each Class' annualized expense ratio, multiplied by the average account value over the period, multiplied by 184/365 (to reflect the one-half year period).
Annual Report
Fidelity Japan Fund
Investment Changes (Unaudited)
Geographic Diversification (% of fund's net assets) |
As of October 31, 2010 |
| Japan | 94.5% | |
| United States of America | 5.5% | |

Percentages are adjusted for the effect of futures contracts, if applicable. |
As of April 30, 2010 |
| Japan | 92.7% | |
| United States of America | 7.3% | |

Percentages are adjusted for the effect of futures contracts, if applicable. |
Asset Allocation |
| % of fund's
net assets | % of fund's net assets
6 months ago |
Stocks | 94.5 | 92.7 |
Short-Term Investments and Net Other Assets | 5.5 | 7.3 |
Top Ten Stocks as of October 31, 2010 |
| % of fund's
net assets | % of fund's net assets
6 months ago |
Mitsubishi UFJ Financial Group, Inc. (Commercial Banks) | 3.7 | 3.8 |
Sumitomo Mitsui Financial Group, Inc. (Commercial Banks) | 3.6 | 4.0 |
ORIX Corp. (Consumer Finance) | 3.5 | 2.5 |
Canon, Inc. (Office Electronics) | 3.3 | 3.4 |
Sumitomo Trust & Banking Co. Ltd. (Commercial Banks) | 3.1 | 2.5 |
Honda Motor Co. Ltd. (Automobiles) | 2.7 | 2.8 |
Denso Corp. (Auto Components) | 2.6 | 1.8 |
The Sumitomo Warehouse Co. Ltd. (Transportation Infrastructure) | 2.2 | 1.6 |
Mitsubishi Estate Co. Ltd. (Real Estate Management & Development) | 2.2 | 2.3 |
Mitsui & Co. Ltd. (Trading Companies & Distributors) | 2.1 | 1.9 |
| 29.0 | |
Market Sectors as of October 31, 2010 |
| % of fund's
net assets | % of fund's net assets
6 months ago |
Financials | 32.4 | 31.1 |
Consumer Discretionary | 18.9 | 17.7 |
Industrials | 18.1 | 14.9 |
Information Technology | 11.6 | 13.3 |
Materials | 6.7 | 6.8 |
Consumer Staples | 3.9 | 2.3 |
Telecommunication Services | 2.0 | 5.5 |
Health Care | 0.9 | 1.1 |
Annual Report
Fidelity Japan Fund
Investments October 31, 2010
Showing Percentage of Net Assets
Common Stocks - 94.5% |
| Shares | | Value |
CONSUMER DISCRETIONARY - 18.9% |
Auto Components - 6.8% |
Denso Corp. | 571,000 | | $ 17,757,013 |
NOK Corp. | 444,700 | | 7,941,269 |
Stanley Electric Co. Ltd. | 713,500 | | 11,978,855 |
Toyoda Gosei Co. Ltd. | 420,600 | | 9,063,258 |
| | 46,740,395 |
Automobiles - 3.6% |
Honda Motor Co. Ltd. | 505,600 | | 18,226,266 |
Toyota Motor Corp. | 181,900 | | 6,442,946 |
| | 24,669,212 |
Household Durables - 1.6% |
Sekisui House Ltd. | 1,131,000 | | 10,629,570 |
Leisure Equipment & Products - 1.9% |
Nikon Corp. | 361,900 | | 6,834,764 |
Sega Sammy Holdings, Inc. | 393,300 | | 6,422,222 |
| | 13,256,986 |
Media - 1.2% |
Fuji Media Holdings, Inc. | 6,020 | | 7,974,798 |
Multiline Retail - 1.6% |
Isetan Mitsukoshi Holdings Ltd. | 418,540 | | 4,618,087 |
Ryohin Keikaku Co. Ltd. | 52,100 | | 1,849,106 |
Takashimaya Co. Ltd. | 611,000 | | 4,599,403 |
| | 11,066,596 |
Specialty Retail - 2.2% |
Nishimatsuya Chain Co. Ltd. | 544,600 | | 5,244,998 |
Shimachu Co. Ltd. | 136,300 | | 2,799,850 |
Xebio Co. Ltd. | 129,400 | | 2,540,723 |
Yamada Denki Co. Ltd. | 65,090 | | 4,230,405 |
| | 14,815,976 |
TOTAL CONSUMER DISCRETIONARY | | 129,153,533 |
CONSUMER STAPLES - 3.9% |
Beverages - 1.2% |
Coca-Cola West Co. Ltd. | 92,300 | | 1,411,971 |
Kirin Holdings Co. Ltd. | 524,000 | | 7,180,735 |
| | 8,592,706 |
Food & Staples Retailing - 1.7% |
FamilyMart Co. Ltd. | 162,000 | | 5,749,621 |
Lawson, Inc. | 128,600 | | 5,849,086 |
| | 11,598,707 |
Personal Products - 1.0% |
Kao Corp. | 171,800 | | 4,366,634 |
Kose Corp. | 92,000 | | 2,205,393 |
| | 6,572,027 |
TOTAL CONSUMER STAPLES | | 26,763,440 |
|
| Shares | | Value |
FINANCIALS - 32.4% |
Capital Markets - 1.1% |
Matsui Securities Co. Ltd. | 762,300 | | $ 4,311,562 |
Nomura Holdings, Inc. | 654,500 | | 3,363,335 |
| | 7,674,897 |
Commercial Banks - 13.8% |
Chiba Bank Ltd. | 1,415,000 | | 8,735,989 |
Mitsubishi UFJ Financial Group, Inc. | 5,428,400 | | 25,193,229 |
Mizuho Financial Group, Inc. | 5,627,500 | | 8,161,669 |
Seven Bank Ltd. | 3,403 | | 6,127,683 |
Sumitomo Mitsui Financial Group, Inc. | 836,600 | | 24,970,624 |
Sumitomo Trust & Banking Co. Ltd. | 3,891,000 | | 21,244,095 |
| | 94,433,289 |
Consumer Finance - 5.0% |
Credit Saison Co. Ltd. | 718,000 | | 10,183,897 |
ORIX Corp. | 264,690 | | 24,143,464 |
| | 34,327,361 |
Insurance - 5.9% |
MS&AD Insurance Group Holdings, Inc. | 248,900 | | 5,962,872 |
NKSJ Holdings, Inc. | 1,971,000 | | 13,544,960 |
Sony Financial Holdings, Inc. | 2,047 | | 7,122,654 |
T&D Holdings, Inc. | 661,000 | | 13,497,219 |
| | 40,127,705 |
Real Estate Investment Trusts - 3.0% |
Japan Prime Realty Investment Corp. | 1,808 | | 4,491,353 |
Japan Real Estate Investment Corp. | 873 | | 8,407,791 |
Nomura Real Estate Office Fund, Inc. | 1,283 | | 7,884,224 |
| | 20,783,368 |
Real Estate Management & Development - 3.6% |
Mitsubishi Estate Co. Ltd. | 829,000 | | 14,522,786 |
Mitsui Fudosan Co. Ltd. | 513,000 | | 9,700,967 |
| | 24,223,753 |
TOTAL FINANCIALS | | 221,570,373 |
HEALTH CARE - 0.9% |
Health Care Providers & Services - 0.9% |
Alfresa Holdings Corp. | 145,100 | | 6,103,684 |
INDUSTRIALS - 18.1% |
Air Freight & Logistics - 0.7% |
Yamato Holdings Co. Ltd. | 381,300 | | 4,807,002 |
Building Products - 0.8% |
Daikin Industries Ltd. | 145,300 | | 5,055,161 |
Construction & Engineering - 0.3% |
Kandenko Co. Ltd. | 365,000 | | 2,127,314 |
Electrical Equipment - 2.4% |
Mitsubishi Electric Corp. | 984,000 | | 9,222,202 |
Sumitomo Electric Industries Ltd. | 585,600 | | 7,451,617 |
| | 16,673,819 |
Common Stocks - continued |
| Shares | | Value |
INDUSTRIALS - continued |
Machinery - 2.8% |
Fanuc Ltd. | 53,100 | | $ 7,687,269 |
Kubota Corp. | 686,000 | | 6,083,491 |
NSK Ltd. | 700,000 | | 5,292,312 |
| | 19,063,072 |
Marine - 0.5% |
Iino Kaiun Kaisha Ltd. | 313,500 | | 1,402,510 |
Mitsui OSK Lines Ltd. | 337,000 | | 2,155,233 |
| | 3,557,743 |
Road & Rail - 1.9% |
East Japan Railway Co. | 207,300 | | 12,801,508 |
Trading Companies & Distributors - 6.5% |
Itochu Corp. | 1,207,800 | | 10,585,501 |
Mitsubishi Corp. | 535,700 | | 12,867,342 |
Mitsui & Co. Ltd. | 906,700 | | 14,260,042 |
Sumitomo Corp. | 499,200 | | 6,320,275 |
| | 44,033,160 |
Transportation Infrastructure - 2.2% |
The Sumitomo Warehouse Co. Ltd. | 2,943,000 | | 15,287,361 |
TOTAL INDUSTRIALS | | 123,406,140 |
INFORMATION TECHNOLOGY - 11.6% |
Computers & Peripherals - 0.9% |
Fujitsu Ltd. | 913,000 | | 6,227,988 |
Electronic Equipment & Components - 4.6% |
Ibiden Co. Ltd. | 312,700 | | 7,701,894 |
Nippon Electric Glass Co. Ltd. | 357,000 | | 4,588,812 |
Yamatake Corp. | 525,700 | | 12,797,891 |
Yaskawa Electric Corp. | 787,000 | | 6,151,646 |
| | 31,240,243 |
Office Electronics - 4.0% |
Canon, Inc. | 489,300 | | 22,524,082 |
Konica Minolta Holdings, Inc. | 531,000 | | 5,131,023 |
| | 27,655,105 |
Semiconductors & Semiconductor Equipment - 1.5% |
ROHM Co. Ltd. | 75,800 | | 4,728,669 |
Tokyo Electron Ltd. | 92,700 | | 5,230,445 |
| | 9,959,114 |
Software - 0.6% |
Nintendo Co. Ltd. | 16,100 | | 4,171,554 |
TOTAL INFORMATION TECHNOLOGY | | 79,254,004 |
|
| Shares | | Value |
MATERIALS - 6.7% |
Chemicals - 5.5% |
JSR Corp. | 608,200 | | $ 10,528,428 |
Mitsubishi Chemical Holdings Corp. | 632,000 | | 3,250,741 |
Nissan Chemical Industries Co. Ltd. | 533,800 | | 6,129,366 |
Nitto Denko Corp. | 148,100 | | 5,539,716 |
Shin-Etsu Chemical Co., Ltd. | 155,000 | | 7,837,731 |
Tokai Carbon Co. Ltd. | 766,000 | | 4,516,573 |
| | 37,802,555 |
Containers & Packaging - 0.1% |
Toyo Seikan Kaisha Ltd. | 38,600 | | 658,661 |
Metals & Mining - 1.1% |
Nippon Steel Corp. | 524,000 | | 1,646,997 |
Sumitomo Metal Industries Ltd. | 2,522,000 | | 5,853,519 |
| | 7,500,516 |
TOTAL MATERIALS | | 45,961,732 |
TELECOMMUNICATION SERVICES - 2.0% |
Wireless Telecommunication Services - 2.0% |
NTT DoCoMo, Inc. | 8,265 | | 13,932,109 |
TOTAL COMMON STOCKS (Cost $752,409,896) | 646,145,015 |
Money Market Funds - 2.0% |
| | | |
Fidelity Cash Central Fund, 0.23% (b)
(Cost $13,390,434) | 13,390,434 | | 13,390,434 |
TOTAL INVESTMENT PORTFOLIO - 96.5% (Cost $765,800,330) | | 659,535,449 |
NET OTHER ASSETS (LIABILITIES) - 3.5% | | 24,061,859 |
NET ASSETS - 100% | $ 683,597,308 |
Legend |
(a) Non-income producing |
(b) Affiliated fund that is available only to investment companies and other accounts managed by Fidelity Investments. The rate quoted is the annualized seven-day yield of the fund at period end. A complete unaudited listing of the fund's holdings as of its most recent quarter end is available upon request. In addition, each Fidelity Central Fund's financial statements, which are not covered by the Fund's report of Independent Registered Public Accounting Firm, are available on the SEC's website or upon request. |
Affiliated Central Funds |
Information regarding fiscal year to date income earned by the Fund from investments in Fidelity Central Funds is as follows: |
Fund | Income earned |
Fidelity Cash Central Fund | $ 117,234 |
Fidelity Securities Lending Cash Central Fund | 20,227 |
Total | $ 137,461 |
Other Information |
The following is a summary of the inputs used, as of October 31, 2010, involving the Fund's assets and liabilities carried at fair value. The inputs or methodology used for valuing securities may not be an indication of the risk associated with investing in those securities. For more information on valuation inputs, and their aggregation into the levels used in the table below, please refer to the Security Valuation section in the accompanying Notes to Financial Statements. |
Valuation Inputs at Reporting Date: |
Description | Total | Level 1 | Level 2 | Level 3 |
Investments in Securities: | | | | |
Equities: | | | | |
Consumer Discretionary | $ 129,153,533 | $ 60,045,484 | $ 69,108,049 | $ - |
Consumer Staples | 26,763,440 | 15,216,071 | 11,547,369 | - |
Financials | 221,570,373 | 71,722,129 | 149,848,244 | - |
Health Care | 6,103,684 | 6,103,684 | - | - |
Industrials | 123,406,140 | 18,817,185 | 104,588,955 | - |
Information Technology | 79,254,004 | 35,551,654 | 43,702,350 | - |
Materials | 45,961,732 | 16,068,144 | 29,893,588 | - |
Telecommunication Services | 13,932,109 | - | 13,932,109 | - |
Money Market Funds | 13,390,434 | 13,390,434 | - | - |
Total Investments in Securities: | $ 659,535,449 | $ 236,914,785 | $ 422,620,664 | $ - |
Income Tax Information |
At October 31, 2010, the Fund had a capital loss carryforward of approximately $415,906,874 of which $151,185,501, $237,833,510 and $26,887,863 will expire on October 31, 2016, 2017 and 2018, respectively. Capital loss carryforwards are only available to offset future capital gains of the Fund to the extent provided by regulations and may be limited. |
See accompanying notes which are an integral part of the financial statements.
Annual Report
Fidelity Japan Fund
Financial Statements
Statement of Assets and Liabilities
| October 31, 2010 |
Assets | | |
Investment in securities, at value - See accompanying schedule: Unaffiliated issuers (cost $752,409,896) | $ 646,145,015 | |
Fidelity Central Funds (cost $13,390,434) | 13,390,434 | |
Total Investments (cost $765,800,330) | | $ 659,535,449 |
Receivable for investments sold | | 18,050,540 |
Receivable for fund shares sold | | 180,832 |
Dividends receivable | | 6,802,286 |
Distributions receivable from Fidelity Central Funds | | 2,255 |
Other receivables | | 23 |
Total assets | | 684,571,385 |
| | |
Liabilities | | |
Payable for investments purchased | $ 51,037 | |
Payable for fund shares redeemed | 319,944 | |
Accrued management fee | 333,392 | |
Transfer agent fee payable | 144,298 | |
Other affiliated payables | 30,310 | |
Other payables and accrued expenses | 95,096 | |
Total liabilities | | 974,077 |
| | |
Net Assets | | $ 683,597,308 |
Net Assets consist of: | | |
Paid in capital | | $ 1,220,369,826 |
Undistributed net investment income | | 9,735,869 |
Accumulated undistributed net realized gain (loss) on investments and foreign currency transactions | | (440,538,383) |
Net unrealized appreciation (depreciation) on investments and assets and liabilities in foreign currencies | | (105,970,004) |
Net Assets | | $ 683,597,308 |
Japan:
Net Asset Value, offering price and redemption price per share ($649,315,663 ÷ 61,440,930 shares) | | $ 10.57 |
| | |
Class F:
Net Asset Value, offering price and redemption price per share ($34,281,645 ÷ 3,235,101 shares) | | $ 10.60 |
Statement of Operations
| Year ended October 31, 2010 |
| | |
Investment Income | | |
Dividends | | $ 20,417,362 |
Income from Fidelity Central Funds | | 137,461 |
Income before foreign taxes withheld | | 20,554,823 |
Less foreign taxes withheld | | (1,429,215) |
Total income | | 19,125,608 |
| | |
Expenses | | |
Management fee
Basic fee | $ 7,147,725 | |
Performance adjustment | (919,668) | |
Transfer agent fees | 2,272,841 | |
Accounting and security lending fees | 471,081 | |
Custodian fees and expenses | 156,426 | |
Independent trustees' compensation | 5,908 | |
Registration fees | 23,820 | |
Audit | 65,356 | |
Legal | 5,260 | |
Miscellaneous | 14,669 | |
Total expenses before reductions | 9,243,418 | |
Expense reductions | (28) | 9,243,390 |
Net investment income (loss) | | 9,882,218 |
Realized and Unrealized Gain (Loss) Net realized gain (loss) on: | | |
Investment securities: | | |
Unaffiliated issuers | (10,754,900) | |
Foreign currency transactions | 550,668 | |
Total net realized gain (loss) | | (10,204,232) |
Change in net unrealized appreciation (depreciation) on: Investment securities | 55,315,671 | |
Assets and liabilities in foreign currencies | 251,854 | |
Total change in net unrealized appreciation (depreciation) | | 55,567,525 |
Net gain (loss) | | 45,363,293 |
Net increase (decrease) in net assets resulting from operations | | $ 55,245,511 |
See accompanying notes which are an integral part of the financial statements.
Annual Report
Statement of Changes in Net Assets
| Year ended
October 31,
2010 | Year ended
October 31,
2009 |
Increase (Decrease) in Net Assets | | |
Operations | | |
Net investment income (loss) | $ 9,882,218 | $ 8,504,736 |
Net realized gain (loss) | (10,204,232) | (243,143,523) |
Change in net unrealized appreciation (depreciation) | 55,567,525 | 346,812,316 |
Net increase (decrease) in net assets resulting from operations | 55,245,511 | 112,173,529 |
Distributions to shareholders from net investment income | (6,665,780) | (12,255,123) |
Distributions to shareholders from net realized gain | (9,507,465) | (1,114,103) |
Total distributions | (16,173,245) | (13,369,226) |
Share transactions - net increase (decrease) | (305,864,432) | (173,975,850) |
Redemption fees | 107,736 | 118,891 |
Total increase (decrease) in net assets | (266,684,430) | (75,052,656) |
| | |
Net Assets | | |
Beginning of period | 950,281,738 | 1,025,334,394 |
End of period (including undistributed net investment income of $9,735,869 and undistributed net investment income of $6,519,430, respectively) | $ 683,597,308 | $ 950,281,738 |
Financial Highlights - Japan
Years ended October 31, | 2010 | 2009 | 2008 | 2007 | 2006 |
Selected Per-Share Data | | | | | |
Net asset value, beginning of period | $ 10.03 | $ 9.03 | $ 18.00 | $ 16.85 | $ 15.00 |
Income from Investment Operations | | | | | |
Net investment income (loss) B | .10 | .08 | .10 | .04 | .01 |
Net realized and unrealized gain (loss) | .61 | 1.04 | (6.64) | 1.35 | 1.85 |
Total from investment operations | .71 | 1.12 | (6.54) | 1.39 | 1.86 |
Distributions from net investment income | (.07) | (.11) | (.04) | (.01) | (.02) |
Distributions from net realized gain | (.10) | (.01) | (2.39) | (.23) | (.01) |
Total distributions | (.17) | (.12) | (2.43) | (.24) | (.03) |
Redemption fees added to paid in capital B | - F | - F | - F | - F | .02 |
Net asset value, end of period | $ 10.57 | $ 10.03 | $ 9.03 | $ 18.00 | $ 16.85 |
Total Return A | 7.12% | 12.84% | (41.88)% | 8.36% | 12.54% |
Ratios to Average Net Assets C, E | | | | | |
Expenses before reductions | .93% | .90% | 1.12% | 1.08% | 1.08% |
Expenses net of fee waivers, if any | .93% | .90% | 1.12% | 1.08% | 1.08% |
Expenses net of all reductions | .93% | .89% | 1.10% | 1.06% | 1.05% |
Net investment income (loss) | .97% | .90% | .72% | .24% | .08% |
Supplemental Data | | | | | |
Net assets, end of period (000 omitted) | $ 649,316 | $ 944,902 | $ 1,025,334 | $ 1,779,451 | $ 1,763,387 |
Portfolio turnover rate D | 43% | 73% | 78% | 158% | 78% |
A Total returns would have been lower had certain expenses not been reduced during the periods shown.
B Calculated based on average shares outstanding during the period.
C Fees and expenses of the underlying Fidelity Central Funds are not included in the Fund's expense ratio. The Fund indirectly bears its proportionate share of the expenses of any underlying Fidelity Central Funds.
D Amount does not include the portfolio activity of any underlying Fidelity Central Funds.
E Expense ratios reflect operating expenses of the class. Expenses before reductions do not reflect amounts reimbursed by the investment adviser or reductions from brokerage service arrangements or reductions from other expense offset arrangements and do not represent the amount paid by the class during periods when reimbursements or reductions occur. Expenses net of fee waivers reflect expenses after reimbursement by the investment adviser but prior to reductions from brokerage service arrangements or other expense offset arrangements. Expenses net of all reductions represent the net expenses paid by the class.
F Amount represents less than $.01 per share.
See accompanying notes which are an integral part of the financial statements.
Annual Report
Financial Highlights - Class F
Years ended October 31, | 2010 | 2009 G |
Selected Per-Share Data | | |
Net asset value, beginning of period | $ 10.04 | $ 10.06 |
Income from Investment Operations | | |
Net investment income (loss) D | .12 | - I |
Net realized and unrealized gain (loss) | .62 | (.02) |
Total from investment operations | .74 | (.02) |
Distributions from net investment income | (.08) | - |
Distributions from net realized gain | (.10) | - |
Total distributions | (.18) | - |
Redemption fees added to paid in capital D, I | - | - |
Net asset value, end of period | $ 10.60 | $ 10.04 |
Total Return B, C | 7.42% | (.20)% |
Ratios to Average Net Assets E, H | | |
Expenses before reductions | .69% | .69% A |
Expenses net of fee waivers, if any | .69% | .69% A |
Expenses net of all reductions | .69% | .68% A |
Net investment income (loss) | 1.21% | .07% A |
Supplemental Data | | |
Net assets, end of period (000 omitted) | $ 34,282 | $ 5,380 |
Portfolio turnover rate F | 43% | 73% |
A Annualized
B Total returns for periods of less than one year are not annualized.
C Total returns would have been lower had certain expenses not been reduced during the periods shown.
D Calculated based on average shares outstanding during the period.
E Fees and expenses of the underlying Fidelity Central Funds are not included in the Fund's expense ratio. The Fund indirectly bears its proportionate share of the expenses of any underlying Fidelity Central Funds.
F Amount does not include the portfolio activity of any underlying Fidelity Central Funds.
G For the period June 26, 2009 (commencement of sale of shares) to October 31, 2009.
H Expense ratios reflect operating expenses of the class. Expenses before reductions do not reflect amounts reimbursed by the investment adviser or reductions from brokerage service arrangements or reductions from other expense offset arrangements and do not represent the amount paid by the class during periods when reimbursements or reductions occur. Expenses net of fee waivers reflect expenses after reimbursement by the investment adviser but prior to reductions from brokerage service arrangements or other expense offset arrangements. Expenses net of all reductions represent the net expenses paid by the class.
I Amount represents less than $.01 per share.
See accompanying notes which are an integral part of the financial statements.
Annual Report
Notes to Financial Statements
For the period ended October 31, 2010
1. Organization.
Fidelity Japan Fund (the Fund) is a fund of Fidelity Investment Trust (the Trust) and is authorized to issue an unlimited number of shares. The Trust is registered under the Investment Company Act of 1940, as amended (the 1940 Act), as an open-end management investment company organized as a Massachusetts business trust. The Fund offers Japan and Class F shares, each of which has equal rights as to assets and voting privileges. Each class has exclusive voting rights with respect to matters that affect that class. Class F shares of the Fund are only available for purchase by mutual funds for which Fidelity Management & Research Company (FMR) or an affiliate serves as investment manager. Investment income, realized and unrealized capital gains and losses, the common expenses of the Fund, and certain fund-level expense reductions, if any, are allocated on a pro-rata basis to each class based on the relative net assets of each class to the total net assets of the Fund. Each class differs with respect to transfer agent fees incurred. Certain expense reductions also differ by class. Subsequent to period end, all Class F shares were redeemed and the Fund no longer offers Class F shares to investors.
2. Investments in Fidelity Central Funds.
The Fund may invest in Fidelity Central Funds, which are open-end investment companies available only to other investment companies and accounts managed by Fidelity Management & Research Company (FMR) and its affiliates. The Fund's Schedule of Investments lists each of the Fidelity Central Funds held as of period end, if any, as an investment of the Fund, but does not include the underlying holdings of each Fidelity Central Fund. As an Investing Fund, the Fund indirectly bears its proportionate share of the expenses of the underlying Fidelity Central Funds.
The Money Market Central Funds seek preservation of capital and current income and are managed by Fidelity Investments Money Management, Inc. (FIMM), an affiliate of FMR.
A complete unaudited list of holdings for each Fidelity Central Fund is available upon request or at the Securities and Exchange Commission (the SEC) web site at www.sec.gov. In addition, the financial statements of the Fidelity Central Funds, which are not covered by the Fund's Report of Independent Registered Public Accounting Firm, are available on the SEC web site or upon request.
3. Significant Accounting Policies.
The financial statements have been prepared in conformity with accounting principles generally accepted in the United States of America (GAAP), which require management to make certain estimates and assumptions at the date of the financial statements. Actual results could differ from those estimates. The following summarizes the significant accounting policies of the Fund:
Security Valuation. Investments are valued as of 4:00 p.m. Eastern time on the last calendar day of the period. The Fund uses independent pricing services approved by the Board of Trustees to value its investments. When current market prices or quotations are not readily available or reliable, valuations may be determined in good faith in accordance with procedures adopted by the Board of Trustees. Factors used in determining value may include market or security specific events. The frequency with which these procedures are used cannot be predicted and they may be utilized to a significant extent. The value used for net asset value (NAV) calculation under these procedures may differ from published prices for the same securities.
The Fund categorizes the inputs to valuation techniques used to value its investments into a disclosure hierarchy consisting of three levels as shown below.
Level 1 - quoted prices in active markets for identical investments
Level 2 - other significant observable inputs (including quoted prices for similar investments, interest rates, prepayment speeds, etc.)
Level 3 - unobservable inputs (including the fund's own assumptions based on the best information available)
Changes in valuation techniques may result in transfers in or out of an assigned level within the disclosure hierarchy. The aggregate value of investments by input level, as of October 31, 2010, is included at the end of the Fund's Schedule of Investments. Valuation techniques used to value the Fund's investments by major category are as follows.
Equity securities, including restricted securities, for which market quotations are readily available, are valued at the last reported sale price or official closing price as reported by an independent pricing service on the primary market or exchange on which they are traded and are categorized as Level 1 in the hierarchy. In the event there were no sales during the day or closing prices are not available, securities are valued at the last quoted bid price or may be valued using the last available price and are generally categorized as Level 2 in the hierarchy. For foreign equity securities, when significant market or security specific events arise, comparisons to the valuation of American Depositary Receipts (ADRs), futures contracts, Exchange-traded funds (ETFs) and certain indexes as well as quoted prices for similar securities are used and are categorized as Level 2 in the hierarchy in these circumstances. Utilizing these techniques may result in significant transfers between Level 1 and Level 2. For restricted equity securities and private placements where observable inputs are limited, assumptions about market activity and risk are used and are categorized as Level 3 in the hierarchy.
Annual Report
3. Significant Accounting Policies - continued
Security Valuation - continued
Investments in open-end mutual funds, including the Fidelity Central Funds, are valued at their closing net asset value each business day and are categorized as Level 1 in the hierarchy. Short-term securities with remaining maturities of sixty days or less for which quotations are not readily available are valued at amortized cost, which approximates fair value and are categorized as Level 2 in the hierarchy.
Foreign Currency. The Fund uses foreign currency contracts to facilitate transactions in foreign-denominated securities. Gains and losses from these transactions may arise from changes in the value of the foreign currency or if the counterparties do not perform under the contracts' terms.
Foreign-denominated assets, including investment securities, and liabilities are translated into U.S. dollars at the exchange rate at period end. Purchases and sales of investment securities, income and dividends received and expenses denominated in foreign currencies are translated into U.S. dollars at the exchange rate in effect on the transaction date.
The effects of exchange rate fluctuations on investments are included with the net realized and unrealized gain (loss) on investment securities. Other foreign currency transactions resulting in realized and unrealized gain (loss) are disclosed separately.
Investment Transactions and Income. For financial reporting purposes, the Fund's investment holdings and NAV include trades executed through the end of the last business day of the period. The NAV per share for processing shareholder transactions is calculated as of the close of business of the New York Stock Exchange (NYSE), normally 4:00 p.m. Eastern time and includes trades executed through the end of the prior business day. Gains and losses on securities sold are determined on the basis of identified cost. Dividend income is recorded on the ex-dividend date, except for certain dividends from foreign securities where the ex-dividend date may have passed, which are recorded as soon as the Fund is informed of the ex-dividend date. Non-cash dividends included in dividend income, if any, are recorded at the fair market value of the securities received. Distributions received on securities that represent a return of capital or capital gain are recorded as a reduction of cost of investments and/or as a realized gain. The Fund estimates the components of distributions received that may be considered return of capital distributions or capital gain distributions. Interest income and distributions from the Fidelity Central Funds are accrued as earned. Interest income includes coupon interest and amortization of premium and accretion of discount on debt securities. Investment income is recorded net of foreign taxes withheld where recovery of such taxes is uncertain.
Expenses. Most expenses of the Trust can be directly attributed to a fund. Expenses which cannot be directly attributed are apportioned amongst each fund in the Trust. Expense estimates are accrued in the period to which they relate and adjustments are made when actual amounts are known.
Income Tax Information and Distributions to Shareholders. Each year the Fund intends to qualify as a regulated investment company, including distributing substantially all of its taxable income and realized gains under Subchapter M of the Internal Revenue Code and filing its U.S. federal tax return. As a result, no provision for income taxes is required. As of October 31, 2010, the Fund did not have any unrecognized tax benefits in the accompanying financial statements. A fund's federal tax return is subject to examination by the Internal Revenue Service (IRS) for a period of three years. Foreign taxes are provided for based on the Fund's understanding of the tax rules and rates that exist in the foreign markets in which it invests.
Distributions are declared and recorded on the ex-dividend date. Income dividends and capital gain distributions are declared separately for each class. Income and capital gain distributions are determined in accordance with income tax regulations, which may differ from GAAP.
Capital accounts within the financial statements are adjusted for permanent book-tax differences. These adjustments have no impact on net assets or the results of operations. Temporary book-tax differences will reverse in a subsequent period.
Book-tax differences are primarily due to the short-term gain distributions from the Fidelity Central Funds, foreign currency transactions, passive foreign investment companies (PFIC), deferred trustees compensation, capital loss carryforwards and losses deferred due to wash sales.
The federal tax cost of investment securities and unrealized appreciation (depreciation) as of period end were as follows:
Gross unrealized appreciation | $ 29,099,097 |
Gross unrealized depreciation | (170,403,023) |
Net unrealized appreciation (depreciation) | $ (141,303,926) |
| |
Tax Cost | $ 800,839,375 |
The tax-based components of distributable earnings as of period end were as follows:
Undistributed ordinary income | $ 20,143,517 |
Capital loss carryforward | $ (415,906,874) |
Net unrealized appreciation (depreciation) | $ (141,009,049) |
Annual Report
Notes to Financial Statements - continued
3. Significant Accounting Policies - continued
Income Tax Information and Distributions to Shareholders - continued
The tax character of distributions paid was as follows:
| October 31, 2010 | October 31, 2009 |
Ordinary Income | $ 16,173,245 | $ 13,369,226 |
Short-Term Trading (Redemption) Fees. Shares held by investors in the Fund less than 90 days are subject to a redemption fee equal to 1.50% of the net asset value of shares redeemed. All redemption fees, which reduce the proceeds of the shareholder redemption, are retained by the Fund and accounted for as an addition to paid in capital.
4. Purchases and Sales of Investments.
Purchases and sales of securities, other than short-term securities, aggregated $399,130,044 and $697,219,555, respectively.
5. Fees and Other Transactions with Affiliates.
Management Fee. FMR and its affiliates provide the Fund with investment management related services for which the Fund pays a monthly management fee. The management fee is the sum of an individual fund fee rate that is based on an annual rate of .45% of the Fund's average net assets and a group fee rate that averaged .26% during the period. The group fee rate is based upon the average net assets of all the mutual funds advised by FMR. The group fee rate decreases as assets under management increase and increases as assets under management decrease. In addition, the management fee is subject to a performance adjustment (up to a maximum of ± .20% of the Fund's average net assets over a 36 month performance period). The upward or downward adjustment to the management fee is based on the relative investment performance of Japan as compared to an appropriate benchmark index. For the period, the total annual management fee rate, including the performance adjustment, was .62% of the Fund's average net assets.
Transfer Agent Fees. Fidelity Investments Institutional Operations Company, Inc. (FIIOC), an affiliate of FMR, is the transfer, dividend disbursing and shareholder servicing agent for each class of the Fund. FIIOC receives account fees and asset-based fees that vary according to the account size and type of account of the shareholders of Japan. FIIOC receives no fees for providing transfer agency services to Class F. FIIOC pays for typesetting, printing and mailing of shareholder reports, except proxy statements. For the period, transfer agent fees for each applicable class were as follows:
| Amount | % of
Average
Net Assets |
Japan | $ 2,272,841 | .24 |
Accounting and Security Lending Fees. Fidelity Service Company, Inc. (FSC), an affiliate of FMR, maintains the Fund's accounting records. The accounting fee is based on the level of average net assets for the month. Under a separate contract, FSC administers the security lending program. The security lending fee is based on the number and duration of lending transactions.
6. Committed Line of Credit.
The Fund participates with other funds managed by FMR or an affiliate in a $3.75 billion credit facility (the "line of credit") to be utilized for temporary or emergency purposes to fund shareholder redemptions or for other short-term liquidity purposes. The Fund has agreed to pay commitment fees on its pro-rata portion of the line of credit, which amounted to $4,048 and is reflected in Miscellaneous expenses on the Statement of Operations. During the period, there were no borrowings on this line of credit.
7. Security Lending.
The Fund lends portfolio securities through a lending agent from time to time in order to earn additional income. The lending agent may loan securities to certain qualified borrowers, including Fidelity Capital Markets (FCM), a broker-dealer affiliated with the Fund. On the settlement date of the loan, the Fund receives collateral (in the form of U.S. Treasury obligations, letters of credit and/or cash) against the loaned securities and maintains collateral in an amount not less than 100% of the market value of the loaned securities during the period of the loan. The market value of the loaned securities is determined at the close of business of the Fund and any additional required collateral is delivered to the Fund on the next business day. If the borrower defaults on its obligation to return the securities loaned because of insolvency or other reasons, a fund could experience delays and costs in
Annual Report
7. Security Lending - continued
recovering the securities loaned or in gaining access to the collateral. Any cash collateral received is invested in the Fidelity Securities Lending Cash Central Fund. At period end, there were no security loans outstanding. Security lending income represents the income earned on investing cash collateral, less rebates paid to borrowers and lending agent fees associated with the loan, plus any premium payments received for lending certain types of securities. Security lending income is presented in the Statement of Operations as a component of income from Fidelity Central Funds. Total security lending income during the period amounted to $20,227. During the period, there were no securities loaned to FCM.
8. Expense Reductions.
Through arrangements with the Fund's custodian, credits realized as a result of uninvested cash balances were used to reduce the Fund's expenses. During the period, these credits reduced the Fund's custody expenses by $28.
9. Distributions to Shareholders.
Distributions to shareholders of each class were as follows:
Years ended October 31, | 2010 | 2009 |
From net investment income | | |
Japan | $ 6,581,344 | $ 12,255,123 |
Class F | 84,436 | - |
Total | $ 6,665,780 | $ 12,255,123 |
From net realized gain | | |
Japan | $ 9,401,920 | $ 1,114,103 |
Class F | 105,545 | - |
Total | $ 9,507,465 | $ 1,114,103 |
10. Share Transactions.
Transactions for each class of shares were as follows:
| Shares | Dollars |
Years ended October 31, | 2010 | 2009 A | 2010 | 2009 A |
Japan | | | | |
Shares sold | 20,810,343 | 14,149,369 | $ 217,088,312 | $ 138,053,275 |
Reinvestment of distributions | 1,440,939 | 1,672,325 | 14,827,260 | 12,626,051 |
Shares redeemed | (55,048,520) | (35,103,846) | (565,865,726) | (330,281,121) |
Net increase (decrease) | (32,797,238) | (19,282,152) | $ (333,950,154) | $ (179,601,795) |
Class F | | | | |
Shares sold | 8,109,487 | 547,276 | $ 83,695,320 | $ 5,744,073 |
Reinvestment of distributions | 18,463 | - | 189,982 | - |
Shares redeemed | (5,428,702) | (11,423) | (55,799,580) | (118,128) |
Net increase (decrease) | 2,699,248 | 535,853 | $ 28,085,722 | $ 5,625,945 |
A Share transactions for Class F are for the period June 26, 2009 (commencement of sale of shares) to October 31, 2009.
11. Other.
The Fund's organizational documents provide former and current trustees and officers with a limited indemnification against liabilities arising in connection with the performance of their duties to the Fund. In the normal course of business, the Fund may also enter into contracts that provide general indemnifications. The Fund's maximum exposure under these arrangements is unknown as this would be dependent on future claims that may be made against the Fund. The risk of material loss from such claims is considered remote.
At the end of the period, the Fidelity Freedom Funds and Fidelity Freedom K Funds were the owners of record, in aggregate, of approximately 29% of the total outstanding shares of the Fund.
12. Proposed Reorganization.
The Board of Trustees of the Fund has approved an Agreement and Plan of Reorganization between the Fund and Fidelity Advisor Japan Fund. The agreement provides for the transfer of all the assets and the assumption of all the liabilities of Fidelity Advisor Japan Fund in exchange solely for the
Annual Report
Notes to Financial Statements - continued
12. Proposed Reorganization - continued
number of equivalent shares of the Fund having the same aggregate net asset value as the outstanding shares of the corresponding classes of the Fidelity Advisor Japan Fund on the day the reorganization is effective.
The reorganization was approved by the Fidelity Advisor Japan Fund shareholders and is expected to become effective on or about December 17, 2010. The reorganization is expected to qualify as a tax-free transaction with no gain or loss recognized by the Funds or their shareholders. In addition, the Board of Trustees of the Fund approved the creation of additional classes of shares. The Fund commenced operations of Class A, T, B, C and Institutional Class on December 14, 2010.
Annual Report
Report of Independent Registered Public Accounting Firm
To the Trustees of Fidelity Investment Trust and the Shareholders of Fidelity Japan Fund:
In our opinion, the accompanying statement of assets and liabilities, including the schedule of investments, and the related statements of operations and of changes in net assets and the financial highlights present fairly, in all material respects, the financial position of Fidelity Japan Fund (a fund of Fidelity Investment Trust) at October 31, 2010, the results of its operations for the year then ended, the changes in its net assets for each of the two years in the period then ended and the financial highlights for each of the periods indicated, in conformity with accounting principles generally accepted in the United States of America. These financial statements and financial highlights (hereafter referred to as "financial statements") are the responsibility of the Fidelity Japan Fund's management. Our responsibility is to express an opinion on these financial statements based on our audits. We conducted our audits of these financial statements in accordance with the standards of the Public Company Accounting Oversight Board (United States). Those standards require that we plan and perform the audit to obtain reasonable assurance about whether the financial statements are free of material misstatement. An audit includes examining, on a test basis, evidence supporting the amounts and disclosures in the financial statements, assessing the accounting principles used and significant estimates made by management, and evaluating the overall financial statement presentation. We believe that our audits, which included confirmation of securities at October 31, 2010 by correspondence with the custodian and brokers, provide a reasonable basis for our opinion.
/s/ PricewaterhouseCoopers LLP
PricewaterhouseCoopers LLP
Boston, Massachusetts
December 17, 2010
Annual Report
The Trustees, Member of the Advisory Board, and executive officers of the trust and fund, as applicable, are listed below. The Board of Trustees governs the fund and is responsible for protecting the interests of shareholders. The Trustees are experienced executives who meet periodically throughout the year to oversee the fund's activities, review contractual arrangements with companies that provide services to the fund, oversee management of the risks associated with such activities and contractual arrangements, and review the fund's performance. Except for James C. Curvey, each of the Trustees oversees 221 funds advised by FMR or an affiliate. Mr. Curvey oversees 410 funds advised by FMR or an affiliate.
The Trustees hold office without limit in time except that (a) any Trustee may resign; (b) any Trustee may be removed by written instrument, signed by at least two-thirds of the number of Trustees prior to such removal; (c) any Trustee who requests to be retired or who has become incapacitated by illness or injury may be retired by written instrument signed by a majority of the other Trustees; and (d) any Trustee may be removed at any special meeting of shareholders by a two-thirds vote of the outstanding voting securities of the trust. Each Trustee who is not an interested person (as defined in the 1940 Act) (Independent Trustee), shall retire not later than the last day of the calendar year in which his or her 72nd birthday occurs. The Independent Trustees may waive this mandatory retirement age policy with respect to individual Trustees. The executive officers and Advisory Board Member hold office without limit in time, except that any officer and Advisory Board Member may resign or may be removed by a vote of a majority of the Trustees at any regular meeting or any special meeting of the Trustees. Except as indicated, each individual has held the office shown or other offices in the same company for the past five years.
Experience, Skills, Attributes, and Qualifications of the Fund's Trustees. The Governance and Nominating Committee has adopted a statement of policy that describes the experience, qualifications, attributes, and skills that are necessary and desirable for potential Independent Trustee candidates (Statement of Policy). The Board believes that each Trustee satisfied at the time he or she was initially elected or appointed a Trustee, and continues to satisfy, the standards contemplated by the Statement of Policy. The Governance and Nominating Committee also engages professional search firms to help identify potential Independent Trustee candidates who have the experience, qualifications, attributes, and skills consistent with the Statement of Policy. From time to time, additional criteria based on the composition and skills of the current Independent Trustees, as well as experience or skills that may be appropriate in light of future changes to board composition, business conditions, and regulatory or other developments, have also been considered by the professional search firms and the Governance and Nominating Committee. In addition, the Board takes into account the Trustees' commitment and participation in Board and committee meetings, as well as their leadership of standing and ad hoc committees throughout their tenure.
In determining that a particular Trustee was and continues to be qualified to serve as a Trustee, the Board has considered a variety of criteria, none of which, in isolation, was controlling. The Board believes that, collectively, the Trustees have balanced and diverse experience, qualifications, attributes, and skills, which allow the Board to operate effectively in governing the fund and protecting the interests of shareholders. Information about the specific experience, skills, attributes, and qualifications of each Trustee, which in each case led to the Board's conclusion that the Trustee should serve (or continue to serve) as a trustee of the fund, is provided below.
Board Structure and Oversight Function. Edward C. Johnson 3d is an interested person (as defined in the 1940 Act) and currently serves as Chairman. The Trustees have determined that an interested Chairman is appropriate and benefits shareholders because an interested Chairman has a personal and professional stake in the quality and continuity of services provided to the fund. Independent Trustees exercise their informed business judgment to appoint an individual of their choosing to serve as Chairman, regardless of whether the Trustee happens to be independent or a member of management. The Independent Trustees have determined that they can act independently and effectively without having an Independent Trustee serve as Chairman and that a key structural component for assuring that they are in a position to do so is for the Independent Trustees to constitute a substantial majority for the Board. The Independent Trustees also regularly meet in executive session. Ned C. Lautenbach serves as Chairman of the Independent Trustees and as such (i) acts as a liaison between the Independent Trustees and management with respect to matters important to the Independent Trustees and (ii) with management prepares agendas for Board meetings.
Fidelity funds are overseen by different Boards of Trustees. The fund's Board oversees Fidelity's equity and high income funds and another Board oversees Fidelity's investment-grade bond, money market, and asset allocation funds. The asset allocation funds may invest in Fidelity funds overseen by the fund's Board. The use of separate Boards, each with its own committee structure, allows the Trustees of each group of Fidelity funds to focus on the unique issues of the funds they oversee, including common research, investment, and operational issues. On occasion, the separate Boards establish joint committees to address issues of overlapping consequences for the Fidelity funds overseen by each Board.
The Trustees operate using a system of committees to facilitate the timely and efficient consideration of all matters of importance to the Trustees, the fund, and fund shareholders and to facilitate compliance with legal and regulatory requirements and oversight of the fund's activities and associated risks. The Board, acting through its committees, has charged FMR and its affiliates with (i) identifying events or circumstances the occurrence of which could have demonstrably adverse effects on the fund's business and/or reputation; (ii) implementing processes and controls to lessen the possibility that such events or circumstances occur or to mitigate the effects of such events or circumstances if they do occur; and (iii) creating and maintaining a system designed to evaluate continuously business and market conditions in order to facilitate the identification and implementation processes described in (i) and (ii) above. Because the day-to-day operations and activities of the fund are carried out by or through FMR, its affiliates and other service providers, the fund's exposure to risks is mitigated but not eliminated by the processes overseen by the Trustees. While each of the Board's committees has responsibility for overseeing different aspects of the fund's activities, oversight is exercised primarily through the Operations, Audit, and Compliance Committees. Appropriate personnel, including but not limited to the fund's Chief Compliance Officer (CCO), FMR's internal auditor, the independent accountants, the fund's Treasurer and portfolio management personnel, make periodic reports to the Board's committees, as appropriate. The responsibilities of each committee, including their oversight responsibilities, are described further under "Standing Committees of the Fund's Trustees."
Annual Report
Trustees and Officers - continued
The fund's Statement of Additional Information (SAI) includes more information about the Trustees. To request a free copy, call Fidelity at 1-800-835-5092.
Interested Trustees*:
Correspondence intended for each Trustee who is an interested person may be sent to Fidelity Investments, 82 Devonshire Street, Boston, Massachusetts 02109.
Name, Age; Principal Occupations and Other Relevant Experience+ |
Edward C. Johnson 3d (80) |
| Year of Election or Appointment: 1984 Mr. Johnson is Trustee and Chairman of the Board of Trustees of certain Trusts. Mr. Johnson serves as Chief Executive Officer, Chairman, and a Director of FMR LLC; Chairman and a Director of FMR; Chairman and a Director of Fidelity Research & Analysis Company (FRAC); Chairman and a Director of Fidelity Investments Money Management, Inc.; and Chairman and a Director of FMR Co., Inc. In addition, Mr. Johnson serves as Chairman and Director of FIL Limited. Previously, Mr. Johnson served as President of FMR LLC (2006-2007). |
James C. Curvey (75) |
| Year of Election or Appointment: 2007 Mr. Curvey also serves as Trustee (2007-present) of other investment companies advised by FMR. Mr. Curvey is a Director of Fidelity Investments Money Management, Inc. (2009-present), Director of Fidelity Research & Analysis Co. (2009-present) and Director of FMR and FMR Co., Inc. (2007-present). Mr. Curvey is also Vice Chairman (2007-present) and Director of FMR LLC. In addition, Mr. Curvey serves as an Overseer for the Boston Symphony Orchestra and a member of the Trustees of Villanova University. Previously, Mr. Curvey was the Vice Chairman (2006-2007) and Director (2000-2007) of FMR Corp. |
* Trustees have been determined to be "Interested Trustees" by virtue of, among other things, their affiliation with the trust or various entities under common control with FMR.
+ The information above includes each Trustee's principal occupation during the last five years and other information relating to the experience, attributes, and skills relevant to each Trustee's qualifications to serve as a Trustee, which led to the conclusion that each Trustee should serve as a Trustee for the fund.
Independent Trustees:
Correspondence intended for each Independent Trustee (that is, the Trustees other than the Interested Trustees) may be sent to Fidelity Investments, P.O. Box 55235, Boston, Massachusetts 02205-5235.
Name, Age; Principal Occupations and Other Relevant Experience+ |
Dennis J. Dirks (62) |
| Year of Election or Appointment: 2005 Prior to his retirement in May 2003, Mr. Dirks was Chief Operating Officer and a member of the Board of The Depository Trust & Clearing Corporation (DTCC). He also served as President, Chief Operating Officer, and Board member of The Depository Trust Company (DTC) and President and Board member of the National Securities Clearing Corporation (NSCC). In addition, Mr. Dirks served as Chief Executive Officer and Board member of the Government Securities Clearing Corporation, Chief Executive Officer and Board member of the Mortgage-Backed Securities Clearing Corporation, as a Trustee and a member of the Finance Committee of Manhattan College (2005-2008), and as a Trustee and a member of the Finance Committee of AHRC of Nassau County (2006-2008). Mr. Dirks is a member of the Independent Directors Council (IDC) Governing Council (2010-Present) and Board of Directors for The Brookville Center for Children's Services, Inc. (2009-present). |
Alan J. Lacy (57) |
| Year of Election or Appointment: 2008 Mr. Lacy serves as Senior Adviser (2007-present) of Oak Hill Capital Partners, L.P. (private equity). Mr. Lacy also served as Chief Executive Officer (2000-2005) and Vice Chairman (2005-2006) of Sears Holdings Corporation and Sears, Roebuck and Co. (retail). In addition, Mr. Lacy serves as a member of the Board of Directors of The Western Union Company (global money transfer, 2006-present) and Bristol-Myers Squibb Company (global pharmaceuticals, 2007-present). Mr. Lacy is Chairman (2008-present) and a member (2006-present) of the Board of Trustees of The National Parks Conservation Association. |
Ned C. Lautenbach (66) |
| Year of Election or Appointment: 2000 Mr. Lautenbach is Chairman of the Independent Trustees of the Equity and High Income Funds (2006-present). Mr. Lautenbach currently serves as the Lead Director of the Eaton Corporation Board of Directors (diversified industrial, 1997-present). Mr. Lautenbach is also a member of the Board of Directors of the Philharmonic Center for the Arts in Naples, Florida (1999-
present); a member of the Board of Trustees of Fairfield University (2005-present); and a member of the Council on Foreign Relations (1994-present). Previously, Mr. Lautenbach was a Partner/Advisory Partner at Clayton, Dubilier & Rice, Inc. (private equity investment, 1998-2010), as well as a Director of Sony Corporation (2006-2007). |
Joseph Mauriello (66) |
| Year of Election or Appointment: 2008 Prior to his retirement in January 2006, Mr. Mauriello served in numerous senior management positions including Deputy Chairman and Chief Operating Officer (2004-2005), and Vice Chairman of Financial Services (2002-2004) of KPMG LLP US (professional services, 1965-2005). Mr. Mauriello currently serves as a member of the Board of Directors of XL Group plc. (global insurance and re-insurance, 2006-present) and of Arcadia Resources Inc. (health care services and products, 2007-present). Previously, Mr. Mauriello served as a Director of the Hamilton Funds of the Bank of New York (2006-2007). |
Cornelia M. Small (66) |
| Year of Election or Appointment: 2005 Ms. Small is a member of the Board of Directors of the Teagle Foundation (2009-present). Ms. Small is also a member of the Investment Committee, and Chair (2008-present) and a member of the Board of Trustees of Smith College. In addition, Ms. Small serves on the Investment Committee of the Berkshire Taconic Community Foundation (2008-present). Previously, Ms. Small served as Chairperson of the Investment Committee (2002-2008) of Smith College. In addition, Ms. Small served as Chief Investment Officer, Director of Global Equity Investments, and a member of the Board of Directors of Scudder, Stevens & Clark and Scudder Kemper Investments. |
William S. Stavropoulos (71) |
| Year of Election or Appointment: 2001 Mr. Stavropoulos is Vice Chairman of the Independent Trustees of the Equity and High Income Funds (2006-present). Mr. Stavropoulos serves as President and Founder of the Michigan Baseball Foundation, the Great Lakes Loons (2007-present). Mr. Stavropoulos is Chairman Emeritus of the Board of Directors of The Dow Chemical Company, where he previously served in numerous senior management positions, including President, CEO (1995-2000; 2002-2004), Chairman of the Executive Committee (2000-2006), and as a member of the Board of Directors (1990-2006). Currently, Mr. Stavropoulos is Chairman of Univar (global distributor of commodity and specialty chemicals, 2010-present), a Director of Teradata Corporation (data warehousing and technology solutions, 2008-present), Chemical Financial Corporation, Maersk Inc. (industrial conglomerate), Tyco International, Inc. (multinational manufacturing and services, 2007-present), and a member of the Advisory Board for Metalmark Capital (private equity investment, 2005-present). Mr. Stavropoulos is a special advisor to Clayton, Dubilier & Rice, Inc. (private equity investment). In addition, Mr. Stavropoulos is a member of the University of Notre Dame Advisory Council for the College of Science. |
David M. Thomas (61) |
| Year of Election or Appointment: 2008 Previously, Mr. Thomas served as Executive Chairman (2005-2006) and Chairman and Chief Executive Officer (2000-2005) of IMS Health, Inc. (pharmaceutical and healthcare information solutions). In addition, Mr. Thomas serves as a member of the Board of Directors of Fortune Brands, Inc. (consumer products), and Interpublic Group of Companies, Inc. (marketing communication, 2004-present). |
Michael E. Wiley (60) |
| Year of Election or Appointment: 2008 Mr. Wiley also serves as a Director of Asia Pacific Exploration Consolidated (international oil and gas exploration and production, 2008-present). Mr. Wiley serves as a Director of Tesoro Corporation (independent oil refiner and marketer, 2005-present), and a Director of Bill Barrett Corporation (exploration and production, 2005-present). In addition, Mr. Wiley also serves as a Director of Post Oak Bank (privately-held bank, 2004-present). Previously, Mr. Wiley served as a member of the Board of Trustees of the University of Tulsa (2000-2006; 2007-2010), as a Senior Energy Advisor of Katzenbach Partners, LLC (consulting, 2006-2007), as an Advisory Director of Riverstone Holdings (private investment), Chairman, President, and CEO of Baker Hughes, Inc. (oilfield services, 2000-2004), and as Director of Spinnaker Exploration Company (exploration and production, 2001-2005). |
+ The information above includes each Trustee's principal occupation during the last five years and other information relating to the experience, attributes, and skills relevant to each Trustee's qualifications to serve as a Trustee, which led to the conclusion that each Trustee should serve as a Trustee for the fund.
Annual Report
Trustees and Officers - continued
Advisory Board Member and Executive Officers:
Correspondence intended for each executive officer and Peter S. Lynch may be sent to Fidelity Investments, 82 Devonshire Street, Boston, Massachusetts 02109.
Name, Age; Principal Occupation |
Peter S. Lynch (66) |
| Year of Election or Appointment: 2003 Member of the Advisory Board of Fidelity's Equity and High Income Funds. Mr. Lynch is Vice Chairman and a Director of FMR and FMR Co., Inc. In addition, Mr. Lynch serves as a Trustee of Boston College and as the Chairman of the Inner-City Scholarship Fund. Previously, Mr. Lynch served on the Special Olympics International Board of Directors (1997-2006). |
Kenneth B. Robins (41) |
| Year of Election or Appointment: 2008 President and Treasurer of Fidelity's Equity and High Income Funds. Mr. Robins also serves as President and Treasurer (2010-
present) and Assistant Treasurer (2009-present) of other Fidelity funds and is an employee of Fidelity Investments (2004-present). Previously, Mr. Robins served as Deputy Treasurer of the Fidelity funds (2005-2008) and Treasurer and Chief Financial Officer of The North Carolina Capital Management Trust: Cash and Term Portfolios (2006-2008). |
Bruce T. Herring (45) |
| Year of Election or Appointment: 2006 Vice President of certain Equity Funds. Mr. Herring also serves as Chief Investment Officer and Director of Fidelity Management & Research (U.K.) Inc. (2010-present) and Group Chief Investments Officer of FMR. Previously, Mr. Herring served as Vice President (2005-2006) and Senior Vice President (2006-2007) of Fidelity Management & Research Company, Vice President of FMR Co., Inc. (2001-2007) and as a portfolio manager for Fidelity U.S. Equity Funds. |
Brian B. Hogan (46) |
| Year of Election or Appointment: 2009 Vice President of certain Equity Funds and Vice President of Sector Funds. Mr. Hogan also serves as President of FMR's Equity Division (2009-present). Previously, Mr. Hogan served as Senior Vice President, Equity Research of FMR (2006-2009) and as a portfolio manager. |
Scott C. Goebel (42) |
| Year of Election or Appointment: 2008 Secretary and Chief Legal Officer (CLO) of the Fidelity funds. Mr. Goebel also serves as Secretary and CLO of The North Carolina Capital Management Trust: Cash and Term Portfolio (2008-present); General Counsel, Secretary, and Senior Vice President of FMR (2008-present) and FMR Co., Inc. (2008-present); Deputy General Counsel of FMR LLC; Chief Legal Officer of Fidelity Management & Research (Hong Kong) Limited (2008-present) and Assistant Secretary of Fidelity Management & Research (Japan) Inc. (2008-present), Fidelity Investments Money Management, Inc. (2008-present), Fidelity Management & Research (U.K.) Inc. (2008-present), and Fidelity Research and Analysis Company (2008-present). Previously, Mr. Goebel served as Assistant Secretary of the Funds (2007-2008) and as Vice President and Secretary of Fidelity Distributors Corporation (FDC) (2005-2007). |
William C. Coffey (41) |
| Year of Election or Appointment: 2009 Assistant Secretary of Fidelity's Equity and High Income Funds. Mr. Coffey also serves as Senior Vice President and Deputy General Counsel of FMR LLC (2010-present), and is an employee of Fidelity Investments. Previously, Mr. Coffey served as Vice President and Associate General Counsel of FMR LLC (2005-2009). |
Holly C. Laurent (56) |
| Year of Election or Appointment: 2008 Anti-Money Laundering (AML) Officer of the Fidelity funds. Ms. Laurent also serves as AML Officer of The North Carolina Capital Management Trust: Cash and Term Portfolio (2008-present) and is an employee of Fidelity Investments. Previously, Ms. Laurent was Senior Vice President and Head of Legal for Fidelity Business Services India Pvt. Ltd. (2006-2008), and Senior Vice President, Deputy General Counsel and Group Head for FMR LLC (2005-2006). |
Christine Reynolds (52) |
| Year of Election or Appointment: 2008 Chief Financial Officer of the Fidelity funds. Ms. Reynolds became President of Fidelity Pricing and Cash Management Services (FPCMS) in August 2008. Ms. Reynolds served as Chief Operating Officer of FPCMS (2007-2008). Previously, Ms. Reynolds served as President, Treasurer, and Anti-Money Laundering officer of the Fidelity funds (2004-2007). |
Kenneth A. Rathgeber (63) |
| Year of Election or Appointment: 2004 Chief Compliance Officer of Fidelity's Equity and High Income Funds. Mr. Rathgeber is Chief Compliance Officer of Fidelity Management & Research (Hong Kong) Limited (2008-present), Fidelity Management & Research (Japan) Inc. (2008-present), FMR (2005-present), FMR Co., Inc. (2005-present), Fidelity Management & Research (U.K.) Inc. (2005-present), Fidelity Research & Analysis Company (2005-present), Fidelity Investments Money Management, Inc. (2005-present), Pyramis Global Advisors, LLC (2005-present), and Strategic Advisers, Inc. (2005-present). |
Jeffrey S. Christian (49) |
| Year of Election or Appointment: 2009 Deputy Treasurer of the Fidelity funds. Mr. Christian is an employee of Fidelity Investments. Previously, Mr. Christian served as Chief Financial Officer (2008-2009) of certain Fidelity funds and Senior Vice President of Fidelity Pricing and Cash Management Services (FPCMS) (2004-2009). |
Bryan A. Mehrmann (49) |
| Year of Election or Appointment: 2005 Deputy Treasurer of the Fidelity funds. Mr. Mehrmann is an employee of Fidelity Investments. |
Adrien E. Deberghes (43) |
| Year of Election or Appointment: 2008 Deputy Treasurer of Fidelity's Equity and High Income Funds. Mr. Deberghes also serves as Assistant Treasurer of other Fidelity funds (2010-present) and is an employee of Fidelity Investments (2008-present). Previously, Mr. Deberghes served as Senior Vice President of Mutual Fund Administration at State Street Corporation (2007-2008), Senior Director of Mutual Fund Administration at Investors Bank & Trust (2005-2007), and Director of Finance for Dunkin' Brands (2000-2005). |
Stephanie J. Dorsey (41) |
| Year of Election or Appointment: 2010 Assistant Treasurer of Fidelity's Equity and High Income Funds. Ms. Dorsey also serves as Deputy Treasurer of other Fidelity funds (2008-present) and is an employee of Fidelity Investments (2008-present). Previously, Ms. Dorsey served as Treasurer (2004-2008) of the JPMorgan Mutual Funds and Vice President (2004-2008) of JPMorgan Chase Bank. |
John R. Hebble (52) |
| Year of Election or Appointment: 2009 Assistant Treasurer of Fidelity's Equity and High Income Funds. Mr. Hebble also serves as Treasurer and Chief Financial Officer of The North Carolina Capital Management Trust: Cash and Term Portfolio (2008-present), President and Treasurer of other Fidelity funds (2008-present) and is an employee of Fidelity Investments. |
Gary W. Ryan (52) |
| Year of Election or Appointment: 2005 Assistant Treasurer of the Fidelity funds. Mr. Ryan is an employee of Fidelity Investments. Previously, Mr. Ryan served as Vice President of Fund Reporting in Fidelity Pricing and Cash Management Services (FPCMS) (1999-2005). |
Jonathan Davis (42) |
| Year of Election or Appointment: 2010 Assistant Treasurer of the Fidelity funds. Mr. Davis is an employee of Fidelity Investments. Previously, Mr. Davis served as Vice President and Associate General Counsel of FMR LLC (2003-2010). |
Annual Report
The Board of Trustees of Fidelity Japan Fund voted to pay to shareholders of record at the opening of business on record date, the following distributions per share derived from capital gains realized from sales of portfolio securities, and dividends derived from net investment income:
| Pay Date | Record Date | Dividends | Capital Gains |
Class F | 12/13/10 | 12/10/10 | $0.241 | $0.211 |
Class F designates 75% of the dividends distributed during the fiscal year as amounts which may be taken into account as a dividend for the purposes of the maximum rate under section 1(h)(11) of the Internal Revenue Code.
The amounts per share which represent income derived from sources within, and taxes paid to, foreign countries or possessions of the United States are as follows:
| Pay Date | Income | Taxes |
Class F | 12/07/09 | $0.081 | $0.0127 |
The fund will notify shareholders in January 2011 of amounts for use in preparing 2010 income tax returns.
Annual Report
Board Approval of Investment Advisory Contracts and Management Fees
Fidelity Japan Fund
Each year, the Board of Trustees, including the Independent Trustees (together, the Board), votes on the renewal of the management contract and sub-advisory agreements (together, the Advisory Contracts) for the fund. The Board, assisted by the advice of fund counsel and Independent Trustees' counsel, requests and considers a broad range of information relevant to the renewal of the Advisory Contracts throughout the year.
The Board meets regularly and considers at each of its meetings factors that are relevant to its annual consideration of the renewal of the fund's Advisory Contracts, including the services and support provided to the fund and its shareholders. The Board has established various standing committees, each composed of Independent Trustees with varying backgrounds, to which the Board has assigned specific subject matter responsibilities in order to enhance effective decision-making by the Board. The Board, acting directly and through its Committees, requests and receives information concerning the annual consideration of the renewal of the fund's Advisory Contracts. The Board also meets as needed to consider matters specifically related to the Board's annual consideration of the renewal of Advisory Contracts. Members of the Board may also meet with trustees of other Fidelity funds through ad hoc joint committees to discuss certain matters relevant to the Fidelity funds.
At its July 2010 meeting, the Board of Trustees, including the Independent Trustees, unanimously determined to renew the fund's Advisory Contracts. In reaching its determination, the Board considered all factors it believed relevant, including (i) the nature, extent, and quality of the services to be provided to the fund and its shareholders (including the investment performance of the fund); (ii) the competitiveness of the fund's management fee and total expenses; (iii) the total costs of the services to be provided by and the profits to be realized by Fidelity from its relationship with the fund; (iv) the extent to which economies of scale would be realized as the fund grows; and (v) whether fee levels reflect these economies of scale, if any, for the benefit of fund shareholders.
In considering whether to renew the Advisory Contracts for the fund, the Board reached a determination, with the assistance of fund counsel and Independent Trustees' counsel and through the exercise of its business judgment, that the renewal of the Advisory Contracts is in the best interests of fund shareholders and that the compensation to be received by Fidelity under the management contract is fair and reasonable. The Board's decision to renew the Advisory Contracts was not based on any single factor noted above, but rather was based on a comprehensive consideration of all the information provided to the Board at its meetings throughout the year. The Board, in reaching its determination to renew the Advisory Contracts, is aware that shareholders in the fund have a broad range of investment choices available to them, including a wide choice among mutual funds offered by Fidelity's competitors, and that the fund's shareholders, with the opportunity to review and weigh the disclosure provided by the fund in its prospectus and other public disclosures, have chosen to invest in this fund, managed by Fidelity.
Nature, Extent, and Quality of Services Provided. The Board considered the staffing within the investment adviser, FMR, and the sub-advisers (together, the Investment Advisers), including the backgrounds of the fund's investment personnel and the fund's investment objective and discipline. The Independent Trustees also had discussions with senior management of Fidelity's investment operations and investment groups. The Board considered the structure of the portfolio manager compensation program and whether this structure provides appropriate incentives to act in the best interest of the fund.
Resources Dedicated to Investment Management and Support Services. The Board and the equity research subcommittee of the Board's Fund Oversight Committee reviewed the size, education, and experience of the Investment Advisers' investment staff, their use of technology, and the Investment Advisers' approach to recruiting, training, and retaining portfolio managers and other research, advisory, and management personnel. The Board noted that Fidelity's analysts have access to a variety of technological tools and market and securities data that enable them to perform both fundamental and quantitative analysis and to specialize in various disciplines. The Board considered Fidelity's extensive global research capabilities that enable the Investment Advisers to aggregate data from various sources in an effort to produce positive investment results. The Board also considered that Fidelity's portfolio managers and analysts have access to daily portfolio attribution that allows for monitoring of a fund's portfolio, as well as an electronic communication system that provides immediate real-time access to research concerning issuers and credit enhancers. The Board noted FMR's continued focus on strengthening the organization and discipline of equity portfolio management and research.
Shareholder and Administrative Services. The Board considered (i) the nature, extent, quality, and cost of advisory, administrative, and shareholder services performed by the Investment Advisers and their affiliates under the Advisory Contracts and under separate agreements covering transfer agency, pricing and bookkeeping, and securities lending services for the fund; (ii) the nature and extent of the investment adviser's supervision of third party service providers, principally custodians and subcustodians; and (iii) the resources devoted to, and the record of compliance with, the fund's compliance policies and procedures. The Board also reviewed the allocation of fund brokerage, including allocations to brokers affiliated with the Investment Advisers, the use of brokerage commissions to pay fund expenses, and the use of "soft" commission dollars to pay for research services.
The Board noted that the growth of fund assets over time across the complex allows Fidelity to reinvest in the development of services designed to enhance the value or convenience of the Fidelity funds as investment vehicles. These services include 24-hour access to account information and market information through phone representatives and over the Internet, and investor education materials and asset allocation tools.
Investment in a Large Fund Family. The Board considered the benefits to shareholders of investing in a Fidelity fund, including the benefits of investing in a fund that is part of a large family of funds offering a variety of investment disciplines and providing a large variety of mutual fund investor services. The Board noted that Fidelity had taken, or had made recommendations that resulted in the Fidelity funds taking, a number of actions over the previous year that benefited particular funds, including (i) dedicating additional resources to investment research and restructuring and broadening the focus of the investment research teams; (ii) bolstering the senior management team that oversees asset management; (iii) launching Class F of certain funds as a lower-fee class available to Freedom K and Freedom Index Funds; (iv) lowering the initial investment minimums and ongoing balance requirements for Real Estate High Income Fund; (v) eliminating subsequent purchase minimums for all funds and adding a waiver of the investment minimum requirement for new accounts opened with the proceeds of a systematic withdrawal plan; (vi) eliminating the withdrawal minimum and maximum limits for systematic withdrawals from Advisor funds; (vii) expanding sales load waivers on Class A shares for Destiny Planholders and expanding Institutional Class eligibility for Class O Destiny Planholders; and (viii) changing certain Class A and Class T sales charge structures to further align them with industry practices.
Annual Report
Board Approval of Investment Advisory Contracts and Management Fees - continued
Investment Performance. The Board considered whether the fund has operated in accordance with its investment objective, as well as its record of compliance with its investment restrictions. It also reviewed the fund's absolute investment performance for the retail class, as well as the fund's relative investment performance for the retail class measured over multiple periods against (i) a broad-based securities market index, and (ii) a peer group of mutual funds deemed appropriate by Fidelity and reviewed by the Board. The following charts considered by the Board show, over the one-, three-, and five-year periods ended December 31, 2009, the cumulative total returns of the retail class of the fund, the cumulative total returns of a broad-based securities market index ("benchmark"), and a range of cumulative total returns of a peer group of mutual funds identified by Lipper Inc. as having an investment objective similar to that of the fund. (Class F of the fund had less than one year of performance as of December 31, 2009.) The box within each chart shows the 25th percentile return (bottom of box) and the 75th percentile return (top of box) of the peer group. Returns shown above the box are in the first quartile and returns shown below the box are in the fourth quartile. The percentage beaten number noted below each chart corresponds to the percentile box and represents the percentage of funds in the peer group whose performance was equal to or lower than that of the retail class of the fund.
Fidelity Japan Fund
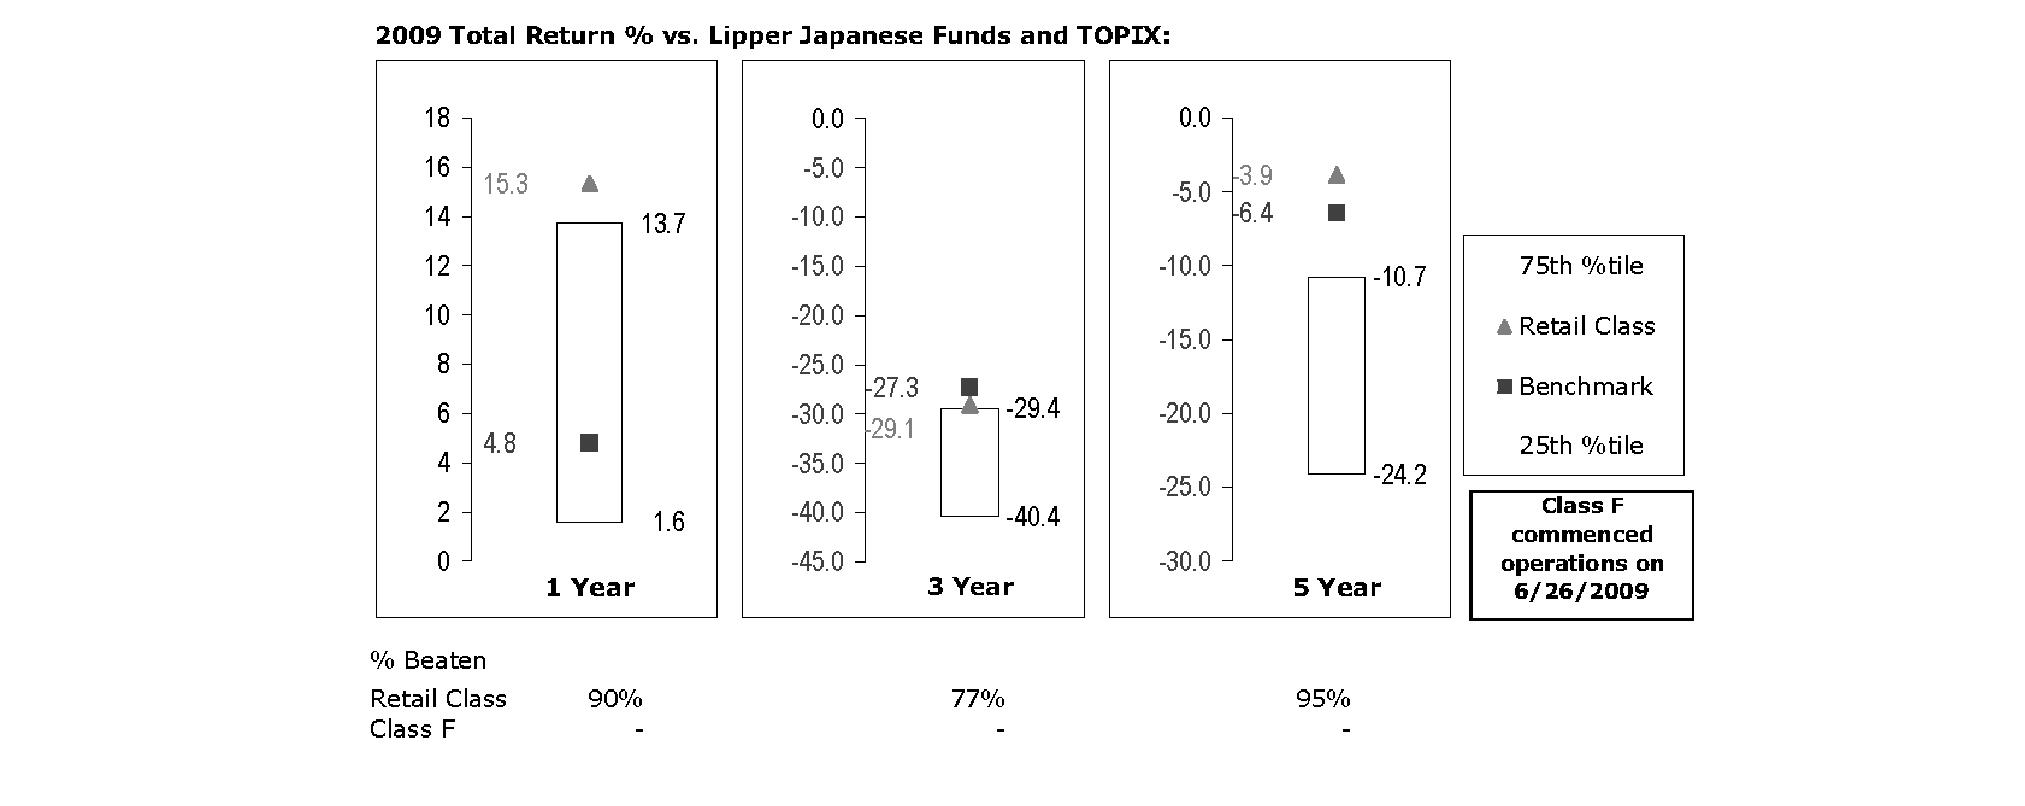
The Board reviewed the fund's relative investment performance against its peer group and noted that the performance of the retail class of the fund was in the first quartile for all the periods shown. The Board also noted that the investment performance of the retail class of the fund compared favorably to its benchmark for the one- and five-year periods, although the fund's three-year cumulative total return was lower than its benchmark. The Board also reviewed the fund's performance since inception as well as performance in the current year.
The Board also considered that the fund's management fee is subject to upward or downward adjustment depending upon whether, and to what extent, the fund's investment performance for the performance period exceeds, or is exceeded by, the record (over the same period) of a Board-approved performance adjustment index. The Board realizes that the performance adjustment provides FMR with a strong economic incentive to seek to achieve superior performance for the fund's shareholders and helps to more closely align the interests of FMR and the fund's shareholders.
Based on its review, and giving particular weight to the nature and quality of the resources dedicated by the Investment Advisers to maintain and improve relative performance and factoring in the unprecedented market events in recent years, the Board concluded that the nature, extent, and quality of investment management and support services and of shareholder and administrative services provided to the fund will benefit the fund's shareholders, particularly in light of the Board's view that the fund's shareholders benefit from investing in a fund that is part of a large family of funds offering a variety of investment disciplines and services.
Competitiveness of Management Fee and Total Fund Expenses. The Board considered the fund's management fee and total expenses compared to "mapped groups" of competitive funds and classes. Fidelity creates "mapped groups" by combining similar Lipper investment objective categories that have comparable management fee characteristics. Combining Lipper investment objective categories aids the Board's management fee and total expense comparisons by broadening the competitive group used for comparison and by reducing the number of universes to which various Fidelity funds are compared.
Annual Report
Management Fee. The Board considered two proprietary management fee comparisons for the 12-month periods shown in the chart below. The group of Lipper funds used by the Board for management fee comparisons is referred to below as the "Total Mapped Group." The Total Mapped Group is broader than the Lipper peer group used by the Board for performance comparisons because the Total Mapped Group combines several Lipper investment objective categories while the Lipper peer group does not. The Total Mapped Group comparison focuses on a fund's standing relative to the total universe of comparable funds available to investors, in terms of gross management fees before expense reimbursements or caps, and without giving effect to the fund's performance adjustment. "TMG %" represents the percentage of funds in the Total Mapped Group that had management fees that were lower than the fund's. For example, a TMG % of 15% means that 85% of the funds in the Total Mapped Group had higher management fees than the fund. The "Asset-Size Peer Group" (ASPG) comparison focuses on a fund's standing relative to non-Fidelity funds similar in size to the fund within the Total Mapped Group. The ASPG represents at least 15% of the funds in the Total Mapped Group with comparable asset size and management fee characteristics, subject to a minimum of 50 funds (or all funds in the Total Mapped Group if fewer than 50). Additional information, such as the ASPG quartile in which the fund's management fee ranked and the impact of the fund's performance adjustment, is also included in the chart and considered by the Board.
Fidelity Japan Fund

The Board noted that the fund's management fee ranked below the median of its Total Mapped Group and below the median of its ASPG for 2009. The Board also noted the effect of the fund's negative performance adjustment on the fund's management fee ranking. The Board noted that the performance adjustment for each year represents calculations for performance periods that differ from the periods shown in the performance charts above.
Based on its review, the Board concluded that the fund's management fee is fair and reasonable in light of the services that the fund receives and the other factors considered.
Total Expenses. In its review of each class's total expenses, the Board considered the fund's management fee as well as other fund or class expenses, as applicable, such as transfer agent fees, pricing and bookkeeping fees, and custodial, legal, and audit fees. The Board also noted the effects of any waivers and reimbursements on fees and expenses, as well as the impact of the fund's performance adjustment. As part of its review, the Board also considered current and historical total expenses of each class of the fund compared to competitive fund median expenses. Each class of the fund is compared to those funds and classes in the Total Mapped Group (used by the Board for management fee comparisons) that have a similar sales load structure.
The Board noted that the total expenses of each class ranked below its competitive median for 2009.
Fees Charged to Other Fidelity Clients. The Board also considered Fidelity fee structures and other information with respect to clients of FMR and its affiliates, such as other mutual funds advised or subadvised by FMR or its affiliates, pension plan clients, and other institutional clients. In March 2010, the Board created an ad hoc joint committee with the board of other Fidelity funds (the Committee) to review and compare Fidelity's institutional investment advisory business with its business of providing services to the Fidelity funds, including the differences in services provided, fees charged, and costs incurred, as well as competition in their respective marketplaces.
Annual Report
Board Approval of Investment Advisory Contracts and Management Fees - continued
Based on its review of total expenses and fees charged to other Fidelity clients, the Board concluded that the total expenses of each class of the fund were reasonable in light of the services that the fund and its shareholders receive and the other factors considered, including the findings of the Committee.
Costs of the Services and Profitability. The Board considered the revenues earned and the expenses incurred by Fidelity in conducting the business of developing, marketing, distributing, managing, administering and servicing the fund and its shareholders. The Board also considered the level of Fidelity's profits in respect of all the Fidelity funds.
On an annual basis, FMR presents to the Board Fidelity's profitability for the fund. Fidelity calculates the profitability for each fund, as well as aggregate profitability for groups of Fidelity funds and all Fidelity funds, using a series of detailed revenue and cost allocation methodologies which originate with the audited books and records of Fidelity. The Audit Committee of the Board reviews any significant changes from the prior year's methodologies.
PricewaterhouseCoopers LLP (PwC), independent registered public accounting firm and auditor to Fidelity and certain Fidelity funds, has been engaged annually by the Board as part of the Board's assessment of Fidelity's profitability analysis. PwC's engagement includes the review and assessment of Fidelity's methodologies used in determining the revenues and expenses attributable to Fidelity's mutual fund business, and completion of agreed-upon procedures surrounding the mathematical accuracy of fund profitability and its conformity to allocation methodologies. After considering PwC's reports issued under the engagement and information provided by Fidelity, the Board believes that while other allocation methods may also be reasonable, Fidelity's profitability methodologies are reasonable in all material respects.
The Board has also reviewed Fidelity's non-fund businesses and fall-out benefits related to the mutual fund business as well as cases where Fidelity's affiliates may benefit from or be related to the fund's business.
The Board considered the costs of the services provided by and the profits realized by Fidelity in connection with the operation of the fund and were satisfied that the profitability was not excessive in the circumstances.
Economies of Scale. The Board considered whether there have been economies of scale in respect of the management of the Fidelity funds, whether the Fidelity funds (including the fund) have appropriately benefited from any such economies of scale, and whether there is potential for realization of any further economies of scale. The Board considered the extent to which the fund will benefit from economies of scale through increased services to the fund, through waivers or reimbursements, or through fee or expense reductions.
In February 2009, the Board and the board of other Fidelity funds created an ad hoc committee (the Economies of Scale Committee) to analyze whether FMR attains economies of scale in respect of the management and servicing of the Fidelity funds, whether the Fidelity funds have appropriately benefited from such economies of scale, and whether there is potential for realization of any further economies of scale.
The Board recognized that the fund's management contract incorporates a "group fee" structure, which provides for lower group fee rates as total fund assets under FMR's management increase, and for higher group fee rates as total fund assets under FMR's management decrease. FMR calculates the group fee rates based on a tiered asset "breakpoint" schedule that varies based on asset class. The Board considered that the group fee is designed to deliver the benefits of economies of scale to fund shareholders when total Fidelity fund assets increase, even if assets of any particular fund are unchanged or have declined, because some portion of Fidelity's costs are attributable to services provided to all Fidelity funds, and all funds benefit if those costs can be allocated among more assets. The Board concluded that, given the group fee structure, fund shareholders will benefit from lower management fees as assets under FMR's management increase at the fund complex level, regardless of whether Fidelity achieves any such economies of scale.
The Board concluded, considering the findings of the Economies of Scale Committee, that any potential economies of scale are being appropriately shared between fund shareholders and Fidelity.
Additional Information Requested by the Board. In order to develop fully the factual basis for consideration of the Fidelity funds' Advisory Contracts, the Board requested and received additional information on certain topics, including (i) fund performance trends, actions to be taken by FMR to improve certain funds' overall performance, and Fidelity's long-term strategies for certain funds; (ii) portfolio manager changes that have occurred during the past year and length of portfolio manager tenure for different categories of funds over time; (iii) Fidelity's compensation structure for portfolio managers, research analysts, and other key personnel, the rationale for the compensation structure, and how the compensation structure provides appropriate performance incentives; (iv) the amount of the investment that each portfolio manager has made in the Fidelity fund(s) that he or she manages; (v) management and other fees paid by FMR to affiliated sub-advisers on behalf of the Fidelity funds; (vi) Fidelity's fee structures and rationale for recommending different fees among different categories of funds; (vii) Fidelity's rationale for recommending which funds should have a performance adjustment component as part of their management fees; (viii) the rationale for any differences between fund fee structures and fee structures in place for other Fidelity clients; and (ix) explanations regarding the relative total expenses borne by certain funds and classes, total expense competitive trends, and actions that might be taken by FMR to reduce total expenses for certain funds and classes.
Based on its evaluation of all of the conclusions noted above, and after considering all factors it believed relevant, the Board ultimately concluded that the advisory fee structures are fair and reasonable, and that the fund's Advisory Contracts should be renewed.
Annual Report
Managing Your Investments
Fidelity offers several ways to conveniently manage your workplace benefits (including your workplace savings plan, investments, and additional services) via your telephone or PC. You can access your plan and account information and research your investments 24 hours a day.
By Phone
Fidelity provides a single toll-free number to access plan information, account balances, positions, and quotes*. It's easy to navigate the service, and on your first call, the system will help you create a personal identification number (PIN) for security.
(phone_graphic)
Fidelity Workplace Investing
1-800-835-5092
By PC
Fidelity's web site on the Internet provides a wide range of information, including plan information, daily financial news, fund performance, interactive planning tools, and news about Fidelity products and services.
(computer_graphic)
Fidelity's Web Site
www.401k.com
* When you call the quotes line, please remember that a fund's yield and return will vary and, except for money market funds, share price will also vary. This means that you may have a gain or loss when you sell your shares. There is no assurance that money market funds will be able to maintain a stable $1 share price; an investment in a money market fund is not insured or guaranteed by the U.S. government. Total returns are historical and include changes in share price, reinvestment of dividends and capital gains, and the effects of any sales charges.
Annual Report
To Write Fidelity
We'll give your correspondence immediate attention and send you written confirmation upon completion of your request.
(letter_graphic)
For Non-Retirement
Accounts
Buying shares
Fidelity Investments
P.O. Box 770001
Cincinnati, OH 45277-0003
Overnight Express
Fidelity Investments
Attn: Distribution Services
100 Crosby Parkway - KC1H
Covington, KY 41015
Selling shares
Fidelity Investments
P.O. Box 770001
Cincinnati, OH 45277-0035
Overnight Express
Fidelity Investments
Attn: Distribution Services
100 Crosby Parkway - KC1H
Covington, KY 41015
General Correspondence
Fidelity Investments
P.O. Box 500
Merrimack, NH 03054-0500
(letter_graphic)
For Retirement
Accounts
Buying shares
Fidelity Investments
P.O. Box 770001
Cincinnati, OH 45277-0003
Selling shares
Fidelity Investments
P.O. Box 770001
Cincinnati, OH 45277-0035
Overnight Express
Fidelity Investments
Attn: Distribution Services
100 Crosby Parkway - KC1H
Covington, KY 41015
General Correspondence
Fidelity Investments
P.O. Box 500
Merrimack, NH 03054-0500
Annual Report
Investment Adviser
Fidelity Management & Research Company
Boston, MA
Investment Sub-Advisers
FMR Co., Inc.
Fidelity Management & Research (U.K.) Inc.
Fidelity Research & Analysis Company
FIL Investments (Japan) Limited
FIL Investment Advisors
FIL Investment Advisors
(U.K.) Limited
Fidelity Management & Research
(Hong Kong) Limited
Fidelity Management & Research
(Japan) Inc.
General Distributor
Fidelity Distributors Corporation
Boston, MA
Transfer and Service Agents
Fidelity Investments Institutional
Operations Company, Inc.
Boston, MA
Fidelity Service Company, Inc.
Boston, MA
Custodians
JPMorgan Chase Bank
New York, NY
JPN-F-ANN-1210
1.891746.101
Fidelity AdvisorSM
Latin America Fund-
Class A, Class T, Class B and Class C
Annual Report
October 31, 2010
Class A, Class T, Class B, and Class C are
classes of Fidelity® Latin America Fund
(2_fidelity_logos) (Registered_Trademark)
Contents
Chairman's Message | <Click Here> | The Chairman's message to shareholders. |
Performance | <Click Here> | How the fund has done over time. |
Management's Discussion of Fund Performance | <Click Here> | The Portfolio Manager's review of fund performance and strategy. |
Shareholder Expense Example | <Click Here> | An example of shareholder expenses. |
Investment Changes | <Click Here> | A summary of major shifts in the fund's investments over the past six months. |
Investments | <Click Here> | A complete list of the fund's investments with their market values. |
Financial Statements | <Click Here> | Statements of assets and liabilities, operations, and changes in net assets, as well as financial highlights. |
Notes | <Click Here> | Notes to the financial statements. |
Report of Independent Registered Public Accounting Firm | <Click Here> | |
Trustees and Officers | <Click Here> | |
Distributions | <Click Here> | |
Board Approval of Investment Advisory Contracts and Management Fees | <Click Here> | |
To view a fund's proxy voting guidelines and proxy voting record for the 12-month period ended June 30, visit http://www.fidelity.com/proxyvotingresults or visit the Securities and Exchange Commission's (SEC) web site at http://www.sec.gov. You may also call 1-800-544-8544 to request a free copy of the proxy voting guidelines.
Standard & Poor's, S&P and S&P 500 are registered service marks of The McGraw-Hill Companies, Inc. and have been licensed for use by Fidelity Distributors Corporation.
Other third party marks appearing herein are the property of their respective owners.
All other marks appearing herein are registered or unregistered trademarks or service marks of FMR LLC or an affiliated company.
This report and the financial statements contained herein are submitted for the general information of the shareholders of the funds. This report is not authorized for distribution to prospective investors in the funds unless preceded or accompanied by an effective prospectus.
A fund files its complete schedule of portfolio holdings with the SEC for the first and third quarters of each fiscal year on Form N-Q. Forms N-Q are available on the SEC's web site at http://www.sec.gov. A fund's Forms N-Q may be reviewed and copied at the SEC's Public Reference Room in Washington, DC. Information regarding the operation of the SEC's Public Reference Room may be obtained by calling 1-800-SEC-0330. For a complete list of a fund's portfolio holdings, view each fund's most recent holdings listing, semiannual report, or annual report on Fidelity's web site at http://www.fidelity.com or http://www.advisor.fidelity.com, as applicable.
NOT FDIC INSURED • MAY LOSE VALUE • NO BANK GUARANTEE
Neither the funds nor Fidelity Distributors Corporation is a bank.
Annual Report
(photo_of_Edward_C_Johnson_3d)
Dear Shareholder:
Equities have staged a rally in the second half of 2010, shaking off concerns about the European debt crisis and the possibility of a double-dip recession in the U.S. Although the short-term surge pushed major equity indexes back into positive territory for the year, several questions remain about the longer-term outlook, including lackluster economic growth and persistently high unemployment. Financial markets are always unpredictable, of course, but there also are several time-tested investment principles that can help put the odds in your favor.
One of the basic tenets is to invest for the long term. Over time, riding out the markets' inevitable ups and downs has proven much more effective than selling into panic or chasing the hottest trend. Even missing only a few of the markets' best days can significantly diminish investor returns. Patience also affords the benefits of compounding - of earning interest on additional income or reinvested dividends and capital gains. There can be tax advantages and cost benefits to consider as well. While staying the course doesn't eliminate risk, it can considerably lessen the effect of short-term declines.
You can further manage your investing risk through diversification. And today, more than ever, geographic diversification should be taken into account. Studies indicate that asset allocation is the single most important determinant of a portfolio's long-term success. The right mix of stocks, bonds and cash - aligned to your particular risk tolerance and investment objective - is very important. Age-appropriate rebalancing is also an essential aspect of asset allocation. For younger investors, an emphasis on equities - which historically have been the best-performing asset class over time - is encouraged. As investors near their specific goal, such as retirement or sending a child to college, consideration may be given to replacing volatile assets (e.g. common stocks) with more-stable fixed investments (bonds or savings plans).
A third principle - investing regularly - can help lower the average cost of your purchases. Investing a certain amount of money each month or quarter helps ensure you won't pay for all your shares at market highs. This strategy - known as dollar cost averaging - also reduces "emotion" from investing, helping shareholders avoid selling weak performers just prior to an upswing, or chasing a hot performer just before a correction.
We invite you to contact us via the Internet, through our Investor Centers or by phone. It is our privilege to provide you the information you need to make the investments that are right for you.
Sincerely,
(The chairman's signature appears here.)
Edward C. Johnson 3d
Annual Report
Average annual total return reflects the change in the value of an investment, assuming reinvestment of the class' distributions from dividend income and capital gains (the profits earned upon the sale of securities that have grown in value, if any) and assuming a constant rate of performance each year. The $10,000 table and the fund's returns do not reflect the deduction of taxes that a shareholder would pay on fund distributions or the redemption of fund shares. During periods of reimbursement by Fidelity, a fund's total return will be greater than it would be had the reimbursement not occurred. How a fund did yesterday is no guarantee of how it will do tomorrow. Returns reflect the conversion of Class B shares to Class A shares after a maximum of seven years.
Average Annual Total Returns
Periods ended October 31, 2010 | Past 1
year | Past 5
years | Past 10
years |
Class A (incl. 5.75% sales charge ) A | 18.63% | 16.36% | 17.19% |
Class T (incl. 3.50% sales charge) B | 21.44% | 16.91% | 17.46% |
Class B (incl. contingent deferred sales charge) C | 20.78% | 17.52% | 17.87% |
Class C (incl. contingent deferred sales charge) D | 24.78% | 17.73% | 17.87% |
A The initial offering of Class A shares took place on September 28, 2010. Returns prior to September 28, 2010 are those of Fidelity Latin America Fund, the original class of the fund, which has no 12b-1 fee. Had Class A's 12b-1 fee been reflected, returns prior to September 28, 2010, would have been lower.
B The initial offering of Class T shares took place on September 28, 2010. Returns prior to September 28, 2010 are those of Fidelity Latin America Fund, the original class of the fund, which has no 12b-1 fee. Had Class T's 12b-1 fee been reflected, returns prior to September 28, 2010, would have been lower.
C The initial offering of Class B shares took place on September 28, 2010. Returns prior to September 28, 2010 are those of Fidelity Latin America Fund, the original class of the fund, which has no 12b-1 fee. Had Class B's 12b-1 fee been reflected, returns prior to September 28, 2010, would have been lower. Class B shares' contingent deferred sales charges included in the past one year, past five years, and past ten years total return figures are 5%, 2%, and 0%, respectively.
D The initial offering of Class C shares took place on September 28, 2010. Returns prior to September 28, 2010 are those of Fidelity Latin America Fund, the original class of the fund, which has no 12b-1 fee. Had Class C's 12b-1 fee been reflected, returns prior to September 28, 2010, would have been lower. Class C shares' contingent deferred sales charges included in the past one year, past five years, and past ten years total return figures are 1%, 0%, and 0%, respectively.
$10,000 Over 10 Years
Let's say hypothetically that $10,000 was invested in FidelitySM Advisor Latin America Fund - Class A on October 31, 2000, and the current 5.75% sales charge was paid. The chart shows how the value of your investment would have changed, and also shows how the MSCI® EM (Emerging Markets) - Latin America Index performed over the same period. The initial offering of Class A took place on September 28, 2010. See above for additional information regarding the performance of Class A.
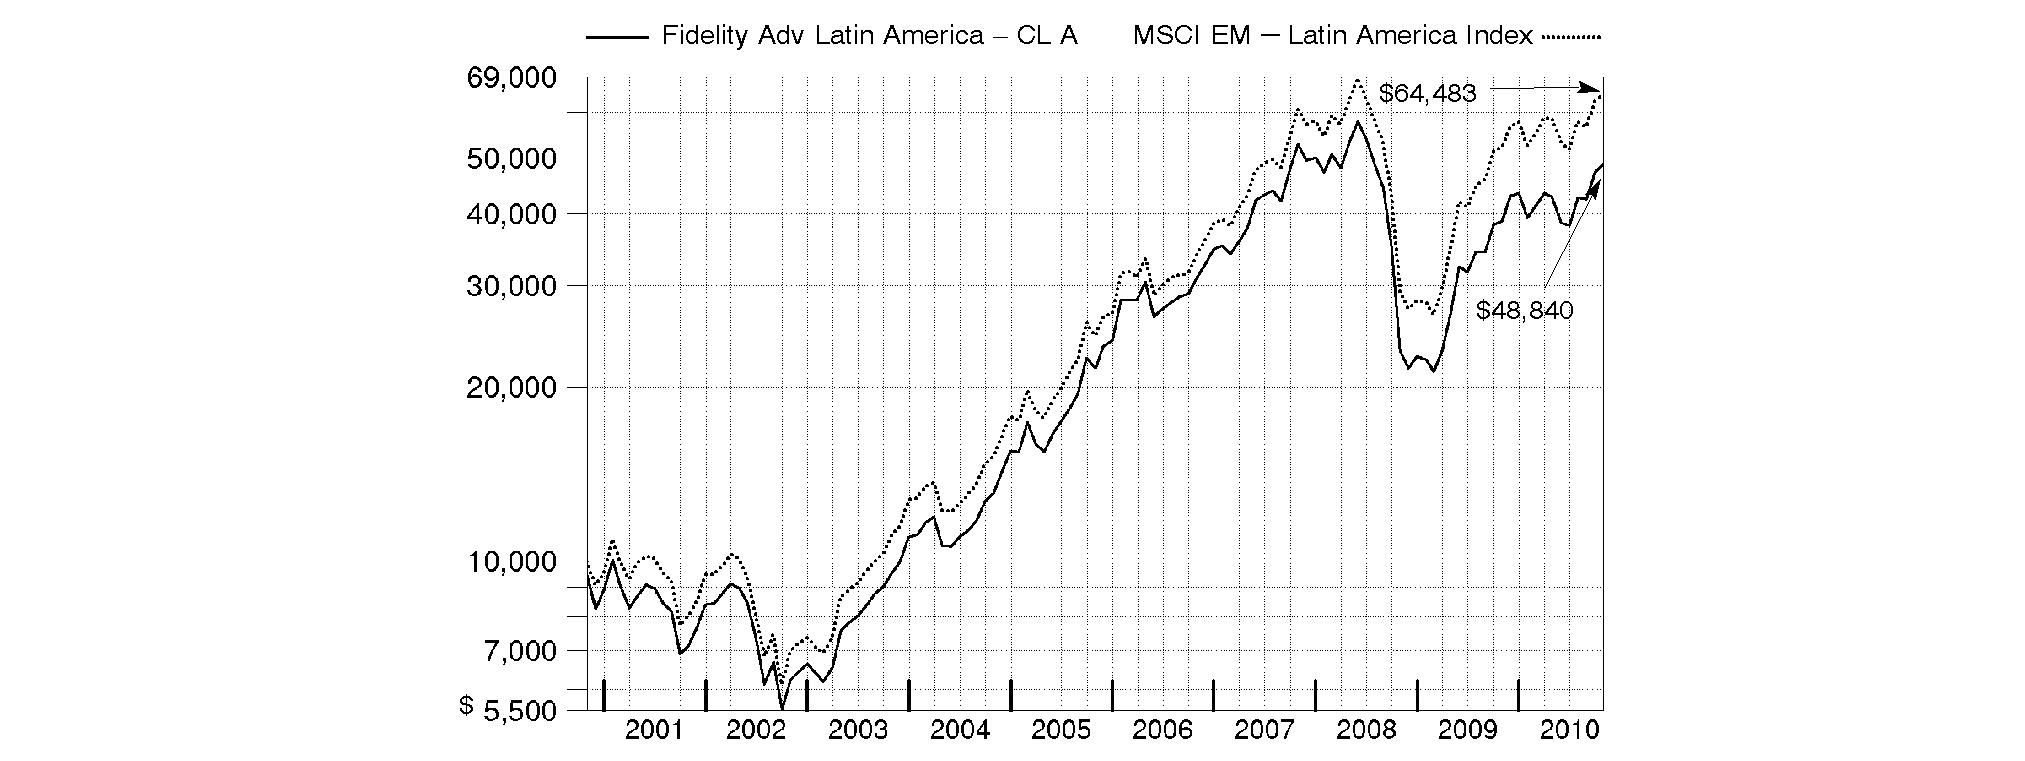
Annual Report
Market Recap: International stocks rode a wave of volatility similar to that of their U.S. counterparts during the 12 months ending October 31, 2010. Stocks gained modestly in the first half of the period, despite growing concerns about the European debt crisis. Sentiment turned decidedly negative in May and June, however, and the market suffered a precipitous decline. These losses were more than offset during the last four months of the period, when signs of economic growth and subsiding debt fears helped propel international stocks about 21%. For the full year, the MSCI® ACWI® (All Country World Index) ex USA Index gained 12.76%, boosted in part by a generally depreciating U.S. dollar. Within the index, Canada and emerging markets were standouts, returning 23% and 24%, respectively. Results in the latter group were led by strong-performing India, Mexico and South Africa, while China fell short of the MSCI benchmark due to cooling economic growth. The developed Asia ex Japan segment rose 16% for the period, lifted by solid results from Singapore and Hong Kong. Meanwhile, Europe rose just 9%, held back mainly by debt-riddled Spain and Italy, as well as lagging major constituent France. Japan returned only 5%, a result of that nation's continued weak economy.
Comments from Adam Kutas, Portfolio Manager of Fidelity AdvisorSM Latin America Fund: For the year, the fund's Class A, Class T, Class B and Class C shares returned 25.87%, 25.85%, 25.78% and 25.78%, respectively (excluding sales charges), outperforming the MSCI EM (Emerging Markets) Latin America Index, which returned 23.75%. Stock selection in materials, consumer staples and health care contributed, as did underweighting the poor-performing energy sector. Conversely, unfavorable stock selection in utilities and underweighting financials hurt. Geographically, the fund benefited from solid picks in Brazil and its positioning in Chile. Underweighting Colombia and weak stock selection in Mexico dampened performance. Overweighting Chilean steel and iron producer CAP and underweighting Brazilian oil giant and major index component Petroleo Brasilerio (Petrobras) boosted performance. Banco Santander Chile also helped, as did four Brazilian companies: airline TAM, dental insurance company and out-of-benchmark holding Odontoprev, and food/beverage/tobacco firms Souza Cruz Industria Comerico and Companhia de Bebidas das Americas. The fund's modest cash position also held back performance amid a strong market. Not owning Mexican copper company and index component Grupo Mexico detracted, as did an investment in Brazilian cable TV company Net Servicos de Comunicacao. Untimely ownership of several firms also curtailed results: Brazilian electric utility Eletrobras, Brazilian brokerage Itausa and Peruvian bank Credicorp. Underweighting Chile's LAN Airlines detracted further. Some stocks I've mentioned were not held at period end.
Note to shareholders: Fidelity Advisor Latin America Fund may invest up to 35% of its total assets in any industry that represents more than 20% of the Latin American market. As of October 31, 2010, the fund did not have more than 25% of its total assets invested in any one industry.
The views expressed above reflect those of the portfolio manager(s) only through the end of the period as stated on the cover of this report and do not necessarily represent the views of Fidelity or any other person in the Fidelity organization. Any such views are subject to change at any time based upon market or other conditions and Fidelity disclaims any responsibility to update such views. These views may not be relied on as investment advice and, because investment decisions for a Fidelity fund are based on numerous factors, may not be relied on as an indication of trading intent on behalf of any Fidelity fund.
Annual Report
Fidelity Latin America Fund
As a shareholder of the Fund, you incur two types of costs: (1) transaction costs, including sales charges (loads) on purchase payments or redemption proceeds, redemption fees, and (2) ongoing costs, including management fees, distribution and/or service (12b-1) fees and other Fund expenses. This Example is intended to help you understand your ongoing costs (in dollars) of investing in the Fund and to compare these costs with the ongoing costs of investing in other mutual funds.
The Example is based on an investment of $1,000 invested at the beginning of the period and held for the entire period (May 1, 2010 to October 31, 2010) for Latin America and for the entire period (September 28, 2010 to October 31, 2010) for Class A,T,B,C and Institutional Class of Latin America.
Actual Expenses
The first line of the accompanying table for each class of the Fund provides information about actual account values and actual expenses. You may use the information in this line, together with the amount you invested, to estimate the expenses that you paid over the period. Simply divide your account value by $1,000.00 (for example, an $8,600 account value divided by $1,000.00 = 8.6), then multiply the result by the number in the first line for a class of the Fund under the heading entitled "Expenses Paid During Period" to estimate the expenses you paid on your account during this period. A small balance maintenance fee of $12.00 that is charged once a year may apply for certain accounts with a value of less than $2,000. This fee is not included in the table below. If it was, the estimate of expenses you paid during the period would be higher, and your ending account value lower, by this amount. In addition, the Fund, as a shareholder in the underlying Fidelity Central Funds, will indirectly bear its pro-rata share of the fees and expenses incurred by the underlying Fidelity Central Funds. These fees and expenses are not included in the Fund's annualized expense ratio used to calculate the expense estimate in the table below.
Hypothetical Example for Comparison Purposes
The second line of the accompanying table for each class of the Fund provides information about hypothetical account values and hypothetical expenses based on a Class' actual expense ratio and an assumed rate of return of 5% per year before expenses, which is not the Class' actual return. The hypothetical account values and expenses may not be used to estimate the actual ending account balance or expenses you paid for the period. You may use this information to compare the ongoing costs of investing in the Fund and other funds. To do so, compare this 5% hypothetical example with the 5% hypothetical examples that appear in the shareholder reports of the other funds. A small balance maintenance fee of $12.00 that is charged once a year may apply for certain accounts with a value of less than $2,000. This fee is not included in the table below. If it was, the estimate of expenses you paid during the period would be higher, and your ending account value lower, by this amount. In addition, the Fund, as a shareholder in the underlying Fidelity Central Funds, will indirectly bear its pro-rata share of the fees and expenses incurred by the underlying Fidelity Central Funds. These fees and expenses are not included in the Fund's annualized expense ratio used to calculate the expense estimate in the table below.
Please note that the expenses shown in the table are meant to highlight your ongoing costs only and do not reflect any transaction costs. Therefore, the second line of the table is useful in comparing ongoing costs only, and will not help you determine the relative total costs of owning different funds. In addition, if these transactional costs were included, your costs would have been higher.
| Annualized
Expense Ratio | Beginning
Account Value | Ending
Account Value
October 31, 2010 | Expenses Paid
During Period |
Class A | 1.37% | | | |
Actual | | $ 1,000.00 | $ 1,051.40 | $ 1.31 B |
Hypothetical A | | $ 1,000.00 | $ 1,018.30 | $ 6.97 C |
Class T | 1.63% | | | |
Actual | | $ 1,000.00 | $ 1,051.20 | $ 1.56 B |
Hypothetical A | | $ 1,000.00 | $ 1,016.99 | $ 8.29 C |
Class B | 2.12% | | | |
Actual | | $ 1,000.00 | $ 1,050.60 | $ 2.02 B |
Hypothetical A | | $ 1,000.00 | $ 1,014.52 | $ 10.76 C |
Class C | 2.09% | | | |
Actual | | $ 1,000.00 | $ 1,050.60 | $ 2.00 B |
Hypothetical A | | $ 1,000.00 | $ 1,014.67 | $ 10.61 C |
Latin America | 1.04% | | | |
Actual | | $ 1,000.00 | $ 1,141.90 | $ 5.61 B |
Hypothetical A | | $ 1,000.00 | $ 1,019.96 | $ 5.30 C |
Institutional Class | 1.08% | | | |
Actual | | $ 1,000.00 | $ 1,051.50 | $ 1.03 B |
Hypothetical A | | $ 1,000.00 | $ 1,019.76 | $ 5.50 C |
A 5% return per year before expenses
B Actual expenses are equal to each Class' annualized expense ratio, multiplied by the average account value over the period, multiplied by 184/365 (to reflect the one-half year period) for Latin America and multiplied by 34/365 (to reflect the period September 28, 2010 to October 31, 2010) for Class A,T,B,C and Institutional Class of Latin America.
C Hypothetical expenses are equal to each Class' annualized expense ratio, multiplied by the average account value over the period, multiplied by 184/365 (to reflect the one-half year period).
Annual Report
Fidelity Latin America Fund
Investment Changes (Unaudited)
Geographic Diversification (% of fund's net assets) |
As of October 31, 2010 |
| Brazil | 59.9% | |
| Mexico | 15.9% | |
| Chile | 11.9% | |
| United States of America | 3.7% | |
| Colombia | 3.3% | |
| Peru | 2.0% | |
| Luxembourg | 1.3% | |
| Bermuda | 1.1% | |
| Bahamas (Nassau) | 0.5% | |
| Other | 0.4% | |

Percentages are adjusted for the effect of futures contracts, if applicable. |
As of April 30, 2010 |
| Brazil | 62.4% | |
| Mexico | 19.3% | |
| Chile | 9.5% | |
| United States of America | 3.9% | |
| Luxembourg | 1.6% | |
| Peru | 1.6% | |
| Panama | 0.9% | |
| Colombia | 0.3% | |
| Bahamas (Nassau) | 0.2% | |
| Other | 0.3% | |

Percentages are adjusted for the effect of futures contracts, if applicable. |
Asset Allocation |
| % of fund's
net assets | % of fund's net assets
6 months ago |
Stocks | 98.2 | 97.6 |
Short-Term Investments and Net Other Assets | 1.8 | 2.4 |
Top Ten Stocks as of October 31, 2010 |
| % of fund's
net assets | % of fund's net assets
6 months ago |
Itau Unibanco Banco Multiplo SA ADR (Brazil, Commercial Banks) | 8.6 | 8.5 |
America Movil SAB de CV Series L sponsored ADR (Mexico, Wireless Telecommunication Services) | 7.6 | 7.8 |
Vale SA (PN-A) sponsored ADR (Brazil, Metals & Mining) | 6.0 | 9.5 |
Petroleo Brasileiro SA - Petrobras (PN) (non-vtg.) (Brazil, Oil, Gas & Consumable Fuels) | 5.6 | 7.5 |
Petroleo Brasileiro SA - Petrobras (ON) sponsored ADR (Brazil, Oil, Gas & Consumable Fuels) | 4.2 | 5.9 |
Companhia de Bebidas das Americas (AmBev) (PN) sponsored ADR (Brazil, Beverages) | 4.1 | 2.6 |
Wal-Mart de Mexico SA de CV Series V (Mexico, Food & Staples Retailing) | 3.7 | 3.3 |
Vale SA sponsored ADR (Brazil, Metals & Mining) | 3.5 | 3.5 |
CAP SA (Chile, Metals & Mining) | 3.3 | 2.7 |
Banco Santander Chile sponsored ADR (Chile, Commercial Banks) | 2.7 | 2.0 |
| 49.3 | |
Market Sectors as of October 31, 2010 |
| % of fund's
net assets | % of fund's net assets
6 months ago |
Financials | 21.2 | 15.5 |
Materials | 19.3 | 22.5 |
Consumer Staples | 16.6 | 13.0 |
Energy | 13.2 | 14.9 |
Telecommunication Services | 11.3 | 12.1 |
Utilities | 6.0 | 7.2 |
Consumer Discretionary | 5.7 | 5.7 |
Industrials | 3.5 | 6.1 |
Health Care | 1.0 | 0.6 |
Information Technology | 0.4 | 0.0 |
Annual Report
Fidelity Latin America Fund
Investments October 31, 2010
Showing Percentage of Net Assets
Common Stocks - 98.2% |
| Shares | | Value |
Bahamas (Nassau) - 0.5% |
Petrominerales Ltd. (d) | 868,800 | | $ 22,258,794 |
Bermuda - 1.1% |
Credicorp Ltd. (NY Shares) | 384,100 | | 48,350,508 |
Brazil - 59.9% |
AES Tiete SA (PN) (non-vtg.) | 6,083,145 | | 83,852,428 |
Banco Bradesco SA: | | | |
(PN) | 3,290,316 | | 67,790,722 |
(PN) sponsored ADR (d) | 5,543,722 | | 115,309,418 |
BR Malls Participacoes SA | 1,736,800 | | 16,590,054 |
Brascan Residential Properties SA | 7,648,900 | | 41,634,619 |
Brasil Foods SA | 1,630,700 | | 23,657,228 |
Brasil Insurance Participacoes e Administracao SA (a) | 7,700 | | 6,110,393 |
Centrais Eletricas Brasileiras SA (Electrobras): | | | |
(PN-B) sponsored ADR (d) | 986,165 | | 16,123,798 |
sponsored ADR | 843,700 | | 11,786,489 |
Companhia de Bebidas das Americas (AmBev): | | | |
(PN) sponsored ADR (d) | 1,320,026 | | 183,800,420 |
sponsored ADR (d) | 70,505 | | 7,984,691 |
Companhia de Concessoes Rodoviarias | 1,974,700 | | 53,395,368 |
Companhia de Saneamento de Minas Gerais | 63,876 | | 979,993 |
CPFL Energia SA sponsored ADR (d) | 420,967 | | 30,238,060 |
Drogasil SA | 441,000 | | 11,154,614 |
Eletropaulo Metropolitana SA (PN-B) | 802,120 | | 14,003,623 |
Gerdau SA | 390,500 | | 3,879,291 |
Gerdau SA sponsored ADR (d) | 682,800 | | 8,903,712 |
Itau Unibanco Banco Multiplo SA | 3,585,931 | | 87,477,155 |
Itau Unibanco Banco Multiplo SA: | | | |
ADR | 11,649,603 | | 286,114,250 |
ADR (a)(e) | 590,300 | | 14,497,768 |
Itausa-Investimentos Itau SA (PN) | 4,987,700 | | 39,550,948 |
Light SA | 695,700 | | 8,759,637 |
Lojas Americanas SA (PN) | 6,847,300 | | 73,616,927 |
Lojas Renner SA | 453,600 | | 17,917,893 |
Multiplan Empreendimentos Imobiliarios SA | 848,000 | | 19,440,395 |
Multiplus SA | 1,836,300 | | 31,195,080 |
Net Servicos de Comunicacao SA (PN) (a) | 5,225,440 | | 70,278,666 |
Odontoprev SA | 3,079,600 | | 45,256,290 |
OGX Petroleo e Gas Participacoes SA (a) | 4,974,700 | | 65,268,813 |
Petroleo Brasileiro SA - Petrobras: | | | |
(ON) | 938,228 | | 15,745,597 |
(ON) sponsored ADR | 5,079,420 | | 173,309,810 |
(PN) (non-vtg.) | 9,078,671 | | 137,951,825 |
(PN) sponsored ADR (non-vtg.) (d) | 3,646,533 | | 113,735,364 |
Souza Cruz Industria Comerico | 2,115,100 | | 108,676,752 |
TAM SA (PN) sponsored ADR (ltd. vtg.) | 2,776,336 | | 68,492,209 |
TIM Participacoes SA | 6,855,400 | | 22,445,672 |
|
| Shares | | Value |
TIM Participacoes SA sponsored ADR (non-vtg.) (d) | 1,621,511 | | $ 52,309,945 |
Usinas Siderurgicas de Minas Gerais SA - Usiminas | 1,195,650 | | 17,430,120 |
Usinas Siderurgicas de Minas Gerais SA - Usiminas (PN-A) (non-vtg.) | 3,663,500 | | 45,718,378 |
Vale SA: | | | |
(PN-A) | 1,813,500 | | 50,902,084 |
(PN-A) sponsored ADR | 7,709,345 | | 221,489,482 |
sponsored ADR | 4,963,500 | | 159,526,890 |
Vivo Participacoes SA: | | | |
(PN) | 806,938 | | 23,242,395 |
sponsored ADR | 1,310,041 | | 37,519,574 |
TOTAL BRAZIL | | 2,705,064,840 |
Canada - 0.3% |
Silver Standard Resources, Inc. (a) | 506,800 | | 12,305,108 |
Chile - 11.9% |
Banco Santander Chile sponsored ADR | 1,323,100 | | 122,571,984 |
CAP SA | 2,940,288 | | 149,674,298 |
Cencosud SA | 6,940,914 | | 54,190,647 |
Compania Cervecerias Unidas SA | 3,869,596 | | 43,114,181 |
Compania Cervecerias Unidas SA sponsored ADR | 241,700 | | 13,595,625 |
Empresa Nacional de Electricidad SA | 7,518,537 | | 13,234,103 |
Empresas La Polar SA | 1,801,860 | | 12,851,907 |
Enersis SA | 45,750,203 | | 20,903,025 |
Enersis SA sponsored ADR | 2,878,372 | | 65,655,665 |
SACI Falabella | 4,206,229 | | 42,135,389 |
TOTAL CHILE | | 537,926,824 |
Colombia - 3.3% |
BanColombia SA sponsored ADR | 1,090,000 | | 73,520,500 |
Bolsa de Valores de Colombia | 385,727,359 | | 9,479,081 |
Ecopetrol SA | 27,756,465 | | 66,550,312 |
Ecopetrol SA ADR | 29,300 | | 1,398,782 |
TOTAL COLOMBIA | | 150,948,675 |
Luxembourg - 1.3% |
Millicom International Cellular SA | 322,113 | | 30,471,890 |
Ternium SA sponsored ADR | 867,307 | | 29,731,284 |
TOTAL LUXEMBOURG | | 60,203,174 |
Mexico - 15.9% |
America Movil SAB de CV: | | | |
Series L | 2,590,600 | | 7,425,387 |
Series L sponsored ADR | 5,867,205 | | 335,956,158 |
Banco Compartamos SA de CV | 1,219,100 | | 8,636,011 |
Bolsa Mexicana de Valores SA de CV (d) | 14,054,300 | | 25,558,445 |
Coca-Cola FEMSA SAB de CV sponsored ADR | 449,000 | | 35,682,030 |
Fomento Economico Mexicano SAB de CV sponsored ADR | 225,258 | | 12,368,917 |
Common Stocks - continued |
| Shares | | Value |
Mexico - continued |
Grupo Bimbo Sab de CV Series A | 659,600 | | $ 5,084,322 |
Grupo Comercial Chedraui de CV (a) | 5,790,100 | | 18,729,160 |
Grupo Modelo SAB de CV Series C | 5,980,200 | | 33,487,764 |
Industrias Penoles SA de CV | 1,201,630 | | 34,040,265 |
Kimberly-Clark de Mexico SA de CV Series A | 5,066,800 | | 31,794,421 |
Wal-Mart de Mexico SA de CV
Series V | 61,686,670 | | 168,719,948 |
TOTAL MEXICO | | 717,482,828 |
Panama - 0.1% |
Copa Holdings SA Class A | 79,300 | | 4,022,889 |
Peru - 2.0% |
Compania de Minas Buenaventura SA sponsored ADR | 1,710,200 | | 90,709,008 |
United States of America - 1.9% |
First Cash Financial Services, Inc. (a) | 664,608 | | 19,320,155 |
Mercadolibre, Inc. (a)(d) | 269,000 | | 17,788,970 |
Southern Copper Corp. | 1,155,100 | | 49,438,280 |
TOTAL UNITED STATES OF AMERICA | | 86,547,405 |
TOTAL COMMON STOCKS (Cost $2,312,779,474) | 4,435,820,053 |
Money Market Funds - 3.5% |
| Shares | | Value |
Fidelity Cash Central Fund, 0.23% (b) | 53,737,385 | | $ 53,737,385 |
Fidelity Securities Lending Cash Central Fund, 0.24% (b)(c) | 102,683,905 | | 102,683,905 |
TOTAL MONEY MARKET FUNDS (Cost $156,421,290) | 156,421,290 |
TOTAL INVESTMENT PORTFOLIO - 101.7% (Cost $2,469,200,764) | | 4,592,241,343 |
NET OTHER ASSETS (LIABILITIES) - (1.7)% | | (74,745,375) |
NET ASSETS - 100% | $ 4,517,495,968 |
Legend |
(a) Non-income producing |
(b) Affiliated fund that is available only to investment companies and other accounts managed by Fidelity Investments. The rate quoted is the annualized seven-day yield of the fund at period end. A complete unaudited listing of the fund's holdings as of its most recent quarter end is available upon request. In addition, each Fidelity Central Fund's financial statements, which are not covered by the Fund's report of Independent Registered Public Accounting Firm, are available on the SEC's website or upon request. |
(c) Investment made with cash collateral received from securities on loan. |
(d) Security or a portion of the security is on loan at period end. |
(e) Security exempt from registration under Rule 144A of the Securities Act of 1933. These securities may be resold in transactions exempt from registration, normally to qualified institutional buyers. At the end of the period, the value of these securities amounted to $14,497,768 or 0.3% of net assets. |
Affiliated Central Funds |
Information regarding fiscal year to date income earned by the Fund from investments in Fidelity Central Funds is as follows: |
Fund | Income earned |
Fidelity Cash Central Fund | $ 84,184 |
Fidelity Securities Lending Cash Central Fund | 586,004 |
Total | $ 670,188 |
Other Information |
The following is a summary of the inputs used, as of October 31, 2010, involving the Fund's assets and liabilities carried at fair value. The inputs or methodology used for valuing securities may not be an indication of the risk associated with investing in those securities. For more information on valuation inputs, and their aggregation into the levels used in the table below, please refer to the Security Valuation section in the accompanying Notes to Financial Statements. |
Valuation Inputs at Reporting Date: |
Description | Total | Level 1 | Level 2 | Level 3 |
Investments in Securities: | | | | |
Equities: | | | | |
Brazil | $ 2,705,064,840 | $ 2,698,954,447 | $ 6,110,393 | $ - |
Mexico | 717,482,828 | 717,482,828 | - | - |
Chile | 537,926,824 | 537,926,824 | - | - |
Colombia | 150,948,675 | 150,948,675 | - | - |
Peru | 90,709,008 | 90,709,008 | - | - |
United States of America | 86,547,405 | 86,547,405 | - | - |
Luxembourg | 60,203,174 | 60,203,174 | - | - |
Bermuda | 48,350,508 | 48,350,508 | - | - |
Bahamas (Nassau) | 22,258,794 | 22,258,794 | - | - |
Other | 16,327,997 | 16,327,997 | - | - |
Money Market Funds | 156,421,290 | 156,421,290 | - | - |
Total Investments in Securities: | $ 4,592,241,343 | $ 4,586,130,950 | $ 6,110,393 | $ - |
Income Tax Information |
At October 31, 2010, the Fund had a capital loss carryforward of approximately $425,993,249 of which $18,806,576, $31,200,847 and $375,985,826 will expire on October 31, 2015, 2016 and 2017, respectively. Capital loss carryforwards are only available to offset future capital gains of the Fund to the extent provided by regulations and may be limited. |
The capital loss carryforward expiring October 31, 2015 and October 31, 2016 were acquired from Fidelity Advisor Latin America Fund. |
See accompanying notes which are an integral part of the financial statements.
Annual Report
Fidelity Latin America Fund
Financial Statements
Statement of Assets and Liabilities
| October 31, 2010 |
| | |
Assets | | |
Investment in securities, at value (including securities loaned of $101,291,620) - See accompanying schedule: Unaffiliated issuers (cost $2,312,779,474) | $ 4,435,820,053 | |
Fidelity Central Funds (cost $156,421,290) | 156,421,290 | |
Total Investments (cost $2,469,200,764) | | $ 4,592,241,343 |
Foreign currency held at value (cost $10,492,341) | | 10,469,243 |
Receivable for investments sold | | 17,239,484 |
Receivable for fund shares sold | | 4,585,338 |
Dividends receivable | | 14,057,987 |
Distributions receivable from Fidelity Central Funds | | 53,766 |
Other receivables | | 570,099 |
Total assets | | 4,639,217,260 |
| | |
Liabilities | | |
Payable for investments purchased | $ 10,996,858 | |
Payable for fund shares redeemed | 3,880,116 | |
Accrued management fee | 2,634,325 | |
Distribution and service plan fees payable | 91,638 | |
Other affiliated payables | 877,009 | |
Other payables and accrued expenses | 557,441 | |
Collateral on securities loaned, at value | 102,683,905 | |
Total liabilities | | 121,721,292 |
| | |
Net Assets | | $ 4,517,495,968 |
Net Assets consist of: | | |
Paid in capital | | $ 2,836,057,819 |
Undistributed net investment income | | 12,014,368 |
Accumulated undistributed net realized gain (loss) on investments and foreign currency transactions | | (453,630,606) |
Net unrealized appreciation (depreciation) on investments and assets and liabilities in foreign currencies | | 2,123,054,387 |
Net Assets | | $ 4,517,495,968 |
Statement of Assets and Liabilities - continued
| October 31, 2010 |
| | |
Calculation of Maximum Offering Price Class A:
Net Asset Value and redemption price per share ($115,625,689 ÷ 2,011,628 shares) | | $ 57.48 |
| | |
Maximum offering price per share (100/94.25 of $57.48) | | $ 60.99 |
Class T:
Net Asset Value and redemption price per share ($36,820,312 ÷ 640,743 shares) | | $ 57.47 |
| | |
Maximum offering price per share (100/96.50 of $57.47) | | $ 59.55 |
Class B:
Net Asset Value and offering price per share ($20,391,715 ÷ 355,023 shares)A | | $ 57.44 |
| | |
Class C:
Net Asset Value and offering price per share ($48,328,614 ÷ 841,390 shares)A | | $ 57.44 |
| | |
Latin America:
Net Asset Value, offering price and redemption price per share ($4,283,461,984 ÷ 74,497,448 shares) | | $ 57.50 |
| | |
Institutional Class:
Net Asset Value, offering price and redemption price per share ($12,867,654 ÷ 223,808 shares) | | $ 57.49 |
A Redemption price per share is equal to net asset value less any applicable contingent deferred sales charge.
See accompanying notes which are an integral part of the financial statements.
Annual Report
Statement of Operations
| Year ended October 31, 2010 |
| | |
Investment Income | | |
Dividends | | $ 140,582,424 |
Interest | | 616 |
Income from Fidelity Central Funds | | 670,188 |
Income before foreign taxes withheld | | 141,253,228 |
Less foreign taxes withheld | | (11,229,284) |
Total income | | 130,023,944 |
| | |
Expenses | | |
Management fee | $ 29,682,512 | |
Transfer agent fees | 9,142,613 | |
Distribution and service plan fees | 91,835 | |
Accounting and security lending fees | 1,584,130 | |
Custodian fees and expenses | 2,502,166 | |
Independent trustees' compensation | 23,783 | |
Registration fees | 191,852 | |
Audit | 73,353 | |
Legal | 20,416 | |
Interest | 8,537 | |
Miscellaneous | 54,353 | |
Total expenses before reductions | 43,375,550 | |
Expense reductions | (1,043,771) | 42,331,779 |
Net investment income (loss) | | 87,692,165 |
Realized and Unrealized Gain (Loss) Net realized gain (loss) on: | | |
Investment securities: | | |
Unaffiliated issuers | 297,443,270 | |
Capital gain distributions from Fidelity Central Funds | 16,900 | |
Foreign currency transactions | (3,949,502) | |
Total net realized gain (loss) | | 293,510,668 |
Change in net unrealized appreciation (depreciation) on: Investment securities | 519,646,669 | |
Assets and liabilities in foreign currencies | (463,211) | |
Total change in net unrealized appreciation (depreciation) | | 519,183,458 |
Net gain (loss) | | 812,694,126 |
Net increase (decrease) in net assets resulting from operations | | $ 900,386,291 |
Statement of Changes in Net Assets
| Year ended
October 31,
2010 | Year ended
October 31,
2009 |
Increase (Decrease) in Net Assets | | |
Operations | | |
Net investment income (loss) | $ 87,692,165 | $ 57,543,805 |
Net realized gain (loss) | 293,510,668 | (469,604,930) |
Change in net unrealized appreciation (depreciation) | 519,183,458 | 1,902,747,452 |
Net increase (decrease) in net assets resulting from operations | 900,386,291 | 1,490,686,327 |
Distributions to shareholders from net investment income | (118,560,409) | (34,726,095) |
Distributions to shareholders from net realized gain | (33,986,366) | - |
Total distributions | (152,546,775) | (34,726,095) |
Share transactions - net increase (decrease) | (275,675,234) | 360,846,005 |
Redemption fees | 1,583,234 | 1,335,831 |
Total increase (decrease) in net assets | 473,747,516 | 1,818,142,068 |
| | |
Net Assets | | |
Beginning of period | 4,043,748,452 | 2,225,606,384 |
End of period (including undistributed net investment income of $12,014,368 and undistributed net investment income of $42,882,612, respectively) | $ 4,517,495,968 | $ 4,043,748,452 |
See accompanying notes which are an integral part of the financial statements.
Annual Report
Financial Highlights - Class A
Period ended October 31, | 2010 H |
Selected Per-Share Data | |
Net asset value, beginning of period | $ 55.47 |
Income from Investment Operations | |
Net investment income (loss) E | .02 |
Net realized and unrealized gain (loss) | 2.79 |
Total from investment operations | 2.81 |
Distributions from net investment income | (.80) |
Redemption fees added to paid in capital E,K | - |
Net asset value, end of period | $ 57.48 |
Total Return B,C,D | 5.14% |
Ratios to Average Net Assets F,I | |
Expenses before reductions | 1.37% A |
Expenses net of fee waivers, if any | 1.37% A |
Expenses net of all reductions | 1.34% A |
Net investment income (loss) | .39% A |
Supplemental Data | |
Net assets, end of period (000 omitted) | $ 115,626 |
Portfolio turnover rate G | 56% J |
A Annualized
B Total returns for periods of less than one year are not annualized.
C Total returns would have been lower had certain expenses not been reduced during the periods shown.
D Total returns do not include the effect of the sales charges.
E Calculated based on average shares outstanding during the period.
F Fees and expenses of the underlying Fidelity Central Funds are not included in the Fund's expense ratio. The Fund indirectly bears its proportionate share of the expenses of any underlying Fidelity Central Funds.
G Amount does not include the portfolio activity of any underlying Fidelity Central Funds.
H For the period September 28, 2010 (commencement of sale of shares) to October 31, 2010.
I Expense ratios reflect operating expenses of the class. Expenses before reductions do not reflect amounts reimbursed by the investment adviser or reductions from brokerage service arrangements or reductions from other expense offset arrangements and do not represent the amount paid by the class during periods when reimbursements or reductions occur. Expense ratios before reductions for start-up periods may not be representative of longer-term operating periods. Expenses net of fee waivers reflect expenses after reimbursement by the investment adviser but prior to reductions from brokerage service arrangements or other expense offset arrangements. Expenses net of all reductions represent the net expenses paid by the class.
J The portfolio turnover rate does not include the assets acquired in the merger.
K Amount represents less than $.01 per share.
Financial Highlights - Class T
Period ended October 31, | 2010 H |
Selected Per-Share Data | |
Net asset value, beginning of period | $ 55.47 |
Income from Investment Operations | |
Net investment income (loss) E | .01 |
Net realized and unrealized gain (loss) | 2.79 |
Total from investment operations | 2.80 |
Distributions from net investment income | (.80) |
Redemption fees added to paid in capital E,K | - |
Net asset value, end of period | $ 57.47 |
Total Return B,C,D | 5.12% |
Ratios to Average Net Assets F,I | |
Expenses before reductions | 1.63% A |
Expenses net of fee waivers, if any | 1.63% A |
Expenses net of all reductions | 1.60% A |
Net investment income (loss) | .13% A |
Supplemental Data | |
Net assets, end of period (000 omitted) | $ 36,820 |
Portfolio turnover rate G | 56% J |
A Annualized
B Total returns for periods of less than one year are not annualized.
C Total returns would have been lower had certain expenses not been reduced during the periods shown.
D Total returns do not include the effect of the sales charges.
E Calculated based on average shares outstanding during the period.
F Fees and expenses of the underlying Fidelity Central Funds are not included in the Fund's expense ratio. The Fund indirectly bears its proportionate share of the expenses of any underlying Fidelity Central Funds.
G Amount does not include the portfolio activity of any underlying Fidelity Central Funds.
H For the period September 28, 2010 (commencement of sale of shares) to October 31, 2010.
I Expense ratios reflect operating expenses of the class. Expenses before reductions do not reflect amounts reimbursed by the investment adviser or reductions from brokerage service arrangements or reductions from other expense offset arrangements and do not represent the amount paid by the class during periods when reimbursements or reductions occur. Expense ratios before reductions for start-up periods may not be representative of longer-term operating periods. Expenses net of fee waivers reflect expenses after reimbursement by the investment adviser but prior to reductions from brokerage service arrangements or other expense offset arrangements. Expenses net of all reductions represent the net expenses paid by the class.
J The portfolio turnover rate does not include the assets acquired in the merger.
K Amount represents less than $.01 per share.
See accompanying notes which are an integral part of the financial statements.
Annual Report
Financial Highlights - Class B
Period ended October 31, | 2010 H |
Selected Per-Share Data | |
Net asset value, beginning of period | $ 55.47 |
Income from Investment Operations | |
Net investment income (loss) E | (.02) |
Net realized and unrealized gain (loss) | 2.79 |
Total from investment operations | 2.77 |
Distributions from net investment income | (.80) |
Redemption fees added to paid in capital E,K | - |
Net asset value, end of period | $ 57.44 |
Total Return B,C,D | 5.06% |
Ratios to Average Net Assets F,I | |
Expenses before reductions | 2.12% A |
Expenses net of fee waivers, if any | 2.12% A |
Expenses net of all reductions | 2.10% A |
Net investment income (loss) | (.36)% A |
Supplemental Data | |
Net assets, end of period (000 omitted) | $ 20,392 |
Portfolio turnover rate G | 56% J |
A Annualized
B Total returns for periods of less than one year are not annualized.
C Total returns would have been lower had certain expenses not been reduced during the periods shown.
D Total returns do not include the effect of the contingent deferred sales charge.
E Calculated based on average shares outstanding during the period.
F Fees and expenses of the underlying Fidelity Central Funds are not included in the Fund's expense ratio. The Fund indirectly bears its proportionate share of the expenses of any underlying Fidelity Central Funds.
G Amount does not include the portfolio activity of any underlying Fidelity Central Funds.
H For the period September 28, 2010 (commencement of sale of shares) to October 31, 2010.
I Expense ratios reflect operating expenses of the class. Expenses before reductions do not reflect amounts reimbursed by the investment adviser or reductions from brokerage service arrangements or reductions from other expense offset arrangements and do not represent the amount paid by the class during periods when reimbursements or reductions occur. Expense ratios before reductions for start-up periods may not be representative of longer-term operating periods. Expenses net of fee waivers reflect expenses after reimbursement by the investment adviser but prior to reductions from brokerage service arrangements or other expense offset arrangements. Expenses net of all reductions represent the net expenses paid by the class.
J The portfolio turnover rate does not include the assets acquired in the merger.
K Amount represents less than $.01 per share.
Financial Highlights - Class C
Period ended October 31, | 2010 H |
Selected Per-Share Data | |
Net asset value, beginning of period | $ 55.47 |
Income from Investment Operations | |
Net investment income (loss) E | (.02) |
Net realized and unrealized gain (loss) | 2.79 |
Total from investment operations | 2.77 |
Distributions from net investment income | (.80) |
Redemption fees added to paid in capital E,K | - |
Net asset value, end of period | $ 57.44 |
Total Return B,C,D | 5.06% |
Ratios to Average Net Assets F,I | |
Expenses before reductions | 2.09% A |
Expenses net of fee waivers, if any | 2.09% A |
Expenses net of all reductions | 2.07% A |
Net investment income (loss) | (.34)% A |
Supplemental Data | |
Net assets, end of period (000 omitted) | $ 48,329 |
Portfolio turnover rate G | 56% J |
A Annualized
B Total returns for periods of less than one year are not annualized.
C Total returns would have been lower had certain expenses not been reduced during the periods shown.
D Total returns do not include the effect of the contingent deferred sales charge.
E Calculated based on average shares outstanding during the period.
F Fees and expenses of the underlying Fidelity Central Funds are not included in the Fund's expense ratio. The Fund indirectly bears its proportionate share of the expenses of any underlying Fidelity Central Funds.
G Amount does not include the portfolio activity of any underlying Fidelity Central Funds.
H For the period September 28, 2010 (commencement of sale of shares) to October 31, 2010.
I Expense ratios reflect operating expenses of the class. Expenses before reductions do not reflect amounts reimbursed by the investment adviser or reductions from brokerage service arrangements or reductions from other expense offset arrangements and do not represent the amount paid by the class during periods when reimbursements or reductions occur. Expense ratios before reductions for start-up periods may not be representative of longer-term operating periods. Expenses net of fee waivers reflect expenses after reimbursement by the investment adviser but prior to reductions from brokerage service arrangements or other expense offset arrangements. Expenses net of all reductions represent the net expenses paid by the class.
J The portfolio turnover rate does not include the assets acquired in the merger.
K Amount represents less than $.01 per share.
See accompanying notes which are an integral part of the financial statements.
Annual Report
Financial Highlights - Latin America
Years ended October 31, | 2010 | 2009 | 2008 | 2007 | 2006 |
Selected Per-Share Data | | | | | |
Net asset value, beginning of period | $ 47.29 | $ 28.69 | $ 67.90 | $ 41.13 | $ 29.40 |
Income from Investment Operations | | | | | |
Net investment income (loss) B | 1.07 | .72 | .83 | .68 | .82 |
Net realized and unrealized gain (loss) | 11.00 | 18.32 | (37.74) | 27.43 | 11.68 |
Total from investment operations | 12.07 | 19.04 | (36.91) | 28.11 | 12.50 |
Distributions from net investment income | (1.49) | (.46) | (.65) | (.61) | (.46) |
Distributions from net realized gain | (.39) | - | (1.72) | (.77) | (.38) |
Total distributions | (1.88) | (.46) | (2.37) | (1.38) | (.84) |
Redemption fees added to paid in capital B | .02 | .02 | .07 | .04 | .07 |
Net asset value, end of period | $ 57.50 | $ 47.29 | $ 28.69 | $ 67.90 | $ 41.13 |
Total Return A | 25.91% | 67.88% | (56.20)% | 70.35% | 43.57% |
Ratios to Average Net Assets C,E | | | | | |
Expenses before reductions | 1.03% | 1.07% | 1.02% | 1.00% | 1.05% |
Expenses net of fee waivers, if any | 1.03% | 1.07% | 1.02% | 1.00% | 1.05% |
Expenses net of all reductions | 1.01% | 1.05% | 1.00% | .98% | 1.02% |
Net investment income (loss) | 2.10% | 2.04% | 1.41% | 1.33% | 2.23% |
Supplemental Data | | | | | |
Net assets, end of period (000 omitted) | $ 4,283,462 | $ 4,043,748 | $ 2,225,606 | $ 6,219,690 | $ 3,122,473 |
Portfolio turnover rate D | 56% F | 52% | 51% | 52% | 60% |
A Total returns would have been lower had certain expenses not been reduced during the periods shown.
B Calculated based on average shares outstanding during the period.
C Fees and expenses of the underlying Fidelity Central Funds are not included in the Fund's expense ratio. The Fund indirectly bears its proportionate share of the expenses of any underlying Fidelity Central Funds.
D Amount does not include the portfolio activity of any underlying Fidelity Central Funds.
E Expense ratios reflect operating expenses of the class. Expenses before reductions do not reflect amounts reimbursed by the investment adviser or reductions from brokerage service arrangements or reductions from other expense offset arrangements and do not represent the amount paid by the class during periods when reimbursements or reductions occur. Expenses net of fee waivers reflect expenses after reimbursement by the investment adviser but prior to reductions from brokerage service arrangements or other expense offset arrangements. Expenses net of all reductions represent the net expenses paid by the class.
F The portfolio turnover rate does not include the assets acquired in the merger.
Financial Highlights - Institutional Class
Period ended October 31, | 2010 G |
Selected Per-Share Data | |
Net asset value, beginning of period | $ 55.47 |
Income from Investment Operations | |
Net investment income (loss) D | .03 |
Net realized and unrealized gain (loss) | 2.79 |
Total from investment operations | 2.82 |
Distributions from net investment income | (.80) |
Redemption fees added to paid in capital D,J | - |
Net asset value, end of period | $ 57.49 |
Total Return B,C | 5.15% |
Ratios to Average Net Assets E,H | |
Expenses before reductions | 1.08% A |
Expenses net of fee waivers, if any | 1.08% A |
Expenses net of all reductions | 1.06% A |
Net investment income (loss) | .68% A |
Supplemental Data | |
Net assets, end of period (000 omitted) | $ 12,868 |
Portfolio turnover rate F | 56% I |
A Annualized
B Total returns for periods of less than one year are not annualized.
C Total returns would have been lower had certain expenses not been reduced during the periods shown.
D Calculated based on average shares outstanding during the period.
E Fees and expenses of the underlying Fidelity Central Funds are not included in the Fund's expense ratio. The Fund indirectly bears its proportionate share of the expenses of any underlying Fidelity Central Funds.
F Amount does not include the portfolio activity of any underlying Fidelity Central Funds.
G For the period September 28, 2010 (commencement of sale of shares) to October 31, 2010.
H Expense ratios reflect operating expenses of the class. Expenses before reductions do not reflect amounts reimbursed by the investment adviser or reductions from brokerage service arrangements or reductions from other expense offset arrangements and do not represent the amount paid by the class during periods when reimbursements or reductions occur. Expense ratios before reductions for start-up periods may not be representative of longer-term operating periods. Expenses net of fee waivers reflect expenses after reimbursement by the investment adviser but prior to reductions from brokerage service arrangements or other expense offset arrangements. Expenses net of all reductions represent the net expenses paid by the class.
I The portfolio turnover rate does not include the assets acquired in the merger.
J Amount represents less than $.01 per share.
See accompanying notes which are an integral part of the financial statements.
Annual Report
Notes to Financial Statements
For the period ended October 31, 2010
1. Organization.
Fidelity Latin America Fund (the Fund) is a fund of Fidelity Investment Trust (the Trust) and is authorized to issue an unlimited number of shares. The Trust is registered under the Investment Company Act of 1940, as amended (the 1940 Act), as an open-end management investment company organized as a Massachusetts business trust. The Fund launched shares of Class A, Class T, Class B, Class C, and Institutional Class and the existing class was designated Latin America on September 28, 2010. Each class has equal rights as to assets and voting privileges. Class B shares are closed to new accounts and additional purchases by existing shareholders. Each class has exclusive voting rights with respect to matters that affect that class. Class B shares automatically convert to Class A shares after a holding period of seven years from the initial date of purchase. Investment income, realized and unrealized capital gains and losses, the common expenses of the Fund, and certain fund-level expense reductions, if any, are allocated on a pro-rata basis to each class based on the relative net assets of each class to the total net assets of the Fund. Each class differs with respect to transfer agent and distribution and service plan fees incurred. Certain expense reductions also differ by class. The Fund's investments in emerging markets can be subject to social, economic, regulatory, and political uncertainties and can be extremely volatile.
2. Investments in Fidelity Central Funds.
The Fund may invest in Fidelity Central Funds, which are open-end investment companies available only to other investment companies and accounts managed by Fidelity Management & Research Company (FMR) and its affiliates. The Fund's Schedule of Investments lists each of the Fidelity Central Funds held as of period end, if any, as an investment of the Fund, but does not include the underlying holdings of each Fidelity Central Fund. As an Investing Fund, the Fund indirectly bears its proportionate share of the expenses of the underlying Fidelity Central Funds.
The Money Market Central Funds seek preservation of capital and current income and are managed by Fidelity Investments Money Management, Inc. (FIMM), an affiliate of FMR.
A complete unaudited list of holdings for each Fidelity Central Fund is available upon request or at the Securities and Exchange Commission (the SEC) web site at www.sec.gov. In addition, the financial statements of the Fidelity Central Funds, which are not covered by the Fund's Report of Independent Registered Public Accounting Firm, are available on the SEC web site or upon request.
3. Significant Accounting Policies.
The financial statements have been prepared in conformity with accounting principles generally accepted in the United States of America (GAAP), which require management to make certain estimates and assumptions at the date of the financial statements. Actual results could differ from those estimates. The following summarizes the significant accounting policies of the Fund:
Security Valuation. Investments are valued as of 4:00 p.m. Eastern time on the last calendar day of the period. The Fund uses independent pricing services approved by the Board of Trustees to value its investments. When current market prices or quotations are not readily available or reliable, valuations may be determined in good faith in accordance with procedures adopted by the Board of Trustees. Factors used in determining value may include market or security specific events. The frequency with which these procedures are used cannot be predicted and they may be utilized to a significant extent. The value used for net asset value (NAV) calculation under these procedures may differ from published prices for the same securities.
The Fund categorizes the inputs to valuation techniques used to value its investments into a disclosure hierarchy consisting of three levels as shown below.
Level 1 - quoted prices in active markets for identical investments
Level 2 - other significant observable inputs (including quoted prices for similar investments, interest rates, prepayment speeds, etc.)
Level 3 - unobservable inputs (including the fund's own assumptions based on the best information available)
Changes in valuation techniques may result in transfers in or out of an assigned level within the disclosure hierarchy. The aggregate value of investments by input level, as of October 31, 2010, is included at the end of the Fund's Schedule of Investments. Valuation techniques used to value the Fund's investments by major category are as follows.
Equity securities, including restricted securities, for which market quotations are readily available, are valued at the last reported sale price or official closing price as reported by an independent pricing service on the primary market or exchange on which they are traded and are categorized as Level 1 in the hierarchy. In the event there were no sales during the day or closing prices are not available, securities are valued at the last quoted bid price or may be valued using the last available price and are generally categorized as Level 2 in the hierarchy. For foreign equity securities, when significant market or security specific events arise, comparisons to the valuation of American Depositary Receipts (ADRs), futures contracts, Exchange-traded
Annual Report
3. Significant Accounting Policies - continued
Security Valuation - continued
funds (ETFs) and certain indexes as well as quoted prices for similar securities are used and are categorized as Level 2 in the hierarchy in these circumstances. Utilizing these techniques may result in transfers between Level 1 and Level 2. For restricted equity securities and private placements where observable inputs are limited, assumptions about market activity and risk are used and are categorized as Level 3 in the hierarchy.
Investments in open-end mutual funds, including the Fidelity Central Funds, are valued at their closing net asset value each business day and are categorized as Level 1 in the hierarchy. Short-term securities with remaining maturities of sixty days or less for which quotations are not readily available are valued at amortized cost, which approximates fair value and are categorized as Level 2 in the hierarchy.
Foreign Currency. The Fund uses foreign currency contracts to facilitate transactions in foreign-denominated securities. Gains and losses from these transactions may arise from changes in the value of the foreign currency or if the counterparties do not perform under the contracts' terms.
Foreign-denominated assets, including investment securities, and liabilities are translated into U.S. dollars at the exchange rate at period end. Purchases and sales of investment securities, income and dividends received and expenses denominated in foreign currencies are translated into U.S. dollars at the exchange rate in effect on the transaction date.
The effects of exchange rate fluctuations on investments are included with the net realized and unrealized gain (loss) on investment securities. Other foreign currency transactions resulting in realized and unrealized gain (loss) are disclosed separately.
Investment Transactions and Income. For financial reporting purposes, the Fund's investment holdings and NAV include trades executed through the end of the last business day of the period. The NAV per share for processing shareholder transactions is calculated as of the close of business of the New York Stock Exchange (NYSE), normally 4:00 p.m. Eastern time and includes trades executed through the end of the prior business day. Gains and losses on securities sold are determined on the basis of identified cost. Dividend income is recorded on the ex-dividend date, except for certain dividends from foreign securities where the ex-dividend date may have passed, which are recorded as soon as the Fund is informed of the ex-dividend date. Non-cash dividends included in dividend income, if any, are recorded at the fair market value of the securities received. Distributions received on securities that represent a return of capital or capital gain are recorded as a reduction of cost of investments and/or as a realized gain. The Fund estimates the components of distributions received that may be considered return of capital distributions or capital gain distributions. Interest income and distributions from the Fidelity Central Funds are accrued as earned. Interest income includes coupon interest and amortization of premium and accretion of discount on debt securities. Investment income is recorded net of foreign taxes withheld where recovery of such taxes is uncertain.
Expenses. Most expenses of the Trust can be directly attributed to a fund. Expenses which cannot be directly attributed are apportioned amongst each fund in the Trust. Expense estimates are accrued in the period to which they relate and adjustments are made when actual amounts are known.
Income Tax Information and Distributions to Shareholders. Each year the Fund intends to qualify as a regulated investment company, including distributing substantially all of its taxable income and realized gains under Subchapter M of the Internal Revenue Code and filing its U.S. federal tax return. As a result, no provision for income taxes is required. As of October 31, 2010, the Fund did not have any unrecognized tax benefits in the accompanying financial statements. A fund's federal tax return is subject to examination by the Internal Revenue Service (IRS) for a period of three years. Foreign taxes are provided for based on the Fund's understanding of the tax rules and rates that exist in the foreign markets in which it invests.
Distributions are declared and recorded on the ex-dividend date. Income dividends and capital gain distributions are declared separately for each class. Income and capital gain distributions are determined in accordance with income tax regulations, which may differ from GAAP.
Capital accounts within the financial statements are adjusted for permanent book-tax differences. These adjustments have no impact on net assets or the results of operations. Temporary book-tax differences will reverse in a subsequent period.
Book-tax differences are primarily due to short-term gain distributions from the Fidelity Central Funds, foreign currency transactions, passive foreign investment companies (PFIC), deferred trustees compensation, capital loss carryforwards and losses deferred due to wash sales.
The federal tax cost of investment securities and unrealized appreciation (depreciation) as of period end were as follows:
Gross unrealized appreciation | $ 2,104,075,629 |
Gross unrealized depreciation | (24,006,376) |
Net unrealized appreciation (depreciation) | $ 2,080,069,253 |
| |
Tax Cost | $ 2,512,172,090 |
Annual Report
Notes to Financial Statements - continued
3. Significant Accounting Policies - continued
Income Tax Information and Distributions to Shareholders - continued
The tax-based components of distributable earnings as of period end were as follows:
Undistributed ordinary income | $ 27,349,071 |
Capital loss carryforward | $ (425,993,249) |
Net unrealized appreciation (depreciation) | $ 2,080,083,061 |
The tax character of distributions paid was as follows:
| October 31, 2010 | October 31, 2009 |
Ordinary Income | $ 152,546,775 | $ 34,726,095 |
Short-Term Trading (Redemption) Fees. Shares purchased by investors and held in the Fund less than 90 days are subject to a redemption fee equal to 1.50% of the net asset value of shares redeemed. All redemption fees, which reduce the proceeds of the shareholder redemption, are retained by the Fund and accounted for as an addition to paid in capital.
4. Operating Policies.
Restricted Securities. The Fund may invest in securities that are subject to legal or contractual restrictions on resale. These securities generally may be resold in transactions exempt from registration or to the public if the securities are registered. Disposal of these securities may involve time-consuming negotiations and expense, and prompt sale at an acceptable price may be difficult. Information regarding restricted securities is included at the end of the Fund's Schedule of Investments.
5. Purchases and Sales of Investments.
Purchases and sales of securities, other than short-term securities, aggregated $2,260,960,609 and $2,764,008,467, respectively.
6. Fees and Other Transactions with Affiliates.
Management Fee. FMR and its affiliates provide the Fund with investment management related services for which the Fund pays a monthly management fee. The management fee is the sum of an individual fund fee rate that is based on an annual rate of .45% of the Fund's average net assets and a group fee rate that averaged .26% during the period. The group fee rate is based upon the average net assets of all the mutual funds advised by FMR. The group fee rate decreases as assets under management increase and increases as assets under management decrease. For the period, the total annual management fee rate was .71% of the Fund's average net assets.
Distribution and Service Plan Fees. In accordance with Rule 12b-1 of the 1940 Act, the Fund has adopted separate Distribution and Service Plans for each class of shares. Certain classes pay Fidelity Distributors Corporation (FDC), an affiliate of FMR, separate Distribution and Service Fees, each of which is based on an annual percentage of each class' average net assets. In addition, FDC may pay financial intermediaries for selling shares of the Fund and providing shareholder support services. For the period, the Distribution and Service Fee rates, total fees and amounts retained by FDC were as follows:
| Distribution
Fee | Service
Fee | Paid
to FDC | Retained
by FDC |
Class A | -% | .25% | $ 22,839 | $ - |
Class T | .25% | .25% | 14,535 | - |
Class B | .75% | .25% | 16,306 | 11,638 |
Class C | .75% | .25% | 38,155 | 2,577 |
| | | $ 91,835 | $ 14,215 |
Sales Load. FDC receives a front-end sales charge of up to 5.75% for selling Class A shares, and 3.50% for selling Class T shares, some of which is paid to financial intermediaries for selling shares of the Fund. FDC receives the proceeds of contingent deferred sales charges levied on Class A, Class T, Class B, and Class C redemptions. These charges depend on the holding period. The deferred sales charges range from 5% to 1% for Class B, 1% for Class C, 1.00% for certain purchases of Class A shares and .25% for certain purchases of Class T shares.
Annual Report
6. Fees and Other Transactions with Affiliates - continued
Sales Load - continued
For the period, sales charge amounts retained by FDC were as follows:
| Retained
by FDC |
Class A | $ 6,464 |
Class T | 880 |
Class B | 2,206 |
Class C | 400 |
| $ 9,950 |
Transfer Agent Fees. Fidelity Investments Institutional Operations Company, Inc. (FIIOC), an affiliate of FMR, is the transfer, dividend disbursing and shareholder servicing agent for each class of the Fund. FIIOC receives account fees and asset-based fees that vary according to the account size and type of account of the shareholders of the respective classes of the Fund. FIIOC pays for typesetting, printing and mailing of shareholder reports, except proxy statements. For the period, transfer agent fees for each class were as follows:
| Amount | % of
Average
Net Assets |
Class A | $ 27,211 | .30* |
Class T | 8,883 | .31* |
Class B | 4,861 | .30* |
Class C | 10,426 | .27* |
Latin America | 9,088,528 | .22 |
Institutional Class | 2,704 | .26* |
| $ 9,142,613 | |
* Annualized
Accounting and Security Lending Fees. Fidelity Service Company, Inc. (FSC), an affiliate of FMR, maintains the Fund's accounting records. The accounting fee is based on the level of average net assets for the month. Under a separate contract, FSC administers the security lending program. The security lending fee is based on the number and duration of lending transactions.
Brokerage Commissions. The Fund placed a portion of its portfolio transactions with brokerage firms which are affiliates of the investment adviser. The commissions paid to these affiliated firms were $6,632 for the period.
Interfund Lending Program. Pursuant to an Exemptive Order issued by the SEC, the Fund, along with other registered investment companies having management contracts with FMR, may participate in an interfund lending program. This program provides an alternative credit facility allowing the funds to borrow from, or lend money to, other participating affiliated funds. At period end, there were no interfund loans outstanding. The Fund's activity in this program during the period for which loans were outstanding was as follows:
Borrower or Lender | Average Daily
Loan Balance | Weighted Average Interest Rate | Interest
Expense |
Borrower | $ 12,527,535 | .44% | $ 6,510 |
7. Committed Line of Credit.
The Fund participates with other funds managed by FMR or an affiliate in a $3.75 billion credit facility (the "line of credit") to be utilized for temporary or emergency purposes to fund shareholder redemptions or for other short-term liquidity purposes. The Fund has agreed to pay commitment fees on its pro-rata portion of the line of credit, which amounted to $16,647 and is reflected in Miscellaneous expenses on the Statement of Operations. During the period, there were no borrowings on this line of credit.
8. Security Lending.
The Fund lends portfolio securities through a lending agent from time to time in order to earn additional income. The lending agent may loan securities to certain qualified borrowers, including Fidelity Capital Markets (FCM), a broker-dealer affiliated with the Fund. On the settlement date of the loan, the Fund receives collateral (in the form of U.S. Treasury obligations, letters of credit and/or cash) against the loaned securities and maintains collateral in an amount not less than 100% of the market value of the loaned securities during the period of the loan. The market value of the loaned securities is determined at the close of business of the Fund and any additional required collateral is delivered to the Fund on the next business day. If the borrower defaults on its obligation to return the securities loaned because of insolvency or other reasons, a fund could experience delays and costs in recovering the securities loaned or in gaining access to the collateral. Any cash collateral received is invested in the Fidelity Securities Lending Cash
Annual Report
Notes to Financial Statements - continued
8. Security Lending - continued
Central Fund. The value of loaned securities and cash collateral at period end are disclosed on the Fund's Statement of Assets and Liabilities. Security lending income represents the income earned on investing cash collateral, less rebates paid to borrowers and lending agent fees associated with the loan, plus any premium payments received for lending certain types of securities. Security lending income is presented in the Statement of Operations as a component of income from Fidelity Central Funds. Total security lending income during the period amounted to $586,004. During the period, there were no securities loaned to FCM.
9. Bank Borrowings.
The Fund is permitted to have bank borrowings for temporary or emergency purposes to fund shareholder redemptions. The Fund has established borrowing arrangements with certain banks. The interest rate on the borrowings is the bank's base rate, as revised from time to time. The average daily loan balance during the period for which loans were outstanding amounted to $14,799,857. The weighted average interest rate was .70%. The interest expense amounted to $2,027 under the bank borrowing program. At period end, there were no bank borrowings outstanding.
10. Expense Reductions.
FMR voluntarily agreed to reimburse a portion of Latin America's operating expenses. During the period, this reimbursement reduced the class' expenses by $62,575.
Many of the brokers with whom FMR places trades on behalf of the Fund provided services to the Fund in addition to trade execution. These services included payments of certain expenses on behalf of the Fund totaling $980,935 for the period. In addition, through arrangements with the Fund's custodian, credits realized as a result of uninvested cash balances were used to reduce the Fund's expenses. During the period, these credits reduced the Fund's custody expenses by $261.
11. Distributions to Shareholders.
Distributions to shareholders of each class were as follows:
Years ended October 31, | 2010 A | 2009 |
From net investment income | | |
Class A | $ 1,442 | $ - |
Class T | 1,442 | - |
Class B | 1,442 | - |
Class C | 1,442 | - |
Latin America | 118,553,199 | 34,726,095 |
Institutional Class | 1,442 | - |
Total | $ 118,560,409 | $ 34,726,095 |
From net realized gain | | |
Latin America | $ 33,986,366 | $ - |
A Distributions for Class A, Class T, Class B, Class C and Institutional Class are for the period September 28, 2010 (commencement of sale of shares) to October 31, 2010.
12. Share Transactions.
Transactions for each class of shares were as follows:
| Shares | Dollars |
Years ended October 31, | 2010 A | 2009 | 2010 A | 2009 |
Class A | | | | |
Shares sold | 41,687 | - | $ 2,369,263 | $ - |
Issued in exchange of shares of Fidelity Advisor Latin America Fund | 2,023,866 | | 113,640,086 | |
Reinvestment of distributions | 26 | - | 1,442 | - |
Shares redeemed | (53,951) | - | (3,076,408) | - |
Net increase (decrease) | 2,011,628 | - | $ 112,934,383 | $ - |
Class T | | | | |
Shares sold | 18,758 | - | $ 1,058,068 | $ - |
Issued in exchange of shares of Fidelity Advisor Latin America Fund | 637,585 | | 35,800,407 | |
Reinvestment of distributions | 26 | - | 1,442 | - |
Shares redeemed | (15,626) | - | (885,588) | - |
Net increase (decrease) | 640,743 | - | $ 35,974,329 | $ - |
Annual Report
12. Share Transactions - continued
| Shares | Dollars |
Years ended October 31, | 2010 A | 2009 | 2010 A | 2009 |
Class B | | | | |
Shares sold | 3,456 | - | $ 192,197 | $ - |
Issued in exchange of shares of Fidelity Advisor Latin America Fund | 359,402 | | 20,176,816 | |
Reinvestment of distributions | 26 | - | 1,442 | - |
Shares redeemed | (7,861) | - | (450,086) | - |
Net increase (decrease) | 355,023 | - | $ 19,920,369 | $ - |
Class C | | | | |
Shares sold | 17,327 | - | $ 976,205 | $ - |
Issued in exchange of shares of Fidelity Advisor Latin America Fund | 840,828 | | 47,204,057 | |
Reinvestment of distributions | 26 | - | 1,442 | - |
Shares redeemed | (16,791) | - | (947,712) | - |
Net increase (decrease) | 841,390 | - | $ 47,233,992 | $ - |
Latin America | | | | |
Shares sold | 22,062,249 | 31,352,380 | $ 1,142,552,819 | $ 1,172,903,800 |
Reinvestment of distributions | 2,770,809 | 1,344,639 | 147,652,381 | 33,594,867 |
Shares redeemed | (35,850,914) | (24,759,791) | (1,794,503,952) | (845,652,662) |
Net increase (decrease) | (11,017,856) | 7,937,228 | $ (504,298,752) | $ 360,846,005 |
Institutional Class | | | | |
Shares sold | 3,784 | - | $ 212,699 | $ - |
Issued in exchange of shares of Fidelity Advisor Latin America Fund | 228,366 | | 12,822,761 | |
Reinvestment of distributions | 26 | - | 1,442 | - |
Shares redeemed | (8,368) | - | (476,457) | - |
Net increase (decrease) | 223,808 | - | $ 12,560,445 | $ - |
A Share transactions for Class A, Class T, Class B, Class C and Institutional are for the period September 28, 2010 (commencement of sale of shares) to October 31, 2010.
13. Other.
The Fund's organizational documents provide former and current trustees and officers with a limited indemnification against liabilities arising in connection with the performance of their duties to the Fund. In the normal course of business, the Fund may also enter into contracts that provide general indemnifications. The Fund's maximum exposure under these arrangements is unknown as this would be dependent on future claims that may be made against the Fund. The risk of material loss from such claims is considered remote.
14. Merger Information.
On October 1, 2010 the Fund acquired all of the assets and assumed all of the liabilities of the Fidelity Advisor Latin America Fund ("Target Fund") pursuant to an agreement and plan of reorganization approved by the Board of Trustees ("The Board") on July 6, 2010. The reorganization provides shareholders of the Target Fund access to a larger portfolio with the same investment objectives and lower expenses. The acquisition was accomplished by an exchange of 2,023,866 Class A shares, 637,585 Class T shares, 359,402 Class B shares, 840,828 Class C shares, and 228,366 Institutional class shares of the Fund, respectively, for 2,219,330 Class A shares, 700,912 Class T shares, 400,205 Class B shares, 940,861 Class C shares, and 245,559 Institutional class shares then outstanding (valued at $51.20, $51.08, $50.42, $50.17 and $52.22 per share for Class A, Class T, Class B, Class C, and Institutional class, respectively) of the Target Fund. The reorganization qualified as a tax-free reorganization for federal income tax purposes with no gain or loss recognized to the funds or their shareholders. The Target Fund's net assets, including securities of $229,225,487, unrealized appreciation of $95,358,358, and net other assets of $418,642, were combined with the Fund's net assets of $4,149,781,255 for total net assets after the acquisition of $4,379,425,384.
Pro forma results of operations of the combined entity for the entire year ended October 31, 2010, as though the acquisition had occurred as of the beginning of the year (rather than on the actual acquisition date), are as follows:
Net investment income (loss) | $ 90,969,628 |
Total net realized gain (loss) | 302,327,523 |
Total change in net unrealized appreciation (depreciation) | 548,871,563 |
Net increase (decrease) in net assets resulting from operations | 942,168,714 |
Because the combined investment portfolios have been managed as a single portfolio since the acquisition was completed, it is not practicable to separate the amounts of revenue and earnings of the acquired fund that have been included in the Fund's accompanying Statement of Operations since October 1, 2010.
Annual Report
Report of Independent Registered Public Accounting Firm
To the Trustees of Fidelity Investment Trust and the Shareholders of Fidelity Latin America Fund:
In our opinion, the accompanying statement of assets and liabilities, including the schedule of investments, and the related statements of operations and of changes in net assets and the financial highlights present fairly, in all material respects, the financial position of Fidelity Latin America Fund (a fund of Fidelity Investment Trust) at October 31, 2010, the results of its operations for the year then ended, the changes in its net assets for each of the two years in the period then ended and the financial highlights for each of the periods indicated, in conformity with accounting principles generally accepted in the United States of America. These financial statements and financial highlights (hereafter referred to as "financial statements") are the responsibility of the Fidelity Latin America Fund's management. Our responsibility is to express an opinion on these financial statements based on our audits. We conducted our audits of these financial statements in accordance with the standards of the Public Company Accounting Oversight Board (United States). Those standards require that we plan and perform the audit to obtain reasonable assurance about whether the financial statements are free of material misstatement. An audit includes examining, on a test basis, evidence supporting the amounts and disclosures in the financial statements, assessing the accounting principles used and significant estimates made by management, and evaluating the overall financial statement presentation. We believe that our audits, which included confirmation of securities at October 31, 2010 by correspondence with the custodian and brokers, provide a reasonable basis for our opinion.
/s/ PricewaterhouseCoopers LLP
PricewaterhouseCoopers LLP
Boston, Massachusetts
December 17, 2010
Annual Report
The Trustees, Member of the Advisory Board, and executive officers of the trust and fund, as applicable, are listed below. The Board of Trustees governs the fund and is responsible for protecting the interests of shareholders. The Trustees are experienced executives who meet periodically throughout the year to oversee the fund's activities, review contractual arrangements with companies that provide services to the fund, oversee management of the risks associated with such activities and contractual arrangements, and review the fund's performance. Except for James C. Curvey, each of the Trustees oversees 221 funds advised by FMR or an affiliate. Mr. Curvey oversees 410 funds advised by FMR or an affiliate.
The Trustees hold office without limit in time except that (a) any Trustee may resign; (b) any Trustee may be removed by written instrument, signed by at least two-thirds of the number of Trustees prior to such removal; (c) any Trustee who requests to be retired or who has become incapacitated by illness or injury may be retired by written instrument signed by a majority of the other Trustees; and (d) any Trustee may be removed at any special meeting of shareholders by a two-thirds vote of the outstanding voting securities of the trust. Each Trustee who is not an interested person (as defined in the 1940 Act) (Independent Trustee), shall retire not later than the last day of the calendar year in which his or her 72nd birthday occurs. The Independent Trustees may waive this mandatory retirement age policy with respect to individual Trustees. The executive officers and Advisory Board Member hold office without limit in time, except that any officer and Advisory Board Member may resign or may be removed by a vote of a majority of the Trustees at any regular meeting or any special meeting of the Trustees. Except as indicated, each individual has held the office shown or other offices in the same company for the past five years.
Experience, Skills, Attributes, and Qualifications of the Fund's Trustees. The Governance and Nominating Committee has adopted a statement of policy that describes the experience, qualifications, attributes, and skills that are necessary and desirable for potential Independent Trustee candidates (Statement of Policy). The Board believes that each Trustee satisfied at the time he or she was initially elected or appointed a Trustee, and continues to satisfy, the standards contemplated by the Statement of Policy. The Governance and Nominating Committee also engages professional search firms to help identify potential Independent Trustee candidates who have the experience, qualifications, attributes, and skills consistent with the Statement of Policy. From time to time, additional criteria based on the composition and skills of the current Independent Trustees, as well as experience or skills that may be appropriate in light of future changes to board composition, business conditions, and regulatory or other developments, have also been considered by the professional search firms and the Governance and Nominating Committee. In addition, the Board takes into account the Trustees' commitment and participation in Board and committee meetings, as well as their leadership of standing and ad hoc committees throughout their tenure.
In determining that a particular Trustee was and continues to be qualified to serve as a Trustee, the Board has considered a variety of criteria, none of which, in isolation, was controlling. The Board believes that, collectively, the Trustees have balanced and diverse experience, qualifications, attributes, and skills, which allow the Board to operate effectively in governing the fund and protecting the interests of shareholders. Information about the specific experience, skills, attributes, and qualifications of each Trustee, which in each case led to the Board's conclusion that the Trustee should serve (or continue to serve) as a trustee of the fund, is provided below.
Board Structure and Oversight Function. Edward C. Johnson 3d is an interested person (as defined in the 1940 Act) and currently serves as Chairman. The Trustees have determined that an interested Chairman is appropriate and benefits shareholders because an interested Chairman has a personal and professional stake in the quality and continuity of services provided to the fund. Independent Trustees exercise their informed business judgment to appoint an individual of their choosing to serve as Chairman, regardless of whether the Trustee happens to be independent or a member of management. The Independent Trustees have determined that they can act independently and effectively without having an Independent Trustee serve as Chairman and that a key structural component for assuring that they are in a position to do so is for the Independent Trustees to constitute a substantial majority for the Board. The Independent Trustees also regularly meet in executive session. Ned C. Lautenbach serves as Chairman of the Independent Trustees and as such (i) acts as a liaison between the Independent Trustees and management with respect to matters important to the Independent Trustees and (ii) with management prepares agendas for Board meetings.
Fidelity funds are overseen by different Boards of Trustees. The fund's Board oversees Fidelity's equity and high income funds and another Board oversees Fidelity's investment-grade bond, money market, and asset allocation funds. The asset allocation funds may invest in Fidelity funds overseen by the fund's Board. The use of separate Boards, each with its own committee structure, allows the Trustees of each group of Fidelity funds to focus on the unique issues of the funds they oversee, including common research, investment, and operational issues. On occasion, the separate Boards establish joint committees to address issues of overlapping consequences for the Fidelity funds overseen by each Board.
The Trustees operate using a system of committees to facilitate the timely and efficient consideration of all matters of importance to the Trustees, the fund, and fund shareholders and to facilitate compliance with legal and regulatory requirements and oversight of the fund's activities and associated risks. The Board, acting through its committees, has charged FMR and its affiliates with (i) identifying events or circumstances the occurrence of which could have demonstrably adverse effects on the fund's business and/or reputation; (ii) implementing processes and controls to lessen the possibility that such events or circumstances occur or to mitigate the effects of such events or circumstances if they do occur; and (iii) creating and maintaining a system designed to evaluate continuously business and market conditions in order to facilitate the identification and implementation processes described in (i) and (ii) above. Because the day-to-day operations and activities of the fund are carried out by or through FMR, its affiliates and other service providers, the fund's exposure to risks is mitigated but not eliminated by the processes overseen by the Trustees. While each of the Board's committees has responsibility for overseeing different aspects of the fund's activities, oversight is exercised primarily through the Operations, Audit, and Compliance Committees. Appropriate personnel, including but not limited to the fund's Chief Compliance Officer (CCO), FMR's internal auditor, the independent accountants, the fund's Treasurer and portfolio management personnel, make periodic reports to the Board's committees, as appropriate. The responsibilities of each committee, including their oversight responsibilities, are described further under "Standing Committees of the Fund's Trustees."
Annual Report
Trustees and Officers - continued
The fund's Statement of Additional Information (SAI) includes more information about the Trustees. To request a free copy, call Fidelity at 1-877-208-0098.
Interested Trustees*:
Correspondence intended for each Trustee who is an interested person may be sent to Fidelity Investments, 82 Devonshire Street, Boston, Massachusetts 02109.
Name, Age; Principal Occupations and Other Relevant Experience+ |
Edward C. Johnson 3d (80) |
| Year of Election or Appointment: 1983 Mr. Johnson is Trustee and Chairman of the Board of Trustees of certain Trusts. Mr. Johnson serves as Chief Executive Officer, Chairman, and a Director of FMR LLC; Chairman and a Director of FMR; Chairman and a Director of Fidelity Research & Analysis Company (FRAC); Chairman and a Director of Fidelity Investments Money Management, Inc.; and Chairman and a Director of FMR Co., Inc. In addition, Mr. Johnson serves as Chairman and Director of FIL Limited. Previously, Mr. Johnson served as President of FMR LLC (2006-2007). |
James C. Curvey (75) |
| Year of Election or Appointment: 2007 Mr. Curvey also serves as Trustee (2007-present) of other investment companies advised by FMR. Mr. Curvey is a Director of Fidelity Investments Money Management, Inc. (2009-present), Director of Fidelity Research & Analysis Co. (2009-present) and Director of FMR and FMR Co., Inc. (2007-present). Mr. Curvey is also Vice Chairman (2007-present) and Director of FMR LLC. In addition, Mr. Curvey serves as an Overseer for the Boston Symphony Orchestra and a member of the Trustees of Villanova University. Previously, Mr. Curvey was the Vice Chairman (2006-2007) and Director (2000-2007) of FMR Corp. |
* Trustees have been determined to be "Interested Trustees" by virtue of, among other things, their affiliation with the trust or various entities under common control with FMR.
+ The information above includes each Trustee's principal occupation during the last five years and other information relating to the experience, attributes, and skills relevant to each Trustee's qualifications to serve as a Trustee, which led to the conclusion that each Trustee should serve as a Trustee for the fund.
Independent Trustees:
Correspondence intended for each Independent Trustee (that is, the Trustees other than the Interested Trustees) may be sent to Fidelity Investments, P.O. Box 55235, Boston, Massachusetts 02205-5235.
Name, Age; Principal Occupations and Other Relevant Experience+ |
Dennis J. Dirks (62) |
| Year of Election or Appointment: 2005 Prior to his retirement in May 2003, Mr. Dirks was Chief Operating Officer and a member of the Board of The Depository Trust & Clearing Corporation (DTCC). He also served as President, Chief Operating Officer, and Board member of The Depository Trust Company (DTC) and President and Board member of the National Securities Clearing Corporation (NSCC). In addition, Mr. Dirks served as Chief Executive Officer and Board member of the Government Securities Clearing Corporation, Chief Executive Officer and Board member of the Mortgage-Backed Securities Clearing Corporation, as a Trustee and a member of the Finance Committee of Manhattan College (2005-2008), and as a Trustee and a member of the Finance Committee of AHRC of Nassau County (2006-2008). Mr. Dirks is a member of the Independent Directors Council (IDC) Governing Council (2010-Present) and Board of Directors for The Brookville Center for Children's Services, Inc. (2009-present). |
Alan J. Lacy (57) |
| Year of Election or Appointment: 2008 Mr. Lacy serves as Senior Adviser (2007-present) of Oak Hill Capital Partners, L.P. (private equity). Mr. Lacy also served as Chief Executive Officer (2000-2005) and Vice Chairman (2005-2006) of Sears Holdings Corporation and Sears, Roebuck and Co. (retail). In addition, Mr. Lacy serves as a member of the Board of Directors of The Western Union Company (global money transfer, 2006-present) and Bristol-Myers Squibb Company (global pharmaceuticals, 2007-present). Mr. Lacy is Chairman (2008-present) and a member (2006-present) of the Board of Trustees of The National Parks Conservation Association. |
Ned C. Lautenbach (66) |
| Year of Election or Appointment: 2000 Mr. Lautenbach is Chairman of the Independent Trustees of the Equity and High Income Funds (2006-present). Mr. Lautenbach currently serves as the Lead Director of the Eaton Corporation Board of Directors (diversified industrial, 1997-present). Mr. Lautenbach is also a member of the Board of Directors of the Philharmonic Center for the Arts in Naples, Florida (1999-
present); a member of the Board of Trustees of Fairfield University (2005-present); and a member of the Council on Foreign Relations (1994-present). Previously, Mr. Lautenbach was a Partner/Advisory Partner at Clayton, Dubilier & Rice, Inc. (private equity investment, 1998-2010), as well as a Director of Sony Corporation (2006-2007). |
Joseph Mauriello (66) |
| Year of Election or Appointment: 2008 Prior to his retirement in January 2006, Mr. Mauriello served in numerous senior management positions including Deputy Chairman and Chief Operating Officer (2004-2005), and Vice Chairman of Financial Services (2002-2004) of KPMG LLP US (professional services, 1965-2005). Mr. Mauriello currently serves as a member of the Board of Directors of XL Group plc. (global insurance and re-insurance, 2006-present) and of Arcadia Resources Inc. (health care services and products, 2007-present).
Previously, Mr. Mauriello served as a Director of the Hamilton Funds of the Bank of New York (2006-2007). |
Cornelia M. Small (66) |
| Year of Election or Appointment: 2005 Ms. Small is a member of the Board of Directors of the Teagle Foundation (2009-present). Ms. Small is also a member of the Investment Committee, and Chair (2008-present) and a member of the Board of Trustees of Smith College. In addition, Ms. Small serves on the Investment Committee of the Berkshire Taconic Community Foundation (2008-present). Previously, Ms. Small served as Chairperson of the Investment Committee (2002-2008) of Smith College. In addition, Ms. Small served as Chief Investment Officer, Director of Global Equity Investments, and a member of the Board of Directors of Scudder, Stevens & Clark and Scudder Kemper Investments. |
William S. Stavropoulos (71) |
| Year of Election or Appointment: 2001 Mr. Stavropoulos is Vice Chairman of the Independent Trustees of the Equity and High Income Funds (2006-present). Mr. Stavropoulos serves as President and Founder of the Michigan Baseball Foundation, the Great Lakes Loons (2007-present). Mr. Stavropoulos is Chairman Emeritus of the Board of Directors of The Dow Chemical Company, where he previously served in numerous senior management positions, including President, CEO (1995-2000; 2002-2004), Chairman of the Executive Committee (2000-2006), and as a member of the Board of Directors (1990-2006). Currently, Mr. Stavropoulos is Chairman of Univar (global distributor of commodity and specialty chemicals, 2010-present), a Director of Teradata Corporation (data warehousing and technology solutions, 2008-present), Chemical Financial Corporation, Maersk Inc. (industrial conglomerate), Tyco International, Inc. (multinational manufacturing and services, 2007-present), and a member of the Advisory Board for Metalmark Capital (private equity investment, 2005-present). Mr. Stavropoulos is a special advisor to Clayton, Dubilier & Rice, Inc. (private equity investment). In addition, Mr. Stavropoulos is a member of the University of Notre Dame Advisory Council for the College of Science. |
David M. Thomas (61) |
| Year of Election or Appointment: 2008 Previously, Mr. Thomas served as Executive Chairman (2005-2006) and Chairman and Chief Executive Officer (2000-2005) of IMS Health, Inc. (pharmaceutical and healthcare information solutions). In addition, Mr. Thomas serves as a member of the Board of Directors of Fortune Brands, Inc. (consumer products), and Interpublic Group of Companies, Inc. (marketing communication, 2004-present). |
Michael E. Wiley (60) |
| Year of Election or Appointment: 2008 Mr. Wiley also serves as a Director of Asia Pacific Exploration Consolidated (international oil and gas exploration and production, 2008-present). Mr. Wiley serves as a Director of Tesoro Corporation (independent oil refiner and marketer, 2005-present), and a Director of Bill Barrett Corporation (exploration and production, 2005-present). In addition, Mr. Wiley also serves as a Director of Post Oak Bank (privately-held bank, 2004-present). Previously, Mr. Wiley served as a member of the Board of Trustees of the University of Tulsa (2000-2006; 2007-2010), as a Senior Energy Advisor of Katzenbach Partners, LLC (consulting, 2006-2007), as an Advisory Director of Riverstone Holdings (private investment), Chairman, President, and CEO of Baker Hughes, Inc. (oilfield services, 2000-2004), and as Director of Spinnaker Exploration Company (exploration and production, 2001-2005). |
+ The information above includes each Trustee's principal occupation during the last five years and other information relating to the experience, attributes, and skills relevant to each Trustee's qualifications to serve as a Trustee, which led to the conclusion that each Trustee should serve as a Trustee for the fund.
Annual Report
Trustees and Officers - continued
Advisory Board Member and Executive Officers:
Correspondence intended for each executive officer and Peter S. Lynch may be sent to Fidelity Investments, 82 Devonshire Street, Boston, Massachusetts 02109.
Name, Age; Principal Occupation |
Peter S. Lynch (66) |
| Year of Election or Appointment: 2003 Member of the Advisory Board of Fidelity's Equity and High Income Funds. Mr. Lynch is Vice Chairman and a Director of FMR and FMR Co., Inc. In addition, Mr. Lynch serves as a Trustee of Boston College and as the Chairman of the Inner-City Scholarship Fund. Previously, Mr. Lynch served on the Special Olympics International Board of Directors (1997-2006). |
Kenneth B. Robins (41) |
| Year of Election or Appointment: 2008 President and Treasurer of Fidelity's Equity and High Income Funds. Mr. Robins also serves as President and Treasurer (2010-
present) and Assistant Treasurer (2009-present) of other Fidelity funds and is an employee of Fidelity Investments (2004-present). Previously, Mr. Robins served as Deputy Treasurer of the Fidelity funds (2005-2008) and Treasurer and Chief Financial Officer of The North Carolina Capital Management Trust: Cash and Term Portfolios (2006-2008). |
Bruce T. Herring (45) |
| Year of Election or Appointment: 2006 Vice President of certain Equity Funds. Mr. Herring also serves as Chief Investment Officer and Director of Fidelity Management & Research (U.K.) Inc. (2010-present) and Group Chief Investments Officer of FMR. Previously, Mr. Herring served as Vice President (2005-2006) and Senior Vice President (2006-2007) of Fidelity Management & Research Company, Vice President of FMR Co., Inc. (2001-2007) and as a portfolio manager for Fidelity U.S. Equity Funds. |
Brian B. Hogan (46) |
| Year of Election or Appointment: 2009 Vice President of certain Equity Funds and Vice President of Sector Funds. Mr. Hogan also serves as President of FMR's Equity Division (2009-present). Previously, Mr. Hogan served as Senior Vice President, Equity Research of FMR (2006-2009) and as a portfolio manager. |
Scott C. Goebel (42) |
| Year of Election or Appointment: 2008 Secretary and Chief Legal Officer (CLO) of the Fidelity funds. Mr. Goebel also serves as Secretary and CLO of The North Carolina Capital Management Trust: Cash and Term Portfolio (2008-present); General Counsel, Secretary, and Senior Vice President of FMR (2008-present) and FMR Co., Inc. (2008-present); Deputy General Counsel of FMR LLC; Chief Legal Officer of Fidelity Management & Research (Hong Kong) Limited (2008-present) and Assistant Secretary of Fidelity Management & Research (Japan) Inc. (2008-present), Fidelity Investments Money Management, Inc. (2008-present), Fidelity Management & Research (U.K.) Inc. (2008-present), and Fidelity Research and Analysis Company (2008-present). Previously, Mr. Goebel served as Assistant Secretary of the Funds (2007-2008) and as Vice President and Secretary of Fidelity Distributors Corporation (FDC) (2005-2007). |
William C. Coffey (41) |
| Year of Election or Appointment: 2009 Assistant Secretary of Fidelity's Equity and High Income Funds. Mr. Coffey also serves as Senior Vice President and Deputy General Counsel of FMR LLC (2010-present), and is an employee of Fidelity Investments. Previously, Mr. Coffey served as Vice President and Associate General Counsel of FMR LLC (2005-2009). |
Holly C. Laurent (56) |
| Year of Election or Appointment: 2008 Anti-Money Laundering (AML) Officer of the Fidelity funds. Ms. Laurent also serves as AML Officer of The North Carolina Capital Management Trust: Cash and Term Portfolio (2008-present) and is an employee of Fidelity Investments. Previously, Ms. Laurent was Senior Vice President and Head of Legal for Fidelity Business Services India Pvt. Ltd. (2006-2008), and Senior Vice President, Deputy General Counsel and Group Head for FMR LLC (2005-2006). |
Christine Reynolds (52) |
| Year of Election or Appointment: 2008 Chief Financial Officer of the Fidelity funds. Ms. Reynolds became President of Fidelity Pricing and Cash Management Services (FPCMS) in August 2008. Ms. Reynolds served as Chief Operating Officer of FPCMS (2007-2008). Previously, Ms. Reynolds served as President, Treasurer, and Anti-Money Laundering officer of the Fidelity funds (2004-2007). |
Kenneth A. Rathgeber (63) |
| Year of Election or Appointment: 2004 Chief Compliance Officer of Fidelity's Equity and High Income Funds. Mr. Rathgeber is Chief Compliance Officer of Fidelity Management & Research (Hong Kong) Limited (2008-present), Fidelity Management & Research (Japan) Inc. (2008-present), FMR (2005-present), FMR Co., Inc. (2005-present), Fidelity Management & Research (U.K.) Inc. (2005-present), Fidelity Research & Analysis Company (2005-present), Fidelity Investments Money Management, Inc. (2005-present), Pyramis Global Advisors, LLC (2005-present), and Strategic Advisers, Inc. (2005-present). |
Jeffrey S. Christian (49) |
| Year of Election or Appointment: 2009 Deputy Treasurer of the Fidelity funds. Mr. Christian is an employee of Fidelity Investments. Previously, Mr. Christian served as Chief Financial Officer (2008-2009) of certain Fidelity funds and Senior Vice President of Fidelity Pricing and Cash Management Services (FPCMS) (2004-2009). |
Bryan A. Mehrmann (49) |
| Year of Election or Appointment: 2005 Deputy Treasurer of the Fidelity funds. Mr. Mehrmann is an employee of Fidelity Investments. |
Adrien E. Deberghes (43) |
| Year of Election or Appointment: 2008 Deputy Treasurer of Fidelity's Equity and High Income Funds. Mr. Deberghes also serves as Assistant Treasurer of other Fidelity funds (2010-present) and is an employee of Fidelity Investments (2008-present). Previously, Mr. Deberghes served as Senior Vice President of Mutual Fund Administration at State Street Corporation (2007-2008), Senior Director of Mutual Fund Administration at Investors Bank & Trust (2005-2007), and Director of Finance for Dunkin' Brands (2000-2005). |
Stephanie J. Dorsey (41) |
| Year of Election or Appointment: 2010 Assistant Treasurer of Fidelity's Equity and High Income Funds. Ms. Dorsey also serves as Deputy Treasurer of other Fidelity funds (2008-present) and is an employee of Fidelity Investments (2008-present). Previously, Ms. Dorsey served as Treasurer (2004-2008) of the JPMorgan Mutual Funds and Vice President (2004-2008) of JPMorgan Chase Bank. |
John R. Hebble (52) |
| Year of Election or Appointment: 2009 Assistant Treasurer of Fidelity's Equity and High Income Funds. Mr. Hebble also serves as Treasurer and Chief Financial Officer of The North Carolina Capital Management Trust: Cash and Term Portfolio (2008-present), President and Treasurer of other Fidelity funds (2008-present) and is an employee of Fidelity Investments. |
Gary W. Ryan (52) |
| Year of Election or Appointment: 2005 Assistant Treasurer of the Fidelity funds. Mr. Ryan is an employee of Fidelity Investments. Previously, Mr. Ryan served as Vice President of Fund Reporting in Fidelity Pricing and Cash Management Services (FPCMS) (1999-2005). |
Jonathan Davis (42) |
| Year of Election or Appointment: 2010 Assistant Treasurer of the Fidelity funds. Mr. Davis is an employee of Fidelity Investments. Previously, Mr. Davis served as Vice President and Associate General Counsel of FMR LLC (2003-2010). |
Annual Report
The Board of Trustees of Fidelity Latin America Fund voted to pay to shareholders of record at the opening of business on record date, the following distributions per share derived from capital gains realized from sales of portfolio securities and dividends derived from net investment income:
| Pay Date | Record Date | Dividends | Capital Gains |
Class A | 12/06/2010 | 12/03/2010 | $0.160 | $0.200 |
Class T | 12/06/2010 | 12/03/2010 | $0.118 | $0.200 |
Class B | 12/06/2010 | 12/03/2010 | $0.040 | $0.200 |
Class C | 12/06/2010 | 12/03/2010 | $0.062 | $0.200 |
Class A designates 100%, Class T designates 100%, Class B designates 100%, and Class C designates 100% of the dividends distributed in September 2010 as amounts which may be taken into account as a dividend for the purposes of the maximum rate under section 1(h)(11) of the Internal Revenue code.
The amounts per share which represent income derived from sources within, and taxes paid to, foreign countries or possessions of the United States are as follows:
| Pay Date | Income | Taxes |
Class A | 09/30/2010 | $0.686 | $0.0948 |
Class T | 09/30/2010 | $0.686 | $0.0948 |
Class B | 09/30/2010 | $0.686 | $0.0948 |
Class C | 09/30/2010 | $0.686 | $0.0948 |
The fund will notify shareholders in January 2011 of amounts for use in preparing 2010 income tax returns.
Annual Report
Board Approval of Investment Advisory Contracts and Management Fees
Fidelity Latin America Fund
Each year, the Board of Trustees, including the Independent Trustees (together, the Board), votes on the renewal of the management contract and sub-advisory agreements (together, the Advisory Contracts) for the fund. The Board, assisted by the advice of fund counsel and Independent Trustees' counsel, requests and considers a broad range of information relevant to the renewal of the Advisory Contracts throughout the year.
The Board meets regularly and considers at each of its meetings factors that are relevant to its annual consideration of the renewal of the fund's Advisory Contracts, including the services and support provided to the fund and its shareholders. The Board has established various standing committees, each composed of Independent Trustees with varying backgrounds, to which the Board has assigned specific subject matter responsibilities in order to enhance effective decision-making by the Board. The Board, acting directly and through its Committees, requests and receives information concerning the annual consideration of the renewal of the fund's Advisory Contracts. The Board also meets as needed to consider matters specifically related to the Board's annual consideration of the renewal of Advisory Contracts. Members of the Board may also meet with trustees of other Fidelity funds through ad hoc joint committees to discuss certain matters relevant to the Fidelity funds.
At its July 2010 meeting, the Board of Trustees, including the Independent Trustees, unanimously determined to renew the fund's Advisory Contracts. In reaching its determination, the Board considered all factors it believed relevant, including (i) the nature, extent, and quality of the services to be provided to the fund and its shareholders (including the investment performance of the fund); (ii) the competitiveness of the fund's management fee and total expenses; (iii) the total costs of the services to be provided by and the profits to be realized by Fidelity from its relationship with the fund; (iv) the extent to which economies of scale would be realized as the fund grows; and (v) whether fee levels reflect these economies of scale, if any, for the benefit of fund shareholders.
In considering whether to renew the Advisory Contracts for the fund, the Board reached a determination, with the assistance of fund counsel and Independent Trustees' counsel and through the exercise of its business judgment, that the renewal of the Advisory Contracts is in the best interests of fund shareholders and that the compensation to be received by Fidelity under the management contract is fair and reasonable. The Board's decision to renew the Advisory Contracts was not based on any single factor noted above, but rather was based on a comprehensive consideration of all the information provided to the Board at its meetings throughout the year. The Board, in reaching its determination to renew the Advisory Contracts, is aware that shareholders in the fund have a broad range of investment choices available to them, including a wide choice among mutual funds offered by Fidelity's competitors, and that the fund's shareholders, with the opportunity to review and weigh the disclosure provided by the fund in its prospectus and other public disclosures, have chosen to invest in this fund, managed by Fidelity.
Nature, Extent, and Quality of Services Provided. The Board considered the staffing within the investment adviser, FMR, and the sub-advisers (together, the Investment Advisers), including the backgrounds of the fund's investment personnel and the fund's investment objective and discipline. The Independent Trustees also had discussions with senior management of Fidelity's investment operations and investment groups. The Board considered the structure of the portfolio manager compensation program and whether this structure provides appropriate incentives to act in the best interest of the fund.
Resources Dedicated to Investment Management and Support Services. The Board and the equity research subcommittee of the Board's Fund Oversight Committee reviewed the size, education, and experience of the Investment Advisers' investment staff, their use of technology, and the Investment Advisers' approach to recruiting, training, and retaining portfolio managers and other research, advisory, and management personnel. The Board noted that Fidelity's analysts have access to a variety of technological tools and market and securities data that enable them to perform both fundamental and quantitative analysis and to specialize in various disciplines. The Board considered Fidelity's extensive global research capabilities that enable the Investment Advisers to aggregate data from various sources in an effort to produce positive investment results. The Board also considered that Fidelity's portfolio managers and analysts have access to daily portfolio attribution that allows for monitoring of a fund's portfolio, as well as an electronic communication system that provides immediate real-time access to research concerning issuers and credit enhancers. The Board noted FMR's continued focus on strengthening the organization and discipline of equity portfolio management and research.
Shareholder and Administrative Services. The Board considered (i) the nature, extent, quality, and cost of advisory, administrative, and shareholder services performed by the Investment Advisers and their affiliates under the Advisory Contracts and under separate agreements covering transfer agency, pricing and bookkeeping, and securities lending services for the fund; (ii) the nature and extent of the investment adviser's supervision of third party service providers, principally custodians and subcustodians; and (iii) the resources devoted to, and the record of compliance with, the fund's compliance policies and procedures. The Board also reviewed the allocation of fund brokerage, including allocations to brokers affiliated with the Investment Advisers, the use of brokerage commissions to pay fund expenses, and the use of "soft" commission dollars to pay for research services.
The Board noted that the growth of fund assets over time across the complex allows Fidelity to reinvest in the development of services designed to enhance the value or convenience of the Fidelity funds as investment vehicles. These services include 24-hour access to account information and market information through phone representatives and over the Internet, and investor education materials and asset allocation tools.
Investment in a Large Fund Family. The Board considered the benefits to shareholders of investing in a Fidelity fund, including the benefits of investing in a fund that is part of a large family of funds offering a variety of investment disciplines and providing a large variety of mutual fund investor services. The Board noted that Fidelity had taken, or had made recommendations that resulted in the Fidelity funds taking, a number of actions over the previous year that benefited particular funds, including (i) dedicating additional resources to investment research and restructuring and broadening the focus of the investment research teams; (ii) bolstering the senior management team that oversees asset management; (iii) launching Class F of certain funds as a lower-fee class available to Freedom K and Freedom Index Funds; (iv) lowering the initial investment minimums and ongoing balance requirements for Real Estate High Income Fund; (v) eliminating subsequent purchase minimums for all funds and adding a waiver of the investment minimum requirement for new accounts opened with the proceeds of a systematic withdrawal plan; (vi) eliminating the withdrawal minimum and maximum limits for systematic withdrawals from Advisor funds; (vii) expanding sales load waivers on Class A shares for Destiny Planholders and expanding Institutional Class eligibility for Class O Destiny Planholders; and (viii) changing certain Class A and Class T sales charge structures to further align them with industry practices.
Annual Report
Board Approval of Investment Advisory Contracts and Management Fees - continued
Investment Performance. The Board considered whether the fund has operated in accordance with its investment objective, as well as its record of compliance with its investment restrictions. It also reviewed the fund's absolute investment performance for the retail class, as well as the fund's relative investment performance for the retail class measured over multiple periods against a broad-based securities market index. The Board noted that FMR does not believe that a meaningful peer group exists against which to compare the fund's performance. The following charts considered by the Board show, over the one-, three-, and five-year periods ended December 31, 2009, the fund's cumulative total returns for the retail class and the cumulative total returns of a broad-based securities market index ("benchmark").
Fidelity Latin America Fund

The Board noted that the investment performance of the fund was lower than its benchmark for all the periods shown. The Board discussed with FMR actions that have been taken by FMR to improve the fund's below-benchmark performance. The Board noted that this fund had underperformed in the previous year and discussed with FMR its disappointment with the continued underperformance of the fund. The Board also reviewed the fund's performance since inception as well as performance in the current year. The Board will continue to closely monitor the performance of the fund in the coming year and discuss with FMR other appropriate actions to address the performance of the fund.
Based on its review, and giving particular weight to the nature and quality of the resources dedicated by the Investment Advisers to maintain and improve relative performance and factoring in the unprecedented market events in recent years, the Board concluded that the nature, extent, and quality of investment management and support services and of shareholder and administrative services provided to the fund will benefit the fund's shareholders, particularly in light of the Board's view that the fund's shareholders benefit from investing in a fund that is part of a large family of funds offering a variety of investment disciplines and services.
Competitiveness of Management Fee and Total Fund Expenses. The Board considered the fund's management fee and total expenses compared to "mapped groups" of competitive funds and classes. Fidelity creates "mapped groups" by combining similar Lipper investment objective categories that have comparable management fee characteristics. Combining Lipper investment objective categories aids the Board's management fee and total expense comparisons by broadening the competitive group used for comparison and by reducing the number of universes to which various Fidelity funds are compared.
Management Fee. The Board considered two proprietary management fee comparisons for the 12-month periods shown in the chart below. The group of Lipper funds used by the Board for management fee comparisons is referred to below as the "Total Mapped Group." The Total Mapped Group comparison focuses on a fund's standing relative to the total universe of comparable funds available to investors, in terms of gross management fees before expense reimbursements or caps, and without giving effect to the fund's performance adjustment. "TMG %" represents the percentage of funds in the Total Mapped Group that had management fees that were lower than the fund's. For example, a TMG % of 7% means that 93% of the funds in the Total Mapped Group had higher management fees than the fund. The "Asset-Size Peer Group" (ASPG) comparison focuses on a fund's standing relative to non-Fidelity funds similar in size to the fund within the Total Mapped Group. The ASPG represents at least 15% of the funds in the Total Mapped Group with comparable asset size and management fee characteristics, subject to a minimum of 50 funds (or all funds in the Total Mapped Group if fewer than 50). Additional information, such as the ASPG quartile in which the fund's management fee ranked and the impact of the fund's performance adjustment, is also included in the chart and considered by the Board.
Annual Report
Fidelity Latin America Fund
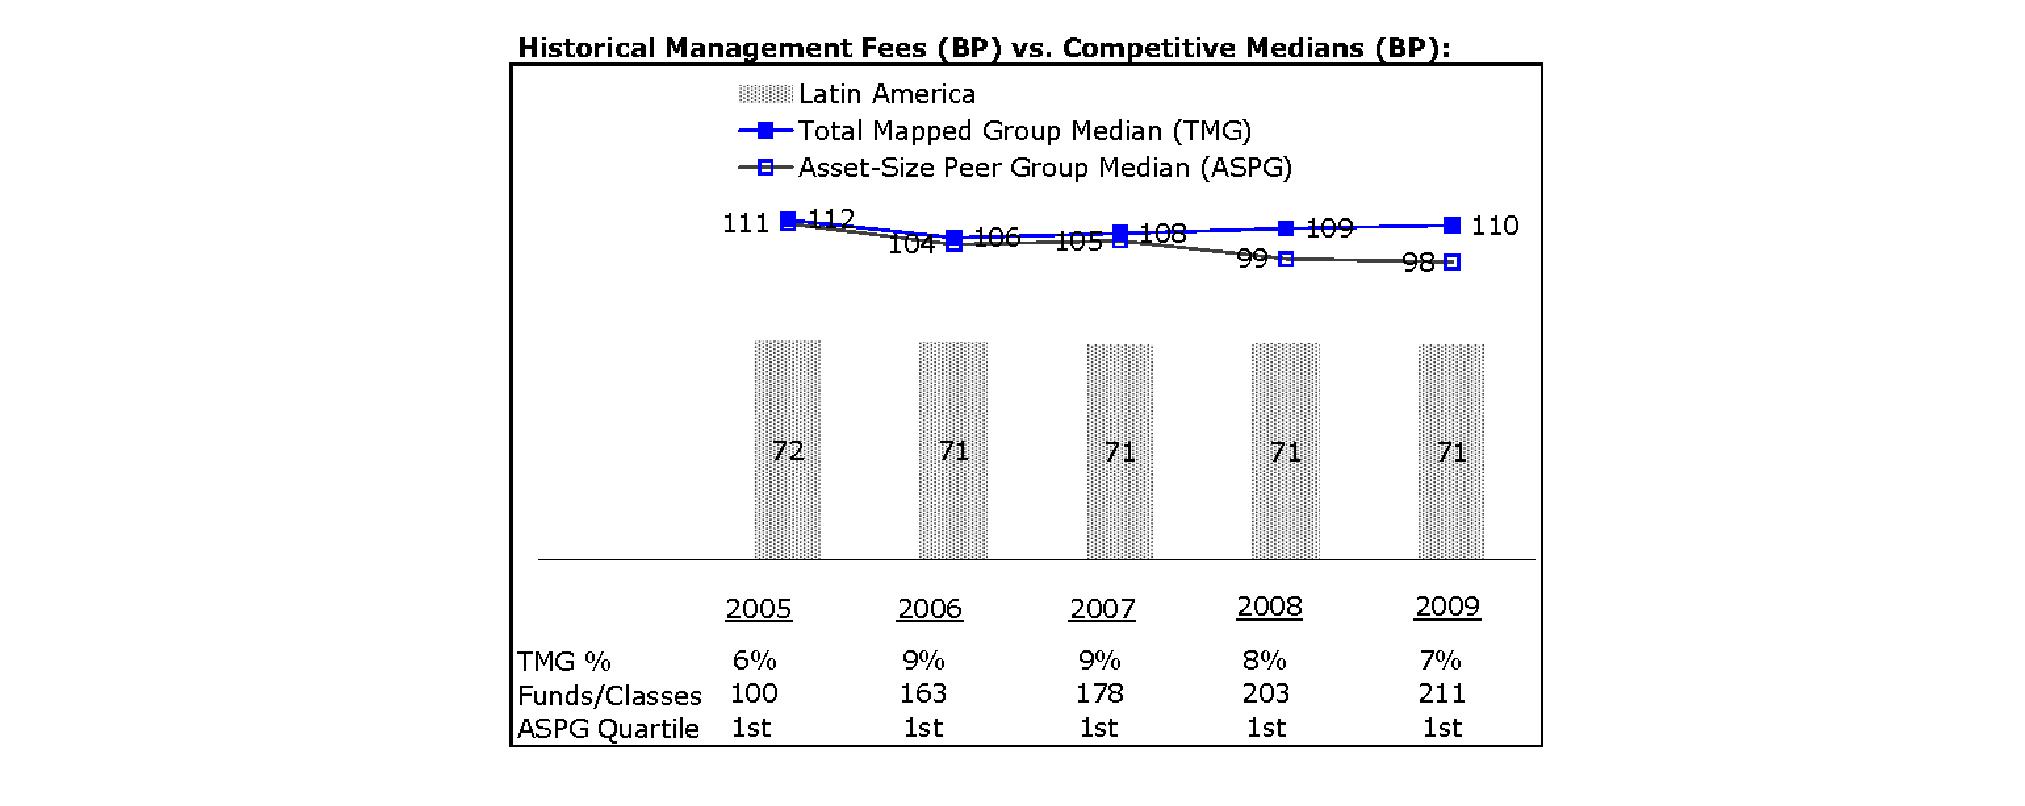
The Board noted that the fund's management fee ranked below the median of its Total Mapped Group and below the median of its ASPG for 2009.
Based on its review, the Board concluded that the fund's management fee is fair and reasonable in light of the services that the fund receives and the other factors considered.
Total Expenses. In its review of the fund's total expenses, the Board considered the fund's management fee as well as other fund expenses, such as transfer agent fees, pricing and bookkeeping fees, and custodial, legal, and audit fees. The Board also noted the effects of any waivers and reimbursements on fees and expenses. As part of its review, the Board also considered current and historical total expenses of each fund compared to competitive fund median expenses. The fund is compared to those funds and classes in the Total Mapped Group (used by the Board for management fee comparisons) that have a similar sales load structure.
The Board noted that the fund's total expenses ranked below its competitive median for 2009.
Fees Charged to Other Fidelity Clients. The Board also considered Fidelity fee structures and other information with respect to clients of FMR and its affiliates, such as other mutual funds advised or subadvised by FMR or its affiliates, pension plan clients, and other institutional clients. In March 2010, the Board created an ad hoc joint committee with the board of other Fidelity funds (the Committee) to review and compare Fidelity's institutional investment advisory business with its business of providing services to the Fidelity funds, including the differences in services provided, fees charged, and costs incurred, as well as competition in their respective marketplaces.
Based on its review of total expenses and fees charged to other Fidelity clients, the Board concluded that the total expenses of each class of the fund were reasonable in light of the services that the fund and its shareholders receive and the other factors considered, including the findings of the Committee.
Costs of the Services and Profitability. The Board considered the revenues earned and the expenses incurred by Fidelity in conducting the business of developing, marketing, distributing, managing, administering and servicing the fund and its shareholders. The Board also considered the level of Fidelity's profits in respect of all the Fidelity funds.
On an annual basis, FMR presents to the Board Fidelity's profitability for the fund. Fidelity calculates the profitability for each fund, as well as aggregate profitability for groups of Fidelity funds and all Fidelity funds, using a series of detailed revenue and cost allocation methodologies which originate with the audited books and records of Fidelity. The Audit Committee of the Board reviews any significant changes from the prior year's methodologies.
Annual Report
Board Approval of Investment Advisory Contracts and Management Fees - continued
PricewaterhouseCoopers LLP (PwC), independent registered public accounting firm and auditor to Fidelity and certain Fidelity funds, has been engaged annually by the Board as part of the Board's assessment of Fidelity's profitability analysis. PwC's engagement includes the review and assessment of Fidelity's methodologies used in determining the revenues and expenses attributable to Fidelity's mutual fund business, and completion of agreed-upon procedures surrounding the mathematical accuracy of fund profitability and its conformity to allocation methodologies. After considering PwC's reports issued under the engagement and information provided by Fidelity, the Board believes that while other allocation methods may also be reasonable, Fidelity's profitability methodologies are reasonable in all material respects.
The Board has also reviewed Fidelity's non-fund businesses and fall-out benefits related to the mutual fund business as well as cases where Fidelity's affiliates may benefit from or be related to the fund's business.
The Board considered the costs of the services provided by and the profits realized by Fidelity in connection with the operation of the fund and were satisfied that the profitability was not excessive in the circumstances.
Economies of Scale. The Board considered whether there have been economies of scale in respect of the management of the Fidelity funds, whether the Fidelity funds (including the fund) have appropriately benefited from any such economies of scale, and whether there is potential for realization of any further economies of scale. The Board considered the extent to which the fund will benefit from economies of scale through increased services to the fund, through waivers or reimbursements, or through fee or expense reductions.
In February 2009, the Board and the board of other Fidelity funds created an ad hoc committee (the Economies of Scale Committee) to analyze whether FMR attains economies of scale in respect of the management and servicing of the Fidelity funds, whether the Fidelity funds have appropriately benefited from such economies of scale, and whether there is potential for realization of any further economies of scale.
The Board recognized that the fund's management contract incorporates a "group fee" structure, which provides for lower group fee rates as total fund assets under FMR's management increase, and for higher group fee rates as total fund assets under FMR's management decrease. FMR calculates the group fee rates based on a tiered asset "breakpoint" schedule that varies based on asset class. The Board considered that the group fee is designed to deliver the benefits of economies of scale to fund shareholders when total Fidelity fund assets increase, even if assets of any particular fund are unchanged or have declined, because some portion of Fidelity's costs are attributable to services provided to all Fidelity funds, and all funds benefit if those costs can be allocated among more assets. The Board concluded that, given the group fee structure, fund shareholders will benefit from lower management fees as assets under FMR's management increase at the fund complex level, regardless of whether Fidelity achieves any such economies of scale.
The Board concluded, considering the findings of the Economies of Scale Committee, that any potential economies of scale are being appropriately shared between fund shareholders and Fidelity.
Additional Information Requested by the Board. In order to develop fully the factual basis for consideration of the Fidelity funds' Advisory Contracts, the Board requested and received additional information on certain topics, including (i) fund performance trends, actions to be taken by FMR to improve certain funds' overall performance, and Fidelity's long-term strategies for certain funds; (ii) portfolio manager changes that have occurred during the past year and length of portfolio manager tenure for different categories of funds over time; (iii) Fidelity's compensation structure for portfolio managers, research analysts, and other key personnel, the rationale for the compensation structure, and how the compensation structure provides appropriate performance incentives; (iv) the amount of the investment that each portfolio manager has made in the Fidelity fund(s) that he or she manages; (v) management and other fees paid by FMR to affiliated sub-advisers on behalf of the Fidelity funds; (vi) Fidelity's fee structures and rationale for recommending different fees among different categories of funds; (vii) Fidelity's rationale for recommending which funds should have a performance adjustment component as part of their management fees; (viii) the rationale for any differences between fund fee structures and fee structures in place for other Fidelity clients; and (ix) explanations regarding the relative total expenses borne by certain funds and classes, total expense competitive trends, and actions that might be taken by FMR to reduce total expenses for certain funds and classes.
Based on its evaluation of all of the conclusions noted above, and after considering all factors it believed relevant, the Board ultimately concluded that the advisory fee structures are fair and reasonable, and that the fund's Advisory Contracts should be renewed.
Annual Report
Investment Adviser
Fidelity Management & Research Company
Boston, MA
Investment Sub-Advisers
FMR Co., Inc.
Fidelity Management & Research
(U.K.) Inc.
Fidelity Research & Analysis Company
FIL Investment Advisors
FIL Investments (Japan) Limited
FIL Investment Advisors
(U.K.) Ltd.
Fidelity Management & Research
(Hong Kong) Limited
Fidelity Management & Research
(Japan) Inc.
General Distributor
Fidelity Distributors Corporation
Boston, MA
Transfer and Service Agents
Fidelity Investments Institutional Operations Company, Inc.
Boston, MA
Fidelity Service Company, Inc.
Boston, MA
Custodian
Brown Brothers Harriman & Co.
Boston, MA
FALAA-UANN-1210
1.917416.100
Fidelity AdvisorSM
Latin America Fund
Institutional Class
Annual Report
October 31, 2010
Institutional Class is a class of
Fidelity® Latin America Fund
(2_fidelity_logos) (Registered_Trademark)
Contents
Chairman's Message | <Click Here> | The Chairman's message to shareholders. |
Performance | <Click Here> | How the fund has done over time. |
Management's Discussion of Fund Performance | <Click Here> | The Portfolio Manager's review of fund performance and strategy. |
Shareholder Expense Example | <Click Here> | An example of shareholder expenses. |
Investment Changes | <Click Here> | A summary of major shifts in the fund's investments over the past six months. |
Investments | <Click Here> | A complete list of the fund's investments with their market values. |
Financial Statements | <Click Here> | Statements of assets and liabilities, operations, and changes in net assets, as well as financial highlights. |
Notes | <Click Here> | Notes to the financial statements. |
Report of Independent Registered Public Accounting Firm | <Click Here> | |
Trustees and Officers | <Click Here> | |
Distributions | <Click Here> | |
Board Approval of Investment Advisory Contracts and Management Fees | <Click Here> | |
To view a fund's proxy voting guidelines and proxy voting record for the 12-month period ended June 30, visit http://www.fidelity.com/proxyvotingresults or visit the Securities and Exchange Commission's (SEC) web site at http://www.sec.gov. You may also call 1-800-544-8544 to request a free copy of the proxy voting guidelines.
Standard & Poor's, S&P and S&P 500 are registered service marks of The McGraw-Hill Companies, Inc. and have been licensed for use by Fidelity Distributors Corporation.
Other third party marks appearing herein are the property of their respective owners.
All other marks appearing herein are registered or unregistered trademarks or service marks of FMR LLC or an affiliated company.
This report and the financial statements contained herein are submitted for the general information of the shareholders of the funds. This report is not authorized for distribution to prospective investors in the funds unless preceded or accompanied by an effective prospectus.
A fund files its complete schedule of portfolio holdings with the SEC for the first and third quarters of each fiscal year on Form N-Q. Forms N-Q are available on the SEC's web site at http://www.sec.gov. A fund's Forms N-Q may be reviewed and copied at the SEC's Public Reference Room in Washington, DC. Information regarding the operation of the SEC's Public Reference Room may be obtained by calling 1-800-SEC-0330. For a complete list of a fund's portfolio holdings, view each fund's most recent holdings listing, semiannual report, or annual report on Fidelity's web site at http://www.fidelity.com or http://www.advisor.fidelity.com, as applicable.
NOT FDIC INSURED • MAY LOSE VALUE • NO BANK GUARANTEE
Neither the funds nor Fidelity Distributors Corporation is a bank.
Annual Report
(photo_of_Edward_C_Johnson_3d)
Dear Shareholder:
Equities have staged a rally in the second half of 2010, shaking off concerns about the European debt crisis and the possibility of a double-dip recession in the U.S. Although the short-term surge pushed major equity indexes back into positive territory for the year, several questions remain about the longer-term outlook, including lackluster economic growth and persistently high unemployment. Financial markets are always unpredictable, of course, but there also are several time-tested investment principles that can help put the odds in your favor.
One of the basic tenets is to invest for the long term. Over time, riding out the markets' inevitable ups and downs has proven much more effective than selling into panic or chasing the hottest trend. Even missing only a few of the markets' best days can significantly diminish investor returns. Patience also affords the benefits of compounding - of earning interest on additional income or reinvested dividends and capital gains. There can be tax advantages and cost benefits to consider as well. While staying the course doesn't eliminate risk, it can considerably lessen the effect of short-term declines.
You can further manage your investing risk through diversification. And today, more than ever, geographic diversification should be taken into account. Studies indicate that asset allocation is the single most important determinant of a portfolio's long-term success. The right mix of stocks, bonds and cash - aligned to your particular risk tolerance and investment objective - is very important. Age-appropriate rebalancing is also an essential aspect of asset allocation. For younger investors, an emphasis on equities - which historically have been the best-performing asset class over time - is encouraged. As investors near their specific goal, such as retirement or sending a child to college, consideration may be given to replacing volatile assets (e.g. common stocks) with more-stable fixed investments (bonds or savings plans).
A third principle - investing regularly - can help lower the average cost of your purchases. Investing a certain amount of money each month or quarter helps ensure you won't pay for all your shares at market highs. This strategy - known as dollar cost averaging - also reduces "emotion" from investing, helping shareholders avoid selling weak performers just prior to an upswing, or chasing a hot performer just before a correction.
We invite you to contact us via the Internet, through our Investor Centers or by phone. It is our privilege to provide you the information you need to make the investments that are right for you.
Sincerely,
(The chairman's signature appears here.)
Edward C. Johnson 3d
Annual Report
Average annual total return reflects the change in the value of an investment, assuming reinvestment of the class' distributions from dividend income and capital gains (the profits earned upon the sale of securities that have grown in value, if any) and assuming a constant rate of performance each year. The $10,000 table and the fund's returns do not reflect the deduction of taxes that a shareholder would pay on fund distributions or the redemption of fund shares. During periods of reimbursement by Fidelity, a fund's total return will be greater than it would be had the reimbursement not occurred. How a fund did yesterday is no guarantee of how it will do tomorrow.
Average Annual Total Returns
Periods ended October 31, 2010 | Past 1
year | Past 5
years | Past 10
years |
Institutional Class A | 25.89% | 17.75% | 17.88% |
A The initial offering of Institutional Class shares took place on September 28, 2010. Returns prior to September 28, 2010 are those of Fidelity Latin America Fund, the original class of the fund.
$10,000 Over 10 Years
Let's say hypothetically that $10,000 was invested in Fidelity AdvisorSM Latin America Fund - Institutional Class on October 31, 2000. The chart shows how the value of your investment would have changed, and also shows how the MSCI® EM (Emerging Markets) - Latin America Index performed over the same period. The initial offering of Institutional Class took place on September 28, 2010. See above for additional information regarding the performance of Institutional Class.
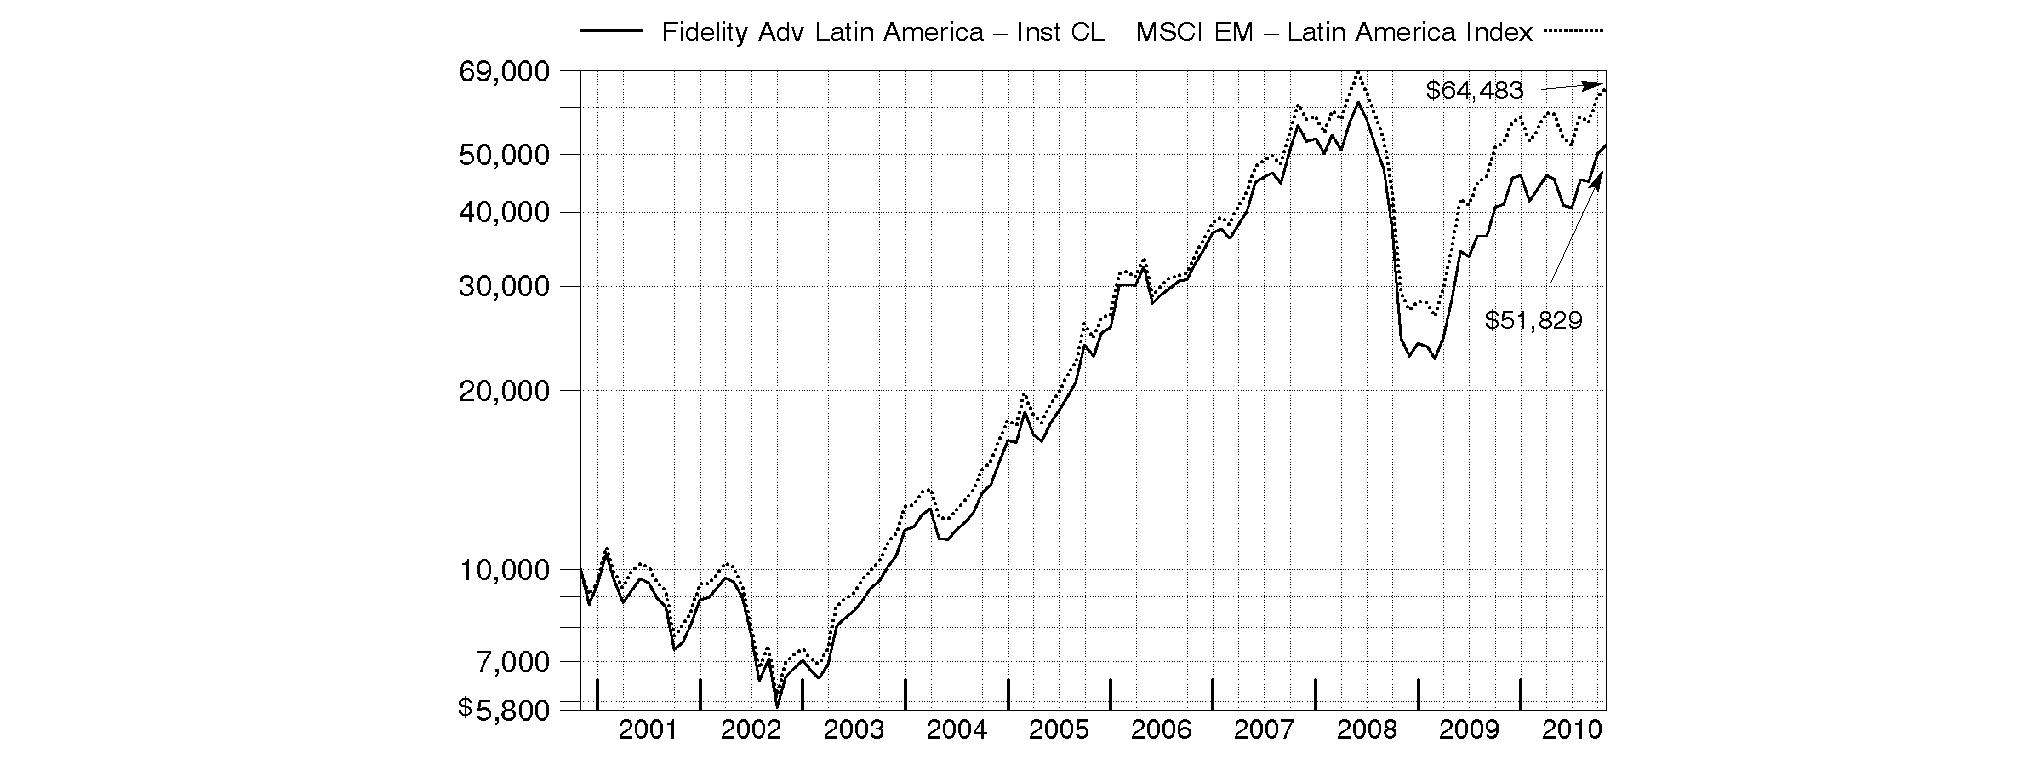
Annual Report
Market Recap: International stocks rode a wave of volatility similar to that of their U.S. counterparts during the 12 months ending October 31, 2010. Stocks gained modestly in the first half of the period, despite growing concerns about the European debt crisis. Sentiment turned decidedly negative in May and June, however, and the market suffered a precipitous decline. These losses were more than offset during the last four months of the period, when signs of economic growth and subsiding debt fears helped propel international stocks about 21%. For the full year, the MSCI® ACWI® (All Country World Index) ex USA Index gained 12.76%, boosted in part by a generally depreciating U.S. dollar. Within the index, Canada and emerging markets were standouts, returning 23% and 24%, respectively. Results in the latter group were led by strong-performing India, Mexico and South Africa, while China fell short of the MSCI benchmark due to cooling economic growth. The developed Asia ex Japan segment rose 16% for the period, lifted by solid results from Singapore and Hong Kong. Meanwhile, Europe rose just 9%, held back mainly by debt-riddled Spain and Italy, as well as lagging major constituent France. Japan returned only 5%, a result of that nation's continued weak economy.
Comments from Adam Kutas, Portfolio Manager of Fidelity AdvisorSM Latin America Fund: For the year, the fund's Institutional Class shares returned 25.89%, outperforming the MSCI EM (Emerging Markets) Latin America Index, which returned 23.75%. Stock selection in materials, consumer staples and health care contributed, as did underweighting the poor-performing energy sector. Conversely, unfavorable stock selection in utilities and underweighting financials hurt. Geographically, the fund benefited from solid picks in Brazil and its positioning in Chile. Underweighting Colombia and weak stock selection in Mexico dampened performance. Overweighting Chilean steel and iron producer CAP and underweighting Brazilian oil giant and major index component Petroleo Brasilerio (Petrobras) boosted performance. Banco Santander Chile also helped, as did four Brazilian companies: airline TAM, dental insurance company and out-of-benchmark holding Odontoprev, and food/beverage/tobacco firms Souza Cruz Industria Comerico and Companhia de Bebidas das Americas. The fund's modest cash position also held back performance amid a strong market. Not owning Mexican copper company and index component Grupo Mexico detracted, as did an investment in Brazilian cable TV company Net Servicos de Comunicacao. Untimely ownership of several firms also curtailed results: Brazilian electric utility Eletrobras, Brazilian brokerage Itausa and Peruvian bank Credicorp. Underweighting Chile's LAN Airlines detracted further. Some stocks I've mentioned were not held at period end.
Note to shareholders: Fidelity Advisor Latin America Fund may invest up to 35% of its total assets in any industry that represents more than 20% of the Latin American market. As of October 31, 2010, the fund did not have more than 25% of its total assets invested in any one industry.
The views expressed above reflect those of the portfolio manager(s) only through the end of the period as stated on the cover of this report and do not necessarily represent the views of Fidelity or any other person in the Fidelity organization. Any such views are subject to change at any time based upon market or other conditions and Fidelity disclaims any responsibility to update such views. These views may not be relied on as investment advice and, because investment decisions for a Fidelity fund are based on numerous factors, may not be relied on as an indication of trading intent on behalf of any Fidelity fund.
Annual Report
Fidelity Latin America Fund
As a shareholder of the Fund, you incur two types of costs: (1) transaction costs, including sales charges (loads) on purchase payments or redemption proceeds, redemption fees, and (2) ongoing costs, including management fees, distribution and/or service (12b-1) fees and other Fund expenses. This Example is intended to help you understand your ongoing costs (in dollars) of investing in the Fund and to compare these costs with the ongoing costs of investing in other mutual funds.
The Example is based on an investment of $1,000 invested at the beginning of the period and held for the entire period (May 1, 2010 to October 31, 2010) for Latin America and for the entire period (September 28, 2010 to October 31, 2010) for Class A,T,B,C and Institutional Class of Latin America.
Actual Expenses
The first line of the accompanying table for each class of the Fund provides information about actual account values and actual expenses. You may use the information in this line, together with the amount you invested, to estimate the expenses that you paid over the period. Simply divide your account value by $1,000.00 (for example, an $8,600 account value divided by $1,000.00 = 8.6), then multiply the result by the number in the first line for a class of the Fund under the heading entitled "Expenses Paid During Period" to estimate the expenses you paid on your account during this period. A small balance maintenance fee of $12.00 that is charged once a year may apply for certain accounts with a value of less than $2,000. This fee is not included in the table below. If it was, the estimate of expenses you paid during the period would be higher, and your ending account value lower, by this amount. In addition, the Fund, as a shareholder in the underlying Fidelity Central Funds, will indirectly bear its pro-rata share of the fees and expenses incurred by the underlying Fidelity Central Funds. These fees and expenses are not included in the Fund's annualized expense ratio used to calculate the expense estimate in the table below.
Hypothetical Example for Comparison Purposes
The second line of the accompanying table for each class of the Fund provides information about hypothetical account values and hypothetical expenses based on a Class' actual expense ratio and an assumed rate of return of 5% per year before expenses, which is not the Class' actual return. The hypothetical account values and expenses may not be used to estimate the actual ending account balance or expenses you paid for the period. You may use this information to compare the ongoing costs of investing in the Fund and other funds. To do so, compare this 5% hypothetical example with the 5% hypothetical examples that appear in the shareholder reports of the other funds. A small balance maintenance fee of $12.00 that is charged once a year may apply for certain accounts with a value of less than $2,000. This fee is not included in the table below. If it was, the estimate of expenses you paid during the period would be higher, and your ending account value lower, by this amount. In addition, the Fund, as a shareholder in the underlying Fidelity Central Funds, will indirectly bear its pro-rata share of the fees and expenses incurred by the underlying Fidelity Central Funds. These fees and expenses are not included in the Fund's annualized expense ratio used to calculate the expense estimate in the table below.
Please note that the expenses shown in the table are meant to highlight your ongoing costs only and do not reflect any transaction costs. Therefore, the second line of the table is useful in comparing ongoing costs only, and will not help you determine the relative total costs of owning different funds. In addition, if these transactional costs were included, your costs would have been higher.
| Annualized
Expense Ratio | Beginning
Account Value | Ending
Account Value
October 31, 2010 | Expenses Paid
During Period |
Class A | 1.37% | | | |
Actual | | $ 1,000.00 | $ 1,051.40 | $ 1.31 B |
Hypothetical A | | $ 1,000.00 | $ 1,018.30 | $ 6.97 C |
Class T | 1.63% | | | |
Actual | | $ 1,000.00 | $ 1,051.20 | $ 1.56 B |
Hypothetical A | | $ 1,000.00 | $ 1,016.99 | $ 8.29 C |
Class B | 2.12% | | | |
Actual | | $ 1,000.00 | $ 1,050.60 | $ 2.02 B |
Hypothetical A | | $ 1,000.00 | $ 1,014.52 | $ 10.76 C |
Class C | 2.09% | | | |
Actual | | $ 1,000.00 | $ 1,050.60 | $ 2.00 B |
Hypothetical A | | $ 1,000.00 | $ 1,014.67 | $ 10.61 C |
Latin America | 1.04% | | | |
Actual | | $ 1,000.00 | $ 1,141.90 | $ 5.61 B |
Hypothetical A | | $ 1,000.00 | $ 1,019.96 | $ 5.30 C |
Institutional Class | 1.08% | | | |
Actual | | $ 1,000.00 | $ 1,051.50 | $ 1.03 B |
Hypothetical A | | $ 1,000.00 | $ 1,019.76 | $ 5.50 C |
A 5% return per year before expenses
B Actual expenses are equal to each Class' annualized expense ratio, multiplied by the average account value over the period, multiplied by 184/365 (to reflect the one-half year period) for Latin America and multiplied by 34/365 (to reflect the period September 28, 2010 to October 31, 2010) for Class A,T,B,C and Institutional Class of Latin America.
C Hypothetical expenses are equal to each Class' annualized expense ratio, multiplied by the average account value over the period, multiplied by 184/365 (to reflect the one-half year period).
Annual Report
Fidelity Latin America Fund
Investment Changes (Unaudited)
Geographic Diversification (% of fund's net assets) |
As of October 31, 2010 |
| Brazil | 59.9% | |
| Mexico | 15.9% | |
| Chile | 11.9% | |
| United States of America | 3.7% | |
| Colombia | 3.3% | |
| Peru | 2.0% | |
| Luxembourg | 1.3% | |
| Bermuda | 1.1% | |
| Bahamas (Nassau) | 0.5% | |
| Other | 0.4% | |

Percentages are adjusted for the effect of futures contracts, if applicable. |
As of April 30, 2010 |
| Brazil | 62.4% | |
| Mexico | 19.3% | |
| Chile | 9.5% | |
| United States of America | 3.9% | |
| Luxembourg | 1.6% | |
| Peru | 1.6% | |
| Panama | 0.9% | |
| Colombia | 0.3% | |
| Bahamas (Nassau) | 0.2% | |
| Other | 0.3% | |

Percentages are adjusted for the effect of futures contracts, if applicable. |
Asset Allocation |
| % of fund's
net assets | % of fund's net assets
6 months ago |
Stocks | 98.2 | 97.6 |
Short-Term Investments and Net Other Assets | 1.8 | 2.4 |
Top Ten Stocks as of October 31, 2010 |
| % of fund's
net assets | % of fund's net assets
6 months ago |
Itau Unibanco Banco Multiplo SA ADR (Brazil, Commercial Banks) | 8.6 | 8.5 |
America Movil SAB de CV Series L sponsored ADR (Mexico, Wireless Telecommunication Services) | 7.6 | 7.8 |
Vale SA (PN-A) sponsored ADR (Brazil, Metals & Mining) | 6.0 | 9.5 |
Petroleo Brasileiro SA - Petrobras (PN) (non-vtg.) (Brazil, Oil, Gas & Consumable Fuels) | 5.6 | 7.5 |
Petroleo Brasileiro SA - Petrobras (ON) sponsored ADR (Brazil, Oil, Gas & Consumable Fuels) | 4.2 | 5.9 |
Companhia de Bebidas das Americas (AmBev) (PN) sponsored ADR (Brazil, Beverages) | 4.1 | 2.6 |
Wal-Mart de Mexico SA de CV Series V (Mexico, Food & Staples Retailing) | 3.7 | 3.3 |
Vale SA sponsored ADR (Brazil, Metals & Mining) | 3.5 | 3.5 |
CAP SA (Chile, Metals & Mining) | 3.3 | 2.7 |
Banco Santander Chile sponsored ADR (Chile, Commercial Banks) | 2.7 | 2.0 |
| 49.3 | |
Market Sectors as of October 31, 2010 |
| % of fund's
net assets | % of fund's net assets
6 months ago |
Financials | 21.2 | 15.5 |
Materials | 19.3 | 22.5 |
Consumer Staples | 16.6 | 13.0 |
Energy | 13.2 | 14.9 |
Telecommunication Services | 11.3 | 12.1 |
Utilities | 6.0 | 7.2 |
Consumer Discretionary | 5.7 | 5.7 |
Industrials | 3.5 | 6.1 |
Health Care | 1.0 | 0.6 |
Information Technology | 0.4 | 0.0 |
Annual Report
Fidelity Latin America Fund
Investments October 31, 2010
Showing Percentage of Net Assets
Common Stocks - 98.2% |
| Shares | | Value |
Bahamas (Nassau) - 0.5% |
Petrominerales Ltd. (d) | 868,800 | | $ 22,258,794 |
Bermuda - 1.1% |
Credicorp Ltd. (NY Shares) | 384,100 | | 48,350,508 |
Brazil - 59.9% |
AES Tiete SA (PN) (non-vtg.) | 6,083,145 | | 83,852,428 |
Banco Bradesco SA: | | | |
(PN) | 3,290,316 | | 67,790,722 |
(PN) sponsored ADR (d) | 5,543,722 | | 115,309,418 |
BR Malls Participacoes SA | 1,736,800 | | 16,590,054 |
Brascan Residential Properties SA | 7,648,900 | | 41,634,619 |
Brasil Foods SA | 1,630,700 | | 23,657,228 |
Brasil Insurance Participacoes e Administracao SA (a) | 7,700 | | 6,110,393 |
Centrais Eletricas Brasileiras SA (Electrobras): | | | |
(PN-B) sponsored ADR (d) | 986,165 | | 16,123,798 |
sponsored ADR | 843,700 | | 11,786,489 |
Companhia de Bebidas das Americas (AmBev): | | | |
(PN) sponsored ADR (d) | 1,320,026 | | 183,800,420 |
sponsored ADR (d) | 70,505 | | 7,984,691 |
Companhia de Concessoes Rodoviarias | 1,974,700 | | 53,395,368 |
Companhia de Saneamento de Minas Gerais | 63,876 | | 979,993 |
CPFL Energia SA sponsored ADR (d) | 420,967 | | 30,238,060 |
Drogasil SA | 441,000 | | 11,154,614 |
Eletropaulo Metropolitana SA (PN-B) | 802,120 | | 14,003,623 |
Gerdau SA | 390,500 | | 3,879,291 |
Gerdau SA sponsored ADR (d) | 682,800 | | 8,903,712 |
Itau Unibanco Banco Multiplo SA | 3,585,931 | | 87,477,155 |
Itau Unibanco Banco Multiplo SA: | | | |
ADR | 11,649,603 | | 286,114,250 |
ADR (a)(e) | 590,300 | | 14,497,768 |
Itausa-Investimentos Itau SA (PN) | 4,987,700 | | 39,550,948 |
Light SA | 695,700 | | 8,759,637 |
Lojas Americanas SA (PN) | 6,847,300 | | 73,616,927 |
Lojas Renner SA | 453,600 | | 17,917,893 |
Multiplan Empreendimentos Imobiliarios SA | 848,000 | | 19,440,395 |
Multiplus SA | 1,836,300 | | 31,195,080 |
Net Servicos de Comunicacao SA (PN) (a) | 5,225,440 | | 70,278,666 |
Odontoprev SA | 3,079,600 | | 45,256,290 |
OGX Petroleo e Gas Participacoes SA (a) | 4,974,700 | | 65,268,813 |
Petroleo Brasileiro SA - Petrobras: | | | |
(ON) | 938,228 | | 15,745,597 |
(ON) sponsored ADR | 5,079,420 | | 173,309,810 |
(PN) (non-vtg.) | 9,078,671 | | 137,951,825 |
(PN) sponsored ADR (non-vtg.) (d) | 3,646,533 | | 113,735,364 |
Souza Cruz Industria Comerico | 2,115,100 | | 108,676,752 |
TAM SA (PN) sponsored ADR (ltd. vtg.) | 2,776,336 | | 68,492,209 |
TIM Participacoes SA | 6,855,400 | | 22,445,672 |
|
| Shares | | Value |
TIM Participacoes SA sponsored ADR (non-vtg.) (d) | 1,621,511 | | $ 52,309,945 |
Usinas Siderurgicas de Minas Gerais SA - Usiminas | 1,195,650 | | 17,430,120 |
Usinas Siderurgicas de Minas Gerais SA - Usiminas (PN-A) (non-vtg.) | 3,663,500 | | 45,718,378 |
Vale SA: | | | |
(PN-A) | 1,813,500 | | 50,902,084 |
(PN-A) sponsored ADR | 7,709,345 | | 221,489,482 |
sponsored ADR | 4,963,500 | | 159,526,890 |
Vivo Participacoes SA: | | | |
(PN) | 806,938 | | 23,242,395 |
sponsored ADR | 1,310,041 | | 37,519,574 |
TOTAL BRAZIL | | 2,705,064,840 |
Canada - 0.3% |
Silver Standard Resources, Inc. (a) | 506,800 | | 12,305,108 |
Chile - 11.9% |
Banco Santander Chile sponsored ADR | 1,323,100 | | 122,571,984 |
CAP SA | 2,940,288 | | 149,674,298 |
Cencosud SA | 6,940,914 | | 54,190,647 |
Compania Cervecerias Unidas SA | 3,869,596 | | 43,114,181 |
Compania Cervecerias Unidas SA sponsored ADR | 241,700 | | 13,595,625 |
Empresa Nacional de Electricidad SA | 7,518,537 | | 13,234,103 |
Empresas La Polar SA | 1,801,860 | | 12,851,907 |
Enersis SA | 45,750,203 | | 20,903,025 |
Enersis SA sponsored ADR | 2,878,372 | | 65,655,665 |
SACI Falabella | 4,206,229 | | 42,135,389 |
TOTAL CHILE | | 537,926,824 |
Colombia - 3.3% |
BanColombia SA sponsored ADR | 1,090,000 | | 73,520,500 |
Bolsa de Valores de Colombia | 385,727,359 | | 9,479,081 |
Ecopetrol SA | 27,756,465 | | 66,550,312 |
Ecopetrol SA ADR | 29,300 | | 1,398,782 |
TOTAL COLOMBIA | | 150,948,675 |
Luxembourg - 1.3% |
Millicom International Cellular SA | 322,113 | | 30,471,890 |
Ternium SA sponsored ADR | 867,307 | | 29,731,284 |
TOTAL LUXEMBOURG | | 60,203,174 |
Mexico - 15.9% |
America Movil SAB de CV: | | | |
Series L | 2,590,600 | | 7,425,387 |
Series L sponsored ADR | 5,867,205 | | 335,956,158 |
Banco Compartamos SA de CV | 1,219,100 | | 8,636,011 |
Bolsa Mexicana de Valores SA de CV (d) | 14,054,300 | | 25,558,445 |
Coca-Cola FEMSA SAB de CV sponsored ADR | 449,000 | | 35,682,030 |
Fomento Economico Mexicano SAB de CV sponsored ADR | 225,258 | | 12,368,917 |
Common Stocks - continued |
| Shares | | Value |
Mexico - continued |
Grupo Bimbo Sab de CV Series A | 659,600 | | $ 5,084,322 |
Grupo Comercial Chedraui de CV (a) | 5,790,100 | | 18,729,160 |
Grupo Modelo SAB de CV Series C | 5,980,200 | | 33,487,764 |
Industrias Penoles SA de CV | 1,201,630 | | 34,040,265 |
Kimberly-Clark de Mexico SA de CV Series A | 5,066,800 | | 31,794,421 |
Wal-Mart de Mexico SA de CV
Series V | 61,686,670 | | 168,719,948 |
TOTAL MEXICO | | 717,482,828 |
Panama - 0.1% |
Copa Holdings SA Class A | 79,300 | | 4,022,889 |
Peru - 2.0% |
Compania de Minas Buenaventura SA sponsored ADR | 1,710,200 | | 90,709,008 |
United States of America - 1.9% |
First Cash Financial Services, Inc. (a) | 664,608 | | 19,320,155 |
Mercadolibre, Inc. (a)(d) | 269,000 | | 17,788,970 |
Southern Copper Corp. | 1,155,100 | | 49,438,280 |
TOTAL UNITED STATES OF AMERICA | | 86,547,405 |
TOTAL COMMON STOCKS (Cost $2,312,779,474) | 4,435,820,053 |
Money Market Funds - 3.5% |
| Shares | | Value |
Fidelity Cash Central Fund, 0.23% (b) | 53,737,385 | | $ 53,737,385 |
Fidelity Securities Lending Cash Central Fund, 0.24% (b)(c) | 102,683,905 | | 102,683,905 |
TOTAL MONEY MARKET FUNDS (Cost $156,421,290) | 156,421,290 |
TOTAL INVESTMENT PORTFOLIO - 101.7% (Cost $2,469,200,764) | | 4,592,241,343 |
NET OTHER ASSETS (LIABILITIES) - (1.7)% | | (74,745,375) |
NET ASSETS - 100% | $ 4,517,495,968 |
Legend |
(a) Non-income producing |
(b) Affiliated fund that is available only to investment companies and other accounts managed by Fidelity Investments. The rate quoted is the annualized seven-day yield of the fund at period end. A complete unaudited listing of the fund's holdings as of its most recent quarter end is available upon request. In addition, each Fidelity Central Fund's financial statements, which are not covered by the Fund's report of Independent Registered Public Accounting Firm, are available on the SEC's website or upon request. |
(c) Investment made with cash collateral received from securities on loan. |
(d) Security or a portion of the security is on loan at period end. |
(e) Security exempt from registration under Rule 144A of the Securities Act of 1933. These securities may be resold in transactions exempt from registration, normally to qualified institutional buyers. At the end of the period, the value of these securities amounted to $14,497,768 or 0.3% of net assets. |
Affiliated Central Funds |
Information regarding fiscal year to date income earned by the Fund from investments in Fidelity Central Funds is as follows: |
Fund | Income earned |
Fidelity Cash Central Fund | $ 84,184 |
Fidelity Securities Lending Cash Central Fund | 586,004 |
Total | $ 670,188 |
Other Information |
The following is a summary of the inputs used, as of October 31, 2010, involving the Fund's assets and liabilities carried at fair value. The inputs or methodology used for valuing securities may not be an indication of the risk associated with investing in those securities. For more information on valuation inputs, and their aggregation into the levels used in the table below, please refer to the Security Valuation section in the accompanying Notes to Financial Statements. |
Valuation Inputs at Reporting Date: |
Description | Total | Level 1 | Level 2 | Level 3 |
Investments in Securities: | | | | |
Equities: | | | | |
Brazil | $ 2,705,064,840 | $ 2,698,954,447 | $ 6,110,393 | $ - |
Mexico | 717,482,828 | 717,482,828 | - | - |
Chile | 537,926,824 | 537,926,824 | - | - |
Colombia | 150,948,675 | 150,948,675 | - | - |
Peru | 90,709,008 | 90,709,008 | - | - |
United States of America | 86,547,405 | 86,547,405 | - | - |
Luxembourg | 60,203,174 | 60,203,174 | - | - |
Bermuda | 48,350,508 | 48,350,508 | - | - |
Bahamas (Nassau) | 22,258,794 | 22,258,794 | - | - |
Other | 16,327,997 | 16,327,997 | - | - |
Money Market Funds | 156,421,290 | 156,421,290 | - | - |
Total Investments in Securities: | $ 4,592,241,343 | $ 4,586,130,950 | $ 6,110,393 | $ - |
Income Tax Information |
At October 31, 2010, the Fund had a capital loss carryforward of approximately $425,993,249 of which $18,806,576, $31,200,847 and $375,985,826 will expire on October 31, 2015, 2016 and 2017, respectively. Capital loss carryforwards are only available to offset future capital gains of the Fund to the extent provided by regulations and may be limited. |
The capital loss carryforward expiring October 31, 2015 and October 31, 2016 were acquired from Fidelity Advisor Latin America Fund. |
See accompanying notes which are an integral part of the financial statements.
Annual Report
Fidelity Latin America Fund
Financial Statements
Statement of Assets and Liabilities
| October 31, 2010 |
| | |
Assets | | |
Investment in securities, at value (including securities loaned of $101,291,620) - See accompanying schedule: Unaffiliated issuers (cost $2,312,779,474) | $ 4,435,820,053 | |
Fidelity Central Funds (cost $156,421,290) | 156,421,290 | |
Total Investments (cost $2,469,200,764) | | $ 4,592,241,343 |
Foreign currency held at value (cost $10,492,341) | | 10,469,243 |
Receivable for investments sold | | 17,239,484 |
Receivable for fund shares sold | | 4,585,338 |
Dividends receivable | | 14,057,987 |
Distributions receivable from Fidelity Central Funds | | 53,766 |
Other receivables | | 570,099 |
Total assets | | 4,639,217,260 |
| | |
Liabilities | | |
Payable for investments purchased | $ 10,996,858 | |
Payable for fund shares redeemed | 3,880,116 | |
Accrued management fee | 2,634,325 | |
Distribution and service plan fees payable | 91,638 | |
Other affiliated payables | 877,009 | |
Other payables and accrued expenses | 557,441 | |
Collateral on securities loaned, at value | 102,683,905 | |
Total liabilities | | 121,721,292 |
| | |
Net Assets | | $ 4,517,495,968 |
Net Assets consist of: | | |
Paid in capital | | $ 2,836,057,819 |
Undistributed net investment income | | 12,014,368 |
Accumulated undistributed net realized gain (loss) on investments and foreign currency transactions | | (453,630,606) |
Net unrealized appreciation (depreciation) on investments and assets and liabilities in foreign currencies | | 2,123,054,387 |
Net Assets | | $ 4,517,495,968 |
Statement of Assets and Liabilities - continued
| October 31, 2010 |
| | |
Calculation of Maximum Offering Price Class A:
Net Asset Value and redemption price per share ($115,625,689 ÷ 2,011,628 shares) | | $ 57.48 |
| | |
Maximum offering price per share (100/94.25 of $57.48) | | $ 60.99 |
Class T:
Net Asset Value and redemption price per share ($36,820,312 ÷ 640,743 shares) | | $ 57.47 |
| | |
Maximum offering price per share (100/96.50 of $57.47) | | $ 59.55 |
Class B:
Net Asset Value and offering price per share ($20,391,715 ÷ 355,023 shares)A | | $ 57.44 |
| | |
Class C:
Net Asset Value and offering price per share ($48,328,614 ÷ 841,390 shares)A | | $ 57.44 |
| | |
Latin America:
Net Asset Value, offering price and redemption price per share ($4,283,461,984 ÷ 74,497,448 shares) | | $ 57.50 |
| | |
Institutional Class:
Net Asset Value, offering price and redemption price per share ($12,867,654 ÷ 223,808 shares) | | $ 57.49 |
A Redemption price per share is equal to net asset value less any applicable contingent deferred sales charge.
See accompanying notes which are an integral part of the financial statements.
Annual Report
Fidelity Latin America Fund
Financial Statements - continued
Statement of Operations
| Year ended October 31, 2010 |
| | |
Investment Income | | |
Dividends | | $ 140,582,424 |
Interest | | 616 |
Income from Fidelity Central Funds | | 670,188 |
Income before foreign taxes withheld | | 141,253,228 |
Less foreign taxes withheld | | (11,229,284) |
Total income | | 130,023,944 |
| | |
Expenses | | |
Management fee | $ 29,682,512 | |
Transfer agent fees | 9,142,613 | |
Distribution and service plan fees | 91,835 | |
Accounting and security lending fees | 1,584,130 | |
Custodian fees and expenses | 2,502,166 | |
Independent trustees' compensation | 23,783 | |
Registration fees | 191,852 | |
Audit | 73,353 | |
Legal | 20,416 | |
Interest | 8,537 | |
Miscellaneous | 54,353 | |
Total expenses before reductions | 43,375,550 | |
Expense reductions | (1,043,771) | 42,331,779 |
Net investment income (loss) | | 87,692,165 |
Realized and Unrealized Gain (Loss) Net realized gain (loss) on: | | |
Investment securities: | | |
Unaffiliated issuers | 297,443,270 | |
Capital gain distributions from Fidelity Central Funds | 16,900 | |
Foreign currency transactions | (3,949,502) | |
Total net realized gain (loss) | | 293,510,668 |
Change in net unrealized appreciation (depreciation) on: Investment securities | 519,646,669 | |
Assets and liabilities in foreign currencies | (463,211) | |
Total change in net unrealized appreciation (depreciation) | | 519,183,458 |
Net gain (loss) | | 812,694,126 |
Net increase (decrease) in net assets resulting from operations | | $ 900,386,291 |
Statement of Changes in Net Assets
| Year ended
October 31,
2010 | Year ended
October 31,
2009 |
Increase (Decrease) in Net Assets | | |
Operations | | |
Net investment income (loss) | $ 87,692,165 | $ 57,543,805 |
Net realized gain (loss) | 293,510,668 | (469,604,930) |
Change in net unrealized appreciation (depreciation) | 519,183,458 | 1,902,747,452 |
Net increase (decrease) in net assets resulting from operations | 900,386,291 | 1,490,686,327 |
Distributions to shareholders from net investment income | (118,560,409) | (34,726,095) |
Distributions to shareholders from net realized gain | (33,986,366) | - |
Total distributions | (152,546,775) | (34,726,095) |
Share transactions - net increase (decrease) | (275,675,234) | 360,846,005 |
Redemption fees | 1,583,234 | 1,335,831 |
Total increase (decrease) in net assets | 473,747,516 | 1,818,142,068 |
| | |
Net Assets | | |
Beginning of period | 4,043,748,452 | 2,225,606,384 |
End of period (including undistributed net investment income of $12,014,368 and undistributed net investment income of $42,882,612, respectively) | $ 4,517,495,968 | $ 4,043,748,452 |
See accompanying notes which are an integral part of the financial statements.
Annual Report
Financial Highlights - Class A
Period ended October 31, | 2010 H |
Selected Per-Share Data | |
Net asset value, beginning of period | $ 55.47 |
Income from Investment Operations | |
Net investment income (loss) E | .02 |
Net realized and unrealized gain (loss) | 2.79 |
Total from investment operations | 2.81 |
Distributions from net investment income | (.80) |
Redemption fees added to paid in capital E,K | - |
Net asset value, end of period | $ 57.48 |
Total Return B,C,D | 5.14% |
Ratios to Average Net Assets F,I | |
Expenses before reductions | 1.37% A |
Expenses net of fee waivers, if any | 1.37% A |
Expenses net of all reductions | 1.34% A |
Net investment income (loss) | .39% A |
Supplemental Data | |
Net assets, end of period (000 omitted) | $ 115,626 |
Portfolio turnover rate G | 56% J |
A Annualized
B Total returns for periods of less than one year are not annualized.
C Total returns would have been lower had certain expenses not been reduced during the periods shown.
D Total returns do not include the effect of the sales charges.
E Calculated based on average shares outstanding during the period.
F Fees and expenses of the underlying Fidelity Central Funds are not included in the Fund's expense ratio. The Fund indirectly bears its proportionate share of the expenses of any underlying Fidelity Central Funds.
G Amount does not include the portfolio activity of any underlying Fidelity Central Funds.
H For the period September 28, 2010 (commencement of sale of shares) to October 31, 2010.
I Expense ratios reflect operating expenses of the class. Expenses before reductions do not reflect amounts reimbursed by the investment adviser or reductions from brokerage service arrangements or reductions from other expense offset arrangements and do not represent the amount paid by the class during periods when reimbursements or reductions occur. Expense ratios before reductions for start-up periods may not be representative of longer-term operating periods. Expenses net of fee waivers reflect expenses after reimbursement by the investment adviser but prior to reductions from brokerage service arrangements or other expense offset arrangements. Expenses net of all reductions represent the net expenses paid by the class.
J The portfolio turnover rate does not include the assets acquired in the merger.
K Amount represents less than $.01 per share.
Financial Highlights - Class T
Period ended October 31, | 2010 H |
Selected Per-Share Data | |
Net asset value, beginning of period | $ 55.47 |
Income from Investment Operations | |
Net investment income (loss) E | .01 |
Net realized and unrealized gain (loss) | 2.79 |
Total from investment operations | 2.80 |
Distributions from net investment income | (.80) |
Redemption fees added to paid in capital E,K | - |
Net asset value, end of period | $ 57.47 |
Total Return B,C,D | 5.12% |
Ratios to Average Net Assets F,I | |
Expenses before reductions | 1.63% A |
Expenses net of fee waivers, if any | 1.63% A |
Expenses net of all reductions | 1.60% A |
Net investment income (loss) | .13% A |
Supplemental Data | |
Net assets, end of period (000 omitted) | $ 36,820 |
Portfolio turnover rate G | 56% J |
A Annualized
B Total returns for periods of less than one year are not annualized.
C Total returns would have been lower had certain expenses not been reduced during the periods shown.
D Total returns do not include the effect of the sales charges.
E Calculated based on average shares outstanding during the period.
F Fees and expenses of the underlying Fidelity Central Funds are not included in the Fund's expense ratio. The Fund indirectly bears its proportionate share of the expenses of any underlying Fidelity Central Funds.
G Amount does not include the portfolio activity of any underlying Fidelity Central Funds.
H For the period September 28, 2010 (commencement of sale of shares) to October 31, 2010.
I Expense ratios reflect operating expenses of the class. Expenses before reductions do not reflect amounts reimbursed by the investment adviser or reductions from brokerage service arrangements or reductions from other expense offset arrangements and do not represent the amount paid by the class during periods when reimbursements or reductions occur. Expense ratios before reductions for start-up periods may not be representative of longer-term operating periods. Expenses net of fee waivers reflect expenses after reimbursement by the investment adviser but prior to reductions from brokerage service arrangements or other expense offset arrangements. Expenses net of all reductions represent the net expenses paid by the class.
J The portfolio turnover rate does not include the assets acquired in the merger.
K Amount represents less than $.01 per share.
See accompanying notes which are an integral part of the financial statements.
Annual Report
Financial Highlights - Class B
Period ended October 31, | 2010 H |
Selected Per-Share Data | |
Net asset value, beginning of period | $ 55.47 |
Income from Investment Operations | |
Net investment income (loss) E | (.02) |
Net realized and unrealized gain (loss) | 2.79 |
Total from investment operations | 2.77 |
Distributions from net investment income | (.80) |
Redemption fees added to paid in capital E,K | - |
Net asset value, end of period | $ 57.44 |
Total Return B,C,D | 5.06% |
Ratios to Average Net Assets F,I | |
Expenses before reductions | 2.12% A |
Expenses net of fee waivers, if any | 2.12% A |
Expenses net of all reductions | 2.10% A |
Net investment income (loss) | (.36)% A |
Supplemental Data | |
Net assets, end of period (000 omitted) | $ 20,392 |
Portfolio turnover rate G | 56% J |
A Annualized
B Total returns for periods of less than one year are not annualized.
C Total returns would have been lower had certain expenses not been reduced during the periods shown.
D Total returns do not include the effect of the contingent deferred sales charge.
E Calculated based on average shares outstanding during the period.
F Fees and expenses of the underlying Fidelity Central Funds are not included in the Fund's expense ratio. The Fund indirectly bears its proportionate share of the expenses of any underlying Fidelity Central Funds.
G Amount does not include the portfolio activity of any underlying Fidelity Central Funds.
H For the period September 28, 2010 (commencement of sale of shares) to October 31, 2010.
I Expense ratios reflect operating expenses of the class. Expenses before reductions do not reflect amounts reimbursed by the investment adviser or reductions from brokerage service arrangements or reductions from other expense offset arrangements and do not represent the amount paid by the class during periods when reimbursements or reductions occur. Expense ratios before reductions for start-up periods may not be representative of longer-term operating periods. Expenses net of fee waivers reflect expenses after reimbursement by the investment adviser but prior to reductions from brokerage service arrangements or other expense offset arrangements. Expenses net of all reductions represent the net expenses paid by the class.
J The portfolio turnover rate does not include the assets acquired in the merger.
K Amount represents less than $.01 per share.
Financial Highlights - Class C
Period ended October 31, | 2010 H |
Selected Per-Share Data | |
Net asset value, beginning of period | $ 55.47 |
Income from Investment Operations | |
Net investment income (loss) E | (.02) |
Net realized and unrealized gain (loss) | 2.79 |
Total from investment operations | 2.77 |
Distributions from net investment income | (.80) |
Redemption fees added to paid in capital E,K | - |
Net asset value, end of period | $ 57.44 |
Total Return B,C,D | 5.06% |
Ratios to Average Net Assets F,I | |
Expenses before reductions | 2.09% A |
Expenses net of fee waivers, if any | 2.09% A |
Expenses net of all reductions | 2.07% A |
Net investment income (loss) | (.34)% A |
Supplemental Data | |
Net assets, end of period (000 omitted) | $ 48,329 |
Portfolio turnover rate G | 56% J |
A Annualized
B Total returns for periods of less than one year are not annualized.
C Total returns would have been lower had certain expenses not been reduced during the periods shown.
D Total returns do not include the effect of the contingent deferred sales charge.
E Calculated based on average shares outstanding during the period.
F Fees and expenses of the underlying Fidelity Central Funds are not included in the Fund's expense ratio. The Fund indirectly bears its proportionate share of the expenses of any underlying Fidelity Central Funds.
G Amount does not include the portfolio activity of any underlying Fidelity Central Funds.
H For the period September 28, 2010 (commencement of sale of shares) to October 31, 2010.
I Expense ratios reflect operating expenses of the class. Expenses before reductions do not reflect amounts reimbursed by the investment adviser or reductions from brokerage service arrangements or reductions from other expense offset arrangements and do not represent the amount paid by the class during periods when reimbursements or reductions occur. Expense ratios before reductions for start-up periods may not be representative of longer-term operating periods. Expenses net of fee waivers reflect expenses after reimbursement by the investment adviser but prior to reductions from brokerage service arrangements or other expense offset arrangements. Expenses net of all reductions represent the net expenses paid by the class.
J The portfolio turnover rate does not include the assets acquired in the merger.
K Amount represents less than $.01 per share.
See accompanying notes which are an integral part of the financial statements.
Annual Report
Financial Highlights - Latin America
Years ended October 31, | 2010 | 2009 | 2008 | 2007 | 2006 |
Selected Per-Share Data | | | | | |
Net asset value, beginning of period | $ 47.29 | $ 28.69 | $ 67.90 | $ 41.13 | $ 29.40 |
Income from Investment Operations | | | | | |
Net investment income (loss) B | 1.07 | .72 | .83 | .68 | .82 |
Net realized and unrealized gain (loss) | 11.00 | 18.32 | (37.74) | 27.43 | 11.68 |
Total from investment operations | 12.07 | 19.04 | (36.91) | 28.11 | 12.50 |
Distributions from net investment income | (1.49) | (.46) | (.65) | (.61) | (.46) |
Distributions from net realized gain | (.39) | - | (1.72) | (.77) | (.38) |
Total distributions | (1.88) | (.46) | (2.37) | (1.38) | (.84) |
Redemption fees added to paid in capital B | .02 | .02 | .07 | .04 | .07 |
Net asset value, end of period | $ 57.50 | $ 47.29 | $ 28.69 | $ 67.90 | $ 41.13 |
Total Return A | 25.91% | 67.88% | (56.20)% | 70.35% | 43.57% |
Ratios to Average Net Assets C,E | | | | | |
Expenses before reductions | 1.03% | 1.07% | 1.02% | 1.00% | 1.05% |
Expenses net of fee waivers, if any | 1.03% | 1.07% | 1.02% | 1.00% | 1.05% |
Expenses net of all reductions | 1.01% | 1.05% | 1.00% | .98% | 1.02% |
Net investment income (loss) | 2.10% | 2.04% | 1.41% | 1.33% | 2.23% |
Supplemental Data | | | | | |
Net assets, end of period (000 omitted) | $ 4,283,462 | $ 4,043,748 | $ 2,225,606 | $ 6,219,690 | $ 3,122,473 |
Portfolio turnover rate D | 56% F | 52% | 51% | 52% | 60% |
A Total returns would have been lower had certain expenses not been reduced during the periods shown.
B Calculated based on average shares outstanding during the period.
C Fees and expenses of the underlying Fidelity Central Funds are not included in the Fund's expense ratio. The Fund indirectly bears its proportionate share of the expenses of any underlying Fidelity Central Funds.
D Amount does not include the portfolio activity of any underlying Fidelity Central Funds.
E Expense ratios reflect operating expenses of the class. Expenses before reductions do not reflect amounts reimbursed by the investment adviser or reductions from brokerage service arrangements or reductions from other expense offset arrangements and do not represent the amount paid by the class during periods when reimbursements or reductions occur. Expenses net of fee waivers reflect expenses after reimbursement by the investment adviser but prior to reductions from brokerage service arrangements or other expense offset arrangements. Expenses net of all reductions represent the net expenses paid by the class.
F The portfolio turnover rate does not include the assets acquired in the merger.
Financial Highlights - Institutional Class
Period ended October 31, | 2010 G |
Selected Per-Share Data | |
Net asset value, beginning of period | $ 55.47 |
Income from Investment Operations | |
Net investment income (loss) D | .03 |
Net realized and unrealized gain (loss) | 2.79 |
Total from investment operations | 2.82 |
Distributions from net investment income | (.80) |
Redemption fees added to paid in capital D,J | - |
Net asset value, end of period | $ 57.49 |
Total Return B,C | 5.15% |
Ratios to Average Net Assets E,H | |
Expenses before reductions | 1.08% A |
Expenses net of fee waivers, if any | 1.08% A |
Expenses net of all reductions | 1.06% A |
Net investment income (loss) | .68% A |
Supplemental Data | |
Net assets, end of period (000 omitted) | $ 12,868 |
Portfolio turnover rate F | 56% I |
A Annualized
B Total returns for periods of less than one year are not annualized.
C Total returns would have been lower had certain expenses not been reduced during the periods shown.
D Calculated based on average shares outstanding during the period.
E Fees and expenses of the underlying Fidelity Central Funds are not included in the Fund's expense ratio. The Fund indirectly bears its proportionate share of the expenses of any underlying Fidelity Central Funds.
F Amount does not include the portfolio activity of any underlying Fidelity Central Funds.
G For the period September 28, 2010 (commencement of sale of shares) to October 31, 2010.
H Expense ratios reflect operating expenses of the class. Expenses before reductions do not reflect amounts reimbursed by the investment adviser or reductions from brokerage service arrangements or reductions from other expense offset arrangements and do not represent the amount paid by the class during periods when reimbursements or reductions occur. Expense ratios before reductions for start-up periods may not be representative of longer-term operating periods. Expenses net of fee waivers reflect expenses after reimbursement by the investment adviser but prior to reductions from brokerage service arrangements or other expense offset arrangements. Expenses net of all reductions represent the net expenses paid by the class.
I The portfolio turnover rate does not include the assets acquired in the merger.
J Amount represents less than $.01 per share.
See accompanying notes which are an integral part of the financial statements.
Annual Report
Notes to Financial Statements
For the period ended October 31, 2010
1. Organization.
Fidelity Latin America Fund (the Fund) is a fund of Fidelity Investment Trust (the Trust) and is authorized to issue an unlimited number of shares. The Trust is registered under the Investment Company Act of 1940, as amended (the 1940 Act), as an open-end management investment company organized as a Massachusetts business trust. The Fund launched shares of Class A, Class T, Class B, Class C, and Institutional Class and the existing class was designated Latin America on September 28, 2010. Each class has equal rights as to assets and voting privileges. Class B shares are closed to new accounts and additional purchases by existing shareholders. Each class has exclusive voting rights with respect to matters that affect that class. Class B shares automatically convert to Class A shares after a holding period of seven years from the initial date of purchase. Investment income, realized and unrealized capital gains and losses, the common expenses of the Fund, and certain fund-level expense reductions, if any, are allocated on a pro-rata basis to each class based on the relative net assets of each class to the total net assets of the Fund. Each class differs with respect to transfer agent and distribution and service plan fees incurred. Certain expense reductions also differ by class. The Fund's investments in emerging markets can be subject to social, economic, regulatory, and political uncertainties and can be extremely volatile.
2. Investments in Fidelity Central Funds.
The Fund may invest in Fidelity Central Funds, which are open-end investment companies available only to other investment companies and accounts managed by Fidelity Management & Research Company (FMR) and its affiliates. The Fund's Schedule of Investments lists each of the Fidelity Central Funds held as of period end, if any, as an investment of the Fund, but does not include the underlying holdings of each Fidelity Central Fund. As an Investing Fund, the Fund indirectly bears its proportionate share of the expenses of the underlying Fidelity Central Funds.
The Money Market Central Funds seek preservation of capital and current income and are managed by Fidelity Investments Money Management, Inc. (FIMM), an affiliate of FMR.
A complete unaudited list of holdings for each Fidelity Central Fund is available upon request or at the Securities and Exchange Commission (the SEC) web site at www.sec.gov. In addition, the financial statements of the Fidelity Central Funds, which are not covered by the Fund's Report of Independent Registered Public Accounting Firm, are available on the SEC web site or upon request.
3. Significant Accounting Policies.
The financial statements have been prepared in conformity with accounting principles generally accepted in the United States of America (GAAP), which require management to make certain estimates and assumptions at the date of the financial statements. Actual results could differ from those estimates. The following summarizes the significant accounting policies of the Fund:
Security Valuation. Investments are valued as of 4:00 p.m. Eastern time on the last calendar day of the period. The Fund uses independent pricing services approved by the Board of Trustees to value its investments. When current market prices or quotations are not readily available or reliable, valuations may be determined in good faith in accordance with procedures adopted by the Board of Trustees. Factors used in determining value may include market or security specific events. The frequency with which these procedures are used cannot be predicted and they may be utilized to a significant extent. The value used for net asset value (NAV) calculation under these procedures may differ from published prices for the same securities.
The Fund categorizes the inputs to valuation techniques used to value its investments into a disclosure hierarchy consisting of three levels as shown below.
Level 1 - quoted prices in active markets for identical investments
Level 2 - other significant observable inputs (including quoted prices for similar investments, interest rates, prepayment speeds, etc.)
Level 3 - unobservable inputs (including the fund's own assumptions based on the best information available)
Changes in valuation techniques may result in transfers in or out of an assigned level within the disclosure hierarchy. The aggregate value of investments by input level, as of October 31, 2010, is included at the end of the Fund's Schedule of Investments. Valuation techniques used to value the Fund's investments by major category are as follows.
Equity securities, including restricted securities, for which market quotations are readily available, are valued at the last reported sale price or official closing price as reported by an independent pricing service on the primary market or exchange on which they are traded and are categorized as Level 1 in the hierarchy. In the event there were no sales during the day or closing prices are not available, securities are valued at the last quoted bid price or may be valued using the last available price and are generally categorized as Level 2 in the hierarchy. For foreign equity securities, when significant market or security specific events arise, comparisons to the valuation of American Depositary Receipts (ADRs), futures contracts, Exchange-traded
Annual Report
3. Significant Accounting Policies - continued
Security Valuation - continued
funds (ETFs) and certain indexes as well as quoted prices for similar securities are used and are categorized as Level 2 in the hierarchy in these circumstances. Utilizing these techniques may result in transfers between Level 1 and Level 2. For restricted equity securities and private placements where observable inputs are limited, assumptions about market activity and risk are used and are categorized as Level 3 in the hierarchy.
Investments in open-end mutual funds, including the Fidelity Central Funds, are valued at their closing net asset value each business day and are categorized as Level 1 in the hierarchy. Short-term securities with remaining maturities of sixty days or less for which quotations are not readily available are valued at amortized cost, which approximates fair value and are categorized as Level 2 in the hierarchy.
Foreign Currency. The Fund uses foreign currency contracts to facilitate transactions in foreign-denominated securities. Gains and losses from these transactions may arise from changes in the value of the foreign currency or if the counterparties do not perform under the contracts' terms.
Foreign-denominated assets, including investment securities, and liabilities are translated into U.S. dollars at the exchange rate at period end. Purchases and sales of investment securities, income and dividends received and expenses denominated in foreign currencies are translated into U.S. dollars at the exchange rate in effect on the transaction date.
The effects of exchange rate fluctuations on investments are included with the net realized and unrealized gain (loss) on investment securities. Other foreign currency transactions resulting in realized and unrealized gain (loss) are disclosed separately.
Investment Transactions and Income. For financial reporting purposes, the Fund's investment holdings and NAV include trades executed through the end of the last business day of the period. The NAV per share for processing shareholder transactions is calculated as of the close of business of the New York Stock Exchange (NYSE), normally 4:00 p.m. Eastern time and includes trades executed through the end of the prior business day. Gains and losses on securities sold are determined on the basis of identified cost. Dividend income is recorded on the ex-dividend date, except for certain dividends from foreign securities where the ex-dividend date may have passed, which are recorded as soon as the Fund is informed of the ex-dividend date. Non-cash dividends included in dividend income, if any, are recorded at the fair market value of the securities received. Distributions received on securities that represent a return of capital or capital gain are recorded as a reduction of cost of investments and/or as a realized gain. The Fund estimates the components of distributions received that may be considered return of capital distributions or capital gain distributions. Interest income and distributions from the Fidelity Central Funds are accrued as earned. Interest income includes coupon interest and amortization of premium and accretion of discount on debt securities. Investment income is recorded net of foreign taxes withheld where recovery of such taxes is uncertain.
Expenses. Most expenses of the Trust can be directly attributed to a fund. Expenses which cannot be directly attributed are apportioned amongst each fund in the Trust. Expense estimates are accrued in the period to which they relate and adjustments are made when actual amounts are known.
Income Tax Information and Distributions to Shareholders. Each year the Fund intends to qualify as a regulated investment company, including distributing substantially all of its taxable income and realized gains under Subchapter M of the Internal Revenue Code and filing its U.S. federal tax return. As a result, no provision for income taxes is required. As of October 31, 2010, the Fund did not have any unrecognized tax benefits in the accompanying financial statements. A fund's federal tax return is subject to examination by the Internal Revenue Service (IRS) for a period of three years. Foreign taxes are provided for based on the Fund's understanding of the tax rules and rates that exist in the foreign markets in which it invests.
Distributions are declared and recorded on the ex-dividend date. Income dividends and capital gain distributions are declared separately for each class. Income and capital gain distributions are determined in accordance with income tax regulations, which may differ from GAAP.
Capital accounts within the financial statements are adjusted for permanent book-tax differences. These adjustments have no impact on net assets or the results of operations. Temporary book-tax differences will reverse in a subsequent period.
Book-tax differences are primarily due to short-term gain distributions from the Fidelity Central Funds, foreign currency transactions, passive foreign investment companies (PFIC), deferred trustees compensation, capital loss carryforwards and losses deferred due to wash sales.
The federal tax cost of investment securities and unrealized appreciation (depreciation) as of period end were as follows:
Gross unrealized appreciation | $ 2,104,075,629 |
Gross unrealized depreciation | (24,006,376) |
Net unrealized appreciation (depreciation) | $ 2,080,069,253 |
| |
Tax Cost | $ 2,512,172,090 |
Annual Report
Notes to Financial Statements - continued
3. Significant Accounting Policies - continued
Income Tax Information and Distributions to Shareholders - continued
The tax-based components of distributable earnings as of period end were as follows:
Undistributed ordinary income | $ 27,349,071 |
Capital loss carryforward | $ (425,993,249) |
Net unrealized appreciation (depreciation) | $ 2,080,083,061 |
The tax character of distributions paid was as follows:
| October 31, 2010 | October 31, 2009 |
Ordinary Income | $ 152,546,775 | $ 34,726,095 |
Short-Term Trading (Redemption) Fees. Shares purchased by investors and held in the Fund less than 90 days are subject to a redemption fee equal to 1.50% of the net asset value of shares redeemed. All redemption fees, which reduce the proceeds of the shareholder redemption, are retained by the Fund and accounted for as an addition to paid in capital.
4. Operating Policies.
Restricted Securities. The Fund may invest in securities that are subject to legal or contractual restrictions on resale. These securities generally may be resold in transactions exempt from registration or to the public if the securities are registered. Disposal of these securities may involve time-consuming negotiations and expense, and prompt sale at an acceptable price may be difficult. Information regarding restricted securities is included at the end of the Fund's Schedule of Investments.
5. Purchases and Sales of Investments.
Purchases and sales of securities, other than short-term securities, aggregated $2,260,960,609 and $2,764,008,467, respectively.
6. Fees and Other Transactions with Affiliates.
Management Fee. FMR and its affiliates provide the Fund with investment management related services for which the Fund pays a monthly management fee. The management fee is the sum of an individual fund fee rate that is based on an annual rate of .45% of the Fund's average net assets and a group fee rate that averaged .26% during the period. The group fee rate is based upon the average net assets of all the mutual funds advised by FMR. The group fee rate decreases as assets under management increase and increases as assets under management decrease. For the period, the total annual management fee rate was .71% of the Fund's average net assets.
Distribution and Service Plan Fees. In accordance with Rule 12b-1 of the 1940 Act, the Fund has adopted separate Distribution and Service Plans for each class of shares. Certain classes pay Fidelity Distributors Corporation (FDC), an affiliate of FMR, separate Distribution and Service Fees, each of which is based on an annual percentage of each class' average net assets. In addition, FDC may pay financial intermediaries for selling shares of the Fund and providing shareholder support services. For the period, the Distribution and Service Fee rates, total fees and amounts retained by FDC were as follows:
| Distribution
Fee | Service
Fee | Paid
to FDC | Retained
by FDC |
Class A | -% | .25% | $ 22,839 | $ - |
Class T | .25% | .25% | 14,535 | - |
Class B | .75% | .25% | 16,306 | 11,638 |
Class C | .75% | .25% | 38,155 | 2,577 |
| | | $ 91,835 | $ 14,215 |
Sales Load. FDC receives a front-end sales charge of up to 5.75% for selling Class A shares, and 3.50% for selling Class T shares, some of which is paid to financial intermediaries for selling shares of the Fund. FDC receives the proceeds of contingent deferred sales charges levied on Class A, Class T, Class B, and Class C redemptions. These charges depend on the holding period. The deferred sales charges range from 5% to 1% for Class B, 1% for Class C, 1.00% for certain purchases of Class A shares and .25% for certain purchases of Class T shares.
Annual Report
6. Fees and Other Transactions with Affiliates - continued
Sales Load - continued
For the period, sales charge amounts retained by FDC were as follows:
| Retained
by FDC |
Class A | $ 6,464 |
Class T | 880 |
Class B | 2,206 |
Class C | 400 |
| $ 9,950 |
Transfer Agent Fees. Fidelity Investments Institutional Operations Company, Inc. (FIIOC), an affiliate of FMR, is the transfer, dividend disbursing and shareholder servicing agent for each class of the Fund. FIIOC receives account fees and asset-based fees that vary according to the account size and type of account of the shareholders of the respective classes of the Fund. FIIOC pays for typesetting, printing and mailing of shareholder reports, except proxy statements. For the period, transfer agent fees for each class were as follows:
| Amount | % of
Average
Net Assets |
Class A | $ 27,211 | .30* |
Class T | 8,883 | .31* |
Class B | 4,861 | .30* |
Class C | 10,426 | .27* |
Latin America | 9,088,528 | .22 |
Institutional Class | 2,704 | .26* |
| $ 9,142,613 | |
* Annualized
Accounting and Security Lending Fees. Fidelity Service Company, Inc. (FSC), an affiliate of FMR, maintains the Fund's accounting records. The accounting fee is based on the level of average net assets for the month. Under a separate contract, FSC administers the security lending program. The security lending fee is based on the number and duration of lending transactions.
Brokerage Commissions. The Fund placed a portion of its portfolio transactions with brokerage firms which are affiliates of the investment adviser. The commissions paid to these affiliated firms were $6,632 for the period.
Interfund Lending Program. Pursuant to an Exemptive Order issued by the SEC, the Fund, along with other registered investment companies having management contracts with FMR, may participate in an interfund lending program. This program provides an alternative credit facility allowing the funds to borrow from, or lend money to, other participating affiliated funds. At period end, there were no interfund loans outstanding. The Fund's activity in this program during the period for which loans were outstanding was as follows:
Borrower or Lender | Average Daily
Loan Balance | Weighted Average Interest Rate | Interest
Expense |
Borrower | $ 12,527,535 | .44% | $ 6,510 |
7. Committed Line of Credit.
The Fund participates with other funds managed by FMR or an affiliate in a $3.75 billion credit facility (the "line of credit") to be utilized for temporary or emergency purposes to fund shareholder redemptions or for other short-term liquidity purposes. The Fund has agreed to pay commitment fees on its pro-rata portion of the line of credit, which amounted to $16,647 and is reflected in Miscellaneous expenses on the Statement of Operations. During the period, there were no borrowings on this line of credit.
8. Security Lending.
The Fund lends portfolio securities through a lending agent from time to time in order to earn additional income. The lending agent may loan securities to certain qualified borrowers, including Fidelity Capital Markets (FCM), a broker-dealer affiliated with the Fund. On the settlement date of the loan, the Fund receives collateral (in the form of U.S. Treasury obligations, letters of credit and/or cash) against the loaned securities and maintains collateral in an amount not less than 100% of the market value of the loaned securities during the period of the loan. The market value of the loaned securities is determined at the close of business of the Fund and any additional required collateral is delivered to the Fund on the next business day. If the borrower defaults on its obligation to return the securities loaned because of insolvency or other reasons, a fund could experience delays and costs in recovering the securities loaned or in gaining access to the collateral. Any cash collateral received is invested in the Fidelity Securities Lending Cash
Annual Report
Notes to Financial Statements - continued
8. Security Lending - continued
Central Fund. The value of loaned securities and cash collateral at period end are disclosed on the Fund's Statement of Assets and Liabilities. Security lending income represents the income earned on investing cash collateral, less rebates paid to borrowers and lending agent fees associated with the loan, plus any premium payments received for lending certain types of securities. Security lending income is presented in the Statement of Operations as a component of income from Fidelity Central Funds. Total security lending income during the period amounted to $586,004. During the period, there were no securities loaned to FCM.
9. Bank Borrowings.
The Fund is permitted to have bank borrowings for temporary or emergency purposes to fund shareholder redemptions. The Fund has established borrowing arrangements with certain banks. The interest rate on the borrowings is the bank's base rate, as revised from time to time. The average daily loan balance during the period for which loans were outstanding amounted to $14,799,857. The weighted average interest rate was .70%. The interest expense amounted to $2,027 under the bank borrowing program. At period end, there were no bank borrowings outstanding.
10. Expense Reductions.
FMR voluntarily agreed to reimburse a portion of Latin America's operating expenses. During the period, this reimbursement reduced the class' expenses by $62,575.
Many of the brokers with whom FMR places trades on behalf of the Fund provided services to the Fund in addition to trade execution. These services included payments of certain expenses on behalf of the Fund totaling $980,935 for the period. In addition, through arrangements with the Fund's custodian, credits realized as a result of uninvested cash balances were used to reduce the Fund's expenses. During the period, these credits reduced the Fund's custody expenses by $261.
11. Distributions to Shareholders.
Distributions to shareholders of each class were as follows:
Years ended October 31, | 2010 A | 2009 |
From net investment income | | |
Class A | $ 1,442 | $ - |
Class T | 1,442 | - |
Class B | 1,442 | - |
Class C | 1,442 | - |
Latin America | 118,553,199 | 34,726,095 |
Institutional Class | 1,442 | - |
Total | $ 118,560,409 | $ 34,726,095 |
From net realized gain | | |
Latin America | $ 33,986,366 | $ - |
A Distributions for Class A, Class T, Class B, Class C and Institutional Class are for the period September 28, 2010 (commencement of sale of shares) to October 31, 2010.
12. Share Transactions.
Transactions for each class of shares were as follows:
| Shares | Dollars |
Years ended October 31, | 2010 A | 2009 | 2010 A | 2009 |
Class A | | | | |
Shares sold | 41,687 | - | $ 2,369,263 | $ - |
Issued in exchange of shares of Fidelity Advisor Latin America Fund | 2,023,866 | | 113,640,086 | |
Reinvestment of distributions | 26 | - | 1,442 | - |
Shares redeemed | (53,951) | - | (3,076,408) | - |
Net increase (decrease) | 2,011,628 | - | $ 112,934,383 | $ - |
Class T | | | | |
Shares sold | 18,758 | - | $ 1,058,068 | $ - |
Issued in exchange of shares of Fidelity Advisor Latin America Fund | 637,585 | | 35,800,407 | |
Reinvestment of distributions | 26 | - | 1,442 | - |
Shares redeemed | (15,626) | - | (885,588) | - |
Net increase (decrease) | 640,743 | - | $ 35,974,329 | $ - |
Annual Report
12. Share Transactions - continued
| Shares | Dollars |
Years ended October 31, | 2010 A | 2009 | 2010 A | 2009 |
Class B | | | | |
Shares sold | 3,456 | - | $ 192,197 | $ - |
Issued in exchange of shares of Fidelity Advisor Latin America Fund | 359,402 | | 20,176,816 | |
Reinvestment of distributions | 26 | - | 1,442 | - |
Shares redeemed | (7,861) | - | (450,086) | - |
Net increase (decrease) | 355,023 | - | $ 19,920,369 | $ - |
Class C | | | | |
Shares sold | 17,327 | - | $ 976,205 | $ - |
Issued in exchange of shares of Fidelity Advisor Latin America Fund | 840,828 | | 47,204,057 | |
Reinvestment of distributions | 26 | - | 1,442 | - |
Shares redeemed | (16,791) | - | (947,712) | - |
Net increase (decrease) | 841,390 | - | $ 47,233,992 | $ - |
Latin America | | | | |
Shares sold | 22,062,249 | 31,352,380 | $ 1,142,552,819 | $ 1,172,903,800 |
Reinvestment of distributions | 2,770,809 | 1,344,639 | 147,652,381 | 33,594,867 |
Shares redeemed | (35,850,914) | (24,759,791) | (1,794,503,952) | (845,652,662) |
Net increase (decrease) | (11,017,856) | 7,937,228 | $ (504,298,752) | $ 360,846,005 |
Institutional Class | | | | |
Shares sold | 3,784 | - | $ 212,699 | $ - |
Issued in exchange of shares of Fidelity Advisor Latin America Fund | 228,366 | | 12,822,761 | |
Reinvestment of distributions | 26 | - | 1,442 | - |
Shares redeemed | (8,368) | - | (476,457) | - |
Net increase (decrease) | 223,808 | - | $ 12,560,445 | $ - |
A Share transactions for Class A, Class T, Class B, Class C and Institutional are for the period September 28, 2010 (commencement of sale of shares) to October 31, 2010.
13. Other.
The Fund's organizational documents provide former and current trustees and officers with a limited indemnification against liabilities arising in connection with the performance of their duties to the Fund. In the normal course of business, the Fund may also enter into contracts that provide general indemnifications. The Fund's maximum exposure under these arrangements is unknown as this would be dependent on future claims that may be made against the Fund. The risk of material loss from such claims is considered remote.
14. Merger Information.
On October 1, 2010 the Fund acquired all of the assets and assumed all of the liabilities of the Fidelity Advisor Latin America Fund ("Target Fund") pursuant to an agreement and plan of reorganization approved by the Board of Trustees ("The Board") on July 6, 2010. The reorganization provides shareholders of the Target Fund access to a larger portfolio with the same investment objectives and lower expenses. The acquisition was accomplished by an exchange of 2,023,866 Class A shares, 637,585 Class T shares, 359,402 Class B shares, 840,828 Class C shares, and 228,366 Institutional class shares of the Fund, respectively, for 2,219,330 Class A shares, 700,912 Class T shares, 400,205 Class B shares, 940,861 Class C shares, and 245,559 Institutional class shares then outstanding (valued at $51.20, $51.08, $50.42, $50.17 and $52.22 per share for Class A, Class T, Class B, Class C, and Institutional class, respectively) of the Target Fund. The reorganization qualified as a tax-free reorganization for federal income tax purposes with no gain or loss recognized to the funds or their shareholders. The Target Fund's net assets, including securities of $229,225,487, unrealized appreciation of $95,358,358, and net other assets of $418,642, were combined with the Fund's net assets of $4,149,781,255 for total net assets after the acquisition of $4,379,425,384.
Pro forma results of operations of the combined entity for the entire year ended October 31, 2010, as though the acquisition had occurred as of the beginning of the year (rather than on the actual acquisition date), are as follows:
Net investment income (loss) | $ 90,969,628 |
Total net realized gain (loss) | 302,327,523 |
Total change in net unrealized appreciation (depreciation) | 548,871,563 |
Net increase (decrease) in net assets resulting from operations | 942,168,714 |
Because the combined investment portfolios have been managed as a single portfolio since the acquisition was completed, it is not practicable to separate the amounts of revenue and earnings of the acquired fund that have been included in the Fund's accompanying Statement of Operations since October 1, 2010.
Annual Report
Report of Independent Registered Public Accounting Firm
To the Trustees of Fidelity Investment Trust and the Shareholders of Fidelity Latin America Fund:
In our opinion, the accompanying statement of assets and liabilities, including the schedule of investments, and the related statements of operations and of changes in net assets and the financial highlights present fairly, in all material respects, the financial position of Fidelity Latin America Fund (a fund of Fidelity Investment Trust) at October 31, 2010, the results of its operations for the year then ended, the changes in its net assets for each of the two years in the period then ended and the financial highlights for each of the periods indicated, in conformity with accounting principles generally accepted in the United States of America. These financial statements and financial highlights (hereafter referred to as "financial statements") are the responsibility of the Fidelity Latin America Fund's management. Our responsibility is to express an opinion on these financial statements based on our audits. We conducted our audits of these financial statements in accordance with the standards of the Public Company Accounting Oversight Board (United States). Those standards require that we plan and perform the audit to obtain reasonable assurance about whether the financial statements are free of material misstatement. An audit includes examining, on a test basis, evidence supporting the amounts and disclosures in the financial statements, assessing the accounting principles used and significant estimates made by management, and evaluating the overall financial statement presentation. We believe that our audits, which included confirmation of securities at October 31, 2010 by correspondence with the custodian and brokers, provide a reasonable basis for our opinion.
/s/ PricewaterhouseCoopers LLP
PricewaterhouseCoopers LLP
Boston, Massachusetts
December 17, 2010
Annual Report
The Trustees, Member of the Advisory Board, and executive officers of the trust and fund, as applicable, are listed below. The Board of Trustees governs the fund and is responsible for protecting the interests of shareholders. The Trustees are experienced executives who meet periodically throughout the year to oversee the fund's activities, review contractual arrangements with companies that provide services to the fund, oversee management of the risks associated with such activities and contractual arrangements, and review the fund's performance. Except for James C. Curvey, each of the Trustees oversees 221 funds advised by FMR or an affiliate. Mr. Curvey oversees 410 funds advised by FMR or an affiliate.
The Trustees hold office without limit in time except that (a) any Trustee may resign; (b) any Trustee may be removed by written instrument, signed by at least two-thirds of the number of Trustees prior to such removal; (c) any Trustee who requests to be retired or who has become incapacitated by illness or injury may be retired by written instrument signed by a majority of the other Trustees; and (d) any Trustee may be removed at any special meeting of shareholders by a two-thirds vote of the outstanding voting securities of the trust. Each Trustee who is not an interested person (as defined in the 1940 Act) (Independent Trustee), shall retire not later than the last day of the calendar year in which his or her 72nd birthday occurs. The Independent Trustees may waive this mandatory retirement age policy with respect to individual Trustees. The executive officers and Advisory Board Member hold office without limit in time, except that any officer and Advisory Board Member may resign or may be removed by a vote of a majority of the Trustees at any regular meeting or any special meeting of the Trustees. Except as indicated, each individual has held the office shown or other offices in the same company for the past five years.
Experience, Skills, Attributes, and Qualifications of the Fund's Trustees. The Governance and Nominating Committee has adopted a statement of policy that describes the experience, qualifications, attributes, and skills that are necessary and desirable for potential Independent Trustee candidates (Statement of Policy). The Board believes that each Trustee satisfied at the time he or she was initially elected or appointed a Trustee, and continues to satisfy, the standards contemplated by the Statement of Policy. The Governance and Nominating Committee also engages professional search firms to help identify potential Independent Trustee candidates who have the experience, qualifications, attributes, and skills consistent with the Statement of Policy. From time to time, additional criteria based on the composition and skills of the current Independent Trustees, as well as experience or skills that may be appropriate in light of future changes to board composition, business conditions, and regulatory or other developments, have also been considered by the professional search firms and the Governance and Nominating Committee. In addition, the Board takes into account the Trustees' commitment and participation in Board and committee meetings, as well as their leadership of standing and ad hoc committees throughout their tenure.
In determining that a particular Trustee was and continues to be qualified to serve as a Trustee, the Board has considered a variety of criteria, none of which, in isolation, was controlling. The Board believes that, collectively, the Trustees have balanced and diverse experience, qualifications, attributes, and skills, which allow the Board to operate effectively in governing the fund and protecting the interests of shareholders. Information about the specific experience, skills, attributes, and qualifications of each Trustee, which in each case led to the Board's conclusion that the Trustee should serve (or continue to serve) as a trustee of the fund, is provided below.
Board Structure and Oversight Function. Edward C. Johnson 3d is an interested person (as defined in the 1940 Act) and currently serves as Chairman. The Trustees have determined that an interested Chairman is appropriate and benefits shareholders because an interested Chairman has a personal and professional stake in the quality and continuity of services provided to the fund. Independent Trustees exercise their informed business judgment to appoint an individual of their choosing to serve as Chairman, regardless of whether the Trustee happens to be independent or a member of management. The Independent Trustees have determined that they can act independently and effectively without having an Independent Trustee serve as Chairman and that a key structural component for assuring that they are in a position to do so is for the Independent Trustees to constitute a substantial majority for the Board. The Independent Trustees also regularly meet in executive session. Ned C. Lautenbach serves as Chairman of the Independent Trustees and as such (i) acts as a liaison between the Independent Trustees and management with respect to matters important to the Independent Trustees and (ii) with management prepares agendas for Board meetings.
Fidelity funds are overseen by different Boards of Trustees. The fund's Board oversees Fidelity's equity and high income funds and another Board oversees Fidelity's investment-grade bond, money market, and asset allocation funds. The asset allocation funds may invest in Fidelity funds overseen by the fund's Board. The use of separate Boards, each with its own committee structure, allows the Trustees of each group of Fidelity funds to focus on the unique issues of the funds they oversee, including common research, investment, and operational issues. On occasion, the separate Boards establish joint committees to address issues of overlapping consequences for the Fidelity funds overseen by each Board.
The Trustees operate using a system of committees to facilitate the timely and efficient consideration of all matters of importance to the Trustees, the fund, and fund shareholders and to facilitate compliance with legal and regulatory requirements and oversight of the fund's activities and associated risks. The Board, acting through its committees, has charged FMR and its affiliates with (i) identifying events or circumstances the occurrence of which could have demonstrably adverse effects on the fund's business and/or reputation; (ii) implementing processes and controls to lessen the possibility that such events or circumstances occur or to mitigate the effects of such events or circumstances if they do occur; and (iii) creating and maintaining a system designed to evaluate continuously business and market conditions in order to facilitate the identification and implementation processes described in (i) and (ii) above. Because the day-to-day operations and activities of the fund are carried out by or through FMR, its affiliates and other service providers, the fund's exposure to risks is mitigated but not eliminated by the processes overseen by the Trustees. While each of the Board's committees has responsibility for overseeing different aspects of the fund's activities, oversight is exercised primarily through the Operations, Audit, and Compliance Committees. Appropriate personnel, including but not limited to the fund's Chief Compliance Officer (CCO), FMR's internal auditor, the independent accountants, the fund's Treasurer and portfolio management personnel, make periodic reports to the Board's committees, as appropriate. The responsibilities of each committee, including their oversight responsibilities, are described further under "Standing Committees of the Fund's Trustees."
Annual Report
Trustees and Officers - continued
The fund's Statement of Additional Information (SAI) includes more information about the Trustees. To request a free copy, call Fidelity at 1-877-208-0098.
Interested Trustees*:
Correspondence intended for each Trustee who is an interested person may be sent to Fidelity Investments, 82 Devonshire Street, Boston, Massachusetts 02109.
Name, Age; Principal Occupations and Other Relevant Experience+ |
Edward C. Johnson 3d (80) |
| Year of Election or Appointment: 1983 Mr. Johnson is Trustee and Chairman of the Board of Trustees of certain Trusts. Mr. Johnson serves as Chief Executive Officer, Chairman, and a Director of FMR LLC; Chairman and a Director of FMR; Chairman and a Director of Fidelity Research & Analysis Company (FRAC); Chairman and a Director of Fidelity Investments Money Management, Inc.; and Chairman and a Director of FMR Co., Inc. In addition, Mr. Johnson serves as Chairman and Director of FIL Limited. Previously, Mr. Johnson served as President of FMR LLC (2006-2007). |
James C. Curvey (75) |
| Year of Election or Appointment: 2007 Mr. Curvey also serves as Trustee (2007-present) of other investment companies advised by FMR. Mr. Curvey is a Director of Fidelity Investments Money Management, Inc. (2009-present), Director of Fidelity Research & Analysis Co. (2009-present) and Director of FMR and FMR Co., Inc. (2007-present). Mr. Curvey is also Vice Chairman (2007-present) and Director of FMR LLC. In addition, Mr. Curvey serves as an Overseer for the Boston Symphony Orchestra and a member of the Trustees of Villanova University. Previously, Mr. Curvey was the Vice Chairman (2006-2007) and Director (2000-2007) of FMR Corp. |
* Trustees have been determined to be "Interested Trustees" by virtue of, among other things, their affiliation with the trust or various entities under common control with FMR.
+ The information above includes each Trustee's principal occupation during the last five years and other information relating to the experience, attributes, and skills relevant to each Trustee's qualifications to serve as a Trustee, which led to the conclusion that each Trustee should serve as a Trustee for the fund.
Independent Trustees:
Correspondence intended for each Independent Trustee (that is, the Trustees other than the Interested Trustees) may be sent to Fidelity Investments, P.O. Box 55235, Boston, Massachusetts 02205-5235.
Name, Age; Principal Occupations and Other Relevant Experience+ |
Dennis J. Dirks (62) |
| Year of Election or Appointment: 2005 Prior to his retirement in May 2003, Mr. Dirks was Chief Operating Officer and a member of the Board of The Depository Trust & Clearing Corporation (DTCC). He also served as President, Chief Operating Officer, and Board member of The Depository Trust Company (DTC) and President and Board member of the National Securities Clearing Corporation (NSCC). In addition, Mr. Dirks served as Chief Executive Officer and Board member of the Government Securities Clearing Corporation, Chief Executive Officer and Board member of the Mortgage-Backed Securities Clearing Corporation, as a Trustee and a member of the Finance Committee of Manhattan College (2005-2008), and as a Trustee and a member of the Finance Committee of AHRC of Nassau County (2006-2008). Mr. Dirks is a member of the Independent Directors Council (IDC) Governing Council (2010-Present) and Board of Directors for The Brookville Center for Children's Services, Inc. (2009-present). |
Alan J. Lacy (57) |
| Year of Election or Appointment: 2008 Mr. Lacy serves as Senior Adviser (2007-present) of Oak Hill Capital Partners, L.P. (private equity). Mr. Lacy also served as Chief Executive Officer (2000-2005) and Vice Chairman (2005-2006) of Sears Holdings Corporation and Sears, Roebuck and Co. (retail). In addition, Mr. Lacy serves as a member of the Board of Directors of The Western Union Company (global money transfer, 2006-present) and Bristol-Myers Squibb Company (global pharmaceuticals, 2007-present). Mr. Lacy is Chairman (2008-present) and a member (2006-present) of the Board of Trustees of The National Parks Conservation Association. |
Ned C. Lautenbach (66) |
| Year of Election or Appointment: 2000 Mr. Lautenbach is Chairman of the Independent Trustees of the Equity and High Income Funds (2006-present). Mr. Lautenbach currently serves as the Lead Director of the Eaton Corporation Board of Directors (diversified industrial, 1997-present). Mr. Lautenbach is also a member of the Board of Directors of the Philharmonic Center for the Arts in Naples, Florida (1999-
present); a member of the Board of Trustees of Fairfield University (2005-present); and a member of the Council on Foreign Relations (1994-present). Previously, Mr. Lautenbach was a Partner/Advisory Partner at Clayton, Dubilier & Rice, Inc. (private equity investment, 1998-2010), as well as a Director of Sony Corporation (2006-2007). |
Joseph Mauriello (66) |
| Year of Election or Appointment: 2008 Prior to his retirement in January 2006, Mr. Mauriello served in numerous senior management positions including Deputy Chairman and Chief Operating Officer (2004-2005), and Vice Chairman of Financial Services (2002-2004) of KPMG LLP US (professional services, 1965-2005). Mr. Mauriello currently serves as a member of the Board of Directors of XL Group plc. (global insurance and re-insurance, 2006-present) and of Arcadia Resources Inc. (health care services and products, 2007-present).
Previously, Mr. Mauriello served as a Director of the Hamilton Funds of the Bank of New York (2006-2007). |
Cornelia M. Small (66) |
| Year of Election or Appointment: 2005 Ms. Small is a member of the Board of Directors of the Teagle Foundation (2009-present). Ms. Small is also a member of the Investment Committee, and Chair (2008-present) and a member of the Board of Trustees of Smith College. In addition, Ms. Small serves on the Investment Committee of the Berkshire Taconic Community Foundation (2008-present). Previously, Ms. Small served as Chairperson of the Investment Committee (2002-2008) of Smith College. In addition, Ms. Small served as Chief Investment Officer, Director of Global Equity Investments, and a member of the Board of Directors of Scudder, Stevens & Clark and Scudder Kemper Investments. |
William S. Stavropoulos (71) |
| Year of Election or Appointment: 2001 Mr. Stavropoulos is Vice Chairman of the Independent Trustees of the Equity and High Income Funds (2006-present). Mr. Stavropoulos serves as President and Founder of the Michigan Baseball Foundation, the Great Lakes Loons (2007-present). Mr. Stavropoulos is Chairman Emeritus of the Board of Directors of The Dow Chemical Company, where he previously served in numerous senior management positions, including President, CEO (1995-2000; 2002-2004), Chairman of the Executive Committee (2000-2006), and as a member of the Board of Directors (1990-2006). Currently, Mr. Stavropoulos is Chairman of Univar (global distributor of commodity and specialty chemicals, 2010-present), a Director of Teradata Corporation (data warehousing and technology solutions, 2008-present), Chemical Financial Corporation, Maersk Inc. (industrial conglomerate), Tyco International, Inc. (multinational manufacturing and services, 2007-present), and a member of the Advisory Board for Metalmark Capital (private equity investment, 2005-present). Mr. Stavropoulos is a special advisor to Clayton, Dubilier & Rice, Inc. (private equity investment). In addition, Mr. Stavropoulos is a member of the University of Notre Dame Advisory Council for the College of Science. |
David M. Thomas (61) |
| Year of Election or Appointment: 2008 Previously, Mr. Thomas served as Executive Chairman (2005-2006) and Chairman and Chief Executive Officer (2000-2005) of IMS Health, Inc. (pharmaceutical and healthcare information solutions). In addition, Mr. Thomas serves as a member of the Board of Directors of Fortune Brands, Inc. (consumer products), and Interpublic Group of Companies, Inc. (marketing communication, 2004-present). |
Michael E. Wiley (60) |
| Year of Election or Appointment: 2008 Mr. Wiley also serves as a Director of Asia Pacific Exploration Consolidated (international oil and gas exploration and production, 2008-present). Mr. Wiley serves as a Director of Tesoro Corporation (independent oil refiner and marketer, 2005-present), and a Director of Bill Barrett Corporation (exploration and production, 2005-present). In addition, Mr. Wiley also serves as a Director of Post Oak Bank (privately-held bank, 2004-present). Previously, Mr. Wiley served as a member of the Board of Trustees of the University of Tulsa (2000-2006; 2007-2010), as a Senior Energy Advisor of Katzenbach Partners, LLC (consulting, 2006-2007), as an Advisory Director of Riverstone Holdings (private investment), Chairman, President, and CEO of Baker Hughes, Inc. (oilfield services, 2000-2004), and as Director of Spinnaker Exploration Company (exploration and production, 2001-2005). |
+ The information above includes each Trustee's principal occupation during the last five years and other information relating to the experience, attributes, and skills relevant to each Trustee's qualifications to serve as a Trustee, which led to the conclusion that each Trustee should serve as a Trustee for the fund.
Annual Report
Trustees and Officers - continued
Advisory Board Member and Executive Officers:
Correspondence intended for each executive officer and Peter S. Lynch may be sent to Fidelity Investments, 82 Devonshire Street, Boston, Massachusetts 02109.
Name, Age; Principal Occupation |
Peter S. Lynch (66) |
| Year of Election or Appointment: 2003 Member of the Advisory Board of Fidelity's Equity and High Income Funds. Mr. Lynch is Vice Chairman and a Director of FMR and FMR Co., Inc. In addition, Mr. Lynch serves as a Trustee of Boston College and as the Chairman of the Inner-City Scholarship Fund. Previously, Mr. Lynch served on the Special Olympics International Board of Directors (1997-2006). |
Kenneth B. Robins (41) |
�� | Year of Election or Appointment: 2008 President and Treasurer of Fidelity's Equity and High Income Funds. Mr. Robins also serves as President and Treasurer (2010-
present) and Assistant Treasurer (2009-present) of other Fidelity funds and is an employee of Fidelity Investments (2004-present). Previously, Mr. Robins served as Deputy Treasurer of the Fidelity funds (2005-2008) and Treasurer and Chief Financial Officer of The North Carolina Capital Management Trust: Cash and Term Portfolios (2006-2008). |
Bruce T. Herring (45) |
| Year of Election or Appointment: 2006 Vice President of certain Equity Funds. Mr. Herring also serves as Chief Investment Officer and Director of Fidelity Management & Research (U.K.) Inc. (2010-present) and Group Chief Investments Officer of FMR. Previously, Mr. Herring served as Vice President (2005-2006) and Senior Vice President (2006-2007) of Fidelity Management & Research Company, Vice President of FMR Co., Inc. (2001-2007) and as a portfolio manager for Fidelity U.S. Equity Funds. |
Brian B. Hogan (46) |
| Year of Election or Appointment: 2009 Vice President of certain Equity Funds and Vice President of Sector Funds. Mr. Hogan also serves as President of FMR's Equity Division (2009-present). Previously, Mr. Hogan served as Senior Vice President, Equity Research of FMR (2006-2009) and as a portfolio manager. |
Scott C. Goebel (42) |
| Year of Election or Appointment: 2008 Secretary and Chief Legal Officer (CLO) of the Fidelity funds. Mr. Goebel also serves as Secretary and CLO of The North Carolina Capital Management Trust: Cash and Term Portfolio (2008-present); General Counsel, Secretary, and Senior Vice President of FMR (2008-present) and FMR Co., Inc. (2008-present); Deputy General Counsel of FMR LLC; Chief Legal Officer of Fidelity Management & Research (Hong Kong) Limited (2008-present) and Assistant Secretary of Fidelity Management & Research (Japan) Inc. (2008-present), Fidelity Investments Money Management, Inc. (2008-present), Fidelity Management & Research (U.K.) Inc. (2008-present), and Fidelity Research and Analysis Company (2008-present). Previously, Mr. Goebel served as Assistant Secretary of the Funds (2007-2008) and as Vice President and Secretary of Fidelity Distributors Corporation (FDC) (2005-2007). |
William C. Coffey (41) |
| Year of Election or Appointment: 2009 Assistant Secretary of Fidelity's Equity and High Income Funds. Mr. Coffey also serves as Senior Vice President and Deputy General Counsel of FMR LLC (2010-present), and is an employee of Fidelity Investments. Previously, Mr. Coffey served as Vice President and Associate General Counsel of FMR LLC (2005-2009). |
Holly C. Laurent (56) |
| Year of Election or Appointment: 2008 Anti-Money Laundering (AML) Officer of the Fidelity funds. Ms. Laurent also serves as AML Officer of The North Carolina Capital Management Trust: Cash and Term Portfolio (2008-present) and is an employee of Fidelity Investments. Previously, Ms. Laurent was Senior Vice President and Head of Legal for Fidelity Business Services India Pvt. Ltd. (2006-2008), and Senior Vice President, Deputy General Counsel and Group Head for FMR LLC (2005-2006). |
Christine Reynolds (52) |
| Year of Election or Appointment: 2008 Chief Financial Officer of the Fidelity funds. Ms. Reynolds became President of Fidelity Pricing and Cash Management Services (FPCMS) in August 2008. Ms. Reynolds served as Chief Operating Officer of FPCMS (2007-2008). Previously, Ms. Reynolds served as President, Treasurer, and Anti-Money Laundering officer of the Fidelity funds (2004-2007). |
Kenneth A. Rathgeber (63) |
| Year of Election or Appointment: 2004 Chief Compliance Officer of Fidelity's Equity and High Income Funds. Mr. Rathgeber is Chief Compliance Officer of Fidelity Management & Research (Hong Kong) Limited (2008-present), Fidelity Management & Research (Japan) Inc. (2008-present), FMR (2005-present), FMR Co., Inc. (2005-present), Fidelity Management & Research (U.K.) Inc. (2005-present), Fidelity Research & Analysis Company (2005-present), Fidelity Investments Money Management, Inc. (2005-present), Pyramis Global Advisors, LLC (2005-present), and Strategic Advisers, Inc. (2005-present). |
Jeffrey S. Christian (49) |
| Year of Election or Appointment: 2009 Deputy Treasurer of the Fidelity funds. Mr. Christian is an employee of Fidelity Investments. Previously, Mr. Christian served as Chief Financial Officer (2008-2009) of certain Fidelity funds and Senior Vice President of Fidelity Pricing and Cash Management Services (FPCMS) (2004-2009). |
Bryan A. Mehrmann (49) |
| Year of Election or Appointment: 2005 Deputy Treasurer of the Fidelity funds. Mr. Mehrmann is an employee of Fidelity Investments. |
Adrien E. Deberghes (43) |
| Year of Election or Appointment: 2008 Deputy Treasurer of Fidelity's Equity and High Income Funds. Mr. Deberghes also serves as Assistant Treasurer of other Fidelity funds (2010-present) and is an employee of Fidelity Investments (2008-present). Previously, Mr. Deberghes served as Senior Vice President of Mutual Fund Administration at State Street Corporation (2007-2008), Senior Director of Mutual Fund Administration at Investors Bank & Trust (2005-2007), and Director of Finance for Dunkin' Brands (2000-2005). |
Stephanie J. Dorsey (41) |
| Year of Election or Appointment: 2010 Assistant Treasurer of Fidelity's Equity and High Income Funds. Ms. Dorsey also serves as Deputy Treasurer of other Fidelity funds (2008-present) and is an employee of Fidelity Investments (2008-present). Previously, Ms. Dorsey served as Treasurer (2004-2008) of the JPMorgan Mutual Funds and Vice President (2004-2008) of JPMorgan Chase Bank. |
John R. Hebble (52) |
| Year of Election or Appointment: 2009 Assistant Treasurer of Fidelity's Equity and High Income Funds. Mr. Hebble also serves as Treasurer and Chief Financial Officer of The North Carolina Capital Management Trust: Cash and Term Portfolio (2008-present), President and Treasurer of other Fidelity funds (2008-present) and is an employee of Fidelity Investments. |
Gary W. Ryan (52) |
| Year of Election or Appointment: 2005 Assistant Treasurer of the Fidelity funds. Mr. Ryan is an employee of Fidelity Investments. Previously, Mr. Ryan served as Vice President of Fund Reporting in Fidelity Pricing and Cash Management Services (FPCMS) (1999-2005). |
Jonathan Davis (42) |
| Year of Election or Appointment: 2010 Assistant Treasurer of the Fidelity funds. Mr. Davis is an employee of Fidelity Investments. Previously, Mr. Davis served as Vice President and Associate General Counsel of FMR LLC (2003-2010). |
Annual Report
The Board of Trustees of Fidelity Latin America Fund voted to pay to shareholders of record at the opening of business on record date, the following distributions per share derived from capital gains realized from sales of portfolio securities and dividends derived from net investment income:
| Pay Date | Record Date | Dividends | Capital Gains |
Institutional Class | 12/06/2010 | 12/03/2010 | $0.203 | $0.200 |
Institutional Class designates 100% of the dividends distributed in September 2010 as amounts which may be taken into account as a dividend for the purposes of the maximum rate under section 1(h)(11) of the Internal Revenue code.
The amounts per share which represent income derived from sources within, and taxes paid to, foreign countries or possessions of the United States are as follows:
| Pay Date | Income | Taxes |
Institutional Class | 09/30/2010 | $0.686 | $0.0948 |
The fund will notify shareholders in January 2011 of amounts for use in preparing 2010 income tax returns.
Annual Report
Board Approval of Investment Advisory Contracts and Management Fees
Fidelity Latin America Fund
Each year, the Board of Trustees, including the Independent Trustees (together, the Board), votes on the renewal of the management contract and sub-advisory agreements (together, the Advisory Contracts) for the fund. The Board, assisted by the advice of fund counsel and Independent Trustees' counsel, requests and considers a broad range of information relevant to the renewal of the Advisory Contracts throughout the year.
The Board meets regularly and considers at each of its meetings factors that are relevant to its annual consideration of the renewal of the fund's Advisory Contracts, including the services and support provided to the fund and its shareholders. The Board has established various standing committees, each composed of Independent Trustees with varying backgrounds, to which the Board has assigned specific subject matter responsibilities in order to enhance effective decision-making by the Board. The Board, acting directly and through its Committees, requests and receives information concerning the annual consideration of the renewal of the fund's Advisory Contracts. The Board also meets as needed to consider matters specifically related to the Board's annual consideration of the renewal of Advisory Contracts. Members of the Board may also meet with trustees of other Fidelity funds through ad hoc joint committees to discuss certain matters relevant to the Fidelity funds.
At its July 2010 meeting, the Board of Trustees, including the Independent Trustees, unanimously determined to renew the fund's Advisory Contracts. In reaching its determination, the Board considered all factors it believed relevant, including (i) the nature, extent, and quality of the services to be provided to the fund and its shareholders (including the investment performance of the fund); (ii) the competitiveness of the fund's management fee and total expenses; (iii) the total costs of the services to be provided by and the profits to be realized by Fidelity from its relationship with the fund; (iv) the extent to which economies of scale would be realized as the fund grows; and (v) whether fee levels reflect these economies of scale, if any, for the benefit of fund shareholders.
In considering whether to renew the Advisory Contracts for the fund, the Board reached a determination, with the assistance of fund counsel and Independent Trustees' counsel and through the exercise of its business judgment, that the renewal of the Advisory Contracts is in the best interests of fund shareholders and that the compensation to be received by Fidelity under the management contract is fair and reasonable. The Board's decision to renew the Advisory Contracts was not based on any single factor noted above, but rather was based on a comprehensive consideration of all the information provided to the Board at its meetings throughout the year. The Board, in reaching its determination to renew the Advisory Contracts, is aware that shareholders in the fund have a broad range of investment choices available to them, including a wide choice among mutual funds offered by Fidelity's competitors, and that the fund's shareholders, with the opportunity to review and weigh the disclosure provided by the fund in its prospectus and other public disclosures, have chosen to invest in this fund, managed by Fidelity.
Nature, Extent, and Quality of Services Provided. The Board considered the staffing within the investment adviser, FMR, and the sub-advisers (together, the Investment Advisers), including the backgrounds of the fund's investment personnel and the fund's investment objective and discipline. The Independent Trustees also had discussions with senior management of Fidelity's investment operations and investment groups. The Board considered the structure of the portfolio manager compensation program and whether this structure provides appropriate incentives to act in the best interest of the fund.
Resources Dedicated to Investment Management and Support Services. The Board and the equity research subcommittee of the Board's Fund Oversight Committee reviewed the size, education, and experience of the Investment Advisers' investment staff, their use of technology, and the Investment Advisers' approach to recruiting, training, and retaining portfolio managers and other research, advisory, and management personnel. The Board noted that Fidelity's analysts have access to a variety of technological tools and market and securities data that enable them to perform both fundamental and quantitative analysis and to specialize in various disciplines. The Board considered Fidelity's extensive global research capabilities that enable the Investment Advisers to aggregate data from various sources in an effort to produce positive investment results. The Board also considered that Fidelity's portfolio managers and analysts have access to daily portfolio attribution that allows for monitoring of a fund's portfolio, as well as an electronic communication system that provides immediate real-time access to research concerning issuers and credit enhancers. The Board noted FMR's continued focus on strengthening the organization and discipline of equity portfolio management and research.
Shareholder and Administrative Services. The Board considered (i) the nature, extent, quality, and cost of advisory, administrative, and shareholder services performed by the Investment Advisers and their affiliates under the Advisory Contracts and under separate agreements covering transfer agency, pricing and bookkeeping, and securities lending services for the fund; (ii) the nature and extent of the investment adviser's supervision of third party service providers, principally custodians and subcustodians; and (iii) the resources devoted to, and the record of compliance with, the fund's compliance policies and procedures. The Board also reviewed the allocation of fund brokerage, including allocations to brokers affiliated with the Investment Advisers, the use of brokerage commissions to pay fund expenses, and the use of "soft" commission dollars to pay for research services.
The Board noted that the growth of fund assets over time across the complex allows Fidelity to reinvest in the development of services designed to enhance the value or convenience of the Fidelity funds as investment vehicles. These services include 24-hour access to account information and market information through phone representatives and over the Internet, and investor education materials and asset allocation tools.
Investment in a Large Fund Family. The Board considered the benefits to shareholders of investing in a Fidelity fund, including the benefits of investing in a fund that is part of a large family of funds offering a variety of investment disciplines and providing a large variety of mutual fund investor services. The Board noted that Fidelity had taken, or had made recommendations that resulted in the Fidelity funds taking, a number of actions over the previous year that benefited particular funds, including (i) dedicating additional resources to investment research and restructuring and broadening the focus of the investment research teams; (ii) bolstering the senior management team that oversees asset management; (iii) launching Class F of certain funds as a lower-fee class available to Freedom K and Freedom Index Funds; (iv) lowering the initial investment minimums and ongoing balance requirements for Real Estate High Income Fund; (v) eliminating subsequent purchase minimums for all funds and adding a waiver of the investment minimum requirement for new accounts opened with the proceeds of a systematic withdrawal plan; (vi) eliminating the withdrawal minimum and maximum limits for systematic withdrawals from Advisor funds; (vii) expanding sales load waivers on Class A shares for Destiny Planholders and expanding Institutional Class eligibility for Class O Destiny Planholders; and (viii) changing certain Class A and Class T sales charge structures to further align them with industry practices.
Annual Report
Board Approval of Investment Advisory Contracts and Management Fees - continued
Investment Performance. The Board considered whether the fund has operated in accordance with its investment objective, as well as its record of compliance with its investment restrictions. It also reviewed the fund's absolute investment performance for the retail class, as well as the fund's relative investment performance for the retail class measured over multiple periods against a broad-based securities market index. The Board noted that FMR does not believe that a meaningful peer group exists against which to compare the fund's performance. The following charts considered by the Board show, over the one-, three-, and five-year periods ended December 31, 2009, the fund's cumulative total returns for the retail class and the cumulative total returns of a broad-based securities market index ("benchmark").
Fidelity Latin America Fund

The Board noted that the investment performance of the fund was lower than its benchmark for all the periods shown. The Board discussed with FMR actions that have been taken by FMR to improve the fund's below-benchmark performance. The Board noted that this fund had underperformed in the previous year and discussed with FMR its disappointment with the continued underperformance of the fund. The Board also reviewed the fund's performance since inception as well as performance in the current year. The Board will continue to closely monitor the performance of the fund in the coming year and discuss with FMR other appropriate actions to address the performance of the fund.
Based on its review, and giving particular weight to the nature and quality of the resources dedicated by the Investment Advisers to maintain and improve relative performance and factoring in the unprecedented market events in recent years, the Board concluded that the nature, extent, and quality of investment management and support services and of shareholder and administrative services provided to the fund will benefit the fund's shareholders, particularly in light of the Board's view that the fund's shareholders benefit from investing in a fund that is part of a large family of funds offering a variety of investment disciplines and services.
Competitiveness of Management Fee and Total Fund Expenses. The Board considered the fund's management fee and total expenses compared to "mapped groups" of competitive funds and classes. Fidelity creates "mapped groups" by combining similar Lipper investment objective categories that have comparable management fee characteristics. Combining Lipper investment objective categories aids the Board's management fee and total expense comparisons by broadening the competitive group used for comparison and by reducing the number of universes to which various Fidelity funds are compared.
Management Fee. The Board considered two proprietary management fee comparisons for the 12-month periods shown in the chart below. The group of Lipper funds used by the Board for management fee comparisons is referred to below as the "Total Mapped Group." The Total Mapped Group comparison focuses on a fund's standing relative to the total universe of comparable funds available to investors, in terms of gross management fees before expense reimbursements or caps, and without giving effect to the fund's performance adjustment. "TMG %" represents the percentage of funds in the Total Mapped Group that had management fees that were lower than the fund's. For example, a TMG % of 7% means that 93% of the funds in the Total Mapped Group had higher management fees than the fund. The "Asset-Size Peer Group" (ASPG) comparison focuses on a fund's standing relative to non-Fidelity funds similar in size to the fund within the Total Mapped Group. The ASPG represents at least 15% of the funds in the Total Mapped Group with comparable asset size and management fee characteristics, subject to a minimum of 50 funds (or all funds in the Total Mapped Group if fewer than 50). Additional information, such as the ASPG quartile in which the fund's management fee ranked and the impact of the fund's performance adjustment, is also included in the chart and considered by the Board.
Annual Report
Fidelity Latin America Fund

The Board noted that the fund's management fee ranked below the median of its Total Mapped Group and below the median of its ASPG for 2009.
Based on its review, the Board concluded that the fund's management fee is fair and reasonable in light of the services that the fund receives and the other factors considered.
Total Expenses. In its review of the fund's total expenses, the Board considered the fund's management fee as well as other fund expenses, such as transfer agent fees, pricing and bookkeeping fees, and custodial, legal, and audit fees. The Board also noted the effects of any waivers and reimbursements on fees and expenses. As part of its review, the Board also considered current and historical total expenses of each fund compared to competitive fund median expenses. The fund is compared to those funds and classes in the Total Mapped Group (used by the Board for management fee comparisons) that have a similar sales load structure.
The Board noted that the fund's total expenses ranked below its competitive median for 2009.
Fees Charged to Other Fidelity Clients. The Board also considered Fidelity fee structures and other information with respect to clients of FMR and its affiliates, such as other mutual funds advised or subadvised by FMR or its affiliates, pension plan clients, and other institutional clients. In March 2010, the Board created an ad hoc joint committee with the board of other Fidelity funds (the Committee) to review and compare Fidelity's institutional investment advisory business with its business of providing services to the Fidelity funds, including the differences in services provided, fees charged, and costs incurred, as well as competition in their respective marketplaces.
Based on its review of total expenses and fees charged to other Fidelity clients, the Board concluded that the total expenses of each class of the fund were reasonable in light of the services that the fund and its shareholders receive and the other factors considered, including the findings of the Committee.
Costs of the Services and Profitability. The Board considered the revenues earned and the expenses incurred by Fidelity in conducting the business of developing, marketing, distributing, managing, administering and servicing the fund and its shareholders. The Board also considered the level of Fidelity's profits in respect of all the Fidelity funds.
On an annual basis, FMR presents to the Board Fidelity's profitability for the fund. Fidelity calculates the profitability for each fund, as well as aggregate profitability for groups of Fidelity funds and all Fidelity funds, using a series of detailed revenue and cost allocation methodologies which originate with the audited books and records of Fidelity. The Audit Committee of the Board reviews any significant changes from the prior year's methodologies.
Annual Report
Board Approval of Investment Advisory Contracts and Management Fees - continued
PricewaterhouseCoopers LLP (PwC), independent registered public accounting firm and auditor to Fidelity and certain Fidelity funds, has been engaged annually by the Board as part of the Board's assessment of Fidelity's profitability analysis. PwC's engagement includes the review and assessment of Fidelity's methodologies used in determining the revenues and expenses attributable to Fidelity's mutual fund business, and completion of agreed-upon procedures surrounding the mathematical accuracy of fund profitability and its conformity to allocation methodologies. After considering PwC's reports issued under the engagement and information provided by Fidelity, the Board believes that while other allocation methods may also be reasonable, Fidelity's profitability methodologies are reasonable in all material respects.
The Board has also reviewed Fidelity's non-fund businesses and fall-out benefits related to the mutual fund business as well as cases where Fidelity's affiliates may benefit from or be related to the fund's business.
The Board considered the costs of the services provided by and the profits realized by Fidelity in connection with the operation of the fund and were satisfied that the profitability was not excessive in the circumstances.
Economies of Scale. The Board considered whether there have been economies of scale in respect of the management of the Fidelity funds, whether the Fidelity funds (including the fund) have appropriately benefited from any such economies of scale, and whether there is potential for realization of any further economies of scale. The Board considered the extent to which the fund will benefit from economies of scale through increased services to the fund, through waivers or reimbursements, or through fee or expense reductions.
In February 2009, the Board and the board of other Fidelity funds created an ad hoc committee (the Economies of Scale Committee) to analyze whether FMR attains economies of scale in respect of the management and servicing of the Fidelity funds, whether the Fidelity funds have appropriately benefited from such economies of scale, and whether there is potential for realization of any further economies of scale.
The Board recognized that the fund's management contract incorporates a "group fee" structure, which provides for lower group fee rates as total fund assets under FMR's management increase, and for higher group fee rates as total fund assets under FMR's management decrease. FMR calculates the group fee rates based on a tiered asset "breakpoint" schedule that varies based on asset class. The Board considered that the group fee is designed to deliver the benefits of economies of scale to fund shareholders when total Fidelity fund assets increase, even if assets of any particular fund are unchanged or have declined, because some portion of Fidelity's costs are attributable to services provided to all Fidelity funds, and all funds benefit if those costs can be allocated among more assets. The Board concluded that, given the group fee structure, fund shareholders will benefit from lower management fees as assets under FMR's management increase at the fund complex level, regardless of whether Fidelity achieves any such economies of scale.
The Board concluded, considering the findings of the Economies of Scale Committee, that any potential economies of scale are being appropriately shared between fund shareholders and Fidelity.
Additional Information Requested by the Board. In order to develop fully the factual basis for consideration of the Fidelity funds' Advisory Contracts, the Board requested and received additional information on certain topics, including (i) fund performance trends, actions to be taken by FMR to improve certain funds' overall performance, and Fidelity's long-term strategies for certain funds; (ii) portfolio manager changes that have occurred during the past year and length of portfolio manager tenure for different categories of funds over time; (iii) Fidelity's compensation structure for portfolio managers, research analysts, and other key personnel, the rationale for the compensation structure, and how the compensation structure provides appropriate performance incentives; (iv) the amount of the investment that each portfolio manager has made in the Fidelity fund(s) that he or she manages; (v) management and other fees paid by FMR to affiliated sub-advisers on behalf of the Fidelity funds; (vi) Fidelity's fee structures and rationale for recommending different fees among different categories of funds; (vii) Fidelity's rationale for recommending which funds should have a performance adjustment component as part of their management fees; (viii) the rationale for any differences between fund fee structures and fee structures in place for other Fidelity clients; and (ix) explanations regarding the relative total expenses borne by certain funds and classes, total expense competitive trends, and actions that might be taken by FMR to reduce total expenses for certain funds and classes.
Based on its evaluation of all of the conclusions noted above, and after considering all factors it believed relevant, the Board ultimately concluded that the advisory fee structures are fair and reasonable, and that the fund's Advisory Contracts should be renewed.
Annual Report
Investment Adviser
Fidelity Management & Research Company
Boston, MA
Investment Sub-Advisers
FMR Co., Inc.
Fidelity Management & Research
(U.K.) Inc.
Fidelity Research & Analysis Company
FIL Investment Advisors
FIL Investments (Japan) Limited
FIL Investment Advisors
(U.K.) Ltd.
Fidelity Management & Research
(Hong Kong) Limited
Fidelity Management & Research
(Japan) Inc.
General Distributor
Fidelity Distributors Corporation
Boston, MA
Transfer and Service Agents
Fidelity Investments Institutional Operations Company, Inc.
Boston, MA
Fidelity Service Company, Inc.
Boston, MA
Custodian
Brown Brothers Harriman & Co.
Boston, MA
FALAI-UANN-1210
1.917407.100
Fidelity®
Emerging Europe,
Middle East, Africa (EMEA)
Fund
Annual Report
October 31, 2010
(2_fidelity_logos) (Registered_Trademark)
Contents
Chairman's Message | <Click Here> | The Chairman's message to shareholders. |
Performance | <Click Here> | How the fund has done over time. |
Management's Discussion of Fund Performance | <Click Here> | The Porfolio Manager's review of fund performance and strategy. |
Shareholder Expense Example | <Click Here> | An example of shareholder expenses. |
Investment Changes | <Click Here> | A summary of major shifts in the fund's investments over the past six months. |
Investments | <Click Here> | A complete list of the fund's investments with their market values. |
Financial Statements | <Click Here> | Statements of assets and liabilities, operations, and changes in net assets, as well as financial highlights. |
Notes | <Click Here> | Notes to the financial statements. |
Report of Independent Registered Public Accounting Firm | <Click Here> | |
Trustees and Officers | <Click Here> | |
Distributions | <Click Here> | |
Board Approval of Investment Advisory Contracts and Management Fees | <Click Here> | |
To view a fund's proxy voting guidelines and proxy voting record for the 12-month period ended June 30, visit http://www.fidelity.com/proxyvotingresults or visit the Securities and Exchange Commission's (SEC) web site at http://www.sec.gov. You may also call 1-800-544-8544 to request a free copy of the proxy voting guidelines.
Standard & Poor's, S&P and S&P 500 are registered service marks of The McGraw-Hill Companies, Inc. and have been licensed for use by Fidelity Distributors Corporation.
Other third party marks appearing herein are the property of their respective owners.
All other marks appearing herein are registered or unregistered trademarks or service marks of FMR LLC or an affiliated company.
Annual Report
This report and the financial statements contained herein are submitted for the general information of the shareholders of the fund. This report is not authorized for distribution to prospective investors in the fund unless preceded or accompanied by an effective prospectus.
A fund files its complete schedule of portfolio holdings with the SEC for the first and third quarters of each fiscal year on Form N-Q. Forms N-Q are available on the SEC's web site at http://www.sec.gov. A fund's Forms N-Q may be reviewed and copied at the SEC's Public Reference Room in Washington, DC. Information regarding the operation of the SEC's Public Reference Room may be obtained by calling 1-800-SEC-0330. For a complete list of a fund's portfolio holdings, view the most recent holdings listing, semiannual report, or annual report on Fidelity's web site at http://www.fidelity.com or http://advisor.fidelity.com, as applicable.
NOT FDIC INSURED • MAY LOSE VALUE • NO BANK GUARANTEE
Neither the fund nor Fidelity Distributors Corporation is a bank.
Annual Report
(photo_of_Edward_C_Johnson_3d)
Dear Shareholder:
Equities have staged a rally in the second half of 2010, shaking off concerns about the European debt crisis and the possibility of a double-dip recession in the U.S. Although the short-term surge pushed major equity indexes back into positive territory for the year, several questions remain about the longer-term outlook, including lackluster economic growth and persistently high unemployment. Financial markets are always unpredictable, of course, but there also are several time-tested investment principles that can help put the odds in your favor.
One of the basic tenets is to invest for the long term. Over time, riding out the markets' inevitable ups and downs has proven much more effective than selling into panic or chasing the hottest trend. Even missing only a few of the markets' best days can significantly diminish investor returns. Patience also affords the benefits of compounding - of earning interest on additional income or reinvested dividends and capital gains. There can be tax advantages and cost benefits to consider as well. While staying the course doesn't eliminate risk, it can considerably lessen the effect of short-term declines.
You can further manage your investing risk through diversification. And today, more than ever, geographic diversification should be taken into account. Studies indicate that asset allocation is the single most important determinant of a portfolio's long-term success. The right mix of stocks, bonds and cash - aligned to your particular risk tolerance and investment objective - is very important. Age-appropriate rebalancing is also an essential aspect of asset allocation. For younger investors, an emphasis on equities - which historically have been the best-performing asset class over time - is encouraged. As investors near their specific goal, such as retirement or sending a child to college, consideration may be given to replacing volatile assets (e.g. common stocks) with more-stable fixed investments (bonds or savings plans).
A third principle - investing regularly - can help lower the average cost of your purchases. Investing a certain amount of money each month or quarter helps ensure you won't pay for all your shares at market highs. This strategy - known as dollar cost averaging - also reduces "emotion" from investing, helping shareholders avoid selling weak performers just prior to an upswing, or chasing a hot performer just before a correction.
We invite you to contact us via the Internet, through our Investor Centers or by phone. It is our privilege to provide you the information you need to make the investments that are right for you.
Sincerely,
(The chairman's signature appears here.)
Edward C. Johnson 3d
Annual Report
Average annual total return reflects the change in the value of an investment, assuming reinvestment of the class' distributions from dividend income and capital gains (the profits earned upon the sale of securities that have grown in value, if any) and assuming a constant rate of performance each year. The $10,000 table and the fund's returns do not reflect the deduction of taxes that a shareholder would pay on fund distributions or the redemption of fund shares. During periods of reimbursement by Fidelity, a fund's total return will be greater than it would be had the reimbursement not occurred. How a fund did yesterday is no guarantee of how it will do tomorrow.
Average Annual Total Returns
Periods ended October 31, 2010 | Past 1
year | Life of
fund A |
Fidelity® Emerging Europe, Middle East, Africa (EMEA) Fund | 24.92% | -3.45% |
A From May 8, 2008.
$10,000 Over Life of Fund
Let's say hypothetically that $10,000 was invested in Fidelity® Emerging Europe, Middle East, Africa (EMEA) Fund, a class of the fund, on May 8, 2008, when the fund started. The chart shows how the value of your investment would have changed, and also shows how the MSCI® EM (Emerging Markets) Europe, Middle East and Africa Index performed over the same period.
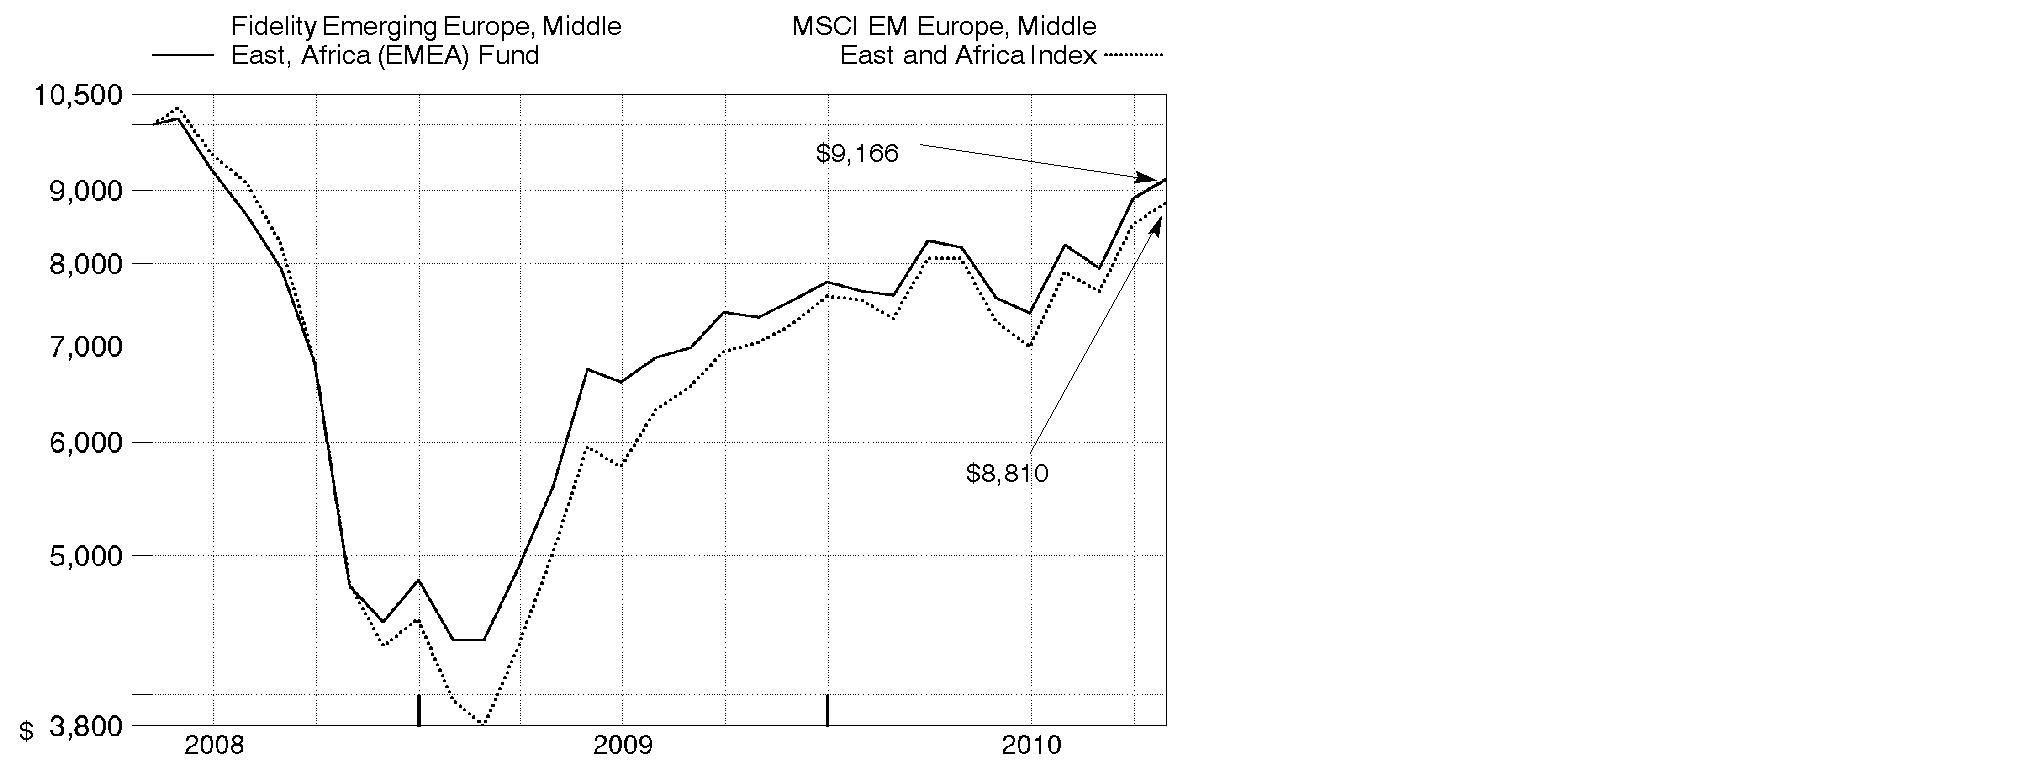
Annual Report
Market Recap: The return-to-risk theme was evident within emerging markets during the 12 months ending October 31, 2010. The combination of strong economic growth and superior fiscal conditions bolstered the performance of emerging-markets stocks, as they finished the period well ahead of most foreign developed-country stock indexes. Several smaller country constituents provided a big boost to the index, while most of its biggest components, though strong, still lagged. The falling value of the U.S. dollar relative to most emerging-markets currencies also provided a meaningful contribution. Rising commodity prices supported returns in commodity-producing regions, such as Latin America, which also benefited from the announced integration of the Chile, Colombia and Peru stock exchanges, scheduled for November. For the 12 months ending October 31, 2010, the MSCI® Emerging Markets Index climbed 23.89%. Among emerging-markets countries, major index components South Korea, Taiwan, Brazil and China gained roughly 25%, 21%, 15% and 9%, respectively. India, also a large constituent, solidly beat the index, returning about 35%. Other strong-performing countries included Thailand (62%), Turkey (55%), Indonesia (52%), Malaysia (36%), Mexico (34%) and South Africa (33%).
Comments from Adam Kutas, Portfolio Manager of Fidelity® Emerging Europe, Middle East, Africa (EMEA) Fund: For the year, the fund's Retail Class shares returned 24.92%, versus the 25.07% return of the MSCI EM (Emerging Markets) Europe, Middle East and Africa Index. The fund's positioning in financials and materials detracted, as did a modest cash position within a strong market. Geographically, the fund lost ground due to unsuccessful stock selection in South Africa and by underweighting Turkey. Underweighting South African cable TV company Naspers and South African gold company AngloGold Ashanti hurt, along with untimely ownership of Harmony Gold Mining. Conversely, overweighting consumer staples and consumer discretionary helped, along with successful stock picks in telecommunication services. Favorable stock selection in Nigeria, Israel and Egypt boosted results. The fund's investments in Nigeria were out of index. South African retailers Clicks Group and Shoprite Holdings contributed, as did Russian gold and silver producer Polymetal.
Note to shareholders: The fund may invest up to 35% of its total assets in any industry that represents more than 20% of the emerging Europe, Middle East and Africa markets. As of October 31, 2010, the fund did not have more than 25% of its total assets invested in any one industry.
The views expressed above reflect those of the portfolio manager(s) only through the end of the period as stated on the cover of this report and do not necessarily represent the views of Fidelity or any other person in the Fidelity organization. Any such views are subject to change at any time based upon market or other conditions and Fidelity disclaims any responsibility to update such views. These views may not be relied on as investment advice and, because investment decisions for a Fidelity fund are based on numerous factors, may not be relied on as an indication of trading intent on behalf of any Fidelity fund.
Annual Report
Shareholder Expense Example
As a shareholder of the Fund, you incur two types of costs: (1) transaction costs, including sales charges (loads) on purchase payments or redemption proceeds, redemption fees, and (2) ongoing costs, including management fees, distribution and/or service (12b-1) fees and other Fund expenses. This Example is intended to help you understand your ongoing costs (in dollars) of investing in the Fund and to compare these costs with the ongoing costs of investing in other mutual funds.
The Example is based on an investment of $1,000 invested at the beginning of the period and held for the entire period (May 1, 2010 to October 31, 2010).
Actual Expenses
The first line of the accompanying table for each class of the Fund provides information about actual account values and actual expenses. You may use the information in this line, together with the amount you invested, to estimate the expenses that you paid over the period. Simply divide your account value by $1,000.00 (for example, an $8,600 account value divided by $1,000.00 = 8.6), then multiply the result by the number in the first line for a class of the Fund under the heading entitled "Expenses Paid During Period" to estimate the expenses you paid on your account during this period. A small balance maintenance fee of $12.00 that is charged once a year may apply for certain accounts with a value of less than $2,000. This fee is not included in the table below. If it was, the estimate of expenses you paid during the period would be higher, and your ending account value lower, by this amount. In addition, the Fund, as a shareholder in the underlying Fidelity Central Funds, will indirectly bear its pro-rata share of the fees and expenses incurred by the underlying Fidelity Central Funds. These fees and expenses are not included in the Fund's annualized expense ratio used to calculate the expense estimate in the table below.
Hypothetical Example for Comparison Purposes
The second line of the accompanying table for each class of the Fund provides information about hypothetical account values and hypothetical expenses based on a Class' actual expense ratio and an assumed rate of return of 5% per year before expenses, which is not the Class' actual return. The hypothetical account values and expenses may not be used to estimate the actual ending account balance or expenses you paid for the period. You may use this information to compare the ongoing costs of investing in the Fund and other funds. To do so, compare this 5% hypothetical example with the 5% hypothetical examples that appear in the shareholder reports of the other funds. A small balance maintenance fee of $12.00 that is charged once a year may apply for certain accounts with a value of less than $2,000. This fee is not included in the table below. If it was, the estimate of expenses you paid during the period would be higher, and your ending account value lower, by this amount. In addition, the Fund, as a shareholder in the underlying Fidelity Central Funds, will indirectly bear its pro-rata share of the fees and expenses incurred by the underlying Fidelity Central Funds. These fees and expenses are not included in the Fund's annualized expense ratio used to calculate the expense estimate in the table below.
Please note that the expenses shown in the table are meant to highlight your ongoing costs only and do not reflect any transaction costs. Therefore, the second line of the table is useful in comparing ongoing costs only, and will not help you determine the relative total costs of owning different funds. In addition, if these transactional costs were included, your costs would have been higher.
Annual Report
| Annualized
Expense Ratio | Beginning
Account Value
May 1, 2010 | Ending
Account Value
October 31, 2010 | Expenses Paid
During Period*
May 1, 2010 to
October 31, 2010 |
Class A | 1.50% ** | | | |
Actual | | $ 1,000.00 | $ 1,115.70 | $ 8.00 ** |
HypotheticalA | | $ 1,000.00 | $ 1,017.64 | $ 7.63 ** |
Class T | 1.75% ** | | | |
Actual | | $ 1,000.00 | $ 1,114.40 | $ 9.33 ** |
HypotheticalA | | $ 1,000.00 | $ 1,016.38 | $ 8.89 ** |
Class B | 2.25% ** | | | |
Actual | | $ 1,000.00 | $ 1,112.10 | $ 11.98 ** |
HypotheticalA | | $ 1,000.00 | $ 1,013.86 | $ 11.42 ** |
Class C | 2.25% ** | | | |
Actual | | $ 1,000.00 | $ 1,111.10 | $ 11.97 ** |
HypotheticalA | | $ 1,000.00 | $ 1,013.86 | $ 11.42 ** |
Emerging Europe, Middle East, Africa (EMEA) | 1.25% ** | | | |
Actual | | $ 1,000.00 | $ 1,116.60 | $ 6.67 ** |
HypotheticalA | | $ 1,000.00 | $ 1,018.90 | $ 6.36 ** |
Institutional Class | 1.25% ** | | | |
Actual | | $ 1,000.00 | $ 1,118.00 | $ 6.67 ** |
HypotheticalA | | $ 1,000.00 | $ 1,018.90 | $ 6.36 ** |
A 5% return per year before expenses
* Expenses are equal to each Class' annualized expense ratio, multiplied by the average account value over the period, multiplied by 184/365 (to reflect the one-half year period).
** If changes to voluntary expense limitations, effective January 1, 2011 had been in effect during the entire period, the annualized expense ratios and the expenses paid in the actual and hypothetical examples above would have been as follows:
| Annualized
Expense Ratio |
Expenses Paid
|
Class A | 1.62% | |
Actual | | $ 8.64 |
HypotheticalA | | $ 8.24 |
| Annualized
Expense Ratio |
Expenses Paid
|
Class T | 1.89% | |
Actual | | $ 10.07 |
HypotheticalA | | $ 9.60 |
Class B | 2.38% | |
Actual | | $ 12.67 |
HypotheticalA | | $ 12.08 |
Class C | 2.37% | |
Actual | | $ 12.61 |
HypotheticalA | | $ 12.03 |
Emerging Europe, Middle East, Africa (EMEA) | 1.36% | |
Actual | | $ 7.25 |
HypotheticalA | | $ 6.92 |
Institutional Class | 1.27% | |
Actual | | $ 6.78 |
HypotheticalA | | $ 6.46 |
A 5% return per year before expenses
Annual Report
Investment Changes (Unaudited)
Geographic Diversification (% of fund's net assets) |
As of October 31, 2010 |
 | South Africa 44.7% | |
 | Russia 28.1% | |
 | Turkey 11.0% | |
 | United States of America* 4.5% | |
 | Poland 3.1% | |
 | Qatar 1.1% | |
 | Kenya 1.1% | |
 | Morocco 1.0% | |
 | Egypt 0.9% | |
 | Other 4.5% | |

* Includes short-term investments and net other assets. |
As of April 30, 2010 |
| South Africa 37.2% | |
| Russia 31.6% | |
| Israel 14.4% | |
| Turkey 3.5% | |
| Nigeria 2.8% | |
| Poland 1.7% | |
| Qatar 1.1% | |
| Morocco 1.1% | |
| Kenya 1.1% | |
| Other* 5.5% | |

* Includes short-term investments and net other assets. |
Asset Allocation |
| % of fund's
net assets | % of fund's net assets
6 months ago |
Stocks | 95.1 | 98.9 |
Bonds | 0.4 | 0.5 |
Short-Term Investments and Net Other Assets | 4.5 | 0.6 |
Top Ten Stocks as of October 31, 2010 |
| % of fund's
net assets | % of fund's net assets
6 months ago |
OAO Gazprom (Russia, Oil, Gas & Consumable Fuels) | 6.5 | 7.3 |
Sberbank (Savings Bank of the Russian Federation) (Russia, Commercial Banks) | 4.8 | 3.7 |
MTN Group Ltd. (South Africa, Wireless Telecommunication Services) | 4.7 | 3.2 |
Lukoil Oil Co. sponsored ADR (United Kingdom) (Russia, Oil, Gas & Consumable Fuels) | 4.5 | 4.5 |
Standard Bank Group Ltd. (South Africa, Commercial Banks) | 4.1 | 4.1 |
Turkiye Garanti Bankasi AS (Turkey, Commercial Banks) | 3.4 | 1.8 |
FirstRand Ltd. (South Africa, Diversified Financial Services) | 3.2 | 2.7 |
Exxaro Resources Ltd. (South Africa, Metals & Mining) | 3.0 | 2.2 |
Shoprite Holdings Ltd. (South Africa, Food & Staples Retailing) | 2.8 | 2.7 |
Sasol Ltd. (South Africa, Oil, Gas & Consumable Fuels) | 2.8 | 2.8 |
| 39.8 | |
Market Sectors as of October 31, 2010 |
| % of fund's
net assets | % of fund's net assets
6 months ago |
Financials | 25.9 | 22.9 |
Energy | 20.2 | 19.1 |
Materials | 13.0 | 15.1 |
Telecommunication Services | 9.4 | 10.1 |
Consumer Discretionary | 9.2 | 6.4 |
Consumer Staples | 8.9 | 6.1 |
Industrials | 4.4 | 3.6 |
Health Care | 2.7 | 11.7 |
Utilities | 1.0 | 2.3 |
Information Technology | 0.4 | 1.6 |
Annual Report
Investments October 31, 2010
Showing Percentage of Net Assets
Common Stocks - 95.1% |
| Shares | | Value |
Australia - 0.3% |
Centamin Egypt Ltd.: | | | |
(Canada) (a) | 50,000 | | $ 141,190 |
(United Kingdom) (a) | 150,000 | | 415,758 |
TOTAL AUSTRALIA | | 556,948 |
Bailiwick of Jersey - 0.3% |
Randgold Resources Ltd. | 5,200 | | 487,311 |
Canada - 0.9% |
Bankers Petroleum Ltd. (a) | 107,000 | | 750,123 |
Equinox Minerals Ltd. (a) | 33,900 | | 184,142 |
TransGlobe Energy Corp. (a) | 50,900 | | 533,504 |
TOTAL CANADA | | 1,467,769 |
Egypt - 0.9% |
Arab Polvara Spinning & Weaving Co. (a) | 680,000 | | 481,614 |
Commercial International Bank Ltd. | 74,300 | | 559,687 |
Egyptian Co. for Mobile Services (MobiNil) | 14,932 | | 444,902 |
TOTAL EGYPT | | 1,486,203 |
Kenya - 1.1% |
British American Tobacco Kenya Ltd. | 179,800 | | 616,775 |
East African Breweries Ltd. | 266,969 | | 700,897 |
Safaricom Ltd. | 7,100,000 | | 426,440 |
TOTAL KENYA | | 1,744,112 |
Morocco - 1.0% |
Maroc Telecom | 90,100 | | 1,705,027 |
Nigeria - 0.8% |
Guaranty Trust Bank PLC GDR (Reg. S) | 54,913 | | 398,668 |
Nigerian Breweries PLC | 662,403 | | 334,188 |
United Bank for Africa PLC | 3,986,048 | | 237,894 |
Zenith Bank PLC | 4,472,241 | | 390,580 |
TOTAL NIGERIA | | 1,361,330 |
Poland - 3.1% |
Bank Polska Kasa Opieki SA | 39,900 | | 2,607,697 |
Eurocash SA | 157,300 | | 1,445,777 |
Powszechna Kasa Oszczednosci Bank SA | 69,900 | | 1,103,471 |
TOTAL POLAND | | 5,156,945 |
Qatar - 1.1% |
Qatar National Bank SAQ | 41,725 | | 1,887,444 |
Common Stocks - continued |
| Shares | | Value |
Russia - 28.1% |
Comstar United TeleSystems OJSC GDR (Reg. S) (a) | 396,557 | | $ 2,569,689 |
DIXY Group OJSC (a) | 62,300 | | 811,671 |
Interregional Distribution Grid Companies Holding JSC (a) | 2,893,400 | | 501,324 |
Lukoil Oil Co. sponsored ADR (United Kingdom) | 134,395 | | 7,499,241 |
Magnit OJSC | 14,200 | | 1,654,353 |
Mobile TeleSystems OJSC (a) | 123,100 | | 997,863 |
Mobile TeleSystems OJSC sponsored ADR | 15,000 | | 324,750 |
Novolipetsk Steel Ojsc | 36,600 | | 1,252,818 |
Novorossiysk Commercial Sea Port JSC | 2,781,700 | | 339,806 |
OAO Gazprom (a) | 1,963,700 | | 10,759,302 |
OAO NOVATEK (a) | 71,900 | | 578,470 |
OAO NOVATEK GDR | 40,200 | | 3,845,130 |
OJSC MMC Norilsk Nickel (a) | 7,200 | | 1,303,694 |
OJSC Oil Co. Rosneft (a) | 75,500 | | 528,303 |
OJSC Oil Company Rosneft GDR (Reg. S) | 294,200 | | 2,050,574 |
Polymetal JSC (a) | 20,500 | | 328,149 |
Protek (a) | 54,500 | | 98,936 |
RusHydro JSC (a) | 15,098,400 | | 776,043 |
Sberbank (Savings Bank of the Russian Federation) | 2,426,500 | | 7,974,184 |
Sistema JSFC sponsored GDR | 25,200 | | 650,160 |
Surgutneftegaz JSC sponsored ADR | 70,900 | | 694,820 |
TGK-1 OAO (a) | 562,635,400 | | 390,469 |
Uralkali JSC (a) | 100,000 | | 494,824 |
VTB Bank JSC unit | 47,100 | | 311,802 |
TOTAL RUSSIA | | 46,736,375 |
South Africa - 44.7% |
Africa Cellular Towers Ltd. (a) | 5,335,800 | | 190,427 |
African Rainbow Minerals Ltd. | 70,500 | | 1,798,567 |
AngloGold Ashanti Ltd. | 72,400 | | 3,395,565 |
Aspen Pharmacare Holdings Ltd. | 237,500 | | 3,170,035 |
Aveng Ltd. | 157,700 | | 990,543 |
Barloworld Ltd. | 44,200 | | 331,261 |
Bidvest Group Ltd. | 72,200 | | 1,540,153 |
Cashbuild Ltd. | 80,500 | | 1,085,967 |
Clicks Group Ltd. | 649,060 | | 4,234,380 |
DRDGOLD Ltd. | 458,514 | | 227,074 |
Exxaro Resources Ltd. | 262,400 | | 4,944,547 |
FirstRand Ltd. | 1,780,100 | | 5,237,345 |
Foschini Ltd. | 105,600 | | 1,281,814 |
Harmony Gold Mining Co. Ltd. | 345,900 | | 3,972,237 |
Illovo Sugar Ltd. | 245,703 | | 911,953 |
Common Stocks - continued |
| Shares | | Value |
South Africa - continued |
Impala Platinum Holdings Ltd. | 53,300 | | $ 1,506,542 |
JSE Ltd. | 35,000 | | 394,715 |
Lewis Group Ltd. | 61,500 | | 627,726 |
Mr Price Group Ltd. | 177,000 | | 1,608,528 |
MTN Group Ltd | 439,250 | | 7,900,800 |
Naspers Ltd. Class N | 58,600 | | 3,076,959 |
Northam Platinum Ltd. | 131,800 | | 911,587 |
Paracon Holdings Ltd. | 2,797,128 | | 682,806 |
Pioneer Foods Ltd. | 72,600 | | 507,937 |
Raubex Group Ltd. | 339,200 | | 1,209,587 |
RMB Holdings Ltd. | 194,100 | | 1,001,388 |
Sanlam Ltd. | 640,500 | | 2,401,058 |
Sasol Ltd. | 102,100 | | 4,597,767 |
Shoprite Holdings Ltd. | 332,100 | | 4,694,405 |
Spur Corp. Ltd. | 100,000 | | 199,856 |
Standard Bank Group Ltd. | 465,963 | | 6,871,325 |
Tiger Brands Ltd. | 38,700 | | 1,037,628 |
Woolworths Holdings Ltd. | 485,792 | | 1,903,625 |
TOTAL SOUTH AFRICA | | 74,446,107 |
Turkey - 11.0% |
Bim Birlesik Magazalar AS JSC | 43,000 | | 1,476,504 |
Boyner Buyuk Magazacilik AS (a) | 286,000 | | 665,997 |
Koc Holding AS | 540,000 | | 2,578,958 |
Sekerbank TAS | 375,000 | | 475,842 |
Trakya Cam Sanayii AS | 211,120 | | 447,469 |
Tupras-Turkiye Petrol Rafinerileri AS | 57,000 | | 1,530,015 |
Turk Telekomunikasyon AS | 132,000 | | 616,607 |
Turkiye Garanti Bankasi AS | 922,000 | | 5,656,836 |
Turkiye Halk Bankasi AS | 241,000 | | 2,436,380 |
Turkiye Is Bankasi AS Series C | 558,000 | | 2,509,308 |
TOTAL TURKEY | | 18,393,916 |
United Arab Emirates - 0.6% |
First Gulf Bank PJSC | 140,000 | | 630,837 |
National Bank of Abu Dhabi PJSC (a) | 100,000 | | 325,356 |
TOTAL UNITED ARAB EMIRATES | | 956,193 |
United Kingdom - 0.9% |
Aurelian Oil & Gas PLC (a) | 237,246 | | 231,863 |
Hikma Pharmaceuticals PLC | 95,992 | | 1,208,818 |
TOTAL UNITED KINGDOM | | 1,440,681 |
Common Stocks - continued |
| Shares | | Value |
Zambia - 0.3% |
Zambeef Products PLC (a) | 629,909 | | $ 501,486 |
TOTAL COMMON STOCKS (Cost $133,056,464) | 158,327,847 |
Government Obligations - 0.4% |
| Principal Amount | | |
Ghana - 0.4% |
Ghana Republic 14.99% 3/11/13
(Cost $672,328) | GHS | 950,000 | | 688,253 |
Money Market Funds - 6.7% |
| Shares | | |
Fidelity Cash Central Fund, 0.23% (b)
(Cost $11,176,764) | 11,176,764 | | 11,176,764 |
TOTAL INVESTMENT PORTFOLIO - 102.2% (Cost $144,905,556) | | 170,192,864 |
NET OTHER ASSETS (LIABILITIES) - (2.2)% | | (3,621,104) |
NET ASSETS - 100% | $ 166,571,760 |
Currency Abbreviations |
GHS | - | Ghana Cedi |
Legend |
(a) Non-income producing |
(b) Affiliated fund that is available only to investment companies and other accounts managed by Fidelity Investments. The rate quoted is the annualized seven-day yield of the fund at period end. A complete unaudited listing of the fund's holdings as of its most recent quarter end is available upon request. In addition, each Fidelity Central Fund's financial statements, which are not covered by the Fund's report of Independent Registered Public Accounting Firm, are available on the SEC's website or upon request. |
Affiliated Central Funds |
Information regarding fiscal year to date income earned by the Fund from investments in Fidelity Central Funds is as follows: |
Fund | Income earned |
Fidelity Cash Central Fund | $ 5,948 |
Other Information |
The following is a summary of the inputs used, as of October 31, 2010, involving the Fund's assets and liabilities carried at fair value. The inputs or methodology used for valuing securities may not be an indication of the risk associated with investing in those securities. For more information on valuation inputs, and their aggregation into the levels used in the table below, please refer to the Security Valuation section in the accompanying Notes to Financial Statements. |
Valuation Inputs at Reporting Date: |
Description | Total | Level 1 | Level 2 | Level 3 |
Investments in Securities: | | | | |
Equities: | | | | |
South Africa | $ 74,446,107 | $ 62,253,464 | $ 12,192,643 | $ - |
Russia | 46,736,375 | 46,736,375 | - | - |
Turkey | 18,393,916 | 18,393,916 | - | - |
Poland | 5,156,945 | 5,156,945 | - | - |
Qatar | 1,887,444 | 1,887,444 | - | - |
Kenya | 1,744,112 | 1,744,112 | - | - |
Morocco | 1,705,027 | 1,705,027 | - | - |
Egypt | 1,486,203 | 1,486,203 | - | - |
Canada | 1,467,769 | 1,467,769 | - | - |
Other | 5,303,949 | 4,816,638 | 487,311 | - |
Government Obligations | 688,253 | - | 688,253 | - |
Money Market Funds | 11,176,764 | 11,176,764 | - | - |
Total Investments in Securities: | $ 170,192,864 | $ 156,824,657 | $ 13,368,207 | $ - |
Income Tax Information |
At October 31, 2010, the Fund had a capital loss carryforward of approximately $13,853,821 of which $9,997,975, $579,836 and $3,276,010 will expire on October 31, 2016, 2017 and 2018, respectively. Capital loss carryforwards are only available to offset future capital gains of the Fund to the extent provided by regulations and may be limited. |
See accompanying notes which are an integral part of the financial statements.
Annual Report
Statement of Assets and Liabilities
| October 31, 2010 |
| | |
Assets | | |
Investment in securities, at value - See accompanying schedule: Unaffiliated issuers (cost $133,728,792) | $ 159,016,100 | |
Fidelity Central Funds (cost $11,176,764) | 11,176,764 | |
Total Investments (cost $144,905,556) | | $ 170,192,864 |
Cash | | 446,420 |
Foreign currency held at value (cost $43,853) | | 43,853 |
Receivable for investments sold | | 715,643 |
Receivable for fund shares sold | | 1,038,751 |
Dividends receivable | | 331,131 |
Interest receivable | | 12,515 |
Distributions receivable from Fidelity Central Funds | | 1,870 |
Receivable from investment adviser for expense reductions | | 8,629 |
Other receivables | | 29,697 |
Total assets | | 172,821,373 |
| | |
Liabilities | | |
Payable for investments purchased | $ 5,868,963 | |
Payable for fund shares redeemed | 141,498 | |
Accrued management fee | 106,100 | |
Distribution and service plan fees payable | 8,041 | |
Other affiliated payables | 39,543 | |
Other payables and accrued expenses | 85,468 | |
Total liabilities | | 6,249,613 |
| | |
Net Assets | | $ 166,571,760 |
Net Assets consist of: | | |
Paid in capital | | $ 155,164,861 |
Undistributed net investment income | | 1,374,218 |
Accumulated undistributed net realized gain (loss) on investments and foreign currency transactions | | (15,260,687) |
Net unrealized appreciation (depreciation) on investments and assets and liabilities in foreign currencies | | 25,293,368 |
Net Assets | | $ 166,571,760 |
See accompanying notes which are an integral part of the financial statements.
Annual Report
Statement of Assets and Liabilities - continued
| October 31, 2010 |
| | |
Calculation of Maximum Offering Price
Class A:
Net Asset Value and redemption price per share
($10,044,764 ÷ 1,119,448 shares) | | $ 8.97 |
| | |
Maximum offering price per share (100/94.25 of $8.97) | | $ 9.52 |
Class T:
Net Asset Value and redemption price per share ($3,114,301 ÷ 347,709 shares) | | $ 8.96 |
| | |
Maximum offering price per share (100/96.50 of $8.96) | | $ 9.28 |
Class B:
Net Asset Value and offering price per share ($821,549 ÷ 92,047 shares)A | | $ 8.93 |
| | |
Class C:
Net Asset Value and offering price per share ($5,150,926 ÷ 578,544 shares)A | | $ 8.90 |
| | |
Emerging Europe, Middle East, Africa (EMEA):
Net Asset Value, offering price and redemption price per share ($140,269,534 ÷ 15,584,892 shares) | | $ 9.00 |
| | |
Institutional Class:
Net Asset Value, offering price and redemption price per share ($7,170,686 ÷ 796,981 shares) | | $ 9.00 |
A Redemption price per share is equal to net asset value less any applicable contingent deferred sales charge.
See accompanying notes which are an integral part of the financial statements.
Annual Report
Financial Statements - continued
Statement of Operations
| Year ended October 31, 2010 |
| | |
Investment Income | | |
Dividends | | $ 3,210,853 |
Interest | | 62,448 |
Income from Fidelity Central Funds | | 5,948 |
Income before foreign taxes withheld | | 3,279,249 |
Less foreign taxes withheld | | (232,147) |
Total income | | 3,047,102 |
| | |
Expenses | | |
Management fee | $ 1,059,214 | |
Transfer agent fees | 390,768 | |
Distribution and service plan fees | 70,509 | |
Accounting fees and expenses | 67,808 | |
Custodian fees and expenses | 228,559 | |
Independent trustees' compensation | 723 | |
Registration fees | 84,861 | |
Audit | 61,037 | |
Legal | 579 | |
Miscellaneous | 1,497 | |
Total expenses before reductions | 1,965,555 | |
Expense reductions | (428,870) | 1,536,685 |
Net investment income (loss) | | 1,510,417 |
Realized and Unrealized Gain (Loss) Net realized gain (loss) on: | | |
Investment securities: | | |
Unaffiliated issuers | (2,970,479) | |
Foreign currency transactions | (243,247) | |
Total net realized gain (loss) | | (3,213,726) |
Change in net unrealized appreciation (depreciation) on: Investment securities | 29,132,713 | |
Assets and liabilities in foreign currencies | 3,280 | |
Total change in net unrealized appreciation (depreciation) | | 29,135,993 |
Net gain (loss) | | 25,922,267 |
Net increase (decrease) in net assets resulting from operations | | $ 27,432,684 |
See accompanying notes which are an integral part of the financial statements.
Annual Report
Statement of Changes in Net Assets
| Year ended
October 31,
2010 | Year ended
October 31,
2009 |
Increase (Decrease) in Net Assets | | |
Operations | | |
Net investment income (loss) | $ 1,510,417 | $ 737,293 |
Net realized gain (loss) | (3,213,726) | (1,386,047) |
Change in net unrealized appreciation (depreciation) | 29,135,993 | 27,532,507 |
Net increase (decrease) in net assets resulting
from operations | 27,432,684 | 26,883,753 |
Distributions to shareholders from net investment income | (816,015) | (273,102) |
Distributions to shareholders from net realized gain | (391,419) | - |
Total distributions | (1,207,434) | (273,102) |
Share transactions - net increase (decrease) | 22,045,599 | 53,100,517 |
Redemption fees | 89,745 | 105,938 |
Total increase (decrease) in net assets | 48,360,594 | 79,817,106 |
| | |
Net Assets | | |
Beginning of period | 118,211,166 | 38,394,060 |
End of period (including undistributed net investment income of $1,374,218 and undistributed net investment income of $679,815, respectively) | $ 166,571,760 | $ 118,211,166 |
See accompanying notes which are an integral part of the financial statements.
Annual Report
Financial Highlights - Class A
Years ended October 31, | 2010 | 2009 | 2008 H |
Selected Per-Share Data | | | |
Net asset value, beginning of period | $ 7.26 | $ 4.75 | $ 10.00 |
Income from Investment Operations | | | |
Net investment income (loss) E | .07 | .05 | .04 |
Net realized and unrealized gain (loss) | 1.70 | 2.48 | (5.31) |
Total from investment operations | 1.77 | 2.53 | (5.27) |
Distributions from net investment income | (.04) | (.03) | - |
Distributions from net realized gain | (.02) | - | - |
Total distributions | (.07) J | (.03) | - |
Redemption fees added to paid in capital E | .01 | .01 | .02 |
Net asset value, end of period | $ 8.97 | $ 7.26 | $ 4.75 |
Total Return B,C,D | 24.66% | 53.78% | (52.50)% |
Ratios to Average Net Assets F,I | | | |
Expenses before reductions | 1.69% | 1.87% | 2.50% A |
Expenses net of fee waivers, if any | 1.50% | 1.50% | 1.50% A |
Expenses net of all reductions | 1.38% | 1.39% | 1.23% A |
Net investment income (loss) | .95% | .84% | 1.20% A |
Supplemental Data | | | |
Net assets, end of period (000 omitted) | $ 10,045 | $ 4,817 | $ 1,368 |
Portfolio turnover rate G | 96% | 58% | 68% |
A Annualized
B Total returns for periods of less than one year are not annualized.
C Total returns would have been lower had certain expenses not been reduced during the periods shown.
D Total returns do not include the effect of the sales charges.
E Calculated based on average shares outstanding during the period.
F Fees and expenses of the underlying Fidelity Central Funds are not included in the Fund's expense ratio. The Fund indirectly bears its proportionate share of the expenses of any underlying Fidelity Central Funds.
G Amount does not include the portfolio activity of any underlying Fidelity Central Funds.
H For the period May 8, 2008 (commencement of operations) to October 31, 2008.
I Expense ratios reflect operating expenses of the class. Expenses before reductions do not reflect amounts reimbursed by the investment adviser or reductions from brokerage service arrangements or reductions from other expense offset arrangements and do not represent the amount paid by the class during periods when reimbursements or reductions occur. Expense ratios before reductions for start-up periods may not be representative of longer-term operating periods. Expenses net of fee waivers reflect expenses after reimbursement by the investment adviser but prior to reductions from brokerage service arrangements or other expense offset arrangements. Expenses net of all reductions represent the net expenses paid by the class.
J Total distributions of $.07 per share is comprised of distributions from net investment income of $.041 and distributions from net realized gain of $.024 per share.
See accompanying notes which are an integral part of the financial statements.
Annual Report
Financial Highlights - Class T
Years ended October 31, | 2010 | 2009 | 2008 H |
Selected Per-Share Data | | | |
Net asset value, beginning of period | $ 7.25 | $ 4.75 | $ 10.00 |
Income from Investment Operations | | | |
Net investment income (loss) E | .06 | .04 | .04 |
Net realized and unrealized gain (loss) | 1.69 | 2.47 | (5.31) |
Total from investment operations | 1.75 | 2.51 | (5.27) |
Distributions from net investment income | (.03) | (.02) | - |
Distributions from net realized gain | (.02) | - | - |
Total distributions | (.05) | (.02) | - |
Redemption fees added to paid in capital E | .01 | .01 | .02 |
Net asset value, end of period | $ 8.96 | $ 7.25 | $ 4.75 |
Total Return B,C,D | 24.44% | 53.20% | (52.50)% |
Ratios to Average Net Assets F,I | | | |
Expenses before reductions | 1.95% | 2.15% | 2.78% A |
Expenses net of fee waivers, if any | 1.75% | 1.75% | 1.75% A |
Expenses net of all reductions | 1.62% | 1.64% | 1.49% A |
Net investment income (loss) | .70% | .59% | .95% A |
Supplemental Data | | | |
Net assets, end of period (000 omitted) | $ 3,114 | $ 1,560 | $ 568 |
Portfolio turnover rate G | 96% | 58% | 68% |
A Annualized
B Total returns for periods of less than one year are not annualized.
C Total returns would have been lower had certain expenses not been reduced during the periods shown.
D Total returns do not include the effect of the sales charges.
E Calculated based on average shares outstanding during the period.
F Fees and expenses of the underlying Fidelity Central Funds are not included in the Fund's expense ratio. The Fund indirectly bears its proportionate share of the expenses of any underlying Fidelity Central Funds.
G Amount does not include the portfolio activity of any underlying Fidelity Central Funds.
H For the period May 8, 2008 (commencement of operations) to October 31, 2008.
I Expense ratios reflect operating expenses of the class. Expenses before reductions do not reflect amounts reimbursed by the investment adviser or reductions from brokerage service arrangements or reductions from other expense offset arrangements and do not represent the amount paid by the class during periods when reimbursements or reductions occur. Expense ratios before reductions for start-up periods may not be representative of longer-term operating periods. Expenses net of fee waivers reflect expenses after reimbursement by the investment adviser but prior to reductions from brokerage service arrangements or other expense offset arrangements. Expenses net of all reductions represent the net expenses paid by the class.
See accompanying notes which are an integral part of the financial statements.
Annual Report
Financial Highlights - Class B
Years ended October 31, | 2010 | 2009 | 2008 H |
Selected Per-Share Data | | | |
Net asset value, beginning of period | $ 7.23 | $ 4.73 | $ 10.00 |
Income from Investment Operations | | | |
Net investment income (loss) E | .02 | .01 | .02 |
Net realized and unrealized gain (loss) | 1.68 | 2.48 | (5.31) |
Total from investment operations | 1.70 | 2.49 | (5.29) |
Distributions from net realized gain | (.01) | - | - |
Redemption fees added to paid in capital E | .01 | .01 | .02 |
Net asset value, end of period | $ 8.93 | $ 7.23 | $ 4.73 |
Total Return B,C,D | 23.72% | 52.85% | (52.70)% |
Ratios to Average Net Assets F,I | | | |
Expenses before reductions | 2.47% | 2.68% | 3.32% A |
Expenses net of fee waivers, if any | 2.25% | 2.25% | 2.25% A |
Expenses net of all reductions | 2.12% | 2.14% | 1.99% A |
Net investment income (loss) | .20% | .09% | .45% A |
Supplemental Data | | | |
Net assets, end of period (000 omitted) | $ 822 | $ 782 | $ 487 |
Portfolio turnover rate G | 96% | 58% | 68% |
A Annualized
B Total returns for periods of less than one year are not annualized.
C Total returns would have been lower had certain expenses not been reduced during the periods shown.
D Total returns do not include the effect of the contingent deferred sales charge.
E Calculated based on average shares outstanding during the period.
F Fees and expenses of the underlying Fidelity Central Funds are not included in the Fund's expense ratio. The Fund indirectly bears its proportionate share of the expenses of any underlying Fidelity Central Funds.
G Amount does not include the portfolio activity of any underlying Fidelity Central Funds.
H For the period May 8, 2008 (commencement of operations) to October 31, 2008.
I Expense ratios reflect operating expenses of the class. Expenses before reductions do not reflect amounts reimbursed by the investment adviser or reductions from brokerage service arrangements or reductions from other expense offset arrangements and do not represent the amount paid by the class during periods when reimbursements or reductions occur. Expense ratios before reductions for start-up periods may not be representative of longer-term operating periods. Expenses net of fee waivers reflect expenses after reimbursement by the investment adviser but prior to reductions from brokerage service arrangements or other expense offset arrangements. Expenses net of all reductions represent the net expenses paid by the class.
See accompanying notes which are an integral part of the financial statements.
Annual Report
Financial Highlights - Class C
Years ended October 31, | 2010 | 2009 | 2008 H |
Selected Per-Share Data | | | |
Net asset value, beginning of period | $ 7.23 | $ 4.73 | $ 10.00 |
Income from Investment Operations | | | |
Net investment income (loss) E | .02 | .01 | .02 |
Net realized and unrealized gain (loss) | 1.67 | 2.48 | (5.31) |
Total from investment operations | 1.69 | 2.49 | (5.29) |
Distributions from net investment income | (.01) | - | - |
Distributions from net realized gain | (.02) | - | - |
Total distributions | (.03) | - | - |
Redemption fees added to paid in capital E | .01 | .01 | .02 |
Net asset value, end of period | $ 8.90 | $ 7.23 | $ 4.73 |
Total Return B,C,D | 23.61% | 52.85% | (52.70)% |
Ratios to Average Net Assets F,I | | | |
Expenses before reductions | 2.45% | 2.61% | 3.28% A |
Expenses net of fee waivers, if any | 2.25% | 2.25% | 2.25% A |
Expenses net of all reductions | 2.13% | 2.14% | 1.99% A |
Net investment income (loss) | .20% | .09% | .45% A |
Supplemental Data | | | |
Net assets, end of period (000 omitted) | $ 5,151 | $ 2,677 | $ 741 |
Portfolio turnover rate G | 96% | 58% | 68% |
A Annualized
B Total returns for periods of less than one year are not annualized.
C Total returns would have been lower had certain expenses not been reduced during the periods shown.
D Total returns do not include the effect of the contingent deferred sales charge.
E Calculated based on average shares outstanding during the period.
F Fees and expenses of the underlying Fidelity Central Funds are not included in the Fund's expense ratio. The Fund indirectly bears its proportionate share of the expenses of any underlying Fidelity Central Funds.
G Amount does not include the portfolio activity of any underlying Fidelity Central Funds.
H For the period May 8, 2008 (commencement of operations) to October 31, 2008.
I Expense ratios reflect operating expenses of the class. Expenses before reductions do not reflect amounts reimbursed by the investment adviser or reductions from brokerage service arrangements or reductions from other expense offset arrangements and do not represent the amount paid by the class during periods when reimbursements or reductions occur. Expense ratios before reductions for start-up periods may not be representative of longer-term operating periods. Expenses net of fee waivers reflect expenses after reimbursement by the investment adviser but prior to reductions from brokerage service arrangements or other expense offset arrangements. Expenses net of all reductions represent the net expenses paid by the class.
See accompanying notes which are an integral part of the financial statements.
Annual Report
Financial Highlights - Emerging Europe, Middle East, Africa (EMEA)
Years ended October 31, | 2010 | 2009 | 2008 G |
Selected Per-Share Data | | | |
Net asset value, beginning of period | $ 7.28 | $ 4.76 | $ 10.00 |
Income from Investment Operations | | | |
Net investment income (loss) D | .09 | .07 | .05 |
Net realized and unrealized gain (loss) | 1.70 | 2.48 | (5.31) |
Total from investment operations | 1.79 | 2.55 | (5.26) |
Distributions from net investment income | (.05) | (.04) | - |
Distributions from net realized gain | (.02) | - | - |
Total distributions | (.08) I | (.04) | - |
Redemption fees added to paid in capital D | .01 | .01 | .02 |
Net asset value, end of period | $ 9.00 | $ 7.28 | $ 4.76 |
Total Return B,C | 24.92% | 54.15% | (52.40)% |
Ratios to Average Net Assets E,H | | | |
Expenses before reductions | 1.45% | 1.61% | 2.19% A |
Expenses net of fee waivers, if any | 1.25% | 1.25% | 1.25% A |
Expenses net of all reductions | 1.12% | 1.14% | .98% A |
Net investment income (loss) | 1.21% | 1.09% | 1.45% A |
Supplemental Data | | | |
Net assets, end of period (000 omitted) | $ 140,270 | $ 104,141 | $ 32,535 |
Portfolio turnover rate F | 96% | 58% | 68% |
A Annualized
B Total returns for periods of less than one year are not annualized.
C Total returns would have been lower had certain expenses not been reduced during the periods shown.
D Calculated based on average shares outstanding during the period.
E Fees and expenses of the underlying Fidelity Central Funds are not included in the Fund's expense ratio. The Fund indirectly bears its proportionate share of the expenses of any underlying Fidelity Central Funds.
F Amount does not include the portfolio activity of any underlying Fidelity Central Funds.
G For the period May 8, 2008 (commencement of operations) to October 31, 2008.
H Expense ratios reflect operating expenses of the class. Expenses before reductions do not reflect amounts reimbursed by the investment adviser or reductions from brokerage service arrangements or reductions from other expense offset arrangements and do not represent the amount paid by the class during periods when reimbursements or reductions occur. Expense ratios before reductions for start-up periods may not be representative of longer-term operating periods. Expenses net of fee waivers reflect expenses after reimbursement by the investment adviser but prior to reductions from brokerage service arrangements or other expense offset arrangements. Expenses net of all reductions represent the net expenses paid by the class.
I Total distributions of $.08 per share is comprised of distributions from net investment income of $.052 and distributions from net realized gain of $.024 per share.
See accompanying notes which are an integral part of the financial statements.
Annual Report
Financial Highlights - Institutional Class
Years ended October 31, | 2010 | 2009 | 2008 G |
Selected Per-Share Data | | | |
Net asset value, beginning of period | $ 7.28 | $ 4.76 | $ 10.00 |
Income from Investment Operations | | | |
Net investment income (loss) D | .09 | .06 | .05 |
Net realized and unrealized gain (loss) | 1.70 | 2.49 | (5.31) |
Total from investment operations | 1.79 | 2.55 | (5.26) |
Distributions from net investment income | (.05) | (.04) | - |
Distributions from net realized gain | (.02) | - | - |
Total distributions | (.08) I | (.04) | - |
Redemption fees added to paid in capital D | .01 | .01 | .02 |
Net asset value, end of period | $ 9.00 | $ 7.28 | $ 4.76 |
Total Return B,C | 24.95% | 54.15% | (52.40)% |
Ratios to Average Net Assets E,H | | | |
Expenses before reductions | 1.34% | 1.60% | 2.12% A |
Expenses net of fee waivers, if any | 1.25% | 1.25% | 1.25% A |
Expenses net of all reductions | 1.13% | 1.14% | .98% A |
Net investment income (loss) | 1.20% | 1.09% | 1.46% A |
Supplemental Data | | | |
Net assets, end of period (000 omitted) | $ 7,171 | $ 4,235 | $ 2,695 |
Portfolio turnover rate F | 96% | 58% | 68% |
A Annualized
B Total returns for periods of less than one year are not annualized.
C Total returns would have been lower had certain expenses not been reduced during the periods shown.
D Calculated based on average shares outstanding during the period.
E Fees and expenses of the underlying Fidelity Central Funds are not included in the Fund's expense ratio. The Fund indirectly bears its proportionate share of the expenses of any underlying Fidelity Central Funds.
F Amount does not include the portfolio activity of any underlying Fidelity Central Funds.
G For the period May 8, 2008 (commencement of operations) to October 31, 2008.
H Expense ratios reflect operating expenses of the class. Expenses before reductions do not reflect amounts reimbursed by the investment adviser or reductions from brokerage service arrangements or reductions from other expense offset arrangements and do not represent the amount paid by the class during periods when reimbursements or reductions occur. Expense ratios before reductions for start-up periods may not be representative of longer-term operating periods. Expenses net of fee waivers reflect expenses after reimbursement by the investment adviser but prior to reductions from brokerage service arrangements or other expense offset arrangements. Expenses net of all reductions represent the net expenses paid by the class.
I Total distributions of $.08 per share is comprised of distributions from net investment income of $.054 and distributions from net realized gain of $.024 per share.
See accompanying notes which are an integral part of the financial statements.
Annual Report
Notes to Financial Statements
For the period ended October 31, 2010
1. Organization.
Fidelity Emerging Europe, Middle East, Africa (EMEA) Fund (the Fund) is a fund of Fidelity Investment Trust (the Trust) and is authorized to issue an unlimited number of shares. The Trust is registered under the Investment Company Act of 1940, as amended (the 1940 Act), as an open-end management investment company organized as a Massachusetts business trust. The Fund offers Class A, Class T, Class C, Emerging Europe, Middle East, Africa (EMEA) and Institutional Class shares, each of which has equal rights as to assets and voting privileges. Effective after the close of business on September 1, 2010, Class B shares were closed to new accounts and additional purchases by existing shareholders. Each class has exclusive voting rights with respect to matters that affect that class. Class B shares will automatically convert to Class A shares after a holding period of seven years from the initial date of purchase. Investment income, realized and unrealized capital gains and losses, the common expenses of the Fund, and certain fund-level expense reductions, if any, are allocated on a pro-rata basis to each class based on the relative net assets of each class to the total net assets of the Fund. Each class differs with respect to transfer agent and distribution and service plan fees incurred. Certain expense reductions also differ by class. The Fund's investments in emerging markets can be subject to social, economic, regulatory, and political uncertainties and can be extremely volatile.
2. Investments in Fidelity Central Funds.
The Fund may invest in Fidelity Central Funds, which are open-end investment companies available only to other investment companies and accounts managed by Fidelity Management & Research Company (FMR) and its affiliates. The Fund's Schedule of Investments lists each of the Fidelity Central Funds held as of period end, if any, as an investment of the Fund, but does not include the underlying holdings of each Fidelity Central Fund. As an Investing Fund, the Fund indirectly bears its proportionate share of the expenses of the underlying Fidelity Central Funds.
The Money Market Central Funds seek preservation of capital and current income and are managed by Fidelity Investments Money Management, Inc. (FIMM), an affiliate of FMR.
A complete unaudited list of holdings for each Fidelity Central Fund is available upon request or at the Securities and Exchange Commission (the SEC) web site at www.sec.gov. In addition, the financial statements of the Fidelity Central Funds, which are not covered by the Fund's Report of Independent Registered Public Accounting Firm, are available on the SEC web site or upon request.
Annual Report
3. Significant Accounting Policies.
The financial statements have been prepared in conformity with accounting principles generally accepted in the United States of America (GAAP), which require management to make certain estimates and assumptions at the date of the financial statements. Actual results could differ from those estimates. The following summarizes the significant accounting policies of the Fund:
Security Valuation. Investments are valued as of 4:00 p.m. Eastern time on the last calendar day of the period. The Fund uses independent pricing services approved by the Board of Trustees to value its investments. When current market prices or quotations are not readily available or reliable, valuations may be determined in good faith in accordance with procedures adopted by the Board of Trustees. Factors used in determining value may include market or security specific events, changes in interest rates and credit quality. The frequency with which these procedures are used cannot be predicted and they may be utilized to a significant extent. The value used for net asset value (NAV) calculation under these procedures may differ from published prices for the same securities.
The Fund categorizes the inputs to valuation techniques used to value its investments into a disclosure hierarchy consisting of three levels as shown below.
Level 1 - quoted prices in active markets for identical investments
Level 2 - other significant observable inputs (including quoted prices for similar investments, interest rates, prepayment speeds, etc.)
Level 3 - unobservable inputs (including the fund's own assumptions based on the best information available)
Changes in valuation techniques may result in transfers in or out of an assigned level within the disclosure hierarchy. The aggregate value of investments by input level, as of October 31, 2010 is included at the end of the Fund's Schedule of Investments. Valuation techniques used to value the Fund's investments by major category are as follows.
Equity securities, including restricted securities, for which market quotations are readily available, are valued at the last reported sale price or official closing price as reported by an independent pricing service on the primary market or exchange on which they are traded and are categorized as Level 1 in the hierarchy. In the event there were no sales during the day or closing prices are not available, securities are valued at the last quoted bid price or may be valued using the last available price and are generally categorized as Level 2 in the hierarchy. For foreign equity securities, when significant market or security specific events arise, comparisons to the valuation of American Depositary Receipts
Annual Report
Notes to Financial Statements - continued
3. Significant Accounting Policies - continued
Security Valuation - continued
(ADRs), futures contracts, Exchange-traded funds (ETFs) and certain indexes as well as quoted prices for similar securities are used and are categorized as Level 2 in the hierarchy in these circumstances. Utilizing these techniques may result in significant transfers between Level 1 and Level 2. For restricted equity securities and private placements where observable inputs are limited, assumptions about market activity and risk are used and are categorized as Level 3 in the hierarchy.
Debt securities, including restricted securities, are valued based on evaluated prices received from independent pricing services or from dealers who make markets in such securities. For foreign government and government agency obligations, pricing services utilize matrix pricing which considers yield or price of bonds of comparable quality, coupon, maturity and type as well as dealer supplied prices and are generally categorized as Level 2 in the hierarchy.
Investments in open-end mutual funds, including the Fidelity Central Funds, are valued at their closing net asset value each business day and are categorized as Level 1 in the hierarchy. Short-term securities with remaining maturities of sixty days or less for which quotations are not readily available are valued at amortized cost, which approximates fair value and are categorized as Level 2 in the hierarchy.
When independent prices are unavailable or unreliable, debt securities may be valued utilizing pricing matrices which consider similar factors that would be used by independent pricing services. These are generally categorized as Level 2 in the hierarchy but may be Level 3 depending on the circumstances.
Foreign Currency. The Fund uses foreign currency contracts to facilitate transactions in foreign-denominated securities. Gains and losses from these transactions may arise from changes in the value of the foreign currency or if the counterparties do not perform under the contracts' terms.
Foreign-denominated assets, including investment securities, and liabilities are translated into U.S. dollars at the exchange rate at period end. Purchases and sales of investment securities, income and dividends received and expenses denominated in foreign currencies are translated into U.S. dollars at the exchange rate in effect on the transaction date.
The effects of exchange rate fluctuations on investments are included with the net realized and unrealized gain (loss) on investment securities. Other foreign currency transactions resulting in realized and unrealized gain (loss) are disclosed separately.
Annual Report
3. Significant Accounting Policies - continued
Investment Transactions and Income. For financial reporting purposes, the Fund's investment holdings and NAV include trades executed through the end of the last business day of the period. The NAV per share for processing shareholder transactions is calculated as of the close of business of the New York Stock Exchange (NYSE), normally 4:00 p.m. Eastern time and includes trades executed through the end of the prior business day. Gains and losses on securities sold are determined on the basis of identified cost. Dividend income is recorded on the ex-dividend date, except for certain dividends from foreign securities where the ex-dividend date may have passed, which are recorded as soon as the Fund is informed of the ex-dividend date. Non-cash dividends included in dividend income, if any, are recorded at the fair market value of the securities received. Distributions received on securities that represent a return of capital or capital gain are recorded as a reduction of cost of investments and/or as a realized gain. The Fund estimates the components of distributions received that may be considered return of capital distributions or capital gain distributions. Interest income and distributions from the Fidelity Central Funds are accrued as earned. Interest income includes coupon interest and amortization of premium and accretion of discount on debt securities. Investment income is recorded net of foreign taxes withheld where recovery of such taxes is uncertain.
Expenses. Most expenses of the Trust can be directly attributed to a fund. Expenses which cannot be directly attributed are apportioned amongst each fund in the Trust. Expense estimates are accrued in the period to which they relate and adjustments are made when actual amounts are known.
Income Tax Information and Distributions to Shareholders. Each year the Fund intends to qualify as a regulated investment company, including distributing substantially all of its taxable income and realized gains under Subchapter M of the Internal Revenue Code and filing its U.S. federal tax return. As a result, no provision for income taxes is required. As of October 31, 2010, the Fund did not have any unrecognized tax benefits in the accompanying financial statements. A fund's federal tax return is subject to examination by the Internal Revenue Service (IRS) for a period of three years. Foreign taxes are provided for based on the Fund's understanding of the tax rules and rates that exist in the foreign markets in which it invests.
Distributions are declared and recorded on the ex-dividend date. Income dividends and capital gain distributions are declared separately for each class. Income and capital gain distributions are determined in accordance with income tax regulations, which may differ from GAAP.
Capital accounts within the financial statements are adjusted for permanent book-tax differences. These adjustments have no impact on net assets or the results of operations. Temporary book-tax differences will reverse in a subsequent period.
Annual Report
Notes to Financial Statements - continued
3. Significant Accounting Policies - continued
Book-tax differences are primarily due to foreign currency transactions, passive foreign investment companies (PFIC), capital loss carryforwards and losses deferred due to wash sales.
The federal tax cost of investment securities and unrealized appreciation (depreciation) as of period end were as follows:
Gross unrealized appreciation | $ 31,285,561 |
Gross unrealized depreciation | (7,672,375) |
Net unrealized appreciation (depreciation) | $ 23,613,186 |
| |
Tax Cost | $ 146,579,678 |
The tax-based components of distributable earnings as of period end were as follows:
Undistributed ordinary income | $ 1,641,475 |
Capital loss carryforward | $ (13,853,821) |
Net unrealized appreciation (depreciation) | $ 23,619,246 |
The tax character of distributions paid was as follows:
| October 31,
2010 | October 31,
2009 |
Ordinary Income | $ 1,207,434 | $ 273,102 |
Short-Term Trading (Redemption) Fees. Shares held by investors in the Fund less than 90 days are subject to a redemption fee equal to 1.50% of the net asset value of shares redeemed. All redemption fees, which reduce the proceeds of the shareholder redemption, are retained by the Fund and accounted for as an addition to paid in capital.
4. Purchases and Sales of Investments.
Purchases and sales of securities, other than short-term securities, aggregated $142,395,176 and $123,992,844, respectively.
5. Fees and Other Transactions with Affiliates.
Management Fee. FMR and its affiliates provide the Fund with investment management related services for which the Fund pays a monthly management fee. The management fee is the sum of an individual fund fee rate that is based on an annual rate of .55% of the Fund's average net assets and a group fee rate that averaged .26% during the
Annual Report
5. Fees and Other Transactions with Affiliates - continued
Management Fee - continued
period. The group fee rate is based upon the average net assets of all the mutual funds advised by FMR. The group fee rate decreases as assets under management increase and increases as assets under management decrease. For the period, the total annual management fee rate was .81% of the Fund's average net assets.
Distribution and Service Plan Fees. In accordance with Rule 12b-1 of the 1940 Act, the Fund has adopted separate Distribution and Service Plans for each class of shares. Certain classes pay Fidelity Distributors Corporation (FDC), an affiliate of FMR, separate Distribution and Service Fees, each of which is based on an annual percentage of each class' average net assets. In addition, FDC may pay financial intermediaries for selling shares of the Fund and providing shareholder support services. For the period, the Distribution and Service Fee rates, total fees and amounts retained by FDC were as follows:
| Distribution
Fee | Service
Fee | Total Fees | Retained
by FDC |
Class A | 0% | .25% | $ 16,288 | $ 304 |
Class T | .25% | .25% | 10,772 | - |
Class B | .75% | .25% | 8,030 | 6,508 |
Class C | .75% | .25% | 35,419 | 16,934 |
| | | $ 70,509 | $ 23,746 |
Sales Load. FDC receives a front-end sales charge of up to 5.75% for selling Class A shares, and 3.50% for selling Class T shares, some of which is paid to financial intermediaries for selling shares of the Fund. FDC receives the proceeds of contingent deferred sales charges levied on Class A, Class T, Class B, and Class C redemptions. These charges depend on the holding period. The deferred sales charges range from 5% to 1% for Class B, 1% for Class C, 1.00% for certain purchases of Class A shares (1.00% to .50% prior to July 12, 2010) and .25% for certain purchases of Class T shares.
For the period, sales charge amounts retained by FDC were as follows:
| Retained
by FDC |
Class A | $ 12,659 |
Class T | 1,864 |
Class B* | 1,097 |
Class C* | 1,555 |
| $ 17,175 |
* When Class B and Class C shares are initially sold, FDC pays commissions from its own resources to financial intermediaries through which the sales are made.
Annual Report
Notes to Financial Statements - continued
5. Fees and Other Transactions with Affiliates - continued
Transfer Agent Fees. Fidelity Investments Institutional Operations Company, Inc. (FIIOC), an affiliate of FMR, is the transfer, dividend disbursing and shareholder servicing agent for each class of the Fund. FIIOC receives account fees and asset-based fees that vary according to the account size and type of account of the shareholders of the respective classes of the Fund. FIIOC pays for typesetting, printing and mailing of shareholder reports, except proxy statements. For the period, transfer agent fees for each class were as follows:
| Amount | % of
Average
Net Assets |
Class A | $ 19,569 | .30 |
Class T | 6,660 | .31 |
Class B | 2,517 | .31 |
Class C | 10,953 | .31 |
Emerging Europe, Middle East, Africa (EMEA) | 340,642 | .30 |
Institutional Class | 10,427 | .20 |
| $ 390,768 | |
Accounting Fees. Fidelity Service Company, Inc. (FSC), an affiliate of FMR, maintains the Fund's accounting records. The fee is based on the level of average net assets for the month.
Brokerage Commissions. The Fund placed a portion of its portfolio transactions with brokerage firms which are affiliates of the investment adviser. The commissions paid to these affiliated firms were $277 for the period.
6. Committed Line of Credit.
The Fund participates with other funds managed by FMR or an affiliate in a $3.75 billion credit facility (the "line of credit") to be utilized for temporary or emergency purposes to fund shareholder redemptions or for other short-term liquidity purposes. The Fund has agreed to pay commitment fees on its pro-rata portion of the line of credit, which amounted to $503 and is reflected in Miscellaneous expenses on the Statement of Operations. During the period, there were no borrowings on this line of credit.
7. Expense Reductions.
FMR voluntarily agreed to reimburse each class to the extent annual operating expenses exceeded certain levels of average net assets as noted in the table below. Some expenses, for example interest expense, including commitment fees, are excluded from this reimbursement.
Annual Report
7. Expense Reductions - continued
The following classes were in reimbursement during the period:
| Expense
Limitations | Reimbursement
from adviser |
Class A | 1.50% | $ 12,027 |
Class T | 1.75% | 4,152 |
Class B | 2.25% | 1,723 |
Class C | 2.25% | 7,018 |
Emerging Europe, Middle East, Africa (EMEA) | 1.25% | 230,099 |
Institutional Class | 1.25% | 4,595 |
| | $ 259,614 |
Effective January 1, 2011, the expense limitation will be changed to 1.65%, 1.90%, 2.40%, 2.40%, 1.40% and 1.40% for Class A, T, B, C, Emerging Europe, Middle East, Africa (EMEA) and Institutional, respectively.
Many of the brokers with whom FMR places trades on behalf of the Fund provided services to the Fund in addition to trade execution. These services included payments of certain expenses on behalf of the Fund totaling $169,256 for the period.
8. Distributions to Shareholders.
Distributions to shareholders of each class were as follows:
Years ended October 31, | 2010 | 2009 |
From net investment income | | |
Class A | $ 26,924 | $ 8,761 |
Class T | 5,586 | 2,185 |
Class C | 2,308 | - |
Emerging Europe, Middle East, Africa (EMEA) | 748,050 | 241,410 |
Institutional Class | 33,147 | 20,746 |
Total | $ 816,015 | $ 273,102 |
From net realized gain | | |
Class A | $ 15,761 | $ - |
Class T | 5,156 | - |
Class B | 1,284 | - |
Class C | 9,232 | - |
Emerging Europe, Middle East, Africa (EMEA) | 345,254 | - |
Institutional Class | 14,732 | - |
Total | $ 391,419 | $ - |
Annual Report
Notes to Financial Statements - continued
9. Share Transactions.
Transactions for each class of shares were as follows:
| Shares | Dollars |
Years ended October 31, | 2010 | 2009 | 2010 | 2009 |
Class A | | | | |
Shares sold | 750,400 | 571,278 | $ 5,978,580 | $ 3,669,041 |
Reinvestment of distributions | 5,604 | 1,833 | 40,683 | 8,321 |
Shares redeemed | (299,775) | (197,844) | (2,302,163) | (1,251,307) |
Net increase (decrease) | 456,229 | 375,267 | $ 3,717,100 | $ 2,426,055 |
Class T | | | | |
Shares sold | 258,490 | 178,308 | $ 2,070,251 | $ 1,129,813 |
Reinvestment of distributions | 1,476 | 481 | 10,717 | 2,182 |
Shares redeemed | (127,308) | (83,315) | (967,322) | (541,782) |
Net increase (decrease) | 132,658 | 95,474 | $ 1,113,646 | $ 590,213 |
Class B | | | | |
Shares sold | 50,154 | 55,038 | $ 403,463 | $ 326,654 |
Reinvestment of distributions | 173 | - | 1,261 | - |
Shares redeemed | (66,507) | (49,759) | (516,486) | (303,402) |
Net increase (decrease) | (16,180) | 5,279 | $ (111,762) | $ 23,252 |
Class C | | | | |
Shares sold | 353,916 | 342,231 | $ 2,814,751 | $ 2,213,144 |
Reinvestment of distributions | 1,559 | - | 11,306 | - |
Shares redeemed | (147,366) | (128,292) | (1,102,603) | (825,454) |
Net increase (decrease) | 208,109 | 213,939 | $ 1,723,454 | $ 1,387,690 |
Emerging Europe, Middle East, Africa (EMEA) | | | |
Shares sold | 10,587,461 | 13,077,282 | $ 85,331,520 | $ 83,717,275 |
Reinvestment of distributions | 144,800 | 50,835 | 1,051,250 | 230,791 |
Shares redeemed | (9,457,558) | (5,656,005) | (72,517,018) | (35,458,373) |
Net increase (decrease) | 1,274,703 | 7,472,112 | $ 13,865,752 | $ 48,489,693 |
Institutional Class | | | | |
Shares sold | 319,437 | 182,348 | $ 2,551,378 | $ 1,155,556 |
Reinvestment of distributions | 825 | 1,053 | 5,986 | 4,781 |
Shares redeemed | (105,236) | (167,948) | (819,955) | (976,723) |
Net increase (decrease) | 215,026 | 15,453 | $ 1,737,409 | $ 183,614 |
10. Other.
The Fund's organizational documents provide former and current trustees and officers with a limited indemnification against liabilities arising in connection with the performance of their duties to the Fund. In the normal course of business, the Fund may also enter into contracts that provide general indemnifications. The Fund's maximum exposure under these arrangements is unknown as this would be dependent on future claims that may be made against the Fund. The risk of material loss from such claims is considered remote.
At the end of the period, FMR or its affiliates were the owners of record of 10% of the total outstanding shares of the Fund.
Annual Report
To the Trustees of Fidelity Investment Trust and Shareholders of Fidelity Emerging Europe, Middle East, Africa (EMEA) Fund:
We have audited the accompanying statement of assets and liabilities of Fidelity Emerging Europe, Middle East, Africa (EMEA) Fund (the Fund), a fund of Fidelity Investment Trust, including the schedule of investments, as of October 31, 2010, and the related statement of operations for the year then ended, the statement of changes in net assets for each of the two years in the period then ended, and the financial highlights for each of the two years in the period then ended and the period May 8, 2008 (commencement of operations) to October 31, 2008. These financial statements and financial highlights are the responsibility of the Fund's management. Our responsibility is to express an opinion on these financial statements and financial highlights based on our audits.
We conducted our audits in accordance with standards of the Public Company Accounting Oversight Board (United States). Those standards require that we plan and perform the audit to obtain reasonable assurance about whether the financial statements and financial highlights are free of material misstatement. The Fund is not required to have, nor were we engaged to perform, an audit of its internal control over financial reporting. Our audits included consideration of internal control over financial reporting as a basis for designing audit procedures that are appropriate in the circumstances, but not for the purpose of expressing an opinion on the effectiveness of the Fund's internal control over financial reporting. Accordingly, we express no such opinion. An audit also includes examining, on a test basis, evidence supporting the amounts and disclosures in the financial statements, assessing the accounting principles used and significant estimates made by management, as well as evaluating the overall financial statement presentation. Our procedures included confirmation of securities owned as of October 31, 2010, by correspondence with the custodians and brokers; where replies were not received from brokers, we performed other auditing procedures. We believe that our audits provide a reasonable basis for our opinion.
In our opinion, the financial statements and financial highlights referred to above present fairly, in all material respects, the financial position of Fidelity Emerging Europe, Middle East, Africa (EMEA) Fund as of October 31, 2010, the results of its operations for the year then ended, the changes in its net assets for each of the two years in the period then ended, and the financial highlights for each of the two years in the period then ended and the period May 8, 2008 (commencement of operations) to October 31, 2008, in conformity with accounting principles generally accepted in the United States of America.
/s/ Deloitte & Touche LLP
DELOITTE & TOUCHE LLP
Boston, Massachusetts
December 16, 2010
Annual Report
The Trustees, Member of the Advisory Board, and executive officers of the trust and fund, as applicable, are listed below. The Board of Trustees governs the fund and is responsible for protecting the interests of shareholders. The Trustees are experienced executives who meet periodically throughout the year to oversee the fund's activities, review contractual arrangements with companies that provide services to the fund, oversee management of the risks associated with such activities and contractual arrangements, and review the fund's performance. Except for James C. Curvey, each of the Trustees oversees 221 funds advised by FMR or an affiliate. Mr. Curvey oversees 410 funds advised by FMR or an affiliate.
The Trustees hold office without limit in time except that (a) any Trustee may resign; (b) any Trustee may be removed by written instrument, signed by at least two-thirds of the number of Trustees prior to such removal; (c) any Trustee who requests to be retired or who has become incapacitated by illness or injury may be retired by written instrument signed by a majority of the other Trustees; and (d) any Trustee may be removed at any special meeting of shareholders by a two-thirds vote of the outstanding voting securities of the trust. Each Trustee who is not an interested person (as defined in the 1940 Act) (Independent Trustee), shall retire not later than the last day of the calendar year in which his or her 72nd birthday occurs. The Independent Trustees may waive this mandatory retirement age policy with respect to individual Trustees. The executive officers and Advisory Board Member hold office without limit in time, except that any officer and Advisory Board Member may resign or may be removed by a vote of a majority of the Trustees at any regular meeting or any special meeting of the Trustees. Except as indicated, each individual has held the office shown or other offices in the same company for the past five years.
Experience, Skills, Attributes, and Qualifications of the Fund's Trustees. The Governance and Nominating Committee has adopted a statement of policy that describes the experience, qualifications, attributes, and skills that are necessary and desirable for potential Independent Trustee candidates (Statement of Policy). The Board believes that each Trustee satisfied at the time he or she was initially elected or appointed a Trustee, and continues to satisfy, the standards contemplated by the Statement of Policy. The Governance and Nominating Committee also engages professional search firms to help identify potential Independent Trustee candidates who have the experience, qualifications, attributes, and skills consistent with the Statement of Policy. From time to time, additional criteria based on the composition and skills of the current Independent Trustees, as well as experience or skills that may be appropriate in light of future changes to board composition, business conditions, and regulatory or other developments, have also been considered by the professional search firms and the Governance and Nominating Committee. In addition, the Board takes into account the Trustees' commitment and participation in Board and committee meetings, as well as their leadership of standing and ad hoc committees throughout their tenure.
In determining that a particular Trustee was and continues to be qualified to serve as a Trustee, the Board has considered a variety of criteria, none of which, in isolation, was controlling. The Board believes that, collectively, the Trustees have balanced and diverse experience, qualifications, attributes, and skills, which allow the Board to operate effectively in governing the fund and protecting the interests of shareholders. Information about the specific experience, skills, attributes, and qualifications of each Trustee, which in each case led to the Board's conclusion that the Trustee should serve (or continue to serve) as a trustee of the fund, is provided below.
Annual Report
Board Structure and Oversight Function. Edward C. Johnson 3d is an interested person (as defined in the 1940 Act) and currently serves as Chairman. The Trustees have determined that an interested Chairman is appropriate and benefits shareholders because an interested Chairman has a personal and professional stake in the quality and continuity of services provided to the fund. Independent Trustees exercise their informed business judgment to appoint an individual of their choosing to serve as Chairman, regardless of whether the Trustee happens to be independent or a member of management. The Independent Trustees have determined that they can act independently and effectively without having an Independent Trustee serve as Chairman and that a key structural component for assuring that they are in a position to do so is for the Independent Trustees to constitute a substantial majority for the Board. The Independent Trustees also regularly meet in executive session. Ned C. Lautenbach serves as Chairman of the Independent Trustees and as such (i) acts as a liaison between the Independent Trustees and management with respect to matters important to the Independent Trustees and (ii) with management prepares agendas for Board meetings.
Fidelity funds are overseen by different Boards of Trustees. The fund's Board oversees Fidelity's equity and high income funds and another Board oversees Fidelity's investment-grade bond, money market, and asset allocation funds. The asset allocation funds may invest in Fidelity funds overseen by the fund's Board. The use of separate Boards, each with its own committee structure, allows the Trustees of each group of Fidelity funds to focus on the unique issues of the funds they oversee, including common research, investment, and operational issues. On occasion, the separate Boards establish joint committees to address issues of overlapping consequences for the Fidelity funds overseen by each Board.
The Trustees operate using a system of committees to facilitate the timely and efficient consideration of all matters of importance to the Trustees, the fund, and fund shareholders and to facilitate compliance with legal and regulatory requirements and oversight of the fund's activities and associated risks. The Board, acting through its committees, has charged FMR and its affiliates with (i) identifying events or circumstances the occurrence of which could have demonstrably adverse effects on the fund's business and/or reputation; (ii) implementing processes and controls to lessen the possibility that such events or circumstances occur or to mitigate the effects of such events or circumstances if they do occur; and (iii) creating and maintaining a system designed to evaluate continuously business and market conditions in order to facilitate the identification and implementation processes described in (i) and (ii) above. Because the day-to-day operations and activities of the fund are carried out by or through FMR, its affiliates and other service providers, the fund's exposure to risks is mitigated but not eliminated by the processes overseen by the Trustees. While each of the Board's committees has responsibility for overseeing different aspects of the fund's activities, oversight is exercised primarily through the Operations, Audit, and Compliance Committees. Appropriate personnel, including but not limited to the fund's Chief Compliance Officer (CCO), FMR's internal auditor, the independent accountants, the fund's Treasurer and portfolio management personnel, make periodic reports to the Board's committees, as appropriate. The responsibilities of each committee, including their oversight responsibilities, are described further under "Standing Committees of the Fund's Trustees."
Annual Report
Trustees and Officers - continued
The fund's Statement of Additional Information (SAI) includes more information about the Trustees. To request a free copy, call Fidelity at 1-800-544-8544.
Interested Trustees*:
Correspondence intended for each Trustee who is an interested person may be sent to Fidelity Investments, 82 Devonshire Street, Boston, Massachusetts 02109.
Name, Age; Principal Occupations and Other Relevant Experience+ |
Edward C. Johnson 3d (80) |
| Year of Election or Appointment: 1984 Mr. Johnson is Trustee and Chairman of the Board of Trustees of certain Trusts. Mr. Johnson serves as Chief Executive Officer, Chairman, and a Director of FMR LLC; Chairman and a Director of FMR; Chairman and a Director of Fidelity Research & Analysis Company (FRAC); Chairman and a Director of Fidelity Investments Money Management, Inc.; and Chairman and a Director of FMR Co., Inc. In addition, Mr. Johnson serves as Chairman and Director of FIL Limited. Previously, Mr. Johnson served as President of FMR LLC (2006-2007). |
James C. Curvey (75) |
| Year of Election or Appointment: 2007 Mr. Curvey also serves as Trustee (2007-present) of other investment companies advised by FMR. Mr. Curvey is a Director of Fidelity Investments Money Management, Inc. (2009-present), Director of Fidelity Research & Analysis Co. (2009-present) and Director of FMR and FMR Co., Inc. (2007-present). Mr. Curvey is also Vice Chairman (2007-present) and Director of FMR LLC. In addition, Mr. Curvey serves as an Overseer for the Boston Symphony Orchestra and a member of the Trustees of Villanova University. Previously, Mr. Curvey was the Vice Chairman (2006-2007) and Director (2000-2007) of FMR Corp. |
* Trustees have been determined to be "Interested Trustees" by virtue of, among other things, their affiliation with the trust or various entities under common control with FMR.
+ The information above includes each Trustee's principal occupation during the last five years and other information relating to the experience, attributes, and skills relevant to each Trustee's qualifications to serve as a Trustee, which led to the conclusion that each Trustee should serve as a Trustee for the fund.
Annual Report
Independent Trustees:
Correspondence intended for each Independent Trustee (that is, the Trustees other than the Interested Trustees) may be sent to Fidelity Investments, P.O. Box 55235, Boston, Massachusetts 02205-5235.
Name, Age; Principal Occupations and Other Relevant Experience+ |
Dennis J. Dirks (62) |
| Year of Election or Appointment: 2005 Prior to his retirement in May 2003, Mr. Dirks was Chief Operating Officer and a member of the Board of The Depository Trust & Clearing Corporation (DTCC). He also served as President, Chief Operating Officer, and Board member of The Depository Trust Company (DTC) and President and Board member of the National Securities Clearing Corporation (NSCC). In addition, Mr. Dirks served as Chief Executive Officer and Board member of the Government Securities Clearing Corporation, Chief Executive Officer and Board member of the Mortgage-Backed Securities Clearing Corporation, as a Trustee and a member of the Finance Committee of Manhattan College (2005-2008), and as a Trustee and a member of the Finance Committee of AHRC of Nassau County (2006-2008). Mr. Dirks is a member of the Independent Directors Council (IDC) Governing Council (2010-Present) and Board of Directors for The Brookville Center for Children's Services, Inc. (2009-present). |
Alan J. Lacy (57) |
| Year of Election or Appointment: 2008 Mr. Lacy serves as Senior Adviser (2007-present) of Oak Hill Capital Partners, L.P. (private equity). Mr. Lacy also served as Chief Executive Officer (2000-2005) and Vice Chairman (2005-2006) of Sears Holdings Corporation and Sears, Roebuck and Co. (retail). In addition, Mr. Lacy serves as a member of the Board of Directors of The Western Union Company (global money transfer, 2006-present) and Bristol-Myers Squibb Company (global pharmaceuticals, 2007-present). Mr. Lacy is Chairman (2008-present) and a member (2006-present) of the Board of Trustees of The National Parks Conservation Association. |
Ned C. Lautenbach (66) |
| Year of Election or Appointment: 2000 Mr. Lautenbach is Chairman of the Independent Trustees of the Equity and High Income Funds (2006-present). Mr. Lautenbach currently serves as the Lead Director of the Eaton Corporation Board of Directors (diversified industrial, 1997-present). Mr. Lautenbach is also a member of the Board of Directors of the Philharmonic Center for the Arts in Naples, Florida (1999-present); a member of the Board of Trustees of Fairfield University (2005-present); and a member of the Council on Foreign Relations (1994-present). Previously, Mr. Lautenbach was a Partner/Advisory Partner at Clayton, Dubilier & Rice, Inc. (private equity investment, 1998-2010), as well as a Director of Sony Corporation (2006-2007). |
Joseph Mauriello (66) |
| Year of Election or Appointment: 2008 Prior to his retirement in January 2006, Mr. Mauriello served in numerous senior management positions including Deputy Chairman and Chief Operating Officer (2004-2005), and Vice Chairman of Financial Services (2002-2004) of KPMG LLP US (professional services, 1965-2005). Mr. Mauriello currently serves as a member of the Board of Directors of XL Group plc. (global insurance and re-insurance, 2006-present) and of Arcadia Resources Inc. (health care services and products, 2007-present). Previously, Mr. Mauriello served as a Director of the Hamilton Funds of the Bank of New York (2006-2007). |
Cornelia M. Small (66) |
| Year of Election or Appointment: 2005 Ms. Small is a member of the Board of Directors of the Teagle Foundation (2009-present). Ms. Small is also a member of the Investment Committee, and Chair (2008-present) and a member of the Board of Trustees of Smith College. In addition, Ms. Small serves on the Investment Committee of the Berkshire Taconic Community Foundation (2008-present). Previously, Ms. Small served as Chairperson of the Investment Committee (2002-2008) of Smith College. In addition, Ms. Small served as Chief Investment Officer, Director of Global Equity Investments, and a member of the Board of Directors of Scudder, Stevens & Clark and Scudder Kemper Investments. |
William S. Stavropoulos (71) |
| Year of Election or Appointment: 2001 Mr. Stavropoulos is Vice Chairman of the Independent Trustees of the Equity and High Income Funds (2006-present). Mr. Stavropoulos serves as President and Founder of the Michigan Baseball Foundation, the Great Lakes Loons (2007-present). Mr. Stavropoulos is Chairman Emeritus of the Board of Directors of The Dow Chemical Company, where he previously served in numerous senior management positions, including President, CEO (1995-2000; 2002-2004), Chairman of the Executive Committee (2000-2006), and as a member of the Board of Directors (1990-2006). Currently, Mr. Stavropoulos is Chairman of Univar (global distributor of commodity and special chemicals, 2010-present), a Director of Teradata Corporation (data warehousing and technology solutions, 2008-present), Chemical Financial Corporation, Maersk Inc. (industrial conglomerate), Tyco International, Inc. (multinational manufacturing and services, 2007-present), and a member of the Advisory Board for Metalmark Capital (private equity investment, 2005-present). Mr. Stavropoulos is a special advisor to Clayton, Dubilier & Rice, Inc. (private equity investment). In addition, Mr. Stavropoulos is a member of the University of Notre Dame Advisory Council for the College of Science. |
David M. Thomas (61) |
| Year of Election or Appointment: 2008 Previously, Mr. Thomas served as Executive Chairman (2005-2006) and Chairman and Chief Executive Officer (2000-2005) of IMS Health, Inc. (pharmaceutical and healthcare information solutions). In addition, Mr. Thomas serves as a member of the Board of Directors of Fortune Brands, Inc. (consumer products), and Interpublic Group of Companies, Inc. (marketing communication, 2004-present). |
Michael E. Wiley (60) |
| Year of Election or Appointment: 2008 Mr. Wiley also serves as a Director of Asia Pacific Exploration Consolidated (international oil and gas exploration and production, 2008-present). Mr. Wiley serves as a Director of Tesoro Corporation (independent oil refiner and marketer, 2005-present), and a Director of Bill Barrett Corporation (exploration and production, 2005-present). In addition, Mr. Wiley also serves as a Director of Post Oak Bank (privately-held bank, 2004-present). Previously, Mr. Wiley served as a member of the Board of Trustees of the University of Tulsa (2000-2006; 2007-2010), as a Senior Energy Advisor of Katzenbach Partners, LLC (consulting, 2006-2007), as an Advisory Director of Riverstone Holdings (private investment), Chairman, President, and CEO of Baker Hughes, Inc. (oilfield services, 2000-2004), and as Director of Spinnaker Exploration Company (exploration and production, 2001-2005). |
+ The information above includes each Trustee's principal occupation during the last five years and other information relating to the experience, attributes, and skills relevant to each Trustee's qualifications to serve as a Trustee, which led to the conclusion that each Trustee should serve as a Trustee for the fund.
Advisory Board Member and Executive Officers:
Correspondence intended for each executive officer and Peter S. Lynch may be sent to Fidelity Investments, 82 Devonshire Street, Boston, Massachusetts 02109.
Name, Age; Principal Occupation |
Peter S. Lynch (66) |
| Year of Election or Appointment: 2003 Member of the Advisory Board of Fidelity's Equity and High Income Funds. Mr. Lynch is Vice Chairman and a Director of FMR and FMR Co., Inc. In addition, Mr. Lynch serves as a Trustee of Boston College and as the Chairman of the Inner-City Scholarship Fund. Previously, Mr. Lynch served on the Special Olympics International Board of Directors (1997-2006). |
Kenneth B. Robins (41) |
| Year of Election or Appointment: 2008 President and Treasurer of Fidelity's Equity and High Income Funds. Mr. Robins also serves as President and Treasurer (2010-present) and Assistant Treasurer (2009-present) of other Fidelity funds and is an employee of Fidelity Investments (2004-present). Previously, Mr. Robins served as Deputy Treasurer of the Fidelity funds (2005-2008) and Treasurer and Chief Financial Officer of The North Carolina Capital Management Trust: Cash and Term Portfolios (2006-2008). |
Bruce T. Herring (45) |
| Year of Election or Appointment: 2006 Vice President of certain Equity Funds. Mr. Herring also serves as Chief Investment Officer and Director of Fidelity Management & Research (U.K.) Inc. (2010-present) and Group Chief Investments Officer of FMR. Previously, Mr. Herring served as Vice President (2005-2006) and Senior Vice President (2006-2007) of Fidelity Management & Research Company, Vice President of FMR Co., Inc. (2001-2007) and as a portfolio manager for Fidelity U.S. Equity Funds. |
Brian B. Hogan (46) |
| Year of Election or Appointment: 2009 Vice President of certain Equity Funds and Vice President of Sector Funds. Mr. Hogan also serves as President of FMR's Equity Division (2009-present). Previously, Mr. Hogan served as Senior Vice President, Equity Research of FMR (2006-2009) and as a portfolio manager. |
Scott C. Goebel (42) |
| Year of Election or Appointment: 2008 Secretary and Chief Legal Officer (CLO) of the Fidelity funds. Mr. Goebel also serves as Secretary and CLO of The North Carolina Capital Management Trust: Cash and Term Portfolio (2008-present); General Counsel, Secretary, and Senior Vice President of FMR (2008-present) and FMR Co., Inc. (2008-present); Deputy General Counsel of FMR LLC; Chief Legal Officer of Fidelity Management & Research (Hong Kong) Limited (2008-present) and Assistant Secretary of Fidelity Management & Research (Japan) Inc. (2008-present), Fidelity Investments Money Management, Inc. (2008-present), Fidelity Management & Research (U.K.) Inc. (2008-present), and Fidelity Research and Analysis Company (2008-present). Previously, Mr. Goebel served as Assistant Secretary of the Funds (2007-2008) and as Vice President and Secretary of Fidelity Distributors Corporation (FDC) (2005-2007). |
William C. Coffey (41) |
| Year of Election or Appointment: 2009 Assistant Secretary of Fidelity's Equity and High Income Funds. Mr. Coffey also serves as Senior Vice President and Deputy General Counsel of FMR LLC (2010-present), and is an employee of Fidelity Investments. Previously, Mr. Coffey served as Vice President and Associate General Counsel of FMR LLC (2005-2009). |
Holly C. Laurent (56) |
| Year of Election or Appointment: 2008 Anti-Money Laundering (AML) Officer of the Fidelity funds. Ms. Laurent also serves as AML Officer of The North Carolina Capital Management Trust: Cash and Term Portfolio (2008-present) and is an employee of Fidelity Investments. Previously, Ms. Laurent was Senior Vice President and Head of Legal for Fidelity Business Services India Pvt. Ltd. (2006-2008), and Senior Vice President, Deputy General Counsel and Group Head for FMR LLC (2005-2006). |
Christine Reynolds (52) |
| Year of Election or Appointment: 2008 Chief Financial Officer of the Fidelity funds. Ms. Reynolds became President of Fidelity Pricing and Cash Management Services (FPCMS) in August 2008. Ms. Reynolds served as Chief Operating Officer of FPCMS (2007-2008). Previously, Ms. Reynolds served as President, Treasurer, and Anti-Money Laundering officer of the Fidelity funds (2004-2007). |
Kenneth A. Rathgeber (63) |
| Year of Election or Appointment: 2004 Chief Compliance Officer of Fidelity's Equity and High Income Funds. Mr. Rathgeber is Chief Compliance Officer of Fidelity Management & Research (Hong Kong) Limited (2008-present), Fidelity Management & Research (Japan) Inc. (2008-present), FMR (2005-present), FMR Co., Inc. (2005-present), Fidelity Management & Research (U.K.) Inc. (2005-present), Fidelity Research & Analysis Company (2005-present), Fidelity Investments Money Management, Inc. (2005-present), Pyramis Global Advisors, LLC (2005-present), and Strategic Advisers, Inc. (2005-present). |
Jeffrey S. Christian (49) |
| Year of Election or Appointment: 2009 Deputy Treasurer of the Fidelity funds. Mr. Christian is an employee of Fidelity Investments. Previously, Mr. Christian served as Chief Financial Officer (2008-2009) of certain Fidelity funds and Senior Vice President of Fidelity Pricing and Cash Management Services (FPCMS) (2004-2009). |
Bryan A. Mehrmann (49) |
| Year of Election or Appointment: 2005 Deputy Treasurer of the Fidelity funds. Mr. Mehrmann is an employee of Fidelity Investments. |
Adrien E. Deberghes (43) |
| Year of Election or Appointment: 2008 Deputy Treasurer of Fidelity's Equity and High Income Funds. Mr. Deberghes also serves as Assistant Treasurer of other Fidelity funds (2010-present) and is an employee of Fidelity Investments (2008-present). Previously, Mr. Deberghes served as Senior Vice President of Mutual Fund Administration at State Street Corporation (2007-2008), Senior Director of Mutual Fund Administration at Investors Bank & Trust (2005-2007), and Director of Finance for Dunkin' Brands (2000-2005). |
Stephanie J. Dorsey (41) |
| Year of Election or Appointment: 2010 Assistant Treasurer of Fidelity's Equity and High Income Funds. Ms. Dorsey also serves as Deputy Treasurer of other Fidelity funds (2008-present) and is an employee of Fidelity Investments (2008-present). Previously, Ms. Dorsey served as Treasurer (2004-2008) of the JPMorgan Mutual Funds and Vice President (2004-2008) of JPMorgan Chase Bank. |
John R. Hebble (52) |
| Year of Election or Appointment: 2009 Assistant Treasurer of Fidelity's Equity and High Income Funds. Mr. Hebble also serves as Treasurer and Chief Financial Officer of The North Carolina Capital Management Trust: Cash and Term Portfolio (2008-present), President and Treasurer of other Fidelity funds (2008-present) and is an employee of Fidelity Investments. |
Gary W. Ryan (52) |
| Year of Election or Appointment: 2005 Assistant Treasurer of the Fidelity funds. Mr. Ryan is an employee of Fidelity Investments. Previously, Mr. Ryan served as Vice President of Fund Reporting in Fidelity Pricing and Cash Management Services (FPCMS) (1999-2005). |
Jonathan Davis (42) |
| Year of Election or Appointment: 2010 Assistant Treasurer of the Fidelity funds. Mr. Davis is an employee of Fidelity Investments. Previously, Mr. Davis served as Vice President and Associate General Counsel of FMR LLC (2003-2010). |
Annual Report
The Board of Trustees of Fidelity Emerging Europe, Middle East, Africa (EMEA) Fund voted to pay to shareholders of record at the opening of business on record date, the following distributions per share derived from capital gains realized from sales of portfolio securities, and dividends derived from net investment income:
| Pay Date | Record Date | Dividends | Capital Gains |
Fidelity Emerging Europe, Middle East, Africa (EMEA) Fund | 12/13/10 | 12/10/10 | $0.071 | $0.015 |
Fidelity Emerging Europe, Middle East, Africa (EMEA) Fund designates 100% of the dividend distributed during the fiscal year as amounts which may be taken into account as a dividend for purposes of the maximum rate under section 1 (h) (11) of the Internal Revenue Code.
The amounts per share which represent income derived from sources within, and taxes paid to, foreign countries or possessions of the United States are as follows:
| Pay Date | Income | Taxes |
Fidelity Emerging Europe, Middle East, Africa (EMEA) Fund | 12/14/2009 | $0.035 | $0.0077 |
The fund will notify shareholders in January 2011 of amounts for use in preparing 2010 income tax returns.
Annual Report
Board Approval of Investment Advisory Contracts and Management Fees
Fidelity Emerging Europe, Middle East, Africa (EMEA) Fund
Each year, the Board of Trustees, including the Independent Trustees (together, the Board), votes on the renewal of the management contract and sub-advisory agreements (together, the Advisory Contracts) for the fund. The Board, assisted by the advice of fund counsel and Independent Trustees' counsel, requests and considers a broad range of information relevant to the renewal of the Advisory Contracts throughout the year.
The Board meets regularly and considers at each of its meetings factors that are relevant to its annual consideration of the renewal of the fund's Advisory Contracts, including the services and support provided to the fund and its shareholders. The Board has established various standing committees, each composed of Independent Trustees with varying backgrounds, to which the Board has assigned specific subject matter responsibilities in order to enhance effective decision-making by the Board. The Board, acting directly and through its Committees, requests and receives information concerning the annual consideration of the renewal of the fund's Advisory Contracts. The Board also meets as needed to consider matters specifically related to the Board's annual consideration of the renewal of Advisory Contracts. Members of the Board may also meet with trustees of other Fidelity funds through ad hoc joint committees to discuss certain matters relevant to the Fidelity funds.
At its July 2010 meeting, the Board of Trustees, including the Independent Trustees, unanimously determined to renew the fund's Advisory Contracts. In reaching its determination, the Board considered all factors it believed relevant, including (i) the nature, extent, and quality of the services to be provided to the fund and its shareholders (including the investment performance of the fund); (ii) the competitiveness of the fund's management fee and total expenses; (iii) the total costs of the services to be provided by and the profits to be realized by Fidelity from its relationship with the fund; (iv) the extent to which economies of scale would be realized as the fund grows; and (v) whether fee levels reflect these economies of scale, if any, for the benefit of fund shareholders.
In considering whether to renew the Advisory Contracts for the fund, the Board reached a determination, with the assistance of fund counsel and Independent Trustees' counsel and through the exercise of its business judgment, that the renewal of the Advisory Contracts is in the best interests of fund shareholders and that the compensation to be received by Fidelity under the management contract is fair and reasonable. The Board's decision to renew the Advisory Contracts was not based on any single factor noted above, but rather was based on a comprehensive consideration of all the information provided to the Board at its meetings throughout the year. The Board, in reaching its determination to renew the Advisory Contracts, is aware that shareholders in the fund have a broad range of investment choices available to them, including a wide choice among mutual funds offered by Fidelity's competitors, and that the fund's shareholders, with the opportunity to review and weigh the disclosure provided by the fund in its prospectus and other public disclosures, have chosen to invest in this fund, managed by Fidelity.
Annual Report
Board Approval of Investment Advisory Contracts and
Management Fees - continued
Nature, Extent, and Quality of Services Provided. The Board considered the staffing within the investment adviser, FMR, and the sub-advisers (together, the Investment Advisers), including the backgrounds of the fund's investment personnel and the fund's investment objective and discipline. The Independent Trustees also had discussions with senior management of Fidelity's investment operations and investment groups. The Board considered the structure of the portfolio manager compensation program and whether this structure provides appropriate incentives to act in the best interest of the fund.
Resources Dedicated to Investment Management and Support Services. The Board and the equity research subcommittee of the Board's Fund Oversight Committee reviewed the size, education, and experience of the Investment Advisers' investment staff, their use of technology, and the Investment Advisers' approach to recruiting, training, and retaining portfolio managers and other research, advisory, and management personnel. The Board noted that Fidelity's analysts have access to a variety of technological tools and market and securities data that enable them to perform both fundamental and quantitative analysis and to specialize in various disciplines. The Board considered Fidelity's extensive global research capabilities that enable the Investment Advisers to aggregate data from various sources in an effort to produce positive investment results. The Board also considered that Fidelity's portfolio managers and analysts have access to daily portfolio attribution that allows for monitoring of a fund's portfolio, as well as an electronic communication system that provides immediate real-time access to research concerning issuers and credit enhancers. The Board noted FMR's continued focus on strengthening the organization and discipline of equity portfolio management and research.
Shareholder and Administrative Services. The Board considered (i) the nature, extent, quality, and cost of advisory, administrative, and shareholder services performed by the Investment Advisers and their affiliates under the Advisory Contracts and under separate agreements covering transfer agency, pricing and bookkeeping, and securities lending services for the fund; (ii) the nature and extent of the investment adviser's supervision of third party service providers, principally custodians and subcustodians; and (iii) the resources devoted to, and the record of compliance with, the fund's compliance policies and procedures. The Board also reviewed the allocation of fund brokerage, including allocations to brokers affiliated with the Investment Advisers, the use of brokerage commissions to pay fund expenses, and the use of "soft" commission dollars to pay for research services.
The Board noted that the growth of fund assets over time across the complex allows Fidelity to reinvest in the development of services designed to enhance the value or convenience of the Fidelity funds as investment vehicles. These services include 24-hour access to account information and market information through phone representatives and over the Internet, and investor education materials and asset allocation tools.
Annual Report
Investment in a Large Fund Family. The Board considered the benefits to shareholders of investing in a Fidelity fund, including the benefits of investing in a fund that is part of a large family of funds offering a variety of investment disciplines and providing a large variety of mutual fund investor services. The Board noted that Fidelity had taken, or had made recommendations that resulted in the Fidelity funds taking, a number of actions over the previous year that benefited particular funds, including (i) dedicating additional resources to investment research and restructuring and broadening the focus of the investment research teams; (ii) bolstering the senior management team that oversees asset management; (iii) launching Class F of certain funds as a lower-fee class available to Freedom K and Freedom Index Funds; (iv) lowering the initial investment minimums and ongoing balance requirements for Real Estate High Income Fund; (v) eliminating subsequent purchase minimums for all funds and adding a waiver of the investment minimum requirement for new accounts opened with the proceeds of a systematic withdrawal plan; (vi) eliminating the withdrawal minimum and maximum limits for systematic withdrawals from Advisor funds; (vii) expanding sales load waivers on Class A shares for Destiny Planholders and expanding Institutional Class eligibility for Class O Destiny Planholders; and (viii) changing certain Class A and Class T sales charge structures to further align them with industry practices.
Investment Performance. The Board considered whether the fund has operated in accordance with its investment objective, as well as its record of compliance with its investment restrictions. It also reviewed the fund's absolute investment performance for each class, as well as the fund's relative investment performance for each class measured against a broad-based securities market index. The Board noted that FMR does not believe that a meaningful peer group exists against which to compare the fund's performance. Because the fund had been in existence less than three calendar years, the following chart considered by the Board shows, for the one-year period ended December 31, 2009, the total returns of Institutional Class (Class I) and Class C of the fund and the total returns of a broad-based securities market index ("benchmark").
Annual Report
Board Approval of Investment Advisory Contracts and
Management Fees - continued
Fidelity Emerging Europe, Middle East, Africa (EMEA) Fund

The Board noted that the investment performance of the fund was lower than its benchmark for the period shown. The Board considered that the variations in performance among the fund's classes reflect the variations in class expenses, which result in lower performance for higher expense classes. The Board also reviewed the fund's performance since inception as well as performance in the current year. The Board noted that it is difficult to evaluate in any comprehensive fashion the performance of the fund, in light of its relatively recent commencement of operations.
Based on its review, and giving particular weight to the nature and quality of the resources dedicated by the Investment Advisers to maintain and improve relative performance and factoring in the unprecedented market events in recent years, the Board concluded that the nature, extent, and quality of investment management and support services and of shareholder and administrative services provided to the fund will benefit the fund's shareholders, particularly in light of the Board's view that the fund's shareholders benefit from investing in a fund that is part of a large family of funds offering a variety of investment disciplines and services.
Competitiveness of Management Fee and Total Fund Expenses. The Board considered the fund's management fee and total expenses compared to "mapped groups" of competitive funds and classes. Fidelity creates "mapped groups" by combining similar Lipper investment objective categories that have comparable management fee characteristics. Combining Lipper investment objective categories aids the Board's management fee and total expense comparisons by broadening the competitive group used for comparison and by reducing the number of universes to which various Fidelity funds are compared.
Annual Report
Management Fee. The Board considered two proprietary management fee comparisons for the 12-month (or shorter) periods shown in the chart below. The group of Lipper funds used by the Board for management fee comparisons is referred to below as the "Total Mapped Group." The Total Mapped Group comparison focuses on a fund's standing relative to the total universe of comparable funds available to investors, in terms of gross management fees before expense reimbursements or caps. "TMG %" represents the percentage of funds in the Total Mapped Group that had management fees that were lower than the fund's. For example, a TMG % of 13% means that 87% of the funds in the Total Mapped Group had higher management fees than the fund. The "Asset-Size Peer Group" (ASPG) comparison focuses on a fund's standing relative to non-Fidelity funds similar in size to the fund within the Total Mapped Group. The ASPG represents at least 15% of the funds in the Total Mapped Group with comparable asset size and management fee characteristics, subject to a minimum of 50 funds (or all funds in the Total Mapped Group if fewer than 50). Additional information, such as the ASPG quartile in which the fund's management fee ranked, is also included in the chart and considered by the Board.
Fidelity Emerging Europe, Middle East, Africa (EMEA) Fund

The Board noted that the fund's management fee ranked below the median of its Total Mapped Group and below the median of its ASPG for 2009.
Based on its review, the Board concluded that the fund's management fee is fair and reasonable in light of the services that the fund receives and the other factors considered.
Total Expenses. In its review of each class's total expenses, the Board considered the fund's management fee as well as other fund or class expenses, as applicable, such as transfer agent fees, pricing and bookkeeping fees, fund-paid 12b-1 fees, and custodial, legal, and audit fees. The Board also noted the effects of any waivers and reimbursements on fees and expenses. As part of its review, the Board also considered current and historical total expenses of each class of the fund compared to competitive fund median expenses. Each class of the fund is compared to those funds and classes in the Total Mapped Group (used by the Board for management fee comparisons) that have a similar sales load structure.
Annual Report
Board Approval of Investment Advisory Contracts and
Management Fees - continued
The Board noted that the total expenses of each class ranked below its competitive median for 2009.
Fees Charged to Other Fidelity Clients. The Board also considered Fidelity fee structures and other information with respect to clients of FMR and its affiliates, such as other mutual funds advised or subadvised by FMR or its affiliates, pension plan clients, and other institutional clients. In March 2010, the Board created an ad hoc joint committee with the board of other Fidelity funds (the Committee) to review and compare Fidelity's institutional investment advisory business with its business of providing services to the Fidelity funds, including the differences in services provided, fees charged, and costs incurred, as well as competition in their respective marketplaces.
Based on its review of total expenses and fees charged to other Fidelity clients, the Board concluded that the total expenses of each class of the fund were reasonable in light of the services that the fund and its shareholders receive and the other factors considered, including the findings of the Committee.
Costs of the Services and Profitability. The Board considered the revenues earned and the expenses incurred by Fidelity in conducting the business of developing, marketing, distributing, managing, administering and servicing the fund and its shareholders. The Board also considered the level of Fidelity's profits in respect of all the Fidelity funds.
On an annual basis, FMR presents to the Board Fidelity's profitability for the fund. Fidelity calculates the profitability for each fund, as well as aggregate profitability for groups of Fidelity funds and all Fidelity funds, using a series of detailed revenue and cost allocation methodologies which originate with the audited books and records of Fidelity. The Audit Committee of the Board reviews any significant changes from the prior year's methodologies.
PricewaterhouseCoopers LLP (PwC), independent registered public accounting firm and auditor to Fidelity and certain Fidelity funds, has been engaged annually by the Board as part of the Board's assessment of Fidelity's profitability analysis. PwC's engagement includes the review and assessment of Fidelity's methodologies used in determining the revenues and expenses attributable to Fidelity's mutual fund business, and completion of agreed-upon procedures surrounding the mathematical accuracy of fund profitability and its conformity to allocation methodologies. After considering PwC's reports issued under the engagement and information provided by Fidelity, the Board believes that while other allocation methods may also be reasonable, Fidelity's profitability methodologies are reasonable in all material respects.
Annual Report
The Board has also reviewed Fidelity's non-fund businesses and fall-out benefits related to the mutual fund business as well as cases where Fidelity's affiliates may benefit from or be related to the fund's business.
The Board considered the costs of the services provided by and the profits realized by Fidelity in connection with the operation of the fund and were satisfied that the profitability was not excessive in the circumstances.
Economies of Scale. The Board considered whether there have been economies of scale in respect of the management of the Fidelity funds, whether the Fidelity funds (including the fund) have appropriately benefited from any such economies of scale, and whether there is potential for realization of any further economies of scale. The Board considered the extent to which the fund will benefit from economies of scale through increased services to the fund, through waivers or reimbursements, or through fee or expense reductions.
In February 2009, the Board and the board of other Fidelity funds created an ad hoc committee (the Economies of Scale Committee) to analyze whether FMR attains economies of scale in respect of the management and servicing of the Fidelity funds, whether the Fidelity funds have appropriately benefited from such economies of scale, and whether there is potential for realization of any further economies of scale.
The Board recognized that the fund's management contract incorporates a "group fee" structure, which provides for lower group fee rates as total fund assets under FMR's management increase, and for higher group fee rates as total fund assets under FMR's management decrease. FMR calculates the group fee rates based on a tiered asset "breakpoint" schedule that varies based on asset class. The Board considered that the group fee is designed to deliver the benefits of economies of scale to fund shareholders when total Fidelity fund assets increase, even if assets of any particular fund are unchanged or have declined, because some portion of Fidelity's costs are attributable to services provided to all Fidelity funds, and all funds benefit if those costs can be allocated among more assets. The Board concluded that, given the group fee structure, fund shareholders will benefit from lower management fees as assets under FMR's management increase at the fund complex level, regardless of whether Fidelity achieves any such economies of scale.
The Board concluded, considering the findings of the Economies of Scale Committee, that any potential economies of scale are being appropriately shared between fund shareholders and Fidelity.
Annual Report
Board Approval of Investment Advisory Contracts and
Management Fees - continued
Additional Information Requested by the Board. In order to develop fully the factual basis for consideration of the Fidelity funds' Advisory Contracts, the Board requested and received additional information on certain topics, including (i) fund performance trends, actions to be taken by FMR to improve certain funds' overall performance, and Fidelity's long-term strategies for certain funds; (ii) portfolio manager changes that have occurred during the past year and length of portfolio manager tenure for different categories of funds over time; (iii) Fidelity's compensation structure for portfolio managers, research analysts, and other key personnel, the rationale for the compensation structure, and how the compensation structure provides appropriate performance incentives; (iv) the amount of the investment that each portfolio manager has made in the Fidelity fund(s) that he or she manages; (v) management and other fees paid by FMR to affiliated sub-advisers on behalf of the Fidelity funds; (vi) Fidelity's fee structures and rationale for recommending different fees among different categories of funds; (vii) Fidelity's rationale for recommending which funds should have a performance adjustment component as part of their management fees; (viii) the rationale for any differences between fund fee structures and fee structures in place for other Fidelity clients; and (ix) explanations regarding the relative total expenses borne by certain funds and classes, total expense competitive trends, and actions that might be taken by FMR to reduce total expenses for certain funds and classes.
Based on its evaluation of all of the conclusions noted above, and after considering all factors it believed relevant, the Board ultimately concluded that the advisory fee structures are fair and reasonable, and that the fund's Advisory Contracts should be renewed.
Annual Report
Investment Adviser
Fidelity Management &
Research Company
Boston, MA
Investment Sub-Advisers
FMR Co., Inc.
Fidelity Management & Research
(U.K.) Inc.
Fidelity Research & Analysis Company
FIL Investments (Japan) Limited
FIL Investment Advisors
FIL Investment Advisors
(U.K.) Limited
Fidelity Management & Research
(Hong Kong) Limited
Fidelity Management & Research
(Japan) Inc.
General Distributor
Fidelity Distributors Corporation
Boston, MA
Transfer and Service Agents
Fidelity Investments Institutional
Operations Company, Inc.
Boston, MA
Fidelity Service Company, Inc.
Boston, MA
Custodian
State Street Bank & Trust Company
Quincy, MA
The Fidelity Telephone Connection
Mutual Fund 24-Hour Service
Exchanges/Redemptions
and Account Assistance 1-800-544-6666
Product Information 1-800-544-6666
Retirement Accounts 1-800-544-4774
(8 a.m. - 9 p.m.)
TDD Service 1-800-544-0118
for the deaf and hearing impaired
(9 a.m. - 9 p.m. Eastern time)
Fidelity Automated Service
Telephone (FAST®)
1-800-544-5555
Automated line for quickest service
EME-UANN-1210
1.861971.102

(Fidelity Investment logo)(registered trademark)
Fidelity AdvisorSM
Emerging Europe,
Middle East, Africa (EMEA)
Fund - Class A, Class T, Class B
and Class C
Annual Report
October 31, 2010
Class A, Class T, Class B, and Class C are classes of Fidelity® Emerging Europe,
Middle East, Africa (EMEA) Fund
(2_fidelity_logos) (Registered_Trademark)
Contents
Chairman's Message | <Click Here> | The Chairman's message to shareholders. |
Performance | <Click Here> | How the fund has done over time. |
Management's Discussion of Fund Performance | <Click Here> | The Portfolio Manager's review of fund performance and strategy. |
Shareholder Expense Example | <Click Here> | An example of shareholder expenses. |
Investment Changes | <Click Here> | A summary of major shifts in the fund's investments over the past six months. |
Investments | <Click Here> | A complete list of the fund's investments with their market values. |
Financial Statements | <Click Here> | Statements of assets and liabilities, operations, and changes in net assets, as well as financial highlights. |
Notes | <Click Here> | Notes to the financial statements. |
Report of Independent Registered Public Accounting Firm | <Click Here> | |
Trustees and Officers | <Click Here> | |
Distributions | <Click Here> | |
Board Approval of Investment Advisory Contracts and Management Fees | <Click Here> | |
To view a fund's proxy voting guidelines and proxy voting record for the 12-month period ended June 30, visit http://www.fidelity.com/proxyvotingresults or visit the Securities and Exchange Commission's (SEC) web site at http://www.sec.gov. You may also call 1-877-208-0098 to request a free copy of the proxy voting guidelines.
Standard & Poor's, S&P and S&P 500 are registered service marks of The McGraw-Hill Companies, Inc. and have been licensed for use by Fidelity Distributors Corporation.
Other third party marks appearing herein are the property of their respective owners.
All other marks appearing herein are registered or unregistered trademarks or service marks of FMR LLC or an affiliated company.
Annual Report
This report and the financial statements contained herein are submitted for the general information of the shareholders of the fund. This report is not authorized for distribution to prospective investors in the fund unless preceded or accompanied by an effective prospectus.
A fund files its complete schedule of portfolio holdings with the SEC for the first and third quarters of each fiscal year on Form N-Q. Forms N-Q are available on the SEC's web site at http://www.sec.gov. A fund's Forms N-Q may be reviewed and copied at the SEC's Public Reference Room in Washington, DC. Information regarding the operation of the SEC's Public Reference Room may be obtained by calling 1-800-SEC-0330. For a complete list of a fund's portfolio holdings, view the most recent holdings listing, semiannual report, or annual report on Fidelity's web site at http://www.fidelity.com or http://advisor.fidelity.com, as applicable.
NOT FDIC INSURED • MAY LOSE VALUE • NO BANK GUARANTEE
Neither the fund nor Fidelity Distributors Corporation is a bank.
Annual Report
(photo_of_Edward_C_Johnson_3d)
Dear Shareholder:
Equities have staged a rally in the second half of 2010, shaking off concerns about the European debt crisis and the possibility of a double-dip recession in the U.S. Although the short-term surge pushed major equity indexes back into positive territory for the year, several questions remain about the longer-term outlook, including lackluster economic growth and persistently high unemployment. Financial markets are always unpredictable, of course, but there also are several time-tested investment principles that can help put the odds in your favor.
One of the basic tenets is to invest for the long term. Over time, riding out the markets' inevitable ups and downs has proven much more effective than selling into panic or chasing the hottest trend. Even missing only a few of the markets' best days can significantly diminish investor returns. Patience also affords the benefits of compounding - of earning interest on additional income or reinvested dividends and capital gains. There can be tax advantages and cost benefits to consider as well. While staying the course doesn't eliminate risk, it can considerably lessen the effect of short-term declines.
You can further manage your investing risk through diversification. And today, more than ever, geographic diversification should be taken into account. Studies indicate that asset allocation is the single most important determinant of a portfolio's long-term success. The right mix of stocks, bonds and cash - aligned to your particular risk tolerance and investment objective - is very important. Age-appropriate rebalancing is also an essential aspect of asset allocation. For younger investors, an emphasis on equities - which historically have been the best-performing asset class over time - is encouraged. As investors near their specific goal, such as retirement or sending a child to college, consideration may be given to replacing volatile assets (e.g. common stocks) with more-stable fixed investments (bonds or savings plans).
A third principle - investing regularly - can help lower the average cost of your purchases. Investing a certain amount of money each month or quarter helps ensure you won't pay for all your shares at market highs. This strategy - known as dollar cost averaging - also reduces "emotion" from investing, helping shareholders avoid selling weak performers just prior to an upswing, or chasing a hot performer just before a correction.
We invite you to contact us via the Internet, through our Investor Centers or by phone. It is our privilege to provide you the information you need to make the investments that are right for you.
Sincerely,
(The chairman's signature appears here.)
Edward C. Johnson 3d
Annual Report
Average annual total return reflects the change in the value of an investment, assuming reinvestment of the class' distributions from dividend income and capital gains (the profits earned upon the sale of securities that have grown in value, if any) and assuming a constant rate of performance each year. The $10,000 table and the fund's returns do not reflect the deduction of taxes that a shareholder would pay on fund distributions or the redemption of fund shares. During periods of reimbursement by Fidelity, a fund's total return will be greater than it would be had the reimbursement not occurred. How a fund did yesterday is no guarantee of how it will do tomorrow.
Average Annual Total Returns
Periods ended October 31, 2010 | | Past 1
year | Life of
fundA |
Class A (incl. 5.75% sales charge) | | 17.49% | -5.97% |
Class T (incl. 3.50% sales charge) | | 20.08% | -5.29% |
Class B (incl. contingent deferred sales charge) B | | 18.72% | -5.56% |
Class C (incl. contingent deferred sales charge) C | | 22.61% | -4.43% |
A From May 8, 2008.
B Class B shares' contingent deferred sales charge included in the past one year and life of fund total return figures are 5% and 4%, respectively.
C Class C shares' contingent deferred sales charge included the past one year and life of fund total return figures are 1% and 0%, respectively.
Annual Report
$10,000 Over Life of Fund
Let's say hypothetically that $10,000 was invested in Fidelity AdvisorSM Emerging Europe, Middle East, Africa (EMEA) Fund - Class A on May 8, 2008, when the fund started, and the current 5.75% sales charge was paid. The chart shows how the value of your investment would have changed, and also shows how the MSCI® EM (Emerging Markets) Europe, Middle East and Africa Index performed over the same period.
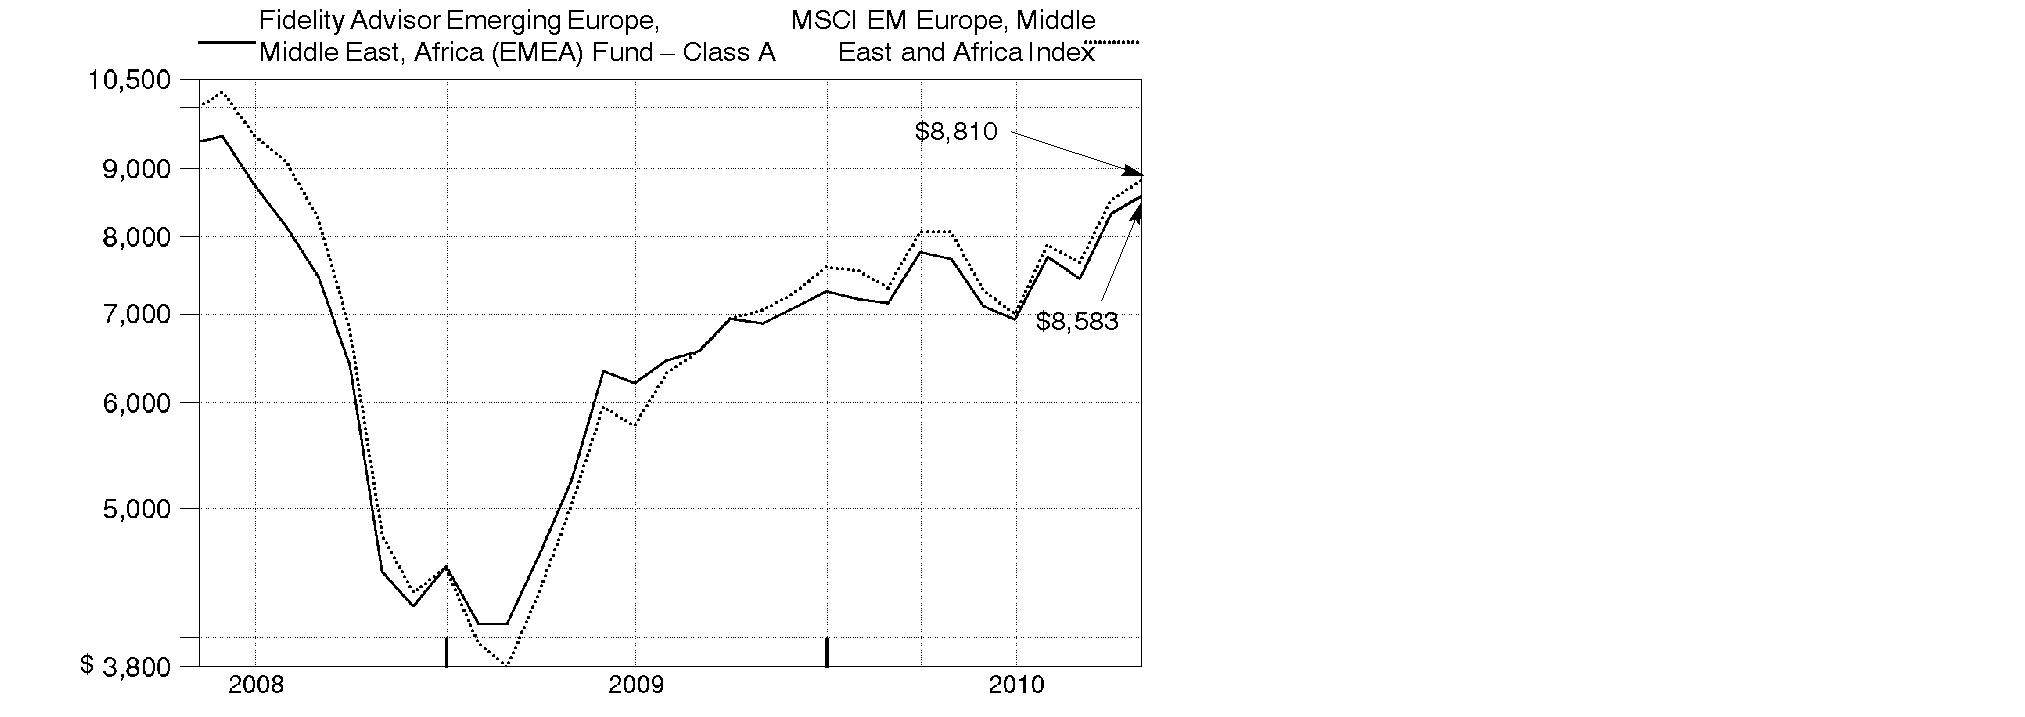
Annual Report
Market Recap: The return-to-risk theme was evident within emerging markets during the 12 months ending October 31, 2010. The combination of strong economic growth and superior fiscal conditions bolstered the performance of emerging-markets stocks, as they finished the period well ahead of most foreign developed-country stock indexes. Several smaller country constituents provided a big boost to the index, while most of its biggest components, though strong, still lagged. The falling value of the U.S. dollar relative to most emerging-markets currencies also provided a meaningful contribution. Rising commodity prices supported returns in commodity-producing regions, such as Latin America, which also benefited from the announced integration of the Chile, Colombia and Peru stock exchanges, scheduled for November. For the 12 months ending October 31, 2010, the MSCI® Emerging Markets Index climbed 23.89%. Among emerging-markets countries, major index components South Korea, Taiwan, Brazil and China gained roughly 25%, 21%, 15% and 9%, respectively. India, also a large constituent, solidly beat the index, returning about 35%. Other strong-performing countries included Thailand (62%), Turkey (55%), Indonesia (52%), Malaysia (36%), Mexico (34%) and South Africa (33%).
Comments from Adam Kutas, Portfolio Manager of Fidelity AdvisorSM Emerging Europe, Middle East, Africa (EMEA) Fund: For the year, the fund's Class A, Class T, Class B and Class C shares returned 24.66%, 24.44%, 23.72% and 23.61%, respectively (excluding sales charges), versus the 25.07% return of the MSCI EM (Emerging Markets) Europe, Middle East and Africa Index. The fund's positioning in financials and materials detracted, as did a modest cash position within a strong market. Geographically, the fund lost ground due to unsuccessful stock selection in South Africa and by underweighting Turkey. Underweighting South African cable TV company Naspers and South African gold company AngloGold Ashanti hurt, along with untimely ownership of Harmony Gold Mining. Conversely, overweighting consumer staples and consumer discretionary helped, along with successful stock picks in telecommunication services. Favorable stock selection in Nigeria, Israel and Egypt boosted results. The fund's investments in Nigeria were out of index. South African retailers Clicks Group and Shoprite Holdings contributed, as did Russian gold and silver producer Polymetal.
Note to shareholders: The fund may invest up to 35% of its total assets in any industry that represents more than 20% of the emerging Europe, Middle East and Africa markets. As of October 31, 2010, the fund did not have more than 25% of its total assets invested in any one industry.
The views expressed above reflect those of the portfolio manager(s) only through the end of the period as stated on the cover of this report and do not necessarily represent the views of Fidelity or any other person in the Fidelity organization. Any such views are subject to change at any time based upon market or other conditions and Fidelity disclaims any responsibility to update such views. These views may not be relied on as investment advice and, because investment decisions for a Fidelity fund are based on numerous factors, may not be relied on as an indication of trading intent on behalf of any Fidelity fund.
Annual Report
Shareholder Expense Example
As a shareholder of the Fund, you incur two types of costs: (1) transaction costs, including sales charges (loads) on purchase payments or redemption proceeds, redemption fees, and (2) ongoing costs, including management fees, distribution and/or service (12b-1) fees and other Fund expenses. This Example is intended to help you understand your ongoing costs (in dollars) of investing in the Fund and to compare these costs with the ongoing costs of investing in other mutual funds.
The Example is based on an investment of $1,000 invested at the beginning of the period and held for the entire period (May 1, 2010 to October 31, 2010).
Actual Expenses
The first line of the accompanying table for each class of the Fund provides information about actual account values and actual expenses. You may use the information in this line, together with the amount you invested, to estimate the expenses that you paid over the period. Simply divide your account value by $1,000.00 (for example, an $8,600 account value divided by $1,000.00 = 8.6), then multiply the result by the number in the first line for a class of the Fund under the heading entitled "Expenses Paid During Period" to estimate the expenses you paid on your account during this period. A small balance maintenance fee of $12.00 that is charged once a year may apply for certain accounts with a value of less than $2,000. This fee is not included in the table below. If it was, the estimate of expenses you paid during the period would be higher, and your ending account value lower, by this amount. In addition, the Fund, as a shareholder in the underlying Fidelity Central Funds, will indirectly bear its pro-rata share of the fees and expenses incurred by the underlying Fidelity Central Funds. These fees and expenses are not included in the Fund's annualized expense ratio used to calculate the expense estimate in the table below.
Hypothetical Example for Comparison Purposes
The second line of the accompanying table for each class of the Fund provides information about hypothetical account values and hypothetical expenses based on a Class' actual expense ratio and an assumed rate of return of 5% per year before expenses, which is not the Class' actual return. The hypothetical account values and expenses may not be used to estimate the actual ending account balance or expenses you paid for the period. You may use this information to compare the ongoing costs of investing in the Fund and other funds. To do so, compare this 5% hypothetical example with the 5% hypothetical examples that appear in the shareholder reports of the other funds. A small balance maintenance fee of $12.00 that is charged once a year may apply for certain accounts with a value of less than $2,000. This fee is not included in the table below. If it was, the estimate of expenses you paid during the period would be higher, and your ending account value lower, by this amount. In addition, the Fund, as a shareholder in the underlying Fidelity Central Funds, will indirectly bear its pro-rata share of the fees and expenses incurred by the underlying Fidelity Central Funds. These fees and expenses are not included in the Fund's annualized expense ratio used to calculate the expense estimate in the table below.
Please note that the expenses shown in the table are meant to highlight your ongoing costs only and do not reflect any transaction costs. Therefore, the second line of the table is useful in comparing ongoing costs only, and will not help you determine the relative total costs of owning different funds. In addition, if these transactional costs were included, your costs would have been higher.
Annual Report
| Annualized
Expense Ratio | Beginning
Account Value
May 1, 2010 | Ending
Account Value
October 31, 2010 | Expenses Paid
During Period*
May 1, 2010 to
October 31, 2010 |
Class A | 1.50% ** | | | |
Actual | | $ 1,000.00 | $ 1,115.70 | $ 8.00 ** |
HypotheticalA | | $ 1,000.00 | $ 1,017.64 | $ 7.63 ** |
Class T | 1.75% ** | | | |
Actual | | $ 1,000.00 | $ 1,114.40 | $ 9.33 ** |
HypotheticalA | | $ 1,000.00 | $ 1,016.38 | $ 8.89 ** |
Class B | 2.25% ** | | | |
Actual | | $ 1,000.00 | $ 1,112.10 | $ 11.98 ** |
HypotheticalA | | $ 1,000.00 | $ 1,013.86 | $ 11.42 ** |
Class C | 2.25% ** | | | |
Actual | | $ 1,000.00 | $ 1,111.10 | $ 11.97 ** |
HypotheticalA | | $ 1,000.00 | $ 1,013.86 | $ 11.42 ** |
Emerging Europe, Middle East, Africa (EMEA) | 1.25% ** | | | |
Actual | | $ 1,000.00 | $ 1,116.60 | $ 6.67 ** |
HypotheticalA | | $ 1,000.00 | $ 1,018.90 | $ 6.36 ** |
Institutional Class | 1.25% ** | | | |
Actual | | $ 1,000.00 | $ 1,118.00 | $ 6.67 ** |
HypotheticalA | | $ 1,000.00 | $ 1,018.90 | $ 6.36 ** |
A 5% return per year before expenses
* Expenses are equal to each Class' annualized expense ratio, multiplied by the average account value over the period, multiplied by 184/365 (to reflect the one-half year period).
** If changes to voluntary expense limitations, effective January 1, 2011 had been in effect during the entire period, the annualized expense ratios and the expenses paid in the actual and hypothetical examples above would have been as follows:
| Annualized
Expense Ratio |
Expenses Paid
|
Class A | 1.62% | |
Actual | | $ 8.64 |
HypotheticalA | | $ 8.24 |
| Annualized
Expense Ratio |
Expenses Paid
|
Class T | 1.89% | |
Actual | | $ 10.07 |
HypotheticalA | | $ 9.60 |
Class B | 2.38% | |
Actual | | $ 12.67 |
HypotheticalA | | $ 12.08 |
Class C | 2.37% | |
Actual | | $ 12.61 |
HypotheticalA | | $ 12.03 |
Emerging Europe, Middle East, Africa (EMEA) | 1.36% | |
Actual | | $ 7.25 |
HypotheticalA | | $ 6.92 |
Institutional Class | 1.27% | |
Actual | | $ 6.78 |
HypotheticalA | | $ 6.46 |
A 5% return per year before expenses
Annual Report
Investment Changes (Unaudited)
Geographic Diversification (% of fund's net assets) |
As of October 31, 2010 |
| South Africa 44.7% | |
| Russia 28.1% | |
| Turkey 11.0% | |
| United States of America* 4.5% | |
| Poland 3.1% | |
| Qatar 1.1% | |
| Kenya 1.1% | |
| Morocco 1.0% | |
| Egypt 0.9% | |
| Other 4.5% | |

* Includes short-term investments and net other assets. |
As of April 30, 2010 |
| South Africa 37.2% | |
| Russia 31.6% | |
| Israel 14.4% | |
| Turkey 3.5% | |
| Nigeria 2.8% | |
| Poland 1.7% | |
| Qatar 1.1% | |
| Morocco 1.1% | |
| Kenya 1.1% | |
| Other* 5.5% | |

* Includes short-term investments and net other assets. |
Asset Allocation |
| % of fund's
net assets | % of fund's net assets
6 months ago |
Stocks | 95.1 | 98.9 |
Bonds | 0.4 | 0.5 |
Short-Term Investments and Net Other Assets | 4.5 | 0.6 |
Top Ten Stocks as of October 31, 2010 |
| % of fund's
net assets | % of fund's net assets
6 months ago |
OAO Gazprom (Russia, Oil, Gas & Consumable Fuels) | 6.5 | 7.3 |
Sberbank (Savings Bank of the Russian Federation) (Russia, Commercial Banks) | 4.8 | 3.7 |
MTN Group Ltd. (South Africa, Wireless Telecommunication Services) | 4.7 | 3.2 |
Lukoil Oil Co. sponsored ADR (United Kingdom) (Russia, Oil, Gas & Consumable Fuels) | 4.5 | 4.5 |
Standard Bank Group Ltd. (South Africa, Commercial Banks) | 4.1 | 4.1 |
Turkiye Garanti Bankasi AS (Turkey, Commercial Banks) | 3.4 | 1.8 |
FirstRand Ltd. (South Africa, Diversified Financial Services) | 3.2 | 2.7 |
Exxaro Resources Ltd. (South Africa, Metals & Mining) | 3.0 | 2.2 |
Shoprite Holdings Ltd. (South Africa, Food & Staples Retailing) | 2.8 | 2.7 |
Sasol Ltd. (South Africa, Oil, Gas & Consumable Fuels) | 2.8 | 2.8 |
| 39.8 | |
Market Sectors as of October 31, 2010 |
| % of fund's
net assets | % of fund's net assets
6 months ago |
Financials | 25.9 | 22.9 |
Energy | 20.2 | 19.1 |
Materials | 13.0 | 15.1 |
Telecommunication Services | 9.4 | 10.1 |
Consumer Discretionary | 9.2 | 6.4 |
Consumer Staples | 8.9 | 6.1 |
Industrials | 4.4 | 3.6 |
Health Care | 2.7 | 11.7 |
Utilities | 1.0 | 2.3 |
Information Technology | 0.4 | 1.6 |
Annual Report
Investments October 31, 2010
Showing Percentage of Net Assets
Common Stocks - 95.1% |
| Shares | | Value |
Australia - 0.3% |
Centamin Egypt Ltd.: | | | |
(Canada) (a) | 50,000 | | $ 141,190 |
(United Kingdom) (a) | 150,000 | | 415,758 |
TOTAL AUSTRALIA | | 556,948 |
Bailiwick of Jersey - 0.3% |
Randgold Resources Ltd. | 5,200 | | 487,311 |
Canada - 0.9% |
Bankers Petroleum Ltd. (a) | 107,000 | | 750,123 |
Equinox Minerals Ltd. (a) | 33,900 | | 184,142 |
TransGlobe Energy Corp. (a) | 50,900 | | 533,504 |
TOTAL CANADA | | 1,467,769 |
Egypt - 0.9% |
Arab Polvara Spinning & Weaving Co. (a) | 680,000 | | 481,614 |
Commercial International Bank Ltd. | 74,300 | | 559,687 |
Egyptian Co. for Mobile Services (MobiNil) | 14,932 | | 444,902 |
TOTAL EGYPT | | 1,486,203 |
Kenya - 1.1% |
British American Tobacco Kenya Ltd. | 179,800 | | 616,775 |
East African Breweries Ltd. | 266,969 | | 700,897 |
Safaricom Ltd. | 7,100,000 | | 426,440 |
TOTAL KENYA | | 1,744,112 |
Morocco - 1.0% |
Maroc Telecom | 90,100 | | 1,705,027 |
Nigeria - 0.8% |
Guaranty Trust Bank PLC GDR (Reg. S) | 54,913 | | 398,668 |
Nigerian Breweries PLC | 662,403 | | 334,188 |
United Bank for Africa PLC | 3,986,048 | | 237,894 |
Zenith Bank PLC | 4,472,241 | | 390,580 |
TOTAL NIGERIA | | 1,361,330 |
Poland - 3.1% |
Bank Polska Kasa Opieki SA | 39,900 | | 2,607,697 |
Eurocash SA | 157,300 | | 1,445,777 |
Powszechna Kasa Oszczednosci Bank SA | 69,900 | | 1,103,471 |
TOTAL POLAND | | 5,156,945 |
Qatar - 1.1% |
Qatar National Bank SAQ | 41,725 | | 1,887,444 |
Common Stocks - continued |
| Shares | | Value |
Russia - 28.1% |
Comstar United TeleSystems OJSC GDR (Reg. S) (a) | 396,557 | | $ 2,569,689 |
DIXY Group OJSC (a) | 62,300 | | 811,671 |
Interregional Distribution Grid Companies Holding JSC (a) | 2,893,400 | | 501,324 |
Lukoil Oil Co. sponsored ADR (United Kingdom) | 134,395 | | 7,499,241 |
Magnit OJSC | 14,200 | | 1,654,353 |
Mobile TeleSystems OJSC (a) | 123,100 | | 997,863 |
Mobile TeleSystems OJSC sponsored ADR | 15,000 | | 324,750 |
Novolipetsk Steel Ojsc | 36,600 | | 1,252,818 |
Novorossiysk Commercial Sea Port JSC | 2,781,700 | | 339,806 |
OAO Gazprom (a) | 1,963,700 | | 10,759,302 |
OAO NOVATEK (a) | 71,900 | | 578,470 |
OAO NOVATEK GDR | 40,200 | | 3,845,130 |
OJSC MMC Norilsk Nickel (a) | 7,200 | | 1,303,694 |
OJSC Oil Co. Rosneft (a) | 75,500 | | 528,303 |
OJSC Oil Company Rosneft GDR (Reg. S) | 294,200 | | 2,050,574 |
Polymetal JSC (a) | 20,500 | | 328,149 |
Protek (a) | 54,500 | | 98,936 |
RusHydro JSC (a) | 15,098,400 | | 776,043 |
Sberbank (Savings Bank of the Russian Federation) | 2,426,500 | | 7,974,184 |
Sistema JSFC sponsored GDR | 25,200 | | 650,160 |
Surgutneftegaz JSC sponsored ADR | 70,900 | | 694,820 |
TGK-1 OAO (a) | 562,635,400 | | 390,469 |
Uralkali JSC (a) | 100,000 | | 494,824 |
VTB Bank JSC unit | 47,100 | | 311,802 |
TOTAL RUSSIA | | 46,736,375 |
South Africa - 44.7% |
Africa Cellular Towers Ltd. (a) | 5,335,800 | | 190,427 |
African Rainbow Minerals Ltd. | 70,500 | | 1,798,567 |
AngloGold Ashanti Ltd. | 72,400 | | 3,395,565 |
Aspen Pharmacare Holdings Ltd. | 237,500 | | 3,170,035 |
Aveng Ltd. | 157,700 | | 990,543 |
Barloworld Ltd. | 44,200 | | 331,261 |
Bidvest Group Ltd. | 72,200 | | 1,540,153 |
Cashbuild Ltd. | 80,500 | | 1,085,967 |
Clicks Group Ltd. | 649,060 | | 4,234,380 |
DRDGOLD Ltd. | 458,514 | | 227,074 |
Exxaro Resources Ltd. | 262,400 | | 4,944,547 |
FirstRand Ltd. | 1,780,100 | | 5,237,345 |
Foschini Ltd. | 105,600 | | 1,281,814 |
Harmony Gold Mining Co. Ltd. | 345,900 | | 3,972,237 |
Illovo Sugar Ltd. | 245,703 | | 911,953 |
Common Stocks - continued |
| Shares | | Value |
South Africa - continued |
Impala Platinum Holdings Ltd. | 53,300 | | $ 1,506,542 |
JSE Ltd. | 35,000 | | 394,715 |
Lewis Group Ltd. | 61,500 | | 627,726 |
Mr Price Group Ltd. | 177,000 | | 1,608,528 |
MTN Group Ltd | 439,250 | | 7,900,800 |
Naspers Ltd. Class N | 58,600 | | 3,076,959 |
Northam Platinum Ltd. | 131,800 | | 911,587 |
Paracon Holdings Ltd. | 2,797,128 | | 682,806 |
Pioneer Foods Ltd. | 72,600 | | 507,937 |
Raubex Group Ltd. | 339,200 | | 1,209,587 |
RMB Holdings Ltd. | 194,100 | | 1,001,388 |
Sanlam Ltd. | 640,500 | | 2,401,058 |
Sasol Ltd. | 102,100 | | 4,597,767 |
Shoprite Holdings Ltd. | 332,100 | | 4,694,405 |
Spur Corp. Ltd. | 100,000 | | 199,856 |
Standard Bank Group Ltd. | 465,963 | | 6,871,325 |
Tiger Brands Ltd. | 38,700 | | 1,037,628 |
Woolworths Holdings Ltd. | 485,792 | | 1,903,625 |
TOTAL SOUTH AFRICA | | 74,446,107 |
Turkey - 11.0% |
Bim Birlesik Magazalar AS JSC | 43,000 | | 1,476,504 |
Boyner Buyuk Magazacilik AS (a) | 286,000 | | 665,997 |
Koc Holding AS | 540,000 | | 2,578,958 |
Sekerbank TAS | 375,000 | | 475,842 |
Trakya Cam Sanayii AS | 211,120 | | 447,469 |
Tupras-Turkiye Petrol Rafinerileri AS | 57,000 | | 1,530,015 |
Turk Telekomunikasyon AS | 132,000 | | 616,607 |
Turkiye Garanti Bankasi AS | 922,000 | | 5,656,836 |
Turkiye Halk Bankasi AS | 241,000 | | 2,436,380 |
Turkiye Is Bankasi AS Series C | 558,000 | | 2,509,308 |
TOTAL TURKEY | | 18,393,916 |
United Arab Emirates - 0.6% |
First Gulf Bank PJSC | 140,000 | | 630,837 |
National Bank of Abu Dhabi PJSC (a) | 100,000 | | 325,356 |
TOTAL UNITED ARAB EMIRATES | | 956,193 |
United Kingdom - 0.9% |
Aurelian Oil & Gas PLC (a) | 237,246 | | 231,863 |
Hikma Pharmaceuticals PLC | 95,992 | | 1,208,818 |
TOTAL UNITED KINGDOM | | 1,440,681 |
Common Stocks - continued |
| Shares | | Value |
Zambia - 0.3% |
Zambeef Products PLC (a) | 629,909 | | $ 501,486 |
TOTAL COMMON STOCKS (Cost $133,056,464) | 158,327,847 |
Government Obligations - 0.4% |
| Principal Amount | | |
Ghana - 0.4% |
Ghana Republic 14.99% 3/11/13
(Cost $672,328) | GHS | 950,000 | | 688,253 |
Money Market Funds - 6.7% |
| Shares | | |
Fidelity Cash Central Fund, 0.23% (b)
(Cost $11,176,764) | 11,176,764 | | 11,176,764 |
TOTAL INVESTMENT PORTFOLIO - 102.2% (Cost $144,905,556) | | 170,192,864 |
NET OTHER ASSETS (LIABILITIES) - (2.2)% | | (3,621,104) |
NET ASSETS - 100% | $ 166,571,760 |
Currency Abbreviations |
GHS | - | Ghana Cedi |
Legend |
(a) Non-income producing |
(b) Affiliated fund that is available only to investment companies and other accounts managed by Fidelity Investments. The rate quoted is the annualized seven-day yield of the fund at period end. A complete unaudited listing of the fund's holdings as of its most recent quarter end is available upon request. In addition, each Fidelity Central Fund's financial statements, which are not covered by the Fund's report of Independent Registered Public Accounting Firm, are available on the SEC's website or upon request. |
Affiliated Central Funds |
Information regarding fiscal year to date income earned by the Fund from investments in Fidelity Central Funds is as follows: |
Fund | Income earned |
Fidelity Cash Central Fund | $ 5,948 |
Other Information |
The following is a summary of the inputs used, as of October 31, 2010, involving the Fund's assets and liabilities carried at fair value. The inputs or methodology used for valuing securities may not be an indication of the risk associated with investing in those securities. For more information on valuation inputs, and their aggregation into the levels used in the table below, please refer to the Security Valuation section in the accompanying Notes to Financial Statements. |
Valuation Inputs at Reporting Date: |
Description | Total | Level 1 | Level 2 | Level 3 |
Investments in Securities: | | | | |
Equities: | | | | |
South Africa | $ 74,446,107 | $ 62,253,464 | $ 12,192,643 | $ - |
Russia | 46,736,375 | 46,736,375 | - | - |
Turkey | 18,393,916 | 18,393,916 | - | - |
Poland | 5,156,945 | 5,156,945 | - | - |
Qatar | 1,887,444 | 1,887,444 | - | - |
Kenya | 1,744,112 | 1,744,112 | - | - |
Morocco | 1,705,027 | 1,705,027 | - | - |
Egypt | 1,486,203 | 1,486,203 | - | - |
Canada | 1,467,769 | 1,467,769 | - | - |
Other | 5,303,949 | 4,816,638 | 487,311 | - |
Government Obligations | 688,253 | - | 688,253 | - |
Money Market Funds | 11,176,764 | 11,176,764 | - | - |
Total Investments in Securities: | $ 170,192,864 | $ 156,824,657 | $ 13,368,207 | $ - |
Income Tax Information |
At October 31, 2010, the Fund had a capital loss carryforward of approximately $13,853,821 of which $9,997,975, $579,836 and $3,276,010 will expire on October 31, 2016, 2017 and 2018, respectively. Capital loss carryforwards are only available to offset future capital gains of the Fund to the extent provided by regulations and may be limited. |
See accompanying notes which are an integral part of the financial statements.
Annual Report
Statement of Assets and Liabilities
| October 31, 2010 |
| | |
Assets | | |
Investment in securities, at value - See accompanying schedule: Unaffiliated issuers (cost $133,728,792) | $ 159,016,100 | |
Fidelity Central Funds (cost $11,176,764) | 11,176,764 | |
Total Investments (cost $144,905,556) | | $ 170,192,864 |
Cash | | 446,420 |
Foreign currency held at value (cost $43,853) | | 43,853 |
Receivable for investments sold | | 715,643 |
Receivable for fund shares sold | | 1,038,751 |
Dividends receivable | | 331,131 |
Interest receivable | | 12,515 |
Distributions receivable from Fidelity Central Funds | | 1,870 |
Receivable from investment adviser for expense reductions | | 8,629 |
Other receivables | | 29,697 |
Total assets | | 172,821,373 |
| | |
Liabilities | | |
Payable for investments purchased | $ 5,868,963 | |
Payable for fund shares redeemed | 141,498 | |
Accrued management fee | 106,100 | |
Distribution and service plan fees payable | 8,041 | |
Other affiliated payables | 39,543 | |
Other payables and accrued expenses | 85,468 | |
Total liabilities | | 6,249,613 |
| | |
Net Assets | | $ 166,571,760 |
Net Assets consist of: | | |
Paid in capital | | $ 155,164,861 |
Undistributed net investment income | | 1,374,218 |
Accumulated undistributed net realized gain (loss) on investments and foreign currency transactions | | (15,260,687) |
Net unrealized appreciation (depreciation) on investments and assets and liabilities in foreign currencies | | 25,293,368 |
Net Assets | | $ 166,571,760 |
See accompanying notes which are an integral part of the financial statements.
Annual Report
Statement of Assets and Liabilities - continued
| October 31, 2010 |
| | |
Calculation of Maximum Offering Price
Class A:
Net Asset Value and redemption price per share
($10,044,764 ÷ 1,119,448 shares) | | $ 8.97 |
| | |
Maximum offering price per share (100/94.25 of $8.97) | | $ 9.52 |
Class T:
Net Asset Value and redemption price per share ($3,114,301 ÷ 347,709 shares) | | $ 8.96 |
| | |
Maximum offering price per share (100/96.50 of $8.96) | | $ 9.28 |
Class B:
Net Asset Value and offering price per share ($821,549 ÷ 92,047 shares)A | | $ 8.93 |
| | |
Class C:
Net Asset Value and offering price per share ($5,150,926 ÷ 578,544 shares)A | | $ 8.90 |
| | |
Emerging Europe, Middle East, Africa (EMEA):
Net Asset Value, offering price and redemption price per share ($140,269,534 ÷ 15,584,892 shares) | | $ 9.00 |
| | |
Institutional Class:
Net Asset Value, offering price and redemption price per share ($7,170,686 ÷ 796,981 shares) | | $ 9.00 |
A Redemption price per share is equal to net asset value less any applicable contingent deferred sales charge.
See accompanying notes which are an integral part of the financial statements.
Annual Report
Financial Statements - continued
Statement of Operations
| Year ended October 31, 2010 |
| | |
Investment Income | | |
Dividends | | $ 3,210,853 |
Interest | | 62,448 |
Income from Fidelity Central Funds | | 5,948 |
Income before foreign taxes withheld | | 3,279,249 |
Less foreign taxes withheld | | (232,147) |
Total income | | 3,047,102 |
| | |
Expenses | | |
Management fee | $ 1,059,214 | |
Transfer agent fees | 390,768 | |
Distribution and service plan fees | 70,509 | |
Accounting fees and expenses | 67,808 | |
Custodian fees and expenses | 228,559 | |
Independent trustees' compensation | 723 | |
Registration fees | 84,861 | |
Audit | 61,037 | |
Legal | 579 | |
Miscellaneous | 1,497 | |
Total expenses before reductions | 1,965,555 | |
Expense reductions | (428,870) | 1,536,685 |
Net investment income (loss) | | 1,510,417 |
Realized and Unrealized Gain (Loss) Net realized gain (loss) on: | | |
Investment securities: | | |
Unaffiliated issuers | (2,970,479) | |
Foreign currency transactions | (243,247) | |
Total net realized gain (loss) | | (3,213,726) |
Change in net unrealized appreciation (depreciation) on: Investment securities | 29,132,713 | |
Assets and liabilities in foreign currencies | 3,280 | |
Total change in net unrealized appreciation (depreciation) | | 29,135,993 |
Net gain (loss) | | 25,922,267 |
Net increase (decrease) in net assets resulting from operations | | $ 27,432,684 |
See accompanying notes which are an integral part of the financial statements.
Annual Report
Statement of Changes in Net Assets
| Year ended
October 31,
2010 | Year ended
October 31,
2009 |
Increase (Decrease) in Net Assets | | |
Operations | | |
Net investment income (loss) | $ 1,510,417 | $ 737,293 |
Net realized gain (loss) | (3,213,726) | (1,386,047) |
Change in net unrealized appreciation (depreciation) | 29,135,993 | 27,532,507 |
Net increase (decrease) in net assets resulting
from operations | 27,432,684 | 26,883,753 |
Distributions to shareholders from net investment income | (816,015) | (273,102) |
Distributions to shareholders from net realized gain | (391,419) | - |
Total distributions | (1,207,434) | (273,102) |
Share transactions - net increase (decrease) | 22,045,599 | 53,100,517 |
Redemption fees | 89,745 | 105,938 |
Total increase (decrease) in net assets | 48,360,594 | 79,817,106 |
| | |
Net Assets | | |
Beginning of period | 118,211,166 | 38,394,060 |
End of period (including undistributed net investment income of $1,374,218 and undistributed net investment income of $679,815, respectively) | $ 166,571,760 | $ 118,211,166 |
See accompanying notes which are an integral part of the financial statements.
Annual Report
Financial Highlights - Class A
Years ended October 31, | 2010 | 2009 | 2008 H |
Selected Per-Share Data | | | |
Net asset value, beginning of period | $ 7.26 | $ 4.75 | $ 10.00 |
Income from Investment Operations | | | |
Net investment income (loss) E | .07 | .05 | .04 |
Net realized and unrealized gain (loss) | 1.70 | 2.48 | (5.31) |
Total from investment operations | 1.77 | 2.53 | (5.27) |
Distributions from net investment income | (.04) | (.03) | - |
Distributions from net realized gain | (.02) | - | - |
Total distributions | (.07) J | (.03) | - |
Redemption fees added to paid in capital E | .01 | .01 | .02 |
Net asset value, end of period | $ 8.97 | $ 7.26 | $ 4.75 |
Total Return B,C,D | 24.66% | 53.78% | (52.50)% |
Ratios to Average Net Assets F,I | | | |
Expenses before reductions | 1.69% | 1.87% | 2.50% A |
Expenses net of fee waivers, if any | 1.50% | 1.50% | 1.50% A |
Expenses net of all reductions | 1.38% | 1.39% | 1.23% A |
Net investment income (loss) | .95% | .84% | 1.20% A |
Supplemental Data | | | |
Net assets, end of period (000 omitted) | $ 10,045 | $ 4,817 | $ 1,368 |
Portfolio turnover rate G | 96% | 58% | 68% |
A Annualized
B Total returns for periods of less than one year are not annualized.
C Total returns would have been lower had certain expenses not been reduced during the periods shown.
D Total returns do not include the effect of the sales charges.
E Calculated based on average shares outstanding during the period.
F Fees and expenses of the underlying Fidelity Central Funds are not included in the Fund's expense ratio. The Fund indirectly bears its proportionate share of the expenses of any underlying Fidelity Central Funds.
G Amount does not include the portfolio activity of any underlying Fidelity Central Funds.
H For the period May 8, 2008 (commencement of operations) to October 31, 2008.
I Expense ratios reflect operating expenses of the class. Expenses before reductions do not reflect amounts reimbursed by the investment adviser or reductions from brokerage service arrangements or reductions from other expense offset arrangements and do not represent the amount paid by the class during periods when reimbursements or reductions occur. Expense ratios before reductions for start-up periods may not be representative of longer-term operating periods. Expenses net of fee waivers reflect expenses after reimbursement by the investment adviser but prior to reductions from brokerage service arrangements or other expense offset arrangements. Expenses net of all reductions represent the net expenses paid by the class.
J Total distributions of $.07 per share is comprised of distributions from net investment income of $.041 and distributions from net realized gain of $.024 per share.
See accompanying notes which are an integral part of the financial statements.
Annual Report
Financial Highlights - Class T
Years ended October 31, | 2010 | 2009 | 2008 H |
Selected Per-Share Data | | | |
Net asset value, beginning of period | $ 7.25 | $ 4.75 | $ 10.00 |
Income from Investment Operations | | | |
Net investment income (loss) E | .06 | .04 | .04 |
Net realized and unrealized gain (loss) | 1.69 | 2.47 | (5.31) |
Total from investment operations | 1.75 | 2.51 | (5.27) |
Distributions from net investment income | (.03) | (.02) | - |
Distributions from net realized gain | (.02) | - | - |
Total distributions | (.05) | (.02) | - |
Redemption fees added to paid in capital E | .01 | .01 | .02 |
Net asset value, end of period | $ 8.96 | $ 7.25 | $ 4.75 |
Total Return B,C,D | 24.44% | 53.20% | (52.50)% |
Ratios to Average Net Assets F,I | | | |
Expenses before reductions | 1.95% | 2.15% | 2.78% A |
Expenses net of fee waivers, if any | 1.75% | 1.75% | 1.75% A |
Expenses net of all reductions | 1.62% | 1.64% | 1.49% A |
Net investment income (loss) | .70% | .59% | .95% A |
Supplemental Data | | | |
Net assets, end of period (000 omitted) | $ 3,114 | $ 1,560 | $ 568 |
Portfolio turnover rate G | 96% | 58% | 68% |
A Annualized
B Total returns for periods of less than one year are not annualized.
C Total returns would have been lower had certain expenses not been reduced during the periods shown.
D Total returns do not include the effect of the sales charges.
E Calculated based on average shares outstanding during the period.
F Fees and expenses of the underlying Fidelity Central Funds are not included in the Fund's expense ratio. The Fund indirectly bears its proportionate share of the expenses of any underlying Fidelity Central Funds.
G Amount does not include the portfolio activity of any underlying Fidelity Central Funds.
H For the period May 8, 2008 (commencement of operations) to October 31, 2008.
I Expense ratios reflect operating expenses of the class. Expenses before reductions do not reflect amounts reimbursed by the investment adviser or reductions from brokerage service arrangements or reductions from other expense offset arrangements and do not represent the amount paid by the class during periods when reimbursements or reductions occur. Expense ratios before reductions for start-up periods may not be representative of longer-term operating periods. Expenses net of fee waivers reflect expenses after reimbursement by the investment adviser but prior to reductions from brokerage service arrangements or other expense offset arrangements. Expenses net of all reductions represent the net expenses paid by the class.
See accompanying notes which are an integral part of the financial statements.
Annual Report
Financial Highlights - Class B
Years ended October 31, | 2010 | 2009 | 2008 H |
Selected Per-Share Data | | | |
Net asset value, beginning of period | $ 7.23 | $ 4.73 | $ 10.00 |
Income from Investment Operations | | | |
Net investment income (loss) E | .02 | .01 | .02 |
Net realized and unrealized gain (loss) | 1.68 | 2.48 | (5.31) |
Total from investment operations | 1.70 | 2.49 | (5.29) |
Distributions from net realized gain | (.01) | - | - |
Redemption fees added to paid in capital E | .01 | .01 | .02 |
Net asset value, end of period | $ 8.93 | $ 7.23 | $ 4.73 |
Total Return B,C,D | 23.72% | 52.85% | (52.70)% |
Ratios to Average Net Assets F,I | | | |
Expenses before reductions | 2.47% | 2.68% | 3.32% A |
Expenses net of fee waivers, if any | 2.25% | 2.25% | 2.25% A |
Expenses net of all reductions | 2.12% | 2.14% | 1.99% A |
Net investment income (loss) | .20% | .09% | .45% A |
Supplemental Data | | | |
Net assets, end of period (000 omitted) | $ 822 | $ 782 | $ 487 |
Portfolio turnover rate G | 96% | 58% | 68% |
A Annualized
B Total returns for periods of less than one year are not annualized.
C Total returns would have been lower had certain expenses not been reduced during the periods shown.
D Total returns do not include the effect of the contingent deferred sales charge.
E Calculated based on average shares outstanding during the period.
F Fees and expenses of the underlying Fidelity Central Funds are not included in the Fund's expense ratio. The Fund indirectly bears its proportionate share of the expenses of any underlying Fidelity Central Funds.
G Amount does not include the portfolio activity of any underlying Fidelity Central Funds.
H For the period May 8, 2008 (commencement of operations) to October 31, 2008.
I Expense ratios reflect operating expenses of the class. Expenses before reductions do not reflect amounts reimbursed by the investment adviser or reductions from brokerage service arrangements or reductions from other expense offset arrangements and do not represent the amount paid by the class during periods when reimbursements or reductions occur. Expense ratios before reductions for start-up periods may not be representative of longer-term operating periods. Expenses net of fee waivers reflect expenses after reimbursement by the investment adviser but prior to reductions from brokerage service arrangements or other expense offset arrangements. Expenses net of all reductions represent the net expenses paid by the class.
See accompanying notes which are an integral part of the financial statements.
Annual Report
Financial Highlights - Class C
Years ended October 31, | 2010 | 2009 | 2008 H |
Selected Per-Share Data | | | |
Net asset value, beginning of period | $ 7.23 | $ 4.73 | $ 10.00 |
Income from Investment Operations | | | |
Net investment income (loss) E | .02 | .01 | .02 |
Net realized and unrealized gain (loss) | 1.67 | 2.48 | (5.31) |
Total from investment operations | 1.69 | 2.49 | (5.29) |
Distributions from net investment income | (.01) | - | - |
Distributions from net realized gain | (.02) | - | - |
Total distributions | (.03) | - | - |
Redemption fees added to paid in capital E | .01 | .01 | .02 |
Net asset value, end of period | $ 8.90 | $ 7.23 | $ 4.73 |
Total Return B,C,D | 23.61% | 52.85% | (52.70)% |
Ratios to Average Net Assets F,I | | | |
Expenses before reductions | 2.45% | 2.61% | 3.28% A |
Expenses net of fee waivers, if any | 2.25% | 2.25% | 2.25% A |
Expenses net of all reductions | 2.13% | 2.14% | 1.99% A |
Net investment income (loss) | .20% | .09% | .45% A |
Supplemental Data | | | |
Net assets, end of period (000 omitted) | $ 5,151 | $ 2,677 | $ 741 |
Portfolio turnover rate G | 96% | 58% | 68% |
A Annualized
B Total returns for periods of less than one year are not annualized.
C Total returns would have been lower had certain expenses not been reduced during the periods shown.
D Total returns do not include the effect of the contingent deferred sales charge.
E Calculated based on average shares outstanding during the period.
F Fees and expenses of the underlying Fidelity Central Funds are not included in the Fund's expense ratio. The Fund indirectly bears its proportionate share of the expenses of any underlying Fidelity Central Funds.
G Amount does not include the portfolio activity of any underlying Fidelity Central Funds.
H For the period May 8, 2008 (commencement of operations) to October 31, 2008.
I Expense ratios reflect operating expenses of the class. Expenses before reductions do not reflect amounts reimbursed by the investment adviser or reductions from brokerage service arrangements or reductions from other expense offset arrangements and do not represent the amount paid by the class during periods when reimbursements or reductions occur. Expense ratios before reductions for start-up periods may not be representative of longer-term operating periods. Expenses net of fee waivers reflect expenses after reimbursement by the investment adviser but prior to reductions from brokerage service arrangements or other expense offset arrangements. Expenses net of all reductions represent the net expenses paid by the class.
See accompanying notes which are an integral part of the financial statements.
Annual Report
Financial Highlights - Emerging Europe, Middle East, Africa (EMEA)
Years ended October 31, | 2010 | 2009 | 2008 G |
Selected Per-Share Data | | | |
Net asset value, beginning of period | $ 7.28 | $ 4.76 | $ 10.00 |
Income from Investment Operations | | | |
Net investment income (loss) D | .09 | .07 | .05 |
Net realized and unrealized gain (loss) | 1.70 | 2.48 | (5.31) |
Total from investment operations | 1.79 | 2.55 | (5.26) |
Distributions from net investment income | (.05) | (.04) | - |
Distributions from net realized gain | (.02) | - | - |
Total distributions | (.08) I | (.04) | - |
Redemption fees added to paid in capital D | .01 | .01 | .02 |
Net asset value, end of period | $ 9.00 | $ 7.28 | $ 4.76 |
Total Return B,C | 24.92% | 54.15% | (52.40)% |
Ratios to Average Net Assets E,H | | | |
Expenses before reductions | 1.45% | 1.61% | 2.19% A |
Expenses net of fee waivers, if any | 1.25% | 1.25% | 1.25% A |
Expenses net of all reductions | 1.12% | 1.14% | .98% A |
Net investment income (loss) | 1.21% | 1.09% | 1.45% A |
Supplemental Data | | | |
Net assets, end of period (000 omitted) | $ 140,270 | $ 104,141 | $ 32,535 |
Portfolio turnover rate F | 96% | 58% | 68% |
A Annualized
B Total returns for periods of less than one year are not annualized.
C Total returns would have been lower had certain expenses not been reduced during the periods shown.
D Calculated based on average shares outstanding during the period.
E Fees and expenses of the underlying Fidelity Central Funds are not included in the Fund's expense ratio. The Fund indirectly bears its proportionate share of the expenses of any underlying Fidelity Central Funds.
F Amount does not include the portfolio activity of any underlying Fidelity Central Funds.
G For the period May 8, 2008 (commencement of operations) to October 31, 2008.
H Expense ratios reflect operating expenses of the class. Expenses before reductions do not reflect amounts reimbursed by the investment adviser or reductions from brokerage service arrangements or reductions from other expense offset arrangements and do not represent the amount paid by the class during periods when reimbursements or reductions occur. Expense ratios before reductions for start-up periods may not be representative of longer-term operating periods. Expenses net of fee waivers reflect expenses after reimbursement by the investment adviser but prior to reductions from brokerage service arrangements or other expense offset arrangements. Expenses net of all reductions represent the net expenses paid by the class.
I Total distributions of $.08 per share is comprised of distributions from net investment income of $.052 and distributions from net realized gain of $.024 per share.
See accompanying notes which are an integral part of the financial statements.
Annual Report
Financial Highlights - Institutional Class
Years ended October 31, | 2010 | 2009 | 2008 G |
Selected Per-Share Data | | | |
Net asset value, beginning of period | $ 7.28 | $ 4.76 | $ 10.00 |
Income from Investment Operations | | | |
Net investment income (loss) D | .09 | .06 | .05 |
Net realized and unrealized gain (loss) | 1.70 | 2.49 | (5.31) |
Total from investment operations | 1.79 | 2.55 | (5.26) |
Distributions from net investment income | (.05) | (.04) | - |
Distributions from net realized gain | (.02) | - | - |
Total distributions | (.08) I | (.04) | - |
Redemption fees added to paid in capital D | .01 | .01 | .02 |
Net asset value, end of period | $ 9.00 | $ 7.28 | $ 4.76 |
Total Return B,C | 24.95% | 54.15% | (52.40)% |
Ratios to Average Net Assets E,H | | | |
Expenses before reductions | 1.34% | 1.60% | 2.12% A |
Expenses net of fee waivers, if any | 1.25% | 1.25% | 1.25% A |
Expenses net of all reductions | 1.13% | 1.14% | .98% A |
Net investment income (loss) | 1.20% | 1.09% | 1.46% A |
Supplemental Data | | | |
Net assets, end of period (000 omitted) | $ 7,171 | $ 4,235 | $ 2,695 |
Portfolio turnover rate F | 96% | 58% | 68% |
A Annualized
B Total returns for periods of less than one year are not annualized.
C Total returns would have been lower had certain expenses not been reduced during the periods shown.
D Calculated based on average shares outstanding during the period.
E Fees and expenses of the underlying Fidelity Central Funds are not included in the Fund's expense ratio. The Fund indirectly bears its proportionate share of the expenses of any underlying Fidelity Central Funds.
F Amount does not include the portfolio activity of any underlying Fidelity Central Funds.
G For the period May 8, 2008 (commencement of operations) to October 31, 2008.
H Expense ratios reflect operating expenses of the class. Expenses before reductions do not reflect amounts reimbursed by the investment adviser or reductions from brokerage service arrangements or reductions from other expense offset arrangements and do not represent the amount paid by the class during periods when reimbursements or reductions occur. Expense ratios before reductions for start-up periods may not be representative of longer-term operating periods. Expenses net of fee waivers reflect expenses after reimbursement by the investment adviser but prior to reductions from brokerage service arrangements or other expense offset arrangements. Expenses net of all reductions represent the net expenses paid by the class.
I Total distributions of $.08 per share is comprised of distributions from net investment income of $.054 and distributions from net realized gain of $.024 per share.
See accompanying notes which are an integral part of the financial statements.
Annual Report
Notes to Financial Statements
For the period ended October 31, 2010
1. Organization.
Fidelity Emerging Europe, Middle East, Africa (EMEA) Fund (the Fund) is a fund of Fidelity Investment Trust (the Trust) and is authorized to issue an unlimited number of shares. The Trust is registered under the Investment Company Act of 1940, as amended (the 1940 Act), as an open-end management investment company organized as a Massachusetts business trust. The Fund offers Class A, Class T, Class C, Emerging Europe, Middle East, Africa (EMEA) and Institutional Class shares, each of which has equal rights as to assets and voting privileges. Effective after the close of business on September 1, 2010, Class B shares were closed to new accounts and additional purchases by existing shareholders. Each class has exclusive voting rights with respect to matters that affect that class. Class B shares will automatically convert to Class A shares after a holding period of seven years from the initial date of purchase. Investment income, realized and unrealized capital gains and losses, the common expenses of the Fund, and certain fund-level expense reductions, if any, are allocated on a pro-rata basis to each class based on the relative net assets of each class to the total net assets of the Fund. Each class differs with respect to transfer agent and distribution and service plan fees incurred. Certain expense reductions also differ by class. The Fund's investments in emerging markets can be subject to social, economic, regulatory, and political uncertainties and can be extremely volatile.
2. Investments in Fidelity Central Funds.
The Fund may invest in Fidelity Central Funds, which are open-end investment companies available only to other investment companies and accounts managed by Fidelity Management & Research Company (FMR) and its affiliates. The Fund's Schedule of Investments lists each of the Fidelity Central Funds held as of period end, if any, as an investment of the Fund, but does not include the underlying holdings of each Fidelity Central Fund. As an Investing Fund, the Fund indirectly bears its proportionate share of the expenses of the underlying Fidelity Central Funds.
The Money Market Central Funds seek preservation of capital and current income and are managed by Fidelity Investments Money Management, Inc. (FIMM), an affiliate of FMR.
A complete unaudited list of holdings for each Fidelity Central Fund is available upon request or at the Securities and Exchange Commission (the SEC) web site at www.sec.gov. In addition, the financial statements of the Fidelity Central Funds, which are not covered by the Fund's Report of Independent Registered Public Accounting Firm, are available on the SEC web site or upon request.
Annual Report
3. Significant Accounting Policies.
The financial statements have been prepared in conformity with accounting principles generally accepted in the United States of America (GAAP), which require management to make certain estimates and assumptions at the date of the financial statements. Actual results could differ from those estimates. The following summarizes the significant accounting policies of the Fund:
Security Valuation. Investments are valued as of 4:00 p.m. Eastern time on the last calendar day of the period. The Fund uses independent pricing services approved by the Board of Trustees to value its investments. When current market prices or quotations are not readily available or reliable, valuations may be determined in good faith in accordance with procedures adopted by the Board of Trustees. Factors used in determining value may include market or security specific events, changes in interest rates and credit quality. The frequency with which these procedures are used cannot be predicted and they may be utilized to a significant extent. The value used for net asset value (NAV) calculation under these procedures may differ from published prices for the same securities.
The Fund categorizes the inputs to valuation techniques used to value its investments into a disclosure hierarchy consisting of three levels as shown below.
Level 1 - quoted prices in active markets for identical investments
Level 2 - other significant observable inputs (including quoted prices for similar investments, interest rates, prepayment speeds, etc.)
Level 3 - unobservable inputs (including the fund's own assumptions based on the best information available)
Changes in valuation techniques may result in transfers in or out of an assigned level within the disclosure hierarchy. The aggregate value of investments by input level, as of October 31, 2010 is included at the end of the Fund's Schedule of Investments. Valuation techniques used to value the Fund's investments by major category are as follows.
Equity securities, including restricted securities, for which market quotations are readily available, are valued at the last reported sale price or official closing price as reported by an independent pricing service on the primary market or exchange on which they are traded and are categorized as Level 1 in the hierarchy. In the event there were no sales during the day or closing prices are not available, securities are valued at the last quoted bid price or may be valued using the last available price and are generally categorized as Level 2 in the hierarchy. For foreign equity securities, when significant market or security specific events arise, comparisons to the valuation of American Depositary Receipts
Annual Report
Notes to Financial Statements - continued
3. Significant Accounting Policies - continued
Security Valuation - continued
(ADRs), futures contracts, Exchange-traded funds (ETFs) and certain indexes as well as quoted prices for similar securities are used and are categorized as Level 2 in the hierarchy in these circumstances. Utilizing these techniques may result in significant transfers between Level 1 and Level 2. For restricted equity securities and private placements where observable inputs are limited, assumptions about market activity and risk are used and are categorized as Level 3 in the hierarchy.
Debt securities, including restricted securities, are valued based on evaluated prices received from independent pricing services or from dealers who make markets in such securities. For foreign government and government agency obligations, pricing services utilize matrix pricing which considers yield or price of bonds of comparable quality, coupon, maturity and type as well as dealer supplied prices and are generally categorized as Level 2 in the hierarchy.
Investments in open-end mutual funds, including the Fidelity Central Funds, are valued at their closing net asset value each business day and are categorized as Level 1 in the hierarchy. Short-term securities with remaining maturities of sixty days or less for which quotations are not readily available are valued at amortized cost, which approximates fair value and are categorized as Level 2 in the hierarchy.
When independent prices are unavailable or unreliable, debt securities may be valued utilizing pricing matrices which consider similar factors that would be used by independent pricing services. These are generally categorized as Level 2 in the hierarchy but may be Level 3 depending on the circumstances.
Foreign Currency. The Fund uses foreign currency contracts to facilitate transactions in foreign-denominated securities. Gains and losses from these transactions may arise from changes in the value of the foreign currency or if the counterparties do not perform under the contracts' terms.
Foreign-denominated assets, including investment securities, and liabilities are translated into U.S. dollars at the exchange rate at period end. Purchases and sales of investment securities, income and dividends received and expenses denominated in foreign currencies are translated into U.S. dollars at the exchange rate in effect on the transaction date.
The effects of exchange rate fluctuations on investments are included with the net realized and unrealized gain (loss) on investment securities. Other foreign currency transactions resulting in realized and unrealized gain (loss) are disclosed separately.
Annual Report
3. Significant Accounting Policies - continued
Investment Transactions and Income. For financial reporting purposes, the Fund's investment holdings and NAV include trades executed through the end of the last business day of the period. The NAV per share for processing shareholder transactions is calculated as of the close of business of the New York Stock Exchange (NYSE), normally 4:00 p.m. Eastern time and includes trades executed through the end of the prior business day. Gains and losses on securities sold are determined on the basis of identified cost. Dividend income is recorded on the ex-dividend date, except for certain dividends from foreign securities where the ex-dividend date may have passed, which are recorded as soon as the Fund is informed of the ex-dividend date. Non-cash dividends included in dividend income, if any, are recorded at the fair market value of the securities received. Distributions received on securities that represent a return of capital or capital gain are recorded as a reduction of cost of investments and/or as a realized gain. The Fund estimates the components of distributions received that may be considered return of capital distributions or capital gain distributions. Interest income and distributions from the Fidelity Central Funds are accrued as earned. Interest income includes coupon interest and amortization of premium and accretion of discount on debt securities. Investment income is recorded net of foreign taxes withheld where recovery of such taxes is uncertain.
Expenses. Most expenses of the Trust can be directly attributed to a fund. Expenses which cannot be directly attributed are apportioned amongst each fund in the Trust. Expense estimates are accrued in the period to which they relate and adjustments are made when actual amounts are known.
Income Tax Information and Distributions to Shareholders. Each year the Fund intends to qualify as a regulated investment company, including distributing substantially all of its taxable income and realized gains under Subchapter M of the Internal Revenue Code and filing its U.S. federal tax return. As a result, no provision for income taxes is required. As of October 31, 2010, the Fund did not have any unrecognized tax benefits in the accompanying financial statements. A fund's federal tax return is subject to examination by the Internal Revenue Service (IRS) for a period of three years. Foreign taxes are provided for based on the Fund's understanding of the tax rules and rates that exist in the foreign markets in which it invests.
Distributions are declared and recorded on the ex-dividend date. Income dividends and capital gain distributions are declared separately for each class. Income and capital gain distributions are determined in accordance with income tax regulations, which may differ from GAAP.
Capital accounts within the financial statements are adjusted for permanent book-tax differences. These adjustments have no impact on net assets or the results of operations. Temporary book-tax differences will reverse in a subsequent period.
Annual Report
Notes to Financial Statements - continued
3. Significant Accounting Policies - continued
Book-tax differences are primarily due to foreign currency transactions, passive foreign investment companies (PFIC), capital loss carryforwards and losses deferred due to wash sales.
The federal tax cost of investment securities and unrealized appreciation (depreciation) as of period end were as follows:
Gross unrealized appreciation | $ 31,285,561 |
Gross unrealized depreciation | (7,672,375) |
Net unrealized appreciation (depreciation) | $ 23,613,186 |
| |
Tax Cost | $ 146,579,678 |
The tax-based components of distributable earnings as of period end were as follows:
Undistributed ordinary income | $ 1,641,475 |
Capital loss carryforward | $ (13,853,821) |
Net unrealized appreciation (depreciation) | $ 23,619,246 |
The tax character of distributions paid was as follows:
| October 31,
2010 | October 31,
2009 |
Ordinary Income | $ 1,207,434 | $ 273,102 |
Short-Term Trading (Redemption) Fees. Shares held by investors in the Fund less than 90 days are subject to a redemption fee equal to 1.50% of the net asset value of shares redeemed. All redemption fees, which reduce the proceeds of the shareholder redemption, are retained by the Fund and accounted for as an addition to paid in capital.
4. Purchases and Sales of Investments.
Purchases and sales of securities, other than short-term securities, aggregated $142,395,176 and $123,992,844, respectively.
5. Fees and Other Transactions with Affiliates.
Management Fee. FMR and its affiliates provide the Fund with investment management related services for which the Fund pays a monthly management fee. The management fee is the sum of an individual fund fee rate that is based on an annual rate of .55% of the Fund's average net assets and a group fee rate that averaged .26% during the
Annual Report
5. Fees and Other Transactions with Affiliates - continued
Management Fee - continued
period. The group fee rate is based upon the average net assets of all the mutual funds advised by FMR. The group fee rate decreases as assets under management increase and increases as assets under management decrease. For the period, the total annual management fee rate was .81% of the Fund's average net assets.
Distribution and Service Plan Fees. In accordance with Rule 12b-1 of the 1940 Act, the Fund has adopted separate Distribution and Service Plans for each class of shares. Certain classes pay Fidelity Distributors Corporation (FDC), an affiliate of FMR, separate Distribution and Service Fees, each of which is based on an annual percentage of each class' average net assets. In addition, FDC may pay financial intermediaries for selling shares of the Fund and providing shareholder support services. For the period, the Distribution and Service Fee rates, total fees and amounts retained by FDC were as follows:
| Distribution
Fee | Service
Fee | Total Fees | Retained
by FDC |
Class A | 0% | .25% | $ 16,288 | $ 304 |
Class T | .25% | .25% | 10,772 | - |
Class B | .75% | .25% | 8,030 | 6,508 |
Class C | .75% | .25% | 35,419 | 16,934 |
| | | $ 70,509 | $ 23,746 |
Sales Load. FDC receives a front-end sales charge of up to 5.75% for selling Class A shares, and 3.50% for selling Class T shares, some of which is paid to financial intermediaries for selling shares of the Fund. FDC receives the proceeds of contingent deferred sales charges levied on Class A, Class T, Class B, and Class C redemptions. These charges depend on the holding period. The deferred sales charges range from 5% to 1% for Class B, 1% for Class C, 1.00% for certain purchases of Class A shares (1.00% to .50% prior to July 12, 2010) and .25% for certain purchases of Class T shares.
For the period, sales charge amounts retained by FDC were as follows:
| Retained
by FDC |
Class A | $ 12,659 |
Class T | 1,864 |
Class B* | 1,097 |
Class C* | 1,555 |
| $ 17,175 |
* When Class B and Class C shares are initially sold, FDC pays commissions from its own resources to financial intermediaries through which the sales are made.
Annual Report
Notes to Financial Statements - continued
5. Fees and Other Transactions with Affiliates - continued
Transfer Agent Fees. Fidelity Investments Institutional Operations Company, Inc. (FIIOC), an affiliate of FMR, is the transfer, dividend disbursing and shareholder servicing agent for each class of the Fund. FIIOC receives account fees and asset-based fees that vary according to the account size and type of account of the shareholders of the respective classes of the Fund. FIIOC pays for typesetting, printing and mailing of shareholder reports, except proxy statements. For the period, transfer agent fees for each class were as follows:
| Amount | % of
Average
Net Assets |
Class A | $ 19,569 | .30 |
Class T | 6,660 | .31 |
Class B | 2,517 | .31 |
Class C | 10,953 | .31 |
Emerging Europe, Middle East, Africa (EMEA) | 340,642 | .30 |
Institutional Class | 10,427 | .20 |
| $ 390,768 | |
Accounting Fees. Fidelity Service Company, Inc. (FSC), an affiliate of FMR, maintains the Fund's accounting records. The fee is based on the level of average net assets for the month.
Brokerage Commissions. The Fund placed a portion of its portfolio transactions with brokerage firms which are affiliates of the investment adviser. The commissions paid to these affiliated firms were $277 for the period.
6. Committed Line of Credit.
The Fund participates with other funds managed by FMR or an affiliate in a $3.75 billion credit facility (the "line of credit") to be utilized for temporary or emergency purposes to fund shareholder redemptions or for other short-term liquidity purposes. The Fund has agreed to pay commitment fees on its pro-rata portion of the line of credit, which amounted to $503 and is reflected in Miscellaneous expenses on the Statement of Operations. During the period, there were no borrowings on this line of credit.
7. Expense Reductions.
FMR voluntarily agreed to reimburse each class to the extent annual operating expenses exceeded certain levels of average net assets as noted in the table below. Some expenses, for example interest expense, including commitment fees, are excluded from this reimbursement.
Annual Report
7. Expense Reductions - continued
The following classes were in reimbursement during the period:
| Expense
Limitations | Reimbursement
from adviser |
Class A | 1.50% | $ 12,027 |
Class T | 1.75% | 4,152 |
Class B | 2.25% | 1,723 |
Class C | 2.25% | 7,018 |
Emerging Europe, Middle East, Africa (EMEA) | 1.25% | 230,099 |
Institutional Class | 1.25% | 4,595 |
| | $ 259,614 |
Effective January 1, 2011, the expense limitation will be changed to 1.65%, 1.90%, 2.40%, 2.40%, 1.40% and 1.40% for Class A, T, B, C, Emerging Europe, Middle East, Africa (EMEA) and Institutional, respectively.
Many of the brokers with whom FMR places trades on behalf of the Fund provided services to the Fund in addition to trade execution. These services included payments of certain expenses on behalf of the Fund totaling $169,256 for the period.
8. Distributions to Shareholders.
Distributions to shareholders of each class were as follows:
Years ended October 31, | 2010 | 2009 |
From net investment income | | |
Class A | $ 26,924 | $ 8,761 |
Class T | 5,586 | 2,185 |
Class C | 2,308 | - |
Emerging Europe, Middle East, Africa (EMEA) | 748,050 | 241,410 |
Institutional Class | 33,147 | 20,746 |
Total | $ 816,015 | $ 273,102 |
From net realized gain | | |
Class A | $ 15,761 | $ - |
Class T | 5,156 | - |
Class B | 1,284 | - |
Class C | 9,232 | - |
Emerging Europe, Middle East, Africa (EMEA) | 345,254 | - |
Institutional Class | 14,732 | - |
Total | $ 391,419 | $ - |
Annual Report
Notes to Financial Statements - continued
9. Share Transactions.
Transactions for each class of shares were as follows:
| Shares | Dollars |
Years ended October 31, | 2010 | 2009 | 2010 | 2009 |
Class A | | | | |
Shares sold | 750,400 | 571,278 | $ 5,978,580 | $ 3,669,041 |
Reinvestment of distributions | 5,604 | 1,833 | 40,683 | 8,321 |
Shares redeemed | (299,775) | (197,844) | (2,302,163) | (1,251,307) |
Net increase (decrease) | 456,229 | 375,267 | $ 3,717,100 | $ 2,426,055 |
Class T | | | | |
Shares sold | 258,490 | 178,308 | $ 2,070,251 | $ 1,129,813 |
Reinvestment of distributions | 1,476 | 481 | 10,717 | 2,182 |
Shares redeemed | (127,308) | (83,315) | (967,322) | (541,782) |
Net increase (decrease) | 132,658 | 95,474 | $ 1,113,646 | $ 590,213 |
Class B | | | | |
Shares sold | 50,154 | 55,038 | $ 403,463 | $ 326,654 |
Reinvestment of distributions | 173 | - | 1,261 | - |
Shares redeemed | (66,507) | (49,759) | (516,486) | (303,402) |
Net increase (decrease) | (16,180) | 5,279 | $ (111,762) | $ 23,252 |
Class C | | | | |
Shares sold | 353,916 | 342,231 | $ 2,814,751 | $ 2,213,144 |
Reinvestment of distributions | 1,559 | - | 11,306 | - |
Shares redeemed | (147,366) | (128,292) | (1,102,603) | (825,454) |
Net increase (decrease) | 208,109 | 213,939 | $ 1,723,454 | $ 1,387,690 |
Emerging Europe, Middle East, Africa (EMEA) | | | |
Shares sold | 10,587,461 | 13,077,282 | $ 85,331,520 | $ 83,717,275 |
Reinvestment of distributions | 144,800 | 50,835 | 1,051,250 | 230,791 |
Shares redeemed | (9,457,558) | (5,656,005) | (72,517,018) | (35,458,373) |
Net increase (decrease) | 1,274,703 | 7,472,112 | $ 13,865,752 | $ 48,489,693 |
Institutional Class | | | | |
Shares sold | 319,437 | 182,348 | $ 2,551,378 | $ 1,155,556 |
Reinvestment of distributions | 825 | 1,053 | 5,986 | 4,781 |
Shares redeemed | (105,236) | (167,948) | (819,955) | (976,723) |
Net increase (decrease) | 215,026 | 15,453 | $ 1,737,409 | $ 183,614 |
10. Other.
The Fund's organizational documents provide former and current trustees and officers with a limited indemnification against liabilities arising in connection with the performance of their duties to the Fund. In the normal course of business, the Fund may also enter into contracts that provide general indemnifications. The Fund's maximum exposure under these arrangements is unknown as this would be dependent on future claims that may be made against the Fund. The risk of material loss from such claims is considered remote.
At the end of the period, FMR or its affiliates were the owners of record of 10% of the total outstanding shares of the Fund.
Annual Report
To the Trustees of Fidelity Investment Trust and Shareholders of Fidelity Emerging Europe, Middle East, Africa (EMEA) Fund:
We have audited the accompanying statement of assets and liabilities of Fidelity Emerging Europe, Middle East, Africa (EMEA) Fund (the Fund), a fund of Fidelity Investment Trust, including the schedule of investments, as of October 31, 2010, and the related statement of operations for the year then ended, the statement of changes in net assets for each of the two years in the period then ended, and the financial highlights for each of the two years in the period then ended and the period May 8, 2008 (commencement of operations) to October 31, 2008. These financial statements and financial highlights are the responsibility of the Fund's management. Our responsibility is to express an opinion on these financial statements and financial highlights based on our audits.
We conducted our audits in accordance with standards of the Public Company Accounting Oversight Board (United States). Those standards require that we plan and perform the audit to obtain reasonable assurance about whether the financial statements and financial highlights are free of material misstatement. The Fund is not required to have, nor were we engaged to perform, an audit of its internal control over financial reporting. Our audits included consideration of internal control over financial reporting as a basis for designing audit procedures that are appropriate in the circumstances, but not for the purpose of expressing an opinion on the effectiveness of the Fund's internal control over financial reporting. Accordingly, we express no such opinion. An audit also includes examining, on a test basis, evidence supporting the amounts and disclosures in the financial statements, assessing the accounting principles used and significant estimates made by management, as well as evaluating the overall financial statement presentation. Our procedures included confirmation of securities owned as of October 31, 2010, by correspondence with the custodians and brokers; where replies were not received from brokers, we performed other auditing procedures. We believe that our audits provide a reasonable basis for our opinion.
In our opinion, the financial statements and financial highlights referred to above present fairly, in all material respects, the financial position of Fidelity Emerging Europe, Middle East, Africa (EMEA) Fund as of October 31, 2010, the results of its operations for the year then ended, the changes in its net assets for each of the two years in the period then ended, and the financial highlights for each of the two years in the period then ended and the period May 8, 2008 (commencement of operations) to October 31, 2008, in conformity with accounting principles generally accepted in the United States of America.
/s/ Deloitte & Touche LLP
DELOITTE & TOUCHE LLP
Boston, Massachusetts
December 16, 2010
Annual Report
The Trustees, Member of the Advisory Board, and executive officers of the trust and fund, as applicable, are listed below. The Board of Trustees governs the fund and is responsible for protecting the interests of shareholders. The Trustees are experienced executives who meet periodically throughout the year to oversee the fund's activities, review contractual arrangements with companies that provide services to the fund, oversee management of the risks associated with such activities and contractual arrangements, and review the fund's performance. Except for James C. Curvey, each of the Trustees oversees 221 funds advised by FMR or an affiliate. Mr. Curvey oversees 410 funds advised by FMR or an affiliate.
The Trustees hold office without limit in time except that (a) any Trustee may resign; (b) any Trustee may be removed by written instrument, signed by at least two-thirds of the number of Trustees prior to such removal; (c) any Trustee who requests to be retired or who has become incapacitated by illness or injury may be retired by written instrument signed by a majority of the other Trustees; and (d) any Trustee may be removed at any special meeting of shareholders by a two-thirds vote of the outstanding voting securities of the trust. Each Trustee who is not an interested person (as defined in the 1940 Act) (Independent Trustee), shall retire not later than the last day of the calendar year in which his or her 72nd birthday occurs. The Independent Trustees may waive this mandatory retirement age policy with respect to individual Trustees. The executive officers and Advisory Board Member hold office without limit in time, except that any officer and Advisory Board Member may resign or may be removed by a vote of a majority of the Trustees at any regular meeting or any special meeting of the Trustees. Except as indicated, each individual has held the office shown or other offices in the same company for the past five years.
Experience, Skills, Attributes, and Qualifications of the Fund's Trustees. The Governance and Nominating Committee has adopted a statement of policy that describes the experience, qualifications, attributes, and skills that are necessary and desirable for potential Independent Trustee candidates (Statement of Policy). The Board believes that each Trustee satisfied at the time he or she was initially elected or appointed a Trustee, and continues to satisfy, the standards contemplated by the Statement of Policy. The Governance and Nominating Committee also engages professional search firms to help identify potential Independent Trustee candidates who have the experience, qualifications, attributes, and skills consistent with the Statement of Policy. From time to time, additional criteria based on the composition and skills of the current Independent Trustees, as well as experience or skills that may be appropriate in light of future changes to board composition, business conditions, and regulatory or other developments, have also been considered by the professional search firms and the Governance and Nominating Committee. In addition, the Board takes into account the Trustees' commitment and participation in Board and committee meetings, as well as their leadership of standing and ad hoc committees throughout their tenure.
In determining that a particular Trustee was and continues to be qualified to serve as a Trustee, the Board has considered a variety of criteria, none of which, in isolation, was controlling. The Board believes that, collectively, the Trustees have balanced and diverse experience, qualifications, attributes, and skills, which allow the Board to operate effectively in governing the fund and protecting the interests of shareholders. Information about the specific experience, skills, attributes, and qualifications of each Trustee, which in each case led to the Board's conclusion that the Trustee should serve (or continue to serve) as a trustee of the fund, is provided below.
Annual Report
Board Structure and Oversight Function. Edward C. Johnson 3d is an interested person (as defined in the 1940 Act) and currently serves as Chairman. The Trustees have determined that an interested Chairman is appropriate and benefits shareholders because an interested Chairman has a personal and professional stake in the quality and continuity of services provided to the fund. Independent Trustees exercise their informed business judgment to appoint an individual of their choosing to serve as Chairman, regardless of whether the Trustee happens to be independent or a member of management. The Independent Trustees have determined that they can act independently and effectively without having an Independent Trustee serve as Chairman and that a key structural component for assuring that they are in a position to do so is for the Independent Trustees to constitute a substantial majority for the Board. The Independent Trustees also regularly meet in executive session. Ned C. Lautenbach serves as Chairman of the Independent Trustees and as such (i) acts as a liaison between the Independent Trustees and management with respect to matters important to the Independent Trustees and (ii) with management prepares agendas for Board meetings.
Fidelity funds are overseen by different Boards of Trustees. The fund's Board oversees Fidelity's equity and high income funds and another Board oversees Fidelity's investment-grade bond, money market, and asset allocation funds. The asset allocation funds may invest in Fidelity funds overseen by the fund's Board. The use of separate Boards, each with its own committee structure, allows the Trustees of each group of Fidelity funds to focus on the unique issues of the funds they oversee, including common research, investment, and operational issues. On occasion, the separate Boards establish joint committees to address issues of overlapping consequences for the Fidelity funds overseen by each Board.
The Trustees operate using a system of committees to facilitate the timely and efficient consideration of all matters of importance to the Trustees, the fund, and fund shareholders and to facilitate compliance with legal and regulatory requirements and oversight of the fund's activities and associated risks. The Board, acting through its committees, has charged FMR and its affiliates with (i) identifying events or circumstances the occurrence of which could have demonstrably adverse effects on the fund's business and/or reputation; (ii) implementing processes and controls to lessen the possibility that such events or circumstances occur or to mitigate the effects of such events or circumstances if they do occur; and (iii) creating and maintaining a system designed to evaluate continuously business and market conditions in order to facilitate the identification and implementation processes described in (i) and (ii) above. Because the day-to-day operations and activities of the fund are carried out by or through FMR, its affiliates and other service providers, the fund's exposure to risks is mitigated but not eliminated by the processes overseen by the Trustees. While each of the Board's committees has responsibility for overseeing different aspects of the fund's activities, oversight is exercised primarily through the Operations, Audit, and Compliance Committees. Appropriate personnel, including but not limited to the fund's Chief Compliance Officer (CCO), FMR's internal auditor, the independent accountants, the fund's Treasurer and portfolio management personnel, make periodic reports to the Board's committees, as appropriate. The responsibilities of each committee, including their oversight responsibilities, are described further under "Standing Committees of the Fund's Trustees."
Annual Report
Trustees and Officers - continued
The fund's Statement of Additional Information (SAI) includes more information about the Trustees. To request a free copy, call Fidelity at 1-877-208-0098.
Interested Trustees*:
Correspondence intended for each Trustee who is an interested person may be sent to Fidelity Investments, 82 Devonshire Street, Boston, Massachusetts 02109.
Name, Age; Principal Occupations and Other Relevant Experience+ |
Edward C. Johnson 3d (80) |
| Year of Election or Appointment: 1984 Mr. Johnson is Trustee and Chairman of the Board of Trustees of certain Trusts. Mr. Johnson serves as Chief Executive Officer, Chairman, and a Director of FMR LLC; Chairman and a Director of FMR; Chairman and a Director of Fidelity Research & Analysis Company (FRAC); Chairman and a Director of Fidelity Investments Money Management, Inc.; and Chairman and a Director of FMR Co., Inc. In addition, Mr. Johnson serves as Chairman and Director of FIL Limited. Previously, Mr. Johnson served as President of FMR LLC (2006-2007). |
James C. Curvey (75) |
| Year of Election or Appointment: 2007 Mr. Curvey also serves as Trustee (2007-present) of other investment companies advised by FMR. Mr. Curvey is a Director of Fidelity Investments Money Management, Inc. (2009-present), Director of Fidelity Research & Analysis Co. (2009-present) and Director of FMR and FMR Co., Inc. (2007-present). Mr. Curvey is also Vice Chairman (2007-present) and Director of FMR LLC. In addition, Mr. Curvey serves as an Overseer for the Boston Symphony Orchestra and a member of the Trustees of Villanova University. Previously, Mr. Curvey was the Vice Chairman (2006-2007) and Director (2000-2007) of FMR Corp. |
* Trustees have been determined to be "Interested Trustees" by virtue of, among other things, their affiliation with the trust or various entities under common control with FMR.
+ The information above includes each Trustee's principal occupation during the last five years and other information relating to the experience, attributes, and skills relevant to each Trustee's qualifications to serve as a Trustee, which led to the conclusion that each Trustee should serve as a Trustee for the fund.
Independent Trustees:
Correspondence intended for each Independent Trustee (that is, the Trustees other than the Interested Trustees) may be sent to Fidelity Investments, P.O. Box 55235, Boston, Massachusetts 02205-5235.
Name, Age; Principal Occupations and Other Relevant Experience+ |
Dennis J. Dirks (62) |
| Year of Election or Appointment: 2005 Prior to his retirement in May 2003, Mr. Dirks was Chief Operating Officer and a member of the Board of The Depository Trust & Clearing Corporation (DTCC). He also served as President, Chief Operating Officer, and Board member of The Depository Trust Company (DTC) and President and Board member of the National Securities Clearing Corporation (NSCC). In addition, Mr. Dirks served as Chief Executive Officer and Board member of the Government Securities Clearing Corporation, Chief Executive Officer and Board member of the Mortgage-Backed Securities Clearing Corporation, as a Trustee and a member of the Finance Committee of Manhattan College (2005-2008), and as a Trustee and a member of the Finance Committee of AHRC of Nassau County (2006-2008). Mr. Dirks is a member of the Independent Directors Council (IDC) Governing Council (2010-Present) and Board of Directors for The Brookville Center for Children's Services, Inc. (2009-present). |
Alan J. Lacy (57) |
| Year of Election or Appointment: 2008 Mr. Lacy serves as Senior Adviser (2007-present) of Oak Hill Capital Partners, L.P. (private equity). Mr. Lacy also served as Chief Executive Officer (2000-2005) and Vice Chairman (2005-2006) of Sears Holdings Corporation and Sears, Roebuck and Co. (retail). In addition, Mr. Lacy serves as a member of the Board of Directors of The Western Union Company (global money transfer, 2006-present) and Bristol-Myers Squibb Company (global pharmaceuticals, 2007-present). Mr. Lacy is Chairman (2008-present) and a member (2006-present) of the Board of Trustees of The National Parks Conservation Association. |
Ned C. Lautenbach (66) |
| Year of Election or Appointment: 2000 Mr. Lautenbach is Chairman of the Independent Trustees of the Equity and High Income Funds (2006-present). Mr. Lautenbach currently serves as the Lead Director of the Eaton Corporation Board of Directors (diversified industrial, 1997-present). Mr. Lautenbach is also a member of the Board of Directors of the Philharmonic Center for the Arts in Naples, Florida (1999 - present); a member of the Board of Trustees of Fairfield University (2005-present); and a member of the Council on Foreign Relations (1994 - present). Previously, Mr. Lautenbach was a Partner/Advisory Partner at Clayton, Dubilier & Rice, Inc. (private equity investment, 1998-2010), as well as a Director of Sony Corporation (2006-2007). |
Joseph Mauriello (66) |
| Year of Election or Appointment: 2008 Prior to his retirement in January 2006, Mr. Mauriello served in numerous senior management positions including Deputy Chairman and Chief Operating Officer (2004-2005), and Vice Chairman of Financial Services (2002-2004) of KPMG LLP US (professional services, 1965-2005). Mr. Mauriello currently serves as a member of the Board of Directors of XL Group plc. (global insurance and re-insurance, 2006-present) and of Arcadia Resources Inc. (health care services and products, 2007-present). Previously, Mr. Mauriello served as a Director of the Hamilton Funds of the Bank of New York (2006-2007). |
Cornelia M. Small (66) |
| Year of Election or Appointment: 2005 Ms. Small is a member of the Board of Directors of the Teagle Foundation (2009-present). Ms. Small is also a member of the Investment Committee, and Chair (2008-present) and a member of the Board of Trustees of Smith College. In addition, Ms. Small serves on the Investment Committee of the Berkshire Taconic Community Foundation (2008-present). Previously, Ms. Small served as Chairperson of the Investment Committee (2002-2008) of Smith College. In addition, Ms. Small served as Chief Investment Officer, Director of Global Equity Investments, and a member of the Board of Directors of Scudder, Stevens & Clark and Scudder Kemper Investments. |
William S. Stavropoulos (71) |
| Year of Election or Appointment: 2001 Mr. Stavropoulos is Vice Chairman of the Independent Trustees of the Equity and High Income Funds (2006-present). Mr. Stavropoulos serves as President and Founder of the Michigan Baseball Foundation, the Great Lakes Loons (2007-present). Mr. Stavropoulos is Chairman Emeritus of the Board of Directors of The Dow Chemical Company, where he previously served in numerous senior management positions, including President, CEO (1995-2000; 2002-2004), Chairman of the Executive Committee (2000-2006), and as a member of the Board of Directors (1990-2006). Currently, Mr. Stavropoulos is Chairman of Univar (global distributor of commodity and special chemicals, 2010-present), a Director of Teradata Corporation (data warehousing and technology solutions, 2008-present), Chemical Financial Corporation, Maersk Inc. (industrial conglomerate), Tyco International, Inc. (multinational manufacturing and services, 2007-present), and a member of the Advisory Board for Metalmark Capital (private equity investment, 2005-present). Mr. Stavropoulos is a special advisor to Clayton, Dubilier & Rice, Inc. (private equity investment). In addition, Mr. Stavropoulos is a member of the University of Notre Dame Advisory Council for the College of Science. |
David M. Thomas (61) |
| Year of Election or Appointment: 2008 Previously, Mr. Thomas served as Executive Chairman (2005-2006) and Chairman and Chief Executive Officer (2000-2005) of IMS Health, Inc. (pharmaceutical and healthcare information solutions). In addition, Mr. Thomas serves as a member of the Board of Directors of Fortune Brands, Inc. (consumer products), and Interpublic Group of Companies, Inc. (marketing communication, 2004-present). |
Michael E. Wiley (60) |
| Year of Election or Appointment: 2008 Mr. Wiley also serves as a Director of Asia Pacific Exploration Consolidated (international oil and gas exploration and production, 2008-present). Mr. Wiley serves as a Director of Tesoro Corporation (independent oil refiner and marketer, 2005-present), and a Director of Bill Barrett Corporation (exploration and production, 2005-present). In addition, Mr. Wiley also serves as a Director of Post Oak Bank (privately-held bank, 2004-present). Previously, Mr. Wiley served as a member of the Board of Trustees of the University of Tulsa (2000-2006; 2007-2010), as a Senior Energy Advisor of Katzenbach Partners, LLC (consulting, 2006-2007), as an Advisory Director of Riverstone Holdings (private investment), Chairman, President, and CEO of Baker Hughes, Inc. (oilfield services, 2000-2004), and as Director of Spinnaker Exploration Company (exploration and production, 2001-2005). |
+ The information above includes each Trustee's principal occupation during the last five years and other information relating to the experience, attributes, and skills relevant to each Trustee's qualifications to serve as a Trustee, which led to the conclusion that each Trustee should serve as a Trustee for the fund.
Advisory Board Member and Executive Officers:
Correspondence intended for each executive officer and Peter S. Lynch may be sent to Fidelity Investments, 82 Devonshire Street, Boston, Massachusetts 02109.
Name, Age; Principal Occupation |
Peter S. Lynch (66) |
| Year of Election or Appointment: 2003 Member of the Advisory Board of Fidelity's Equity and High Income Funds. Mr. Lynch is Vice Chairman and a Director of FMR and FMR Co., Inc. In addition, Mr. Lynch serves as a Trustee of Boston College and as the Chairman of the Inner-City Scholarship Fund. Previously, Mr. Lynch served on the Special Olympics International Board of Directors (1997-2006). |
Kenneth B. Robins (41) |
| Year of Election or Appointment: 2008 President and Treasurer of Fidelity's Equity and High Income Funds. Mr. Robins also serves as President and Treasurer (2010-present) and Assistant Treasurer (2009-present) of other Fidelity funds and is an employee of Fidelity Investments (2004-present). Previously, Mr. Robins served as Deputy Treasurer of the Fidelity funds (2005-2008) and Treasurer and Chief Financial Officer of The North Carolina Capital Management Trust: Cash and Term Portfolios (2006-2008). |
Bruce T. Herring (45) |
| Year of Election or Appointment: 2006 Vice President of certain Equity Funds. Mr. Herring also serves as Chief Investment Officer and Director of Fidelity Management & Research (U.K.) Inc. (2010-present) and Group Chief Investments Officer of FMR. Previously, Mr. Herring served as Vice President (2005-2006) and Senior Vice President (2006-2007) of Fidelity Management & Research Company, Vice President of FMR Co., Inc. (2001-2007) and as a portfolio manager for Fidelity U.S. Equity Funds. |
Brian B. Hogan (46) |
| Year of Election or Appointment: 2009 Vice President of certain Equity Funds and Vice President of Sector Funds. Mr. Hogan also serves as President of FMR's Equity Division (2009-present). Previously, Mr. Hogan served as Senior Vice President, Equity Research of FMR (2006-2009) and as a portfolio manager. |
Scott C. Goebel (42) |
| Year of Election or Appointment: 2008 Secretary and Chief Legal Officer (CLO) of the Fidelity funds. Mr. Goebel also serves as Secretary and CLO of The North Carolina Capital Management Trust: Cash and Term Portfolio (2008-present); General Counsel, Secretary, and Senior Vice President of FMR (2008-present) and FMR Co., Inc. (2008-present); Deputy General Counsel of FMR LLC; Chief Legal Officer of Fidelity Management & Research (Hong Kong) Limited (2008-present) and Assistant Secretary of Fidelity Management & Research (Japan) Inc. (2008-present), Fidelity Investments Money Management, Inc. (2008-present), Fidelity Management & Research (U.K.) Inc. (2008-present), and Fidelity Research and Analysis Company (2008-present). Previously, Mr. Goebel served as Assistant Secretary of the Funds (2007-2008) and as Vice President and Secretary of Fidelity Distributors Corporation (FDC) (2005-2007). |
William C. Coffey (41) |
| Year of Election or Appointment: 2009 Assistant Secretary of Fidelity's Equity and High Income Funds. Mr. Coffey also serves as Senior Vice President and Deputy General Counsel of FMR LLC (2010-present), and is an employee of Fidelity Investments. Previously, Mr. Coffey served as Vice President and Associate General Counsel of FMR LLC (2005-2009). |
Holly C. Laurent (56) |
| Year of Election or Appointment: 2008 Anti-Money Laundering (AML) Officer of the Fidelity funds. Ms. Laurent also serves as AML Officer of The North Carolina Capital Management Trust: Cash and Term Portfolio (2008-present) and is an employee of Fidelity Investments. Previously, Ms. Laurent was Senior Vice President and Head of Legal for Fidelity Business Services India Pvt. Ltd. (2006-2008), and Senior Vice President, Deputy General Counsel and Group Head for FMR LLC (2005-2006). |
Christine Reynolds (52) |
| Year of Election or Appointment: 2008 Chief Financial Officer of the Fidelity funds. Ms. Reynolds became President of Fidelity Pricing and Cash Management Services (FPCMS) in August 2008. Ms. Reynolds served as Chief Operating Officer of FPCMS (2007-2008). Previously, Ms. Reynolds served as President, Treasurer, and Anti-Money Laundering officer of the Fidelity funds (2004-2007). |
Kenneth A. Rathgeber (63) |
| Year of Election or Appointment: 2004 Chief Compliance Officer of Fidelity's Equity and High Income Funds. Mr. Rathgeber is Chief Compliance Officer of Fidelity Management & Research (Hong Kong) Limited (2008-present), Fidelity Management & Research (Japan) Inc. (2008-present), FMR (2005-present), FMR Co., Inc. (2005-present), Fidelity Management & Research (U.K.) Inc. (2005-present), Fidelity Research & Analysis Company (2005-present), Fidelity Investments Money Management, Inc. (2005-present), Pyramis Global Advisors, LLC (2005-present), and Strategic Advisers, Inc. (2005-present). |
Jeffrey S. Christian (49) |
| Year of Election or Appointment: 2009 Deputy Treasurer of the Fidelity funds. Mr. Christian is an employee of Fidelity Investments. Previously, Mr. Christian served as Chief Financial Officer (2008-2009) of certain Fidelity funds and Senior Vice President of Fidelity Pricing and Cash Management Services (FPCMS) (2004-2009). |
Bryan A. Mehrmann (49) |
| Year of Election or Appointment: 2005 Deputy Treasurer of the Fidelity funds. Mr. Mehrmann is an employee of Fidelity Investments. |
Adrien E. Deberghes (43) |
| Year of Election or Appointment: 2008 Deputy Treasurer of Fidelity's Equity and High Income Funds. Mr. Deberghes also serves as Assistant Treasurer of other Fidelity funds (2010-present) and is an employee of Fidelity Investments (2008-present). Previously, Mr. Deberghes served as Senior Vice President of Mutual Fund Administration at State Street Corporation (2007-2008), Senior Director of Mutual Fund Administration at Investors Bank & Trust (2005-2007), and Director of Finance for Dunkin' Brands (2000-2005). |
Stephanie J. Dorsey (41) |
| Year of Election or Appointment: 2010 Assistant Treasurer of Fidelity's Equity and High Income Funds. Ms. Dorsey also serves as Deputy Treasurer of other Fidelity funds (2008-present) and is an employee of Fidelity Investments (2008-present). Previously, Ms. Dorsey served as Treasurer (2004-2008) of the JPMorgan Mutual Funds and Vice President (2004-2008) of JPMorgan Chase Bank. |
John R. Hebble (52) |
| Year of Election or Appointment: 2009 Assistant Treasurer of Fidelity's Equity and High Income Funds. Mr. Hebble also serves as Treasurer and Chief Financial Officer of The North Carolina Capital Management Trust: Cash and Term Portfolio (2008-present), President and Treasurer of other Fidelity funds (2008-present) and is an employee of Fidelity Investments. |
Gary W. Ryan (52) |
| Year of Election or Appointment: 2005 Assistant Treasurer of the Fidelity funds. Mr. Ryan is an employee of Fidelity Investments. Previously, Mr. Ryan served as Vice President of Fund Reporting in Fidelity Pricing and Cash Management Services (FPCMS) (1999-2005). |
Jonathan Davis (42) |
| Year of Election or Appointment: 2010 Assistant Treasurer of the Fidelity funds. Mr. Davis is an employee of Fidelity Investments. Previously, Mr. Davis served as Vice President and Associate General Counsel of FMR LLC (2003-2010). |
Annual Report
The Board of Trustees of Fidelity Emerging Europe, Middle East, Africa (EMEA) Fund voted to pay to shareholders of record at the opening of business on record date, the following distributions per share derived from capital gains realized from sales of portfolio securities, and dividends derived from net investment income:
| Pay Date | Record Date | Dividends | Capital Gains |
Class A | 12/13/10 | 12/10/10 | $0.059 | $0.015 |
Class T | 12/13/10 | 12/10/10 | $0.046 | $0.015 |
Class B | 12/13/10 | 12/10/10 | $0.000 | $0.010 |
Class C | 12/13/10 | 12/10/10 | $0.025 | $0.015 |
Class A, T, B and C designate 100% of the dividend distributed during the fiscal year as amounts which may be taken into account as a dividend for purposes of the maximum rate under section 1(h)(11) of the Internal Revenue Code.
The amounts per share which represent income derived from sources within, and taxes paid to, foreign countries or possessions of the United States are as follows:
| Pay Date | Income | Taxes |
Class A | 12/14/2009 | $0.030 | $0.0077 |
Class T | 12/14/2009 | $0.024 | $0.0077 |
Class B | 12/14/2009 | $0.008 | $0.0077 |
Class C | 12/14/2009 | $0.016 | $0.0077 |
The fund will notify shareholders in January 2011 of amounts for use in preparing 2010 income tax returns.
Annual Report
Board Approval of Investment Advisory Contracts and Management Fees
Fidelity Emerging Europe, Middle East, Africa (EMEA) Fund
Each year, the Board of Trustees, including the Independent Trustees (together, the Board), votes on the renewal of the management contract and sub-advisory agreements (together, the Advisory Contracts) for the fund. The Board, assisted by the advice of fund counsel and Independent Trustees' counsel, requests and considers a broad range of information relevant to the renewal of the Advisory Contracts throughout the year.
The Board meets regularly and considers at each of its meetings factors that are relevant to its annual consideration of the renewal of the fund's Advisory Contracts, including the services and support provided to the fund and its shareholders. The Board has established various standing committees, each composed of Independent Trustees with varying backgrounds, to which the Board has assigned specific subject matter responsibilities in order to enhance effective decision-making by the Board. The Board, acting directly and through its Committees, requests and receives information concerning the annual consideration of the renewal of the fund's Advisory Contracts. The Board also meets as needed to consider matters specifically related to the Board's annual consideration of the renewal of Advisory Contracts. Members of the Board may also meet with trustees of other Fidelity funds through ad hoc joint committees to discuss certain matters relevant to the Fidelity funds.
At its July 2010 meeting, the Board of Trustees, including the Independent Trustees, unanimously determined to renew the fund's Advisory Contracts. In reaching its determination, the Board considered all factors it believed relevant, including (i) the nature, extent, and quality of the services to be provided to the fund and its shareholders (including the investment performance of the fund); (ii) the competitiveness of the fund's management fee and total expenses; (iii) the total costs of the services to be provided by and the profits to be realized by Fidelity from its relationship with the fund; (iv) the extent to which economies of scale would be realized as the fund grows; and (v) whether fee levels reflect these economies of scale, if any, for the benefit of fund shareholders.
In considering whether to renew the Advisory Contracts for the fund, the Board reached a determination, with the assistance of fund counsel and Independent Trustees' counsel and through the exercise of its business judgment, that the renewal of the Advisory Contracts is in the best interests of fund shareholders and that the compensation to be received by Fidelity under the management contract is fair and reasonable. The Board's decision to renew the Advisory Contracts was not based on any single factor noted above, but rather was based on a comprehensive consideration of all the information provided to the Board at its meetings throughout the year. The Board, in reaching its determination to renew the Advisory Contracts, is aware that shareholders in the fund have a broad range of investment choices available to them, including a wide choice among mutual funds offered by Fidelity's competitors, and that the fund's shareholders, with the opportunity to review and weigh the disclosure provided by the fund in its prospectus and other public disclosures, have chosen to invest in this fund, managed by Fidelity.
Annual Report
Board Approval of Investment Advisory Contracts and
Management Fees - continued
Nature, Extent, and Quality of Services Provided. The Board considered the staffing within the investment adviser, FMR, and the sub-advisers (together, the Investment Advisers), including the backgrounds of the fund's investment personnel and the fund's investment objective and discipline. The Independent Trustees also had discussions with senior management of Fidelity's investment operations and investment groups. The Board considered the structure of the portfolio manager compensation program and whether this structure provides appropriate incentives to act in the best interest of the fund.
Resources Dedicated to Investment Management and Support Services. The Board and the equity research subcommittee of the Board's Fund Oversight Committee reviewed the size, education, and experience of the Investment Advisers' investment staff, their use of technology, and the Investment Advisers' approach to recruiting, training, and retaining portfolio managers and other research, advisory, and management personnel. The Board noted that Fidelity's analysts have access to a variety of technological tools and market and securities data that enable them to perform both fundamental and quantitative analysis and to specialize in various disciplines. The Board considered Fidelity's extensive global research capabilities that enable the Investment Advisers to aggregate data from various sources in an effort to produce positive investment results. The Board also considered that Fidelity's portfolio managers and analysts have access to daily portfolio attribution that allows for monitoring of a fund's portfolio, as well as an electronic communication system that provides immediate real-time access to research concerning issuers and credit enhancers. The Board noted FMR's continued focus on strengthening the organization and discipline of equity portfolio management and research.
Shareholder and Administrative Services. The Board considered (i) the nature, extent, quality, and cost of advisory, administrative, and shareholder services performed by the Investment Advisers and their affiliates under the Advisory Contracts and under separate agreements covering transfer agency, pricing and bookkeeping, and securities lending services for the fund; (ii) the nature and extent of the investment adviser's supervision of third party service providers, principally custodians and subcustodians; and (iii) the resources devoted to, and the record of compliance with, the fund's compliance policies and procedures. The Board also reviewed the allocation of fund brokerage, including allocations to brokers affiliated with the Investment Advisers, the use of brokerage commissions to pay fund expenses, and the use of "soft" commission dollars to pay for research services.
The Board noted that the growth of fund assets over time across the complex allows Fidelity to reinvest in the development of services designed to enhance the value or convenience of the Fidelity funds as investment vehicles. These services include 24-hour access to account information and market information through phone representatives and over the Internet, and investor education materials and asset allocation tools.
Annual Report
Investment in a Large Fund Family. The Board considered the benefits to shareholders of investing in a Fidelity fund, including the benefits of investing in a fund that is part of a large family of funds offering a variety of investment disciplines and providing a large variety of mutual fund investor services. The Board noted that Fidelity had taken, or had made recommendations that resulted in the Fidelity funds taking, a number of actions over the previous year that benefited particular funds, including (i) dedicating additional resources to investment research and restructuring and broadening the focus of the investment research teams; (ii) bolstering the senior management team that oversees asset management; (iii) launching Class F of certain funds as a lower-fee class available to Freedom K and Freedom Index Funds; (iv) lowering the initial investment minimums and ongoing balance requirements for Real Estate High Income Fund; (v) eliminating subsequent purchase minimums for all funds and adding a waiver of the investment minimum requirement for new accounts opened with the proceeds of a systematic withdrawal plan; (vi) eliminating the withdrawal minimum and maximum limits for systematic withdrawals from Advisor funds; (vii) expanding sales load waivers on Class A shares for Destiny Planholders and expanding Institutional Class eligibility for Class O Destiny Planholders; and (viii) changing certain Class A and Class T sales charge structures to further align them with industry practices.
Investment Performance. The Board considered whether the fund has operated in accordance with its investment objective, as well as its record of compliance with its investment restrictions. It also reviewed the fund's absolute investment performance for each class, as well as the fund's relative investment performance for each class measured against a broad-based securities market index. The Board noted that FMR does not believe that a meaningful peer group exists against which to compare the fund's performance. Because the fund had been in existence less than three calendar years, the following chart considered by the Board shows, for the one-year period ended December 31, 2009, the total returns of Institutional Class (Class I) and Class C of the fund and the total returns of a broad-based securities market index ("benchmark").
Annual Report
Board Approval of Investment Advisory Contracts and
Management Fees - continued
Fidelity Emerging Europe, Middle East, Africa (EMEA) Fund
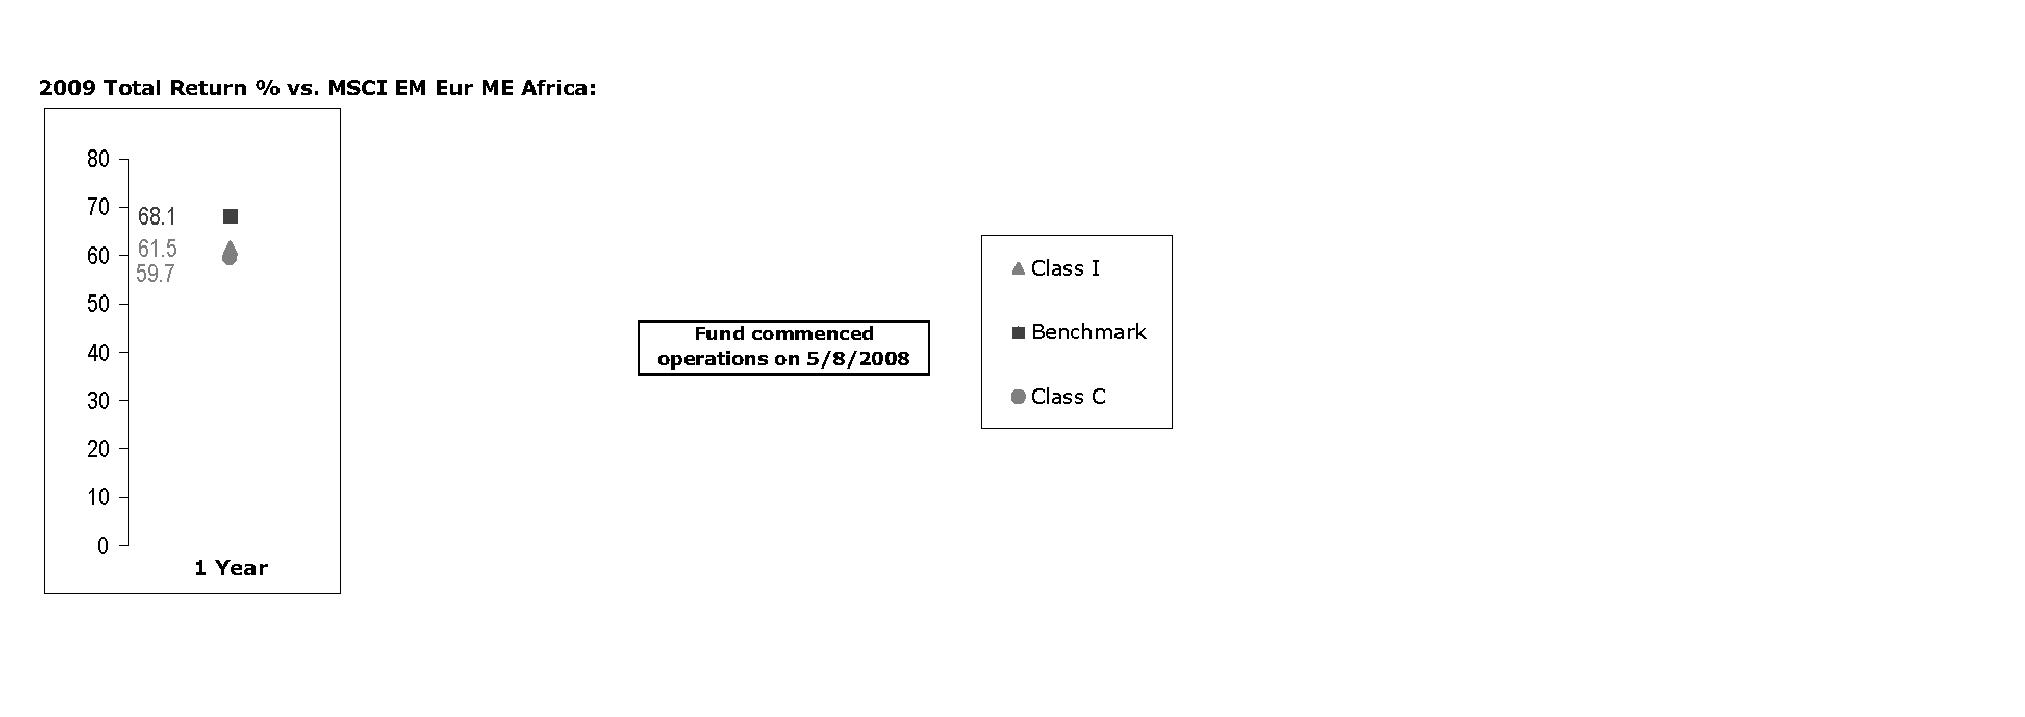
The Board noted that the investment performance of the fund was lower than its benchmark for the period shown. The Board considered that the variations in performance among the fund's classes reflect the variations in class expenses, which result in lower performance for higher expense classes. The Board also reviewed the fund's performance since inception as well as performance in the current year. The Board noted that it is difficult to evaluate in any comprehensive fashion the performance of the fund, in light of its relatively recent commencement of operations.
Based on its review, and giving particular weight to the nature and quality of the resources dedicated by the Investment Advisers to maintain and improve relative performance and factoring in the unprecedented market events in recent years, the Board concluded that the nature, extent, and quality of investment management and support services and of shareholder and administrative services provided to the fund will benefit the fund's shareholders, particularly in light of the Board's view that the fund's shareholders benefit from investing in a fund that is part of a large family of funds offering a variety of investment disciplines and services.
Competitiveness of Management Fee and Total Fund Expenses. The Board considered the fund's management fee and total expenses compared to "mapped groups" of competitive funds and classes. Fidelity creates "mapped groups" by combining similar Lipper investment objective categories that have comparable management fee characteristics. Combining Lipper investment objective categories aids the Board's management fee and total expense comparisons by broadening the competitive group used for comparison and by reducing the number of universes to which various Fidelity funds are compared.
Annual Report
Management Fee. The Board considered two proprietary management fee comparisons for the 12-month (or shorter) periods shown in the chart below. The group of Lipper funds used by the Board for management fee comparisons is referred to below as the "Total Mapped Group." The Total Mapped Group comparison focuses on a fund's standing relative to the total universe of comparable funds available to investors, in terms of gross management fees before expense reimbursements or caps. "TMG %" represents the percentage of funds in the Total Mapped Group that had management fees that were lower than the fund's. For example, a TMG % of 13% means that 87% of the funds in the Total Mapped Group had higher management fees than the fund. The "Asset-Size Peer Group" (ASPG) comparison focuses on a fund's standing relative to non-Fidelity funds similar in size to the fund within the Total Mapped Group. The ASPG represents at least 15% of the funds in the Total Mapped Group with comparable asset size and management fee characteristics, subject to a minimum of 50 funds (or all funds in the Total Mapped Group if fewer than 50). Additional information, such as the ASPG quartile in which the fund's management fee ranked, is also included in the chart and considered by the Board.
Fidelity Emerging Europe, Middle East, Africa (EMEA) Fund
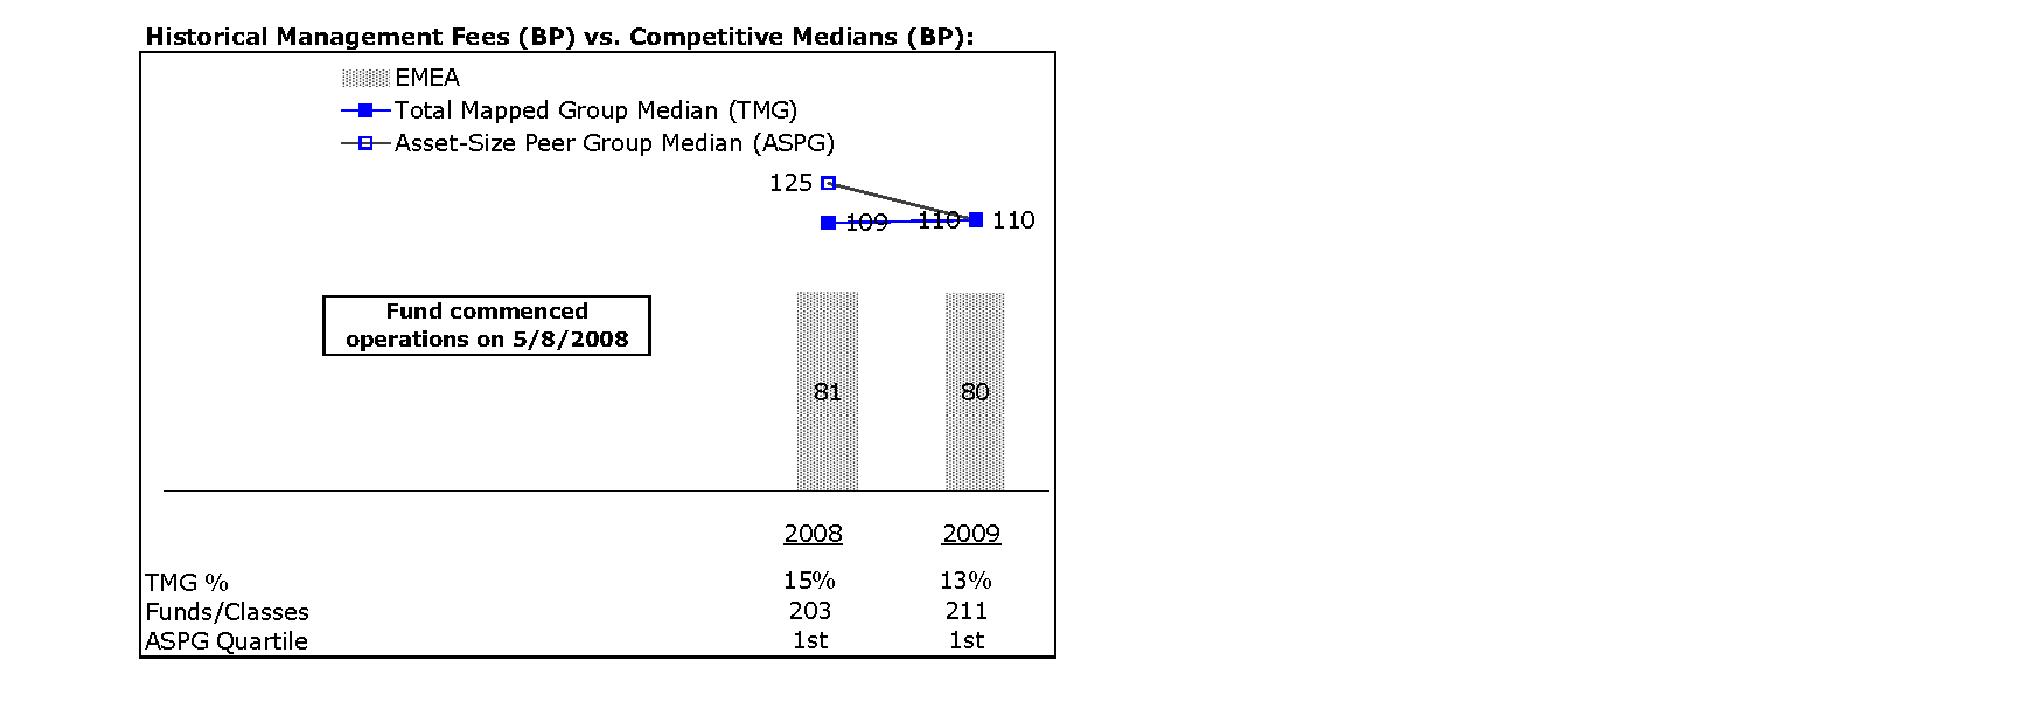
The Board noted that the fund's management fee ranked below the median of its Total Mapped Group and below the median of its ASPG for 2009.
Based on its review, the Board concluded that the fund's management fee is fair and reasonable in light of the services that the fund receives and the other factors considered.
Total Expenses. In its review of each class's total expenses, the Board considered the fund's management fee as well as other fund or class expenses, as applicable, such as transfer agent fees, pricing and bookkeeping fees, fund-paid 12b-1 fees, and custodial, legal, and audit fees. The Board also noted the effects of any waivers and reimbursements on fees and expenses. As part of its review, the Board also considered current and historical total expenses of each class of the fund compared to competitive fund median expenses. Each class of the fund is compared to those funds and classes in the Total Mapped Group (used by the Board for management fee comparisons) that have a similar sales load structure.
Annual Report
Board Approval of Investment Advisory Contracts and
Management Fees - continued
The Board noted that the total expenses of each class ranked below its competitive median for 2009.
Fees Charged to Other Fidelity Clients. The Board also considered Fidelity fee structures and other information with respect to clients of FMR and its affiliates, such as other mutual funds advised or subadvised by FMR or its affiliates, pension plan clients, and other institutional clients. In March 2010, the Board created an ad hoc joint committee with the board of other Fidelity funds (the Committee) to review and compare Fidelity's institutional investment advisory business with its business of providing services to the Fidelity funds, including the differences in services provided, fees charged, and costs incurred, as well as competition in their respective marketplaces.
Based on its review of total expenses and fees charged to other Fidelity clients, the Board concluded that the total expenses of each class of the fund were reasonable in light of the services that the fund and its shareholders receive and the other factors considered, including the findings of the Committee.
Costs of the Services and Profitability. The Board considered the revenues earned and the expenses incurred by Fidelity in conducting the business of developing, marketing, distributing, managing, administering and servicing the fund and its shareholders. The Board also considered the level of Fidelity's profits in respect of all the Fidelity funds.
On an annual basis, FMR presents to the Board Fidelity's profitability for the fund. Fidelity calculates the profitability for each fund, as well as aggregate profitability for groups of Fidelity funds and all Fidelity funds, using a series of detailed revenue and cost allocation methodologies which originate with the audited books and records of Fidelity. The Audit Committee of the Board reviews any significant changes from the prior year's methodologies.
PricewaterhouseCoopers LLP (PwC), independent registered public accounting firm and auditor to Fidelity and certain Fidelity funds, has been engaged annually by the Board as part of the Board's assessment of Fidelity's profitability analysis. PwC's engagement includes the review and assessment of Fidelity's methodologies used in determining the revenues and expenses attributable to Fidelity's mutual fund business, and completion of agreed-upon procedures surrounding the mathematical accuracy of fund profitability and its conformity to allocation methodologies. After considering PwC's reports issued under the engagement and information provided by Fidelity, the Board believes that while other allocation methods may also be reasonable, Fidelity's profitability methodologies are reasonable in all material respects.
Annual Report
The Board has also reviewed Fidelity's non-fund businesses and fall-out benefits related to the mutual fund business as well as cases where Fidelity's affiliates may benefit from or be related to the fund's business.
The Board considered the costs of the services provided by and the profits realized by Fidelity in connection with the operation of the fund and were satisfied that the profitability was not excessive in the circumstances.
Economies of Scale. The Board considered whether there have been economies of scale in respect of the management of the Fidelity funds, whether the Fidelity funds (including the fund) have appropriately benefited from any such economies of scale, and whether there is potential for realization of any further economies of scale. The Board considered the extent to which the fund will benefit from economies of scale through increased services to the fund, through waivers or reimbursements, or through fee or expense reductions.
In February 2009, the Board and the board of other Fidelity funds created an ad hoc committee (the Economies of Scale Committee) to analyze whether FMR attains economies of scale in respect of the management and servicing of the Fidelity funds, whether the Fidelity funds have appropriately benefited from such economies of scale, and whether there is potential for realization of any further economies of scale.
The Board recognized that the fund's management contract incorporates a "group fee" structure, which provides for lower group fee rates as total fund assets under FMR's management increase, and for higher group fee rates as total fund assets under FMR's management decrease. FMR calculates the group fee rates based on a tiered asset "breakpoint" schedule that varies based on asset class. The Board considered that the group fee is designed to deliver the benefits of economies of scale to fund shareholders when total Fidelity fund assets increase, even if assets of any particular fund are unchanged or have declined, because some portion of Fidelity's costs are attributable to services provided to all Fidelity funds, and all funds benefit if those costs can be allocated among more assets. The Board concluded that, given the group fee structure, fund shareholders will benefit from lower management fees as assets under FMR's management increase at the fund complex level, regardless of whether Fidelity achieves any such economies of scale.
The Board concluded, considering the findings of the Economies of Scale Committee, that any potential economies of scale are being appropriately shared between fund shareholders and Fidelity.
Annual Report
Board Approval of Investment Advisory Contracts and
Management Fees - continued
Additional Information Requested by the Board. In order to develop fully the factual basis for consideration of the Fidelity funds' Advisory Contracts, the Board requested and received additional information on certain topics, including (i) fund performance trends, actions to be taken by FMR to improve certain funds' overall performance, and Fidelity's long-term strategies for certain funds; (ii) portfolio manager changes that have occurred during the past year and length of portfolio manager tenure for different categories of funds over time; (iii) Fidelity's compensation structure for portfolio managers, research analysts, and other key personnel, the rationale for the compensation structure, and how the compensation structure provides appropriate performance incentives; (iv) the amount of the investment that each portfolio manager has made in the Fidelity fund(s) that he or she manages; (v) management and other fees paid by FMR to affiliated sub-advisers on behalf of the Fidelity funds; (vi) Fidelity's fee structures and rationale for recommending different fees among different categories of funds; (vii) Fidelity's rationale for recommending which funds should have a performance adjustment component as part of their management fees; (viii) the rationale for any differences between fund fee structures and fee structures in place for other Fidelity clients; and (ix) explanations regarding the relative total expenses borne by certain funds and classes, total expense competitive trends, and actions that might be taken by FMR to reduce total expenses for certain funds and classes.
Based on its evaluation of all of the conclusions noted above, and after considering all factors it believed relevant, the Board ultimately concluded that the advisory fee structures are fair and reasonable, and that the fund's Advisory Contracts should be renewed.
Annual Report
Investment Adviser
Fidelity Management & Research Company
Boston, MA
Investment Sub-Advisers
FMR Co., Inc.
Fidelity Management & Research
(U.K.) Inc.
Fidelity Research & Analysis Company
FIL Investments (Japan) Limited
FIL Investment Advisors
FIL Investment Advisors
(U.K.) Limited
Fidelity Management & Research
(Hong Kong) Limited
Fidelity Management & Research
(Japan) Inc.
General Distributor
Fidelity Distributors Corporation
Boston, MA
Transfer and Service Agents
Fidelity Investments Institutional
Operations Company, Inc.
Boston, MA
Fidelity Service Company, Inc.
Boston, MA
Custodian
State Street Bank & Trust Company
Quincy, MA
AEME-UANN-1210
1.861988.102

(Fidelity Investment logo)(registered trademark)
Fidelity AdvisorSM
Emerging Europe,
Middle East, Africa (EMEA)
Fund - Institutional Class
Annual Report
October 31, 2010
Institutional Class is a
class of Fidelity® Emerging Europe, Middle East, Africa (EMEA) Fund
(2_fidelity_logos) (Registered_Trademark)
Contents
Chairman's Message | <Click Here> | The Chairman's message to shareholders. |
Performance | <Click Here> | How the fund has done over time. |
Management's Discussion of Fund Performance | <Click Here> | The Portfolio Manager's review of fund performance and strategy. |
Shareholder Expense Example | <Click Here> | An example of shareholder expenses. |
Investment Changes | <Click Here> | A summary of major shifts in the fund's investments over the past six months. |
Investments | <Click Here> | A complete list of the fund's investments with their market values. |
Financial Statements | <Click Here> | Statements of assets and liabilities, operations, and changes in net assets, as well as financial highlights. |
Notes | <Click Here> | Notes to the financial statements. |
Report of Independent Registered Public Accounting Firm | <Click Here> | |
Trustees and Officers | <Click Here> | |
Distributions | <Click Here> | |
Board Approval of Investment Advisory Contracts and Management Fees | <Click Here> | |
To view a fund's proxy voting guidelines and proxy voting record for the 12-month period ended June 30, visit http://www.fidelity.com/proxyvotingresults or visit the Securities and Exchange Commission's (SEC) web site at http://www.sec.gov. You may also call 1-877-208-0098 to request a free copy of the proxy voting guidelines.
Standard & Poor's, S&P and S&P 500 are registered service marks of The McGraw-Hill Companies, Inc. and have been licensed for use by Fidelity Distributors Corporation.
Other third party marks appearing herein are the property of their respective owners.
All other marks appearing herein are registered or unregistered trademarks or service marks of FMR LLC or an affiliated company.
Annual Report
This report and the financial statements contained herein are submitted for the general information of the shareholders of the fund. This report is not authorized for distribution to prospective investors in the fund unless preceded or accompanied by an effective prospectus.
A fund files its complete schedule of portfolio holdings with the SEC for the first and third quarters of each fiscal year on Form N-Q. Forms N-Q are available on the SEC's web site at http://www.sec.gov. A fund's Forms N-Q may be reviewed and copied at the SEC's Public Reference Room in Washington, DC. Information regarding the operation of the SEC's Public Reference Room may be obtained by calling 1-800-SEC-0330. For a complete list of a fund's portfolio holdings, view the most recent holdings listing, semiannual report, or annual report on Fidelity's web site at http://www.fidelity.com or http://advisor.fidelity.com, as applicable.
NOT FDIC INSURED • MAY LOSE VALUE • NO BANK GUARANTEE
Neither the fund nor Fidelity Distributors Corporation is a bank.
Annual Report
(photo_of_Edward_C_Johnson_3d)
Dear Shareholder:
Equities have staged a rally in the second half of 2010, shaking off concerns about the European debt crisis and the possibility of a double-dip recession in the U.S. Although the short-term surge pushed major equity indexes back into positive territory for the year, several questions remain about the longer-term outlook, including lackluster economic growth and persistently high unemployment. Financial markets are always unpredictable, of course, but there also are several time-tested investment principles that can help put the odds in your favor.
One of the basic tenets is to invest for the long term. Over time, riding out the markets' inevitable ups and downs has proven much more effective than selling into panic or chasing the hottest trend. Even missing only a few of the markets' best days can significantly diminish investor returns. Patience also affords the benefits of compounding - of earning interest on additional income or reinvested dividends and capital gains. There can be tax advantages and cost benefits to consider as well. While staying the course doesn't eliminate risk, it can considerably lessen the effect of short-term declines.
You can further manage your investing risk through diversification. And today, more than ever, geographic diversification should be taken into account. Studies indicate that asset allocation is the single most important determinant of a portfolio's long-term success. The right mix of stocks, bonds and cash - aligned to your particular risk tolerance and investment objective - is very important. Age-appropriate rebalancing is also an essential aspect of asset allocation. For younger investors, an emphasis on equities - which historically have been the best-performing asset class over time - is encouraged. As investors near their specific goal, such as retirement or sending a child to college, consideration may be given to replacing volatile assets (e.g. common stocks) with more-stable fixed investments (bonds or savings plans).
A third principle - investing regularly - can help lower the average cost of your purchases. Investing a certain amount of money each month or quarter helps ensure you won't pay for all your shares at market highs. This strategy - known as dollar cost averaging - also reduces "emotion" from investing, helping shareholders avoid selling weak performers just prior to an upswing, or chasing a hot performer just before a correction.
We invite you to contact us via the Internet, through our Investor Centers or by phone. It is our privilege to provide you the information you need to make the investments that are right for you.
Sincerely,
(The chairman's signature appears here.)
Edward C. Johnson 3d
Annual Report
Average annual total return reflects the change in the value of an investment, assuming reinvestment of the class' distributions from dividend income and capital gains (the profits earned upon the sale of securities that have grown in value, if any) and assuming a constant rate of performance each year. The $10,000 table and the fund's returns do not reflect the deduction of taxes that a shareholder would pay on fund distributions or the redemption of fund shares. During periods of reimbursement by Fidelity, a fund's total return will be greater than it would be had the reimbursement not occurred. How a fund did yesterday is no guarantee of how it will do tomorrow.
Average Annual Total Returns
Periods ended October 31, 2010 | | Past 1
year | Life of
fund A |
Institutional Class | | 24.95% | -3.44% |
A From May 8, 2008.
$10,000 Over Life of Fund
Let's say hypothetically that $10,000 was invested in Fidelity AdvisorSM Emerging Europe, Middle East, Africa (EMEA) Fund - Institutional Class on May 8, 2008, when the fund started. The chart shows how the value of your investment would have changed, and also shows how the MSCI® EM (Emerging Markets) Europe, Middle East and Africa Index performed over the same period.
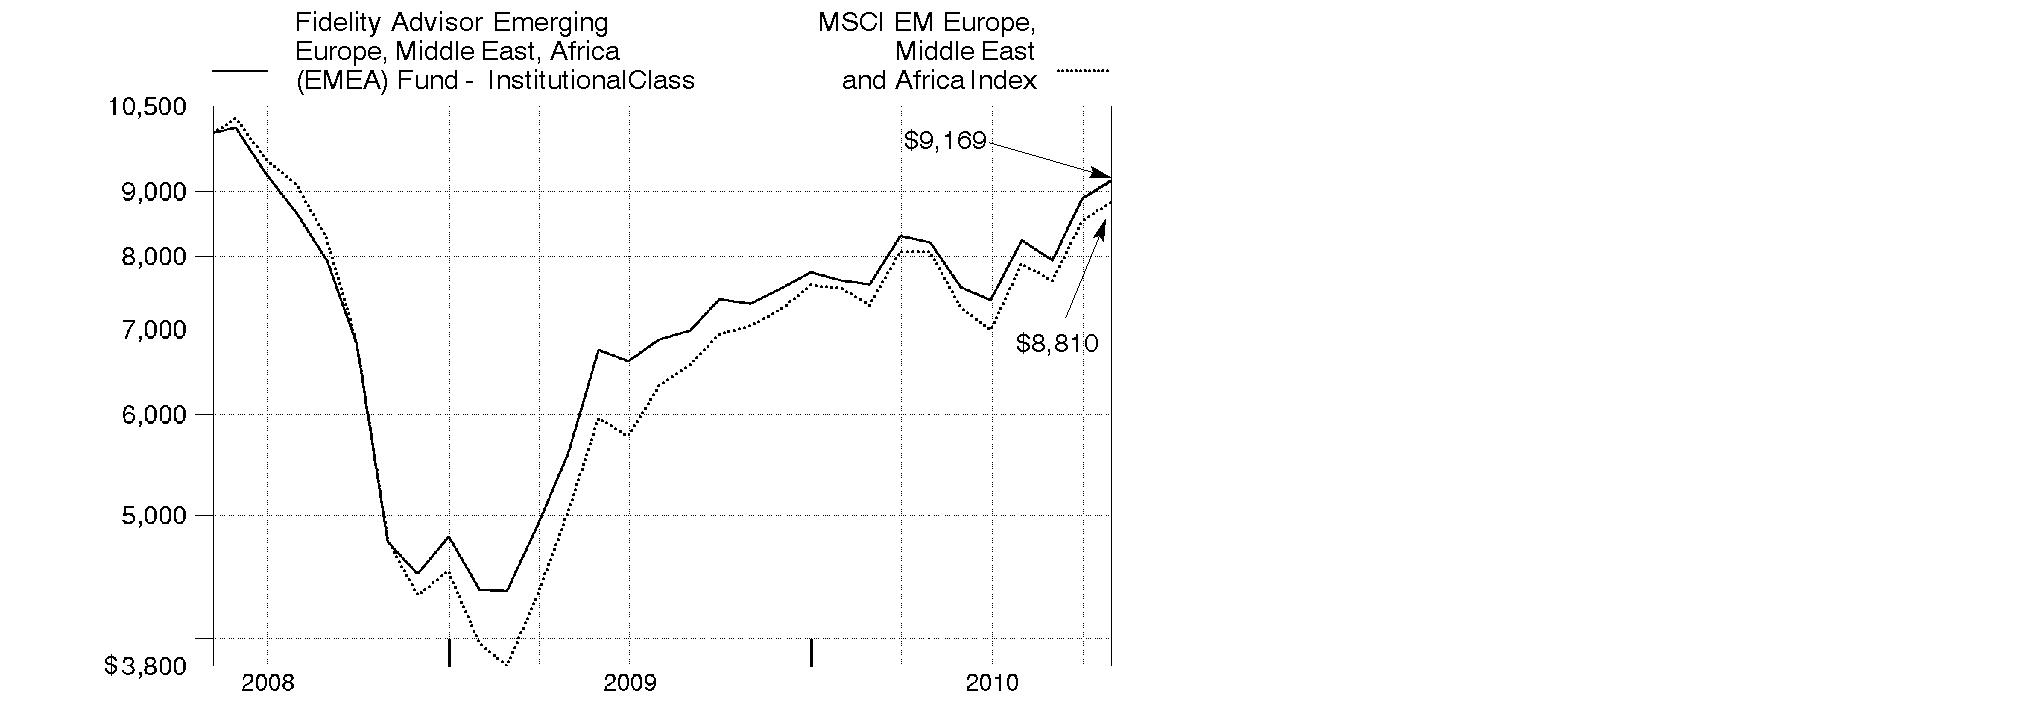
Annual Report
Market Recap: The return-to-risk theme was evident within emerging markets during the 12 months ending October 31, 2010. The combination of strong economic growth and superior fiscal conditions bolstered the performance of emerging-markets stocks, as they finished the period well ahead of most foreign developed-country stock indexes. Several smaller country constituents provided a big boost to the index, while most of its biggest components, though strong, still lagged. The falling value of the U.S. dollar relative to most emerging-markets currencies also provided a meaningful contribution. Rising commodity prices supported returns in commodity-producing regions, such as Latin America, which also benefited from the announced integration of the Chile, Colombia and Peru stock exchanges, scheduled for November. For the 12 months ending October 31, 2010, the MSCI® Emerging Markets Index climbed 23.89%. Among emerging-markets countries, major index components South Korea, Taiwan, Brazil and China gained roughly 25%, 21%, 15% and 9%, respectively. India, also a large constituent, solidly beat the index, returning about 35%. Other strong-performing countries included Thailand (62%), Turkey (55%), Indonesia (52%), Malaysia (36%), Mexico (34%) and South Africa (33%).
Comments from Adam Kutas, Portfolio Manager of Fidelity AdvisorSM Emerging Europe, Middle East, Africa (EMEA) Fund: For the year, the fund's Institutional Class shares returned 24.95%, versus the 25.07% return of the MSCI EM (Emerging Markets) Europe, Middle East and Africa Index. The fund's positioning in financials and materials detracted, as did a modest cash position within a strong market. Geographically, the fund lost ground due to unsuccessful stock selection in South Africa and by underweighting Turkey. Underweighting South African cable TV company Naspers and South African gold company AngloGold Ashanti hurt, along with untimely ownership of Harmony Gold Mining. Conversely, overweighting consumer staples and consumer discretionary helped, along with stock picks in telecommunication services. Favorable stock selection in Nigeria, Israel and Egypt boosted results. The fund's investments in Nigeria were out of index. South African retailers Clicks Group and Shoprite Holdings contributed, as did Russian gold and silver producer Polymetal.
Note to shareholders: The fund may invest up to 35% of its total assets in any industry that represents more than 20% of the emerging Europe, Middle East and Africa markets. As of October 31, 2010, the fund did not have more than 25% of its total assets invested in any one industry.
The views expressed above reflect those of the portfolio manager(s) only through the end of the period as stated on the cover of this report and do not necessarily represent the views of Fidelity or any other person in the Fidelity organization. Any such views are subject to change at any time based upon market or other conditions and Fidelity disclaims any responsibility to update such views. These views may not be relied on as investment advice and, because investment decisions for a Fidelity fund are based on numerous factors, may not be relied on as an indication of trading intent on behalf of any Fidelity fund.
Annual Report
Shareholder Expense Example
As a shareholder of the Fund, you incur two types of costs: (1) transaction costs, including sales charges (loads) on purchase payments or redemption proceeds, redemption fees, and (2) ongoing costs, including management fees, distribution and/or service (12b-1) fees and other Fund expenses. This Example is intended to help you understand your ongoing costs (in dollars) of investing in the Fund and to compare these costs with the ongoing costs of investing in other mutual funds.
The Example is based on an investment of $1,000 invested at the beginning of the period and held for the entire period (May 1, 2010 to October 31, 2010).
Actual Expenses
The first line of the accompanying table for each class of the Fund provides information about actual account values and actual expenses. You may use the information in this line, together with the amount you invested, to estimate the expenses that you paid over the period. Simply divide your account value by $1,000.00 (for example, an $8,600 account value divided by $1,000.00 = 8.6), then multiply the result by the number in the first line for a class of the Fund under the heading entitled "Expenses Paid During Period" to estimate the expenses you paid on your account during this period. A small balance maintenance fee of $12.00 that is charged once a year may apply for certain accounts with a value of less than $2,000. This fee is not included in the table below. If it was, the estimate of expenses you paid during the period would be higher, and your ending account value lower, by this amount. In addition, the Fund, as a shareholder in the underlying Fidelity Central Funds, will indirectly bear its pro-rata share of the fees and expenses incurred by the underlying Fidelity Central Funds. These fees and expenses are not included in the Fund's annualized expense ratio used to calculate the expense estimate in the table below.
Hypothetical Example for Comparison Purposes
The second line of the accompanying table for each class of the Fund provides information about hypothetical account values and hypothetical expenses based on a Class' actual expense ratio and an assumed rate of return of 5% per year before expenses, which is not the Class' actual return. The hypothetical account values and expenses may not be used to estimate the actual ending account balance or expenses you paid for the period. You may use this information to compare the ongoing costs of investing in the Fund and other funds. To do so, compare this 5% hypothetical example with the 5% hypothetical examples that appear in the shareholder reports of the other funds. A small balance maintenance fee of $12.00 that is charged once a year may apply for certain accounts with a value of less than $2,000. This fee is not included in the table below. If it was, the estimate of expenses you paid during the period would be higher, and your ending account value lower, by this amount. In addition, the Fund, as a shareholder in the underlying Fidelity Central Funds, will indirectly bear its pro-rata share of the fees and expenses incurred by the underlying Fidelity Central Funds. These fees and expenses are not included in the Fund's annualized expense ratio used to calculate the expense estimate in the table below.
Please note that the expenses shown in the table are meant to highlight your ongoing costs only and do not reflect any transaction costs. Therefore, the second line of the table is useful in comparing ongoing costs only, and will not help you determine the relative total costs of owning different funds. In addition, if these transactional costs were included, your costs would have been higher.
Annual Report
Shareholder Expense Example - continued
| Annualized
Expense Ratio | Beginning
Account Value
May 1, 2010 | Ending
Account Value
October 31, 2010 | Expenses Paid
During Period*
May 1, 2010 to
October 31, 2010 |
Class A | 1.50% ** | | | |
Actual | | $ 1,000.00 | $ 1,115.70 | $ 8.00 ** |
HypotheticalA | | $ 1,000.00 | $ 1,017.64 | $ 7.63 ** |
Class T | 1.75% ** | | | |
Actual | | $ 1,000.00 | $ 1,114.40 | $ 9.33 ** |
HypotheticalA | | $ 1,000.00 | $ 1,016.38 | $ 8.89 ** |
Class B | 2.25% ** | | | |
Actual | | $ 1,000.00 | $ 1,112.10 | $ 11.98 ** |
HypotheticalA | | $ 1,000.00 | $ 1,013.86 | $ 11.42 ** |
Class C | 2.25% ** | | | |
Actual | | $ 1,000.00 | $ 1,111.10 | $ 11.97 ** |
HypotheticalA | | $ 1,000.00 | $ 1,013.86 | $ 11.42 ** |
Emerging Europe, Middle East, Africa (EMEA) | 1.25% ** | | | |
Actual | | $ 1,000.00 | $ 1,116.60 | $ 6.67 ** |
HypotheticalA | | $ 1,000.00 | $ 1,018.90 | $ 6.36 ** |
Institutional Class | 1.25% ** | | | |
Actual | | $ 1,000.00 | $ 1,118.00 | $ 6.67 ** |
HypotheticalA | | $ 1,000.00 | $ 1,018.90 | $ 6.36 ** |
A 5% return per year before expenses
* Expenses are equal to each Class' annualized expense ratio, multiplied by the average account value over the period, multiplied by 184/365 (to reflect the one-half year period).
** If changes to voluntary expense limitations, effective January 1, 2011 had been in effect during the entire period, the annualized expense ratios and the expenses paid in the actual and hypothetical examples above would have been as follows:
| Annualized
Expense Ratio |
Expenses Paid
|
Class A | 1.62% | |
Actual | | $ 8.64 |
HypotheticalA | | $ 8.24 |
| Annualized
Expense Ratio |
Expenses Paid
|
Class T | 1.89% | |
Actual | | $ 10.07 |
HypotheticalA | | $ 9.60 |
Class B | 2.38% | |
Actual | | $ 12.67 |
HypotheticalA | | $ 12.08 |
Class C | 2.37% | |
Actual | | $ 12.61 |
HypotheticalA | | $ 12.03 |
Emerging Europe, Middle East, Africa (EMEA) | 1.36% | |
Actual | | $ 7.25 |
HypotheticalA | | $ 6.92 |
Institutional Class | 1.27% | |
Actual | | $ 6.78 |
HypotheticalA | | $ 6.46 |
A 5% return per year before expenses
Annual Report
Investment Changes (Unaudited)
Geographic Diversification (% of fund's net assets) |
As of October 31, 2010 |
| South Africa 44.7% | |
| Russia 28.1% | |
| Turkey 11.0% | |
| United States of America* 4.5% | |
| Poland 3.1% | |
| Qatar 1.1% | |
| Kenya 1.1% | |
| Morocco 1.0% | |
| Egypt 0.9% | |
| Other 4.5% | |

* Includes short-term investments and net other assets. |
As of April 30, 2010 |
| South Africa 37.2% | |
| Russia 31.6% | |
| Israel 14.4% | |
| Turkey 3.5% | |
| Nigeria 2.8% | |
| Poland 1.7% | |
| Qatar 1.1% | |
| Morocco 1.1% | |
| Kenya 1.1% | |
| Other* 5.5% | |

* Includes short-term investments and net other assets. |
Asset Allocation |
| % of fund's
net assets | % of fund's net assets
6 months ago |
Stocks | 95.1 | 98.9 |
Bonds | 0.4 | 0.5 |
Short-Term Investments and Net Other Assets | 4.5 | 0.6 |
Top Ten Stocks as of October 31, 2010 |
| % of fund's
net assets | % of fund's net assets
6 months ago |
OAO Gazprom (Russia, Oil, Gas & Consumable Fuels) | 6.5 | 7.3 |
Sberbank (Savings Bank of the Russian Federation) (Russia, Commercial Banks) | 4.8 | 3.7 |
MTN Group Ltd. (South Africa, Wireless Telecommunication Services) | 4.7 | 3.2 |
Lukoil Oil Co. sponsored ADR (United Kingdom) (Russia, Oil, Gas & Consumable Fuels) | 4.5 | 4.5 |
Standard Bank Group Ltd. (South Africa, Commercial Banks) | 4.1 | 4.1 |
Turkiye Garanti Bankasi AS (Turkey, Commercial Banks) | 3.4 | 1.8 |
FirstRand Ltd. (South Africa, Diversified Financial Services) | 3.2 | 2.7 |
Exxaro Resources Ltd. (South Africa, Metals & Mining) | 3.0 | 2.2 |
Shoprite Holdings Ltd. (South Africa, Food & Staples Retailing) | 2.8 | 2.7 |
Sasol Ltd. (South Africa, Oil, Gas & Consumable Fuels) | 2.8 | 2.8 |
| 39.8 | |
Market Sectors as of October 31, 2010 |
| % of fund's
net assets | % of fund's net assets
6 months ago |
Financials | 25.9 | 22.9 |
Energy | 20.2 | 19.1 |
Materials | 13.0 | 15.1 |
Telecommunication Services | 9.4 | 10.1 |
Consumer Discretionary | 9.2 | 6.4 |
Consumer Staples | 8.9 | 6.1 |
Industrials | 4.4 | 3.6 |
Health Care | 2.7 | 11.7 |
Utilities | 1.0 | 2.3 |
Information Technology | 0.4 | 1.6 |
Annual Report
Investments October 31, 2010
Showing Percentage of Net Assets
Common Stocks - 95.1% |
| Shares | | Value |
Australia - 0.3% |
Centamin Egypt Ltd.: | | | |
(Canada) (a) | 50,000 | | $ 141,190 |
(United Kingdom) (a) | 150,000 | | 415,758 |
TOTAL AUSTRALIA | | 556,948 |
Bailiwick of Jersey - 0.3% |
Randgold Resources Ltd. | 5,200 | | 487,311 |
Canada - 0.9% |
Bankers Petroleum Ltd. (a) | 107,000 | | 750,123 |
Equinox Minerals Ltd. (a) | 33,900 | | 184,142 |
TransGlobe Energy Corp. (a) | 50,900 | | 533,504 |
TOTAL CANADA | | 1,467,769 |
Egypt - 0.9% |
Arab Polvara Spinning & Weaving Co. (a) | 680,000 | | 481,614 |
Commercial International Bank Ltd. | 74,300 | | 559,687 |
Egyptian Co. for Mobile Services (MobiNil) | 14,932 | | 444,902 |
TOTAL EGYPT | | 1,486,203 |
Kenya - 1.1% |
British American Tobacco Kenya Ltd. | 179,800 | | 616,775 |
East African Breweries Ltd. | 266,969 | | 700,897 |
Safaricom Ltd. | 7,100,000 | | 426,440 |
TOTAL KENYA | | 1,744,112 |
Morocco - 1.0% |
Maroc Telecom | 90,100 | | 1,705,027 |
Nigeria - 0.8% |
Guaranty Trust Bank PLC GDR (Reg. S) | 54,913 | | 398,668 |
Nigerian Breweries PLC | 662,403 | | 334,188 |
United Bank for Africa PLC | 3,986,048 | | 237,894 |
Zenith Bank PLC | 4,472,241 | | 390,580 |
TOTAL NIGERIA | | 1,361,330 |
Poland - 3.1% |
Bank Polska Kasa Opieki SA | 39,900 | | 2,607,697 |
Eurocash SA | 157,300 | | 1,445,777 |
Powszechna Kasa Oszczednosci Bank SA | 69,900 | | 1,103,471 |
TOTAL POLAND | | 5,156,945 |
Qatar - 1.1% |
Qatar National Bank SAQ | 41,725 | | 1,887,444 |
Common Stocks - continued |
| Shares | | Value |
Russia - 28.1% |
Comstar United TeleSystems OJSC GDR (Reg. S) (a) | 396,557 | | $ 2,569,689 |
DIXY Group OJSC (a) | 62,300 | | 811,671 |
Interregional Distribution Grid Companies Holding JSC (a) | 2,893,400 | | 501,324 |
Lukoil Oil Co. sponsored ADR (United Kingdom) | 134,395 | | 7,499,241 |
Magnit OJSC | 14,200 | | 1,654,353 |
Mobile TeleSystems OJSC (a) | 123,100 | | 997,863 |
Mobile TeleSystems OJSC sponsored ADR | 15,000 | | 324,750 |
Novolipetsk Steel Ojsc | 36,600 | | 1,252,818 |
Novorossiysk Commercial Sea Port JSC | 2,781,700 | | 339,806 |
OAO Gazprom (a) | 1,963,700 | | 10,759,302 |
OAO NOVATEK (a) | 71,900 | | 578,470 |
OAO NOVATEK GDR | 40,200 | | 3,845,130 |
OJSC MMC Norilsk Nickel (a) | 7,200 | | 1,303,694 |
OJSC Oil Co. Rosneft (a) | 75,500 | | 528,303 |
OJSC Oil Company Rosneft GDR (Reg. S) | 294,200 | | 2,050,574 |
Polymetal JSC (a) | 20,500 | | 328,149 |
Protek (a) | 54,500 | | 98,936 |
RusHydro JSC (a) | 15,098,400 | | 776,043 |
Sberbank (Savings Bank of the Russian Federation) | 2,426,500 | | 7,974,184 |
Sistema JSFC sponsored GDR | 25,200 | | 650,160 |
Surgutneftegaz JSC sponsored ADR | 70,900 | | 694,820 |
TGK-1 OAO (a) | 562,635,400 | | 390,469 |
Uralkali JSC (a) | 100,000 | | 494,824 |
VTB Bank JSC unit | 47,100 | | 311,802 |
TOTAL RUSSIA | | 46,736,375 |
South Africa - 44.7% |
Africa Cellular Towers Ltd. (a) | 5,335,800 | | 190,427 |
African Rainbow Minerals Ltd. | 70,500 | | 1,798,567 |
AngloGold Ashanti Ltd. | 72,400 | | 3,395,565 |
Aspen Pharmacare Holdings Ltd. | 237,500 | | 3,170,035 |
Aveng Ltd. | 157,700 | | 990,543 |
Barloworld Ltd. | 44,200 | | 331,261 |
Bidvest Group Ltd. | 72,200 | | 1,540,153 |
Cashbuild Ltd. | 80,500 | | 1,085,967 |
Clicks Group Ltd. | 649,060 | | 4,234,380 |
DRDGOLD Ltd. | 458,514 | | 227,074 |
Exxaro Resources Ltd. | 262,400 | | 4,944,547 |
FirstRand Ltd. | 1,780,100 | | 5,237,345 |
Foschini Ltd. | 105,600 | | 1,281,814 |
Harmony Gold Mining Co. Ltd. | 345,900 | | 3,972,237 |
Illovo Sugar Ltd. | 245,703 | | 911,953 |
Common Stocks - continued |
| Shares | | Value |
South Africa - continued |
Impala Platinum Holdings Ltd. | 53,300 | | $ 1,506,542 |
JSE Ltd. | 35,000 | | 394,715 |
Lewis Group Ltd. | 61,500 | | 627,726 |
Mr Price Group Ltd. | 177,000 | | 1,608,528 |
MTN Group Ltd | 439,250 | | 7,900,800 |
Naspers Ltd. Class N | 58,600 | | 3,076,959 |
Northam Platinum Ltd. | 131,800 | | 911,587 |
Paracon Holdings Ltd. | 2,797,128 | | 682,806 |
Pioneer Foods Ltd. | 72,600 | | 507,937 |
Raubex Group Ltd. | 339,200 | | 1,209,587 |
RMB Holdings Ltd. | 194,100 | | 1,001,388 |
Sanlam Ltd. | 640,500 | | 2,401,058 |
Sasol Ltd. | 102,100 | | 4,597,767 |
Shoprite Holdings Ltd. | 332,100 | | 4,694,405 |
Spur Corp. Ltd. | 100,000 | | 199,856 |
Standard Bank Group Ltd. | 465,963 | | 6,871,325 |
Tiger Brands Ltd. | 38,700 | | 1,037,628 |
Woolworths Holdings Ltd. | 485,792 | | 1,903,625 |
TOTAL SOUTH AFRICA | | 74,446,107 |
Turkey - 11.0% |
Bim Birlesik Magazalar AS JSC | 43,000 | | 1,476,504 |
Boyner Buyuk Magazacilik AS (a) | 286,000 | | 665,997 |
Koc Holding AS | 540,000 | | 2,578,958 |
Sekerbank TAS | 375,000 | | 475,842 |
Trakya Cam Sanayii AS | 211,120 | | 447,469 |
Tupras-Turkiye Petrol Rafinerileri AS | 57,000 | | 1,530,015 |
Turk Telekomunikasyon AS | 132,000 | | 616,607 |
Turkiye Garanti Bankasi AS | 922,000 | | 5,656,836 |
Turkiye Halk Bankasi AS | 241,000 | | 2,436,380 |
Turkiye Is Bankasi AS Series C | 558,000 | | 2,509,308 |
TOTAL TURKEY | | 18,393,916 |
United Arab Emirates - 0.6% |
First Gulf Bank PJSC | 140,000 | | 630,837 |
National Bank of Abu Dhabi PJSC (a) | 100,000 | | 325,356 |
TOTAL UNITED ARAB EMIRATES | | 956,193 |
United Kingdom - 0.9% |
Aurelian Oil & Gas PLC (a) | 237,246 | | 231,863 |
Hikma Pharmaceuticals PLC | 95,992 | | 1,208,818 |
TOTAL UNITED KINGDOM | | 1,440,681 |
Common Stocks - continued |
| Shares | | Value |
Zambia - 0.3% |
Zambeef Products PLC (a) | 629,909 | | $ 501,486 |
TOTAL COMMON STOCKS (Cost $133,056,464) | 158,327,847 |
Government Obligations - 0.4% |
| Principal Amount | | |
Ghana - 0.4% |
Ghana Republic 14.99% 3/11/13
(Cost $672,328) | GHS | 950,000 | | 688,253 |
Money Market Funds - 6.7% |
| Shares | | |
Fidelity Cash Central Fund, 0.23% (b)
(Cost $11,176,764) | 11,176,764 | | 11,176,764 |
TOTAL INVESTMENT PORTFOLIO - 102.2% (Cost $144,905,556) | | 170,192,864 |
NET OTHER ASSETS (LIABILITIES) - (2.2)% | | (3,621,104) |
NET ASSETS - 100% | $ 166,571,760 |
Currency Abbreviations |
GHS | - | Ghana Cedi |
Legend |
(a) Non-income producing |
(b) Affiliated fund that is available only to investment companies and other accounts managed by Fidelity Investments. The rate quoted is the annualized seven-day yield of the fund at period end. A complete unaudited listing of the fund's holdings as of its most recent quarter end is available upon request. In addition, each Fidelity Central Fund's financial statements, which are not covered by the Fund's report of Independent Registered Public Accounting Firm, are available on the SEC's website or upon request. |
Affiliated Central Funds |
Information regarding fiscal year to date income earned by the Fund from investments in Fidelity Central Funds is as follows: |
Fund | Income earned |
Fidelity Cash Central Fund | $ 5,948 |
Other Information |
The following is a summary of the inputs used, as of October 31, 2010, involving the Fund's assets and liabilities carried at fair value. The inputs or methodology used for valuing securities may not be an indication of the risk associated with investing in those securities. For more information on valuation inputs, and their aggregation into the levels used in the table below, please refer to the Security Valuation section in the accompanying Notes to Financial Statements. |
Valuation Inputs at Reporting Date: |
Description | Total | Level 1 | Level 2 | Level 3 |
Investments in Securities: | | | | |
Equities: | | | | |
South Africa | $ 74,446,107 | $ 62,253,464 | $ 12,192,643 | $ - |
Russia | 46,736,375 | 46,736,375 | - | - |
Turkey | 18,393,916 | 18,393,916 | - | - |
Poland | 5,156,945 | 5,156,945 | - | - |
Qatar | 1,887,444 | 1,887,444 | - | - |
Kenya | 1,744,112 | 1,744,112 | - | - |
Morocco | 1,705,027 | 1,705,027 | - | - |
Egypt | 1,486,203 | 1,486,203 | - | - |
Canada | 1,467,769 | 1,467,769 | - | - |
Other | 5,303,949 | 4,816,638 | 487,311 | - |
Government Obligations | 688,253 | - | 688,253 | - |
Money Market Funds | 11,176,764 | 11,176,764 | - | - |
Total Investments in Securities: | $ 170,192,864 | $ 156,824,657 | $ 13,368,207 | $ - |
Income Tax Information |
At October 31, 2010, the Fund had a capital loss carryforward of approximately $13,853,821 of which $9,997,975, $579,836 and $3,276,010 will expire on October 31, 2016, 2017 and 2018, respectively. Capital loss carryforwards are only available to offset future capital gains of the Fund to the extent provided by regulations and may be limited. |
See accompanying notes which are an integral part of the financial statements.
Annual Report
Statement of Assets and Liabilities
| October 31, 2010 |
| | |
Assets | | |
Investment in securities, at value - See accompanying schedule: Unaffiliated issuers (cost $133,728,792) | $ 159,016,100 | |
Fidelity Central Funds (cost $11,176,764) | 11,176,764 | |
Total Investments (cost $144,905,556) | | $ 170,192,864 |
Cash | | 446,420 |
Foreign currency held at value (cost $43,853) | | 43,853 |
Receivable for investments sold | | 715,643 |
Receivable for fund shares sold | | 1,038,751 |
Dividends receivable | | 331,131 |
Interest receivable | | 12,515 |
Distributions receivable from Fidelity Central Funds | | 1,870 |
Receivable from investment adviser for expense reductions | | 8,629 |
Other receivables | | 29,697 |
Total assets | | 172,821,373 |
| | |
Liabilities | | |
Payable for investments purchased | $ 5,868,963 | |
Payable for fund shares redeemed | 141,498 | |
Accrued management fee | 106,100 | |
Distribution and service plan fees payable | 8,041 | |
Other affiliated payables | 39,543 | |
Other payables and accrued expenses | 85,468 | |
Total liabilities | | 6,249,613 |
| | |
Net Assets | | $ 166,571,760 |
Net Assets consist of: | | |
Paid in capital | | $ 155,164,861 |
Undistributed net investment income | | 1,374,218 |
Accumulated undistributed net realized gain (loss) on investments and foreign currency transactions | | (15,260,687) |
Net unrealized appreciation (depreciation) on investments and assets and liabilities in foreign currencies | | 25,293,368 |
Net Assets | | $ 166,571,760 |
See accompanying notes which are an integral part of the financial statements.
Annual Report
Financial Statements - continued
Statement of Assets and Liabilities - continued
| October 31, 2010 |
| | |
Calculation of Maximum Offering Price
Class A:
Net Asset Value and redemption price per share
($10,044,764 ÷ 1,119,448 shares) | | $ 8.97 |
| | |
Maximum offering price per share (100/94.25 of $8.97) | | $ 9.52 |
Class T:
Net Asset Value and redemption price per share ($3,114,301 ÷ 347,709 shares) | | $ 8.96 |
| | |
Maximum offering price per share (100/96.50 of $8.96) | | $ 9.28 |
Class B:
Net Asset Value and offering price per share ($821,549 ÷ 92,047 shares)A | | $ 8.93 |
| | |
Class C:
Net Asset Value and offering price per share ($5,150,926 ÷ 578,544 shares)A | | $ 8.90 |
| | |
Emerging Europe, Middle East, Africa (EMEA):
Net Asset Value, offering price and redemption price per share ($140,269,534 ÷ 15,584,892 shares) | | $ 9.00 |
| | |
Institutional Class:
Net Asset Value, offering price and redemption price per share ($7,170,686 ÷ 796,981 shares) | | $ 9.00 |
A Redemption price per share is equal to net asset value less any applicable contingent deferred sales charge.
See accompanying notes which are an integral part of the financial statements.
Annual Report
Statement of Operations
| Year ended October 31, 2010 |
| | |
Investment Income | | |
Dividends | | $ 3,210,853 |
Interest | | 62,448 |
Income from Fidelity Central Funds | | 5,948 |
Income before foreign taxes withheld | | 3,279,249 |
Less foreign taxes withheld | | (232,147) |
Total income | | 3,047,102 |
| | |
Expenses | | |
Management fee | $ 1,059,214 | |
Transfer agent fees | 390,768 | |
Distribution and service plan fees | 70,509 | |
Accounting fees and expenses | 67,808 | |
Custodian fees and expenses | 228,559 | |
Independent trustees' compensation | 723 | |
Registration fees | 84,861 | |
Audit | 61,037 | |
Legal | 579 | |
Miscellaneous | 1,497 | |
Total expenses before reductions | 1,965,555 | |
Expense reductions | (428,870) | 1,536,685 |
Net investment income (loss) | | 1,510,417 |
Realized and Unrealized Gain (Loss) Net realized gain (loss) on: | | |
Investment securities: | | |
Unaffiliated issuers | (2,970,479) | |
Foreign currency transactions | (243,247) | |
Total net realized gain (loss) | | (3,213,726) |
Change in net unrealized appreciation (depreciation) on: Investment securities | 29,132,713 | |
Assets and liabilities in foreign currencies | 3,280 | |
Total change in net unrealized appreciation (depreciation) | | 29,135,993 |
Net gain (loss) | | 25,922,267 |
Net increase (decrease) in net assets resulting from operations | | $ 27,432,684 |
See accompanying notes which are an integral part of the financial statements.
Annual Report
Financial Statements - continued
Statement of Changes in Net Assets
| Year ended
October 31,
2010 | Year ended
October 31,
2009 |
Increase (Decrease) in Net Assets | | |
Operations | | |
Net investment income (loss) | $ 1,510,417 | $ 737,293 |
Net realized gain (loss) | (3,213,726) | (1,386,047) |
Change in net unrealized appreciation (depreciation) | 29,135,993 | 27,532,507 |
Net increase (decrease) in net assets resulting
from operations | 27,432,684 | 26,883,753 |
Distributions to shareholders from net investment income | (816,015) | (273,102) |
Distributions to shareholders from net realized gain | (391,419) | - |
Total distributions | (1,207,434) | (273,102) |
Share transactions - net increase (decrease) | 22,045,599 | 53,100,517 |
Redemption fees | 89,745 | 105,938 |
Total increase (decrease) in net assets | 48,360,594 | 79,817,106 |
| | |
Net Assets | | |
Beginning of period | 118,211,166 | 38,394,060 |
End of period (including undistributed net investment income of $1,374,218 and undistributed net investment income of $679,815, respectively) | $ 166,571,760 | $ 118,211,166 |
See accompanying notes which are an integral part of the financial statements.
Annual Report
Financial Highlights - Class A
Years ended October 31, | 2010 | 2009 | 2008 H |
Selected Per-Share Data | | | |
Net asset value, beginning of period | $ 7.26 | $ 4.75 | $ 10.00 |
Income from Investment Operations | | | |
Net investment income (loss) E | .07 | .05 | .04 |
Net realized and unrealized gain (loss) | 1.70 | 2.48 | (5.31) |
Total from investment operations | 1.77 | 2.53 | (5.27) |
Distributions from net investment income | (.04) | (.03) | - |
Distributions from net realized gain | (.02) | - | - |
Total distributions | (.07) J | (.03) | - |
Redemption fees added to paid in capital E | .01 | .01 | .02 |
Net asset value, end of period | $ 8.97 | $ 7.26 | $ 4.75 |
Total Return B,C,D | 24.66% | 53.78% | (52.50)% |
Ratios to Average Net Assets F,I | | | |
Expenses before reductions | 1.69% | 1.87% | 2.50% A |
Expenses net of fee waivers, if any | 1.50% | 1.50% | 1.50% A |
Expenses net of all reductions | 1.38% | 1.39% | 1.23% A |
Net investment income (loss) | .95% | .84% | 1.20% A |
Supplemental Data | | | |
Net assets, end of period (000 omitted) | $ 10,045 | $ 4,817 | $ 1,368 |
Portfolio turnover rate G | 96% | 58% | 68% |
A Annualized
B Total returns for periods of less than one year are not annualized.
C Total returns would have been lower had certain expenses not been reduced during the periods shown.
D Total returns do not include the effect of the sales charges.
E Calculated based on average shares outstanding during the period.
F Fees and expenses of the underlying Fidelity Central Funds are not included in the Fund's expense ratio. The Fund indirectly bears its proportionate share of the expenses of any underlying Fidelity Central Funds.
G Amount does not include the portfolio activity of any underlying Fidelity Central Funds.
H For the period May 8, 2008 (commencement of operations) to October 31, 2008.
I Expense ratios reflect operating expenses of the class. Expenses before reductions do not reflect amounts reimbursed by the investment adviser or reductions from brokerage service arrangements or reductions from other expense offset arrangements and do not represent the amount paid by the class during periods when reimbursements or reductions occur. Expense ratios before reductions for start-up periods may not be representative of longer-term operating periods. Expenses net of fee waivers reflect expenses after reimbursement by the investment adviser but prior to reductions from brokerage service arrangements or other expense offset arrangements. Expenses net of all reductions represent the net expenses paid by the class.
J Total distributions of $.07 per share is comprised of distributions from net investment income of $.041 and distributions from net realized gain of $.024 per share.
See accompanying notes which are an integral part of the financial statements.
Annual Report
Financial Highlights - Class T
Years ended October 31, | 2010 | 2009 | 2008 H |
Selected Per-Share Data | | | |
Net asset value, beginning of period | $ 7.25 | $ 4.75 | $ 10.00 |
Income from Investment Operations | | | |
Net investment income (loss) E | .06 | .04 | .04 |
Net realized and unrealized gain (loss) | 1.69 | 2.47 | (5.31) |
Total from investment operations | 1.75 | 2.51 | (5.27) |
Distributions from net investment income | (.03) | (.02) | - |
Distributions from net realized gain | (.02) | - | - |
Total distributions | (.05) | (.02) | - |
Redemption fees added to paid in capital E | .01 | .01 | .02 |
Net asset value, end of period | $ 8.96 | $ 7.25 | $ 4.75 |
Total Return B,C,D | 24.44% | 53.20% | (52.50)% |
Ratios to Average Net Assets F,I | | | |
Expenses before reductions | 1.95% | 2.15% | 2.78% A |
Expenses net of fee waivers, if any | 1.75% | 1.75% | 1.75% A |
Expenses net of all reductions | 1.62% | 1.64% | 1.49% A |
Net investment income (loss) | .70% | .59% | .95% A |
Supplemental Data | | | |
Net assets, end of period (000 omitted) | $ 3,114 | $ 1,560 | $ 568 |
Portfolio turnover rate G | 96% | 58% | 68% |
A Annualized
B Total returns for periods of less than one year are not annualized.
C Total returns would have been lower had certain expenses not been reduced during the periods shown.
D Total returns do not include the effect of the sales charges.
E Calculated based on average shares outstanding during the period.
F Fees and expenses of the underlying Fidelity Central Funds are not included in the Fund's expense ratio. The Fund indirectly bears its proportionate share of the expenses of any underlying Fidelity Central Funds.
G Amount does not include the portfolio activity of any underlying Fidelity Central Funds.
H For the period May 8, 2008 (commencement of operations) to October 31, 2008.
I Expense ratios reflect operating expenses of the class. Expenses before reductions do not reflect amounts reimbursed by the investment adviser or reductions from brokerage service arrangements or reductions from other expense offset arrangements and do not represent the amount paid by the class during periods when reimbursements or reductions occur. Expense ratios before reductions for start-up periods may not be representative of longer-term operating periods. Expenses net of fee waivers reflect expenses after reimbursement by the investment adviser but prior to reductions from brokerage service arrangements or other expense offset arrangements. Expenses net of all reductions represent the net expenses paid by the class.
See accompanying notes which are an integral part of the financial statements.
Annual Report
Financial Highlights - Class B
Years ended October 31, | 2010 | 2009 | 2008 H |
Selected Per-Share Data | | | |
Net asset value, beginning of period | $ 7.23 | $ 4.73 | $ 10.00 |
Income from Investment Operations | | | |
Net investment income (loss) E | .02 | .01 | .02 |
Net realized and unrealized gain (loss) | 1.68 | 2.48 | (5.31) |
Total from investment operations | 1.70 | 2.49 | (5.29) |
Distributions from net realized gain | (.01) | - | - |
Redemption fees added to paid in capital E | .01 | .01 | .02 |
Net asset value, end of period | $ 8.93 | $ 7.23 | $ 4.73 |
Total Return B,C,D | 23.72% | 52.85% | (52.70)% |
Ratios to Average Net Assets F,I | | | |
Expenses before reductions | 2.47% | 2.68% | 3.32% A |
Expenses net of fee waivers, if any | 2.25% | 2.25% | 2.25% A |
Expenses net of all reductions | 2.12% | 2.14% | 1.99% A |
Net investment income (loss) | .20% | .09% | .45% A |
Supplemental Data | | | |
Net assets, end of period (000 omitted) | $ 822 | $ 782 | $ 487 |
Portfolio turnover rate G | 96% | 58% | 68% |
A Annualized
B Total returns for periods of less than one year are not annualized.
C Total returns would have been lower had certain expenses not been reduced during the periods shown.
D Total returns do not include the effect of the contingent deferred sales charge.
E Calculated based on average shares outstanding during the period.
F Fees and expenses of the underlying Fidelity Central Funds are not included in the Fund's expense ratio. The Fund indirectly bears its proportionate share of the expenses of any underlying Fidelity Central Funds.
G Amount does not include the portfolio activity of any underlying Fidelity Central Funds.
H For the period May 8, 2008 (commencement of operations) to October 31, 2008.
I Expense ratios reflect operating expenses of the class. Expenses before reductions do not reflect amounts reimbursed by the investment adviser or reductions from brokerage service arrangements or reductions from other expense offset arrangements and do not represent the amount paid by the class during periods when reimbursements or reductions occur. Expense ratios before reductions for start-up periods may not be representative of longer-term operating periods. Expenses net of fee waivers reflect expenses after reimbursement by the investment adviser but prior to reductions from brokerage service arrangements or other expense offset arrangements. Expenses net of all reductions represent the net expenses paid by the class.
See accompanying notes which are an integral part of the financial statements.
Annual Report
Financial Highlights - Class C
Years ended October 31, | 2010 | 2009 | 2008 H |
Selected Per-Share Data | | | |
Net asset value, beginning of period | $ 7.23 | $ 4.73 | $ 10.00 |
Income from Investment Operations | | | |
Net investment income (loss) E | .02 | .01 | .02 |
Net realized and unrealized gain (loss) | 1.67 | 2.48 | (5.31) |
Total from investment operations | 1.69 | 2.49 | (5.29) |
Distributions from net investment income | (.01) | - | - |
Distributions from net realized gain | (.02) | - | - |
Total distributions | (.03) | - | - |
Redemption fees added to paid in capital E | .01 | .01 | .02 |
Net asset value, end of period | $ 8.90 | $ 7.23 | $ 4.73 |
Total Return B,C,D | 23.61% | 52.85% | (52.70)% |
Ratios to Average Net Assets F,I | | | |
Expenses before reductions | 2.45% | 2.61% | 3.28% A |
Expenses net of fee waivers, if any | 2.25% | 2.25% | 2.25% A |
Expenses net of all reductions | 2.13% | 2.14% | 1.99% A |
Net investment income (loss) | .20% | .09% | .45% A |
Supplemental Data | | | |
Net assets, end of period (000 omitted) | $ 5,151 | $ 2,677 | $ 741 |
Portfolio turnover rate G | 96% | 58% | 68% |
A Annualized
B Total returns for periods of less than one year are not annualized.
C Total returns would have been lower had certain expenses not been reduced during the periods shown.
D Total returns do not include the effect of the contingent deferred sales charge.
E Calculated based on average shares outstanding during the period.
F Fees and expenses of the underlying Fidelity Central Funds are not included in the Fund's expense ratio. The Fund indirectly bears its proportionate share of the expenses of any underlying Fidelity Central Funds.
G Amount does not include the portfolio activity of any underlying Fidelity Central Funds.
H For the period May 8, 2008 (commencement of operations) to October 31, 2008.
I Expense ratios reflect operating expenses of the class. Expenses before reductions do not reflect amounts reimbursed by the investment adviser or reductions from brokerage service arrangements or reductions from other expense offset arrangements and do not represent the amount paid by the class during periods when reimbursements or reductions occur. Expense ratios before reductions for start-up periods may not be representative of longer-term operating periods. Expenses net of fee waivers reflect expenses after reimbursement by the investment adviser but prior to reductions from brokerage service arrangements or other expense offset arrangements. Expenses net of all reductions represent the net expenses paid by the class.
See accompanying notes which are an integral part of the financial statements.
Annual Report
Financial Highlights - Emerging Europe, Middle East, Africa (EMEA)
Years ended October 31, | 2010 | 2009 | 2008 G |
Selected Per-Share Data | | | |
Net asset value, beginning of period | $ 7.28 | $ 4.76 | $ 10.00 |
Income from Investment Operations | | | |
Net investment income (loss) D | .09 | .07 | .05 |
Net realized and unrealized gain (loss) | 1.70 | 2.48 | (5.31) |
Total from investment operations | 1.79 | 2.55 | (5.26) |
Distributions from net investment income | (.05) | (.04) | - |
Distributions from net realized gain | (.02) | - | - |
Total distributions | (.08) I | (.04) | - |
Redemption fees added to paid in capital D | .01 | .01 | .02 |
Net asset value, end of period | $ 9.00 | $ 7.28 | $ 4.76 |
Total Return B,C | 24.92% | 54.15% | (52.40)% |
Ratios to Average Net Assets E,H | | | |
Expenses before reductions | 1.45% | 1.61% | 2.19% A |
Expenses net of fee waivers, if any | 1.25% | 1.25% | 1.25% A |
Expenses net of all reductions | 1.12% | 1.14% | .98% A |
Net investment income (loss) | 1.21% | 1.09% | 1.45% A |
Supplemental Data | | | |
Net assets, end of period (000 omitted) | $ 140,270 | $ 104,141 | $ 32,535 |
Portfolio turnover rate F | 96% | 58% | 68% |
A Annualized
B Total returns for periods of less than one year are not annualized.
C Total returns would have been lower had certain expenses not been reduced during the periods shown.
D Calculated based on average shares outstanding during the period.
E Fees and expenses of the underlying Fidelity Central Funds are not included in the Fund's expense ratio. The Fund indirectly bears its proportionate share of the expenses of any underlying Fidelity Central Funds.
F Amount does not include the portfolio activity of any underlying Fidelity Central Funds.
G For the period May 8, 2008 (commencement of operations) to October 31, 2008.
H Expense ratios reflect operating expenses of the class. Expenses before reductions do not reflect amounts reimbursed by the investment adviser or reductions from brokerage service arrangements or reductions from other expense offset arrangements and do not represent the amount paid by the class during periods when reimbursements or reductions occur. Expense ratios before reductions for start-up periods may not be representative of longer-term operating periods. Expenses net of fee waivers reflect expenses after reimbursement by the investment adviser but prior to reductions from brokerage service arrangements or other expense offset arrangements. Expenses net of all reductions represent the net expenses paid by the class.
I Total distributions of $.08 per share is comprised of distributions from net investment income of $.052 and distributions from net realized gain of $.024 per share.
See accompanying notes which are an integral part of the financial statements.
Annual Report
Financial Highlights - Institutional Class
Years ended October 31, | 2010 | 2009 | 2008 G |
Selected Per-Share Data | | | |
Net asset value, beginning of period | $ 7.28 | $ 4.76 | $ 10.00 |
Income from Investment Operations | | | |
Net investment income (loss) D | .09 | .06 | .05 |
Net realized and unrealized gain (loss) | 1.70 | 2.49 | (5.31) |
Total from investment operations | 1.79 | 2.55 | (5.26) |
Distributions from net investment income | (.05) | (.04) | - |
Distributions from net realized gain | (.02) | - | - |
Total distributions | (.08) I | (.04) | - |
Redemption fees added to paid in capital D | .01 | .01 | .02 |
Net asset value, end of period | $ 9.00 | $ 7.28 | $ 4.76 |
Total Return B,C | 24.95% | 54.15% | (52.40)% |
Ratios to Average Net Assets E,H | | | |
Expenses before reductions | 1.34% | 1.60% | 2.12% A |
Expenses net of fee waivers, if any | 1.25% | 1.25% | 1.25% A |
Expenses net of all reductions | 1.13% | 1.14% | .98% A |
Net investment income (loss) | 1.20% | 1.09% | 1.46% A |
Supplemental Data | | | |
Net assets, end of period (000 omitted) | $ 7,171 | $ 4,235 | $ 2,695 |
Portfolio turnover rate F | 96% | 58% | 68% |
A Annualized
B Total returns for periods of less than one year are not annualized.
C Total returns would have been lower had certain expenses not been reduced during the periods shown.
D Calculated based on average shares outstanding during the period.
E Fees and expenses of the underlying Fidelity Central Funds are not included in the Fund's expense ratio. The Fund indirectly bears its proportionate share of the expenses of any underlying Fidelity Central Funds.
F Amount does not include the portfolio activity of any underlying Fidelity Central Funds.
G For the period May 8, 2008 (commencement of operations) to October 31, 2008.
H Expense ratios reflect operating expenses of the class. Expenses before reductions do not reflect amounts reimbursed by the investment adviser or reductions from brokerage service arrangements or reductions from other expense offset arrangements and do not represent the amount paid by the class during periods when reimbursements or reductions occur. Expense ratios before reductions for start-up periods may not be representative of longer-term operating periods. Expenses net of fee waivers reflect expenses after reimbursement by the investment adviser but prior to reductions from brokerage service arrangements or other expense offset arrangements. Expenses net of all reductions represent the net expenses paid by the class.
I Total distributions of $.08 per share is comprised of distributions from net investment income of $.054 and distributions from net realized gain of $.024 per share.
See accompanying notes which are an integral part of the financial statements.
Annual Report
Notes to Financial Statements
For the period ended October 31, 2010
1. Organization.
Fidelity Emerging Europe, Middle East, Africa (EMEA) Fund (the Fund) is a fund of Fidelity Investment Trust (the Trust) and is authorized to issue an unlimited number of shares. The Trust is registered under the Investment Company Act of 1940, as amended (the 1940 Act), as an open-end management investment company organized as a Massachusetts business trust. The Fund offers Class A, Class T, Class C, Emerging Europe, Middle East, Africa (EMEA) and Institutional Class shares, each of which has equal rights as to assets and voting privileges. Effective after the close of business on September 1, 2010, Class B shares were closed to new accounts and additional purchases by existing shareholders. Each class has exclusive voting rights with respect to matters that affect that class. Class B shares will automatically convert to Class A shares after a holding period of seven years from the initial date of purchase. Investment income, realized and unrealized capital gains and losses, the common expenses of the Fund, and certain fund-level expense reductions, if any, are allocated on a pro-rata basis to each class based on the relative net assets of each class to the total net assets of the Fund. Each class differs with respect to transfer agent and distribution and service plan fees incurred. Certain expense reductions also differ by class. The Fund's investments in emerging markets can be subject to social, economic, regulatory, and political uncertainties and can be extremely volatile.
2. Investments in Fidelity Central Funds.
The Fund may invest in Fidelity Central Funds, which are open-end investment companies available only to other investment companies and accounts managed by Fidelity Management & Research Company (FMR) and its affiliates. The Fund's Schedule of Investments lists each of the Fidelity Central Funds held as of period end, if any, as an investment of the Fund, but does not include the underlying holdings of each Fidelity Central Fund. As an Investing Fund, the Fund indirectly bears its proportionate share of the expenses of the underlying Fidelity Central Funds.
The Money Market Central Funds seek preservation of capital and current income and are managed by Fidelity Investments Money Management, Inc. (FIMM), an affiliate of FMR.
A complete unaudited list of holdings for each Fidelity Central Fund is available upon request or at the Securities and Exchange Commission (the SEC) web site at www.sec.gov. In addition, the financial statements of the Fidelity Central Funds, which are not covered by the Fund's Report of Independent Registered Public Accounting Firm, are available on the SEC web site or upon request.
Annual Report
3. Significant Accounting Policies.
The financial statements have been prepared in conformity with accounting principles generally accepted in the United States of America (GAAP), which require management to make certain estimates and assumptions at the date of the financial statements. Actual results could differ from those estimates. The following summarizes the significant accounting policies of the Fund:
Security Valuation. Investments are valued as of 4:00 p.m. Eastern time on the last calendar day of the period. The Fund uses independent pricing services approved by the Board of Trustees to value its investments. When current market prices or quotations are not readily available or reliable, valuations may be determined in good faith in accordance with procedures adopted by the Board of Trustees. Factors used in determining value may include market or security specific events, changes in interest rates and credit quality. The frequency with which these procedures are used cannot be predicted and they may be utilized to a significant extent. The value used for net asset value (NAV) calculation under these procedures may differ from published prices for the same securities.
The Fund categorizes the inputs to valuation techniques used to value its investments into a disclosure hierarchy consisting of three levels as shown below.
Level 1 - quoted prices in active markets for identical investments
Level 2 - other significant observable inputs (including quoted prices for similar investments, interest rates, prepayment speeds, etc.)
Level 3 - unobservable inputs (including the fund's own assumptions based on the best information available)
Changes in valuation techniques may result in transfers in or out of an assigned level within the disclosure hierarchy. The aggregate value of investments by input level, as of October 31, 2010 is included at the end of the Fund's Schedule of Investments. Valuation techniques used to value the Fund's investments by major category are as follows.
Equity securities, including restricted securities, for which market quotations are readily available, are valued at the last reported sale price or official closing price as reported by an independent pricing service on the primary market or exchange on which they are traded and are categorized as Level 1 in the hierarchy. In the event there were no sales during the day or closing prices are not available, securities are valued at the last quoted bid price or may be valued using the last available price and are generally categorized as Level 2 in the hierarchy. For foreign equity securities, when significant market or security specific events arise, comparisons to the valuation of American Depositary Receipts
Annual Report
Notes to Financial Statements - continued
3. Significant Accounting Policies - continued
Security Valuation - continued
(ADRs), futures contracts, Exchange-traded funds (ETFs) and certain indexes as well as quoted prices for similar securities are used and are categorized as Level 2 in the hierarchy in these circumstances. Utilizing these techniques may result in significant transfers between Level 1 and Level 2. For restricted equity securities and private placements where observable inputs are limited, assumptions about market activity and risk are used and are categorized as Level 3 in the hierarchy.
Debt securities, including restricted securities, are valued based on evaluated prices received from independent pricing services or from dealers who make markets in such securities. For foreign government and government agency obligations, pricing services utilize matrix pricing which considers yield or price of bonds of comparable quality, coupon, maturity and type as well as dealer supplied prices and are generally categorized as Level 2 in the hierarchy.
Investments in open-end mutual funds, including the Fidelity Central Funds, are valued at their closing net asset value each business day and are categorized as Level 1 in the hierarchy. Short-term securities with remaining maturities of sixty days or less for which quotations are not readily available are valued at amortized cost, which approximates fair value and are categorized as Level 2 in the hierarchy.
When independent prices are unavailable or unreliable, debt securities may be valued utilizing pricing matrices which consider similar factors that would be used by independent pricing services. These are generally categorized as Level 2 in the hierarchy but may be Level 3 depending on the circumstances.
Foreign Currency. The Fund uses foreign currency contracts to facilitate transactions in foreign-denominated securities. Gains and losses from these transactions may arise from changes in the value of the foreign currency or if the counterparties do not perform under the contracts' terms.
Foreign-denominated assets, including investment securities, and liabilities are translated into U.S. dollars at the exchange rate at period end. Purchases and sales of investment securities, income and dividends received and expenses denominated in foreign currencies are translated into U.S. dollars at the exchange rate in effect on the transaction date.
The effects of exchange rate fluctuations on investments are included with the net realized and unrealized gain (loss) on investment securities. Other foreign currency transactions resulting in realized and unrealized gain (loss) are disclosed separately.
Annual Report
3. Significant Accounting Policies - continued
Investment Transactions and Income. For financial reporting purposes, the Fund's investment holdings and NAV include trades executed through the end of the last business day of the period. The NAV per share for processing shareholder transactions is calculated as of the close of business of the New York Stock Exchange (NYSE), normally 4:00 p.m. Eastern time and includes trades executed through the end of the prior business day. Gains and losses on securities sold are determined on the basis of identified cost. Dividend income is recorded on the ex-dividend date, except for certain dividends from foreign securities where the ex-dividend date may have passed, which are recorded as soon as the Fund is informed of the ex-dividend date. Non-cash dividends included in dividend income, if any, are recorded at the fair market value of the securities received. Distributions received on securities that represent a return of capital or capital gain are recorded as a reduction of cost of investments and/or as a realized gain. The Fund estimates the components of distributions received that may be considered return of capital distributions or capital gain distributions. Interest income and distributions from the Fidelity Central Funds are accrued as earned. Interest income includes coupon interest and amortization of premium and accretion of discount on debt securities. Investment income is recorded net of foreign taxes withheld where recovery of such taxes is uncertain.
Expenses. Most expenses of the Trust can be directly attributed to a fund. Expenses which cannot be directly attributed are apportioned amongst each fund in the Trust. Expense estimates are accrued in the period to which they relate and adjustments are made when actual amounts are known.
Income Tax Information and Distributions to Shareholders. Each year the Fund intends to qualify as a regulated investment company, including distributing substantially all of its taxable income and realized gains under Subchapter M of the Internal Revenue Code and filing its U.S. federal tax return. As a result, no provision for income taxes is required. As of October 31, 2010, the Fund did not have any unrecognized tax benefits in the accompanying financial statements. A fund's federal tax return is subject to examination by the Internal Revenue Service (IRS) for a period of three years. Foreign taxes are provided for based on the Fund's understanding of the tax rules and rates that exist in the foreign markets in which it invests.
Distributions are declared and recorded on the ex-dividend date. Income dividends and capital gain distributions are declared separately for each class. Income and capital gain distributions are determined in accordance with income tax regulations, which may differ from GAAP.
Capital accounts within the financial statements are adjusted for permanent book-tax differences. These adjustments have no impact on net assets or the results of operations. Temporary book-tax differences will reverse in a subsequent period.
Annual Report
Notes to Financial Statements - continued
3. Significant Accounting Policies - continued
Book-tax differences are primarily due to foreign currency transactions, passive foreign investment companies (PFIC), capital loss carryforwards and losses deferred due to wash sales.
The federal tax cost of investment securities and unrealized appreciation (depreciation) as of period end were as follows:
Gross unrealized appreciation | $ 31,285,561 |
Gross unrealized depreciation | (7,672,375) |
Net unrealized appreciation (depreciation) | $ 23,613,186 |
| |
Tax Cost | $ 146,579,678 |
The tax-based components of distributable earnings as of period end were as follows:
Undistributed ordinary income | $ 1,641,475 |
Capital loss carryforward | $ (13,853,821) |
Net unrealized appreciation (depreciation) | $ 23,619,246 |
The tax character of distributions paid was as follows:
| October 31,
2010 | October 31,
2009 |
Ordinary Income | $ 1,207,434 | $ 273,102 |
Short-Term Trading (Redemption) Fees. Shares held by investors in the Fund less than 90 days are subject to a redemption fee equal to 1.50% of the net asset value of shares redeemed. All redemption fees, which reduce the proceeds of the shareholder redemption, are retained by the Fund and accounted for as an addition to paid in capital.
4. Purchases and Sales of Investments.
Purchases and sales of securities, other than short-term securities, aggregated $142,395,176 and $123,992,844, respectively.
5. Fees and Other Transactions with Affiliates.
Management Fee. FMR and its affiliates provide the Fund with investment management related services for which the Fund pays a monthly management fee. The management fee is the sum of an individual fund fee rate that is based on an annual rate of .55% of the Fund's average net assets and a group fee rate that averaged .26% during the
Annual Report
5. Fees and Other Transactions with Affiliates - continued
Management Fee - continued
period. The group fee rate is based upon the average net assets of all the mutual funds advised by FMR. The group fee rate decreases as assets under management increase and increases as assets under management decrease. For the period, the total annual management fee rate was .81% of the Fund's average net assets.
Distribution and Service Plan Fees. In accordance with Rule 12b-1 of the 1940 Act, the Fund has adopted separate Distribution and Service Plans for each class of shares. Certain classes pay Fidelity Distributors Corporation (FDC), an affiliate of FMR, separate Distribution and Service Fees, each of which is based on an annual percentage of each class' average net assets. In addition, FDC may pay financial intermediaries for selling shares of the Fund and providing shareholder support services. For the period, the Distribution and Service Fee rates, total fees and amounts retained by FDC were as follows:
| Distribution
Fee | Service
Fee | Total Fees | Retained
by FDC |
Class A | 0% | .25% | $ 16,288 | $ 304 |
Class T | .25% | .25% | 10,772 | - |
Class B | .75% | .25% | 8,030 | 6,508 |
Class C | .75% | .25% | 35,419 | 16,934 |
| | | $ 70,509 | $ 23,746 |
Sales Load. FDC receives a front-end sales charge of up to 5.75% for selling Class A shares, and 3.50% for selling Class T shares, some of which is paid to financial intermediaries for selling shares of the Fund. FDC receives the proceeds of contingent deferred sales charges levied on Class A, Class T, Class B, and Class C redemptions. These charges depend on the holding period. The deferred sales charges range from 5% to 1% for Class B, 1% for Class C, 1.00% for certain purchases of Class A shares (1.00% to .50% prior to July 12, 2010) and .25% for certain purchases of Class T shares.
For the period, sales charge amounts retained by FDC were as follows:
| Retained
by FDC |
Class A | $ 12,659 |
Class T | 1,864 |
Class B* | 1,097 |
Class C* | 1,555 |
| $ 17,175 |
* When Class B and Class C shares are initially sold, FDC pays commissions from its own resources to financial intermediaries through which the sales are made.
Annual Report
Notes to Financial Statements - continued
5. Fees and Other Transactions with Affiliates - continued
Transfer Agent Fees. Fidelity Investments Institutional Operations Company, Inc. (FIIOC), an affiliate of FMR, is the transfer, dividend disbursing and shareholder servicing agent for each class of the Fund. FIIOC receives account fees and asset-based fees that vary according to the account size and type of account of the shareholders of the respective classes of the Fund. FIIOC pays for typesetting, printing and mailing of shareholder reports, except proxy statements. For the period, transfer agent fees for each class were as follows:
| Amount | % of
Average
Net Assets |
Class A | $ 19,569 | .30 |
Class T | 6,660 | .31 |
Class B | 2,517 | .31 |
Class C | 10,953 | .31 |
Emerging Europe, Middle East, Africa (EMEA) | 340,642 | .30 |
Institutional Class | 10,427 | .20 |
| $ 390,768 | |
Accounting Fees. Fidelity Service Company, Inc. (FSC), an affiliate of FMR, maintains the Fund's accounting records. The fee is based on the level of average net assets for the month.
Brokerage Commissions. The Fund placed a portion of its portfolio transactions with brokerage firms which are affiliates of the investment adviser. The commissions paid to these affiliated firms were $277 for the period.
6. Committed Line of Credit.
The Fund participates with other funds managed by FMR or an affiliate in a $3.75 billion credit facility (the "line of credit") to be utilized for temporary or emergency purposes to fund shareholder redemptions or for other short-term liquidity purposes. The Fund has agreed to pay commitment fees on its pro-rata portion of the line of credit, which amounted to $503 and is reflected in Miscellaneous expenses on the Statement of Operations. During the period, there were no borrowings on this line of credit.
7. Expense Reductions.
FMR voluntarily agreed to reimburse each class to the extent annual operating expenses exceeded certain levels of average net assets as noted in the table below. Some expenses, for example interest expense, including commitment fees, are excluded from this reimbursement.
Annual Report
7. Expense Reductions - continued
The following classes were in reimbursement during the period:
| Expense
Limitations | Reimbursement
from adviser |
Class A | 1.50% | $ 12,027 |
Class T | 1.75% | 4,152 |
Class B | 2.25% | 1,723 |
Class C | 2.25% | 7,018 |
Emerging Europe, Middle East, Africa (EMEA) | 1.25% | 230,099 |
Institutional Class | 1.25% | 4,595 |
| | $ 259,614 |
Effective January 1, 2011, the expense limitation will be changed to 1.65%, 1.90%, 2.40%, 2.40%, 1.40% and 1.40% for Class A, T, B, C, Emerging Europe, Middle East, Africa (EMEA) and Institutional, respectively.
Many of the brokers with whom FMR places trades on behalf of the Fund provided services to the Fund in addition to trade execution. These services included payments of certain expenses on behalf of the Fund totaling $169,256 for the period.
8. Distributions to Shareholders.
Distributions to shareholders of each class were as follows:
Years ended October 31, | 2010 | 2009 |
From net investment income | | |
Class A | $ 26,924 | $ 8,761 |
Class T | 5,586 | 2,185 |
Class C | 2,308 | - |
Emerging Europe, Middle East, Africa (EMEA) | 748,050 | 241,410 |
Institutional Class | 33,147 | 20,746 |
Total | $ 816,015 | $ 273,102 |
From net realized gain | | |
Class A | $ 15,761 | $ - |
Class T | 5,156 | - |
Class B | 1,284 | - |
Class C | 9,232 | - |
Emerging Europe, Middle East, Africa (EMEA) | 345,254 | - |
Institutional Class | 14,732 | - |
Total | $ 391,419 | $ - |
Annual Report
Notes to Financial Statements - continued
9. Share Transactions.
Transactions for each class of shares were as follows:
| Shares | Dollars |
Years ended October 31, | 2010 | 2009 | 2010 | 2009 |
Class A | | | | |
Shares sold | 750,400 | 571,278 | $ 5,978,580 | $ 3,669,041 |
Reinvestment of distributions | 5,604 | 1,833 | 40,683 | 8,321 |
Shares redeemed | (299,775) | (197,844) | (2,302,163) | (1,251,307) |
Net increase (decrease) | 456,229 | 375,267 | $ 3,717,100 | $ 2,426,055 |
Class T | | | | |
Shares sold | 258,490 | 178,308 | $ 2,070,251 | $ 1,129,813 |
Reinvestment of distributions | 1,476 | 481 | 10,717 | 2,182 |
Shares redeemed | (127,308) | (83,315) | (967,322) | (541,782) |
Net increase (decrease) | 132,658 | 95,474 | $ 1,113,646 | $ 590,213 |
Class B | | | | |
Shares sold | 50,154 | 55,038 | $ 403,463 | $ 326,654 |
Reinvestment of distributions | 173 | - | 1,261 | - |
Shares redeemed | (66,507) | (49,759) | (516,486) | (303,402) |
Net increase (decrease) | (16,180) | 5,279 | $ (111,762) | $ 23,252 |
Class C | | | | |
Shares sold | 353,916 | 342,231 | $ 2,814,751 | $ 2,213,144 |
Reinvestment of distributions | 1,559 | - | 11,306 | - |
Shares redeemed | (147,366) | (128,292) | (1,102,603) | (825,454) |
Net increase (decrease) | 208,109 | 213,939 | $ 1,723,454 | $ 1,387,690 |
Emerging Europe, Middle East, Africa (EMEA) | | | |
Shares sold | 10,587,461 | 13,077,282 | $ 85,331,520 | $ 83,717,275 |
Reinvestment of distributions | 144,800 | 50,835 | 1,051,250 | 230,791 |
Shares redeemed | (9,457,558) | (5,656,005) | (72,517,018) | (35,458,373) |
Net increase (decrease) | 1,274,703 | 7,472,112 | $ 13,865,752 | $ 48,489,693 |
Institutional Class | | | | |
Shares sold | 319,437 | 182,348 | $ 2,551,378 | $ 1,155,556 |
Reinvestment of distributions | 825 | 1,053 | 5,986 | 4,781 |
Shares redeemed | (105,236) | (167,948) | (819,955) | (976,723) |
Net increase (decrease) | 215,026 | 15,453 | $ 1,737,409 | $ 183,614 |
10. Other.
The Fund's organizational documents provide former and current trustees and officers with a limited indemnification against liabilities arising in connection with the performance of their duties to the Fund. In the normal course of business, the Fund may also enter into contracts that provide general indemnifications. The Fund's maximum exposure under these arrangements is unknown as this would be dependent on future claims that may be made against the Fund. The risk of material loss from such claims is considered remote.
At the end of the period, FMR or its affiliates were the owners of record of 10% of the total outstanding shares of the Fund.
Annual Report
To the Trustees of Fidelity Investment Trust and Shareholders of Fidelity Emerging Europe, Middle East, Africa (EMEA) Fund:
We have audited the accompanying statement of assets and liabilities of Fidelity Emerging Europe, Middle East, Africa (EMEA) Fund (the Fund), a fund of Fidelity Investment Trust, including the schedule of investments, as of October 31, 2010, and the related statement of operations for the year then ended, the statement of changes in net assets for each of the two years in the period then ended, and the financial highlights for each of the two years in the period then ended and the period May 8, 2008 (commencement of operations) to October 31, 2008. These financial statements and financial highlights are the responsibility of the Fund's management. Our responsibility is to express an opinion on these financial statements and financial highlights based on our audits.
We conducted our audits in accordance with standards of the Public Company Accounting Oversight Board (United States). Those standards require that we plan and perform the audit to obtain reasonable assurance about whether the financial statements and financial highlights are free of material misstatement. The Fund is not required to have, nor were we engaged to perform, an audit of its internal control over financial reporting. Our audits included consideration of internal control over financial reporting as a basis for designing audit procedures that are appropriate in the circumstances, but not for the purpose of expressing an opinion on the effectiveness of the Fund's internal control over financial reporting. Accordingly, we express no such opinion. An audit also includes examining, on a test basis, evidence supporting the amounts and disclosures in the financial statements, assessing the accounting principles used and significant estimates made by management, as well as evaluating the overall financial statement presentation. Our procedures included confirmation of securities owned as of October 31, 2010, by correspondence with the custodians and brokers; where replies were not received from brokers, we performed other auditing procedures. We believe that our audits provide a reasonable basis for our opinion.
In our opinion, the financial statements and financial highlights referred to above present fairly, in all material respects, the financial position of Fidelity Emerging Europe, Middle East, Africa (EMEA) Fund as of October 31, 2010, the results of its operations for the year then ended, the changes in its net assets for each of the two years in the period then ended, and the financial highlights for each of the two years in the period then ended and the period May 8, 2008 (commencement of operations) to October 31, 2008, in conformity with accounting principles generally accepted in the United States of America.
/s/ Deloitte & Touche LLP
DELOITTE & TOUCHE LLP
Boston, Massachusetts
December 16, 2010
Annual Report
The Trustees, Member of the Advisory Board, and executive officers of the trust and fund, as applicable, are listed below. The Board of Trustees governs the fund and is responsible for protecting the interests of shareholders. The Trustees are experienced executives who meet periodically throughout the year to oversee the fund's activities, review contractual arrangements with companies that provide services to the fund, oversee management of the risks associated with such activities and contractual arrangements, and review the fund's performance. Except for James C. Curvey, each of the Trustees oversees 221 funds advised by FMR or an affiliate. Mr. Curvey oversees 410 funds advised by FMR or an affiliate.
The Trustees hold office without limit in time except that (a) any Trustee may resign; (b) any Trustee may be removed by written instrument, signed by at least two-thirds of the number of Trustees prior to such removal; (c) any Trustee who requests to be retired or who has become incapacitated by illness or injury may be retired by written instrument signed by a majority of the other Trustees; and (d) any Trustee may be removed at any special meeting of shareholders by a two-thirds vote of the outstanding voting securities of the trust. Each Trustee who is not an interested person (as defined in the 1940 Act) (Independent Trustee), shall retire not later than the last day of the calendar year in which his or her 72nd birthday occurs. The Independent Trustees may waive this mandatory retirement age policy with respect to individual Trustees. The executive officers and Advisory Board Member hold office without limit in time, except that any officer and Advisory Board Member may resign or may be removed by a vote of a majority of the Trustees at any regular meeting or any special meeting of the Trustees. Except as indicated, each individual has held the office shown or other offices in the same company for the past five years.
Experience, Skills, Attributes, and Qualifications of the Fund's Trustees. The Governance and Nominating Committee has adopted a statement of policy that describes the experience, qualifications, attributes, and skills that are necessary and desirable for potential Independent Trustee candidates (Statement of Policy). The Board believes that each Trustee satisfied at the time he or she was initially elected or appointed a Trustee, and continues to satisfy, the standards contemplated by the Statement of Policy. The Governance and Nominating Committee also engages professional search firms to help identify potential Independent Trustee candidates who have the experience, qualifications, attributes, and skills consistent with the Statement of Policy. From time to time, additional criteria based on the composition and skills of the current Independent Trustees, as well as experience or skills that may be appropriate in light of future changes to board composition, business conditions, and regulatory or other developments, have also been considered by the professional search firms and the Governance and Nominating Committee. In addition, the Board takes into account the Trustees' commitment and participation in Board and committee meetings, as well as their leadership of standing and ad hoc committees throughout their tenure.
In determining that a particular Trustee was and continues to be qualified to serve as a Trustee, the Board has considered a variety of criteria, none of which, in isolation, was controlling. The Board believes that, collectively, the Trustees have balanced and diverse experience, qualifications, attributes, and skills, which allow the Board to operate effectively in governing the fund and protecting the interests of shareholders. Information about the specific experience, skills, attributes, and qualifications of each Trustee, which in each case led to the Board's conclusion that the Trustee should serve (or continue to serve) as a trustee of the fund, is provided below.
Annual Report
Board Structure and Oversight Function. Edward C. Johnson 3d is an interested person (as defined in the 1940 Act) and currently serves as Chairman. The Trustees have determined that an interested Chairman is appropriate and benefits shareholders because an interested Chairman has a personal and professional stake in the quality and continuity of services provided to the fund. Independent Trustees exercise their informed business judgment to appoint an individual of their choosing to serve as Chairman, regardless of whether the Trustee happens to be independent or a member of management. The Independent Trustees have determined that they can act independently and effectively without having an Independent Trustee serve as Chairman and that a key structural component for assuring that they are in a position to do so is for the Independent Trustees to constitute a substantial majority for the Board. The Independent Trustees also regularly meet in executive session. Ned C. Lautenbach serves as Chairman of the Independent Trustees and as such (i) acts as a liaison between the Independent Trustees and management with respect to matters important to the Independent Trustees and (ii) with management prepares agendas for Board meetings.
Fidelity funds are overseen by different Boards of Trustees. The fund's Board oversees Fidelity's equity and high income funds and another Board oversees Fidelity's investment-grade bond, money market, and asset allocation funds. The asset allocation funds may invest in Fidelity funds overseen by the fund's Board. The use of separate Boards, each with its own committee structure, allows the Trustees of each group of Fidelity funds to focus on the unique issues of the funds they oversee, including common research, investment, and operational issues. On occasion, the separate Boards establish joint committees to address issues of overlapping consequences for the Fidelity funds overseen by each Board.
The Trustees operate using a system of committees to facilitate the timely and efficient consideration of all matters of importance to the Trustees, the fund, and fund shareholders and to facilitate compliance with legal and regulatory requirements and oversight of the fund's activities and associated risks. The Board, acting through its committees, has charged FMR and its affiliates with (i) identifying events or circumstances the occurrence of which could have demonstrably adverse effects on the fund's business and/or reputation; (ii) implementing processes and controls to lessen the possibility that such events or circumstances occur or to mitigate the effects of such events or circumstances if they do occur; and (iii) creating and maintaining a system designed to evaluate continuously business and market conditions in order to facilitate the identification and implementation processes described in (i) and (ii) above. Because the day-to-day operations and activities of the fund are carried out by or through FMR, its affiliates and other service providers, the fund's exposure to risks is mitigated but not eliminated by the processes overseen by the Trustees. While each of the Board's committees has responsibility for overseeing different aspects of the fund's activities, oversight is exercised primarily through the Operations, Audit, and Compliance Committees. Appropriate personnel, including but not limited to the fund's Chief Compliance Officer (CCO), FMR's internal auditor, the independent accountants, the fund's Treasurer and portfolio management personnel, make periodic reports to the Board's committees, as appropriate. The responsibilities of each committee, including their oversight responsibilities, are described further under "Standing Committees of the Fund's Trustees."
Annual Report
Trustees and Officers - continued
The fund's Statement of Additional Information (SAI) includes more information about the Trustees. To request a free copy, call Fidelity at 1-877-208-0098.
Interested Trustees*:
Correspondence intended for each Trustee who is an interested person may be sent to Fidelity Investments, 82 Devonshire Street, Boston, Massachusetts 02109.
Name, Age; Principal Occupations and Other Relevant Experience+ |
Edward C. Johnson 3d (80) |
| Year of Election or Appointment: 1984 Mr. Johnson is Trustee and Chairman of the Board of Trustees of certain Trusts. Mr. Johnson serves as Chief Executive Officer, Chairman, and a Director of FMR LLC; Chairman and a Director of FMR; Chairman and a Director of Fidelity Research & Analysis Company (FRAC); Chairman and a Director of Fidelity Investments Money Management, Inc.; and Chairman and a Director of FMR Co., Inc. In addition, Mr. Johnson serves as Chairman and Director of FIL Limited. Previously, Mr. Johnson served as President of FMR LLC (2006-2007). |
James C. Curvey (75) |
| Year of Election or Appointment: 2007 Mr. Curvey also serves as Trustee (2007-present) of other investment companies advised by FMR. Mr. Curvey is a Director of Fidelity Investments Money Management, Inc. (2009-present), Director of Fidelity Research & Analysis Co. (2009-present) and Director of FMR and FMR Co., Inc. (2007-present). Mr. Curvey is also Vice Chairman (2007-present) and Director of FMR LLC. In addition, Mr. Curvey serves as an Overseer for the Boston Symphony Orchestra and a member of the Trustees of Villanova University. Previously, Mr. Curvey was the Vice Chairman (2006-2007) and Director (2000-2007) of FMR Corp. |
* Trustees have been determined to be "Interested Trustees" by virtue of, among other things, their affiliation with the trust or various entities under common control with FMR.
+ The information above includes each Trustee's principal occupation during the last five years and other information relating to the experience, attributes, and skills relevant to each Trustee's qualifications to serve as a Trustee, which led to the conclusion that each Trustee should serve as a Trustee for the fund.
Independent Trustees:
Correspondence intended for each Independent Trustee (that is, the Trustees other than the Interested Trustees) may be sent to Fidelity Investments, P.O. Box 55235, Boston, Massachusetts 02205-5235.
Name, Age; Principal Occupations and Other Relevant Experience+ |
Dennis J. Dirks (62) |
| Year of Election or Appointment: 2005 Prior to his retirement in May 2003, Mr. Dirks was Chief Operating Officer and a member of the Board of The Depository Trust & Clearing Corporation (DTCC). He also served as President, Chief Operating Officer, and Board member of The Depository Trust Company (DTC) and President and Board member of the National Securities Clearing Corporation (NSCC). In addition, Mr. Dirks served as Chief Executive Officer and Board member of the Government Securities Clearing Corporation, Chief Executive Officer and Board member of the Mortgage-Backed Securities Clearing Corporation, as a Trustee and a member of the Finance Committee of Manhattan College (2005-2008), and as a Trustee and a member of the Finance Committee of AHRC of Nassau County (2006-2008). Mr. Dirks is a member of the Independent Directors Council (IDC) Governing Council (2010-Present) and Board of Directors for The Brookville Center for Children's Services, Inc. (2009-present). |
Alan J. Lacy (57) |
| Year of Election or Appointment: 2008 Mr. Lacy serves as Senior Adviser (2007-present) of Oak Hill Capital Partners, L.P. (private equity). Mr. Lacy also served as Chief Executive Officer (2000-2005) and Vice Chairman (2005-2006) of Sears Holdings Corporation and Sears, Roebuck and Co. (retail). In addition, Mr. Lacy serves as a member of the Board of Directors of The Western Union Company (global money transfer, 2006-present) and Bristol-Myers Squibb Company (global pharmaceuticals, 2007-present). Mr. Lacy is Chairman (2008-present) and a member (2006-present) of the Board of Trustees of The National Parks Conservation Association. |
Ned C. Lautenbach (66) |
| Year of Election or Appointment: 2000 Mr. Lautenbach is Chairman of the Independent Trustees of the Equity and High Income Funds (2006-present). Mr. Lautenbach currently serves as the Lead Director of the Eaton Corporation Board of Directors (diversified industrial, 1997-present). Mr. Lautenbach is also a member of the Board of Directors of the Philharmonic Center for the Arts in Naples, Florida (1999 - present); a member of the Board of Trustees of Fairfield University (2005-present); and a member of the Council on Foreign Relations (1994 - present). Previously, Mr. Lautenbach was a Partner/Advisory Partner at Clayton, Dubilier & Rice, Inc. (private equity investment, 1998-2010), as well as a Director of Sony Corporation (2006-2007). |
Joseph Mauriello (66) |
| Year of Election or Appointment: 2008 Prior to his retirement in January 2006, Mr. Mauriello served in numerous senior management positions including Deputy Chairman and Chief Operating Officer (2004-2005), and Vice Chairman of Financial Services (2002-2004) of KPMG LLP US (professional services, 1965-2005). Mr. Mauriello currently serves as a member of the Board of Directors of XL Group plc. (global insurance and re-insurance, 2006-present) and of Arcadia Resources Inc. (health care services and products, 2007-present). Previously, Mr. Mauriello served as a Director of the Hamilton Funds of the Bank of New York (2006-2007). |
Cornelia M. Small (66) |
| Year of Election or Appointment: 2005 Ms. Small is a member of the Board of Directors of the Teagle Foundation (2009-present). Ms. Small is also a member of the Investment Committee, and Chair (2008-present) and a member of the Board of Trustees of Smith College. In addition, Ms. Small serves on the Investment Committee of the Berkshire Taconic Community Foundation (2008-present). Previously, Ms. Small served as Chairperson of the Investment Committee (2002-2008) of Smith College. In addition, Ms. Small served as Chief Investment Officer, Director of Global Equity Investments, and a member of the Board of Directors of Scudder, Stevens & Clark and Scudder Kemper Investments. |
William S. Stavropoulos (71) |
| Year of Election or Appointment: 2001 Mr. Stavropoulos is Vice Chairman of the Independent Trustees of the Equity and High Income Funds (2006-present). Mr. Stavropoulos serves as President and Founder of the Michigan Baseball Foundation, the Great Lakes Loons (2007-present). Mr. Stavropoulos is Chairman Emeritus of the Board of Directors of The Dow Chemical Company, where he previously served in numerous senior management positions, including President, CEO (1995-2000; 2002-2004), Chairman of the Executive Committee (2000-2006), and as a member of the Board of Directors (1990-2006). Currently, Mr. Stavropoulos is Chairman of Univar (global distributor of commodity and special chemicals, 2010-present), a Director of Teradata Corporation (data warehousing and technology solutions, 2008-present), Chemical Financial Corporation, Maersk Inc. (industrial conglomerate), Tyco International, Inc. (multinational manufacturing and services, 2007-present), and a member of the Advisory Board for Metalmark Capital (private equity investment, 2005-present). Mr. Stavropoulos is a special advisor to Clayton, Dubilier & Rice, Inc. (private equity investment). In addition, Mr. Stavropoulos is a member of the University of Notre Dame Advisory Council for the College of Science. |
David M. Thomas (61) |
| Year of Election or Appointment: 2008 Previously, Mr. Thomas served as Executive Chairman (2005-2006) and Chairman and Chief Executive Officer (2000-2005) of IMS Health, Inc. (pharmaceutical and healthcare information solutions). In addition, Mr. Thomas serves as a member of the Board of Directors of Fortune Brands, Inc. (consumer products), and Interpublic Group of Companies, Inc. (marketing communication, 2004-present). |
Michael E. Wiley (60) |
| Year of Election or Appointment: 2008 Mr. Wiley also serves as a Director of Asia Pacific Exploration Consolidated (international oil and gas exploration and production, 2008-present). Mr. Wiley serves as a Director of Tesoro Corporation (independent oil refiner and marketer, 2005-present), and a Director of Bill Barrett Corporation (exploration and production, 2005-present). In addition, Mr. Wiley also serves as a Director of Post Oak Bank (privately-held bank, 2004-present). Previously, Mr. Wiley served as a member of the Board of Trustees of the University of Tulsa (2000-2006; 2007-2010), as a Senior Energy Advisor of Katzenbach Partners, LLC (consulting, 2006-2007), as an Advisory Director of Riverstone Holdings (private investment), Chairman, President, and CEO of Baker Hughes, Inc. (oilfield services, 2000-2004), and as Director of Spinnaker Exploration Company (exploration and production, 2001-2005). |
+ The information above includes each Trustee's principal occupation during the last five years and other information relating to the experience, attributes, and skills relevant to each Trustee's qualifications to serve as a Trustee, which led to the conclusion that each Trustee should serve as a Trustee for the fund.
Advisory Board Member and Executive Officers:
Correspondence intended for each executive officer and Peter S. Lynch may be sent to Fidelity Investments, 82 Devonshire Street, Boston, Massachusetts 02109.
Name, Age; Principal Occupation |
Peter S. Lynch (66) |
| Year of Election or Appointment: 2003 Member of the Advisory Board of Fidelity's Equity and High Income Funds. Mr. Lynch is Vice Chairman and a Director of FMR and FMR Co., Inc. In addition, Mr. Lynch serves as a Trustee of Boston College and as the Chairman of the Inner-City Scholarship Fund. Previously, Mr. Lynch served on the Special Olympics International Board of Directors (1997-2006). |
Kenneth B. Robins (41) |
| Year of Election or Appointment: 2008 President and Treasurer of Fidelity's Equity and High Income Funds. Mr. Robins also serves as President and Treasurer (2010-present) and Assistant Treasurer (2009-present) of other Fidelity funds and is an employee of Fidelity Investments (2004-present). Previously, Mr. Robins served as Deputy Treasurer of the Fidelity funds (2005-2008) and Treasurer and Chief Financial Officer of The North Carolina Capital Management Trust: Cash and Term Portfolios (2006-2008). |
Bruce T. Herring (45) |
| Year of Election or Appointment: 2006 Vice President of certain Equity Funds. Mr. Herring also serves as Chief Investment Officer and Director of Fidelity Management & Research (U.K.) Inc. (2010-present) and Group Chief Investments Officer of FMR. Previously, Mr. Herring served as Vice President (2005-2006) and Senior Vice President (2006-2007) of Fidelity Management & Research Company, Vice President of FMR Co., Inc. (2001-2007) and as a portfolio manager for Fidelity U.S. Equity Funds. |
Brian B. Hogan (46) |
| Year of Election or Appointment: 2009 Vice President of certain Equity Funds and Vice President of Sector Funds. Mr. Hogan also serves as President of FMR's Equity Division (2009-present). Previously, Mr. Hogan served as Senior Vice President, Equity Research of FMR (2006-2009) and as a portfolio manager. |
Scott C. Goebel (42) |
| Year of Election or Appointment: 2008 Secretary and Chief Legal Officer (CLO) of the Fidelity funds. Mr. Goebel also serves as Secretary and CLO of The North Carolina Capital Management Trust: Cash and Term Portfolio (2008-present); General Counsel, Secretary, and Senior Vice President of FMR (2008-present) and FMR Co., Inc. (2008-present); Deputy General Counsel of FMR LLC; Chief Legal Officer of Fidelity Management & Research (Hong Kong) Limited (2008-present) and Assistant Secretary of Fidelity Management & Research (Japan) Inc. (2008-present), Fidelity Investments Money Management, Inc. (2008-present), Fidelity Management & Research (U.K.) Inc. (2008-present), and Fidelity Research and Analysis Company (2008-present). Previously, Mr. Goebel served as Assistant Secretary of the Funds (2007-2008) and as Vice President and Secretary of Fidelity Distributors Corporation (FDC) (2005-2007). |
William C. Coffey (41) |
| Year of Election or Appointment: 2009 Assistant Secretary of Fidelity's Equity and High Income Funds. Mr. Coffey also serves as Senior Vice President and Deputy General Counsel of FMR LLC (2010-present), and is an employee of Fidelity Investments. Previously, Mr. Coffey served as Vice President and Associate General Counsel of FMR LLC (2005-2009). |
Holly C. Laurent (56) |
| Year of Election or Appointment: 2008 Anti-Money Laundering (AML) Officer of the Fidelity funds. Ms. Laurent also serves as AML Officer of The North Carolina Capital Management Trust: Cash and Term Portfolio (2008-present) and is an employee of Fidelity Investments. Previously, Ms. Laurent was Senior Vice President and Head of Legal for Fidelity Business Services India Pvt. Ltd. (2006-2008), and Senior Vice President, Deputy General Counsel and Group Head for FMR LLC (2005-2006). |
Christine Reynolds (52) |
| Year of Election or Appointment: 2008 Chief Financial Officer of the Fidelity funds. Ms. Reynolds became President of Fidelity Pricing and Cash Management Services (FPCMS) in August 2008. Ms. Reynolds served as Chief Operating Officer of FPCMS (2007-2008). Previously, Ms. Reynolds served as President, Treasurer, and Anti-Money Laundering officer of the Fidelity funds (2004-2007). |
Kenneth A. Rathgeber (63) |
| Year of Election or Appointment: 2004 Chief Compliance Officer of Fidelity's Equity and High Income Funds. Mr. Rathgeber is Chief Compliance Officer of Fidelity Management & Research (Hong Kong) Limited (2008-present), Fidelity Management & Research (Japan) Inc. (2008-present), FMR (2005-present), FMR Co., Inc. (2005-present), Fidelity Management & Research (U.K.) Inc. (2005-present), Fidelity Research & Analysis Company (2005-present), Fidelity Investments Money Management, Inc. (2005-present), Pyramis Global Advisors, LLC (2005-present), and Strategic Advisers, Inc. (2005-present). |
Jeffrey S. Christian (49) |
| Year of Election or Appointment: 2009 Deputy Treasurer of the Fidelity funds. Mr. Christian is an employee of Fidelity Investments. Previously, Mr. Christian served as Chief Financial Officer (2008-2009) of certain Fidelity funds and Senior Vice President of Fidelity Pricing and Cash Management Services (FPCMS) (2004-2009). |
Bryan A. Mehrmann (49) |
| Year of Election or Appointment: 2005 Deputy Treasurer of the Fidelity funds. Mr. Mehrmann is an employee of Fidelity Investments. |
Adrien E. Deberghes (43) |
| Year of Election or Appointment: 2008 Deputy Treasurer of Fidelity's Equity and High Income Funds. Mr. Deberghes also serves as Assistant Treasurer of other Fidelity funds (2010-present) and is an employee of Fidelity Investments (2008-present). Previously, Mr. Deberghes served as Senior Vice President of Mutual Fund Administration at State Street Corporation (2007-2008), Senior Director of Mutual Fund Administration at Investors Bank & Trust (2005-2007), and Director of Finance for Dunkin' Brands (2000-2005). |
Stephanie J. Dorsey (41) |
| Year of Election or Appointment: 2010 Assistant Treasurer of Fidelity's Equity and High Income Funds. Ms. Dorsey also serves as Deputy Treasurer of other Fidelity funds (2008-present) and is an employee of Fidelity Investments (2008-present). Previously, Ms. Dorsey served as Treasurer (2004-2008) of the JPMorgan Mutual Funds and Vice President (2004-2008) of JPMorgan Chase Bank. |
John R. Hebble (52) |
| Year of Election or Appointment: 2009 Assistant Treasurer of Fidelity's Equity and High Income Funds. Mr. Hebble also serves as Treasurer and Chief Financial Officer of The North Carolina Capital Management Trust: Cash and Term Portfolio (2008-present), President and Treasurer of other Fidelity funds (2008-present) and is an employee of Fidelity Investments. |
Gary W. Ryan (52) |
| Year of Election or Appointment: 2005 Assistant Treasurer of the Fidelity funds. Mr. Ryan is an employee of Fidelity Investments. Previously, Mr. Ryan served as Vice President of Fund Reporting in Fidelity Pricing and Cash Management Services (FPCMS) (1999-2005). |
Jonathan Davis (42) |
| Year of Election or Appointment: 2010 Assistant Treasurer of the Fidelity funds. Mr. Davis is an employee of Fidelity Investments. Previously, Mr. Davis served as Vice President and Associate General Counsel of FMR LLC (2003-2010). |
Annual Report
The Board of Trustees of Fidelity Emerging Europe, Middle East, Africa, (EMEA) Fund voted to pay to shareholders of record at the opening of business on record date, the following distributions per share derived from capital gains realized from sales of portfolio securities, and dividends derived from net investment income:
| Pay Date | Record Date | Dividends | Capital Gains |
Institutional Class | 12/13/10 | 12/10/10 | $0.071 | $0.015 |
Institutional Class designates 100% of the dividend distributed during the fiscal year as amounts which may be taken into account as a dividend for purposes of the maximum rate under section 1(h)(11) of the Internal Revenue Code.
The amounts per share which represent income derived from sources within, and taxes paid to, foreign countries or possessions of the United States are as follows:
| Pay Date | Income | Taxes |
Institutional Class | 12/14/2009 | $0.035 | $0.0077 |
The fund will notify shareholders in January 2011 of amounts for use in preparing 2010 income tax returns.
Annual Report
Board Approval of Investment Advisory Contracts and Management Fees
Fidelity Emerging Europe, Middle East, Africa (EMEA) Fund
Each year, the Board of Trustees, including the Independent Trustees (together, the Board), votes on the renewal of the management contract and sub-advisory agreements (together, the Advisory Contracts) for the fund. The Board, assisted by the advice of fund counsel and Independent Trustees' counsel, requests and considers a broad range of information relevant to the renewal of the Advisory Contracts throughout the year.
The Board meets regularly and considers at each of its meetings factors that are relevant to its annual consideration of the renewal of the fund's Advisory Contracts, including the services and support provided to the fund and its shareholders. The Board has established various standing committees, each composed of Independent Trustees with varying backgrounds, to which the Board has assigned specific subject matter responsibilities in order to enhance effective decision-making by the Board. The Board, acting directly and through its Committees, requests and receives information concerning the annual consideration of the renewal of the fund's Advisory Contracts. The Board also meets as needed to consider matters specifically related to the Board's annual consideration of the renewal of Advisory Contracts. Members of the Board may also meet with trustees of other Fidelity funds through ad hoc joint committees to discuss certain matters relevant to the Fidelity funds.
At its July 2010 meeting, the Board of Trustees, including the Independent Trustees, unanimously determined to renew the fund's Advisory Contracts. In reaching its determination, the Board considered all factors it believed relevant, including (i) the nature, extent, and quality of the services to be provided to the fund and its shareholders (including the investment performance of the fund); (ii) the competitiveness of the fund's management fee and total expenses; (iii) the total costs of the services to be provided by and the profits to be realized by Fidelity from its relationship with the fund; (iv) the extent to which economies of scale would be realized as the fund grows; and (v) whether fee levels reflect these economies of scale, if any, for the benefit of fund shareholders.
In considering whether to renew the Advisory Contracts for the fund, the Board reached a determination, with the assistance of fund counsel and Independent Trustees' counsel and through the exercise of its business judgment, that the renewal of the Advisory Contracts is in the best interests of fund shareholders and that the compensation to be received by Fidelity under the management contract is fair and reasonable. The Board's decision to renew the Advisory Contracts was not based on any single factor noted above, but rather was based on a comprehensive consideration of all the information provided to the Board at its meetings throughout the year. The Board, in reaching its determination to renew the Advisory Contracts, is aware that shareholders in the fund have a broad range of investment choices available to them, including a wide choice among mutual funds offered by Fidelity's competitors, and that the fund's shareholders, with the opportunity to review and weigh the disclosure provided by the fund in its prospectus and other public disclosures, have chosen to invest in this fund, managed by Fidelity.
Annual Report
Board Approval of Investment Advisory Contracts and
Management Fees - continued
Nature, Extent, and Quality of Services Provided. The Board considered the staffing within the investment adviser, FMR, and the sub-advisers (together, the Investment Advisers), including the backgrounds of the fund's investment personnel and the fund's investment objective and discipline. The Independent Trustees also had discussions with senior management of Fidelity's investment operations and investment groups. The Board considered the structure of the portfolio manager compensation program and whether this structure provides appropriate incentives to act in the best interest of the fund.
Resources Dedicated to Investment Management and Support Services. The Board and the equity research subcommittee of the Board's Fund Oversight Committee reviewed the size, education, and experience of the Investment Advisers' investment staff, their use of technology, and the Investment Advisers' approach to recruiting, training, and retaining portfolio managers and other research, advisory, and management personnel. The Board noted that Fidelity's analysts have access to a variety of technological tools and market and securities data that enable them to perform both fundamental and quantitative analysis and to specialize in various disciplines. The Board considered Fidelity's extensive global research capabilities that enable the Investment Advisers to aggregate data from various sources in an effort to produce positive investment results. The Board also considered that Fidelity's portfolio managers and analysts have access to daily portfolio attribution that allows for monitoring of a fund's portfolio, as well as an electronic communication system that provides immediate real-time access to research concerning issuers and credit enhancers. The Board noted FMR's continued focus on strengthening the organization and discipline of equity portfolio management and research.
Shareholder and Administrative Services. The Board considered (i) the nature, extent, quality, and cost of advisory, administrative, and shareholder services performed by the Investment Advisers and their affiliates under the Advisory Contracts and under separate agreements covering transfer agency, pricing and bookkeeping, and securities lending services for the fund; (ii) the nature and extent of the investment adviser's supervision of third party service providers, principally custodians and subcustodians; and (iii) the resources devoted to, and the record of compliance with, the fund's compliance policies and procedures. The Board also reviewed the allocation of fund brokerage, including allocations to brokers affiliated with the Investment Advisers, the use of brokerage commissions to pay fund expenses, and the use of "soft" commission dollars to pay for research services.
The Board noted that the growth of fund assets over time across the complex allows Fidelity to reinvest in the development of services designed to enhance the value or convenience of the Fidelity funds as investment vehicles. These services include 24-hour access to account information and market information through phone representatives and over the Internet, and investor education materials and asset allocation tools.
Annual Report
Investment in a Large Fund Family. The Board considered the benefits to shareholders of investing in a Fidelity fund, including the benefits of investing in a fund that is part of a large family of funds offering a variety of investment disciplines and providing a large variety of mutual fund investor services. The Board noted that Fidelity had taken, or had made recommendations that resulted in the Fidelity funds taking, a number of actions over the previous year that benefited particular funds, including (i) dedicating additional resources to investment research and restructuring and broadening the focus of the investment research teams; (ii) bolstering the senior management team that oversees asset management; (iii) launching Class F of certain funds as a lower-fee class available to Freedom K and Freedom Index Funds; (iv) lowering the initial investment minimums and ongoing balance requirements for Real Estate High Income Fund; (v) eliminating subsequent purchase minimums for all funds and adding a waiver of the investment minimum requirement for new accounts opened with the proceeds of a systematic withdrawal plan; (vi) eliminating the withdrawal minimum and maximum limits for systematic withdrawals from Advisor funds; (vii) expanding sales load waivers on Class A shares for Destiny Planholders and expanding Institutional Class eligibility for Class O Destiny Planholders; and (viii) changing certain Class A and Class T sales charge structures to further align them with industry practices.
Investment Performance. The Board considered whether the fund has operated in accordance with its investment objective, as well as its record of compliance with its investment restrictions. It also reviewed the fund's absolute investment performance for each class, as well as the fund's relative investment performance for each class measured against a broad-based securities market index. The Board noted that FMR does not believe that a meaningful peer group exists against which to compare the fund's performance. Because the fund had been in existence less than three calendar years, the following chart considered by the Board shows, for the one-year period ended December 31, 2009, the total returns of Institutional Class (Class I) and Class C of the fund and the total returns of a broad-based securities market index ("benchmark").
Annual Report
Board Approval of Investment Advisory Contracts and
Management Fees - continued
Fidelity Emerging Europe, Middle East, Africa (EMEA) Fund
The Board noted that the investment performance of the fund was lower than its benchmark for the period shown. The Board considered that the variations in performance among the fund's classes reflect the variations in class expenses, which result in lower performance for higher expense classes. The Board also reviewed the fund's performance since inception as well as performance in the current year. The Board noted that it is difficult to evaluate in any comprehensive fashion the performance of the fund, in light of its relatively recent commencement of operations.
Based on its review, and giving particular weight to the nature and quality of the resources dedicated by the Investment Advisers to maintain and improve relative performance and factoring in the unprecedented market events in recent years, the Board concluded that the nature, extent, and quality of investment management and support services and of shareholder and administrative services provided to the fund will benefit the fund's shareholders, particularly in light of the Board's view that the fund's shareholders benefit from investing in a fund that is part of a large family of funds offering a variety of investment disciplines and services.
Competitiveness of Management Fee and Total Fund Expenses. The Board considered the fund's management fee and total expenses compared to "mapped groups" of competitive funds and classes. Fidelity creates "mapped groups" by combining similar Lipper investment objective categories that have comparable management fee characteristics. Combining Lipper investment objective categories aids the Board's management fee and total expense comparisons by broadening the competitive group used for comparison and by reducing the number of universes to which various Fidelity funds are compared.
Annual Report
Management Fee. The Board considered two proprietary management fee comparisons for the 12-month (or shorter) periods shown in the chart below. The group of Lipper funds used by the Board for management fee comparisons is referred to below as the "Total Mapped Group." The Total Mapped Group comparison focuses on a fund's standing relative to the total universe of comparable funds available to investors, in terms of gross management fees before expense reimbursements or caps. "TMG %" represents the percentage of funds in the Total Mapped Group that had management fees that were lower than the fund's. For example, a TMG % of 13% means that 87% of the funds in the Total Mapped Group had higher management fees than the fund. The "Asset-Size Peer Group" (ASPG) comparison focuses on a fund's standing relative to non-Fidelity funds similar in size to the fund within the Total Mapped Group. The ASPG represents at least 15% of the funds in the Total Mapped Group with comparable asset size and management fee characteristics, subject to a minimum of 50 funds (or all funds in the Total Mapped Group if fewer than 50). Additional information, such as the ASPG quartile in which the fund's management fee ranked, is also included in the chart and considered by the Board.
Fidelity Emerging Europe, Middle East, Africa (EMEA) Fund

The Board noted that the fund's management fee ranked below the median of its Total Mapped Group and below the median of its ASPG for 2009.
Based on its review, the Board concluded that the fund's management fee is fair and reasonable in light of the services that the fund receives and the other factors considered.
Total Expenses. In its review of each class's total expenses, the Board considered the fund's management fee as well as other fund or class expenses, as applicable, such as transfer agent fees, pricing and bookkeeping fees, fund-paid 12b-1 fees, and custodial, legal, and audit fees. The Board also noted the effects of any waivers and reimbursements on fees and expenses. As part of its review, the Board also considered current and historical total expenses of each class of the fund compared to competitive fund median expenses. Each class of the fund is compared to those funds and classes in the Total Mapped Group (used by the Board for management fee comparisons) that have a similar sales load structure.
Annual Report
Board Approval of Investment Advisory Contracts and
Management Fees - continued
The Board noted that the total expenses of each class ranked below its competitive median for 2009.
Fees Charged to Other Fidelity Clients. The Board also considered Fidelity fee structures and other information with respect to clients of FMR and its affiliates, such as other mutual funds advised or subadvised by FMR or its affiliates, pension plan clients, and other institutional clients. In March 2010, the Board created an ad hoc joint committee with the board of other Fidelity funds (the Committee) to review and compare Fidelity's institutional investment advisory business with its business of providing services to the Fidelity funds, including the differences in services provided, fees charged, and costs incurred, as well as competition in their respective marketplaces.
Based on its review of total expenses and fees charged to other Fidelity clients, the Board concluded that the total expenses of each class of the fund were reasonable in light of the services that the fund and its shareholders receive and the other factors considered, including the findings of the Committee.
Costs of the Services and Profitability. The Board considered the revenues earned and the expenses incurred by Fidelity in conducting the business of developing, marketing, distributing, managing, administering and servicing the fund and its shareholders. The Board also considered the level of Fidelity's profits in respect of all the Fidelity funds.
On an annual basis, FMR presents to the Board Fidelity's profitability for the fund. Fidelity calculates the profitability for each fund, as well as aggregate profitability for groups of Fidelity funds and all Fidelity funds, using a series of detailed revenue and cost allocation methodologies which originate with the audited books and records of Fidelity. The Audit Committee of the Board reviews any significant changes from the prior year's methodologies.
PricewaterhouseCoopers LLP (PwC), independent registered public accounting firm and auditor to Fidelity and certain Fidelity funds, has been engaged annually by the Board as part of the Board's assessment of Fidelity's profitability analysis. PwC's engagement includes the review and assessment of Fidelity's methodologies used in determining the revenues and expenses attributable to Fidelity's mutual fund business, and completion of agreed-upon procedures surrounding the mathematical accuracy of fund profitability and its conformity to allocation methodologies. After considering PwC's reports issued under the engagement and information provided by Fidelity, the Board believes that while other allocation methods may also be reasonable, Fidelity's profitability methodologies are reasonable in all material respects.
Annual Report
The Board has also reviewed Fidelity's non-fund businesses and fall-out benefits related to the mutual fund business as well as cases where Fidelity's affiliates may benefit from or be related to the fund's business.
The Board considered the costs of the services provided by and the profits realized by Fidelity in connection with the operation of the fund and were satisfied that the profitability was not excessive in the circumstances.
Economies of Scale. The Board considered whether there have been economies of scale in respect of the management of the Fidelity funds, whether the Fidelity funds (including the fund) have appropriately benefited from any such economies of scale, and whether there is potential for realization of any further economies of scale. The Board considered the extent to which the fund will benefit from economies of scale through increased services to the fund, through waivers or reimbursements, or through fee or expense reductions.
In February 2009, the Board and the board of other Fidelity funds created an ad hoc committee (the Economies of Scale Committee) to analyze whether FMR attains economies of scale in respect of the management and servicing of the Fidelity funds, whether the Fidelity funds have appropriately benefited from such economies of scale, and whether there is potential for realization of any further economies of scale.
The Board recognized that the fund's management contract incorporates a "group fee" structure, which provides for lower group fee rates as total fund assets under FMR's management increase, and for higher group fee rates as total fund assets under FMR's management decrease. FMR calculates the group fee rates based on a tiered asset "breakpoint" schedule that varies based on asset class. The Board considered that the group fee is designed to deliver the benefits of economies of scale to fund shareholders when total Fidelity fund assets increase, even if assets of any particular fund are unchanged or have declined, because some portion of Fidelity's costs are attributable to services provided to all Fidelity funds, and all funds benefit if those costs can be allocated among more assets. The Board concluded that, given the group fee structure, fund shareholders will benefit from lower management fees as assets under FMR's management increase at the fund complex level, regardless of whether Fidelity achieves any such economies of scale.
The Board concluded, considering the findings of the Economies of Scale Committee, that any potential economies of scale are being appropriately shared between fund shareholders and Fidelity.
Annual Report
Board Approval of Investment Advisory Contracts and
Management Fees - continued
Additional Information Requested by the Board. In order to develop fully the factual basis for consideration of the Fidelity funds' Advisory Contracts, the Board requested and received additional information on certain topics, including (i) fund performance trends, actions to be taken by FMR to improve certain funds' overall performance, and Fidelity's long-term strategies for certain funds; (ii) portfolio manager changes that have occurred during the past year and length of portfolio manager tenure for different categories of funds over time; (iii) Fidelity's compensation structure for portfolio managers, research analysts, and other key personnel, the rationale for the compensation structure, and how the compensation structure provides appropriate performance incentives; (iv) the amount of the investment that each portfolio manager has made in the Fidelity fund(s) that he or she manages; (v) management and other fees paid by FMR to affiliated sub-advisers on behalf of the Fidelity funds; (vi) Fidelity's fee structures and rationale for recommending different fees among different categories of funds; (vii) Fidelity's rationale for recommending which funds should have a performance adjustment component as part of their management fees; (viii) the rationale for any differences between fund fee structures and fee structures in place for other Fidelity clients; and (ix) explanations regarding the relative total expenses borne by certain funds and classes, total expense competitive trends, and actions that might be taken by FMR to reduce total expenses for certain funds and classes.
Based on its evaluation of all of the conclusions noted above, and after considering all factors it believed relevant, the Board ultimately concluded that the advisory fee structures are fair and reasonable, and that the fund's Advisory Contracts should be renewed.
Annual Report
Investment Adviser
Fidelity Management & Research Company
Boston, MA
Investment Sub-Advisers
FMR Co., Inc.
Fidelity Management & Research
(U.K.) Inc.
Fidelity Research & Analysis Company
FIL Investments (Japan) Limited
FIL Investment Advisors
FIL Investment Advisors
(U.K.) Limited
Fidelity Management & Research
(Hong Kong) Limited
Fidelity Management & Research
(Japan) Inc.
General Distributor
Fidelity Distributors Corporation
Boston, MA
Transfer and Service Agents
Fidelity Investments Institutional
Operations Company, Inc.
Boston, MA
Fidelity Service Company, Inc.
Boston, MA
Custodian
State Street Bank & Trust Company
Quincy, MA
AEMEI-UANN-1210
1.861980.102
Fidelity®
Global Commodity Stock
Fund
Annual Report
October 31, 2010
(2_fidelity_logos) (Registered_Trademark)
Contents
Chairman's Message | <Click Here> | The Chairman's message to shareholders. |
Performance | <Click Here> | How the fund has done over time. |
Management's Discussion of Fund Performance | <Click Here> | The Portfolio Manager's review of fund performance and strategy. |
Shareholder Expense Example | <Click Here> | An example of shareholder expenses. |
Investment Changes | <Click Here> | A summary of major shifts in the fund's investments over the past six months. |
Investments | <Click Here> | A complete list of the fund's investments with their market values. |
Financial Statements | <Click Here> | Statements of assets and liabilities, operations, and changes in net assets, as well as financial highlights. |
Notes | <Click Here> | Notes to the financial statements. |
Report of Independent Registered Public Accounting Firm | <Click Here> | |
Trustees and Officers | <Click Here> | |
Distributions | <Click Here> | |
Board Approval of Investment Advisory Contracts and Management Fees | <Click Here> | |
To view a fund's proxy voting guidelines and proxy voting record for the 12-month period ended June 30, visit http://www.fidelity.com/proxyvotingresults or visit the Securities and Exchange Commission's (SEC) web site at http://www.sec.gov. You may also call 1-800-544-8544 to request a free copy of the proxy voting guidelines.
Standard & Poor's, S&P and S&P 500 are registered service marks of The McGraw-Hill Companies, Inc. and have been licensed for use by Fidelity Distributors Corporation.
Other third party marks appearing herein are the property of their respective owners.
All other marks appearing herein are registered or unregistered trademarks or service marks of FMR LLC or an affiliated company.
Annual Report
This report and the financial statements contained herein are submitted for the general information of the shareholders of the fund. This report is not authorized for distribution to prospective investors in the fund unless preceded or accompanied by an effective prospectus.
A fund files its complete schedule of portfolio holdings with the SEC for the first and third quarters of each fiscal year on Form N-Q. Forms N-Q are available on the SEC's web site at http://www.sec.gov. A fund's Forms N-Q may be reviewed and copied at the SEC's Public Reference Room in Washington, DC. Information regarding the operation of the SEC's Public Reference Room may be obtained by calling 1-800-SEC-0330. For a complete list of a fund's portfolio holdings, view the most recent holdings listing, semiannual report, or annual report on Fidelity's web site at http://www.fidelity.com or http://www.advisor.fidelity.com, as applicable.
NOT FDIC INSURED • MAY LOSE VALUE • NO BANK GUARANTEE
Neither the fund nor Fidelity Distributors Corporation is a bank.
Annual Report
(photo_of_Edward_C_Johnson_3d)
Dear Shareholder:
Equities have staged a rally in the second half of 2010, shaking off concerns about the European debt crisis and the possibility of a double-dip recession in the U.S. Although the short-term surge pushed major equity indexes back into positive territory for the year, several questions remain about the longer-term outlook, including lackluster economic growth and persistently high unemployment. Financial markets are always unpredictable, of course, but there also are several time-tested investment principles that can help put the odds in your favor.
One of the basic tenets is to invest for the long term. Over time, riding out the markets' inevitable ups and downs has proven much more effective than selling into panic or chasing the hottest trend. Even missing only a few of the markets' best days can significantly diminish investor returns. Patience also affords the benefits of compounding - of earning interest on additional income or reinvested dividends and capital gains. There can be tax advantages and cost benefits to consider as well. While staying the course doesn't eliminate risk, it can considerably lessen the effect of short-term declines.
You can further manage your investing risk through diversification. And today, more than ever, geographic diversification should be taken into account. Studies indicate that asset allocation is the single most important determinant of a portfolio's long-term success. The right mix of stocks, bonds and cash - aligned to your particular risk tolerance and investment objective - is very important. Age-appropriate rebalancing is also an essential aspect of asset allocation. For younger investors, an emphasis on equities - which historically have been the best-performing asset class over time - is encouraged. As investors near their specific goal, such as retirement or sending a child to college, consideration may be given to replacing volatile assets (e.g. common stocks) with more-stable fixed investments (bonds or savings plans).
A third principle - investing regularly - can help lower the average cost of your purchases. Investing a certain amount of money each month or quarter helps ensure you won't pay for all your shares at market highs. This strategy - known as dollar cost averaging - also reduces "emotion" from investing, helping shareholders avoid selling weak performers just prior to an upswing, or chasing a hot performer just before a correction.
We invite you to contact us via the Internet, through our Investor Centers or by phone. It is our privilege to provide you the information you need to make the investments that are right for you.
Sincerely,
(The chairman's signature appears here.)
Edward C. Johnson 3d
Annual Report
Average annual total return reflects the change in the value of an investment, assuming reinvestment of the class' dividend income and capital gains (the profits earned upon the sale of securities that have grown in value, if any) and assuming a constant rate of performance each year. The $10,000 table and the fund's returns do not reflect the deduction of taxes that a shareholder would pay on fund distributions or the redemption of fund shares. During periods of reimbursement by Fidelity, a fund's total return will be greater than it would be had the reimbursement not occurred. How a fund did yesterday is no guarantee of how it will do tomorrow.
Average Annual Total Returns
Periods ended October 31, 2010 | Past 1
year | Life of
fund A |
Fidelity Global Commodity Stock Fund | 18.38% | 32.79% |
A From March 25, 2009
$10,000 Over Life of Fund
Let's say hypothetically that $10,000 was invested in Fidelity® Global Commodity Stock Fund, a class of the fund, on March 25, 2009, when the fund started. The chart shows how the value of your investment would have changed, and also shows how the MSCI® ACWI® (All Country World Index) Index performed over the same period.
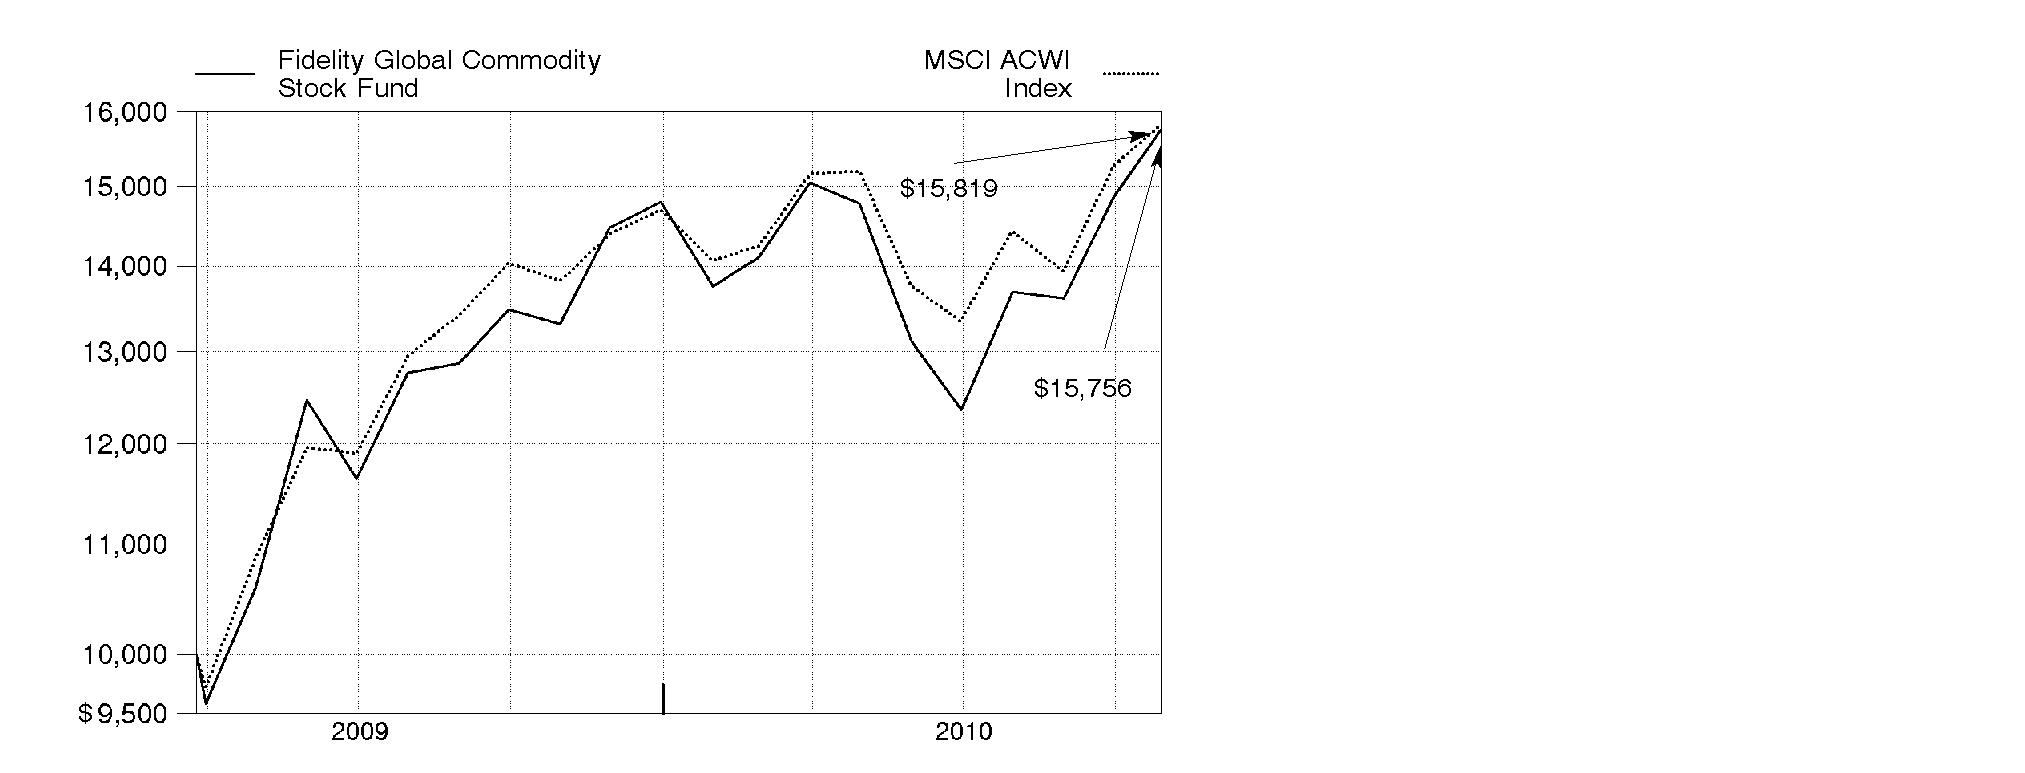
Annual Report
Market Recap: International stocks rode a wave of volatility similar to that of their U.S. counterparts during the 12 months ending October 31, 2010. Stocks gained modestly in the first half of the period, despite growing concerns about the European debt crisis. Sentiment turned decidedly negative in May and June, however, and the market suffered a precipitous decline. These losses were more than offset during the last four months of the period, when signs of economic growth and subsiding debt fears helped propel international stocks about 21%. For the full year, the MSCI® ACWI® (All Country World Index) ex USA Index gained 12.76%, boosted in part by a generally depreciating U.S. dollar. Within the index, Canada and emerging markets were standouts, returning 23% and 24%, respectively. Results in the latter group were led by strong-performing India, Mexico and South Africa, while China fell short of the MSCI benchmark due to cooling economic growth. The developed Asia ex Japan segment rose 16% for the period, lifted by solid results from Singapore and Hong Kong. Meanwhile, Europe rose just 9%, held back mainly by debt-riddled Spain and Italy, as well as lagging major constituent France. Japan returned only 5%, a result of that nation's continued weak economy.
Comments from S. Joseph Wickwire II, Portfolio Manager of Fidelity® Global Commodity Stock Fund: During the year, the fund's Retail Class shares returned 18.38%, versus 17.46% for the MSCI ACWI (All Country World Index) Commodity Producers Sector Capped Index and 14.47% for the MSCI ACWI (All Country World Index) Index. Versus the capped index, performance was aided by stock selection and an overweighting in gold, as well as an underweighting and favorable picks in integrated oil/gas. Geographically, security selection in the U.S. and U.K. added value. Notable contributors included Randgold Resources, a U.K.-based company with most of its assets in West Africa. Out-of-index positions in Lihir Gold, headquartered in Papua New Guinea, and Australia's Centennial Coal also helped, as did fertilizer maker Mosaic. Lihir and Centennial were acquired during the period. Conversely, stock selection in oil and gas exploration/production and in agricultural products was mildly negative, while underweighting Canada and Chile dampened the fund's gain a bit. Our small cash position also was a slight detractor. Underweighted exposure to Potash Corp. of Saskatchewan and strong-performing metals miner Rio Tinto - an index component - hampered the fund's results. Out-of-benchmark positions in Duoyuan Global Water, one of the top providers of water treatment equipment in China, and OPTI Canada, a small Canadian oil producer, also detracted.
The views expressed above reflect those of the portfolio manager(s) only through the end of the period as stated on the cover of this report and do not necessarily represent the views of Fidelity or any other person in the Fidelity organization. Any such views are subject to change at any time based upon market or other conditions and Fidelity disclaims any responsibility to update such views. These views may not be relied on as investment advice and, because investment decisions for a Fidelity fund are based on numerous factors, may not be relied on as an indication of trading intent on behalf of any Fidelity fund.
Annual Report
Shareholder Expense Example
As a shareholder of the Fund, you incur two types of costs: (1) transaction costs, including sales charges (loads) on purchase payments or redemption proceeds, redemption fees, and (2) ongoing costs, including management fees, distribution and/or service (12b-1) fees and other Fund expenses. This Example is intended to help you understand your ongoing costs (in dollars) of investing in the Fund and to compare these costs with the ongoing costs of investing in other mutual funds.
The Example is based on an investment of $1,000 invested at the beginning of the period and held for the entire period (May 1, 2010 to October 31, 2010).
Actual Expenses
The first line of the accompanying table for each class of the Fund provides information about actual account values and actual expenses. You may use the information in this line, together with the amount you invested, to estimate the expenses that you paid over the period. Simply divide your account value by $1,000.00 (for example, an $8,600 account value divided by $1,000.00 = 8.6), then multiply the result by the number in the first line for a class of the Fund under the heading entitled "Expenses Paid During Period" to estimate the expenses you paid on your account during this period. A small balance maintenance fee of $12.00 that is charged once a year may apply for certain accounts with a value of less than $2,000. This fee is not included in the table below. If it was, the estimate of expenses you paid during the period would be higher, and your ending account value lower, by this amount. In addition, the Fund, as a shareholder in the underlying Fidelity Central Funds, will indirectly bear its pro-rata share of the fees and expenses incurred by the underlying Fidelity Central Funds. These fees and expenses are not included in the Fund's annualized expense ratio used to calculate the expense estimate in the table below.
Hypothetical Example for Comparison Purposes
The second line of the accompanying table for each class of the Fund provides information about hypothetical account values and hypothetical expenses based on a Class' actual expense ratio and an assumed rate of return of 5% per year before expenses, which is not the Class' actual return. The hypothetical account values and expenses may not be used to estimate the actual ending account balance or expenses you paid for the period. You may use this information to compare the ongoing costs of investing in the Fund and other funds. To do so, compare this 5% hypothetical example with the 5% hypothetical examples that appear in the shareholder reports of the other funds. A small balance maintenance fee of $12.00 that is charged once a year may apply for certain accounts with a value of less than $2,000. This fee is not included in the table below. If it was, the estimate of expenses you paid during the period would be higher, and your ending account value lower, by this amount. In addition, the Fund, as a shareholder in the underlying Fidelity Central Funds, will indirectly bear its pro-rata share of the fees and expenses incurred by the underlying Fidelity Central Funds. These fees and expenses are not included in the Fund's annualized expense ratio used to calculate the expense estimate in the table below.
Please note that the expenses shown in the table are meant to highlight your ongoing costs only and do not reflect any transaction costs. Therefore, the second line of the table is useful in comparing ongoing costs only, and will not help you determine the relative total costs of owning different funds. In addition, if these transactional costs were included, your costs would have been higher.
Annual Report
| Annualized
Expense
Ratio | Beginning
Account Value
May 1, 2010 | Ending
Account Value
October 31, 2010 | Expenses Paid
During Period*
May 1, 2010 to
October 31, 2010 |
Class A | 1.35% | | | |
Actual | | $ 1,000.00 | $ 1,065.60 | $ 7.03 |
HypotheticalA | | $ 1,000.00 | $ 1,018.40 | $ 6.87 |
Class T | 1.59% | | | |
Actual | | $ 1,000.00 | $ 1,064.30 | $ 8.27 |
HypotheticalA | | $ 1,000.00 | $ 1,017.19 | $ 8.08 |
Class B | 2.11% | | | |
Actual | | $ 1,000.00 | $ 1,061.80 | $ 10.97 |
HypotheticalA | | $ 1,000.00 | $ 1,014.57 | $ 10.71 |
Class C | 2.11% | | | |
Actual | | $ 1,000.00 | $ 1,061.10 | $ 10.96 |
HypotheticalA | | $ 1,000.00 | $ 1,014.57 | $ 10.71 |
Global Commodity Stock | 1.05% | | | |
Actual | | $ 1,000.00 | $ 1,066.80 | $ 5.47 |
HypotheticalA | | $ 1,000.00 | $ 1,019.91 | $ 5.35 |
Institutional Class | 1.05% | | | |
Actual | | $ 1,000.00 | $ 1,066.80 | $ 5.47 |
HypotheticalA | | $ 1,000.00 | $ 1,019.91 | $ 5.35 |
A 5% return per year before expenses
* Expenses are equal to each Class' annualized expense ratio, multiplied by the average account value over the period, multiplied by 184/365 (to reflect the one-half year period).
Annual Report
Investment Changes (Unaudited)
Top Ten Stocks as of October 31, 2010 |
| % of fund's
net assets | % of fund's net assets
6 months ago |
BHP Billiton PLC | 5.5 | 4.5 |
Exxon Mobil Corp. | 4.8 | 4.7 |
Potash Corp. of Saskatchewan, Inc. | 4.1 | 2.2 |
Monsanto Co. | 2.9 | 3.8 |
Rio Tinto PLC | 2.9 | 2.3 |
Royal Dutch Shell PLC Class A (United Kingdom) | 2.8 | 2.6 |
Syngenta AG (Switzerland) | 2.6 | 2.7 |
Chevron Corp. | 2.3 | 2.5 |
Vale SA (PN-A) sponsored ADR | 2.1 | 2.1 |
Archer Daniels Midland Co. | 2.1 | 1.9 |
| 32.1 | |
Top Sectors (% of fund's net assets) |
As of October 31, 2010 |
| Agriculture 26.2% | |
 | Energy 32.8% | |
| Metals 34.6% | |
 | All Others* 6.4% | |

As of April 30, 2010 |
 | Agriculture 27.3% | |
 | Energy 35.6% | |
 | Metals 31.6% | |
| All Others* 5.5% | |

* Includes short-term investments and net other assets. |
Annual Report
Investments October 31, 2010
Showing Percentage of Net Assets
Common Stocks - 99.2% |
| Shares | | Value |
CHEMICALS - 18.5% |
Commodity Chemicals - 0.0% |
Grasim Industries Ltd. | 3,318 | | $ 174,452 |
Diversified Chemicals - 0.4% |
Dow Chemical Co. | 52,600 | | 1,621,658 |
Fertilizers & Agricultural Chemicals - 17.9% |
Agrium, Inc. | 62,300 | | 5,511,037 |
CF Industries Holdings, Inc. | 35,072 | | 4,297,372 |
China BlueChemical Ltd. (H shares) | 770,000 | | 608,947 |
Fertilizantes Fosfatados SA (PN) (a) | 7,600 | | 85,998 |
Fertilizantes Heringer SA (a) | 67,300 | | 376,614 |
Incitec Pivot Ltd. | 663,200 | | 2,416,898 |
Israel Chemicals Ltd. | 213,700 | | 3,268,699 |
Israel Corp. Ltd. (Class A) (a) | 100 | | 107,290 |
K&S AG | 59,707 | | 4,154,796 |
Makhteshim-Agan Industries | 45,000 | | 226,176 |
Monsanto Co. | 210,100 | | 12,484,142 |
Nufarm Ltd. (d) | 205,300 | | 915,106 |
Potash Corp. of Saskatchewan, Inc. | 122,400 | | 17,701,735 |
Sinofert Holdings Ltd. (a) | 1,632,000 | | 863,241 |
Sociedad Quimica y Minera de Chile SA (PN-B) sponsored ADR | 5,400 | | 279,720 |
Syngenta AG (Switzerland) | 41,272 | | 11,424,180 |
Taiwan Fertilizer Co. Ltd. | 448,000 | | 1,529,685 |
The Mosaic Co. | 65,200 | | 4,770,032 |
United Phosphorous Ltd. | 314,732 | | 1,415,140 |
Uralkali JSC GDR (Reg. S) | 62,100 | | 1,536,975 |
Yara International ASA | 80,600 | | 4,236,820 |
| | 78,210,603 |
Specialty Chemicals - 0.2% |
Innophos Holdings, Inc. | 24,000 | | 881,280 |
Johnson Matthey PLC | 2,900 | | 88,929 |
| | 970,209 |
TOTAL CHEMICALS | | 80,976,922 |
CONSTRUCTION & ENGINEERING - 0.7% |
Construction & Engineering - 0.7% |
Fluor Corp. | 32,300 | | 1,556,537 |
Foster Wheeler AG (a) | 3,500 | | 81,970 |
Granite Construction, Inc. | 11,800 | | 285,324 |
Common Stocks - continued |
| Shares | | Value |
CONSTRUCTION & ENGINEERING - CONTINUED |
Construction & Engineering - continued |
Jacobs Engineering Group, Inc. (a) | 29,600 | | $ 1,142,856 |
KBR, Inc. | 2,383 | | 60,528 |
| | 3,127,215 |
CONSTRUCTION MATERIALS - 0.5% |
Construction Materials - 0.5% |
HeidelbergCement AG | 39,612 | | 2,071,614 |
Martin Marietta Materials, Inc. | 1,100 | | 88,528 |
| | 2,160,142 |
CONTAINERS & PACKAGING - 0.3% |
Paper Packaging - 0.3% |
Rock-Tenn Co. Class A | 21,900 | | 1,245,015 |
ELECTRICAL EQUIPMENT - 0.1% |
Electrical Components & Equipment - 0.1% |
Regal-Beloit Corp. | 9,202 | | 531,047 |
ENERGY EQUIPMENT & SERVICES - 2.1% |
Oil & Gas Drilling - 0.7% |
Ensco International Ltd. ADR | 16,600 | | 769,244 |
Noble Corp. | 28,500 | | 984,105 |
Transocean Ltd. (a) | 7,000 | | 443,520 |
Trinidad Drilling Ltd. | 28,600 | | 143,014 |
Vantage Drilling Co. (a) | 334,200 | | 574,824 |
| | 2,914,707 |
Oil & Gas Equipment & Services - 1.4% |
Aker Solutions ASA | 19,200 | | 292,294 |
Baker Hughes, Inc. | 17,480 | | 809,848 |
Fugro NV (Certificaten Van Aandelen) unit | 1,100 | | 77,800 |
Halliburton Co. | 48,400 | | 1,542,024 |
ION Geophysical Corp. (a) | 300,700 | | 1,470,423 |
National Oilwell Varco, Inc. | 1,400 | | 75,264 |
Saipem SpA | 27,278 | | 1,211,934 |
Schlumberger Ltd. | 6,500 | | 454,285 |
Technip SA | 800 | | 67,224 |
Wellstream Holdings PLC | 31,400 | | 372,276 |
| | 6,373,372 |
TOTAL ENERGY EQUIPMENT & SERVICES | | 9,288,079 |
Common Stocks - continued |
| Shares | | Value |
FOOD PRODUCTS - 4.7% |
Agricultural Products - 4.2% |
Archer Daniels Midland Co. | 273,800 | | $ 9,123,016 |
Bunge Ltd. | 25,800 | | 1,549,806 |
Chaoda Modern Agriculture (Holdings) Ltd. | 594,000 | | 484,319 |
China Agri-Industries Holding Ltd. | 1,150,000 | | 1,673,537 |
China Green (Holdings) Ltd. | 300,000 | | 307,692 |
Golden Agri-Resources Ltd. | 2,306,000 | | 1,158,078 |
IOI Corp. Bhd | 223,606 | | 418,318 |
Kuala Lumpur Kepong Bhd | 27,000 | | 171,842 |
Origin Agritech Ltd. (a) | 40,410 | | 351,971 |
PPB Group Bhd | 124,300 | | 767,136 |
Viterra, Inc. (a) | 18,300 | | 175,302 |
Wilmar International Ltd. | 483,000 | | 2,388,318 |
| | 18,569,335 |
Packaged Foods & Meats - 0.5% |
China Yurun Food Group Ltd. | 71,000 | | 276,168 |
Cosan Ltd. Class A | 63,100 | | 829,765 |
MHP SA GDR (Reg. S) (a) | 51,400 | | 812,120 |
Tingyi (Cayman Islands) Holding Corp. | 32,000 | | 87,109 |
| | 2,005,162 |
TOTAL FOOD PRODUCTS | | 20,574,497 |
INDUSTRIAL CONGLOMERATES - 0.2% |
Industrial Conglomerates - 0.2% |
Keppel Corp. Ltd. | 110,000 | | 848,180 |
MACHINERY - 0.9% |
Construction & Farm Machinery & Heavy Trucks - 0.8% |
Bucyrus International, Inc. Class A | 5,300 | | 361,248 |
Caterpillar, Inc. | 1,100 | | 86,460 |
Cummins, Inc. | 10,700 | | 942,670 |
Deere & Co. | 1,100 | | 84,480 |
Jain Irrigation Systems Ltd. | 162,100 | | 848,442 |
Komatsu Ltd. | 32,000 | | 782,126 |
PT United Tractors Tbk | 62,500 | | 155,245 |
Weichai Power Co. Ltd. (H Shares) | 9,000 | | 118,200 |
| | 3,378,871 |
Common Stocks - continued |
| Shares | | Value |
MACHINERY - CONTINUED |
Industrial Machinery - 0.1% |
Duoyuan Global Water, Inc. ADR (a)(d) | 46,000 | | $ 575,460 |
TOTAL MACHINERY | | 3,954,331 |
METALS & MINING - 34.6% |
Aluminum - 0.4% |
Alcoa, Inc. | 119,200 | | 1,565,096 |
Diversified Metals & Mining - 15.6% |
African Rainbow Minerals Ltd. | 42,400 | | 1,081,692 |
Anglo American PLC (United Kingdom) | 166,151 | | 7,741,062 |
Antofagasta PLC | 17,500 | | 370,657 |
BHP Billiton PLC | 683,416 | | 24,206,989 |
Eramet SA | 222 | | 76,932 |
Eurasian Natural Resources Corp. PLC | 46,500 | | 648,522 |
First Quantum Minerals Ltd. | 13,800 | | 1,208,430 |
Freeport-McMoRan Copper & Gold, Inc. | 49,300 | | 4,667,724 |
Grupo Mexico SA de CV Series B | 92,082 | | 302,777 |
HudBay Minerals, Inc. | 12,200 | | 192,588 |
Ivanhoe Australia Ltd. (a) | 50,000 | | 155,764 |
Ivanhoe Mines Ltd. (a) | 11,000 | | 263,379 |
Jiangxi Copper Co. Ltd. (H Shares) | 40,000 | | 111,466 |
Kazakhmys PLC | 75,400 | | 1,589,756 |
Mitsubishi Materials Corp. (a) | 119,000 | | 372,528 |
Mongolian Mining Corp. | 442,000 | | 478,423 |
OJSC MMC Norilsk Nickel sponsored ADR | 102,500 | | 1,911,625 |
Rio Tinto PLC | 191,987 | | 12,468,050 |
Southern Copper Corp. | 2,100 | | 89,880 |
Sterlite Industries (India) Ltd. | 173,488 | | 665,507 |
Sumitomo Metal Mining Co. Ltd. | 42,000 | | 668,359 |
Teck Resources Ltd. Class B (sub. vtg.) | 57,700 | | 2,579,782 |
Vedanta Resources PLC | 11,800 | | 392,286 |
Walter Energy, Inc. | 12,900 | | 1,134,684 |
Xstrata PLC | 245,891 | | 4,764,877 |
| | 68,143,739 |
Gold - 9.0% |
Agnico-Eagle Mines Ltd.: | | | |
(Canada) | 27,500 | | 2,132,807 |
(United States) | 100 | | 7,759 |
AngloGold Ashanti Ltd. sponsored ADR | 78,800 | | 3,712,268 |
Barrick Gold Corp. | 149,600 | | 7,204,973 |
Common Stocks - continued |
| Shares | | Value |
METALS & MINING - CONTINUED |
Gold - continued |
Eldorado Gold Corp. | 28,000 | | $ 474,125 |
Franco-Nevada Corp. | 9,800 | | 338,037 |
Gold Fields Ltd. sponsored ADR | 75,300 | | 1,187,481 |
Goldcorp, Inc. | 154,500 | | 6,898,647 |
Harmony Gold Mining Co. Ltd. sponsored ADR | 39,100 | | 451,214 |
IAMGOLD Corp. | 71,100 | | 1,297,354 |
Kinross Gold Corp. | 180,205 | | 3,242,241 |
Kinross Gold Corp. warrants 9/17/14 (a) | 2,772 | | 11,388 |
Newcrest Mining Ltd. | 118,138 | | 4,624,726 |
Newmont Mining Corp. | 59,600 | | 3,627,852 |
Polyus Gold OJSC sponsored ADR | 11,000 | | 328,900 |
Randgold Resources Ltd. sponsored ADR | 27,000 | | 2,535,840 |
Royal Gold, Inc. | 3,000 | | 148,530 |
Yamana Gold, Inc. | 99,700 | | 1,096,808 |
Zijin Mining Group Co. Ltd. (H Shares) | 92,000 | | 86,763 |
| | 39,407,713 |
Precious Metals & Minerals - 1.2% |
Anglo Platinum Ltd. (a) | 5,800 | | 573,786 |
Aquarius Platinum Ltd. (United Kingdom) | 104,000 | | 600,345 |
Compania de Minas Buenaventura SA sponsored ADR | 5,700 | | 302,328 |
Impala Platinum Holdings Ltd. | 48,900 | | 1,382,174 |
Lonmin PLC (a) | 4,922 | | 137,922 |
Northam Platinum Ltd. | 20,900 | | 144,554 |
Pan American Silver Corp. | 11,100 | | 354,312 |
Polymetal JSC GDR (Reg. S) (a) | 15,700 | | 248,060 |
Silver Standard Resources, Inc. (a) | 16,000 | | 388,480 |
Silver Wheaton Corp. (a) | 31,400 | | 902,685 |
| | 5,034,646 |
Steel - 8.4% |
Allegheny Technologies, Inc. | 1,400 | | 73,766 |
ArcelorMittal SA Class A unit (d) | 108,200 | | 3,503,516 |
Atlas Iron Ltd. (a) | 36,000 | | 88,521 |
BlueScope Steel Ltd. | 491,649 | | 960,880 |
Carpenter Technology Corp. | 30,300 | | 1,080,498 |
China Steel Corp. | 33,819 | | 34,311 |
Cliffs Natural Resources, Inc. | 3,400 | | 221,680 |
Commercial Metals Co. | 54,000 | | 749,520 |
Companhia Siderurgica Nacional SA (CSN) | 9,900 | | 164,399 |
Gerdau SA sponsored ADR (d) | 31,300 | | 408,152 |
JFE Holdings, Inc. | 74,200 | | 2,313,892 |
Common Stocks - continued |
| Shares | | Value |
METALS & MINING - CONTINUED |
Steel - continued |
Jindal Steel & Power Ltd. | 57,871 | | $ 910,726 |
JSW Steel Ltd. | 11,131 | | 336,994 |
Kobe Steel Ltd. | 231,000 | | 507,684 |
Maanshan Iron & Steel Co. Ltd. (H Shares) | 1,136,000 | | 650,713 |
Magnitogorsk Iron & Steel Works OJSC unit (a) | 6,500 | | 81,250 |
Maruichi Steel Tube Ltd. | 13,000 | | 257,351 |
Mechel Steel Group OAO sponsored ADR | 16,000 | | 376,800 |
Nippon Steel Corp. | 570,000 | | 1,791,580 |
Novolipetsk Steel Ojsc | 4,500 | | 154,035 |
Nucor Corp. | 27,700 | | 1,058,694 |
OneSteel Ltd. | 142,793 | | 377,695 |
POSCO | 8,607 | | 3,554,719 |
Reliance Steel & Aluminum Co. | 33,200 | | 1,389,420 |
Salzgitter AG | 3,225 | | 231,506 |
Sumitomo Metal Industries Ltd. | 578,000 | | 1,341,528 |
Tata Steel Ltd. | 24,147 | | 321,088 |
Ternium SA sponsored ADR | 4,600 | | 157,688 |
Thyssenkrupp AG | 10,000 | | 367,899 |
Tokyo Steel Manufacturing Co. Ltd. | 9,500 | | 94,209 |
United States Steel Corp. (d) | 28,400 | | 1,215,236 |
Vale SA (PN-A) sponsored ADR | 326,000 | | 9,365,980 |
Voestalpine AG | 29,400 | | 1,165,282 |
Yamato Kogyo Co. Ltd. | 58,000 | | 1,487,660 |
| | 36,794,872 |
TOTAL METALS & MINING | | 150,946,066 |
OIL, GAS & CONSUMABLE FUELS - 30.7% |
Coal & Consumable Fuels - 1.6% |
Alpha Natural Resources, Inc. (a) | 41,505 | | 1,874,781 |
Arch Coal, Inc. | 24,000 | | 590,160 |
Banpu PCL (For. Reg.) | 7,700 | | 199,058 |
China Coal Energy Co. Ltd. (H Shares) | 146,000 | | 252,398 |
China Shenhua Energy Co. Ltd. (H Shares) | 72,500 | | 322,690 |
Cloud Peak Energy, Inc. | 22,100 | | 383,877 |
CONSOL Energy, Inc. | 15,900 | | 584,484 |
Massey Energy Co. | 42,600 | | 1,792,182 |
Paladin Energy Ltd. (a) | 21,511 | | 86,400 |
Peabody Energy Corp. | 14,800 | | 782,920 |
Common Stocks - continued |
| Shares | | Value |
OIL, GAS & CONSUMABLE FUELS - CONTINUED |
Coal & Consumable Fuels - continued |
PT Bumi Resources Tbk | 684,000 | | $ 170,282 |
Uranium One, Inc. (a) | 22,400 | | 91,585 |
| | 7,130,817 |
Integrated Oil & Gas - 21.3% |
BG Group PLC | 222,057 | | 4,324,368 |
BP PLC | 1,159,800 | | 7,882,370 |
Cenovus Energy, Inc. | 4,500 | | 125,218 |
Chevron Corp. | 122,300 | | 10,103,203 |
China Petroleum & Chemical Corp. (H Shares) | 597,000 | | 568,024 |
ConocoPhillips | 22,000 | | 1,306,800 |
Ecopetrol SA ADR | 2,000 | | 95,480 |
ENI SpA | 156,727 | | 3,528,187 |
Exxon Mobil Corp. | 312,361 | | 20,762,636 |
Hess Corp. | 8,100 | | 510,543 |
Imperial Oil Ltd. | 11,600 | | 446,075 |
InterOil Corp. (a)(d) | 6,800 | | 484,024 |
Lukoil Oil Co. sponsored ADR | 29,000 | | 1,619,650 |
Marathon Oil Corp. | 116,800 | | 4,154,576 |
Murphy Oil Corp. | 14,200 | | 925,272 |
OAO Gazprom sponsored ADR | 121,300 | | 2,650,405 |
Occidental Petroleum Corp. | 63,100 | | 4,961,553 |
Origin Energy Ltd. | 55,019 | | 859,156 |
Petroleo Brasileiro SA - Petrobras (PN) sponsored ADR (non-vtg.) | 173,000 | | 5,395,870 |
Repsol YPF SA | 53,241 | | 1,476,022 |
Royal Dutch Shell PLC Class A (United Kingdom) | 379,950 | | 12,333,010 |
StatoilHydro ASA | 3,900 | | 85,144 |
Suncor Energy, Inc. | 118,232 | | 3,788,432 |
Surgutneftegaz JSC sponsored ADR | 3,930 | | 38,082 |
Total SA | 81,255 | | 4,421,915 |
| | 92,846,015 |
Oil & Gas Exploration & Production - 7.2% |
Alange Energy Corp. (a) | 190,000 | | 137,857 |
Anadarko Petroleum Corp. | 39,400 | | 2,425,858 |
Apache Corp. | 21,600 | | 2,182,032 |
Berry Petroleum Co. Class A | 36,300 | | 1,241,823 |
Cairn Energy PLC (a) | 44,204 | | 273,300 |
Canadian Natural Resources Ltd. | 83,800 | | 3,050,783 |
Chesapeake Energy Corp. | 31,100 | | 674,870 |
Cimarex Energy Co. | 6,800 | | 521,900 |
Common Stocks - continued |
| Shares | | Value |
OIL, GAS & CONSUMABLE FUELS - CONTINUED |
Oil & Gas Exploration & Production - continued |
CNOOC Ltd. sponsored ADR | 8,200 | | $ 1,713,144 |
CNPC (Hong Kong) Ltd. | 50,000 | | 63,603 |
Concho Resources, Inc. (a) | 1,200 | | 82,404 |
Denbury Resources, Inc. (a) | 51,400 | | 874,828 |
Devon Energy Corp. | 13,800 | | 897,276 |
EnCana Corp. | 5,200 | | 146,889 |
EOG Resources, Inc. | 13,600 | | 1,301,792 |
Falkland Oil & Gas Ltd. (a)(d) | 216,700 | | 355,866 |
Gran Tierra Energy, Inc. (a) | 7,200 | | 53,652 |
Heritage Oil PLC | 75,500 | | 416,715 |
Japan Petroleum Exploration Co. Ltd. | 4,800 | | 183,422 |
Lundin Petroleum AB (a) | 30,000 | | 283,764 |
Mariner Energy, Inc. (a) | 19,800 | | 493,416 |
Newfield Exploration Co. (a) | 1,400 | | 83,468 |
Nexen, Inc. | 8,300 | | 176,596 |
Niko Resources Ltd. | 11,200 | | 1,068,497 |
Noble Energy, Inc. | 9,800 | | 798,504 |
Northern Oil & Gas, Inc. (a) | 47,600 | | 936,768 |
OAO NOVATEK GDR | 7,600 | | 726,940 |
OGX Petroleo e Gas Participacoes SA (a) | 5,900 | | 77,409 |
Oil & Natural Gas Corp. Ltd. | 5,222 | | 153,632 |
OPTI Canada, Inc. (a) | 1,496,600 | | 1,027,179 |
Pacific Rubiales Energy Corp. (a) | 6,300 | | 200,817 |
Painted Pony Petroleum Ltd. Class A (a) | 27,400 | | 188,595 |
PetroBakken Energy Ltd. Class A | 7,348 | | 162,248 |
Petrobank Energy & Resources Ltd. (a) | 42,100 | | 1,675,497 |
Petrohawk Energy Corp. (a) | 43,200 | | 734,832 |
Petrominerales Ltd. | 3,200 | | 81,985 |
Plains Exploration & Production Co. (a) | 1,000 | | 27,870 |
Progress Energy Resources Corp. | 23,200 | | 246,354 |
QEP Resources, Inc. | 10,900 | | 360,027 |
Rockhopper Exploration PLC (a) | 120,800 | | 616,424 |
Santos Ltd. | 31,881 | | 394,151 |
Southwestern Energy Co. (a) | 52,800 | | 1,787,280 |
Talisman Energy, Inc. | 105,000 | | 1,903,569 |
Tullow Oil PLC | 10,100 | | 191,753 |
Ultra Petroleum Corp. (a) | 5,000 | | 205,750 |
Whiting Petroleum Corp. (a) | 1,700 | | 170,748 |
| | 31,372,087 |
Common Stocks - continued |
| Shares | | Value |
OIL, GAS & CONSUMABLE FUELS - CONTINUED |
Oil & Gas Refining & Marketing - 0.6% |
Frontier Oil Corp. | 57,600 | | $ 763,200 |
Holly Corp. | 37,400 | | 1,224,102 |
Neste Oil Oyj | 3,800 | | 63,027 |
Reliance Industries Ltd. | 24,940 | | 616,818 |
Sunoco, Inc. | 4,200 | | 157,374 |
| | 2,824,521 |
TOTAL OIL, GAS & CONSUMABLE FUELS | | 134,173,440 |
PAPER & FOREST PRODUCTS - 4.1% |
Forest Products - 0.6% |
China Forestry Holdings Co. Ltd. | 988,000 | | 469,065 |
Duratex SA | 7,100 | | 81,801 |
Sino-Forest Corp. (a) | 97,000 | | 1,917,364 |
| | 2,468,230 |
Paper Products - 3.5% |
Domtar Corp. | 1,300 | | 103,168 |
Empresas CMPC SA | 1,653 | | 89,214 |
Fibria Celulose SA sponsored ADR (a)(d) | 96,589 | | 1,734,738 |
International Paper Co. | 194,100 | | 4,906,848 |
MeadWestvaco Corp. | 3,400 | | 87,482 |
Nine Dragons Paper (Holdings) Ltd. | 702,000 | | 1,132,075 |
Nippon Paper Group, Inc. | 24,300 | | 616,976 |
Oji Paper Co. Ltd. | 429,000 | | 1,978,916 |
Sappi Ltd. (a) | 61,475 | | 304,696 |
Stora Enso Oyj (R Shares) | 70,400 | | 699,421 |
Suzano Papel e Celulose SA | 46,125 | | 441,945 |
Svenska Cellulosa AB (SCA) (B Shares) | 106,500 | | 1,651,311 |
UPM-Kymmene Corp. | 108,000 | | 1,795,805 |
| | 15,542,595 |
TOTAL PAPER & FOREST PRODUCTS | | 18,010,825 |
REAL ESTATE INVESTMENT TRUSTS - 0.9% |
Specialized REITs - 0.9% |
Rayonier, Inc. | 8,200 | | 428,040 |
Weyerhaeuser Co. | 218,485 | | 3,543,827 |
| | 3,971,867 |
Common Stocks - continued |
| Shares | | Value |
ROAD & RAIL - 0.1% |
Railroads - 0.1% |
CSX Corp. | 8,800 | | $ 540,760 |
SPECIALTY RETAIL - 0.3% |
Specialty Stores - 0.3% |
Tsutsumi Jewelry Co. Ltd. | 45,300 | | 1,066,776 |
TRADING COMPANIES & DISTRIBUTORS - 0.4% |
Trading Companies & Distributors - 0.4% |
Adani Enterprises Ltd. | 6,000 | | 95,357 |
Kloeckner & Co. AG (a) | 15,374 | | 340,135 |
Mills Estruturas e Servicos de Engenharia SA (a) | 20,000 | | 241,359 |
Noble Group Ltd. | 566,090 | | 813,511 |
| | 1,490,362 |
TRANSPORTATION INFRASTRUCTURE - 0.1% |
Highways & Railtracks - 0.1% |
Ecorodovias Infraestrutura e Logistica SA (a) | 24,100 | | 182,747 |
TOTAL COMMON STOCKS (Cost $384,228,881) | 433,088,271 |
Money Market Funds - 2.8% |
| | | |
Fidelity Cash Central Fund, 0.23% (b) | 6,054,985 | | 6,054,985 |
Fidelity Securities Lending Cash Central Fund, 0.24% (b)(c) | 6,183,336 | | 6,183,336 |
TOTAL MONEY MARKET FUNDS (Cost $12,238,321) | 12,238,321 |
TOTAL INVESTMENT PORTFOLIO - 102.0% (Cost $396,467,202) | | 445,326,592 |
NET OTHER ASSETS (LIABILITIES) - (2.0)% | | (8,583,437) |
NET ASSETS - 100% | $ 436,743,155 |
Legend |
(a) Non-income producing |
(b) Affiliated fund that is available only to investment companies and other accounts managed by Fidelity Investments. The rate quoted is the annualized seven-day yield of the fund at period end. A complete unaudited listing of the fund's holdings as of its most recent quarter end is available upon request. In addition, each Fidelity Central Fund's financial statements, which are not covered by the Fund's report of Independent Registered Public Accounting Firm, are available on the SEC's website or upon request. |
(c) Investment made with cash collateral received from securities on loan. |
(d) Security or a portion of the security is on loan at period end. |
Affiliated Central Funds |
Information regarding fiscal year to date income earned by the Fund from investments in Fidelity Central Funds is as follows: |
Fund | Income earned |
Fidelity Cash Central Fund | $ 10,925 |
Fidelity Securities Lending Cash Central Fund | 89,586 |
Total | $ 100,511 |
Other Information |
The following is a summary of the inputs used, as of October 31, 2010, involving the Fund's assets and liabilities carried at fair value. The inputs or methodology used for valuing securities may not be an indication of the risk associated with investing in those securities. For more information on valuation inputs, and their aggregation into the levels used in the tables below, please refer to the Security Valuation section in the accompanying Notes to Financial Statements. |
Valuation Inputs at Reporting Date: |
Description | Total | Level 1 | Level 2 | Level 3 |
Investments in Securities: | | | | |
Common Stocks | $ 433,088,271 | $ 352,259,123 | $ 80,829,148 | $ - |
Money Market Funds | 12,238,321 | 12,238,321 | - | - |
Total Investments in Securities: | $ 445,326,592 | $ 364,497,444 | $ 80,829,148 | $ - |
Other Information - continued |
The following is a reconciliation of Investments in Securities for which Level 3 inputs were used in determining value: |
Investments in Securities: | |
Beginning Balance | $ 65,806 |
Total Realized Gain (Loss) | 69,126 |
Total Unrealized Gain (Loss) | (9,563) |
Cost of Purchases | 55,134 |
Proceeds of Sales | (180,503) |
Amortization/Accretion | - |
Transfers in to Level 3 | - |
Transfers out of Level 3 | - |
Ending Balance | $ - |
The change in unrealized gain (loss) for the period attributable to Level 3 securities held at October 31, 2010 | $ - |
The information used in the above reconciliation represents fiscal year to date activity for any Investments in Securities identified as using Level 3 inputs at either the beginning or the end of the current fiscal period. Transfers in or out of Level 3 represent the beginning value of any Security or Instrument where a change in the pricing level occurred from the beginning to the end of the period. The cost of purchases and the proceeds of sales may include securities received or delivered through corporate actions or exchanges. Realized and unrealized gains (losses) disclosed in the reconciliation are included in Net Gain (Loss) on the Fund's Statement of Operations. |
Distribution of investments by country of issue, as a percentage of total net assets, is as follows: (Unaudited) |
United States of America | 32.1% |
United Kingdom | 18.2% |
Canada | 16.0% |
Brazil | 4.2% |
Japan | 3.0% |
Switzerland | 2.9% |
Australia | 2.5% |
Russia | 2.3% |
South Africa | 1.9% |
Germany | 1.7% |
Bermuda | 1.3% |
India | 1.1% |
Italy | 1.1% |
Norway | 1.1% |
France | 1.0% |
Luxembourg | 1.0% |
Others (Individually Less Than 1%) | 8.6% |
| 100.0% |
See accompanying notes which are an integral part of the financial statements.
Annual Report
Statement of Assets and Liabilities
| October 31, 2010 |
| | |
Assets | | |
Investment in securities, at value (including securities loaned of $6,035,071) - See accompanying schedule: Unaffiliated issuers (cost $384,228,881) | $ 433,088,271 | |
Fidelity Central Funds (cost $12,238,321) | 12,238,321 | |
Total Investments (cost $396,467,202) | | $ 445,326,592 |
Foreign currency held at value (cost $1,064) | | 1,049 |
Receivable for investments sold | | 4,050,412 |
Receivable for fund shares sold | | 1,637,236 |
Dividends receivable | | 365,521 |
Distributions receivable from Fidelity Central Funds | | 3,807 |
Other receivables | | 8,763 |
Total assets | | 451,393,380 |
| | |
Liabilities | | |
Payable for investments purchased | $ 7,445,387 | |
Payable for fund shares redeemed | 520,792 | |
Accrued management fee | 247,232 | |
Distribution and service plan fees payable | 31,885 | |
Other affiliated payables | 96,299 | |
Other payables and accrued expenses | 125,294 | |
Collateral on securities loaned, at value | 6,183,336 | |
Total liabilities | | 14,650,225 |
| | |
Net Assets | | $ 436,743,155 |
Net Assets consist of: | | |
Paid in capital | | $ 387,323,136 |
Undistributed net investment income | | 4,074,073 |
Accumulated undistributed net realized gain (loss) on investments and foreign currency transactions | | (3,442,191) |
Net unrealized appreciation (depreciation) on investments and assets and liabilities in foreign currencies | | 48,788,137 |
Net Assets | | $ 436,743,155 |
See accompanying notes which are an integral part of the financial statements.
Annual Report
Financial Statements - continued
Statement of Assets and Liabilities - continued
| October 31, 2010 |
| | |
Calculation of Maximum Offering Price
Class A:
Net Asset Value and redemption price per share ($60,369,831 ÷ 3,869,054 shares) | | $ 15.60 |
| | |
Maximum offering price per share (100/94.25 of $15.60) | | $ 16.55 |
Class T:
Net Asset Value and redemption price per share ($11,762,486 ÷ 756,241 shares) | | $ 15.55 |
| | |
Maximum offering price per share (100/96.50 of $15.55) | | $ 16.11 |
Class B:
Net Asset Value and offering price per share ($4,348,164 ÷ 281,298 shares)A | | $ 15.46 |
| | |
Class C:
Net Asset Value and offering price per share ($14,337,610 ÷ 927,787 shares)A | | $ 15.45 |
| | |
| | |
Global Commodity Stock:
Net Asset Value, offering price and redemption price per share ($310,186,006 ÷ 19,806,577 shares) | | $ 15.66 |
| | |
Institutional Class:
Net Asset Value, offering price and redemption price per share ($35,739,058 ÷ 2,281,918 shares) | | $ 15.66 |
A Redemption price per share is equal to net asset value less any applicable contingent deferred sales charge.
See accompanying notes which are an integral part of the financial statements.
Annual Report
Statement of Operations
| Year ended October 31, 2010 |
| | |
Investment Income | | |
Dividends | | $ 6,484,153 |
Special dividends | | 3,210,012 |
Interest | | 2 |
Income from Fidelity Central Funds | | 100,511 |
Income before foreign taxes withheld | | 9,794,678 |
Less foreign taxes withheld | | (414,094) |
Total income | | 9,380,584 |
| | |
Expenses | | |
Management fee | $ 2,448,315 | |
Transfer agent fees | 859,170 | |
Distribution and service plan fees | 299,224 | |
Accounting and security lending fees | 179,820 | |
Custodian fees and expenses | 137,701 | |
Independent trustees' compensation | 1,830 | |
Registration fees | 149,234 | |
Audit | 52,141 | |
Legal | 1,176 | |
Interest | 920 | |
Miscellaneous | 2,271 | |
Total expenses before reductions | 4,131,802 | |
Expense reductions | (41,295) | 4,090,507 |
Net investment income (loss) | | 5,290,077 |
Realized and Unrealized Gain (Loss) Net realized gain (loss) on: | | |
Investment securities: | | |
Unaffiliated issuers (net of foreign taxes of $9,801) | (2,524,423) | |
Foreign currency transactions | (119,006) | |
Total net realized gain (loss) | | (2,643,429) |
Change in net unrealized appreciation (depreciation) on: Investment securities (net of increase in deferred foreign taxes of $72,455) | 40,352,125 | |
Assets and liabilities in foreign currencies | 4,035 | |
Total change in net unrealized appreciation (depreciation) | | 40,356,160 |
Net gain (loss) | | 37,712,731 |
Net increase (decrease) in net assets resulting from operations | | $ 43,002,808 |
See accompanying notes which are an integral part of the financial statements.
Annual Report
Financial Statements - continued
Statement of Changes in Net Assets
| Year ended
October 31, 2010 | For the period
March 25, 2009
(commencement of
operations) to
October 31, 2009 |
Increase (Decrease) in Net Assets | | |
Operations | | |
Net investment income (loss) | $ 5,290,077 | $ 14,516 |
Net realized gain (loss) | (2,643,429) | 1,187,329 |
Change in net unrealized appreciation (depreciation) | 40,356,160 | 8,431,977 |
Net increase (decrease) in net assets resulting
from operations | 43,002,808 | 9,633,822 |
Distributions to shareholders from net investment income | (188,424) | - |
Distributions to shareholders from net realized gain | (1,358,291) | - |
Total distributions | (1,546,715) | - |
Share transactions - net increase (decrease) | 198,095,255 | 187,451,591 |
Redemption fees | 48,090 | 58,304 |
Total increase (decrease) in net assets | 239,599,438 | 197,143,717 |
| | |
Net Assets | | |
Beginning of period | 197,143,717 | - |
End of period (including undistributed net investment income of $4,074,073 and undistributed net investment income of $13,431, respectively) | $ 436,743,155 | $ 197,143,717 |
See accompanying notes which are an integral part of the financial statements.
Annual Report
Financial Highlights - Class A
Years ended October 31, | 2010 | 2009 H |
Selected Per-Share Data | | |
Net asset value, beginning of period | $ 13.29 | $ 10.00 |
Income from Investment Operations | | |
Net investment income (loss) E | .19 K | (.01) |
Net realized and unrealized gain (loss) | 2.20 | 3.29 |
Total from investment operations | 2.39 | 3.28 |
Distributions from net investment income | - J | - |
Distributions from net realized gain | (.08) | - |
Total distributions | (.08) | - |
Redemption fees added to paid in capital E | - J | .01 |
Net asset value, end of period | $ 15.60 | $ 13.29 |
Total ReturnB,C,D | 18.04% | 32.90% |
Ratios to Average Net AssetsF,I | | |
Expenses before reductions | 1.37% | 1.65% A |
Expenses net of fee waivers, if any | 1.37% | 1.50%A |
Expenses net of all reductions | 1.36% | 1.48%A |
Net investment income (loss) | 1.35% K | (.15)%A |
Supplemental Data | | |
Net assets, end of period (000 omitted) | $ 60,370 | $ 15,705 |
Portfolio turnover rateG | 54% | 25%A |
A Annualized
B Total returns for periods of less than one year are not annualized.
C Total returns would have been lower had certain expenses not been reduced during the periods shown.
D Total returns do not include the effect of the sales charges.
E Calculated based on average shares outstanding during the period.
F Fees and expenses of the underlying Fidelity Central Funds are not included in the Fund's expense ratio. The Fund indirectly bears its proportionate share of the expenses of any underlying Fidelity Central Funds.
G Amount does not include the portfolio activity of any underlying Fidelity Central Funds.
H For the period March 25, 2009 (commencement of operations) to October 31, 2009.
I Expense ratios reflect operating expenses of the class. Expenses before reductions do not reflect amounts reimbursed by the investment adviser or reductions from brokerage service arrangements or reductions from other expense offset arrangements and do not represent the amount paid by the class during periods when reimbursements or reductions occur. Expense ratios before reductions for start-up periods may not be representative of longer-term operating periods. Expenses net of fee waivers reflect expenses after reimbursement by the investment adviser but prior to reductions from brokerage service arrangements or other expense offset arrangements. Expenses net of all reductions represent the net expenses paid by the class.
J Amount represents less than $.01 per share.
K Investment income per share reflects a special dividend which amounted to $.13 per share. Excluding the special dividend, the ratio of net investment income (loss) to average net assets would have been .42%.
See accompanying notes which are an integral part of the financial statements.
Annual Report
Financial Highlights - Class T
Years ended October 31, | 2010 | 2009 H |
Selected Per-Share Data | | |
Net asset value, beginning of period | $ 13.27 | $ 10.00 |
Income from Investment Operations | | |
Net investment income (loss) E | .16 K | (.03) |
Net realized and unrealized gain (loss) | 2.19 | 3.29 |
Total from investment operations | 2.35 | 3.26 |
Distributions from net realized gain | (.07) | - |
Redemption fees added to paid in capital E | - J | .01 |
Net asset value, end of period | $ 15.55 | $ 13.27 |
Total Return B,C,D | 17.73% | 32.70% |
Ratios to Average Net Assets F,I | | |
Expenses before reductions | 1.63% | 2.04% A |
Expenses net of fee waivers, if any | 1.63% | 1.75% A |
Expenses net of all reductions | 1.61% | 1.73% A |
Net investment income (loss) | 1.10% K | (.40)% A |
Supplemental Data | | |
Net assets, end of period (000 omitted) | $ 11,762 | $ 4,665 |
Portfolio turnover rate G | 54% | 25% A |
A Annualized
B Total returns for periods of less than one year are not annualized.
C Total returns would have been lower had certain expenses not been reduced during the periods shown.
D Total returns do not include the effect of the sales charges.
E Calculated based on average shares outstanding during the period.
F Fees and expenses of the underlying Fidelity Central Funds are not included in the Fund's expense ratio. The Fund indirectly bears its proportionate share of the expenses of any underlying Fidelity Central Funds.
G Amount does not include the portfolio activity of any underlying Fidelity Central Funds.
H For the period March 25, 2009 (commencement of operations) to October 31, 2009.
I Expense ratios reflect operating expenses of the class. Expenses before reductions do not reflect amounts reimbursed by the investment adviser or reductions from brokerage service arrangements or reductions from other expense offset arrangements and do not represent the amount paid by the class during periods when reimbursements or reductions occur. Expense ratios before reductions for start-up periods may not be representative of longer-term operating periods. Expenses net of fee waivers reflect expenses after reimbursement by the investment adviser but prior to reductions from brokerage service arrangements or other expense offset arrangements. Expenses net of all reductions represent the net expenses paid by the class.
J Amount represents less than $.01 per share.
K Investment income per share reflects a special dividend which amounted to $.13 per share. Excluding the special dividend, the ratio of net investment income (loss) to average net assets would have been .17%.
See accompanying notes which are an integral part of the financial statements.
Annual Report
Financial Highlights - Class B
Years ended October 31, | 2010 | 2009 H |
Selected Per-Share Data | | |
Net asset value, beginning of period | $ 13.22 | $ 10.00 |
Income from Investment Operations | | |
Net investment income (loss) E | .08 K | (.07) |
Net realized and unrealized gain (loss) | 2.20 | 3.28 |
Total from investment operations | 2.28 | 3.21 |
Distributions from net realized gain | (.04) | - |
Redemption fees added to paid in capital E | - J | .01 |
Net asset value, end of period | $ 15.46 | $ 13.22 |
Total Return B,C,D | 17.23% | 32.20% |
Ratios to Average Net Assets F,I | | |
Expenses before reductions | 2.16% | 2.66% A |
Expenses net of fee waivers, if any | 2.16% | 2.25% A |
Expenses net of all reductions | 2.15% | 2.23% A |
Net investment income (loss) | .56% K | (.90)% A |
Supplemental Data | | |
Net assets, end of period (000 omitted) | $ 4,348 | $ 2,726 |
Portfolio turnover rate G | 54% | 25% A |
A Annualized
B Total returns for periods of less than one year are not annualized.
C Total returns would have been lower had certain expenses not been reduced during the periods shown.
D Total returns do not include the effect of the contingent deferred sales charge.
E Calculated based on average shares outstanding during the period.
F Fees and expenses of the underlying Fidelity Central Funds are not included in the Fund's expense ratio. The Fund indirectly bears its proportionate share of the expenses of any underlying Fidelity Central Funds.
G Amount does not include the portfolio activity of any underlying Fidelity Central Funds.
H For the period March 25, 2009 (commencement of operations) to October 31, 2009.
I Expense ratios reflect operating expenses of the class. Expenses before reductions do not reflect amounts reimbursed by the investment adviser or reductions from brokerage service arrangements or reductions from other expense offset arrangements and do not represent the amount paid by the class during periods when reimbursements or reductions occur. Expense ratios before reductions for start-up periods may not be representative of longer-term operating periods. Expenses net of fee waivers reflect expenses after reimbursement by the investment adviser but prior to reductions from brokerage service arrangements or other expense offset arrangements. Expenses net of all reductions represent the net expenses paid by the class.
J Amount represents less than $.01 per share.
K Investment income per share reflects a special dividend which amounted to $.13 per share. Excluding the special dividend, the ratio of net investment income (loss) to average net assets would have been (.37)%.
See accompanying notes which are an integral part of the financial statements.
Annual Report
Financial Highlights - Class C
Years ended October 31, | 2010 | 2009 H |
Selected Per-Share Data | | |
Net asset value, beginning of period | $ 13.22 | $ 10.00 |
Income from Investment Operations | | |
Net investment income (loss) E | .08 K | (.07) |
Net realized and unrealized gain (loss) | 2.19 | 3.28 |
Total from investment operations | 2.27 | 3.21 |
Distributions from net realized gain | (.04) | - |
Redemption fees added to paid in capital E | - J | .01 |
Net asset value, end of period | $ 15.45 | $ 13.22 |
Total Return B,C,D | 17.21% | 32.20% |
Ratios to Average Net Assets F,I | | |
Expenses before reductions | 2.14% | 2.53% A |
Expenses net of fee waivers, if any | 2.14% | 2.25% A |
Expenses net of all reductions | 2.13% | 2.23% A |
Net investment income (loss) | .58% K | (.90)% A |
Supplemental Data | | |
Net assets, end of period (000 omitted) | $ 14,338 | $ 4,798 |
Portfolio turnover rate G | 54% | 25% A |
A Annualized
B Total returns for periods of less than one year are not annualized.
C Total returns would have been lower had certain expenses not been reduced during the periods shown.
D Total returns do not include the effect of the contingent deferred sales charge.
E Calculated based on average shares outstanding during the period.
F Fees and expenses of the underlying Fidelity Central Funds are not included in the Fund's expense ratio. The Fund indirectly bears its proportionate share of the expenses of any underlying Fidelity Central Funds.
G Amount does not include the portfolio activity of any underlying Fidelity Central Funds.
H For the period March 25, 2009 (commencement of operations) to October 31, 2009.
I Expense ratios reflect operating expenses of the class. Expenses before reductions do not reflect amounts reimbursed by the investment adviser or reductions from brokerage service arrangements or reductions from other expense offset arrangements and do not represent the amount paid by the class during periods when reimbursements or reductions occur. Expense ratios before reductions for start-up periods may not be representative of longer-term operating periods. Expenses net of fee waivers reflect expenses after reimbursement by the investment adviser but prior to reductions from brokerage service arrangements or other expense offset arrangements. Expenses net of all reductions represent the net expenses paid by the class.
J Amount represents less than $.01 per share.
K Investment income per share reflects a special dividend which amounted to $.13 per share. Excluding the special dividend, the ratio of net investment income (loss) to average net assets would have been (.34)%.
See accompanying notes which are an integral part of the financial statements.
Annual Report
Financial Highlights - Global Commodity Stock
Years ended October 31, | 2010 | 2009 G |
Selected Per-Share Data | | |
Net asset value, beginning of period | $ 13.31 | $ 10.00 |
Income from Investment Operations | | |
Net investment income (loss)D | .23 J | .01 |
Net realized and unrealized gain (loss) | 2.21 | 3.29 |
Total from investment operations | 2.44 | 3.30 |
Distributions from net investment income | (.01) | - |
Distributions from net realized gain | (.08) | - |
Total distributions | (.09) | - |
Redemption fees added to paid in capitalD | -I | .01 |
Net asset value, end of period | $ 15.66 | $ 13.31 |
Total ReturnB,C | 18.38% | 33.10% |
Ratios to Average Net AssetsE,H | | |
Expenses before reductions | 1.10% | 1.42%A |
Expenses net of fee waivers, if any | 1.10% | 1.25%A |
Expenses net of all reductions | 1.09% | 1.23%A |
Net investment income (loss) | 1.62% J | .10%A |
Supplemental Data | | |
Net assets, end of period (000 omitted) | $ 310,186 | $ 159,439 |
Portfolio turnover rateF | 54% | 25%A |
A Annualized
B Total returns for periods of less than one year are not annualized.
C Total returns would have been lower had certain expenses not been reduced during the periods shown.
D Calculated based on average shares outstanding during the period.
E Fees and expenses of the underlying Fidelity Central Funds are not included in the Fund's expense ratio. The Fund indirectly bears its proportionate share of the expenses of any underlying Fidelity Central Funds.
F Amount does not include the portfolio activity of any underlying Fidelity Central Funds.
G For the period March 25, 2009 (commencement of operations) to October 31, 2009.
H Expense ratios reflect operating expenses of the class. Expenses before reductions do not reflect amounts reimbursed by the investment adviser or reductions from brokerage service arrangements or reductions from other expense offset arrangements and do not represent the amount paid by the class during periods when reimbursements or reductions occur. Expense ratios before reductions for start-up periods may not be representative of longer-term operating periods. Expenses net of fee waivers reflect expenses after reimbursement by the investment adviser but prior to reductions from brokerage service arrangements or other expense offset arrangements. Expenses net of all reductions represent the net expenses paid by the class.
I Amount represents less than $.01 per share.
J Investment income per share reflects a special dividend which amounted to $.13 per share. Excluding the special dividend, the ratio of net investment income (loss) to average net assets would have been .69%.
See accompanying notes which are an integral part of the financial statements.
Annual Report
Financial Highlights - Institutional Class
Years ended October 31, | 2010 | 2009 G |
Selected Per-Share Data | | |
Net asset value, beginning of period | $ 13.31 | $ 10.00 |
Income from Investment Operations | | |
Net investment income (loss) D | .23 J | .01 |
Net realized and unrealized gain (loss) | 2.21 | 3.29 |
Total from investment operations | 2.44 | 3.30 |
Distributions from net investment income | (.01) | - |
Distributions from net realized gain | (.08) | - |
Total distributions | (.09) | - |
Redemption fees added to paid in capital D | - I | .01 |
Net asset value, end of period | $ 15.66 | $ 13.31 |
Total Return B,C | 18.39% | 33.10% |
Ratios to Average Net Assets E,H | | |
Expenses before reductions | 1.09% | 1.36% A |
Expenses net of fee waivers, if any | 1.09% | 1.25% A |
Expenses net of all reductions | 1.07% | 1.23% A |
Net investment income (loss) | 1.64% J | .10% A |
Supplemental Data | | |
Net assets, end of period (000 omitted) | $ 35,739 | $ 9,811 |
Portfolio turnover rate F | 54% | 25% A |
A Annualized
B Total returns for periods of less than one year are not annualized.
C Total returns would have been lower had certain expenses not been reduced during the periods shown.
D Calculated based on average shares outstanding during the period.
E Fees and expenses of the underlying Fidelity Central Funds are not included in the Fund's expense ratio. The Fund indirectly bears its proportionate share of the expenses of any underlying Fidelity Central Funds.
F Amount does not include the portfolio activity of any underlying Fidelity Central Funds.
G For the period March 25, 2009 (commencement of operations) to October 31, 2009.
H Expense ratios reflect operating expenses of the class. Expenses before reductions do not reflect amounts reimbursed by the investment adviser or reductions from brokerage service arrangements or reductions from other expense offset arrangements and do not represent the amount paid by the class during periods when reimbursements or reductions occur. Expense ratios before reductions for start-up periods may not be representative of longer-term operating periods. Expenses net of fee waivers reflect expenses after reimbursement by the investment adviser but prior to reductions from brokerage service arrangements or other expense offset arrangements. Expenses net of all reductions represent the net expenses paid by the class.
I Amount represents less than $.01 per share.
J Investment income per share reflects a special dividend which amounted to $.13 per share. Excluding the special dividend, the ratio of net investment income (loss) to average net assets would have been .71%.
See accompanying notes which are an integral part of the financial statements.
Annual Report
Notes to Financial Statements
For the period ended October 31, 2010
1. Organization.
Fidelity Global Commodity Stock Fund (the Fund) is a non-diversified fund of Fidelity Investment Trust (the Trust) and is authorized to issue an unlimited number of shares. The Trust is registered under the Investment Company Act of 1940, as amended (the 1940 Act), as an open-end management investment company organized as a Massachusetts business trust. The Fund offers Class A, Class T, Class C, Global Commodity Stock, and Institutional Class shares, each of which has equal rights as to assets and voting privileges. Effective after the close of business on September 1, 2010, Class B shares were closed to new accounts and additional purchases by existing shareholders. Each class has exclusive voting rights with respect to matters that affect that class. Class B shares will automatically convert to Class A shares after a holding period of seven years from the initial date of purchase. Investment income, realized and unrealized capital gains and losses, the common expenses of the Fund, and certain fund-level expense reductions, if any, are allocated on a pro-rata basis to each class based on the relative net assets of each class to the total net assets of the Fund. Each class differs with respect to transfer agent and distribution and service plan fees incurred. Certain expense reductions also differ by class. The Fund's investments in emerging markets can be subject to social, economic, regulatory, and political uncertainties and can be extremely volatile.
2. Investments in Fidelity Central Funds.
The Fund may invest in Fidelity Central Funds, which are open-end investment companies available only to other investment companies and accounts managed by Fidelity Management & Research Company (FMR) and its affiliates. The Fund's Schedule of Investments lists each of the Fidelity Central Funds held as of period end, if any, as an investment of the Fund, but does not include the underlying holdings of each Fidelity Central Fund. As an Investing Fund, the Fund indirectly bears its proportionate share of the expenses of the underlying Fidelity Central Funds.
The Money Market Central Funds seek preservation of capital and current income and are managed by Fidelity Investments Money Management, Inc. (FIMM), an affiliate of FMR.
A complete unaudited list of holdings for each Fidelity Central Fund is available upon request or at the Securities and Exchange Commission (the SEC) web site at www.sec.gov. In addition, the financial statements of the Fidelity Central Funds which are not covered by the Fund's Report of Independent Registered Public Accounting Firm, are available on the SEC web site or upon request.
3. Significant Accounting Policies.
The financial statements have been prepared in conformity with accounting principles generally accepted in the United States of America (GAAP), which require management
Annual Report
Notes to Financial Statements - continued
3. Significant Accounting Policies - continued
to make certain estimates and assumptions at the date of the financial statements. Actual results could differ from those estimates. The following summarizes the significant accounting policies of the Fund:
Security Valuation. Investments are valued as of 4:00 p.m. Eastern time on the last calendar day of the period. The Fund uses independent pricing services approved by the Board of Trustees to value its investments. When current market prices or quotations are not readily available or reliable, valuations may be determined in good faith in accordance with procedures adopted by the Board of Trustees. Factors used in determining value may include market or security specific events. The frequency with which these procedures are used cannot be predicted and they may be utilized to a significant extent. The value used for net asset value (NAV) calculation under these procedures may differ from published prices for the same securities.
The Fund categorizes the inputs to valuation techniques used to value its investments into a disclosure hierarchy consisting of three levels as shown below.
Level 1 - quoted prices in active markets for identical investments
Level 2 - other significant observable inputs (including quoted prices for similar investments, interest rates, prepayment speeds, etc.)
Level 3 - unobservable inputs (including the fund's own assumptions based on the best information available)
Changes in valuation techniques may result in transfers in or out of an assigned level within the disclosure hierarchy. The aggregate value of investments by input level, as of October 31, 2010, as well as a roll forward of Level 3 securities, is included at the end of the Fund's Schedule of Investments. Valuation techniques used to value the Fund's investments by major category are as follows.
Equity securities, including restricted securities, for which market quotations are readily available, are valued at the last reported sale price or official closing price as reported by an independent pricing service on the primary market or exchange on which they are traded and are categorized as Level 1 in the hierarchy. In the event there were no sales during the day or closing prices are not available, securities are valued at the last quoted bid price or may be valued using the last available price and are generally categorized as Level 2 in the hierarchy. For foreign equity securities, when significant market or security specific events arise, comparisons to the valuation of American Depositary Receipts (ADRs), futures contracts, Exchange-traded funds (ETFs) and certain indexes as well as quoted prices for similar securities are used and are categorized as Level 2 in the hierarchy in these circumstances. Utilizing these techniques may result in transfers between
Annual Report
3. Significant Accounting Policies - continued
Security Valuation - continued
Level 1 and Level 2. For restricted equity securities and private placements where observable inputs are limited, assumptions about market activity and risk are used and are categorized as Level 3 in the hierarchy.
Investments in open-end mutual funds, including the Fidelity Central Funds, are valued at their closing net asset value each business day and are categorized as Level 1 in the hierarchy. Short-term securities with remaining maturities of sixty days or less for which quotations are not readily available are valued at amortized cost, which approximates fair value and are categorized as Level 2 in the hierarchy.
Foreign Currency. The Fund uses foreign currency contracts to facilitate transactions in foreign-denominated securities. Gains and losses from these transactions may arise from changes in the value of the foreign currency or if the counterparties do not perform under the contracts' terms.
Foreign-denominated assets, including investment securities, and liabilities are translated into U.S. dollars at the exchange rate at period end. Purchases and sales of investment securities, income and dividends received and expenses denominated in foreign currencies are translated into U.S. dollars at the exchange rate in effect on the transaction date.
The effects of exchange rate fluctuations on investments are included with the net realized and unrealized gain (loss) on investment securities. Other foreign currency transactions resulting in realized and unrealized gain (loss) are disclosed separately.
Investment Transactions and Income. For financial reporting purposes, the Fund's investment holdings and NAV include trades executed through the end of the last business day of the period. The NAV per share for processing shareholder transactions is calculated as of the close of business of the New York Stock Exchange (NYSE), normally 4:00 p.m. Eastern time and includes trades executed through the end of the prior business day. Gains and losses on securities sold are determined on the basis of identified cost. Dividend income is recorded on the ex-dividend date, except for certain dividends from foreign securities where the ex-dividend date may have passed, which are recorded as soon as the Fund is informed of the ex-dividend date. Non-cash dividends included in dividend income, if any, are recorded at the fair market value of the securities received. Distributions received on securities that represent a return of capital or capital gain are recorded as a reduction of cost of investments and/or as a realized gain. The Fund estimates the components of distributions received that may be considered return of capital distributions or capital gain distributions. Large, non-recurring dividends recognized by the Fund are presented separately on the Statement of Operations as "Special Dividends" and the impact of these dividends is presented in the Financial Highlights.
Annual Report
Notes to Financial Statements - continued
3. Significant Accounting Policies - continued
Investment Transactions and Income - continued
Interest income and distributions from the Fidelity Central Funds are accrued as earned. Interest income includes coupon interest and amortization of premium and accretion of discount on debt securities. Investment income is recorded net of foreign taxes withheld where recovery of such taxes is uncertain.
Expenses. Most expenses of the Trust can be directly attributed to a fund. Expenses which cannot be directly attributed are apportioned amongst each fund in the Trust. Expense estimates are accrued in the period to which they relate and adjustments are made when actual amounts are known.
Income Tax Information and Distributions to Shareholders. Each year the Fund intends to qualify as a regulated investment company, including distributing substantially all of its taxable income and realized gains under Subchapter M of the Internal Revenue Code and filing its U.S. federal tax return. As a result, no provision for income taxes is required. As of October 31, 2010, the Fund did not have any unrecognized tax benefits in the accompanying financial statements. A fund's federal tax return is subject to examination by the Internal Revenue Service (IRS) for a period of three years. Foreign taxes are provided for based on the Fund's understanding of the tax rules and rates that exist in the foreign markets in which it invests. The Fund is subject to a tax imposed on short term capital gains on securities of certain issuers domiciled in India. The Fund records an estimated deferred tax liability included in Other payables and accrued expenses in the accompanying Statement of Assets & Liabilities for net unrealized gains on these securities in an amount that would be payable if the securities were disposed of at period end.
Distributions are declared and recorded on the ex-dividend date. Income dividends and capital gain distributions are declared separately for each class. Income and capital gain distributions are determined in accordance with income tax regulations, which may differ from GAAP. In addition, the fund claimed a portion of the payment made to redeeming shareholders as a distribution for income tax purposes.
Capital accounts within the financial statements are adjusted for permanent book-tax differences. These adjustments have no impact on net assets or the results of operations. Temporary book-tax differences will reverse in a subsequent period.
Book-tax differences are primarily due to foreign currency transactions, certain foreign taxes, passive foreign investment companies (PFIC)and losses deferred due to wash sales.
Annual Report
3. Significant Accounting Policies - continued
Income Tax Information and Distributions to Shareholders - continued
The federal tax cost of investment securities and unrealized appreciation (depreciation) as of period end were as follows:
Gross unrealized appreciation | $ 61,409,156 |
Gross unrealized depreciation | (18,023,785) |
Net unrealized appreciation (depreciation) | $ 43,385,371 |
| |
Tax Cost | $ 401,941,221 |
The tax-based components of distributable earnings as of period end were as follows:
Undistributed ordinary income | $ 4,193,998 |
Undistributed long-term capital gain | $ 1,911,902 |
Net unrealized appreciation (depreciation) | $ 43,386,573 |
The tax character of distributions paid was as follows:
| October 31,
2010 | October 31,
2009 |
Ordinary Income | $ 1,546,715 | $ - |
Short-Term Trading (Redemption) Fees. Shares held by investors in the Fund less than 30 days are subject to a redemption fee equal to 1.00% of the net asset value of shares redeemed. All redemption fees, which reduce the proceeds of the shareholder redemption, are retained by the Fund and accounted for as an addition to paid in capital.
4. Purchases and Sales of Investments.
Purchases and sales of securities, other than short-term securities, aggregated $387,406,917 and $178,635,735, respectively.
5. Fees and Other Transactions with Affiliates.
Management Fee. FMR and its affiliates provide the Fund with investment management related services for which the Fund pays a monthly management fee. The management fee is the sum of an individual fund fee rate that is based on an annual rate of .45% of the Fund's average net assets and a group fee rate that averaged .26% during the period. The group fee rate is based upon the average net assets of all the mutual funds
Annual Report
Notes to Financial Statements - continued
5. Fees and Other Transactions with Affiliates - continued
Management Fee - continued
advised by FMR. The group fee rate decreases as assets under management increase and increases as assets under management decrease. For the period, the total annual management fee rate was .71% of the Fund's average net assets.
Distribution and Service Plan Fees. In accordance with Rule 12b-1 of the 1940 Act, the Fund has adopted separate Distribution and Service Plans for each class of shares. Certain classes pay Fidelity Distributors Corporation (FDC), an affiliate of FMR, separate Distribution and Service Fees, each of which is based on an annual percentage of each class' average net assets. In addition, FDC may pay financial intermediaries for selling shares of the Fund and providing shareholder support services. For the period, the Distribution and Service Fee rates, total fees and amounts retained by FDC were as follows:
| Distribution
Fee | Service
Fee | Total Fees | Retained
by FDC |
Class A | -% | .25% | $ 100,827 | $ 5,669 |
Class T | .25% | .25% | 44,998 | 3,026 |
Class B | .75% | .25% | 43,683 | 34,562 |
Class C | .75% | .25% | 109,716 | 73,600 |
| | | $ 299,224 | $ 116,857 |
Sales Load. FDC receives a front-end sales charge of up to 5.75% for selling Class A shares, and 3.50% for selling Class T shares, some of which is paid to financial intermediaries for selling shares of the Fund. FDC receives the proceeds of contingent deferred sales charges levied on Class A, Class T, Class B, and Class C redemptions. These charges depend on the holding period. The deferred sales charges range from 5% to 1% for Class B, 1% for Class C, 1.00% for certain purchases of Class A shares (1.00% to .50% prior to July 12, 2010) and .25% for certain purchases of Class T shares.
For the period, sales charge amounts retained by FDC were as follows:
| Retained
by FDC |
Class A | $ 71,199 |
Class T | 9,668 |
Class B* | 64,189 |
Class C* | 4,311 |
| $ 149,367 |
* When Class B and Class C shares are initially sold, FDC pays commissions from its own resources to financial intermediaries through which the sales are made.
Annual Report
5. Fees and Other Transactions with Affiliates - continued
Transfer Agent Fees. Fidelity Investments Institutional Operations Company, Inc. (FIIOC), an affiliate of FMR, is the transfer, dividend disbursing and shareholder servicing agent for each class of the Fund. FIIOC receives account fees and asset-based fees that vary according to the account size and type of account of the shareholders of the respective classes of the Fund. FIIOC pays for typesetting, printing and mailing of shareholder reports, except proxy statements. For the period, transfer agent fees for each class were as follows:
| Amount | % of
Average
Net Assets |
Class A | $ 107,075 | .26 |
Class T | 24,116 | .27 |
Class B | 13,309 | .30 |
Class C | 31,332 | .28 |
Global Commodity Stock | 629,234 | .24 |
Institutional Class | 54,104 | .23 |
| $ 859,170 | |
Accounting and Security Lending Fees. Fidelity Service Company, Inc. (FSC), an affiliate of FMR, maintains the Fund's accounting records. The accounting fee is based on the level of average net assets for the month. Under a separate contract, FSC administers the security lending program. The security lending fee is based on the number and duration of lending transactions.
Brokerage Commissions. The Fund placed a portion of its portfolio transactions with brokerage firms which are affiliates of the investment adviser. The commissions paid to these affiliated firms were $9,718 for the period.
Interfund Lending Program. Pursuant to an Exemptive Order issued by the SEC, the Fund, along with other registered investment companies having management contracts with FMR, may participate in an interfund lending program. This program provides an alternative credit facility allowing the funds to borrow from, or lend money to, other participating affiliated funds. At period end, there were no interfund loans outstanding. The Fund's activity in this program during the period for which loans were outstanding was as follows:
Borrower or Lender | Average
Daily Loan
Balance | Weighted
Average Interest
Rate | Interest
Expense |
Borrower | $ 3,460,667 | .46% | $ 666 |
Annual Report
Notes to Financial Statements - continued
6. Committed Line of Credit.
The Fund participates with other funds managed by FMR or an affiliate in a $3.75 billion credit facility (the "line of credit") to be utilized for temporary or emergency purposes to fund shareholder redemptions or for other short-term liquidity purposes. The Fund has agreed to pay commitment fees on its pro-rata portion of the line of credit, which amounted to $774 and is reflected in Miscellaneous expenses on the Statement of Operations. During the period, there were no borrowings on this line of credit.
7. Security Lending.
The Fund lends portfolio securities through a lending agent from time to time in order to earn additional income. The lending agent may loan securities to certain qualified borrowers, including Fidelity Capital Markets (FCM), a broker-dealer affiliated with the Fund. On the settlement date of the loan, the Fund receives collateral (in the form of U.S. Treasury obligations, letters of credit and/or cash) against the loaned securities and maintains collateral in an amount not less than 100% of the market value of the loaned securities during the period of the loan. The market value of the loaned securities is determined at the close of business of the Fund and any additional required collateral is delivered to the Fund on the next business day. If the borrower defaults on its obligation to return the securities loaned because of insolvency or other reasons, a fund could experience delays and costs in recovering the securities loaned or in gaining access to the collateral. Any cash collateral received is invested in the Fidelity Securities Lending Cash Central Fund. The value of loaned securities and cash collateral at period end are disclosed on the Fund's Statement of Assets and Liabilities. Security lending income represents the income earned on investing cash collateral, less rebates paid to borrowers and lending agent fees associated with the loan, plus any premium payments received for lending certain types of securities. Security lending income is presented in the Statement of Operations as a component of income from Fidelity Central Funds. Total security lending income during the period amounted to $89,586. During the period, there were no securities loaned to FCM.
8. Bank Borrowings.
The Fund is permitted to have bank borrowings for temporary or emergency purposes to fund shareholder redemptions. The Fund has established borrowing arrangements with certain banks. The interest rate on the borrowings is the bank's base rate, as revised from time to time. The average daily loan balance during the period for which loans were outstanding amounted to $3,318,000. The weighted average interest rate was .69%. The interest expense amounted to $254 under the bank borrowing program. At period end, there were no bank borrowings outstanding.
Annual Report
9. Expense Reductions.
Many of the brokers with whom FMR places trades on behalf of the Fund provided services to the Fund in addition to trade execution. These services included payments of certain expenses on behalf of the Fund totaling $41,295 for the period.
10. Distributions to Shareholders.
Distributions to shareholders of each class were as follows:
Years ended October 31, | 2010 | 2009 A |
From net investment income | | |
Class A | $ 7,432 | $ - |
Global Commodity Stock | 168,019 | - |
Institutional Class | 12,973 | - |
Total | $ 188,424 | $ - |
From net realized gain | | |
Class A | $ 143,058 | $ - |
Class T | 30,137 | - |
Class B | 9,302 | - |
Class C | 20,828 | - |
Global Commodity Stock | 1,078,126 | - |
Institutional Class | 76,840 | - |
Total | $ 1,358,291 | $ - |
A For the period March 25, 2009 (commencement of operations) to October 31, 2009.
11. Share Transactions.
Transactions for each class of shares were as follows:
| Shares | Dollars |
Years ended October 31, | 2010 | 2009 A | 2010 | 2009 A |
Class A | | | | |
Shares sold | 3,636,511 | 1,217,436 | $ 52,113,230 | $ 15,536,230 |
Reinvestment of distributions | 8,310 | - | 119,911 | - |
Shares redeemed | (957,806) | (35,397) | (13,354,681) | (440,651) |
Net increase (decrease) | 2,687,015 | 1,182,039 | $ 38,878,460 | $ 15,095,579 |
Class T | | | | |
Shares sold | 635,625 | 352,496 | $ 9,055,849 | $ 4,355,249 |
Reinvestment of distributions | 2,006 | - | 28,921 | - |
Shares redeemed | (233,090) | (796) | (3,190,490) | (10,905) |
Net increase (decrease) | 404,541 | 351,700 | $ 5,894,280 | $ 4,344,344 |
Annual Report
Notes to Financial Statements - continued
11. Share Transactions - continued
Transactions for each class of shares were as follows: - continued
| Shares | Dollars |
Years ended October 31, | 2010 | 2009 A | 2010 | 2009 A |
Class B | | | | |
Shares sold | 275,613 | 209,917 | $ 3,943,173 | $ 2,460,093 |
Reinvestment of distributions | 543 | - | 7,824 | - |
Shares redeemed | (200,985) | (3,790) | (2,763,660) | (51,192) |
Net increase (decrease) | 75,171 | 206,127 | $ 1,187,337 | $ 2,408,901 |
Class C | | | | |
Shares sold | 869,321 | 368,806 | $ 12,506,411 | $ 4,531,477 |
Reinvestment of distributions | 1,339 | - | 19,266 | - |
Shares redeemed | (305,685) | (5,994) | (4,197,936) | (81,571) |
Net increase (decrease) | 564,975 | 362,812 | $ 8,327,741 | $ 4,449,906 |
Global Commodity Stock | | | | |
Shares sold | 19,122,952 | 14,544,887 | $ 278,892,729 | $ 183,653,183 |
Reinvestment of distributions | 81,765 | - | 1,181,498 | - |
Shares redeemed | (11,379,620) | (2,563,407) | (158,960,668) | (31,996,439) |
Net increase (decrease) | 7,825,097 | 11,981,480 | $ 121,113,559 | $ 151,656,744 |
Institutional Class | | | | |
Shares sold | 1,969,025 | 773,649 | $ 28,672,948 | $ 9,932,033 |
Reinvestment of distributions | 2,588 | - | 37,397 | - |
Shares redeemed | (426,975) | (36,369) | (6,016,467) | (435,916) |
Net increase (decrease) | 1,544,638 | 737,280 | $ 22,693,878 | $ 9,496,117 |
A For the period March 25, 2009 (commencement of operations) to October 31, 2009.
12. Other.
The Fund's organizational documents provide former and current trustees and officers with a limited indemnification against liabilities arising in connection with the performance of their duties to the Fund. In the normal course of business, the Fund may also enter into contracts that provide general indemnifications. The Fund's maximum exposure under these arrangements is unknown as this would be dependent on future claims that may be made against the Fund. The risk of material loss from such claims is considered remote.
Annual Report
To the Trustees of Fidelity Investment Trust and the Shareholders of Fidelity Global Commodity Stock Fund:
In our opinion, the accompanying statement of assets and liabilities, including the schedule of investments, and the related statements of operations and of changes in net assets and the financial highlights present fairly, in all material respects, the financial position of Fidelity Global Commodity Stock Fund (a fund of Fidelity Investment Trust) at October 31, 2010, the results of its operations for the year then ended, the changes in its net assets for each of the periods indicated and the financial highlights for each of the periods indicated, in conformity with accounting principles generally accepted in the United States of America. These financial statements and financial highlights (hereafter referred to as "financial statements") are the responsibility of the Fidelity Global Commodity Stock Fund's management. Our responsibility is to express an opinion on these financial statements based on our audits. We conducted our audits of these financial statements in accordance with the standards of the Public Company Accounting Oversight Board (United States). Those standards require that we plan and perform the audit to obtain reasonable assurance about whether the financial statements are free of material misstatement. An audit includes examining, on a test basis, evidence supporting the amounts and disclosures in the financial statements, assessing the accounting principles used and significant estimates made by management, and evaluating the overall financial statement presentation. We believe that our audits, which included confirmation of securities at October 31, 2010 by correspondence with the custodian and brokers, provide a reasonable basis for our opinion.
/s/ PricewaterhouseCoopers LLP
PricewaterhouseCoopers LLP
Boston, Massachusetts
December 17, 2010
Annual Report
The Trustees, Member of the Advisory Board, and executive officers of the trust and fund, as applicable, are listed below. The Board of Trustees governs the fund and is responsible for protecting the interests of shareholders. The Trustees are experienced executives who meet periodically throughout the year to oversee the fund's activities, review contractual arrangements with companies that provide services to the fund, oversee management of the risks associated with such activities and contractual arrangements, and review the fund's performance. Except for James C. Curvey, each of the Trustees oversees 221 funds advised by FMR or an affiliate. Mr. Curvey oversees 410 funds advised by FMR or an affiliate.
The Trustees hold office without limit in time except that (a) any Trustee may resign; (b) any Trustee may be removed by written instrument, signed by at least two-thirds of the number of Trustees prior to such removal; (c) any Trustee who requests to be retired or who has become incapacitated by illness or injury may be retired by written instrument signed by a majority of the other Trustees; and (d) any Trustee may be removed at any special meeting of shareholders by a two-thirds vote of the outstanding voting securities of the trust. Each Trustee who is not an interested person (as defined in the 1940 Act) (Independent Trustee), shall retire not later than the last day of the calendar year in which his or her 72nd birthday occurs. The Independent Trustees may waive this mandatory retirement age policy with respect to individual Trustees. The executive officers and Advisory Board Member hold office without limit in time, except that any officer and Advisory Board Member may resign or may be removed by a vote of a majority of the Trustees at any regular meeting or any special meeting of the Trustees. Except as indicated, each individual has held the office shown or other offices in the same company for the past five years.
Experience, Skills, Attributes, and Qualifications of the Fund's Trustees. The Governance and Nominating Committee has adopted a statement of policy that describes the experience, qualifications, attributes, and skills that are necessary and desirable for potential Independent Trustee candidates (Statement of Policy). The Board believes that each Trustee satisfied at the time he or she was initially elected or appointed a Trustee, and continues to satisfy, the standards contemplated by the Statement of Policy. The Governance and Nominating Committee also engages professional search firms to help identify potential Independent Trustee candidates who have the experience, qualifications, attributes, and skills consistent with the Statement of Policy. From time to time, additional criteria based on the composition and skills of the current Independent Trustees, as well as experience or skills that may be appropriate in light of future changes to board composition, business conditions, and regulatory or other developments, have also been considered by the professional search firms and the Governance and Nominating Committee. In addition, the Board takes into account the Trustees' commitment and participation in Board and committee meetings, as well as their leadership of standing and ad hoc committees throughout their tenure.
In determining that a particular Trustee was and continues to be qualified to serve as a Trustee, the Board has considered a variety of criteria, none of which, in isolation, was controlling. The Board believes that, collectively, the Trustees have balanced and diverse experience, qualifications, attributes, and skills, which allow the Board to operate effectively in governing the fund and protecting the interests of shareholders. Information about the specific experience, skills, attributes, and qualifications of each Trustee, which in each case led to the Board's conclusion that the Trustee should serve (or continue to serve) as a trustee of the fund, is provided below.
Annual Report
Board Structure and Oversight Function. Edward C. Johnson 3d is an interested person (as defined in the 1940 Act) and currently serves as Chairman. The Trustees have determined that an interested Chairman is appropriate and benefits shareholders because an interested Chairman has a personal and professional stake in the quality and continuity of services provided to the fund. Independent Trustees exercise their informed business judgment to appoint an individual of their choosing to serve as Chairman, regardless of whether the Trustee happens to be independent or a member of management. The Independent Trustees have determined that they can act independently and effectively without having an Independent Trustee serve as Chairman and that a key structural component for assuring that they are in a position to do so is for the Independent Trustees to constitute a substantial majority for the Board. The Independent Trustees also regularly meet in executive session. Ned C. Lautenbach serves as Chairman of the Independent Trustees and as such (i) acts as a liaison between the Independent Trustees and management with respect to matters important to the Independent Trustees and (ii) with management prepares agendas for Board meetings.
Fidelity funds are overseen by different Boards of Trustees. The fund's Board oversees Fidelity's equity and high income funds and another Board oversees Fidelity's investment-grade bond, money market, and asset allocation funds. The asset allocation funds may invest in Fidelity funds overseen by the fund's Board. The use of separate Boards, each with its own committee structure, allows the Trustees of each group of Fidelity funds to focus on the unique issues of the funds they oversee, including common research, investment, and operational issues. On occasion, the separate Boards establish joint committees to address issues of overlapping consequences for the Fidelity funds overseen by each Board.
The Trustees operate using a system of committees to facilitate the timely and efficient consideration of all matters of importance to the Trustees, the fund, and fund shareholders and to facilitate compliance with legal and regulatory requirements and oversight of the fund's activities and associated risks. The Board, acting through its committees, has charged FMR and its affiliates with (i) identifying events or circumstances the occurrence of which could have demonstrably adverse effects on the fund's business and/or reputation; (ii) implementing processes and controls to lessen the possibility that such events or circumstances occur or to mitigate the effects of such events or circumstances if they do occur; and (iii) creating and maintaining a system designed to evaluate continuously business and market conditions in order to facilitate the identification and implementation processes described in (i) and (ii) above. Because the day-to-day operations and activities of the fund are carried out by or through FMR, its affiliates and other service providers, the fund's exposure to risks is mitigated but not eliminated by the processes overseen by the Trustees. While each of the Board's committees has responsibility for overseeing different aspects of the fund's activities, oversight is exercised primarily through the Operations, Audit, and Compliance Committees. Appropriate personnel, including but not limited to the fund's Chief Compliance Officer (CCO), FMR's internal auditor, the independent accountants, the fund's Treasurer and portfolio management personnel, make periodic reports to the Board's committees, as appropriate. The responsibilities of each committee, including their oversight responsibilities, are described further under "Standing Committees of the Fund's Trustees."
Annual Report
Trustees and Officers - continued
The fund's Statement of Additional Information (SAI) includes more information about the Trustees. To request a free copy, call Fidelity at 1-800-208-0098.
Interested Trustees*:
Correspondence intended for each Trustee who is an interested person may be sent to Fidelity Investments, 82 Devonshire Street, Boston, Massachusetts 02109.
Name, Age; Principal Occupations and Other Relevant Experience+ |
Edward C. Johnson 3d (80) |
| Year of Election or Appointment: 1984 Mr. Johnson is Trustee and Chairman of the Board of Trustees of certain Trusts. Mr. Johnson serves as Chief Executive Officer, Chairman, and a Director of FMR LLC; Chairman and a Director of FMR; Chairman and a Director of Fidelity Research & Analysis Company (FRAC); Chairman and a Director of Fidelity Investments Money Management, Inc.; and Chairman and a Director of FMR Co., Inc. In addition, Mr. Johnson serves as Chairman and Director of FIL Limited. Previously, Mr. Johnson served as President of FMR LLC (2006-2007). |
James C. Curvey (75) |
| Year of Election or Appointment: 2007 Mr. Curvey also serves as Trustee (2007-present) of other investment companies advised by FMR. Mr. Curvey is a Director of Fidelity Investments Money Management, Inc. (2009-present), Director of Fidelity Research & Analysis Co. (2009-present) and Director of FMR and FMR Co., Inc. (2007-present). Mr. Curvey is also Vice Chairman (2007-present) and Director of FMR LLC. In addition, Mr. Curvey serves as an Overseer for the Boston Symphony Orchestra and a member of the Trustees of Villanova University. Previously, Mr. Curvey was the Vice Chairman (2006-2007) and Director (2000-2007) of FMR Corp. |
* Trustees have been determined to be "Interested Trustees" by virtue of, among other things, their affiliation with the trust or various entities under common control with FMR.
+ The information above includes each Trustee's principal occupation during the last five years and other information relating to the experience, attributes, and skills relevant to each Trustee's qualifications to serve as a Trustee, which led to the conclusion that each Trustee should serve as a Trustee for the fund.
Annual Report
Independent Trustees:
Correspondence intended for each Independent Trustee (that is, the Trustees other than the Interested Trustees) may be sent to Fidelity Investments, P.O. Box 55235, Boston, Massachusetts 02205-5235.
Name, Age; Principal Occupations and Other Relevant Experience+ |
Dennis J. Dirks (62) |
| Year of Election or Appointment: 2005 Prior to his retirement in May 2003, Mr. Dirks was Chief Operating Officer and a member of the Board of The Depository Trust & Clearing Corporation (DTCC). He also served as President, Chief Operating Officer, and Board member of The Depository Trust Company (DTC) and President and Board member of the National Securities Clearing Corporation (NSCC). In addition, Mr. Dirks served as Chief Executive Officer and Board member of the Government Securities Clearing Corporation, Chief Executive Officer and Board member of the Mortgage-Backed Securities Clearing Corporation, as a Trustee and a member of the Finance Committee of Manhattan College (2005-2008), and as a Trustee and a member of the Finance Committee of AHRC of Nassau County (2006-2008). Mr. Dirks is a member of the Independent Directors Council (IDC) Governing Council (2010-Present) and Board of Directors for The Brookville Center for Children's Services, Inc. (2009-present). |
Alan J. Lacy (57) |
| Year of Election or Appointment: 2008 Mr. Lacy serves as Senior Adviser (2007-present) of Oak Hill Capital Partners, L.P. (private equity). Mr. Lacy also served as Chief Executive Officer (2000-2005) and Vice Chairman (2005-2006) of Sears Holdings Corporation and Sears, Roebuck and Co. (retail). In addition, Mr. Lacy serves as a member of the Board of Directors of The Western Union Company (global money transfer, 2006-present) and Bristol-Myers Squibb Company (global pharmaceuticals, 2007-present). Mr. Lacy is Chairman (2008-present) and a member (2006-present) of the Board of Trustees of The National Parks Conservation Association. |
Ned C. Lautenbach (66) |
| Year of Election or Appointment: 2000 Mr. Lautenbach is Chairman of the Independent Trustees of the Equity and High Income Funds (2006-present). Mr. Lautenbach currently serves as the Lead Director of the Eaton Corporation Board of Directors (diversified industrial, 1997-present). Mr. Lautenbach is also a member of the Board of Directors of the Philharmonic Center for the Arts in Naples, Florida (1999-present); a member of the Board of Trustees of Fairfield University (2005-present); and a member of the Council on Foreign Relations (1994-present). Previously, Mr. Lautenbach was a Partner/Advisory Partner at Clayton, Dubilier & Rice, Inc. (private equity investment, 1998-2010), as well as a Director of Sony Corporation (2006-2007). |
Joseph Mauriello (66) |
| Year of Election or Appointment: 2008 Prior to his retirement in January 2006, Mr. Mauriello served in numerous senior management positions including Deputy Chairman and Chief Operating Officer (2004-2005), and Vice Chairman of Financial Services (2002-2004) of KPMG LLP US (professional services, 1965-2005). Mr. Mauriello currently serves as a member of the Board of Directors of XL Group plc. (global insurance and re-insurance, 2006-present) and of Arcadia Resources Inc. (health care services and products, 2007-present). Previously, Mr. Mauriello served as a Director of the Hamilton Funds of the Bank of New York (2006-2007). |
Cornelia M. Small (66) |
| Year of Election or Appointment: 2005 Ms. Small is a member of the Board of Directors of the Teagle Foundation (2009-present). Ms. Small is also a member of the Investment Committee, and Chair (2008-present) and a member of the Board of Trustees of Smith College. In addition, Ms. Small serves on the Investment Committee of the Berkshire Taconic Community Foundation (2008-present). Previously, Ms. Small served as Chairperson of the Investment Committee (2002-2008) of Smith College. In addition, Ms. Small served as Chief Investment Officer, Director of Global Equity Investments, and a member of the Board of Directors of Scudder, Stevens & Clark and Scudder Kemper Investments. |
William S. Stavropoulos (71) |
| Year of Election or Appointment: 2001 Mr. Stavropoulos is Vice Chairman of the Independent Trustees of the Equity and High Income Funds (2006-present). Mr. Stavropoulos serves as President and Founder of the Michigan Baseball Foundation, the Great Lakes Loons (2007-present). Mr. Stavropoulos is Chairman Emeritus of the Board of Directors of The Dow Chemical Company, where he previously served in numerous senior management positions, including President, CEO (1995-2000; 2002-2004), Chairman of the Executive Committee (2000-2006), and as a member of the Board of Directors (1990-2006). Currently, Mr. Stavropoulos is Chairman of Univar (global distributor of commodity and specialty chemicals, 2010-present), a Director of Teradata Corporation (data warehousing and technology solutions, 2008-present), Chemical Financial Corporation, Maersk Inc. (industrial conglomerate), Tyco International, Inc. (multinational manufacturing and services, 2007-present), and a member of the Advisory Board for Metalmark Capital (private equity investment, 2005-present). Mr. Stavropoulos is a special advisor to Clayton, Dubilier & Rice, Inc. (private equity investment). In addition, Mr. Stavropoulos is a member of the University of Notre Dame Advisory Council for the College of Science. |
David M. Thomas (61) |
| Year of Election or Appointment: 2008 Previously, Mr. Thomas served as Executive Chairman (2005-2006) and Chairman and Chief Executive Officer (2000-2005) of IMS Health, Inc. (pharmaceutical and healthcare information solutions). In addition, Mr. Thomas serves as a member of the Board of Directors of Fortune Brands, Inc. (consumer products), and Interpublic Group of Companies, Inc. (marketing communication, 2004-present). |
Michael E. Wiley (60) |
| Year of Election or Appointment: 2008 Mr. Wiley also serves as a Director of Asia Pacific Exploration Consolidated (international oil and gas exploration and production, 2008-present). Mr. Wiley serves as a Director of Tesoro Corporation (independent oil refiner and marketer, 2005-present), and a Director of Bill Barrett Corporation (exploration and production, 2005-present). In addition, Mr. Wiley also serves as a Director of Post Oak Bank (privately-held bank, 2004-present). Previously, Mr. Wiley served as a member of the Board of Trustees of the University of Tulsa (2000-2006; 2007-2010), as a Senior Energy Advisor of Katzenbach Partners, LLC (consulting, 2006-2007), as an Advisory Director of Riverstone Holdings (private investment), Chairman, President, and CEO of Baker Hughes, Inc. (oilfield services, 2000-2004), and as Director of Spinnaker Exploration Company (exploration and production, 2001-2005). |
+ The information above includes each Trustee's principal occupation during the last five years and other information relating to the experience, attributes, and skills relevant to each Trustee's qualifications to serve as a Trustee, which led to the conclusion that each Trustee should serve as a Trustee for the fund.
Advisory Board Member and Executive Officers:
Correspondence intended for each executive officer and Peter S. Lynch may be sent to Fidelity Investments, 82 Devonshire Street, Boston, Massachusetts 02109.
Name, Age; Principal Occupation |
Peter S. Lynch (66) |
| Year of Election or Appointment: 2003 Member of the Advisory Board of Fidelity's Equity and High Income Funds. Mr. Lynch is Vice Chairman and a Director of FMR and FMR Co., Inc. In addition, Mr. Lynch serves as a Trustee of Boston College and as the Chairman of the Inner-City Scholarship Fund. Previously, Mr. Lynch served on the Special Olympics International Board of Directors (1997-2006). |
Kenneth B. Robins (41) |
| Year of Election or Appointment: 2008 President and Treasurer of Fidelity's Equity and High Income Funds. Mr. Robins also serves as President and Treasurer (2010-present) and Assistant Treasurer (2009-present) of other Fidelity funds and is an employee of Fidelity Investments (2004-present). Previously, Mr. Robins served as Deputy Treasurer of the Fidelity funds (2005-2008) and Treasurer and Chief Financial Officer of The North Carolina Capital Management Trust: Cash and Term Portfolios (2006-2008). |
Brian B. Hogan (46) |
| Year of Election or Appointment: 2009 Vice President of certain Equity Funds and Vice President of Sector Funds. Mr. Hogan also serves as President of FMR's Equity Division (2009-present). Previously, Mr. Hogan served as Senior Vice President, Equity Research of FMR (2006-2009) and as a portfolio manager. |
Christopher S. Bartel (38) |
| Year of Election or Appointment: 2009 Vice President of Fidelity's Sector and Real Estate Equity Funds. Mr. Bartel also serves as Senior Vice President of Equity Research (2009-present). Previously, Mr. Bartel served as Managing Director of Research (2006-2009) and an analyst and portfolio manager (2000-2006). |
Scott C. Goebel (42) |
| Year of Election or Appointment: 2008 Secretary and Chief Legal Officer (CLO) of the Fidelity funds. Mr. Goebel also serves as Secretary and CLO of The North Carolina Capital Management Trust: Cash and Term Portfolio (2008-present); General Counsel, Secretary, and Senior Vice President of FMR (2008-present) and FMR Co., Inc. (2008-present); Deputy General Counsel of FMR LLC; Chief Legal Officer of Fidelity Management & Research (Hong Kong) Limited (2008-present) and Assistant Secretary of Fidelity Management & Research (Japan) Inc. (2008-present), Fidelity Investments Money Management, Inc. (2008-present), Fidelity Management & Research (U.K.) Inc. (2008-present), and Fidelity Research and Analysis Company (2008-present). Previously, Mr. Goebel served as Assistant Secretary of the Funds (2007-2008) and as Vice President and Secretary of Fidelity Distributors Corporation (FDC) (2005-2007). |
William C. Coffey (41) |
| Year of Election or Appointment: 2009 Assistant Secretary of Fidelity's Equity and High Income Funds. Mr. Coffey also serves as Senior Vice President and Deputy General Counsel of FMR LLC (2010-present), and is an employee of Fidelity Investments. Previously, Mr. Coffey served as Vice President and Associate General Counsel of FMR LLC (2005-2009). |
Holly C. Laurent (56) |
| Year of Election or Appointment: 2008 Anti-Money Laundering (AML) Officer of the Fidelity funds. Ms. Laurent also serves as AML Officer of The North Carolina Capital Management Trust: Cash and Term Portfolio (2008-present) and is an employee of Fidelity Investments. Previously, Ms. Laurent was Senior Vice President and Head of Legal for Fidelity Business Services India Pvt. Ltd. (2006-2008), and Senior Vice President, Deputy General Counsel and Group Head for FMR LLC (2005-2006). |
Christine Reynolds (52) |
| Year of Election or Appointment: 2008 Chief Financial Officer of the Fidelity funds. Ms. Reynolds became President of Fidelity Pricing and Cash Management Services (FPCMS) in August 2008. Ms. Reynolds served as Chief Operating Officer of FPCMS (2007-2008). Previously, Ms. Reynolds served as President, Treasurer, and Anti-Money Laundering officer of the Fidelity funds (2004-2007). |
Kenneth A. Rathgeber (63) |
| Year of Election or Appointment: 2004 Chief Compliance Officer of Fidelity's Equity and High Income Funds. Mr. Rathgeber is Chief Compliance Officer of Fidelity Management & Research (Hong Kong) Limited (2008-present), Fidelity Management & Research (Japan) Inc. (2008-present), FMR (2005-present), FMR Co., Inc. (2005-present), Fidelity Management & Research (U.K.) Inc. (2005-present), Fidelity Research & Analysis Company (2005-present), Fidelity Investments Money Management, Inc. (2005-present), Pyramis Global Advisors, LLC (2005-present), and Strategic Advisers, Inc. (2005-present). |
Jeffrey S. Christian (49) |
| Year of Election or Appointment: 2009 Deputy Treasurer of the Fidelity funds. Mr. Christian is an employee of Fidelity Investments. Previously, Mr. Christian served as Chief Financial Officer (2008-2009) of certain Fidelity funds and Senior Vice President of Fidelity Pricing and Cash Management Services (FPCMS) (2004-2009). |
Bryan A. Mehrmann (49) |
| Year of Election or Appointment: 2005 Deputy Treasurer of the Fidelity funds. Mr. Mehrmann is an employee of Fidelity Investments. |
Adrien E. Deberghes (43) |
| Year of Election or Appointment: 2008 Deputy Treasurer of Fidelity's Equity and High Income Funds. Mr. Deberghes also serves as Assistant Treasurer of other Fidelity funds (2010-present) and is an employee of Fidelity Investments (2008-present). Previously, Mr. Deberghes served as Senior Vice President of Mutual Fund Administration at State Street Corporation (2007-2008), Senior Director of Mutual Fund Administration at Investors Bank & Trust (2005-2007), and Director of Finance for Dunkin' Brands (2000-2005). |
Stephanie J. Dorsey (41) |
| Year of Election or Appointment: 2010 Assistant Treasurer of Fidelity's Equity and High Income Funds. Ms. Dorsey also serves as Deputy Treasurer of other Fidelity funds (2008-present) and is an employee of Fidelity Investments (2008-present). Previously, Ms. Dorsey served as Treasurer (2004-2008) of the JPMorgan Mutual Funds and Vice President (2004-2008) of JPMorgan Chase Bank. |
John R. Hebble (52) |
| Year of Election or Appointment: 2009 Assistant Treasurer of Fidelity's Equity and High Income Funds. Mr. Hebble also serves as Treasurer and Chief Financial Officer of The North Carolina Capital Management Trust: Cash and Term Portfolio (2008-present), President and Treasurer of other Fidelity funds (2008-present) and is an employee of Fidelity Investments. |
Gary W. Ryan (52) |
| Year of Election or Appointment: 2005 Assistant Treasurer of the Fidelity funds. Mr. Ryan is an employee of Fidelity Investments. Previously, Mr. Ryan served as Vice President of Fund Reporting in Fidelity Pricing and Cash Management Services (FPCMS) (1999-2005). |
Jonathan Davis (42) |
| Year of Election or Appointment: 2010 Assistant Treasurer of the Fidelity funds. Mr. Davis is an employee of Fidelity Investments. Previously, Mr. Davis served as Vice President and Associate General Counsel of FMR LLC (2003-2010). |
Annual Report
The Board of Trustees of Fidelity Global Commodity Stock Fund voted to pay to shareholders of record at the opening of business on record date, the following distributions per share derived from capital gains realized from sales of portfolio securities, and dividends derived from net investment income:
| Pay Date | Record Date | Dividends | Capital Gains |
Fidelity Global Commodity Stock Fund | 12/13/10 | 12/10/10 | $0.133 | $0.062 |
The fund hereby designates as a capital gain dividend with respect to the taxable year ended October 31, 2010, $1,911,902, or, if subsequently determined to be different, the net capital gain of such year.
The fund designates 11% of the dividends distributed during the fiscal year as qualifying for the dividends-received deduction for corporate shareholders.
The fund designates 57% of the dividends distributed during the fiscal year as amounts which may be taken into account as a dividend for purposes of the maximum rate under section 1(h)(11) of the Internal Revenue Code.
The amounts per share which represent income derived from sources within, and taxes paid to, foreign countries or possessions of the United States are as follows:
| Pay Date | Income | Taxes |
Fidelity Global Commodity Stock Fund | 12/14/09 | $0.008 | $0.0027 |
The fund will notify shareholders in January 2011 of amounts for use in preparing 2010 income tax returns.
Annual Report
Board Approval of Investment Advisory Contracts and Management Fees
Fidelity Global Commodity Stock Fund
Each year, the Board of Trustees, including the Independent Trustees (together, the Board), votes on the renewal of the management contract and sub-advisory agreements (together, the Advisory Contracts) for the fund. The Board, assisted by the advice of fund counsel and Independent Trustees' counsel, requests and considers a broad range of information relevant to the renewal of the Advisory Contracts throughout the year.
The Board meets regularly and considers at each of its meetings factors that are relevant to its annual consideration of the renewal of the fund's Advisory Contracts, including the services and support provided to the fund and its shareholders. The Board has established various standing committees, each composed of Independent Trustees with varying backgrounds, to which the Board has assigned specific subject matter responsibilities in order to enhance effective decision-making by the Board. The Board, acting directly and through its Committees, requests and receives information concerning the annual consideration of the renewal of the fund's Advisory Contracts. The Board also meets as needed to consider matters specifically related to the Board's annual consideration of the renewal of Advisory Contracts. Members of the Board may also meet with trustees of other Fidelity funds through ad hoc joint committees to discuss certain matters relevant to the Fidelity funds.
At its July 2010 meeting, the Board of Trustees, including the Independent Trustees, unanimously determined to renew the fund's Advisory Contracts. In reaching its determination, the Board considered all factors it believed relevant, including (i) the nature, extent, and quality of the services to be provided to the fund and its shareholders (including the investment performance of the fund); (ii) the competitiveness of the fund's management fee and total expenses; (iii) the total costs of the services to be provided by and the profits to be realized by Fidelity from its relationship with the fund; (iv) the extent to which economies of scale would be realized as the fund grows; and (v) whether fee levels reflect these economies of scale, if any, for the benefit of fund shareholders.
In considering whether to renew the Advisory Contracts for the fund, the Board reached a determination, with the assistance of fund counsel and Independent Trustees' counsel and through the exercise of its business judgment, that the renewal of the Advisory Contracts is in the best interests of fund shareholders and that the compensation to be received by Fidelity under the management contract is fair and reasonable. The Board's decision to renew the Advisory Contracts was not based on any single factor noted above, but rather was based on a comprehensive consideration of all the information provided to the Board at its meetings throughout the year. The Board, in reaching its determination to renew the Advisory Contracts, is aware that shareholders in the fund have a broad range of investment choices available to them, including a wide choice among mutual funds offered by Fidelity's competitors, and that the fund's shareholders, with the opportunity to review and weigh the disclosure provided by the fund in its prospectus and other public disclosures, have chosen to invest in this fund, managed by Fidelity.
Annual Report
Board Approval of Investment Advisory Contracts and
Management Fees - continued
Nature, Extent, and Quality of Services Provided. The Board considered the staffing within the investment adviser, FMR, and the sub-advisers (together, the Investment Advisers), including the backgrounds of the fund's investment personnel and the fund's investment objective and discipline. The Independent Trustees also had discussions with senior management of Fidelity's investment operations and investment groups. The Board considered the structure of the portfolio manager compensation program and whether this structure provides appropriate incentives to act in the best interest of the fund.
Resources Dedicated to Investment Management and Support Services. The Board and the equity research subcommittee of the Board's Fund Oversight Committee reviewed the size, education, and experience of the Investment Advisers' investment staff, their use of technology, and the Investment Advisers' approach to recruiting, training, and retaining portfolio managers and other research, advisory, and management personnel. The Board noted that Fidelity's analysts have access to a variety of technological tools and market and securities data that enable them to perform both fundamental and quantitative analysis and to specialize in various disciplines. The Board considered Fidelity's extensive global research capabilities that enable the Investment Advisers to aggregate data from various sources in an effort to produce positive investment results. The Board also considered that Fidelity's portfolio managers and analysts have access to daily portfolio attribution that allows for monitoring of a fund's portfolio, as well as an electronic communication system that provides immediate real-time access to research concerning issuers and credit enhancers. The Board noted FMR's continued focus on strengthening the organization and discipline of equity portfolio management and research.
Shareholder and Administrative Services. The Board considered (i) the nature, extent, quality, and cost of advisory, administrative, and shareholder services performed by the Investment Advisers and their affiliates under the Advisory Contracts and under separate agreements covering transfer agency, pricing and bookkeeping, and securities lending services for the fund; (ii) the nature and extent of the investment adviser's supervision of third party service providers, principally custodians and subcustodians; and (iii) the resources devoted to, and the record of compliance with, the fund's compliance policies and procedures. The Board also reviewed the allocation of fund brokerage, including allocations to brokers affiliated with the Investment Advisers, the use of brokerage commissions to pay fund expenses, and the use of "soft" commission dollars to pay for research services.
The Board noted that the growth of fund assets over time across the complex allows Fidelity to reinvest in the development of services designed to enhance the value or convenience of the Fidelity funds as investment vehicles. These services include 24-hour access to account information and market information through phone representatives and over the Internet, and investor education materials and asset allocation tools.
Annual Report
Investment in a Large Fund Family. The Board considered the benefits to shareholders of investing in a Fidelity fund, including the benefits of investing in a fund that is part of a large family of funds offering a variety of investment disciplines and providing a large variety of mutual fund investor services. The Board noted that Fidelity had taken, or had made recommendations that resulted in the Fidelity funds taking, a number of actions over the previous year that benefited particular funds, including (i) dedicating additional resources to investment research and restructuring and broadening the focus of the investment research teams; (ii) bolstering the senior management team that oversees asset management; (iii) launching Class F of certain funds as a lower-fee class available to Freedom K and Freedom Index Funds; (iv) lowering the initial investment minimums and ongoing balance requirements for Real Estate High Income Fund; (v) eliminating subsequent purchase minimums for all funds and adding a waiver of the investment minimum requirement for new accounts opened with the proceeds of a systematic withdrawal plan; (vi) eliminating the withdrawal minimum and maximum limits for systematic withdrawals from Advisor funds; (vii) expanding sales load waivers on Class A shares for Destiny Planholders and expanding Institutional Class eligibility for Class O Destiny Planholders; and (viii) changing certain Class A and Class T sales charge structures to further align them with industry practices.
Investment Performance. The Board considered whether the fund has operated in accordance with its investment objective, as well as its record of compliance with its investment restrictions. The Board noted that it is not possible to evaluate performance in any comprehensive fashion because the fund had been in operation for less than one calendar year. Once the fund has been in operation for at least one calendar year, the Board will review the fund's absolute investment performance for each class, as well as the fund's relative investment performance for each class measured against a broad-based securities market index and, if a meaningful peer group exists, a peer group of mutual funds.
Based on its review, and giving particular weight to the nature and quality of the resources dedicated by the Investment Advisers to maintain and improve relative performance and factoring in the unprecedented market events in recent years, the Board concluded that the nature, extent, and quality of investment management and support services and of shareholder and administrative services provided to the fund will benefit the fund's shareholders, particularly in light of the Board's view that the fund's shareholders benefit from investing in a fund that is part of a large family of funds offering a variety of investment disciplines and services.
Annual Report
Board Approval of Investment Advisory Contracts and
Management Fees - continued
Competitiveness of Management Fee and Total Fund Expenses. The Board considered the fund's management fee and total expenses compared to "mapped groups" of competitive funds and classes. Fidelity creates "mapped groups" by combining similar Lipper investment objective categories that have comparable management fee characteristics. Combining Lipper investment objective categories aids the Board's management fee and total expense comparisons by broadening the competitive group used for comparison and by reducing the number of universes to which various Fidelity funds are compared.
Management Fee. The Board considered two proprietary management fee comparisons for the period of the fund's operations shown in the chart below. The group of Lipper funds used by the Board for management fee comparisons is referred to below as the "Total Mapped Group." The Total Mapped Group comparison focuses on a fund's standing relative to the total universe of comparable funds available to investors, in terms of gross management fees before expense reimbursements or caps. "TMG %" represents the percentage of funds in the Total Mapped Group that had management fees that were lower than the fund's. For example, a TMG % of 29% means that 71% of the funds in the Total Mapped Group had higher management fees than the fund. The "Asset-Size Peer Group" (ASPG) comparison focuses on a fund's standing relative to non-Fidelity funds similar in size to the fund within the Total Mapped Group. The ASPG represents at least 15% of the funds in the Total Mapped Group with comparable asset size and management fee characteristics, subject to a minimum of 50 funds (or all funds in the Total Mapped Group if fewer than 50). Additional information, such as the ASPG quartile in which the fund's management fee ranked, is also included in the chart and considered by the Board.
Fidelity Global Commodity Stock Fund

Annual Report
The Board noted that the fund's management fee ranked below the median of its Total Mapped Group and below the median of its ASPG for the period.
Based on its review, the Board concluded that the fund's management fee is fair and reasonable in light of the services that the fund receives and the other factors considered.
Total Expenses. In its review of each class's total expenses, the Board considered the fund's management fee as well as other fund or class expenses, as applicable, such as transfer agent fees, pricing and bookkeeping fees, fund-paid 12b-1 fees, and custodial, legal, and audit fees. The Board also noted the effects of any waivers and reimbursements on fees and expenses. As part of its review, the Board also considered current and historical total expenses of each class of the fund compared to competitive fund median expenses. Each class of the fund is compared to those funds and classes in the Total Mapped Group (used by the Board for management fee comparisons) that have a similar sales load structure.
The Board noted that the total expenses of the retail class ranked below its competitive median for the period and the total expenses of each of Class A, Class T, Class B, Class C, and Institutional Class ranked above its competitive median for the period. The Board considered that total expenses for Class T were above median primarily because its 12b-1 fee is higher than the typical front-end load class. The Board noted that the fund offers multiple classes, each of which has a different sales load and 12b-1 fee structure, and that the multiple structures are intended to offer a range of pricing options for the intermediary market. The Board also noted that the total expenses of the classes vary primarily by the level of their 12b-1 fees, although differences in transfer agent fees may also cause expenses to vary from class to class.
Fees Charged to Other Fidelity Clients. The Board also considered Fidelity fee structures and other information with respect to clients of FMR and its affiliates, such as other mutual funds advised or subadvised by FMR or its affiliates, pension plan clients, and other institutional clients. In March 2010, the Board created an ad hoc joint committee with the board of other Fidelity funds (the Committee) to review and compare Fidelity's institutional investment advisory business with its business of providing services to the Fidelity funds, including the differences in services provided, fees charged, and costs incurred, as well as competition in their respective marketplaces.
Based on its review of total expenses and fees charged to other Fidelity clients, the Board concluded that the total expenses of each class of the fund were reasonable, although in some cases above the median of the universe presented for comparison, in light of the services that the fund and its shareholders receive and the other factors considered, including the findings of the Committee.
Annual Report
Board Approval of Investment Advisory Contracts and
Management Fees - continued
Costs of the Services and Profitability. The Board considered the revenues earned and the expenses incurred by Fidelity in conducting the business of developing, marketing, distributing, managing, administering and servicing the fund and its shareholders. The Board also considered the level of Fidelity's profits in respect of all the Fidelity funds.
On an annual basis, FMR presents to the Board Fidelity's profitability for the fund. Fidelity calculates the profitability for each fund, as well as aggregate profitability for groups of Fidelity funds and all Fidelity funds, using a series of detailed revenue and cost allocation methodologies which originate with the audited books and records of Fidelity. The Audit Committee of the Board reviews any significant changes from the prior year's methodologies.
PricewaterhouseCoopers LLP (PwC), independent registered public accounting firm and auditor to Fidelity and certain Fidelity funds, has been engaged annually by the Board as part of the Board's assessment of Fidelity's profitability analysis. PwC's engagement includes the review and assessment of Fidelity's methodologies used in determining the revenues and expenses attributable to Fidelity's mutual fund business, and completion of agreed-upon procedures surrounding the mathematical accuracy of fund profitability and its conformity to allocation methodologies. After considering PwC's reports issued under the engagement and information provided by Fidelity, the Board believes that while other allocation methods may also be reasonable, Fidelity's profitability methodologies are reasonable in all material respects.
The Board has also reviewed Fidelity's non-fund businesses and fall-out benefits related to the mutual fund business as well as cases where Fidelity's affiliates may benefit from or be related to the fund's business.
The Board considered the costs of the services provided by and the profits realized by Fidelity in connection with the operation of the fund and were satisfied that the profitability was not excessive in the circumstances.
Economies of Scale. The Board considered whether there have been economies of scale in respect of the management of the Fidelity funds, whether the Fidelity funds (including the fund) have appropriately benefited from any such economies of scale, and whether there is potential for realization of any further economies of scale. The Board considered the extent to which the fund will benefit from economies of scale through increased services to the fund, through waivers or reimbursements, or through fee or expense reductions.
In February 2009, the Board and the board of other Fidelity funds created an ad hoc committee (the Economies of Scale Committee) to analyze whether FMR attains economies of scale in respect of the management and servicing of the Fidelity funds, whether the Fidelity funds have appropriately benefited from such economies of scale, and whether there is potential for realization of any further economies of scale.
Annual Report
The Board recognized that the fund's management contract incorporates a "group fee" structure, which provides for lower group fee rates as total fund assets under FMR's management increase, and for higher group fee rates as total fund assets under FMR's management decrease. FMR calculates the group fee rates based on a tiered asset "breakpoint" schedule that varies based on asset class. The Board considered that the group fee is designed to deliver the benefits of economies of scale to fund shareholders when total Fidelity fund assets increase, even if assets of any particular fund are unchanged or have declined, because some portion of Fidelity's costs are attributable to services provided to all Fidelity funds, and all funds benefit if those costs can be allocated among more assets. The Board concluded that, given the group fee structure, fund shareholders will benefit from lower management fees as assets under FMR's management increase at the fund complex level, regardless of whether Fidelity achieves any such economies of scale.
The Board concluded, considering the findings of the Economies of Scale Committee, that any potential economies of scale are being appropriately shared between fund shareholders and Fidelity.
Additional Information Requested by the Board. In order to develop fully the factual basis for consideration of the Fidelity funds' Advisory Contracts, the Board requested and received additional information on certain topics, including (i) fund performance trends, actions to be taken by FMR to improve certain funds' overall performance, and Fidelity's long-term strategies for certain funds; (ii) portfolio manager changes that have occurred during the past year and length of portfolio manager tenure for different categories of funds over time; (iii) Fidelity's compensation structure for portfolio managers, research analysts, and other key personnel, the rationale for the compensation structure, and how the compensation structure provides appropriate performance incentives; (iv) the amount of the investment that each portfolio manager has made in the Fidelity fund(s) that he or she manages; (v) management and other fees paid by FMR to affiliated sub-advisers on behalf of the Fidelity funds; (vi) Fidelity's fee structures and rationale for recommending different fees among different categories of funds; (vii) Fidelity's rationale for recommending which funds should have a performance adjustment component as part of their management fees; (viii) the rationale for any differences between fund fee structures and fee structures in place for other Fidelity clients; and (ix) explanations regarding the relative total expenses borne by certain funds and classes, total expense competitive trends, and actions that might be taken by FMR to reduce total expenses for certain funds and classes.
Based on its evaluation of all of the conclusions noted above, and after considering all factors it believed relevant, the Board ultimately concluded that the advisory fee structures are fair and reasonable, and that the fund's Advisory Contracts should be renewed.
Annual Report
Managing Your Investments
Fidelity offers several ways to conveniently manage your personal investments via your telephone or PC. You can access your account information, conduct trades and research your investments 24 hours a day.
By Phone
Fidelity Automated Service Telephone provides a single toll-free number to access account balances, positions, quotes and trading. It's easy to navigate the service, and on your first call, the system will help you create a personal identification number (PIN) for security.
(phone_graphic)
Fidelity Automated
Service Telephone (FAST®)
1-800-544-5555
Press
 For mutual fund and brokerage trading.
 For quotes.*
 For account balances and holdings.
 To review orders and mutual
fund activity.
 To change your PIN.

 To speak to a Fidelity representative.
By PC
Fidelity's web site on the Internet provides a wide range of information, including daily financial news, fund performance, interactive planning tools and news about Fidelity products and services.
(computer_graphic)
Fidelity's Web Site
www.fidelity.com
* When you call the quotes line, please remember that a fund's yield and return will vary and, except for money market funds, share price will also vary. This means that you may have a gain or loss when you sell your shares. There is no assurance that money market funds will be able to maintain a stable $1 share price; an investment in a money market fund is not insured or guaranteed by the U.S. government. Total returns are historical and include changes in share price, reinvestment of dividends and capital gains, and the effects of any sales charges.
Annual Report
To Visit Fidelity
For directions and hours,
please call 1-800-544-9797.
Arizona
7001 West Ray Road
Chandler, AZ
15445 N. Scottsdale Road
Scottsdale, AZ
17550 North 75th Avenue
Glendale, AZ
5330 E. Broadway Blvd
Tucson, AZ
California
815 East Birch Street
Brea, CA
1411 Chapin Avenue
Burlingame, CA
851 East Hamilton Avenue
Campbell, CA
601 Larkspur Landing Circle
Larkspur, CA
2000 Avenue of the Stars
Los Angeles, CA
27101 Puerta Real
Mission Viejo, CA
73575 El Paseo
Palm Desert, CA
251 University Avenue
Palo Alto, CA
123 South Lake Avenue
Pasadena, CA
16656 Bernardo Ctr. Drive
Rancho Bernardo, CA
1220 Roseville Parkway
Roseville, CA
1740 Arden Way
Sacramento, CA
7676 Hazard Center Drive
San Diego, CA
11943 El Camino Real
San Diego, CA
8 Montgomery Street
San Francisco, CA
3793 State Street
Santa Barbara, CA
1200 Wilshire Boulevard
Santa Monica, CA
398 West El Camino Real
Sunnyvale, CA
111 South Westlake Blvd
Thousand Oaks, CA
21701 Hawthorne Boulevard
Torrance, CA
2001 North Main Street
Walnut Creek, CA
6326 Canoga Avenue
Woodland Hills, CA
2211 Michelson Drive
Irvine, CA
Colorado
281 East Flatiron Circle
Broomfield, CO
1625 Broadway
Denver, CO
9185 Westview Road
Lone Tree, CO
Connecticut
48 West Putnam Avenue
Greenwich, CT
265 Church Street
New Haven, CT
300 Atlantic Street
Stamford, CT
29 South Main Street
West Hartford, CT
1261 Post Road
Fairfield, CT
Delaware
400 Delaware Avenue
Wilmington, DE
Florida
175 East Altamonte Drive
Altamonte Springs, FL
1400 Glades Road
Boca Raton, FL
121 Alhambra Plaza
Coral Gables, FL
2948 N. Federal Highway
Ft. Lauderdale, FL
4671 Town Center Parkway
Jacksonville, FL
8880 Tamiami Trail, North
Naples, FL
230 Royal Palm Way
Palm Beach, FL
3501 PGA Boulevard
Palm Beach Gardens, FL
3550 Tamiami Trail, South
Sarasota, FL
1502 N. Westshore Blvd.
Tampa, FL
2465 State Road 7
Wellington, FL
Georgia
3242 Peachtree Road
Atlanta, GA
1000 Abernathy Road
Atlanta, GA
Illinois
One North LaSalle Street
Chicago, IL
401 North Michigan Avenue
Chicago, IL
One Skokie Valley Road
Highland Park, IL
1415 West 22nd Street
Oak Brook, IL
15105 S LaGrange Road
Orland Park, IL
1572 East Golf Road
Schaumburg, IL
1823 Freedom Drive
Naperville, IL
Indiana
8480 Keystone Crossing
Indianapolis, IN
Kansas
5400 College Boulevard
Overland Park, KS
Maine
Three Canal Plaza
Portland, ME
Maryland
7315 Wisconsin Avenue
Bethesda, MD
610 York Road
Towson, MD
Massachusetts
801 Boylston Street
Boston, MA
155 Congress Street
Boston, MA
300 Granite Street
Braintree, MA
44 Mall Road
Burlington, MA
238 Main Street
Cambridge, MA
200 Endicott Street
Danvers, MA
Fidelity Brokerage Services, Inc., 100 Summer St., Boston, MA 02110 Member NYSE/SIPC
Annual Report
405 Cochituate Road
Framingham, MA
551 Boston Turnpike
Shrewsbury, MA
Michigan
500 E. Eisenhower Pkwy.
Ann Arbor, MI
280 N. Old Woodward Ave.
Birmingham, MI
30200 Northwestern Hwy.
Farmington Hills, MI
43420 Grand River Avenue
Novi, MI
3480 28th Street
Grand Rapids, MI
2425 S. Linden Road STE E
Flint, MI
Minnesota
7740 France Avenue South
Edina, MN
8342 3rd Street North
Oakdale, MN
Missouri
1524 South Lindbergh Blvd.
St. Louis, MO
Nevada
2225 Village Walk Drive
Henderson, NV
New Jersey
501 Route 73 South
Marlton, NJ
150 Essex Street
Millburn, NJ
35 Morris Street
Morristown, NJ
396 Route 17, North
Paramus, NJ
3518 Route 1 North
Princeton, NJ
530 Broad Street
Shrewsbury, NJ
New Mexico
2261 Q Street NE
Albuquerque, NM
New York
1130 Franklin Avenue
Garden City, NY
37 West Jericho Turnpike
Huntington Station, NY
1271 Avenue of the Americas
New York, NY
980 Madison Avenue
New York, NY
61 Broadway
New York, NY
350 Park Avenue
New York, NY
200 Fifth Avenue
New York, NY
733 Third Avenue
New York, NY
2070 Broadway
New York, NY
1075 Northern Blvd.
Roslyn, NY
799 Central Park Avenue
Scarsdale, NY
3349 Monroe Avenue
Rochester, NY
North Carolina
4611 Sharon Road
Charlotte, NC
7011 Fayetteville Road
Durham, NC
Ohio
3805 Edwards Road
Cincinnati, OH
1324 Polaris Parkway
Columbus, OH
1800 Crocker Road
Westlake, OH
28699 Chagrin Boulevard
Woodmere Village, OH
Oregon
7493 SW Bridgeport Road
Tigard, OR
Pennsylvania
600 West DeKalb Pike
King of Prussia, PA
1735 Market Street
Philadelphia, PA
12001 Perry Highway
Wexford, PA
Rhode Island
10 Memorial Boulevard
Providence, RI
Tennessee
3018 Peoples Street
Johnson City, TN
7628 West Farmington Blvd.
Germantown, TN
2035 Mallory Lane
Franklin, TN
Texas
10000 Research Boulevard
Austin, TX
4001 Northwest Parkway
Dallas, TX
12532 Memorial Drive
Houston, TX
2701 Drexel Drive
Houston, TX
6560 Fannin Street
Houston, TX
1701 Lake Robbins Drive
The Woodlands, TX
6500 N. MacArthur Blvd.
Irving, TX
6005 West Park Boulevard
Plano, TX
1576 East Southlake Blvd.
Southlake, TX
15600 Southwest Freeway
Sugar Land, TX
139 N. Loop 1604 East
San Antonio, TX
Utah
279 West South Temple
Salt Lake City, UT
Virginia
1861 International Drive
McLean, VA
11957 Democracy Drive
Reston, VA
Washington
10500 NE 8th Street
Bellevue, WA
1518 6th Avenue
Seattle, WA
304 Strander Blvd
Tukwila, WA
Washington, DC
1900 K Street, N.W.
Washington, DC
Wisconsin
16020 West Bluemound Road
Brookfield, WI
Annual Report
Investment Adviser
Fidelity Management & Research Company
Boston, MA
Investment Sub-Advisers
FMR Co., Inc.
Fidelity Management &
Research (U.K.) Inc.
Fidelity Research & Analysis Company
FIL Investments (Japan) Limited
FIL Investment Advisors
FIL Investment Advisors
(U.K.) Limited
Fidelity Management & Research
(Hong Kong) Limited
Fidelity Management & Research
(Japan) Inc.
General Distributor
Fidelity Distributors Corporation
Boston, MA
Transfer and Service Agents
Fidelity Investments Institutional
Operations Company, Inc.
Boston, MA
Fidelity Service Company, Inc.
Boston, MA
Custodian
State Street Bank and Trust Company
Quincy, MA
The Fidelity Telephone Connection
Mutual Fund 24-Hour Service
Exchanges/Redemptions
and Account Assistance 1-800-544-6666
Product Information 1-800-544-6666
Retirement Accounts 1-800-544-4774
(8 a.m. - 9 p.m.)
TDD Service 1-800-544-0118
for the deaf and hearing impaired
(9 a.m. - 9 p.m. Eastern time)
Fidelity Automated Service
Telephone (FAST®)
1-800-544-5555

Automated line for quickest service
GCS-UANN-1210
1.879379.101
(Fidelity Investment logo)(registered trademark)
Fidelity AdvisorSM
Global Commodity Stock
Fund - Class A, Class T, Class B
and Class C
Annual Report
October 31, 2010
Class A, Class T, Class B,
and Class C are classes
of Fidelity® Global Commodity
Stock Fund
(2_fidelity_logos) (Registered_Trademark)
Contents
Chairman's Message | <Click Here> | The Chairman's message to shareholders. |
Performance | <Click Here> | How the fund has done over time. |
Management's Discussion of Fund Performance | <Click Here> | The Portfolio Manager's review of fund performance and strategy. |
Shareholder Expense Example | <Click Here> | An example of shareholder expenses. |
Investment Changes | <Click Here> | A summary of major shifts in the fund's investments over the past six months. |
Investments | <Click Here> | A complete list of the fund's investments with their market values. |
Financial Statements | <Click Here> | Statements of assets and liabilities, operations, and changes in net assets, as well as financial highlights. |
Notes | <Click Here> | Notes to the financial statements. |
Report of Independent Registered Public Accounting Firm | <Click Here> | |
Trustees and Officers | <Click Here> | |
Distributions | <Click Here> | |
Board Approval of Investment Advisory Contracts and Management Fees | <Click Here> | |
To view a fund's proxy voting guidelines and proxy voting record for the 12-month period ended June 30, visit http://www.fidelity.com/proxyvotingresults or visit the Securities and Exchange Commission's (SEC) web site at http://www.sec.gov. You may also call 1-877-208-0098 to request a free copy of the proxy voting guidelines.
Standard & Poor's, S&P and S&P 500 are registered service marks of The McGraw-Hill Companies, Inc. and have been licensed for use by Fidelity Distributors Corporation.
Other third party marks appearing herein are the property of their respective owners.
All other marks appearing herein are registered or unregistered trademarks or service marks of FMR LLC or an affiliated company.
Annual Report
This report and the financial statements contained herein are submitted for the general information of the shareholders of the fund. This report is not authorized for distribution to prospective investors in the fund unless preceded or accompanied by an effective prospectus.
A fund files its complete schedule of portfolio holdings with the SEC for the first and third quarters of each fiscal year on Form N-Q. Forms N-Q are available on the SEC's web site at http://www.sec.gov. A fund's Forms N-Q may be reviewed and copied at the SEC's Public Reference Room in Washington, DC. Information regarding the operation of the SEC's Public Reference Room may be obtained by calling 1-800-SEC-0330. For a complete list of a fund's portfolio holdings, view the most recent holdings listing, semiannual report, or annual report on Fidelity's web site at http://www.fidelity.com or http://www.advisor.fidelity.com, as applicable.
NOT FDIC INSURED • MAY LOSE VALUE • NO BANK GUARANTEE
Neither the fund nor Fidelity Distributors Corporation is a bank.
Annual Report
(photo_of_Edward_C_Johnson_3d)
Dear Shareholder:
Equities have staged a rally in the second half of 2010, shaking off concerns about the European debt crisis and the possibility of a double-dip recession in the U.S. Although the short-term surge pushed major equity indexes back into positive territory for the year, several questions remain about the longer-term outlook, including lackluster economic growth and persistently high unemployment. Financial markets are always unpredictable, of course, but there also are several time-tested investment principles that can help put the odds in your favor.
One of the basic tenets is to invest for the long term. Over time, riding out the markets' inevitable ups and downs has proven much more effective than selling into panic or chasing the hottest trend. Even missing only a few of the markets' best days can significantly diminish investor returns. Patience also affords the benefits of compounding - of earning interest on additional income or reinvested dividends and capital gains. There can be tax advantages and cost benefits to consider as well. While staying the course doesn't eliminate risk, it can considerably lessen the effect of short-term declines.
You can further manage your investing risk through diversification. And today, more than ever, geographic diversification should be taken into account. Studies indicate that asset allocation is the single most important determinant of a portfolio's long-term success. The right mix of stocks, bonds and cash - aligned to your particular risk tolerance and investment objective - is very important. Age-appropriate rebalancing is also an essential aspect of asset allocation. For younger investors, an emphasis on equities - which historically have been the best-performing asset class over time - is encouraged. As investors near their specific goal, such as retirement or sending a child to college, consideration may be given to replacing volatile assets (e.g. common stocks) with more-stable fixed investments (bonds or savings plans).
A third principle - investing regularly - can help lower the average cost of your purchases. Investing a certain amount of money each month or quarter helps ensure you won't pay for all your shares at market highs. This strategy - known as dollar cost averaging - also reduces "emotion" from investing, helping shareholders avoid selling weak performers just prior to an upswing, or chasing a hot performer just before a correction.
We invite you to contact us via the Internet, through our Investor Centers or by phone. It is our privilege to provide you the information you need to make the investments that are right for you.
Sincerely,
(The chairman's signature appears here.)
Edward C. Johnson 3d
Annual Report
Average annual total return reflects the change in the value of an investment, assuming reinvestment of the class' distributions from dividend income and capital gains (the profits earned upon the sale of securities that have grown in value, if any) and assuming a constant rate of performance each year. The $10,000 table and the fund's returns do not reflect the deduction of taxes that a shareholder would pay on fund distributions or the redemption of fund shares. During periods of reimbursement by Fidelity, a fund's total return will be greater than it would be had the reimbursement not occurred. How a fund did yesterday is no guarantee of how it will do tomorrow.
Average Annual Total Returns
Periods ended October 31, 2010 | Past 1
year | Life of
fund A |
Class A (incl. 5.75% sales charge) | 11.25% | 27.63% |
Class T (incl. 3.50% sales charge) | 13.61% | 29.18% |
Class B (incl. contingent deferred sales charge) B | 12.23% | 29.30% |
Class C (incl. contingent deferred sales charge) C | 16.21% | 31.42% |
A From March 25, 2009.
B Class B shares' contingent deferred sales charges included in the past one year and life of fund total return figures are 5% and 4%, respectively.
C Class C shares' contingent deferred sales charges included in the past one year and life of fund total return figures are 1% and 0%, respectively.
Annual Report
$10,000 Over Life of Fund
Let's say hypothetically that $10,000 was invested in Fidelity AdvisorSM Global Commodity Stock Fund - Class A on March 25, 2009, when the fund started, and the current 5.75% sales charge was paid. The chart shows how the value of your investment would have changed, and also shows how the MSCI® ACWI® (All Country World Index) Index performed over the same period.
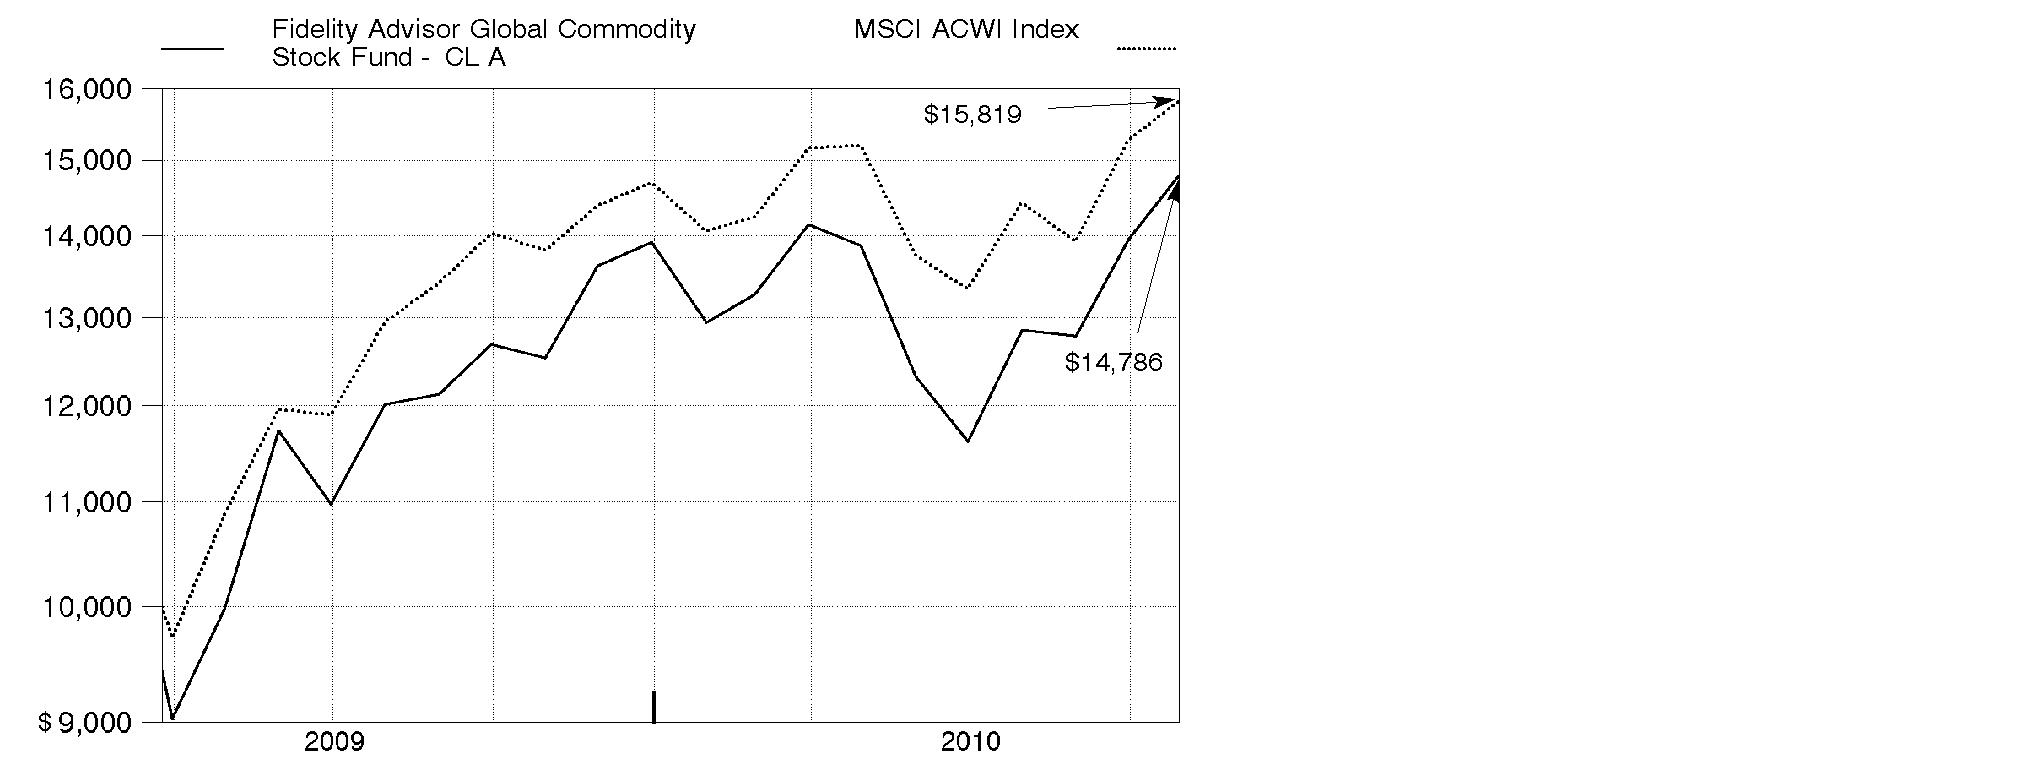
Annual Report
Market Recap: International stocks rode a wave of volatility similar to that of their U.S. counterparts during the 12 months ending October 31, 2010. Stocks gained modestly in the first half of the period, despite growing concerns about the European debt crisis. Sentiment turned decidedly negative in May and June, however, and the market suffered a precipitous decline. These losses were more than offset during the last four months of the period, when signs of economic growth and subsiding debt fears helped propel international stocks about 21%. For the full year, the MSCI® ACWI® (All Country World Index) ex USA Index gained 12.76%, boosted in part by a generally depreciating U.S. dollar. Within the index, Canada and emerging markets were standouts, returning 23% and 24%, respectively. Results in the latter group were led by strong-performing India, Mexico and South Africa, while China fell short of the MSCI benchmark due to cooling economic growth. The developed Asia ex Japan segment rose 16% for the period, lifted by solid results from Singapore and Hong Kong. Meanwhile, Europe rose just 9%, held back mainly by debt-riddled Spain and Italy, as well as lagging major constituent France. Japan returned only 5%, a result of that nation's continued weak economy.
Comments from S. Joseph Wickwire II, Portfolio Manager of Fidelity AdvisorSM Global Commodity Stock Fund: During the year, the fund's Class A, Class T, Class B and Class C shares returned 18.04%, 17.73%, 17.23% and 17.21%, respectively (excluding sales charges), versus 17.46% for the MSCI ACWI (All Country World Index) Commodity Producers Sector Capped Index and 14.47% for the MSCI ACWI (All Country World Index) Index. Versus the capped index, performance was aided by stock selection and an overweighting in gold, as well as an underweighting and favorable picks in integrated oil/gas. Geographically, security selection in the U.S. and U.K. added value. Notable contributors included Randgold Resources, a U.K.-based company with most of its assets in West Africa. Out-of-index positions in Lihir Gold, headquartered in Papua New Guinea, and Australia's Centennial Coal also helped, as did fertilizer maker Mosaic. Lihir and Centennial were acquired during the period. Conversely, stock selection in oil and gas exploration/production and in agricultural products was mildly negative, while underweighting Canada and Chile dampened the fund's gain a bit. Our small cash position also was a slight detractor. Underweighted exposure to Potash Corp. of Saskatchewan and strong-performing metals miner Rio Tinto - an index component - hampered the fund's results. Out-of-benchmark positions in Duoyuan Global Water, one of the top providers of water treatment equipment in China, and OPTI Canada, a small Canadian oil producer, also detracted.
The views expressed above reflect those of the portfolio manager(s) only through the end of the period as stated on the cover of this report and do not necessarily represent the views of Fidelity or any other person in the Fidelity organization. Any such views are subject to change at any time based upon market or other conditions and Fidelity disclaims any responsibility to update such views. These views may not be relied on as investment advice and, because investment decisions for a Fidelity fund are based on numerous factors, may not be relied on as an indication of trading intent on behalf of any Fidelity fund.
Annual Report
Shareholder Expense Example
As a shareholder of the Fund, you incur two types of costs: (1) transaction costs, including sales charges (loads) on purchase payments or redemption proceeds, redemption fees, and (2) ongoing costs, including management fees, distribution and/or service (12b-1) fees and other Fund expenses. This Example is intended to help you understand your ongoing costs (in dollars) of investing in the Fund and to compare these costs with the ongoing costs of investing in other mutual funds.
The Example is based on an investment of $1,000 invested at the beginning of the period and held for the entire period (May 1, 2010 to October 31, 2010).
Actual Expenses
The first line of the accompanying table for each class of the Fund provides information about actual account values and actual expenses. You may use the information in this line, together with the amount you invested, to estimate the expenses that you paid over the period. Simply divide your account value by $1,000.00 (for example, an $8,600 account value divided by $1,000.00 = 8.6), then multiply the result by the number in the first line for a class of the Fund under the heading entitled "Expenses Paid During Period" to estimate the expenses you paid on your account during this period. A small balance maintenance fee of $12.00 that is charged once a year may apply for certain accounts with a value of less than $2,000. This fee is not included in the table below. If it was, the estimate of expenses you paid during the period would be higher, and your ending account value lower, by this amount. In addition, the Fund, as a shareholder in the underlying Fidelity Central Funds, will indirectly bear its pro-rata share of the fees and expenses incurred by the underlying Fidelity Central Funds. These fees and expenses are not included in the Fund's annualized expense ratio used to calculate the expense estimate in the table below.
Hypothetical Example for Comparison Purposes
The second line of the accompanying table for each class of the Fund provides information about hypothetical account values and hypothetical expenses based on a Class' actual expense ratio and an assumed rate of return of 5% per year before expenses, which is not the Class' actual return. The hypothetical account values and expenses may not be used to estimate the actual ending account balance or expenses you paid for the period. You may use this information to compare the ongoing costs of investing in the Fund and other funds. To do so, compare this 5% hypothetical example with the 5% hypothetical examples that appear in the shareholder reports of the other funds. A small balance maintenance fee of $12.00 that is charged once a year may apply for certain accounts with a value of less than $2,000. This fee is not included in the table below. If it was, the estimate of expenses you paid during the period would be higher, and your ending account value lower, by this amount. In addition, the Fund, as a shareholder in the underlying Fidelity Central Funds, will indirectly bear its pro-rata share of the fees and expenses incurred by the underlying Fidelity Central Funds. These fees and expenses are not included in the Fund's annualized expense ratio used to calculate the expense estimate in the table below.
Please note that the expenses shown in the table are meant to highlight your ongoing costs only and do not reflect any transaction costs. Therefore, the second line of the table is useful in comparing ongoing costs only, and will not help you determine the relative total costs of owning different funds. In addition, if these transactional costs were included, your costs would have been higher.
Annual Report
| Annualized
Expense
Ratio | Beginning
Account Value
May 1, 2010 | Ending
Account Value
October 31, 2010 | Expenses Paid
During Period*
May 1, 2010 to
October 31, 2010 |
Class A | 1.35% | | | |
Actual | | $ 1,000.00 | $ 1,065.60 | $ 7.03 |
HypotheticalA | | $ 1,000.00 | $ 1,018.40 | $ 6.87 |
Class T | 1.59% | | | |
Actual | | $ 1,000.00 | $ 1,064.30 | $ 8.27 |
HypotheticalA | | $ 1,000.00 | $ 1,017.19 | $ 8.08 |
Class B | 2.11% | | | |
Actual | | $ 1,000.00 | $ 1,061.80 | $ 10.97 |
HypotheticalA | | $ 1,000.00 | $ 1,014.57 | $ 10.71 |
Class C | 2.11% | | | |
Actual | | $ 1,000.00 | $ 1,061.10 | $ 10.96 |
HypotheticalA | | $ 1,000.00 | $ 1,014.57 | $ 10.71 |
Global Commodity Stock | 1.05% | | | |
Actual | | $ 1,000.00 | $ 1,066.80 | $ 5.47 |
HypotheticalA | | $ 1,000.00 | $ 1,019.91 | $ 5.35 |
Institutional Class | 1.05% | | | |
Actual | | $ 1,000.00 | $ 1,066.80 | $ 5.47 |
HypotheticalA | | $ 1,000.00 | $ 1,019.91 | $ 5.35 |
A 5% return per year before expenses
* Expenses are equal to each Class' annualized expense ratio, multiplied by the average account value over the period, multiplied by 184/365 (to reflect the one-half year period).
Annual Report
Investment Changes (Unaudited)
Top Ten Stocks as of October 31, 2010 |
| % of fund's
net assets | % of fund's net assets
6 months ago |
BHP Billiton PLC | 5.5 | 4.5 |
Exxon Mobil Corp. | 4.8 | 4.7 |
Potash Corp. of Saskatchewan, Inc. | 4.1 | 2.2 |
Monsanto Co. | 2.9 | 3.8 |
Rio Tinto PLC | 2.9 | 2.3 |
Royal Dutch Shell PLC Class A (United Kingdom) | 2.8 | 2.6 |
Syngenta AG (Switzerland) | 2.6 | 2.7 |
Chevron Corp. | 2.3 | 2.5 |
Vale SA (PN-A) sponsored ADR | 2.1 | 2.1 |
Archer Daniels Midland Co. | 2.1 | 1.9 |
| 32.1 | |
Top Sectors (% of fund's net assets) |
As of October 31, 2010 |
| Agriculture 26.2% | |
| Energy 32.8% | |
| Metals 34.6% | |
| All Others* 6.4% | |

As of April 30, 2010 |
| Agriculture 27.3% | |
| Energy 35.6% | |
| Metals 31.6% | |
| All Others* 5.5% | |

* Includes short-term investments and net other assets. |
Annual Report
Investments October 31, 2010
Showing Percentage of Net Assets
Common Stocks - 99.2% |
| Shares | | Value |
CHEMICALS - 18.5% |
Commodity Chemicals - 0.0% |
Grasim Industries Ltd. | 3,318 | | $ 174,452 |
Diversified Chemicals - 0.4% |
Dow Chemical Co. | 52,600 | | 1,621,658 |
Fertilizers & Agricultural Chemicals - 17.9% |
Agrium, Inc. | 62,300 | | 5,511,037 |
CF Industries Holdings, Inc. | 35,072 | | 4,297,372 |
China BlueChemical Ltd. (H shares) | 770,000 | | 608,947 |
Fertilizantes Fosfatados SA (PN) (a) | 7,600 | | 85,998 |
Fertilizantes Heringer SA (a) | 67,300 | | 376,614 |
Incitec Pivot Ltd. | 663,200 | | 2,416,898 |
Israel Chemicals Ltd. | 213,700 | | 3,268,699 |
Israel Corp. Ltd. (Class A) (a) | 100 | | 107,290 |
K&S AG | 59,707 | | 4,154,796 |
Makhteshim-Agan Industries | 45,000 | | 226,176 |
Monsanto Co. | 210,100 | | 12,484,142 |
Nufarm Ltd. (d) | 205,300 | | 915,106 |
Potash Corp. of Saskatchewan, Inc. | 122,400 | | 17,701,735 |
Sinofert Holdings Ltd. (a) | 1,632,000 | | 863,241 |
Sociedad Quimica y Minera de Chile SA (PN-B) sponsored ADR | 5,400 | | 279,720 |
Syngenta AG (Switzerland) | 41,272 | | 11,424,180 |
Taiwan Fertilizer Co. Ltd. | 448,000 | | 1,529,685 |
The Mosaic Co. | 65,200 | | 4,770,032 |
United Phosphorous Ltd. | 314,732 | | 1,415,140 |
Uralkali JSC GDR (Reg. S) | 62,100 | | 1,536,975 |
Yara International ASA | 80,600 | | 4,236,820 |
| | 78,210,603 |
Specialty Chemicals - 0.2% |
Innophos Holdings, Inc. | 24,000 | | 881,280 |
Johnson Matthey PLC | 2,900 | | 88,929 |
| | 970,209 |
TOTAL CHEMICALS | | 80,976,922 |
CONSTRUCTION & ENGINEERING - 0.7% |
Construction & Engineering - 0.7% |
Fluor Corp. | 32,300 | | 1,556,537 |
Foster Wheeler AG (a) | 3,500 | | 81,970 |
Granite Construction, Inc. | 11,800 | | 285,324 |
Common Stocks - continued |
| Shares | | Value |
CONSTRUCTION & ENGINEERING - CONTINUED |
Construction & Engineering - continued |
Jacobs Engineering Group, Inc. (a) | 29,600 | | $ 1,142,856 |
KBR, Inc. | 2,383 | | 60,528 |
| | 3,127,215 |
CONSTRUCTION MATERIALS - 0.5% |
Construction Materials - 0.5% |
HeidelbergCement AG | 39,612 | | 2,071,614 |
Martin Marietta Materials, Inc. | 1,100 | | 88,528 |
| | 2,160,142 |
CONTAINERS & PACKAGING - 0.3% |
Paper Packaging - 0.3% |
Rock-Tenn Co. Class A | 21,900 | | 1,245,015 |
ELECTRICAL EQUIPMENT - 0.1% |
Electrical Components & Equipment - 0.1% |
Regal-Beloit Corp. | 9,202 | | 531,047 |
ENERGY EQUIPMENT & SERVICES - 2.1% |
Oil & Gas Drilling - 0.7% |
Ensco International Ltd. ADR | 16,600 | | 769,244 |
Noble Corp. | 28,500 | | 984,105 |
Transocean Ltd. (a) | 7,000 | | 443,520 |
Trinidad Drilling Ltd. | 28,600 | | 143,014 |
Vantage Drilling Co. (a) | 334,200 | | 574,824 |
| | 2,914,707 |
Oil & Gas Equipment & Services - 1.4% |
Aker Solutions ASA | 19,200 | | 292,294 |
Baker Hughes, Inc. | 17,480 | | 809,848 |
Fugro NV (Certificaten Van Aandelen) unit | 1,100 | | 77,800 |
Halliburton Co. | 48,400 | | 1,542,024 |
ION Geophysical Corp. (a) | 300,700 | | 1,470,423 |
National Oilwell Varco, Inc. | 1,400 | | 75,264 |
Saipem SpA | 27,278 | | 1,211,934 |
Schlumberger Ltd. | 6,500 | | 454,285 |
Technip SA | 800 | | 67,224 |
Wellstream Holdings PLC | 31,400 | | 372,276 |
| | 6,373,372 |
TOTAL ENERGY EQUIPMENT & SERVICES | | 9,288,079 |
Common Stocks - continued |
| Shares | | Value |
FOOD PRODUCTS - 4.7% |
Agricultural Products - 4.2% |
Archer Daniels Midland Co. | 273,800 | | $ 9,123,016 |
Bunge Ltd. | 25,800 | | 1,549,806 |
Chaoda Modern Agriculture (Holdings) Ltd. | 594,000 | | 484,319 |
China Agri-Industries Holding Ltd. | 1,150,000 | | 1,673,537 |
China Green (Holdings) Ltd. | 300,000 | | 307,692 |
Golden Agri-Resources Ltd. | 2,306,000 | | 1,158,078 |
IOI Corp. Bhd | 223,606 | | 418,318 |
Kuala Lumpur Kepong Bhd | 27,000 | | 171,842 |
Origin Agritech Ltd. (a) | 40,410 | | 351,971 |
PPB Group Bhd | 124,300 | | 767,136 |
Viterra, Inc. (a) | 18,300 | | 175,302 |
Wilmar International Ltd. | 483,000 | | 2,388,318 |
| | 18,569,335 |
Packaged Foods & Meats - 0.5% |
China Yurun Food Group Ltd. | 71,000 | | 276,168 |
Cosan Ltd. Class A | 63,100 | | 829,765 |
MHP SA GDR (Reg. S) (a) | 51,400 | | 812,120 |
Tingyi (Cayman Islands) Holding Corp. | 32,000 | | 87,109 |
| | 2,005,162 |
TOTAL FOOD PRODUCTS | | 20,574,497 |
INDUSTRIAL CONGLOMERATES - 0.2% |
Industrial Conglomerates - 0.2% |
Keppel Corp. Ltd. | 110,000 | | 848,180 |
MACHINERY - 0.9% |
Construction & Farm Machinery & Heavy Trucks - 0.8% |
Bucyrus International, Inc. Class A | 5,300 | | 361,248 |
Caterpillar, Inc. | 1,100 | | 86,460 |
Cummins, Inc. | 10,700 | | 942,670 |
Deere & Co. | 1,100 | | 84,480 |
Jain Irrigation Systems Ltd. | 162,100 | | 848,442 |
Komatsu Ltd. | 32,000 | | 782,126 |
PT United Tractors Tbk | 62,500 | | 155,245 |
Weichai Power Co. Ltd. (H Shares) | 9,000 | | 118,200 |
| | 3,378,871 |
Common Stocks - continued |
| Shares | | Value |
MACHINERY - CONTINUED |
Industrial Machinery - 0.1% |
Duoyuan Global Water, Inc. ADR (a)(d) | 46,000 | | $ 575,460 |
TOTAL MACHINERY | | 3,954,331 |
METALS & MINING - 34.6% |
Aluminum - 0.4% |
Alcoa, Inc. | 119,200 | | 1,565,096 |
Diversified Metals & Mining - 15.6% |
African Rainbow Minerals Ltd. | 42,400 | | 1,081,692 |
Anglo American PLC (United Kingdom) | 166,151 | | 7,741,062 |
Antofagasta PLC | 17,500 | | 370,657 |
BHP Billiton PLC | 683,416 | | 24,206,989 |
Eramet SA | 222 | | 76,932 |
Eurasian Natural Resources Corp. PLC | 46,500 | | 648,522 |
First Quantum Minerals Ltd. | 13,800 | | 1,208,430 |
Freeport-McMoRan Copper & Gold, Inc. | 49,300 | | 4,667,724 |
Grupo Mexico SA de CV Series B | 92,082 | | 302,777 |
HudBay Minerals, Inc. | 12,200 | | 192,588 |
Ivanhoe Australia Ltd. (a) | 50,000 | | 155,764 |
Ivanhoe Mines Ltd. (a) | 11,000 | | 263,379 |
Jiangxi Copper Co. Ltd. (H Shares) | 40,000 | | 111,466 |
Kazakhmys PLC | 75,400 | | 1,589,756 |
Mitsubishi Materials Corp. (a) | 119,000 | | 372,528 |
Mongolian Mining Corp. | 442,000 | | 478,423 |
OJSC MMC Norilsk Nickel sponsored ADR | 102,500 | | 1,911,625 |
Rio Tinto PLC | 191,987 | | 12,468,050 |
Southern Copper Corp. | 2,100 | | 89,880 |
Sterlite Industries (India) Ltd. | 173,488 | | 665,507 |
Sumitomo Metal Mining Co. Ltd. | 42,000 | | 668,359 |
Teck Resources Ltd. Class B (sub. vtg.) | 57,700 | | 2,579,782 |
Vedanta Resources PLC | 11,800 | | 392,286 |
Walter Energy, Inc. | 12,900 | | 1,134,684 |
Xstrata PLC | 245,891 | | 4,764,877 |
| | 68,143,739 |
Gold - 9.0% |
Agnico-Eagle Mines Ltd.: | | | |
(Canada) | 27,500 | | 2,132,807 |
(United States) | 100 | | 7,759 |
AngloGold Ashanti Ltd. sponsored ADR | 78,800 | | 3,712,268 |
Barrick Gold Corp. | 149,600 | | 7,204,973 |
Common Stocks - continued |
| Shares | | Value |
METALS & MINING - CONTINUED |
Gold - continued |
Eldorado Gold Corp. | 28,000 | | $ 474,125 |
Franco-Nevada Corp. | 9,800 | | 338,037 |
Gold Fields Ltd. sponsored ADR | 75,300 | | 1,187,481 |
Goldcorp, Inc. | 154,500 | | 6,898,647 |
Harmony Gold Mining Co. Ltd. sponsored ADR | 39,100 | | 451,214 |
IAMGOLD Corp. | 71,100 | | 1,297,354 |
Kinross Gold Corp. | 180,205 | | 3,242,241 |
Kinross Gold Corp. warrants 9/17/14 (a) | 2,772 | | 11,388 |
Newcrest Mining Ltd. | 118,138 | | 4,624,726 |
Newmont Mining Corp. | 59,600 | | 3,627,852 |
Polyus Gold OJSC sponsored ADR | 11,000 | | 328,900 |
Randgold Resources Ltd. sponsored ADR | 27,000 | | 2,535,840 |
Royal Gold, Inc. | 3,000 | | 148,530 |
Yamana Gold, Inc. | 99,700 | | 1,096,808 |
Zijin Mining Group Co. Ltd. (H Shares) | 92,000 | | 86,763 |
| | 39,407,713 |
Precious Metals & Minerals - 1.2% |
Anglo Platinum Ltd. (a) | 5,800 | | 573,786 |
Aquarius Platinum Ltd. (United Kingdom) | 104,000 | | 600,345 |
Compania de Minas Buenaventura SA sponsored ADR | 5,700 | | 302,328 |
Impala Platinum Holdings Ltd. | 48,900 | | 1,382,174 |
Lonmin PLC (a) | 4,922 | | 137,922 |
Northam Platinum Ltd. | 20,900 | | 144,554 |
Pan American Silver Corp. | 11,100 | | 354,312 |
Polymetal JSC GDR (Reg. S) (a) | 15,700 | | 248,060 |
Silver Standard Resources, Inc. (a) | 16,000 | | 388,480 |
Silver Wheaton Corp. (a) | 31,400 | | 902,685 |
| | 5,034,646 |
Steel - 8.4% |
Allegheny Technologies, Inc. | 1,400 | | 73,766 |
ArcelorMittal SA Class A unit (d) | 108,200 | | 3,503,516 |
Atlas Iron Ltd. (a) | 36,000 | | 88,521 |
BlueScope Steel Ltd. | 491,649 | | 960,880 |
Carpenter Technology Corp. | 30,300 | | 1,080,498 |
China Steel Corp. | 33,819 | | 34,311 |
Cliffs Natural Resources, Inc. | 3,400 | | 221,680 |
Commercial Metals Co. | 54,000 | | 749,520 |
Companhia Siderurgica Nacional SA (CSN) | 9,900 | | 164,399 |
Gerdau SA sponsored ADR (d) | 31,300 | | 408,152 |
JFE Holdings, Inc. | 74,200 | | 2,313,892 |
Common Stocks - continued |
| Shares | | Value |
METALS & MINING - CONTINUED |
Steel - continued |
Jindal Steel & Power Ltd. | 57,871 | | $ 910,726 |
JSW Steel Ltd. | 11,131 | | 336,994 |
Kobe Steel Ltd. | 231,000 | | 507,684 |
Maanshan Iron & Steel Co. Ltd. (H Shares) | 1,136,000 | | 650,713 |
Magnitogorsk Iron & Steel Works OJSC unit (a) | 6,500 | | 81,250 |
Maruichi Steel Tube Ltd. | 13,000 | | 257,351 |
Mechel Steel Group OAO sponsored ADR | 16,000 | | 376,800 |
Nippon Steel Corp. | 570,000 | | 1,791,580 |
Novolipetsk Steel Ojsc | 4,500 | | 154,035 |
Nucor Corp. | 27,700 | | 1,058,694 |
OneSteel Ltd. | 142,793 | | 377,695 |
POSCO | 8,607 | | 3,554,719 |
Reliance Steel & Aluminum Co. | 33,200 | | 1,389,420 |
Salzgitter AG | 3,225 | | 231,506 |
Sumitomo Metal Industries Ltd. | 578,000 | | 1,341,528 |
Tata Steel Ltd. | 24,147 | | 321,088 |
Ternium SA sponsored ADR | 4,600 | | 157,688 |
Thyssenkrupp AG | 10,000 | | 367,899 |
Tokyo Steel Manufacturing Co. Ltd. | 9,500 | | 94,209 |
United States Steel Corp. (d) | 28,400 | | 1,215,236 |
Vale SA (PN-A) sponsored ADR | 326,000 | | 9,365,980 |
Voestalpine AG | 29,400 | | 1,165,282 |
Yamato Kogyo Co. Ltd. | 58,000 | | 1,487,660 |
| | 36,794,872 |
TOTAL METALS & MINING | | 150,946,066 |
OIL, GAS & CONSUMABLE FUELS - 30.7% |
Coal & Consumable Fuels - 1.6% |
Alpha Natural Resources, Inc. (a) | 41,505 | | 1,874,781 |
Arch Coal, Inc. | 24,000 | | 590,160 |
Banpu PCL (For. Reg.) | 7,700 | | 199,058 |
China Coal Energy Co. Ltd. (H Shares) | 146,000 | | 252,398 |
China Shenhua Energy Co. Ltd. (H Shares) | 72,500 | | 322,690 |
Cloud Peak Energy, Inc. | 22,100 | | 383,877 |
CONSOL Energy, Inc. | 15,900 | | 584,484 |
Massey Energy Co. | 42,600 | | 1,792,182 |
Paladin Energy Ltd. (a) | 21,511 | | 86,400 |
Peabody Energy Corp. | 14,800 | | 782,920 |
Common Stocks - continued |
| Shares | | Value |
OIL, GAS & CONSUMABLE FUELS - CONTINUED |
Coal & Consumable Fuels - continued |
PT Bumi Resources Tbk | 684,000 | | $ 170,282 |
Uranium One, Inc. (a) | 22,400 | | 91,585 |
| | 7,130,817 |
Integrated Oil & Gas - 21.3% |
BG Group PLC | 222,057 | | 4,324,368 |
BP PLC | 1,159,800 | | 7,882,370 |
Cenovus Energy, Inc. | 4,500 | | 125,218 |
Chevron Corp. | 122,300 | | 10,103,203 |
China Petroleum & Chemical Corp. (H Shares) | 597,000 | | 568,024 |
ConocoPhillips | 22,000 | | 1,306,800 |
Ecopetrol SA ADR | 2,000 | | 95,480 |
ENI SpA | 156,727 | | 3,528,187 |
Exxon Mobil Corp. | 312,361 | | 20,762,636 |
Hess Corp. | 8,100 | | 510,543 |
Imperial Oil Ltd. | 11,600 | | 446,075 |
InterOil Corp. (a)(d) | 6,800 | | 484,024 |
Lukoil Oil Co. sponsored ADR | 29,000 | | 1,619,650 |
Marathon Oil Corp. | 116,800 | | 4,154,576 |
Murphy Oil Corp. | 14,200 | | 925,272 |
OAO Gazprom sponsored ADR | 121,300 | | 2,650,405 |
Occidental Petroleum Corp. | 63,100 | | 4,961,553 |
Origin Energy Ltd. | 55,019 | | 859,156 |
Petroleo Brasileiro SA - Petrobras (PN) sponsored ADR (non-vtg.) | 173,000 | | 5,395,870 |
Repsol YPF SA | 53,241 | | 1,476,022 |
Royal Dutch Shell PLC Class A (United Kingdom) | 379,950 | | 12,333,010 |
StatoilHydro ASA | 3,900 | | 85,144 |
Suncor Energy, Inc. | 118,232 | | 3,788,432 |
Surgutneftegaz JSC sponsored ADR | 3,930 | | 38,082 |
Total SA | 81,255 | | 4,421,915 |
| | 92,846,015 |
Oil & Gas Exploration & Production - 7.2% |
Alange Energy Corp. (a) | 190,000 | | 137,857 |
Anadarko Petroleum Corp. | 39,400 | | 2,425,858 |
Apache Corp. | 21,600 | | 2,182,032 |
Berry Petroleum Co. Class A | 36,300 | | 1,241,823 |
Cairn Energy PLC (a) | 44,204 | | 273,300 |
Canadian Natural Resources Ltd. | 83,800 | | 3,050,783 |
Chesapeake Energy Corp. | 31,100 | | 674,870 |
Cimarex Energy Co. | 6,800 | | 521,900 |
Common Stocks - continued |
| Shares | | Value |
OIL, GAS & CONSUMABLE FUELS - CONTINUED |
Oil & Gas Exploration & Production - continued |
CNOOC Ltd. sponsored ADR | 8,200 | | $ 1,713,144 |
CNPC (Hong Kong) Ltd. | 50,000 | | 63,603 |
Concho Resources, Inc. (a) | 1,200 | | 82,404 |
Denbury Resources, Inc. (a) | 51,400 | | 874,828 |
Devon Energy Corp. | 13,800 | | 897,276 |
EnCana Corp. | 5,200 | | 146,889 |
EOG Resources, Inc. | 13,600 | | 1,301,792 |
Falkland Oil & Gas Ltd. (a)(d) | 216,700 | | 355,866 |
Gran Tierra Energy, Inc. (a) | 7,200 | | 53,652 |
Heritage Oil PLC | 75,500 | | 416,715 |
Japan Petroleum Exploration Co. Ltd. | 4,800 | | 183,422 |
Lundin Petroleum AB (a) | 30,000 | | 283,764 |
Mariner Energy, Inc. (a) | 19,800 | | 493,416 |
Newfield Exploration Co. (a) | 1,400 | | 83,468 |
Nexen, Inc. | 8,300 | | 176,596 |
Niko Resources Ltd. | 11,200 | | 1,068,497 |
Noble Energy, Inc. | 9,800 | | 798,504 |
Northern Oil & Gas, Inc. (a) | 47,600 | | 936,768 |
OAO NOVATEK GDR | 7,600 | | 726,940 |
OGX Petroleo e Gas Participacoes SA (a) | 5,900 | | 77,409 |
Oil & Natural Gas Corp. Ltd. | 5,222 | | 153,632 |
OPTI Canada, Inc. (a) | 1,496,600 | | 1,027,179 |
Pacific Rubiales Energy Corp. (a) | 6,300 | | 200,817 |
Painted Pony Petroleum Ltd. Class A (a) | 27,400 | | 188,595 |
PetroBakken Energy Ltd. Class A | 7,348 | | 162,248 |
Petrobank Energy & Resources Ltd. (a) | 42,100 | | 1,675,497 |
Petrohawk Energy Corp. (a) | 43,200 | | 734,832 |
Petrominerales Ltd. | 3,200 | | 81,985 |
Plains Exploration & Production Co. (a) | 1,000 | | 27,870 |
Progress Energy Resources Corp. | 23,200 | | 246,354 |
QEP Resources, Inc. | 10,900 | | 360,027 |
Rockhopper Exploration PLC (a) | 120,800 | | 616,424 |
Santos Ltd. | 31,881 | | 394,151 |
Southwestern Energy Co. (a) | 52,800 | | 1,787,280 |
Talisman Energy, Inc. | 105,000 | | 1,903,569 |
Tullow Oil PLC | 10,100 | | 191,753 |
Ultra Petroleum Corp. (a) | 5,000 | | 205,750 |
Whiting Petroleum Corp. (a) | 1,700 | | 170,748 |
| | 31,372,087 |
Common Stocks - continued |
| Shares | | Value |
OIL, GAS & CONSUMABLE FUELS - CONTINUED |
Oil & Gas Refining & Marketing - 0.6% |
Frontier Oil Corp. | 57,600 | | $ 763,200 |
Holly Corp. | 37,400 | | 1,224,102 |
Neste Oil Oyj | 3,800 | | 63,027 |
Reliance Industries Ltd. | 24,940 | | 616,818 |
Sunoco, Inc. | 4,200 | | 157,374 |
| | 2,824,521 |
TOTAL OIL, GAS & CONSUMABLE FUELS | | 134,173,440 |
PAPER & FOREST PRODUCTS - 4.1% |
Forest Products - 0.6% |
China Forestry Holdings Co. Ltd. | 988,000 | | 469,065 |
Duratex SA | 7,100 | | 81,801 |
Sino-Forest Corp. (a) | 97,000 | | 1,917,364 |
| | 2,468,230 |
Paper Products - 3.5% |
Domtar Corp. | 1,300 | | 103,168 |
Empresas CMPC SA | 1,653 | | 89,214 |
Fibria Celulose SA sponsored ADR (a)(d) | 96,589 | | 1,734,738 |
International Paper Co. | 194,100 | | 4,906,848 |
MeadWestvaco Corp. | 3,400 | | 87,482 |
Nine Dragons Paper (Holdings) Ltd. | 702,000 | | 1,132,075 |
Nippon Paper Group, Inc. | 24,300 | | 616,976 |
Oji Paper Co. Ltd. | 429,000 | | 1,978,916 |
Sappi Ltd. (a) | 61,475 | | 304,696 |
Stora Enso Oyj (R Shares) | 70,400 | | 699,421 |
Suzano Papel e Celulose SA | 46,125 | | 441,945 |
Svenska Cellulosa AB (SCA) (B Shares) | 106,500 | | 1,651,311 |
UPM-Kymmene Corp. | 108,000 | | 1,795,805 |
| | 15,542,595 |
TOTAL PAPER & FOREST PRODUCTS | | 18,010,825 |
REAL ESTATE INVESTMENT TRUSTS - 0.9% |
Specialized REITs - 0.9% |
Rayonier, Inc. | 8,200 | | 428,040 |
Weyerhaeuser Co. | 218,485 | | 3,543,827 |
| | 3,971,867 |
Common Stocks - continued |
| Shares | | Value |
ROAD & RAIL - 0.1% |
Railroads - 0.1% |
CSX Corp. | 8,800 | | $ 540,760 |
SPECIALTY RETAIL - 0.3% |
Specialty Stores - 0.3% |
Tsutsumi Jewelry Co. Ltd. | 45,300 | | 1,066,776 |
TRADING COMPANIES & DISTRIBUTORS - 0.4% |
Trading Companies & Distributors - 0.4% |
Adani Enterprises Ltd. | 6,000 | | 95,357 |
Kloeckner & Co. AG (a) | 15,374 | | 340,135 |
Mills Estruturas e Servicos de Engenharia SA (a) | 20,000 | | 241,359 |
Noble Group Ltd. | 566,090 | | 813,511 |
| | 1,490,362 |
TRANSPORTATION INFRASTRUCTURE - 0.1% |
Highways & Railtracks - 0.1% |
Ecorodovias Infraestrutura e Logistica SA (a) | 24,100 | | 182,747 |
TOTAL COMMON STOCKS (Cost $384,228,881) | 433,088,271 |
Money Market Funds - 2.8% |
| | | |
Fidelity Cash Central Fund, 0.23% (b) | 6,054,985 | | 6,054,985 |
Fidelity Securities Lending Cash Central Fund, 0.24% (b)(c) | 6,183,336 | | 6,183,336 |
TOTAL MONEY MARKET FUNDS (Cost $12,238,321) | 12,238,321 |
TOTAL INVESTMENT PORTFOLIO - 102.0% (Cost $396,467,202) | | 445,326,592 |
NET OTHER ASSETS (LIABILITIES) - (2.0)% | | (8,583,437) |
NET ASSETS - 100% | $ 436,743,155 |
Legend |
(a) Non-income producing |
(b) Affiliated fund that is available only to investment companies and other accounts managed by Fidelity Investments. The rate quoted is the annualized seven-day yield of the fund at period end. A complete unaudited listing of the fund's holdings as of its most recent quarter end is available upon request. In addition, each Fidelity Central Fund's financial statements, which are not covered by the Fund's report of Independent Registered Public Accounting Firm, are available on the SEC's website or upon request. |
(c) Investment made with cash collateral received from securities on loan. |
(d) Security or a portion of the security is on loan at period end. |
Affiliated Central Funds |
Information regarding fiscal year to date income earned by the Fund from investments in Fidelity Central Funds is as follows: |
Fund | Income earned |
Fidelity Cash Central Fund | $ 10,925 |
Fidelity Securities Lending Cash Central Fund | 89,586 |
Total | $ 100,511 |
Other Information |
The following is a summary of the inputs used, as of October 31, 2010, involving the Fund's assets and liabilities carried at fair value. The inputs or methodology used for valuing securities may not be an indication of the risk associated with investing in those securities. For more information on valuation inputs, and their aggregation into the levels used in the tables below, please refer to the Security Valuation section in the accompanying Notes to Financial Statements. |
Valuation Inputs at Reporting Date: |
Description | Total | Level 1 | Level 2 | Level 3 |
Investments in Securities: | | | | |
Common Stocks | $ 433,088,271 | $ 352,259,123 | $ 80,829,148 | $ - |
Money Market Funds | 12,238,321 | 12,238,321 | - | - |
Total Investments in Securities: | $ 445,326,592 | $ 364,497,444 | $ 80,829,148 | $ - |
Other Information - continued |
The following is a reconciliation of Investments in Securities for which Level 3 inputs were used in determining value: |
Investments in Securities: | |
Beginning Balance | $ 65,806 |
Total Realized Gain (Loss) | 69,126 |
Total Unrealized Gain (Loss) | (9,563) |
Cost of Purchases | 55,134 |
Proceeds of Sales | (180,503) |
Amortization/Accretion | - |
Transfers in to Level 3 | - |
Transfers out of Level 3 | - |
Ending Balance | $ - |
The change in unrealized gain (loss) for the period attributable to Level 3 securities held at October 31, 2010 | $ - |
The information used in the above reconciliation represents fiscal year to date activity for any Investments in Securities identified as using Level 3 inputs at either the beginning or the end of the current fiscal period. Transfers in or out of Level 3 represent the beginning value of any Security or Instrument where a change in the pricing level occurred from the beginning to the end of the period. The cost of purchases and the proceeds of sales may include securities received or delivered through corporate actions or exchanges. Realized and unrealized gains (losses) disclosed in the reconciliation are included in Net Gain (Loss) on the Fund's Statement of Operations. |
Distribution of investments by country of issue, as a percentage of total net assets, is as follows: (Unaudited) |
United States of America | 32.1% |
United Kingdom | 18.2% |
Canada | 16.0% |
Brazil | 4.2% |
Japan | 3.0% |
Switzerland | 2.9% |
Australia | 2.5% |
Russia | 2.3% |
South Africa | 1.9% |
Germany | 1.7% |
Bermuda | 1.3% |
India | 1.1% |
Italy | 1.1% |
Norway | 1.1% |
France | 1.0% |
Luxembourg | 1.0% |
Others (Individually Less Than 1%) | 8.6% |
| 100.0% |
See accompanying notes which are an integral part of the financial statements.
Annual Report
Statement of Assets and Liabilities
| October 31, 2010 |
| | |
Assets | | |
Investment in securities, at value (including securities loaned of $6,035,071) - See accompanying schedule: Unaffiliated issuers (cost $384,228,881) | $ 433,088,271 | |
Fidelity Central Funds (cost $12,238,321) | 12,238,321 | |
Total Investments (cost $396,467,202) | | $ 445,326,592 |
Foreign currency held at value (cost $1,064) | | 1,049 |
Receivable for investments sold | | 4,050,412 |
Receivable for fund shares sold | | 1,637,236 |
Dividends receivable | | 365,521 |
Distributions receivable from Fidelity Central Funds | | 3,807 |
Other receivables | | 8,763 |
Total assets | | 451,393,380 |
| | |
Liabilities | | |
Payable for investments purchased | $ 7,445,387 | |
Payable for fund shares redeemed | 520,792 | |
Accrued management fee | 247,232 | |
Distribution and service plan fees payable | 31,885 | |
Other affiliated payables | 96,299 | |
Other payables and accrued expenses | 125,294 | |
Collateral on securities loaned, at value | 6,183,336 | |
Total liabilities | | 14,650,225 |
| | |
Net Assets | | $ 436,743,155 |
Net Assets consist of: | | |
Paid in capital | | $ 387,323,136 |
Undistributed net investment income | | 4,074,073 |
Accumulated undistributed net realized gain (loss) on investments and foreign currency transactions | | (3,442,191) |
Net unrealized appreciation (depreciation) on investments and assets and liabilities in foreign currencies | | 48,788,137 |
Net Assets | | $ 436,743,155 |
See accompanying notes which are an integral part of the financial statements.
Annual Report
Financial Statements - continued
Statement of Assets and Liabilities - continued
| October 31, 2010 |
| | |
Calculation of Maximum Offering Price
Class A:
Net Asset Value and redemption price per share ($60,369,831 ÷ 3,869,054 shares) | | $ 15.60 |
| | |
Maximum offering price per share (100/94.25 of $15.60) | | $ 16.55 |
Class T:
Net Asset Value and redemption price per share ($11,762,486 ÷ 756,241 shares) | | $ 15.55 |
| | |
Maximum offering price per share (100/96.50 of $15.55) | | $ 16.11 |
Class B:
Net Asset Value and offering price per share ($4,348,164 ÷ 281,298 shares)A | | $ 15.46 |
| | |
Class C:
Net Asset Value and offering price per share ($14,337,610 ÷ 927,787 shares)A | | $ 15.45 |
| | |
| | |
Global Commodity Stock:
Net Asset Value, offering price and redemption price per share ($310,186,006 ÷ 19,806,577 shares) | | $ 15.66 |
| | |
Institutional Class:
Net Asset Value, offering price and redemption price per share ($35,739,058 ÷ 2,281,918 shares) | | $ 15.66 |
A Redemption price per share is equal to net asset value less any applicable contingent deferred sales charge.
See accompanying notes which are an integral part of the financial statements.
Annual Report
Statement of Operations
| Year ended October 31, 2010 |
| | |
Investment Income | | |
Dividends | | $ 6,484,153 |
Special dividends | | 3,210,012 |
Interest | | 2 |
Income from Fidelity Central Funds | | 100,511 |
Income before foreign taxes withheld | | 9,794,678 |
Less foreign taxes withheld | | (414,094) |
Total income | | 9,380,584 |
| | |
Expenses | | |
Management fee | $ 2,448,315 | |
Transfer agent fees | 859,170 | |
Distribution and service plan fees | 299,224 | |
Accounting and security lending fees | 179,820 | |
Custodian fees and expenses | 137,701 | |
Independent trustees' compensation | 1,830 | |
Registration fees | 149,234 | |
Audit | 52,141 | |
Legal | 1,176 | |
Interest | 920 | |
Miscellaneous | 2,271 | |
Total expenses before reductions | 4,131,802 | |
Expense reductions | (41,295) | 4,090,507 |
Net investment income (loss) | | 5,290,077 |
Realized and Unrealized Gain (Loss) Net realized gain (loss) on: | | |
Investment securities: | | |
Unaffiliated issuers (net of foreign taxes of $9,801) | (2,524,423) | |
Foreign currency transactions | (119,006) | |
Total net realized gain (loss) | | (2,643,429) |
Change in net unrealized appreciation (depreciation) on: Investment securities (net of increase in deferred foreign taxes of $72,455) | 40,352,125 | |
Assets and liabilities in foreign currencies | 4,035 | |
Total change in net unrealized appreciation (depreciation) | | 40,356,160 |
Net gain (loss) | | 37,712,731 |
Net increase (decrease) in net assets resulting from operations | | $ 43,002,808 |
See accompanying notes which are an integral part of the financial statements.
Annual Report
Financial Statements - continued
Statement of Changes in Net Assets
| Year ended
October 31, 2010 | For the period
March 25, 2009
(commencement of
operations) to
October 31, 2009 |
Increase (Decrease) in Net Assets | | |
Operations | | |
Net investment income (loss) | $ 5,290,077 | $ 14,516 |
Net realized gain (loss) | (2,643,429) | 1,187,329 |
Change in net unrealized appreciation (depreciation) | 40,356,160 | 8,431,977 |
Net increase (decrease) in net assets resulting
from operations | 43,002,808 | 9,633,822 |
Distributions to shareholders from net investment income | (188,424) | - |
Distributions to shareholders from net realized gain | (1,358,291) | - |
Total distributions | (1,546,715) | - |
Share transactions - net increase (decrease) | 198,095,255 | 187,451,591 |
Redemption fees | 48,090 | 58,304 |
Total increase (decrease) in net assets | 239,599,438 | 197,143,717 |
| | |
Net Assets | | |
Beginning of period | 197,143,717 | - |
End of period (including undistributed net investment income of $4,074,073 and undistributed net investment income of $13,431, respectively) | $ 436,743,155 | $ 197,143,717 |
See accompanying notes which are an integral part of the financial statements.
Annual Report
Financial Highlights - Class A
Years ended October 31, | 2010 | 2009 H |
Selected Per-Share Data | | |
Net asset value, beginning of period | $ 13.29 | $ 10.00 |
Income from Investment Operations | | |
Net investment income (loss) E | .19 K | (.01) |
Net realized and unrealized gain (loss) | 2.20 | 3.29 |
Total from investment operations | 2.39 | 3.28 |
Distributions from net investment income | - J | - |
Distributions from net realized gain | (.08) | - |
Total distributions | (.08) | - |
Redemption fees added to paid in capital E | - J | .01 |
Net asset value, end of period | $ 15.60 | $ 13.29 |
Total ReturnB,C,D | 18.04% | 32.90% |
Ratios to Average Net AssetsF,I | | |
Expenses before reductions | 1.37% | 1.65% A |
Expenses net of fee waivers, if any | 1.37% | 1.50%A |
Expenses net of all reductions | 1.36% | 1.48%A |
Net investment income (loss) | 1.35% K | (.15)%A |
Supplemental Data | | |
Net assets, end of period (000 omitted) | $ 60,370 | $ 15,705 |
Portfolio turnover rateG | 54% | 25%A |
A Annualized
B Total returns for periods of less than one year are not annualized.
C Total returns would have been lower had certain expenses not been reduced during the periods shown.
D Total returns do not include the effect of the sales charges.
E Calculated based on average shares outstanding during the period.
F Fees and expenses of the underlying Fidelity Central Funds are not included in the Fund's expense ratio. The Fund indirectly bears its proportionate share of the expenses of any underlying Fidelity Central Funds.
G Amount does not include the portfolio activity of any underlying Fidelity Central Funds.
H For the period March 25, 2009 (commencement of operations) to October 31, 2009.
I Expense ratios reflect operating expenses of the class. Expenses before reductions do not reflect amounts reimbursed by the investment adviser or reductions from brokerage service arrangements or reductions from other expense offset arrangements and do not represent the amount paid by the class during periods when reimbursements or reductions occur. Expense ratios before reductions for start-up periods may not be representative of longer-term operating periods. Expenses net of fee waivers reflect expenses after reimbursement by the investment adviser but prior to reductions from brokerage service arrangements or other expense offset arrangements. Expenses net of all reductions represent the net expenses paid by the class.
J Amount represents less than $.01 per share.
K Investment income per share reflects a special dividend which amounted to $.13 per share. Excluding the special dividend, the ratio of net investment income (loss) to average net assets would have been .42%.
See accompanying notes which are an integral part of the financial statements.
Annual Report
Financial Highlights - Class T
Years ended October 31, | 2010 | 2009 H |
Selected Per-Share Data | | |
Net asset value, beginning of period | $ 13.27 | $ 10.00 |
Income from Investment Operations | | |
Net investment income (loss) E | .16 K | (.03) |
Net realized and unrealized gain (loss) | 2.19 | 3.29 |
Total from investment operations | 2.35 | 3.26 |
Distributions from net realized gain | (.07) | - |
Redemption fees added to paid in capital E | - J | .01 |
Net asset value, end of period | $ 15.55 | $ 13.27 |
Total Return B,C,D | 17.73% | 32.70% |
Ratios to Average Net Assets F,I | | |
Expenses before reductions | 1.63% | 2.04% A |
Expenses net of fee waivers, if any | 1.63% | 1.75% A |
Expenses net of all reductions | 1.61% | 1.73% A |
Net investment income (loss) | 1.10% K | (.40)% A |
Supplemental Data | | |
Net assets, end of period (000 omitted) | $ 11,762 | $ 4,665 |
Portfolio turnover rate G | 54% | 25% A |
A Annualized
B Total returns for periods of less than one year are not annualized.
C Total returns would have been lower had certain expenses not been reduced during the periods shown.
D Total returns do not include the effect of the sales charges.
E Calculated based on average shares outstanding during the period.
F Fees and expenses of the underlying Fidelity Central Funds are not included in the Fund's expense ratio. The Fund indirectly bears its proportionate share of the expenses of any underlying Fidelity Central Funds.
G Amount does not include the portfolio activity of any underlying Fidelity Central Funds.
H For the period March 25, 2009 (commencement of operations) to October 31, 2009.
I Expense ratios reflect operating expenses of the class. Expenses before reductions do not reflect amounts reimbursed by the investment adviser or reductions from brokerage service arrangements or reductions from other expense offset arrangements and do not represent the amount paid by the class during periods when reimbursements or reductions occur. Expense ratios before reductions for start-up periods may not be representative of longer-term operating periods. Expenses net of fee waivers reflect expenses after reimbursement by the investment adviser but prior to reductions from brokerage service arrangements or other expense offset arrangements. Expenses net of all reductions represent the net expenses paid by the class.
J Amount represents less than $.01 per share.
K Investment income per share reflects a special dividend which amounted to $.13 per share. Excluding the special dividend, the ratio of net investment income (loss) to average net assets would have been .17%.
See accompanying notes which are an integral part of the financial statements.
Annual Report
Financial Highlights - Class B
Years ended October 31, | 2010 | 2009 H |
Selected Per-Share Data | | |
Net asset value, beginning of period | $ 13.22 | $ 10.00 |
Income from Investment Operations | | |
Net investment income (loss) E | .08 K | (.07) |
Net realized and unrealized gain (loss) | 2.20 | 3.28 |
Total from investment operations | 2.28 | 3.21 |
Distributions from net realized gain | (.04) | - |
Redemption fees added to paid in capital E | - J | .01 |
Net asset value, end of period | $ 15.46 | $ 13.22 |
Total Return B,C,D | 17.23% | 32.20% |
Ratios to Average Net Assets F,I | | |
Expenses before reductions | 2.16% | 2.66% A |
Expenses net of fee waivers, if any | 2.16% | 2.25% A |
Expenses net of all reductions | 2.15% | 2.23% A |
Net investment income (loss) | .56% K | (.90)% A |
Supplemental Data | | |
Net assets, end of period (000 omitted) | $ 4,348 | $ 2,726 |
Portfolio turnover rate G | 54% | 25% A |
A Annualized
B Total returns for periods of less than one year are not annualized.
C Total returns would have been lower had certain expenses not been reduced during the periods shown.
D Total returns do not include the effect of the contingent deferred sales charge.
E Calculated based on average shares outstanding during the period.
F Fees and expenses of the underlying Fidelity Central Funds are not included in the Fund's expense ratio. The Fund indirectly bears its proportionate share of the expenses of any underlying Fidelity Central Funds.
G Amount does not include the portfolio activity of any underlying Fidelity Central Funds.
H For the period March 25, 2009 (commencement of operations) to October 31, 2009.
I Expense ratios reflect operating expenses of the class. Expenses before reductions do not reflect amounts reimbursed by the investment adviser or reductions from brokerage service arrangements or reductions from other expense offset arrangements and do not represent the amount paid by the class during periods when reimbursements or reductions occur. Expense ratios before reductions for start-up periods may not be representative of longer-term operating periods. Expenses net of fee waivers reflect expenses after reimbursement by the investment adviser but prior to reductions from brokerage service arrangements or other expense offset arrangements. Expenses net of all reductions represent the net expenses paid by the class.
J Amount represents less than $.01 per share.
K Investment income per share reflects a special dividend which amounted to $.13 per share. Excluding the special dividend, the ratio of net investment income (loss) to average net assets would have been (.37)%.
See accompanying notes which are an integral part of the financial statements.
Annual Report
Financial Highlights - Class C
Years ended October 31, | 2010 | 2009 H |
Selected Per-Share Data | | |
Net asset value, beginning of period | $ 13.22 | $ 10.00 |
Income from Investment Operations | | |
Net investment income (loss) E | .08 K | (.07) |
Net realized and unrealized gain (loss) | 2.19 | 3.28 |
Total from investment operations | 2.27 | 3.21 |
Distributions from net realized gain | (.04) | - |
Redemption fees added to paid in capital E | - J | .01 |
Net asset value, end of period | $ 15.45 | $ 13.22 |
Total Return B,C,D | 17.21% | 32.20% |
Ratios to Average Net Assets F,I | | |
Expenses before reductions | 2.14% | 2.53% A |
Expenses net of fee waivers, if any | 2.14% | 2.25% A |
Expenses net of all reductions | 2.13% | 2.23% A |
Net investment income (loss) | .58% K | (.90)% A |
Supplemental Data | | |
Net assets, end of period (000 omitted) | $ 14,338 | $ 4,798 |
Portfolio turnover rate G | 54% | 25% A |
A Annualized
B Total returns for periods of less than one year are not annualized.
C Total returns would have been lower had certain expenses not been reduced during the periods shown.
D Total returns do not include the effect of the contingent deferred sales charge.
E Calculated based on average shares outstanding during the period.
F Fees and expenses of the underlying Fidelity Central Funds are not included in the Fund's expense ratio. The Fund indirectly bears its proportionate share of the expenses of any underlying Fidelity Central Funds.
G Amount does not include the portfolio activity of any underlying Fidelity Central Funds.
H For the period March 25, 2009 (commencement of operations) to October 31, 2009.
I Expense ratios reflect operating expenses of the class. Expenses before reductions do not reflect amounts reimbursed by the investment adviser or reductions from brokerage service arrangements or reductions from other expense offset arrangements and do not represent the amount paid by the class during periods when reimbursements or reductions occur. Expense ratios before reductions for start-up periods may not be representative of longer-term operating periods. Expenses net of fee waivers reflect expenses after reimbursement by the investment adviser but prior to reductions from brokerage service arrangements or other expense offset arrangements. Expenses net of all reductions represent the net expenses paid by the class.
J Amount represents less than $.01 per share.
K Investment income per share reflects a special dividend which amounted to $.13 per share. Excluding the special dividend, the ratio of net investment income (loss) to average net assets would have been (.34)%.
See accompanying notes which are an integral part of the financial statements.
Annual Report
Financial Highlights - Global Commodity Stock
Years ended October 31, | 2010 | 2009 G |
Selected Per-Share Data | | |
Net asset value, beginning of period | $ 13.31 | $ 10.00 |
Income from Investment Operations | | |
Net investment income (loss)D | .23 J | .01 |
Net realized and unrealized gain (loss) | 2.21 | 3.29 |
Total from investment operations | 2.44 | 3.30 |
Distributions from net investment income | (.01) | - |
Distributions from net realized gain | (.08) | - |
Total distributions | (.09) | - |
Redemption fees added to paid in capitalD | -I | .01 |
Net asset value, end of period | $ 15.66 | $ 13.31 |
Total ReturnB,C | 18.38% | 33.10% |
Ratios to Average Net AssetsE,H | | |
Expenses before reductions | 1.10% | 1.42%A |
Expenses net of fee waivers, if any | 1.10% | 1.25%A |
Expenses net of all reductions | 1.09% | 1.23%A |
Net investment income (loss) | 1.62% J | .10%A |
Supplemental Data | | |
Net assets, end of period (000 omitted) | $ 310,186 | $ 159,439 |
Portfolio turnover rateF | 54% | 25%A |
A Annualized
B Total returns for periods of less than one year are not annualized.
C Total returns would have been lower had certain expenses not been reduced during the periods shown.
D Calculated based on average shares outstanding during the period.
E Fees and expenses of the underlying Fidelity Central Funds are not included in the Fund's expense ratio. The Fund indirectly bears its proportionate share of the expenses of any underlying Fidelity Central Funds.
F Amount does not include the portfolio activity of any underlying Fidelity Central Funds.
G For the period March 25, 2009 (commencement of operations) to October 31, 2009.
H Expense ratios reflect operating expenses of the class. Expenses before reductions do not reflect amounts reimbursed by the investment adviser or reductions from brokerage service arrangements or reductions from other expense offset arrangements and do not represent the amount paid by the class during periods when reimbursements or reductions occur. Expense ratios before reductions for start-up periods may not be representative of longer-term operating periods. Expenses net of fee waivers reflect expenses after reimbursement by the investment adviser but prior to reductions from brokerage service arrangements or other expense offset arrangements. Expenses net of all reductions represent the net expenses paid by the class.
I Amount represents less than $.01 per share.
J Investment income per share reflects a special dividend which amounted to $.13 per share. Excluding the special dividend, the ratio of net investment income (loss) to average net assets would have been .69%.
See accompanying notes which are an integral part of the financial statements.
Annual Report
Financial Highlights - Institutional Class
Years ended October 31, | 2010 | 2009 G |
Selected Per-Share Data | | |
Net asset value, beginning of period | $ 13.31 | $ 10.00 |
Income from Investment Operations | | |
Net investment income (loss) D | .23 J | .01 |
Net realized and unrealized gain (loss) | 2.21 | 3.29 |
Total from investment operations | 2.44 | 3.30 |
Distributions from net investment income | (.01) | - |
Distributions from net realized gain | (.08) | - |
Total distributions | (.09) | - |
Redemption fees added to paid in capital D | - I | .01 |
Net asset value, end of period | $ 15.66 | $ 13.31 |
Total Return B,C | 18.39% | 33.10% |
Ratios to Average Net Assets E,H | | |
Expenses before reductions | 1.09% | 1.36% A |
Expenses net of fee waivers, if any | 1.09% | 1.25% A |
Expenses net of all reductions | 1.07% | 1.23% A |
Net investment income (loss) | 1.64% J | .10% A |
Supplemental Data | | |
Net assets, end of period (000 omitted) | $ 35,739 | $ 9,811 |
Portfolio turnover rate F | 54% | 25% A |
A Annualized
B Total returns for periods of less than one year are not annualized.
C Total returns would have been lower had certain expenses not been reduced during the periods shown.
D Calculated based on average shares outstanding during the period.
E Fees and expenses of the underlying Fidelity Central Funds are not included in the Fund's expense ratio. The Fund indirectly bears its proportionate share of the expenses of any underlying Fidelity Central Funds.
F Amount does not include the portfolio activity of any underlying Fidelity Central Funds.
G For the period March 25, 2009 (commencement of operations) to October 31, 2009.
H Expense ratios reflect operating expenses of the class. Expenses before reductions do not reflect amounts reimbursed by the investment adviser or reductions from brokerage service arrangements or reductions from other expense offset arrangements and do not represent the amount paid by the class during periods when reimbursements or reductions occur. Expense ratios before reductions for start-up periods may not be representative of longer-term operating periods. Expenses net of fee waivers reflect expenses after reimbursement by the investment adviser but prior to reductions from brokerage service arrangements or other expense offset arrangements. Expenses net of all reductions represent the net expenses paid by the class.
I Amount represents less than $.01 per share.
J Investment income per share reflects a special dividend which amounted to $.13 per share. Excluding the special dividend, the ratio of net investment income (loss) to average net assets would have been .71%.
See accompanying notes which are an integral part of the financial statements.
Annual Report
Notes to Financial Statements
For the period ended October 31, 2010
1. Organization.
Fidelity Global Commodity Stock Fund (the Fund) is a non-diversified fund of Fidelity Investment Trust (the Trust) and is authorized to issue an unlimited number of shares. The Trust is registered under the Investment Company Act of 1940, as amended (the 1940 Act), as an open-end management investment company organized as a Massachusetts business trust. The Fund offers Class A, Class T, Class C, Global Commodity Stock, and Institutional Class shares, each of which has equal rights as to assets and voting privileges. Effective after the close of business on September 1, 2010, Class B shares were closed to new accounts and additional purchases by existing shareholders. Each class has exclusive voting rights with respect to matters that affect that class. Class B shares will automatically convert to Class A shares after a holding period of seven years from the initial date of purchase. Investment income, realized and unrealized capital gains and losses, the common expenses of the Fund, and certain fund-level expense reductions, if any, are allocated on a pro-rata basis to each class based on the relative net assets of each class to the total net assets of the Fund. Each class differs with respect to transfer agent and distribution and service plan fees incurred. Certain expense reductions also differ by class. The Fund's investments in emerging markets can be subject to social, economic, regulatory, and political uncertainties and can be extremely volatile.
2. Investments in Fidelity Central Funds.
The Fund may invest in Fidelity Central Funds, which are open-end investment companies available only to other investment companies and accounts managed by Fidelity Management & Research Company (FMR) and its affiliates. The Fund's Schedule of Investments lists each of the Fidelity Central Funds held as of period end, if any, as an investment of the Fund, but does not include the underlying holdings of each Fidelity Central Fund. As an Investing Fund, the Fund indirectly bears its proportionate share of the expenses of the underlying Fidelity Central Funds.
The Money Market Central Funds seek preservation of capital and current income and are managed by Fidelity Investments Money Management, Inc. (FIMM), an affiliate of FMR.
A complete unaudited list of holdings for each Fidelity Central Fund is available upon request or at the Securities and Exchange Commission (the SEC) web site at www.sec.gov. In addition, the financial statements of the Fidelity Central Funds which are not covered by the Fund's Report of Independent Registered Public Accounting Firm, are available on the SEC web site or upon request.
3. Significant Accounting Policies.
The financial statements have been prepared in conformity with accounting principles generally accepted in the United States of America (GAAP), which require management
Annual Report
Notes to Financial Statements - continued
3. Significant Accounting Policies - continued
to make certain estimates and assumptions at the date of the financial statements. Actual results could differ from those estimates. The following summarizes the significant accounting policies of the Fund:
Security Valuation. Investments are valued as of 4:00 p.m. Eastern time on the last calendar day of the period. The Fund uses independent pricing services approved by the Board of Trustees to value its investments. When current market prices or quotations are not readily available or reliable, valuations may be determined in good faith in accordance with procedures adopted by the Board of Trustees. Factors used in determining value may include market or security specific events. The frequency with which these procedures are used cannot be predicted and they may be utilized to a significant extent. The value used for net asset value (NAV) calculation under these procedures may differ from published prices for the same securities.
The Fund categorizes the inputs to valuation techniques used to value its investments into a disclosure hierarchy consisting of three levels as shown below.
Level 1 - quoted prices in active markets for identical investments
Level 2 - other significant observable inputs (including quoted prices for similar investments, interest rates, prepayment speeds, etc.)
Level 3 - unobservable inputs (including the fund's own assumptions based on the best information available)
Changes in valuation techniques may result in transfers in or out of an assigned level within the disclosure hierarchy. The aggregate value of investments by input level, as of October 31, 2010, as well as a roll forward of Level 3 securities, is included at the end of the Fund's Schedule of Investments. Valuation techniques used to value the Fund's investments by major category are as follows.
Equity securities, including restricted securities, for which market quotations are readily available, are valued at the last reported sale price or official closing price as reported by an independent pricing service on the primary market or exchange on which they are traded and are categorized as Level 1 in the hierarchy. In the event there were no sales during the day or closing prices are not available, securities are valued at the last quoted bid price or may be valued using the last available price and are generally categorized as Level 2 in the hierarchy. For foreign equity securities, when significant market or security specific events arise, comparisons to the valuation of American Depositary Receipts (ADRs), futures contracts, Exchange-traded funds (ETFs) and certain indexes as well as quoted prices for similar securities are used and are categorized as Level 2 in the hierarchy in these circumstances. Utilizing these techniques may result in transfers between
Annual Report
3. Significant Accounting Policies - continued
Security Valuation - continued
Level 1 and Level 2. For restricted equity securities and private placements where observable inputs are limited, assumptions about market activity and risk are used and are categorized as Level 3 in the hierarchy.
Investments in open-end mutual funds, including the Fidelity Central Funds, are valued at their closing net asset value each business day and are categorized as Level 1 in the hierarchy. Short-term securities with remaining maturities of sixty days or less for which quotations are not readily available are valued at amortized cost, which approximates fair value and are categorized as Level 2 in the hierarchy.
Foreign Currency. The Fund uses foreign currency contracts to facilitate transactions in foreign-denominated securities. Gains and losses from these transactions may arise from changes in the value of the foreign currency or if the counterparties do not perform under the contracts' terms.
Foreign-denominated assets, including investment securities, and liabilities are translated into U.S. dollars at the exchange rate at period end. Purchases and sales of investment securities, income and dividends received and expenses denominated in foreign currencies are translated into U.S. dollars at the exchange rate in effect on the transaction date.
The effects of exchange rate fluctuations on investments are included with the net realized and unrealized gain (loss) on investment securities. Other foreign currency transactions resulting in realized and unrealized gain (loss) are disclosed separately.
Investment Transactions and Income. For financial reporting purposes, the Fund's investment holdings and NAV include trades executed through the end of the last business day of the period. The NAV per share for processing shareholder transactions is calculated as of the close of business of the New York Stock Exchange (NYSE), normally 4:00 p.m. Eastern time and includes trades executed through the end of the prior business day. Gains and losses on securities sold are determined on the basis of identified cost. Dividend income is recorded on the ex-dividend date, except for certain dividends from foreign securities where the ex-dividend date may have passed, which are recorded as soon as the Fund is informed of the ex-dividend date. Non-cash dividends included in dividend income, if any, are recorded at the fair market value of the securities received. Distributions received on securities that represent a return of capital or capital gain are recorded as a reduction of cost of investments and/or as a realized gain. The Fund estimates the components of distributions received that may be considered return of capital distributions or capital gain distributions. Large, non-recurring dividends recognized by the Fund are presented separately on the Statement of Operations as "Special Dividends" and the impact of these dividends is presented in the Financial Highlights.
Annual Report
Notes to Financial Statements - continued
3. Significant Accounting Policies - continued
Investment Transactions and Income - continued
Interest income and distributions from the Fidelity Central Funds are accrued as earned. Interest income includes coupon interest and amortization of premium and accretion of discount on debt securities. Investment income is recorded net of foreign taxes withheld where recovery of such taxes is uncertain.
Expenses. Most expenses of the Trust can be directly attributed to a fund. Expenses which cannot be directly attributed are apportioned amongst each fund in the Trust. Expense estimates are accrued in the period to which they relate and adjustments are made when actual amounts are known.
Income Tax Information and Distributions to Shareholders. Each year the Fund intends to qualify as a regulated investment company, including distributing substantially all of its taxable income and realized gains under Subchapter M of the Internal Revenue Code and filing its U.S. federal tax return. As a result, no provision for income taxes is required. As of October 31, 2010, the Fund did not have any unrecognized tax benefits in the accompanying financial statements. A fund's federal tax return is subject to examination by the Internal Revenue Service (IRS) for a period of three years. Foreign taxes are provided for based on the Fund's understanding of the tax rules and rates that exist in the foreign markets in which it invests. The Fund is subject to a tax imposed on short term capital gains on securities of certain issuers domiciled in India. The Fund records an estimated deferred tax liability included in Other payables and accrued expenses in the accompanying Statement of Assets & Liabilities for net unrealized gains on these securities in an amount that would be payable if the securities were disposed of at period end.
Distributions are declared and recorded on the ex-dividend date. Income dividends and capital gain distributions are declared separately for each class. Income and capital gain distributions are determined in accordance with income tax regulations, which may differ from GAAP. In addition, the fund claimed a portion of the payment made to redeeming shareholders as a distribution for income tax purposes.
Capital accounts within the financial statements are adjusted for permanent book-tax differences. These adjustments have no impact on net assets or the results of operations. Temporary book-tax differences will reverse in a subsequent period.
Book-tax differences are primarily due to foreign currency transactions, certain foreign taxes, passive foreign investment companies (PFIC)and losses deferred due to wash sales.
Annual Report
3. Significant Accounting Policies - continued
Income Tax Information and Distributions to Shareholders - continued
The federal tax cost of investment securities and unrealized appreciation (depreciation) as of period end were as follows:
Gross unrealized appreciation | $ 61,409,156 |
Gross unrealized depreciation | (18,023,785) |
Net unrealized appreciation (depreciation) | $ 43,385,371 |
| |
Tax Cost | $ 401,941,221 |
The tax-based components of distributable earnings as of period end were as follows:
Undistributed ordinary income | $ 4,193,998 |
Undistributed long-term capital gain | $ 1,911,902 |
Net unrealized appreciation (depreciation) | $ 43,386,573 |
The tax character of distributions paid was as follows:
| October 31,
2010 | October 31,
2009 |
Ordinary Income | $ 1,546,715 | $ - |
Short-Term Trading (Redemption) Fees. Shares held by investors in the Fund less than 30 days are subject to a redemption fee equal to 1.00% of the net asset value of shares redeemed. All redemption fees, which reduce the proceeds of the shareholder redemption, are retained by the Fund and accounted for as an addition to paid in capital.
4. Purchases and Sales of Investments.
Purchases and sales of securities, other than short-term securities, aggregated $387,406,917 and $178,635,735, respectively.
5. Fees and Other Transactions with Affiliates.
Management Fee. FMR and its affiliates provide the Fund with investment management related services for which the Fund pays a monthly management fee. The management fee is the sum of an individual fund fee rate that is based on an annual rate of .45% of the Fund's average net assets and a group fee rate that averaged .26% during the period. The group fee rate is based upon the average net assets of all the mutual funds
Annual Report
Notes to Financial Statements - continued
5. Fees and Other Transactions with Affiliates - continued
Management Fee - continued
advised by FMR. The group fee rate decreases as assets under management increase and increases as assets under management decrease. For the period, the total annual management fee rate was .71% of the Fund's average net assets.
Distribution and Service Plan Fees. In accordance with Rule 12b-1 of the 1940 Act, the Fund has adopted separate Distribution and Service Plans for each class of shares. Certain classes pay Fidelity Distributors Corporation (FDC), an affiliate of FMR, separate Distribution and Service Fees, each of which is based on an annual percentage of each class' average net assets. In addition, FDC may pay financial intermediaries for selling shares of the Fund and providing shareholder support services. For the period, the Distribution and Service Fee rates, total fees and amounts retained by FDC were as follows:
| Distribution
Fee | Service
Fee | Total Fees | Retained
by FDC |
Class A | -% | .25% | $ 100,827 | $ 5,669 |
Class T | .25% | .25% | 44,998 | 3,026 |
Class B | .75% | .25% | 43,683 | 34,562 |
Class C | .75% | .25% | 109,716 | 73,600 |
| | | $ 299,224 | $ 116,857 |
Sales Load. FDC receives a front-end sales charge of up to 5.75% for selling Class A shares, and 3.50% for selling Class T shares, some of which is paid to financial intermediaries for selling shares of the Fund. FDC receives the proceeds of contingent deferred sales charges levied on Class A, Class T, Class B, and Class C redemptions. These charges depend on the holding period. The deferred sales charges range from 5% to 1% for Class B, 1% for Class C, 1.00% for certain purchases of Class A shares (1.00% to .50% prior to July 12, 2010) and .25% for certain purchases of Class T shares.
For the period, sales charge amounts retained by FDC were as follows:
| Retained
by FDC |
Class A | $ 71,199 |
Class T | 9,668 |
Class B* | 64,189 |
Class C* | 4,311 |
| $ 149,367 |
* When Class B and Class C shares are initially sold, FDC pays commissions from its own resources to financial intermediaries through which the sales are made.
Annual Report
5. Fees and Other Transactions with Affiliates - continued
Transfer Agent Fees. Fidelity Investments Institutional Operations Company, Inc. (FIIOC), an affiliate of FMR, is the transfer, dividend disbursing and shareholder servicing agent for each class of the Fund. FIIOC receives account fees and asset-based fees that vary according to the account size and type of account of the shareholders of the respective classes of the Fund. FIIOC pays for typesetting, printing and mailing of shareholder reports, except proxy statements. For the period, transfer agent fees for each class were as follows:
| Amount | % of
Average
Net Assets |
Class A | $ 107,075 | .26 |
Class T | 24,116 | .27 |
Class B | 13,309 | .30 |
Class C | 31,332 | .28 |
Global Commodity Stock | 629,234 | .24 |
Institutional Class | 54,104 | .23 |
| $ 859,170 | |
Accounting and Security Lending Fees. Fidelity Service Company, Inc. (FSC), an affiliate of FMR, maintains the Fund's accounting records. The accounting fee is based on the level of average net assets for the month. Under a separate contract, FSC administers the security lending program. The security lending fee is based on the number and duration of lending transactions.
Brokerage Commissions. The Fund placed a portion of its portfolio transactions with brokerage firms which are affiliates of the investment adviser. The commissions paid to these affiliated firms were $9,718 for the period.
Interfund Lending Program. Pursuant to an Exemptive Order issued by the SEC, the Fund, along with other registered investment companies having management contracts with FMR, may participate in an interfund lending program. This program provides an alternative credit facility allowing the funds to borrow from, or lend money to, other participating affiliated funds. At period end, there were no interfund loans outstanding. The Fund's activity in this program during the period for which loans were outstanding was as follows:
Borrower or Lender | Average
Daily Loan
Balance | Weighted
Average Interest
Rate | Interest
Expense |
Borrower | $ 3,460,667 | .46% | $ 666 |
Annual Report
Notes to Financial Statements - continued
6. Committed Line of Credit.
The Fund participates with other funds managed by FMR or an affiliate in a $3.75 billion credit facility (the "line of credit") to be utilized for temporary or emergency purposes to fund shareholder redemptions or for other short-term liquidity purposes. The Fund has agreed to pay commitment fees on its pro-rata portion of the line of credit, which amounted to $774 and is reflected in Miscellaneous expenses on the Statement of Operations. During the period, there were no borrowings on this line of credit.
7. Security Lending.
The Fund lends portfolio securities through a lending agent from time to time in order to earn additional income. The lending agent may loan securities to certain qualified borrowers, including Fidelity Capital Markets (FCM), a broker-dealer affiliated with the Fund. On the settlement date of the loan, the Fund receives collateral (in the form of U.S. Treasury obligations, letters of credit and/or cash) against the loaned securities and maintains collateral in an amount not less than 100% of the market value of the loaned securities during the period of the loan. The market value of the loaned securities is determined at the close of business of the Fund and any additional required collateral is delivered to the Fund on the next business day. If the borrower defaults on its obligation to return the securities loaned because of insolvency or other reasons, a fund could experience delays and costs in recovering the securities loaned or in gaining access to the collateral. Any cash collateral received is invested in the Fidelity Securities Lending Cash Central Fund. The value of loaned securities and cash collateral at period end are disclosed on the Fund's Statement of Assets and Liabilities. Security lending income represents the income earned on investing cash collateral, less rebates paid to borrowers and lending agent fees associated with the loan, plus any premium payments received for lending certain types of securities. Security lending income is presented in the Statement of Operations as a component of income from Fidelity Central Funds. Total security lending income during the period amounted to $89,586. During the period, there were no securities loaned to FCM.
8. Bank Borrowings.
The Fund is permitted to have bank borrowings for temporary or emergency purposes to fund shareholder redemptions. The Fund has established borrowing arrangements with certain banks. The interest rate on the borrowings is the bank's base rate, as revised from time to time. The average daily loan balance during the period for which loans were outstanding amounted to $3,318,000. The weighted average interest rate was .69%. The interest expense amounted to $254 under the bank borrowing program. At period end, there were no bank borrowings outstanding.
Annual Report
9. Expense Reductions.
Many of the brokers with whom FMR places trades on behalf of the Fund provided services to the Fund in addition to trade execution. These services included payments of certain expenses on behalf of the Fund totaling $41,295 for the period.
10. Distributions to Shareholders.
Distributions to shareholders of each class were as follows:
Years ended October 31, | 2010 | 2009 A |
From net investment income | | |
Class A | $ 7,432 | $ - |
Global Commodity Stock | 168,019 | - |
Institutional Class | 12,973 | - |
Total | $ 188,424 | $ - |
From net realized gain | | |
Class A | $ 143,058 | $ - |
Class T | 30,137 | - |
Class B | 9,302 | - |
Class C | 20,828 | - |
Global Commodity Stock | 1,078,126 | - |
Institutional Class | 76,840 | - |
Total | $ 1,358,291 | $ - |
A For the period March 25, 2009 (commencement of operations) to October 31, 2009.
11. Share Transactions.
Transactions for each class of shares were as follows:
| Shares | Dollars |
Years ended October 31, | 2010 | 2009 A | 2010 | 2009 A |
Class A | | | | |
Shares sold | 3,636,511 | 1,217,436 | $ 52,113,230 | $ 15,536,230 |
Reinvestment of distributions | 8,310 | - | 119,911 | - |
Shares redeemed | (957,806) | (35,397) | (13,354,681) | (440,651) |
Net increase (decrease) | 2,687,015 | 1,182,039 | $ 38,878,460 | $ 15,095,579 |
Class T | | | | |
Shares sold | 635,625 | 352,496 | $ 9,055,849 | $ 4,355,249 |
Reinvestment of distributions | 2,006 | - | 28,921 | - |
Shares redeemed | (233,090) | (796) | (3,190,490) | (10,905) |
Net increase (decrease) | 404,541 | 351,700 | $ 5,894,280 | $ 4,344,344 |
Annual Report
Notes to Financial Statements - continued
11. Share Transactions - continued
Transactions for each class of shares were as follows: - continued
| Shares | Dollars |
Years ended October 31, | 2010 | 2009 A | 2010 | 2009 A |
Class B | | | | |
Shares sold | 275,613 | 209,917 | $ 3,943,173 | $ 2,460,093 |
Reinvestment of distributions | 543 | - | 7,824 | - |
Shares redeemed | (200,985) | (3,790) | (2,763,660) | (51,192) |
Net increase (decrease) | 75,171 | 206,127 | $ 1,187,337 | $ 2,408,901 |
Class C | | | | |
Shares sold | 869,321 | 368,806 | $ 12,506,411 | $ 4,531,477 |
Reinvestment of distributions | 1,339 | - | 19,266 | - |
Shares redeemed | (305,685) | (5,994) | (4,197,936) | (81,571) |
Net increase (decrease) | 564,975 | 362,812 | $ 8,327,741 | $ 4,449,906 |
Global Commodity Stock | | | | |
Shares sold | 19,122,952 | 14,544,887 | $ 278,892,729 | $ 183,653,183 |
Reinvestment of distributions | 81,765 | - | 1,181,498 | - |
Shares redeemed | (11,379,620) | (2,563,407) | (158,960,668) | (31,996,439) |
Net increase (decrease) | 7,825,097 | 11,981,480 | $ 121,113,559 | $ 151,656,744 |
Institutional Class | | | | |
Shares sold | 1,969,025 | 773,649 | $ 28,672,948 | $ 9,932,033 |
Reinvestment of distributions | 2,588 | - | 37,397 | - |
Shares redeemed | (426,975) | (36,369) | (6,016,467) | (435,916) |
Net increase (decrease) | 1,544,638 | 737,280 | $ 22,693,878 | $ 9,496,117 |
A For the period March 25, 2009 (commencement of operations) to October 31, 2009.
12. Other.
The Fund's organizational documents provide former and current trustees and officers with a limited indemnification against liabilities arising in connection with the performance of their duties to the Fund. In the normal course of business, the Fund may also enter into contracts that provide general indemnifications. The Fund's maximum exposure under these arrangements is unknown as this would be dependent on future claims that may be made against the Fund. The risk of material loss from such claims is considered remote.
Annual Report
To the Trustees of Fidelity Investment Trust and the Shareholders of Fidelity Global Commodity Stock Fund:
In our opinion, the accompanying statement of assets and liabilities, including the schedule of investments, and the related statements of operations and of changes in net assets and the financial highlights present fairly, in all material respects, the financial position of Fidelity Global Commodity Stock Fund (a fund of Fidelity Investment Trust) at October 31, 2010, the results of its operations for the year then ended, the changes in its net assets for each of the periods indicated and the financial highlights for each of the periods indicated, in conformity with accounting principles generally accepted in the United States of America. These financial statements and financial highlights (hereafter referred to as "financial statements") are the responsibility of the Fidelity Global Commodity Stock Fund's management. Our responsibility is to express an opinion on these financial statements based on our audits. We conducted our audits of these financial statements in accordance with the standards of the Public Company Accounting Oversight Board (United States). Those standards require that we plan and perform the audit to obtain reasonable assurance about whether the financial statements are free of material misstatement. An audit includes examining, on a test basis, evidence supporting the amounts and disclosures in the financial statements, assessing the accounting principles used and significant estimates made by management, and evaluating the overall financial statement presentation. We believe that our audits, which included confirmation of securities at October 31, 2010 by correspondence with the custodian and brokers, provide a reasonable basis for our opinion.
/s/ PricewaterhouseCoopers LLP
PricewaterhouseCoopers LLP
Boston, Massachusetts
December 17, 2010
Annual Report
The Trustees, Member of the Advisory Board, and executive officers of the trust and fund, as applicable, are listed below. The Board of Trustees governs the fund and is responsible for protecting the interests of shareholders. The Trustees are experienced executives who meet periodically throughout the year to oversee the fund's activities, review contractual arrangements with companies that provide services to the fund, oversee management of the risks associated with such activities and contractual arrangements, and review the fund's performance. Except for James C. Curvey, each of the Trustees oversees 221 funds advised by FMR or an affiliate. Mr. Curvey oversees 410 funds advised by FMR or an affiliate.
The Trustees hold office without limit in time except that (a) any Trustee may resign; (b) any Trustee may be removed by written instrument, signed by at least two-thirds of the number of Trustees prior to such removal; (c) any Trustee who requests to be retired or who has become incapacitated by illness or injury may be retired by written instrument signed by a majority of the other Trustees; and (d) any Trustee may be removed at any special meeting of shareholders by a two-thirds vote of the outstanding voting securities of the trust. Each Trustee who is not an interested person (as defined in the 1940 Act) (Independent Trustee), shall retire not later than the last day of the calendar year in which his or her 72nd birthday occurs. The Independent Trustees may waive this mandatory retirement age policy with respect to individual Trustees. The executive officers and Advisory Board Member hold office without limit in time, except that any officer and Advisory Board Member may resign or may be removed by a vote of a majority of the Trustees at any regular meeting or any special meeting of the Trustees. Except as indicated, each individual has held the office shown or other offices in the same company for the past five years.
Experience, Skills, Attributes, and Qualifications of the Fund's Trustees. The Governance and Nominating Committee has adopted a statement of policy that describes the experience, qualifications, attributes, and skills that are necessary and desirable for potential Independent Trustee candidates (Statement of Policy). The Board believes that each Trustee satisfied at the time he or she was initially elected or appointed a Trustee, and continues to satisfy, the standards contemplated by the Statement of Policy. The Governance and Nominating Committee also engages professional search firms to help identify potential Independent Trustee candidates who have the experience, qualifications, attributes, and skills consistent with the Statement of Policy. From time to time, additional criteria based on the composition and skills of the current Independent Trustees, as well as experience or skills that may be appropriate in light of future changes to board composition, business conditions, and regulatory or other developments, have also been considered by the professional search firms and the Governance and Nominating Committee. In addition, the Board takes into account the Trustees' commitment and participation in Board and committee meetings, as well as their leadership of standing and ad hoc committees throughout their tenure.
In determining that a particular Trustee was and continues to be qualified to serve as a Trustee, the Board has considered a variety of criteria, none of which, in isolation, was controlling. The Board believes that, collectively, the Trustees have balanced and diverse experience, qualifications, attributes, and skills, which allow the Board to operate effectively in governing the fund and protecting the interests of shareholders. Information about the specific experience, skills, attributes, and qualifications of each Trustee, which in each case led to the Board's conclusion that the Trustee should serve (or continue to serve) as a trustee of the fund, is provided below.
Annual Report
Board Structure and Oversight Function. Edward C. Johnson 3d is an interested person (as defined in the 1940 Act) and currently serves as Chairman. The Trustees have determined that an interested Chairman is appropriate and benefits shareholders because an interested Chairman has a personal and professional stake in the quality and continuity of services provided to the fund. Independent Trustees exercise their informed business judgment to appoint an individual of their choosing to serve as Chairman, regardless of whether the Trustee happens to be independent or a member of management. The Independent Trustees have determined that they can act independently and effectively without having an Independent Trustee serve as Chairman and that a key structural component for assuring that they are in a position to do so is for the Independent Trustees to constitute a substantial majority for the Board. The Independent Trustees also regularly meet in executive session. Ned C. Lautenbach serves as Chairman of the Independent Trustees and as such (i) acts as a liaison between the Independent Trustees and management with respect to matters important to the Independent Trustees and (ii) with management prepares agendas for Board meetings.
Fidelity funds are overseen by different Boards of Trustees. The fund's Board oversees Fidelity's equity and high income funds and another Board oversees Fidelity's investment-grade bond, money market, and asset allocation funds. The asset allocation funds may invest in Fidelity funds overseen by the fund's Board. The use of separate Boards, each with its own committee structure, allows the Trustees of each group of Fidelity funds to focus on the unique issues of the funds they oversee, including common research, investment, and operational issues. On occasion, the separate Boards establish joint committees to address issues of overlapping consequences for the Fidelity funds overseen by each Board.
The Trustees operate using a system of committees to facilitate the timely and efficient consideration of all matters of importance to the Trustees, the fund, and fund shareholders and to facilitate compliance with legal and regulatory requirements and oversight of the fund's activities and associated risks. The Board, acting through its committees, has charged FMR and its affiliates with (i) identifying events or circumstances the occurrence of which could have demonstrably adverse effects on the fund's business and/or reputation; (ii) implementing processes and controls to lessen the possibility that such events or circumstances occur or to mitigate the effects of such events or circumstances if they do occur; and (iii) creating and maintaining a system designed to evaluate continuously business and market conditions in order to facilitate the identification and implementation processes described in (i) and (ii) above. Because the day-to-day operations and activities of the fund are carried out by or through FMR, its affiliates and other service providers, the fund's exposure to risks is mitigated but not eliminated by the processes overseen by the Trustees. While each of the Board's committees has responsibility for overseeing different aspects of the fund's activities, oversight is exercised primarily through the Operations, Audit, and Compliance Committees. Appropriate personnel, including but not limited to the fund's Chief Compliance Officer (CCO), FMR's internal auditor, the independent accountants, the fund's Treasurer and portfolio management personnel, make periodic reports to the Board's committees, as appropriate. The responsibilities of each committee, including their oversight responsibilities, are described further under "Standing Committees of the Fund's Trustees."
Annual Report
Trustees and Officers - continued
The fund's Statement of Additional Information (SAI) includes more information about the Trustees. To request a free copy, call Fidelity at 1-800-544-8544.
Interested Trustees*:
Correspondence intended for each Trustee who is an interested person may be sent to Fidelity Investments, 82 Devonshire Street, Boston, Massachusetts 02109.
Name, Age; Principal Occupations and Other Relevant Experience+ |
Edward C. Johnson 3d (80) |
| Year of Election or Appointment: 1984 Mr. Johnson is Trustee and Chairman of the Board of Trustees of certain Trusts. Mr. Johnson serves as Chief Executive Officer, Chairman, and a Director of FMR LLC; Chairman and a Director of FMR; Chairman and a Director of Fidelity Research & Analysis Company (FRAC); Chairman and a Director of Fidelity Investments Money Management, Inc.; and Chairman and a Director of FMR Co., Inc. In addition, Mr. Johnson serves as Chairman and Director of FIL Limited. Previously, Mr. Johnson served as President of FMR LLC (2006-2007). |
James C. Curvey (75) |
| Year of Election or Appointment: 2007 Mr. Curvey also serves as Trustee (2007-present) of other investment companies advised by FMR. Mr. Curvey is a Director of Fidelity Investments Money Management, Inc. (2009-present), Director of Fidelity Research & Analysis Co. (2009-present) and Director of FMR and FMR Co., Inc. (2007-present). Mr. Curvey is also Vice Chairman (2007-present) and Director of FMR LLC. In addition, Mr. Curvey serves as an Overseer for the Boston Symphony Orchestra and a member of the Trustees of Villanova University. Previously, Mr. Curvey was the Vice Chairman (2006-2007) and Director (2000-2007) of FMR Corp. |
* Trustees have been determined to be "Interested Trustees" by virtue of, among other things, their affiliation with the trust or various entities under common control with FMR.
+ The information above includes each Trustee's principal occupation during the last five years and other information relating to the experience, attributes, and skills relevant to each Trustee's qualifications to serve as a Trustee, which led to the conclusion that each Trustee should serve as a Trustee for the fund.
Annual Report
Independent Trustees:
Correspondence intended for each Independent Trustee (that is, the Trustees other than the Interested Trustees) may be sent to Fidelity Investments, P.O. Box 55235, Boston, Massachusetts 02205-5235.
Name, Age; Principal Occupations and Other Relevant Experience+ |
Dennis J. Dirks (62) |
| Year of Election or Appointment: 2005 Prior to his retirement in May 2003, Mr. Dirks was Chief Operating Officer and a member of the Board of The Depository Trust & Clearing Corporation (DTCC). He also served as President, Chief Operating Officer, and Board member of The Depository Trust Company (DTC) and President and Board member of the National Securities Clearing Corporation (NSCC). In addition, Mr. Dirks served as Chief Executive Officer and Board member of the Government Securities Clearing Corporation, Chief Executive Officer and Board member of the Mortgage-Backed Securities Clearing Corporation, as a Trustee and a member of the Finance Committee of Manhattan College (2005-2008), and as a Trustee and a member of the Finance Committee of AHRC of Nassau County (2006-2008). Mr. Dirks is a member of the Independent Directors Council (IDC) Governing Council (2010-Present) and Board of Directors for The Brookville Center for Children's Services, Inc. (2009-present). |
Alan J. Lacy (57) |
| Year of Election or Appointment: 2008 Mr. Lacy serves as Senior Adviser (2007-present) of Oak Hill Capital Partners, L.P. (private equity). Mr. Lacy also served as Chief Executive Officer (2000-2005) and Vice Chairman (2005-2006) of Sears Holdings Corporation and Sears, Roebuck and Co. (retail). In addition, Mr. Lacy serves as a member of the Board of Directors of The Western Union Company (global money transfer, 2006-present) and Bristol-Myers Squibb Company (global pharmaceuticals, 2007-present). Mr. Lacy is Chairman (2008-present) and a member (2006-present) of the Board of Trustees of The National Parks Conservation Association. |
Ned C. Lautenbach (66) |
| Year of Election or Appointment: 2000 Mr. Lautenbach is Chairman of the Independent Trustees of the Equity and High Income Funds (2006-present). Mr. Lautenbach currently serves as the Lead Director of the Eaton Corporation Board of Directors (diversified industrial, 1997-present). Mr. Lautenbach is also a member of the Board of Directors of the Philharmonic Center for the Arts in Naples, Florida (1999-present); a member of the Board of Trustees of Fairfield University (2005-present); and a member of the Council on Foreign Relations (1994-present). Previously, Mr. Lautenbach was a Partner/Advisory Partner at Clayton, Dubilier & Rice, Inc. (private equity investment, 1998-2010), as well as a Director of Sony Corporation (2006-2007). |
Joseph Mauriello (66) |
| Year of Election or Appointment: 2008 Prior to his retirement in January 2006, Mr. Mauriello served in numerous senior management positions including Deputy Chairman and Chief Operating Officer (2004-2005), and Vice Chairman of Financial Services (2002-2004) of KPMG LLP US (professional services, 1965-2005). Mr. Mauriello currently serves as a member of the Board of Directors of XL Group plc. (global insurance and re-insurance, 2006-present) and of Arcadia Resources Inc. (health care services and products, 2007-present). Previously, Mr. Mauriello served as a Director of the Hamilton Funds of the Bank of New York (2006-2007). |
Cornelia M. Small (66) |
| Year of Election or Appointment: 2005 Ms. Small is a member of the Board of Directors of the Teagle Foundation (2009-present). Ms. Small is also a member of the Investment Committee, and Chair (2008-present) and a member of the Board of Trustees of Smith College. In addition, Ms. Small serves on the Investment Committee of the Berkshire Taconic Community Foundation (2008-present). Previously, Ms. Small served as Chairperson of the Investment Committee (2002-2008) of Smith College. In addition, Ms. Small served as Chief Investment Officer, Director of Global Equity Investments, and a member of the Board of Directors of Scudder, Stevens & Clark and Scudder Kemper Investments. |
William S. Stavropoulos (71) |
| Year of Election or Appointment: 2001 Mr. Stavropoulos is Vice Chairman of the Independent Trustees of the Equity and High Income Funds (2006-present). Mr. Stavropoulos serves as President and Founder of the Michigan Baseball Foundation, the Great Lakes Loons (2007-present). Mr. Stavropoulos is Chairman Emeritus of the Board of Directors of The Dow Chemical Company, where he previously served in numerous senior management positions, including President, CEO (1995-2000; 2002-2004), Chairman of the Executive Committee (2000-2006), and as a member of the Board of Directors (1990-2006). Currently, Mr. Stavropoulos is Chairman of Univar (global distributor of commodity and specialty chemicals, 2010-present), a Director of Teradata Corporation (data warehousing and technology solutions, 2008-present), Chemical Financial Corporation, Maersk Inc. (industrial conglomerate), Tyco International, Inc. (multinational manufacturing and services, 2007-present), and a member of the Advisory Board for Metalmark Capital (private equity investment, 2005-present). Mr. Stavropoulos is a special advisor to Clayton, Dubilier & Rice, Inc. (private equity investment). In addition, Mr. Stavropoulos is a member of the University of Notre Dame Advisory Council for the College of Science. |
David M. Thomas (61) |
| Year of Election or Appointment: 2008 Previously, Mr. Thomas served as Executive Chairman (2005-2006) and Chairman and Chief Executive Officer (2000-2005) of IMS Health, Inc. (pharmaceutical and healthcare information solutions). In addition, Mr. Thomas serves as a member of the Board of Directors of Fortune Brands, Inc. (consumer products), and Interpublic Group of Companies, Inc. (marketing communication, 2004-present). |
Michael E. Wiley (60) |
| Year of Election or Appointment: 2008 Mr. Wiley also serves as a Director of Asia Pacific Exploration Consolidated (international oil and gas exploration and production, 2008-present). Mr. Wiley serves as a Director of Tesoro Corporation (independent oil refiner and marketer, 2005-present), and a Director of Bill Barrett Corporation (exploration and production, 2005-present). In addition, Mr. Wiley also serves as a Director of Post Oak Bank (privately-held bank, 2004-present). Previously, Mr. Wiley served as a member of the Board of Trustees of the University of Tulsa (2000-2006; 2007-2010), as a Senior Energy Advisor of Katzenbach Partners, LLC (consulting, 2006-2007), as an Advisory Director of Riverstone Holdings (private investment), Chairman, President, and CEO of Baker Hughes, Inc. (oilfield services, 2000-2004), and as Director of Spinnaker Exploration Company (exploration and production, 2001-2005). |
+ The information above includes each Trustee's principal occupation during the last five years and other information relating to the experience, attributes, and skills relevant to each Trustee's qualifications to serve as a Trustee, which led to the conclusion that each Trustee should serve as a Trustee for the fund.
Advisory Board Member and Executive Officers:
Correspondence intended for each executive officer and Peter S. Lynch may be sent to Fidelity Investments, 82 Devonshire Street, Boston, Massachusetts 02109.
Name, Age; Principal Occupation |
Peter S. Lynch (66) |
| Year of Election or Appointment: 2003 Member of the Advisory Board of Fidelity's Equity and High Income Funds. Mr. Lynch is Vice Chairman and a Director of FMR and FMR Co., Inc. In addition, Mr. Lynch serves as a Trustee of Boston College and as the Chairman of the Inner-City Scholarship Fund. Previously, Mr. Lynch served on the Special Olympics International Board of Directors (1997-2006). |
Kenneth B. Robins (41) |
| Year of Election or Appointment: 2008 President and Treasurer of Fidelity's Equity and High Income Funds. Mr. Robins also serves as President and Treasurer (2010-present) and Assistant Treasurer (2009-present) of other Fidelity funds and is an employee of Fidelity Investments (2004-present). Previously, Mr. Robins served as Deputy Treasurer of the Fidelity funds (2005-2008) and Treasurer and Chief Financial Officer of The North Carolina Capital Management Trust: Cash and Term Portfolios (2006-2008). |
Brian B. Hogan (46) |
| Year of Election or Appointment: 2009 Vice President of certain Equity Funds and Vice President of Sector Funds. Mr. Hogan also serves as President of FMR's Equity Division (2009-present). Previously, Mr. Hogan served as Senior Vice President, Equity Research of FMR (2006-2009) and as a portfolio manager. |
Christopher S. Bartel (38) |
| Year of Election or Appointment: 2009 Vice President of Fidelity's Sector and Real Estate Equity Funds. Mr. Bartel also serves as Senior Vice President of Equity Research (2009-present). Previously, Mr. Bartel served as Managing Director of Research (2006-2009) and an analyst and portfolio manager (2000-2006). |
Scott C. Goebel (42) |
| Year of Election or Appointment: 2008 Secretary and Chief Legal Officer (CLO) of the Fidelity funds. Mr. Goebel also serves as Secretary and CLO of The North Carolina Capital Management Trust: Cash and Term Portfolio (2008-present); General Counsel, Secretary, and Senior Vice President of FMR (2008-present) and FMR Co., Inc. (2008-present); Deputy General Counsel of FMR LLC; Chief Legal Officer of Fidelity Management & Research (Hong Kong) Limited (2008-present) and Assistant Secretary of Fidelity Management & Research (Japan) Inc. (2008-present), Fidelity Investments Money Management, Inc. (2008-present), Fidelity Management & Research (U.K.) Inc. (2008-present), and Fidelity Research and Analysis Company (2008-present). Previously, Mr. Goebel served as Assistant Secretary of the Funds (2007-2008) and as Vice President and Secretary of Fidelity Distributors Corporation (FDC) (2005-2007). |
William C. Coffey (41) |
| Year of Election or Appointment: 2009 Assistant Secretary of Fidelity's Equity and High Income Funds. Mr. Coffey also serves as Senior Vice President and Deputy General Counsel of FMR LLC (2010-present), and is an employee of Fidelity Investments. Previously, Mr. Coffey served as Vice President and Associate General Counsel of FMR LLC (2005-2009). |
Holly C. Laurent (56) |
| Year of Election or Appointment: 2008 Anti-Money Laundering (AML) Officer of the Fidelity funds. Ms. Laurent also serves as AML Officer of The North Carolina Capital Management Trust: Cash and Term Portfolio (2008-present) and is an employee of Fidelity Investments. Previously, Ms. Laurent was Senior Vice President and Head of Legal for Fidelity Business Services India Pvt. Ltd. (2006-2008), and Senior Vice President, Deputy General Counsel and Group Head for FMR LLC (2005-2006). |
Christine Reynolds (52) |
| Year of Election or Appointment: 2008 Chief Financial Officer of the Fidelity funds. Ms. Reynolds became President of Fidelity Pricing and Cash Management Services (FPCMS) in August 2008. Ms. Reynolds served as Chief Operating Officer of FPCMS (2007-2008). Previously, Ms. Reynolds served as President, Treasurer, and Anti-Money Laundering officer of the Fidelity funds (2004-2007). |
Kenneth A. Rathgeber (63) |
| Year of Election or Appointment: 2004 Chief Compliance Officer of Fidelity's Equity and High Income Funds. Mr. Rathgeber is Chief Compliance Officer of Fidelity Management & Research (Hong Kong) Limited (2008-present), Fidelity Management & Research (Japan) Inc. (2008-present), FMR (2005-present), FMR Co., Inc. (2005-present), Fidelity Management & Research (U.K.) Inc. (2005-present), Fidelity Research & Analysis Company (2005-present), Fidelity Investments Money Management, Inc. (2005-present), Pyramis Global Advisors, LLC (2005-present), and Strategic Advisers, Inc. (2005-present). |
Jeffrey S. Christian (49) |
| Year of Election or Appointment: 2009 Deputy Treasurer of the Fidelity funds. Mr. Christian is an employee of Fidelity Investments. Previously, Mr. Christian served as Chief Financial Officer (2008-2009) of certain Fidelity funds and Senior Vice President of Fidelity Pricing and Cash Management Services (FPCMS) (2004-2009). |
Bryan A. Mehrmann (49) |
| Year of Election or Appointment: 2005 Deputy Treasurer of the Fidelity funds. Mr. Mehrmann is an employee of Fidelity Investments. |
Adrien E. Deberghes (43) |
| Year of Election or Appointment: 2008 Deputy Treasurer of Fidelity's Equity and High Income Funds. Mr. Deberghes also serves as Assistant Treasurer of other Fidelity funds (2010-present) and is an employee of Fidelity Investments (2008-present). Previously, Mr. Deberghes served as Senior Vice President of Mutual Fund Administration at State Street Corporation (2007-2008), Senior Director of Mutual Fund Administration at Investors Bank & Trust (2005-2007), and Director of Finance for Dunkin' Brands (2000-2005). |
Stephanie J. Dorsey (41) |
| Year of Election or Appointment: 2010 Assistant Treasurer of Fidelity's Equity and High Income Funds. Ms. Dorsey also serves as Deputy Treasurer of other Fidelity funds (2008-present) and is an employee of Fidelity Investments (2008-present). Previously, Ms. Dorsey served as Treasurer (2004-2008) of the JPMorgan Mutual Funds and Vice President (2004-2008) of JPMorgan Chase Bank. |
John R. Hebble (52) |
| Year of Election or Appointment: 2009 Assistant Treasurer of Fidelity's Equity and High Income Funds. Mr. Hebble also serves as Treasurer and Chief Financial Officer of The North Carolina Capital Management Trust: Cash and Term Portfolio (2008-present), President and Treasurer of other Fidelity funds (2008-present) and is an employee of Fidelity Investments. |
Gary W. Ryan (52) |
| Year of Election or Appointment: 2005 Assistant Treasurer of the Fidelity funds. Mr. Ryan is an employee of Fidelity Investments. Previously, Mr. Ryan served as Vice President of Fund Reporting in Fidelity Pricing and Cash Management Services (FPCMS) (1999-2005). |
Jonathan Davis (42) |
| Year of Election or Appointment: 2010 Assistant Treasurer of the Fidelity funds. Mr. Davis is an employee of Fidelity Investments. Previously, Mr. Davis served as Vice President and Associate General Counsel of FMR LLC (2003-2010). |
Annual Report
The Board of Trustees of Fidelity Global Commodity Stock Fund voted to pay to shareholders of record at the opening of business on record date, the following distributions per share derived from capital gains realized from sales of portfolio securities, and dividends derived from net investment income:
| Pay Date | Record Date | Dividends | Capital Gains |
Class A | 12/13/10 | 12/10/10 | $0.11 | $0.062 |
Class T | 12/13/10 | 12/10/10 | $0.073 | $0.062 |
Class B | 12/13/10 | 12/10/10 | $0.00 | $0.062 |
Class C | 12/13/10 | 12/10/10 | $0.026 | $0.062 |
The fund hereby designates as a capital gain dividend with respect to the taxable year ended October 31, 2010, $1,911,902, or, if subsequently determined to be different, the net capital gain of such year.
Class A, T, B, and C designate 12%, 15%, 28%, and 23% of the dividends distributed, respectively during the fiscal year as qualifying for the dividends-received deduction for corporate shareholders.
Class A, T, B and C designate 62%, 75%, 100%, and 100% of the dividends distributed, respectively during the fiscal year as amounts which may be taken into account as a dividend for purposes of the maximum rate under section 1(h)(11) of the Internal Revenue Code.
The amounts per share which represent income derived from sources within, and taxes paid to, foreign countries or possessions of the United States are as follows:
| Pay Date | Income | Taxes |
Class A | 12/14/09 | $0.007 | $0.0027 |
Class T | 12/14/09 | $0.006 | $0.0027 |
Class B | 12/14/09 | $0.003 | $0.0027 |
Class C | 12/14/09 | $0.004 | $0.0027 |
The fund will notify shareholders in January 2011 of amounts for use in preparing 2010 income tax returns.
Annual Report
Board Approval of Investment Advisory Contracts and Management Fees
Fidelity Global Commodity Stock Fund
Each year, the Board of Trustees, including the Independent Trustees (together, the Board), votes on the renewal of the management contract and sub-advisory agreements (together, the Advisory Contracts) for the fund. The Board, assisted by the advice of fund counsel and Independent Trustees' counsel, requests and considers a broad range of information relevant to the renewal of the Advisory Contracts throughout the year.
The Board meets regularly and considers at each of its meetings factors that are relevant to its annual consideration of the renewal of the fund's Advisory Contracts, including the services and support provided to the fund and its shareholders. The Board has established various standing committees, each composed of Independent Trustees with varying backgrounds, to which the Board has assigned specific subject matter responsibilities in order to enhance effective decision-making by the Board. The Board, acting directly and through its Committees, requests and receives information concerning the annual consideration of the renewal of the fund's Advisory Contracts. The Board also meets as needed to consider matters specifically related to the Board's annual consideration of the renewal of Advisory Contracts. Members of the Board may also meet with trustees of other Fidelity funds through ad hoc joint committees to discuss certain matters relevant to the Fidelity funds.
At its July 2010 meeting, the Board of Trustees, including the Independent Trustees, unanimously determined to renew the fund's Advisory Contracts. In reaching its determination, the Board considered all factors it believed relevant, including (i) the nature, extent, and quality of the services to be provided to the fund and its shareholders (including the investment performance of the fund); (ii) the competitiveness of the fund's management fee and total expenses; (iii) the total costs of the services to be provided by and the profits to be realized by Fidelity from its relationship with the fund; (iv) the extent to which economies of scale would be realized as the fund grows; and (v) whether fee levels reflect these economies of scale, if any, for the benefit of fund shareholders.
In considering whether to renew the Advisory Contracts for the fund, the Board reached a determination, with the assistance of fund counsel and Independent Trustees' counsel and through the exercise of its business judgment, that the renewal of the Advisory Contracts is in the best interests of fund shareholders and that the compensation to be received by Fidelity under the management contract is fair and reasonable. The Board's decision to renew the Advisory Contracts was not based on any single factor noted above, but rather was based on a comprehensive consideration of all the information provided to the Board at its meetings throughout the year. The Board, in reaching its determination to renew the Advisory Contracts, is aware that shareholders in the fund have a broad range of investment choices available to them, including a wide choice among mutual funds offered by Fidelity's competitors, and that the fund's shareholders, with the opportunity to review and weigh the disclosure provided by the fund in its prospectus and other public disclosures, have chosen to invest in this fund, managed by Fidelity.
Annual Report
Board Approval of Investment Advisory Contracts and
Management Fees - continued
Nature, Extent, and Quality of Services Provided. The Board considered the staffing within the investment adviser, FMR, and the sub-advisers (together, the Investment Advisers), including the backgrounds of the fund's investment personnel and the fund's investment objective and discipline. The Independent Trustees also had discussions with senior management of Fidelity's investment operations and investment groups. The Board considered the structure of the portfolio manager compensation program and whether this structure provides appropriate incentives to act in the best interest of the fund.
Resources Dedicated to Investment Management and Support Services. The Board and the equity research subcommittee of the Board's Fund Oversight Committee reviewed the size, education, and experience of the Investment Advisers' investment staff, their use of technology, and the Investment Advisers' approach to recruiting, training, and retaining portfolio managers and other research, advisory, and management personnel. The Board noted that Fidelity's analysts have access to a variety of technological tools and market and securities data that enable them to perform both fundamental and quantitative analysis and to specialize in various disciplines. The Board considered Fidelity's extensive global research capabilities that enable the Investment Advisers to aggregate data from various sources in an effort to produce positive investment results. The Board also considered that Fidelity's portfolio managers and analysts have access to daily portfolio attribution that allows for monitoring of a fund's portfolio, as well as an electronic communication system that provides immediate real-time access to research concerning issuers and credit enhancers. The Board noted FMR's continued focus on strengthening the organization and discipline of equity portfolio management and research.
Shareholder and Administrative Services. The Board considered (i) the nature, extent, quality, and cost of advisory, administrative, and shareholder services performed by the Investment Advisers and their affiliates under the Advisory Contracts and under separate agreements covering transfer agency, pricing and bookkeeping, and securities lending services for the fund; (ii) the nature and extent of the investment adviser's supervision of third party service providers, principally custodians and subcustodians; and (iii) the resources devoted to, and the record of compliance with, the fund's compliance policies and procedures. The Board also reviewed the allocation of fund brokerage, including allocations to brokers affiliated with the Investment Advisers, the use of brokerage commissions to pay fund expenses, and the use of "soft" commission dollars to pay for research services.
The Board noted that the growth of fund assets over time across the complex allows Fidelity to reinvest in the development of services designed to enhance the value or convenience of the Fidelity funds as investment vehicles. These services include 24-hour access to account information and market information through phone representatives and over the Internet, and investor education materials and asset allocation tools.
Annual Report
Investment in a Large Fund Family. The Board considered the benefits to shareholders of investing in a Fidelity fund, including the benefits of investing in a fund that is part of a large family of funds offering a variety of investment disciplines and providing a large variety of mutual fund investor services. The Board noted that Fidelity had taken, or had made recommendations that resulted in the Fidelity funds taking, a number of actions over the previous year that benefited particular funds, including (i) dedicating additional resources to investment research and restructuring and broadening the focus of the investment research teams; (ii) bolstering the senior management team that oversees asset management; (iii) launching Class F of certain funds as a lower-fee class available to Freedom K and Freedom Index Funds; (iv) lowering the initial investment minimums and ongoing balance requirements for Real Estate High Income Fund; (v) eliminating subsequent purchase minimums for all funds and adding a waiver of the investment minimum requirement for new accounts opened with the proceeds of a systematic withdrawal plan; (vi) eliminating the withdrawal minimum and maximum limits for systematic withdrawals from Advisor funds; (vii) expanding sales load waivers on Class A shares for Destiny Planholders and expanding Institutional Class eligibility for Class O Destiny Planholders; and (viii) changing certain Class A and Class T sales charge structures to further align them with industry practices.
Investment Performance. The Board considered whether the fund has operated in accordance with its investment objective, as well as its record of compliance with its investment restrictions. The Board noted that it is not possible to evaluate performance in any comprehensive fashion because the fund had been in operation for less than one calendar year. Once the fund has been in operation for at least one calendar year, the Board will review the fund's absolute investment performance for each class, as well as the fund's relative investment performance for each class measured against a broad-based securities market index and, if a meaningful peer group exists, a peer group of mutual funds.
Based on its review, and giving particular weight to the nature and quality of the resources dedicated by the Investment Advisers to maintain and improve relative performance and factoring in the unprecedented market events in recent years, the Board concluded that the nature, extent, and quality of investment management and support services and of shareholder and administrative services provided to the fund will benefit the fund's shareholders, particularly in light of the Board's view that the fund's shareholders benefit from investing in a fund that is part of a large family of funds offering a variety of investment disciplines and services.
Annual Report
Board Approval of Investment Advisory Contracts and
Management Fees - continued
Competitiveness of Management Fee and Total Fund Expenses. The Board considered the fund's management fee and total expenses compared to "mapped groups" of competitive funds and classes. Fidelity creates "mapped groups" by combining similar Lipper investment objective categories that have comparable management fee characteristics. Combining Lipper investment objective categories aids the Board's management fee and total expense comparisons by broadening the competitive group used for comparison and by reducing the number of universes to which various Fidelity funds are compared.
Management Fee. The Board considered two proprietary management fee comparisons for the period of the fund's operations shown in the chart below. The group of Lipper funds used by the Board for management fee comparisons is referred to below as the "Total Mapped Group." The Total Mapped Group comparison focuses on a fund's standing relative to the total universe of comparable funds available to investors, in terms of gross management fees before expense reimbursements or caps. "TMG %" represents the percentage of funds in the Total Mapped Group that had management fees that were lower than the fund's. For example, a TMG % of 29% means that 71% of the funds in the Total Mapped Group had higher management fees than the fund. The "Asset-Size Peer Group" (ASPG) comparison focuses on a fund's standing relative to non-Fidelity funds similar in size to the fund within the Total Mapped Group. The ASPG represents at least 15% of the funds in the Total Mapped Group with comparable asset size and management fee characteristics, subject to a minimum of 50 funds (or all funds in the Total Mapped Group if fewer than 50). Additional information, such as the ASPG quartile in which the fund's management fee ranked, is also included in the chart and considered by the Board.
Fidelity Global Commodity Stock Fund
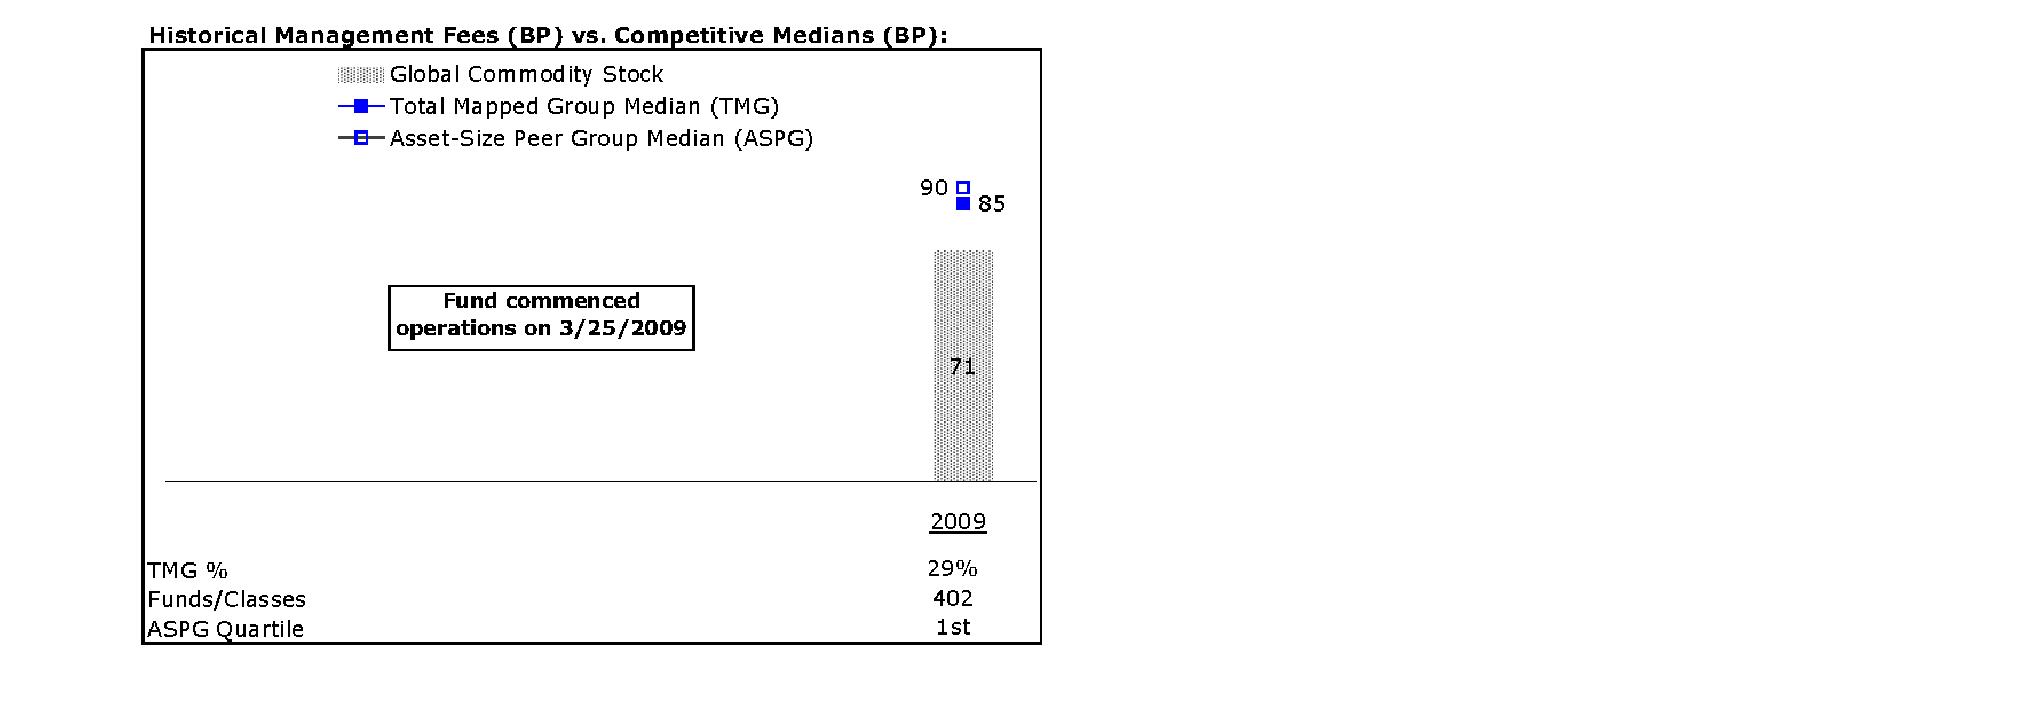
Annual Report
The Board noted that the fund's management fee ranked below the median of its Total Mapped Group and below the median of its ASPG for the period.
Based on its review, the Board concluded that the fund's management fee is fair and reasonable in light of the services that the fund receives and the other factors considered.
Total Expenses. In its review of each class's total expenses, the Board considered the fund's management fee as well as other fund or class expenses, as applicable, such as transfer agent fees, pricing and bookkeeping fees, fund-paid 12b-1 fees, and custodial, legal, and audit fees. The Board also noted the effects of any waivers and reimbursements on fees and expenses. As part of its review, the Board also considered current and historical total expenses of each class of the fund compared to competitive fund median expenses. Each class of the fund is compared to those funds and classes in the Total Mapped Group (used by the Board for management fee comparisons) that have a similar sales load structure.
The Board noted that the total expenses of the retail class ranked below its competitive median for the period and the total expenses of each of Class A, Class T, Class B, Class C, and Institutional Class ranked above its competitive median for the period. The Board considered that total expenses for Class T were above median primarily because its 12b-1 fee is higher than the typical front-end load class. The Board noted that the fund offers multiple classes, each of which has a different sales load and 12b-1 fee structure, and that the multiple structures are intended to offer a range of pricing options for the intermediary market. The Board also noted that the total expenses of the classes vary primarily by the level of their 12b-1 fees, although differences in transfer agent fees may also cause expenses to vary from class to class.
Fees Charged to Other Fidelity Clients. The Board also considered Fidelity fee structures and other information with respect to clients of FMR and its affiliates, such as other mutual funds advised or subadvised by FMR or its affiliates, pension plan clients, and other institutional clients. In March 2010, the Board created an ad hoc joint committee with the board of other Fidelity funds (the Committee) to review and compare Fidelity's institutional investment advisory business with its business of providing services to the Fidelity funds, including the differences in services provided, fees charged, and costs incurred, as well as competition in their respective marketplaces.
Based on its review of total expenses and fees charged to other Fidelity clients, the Board concluded that the total expenses of each class of the fund were reasonable, although in some cases above the median of the universe presented for comparison, in light of the services that the fund and its shareholders receive and the other factors considered, including the findings of the Committee.
Annual Report
Board Approval of Investment Advisory Contracts and
Management Fees - continued
Costs of the Services and Profitability. The Board considered the revenues earned and the expenses incurred by Fidelity in conducting the business of developing, marketing, distributing, managing, administering and servicing the fund and its shareholders. The Board also considered the level of Fidelity's profits in respect of all the Fidelity funds.
On an annual basis, FMR presents to the Board Fidelity's profitability for the fund. Fidelity calculates the profitability for each fund, as well as aggregate profitability for groups of Fidelity funds and all Fidelity funds, using a series of detailed revenue and cost allocation methodologies which originate with the audited books and records of Fidelity. The Audit Committee of the Board reviews any significant changes from the prior year's methodologies.
PricewaterhouseCoopers LLP (PwC), independent registered public accounting firm and auditor to Fidelity and certain Fidelity funds, has been engaged annually by the Board as part of the Board's assessment of Fidelity's profitability analysis. PwC's engagement includes the review and assessment of Fidelity's methodologies used in determining the revenues and expenses attributable to Fidelity's mutual fund business, and completion of agreed-upon procedures surrounding the mathematical accuracy of fund profitability and its conformity to allocation methodologies. After considering PwC's reports issued under the engagement and information provided by Fidelity, the Board believes that while other allocation methods may also be reasonable, Fidelity's profitability methodologies are reasonable in all material respects.
The Board has also reviewed Fidelity's non-fund businesses and fall-out benefits related to the mutual fund business as well as cases where Fidelity's affiliates may benefit from or be related to the fund's business.
The Board considered the costs of the services provided by and the profits realized by Fidelity in connection with the operation of the fund and were satisfied that the profitability was not excessive in the circumstances.
Economies of Scale. The Board considered whether there have been economies of scale in respect of the management of the Fidelity funds, whether the Fidelity funds (including the fund) have appropriately benefited from any such economies of scale, and whether there is potential for realization of any further economies of scale. The Board considered the extent to which the fund will benefit from economies of scale through increased services to the fund, through waivers or reimbursements, or through fee or expense reductions.
In February 2009, the Board and the board of other Fidelity funds created an ad hoc committee (the Economies of Scale Committee) to analyze whether FMR attains economies of scale in respect of the management and servicing of the Fidelity funds, whether the Fidelity funds have appropriately benefited from such economies of scale, and whether there is potential for realization of any further economies of scale.
Annual Report
The Board recognized that the fund's management contract incorporates a "group fee" structure, which provides for lower group fee rates as total fund assets under FMR's management increase, and for higher group fee rates as total fund assets under FMR's management decrease. FMR calculates the group fee rates based on a tiered asset "breakpoint" schedule that varies based on asset class. The Board considered that the group fee is designed to deliver the benefits of economies of scale to fund shareholders when total Fidelity fund assets increase, even if assets of any particular fund are unchanged or have declined, because some portion of Fidelity's costs are attributable to services provided to all Fidelity funds, and all funds benefit if those costs can be allocated among more assets. The Board concluded that, given the group fee structure, fund shareholders will benefit from lower management fees as assets under FMR's management increase at the fund complex level, regardless of whether Fidelity achieves any such economies of scale.
The Board concluded, considering the findings of the Economies of Scale Committee, that any potential economies of scale are being appropriately shared between fund shareholders and Fidelity.
Additional Information Requested by the Board. In order to develop fully the factual basis for consideration of the Fidelity funds' Advisory Contracts, the Board requested and received additional information on certain topics, including (i) fund performance trends, actions to be taken by FMR to improve certain funds' overall performance, and Fidelity's long-term strategies for certain funds; (ii) portfolio manager changes that have occurred during the past year and length of portfolio manager tenure for different categories of funds over time; (iii) Fidelity's compensation structure for portfolio managers, research analysts, and other key personnel, the rationale for the compensation structure, and how the compensation structure provides appropriate performance incentives; (iv) the amount of the investment that each portfolio manager has made in the Fidelity fund(s) that he or she manages; (v) management and other fees paid by FMR to affiliated sub-advisers on behalf of the Fidelity funds; (vi) Fidelity's fee structures and rationale for recommending different fees among different categories of funds; (vii) Fidelity's rationale for recommending which funds should have a performance adjustment component as part of their management fees; (viii) the rationale for any differences between fund fee structures and fee structures in place for other Fidelity clients; and (ix) explanations regarding the relative total expenses borne by certain funds and classes, total expense competitive trends, and actions that might be taken by FMR to reduce total expenses for certain funds and classes.
Based on its evaluation of all of the conclusions noted above, and after considering all factors it believed relevant, the Board ultimately concluded that the advisory fee structures are fair and reasonable, and that the fund's Advisory Contracts should be renewed.
Annual Report
Investment Adviser
Fidelity Management & Research Company
Boston, MA
Investment Sub-Advisers
FMR Co., Inc.
Fidelity Management & Research
(U.K.) Inc.
Fidelity Research & Analysis Company
FIL Investment Advisors
FIL Investments (Japan) Limited
FIL Investment Advisors (U.K.) Limited
Fidelity Management & Research
(Hong Kong) Limited
Fidelity Management & Research
(Japan) Inc.
General Distributor
Fidelity Distributors Corporation
Boston, MA
Transfer and Service Agents
Fidelity Investments Institutional
Operations Company, Inc.
Boston, MA
Fidelity Service Company, Inc.
Boston, MA
Custodian
State Street Bank and Trust Company
Quincy, MA
AGCS-UANN-1210
1.879395.101
(Fidelity Investment logo)(registered trademark)
Fidelity AdvisorSM
Global Commodity Stock
Fund - Institutional Class
Annual Report
October 31, 2010
Institutional Class is a
class of Fidelity® Global
Commodity Stock Fund
(2_fidelity_logos) (Registered_Trademark)
Contents
Chairman's Message | <Click Here> | The Chairman's message to shareholders. |
Performance | <Click Here> | How the fund has done over time. |
Management's Discussion of Fund Performance | <Click Here> | The Portfolio Manager's review of fund performance and strategy. |
Shareholder Expense Example | <Click Here> | An example of shareholder expenses. |
Investment Changes | <Click Here> | A summary of major shifts in the fund's investments over the past six months. |
Investments | <Click Here> | A complete list of the fund's investments with their market values. |
Financial Statements | <Click Here> | Statements of assets and liabilities, operations, and changes in net assets, as well as financial highlights. |
Notes | <Click Here> | Notes to the financial statements. |
Report of Independent Registered Public Accounting Firm | <Click Here> | |
Trustees and Officers | <Click Here> | |
Distributions | <Click Here> | |
Board Approval of Investment Advisory Contracts and Management Fees | <Click Here> | |
To view a fund's proxy voting guidelines and proxy voting record for the 12-month period ended June 30, visit http://www.fidelity.com/proxyvotingresults or visit the Securities and Exchange Commission's (SEC) web site at http://www.sec.gov. You may also call 1-877-208-0098 to request a free copy of the proxy voting guidelines.
Standard & Poor's, S&P and S&P 500 are registered service marks of The McGraw-Hill Companies, Inc. and have been licensed for use by Fidelity Distributors Corporation.
Other third party marks appearing herein are the property of their respective owners.
All other marks appearing herein are registered or unregistered trademarks or service marks of FMR LLC or an affiliated company.
Annual Report
This report and the financial statements contained herein are submitted for the general information of the shareholders of the fund. This report is not authorized for distribution to prospective investors in the fund unless preceded or accompanied by an effective prospectus.
A fund files its complete schedule of portfolio holdings with the SEC for the first and third quarters of each fiscal year on Form N-Q. Forms N-Q are available on the SEC's web site at http://www.sec.gov. A fund's Forms N-Q may be reviewed and copied at the SEC's Public Reference Room in Washington, DC. Information regarding the operation of the SEC's Public Reference Room may be obtained by calling 1-800-SEC-0330. For a complete list of a fund's portfolio holdings, view the most recent holdings listing, semiannual report, or annual report on Fidelity's web site at http://www.fidelity.com or http://www.advisor.fidelity.com, as applicable .
NOT FDIC INSURED • MAY LOSE VALUE • NO BANK GUARANTEE
Neither the fund nor Fidelity Distributors Corporation is a bank.
Annual Report
(photo_of_Edward_C_Johnson_3d)
Dear Shareholder:
Equities have staged a rally in the second half of 2010, shaking off concerns about the European debt crisis and the possibility of a double-dip recession in the U.S. Although the short-term surge pushed major equity indexes back into positive territory for the year, several questions remain about the longer-term outlook, including lackluster economic growth and persistently high unemployment. Financial markets are always unpredictable, of course, but there also are several time-tested investment principles that can help put the odds in your favor.
One of the basic tenets is to invest for the long term. Over time, riding out the markets' inevitable ups and downs has proven much more effective than selling into panic or chasing the hottest trend. Even missing only a few of the markets' best days can significantly diminish investor returns. Patience also affords the benefits of compounding - of earning interest on additional income or reinvested dividends and capital gains. There can be tax advantages and cost benefits to consider as well. While staying the course doesn't eliminate risk, it can considerably lessen the effect of short-term declines.
You can further manage your investing risk through diversification. And today, more than ever, geographic diversification should be taken into account. Studies indicate that asset allocation is the single most important determinant of a portfolio's long-term success. The right mix of stocks, bonds and cash - aligned to your particular risk tolerance and investment objective - is very important. Age-appropriate rebalancing is also an essential aspect of asset allocation. For younger investors, an emphasis on equities - which historically have been the best-performing asset class over time - is encouraged. As investors near their specific goal, such as retirement or sending a child to college, consideration may be given to replacing volatile assets (e.g. common stocks) with more-stable fixed investments (bonds or savings plans).
A third principle - investing regularly - can help lower the average cost of your purchases. Investing a certain amount of money each month or quarter helps ensure you won't pay for all your shares at market highs. This strategy - known as dollar cost averaging - also reduces "emotion" from investing, helping shareholders avoid selling weak performers just prior to an upswing, or chasing a hot performer just before a correction.
We invite you to contact us via the Internet, through our Investor Centers or by phone. It is our privilege to provide you the information you need to make the investments that are right for you.
Sincerely,
(The chairman's signature appears here.)
Edward C. Johnson 3d
Annual Report
Average annual total return reflects the change in the value of an investment, assuming reinvestment of the class' distributions from dividend income and capital gains (the profits earned upon the sale of securities that have grown in value, if any) and assuming a constant rate of performance each year. The $10,000 table and the fund's returns do not reflect the deduction of taxes that a shareholder would pay on fund distributions or the redemption of fund shares. During periods of reimbursement by Fidelity, a fund's total return will be greater than it would be had the reimbursement not occurred. How a fund did yesterday is no guarantee of how it will do tomorrow.
Average Annual Total Returns
Periods ended October 31, 2010 | Past 1
year | Life of
fund A |
Institutional Class | 18.39% | 32.80% |
A From March 25, 2009.
$10,000 Over Life of Fund
Let's say hypothetically that $10,000 was invested in Fidelity AdvisorSM Global Commodity Stock Fund - Institutional Class on March 25, 2009, when the fund started. The chart shows how the value of your investment would have changed, and also shows how the MSCI® ACWI® (All Country World Index) Index performed over the same period.
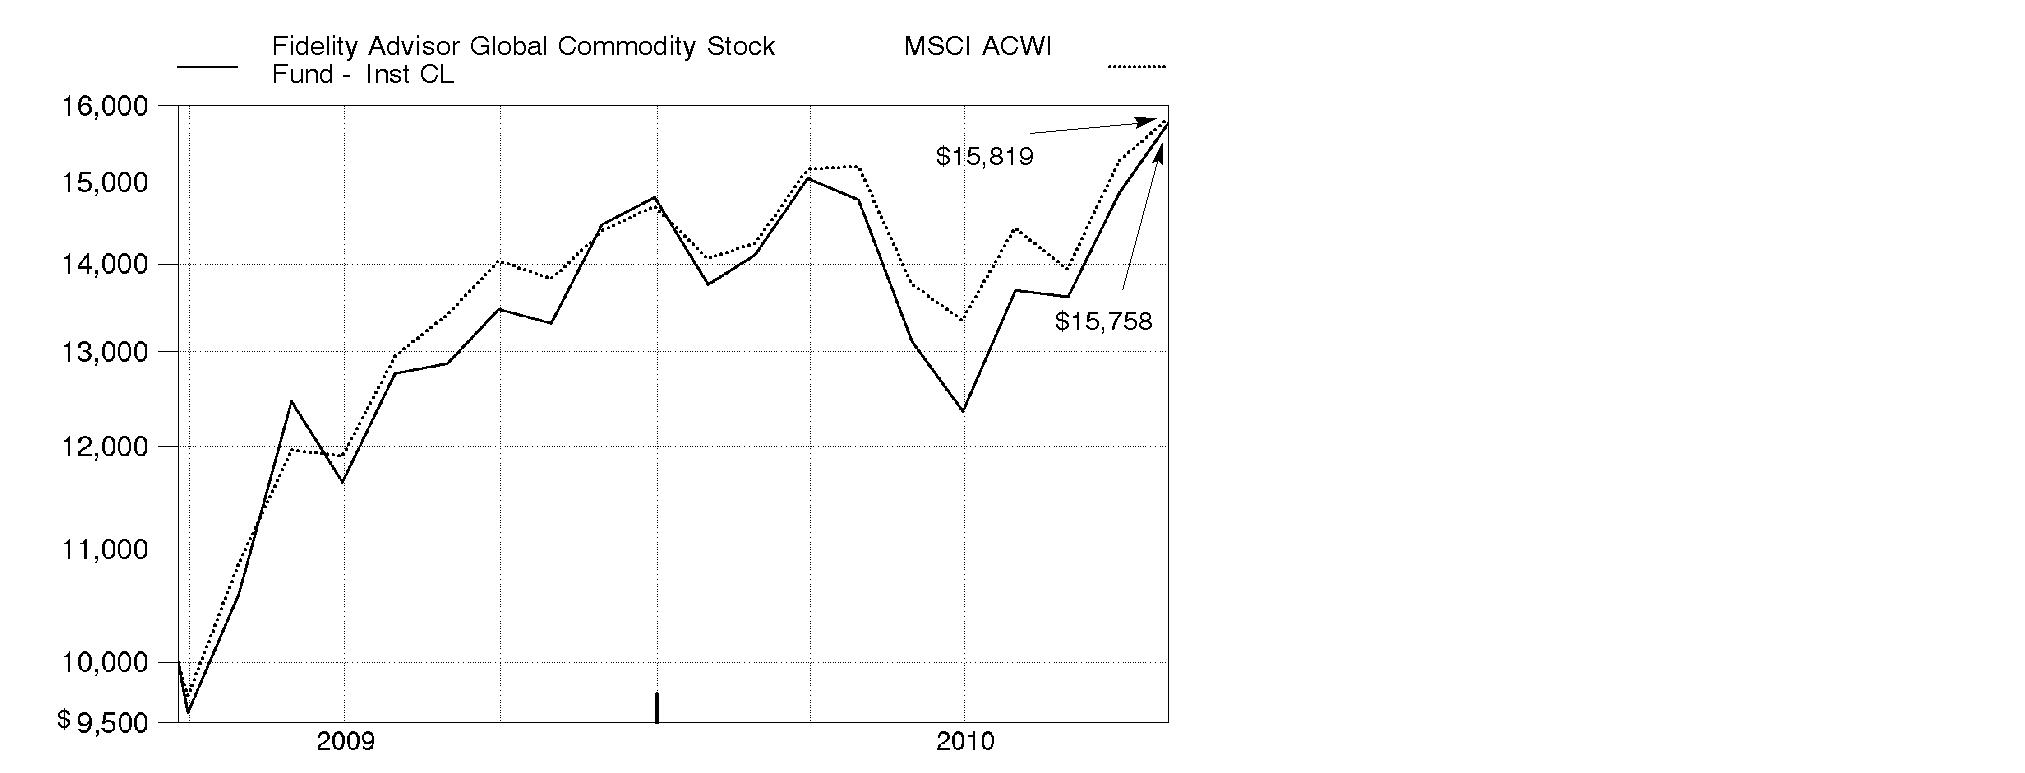
Annual Report
Market Recap: International stocks rode a wave of volatility similar to that of their U.S. counterparts during the 12 months ending October 31, 2010. Stocks gained modestly in the first half of the period, despite growing concerns about the European debt crisis. Sentiment turned decidedly negative in May and June, however, and the market suffered a precipitous decline. These losses were more than offset during the last four months of the period, when signs of economic growth and subsiding debt fears helped propel international stocks about 21%. For the full year, the MSCI® ACWI® (All Country World Index) ex USA Index gained 12.76%, boosted in part by a generally depreciating U.S. dollar. Within the index, Canada and emerging markets were standouts, returning 23% and 24%, respectively. Results in the latter group were led by strong-performing India, Mexico and South Africa, while China fell short of the MSCI benchmark due to cooling economic growth. The developed Asia ex Japan segment rose 16% for the period, lifted by solid results from Singapore and Hong Kong. Meanwhile, Europe rose just 9%, held back mainly by debt-riddled Spain and Italy, as well as lagging major constituent France. Japan returned only 5%, a result of that nation's continued weak economy.
Comments from S. Joseph Wickwire II, Portfolio Manager of Fidelity AdvisorSM Global Commodity Stock Fund: During the year, the fund's Institutional Class shares returned 18.39%, versus 17.46% for the MSCI ACWI (All Country World Index) Commodity Producers Sector Capped Index and 14.47% for the MSCI ACWI (All Country World Index) Index. Versus the capped index, performance was aided by stock selection and an overweighting in gold, as well as an underweighting and favorable picks in integrated oil/gas. Geographically, security selection in the U.S. and U.K. added value. Notable contributors included Randgold Resources, a U.K.-based company with most of its assets in West Africa. Out-of-index positions in Lihir Gold, headquartered in Papua New Guinea, and Australia's Centennial Coal also helped, as did fertilizer maker Mosaic. Lihir and Centennial were acquired during the period. Conversely, stock selection in oil and gas exploration/production and in agricultural products was mildly negative, while underweighting Canada and Chile dampened the fund's gain a bit. Our small cash position also was a slight detractor. Underweighted exposure to Potash Corp. of Saskatchewan and strong-performing metals miner Rio Tinto - an index component - hampered the fund's results. Out-of-benchmark positions in Duoyuan Global Water, one of the top water plays in China, and OPTI Canada, a small Canadian oil producer, also detracted.
The views expressed above reflect those of the portfolio manager(s) only through the end of the period as stated on the cover of this report and do not necessarily represent the views of Fidelity or any other person in the Fidelity organization. Any such views are subject to change at any time based upon market or other conditions and Fidelity disclaims any responsibility to update such views. These views may not be relied on as investment advice and, because investment decisions for a Fidelity fund are based on numerous factors, may not be relied on as an indication of trading intent on behalf of any Fidelity fund.
Annual Report
Shareholder Expense Example
As a shareholder of the Fund, you incur two types of costs: (1) transaction costs, including sales charges (loads) on purchase payments or redemption proceeds, redemption fees, and (2) ongoing costs, including management fees, distribution and/or service (12b-1) fees and other Fund expenses. This Example is intended to help you understand your ongoing costs (in dollars) of investing in the Fund and to compare these costs with the ongoing costs of investing in other mutual funds.
The Example is based on an investment of $1,000 invested at the beginning of the period and held for the entire period (May 1, 2010 to October 31, 2010).
Actual Expenses
The first line of the accompanying table for each class of the Fund provides information about actual account values and actual expenses. You may use the information in this line, together with the amount you invested, to estimate the expenses that you paid over the period. Simply divide your account value by $1,000.00 (for example, an $8,600 account value divided by $1,000.00 = 8.6), then multiply the result by the number in the first line for a class of the Fund under the heading entitled "Expenses Paid During Period" to estimate the expenses you paid on your account during this period. A small balance maintenance fee of $12.00 that is charged once a year may apply for certain accounts with a value of less than $2,000. This fee is not included in the table below. If it was, the estimate of expenses you paid during the period would be higher, and your ending account value lower, by this amount. In addition, the Fund, as a shareholder in the underlying Fidelity Central Funds, will indirectly bear its pro-rata share of the fees and expenses incurred by the underlying Fidelity Central Funds. These fees and expenses are not included in the Fund's annualized expense ratio used to calculate the expense estimate in the table below.
Hypothetical Example for Comparison Purposes
The second line of the accompanying table for each class of the Fund provides information about hypothetical account values and hypothetical expenses based on a Class' actual expense ratio and an assumed rate of return of 5% per year before expenses, which is not the Class' actual return. The hypothetical account values and expenses may not be used to estimate the actual ending account balance or expenses you paid for the period. You may use this information to compare the ongoing costs of investing in the Fund and other funds. To do so, compare this 5% hypothetical example with the 5% hypothetical examples that appear in the shareholder reports of the other funds. A small balance maintenance fee of $12.00 that is charged once a year may apply for certain accounts with a value of less than $2,000. This fee is not included in the table below. If it was, the estimate of expenses you paid during the period would be higher, and your ending account value lower, by this amount. In addition, the Fund, as a shareholder in the underlying Fidelity Central Funds, will indirectly bear its pro-rata share of the fees and expenses incurred by the underlying Fidelity Central Funds. These fees and expenses are not included in the Fund's annualized expense ratio used to calculate the expense estimate in the table below.
Please note that the expenses shown in the table are meant to highlight your ongoing costs only and do not reflect any transaction costs. Therefore, the second line of the table is useful in comparing ongoing costs only, and will not help you determine the relative total costs of owning different funds. In addition, if these transactional costs were included, your costs would have been higher.
Annual Report
Shareholder Expense Example - continued
| Annualized
Expense
Ratio | Beginning
Account Value
May 1, 2010 | Ending
Account Value
October 31, 2010 | Expenses Paid
During Period*
May 1, 2010 to
October 31, 2010 |
Class A | 1.35% | | | |
Actual | | $ 1,000.00 | $ 1,065.60 | $ 7.03 |
HypotheticalA | | $ 1,000.00 | $ 1,018.40 | $ 6.87 |
Class T | 1.59% | | | |
Actual | | $ 1,000.00 | $ 1,064.30 | $ 8.27 |
HypotheticalA | | $ 1,000.00 | $ 1,017.19 | $ 8.08 |
Class B | 2.11% | | | |
Actual | | $ 1,000.00 | $ 1,061.80 | $ 10.97 |
HypotheticalA | | $ 1,000.00 | $ 1,014.57 | $ 10.71 |
Class C | 2.11% | | | |
Actual | | $ 1,000.00 | $ 1,061.10 | $ 10.96 |
HypotheticalA | | $ 1,000.00 | $ 1,014.57 | $ 10.71 |
Global Commodity Stock | 1.05% | | | |
Actual | | $ 1,000.00 | $ 1,066.80 | $ 5.47 |
HypotheticalA | | $ 1,000.00 | $ 1,019.91 | $ 5.35 |
Institutional Class | 1.05% | | | |
Actual | | $ 1,000.00 | $ 1,066.80 | $ 5.47 |
HypotheticalA | | $ 1,000.00 | $ 1,019.91 | $ 5.35 |
A 5% return per year before expenses
* Expenses are equal to each Class' annualized expense ratio, multiplied by the average account value over the period, multiplied by 184/365 (to reflect the one-half year period).
Annual Report
Investment Changes (Unaudited)
Top Ten Stocks as of October 31, 2010 |
| % of fund's
net assets | % of fund's net assets
6 months ago |
BHP Billiton PLC | 5.5 | 4.5 |
Exxon Mobil Corp. | 4.8 | 4.7 |
Potash Corp. of Saskatchewan, Inc. | 4.1 | 2.2 |
Monsanto Co. | 2.9 | 3.8 |
Rio Tinto PLC | 2.9 | 2.3 |
Royal Dutch Shell PLC Class A (United Kingdom) | 2.8 | 2.6 |
Syngenta AG (Switzerland) | 2.6 | 2.7 |
Chevron Corp. | 2.3 | 2.5 |
Vale SA (PN-A) sponsored ADR | 2.1 | 2.1 |
Archer Daniels Midland Co. | 2.1 | 1.9 |
| 32.1 | |
Top Sectors (% of fund's net assets) |
As of October 31, 2010 |
| Agriculture 26.2% | |
| Energy 32.8% | |
| Metals 34.6% | |
| All Others* 6.4% | |

As of April 30, 2010 |
| Agriculture 27.3% | |
| Energy 35.6% | |
| Metals 31.6% | |
| All Others* 5.5% | |

* Includes short-term investments and net other assets. |
Annual Report
Investments October 31, 2010
Showing Percentage of Net Assets
Common Stocks - 99.2% |
| Shares | | Value |
CHEMICALS - 18.5% |
Commodity Chemicals - 0.0% |
Grasim Industries Ltd. | 3,318 | | $ 174,452 |
Diversified Chemicals - 0.4% |
Dow Chemical Co. | 52,600 | | 1,621,658 |
Fertilizers & Agricultural Chemicals - 17.9% |
Agrium, Inc. | 62,300 | | 5,511,037 |
CF Industries Holdings, Inc. | 35,072 | | 4,297,372 |
China BlueChemical Ltd. (H shares) | 770,000 | | 608,947 |
Fertilizantes Fosfatados SA (PN) (a) | 7,600 | | 85,998 |
Fertilizantes Heringer SA (a) | 67,300 | | 376,614 |
Incitec Pivot Ltd. | 663,200 | | 2,416,898 |
Israel Chemicals Ltd. | 213,700 | | 3,268,699 |
Israel Corp. Ltd. (Class A) (a) | 100 | | 107,290 |
K&S AG | 59,707 | | 4,154,796 |
Makhteshim-Agan Industries | 45,000 | | 226,176 |
Monsanto Co. | 210,100 | | 12,484,142 |
Nufarm Ltd. (d) | 205,300 | | 915,106 |
Potash Corp. of Saskatchewan, Inc. | 122,400 | | 17,701,735 |
Sinofert Holdings Ltd. (a) | 1,632,000 | | 863,241 |
Sociedad Quimica y Minera de Chile SA (PN-B) sponsored ADR | 5,400 | | 279,720 |
Syngenta AG (Switzerland) | 41,272 | | 11,424,180 |
Taiwan Fertilizer Co. Ltd. | 448,000 | | 1,529,685 |
The Mosaic Co. | 65,200 | | 4,770,032 |
United Phosphorous Ltd. | 314,732 | | 1,415,140 |
Uralkali JSC GDR (Reg. S) | 62,100 | | 1,536,975 |
Yara International ASA | 80,600 | | 4,236,820 |
| | 78,210,603 |
Specialty Chemicals - 0.2% |
Innophos Holdings, Inc. | 24,000 | | 881,280 |
Johnson Matthey PLC | 2,900 | | 88,929 |
| | 970,209 |
TOTAL CHEMICALS | | 80,976,922 |
CONSTRUCTION & ENGINEERING - 0.7% |
Construction & Engineering - 0.7% |
Fluor Corp. | 32,300 | | 1,556,537 |
Foster Wheeler AG (a) | 3,500 | | 81,970 |
Granite Construction, Inc. | 11,800 | | 285,324 |
Common Stocks - continued |
| Shares | | Value |
CONSTRUCTION & ENGINEERING - CONTINUED |
Construction & Engineering - continued |
Jacobs Engineering Group, Inc. (a) | 29,600 | | $ 1,142,856 |
KBR, Inc. | 2,383 | | 60,528 |
| | 3,127,215 |
CONSTRUCTION MATERIALS - 0.5% |
Construction Materials - 0.5% |
HeidelbergCement AG | 39,612 | | 2,071,614 |
Martin Marietta Materials, Inc. | 1,100 | | 88,528 |
| | 2,160,142 |
CONTAINERS & PACKAGING - 0.3% |
Paper Packaging - 0.3% |
Rock-Tenn Co. Class A | 21,900 | | 1,245,015 |
ELECTRICAL EQUIPMENT - 0.1% |
Electrical Components & Equipment - 0.1% |
Regal-Beloit Corp. | 9,202 | | 531,047 |
ENERGY EQUIPMENT & SERVICES - 2.1% |
Oil & Gas Drilling - 0.7% |
Ensco International Ltd. ADR | 16,600 | | 769,244 |
Noble Corp. | 28,500 | | 984,105 |
Transocean Ltd. (a) | 7,000 | | 443,520 |
Trinidad Drilling Ltd. | 28,600 | | 143,014 |
Vantage Drilling Co. (a) | 334,200 | | 574,824 |
| | 2,914,707 |
Oil & Gas Equipment & Services - 1.4% |
Aker Solutions ASA | 19,200 | | 292,294 |
Baker Hughes, Inc. | 17,480 | | 809,848 |
Fugro NV (Certificaten Van Aandelen) unit | 1,100 | | 77,800 |
Halliburton Co. | 48,400 | | 1,542,024 |
ION Geophysical Corp. (a) | 300,700 | | 1,470,423 |
National Oilwell Varco, Inc. | 1,400 | | 75,264 |
Saipem SpA | 27,278 | | 1,211,934 |
Schlumberger Ltd. | 6,500 | | 454,285 |
Technip SA | 800 | | 67,224 |
Wellstream Holdings PLC | 31,400 | | 372,276 |
| | 6,373,372 |
TOTAL ENERGY EQUIPMENT & SERVICES | | 9,288,079 |
Common Stocks - continued |
| Shares | | Value |
FOOD PRODUCTS - 4.7% |
Agricultural Products - 4.2% |
Archer Daniels Midland Co. | 273,800 | | $ 9,123,016 |
Bunge Ltd. | 25,800 | | 1,549,806 |
Chaoda Modern Agriculture (Holdings) Ltd. | 594,000 | | 484,319 |
China Agri-Industries Holding Ltd. | 1,150,000 | | 1,673,537 |
China Green (Holdings) Ltd. | 300,000 | | 307,692 |
Golden Agri-Resources Ltd. | 2,306,000 | | 1,158,078 |
IOI Corp. Bhd | 223,606 | | 418,318 |
Kuala Lumpur Kepong Bhd | 27,000 | | 171,842 |
Origin Agritech Ltd. (a) | 40,410 | | 351,971 |
PPB Group Bhd | 124,300 | | 767,136 |
Viterra, Inc. (a) | 18,300 | | 175,302 |
Wilmar International Ltd. | 483,000 | | 2,388,318 |
| | 18,569,335 |
Packaged Foods & Meats - 0.5% |
China Yurun Food Group Ltd. | 71,000 | | 276,168 |
Cosan Ltd. Class A | 63,100 | | 829,765 |
MHP SA GDR (Reg. S) (a) | 51,400 | | 812,120 |
Tingyi (Cayman Islands) Holding Corp. | 32,000 | | 87,109 |
| | 2,005,162 |
TOTAL FOOD PRODUCTS | | 20,574,497 |
INDUSTRIAL CONGLOMERATES - 0.2% |
Industrial Conglomerates - 0.2% |
Keppel Corp. Ltd. | 110,000 | | 848,180 |
MACHINERY - 0.9% |
Construction & Farm Machinery & Heavy Trucks - 0.8% |
Bucyrus International, Inc. Class A | 5,300 | | 361,248 |
Caterpillar, Inc. | 1,100 | | 86,460 |
Cummins, Inc. | 10,700 | | 942,670 |
Deere & Co. | 1,100 | | 84,480 |
Jain Irrigation Systems Ltd. | 162,100 | | 848,442 |
Komatsu Ltd. | 32,000 | | 782,126 |
PT United Tractors Tbk | 62,500 | | 155,245 |
Weichai Power Co. Ltd. (H Shares) | 9,000 | | 118,200 |
| | 3,378,871 |
Common Stocks - continued |
| Shares | | Value |
MACHINERY - CONTINUED |
Industrial Machinery - 0.1% |
Duoyuan Global Water, Inc. ADR (a)(d) | 46,000 | | $ 575,460 |
TOTAL MACHINERY | | 3,954,331 |
METALS & MINING - 34.6% |
Aluminum - 0.4% |
Alcoa, Inc. | 119,200 | | 1,565,096 |
Diversified Metals & Mining - 15.6% |
African Rainbow Minerals Ltd. | 42,400 | | 1,081,692 |
Anglo American PLC (United Kingdom) | 166,151 | | 7,741,062 |
Antofagasta PLC | 17,500 | | 370,657 |
BHP Billiton PLC | 683,416 | | 24,206,989 |
Eramet SA | 222 | | 76,932 |
Eurasian Natural Resources Corp. PLC | 46,500 | | 648,522 |
First Quantum Minerals Ltd. | 13,800 | | 1,208,430 |
Freeport-McMoRan Copper & Gold, Inc. | 49,300 | | 4,667,724 |
Grupo Mexico SA de CV Series B | 92,082 | | 302,777 |
HudBay Minerals, Inc. | 12,200 | | 192,588 |
Ivanhoe Australia Ltd. (a) | 50,000 | | 155,764 |
Ivanhoe Mines Ltd. (a) | 11,000 | | 263,379 |
Jiangxi Copper Co. Ltd. (H Shares) | 40,000 | | 111,466 |
Kazakhmys PLC | 75,400 | | 1,589,756 |
Mitsubishi Materials Corp. (a) | 119,000 | | 372,528 |
Mongolian Mining Corp. | 442,000 | | 478,423 |
OJSC MMC Norilsk Nickel sponsored ADR | 102,500 | | 1,911,625 |
Rio Tinto PLC | 191,987 | | 12,468,050 |
Southern Copper Corp. | 2,100 | | 89,880 |
Sterlite Industries (India) Ltd. | 173,488 | | 665,507 |
Sumitomo Metal Mining Co. Ltd. | 42,000 | | 668,359 |
Teck Resources Ltd. Class B (sub. vtg.) | 57,700 | | 2,579,782 |
Vedanta Resources PLC | 11,800 | | 392,286 |
Walter Energy, Inc. | 12,900 | | 1,134,684 |
Xstrata PLC | 245,891 | | 4,764,877 |
| | 68,143,739 |
Gold - 9.0% |
Agnico-Eagle Mines Ltd.: | | | |
(Canada) | 27,500 | | 2,132,807 |
(United States) | 100 | | 7,759 |
AngloGold Ashanti Ltd. sponsored ADR | 78,800 | | 3,712,268 |
Barrick Gold Corp. | 149,600 | | 7,204,973 |
Common Stocks - continued |
| Shares | | Value |
METALS & MINING - CONTINUED |
Gold - continued |
Eldorado Gold Corp. | 28,000 | | $ 474,125 |
Franco-Nevada Corp. | 9,800 | | 338,037 |
Gold Fields Ltd. sponsored ADR | 75,300 | | 1,187,481 |
Goldcorp, Inc. | 154,500 | | 6,898,647 |
Harmony Gold Mining Co. Ltd. sponsored ADR | 39,100 | | 451,214 |
IAMGOLD Corp. | 71,100 | | 1,297,354 |
Kinross Gold Corp. | 180,205 | | 3,242,241 |
Kinross Gold Corp. warrants 9/17/14 (a) | 2,772 | | 11,388 |
Newcrest Mining Ltd. | 118,138 | | 4,624,726 |
Newmont Mining Corp. | 59,600 | | 3,627,852 |
Polyus Gold OJSC sponsored ADR | 11,000 | | 328,900 |
Randgold Resources Ltd. sponsored ADR | 27,000 | | 2,535,840 |
Royal Gold, Inc. | 3,000 | | 148,530 |
Yamana Gold, Inc. | 99,700 | | 1,096,808 |
Zijin Mining Group Co. Ltd. (H Shares) | 92,000 | | 86,763 |
| | 39,407,713 |
Precious Metals & Minerals - 1.2% |
Anglo Platinum Ltd. (a) | 5,800 | | 573,786 |
Aquarius Platinum Ltd. (United Kingdom) | 104,000 | | 600,345 |
Compania de Minas Buenaventura SA sponsored ADR | 5,700 | | 302,328 |
Impala Platinum Holdings Ltd. | 48,900 | | 1,382,174 |
Lonmin PLC (a) | 4,922 | | 137,922 |
Northam Platinum Ltd. | 20,900 | | 144,554 |
Pan American Silver Corp. | 11,100 | | 354,312 |
Polymetal JSC GDR (Reg. S) (a) | 15,700 | | 248,060 |
Silver Standard Resources, Inc. (a) | 16,000 | | 388,480 |
Silver Wheaton Corp. (a) | 31,400 | | 902,685 |
| | 5,034,646 |
Steel - 8.4% |
Allegheny Technologies, Inc. | 1,400 | | 73,766 |
ArcelorMittal SA Class A unit (d) | 108,200 | | 3,503,516 |
Atlas Iron Ltd. (a) | 36,000 | | 88,521 |
BlueScope Steel Ltd. | 491,649 | | 960,880 |
Carpenter Technology Corp. | 30,300 | | 1,080,498 |
China Steel Corp. | 33,819 | | 34,311 |
Cliffs Natural Resources, Inc. | 3,400 | | 221,680 |
Commercial Metals Co. | 54,000 | | 749,520 |
Companhia Siderurgica Nacional SA (CSN) | 9,900 | | 164,399 |
Gerdau SA sponsored ADR (d) | 31,300 | | 408,152 |
JFE Holdings, Inc. | 74,200 | | 2,313,892 |
Common Stocks - continued |
| Shares | | Value |
METALS & MINING - CONTINUED |
Steel - continued |
Jindal Steel & Power Ltd. | 57,871 | | $ 910,726 |
JSW Steel Ltd. | 11,131 | | 336,994 |
Kobe Steel Ltd. | 231,000 | | 507,684 |
Maanshan Iron & Steel Co. Ltd. (H Shares) | 1,136,000 | | 650,713 |
Magnitogorsk Iron & Steel Works OJSC unit (a) | 6,500 | | 81,250 |
Maruichi Steel Tube Ltd. | 13,000 | | 257,351 |
Mechel Steel Group OAO sponsored ADR | 16,000 | | 376,800 |
Nippon Steel Corp. | 570,000 | | 1,791,580 |
Novolipetsk Steel Ojsc | 4,500 | | 154,035 |
Nucor Corp. | 27,700 | | 1,058,694 |
OneSteel Ltd. | 142,793 | | 377,695 |
POSCO | 8,607 | | 3,554,719 |
Reliance Steel & Aluminum Co. | 33,200 | | 1,389,420 |
Salzgitter AG | 3,225 | | 231,506 |
Sumitomo Metal Industries Ltd. | 578,000 | | 1,341,528 |
Tata Steel Ltd. | 24,147 | | 321,088 |
Ternium SA sponsored ADR | 4,600 | | 157,688 |
Thyssenkrupp AG | 10,000 | | 367,899 |
Tokyo Steel Manufacturing Co. Ltd. | 9,500 | | 94,209 |
United States Steel Corp. (d) | 28,400 | | 1,215,236 |
Vale SA (PN-A) sponsored ADR | 326,000 | | 9,365,980 |
Voestalpine AG | 29,400 | | 1,165,282 |
Yamato Kogyo Co. Ltd. | 58,000 | | 1,487,660 |
| | 36,794,872 |
TOTAL METALS & MINING | | 150,946,066 |
OIL, GAS & CONSUMABLE FUELS - 30.7% |
Coal & Consumable Fuels - 1.6% |
Alpha Natural Resources, Inc. (a) | 41,505 | | 1,874,781 |
Arch Coal, Inc. | 24,000 | | 590,160 |
Banpu PCL (For. Reg.) | 7,700 | | 199,058 |
China Coal Energy Co. Ltd. (H Shares) | 146,000 | | 252,398 |
China Shenhua Energy Co. Ltd. (H Shares) | 72,500 | | 322,690 |
Cloud Peak Energy, Inc. | 22,100 | | 383,877 |
CONSOL Energy, Inc. | 15,900 | | 584,484 |
Massey Energy Co. | 42,600 | | 1,792,182 |
Paladin Energy Ltd. (a) | 21,511 | | 86,400 |
Peabody Energy Corp. | 14,800 | | 782,920 |
Common Stocks - continued |
| Shares | | Value |
OIL, GAS & CONSUMABLE FUELS - CONTINUED |
Coal & Consumable Fuels - continued |
PT Bumi Resources Tbk | 684,000 | | $ 170,282 |
Uranium One, Inc. (a) | 22,400 | | 91,585 |
| | 7,130,817 |
Integrated Oil & Gas - 21.3% |
BG Group PLC | 222,057 | | 4,324,368 |
BP PLC | 1,159,800 | | 7,882,370 |
Cenovus Energy, Inc. | 4,500 | | 125,218 |
Chevron Corp. | 122,300 | | 10,103,203 |
China Petroleum & Chemical Corp. (H Shares) | 597,000 | | 568,024 |
ConocoPhillips | 22,000 | | 1,306,800 |
Ecopetrol SA ADR | 2,000 | | 95,480 |
ENI SpA | 156,727 | | 3,528,187 |
Exxon Mobil Corp. | 312,361 | | 20,762,636 |
Hess Corp. | 8,100 | | 510,543 |
Imperial Oil Ltd. | 11,600 | | 446,075 |
InterOil Corp. (a)(d) | 6,800 | | 484,024 |
Lukoil Oil Co. sponsored ADR | 29,000 | | 1,619,650 |
Marathon Oil Corp. | 116,800 | | 4,154,576 |
Murphy Oil Corp. | 14,200 | | 925,272 |
OAO Gazprom sponsored ADR | 121,300 | | 2,650,405 |
Occidental Petroleum Corp. | 63,100 | | 4,961,553 |
Origin Energy Ltd. | 55,019 | | 859,156 |
Petroleo Brasileiro SA - Petrobras (PN) sponsored ADR (non-vtg.) | 173,000 | | 5,395,870 |
Repsol YPF SA | 53,241 | | 1,476,022 |
Royal Dutch Shell PLC Class A (United Kingdom) | 379,950 | | 12,333,010 |
StatoilHydro ASA | 3,900 | | 85,144 |
Suncor Energy, Inc. | 118,232 | | 3,788,432 |
Surgutneftegaz JSC sponsored ADR | 3,930 | | 38,082 |
Total SA | 81,255 | | 4,421,915 |
| | 92,846,015 |
Oil & Gas Exploration & Production - 7.2% |
Alange Energy Corp. (a) | 190,000 | | 137,857 |
Anadarko Petroleum Corp. | 39,400 | | 2,425,858 |
Apache Corp. | 21,600 | | 2,182,032 |
Berry Petroleum Co. Class A | 36,300 | | 1,241,823 |
Cairn Energy PLC (a) | 44,204 | | 273,300 |
Canadian Natural Resources Ltd. | 83,800 | | 3,050,783 |
Chesapeake Energy Corp. | 31,100 | | 674,870 |
Cimarex Energy Co. | 6,800 | | 521,900 |
Common Stocks - continued |
| Shares | | Value |
OIL, GAS & CONSUMABLE FUELS - CONTINUED |
Oil & Gas Exploration & Production - continued |
CNOOC Ltd. sponsored ADR | 8,200 | | $ 1,713,144 |
CNPC (Hong Kong) Ltd. | 50,000 | | 63,603 |
Concho Resources, Inc. (a) | 1,200 | | 82,404 |
Denbury Resources, Inc. (a) | 51,400 | | 874,828 |
Devon Energy Corp. | 13,800 | | 897,276 |
EnCana Corp. | 5,200 | | 146,889 |
EOG Resources, Inc. | 13,600 | | 1,301,792 |
Falkland Oil & Gas Ltd. (a)(d) | 216,700 | | 355,866 |
Gran Tierra Energy, Inc. (a) | 7,200 | | 53,652 |
Heritage Oil PLC | 75,500 | | 416,715 |
Japan Petroleum Exploration Co. Ltd. | 4,800 | | 183,422 |
Lundin Petroleum AB (a) | 30,000 | | 283,764 |
Mariner Energy, Inc. (a) | 19,800 | | 493,416 |
Newfield Exploration Co. (a) | 1,400 | | 83,468 |
Nexen, Inc. | 8,300 | | 176,596 |
Niko Resources Ltd. | 11,200 | | 1,068,497 |
Noble Energy, Inc. | 9,800 | | 798,504 |
Northern Oil & Gas, Inc. (a) | 47,600 | | 936,768 |
OAO NOVATEK GDR | 7,600 | | 726,940 |
OGX Petroleo e Gas Participacoes SA (a) | 5,900 | | 77,409 |
Oil & Natural Gas Corp. Ltd. | 5,222 | | 153,632 |
OPTI Canada, Inc. (a) | 1,496,600 | | 1,027,179 |
Pacific Rubiales Energy Corp. (a) | 6,300 | | 200,817 |
Painted Pony Petroleum Ltd. Class A (a) | 27,400 | | 188,595 |
PetroBakken Energy Ltd. Class A | 7,348 | | 162,248 |
Petrobank Energy & Resources Ltd. (a) | 42,100 | | 1,675,497 |
Petrohawk Energy Corp. (a) | 43,200 | | 734,832 |
Petrominerales Ltd. | 3,200 | | 81,985 |
Plains Exploration & Production Co. (a) | 1,000 | | 27,870 |
Progress Energy Resources Corp. | 23,200 | | 246,354 |
QEP Resources, Inc. | 10,900 | | 360,027 |
Rockhopper Exploration PLC (a) | 120,800 | | 616,424 |
Santos Ltd. | 31,881 | | 394,151 |
Southwestern Energy Co. (a) | 52,800 | | 1,787,280 |
Talisman Energy, Inc. | 105,000 | | 1,903,569 |
Tullow Oil PLC | 10,100 | | 191,753 |
Ultra Petroleum Corp. (a) | 5,000 | | 205,750 |
Whiting Petroleum Corp. (a) | 1,700 | | 170,748 |
| | 31,372,087 |
Common Stocks - continued |
| Shares | | Value |
OIL, GAS & CONSUMABLE FUELS - CONTINUED |
Oil & Gas Refining & Marketing - 0.6% |
Frontier Oil Corp. | 57,600 | | $ 763,200 |
Holly Corp. | 37,400 | | 1,224,102 |
Neste Oil Oyj | 3,800 | | 63,027 |
Reliance Industries Ltd. | 24,940 | | 616,818 |
Sunoco, Inc. | 4,200 | | 157,374 |
| | 2,824,521 |
TOTAL OIL, GAS & CONSUMABLE FUELS | | 134,173,440 |
PAPER & FOREST PRODUCTS - 4.1% |
Forest Products - 0.6% |
China Forestry Holdings Co. Ltd. | 988,000 | | 469,065 |
Duratex SA | 7,100 | | 81,801 |
Sino-Forest Corp. (a) | 97,000 | | 1,917,364 |
| | 2,468,230 |
Paper Products - 3.5% |
Domtar Corp. | 1,300 | | 103,168 |
Empresas CMPC SA | 1,653 | | 89,214 |
Fibria Celulose SA sponsored ADR (a)(d) | 96,589 | | 1,734,738 |
International Paper Co. | 194,100 | | 4,906,848 |
MeadWestvaco Corp. | 3,400 | | 87,482 |
Nine Dragons Paper (Holdings) Ltd. | 702,000 | | 1,132,075 |
Nippon Paper Group, Inc. | 24,300 | | 616,976 |
Oji Paper Co. Ltd. | 429,000 | | 1,978,916 |
Sappi Ltd. (a) | 61,475 | | 304,696 |
Stora Enso Oyj (R Shares) | 70,400 | | 699,421 |
Suzano Papel e Celulose SA | 46,125 | | 441,945 |
Svenska Cellulosa AB (SCA) (B Shares) | 106,500 | | 1,651,311 |
UPM-Kymmene Corp. | 108,000 | | 1,795,805 |
| | 15,542,595 |
TOTAL PAPER & FOREST PRODUCTS | | 18,010,825 |
REAL ESTATE INVESTMENT TRUSTS - 0.9% |
Specialized REITs - 0.9% |
Rayonier, Inc. | 8,200 | | 428,040 |
Weyerhaeuser Co. | 218,485 | | 3,543,827 |
| | 3,971,867 |
Common Stocks - continued |
| Shares | | Value |
ROAD & RAIL - 0.1% |
Railroads - 0.1% |
CSX Corp. | 8,800 | | $ 540,760 |
SPECIALTY RETAIL - 0.3% |
Specialty Stores - 0.3% |
Tsutsumi Jewelry Co. Ltd. | 45,300 | | 1,066,776 |
TRADING COMPANIES & DISTRIBUTORS - 0.4% |
Trading Companies & Distributors - 0.4% |
Adani Enterprises Ltd. | 6,000 | | 95,357 |
Kloeckner & Co. AG (a) | 15,374 | | 340,135 |
Mills Estruturas e Servicos de Engenharia SA (a) | 20,000 | | 241,359 |
Noble Group Ltd. | 566,090 | | 813,511 |
| | 1,490,362 |
TRANSPORTATION INFRASTRUCTURE - 0.1% |
Highways & Railtracks - 0.1% |
Ecorodovias Infraestrutura e Logistica SA (a) | 24,100 | | 182,747 |
TOTAL COMMON STOCKS (Cost $384,228,881) | 433,088,271 |
Money Market Funds - 2.8% |
| | | |
Fidelity Cash Central Fund, 0.23% (b) | 6,054,985 | | 6,054,985 |
Fidelity Securities Lending Cash Central Fund, 0.24% (b)(c) | 6,183,336 | | 6,183,336 |
TOTAL MONEY MARKET FUNDS (Cost $12,238,321) | 12,238,321 |
TOTAL INVESTMENT PORTFOLIO - 102.0% (Cost $396,467,202) | | 445,326,592 |
NET OTHER ASSETS (LIABILITIES) - (2.0)% | | (8,583,437) |
NET ASSETS - 100% | $ 436,743,155 |
Legend |
(a) Non-income producing |
(b) Affiliated fund that is available only to investment companies and other accounts managed by Fidelity Investments. The rate quoted is the annualized seven-day yield of the fund at period end. A complete unaudited listing of the fund's holdings as of its most recent quarter end is available upon request. In addition, each Fidelity Central Fund's financial statements, which are not covered by the Fund's report of Independent Registered Public Accounting Firm, are available on the SEC's website or upon request. |
(c) Investment made with cash collateral received from securities on loan. |
(d) Security or a portion of the security is on loan at period end. |
Affiliated Central Funds |
Information regarding fiscal year to date income earned by the Fund from investments in Fidelity Central Funds is as follows: |
Fund | Income earned |
Fidelity Cash Central Fund | $ 10,925 |
Fidelity Securities Lending Cash Central Fund | 89,586 |
Total | $ 100,511 |
Other Information |
The following is a summary of the inputs used, as of October 31, 2010, involving the Fund's assets and liabilities carried at fair value. The inputs or methodology used for valuing securities may not be an indication of the risk associated with investing in those securities. For more information on valuation inputs, and their aggregation into the levels used in the tables below, please refer to the Security Valuation section in the accompanying Notes to Financial Statements. |
Valuation Inputs at Reporting Date: |
Description | Total | Level 1 | Level 2 | Level 3 |
Investments in Securities: | | | | |
Common Stocks | $ 433,088,271 | $ 352,259,123 | $ 80,829,148 | $ - |
Money Market Funds | 12,238,321 | 12,238,321 | - | - |
Total Investments in Securities: | $ 445,326,592 | $ 364,497,444 | $ 80,829,148 | $ - |
Other Information - continued |
The following is a reconciliation of Investments in Securities for which Level 3 inputs were used in determining value: |
Investments in Securities: | |
Beginning Balance | $ 65,806 |
Total Realized Gain (Loss) | 69,126 |
Total Unrealized Gain (Loss) | (9,563) |
Cost of Purchases | 55,134 |
Proceeds of Sales | (180,503) |
Amortization/Accretion | - |
Transfers in to Level 3 | - |
Transfers out of Level 3 | - |
Ending Balance | $ - |
The change in unrealized gain (loss) for the period attributable to Level 3 securities held at October 31, 2010 | $ - |
The information used in the above reconciliation represents fiscal year to date activity for any Investments in Securities identified as using Level 3 inputs at either the beginning or the end of the current fiscal period. Transfers in or out of Level 3 represent the beginning value of any Security or Instrument where a change in the pricing level occurred from the beginning to the end of the period. The cost of purchases and the proceeds of sales may include securities received or delivered through corporate actions or exchanges. Realized and unrealized gains (losses) disclosed in the reconciliation are included in Net Gain (Loss) on the Fund's Statement of Operations. |
Distribution of investments by country of issue, as a percentage of total net assets, is as follows: (Unaudited) |
United States of America | 32.1% |
United Kingdom | 18.2% |
Canada | 16.0% |
Brazil | 4.2% |
Japan | 3.0% |
Switzerland | 2.9% |
Australia | 2.5% |
Russia | 2.3% |
South Africa | 1.9% |
Germany | 1.7% |
Bermuda | 1.3% |
India | 1.1% |
Italy | 1.1% |
Norway | 1.1% |
France | 1.0% |
Luxembourg | 1.0% |
Others (Individually Less Than 1%) | 8.6% |
| 100.0% |
See accompanying notes which are an integral part of the financial statements.
Annual Report
Statement of Assets and Liabilities
| October 31, 2010 |
| | |
Assets | | |
Investment in securities, at value (including securities loaned of $6,035,071) - See accompanying schedule: Unaffiliated issuers (cost $384,228,881) | $ 433,088,271 | |
Fidelity Central Funds (cost $12,238,321) | 12,238,321 | |
Total Investments (cost $396,467,202) | | $ 445,326,592 |
Foreign currency held at value (cost $1,064) | | 1,049 |
Receivable for investments sold | | 4,050,412 |
Receivable for fund shares sold | | 1,637,236 |
Dividends receivable | | 365,521 |
Distributions receivable from Fidelity Central Funds | | 3,807 |
Other receivables | | 8,763 |
Total assets | | 451,393,380 |
| | |
Liabilities | | |
Payable for investments purchased | $ 7,445,387 | |
Payable for fund shares redeemed | 520,792 | |
Accrued management fee | 247,232 | |
Distribution and service plan fees payable | 31,885 | |
Other affiliated payables | 96,299 | |
Other payables and accrued expenses | 125,294 | |
Collateral on securities loaned, at value | 6,183,336 | |
Total liabilities | | 14,650,225 |
| | |
Net Assets | | $ 436,743,155 |
Net Assets consist of: | | |
Paid in capital | | $ 387,323,136 |
Undistributed net investment income | | 4,074,073 |
Accumulated undistributed net realized gain (loss) on investments and foreign currency transactions | | (3,442,191) |
Net unrealized appreciation (depreciation) on investments and assets and liabilities in foreign currencies | | 48,788,137 |
Net Assets | | $ 436,743,155 |
See accompanying notes which are an integral part of the financial statements.
Annual Report
Statement of Assets and Liabilities - continued
| October 31, 2010 |
| | |
Calculation of Maximum Offering Price
Class A:
Net Asset Value and redemption price per share ($60,369,831 ÷ 3,869,054 shares) | | $ 15.60 |
| | |
Maximum offering price per share (100/94.25 of $15.60) | | $ 16.55 |
Class T:
Net Asset Value and redemption price per share ($11,762,486 ÷ 756,241 shares) | | $ 15.55 |
| | |
Maximum offering price per share (100/96.50 of $15.55) | | $ 16.11 |
Class B:
Net Asset Value and offering price per share ($4,348,164 ÷ 281,298 shares)A | | $ 15.46 |
| | |
Class C:
Net Asset Value and offering price per share ($14,337,610 ÷ 927,787 shares)A | | $ 15.45 |
| | |
| | |
Global Commodity Stock:
Net Asset Value, offering price and redemption price per share ($310,186,006 ÷ 19,806,577 shares) | | $ 15.66 |
| | |
Institutional Class:
Net Asset Value, offering price and redemption price per share ($35,739,058 ÷ 2,281,918 shares) | | $ 15.66 |
A Redemption price per share is equal to net asset value less any applicable contingent deferred sales charge.
See accompanying notes which are an integral part of the financial statements.
Annual Report
Financial Statements - continued
Statement of Operations
| Year ended October 31, 2010 |
| | |
Investment Income | | |
Dividends | | $ 6,484,153 |
Special dividends | | 3,210,012 |
Interest | | 2 |
Income from Fidelity Central Funds | | 100,511 |
Income before foreign taxes withheld | | 9,794,678 |
Less foreign taxes withheld | | (414,094) |
Total income | | 9,380,584 |
| | |
Expenses | | |
Management fee | $ 2,448,315 | |
Transfer agent fees | 859,170 | |
Distribution and service plan fees | 299,224 | |
Accounting and security lending fees | 179,820 | |
Custodian fees and expenses | 137,701 | |
Independent trustees' compensation | 1,830 | |
Registration fees | 149,234 | |
Audit | 52,141 | |
Legal | 1,176 | |
Interest | 920 | |
Miscellaneous | 2,271 | |
Total expenses before reductions | 4,131,802 | |
Expense reductions | (41,295) | 4,090,507 |
Net investment income (loss) | | 5,290,077 |
Realized and Unrealized Gain (Loss) Net realized gain (loss) on: | | |
Investment securities: | | |
Unaffiliated issuers (net of foreign taxes of $9,801) | (2,524,423) | |
Foreign currency transactions | (119,006) | |
Total net realized gain (loss) | | (2,643,429) |
Change in net unrealized appreciation (depreciation) on: Investment securities (net of increase in deferred foreign taxes of $72,455) | 40,352,125 | |
Assets and liabilities in foreign currencies | 4,035 | |
Total change in net unrealized appreciation (depreciation) | | 40,356,160 |
Net gain (loss) | | 37,712,731 |
Net increase (decrease) in net assets resulting from operations | | $ 43,002,808 |
See accompanying notes which are an integral part of the financial statements.
Annual Report
Statement of Changes in Net Assets
| Year ended
October 31, 2010 | For the period
March 25, 2009
(commencement of
operations) to
October 31, 2009 |
Increase (Decrease) in Net Assets | | |
Operations | | |
Net investment income (loss) | $ 5,290,077 | $ 14,516 |
Net realized gain (loss) | (2,643,429) | 1,187,329 |
Change in net unrealized appreciation (depreciation) | 40,356,160 | 8,431,977 |
Net increase (decrease) in net assets resulting
from operations | 43,002,808 | 9,633,822 |
Distributions to shareholders from net investment income | (188,424) | - |
Distributions to shareholders from net realized gain | (1,358,291) | - |
Total distributions | (1,546,715) | - |
Share transactions - net increase (decrease) | 198,095,255 | 187,451,591 |
Redemption fees | 48,090 | 58,304 |
Total increase (decrease) in net assets | 239,599,438 | 197,143,717 |
| | |
Net Assets | | |
Beginning of period | 197,143,717 | - |
End of period (including undistributed net investment income of $4,074,073 and undistributed net investment income of $13,431, respectively) | $ 436,743,155 | $ 197,143,717 |
See accompanying notes which are an integral part of the financial statements.
Annual Report
Financial Highlights - Class A
Years ended October 31, | 2010 | 2009 H |
Selected Per-Share Data | | |
Net asset value, beginning of period | $ 13.29 | $ 10.00 |
Income from Investment Operations | | |
Net investment income (loss) E | .19 K | (.01) |
Net realized and unrealized gain (loss) | 2.20 | 3.29 |
Total from investment operations | 2.39 | 3.28 |
Distributions from net investment income | - J | - |
Distributions from net realized gain | (.08) | - |
Total distributions | (.08) | - |
Redemption fees added to paid in capital E | - J | .01 |
Net asset value, end of period | $ 15.60 | $ 13.29 |
Total ReturnB,C,D | 18.04% | 32.90% |
Ratios to Average Net AssetsF,I | | |
Expenses before reductions | 1.37% | 1.65% A |
Expenses net of fee waivers, if any | 1.37% | 1.50%A |
Expenses net of all reductions | 1.36% | 1.48%A |
Net investment income (loss) | 1.35% K | (.15)%A |
Supplemental Data | | |
Net assets, end of period (000 omitted) | $ 60,370 | $ 15,705 |
Portfolio turnover rateG | 54% | 25%A |
A Annualized
B Total returns for periods of less than one year are not annualized.
C Total returns would have been lower had certain expenses not been reduced during the periods shown.
D Total returns do not include the effect of the sales charges.
E Calculated based on average shares outstanding during the period.
F Fees and expenses of the underlying Fidelity Central Funds are not included in the Fund's expense ratio. The Fund indirectly bears its proportionate share of the expenses of any underlying Fidelity Central Funds.
G Amount does not include the portfolio activity of any underlying Fidelity Central Funds.
H For the period March 25, 2009 (commencement of operations) to October 31, 2009.
I Expense ratios reflect operating expenses of the class. Expenses before reductions do not reflect amounts reimbursed by the investment adviser or reductions from brokerage service arrangements or reductions from other expense offset arrangements and do not represent the amount paid by the class during periods when reimbursements or reductions occur. Expense ratios before reductions for start-up periods may not be representative of longer-term operating periods. Expenses net of fee waivers reflect expenses after reimbursement by the investment adviser but prior to reductions from brokerage service arrangements or other expense offset arrangements. Expenses net of all reductions represent the net expenses paid by the class.
J Amount represents less than $.01 per share.
K Investment income per share reflects a special dividend which amounted to $.13 per share. Excluding the special dividend, the ratio of net investment income (loss) to average net assets would have been .42%.
See accompanying notes which are an integral part of the financial statements.
Annual Report
Financial Highlights - Class T
Years ended October 31, | 2010 | 2009 H |
Selected Per-Share Data | | |
Net asset value, beginning of period | $ 13.27 | $ 10.00 |
Income from Investment Operations | | |
Net investment income (loss) E | .16 K | (.03) |
Net realized and unrealized gain (loss) | 2.19 | 3.29 |
Total from investment operations | 2.35 | 3.26 |
Distributions from net realized gain | (.07) | - |
Redemption fees added to paid in capital E | - J | .01 |
Net asset value, end of period | $ 15.55 | $ 13.27 |
Total Return B,C,D | 17.73% | 32.70% |
Ratios to Average Net Assets F,I | | |
Expenses before reductions | 1.63% | 2.04% A |
Expenses net of fee waivers, if any | 1.63% | 1.75% A |
Expenses net of all reductions | 1.61% | 1.73% A |
Net investment income (loss) | 1.10% K | (.40)% A |
Supplemental Data | | |
Net assets, end of period (000 omitted) | $ 11,762 | $ 4,665 |
Portfolio turnover rate G | 54% | 25% A |
A Annualized
B Total returns for periods of less than one year are not annualized.
C Total returns would have been lower had certain expenses not been reduced during the periods shown.
D Total returns do not include the effect of the sales charges.
E Calculated based on average shares outstanding during the period.
F Fees and expenses of the underlying Fidelity Central Funds are not included in the Fund's expense ratio. The Fund indirectly bears its proportionate share of the expenses of any underlying Fidelity Central Funds.
G Amount does not include the portfolio activity of any underlying Fidelity Central Funds.
H For the period March 25, 2009 (commencement of operations) to October 31, 2009.
I Expense ratios reflect operating expenses of the class. Expenses before reductions do not reflect amounts reimbursed by the investment adviser or reductions from brokerage service arrangements or reductions from other expense offset arrangements and do not represent the amount paid by the class during periods when reimbursements or reductions occur. Expense ratios before reductions for start-up periods may not be representative of longer-term operating periods. Expenses net of fee waivers reflect expenses after reimbursement by the investment adviser but prior to reductions from brokerage service arrangements or other expense offset arrangements. Expenses net of all reductions represent the net expenses paid by the class.
J Amount represents less than $.01 per share.
K Investment income per share reflects a special dividend which amounted to $.13 per share. Excluding the special dividend, the ratio of net investment income (loss) to average net assets would have been .17%.
See accompanying notes which are an integral part of the financial statements.
Annual Report
Financial Highlights - Class B
Years ended October 31, | 2010 | 2009 H |
Selected Per-Share Data | | |
Net asset value, beginning of period | $ 13.22 | $ 10.00 |
Income from Investment Operations | | |
Net investment income (loss) E | .08 K | (.07) |
Net realized and unrealized gain (loss) | 2.20 | 3.28 |
Total from investment operations | 2.28 | 3.21 |
Distributions from net realized gain | (.04) | - |
Redemption fees added to paid in capital E | - J | .01 |
Net asset value, end of period | $ 15.46 | $ 13.22 |
Total Return B,C,D | 17.23% | 32.20% |
Ratios to Average Net Assets F,I | | |
Expenses before reductions | 2.16% | 2.66% A |
Expenses net of fee waivers, if any | 2.16% | 2.25% A |
Expenses net of all reductions | 2.15% | 2.23% A |
Net investment income (loss) | .56% K | (.90)% A |
Supplemental Data | | |
Net assets, end of period (000 omitted) | $ 4,348 | $ 2,726 |
Portfolio turnover rate G | 54% | 25% A |
A Annualized
B Total returns for periods of less than one year are not annualized.
C Total returns would have been lower had certain expenses not been reduced during the periods shown.
D Total returns do not include the effect of the contingent deferred sales charge.
E Calculated based on average shares outstanding during the period.
F Fees and expenses of the underlying Fidelity Central Funds are not included in the Fund's expense ratio. The Fund indirectly bears its proportionate share of the expenses of any underlying Fidelity Central Funds.
G Amount does not include the portfolio activity of any underlying Fidelity Central Funds.
H For the period March 25, 2009 (commencement of operations) to October 31, 2009.
I Expense ratios reflect operating expenses of the class. Expenses before reductions do not reflect amounts reimbursed by the investment adviser or reductions from brokerage service arrangements or reductions from other expense offset arrangements and do not represent the amount paid by the class during periods when reimbursements or reductions occur. Expense ratios before reductions for start-up periods may not be representative of longer-term operating periods. Expenses net of fee waivers reflect expenses after reimbursement by the investment adviser but prior to reductions from brokerage service arrangements or other expense offset arrangements. Expenses net of all reductions represent the net expenses paid by the class.
J Amount represents less than $.01 per share.
K Investment income per share reflects a special dividend which amounted to $.13 per share. Excluding the special dividend, the ratio of net investment income (loss) to average net assets would have been (.37)%.
See accompanying notes which are an integral part of the financial statements.
Annual Report
Financial Highlights - Class C
Years ended October 31, | 2010 | 2009 H |
Selected Per-Share Data | | |
Net asset value, beginning of period | $ 13.22 | $ 10.00 |
Income from Investment Operations | | |
Net investment income (loss) E | .08 K | (.07) |
Net realized and unrealized gain (loss) | 2.19 | 3.28 |
Total from investment operations | 2.27 | 3.21 |
Distributions from net realized gain | (.04) | - |
Redemption fees added to paid in capital E | - J | .01 |
Net asset value, end of period | $ 15.45 | $ 13.22 |
Total Return B,C,D | 17.21% | 32.20% |
Ratios to Average Net Assets F,I | | |
Expenses before reductions | 2.14% | 2.53% A |
Expenses net of fee waivers, if any | 2.14% | 2.25% A |
Expenses net of all reductions | 2.13% | 2.23% A |
Net investment income (loss) | .58% K | (.90)% A |
Supplemental Data | | |
Net assets, end of period (000 omitted) | $ 14,338 | $ 4,798 |
Portfolio turnover rate G | 54% | 25% A |
A Annualized
B Total returns for periods of less than one year are not annualized.
C Total returns would have been lower had certain expenses not been reduced during the periods shown.
D Total returns do not include the effect of the contingent deferred sales charge.
E Calculated based on average shares outstanding during the period.
F Fees and expenses of the underlying Fidelity Central Funds are not included in the Fund's expense ratio. The Fund indirectly bears its proportionate share of the expenses of any underlying Fidelity Central Funds.
G Amount does not include the portfolio activity of any underlying Fidelity Central Funds.
H For the period March 25, 2009 (commencement of operations) to October 31, 2009.
I Expense ratios reflect operating expenses of the class. Expenses before reductions do not reflect amounts reimbursed by the investment adviser or reductions from brokerage service arrangements or reductions from other expense offset arrangements and do not represent the amount paid by the class during periods when reimbursements or reductions occur. Expense ratios before reductions for start-up periods may not be representative of longer-term operating periods. Expenses net of fee waivers reflect expenses after reimbursement by the investment adviser but prior to reductions from brokerage service arrangements or other expense offset arrangements. Expenses net of all reductions represent the net expenses paid by the class.
J Amount represents less than $.01 per share.
K Investment income per share reflects a special dividend which amounted to $.13 per share. Excluding the special dividend, the ratio of net investment income (loss) to average net assets would have been (.34)%.
See accompanying notes which are an integral part of the financial statements.
Annual Report
Financial Highlights - Global Commodity Stock
Years ended October 31, | 2010 | 2009 G |
Selected Per-Share Data | | |
Net asset value, beginning of period | $ 13.31 | $ 10.00 |
Income from Investment Operations | | |
Net investment income (loss)D | .23 J | .01 |
Net realized and unrealized gain (loss) | 2.21 | 3.29 |
Total from investment operations | 2.44 | 3.30 |
Distributions from net investment income | (.01) | - |
Distributions from net realized gain | (.08) | - |
Total distributions | (.09) | - |
Redemption fees added to paid in capitalD | -I | .01 |
Net asset value, end of period | $ 15.66 | $ 13.31 |
Total ReturnB,C | 18.38% | 33.10% |
Ratios to Average Net AssetsE,H | | |
Expenses before reductions | 1.10% | 1.42%A |
Expenses net of fee waivers, if any | 1.10% | 1.25%A |
Expenses net of all reductions | 1.09% | 1.23%A |
Net investment income (loss) | 1.62% J | .10%A |
Supplemental Data | | |
Net assets, end of period (000 omitted) | $ 310,186 | $ 159,439 |
Portfolio turnover rateF | 54% | 25%A |
A Annualized
B Total returns for periods of less than one year are not annualized.
C Total returns would have been lower had certain expenses not been reduced during the periods shown.
D Calculated based on average shares outstanding during the period.
E Fees and expenses of the underlying Fidelity Central Funds are not included in the Fund's expense ratio. The Fund indirectly bears its proportionate share of the expenses of any underlying Fidelity Central Funds.
F Amount does not include the portfolio activity of any underlying Fidelity Central Funds.
G For the period March 25, 2009 (commencement of operations) to October 31, 2009.
H Expense ratios reflect operating expenses of the class. Expenses before reductions do not reflect amounts reimbursed by the investment adviser or reductions from brokerage service arrangements or reductions from other expense offset arrangements and do not represent the amount paid by the class during periods when reimbursements or reductions occur. Expense ratios before reductions for start-up periods may not be representative of longer-term operating periods. Expenses net of fee waivers reflect expenses after reimbursement by the investment adviser but prior to reductions from brokerage service arrangements or other expense offset arrangements. Expenses net of all reductions represent the net expenses paid by the class.
I Amount represents less than $.01 per share.
J Investment income per share reflects a special dividend which amounted to $.13 per share. Excluding the special dividend, the ratio of net investment income (loss) to average net assets would have been .69%.
See accompanying notes which are an integral part of the financial statements.
Annual Report
Financial Highlights - Institutional Class
Years ended October 31, | 2010 | 2009 G |
Selected Per-Share Data | | |
Net asset value, beginning of period | $ 13.31 | $ 10.00 |
Income from Investment Operations | | |
Net investment income (loss) D | .23 J | .01 |
Net realized and unrealized gain (loss) | 2.21 | 3.29 |
Total from investment operations | 2.44 | 3.30 |
Distributions from net investment income | (.01) | - |
Distributions from net realized gain | (.08) | - |
Total distributions | (.09) | - |
Redemption fees added to paid in capital D | - I | .01 |
Net asset value, end of period | $ 15.66 | $ 13.31 |
Total Return B,C | 18.39% | 33.10% |
Ratios to Average Net Assets E,H | | |
Expenses before reductions | 1.09% | 1.36% A |
Expenses net of fee waivers, if any | 1.09% | 1.25% A |
Expenses net of all reductions | 1.07% | 1.23% A |
Net investment income (loss) | 1.64% J | .10% A |
Supplemental Data | | |
Net assets, end of period (000 omitted) | $ 35,739 | $ 9,811 |
Portfolio turnover rate F | 54% | 25% A |
A Annualized
B Total returns for periods of less than one year are not annualized.
C Total returns would have been lower had certain expenses not been reduced during the periods shown.
D Calculated based on average shares outstanding during the period.
E Fees and expenses of the underlying Fidelity Central Funds are not included in the Fund's expense ratio. The Fund indirectly bears its proportionate share of the expenses of any underlying Fidelity Central Funds.
F Amount does not include the portfolio activity of any underlying Fidelity Central Funds.
G For the period March 25, 2009 (commencement of operations) to October 31, 2009.
H Expense ratios reflect operating expenses of the class. Expenses before reductions do not reflect amounts reimbursed by the investment adviser or reductions from brokerage service arrangements or reductions from other expense offset arrangements and do not represent the amount paid by the class during periods when reimbursements or reductions occur. Expense ratios before reductions for start-up periods may not be representative of longer-term operating periods. Expenses net of fee waivers reflect expenses after reimbursement by the investment adviser but prior to reductions from brokerage service arrangements or other expense offset arrangements. Expenses net of all reductions represent the net expenses paid by the class.
I Amount represents less than $.01 per share.
J Investment income per share reflects a special dividend which amounted to $.13 per share. Excluding the special dividend, the ratio of net investment income (loss) to average net assets would have been .71%.
See accompanying notes which are an integral part of the financial statements.
Annual Report
Notes to Financial Statements
For the period ended October 31, 2010
1. Organization.
Fidelity Global Commodity Stock Fund (the Fund) is a non-diversified fund of Fidelity Investment Trust (the Trust) and is authorized to issue an unlimited number of shares. The Trust is registered under the Investment Company Act of 1940, as amended (the 1940 Act), as an open-end management investment company organized as a Massachusetts business trust. The Fund offers Class A, Class T, Class C, Global Commodity Stock, and Institutional Class shares, each of which has equal rights as to assets and voting privileges. Effective after the close of business on September 1, 2010, Class B shares were closed to new accounts and additional purchases by existing shareholders. Each class has exclusive voting rights with respect to matters that affect that class. Class B shares will automatically convert to Class A shares after a holding period of seven years from the initial date of purchase. Investment income, realized and unrealized capital gains and losses, the common expenses of the Fund, and certain fund-level expense reductions, if any, are allocated on a pro-rata basis to each class based on the relative net assets of each class to the total net assets of the Fund. Each class differs with respect to transfer agent and distribution and service plan fees incurred. Certain expense reductions also differ by class. The Fund's investments in emerging markets can be subject to social, economic, regulatory, and political uncertainties and can be extremely volatile.
2. Investments in Fidelity Central Funds.
The Fund may invest in Fidelity Central Funds, which are open-end investment companies available only to other investment companies and accounts managed by Fidelity Management & Research Company (FMR) and its affiliates. The Fund's Schedule of Investments lists each of the Fidelity Central Funds held as of period end, if any, as an investment of the Fund, but does not include the underlying holdings of each Fidelity Central Fund. As an Investing Fund, the Fund indirectly bears its proportionate share of the expenses of the underlying Fidelity Central Funds.
The Money Market Central Funds seek preservation of capital and current income and are managed by Fidelity Investments Money Management, Inc. (FIMM), an affiliate of FMR.
A complete unaudited list of holdings for each Fidelity Central Fund is available upon request or at the Securities and Exchange Commission (the SEC) web site at www.sec.gov. In addition, the financial statements of the Fidelity Central Funds which are not covered by the Fund's Report of Independent Registered Public Accounting Firm, are available on the SEC web site or upon request.
3. Significant Accounting Policies.
The financial statements have been prepared in conformity with accounting principles generally accepted in the United States of America (GAAP), which require management
Annual Report
3. Significant Accounting Policies - continued
to make certain estimates and assumptions at the date of the financial statements. Actual results could differ from those estimates. The following summarizes the significant accounting policies of the Fund:
Security Valuation. Investments are valued as of 4:00 p.m. Eastern time on the last calendar day of the period. The Fund uses independent pricing services approved by the Board of Trustees to value its investments. When current market prices or quotations are not readily available or reliable, valuations may be determined in good faith in accordance with procedures adopted by the Board of Trustees. Factors used in determining value may include market or security specific events. The frequency with which these procedures are used cannot be predicted and they may be utilized to a significant extent. The value used for net asset value (NAV) calculation under these procedures may differ from published prices for the same securities.
The Fund categorizes the inputs to valuation techniques used to value its investments into a disclosure hierarchy consisting of three levels as shown below.
Level 1 - quoted prices in active markets for identical investments
Level 2 - other significant observable inputs (including quoted prices for similar investments, interest rates, prepayment speeds, etc.)
Level 3 - unobservable inputs (including the fund's own assumptions based on the best information available)
Changes in valuation techniques may result in transfers in or out of an assigned level within the disclosure hierarchy. The aggregate value of investments by input level, as of October 31, 2010, as well as a roll forward of Level 3 securities, is included at the end of the Fund's Schedule of Investments. Valuation techniques used to value the Fund's investments by major category are as follows.
Equity securities, including restricted securities, for which market quotations are readily available, are valued at the last reported sale price or official closing price as reported by an independent pricing service on the primary market or exchange on which they are traded and are categorized as Level 1 in the hierarchy. In the event there were no sales during the day or closing prices are not available, securities are valued at the last quoted bid price or may be valued using the last available price and are generally categorized as Level 2 in the hierarchy. For foreign equity securities, when significant market or security specific events arise, comparisons to the valuation of American Depositary Receipts (ADRs), futures contracts, Exchange-traded funds (ETFs) and certain indexes as well as quoted prices for similar securities are used and are categorized as Level 2 in the hierarchy in these circumstances. Utilizing these techniques may result in transfers between
Annual Report
Notes to Financial Statements - continued
3. Significant Accounting Policies - continued
Security Valuation - continued
Level 1 and Level 2. For restricted equity securities and private placements where observable inputs are limited, assumptions about market activity and risk are used and are categorized as Level 3 in the hierarchy.
Investments in open-end mutual funds, including the Fidelity Central Funds, are valued at their closing net asset value each business day and are categorized as Level 1 in the hierarchy. Short-term securities with remaining maturities of sixty days or less for which quotations are not readily available are valued at amortized cost, which approximates fair value and are categorized as Level 2 in the hierarchy.
Foreign Currency. The Fund uses foreign currency contracts to facilitate transactions in foreign-denominated securities. Gains and losses from these transactions may arise from changes in the value of the foreign currency or if the counterparties do not perform under the contracts' terms.
Foreign-denominated assets, including investment securities, and liabilities are translated into U.S. dollars at the exchange rate at period end. Purchases and sales of investment securities, income and dividends received and expenses denominated in foreign currencies are translated into U.S. dollars at the exchange rate in effect on the transaction date.
The effects of exchange rate fluctuations on investments are included with the net realized and unrealized gain (loss) on investment securities. Other foreign currency transactions resulting in realized and unrealized gain (loss) are disclosed separately.
Investment Transactions and Income. For financial reporting purposes, the Fund's investment holdings and NAV include trades executed through the end of the last business day of the period. The NAV per share for processing shareholder transactions is calculated as of the close of business of the New York Stock Exchange (NYSE), normally 4:00 p.m. Eastern time and includes trades executed through the end of the prior business day. Gains and losses on securities sold are determined on the basis of identified cost. Dividend income is recorded on the ex-dividend date, except for certain dividends from foreign securities where the ex-dividend date may have passed, which are recorded as soon as the Fund is informed of the ex-dividend date. Non-cash dividends included in dividend income, if any, are recorded at the fair market value of the securities received. Distributions received on securities that represent a return of capital or capital gain are recorded as a reduction of cost of investments and/or as a realized gain. The Fund estimates the components of distributions received that may be considered return of capital distributions or capital gain distributions. Large, non-recurring dividends recognized by the Fund are presented separately on the Statement of Operations as "Special Dividends" and the impact of these dividends is presented in the Financial Highlights.
Annual Report
3. Significant Accounting Policies - continued
Investment Transactions and Income - continued
Interest income and distributions from the Fidelity Central Funds are accrued as earned. Interest income includes coupon interest and amortization of premium and accretion of discount on debt securities. Investment income is recorded net of foreign taxes withheld where recovery of such taxes is uncertain.
Expenses. Most expenses of the Trust can be directly attributed to a fund. Expenses which cannot be directly attributed are apportioned amongst each fund in the Trust. Expense estimates are accrued in the period to which they relate and adjustments are made when actual amounts are known.
Income Tax Information and Distributions to Shareholders. Each year the Fund intends to qualify as a regulated investment company, including distributing substantially all of its taxable income and realized gains under Subchapter M of the Internal Revenue Code and filing its U.S. federal tax return. As a result, no provision for income taxes is required. As of October 31, 2010, the Fund did not have any unrecognized tax benefits in the accompanying financial statements. A fund's federal tax return is subject to examination by the Internal Revenue Service (IRS) for a period of three years. Foreign taxes are provided for based on the Fund's understanding of the tax rules and rates that exist in the foreign markets in which it invests. The Fund is subject to a tax imposed on short term capital gains on securities of certain issuers domiciled in India. The Fund records an estimated deferred tax liability included in Other payables and accrued expenses in the accompanying Statement of Assets & Liabilities for net unrealized gains on these securities in an amount that would be payable if the securities were disposed of at period end.
Distributions are declared and recorded on the ex-dividend date. Income dividends and capital gain distributions are declared separately for each class. Income and capital gain distributions are determined in accordance with income tax regulations, which may differ from GAAP. In addition, the fund claimed a portion of the payment made to redeeming shareholders as a distribution for income tax purposes.
Capital accounts within the financial statements are adjusted for permanent book-tax differences. These adjustments have no impact on net assets or the results of operations. Temporary book-tax differences will reverse in a subsequent period.
Book-tax differences are primarily due to foreign currency transactions, certain foreign taxes, passive foreign investment companies (PFIC)and losses deferred due to wash sales.
Annual Report
Notes to Financial Statements - continued
3. Significant Accounting Policies - continued
Income Tax Information and Distributions to Shareholders - continued
The federal tax cost of investment securities and unrealized appreciation (depreciation) as of period end were as follows:
Gross unrealized appreciation | $ 61,409,156 |
Gross unrealized depreciation | (18,023,785) |
Net unrealized appreciation (depreciation) | $ 43,385,371 |
| |
Tax Cost | $ 401,941,221 |
The tax-based components of distributable earnings as of period end were as follows:
Undistributed ordinary income | $ 4,193,998 |
Undistributed long-term capital gain | $ 1,911,902 |
Net unrealized appreciation (depreciation) | $ 43,386,573 |
The tax character of distributions paid was as follows:
| October 31,
2010 | October 31,
2009 |
Ordinary Income | $ 1,546,715 | $ - |
Short-Term Trading (Redemption) Fees. Shares held by investors in the Fund less than 30 days are subject to a redemption fee equal to 1.00% of the net asset value of shares redeemed. All redemption fees, which reduce the proceeds of the shareholder redemption, are retained by the Fund and accounted for as an addition to paid in capital.
4. Purchases and Sales of Investments.
Purchases and sales of securities, other than short-term securities, aggregated $387,406,917 and $178,635,735, respectively.
5. Fees and Other Transactions with Affiliates.
Management Fee. FMR and its affiliates provide the Fund with investment management related services for which the Fund pays a monthly management fee. The management fee is the sum of an individual fund fee rate that is based on an annual rate of .45% of the Fund's average net assets and a group fee rate that averaged .26% during the period. The group fee rate is based upon the average net assets of all the mutual funds
Annual Report
5. Fees and Other Transactions with Affiliates - continued
Management Fee - continued
advised by FMR. The group fee rate decreases as assets under management increase and increases as assets under management decrease. For the period, the total annual management fee rate was .71% of the Fund's average net assets.
Distribution and Service Plan Fees. In accordance with Rule 12b-1 of the 1940 Act, the Fund has adopted separate Distribution and Service Plans for each class of shares. Certain classes pay Fidelity Distributors Corporation (FDC), an affiliate of FMR, separate Distribution and Service Fees, each of which is based on an annual percentage of each class' average net assets. In addition, FDC may pay financial intermediaries for selling shares of the Fund and providing shareholder support services. For the period, the Distribution and Service Fee rates, total fees and amounts retained by FDC were as follows:
| Distribution
Fee | Service
Fee | Total Fees | Retained
by FDC |
Class A | -% | .25% | $ 100,827 | $ 5,669 |
Class T | .25% | .25% | 44,998 | 3,026 |
Class B | .75% | .25% | 43,683 | 34,562 |
Class C | .75% | .25% | 109,716 | 73,600 |
| | | $ 299,224 | $ 116,857 |
Sales Load. FDC receives a front-end sales charge of up to 5.75% for selling Class A shares, and 3.50% for selling Class T shares, some of which is paid to financial intermediaries for selling shares of the Fund. FDC receives the proceeds of contingent deferred sales charges levied on Class A, Class T, Class B, and Class C redemptions. These charges depend on the holding period. The deferred sales charges range from 5% to 1% for Class B, 1% for Class C, 1.00% for certain purchases of Class A shares (1.00% to .50% prior to July 12, 2010) and .25% for certain purchases of Class T shares.
For the period, sales charge amounts retained by FDC were as follows:
| Retained
by FDC |
Class A | $ 71,199 |
Class T | 9,668 |
Class B* | 64,189 |
Class C* | 4,311 |
| $ 149,367 |
* When Class B and Class C shares are initially sold, FDC pays commissions from its own resources to financial intermediaries through which the sales are made.
Annual Report
Notes to Financial Statements - continued
5. Fees and Other Transactions with Affiliates - continued
Transfer Agent Fees. Fidelity Investments Institutional Operations Company, Inc. (FIIOC), an affiliate of FMR, is the transfer, dividend disbursing and shareholder servicing agent for each class of the Fund. FIIOC receives account fees and asset-based fees that vary according to the account size and type of account of the shareholders of the respective classes of the Fund. FIIOC pays for typesetting, printing and mailing of shareholder reports, except proxy statements. For the period, transfer agent fees for each class were as follows:
| Amount | % of
Average
Net Assets |
Class A | $ 107,075 | .26 |
Class T | 24,116 | .27 |
Class B | 13,309 | .30 |
Class C | 31,332 | .28 |
Global Commodity Stock | 629,234 | .24 |
Institutional Class | 54,104 | .23 |
| $ 859,170 | |
Accounting and Security Lending Fees. Fidelity Service Company, Inc. (FSC), an affiliate of FMR, maintains the Fund's accounting records. The accounting fee is based on the level of average net assets for the month. Under a separate contract, FSC administers the security lending program. The security lending fee is based on the number and duration of lending transactions.
Brokerage Commissions. The Fund placed a portion of its portfolio transactions with brokerage firms which are affiliates of the investment adviser. The commissions paid to these affiliated firms were $9,718 for the period.
Interfund Lending Program. Pursuant to an Exemptive Order issued by the SEC, the Fund, along with other registered investment companies having management contracts with FMR, may participate in an interfund lending program. This program provides an alternative credit facility allowing the funds to borrow from, or lend money to, other participating affiliated funds. At period end, there were no interfund loans outstanding. The Fund's activity in this program during the period for which loans were outstanding was as follows:
Borrower or Lender | Average
Daily Loan
Balance | Weighted
Average Interest
Rate | Interest
Expense |
Borrower | $ 3,460,667 | .46% | $ 666 |
Annual Report
6. Committed Line of Credit.
The Fund participates with other funds managed by FMR or an affiliate in a $3.75 billion credit facility (the "line of credit") to be utilized for temporary or emergency purposes to fund shareholder redemptions or for other short-term liquidity purposes. The Fund has agreed to pay commitment fees on its pro-rata portion of the line of credit, which amounted to $774 and is reflected in Miscellaneous expenses on the Statement of Operations. During the period, there were no borrowings on this line of credit.
7. Security Lending.
The Fund lends portfolio securities through a lending agent from time to time in order to earn additional income. The lending agent may loan securities to certain qualified borrowers, including Fidelity Capital Markets (FCM), a broker-dealer affiliated with the Fund. On the settlement date of the loan, the Fund receives collateral (in the form of U.S. Treasury obligations, letters of credit and/or cash) against the loaned securities and maintains collateral in an amount not less than 100% of the market value of the loaned securities during the period of the loan. The market value of the loaned securities is determined at the close of business of the Fund and any additional required collateral is delivered to the Fund on the next business day. If the borrower defaults on its obligation to return the securities loaned because of insolvency or other reasons, a fund could experience delays and costs in recovering the securities loaned or in gaining access to the collateral. Any cash collateral received is invested in the Fidelity Securities Lending Cash Central Fund. The value of loaned securities and cash collateral at period end are disclosed on the Fund's Statement of Assets and Liabilities. Security lending income represents the income earned on investing cash collateral, less rebates paid to borrowers and lending agent fees associated with the loan, plus any premium payments received for lending certain types of securities. Security lending income is presented in the Statement of Operations as a component of income from Fidelity Central Funds. Total security lending income during the period amounted to $89,586. During the period, there were no securities loaned to FCM.
8. Bank Borrowings.
The Fund is permitted to have bank borrowings for temporary or emergency purposes to fund shareholder redemptions. The Fund has established borrowing arrangements with certain banks. The interest rate on the borrowings is the bank's base rate, as revised from time to time. The average daily loan balance during the period for which loans were outstanding amounted to $3,318,000. The weighted average interest rate was .69%. The interest expense amounted to $254 under the bank borrowing program. At period end, there were no bank borrowings outstanding.
Annual Report
Notes to Financial Statements - continued
9. Expense Reductions.
Many of the brokers with whom FMR places trades on behalf of the Fund provided services to the Fund in addition to trade execution. These services included payments of certain expenses on behalf of the Fund totaling $41,295 for the period.
10. Distributions to Shareholders.
Distributions to shareholders of each class were as follows:
Years ended October 31, | 2010 | 2009 A |
From net investment income | | |
Class A | $ 7,432 | $ - |
Global Commodity Stock | 168,019 | - |
Institutional Class | 12,973 | - |
Total | $ 188,424 | $ - |
From net realized gain | | |
Class A | $ 143,058 | $ - |
Class T | 30,137 | - |
Class B | 9,302 | - |
Class C | 20,828 | - |
Global Commodity Stock | 1,078,126 | - |
Institutional Class | 76,840 | - |
Total | $ 1,358,291 | $ - |
A For the period March 25, 2009 (commencement of operations) to October 31, 2009.
11. Share Transactions.
Transactions for each class of shares were as follows:
| Shares | Dollars |
Years ended October 31, | 2010 | 2009 A | 2010 | 2009 A |
Class A | | | | |
Shares sold | 3,636,511 | 1,217,436 | $ 52,113,230 | $ 15,536,230 |
Reinvestment of distributions | 8,310 | - | 119,911 | - |
Shares redeemed | (957,806) | (35,397) | (13,354,681) | (440,651) |
Net increase (decrease) | 2,687,015 | 1,182,039 | $ 38,878,460 | $ 15,095,579 |
Class T | | | | |
Shares sold | 635,625 | 352,496 | $ 9,055,849 | $ 4,355,249 |
Reinvestment of distributions | 2,006 | - | 28,921 | - |
Shares redeemed | (233,090) | (796) | (3,190,490) | (10,905) |
Net increase (decrease) | 404,541 | 351,700 | $ 5,894,280 | $ 4,344,344 |
Annual Report
11. Share Transactions - continued
Transactions for each class of shares were as follows: - continued
| Shares | Dollars |
Years ended October 31, | 2010 | 2009 A | 2010 | 2009 A |
Class B | | | | |
Shares sold | 275,613 | 209,917 | $ 3,943,173 | $ 2,460,093 |
Reinvestment of distributions | 543 | - | 7,824 | - |
Shares redeemed | (200,985) | (3,790) | (2,763,660) | (51,192) |
Net increase (decrease) | 75,171 | 206,127 | $ 1,187,337 | $ 2,408,901 |
Class C | | | | |
Shares sold | 869,321 | 368,806 | $ 12,506,411 | $ 4,531,477 |
Reinvestment of distributions | 1,339 | - | 19,266 | - |
Shares redeemed | (305,685) | (5,994) | (4,197,936) | (81,571) |
Net increase (decrease) | 564,975 | 362,812 | $ 8,327,741 | $ 4,449,906 |
Global Commodity Stock | | | | |
Shares sold | 19,122,952 | 14,544,887 | $ 278,892,729 | $ 183,653,183 |
Reinvestment of distributions | 81,765 | - | 1,181,498 | - |
Shares redeemed | (11,379,620) | (2,563,407) | (158,960,668) | (31,996,439) |
Net increase (decrease) | 7,825,097 | 11,981,480 | $ 121,113,559 | $ 151,656,744 |
Institutional Class | | | | |
Shares sold | 1,969,025 | 773,649 | $ 28,672,948 | $ 9,932,033 |
Reinvestment of distributions | 2,588 | - | 37,397 | - |
Shares redeemed | (426,975) | (36,369) | (6,016,467) | (435,916) |
Net increase (decrease) | 1,544,638 | 737,280 | $ 22,693,878 | $ 9,496,117 |
A For the period March 25, 2009 (commencement of operations) to October 31, 2009.
12. Other.
The Fund's organizational documents provide former and current trustees and officers with a limited indemnification against liabilities arising in connection with the performance of their duties to the Fund. In the normal course of business, the Fund may also enter into contracts that provide general indemnifications. The Fund's maximum exposure under these arrangements is unknown as this would be dependent on future claims that may be made against the Fund. The risk of material loss from such claims is considered remote.
Annual Report
To the Trustees of Fidelity Investment Trust and the Shareholders of Fidelity Global Commodity Stock Fund:
In our opinion, the accompanying statement of assets and liabilities, including the schedule of investments, and the related statements of operations and of changes in net assets and the financial highlights present fairly, in all material respects, the financial position of Fidelity Global Commodity Stock Fund (a fund of Fidelity Investment Trust) at October 31, 2010, the results of its operations for the year then ended, the changes in its net assets for each of the periods indicated and the financial highlights for each of the periods indicated, in conformity with accounting principles generally accepted in the United States of America. These financial statements and financial highlights (hereafter referred to as "financial statements") are the responsibility of the Fidelity Global Commodity Stock Fund's management. Our responsibility is to express an opinion on these financial statements based on our audits. We conducted our audits of these financial statements in accordance with the standards of the Public Company Accounting Oversight Board (United States). Those standards require that we plan and perform the audit to obtain reasonable assurance about whether the financial statements are free of material misstatement. An audit includes examining, on a test basis, evidence supporting the amounts and disclosures in the financial statements, assessing the accounting principles used and significant estimates made by management, and evaluating the overall financial statement presentation. We believe that our audits, which included confirmation of securities at October 31, 2010 by correspondence with the custodian and brokers, provide a reasonable basis for our opinion.
/s/ PricewaterhouseCoopers LLP
PricewaterhouseCoopers LLP
Boston, Massachusetts
December 17, 2010
Annual Report
The Trustees, Member of the Advisory Board, and executive officers of the trust and fund, as applicable, are listed below. The Board of Trustees governs the fund and is responsible for protecting the interests of shareholders. The Trustees are experienced executives who meet periodically throughout the year to oversee the fund's activities, review contractual arrangements with companies that provide services to the fund, oversee management of the risks associated with such activities and contractual arrangements, and review the fund's performance. Except for James C. Curvey, each of the Trustees oversees 221 funds advised by FMR or an affiliate. Mr. Curvey oversees 410 funds advised by FMR or an affiliate.
The Trustees hold office without limit in time except that (a) any Trustee may resign; (b) any Trustee may be removed by written instrument, signed by at least two-thirds of the number of Trustees prior to such removal; (c) any Trustee who requests to be retired or who has become incapacitated by illness or injury may be retired by written instrument signed by a majority of the other Trustees; and (d) any Trustee may be removed at any special meeting of shareholders by a two-thirds vote of the outstanding voting securities of the trust. Each Trustee who is not an interested person (as defined in the 1940 Act) (Independent Trustee), shall retire not later than the last day of the calendar year in which his or her 72nd birthday occurs. The Independent Trustees may waive this mandatory retirement age policy with respect to individual Trustees. The executive officers and Advisory Board Member hold office without limit in time, except that any officer and Advisory Board Member may resign or may be removed by a vote of a majority of the Trustees at any regular meeting or any special meeting of the Trustees. Except as indicated, each individual has held the office shown or other offices in the same company for the past five years.
Experience, Skills, Attributes, and Qualifications of the Fund's Trustees. The Governance and Nominating Committee has adopted a statement of policy that describes the experience, qualifications, attributes, and skills that are necessary and desirable for potential Independent Trustee candidates (Statement of Policy). The Board believes that each Trustee satisfied at the time he or she was initially elected or appointed a Trustee, and continues to satisfy, the standards contemplated by the Statement of Policy. The Governance and Nominating Committee also engages professional search firms to help identify potential Independent Trustee candidates who have the experience, qualifications, attributes, and skills consistent with the Statement of Policy. From time to time, additional criteria based on the composition and skills of the current Independent Trustees, as well as experience or skills that may be appropriate in light of future changes to board composition, business conditions, and regulatory or other developments, have also been considered by the professional search firms and the Governance and Nominating Committee. In addition, the Board takes into account the Trustees' commitment and participation in Board and committee meetings, as well as their leadership of standing and ad hoc committees throughout their tenure.
In determining that a particular Trustee was and continues to be qualified to serve as a Trustee, the Board has considered a variety of criteria, none of which, in isolation, was controlling. The Board believes that, collectively, the Trustees have balanced and diverse experience, qualifications, attributes, and skills, which allow the Board to operate effectively in governing the fund and protecting the interests of shareholders. Information about the specific experience, skills, attributes, and qualifications of each Trustee, which in each case led to the Board's conclusion that the Trustee should serve (or continue to serve) as a trustee of the fund, is provided below.
Annual Report
Board Structure and Oversight Function. Edward C. Johnson 3d is an interested person (as defined in the 1940 Act) and currently serves as Chairman. The Trustees have determined that an interested Chairman is appropriate and benefits shareholders because an interested Chairman has a personal and professional stake in the quality and continuity of services provided to the fund. Independent Trustees exercise their informed business judgment to appoint an individual of their choosing to serve as Chairman, regardless of whether the Trustee happens to be independent or a member of management. The Independent Trustees have determined that they can act independently and effectively without having an Independent Trustee serve as Chairman and that a key structural component for assuring that they are in a position to do so is for the Independent Trustees to constitute a substantial majority for the Board. The Independent Trustees also regularly meet in executive session. Ned C. Lautenbach serves as Chairman of the Independent Trustees and as such (i) acts as a liaison between the Independent Trustees and management with respect to matters important to the Independent Trustees and (ii) with management prepares agendas for Board meetings.
Fidelity funds are overseen by different Boards of Trustees. The fund's Board oversees Fidelity's equity and high income funds and another Board oversees Fidelity's investment-grade bond, money market, and asset allocation funds. The asset allocation funds may invest in Fidelity funds overseen by the fund's Board. The use of separate Boards, each with its own committee structure, allows the Trustees of each group of Fidelity funds to focus on the unique issues of the funds they oversee, including common research, investment, and operational issues. On occasion, the separate Boards establish joint committees to address issues of overlapping consequences for the Fidelity funds overseen by each Board.
The Trustees operate using a system of committees to facilitate the timely and efficient consideration of all matters of importance to the Trustees, the fund, and fund shareholders and to facilitate compliance with legal and regulatory requirements and oversight of the fund's activities and associated risks. The Board, acting through its committees, has charged FMR and its affiliates with (i) identifying events or circumstances the occurrence of which could have demonstrably adverse effects on the fund's business and/or reputation; (ii) implementing processes and controls to lessen the possibility that such events or circumstances occur or to mitigate the effects of such events or circumstances if they do occur; and (iii) creating and maintaining a system designed to evaluate continuously business and market conditions in order to facilitate the identification and implementation processes described in (i) and (ii) above. Because the day-to-day operations and activities of the fund are carried out by or through FMR, its affiliates and other service providers, the fund's exposure to risks is mitigated but not eliminated by the processes overseen by the Trustees. While each of the Board's committees has responsibility for overseeing different aspects of the fund's activities, oversight is exercised primarily through the Operations, Audit, and Compliance Committees. Appropriate personnel, including but not limited to the fund's Chief Compliance Officer (CCO), FMR's internal auditor, the independent accountants, the fund's Treasurer and portfolio management personnel, make periodic reports to the Board's committees, as appropriate. The responsibilities of each committee, including their oversight responsibilities, are described further under "Standing Committees of the Fund's Trustees."
Annual Report
Trustees and Officers - continued
The fund's Statement of Additional Information (SAI) includes more information about the Trustees. To request a free copy, call Fidelity at 1-800-544-8544.
Interested Trustees*:
Correspondence intended for each Trustee who is an interested person may be sent to Fidelity Investments, 82 Devonshire Street, Boston, Massachusetts 02109.
Name, Age; Principal Occupations and Other Relevant Experience+ |
Edward C. Johnson 3d (80) |
| Year of Election or Appointment: 1984 Mr. Johnson is Trustee and Chairman of the Board of Trustees of certain Trusts. Mr. Johnson serves as Chief Executive Officer, Chairman, and a Director of FMR LLC; Chairman and a Director of FMR; Chairman and a Director of Fidelity Research & Analysis Company (FRAC); Chairman and a Director of Fidelity Investments Money Management, Inc.; and Chairman and a Director of FMR Co., Inc. In addition, Mr. Johnson serves as Chairman and Director of FIL Limited. Previously, Mr. Johnson served as President of FMR LLC (2006-2007). |
James C. Curvey (75) |
| Year of Election or Appointment: 2007 Mr. Curvey also serves as Trustee (2007-present) of other investment companies advised by FMR. Mr. Curvey is a Director of Fidelity Investments Money Management, Inc. (2009-present), Director of Fidelity Research & Analysis Co. (2009-present) and Director of FMR and FMR Co., Inc. (2007-present). Mr. Curvey is also Vice Chairman (2007-present) and Director of FMR LLC. In addition, Mr. Curvey serves as an Overseer for the Boston Symphony Orchestra and a member of the Trustees of Villanova University. Previously, Mr. Curvey was the Vice Chairman (2006-2007) and Director (2000-2007) of FMR Corp. |
* Trustees have been determined to be "Interested Trustees" by virtue of, among other things, their affiliation with the trust or various entities under common control with FMR.
+ The information above includes each Trustee's principal occupation during the last five years and other information relating to the experience, attributes, and skills relevant to each Trustee's qualifications to serve as a Trustee, which led to the conclusion that each Trustee should serve as a Trustee for the fund.
Annual Report
Independent Trustees:
Correspondence intended for each Independent Trustee (that is, the Trustees other than the Interested Trustees) may be sent to Fidelity Investments, P.O. Box 55235, Boston, Massachusetts 02205-5235.
Name, Age; Principal Occupations and Other Relevant Experience+ |
Dennis J. Dirks (62) |
| Year of Election or Appointment: 2005 Prior to his retirement in May 2003, Mr. Dirks was Chief Operating Officer and a member of the Board of The Depository Trust & Clearing Corporation (DTCC). He also served as President, Chief Operating Officer, and Board member of The Depository Trust Company (DTC) and President and Board member of the National Securities Clearing Corporation (NSCC). In addition, Mr. Dirks served as Chief Executive Officer and Board member of the Government Securities Clearing Corporation, Chief Executive Officer and Board member of the Mortgage-Backed Securities Clearing Corporation, as a Trustee and a member of the Finance Committee of Manhattan College (2005-2008), and as a Trustee and a member of the Finance Committee of AHRC of Nassau County (2006-2008). Mr. Dirks is a member of the Independent Directors Council (IDC) Governing Council (2010-Present) and Board of Directors for The Brookville Center for Children's Services, Inc. (2009-present). |
Alan J. Lacy (57) |
| Year of Election or Appointment: 2008 Mr. Lacy serves as Senior Adviser (2007-present) of Oak Hill Capital Partners, L.P. (private equity). Mr. Lacy also served as Chief Executive Officer (2000-2005) and Vice Chairman (2005-2006) of Sears Holdings Corporation and Sears, Roebuck and Co. (retail). In addition, Mr. Lacy serves as a member of the Board of Directors of The Western Union Company (global money transfer, 2006-present) and Bristol-Myers Squibb Company (global pharmaceuticals, 2007-present). Mr. Lacy is Chairman (2008-present) and a member (2006-present) of the Board of Trustees of The National Parks Conservation Association. |
Ned C. Lautenbach (66) |
| Year of Election or Appointment: 2000 Mr. Lautenbach is Chairman of the Independent Trustees of the Equity and High Income Funds (2006-present). Mr. Lautenbach currently serves as the Lead Director of the Eaton Corporation Board of Directors (diversified industrial, 1997-present). Mr. Lautenbach is also a member of the Board of Directors of the Philharmonic Center for the Arts in Naples, Florida (1999-present); a member of the Board of Trustees of Fairfield University (2005-present); and a member of the Council on Foreign Relations (1994-present). Previously, Mr. Lautenbach was a Partner/Advisory Partner at Clayton, Dubilier & Rice, Inc. (private equity investment, 1998-2010), as well as a Director of Sony Corporation (2006-2007). |
Joseph Mauriello (66) |
| Year of Election or Appointment: 2008 Prior to his retirement in January 2006, Mr. Mauriello served in numerous senior management positions including Deputy Chairman and Chief Operating Officer (2004-2005), and Vice Chairman of Financial Services (2002-2004) of KPMG LLP US (professional services, 1965-2005). Mr. Mauriello currently serves as a member of the Board of Directors of XL Group plc. (global insurance and re-insurance, 2006-present) and of Arcadia Resources Inc. (health care services and products, 2007-present). Previously, Mr. Mauriello served as a Director of the Hamilton Funds of the Bank of New York (2006-2007). |
Cornelia M. Small (66) |
| Year of Election or Appointment: 2005 Ms. Small is a member of the Board of Directors of the Teagle Foundation (2009-present). Ms. Small is also a member of the Investment Committee, and Chair (2008-present) and a member of the Board of Trustees of Smith College. In addition, Ms. Small serves on the Investment Committee of the Berkshire Taconic Community Foundation (2008-present). Previously, Ms. Small served as Chairperson of the Investment Committee (2002-2008) of Smith College. In addition, Ms. Small served as Chief Investment Officer, Director of Global Equity Investments, and a member of the Board of Directors of Scudder, Stevens & Clark and Scudder Kemper Investments. |
William S. Stavropoulos (71) |
| Year of Election or Appointment: 2001 Mr. Stavropoulos is Vice Chairman of the Independent Trustees of the Equity and High Income Funds (2006-present). Mr. Stavropoulos serves as President and Founder of the Michigan Baseball Foundation, the Great Lakes Loons (2007-present). Mr. Stavropoulos is Chairman Emeritus of the Board of Directors of The Dow Chemical Company, where he previously served in numerous senior management positions, including President, CEO (1995-2000; 2002-2004), Chairman of the Executive Committee (2000-2006), and as a member of the Board of Directors (1990-2006). Currently, Mr. Stavropoulos is Chairman of Univar (global distributor of commodity and specialty chemicals, 2010-present), a Director of Teradata Corporation (data warehousing and technology solutions, 2008-present), Chemical Financial Corporation, Maersk Inc. (industrial conglomerate), Tyco International, Inc. (multinational manufacturing and services, 2007-present), and a member of the Advisory Board for Metalmark Capital (private equity investment, 2005-present). Mr. Stavropoulos is a special advisor to Clayton, Dubilier & Rice, Inc. (private equity investment). In addition, Mr. Stavropoulos is a member of the University of Notre Dame Advisory Council for the College of Science. |
David M. Thomas (61) |
| Year of Election or Appointment: 2008 Previously, Mr. Thomas served as Executive Chairman (2005-2006) and Chairman and Chief Executive Officer (2000-2005) of IMS Health, Inc. (pharmaceutical and healthcare information solutions). In addition, Mr. Thomas serves as a member of the Board of Directors of Fortune Brands, Inc. (consumer products), and Interpublic Group of Companies, Inc. (marketing communication, 2004-present). |
Michael E. Wiley (60) |
| Year of Election or Appointment: 2008 Mr. Wiley also serves as a Director of Asia Pacific Exploration Consolidated (international oil and gas exploration and production, 2008-present). Mr. Wiley serves as a Director of Tesoro Corporation (independent oil refiner and marketer, 2005-present), and a Director of Bill Barrett Corporation (exploration and production, 2005-present). In addition, Mr. Wiley also serves as a Director of Post Oak Bank (privately-held bank, 2004-present). Previously, Mr. Wiley served as a member of the Board of Trustees of the University of Tulsa (2000-2006; 2007-2010), as a Senior Energy Advisor of Katzenbach Partners, LLC (consulting, 2006-2007), as an Advisory Director of Riverstone Holdings (private investment), Chairman, President, and CEO of Baker Hughes, Inc. (oilfield services, 2000-2004), and as Director of Spinnaker Exploration Company (exploration and production, 2001-2005). |
+ The information above includes each Trustee's principal occupation during the last five years and other information relating to the experience, attributes, and skills relevant to each Trustee's qualifications to serve as a Trustee, which led to the conclusion that each Trustee should serve as a Trustee for the fund.
Advisory Board Member and Executive Officers:
Correspondence intended for each executive officer and Peter S. Lynch may be sent to Fidelity Investments, 82 Devonshire Street, Boston, Massachusetts 02109.
Name, Age; Principal Occupation |
Peter S. Lynch (66) |
| Year of Election or Appointment: 2003 Member of the Advisory Board of Fidelity's Equity and High Income Funds. Mr. Lynch is Vice Chairman and a Director of FMR and FMR Co., Inc. In addition, Mr. Lynch serves as a Trustee of Boston College and as the Chairman of the Inner-City Scholarship Fund. Previously, Mr. Lynch served on the Special Olympics International Board of Directors (1997-2006). |
Kenneth B. Robins (41) |
| Year of Election or Appointment: 2008 President and Treasurer of Fidelity's Equity and High Income Funds. Mr. Robins also serves as President and Treasurer (2010-present) and Assistant Treasurer (2009-present) of other Fidelity funds and is an employee of Fidelity Investments (2004-present). Previously, Mr. Robins served as Deputy Treasurer of the Fidelity funds (2005-2008) and Treasurer and Chief Financial Officer of The North Carolina Capital Management Trust: Cash and Term Portfolios (2006-2008). |
Brian B. Hogan (46) |
| Year of Election or Appointment: 2009 Vice President of certain Equity Funds and Vice President of Sector Funds. Mr. Hogan also serves as President of FMR's Equity Division (2009-present). Previously, Mr. Hogan served as Senior Vice President, Equity Research of FMR (2006-2009) and as a portfolio manager. |
Christopher S. Bartel (38) |
| Year of Election or Appointment: 2009 Vice President of Fidelity's Sector and Real Estate Equity Funds. Mr. Bartel also serves as Senior Vice President of Equity Research (2009-present). Previously, Mr. Bartel served as Managing Director of Research (2006-2009) and an analyst and portfolio manager (2000-2006). |
Scott C. Goebel (42) |
| Year of Election or Appointment: 2008 Secretary and Chief Legal Officer (CLO) of the Fidelity funds. Mr. Goebel also serves as Secretary and CLO of The North Carolina Capital Management Trust: Cash and Term Portfolio (2008-present); General Counsel, Secretary, and Senior Vice President of FMR (2008-present) and FMR Co., Inc. (2008-present); Deputy General Counsel of FMR LLC; Chief Legal Officer of Fidelity Management & Research (Hong Kong) Limited (2008-present) and Assistant Secretary of Fidelity Management & Research (Japan) Inc. (2008-present), Fidelity Investments Money Management, Inc. (2008-present), Fidelity Management & Research (U.K.) Inc. (2008-present), and Fidelity Research and Analysis Company (2008-present). Previously, Mr. Goebel served as Assistant Secretary of the Funds (2007-2008) and as Vice President and Secretary of Fidelity Distributors Corporation (FDC) (2005-2007). |
William C. Coffey (41) |
| Year of Election or Appointment: 2009 Assistant Secretary of Fidelity's Equity and High Income Funds. Mr. Coffey also serves as Senior Vice President and Deputy General Counsel of FMR LLC (2010-present), and is an employee of Fidelity Investments. Previously, Mr. Coffey served as Vice President and Associate General Counsel of FMR LLC (2005-2009). |
Holly C. Laurent (56) |
| Year of Election or Appointment: 2008 Anti-Money Laundering (AML) Officer of the Fidelity funds. Ms. Laurent also serves as AML Officer of The North Carolina Capital Management Trust: Cash and Term Portfolio (2008-present) and is an employee of Fidelity Investments. Previously, Ms. Laurent was Senior Vice President and Head of Legal for Fidelity Business Services India Pvt. Ltd. (2006-2008), and Senior Vice President, Deputy General Counsel and Group Head for FMR LLC (2005-2006). |
Christine Reynolds (52) |
| Year of Election or Appointment: 2008 Chief Financial Officer of the Fidelity funds. Ms. Reynolds became President of Fidelity Pricing and Cash Management Services (FPCMS) in August 2008. Ms. Reynolds served as Chief Operating Officer of FPCMS (2007-2008). Previously, Ms. Reynolds served as President, Treasurer, and Anti-Money Laundering officer of the Fidelity funds (2004-2007). |
Kenneth A. Rathgeber (63) |
| Year of Election or Appointment: 2004 Chief Compliance Officer of Fidelity's Equity and High Income Funds. Mr. Rathgeber is Chief Compliance Officer of Fidelity Management & Research (Hong Kong) Limited (2008-present), Fidelity Management & Research (Japan) Inc. (2008-present), FMR (2005-present), FMR Co., Inc. (2005-present), Fidelity Management & Research (U.K.) Inc. (2005-present), Fidelity Research & Analysis Company (2005-present), Fidelity Investments Money Management, Inc. (2005-present), Pyramis Global Advisors, LLC (2005-present), and Strategic Advisers, Inc. (2005-present). |
Jeffrey S. Christian (49) |
| Year of Election or Appointment: 2009 Deputy Treasurer of the Fidelity funds. Mr. Christian is an employee of Fidelity Investments. Previously, Mr. Christian served as Chief Financial Officer (2008-2009) of certain Fidelity funds and Senior Vice President of Fidelity Pricing and Cash Management Services (FPCMS) (2004-2009). |
Bryan A. Mehrmann (49) |
| Year of Election or Appointment: 2005 Deputy Treasurer of the Fidelity funds. Mr. Mehrmann is an employee of Fidelity Investments. |
Adrien E. Deberghes (43) |
| Year of Election or Appointment: 2008 Deputy Treasurer of Fidelity's Equity and High Income Funds. Mr. Deberghes also serves as Assistant Treasurer of other Fidelity funds (2010-present) and is an employee of Fidelity Investments (2008-present). Previously, Mr. Deberghes served as Senior Vice President of Mutual Fund Administration at State Street Corporation (2007-2008), Senior Director of Mutual Fund Administration at Investors Bank & Trust (2005-2007), and Director of Finance for Dunkin' Brands (2000-2005). |
Stephanie J. Dorsey (41) |
| Year of Election or Appointment: 2010 Assistant Treasurer of Fidelity's Equity and High Income Funds. Ms. Dorsey also serves as Deputy Treasurer of other Fidelity funds (2008-present) and is an employee of Fidelity Investments (2008-present). Previously, Ms. Dorsey served as Treasurer (2004-2008) of the JPMorgan Mutual Funds and Vice President (2004-2008) of JPMorgan Chase Bank. |
John R. Hebble (52) |
| Year of Election or Appointment: 2009 Assistant Treasurer of Fidelity's Equity and High Income Funds. Mr. Hebble also serves as Treasurer and Chief Financial Officer of The North Carolina Capital Management Trust: Cash and Term Portfolio (2008-present), President and Treasurer of other Fidelity funds (2008-present) and is an employee of Fidelity Investments. |
Gary W. Ryan (52) |
| Year of Election or Appointment: 2005 Assistant Treasurer of the Fidelity funds. Mr. Ryan is an employee of Fidelity Investments. Previously, Mr. Ryan served as Vice President of Fund Reporting in Fidelity Pricing and Cash Management Services (FPCMS) (1999-2005). |
Jonathan Davis (42) |
| Year of Election or Appointment: 2010 Assistant Treasurer of the Fidelity funds. Mr. Davis is an employee of Fidelity Investments. Previously, Mr. Davis served as Vice President and Associate General Counsel of FMR LLC (2003-2010). |
Annual Report
The Board of Trustees of Fidelity Global Commodity Stock Fund voted to pay to shareholders of record at the opening of business on record date, the following distributions per share derived from capital gains realized from sales of portfolio securities, and dividends derived from net investment income:
| Pay Date | Record Date | Dividends | Capital Gains |
Institutional Class | 12/13/10 | 12/10/10 | $0.137 | $0.062 |
The fund hereby designates as a capital gain dividend with respect to the taxable year ended October 31, 2010, $1,911,902, or, if subsequently determined to be different, the net capital gain of such year.
Institutional Class designates 11% of the dividends distributed during the fiscal year as qualifying for the dividends-received deduction for corporate shareholders.
Institutional Class designates 56% of the dividends distributed during the fiscal year as amounts which may be taken into account as a dividend for the purposes of the maximum rate under section 1(h)(11) of the Internal Revenue Code.
The amounts per share which represent income derived from sources within, and taxes paid to, foreign countries or possessions of the United States are as follows:
| Pay Date | Income | Taxes |
Institutional Class | 12/14/09 | $0.008 | $0.0027 |
The fund will notify shareholders in January 2011 of amounts for use in preparing 2010 income tax returns.
Annual Report
Board Approval of Investment Advisory Contracts and Management Fees
Fidelity Global Commodity Stock Fund
Each year, the Board of Trustees, including the Independent Trustees (together, the Board), votes on the renewal of the management contract and sub-advisory agreements (together, the Advisory Contracts) for the fund. The Board, assisted by the advice of fund counsel and Independent Trustees' counsel, requests and considers a broad range of information relevant to the renewal of the Advisory Contracts throughout the year.
The Board meets regularly and considers at each of its meetings factors that are relevant to its annual consideration of the renewal of the fund's Advisory Contracts, including the services and support provided to the fund and its shareholders. The Board has established various standing committees, each composed of Independent Trustees with varying backgrounds, to which the Board has assigned specific subject matter responsibilities in order to enhance effective decision-making by the Board. The Board, acting directly and through its Committees, requests and receives information concerning the annual consideration of the renewal of the fund's Advisory Contracts. The Board also meets as needed to consider matters specifically related to the Board's annual consideration of the renewal of Advisory Contracts. Members of the Board may also meet with trustees of other Fidelity funds through ad hoc joint committees to discuss certain matters relevant to the Fidelity funds.
At its July 2010 meeting, the Board of Trustees, including the Independent Trustees, unanimously determined to renew the fund's Advisory Contracts. In reaching its determination, the Board considered all factors it believed relevant, including (i) the nature, extent, and quality of the services to be provided to the fund and its shareholders (including the investment performance of the fund); (ii) the competitiveness of the fund's management fee and total expenses; (iii) the total costs of the services to be provided by and the profits to be realized by Fidelity from its relationship with the fund; (iv) the extent to which economies of scale would be realized as the fund grows; and (v) whether fee levels reflect these economies of scale, if any, for the benefit of fund shareholders.
In considering whether to renew the Advisory Contracts for the fund, the Board reached a determination, with the assistance of fund counsel and Independent Trustees' counsel and through the exercise of its business judgment, that the renewal of the Advisory Contracts is in the best interests of fund shareholders and that the compensation to be received by Fidelity under the management contract is fair and reasonable. The Board's decision to renew the Advisory Contracts was not based on any single factor noted above, but rather was based on a comprehensive consideration of all the information provided to the Board at its meetings throughout the year. The Board, in reaching its determination to renew the Advisory Contracts, is aware that shareholders in the fund have a broad range of investment choices available to them, including a wide choice among mutual funds offered by Fidelity's competitors, and that the fund's shareholders, with the opportunity to review and weigh the disclosure provided by the fund in its prospectus and other public disclosures, have chosen to invest in this fund, managed by Fidelity.
Annual Report
Board Approval of Investment Advisory Contracts and
Management Fees - continued
Nature, Extent, and Quality of Services Provided. The Board considered the staffing within the investment adviser, FMR, and the sub-advisers (together, the Investment Advisers), including the backgrounds of the fund's investment personnel and the fund's investment objective and discipline. The Independent Trustees also had discussions with senior management of Fidelity's investment operations and investment groups. The Board considered the structure of the portfolio manager compensation program and whether this structure provides appropriate incentives to act in the best interest of the fund.
Resources Dedicated to Investment Management and Support Services. The Board and the equity research subcommittee of the Board's Fund Oversight Committee reviewed the size, education, and experience of the Investment Advisers' investment staff, their use of technology, and the Investment Advisers' approach to recruiting, training, and retaining portfolio managers and other research, advisory, and management personnel. The Board noted that Fidelity's analysts have access to a variety of technological tools and market and securities data that enable them to perform both fundamental and quantitative analysis and to specialize in various disciplines. The Board considered Fidelity's extensive global research capabilities that enable the Investment Advisers to aggregate data from various sources in an effort to produce positive investment results. The Board also considered that Fidelity's portfolio managers and analysts have access to daily portfolio attribution that allows for monitoring of a fund's portfolio, as well as an electronic communication system that provides immediate real-time access to research concerning issuers and credit enhancers. The Board noted FMR's continued focus on strengthening the organization and discipline of equity portfolio management and research.
Shareholder and Administrative Services. The Board considered (i) the nature, extent, quality, and cost of advisory, administrative, and shareholder services performed by the Investment Advisers and their affiliates under the Advisory Contracts and under separate agreements covering transfer agency, pricing and bookkeeping, and securities lending services for the fund; (ii) the nature and extent of the investment adviser's supervision of third party service providers, principally custodians and subcustodians; and (iii) the resources devoted to, and the record of compliance with, the fund's compliance policies and procedures. The Board also reviewed the allocation of fund brokerage, including allocations to brokers affiliated with the Investment Advisers, the use of brokerage commissions to pay fund expenses, and the use of "soft" commission dollars to pay for research services.
The Board noted that the growth of fund assets over time across the complex allows Fidelity to reinvest in the development of services designed to enhance the value or convenience of the Fidelity funds as investment vehicles. These services include 24-hour access to account information and market information through phone representatives and over the Internet, and investor education materials and asset allocation tools.
Annual Report
Investment in a Large Fund Family. The Board considered the benefits to shareholders of investing in a Fidelity fund, including the benefits of investing in a fund that is part of a large family of funds offering a variety of investment disciplines and providing a large variety of mutual fund investor services. The Board noted that Fidelity had taken, or had made recommendations that resulted in the Fidelity funds taking, a number of actions over the previous year that benefited particular funds, including (i) dedicating additional resources to investment research and restructuring and broadening the focus of the investment research teams; (ii) bolstering the senior management team that oversees asset management; (iii) launching Class F of certain funds as a lower-fee class available to Freedom K and Freedom Index Funds; (iv) lowering the initial investment minimums and ongoing balance requirements for Real Estate High Income Fund; (v) eliminating subsequent purchase minimums for all funds and adding a waiver of the investment minimum requirement for new accounts opened with the proceeds of a systematic withdrawal plan; (vi) eliminating the withdrawal minimum and maximum limits for systematic withdrawals from Advisor funds; (vii) expanding sales load waivers on Class A shares for Destiny Planholders and expanding Institutional Class eligibility for Class O Destiny Planholders; and (viii) changing certain Class A and Class T sales charge structures to further align them with industry practices.
Investment Performance. The Board considered whether the fund has operated in accordance with its investment objective, as well as its record of compliance with its investment restrictions. The Board noted that it is not possible to evaluate performance in any comprehensive fashion because the fund had been in operation for less than one calendar year. Once the fund has been in operation for at least one calendar year, the Board will review the fund's absolute investment performance for each class, as well as the fund's relative investment performance for each class measured against a broad-based securities market index and, if a meaningful peer group exists, a peer group of mutual funds.
Based on its review, and giving particular weight to the nature and quality of the resources dedicated by the Investment Advisers to maintain and improve relative performance and factoring in the unprecedented market events in recent years, the Board concluded that the nature, extent, and quality of investment management and support services and of shareholder and administrative services provided to the fund will benefit the fund's shareholders, particularly in light of the Board's view that the fund's shareholders benefit from investing in a fund that is part of a large family of funds offering a variety of investment disciplines and services.
Annual Report
Board Approval of Investment Advisory Contracts and
Management Fees - continued
Competitiveness of Management Fee and Total Fund Expenses. The Board considered the fund's management fee and total expenses compared to "mapped groups" of competitive funds and classes. Fidelity creates "mapped groups" by combining similar Lipper investment objective categories that have comparable management fee characteristics. Combining Lipper investment objective categories aids the Board's management fee and total expense comparisons by broadening the competitive group used for comparison and by reducing the number of universes to which various Fidelity funds are compared.
Management Fee. The Board considered two proprietary management fee comparisons for the period of the fund's operations shown in the chart below. The group of Lipper funds used by the Board for management fee comparisons is referred to below as the "Total Mapped Group." The Total Mapped Group comparison focuses on a fund's standing relative to the total universe of comparable funds available to investors, in terms of gross management fees before expense reimbursements or caps. "TMG %" represents the percentage of funds in the Total Mapped Group that had management fees that were lower than the fund's. For example, a TMG % of 29% means that 71% of the funds in the Total Mapped Group had higher management fees than the fund. The "Asset-Size Peer Group" (ASPG) comparison focuses on a fund's standing relative to non-Fidelity funds similar in size to the fund within the Total Mapped Group. The ASPG represents at least 15% of the funds in the Total Mapped Group with comparable asset size and management fee characteristics, subject to a minimum of 50 funds (or all funds in the Total Mapped Group if fewer than 50). Additional information, such as the ASPG quartile in which the fund's management fee ranked, is also included in the chart and considered by the Board.
Fidelity Global Commodity Stock Fund

Annual Report
The Board noted that the fund's management fee ranked below the median of its Total Mapped Group and below the median of its ASPG for the period.
Based on its review, the Board concluded that the fund's management fee is fair and reasonable in light of the services that the fund receives and the other factors considered.
Total Expenses. In its review of each class's total expenses, the Board considered the fund's management fee as well as other fund or class expenses, as applicable, such as transfer agent fees, pricing and bookkeeping fees, fund-paid 12b-1 fees, and custodial, legal, and audit fees. The Board also noted the effects of any waivers and reimbursements on fees and expenses. As part of its review, the Board also considered current and historical total expenses of each class of the fund compared to competitive fund median expenses. Each class of the fund is compared to those funds and classes in the Total Mapped Group (used by the Board for management fee comparisons) that have a similar sales load structure.
The Board noted that the total expenses of the retail class ranked below its competitive median for the period and the total expenses of each of Class A, Class T, Class B, Class C, and Institutional Class ranked above its competitive median for the period. The Board considered that total expenses for Class T were above median primarily because its 12b-1 fee is higher than the typical front-end load class. The Board noted that the fund offers multiple classes, each of which has a different sales load and 12b-1 fee structure, and that the multiple structures are intended to offer a range of pricing options for the intermediary market. The Board also noted that the total expenses of the classes vary primarily by the level of their 12b-1 fees, although differences in transfer agent fees may also cause expenses to vary from class to class.
Fees Charged to Other Fidelity Clients. The Board also considered Fidelity fee structures and other information with respect to clients of FMR and its affiliates, such as other mutual funds advised or subadvised by FMR or its affiliates, pension plan clients, and other institutional clients. In March 2010, the Board created an ad hoc joint committee with the board of other Fidelity funds (the Committee) to review and compare Fidelity's institutional investment advisory business with its business of providing services to the Fidelity funds, including the differences in services provided, fees charged, and costs incurred, as well as competition in their respective marketplaces.
Based on its review of total expenses and fees charged to other Fidelity clients, the Board concluded that the total expenses of each class of the fund were reasonable, although in some cases above the median of the universe presented for comparison, in light of the services that the fund and its shareholders receive and the other factors considered, including the findings of the Committee.
Annual Report
Board Approval of Investment Advisory Contracts and
Management Fees - continued
Costs of the Services and Profitability. The Board considered the revenues earned and the expenses incurred by Fidelity in conducting the business of developing, marketing, distributing, managing, administering and servicing the fund and its shareholders. The Board also considered the level of Fidelity's profits in respect of all the Fidelity funds.
On an annual basis, FMR presents to the Board Fidelity's profitability for the fund. Fidelity calculates the profitability for each fund, as well as aggregate profitability for groups of Fidelity funds and all Fidelity funds, using a series of detailed revenue and cost allocation methodologies which originate with the audited books and records of Fidelity. The Audit Committee of the Board reviews any significant changes from the prior year's methodologies.
PricewaterhouseCoopers LLP (PwC), independent registered public accounting firm and auditor to Fidelity and certain Fidelity funds, has been engaged annually by the Board as part of the Board's assessment of Fidelity's profitability analysis. PwC's engagement includes the review and assessment of Fidelity's methodologies used in determining the revenues and expenses attributable to Fidelity's mutual fund business, and completion of agreed-upon procedures surrounding the mathematical accuracy of fund profitability and its conformity to allocation methodologies. After considering PwC's reports issued under the engagement and information provided by Fidelity, the Board believes that while other allocation methods may also be reasonable, Fidelity's profitability methodologies are reasonable in all material respects.
The Board has also reviewed Fidelity's non-fund businesses and fall-out benefits related to the mutual fund business as well as cases where Fidelity's affiliates may benefit from or be related to the fund's business.
The Board considered the costs of the services provided by and the profits realized by Fidelity in connection with the operation of the fund and were satisfied that the profitability was not excessive in the circumstances.
Economies of Scale. The Board considered whether there have been economies of scale in respect of the management of the Fidelity funds, whether the Fidelity funds (including the fund) have appropriately benefited from any such economies of scale, and whether there is potential for realization of any further economies of scale. The Board considered the extent to which the fund will benefit from economies of scale through increased services to the fund, through waivers or reimbursements, or through fee or expense reductions.
In February 2009, the Board and the board of other Fidelity funds created an ad hoc committee (the Economies of Scale Committee) to analyze whether FMR attains economies of scale in respect of the management and servicing of the Fidelity funds, whether the Fidelity funds have appropriately benefited from such economies of scale, and whether there is potential for realization of any further economies of scale.
Annual Report
The Board recognized that the fund's management contract incorporates a "group fee" structure, which provides for lower group fee rates as total fund assets under FMR's management increase, and for higher group fee rates as total fund assets under FMR's management decrease. FMR calculates the group fee rates based on a tiered asset "breakpoint" schedule that varies based on asset class. The Board considered that the group fee is designed to deliver the benefits of economies of scale to fund shareholders when total Fidelity fund assets increase, even if assets of any particular fund are unchanged or have declined, because some portion of Fidelity's costs are attributable to services provided to all Fidelity funds, and all funds benefit if those costs can be allocated among more assets. The Board concluded that, given the group fee structure, fund shareholders will benefit from lower management fees as assets under FMR's management increase at the fund complex level, regardless of whether Fidelity achieves any such economies of scale.
The Board concluded, considering the findings of the Economies of Scale Committee, that any potential economies of scale are being appropriately shared between fund shareholders and Fidelity.
Additional Information Requested by the Board. In order to develop fully the factual basis for consideration of the Fidelity funds' Advisory Contracts, the Board requested and received additional information on certain topics, including (i) fund performance trends, actions to be taken by FMR to improve certain funds' overall performance, and Fidelity's long-term strategies for certain funds; (ii) portfolio manager changes that have occurred during the past year and length of portfolio manager tenure for different categories of funds over time; (iii) Fidelity's compensation structure for portfolio managers, research analysts, and other key personnel, the rationale for the compensation structure, and how the compensation structure provides appropriate performance incentives; (iv) the amount of the investment that each portfolio manager has made in the Fidelity fund(s) that he or she manages; (v) management and other fees paid by FMR to affiliated sub-advisers on behalf of the Fidelity funds; (vi) Fidelity's fee structures and rationale for recommending different fees among different categories of funds; (vii) Fidelity's rationale for recommending which funds should have a performance adjustment component as part of their management fees; (viii) the rationale for any differences between fund fee structures and fee structures in place for other Fidelity clients; and (ix) explanations regarding the relative total expenses borne by certain funds and classes, total expense competitive trends, and actions that might be taken by FMR to reduce total expenses for certain funds and classes.
Based on its evaluation of all of the conclusions noted above, and after considering all factors it believed relevant, the Board ultimately concluded that the advisory fee structures are fair and reasonable, and that the fund's Advisory Contracts should be renewed.
Annual Report
Investment Adviser
Fidelity Management & Research Company
Boston, MA
Investment Sub-Advisers
FMR Co., Inc.
Fidelity Management & Research
(U.K.) Inc.
Fidelity Research & Analysis Company
FIL Investment Advisors
FIL Investments (Japan) Limited
FIL Investment Advisors
(U.K.) Limited
Fidelity Management & Research
(Hong Kong) Limited
Fidelity Management & Research
(Japan) Inc.
General Distributor
Fidelity Distributors Corporation
Boston, MA
Transfer and Service Agents
Fidelity Investments Institutional
Operations Company, Inc.
Boston, MA
Fidelity Service Company, Inc.
Boston, MA
Custodian
State Street Bank and Trust Company
Quincy, MA
AGCSI-UANN-1210
1.879388.101
Fidelity®
International Discovery
Fund
Annual Report
October 31, 2010
(2_fidelity_logos) (Registered_Trademark)
Contents
Chairman's Message | <Click Here> | The Chairman's message to shareholders. |
Performance | <Click Here> | How the fund has done over time. |
Management's Discussion of Fund Performance | <Click Here> | The Portfolio Manager's review of fund performance and strategy. |
Shareholder Expense Example | <Click Here> | An example of shareholder expenses. |
Investment Changes | <Click Here> | A summary of major shifts in the fund's investments over the past six months. |
Investments | <Click Here> | A complete list of the fund's investments with their market values. |
Financial Statements | <Click Here> | Statements of assets and liabilities, operations, and changes in net assets, as well as financial highlights. |
Notes | <Click Here> | Notes to the financial statements. |
Report of Independent Registered Public Accounting Firm | <Click Here> | |
Trustees and Officers | <Click Here> | |
Distributions | <Click Here> | |
Board Approval of Investment Advisory Contracts and Management Fees | <Click Here> | |
To view a fund's proxy voting guidelines and proxy voting record for the 12-month period ended June 30, visit http://www.fidelity.com/proxyvotingresults or visit the Securities and Exchange Commission's (SEC) web site at http://www.sec.gov. You may also call 1-800-544-8544 to request a free copy of the proxy voting guidelines.
Standard & Poor's, S&P and S&P 500 are registered service marks of The McGraw-Hill Companies, Inc. and have been licensed for use by Fidelity Distributors Corporation.
Other third party marks appearing herein are the property of their respective owners.
All other marks appearing herein are registered or unregistered trademarks or service marks of FMR LLC or an affiliated company.
Annual Report
This report and the financial statements contained herein are submitted for the general information of the shareholders of the fund. This report is not authorized for distribution to prospective investors in the fund unless preceded or accompanied by an effective prospectus.
A fund files its complete schedule of portfolio holdings with the SEC for the first and third quarters of each fiscal year on Form N-Q. Forms N-Q are available on the SEC's web site at http://www.sec.gov. A fund's Forms N-Q may be reviewed and copied at the SEC's Public Reference Room in Washington, DC. Information regarding the operation of the SEC's Public Reference Room may be obtained by calling 1-800-SEC-0330. For a complete list of a fund's portfolio holdings, view the most recent holdings listing, semiannual report, or annual report on Fidelity's web site at http://www.fidelity.com or http://www.advisor.fidelity.com, as applicable.
NOT FDIC INSURED • MAY LOSE VALUE • NO BANK GUARANTEE
Neither the fund nor Fidelity Distributors Corporation is a bank.
Annual Report
(photo_of_Edward_C_Johnson_3d)
Dear Shareholder:
Equities have staged a rally in the second half of 2010, shaking off concerns about the European debt crisis and the possibility of a double-dip recession in the U.S. Although the short-term surge pushed major equity indexes back into positive territory for the year, several questions remain about the longer-term outlook, including lackluster economic growth and persistently high unemployment. Financial markets are always unpredictable, of course, but there also are several time-tested investment principles that can help put the odds in your favor.
One of the basic tenets is to invest for the long term. Over time, riding out the markets' inevitable ups and downs has proven much more effective than selling into panic or chasing the hottest trend. Even missing only a few of the markets' best days can significantly diminish investor returns. Patience also affords the benefits of compounding - of earning interest on additional income or reinvested dividends and capital gains. There can be tax advantages and cost benefits to consider as well. While staying the course doesn't eliminate risk, it can considerably lessen the effect of short-term declines.
You can further manage your investing risk through diversification. And today, more than ever, geographic diversification should be taken into account. Studies indicate that asset allocation is the single most important determinant of a portfolio's long-term success. The right mix of stocks, bonds and cash - aligned to your particular risk tolerance and investment objective - is very important. Age-appropriate rebalancing is also an essential aspect of asset allocation. For younger investors, an emphasis on equities - which historically have been the best-performing asset class over time - is encouraged. As investors near their specific goal, such as retirement or sending a child to college, consideration may be given to replacing volatile assets (e.g. common stocks) with more-stable fixed investments (bonds or savings plans).
A third principle - investing regularly - can help lower the average cost of your purchases. Investing a certain amount of money each month or quarter helps ensure you won't pay for all your shares at market highs. This strategy - known as dollar cost averaging - also reduces "emotion" from investing, helping shareholders avoid selling weak performers just prior to an upswing, or chasing a hot performer just before a correction.
We invite you to contact us via the Internet, through our Investor Centers or by phone. It is our privilege to provide you the information you need to make the investments that are right for you.
Sincerely,
(The chairman's signature appears here.)
Edward C. Johnson 3d
Annual Report
Average annual total return reflects the change in the value of an investment, assuming reinvestment of the class' distributions from dividend income and capital gains (the profits earned upon the sale of securities that have grown in value, if any) and assuming a constant rate of performance each year. The $10,000 table and the fund's returns do not reflect the deduction of taxes that a shareholder would pay on fund distributions or the redemption of fund shares. During periods of reimbursement by Fidelity, a fund's total return will be greater than it would be had the reimbursement not occurred. How a fund did yesterday is no guarantee of how it will do tomorrow.
Average Annual Total Returns
Periods ended October 31, 2010 | Past 1
year | Past 5
years | Past 10
years |
Fidelity® International Discovery Fund A | 13.76% | 4.48% | 5.23% |
A Prior to October 1, 2004, Fidelity International Discovery Fund operated under certain different investment policies. The fund's historical performance may not represent its current investment policies.
$10,000 Over 10 Years
Let's say hypothetically that $10,000 was invested in Fidelity® International Discovery Fund, a class of the fund, on October 31, 2000. The chart shows how the value of your investment would have changed, and also shows how the MSCI® EAFE ® (Europe, Australasia, Far East) Index performed over the same period.
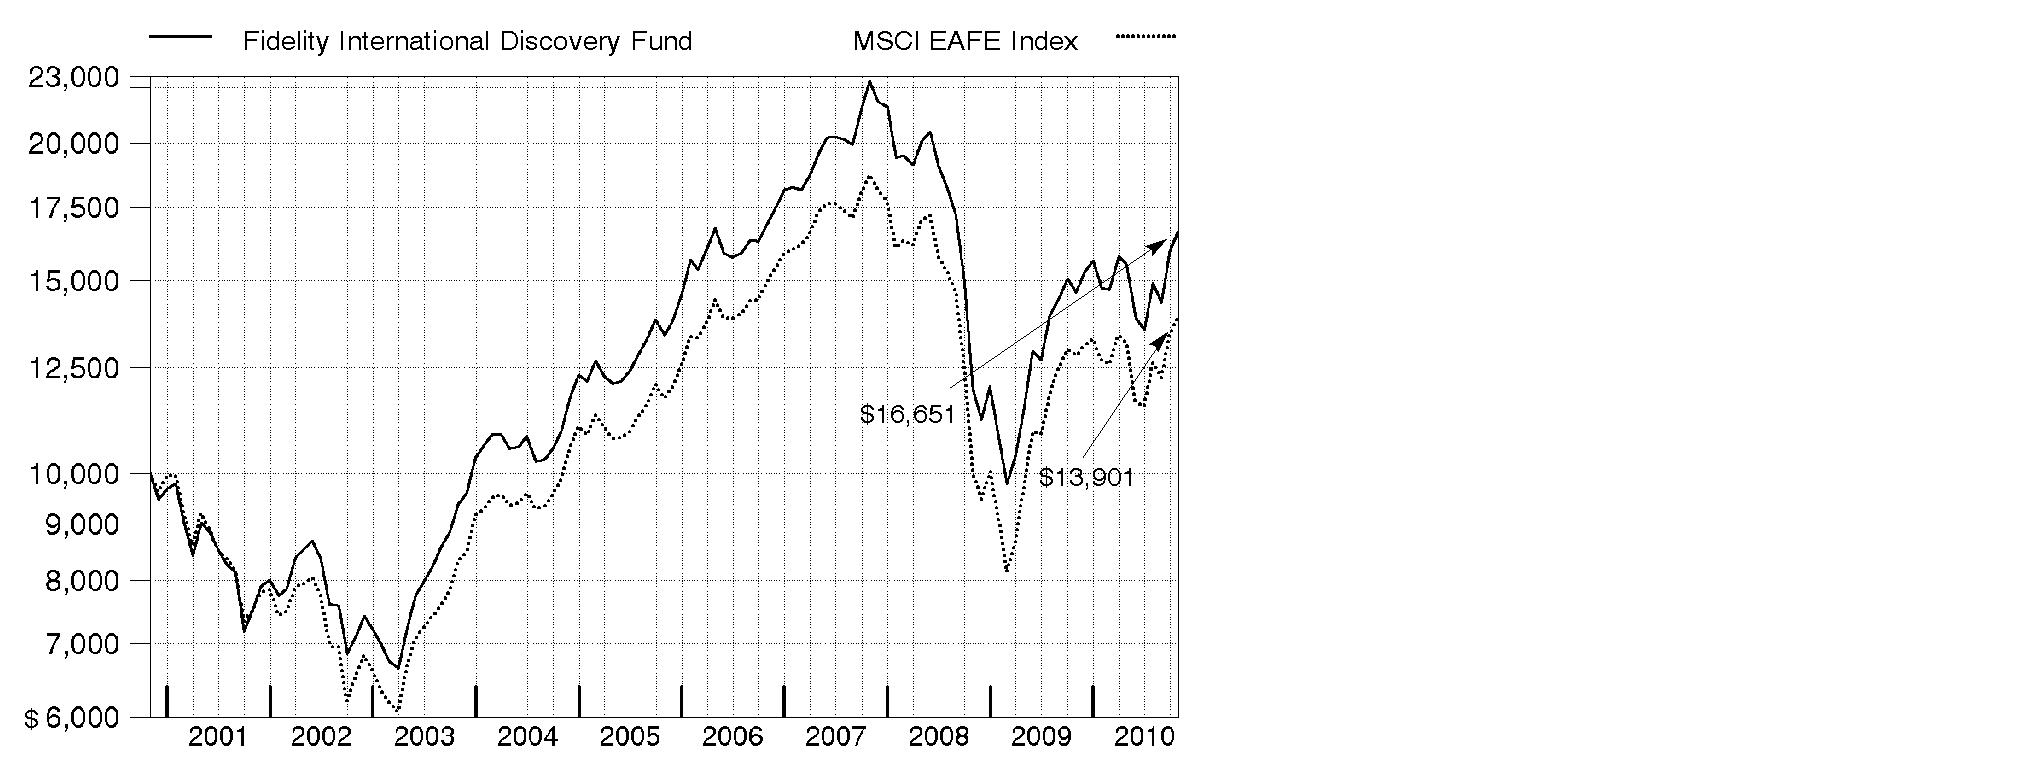
Annual Report
Market Recap: International stocks rode a wave of volatility similar to that of their U.S. counterparts during the 12 months ending October 31, 2010. Stocks gained modestly in the first half of the period, despite growing concerns about the European debt crisis. Sentiment turned decidedly negative in May and June, however, and the market suffered a precipitous decline. These losses were more than offset during the last four months of the period, when signs of economic growth and subsiding debt fears helped propel international stocks about 21%. For the full year, the MSCI® ACWI® (All Country World Index) ex USA Index gained 12.76%, boosted in part by a generally depreciating U.S. dollar. Within the index, Canada and emerging markets were standouts, returning 23% and 24%, respectively. Results in the latter group were led by strong-performing India, Mexico and South Africa, while China fell short of the MSCI benchmark due to cooling economic growth. The developed Asia ex Japan segment rose 16% for the period, lifted by solid results from Singapore and Hong Kong. Meanwhile, Europe rose just 9%, held back mainly by debt-riddled Spain and Italy, as well as lagging major constituent France. Japan returned only 5%, a result of that nation's continued weak economy.
Comments from William Kennedy, Portfolio Manager of Fidelity® International Discovery Fund: For the 12 months ending October 31, 2010, the fund's Retail Class shares returned 13.76%, beating the 8.49% return of the MSCI EAFE® (Europe, Australasia, Far East) Index. Stock selection drove relative performance, with particularly strong gains coming from investments in emerging markets, as well as the consumer discretionary, information technology, health care and industrials sectors. Top contributors included Elekta, a Swedish manufacturer of radiation-therapy equipment that benefited from successful product launches and an increase in capital spending by hospitals, and SSL International, a U.K. health care company that received a handsome buyout offer. I sold SSL. In consumer discretionary - which increased as a percentage of fund assets - strong gains at Carphone Warehouse Group, a U.K. cell phone retailer, were fueled in part by an expanding partnership with big-box electronics retailer Best Buy. All three holdings were out-of-index positions. Detractors were minimal, with underweightings in consumer staples and materials just nicking results. Stock disappointments included HeidelbergCement, a German cement company whose U.S. business was hurt by the weak housing market, and Swiss investment bank UBS, whose revenue slowed more than expected.
The views expressed above reflect those of the portfolio manager(s) only through the end of the period as stated on the cover of this report and do not necessarily represent the views of Fidelity or any other person in the Fidelity organization. Any such views are subject to change at any time based upon market or other conditions and Fidelity disclaims any responsibility to update such views. These views may not be relied on as investment advice and, because investment decisions for a Fidelity fund are based on numerous factors, may not be relied on as an indication of trading intent on behalf of any Fidelity fund.
Annual Report
Shareholder Expense Example
As a shareholder of the Fund, you incur two types of costs: (1) transaction costs, including sales charges (loads) on purchase payments or redemption proceeds, redemption fees, and (2) ongoing costs, including management fees, distribution and/or service (12b-1) fees and other Fund expenses. This Example is intended to help you understand your ongoing costs (in dollars) of investing in the Fund and to compare these costs with the ongoing costs of investing in other mutual funds.
The Example is based on an investment of $1,000 invested at the beginning of the period and held for the entire period (May 1, 2010 to October 31, 2010).
Actual Expenses
The first line of the accompanying table for each class of the Fund provides information about actual account values and actual expenses. You may use the information in this line, together with the amount you invested, to estimate the expenses that you paid over the period. Simply divide your account value by $1,000.00 (for example, an $8,600 account value divided by $1,000.00 = 8.6), then multiply the result by the number in the first line for a class of the Fund under the heading entitled "Expenses Paid During Period" to estimate the expenses you paid on your account during this period. A small balance maintenance fee of $12.00 that is charged once a year may apply for certain accounts with a value of less than $2,000. This fee is not included in the table below. If it was, the estimate of expenses you paid during the period would be higher, and your ending account value lower, by this amount. In addition, the Fund, as a shareholder in the underlying Fidelity Central Funds, will indirectly bear its pro-rata share of the fees and expenses incurred by the underlying Fidelity Central Funds. These fees and expenses are not included in the Fund's annualized expense ratio used to calculate the expense estimate in the table below.
Hypothetical Example for Comparison Purposes
The second line of the accompanying table for each class of the Fund provides information about hypothetical account values and hypothetical expenses based on a Class' actual expense ratio and an assumed rate of return of 5% per year before expenses, which is not the Class' actual return. The hypothetical account values and expenses may not be used to estimate the actual ending account balance or expenses you paid for the period. You may use this information to compare the ongoing costs of investing in the Fund and other funds. To do so, compare this 5% hypothetical example with the 5% hypothetical examples that appear in the shareholder reports of the other funds. A small balance maintenance fee of $12.00 that is charged once a year may apply for certain accounts with a value of less than $2,000. This fee is not included in the table below. If it was, the estimate of expenses you paid during the period would be higher, and your ending account value lower, by this amount. In addition, the Fund, as a shareholder in the underlying Fidelity Central Funds, will indirectly bear its pro-rata share of the fees and expenses incurred by the underlying Fidelity Central Funds. These fees and expenses are not included in the Fund's annualized expense ratio used to calculate the expense estimate in the table below.
Annual Report
Please note that the expenses shown in the table are meant to highlight your ongoing costs only and do not reflect any transaction costs. Therefore, the second line of the table is useful in comparing ongoing costs only, and will not help you determine the relative total costs of owning different funds. In addition, if these transactional costs were included, your costs would have been higher.
| Annualized
Expense Ratio | Beginning
Account Value
May 1, 2010 | Ending
Account Value
October 31, 2010 | Expenses Paid
During Period*
May 1, 2009 to October 31, 2010 |
Class A | 1.32% | | | |
Actual | | $ 1,000.00 | $ 1,071.90 | $ 6.89 |
Hypothetical A | | $ 1,000.00 | $ 1,018.55 | $ 6.72 |
Class T | 1.57% | | | |
Actual | | $ 1,000.00 | $ 1,070.70 | $ 8.19 |
Hypothetical A | | $ 1,000.00 | $ 1,017.29 | $ 7.98 |
Class B | 2.08% | | | |
Actual | | $ 1,000.00 | $ 1,067.90 | $ 10.84 |
Hypothetical A | | $ 1,000.00 | $ 1,014.72 | $ 10.56 |
Class C | 2.07% | | | |
Actual | | $ 1,000.00 | $ 1,067.70 | $ 10.79 |
Hypothetical A | | $ 1,000.00 | $ 1,014.77 | $ 10.51 |
International Discovery | 1.02% | | | |
Actual | | $ 1,000.00 | $ 1,073.70 | $ 5.33 |
Hypothetical A | | $ 1,000.00 | $ 1,020.06 | $ 5.19 |
Class K | .82% | | | |
Actual | | $ 1,000.00 | $ 1,074.80 | $ 4.29 |
Hypothetical A | | $ 1,000.00 | $ 1,021.07 | $ 4.18 |
Institutional Class | .97% | | | |
Actual | | $ 1,000.00 | $ 1,074.10 | $ 5.07 |
Hypothetical A | | $ 1,000.00 | $ 1,020.32 | $ 4.94 |
A 5% return per year before expenses
*Expenses are equal to each Class' annualized expense ratio, multiplied by the average account value over the period, multiplied by 184/365 (to reflect the one-half year period).
Annual Report
Investment Changes (Unaudited)
Geographic Diversification (% of fund's net assets) |
As of October 31, 2010 |
| United Kingdom 20.9% | |
| Japan 12.1% | |
| France 8.8% | |
| Switzerland 7.0% | |
| Germany 6.6% | |
| United States of America 4.3% | |
| Spain 3.8% | |
| Denmark 3.3% | |
| Australia 3.0% | |
| Other 30.2% | |

Percentages are adjusted for the effect of futures contracts, if applicable. |
As of April 30, 2010 |
| United Kingdom 20.0% | |
| Japan 18.7% | |
| France 9.6% | |
| Switzerland 7.2% | |
| Germany 6.7% | |
| Netherlands 3.8% | |
| Australia 3.0% | |
| Spain 3.0% | |
| United States of America 2.3% | |
| Other 25.7% | |

Percentages are adjusted for the effect of futures contracts, if applicable. |
Asset Allocation (% of fund's net assets) |
| As of
October 31, 2010 | As of
April 30, 2010 |
Stocks | 98.6 | 99.3 |
Short-Term Investments and Net Other Assets | 1.4 | 0.7 |
Top Ten Stocks as of October 31, 2010 |
| % of fund's
net assets | % of fund's net assets
6 months ago |
BHP Billiton PLC (United Kingdom, Metals & Mining) | 1.9 | 1.3 |
Royal Dutch Shell PLC Class B (United Kingdom, Oil, Gas & Consumable Fuels) | 1.9 | 2.0 |
BP PLC (United Kingdom, Oil, Gas & Consumable Fuels) | 1.6 | 1.2 |
Nestle SA (Switzerland, Food Products) | 1.6 | 1.4 |
Novartis AG (Switzerland, Pharmaceuticals) | 1.5 | 1.2 |
Novo Nordisk AS Series B (Denmark, Pharmaceuticals) | 1.4 | 0.9 |
HSBC Holdings PLC (United Kingdom) (United Kingdom, Commercial Banks) | 1.3 | 1.9 |
Bayerische Motoren Werke AG (BMW) (Germany, Automobiles) | 1.3 | 0.9 |
SOFTBANK CORP. (Japan, Wireless Telecommunication Services) | 1.3 | 0.8 |
LVMH Moet Hennessy - Louis Vuitton (France, Textiles, Apparel & Luxury Goods) | 1.2 | 0.6 |
| 15.0 | |
Market Sectors as of October 31, 2010 |
| % of fund's
net assets | % of fund's net assets
6 months ago |
Financials | 22.0 | 21.6 |
Consumer Discretionary | 20.8 | 15.7 |
Industrials | 9.5 | 11.0 |
Materials | 9.3 | 9.6 |
Health Care | 9.1 | 9.1 |
Consumer Staples | 8.6 | 7.8 |
Energy | 6.4 | 7.8 |
Information Technology | 6.1 | 11.1 |
Telecommunication Services | 6.2 | 4.0 |
Utilities | 0.6 | 1.6 |
Annual Report
Investments October 31, 2010
Showing Percentage of Net Assets
Common Stocks - 97.2% |
| Shares | | Value (000s) |
Australia - 3.0% |
Australia & New Zealand Banking Group Ltd. | 4,456,031 | | $ 108,304 |
JB Hi-Fi Ltd. (d) | 1,401,880 | | 27,302 |
Macquarie Group Ltd. | 1,446,043 | | 51,282 |
Newcrest Mining Ltd. | 1,300,681 | | 50,918 |
Wesfarmers Ltd. | 1,097,894 | | 35,644 |
Westfield Group unit | 2,381,694 | | 28,885 |
TOTAL AUSTRALIA | | 302,335 |
Bailiwick of Jersey - 0.6% |
Experian PLC | 3,677,200 | | 42,742 |
Informa PLC | 2,335,767 | | 16,316 |
TOTAL BAILIWICK OF JERSEY | | 59,058 |
Belgium - 1.2% |
Anheuser-Busch InBev SA NV | 1,791,980 | | 112,293 |
EVS Broadcast Equipment SA | 89,263 | | 5,602 |
TOTAL BELGIUM | | 117,895 |
Bermuda - 1.1% |
Huabao International Holdings Ltd. | 27,748,000 | | 41,812 |
Li & Fung Ltd. | 4,808,000 | | 25,401 |
Noble Group Ltd. | 26,477,364 | | 38,050 |
Sihuan Pharmaceutical Holdings Group Ltd. | 496,000 | | 360 |
TOTAL BERMUDA | | 105,623 |
Brazil - 1.7% |
Banco ABC Brasil SA | 572,000 | | 5,635 |
Banco Santander (Brasil) SA ADR | 1,896,000 | | 27,302 |
Diagnosticos da America SA | 2,508,000 | | 30,959 |
Drogasil SA | 1,040,700 | | 26,323 |
Souza Cruz Industria Comerico | 1,579,500 | | 81,157 |
TOTAL BRAZIL | | 171,376 |
British Virgin Islands - 0.3% |
HLS Systems International Ltd. (a)(d) | 610,767 | | 7,720 |
Playtech Ltd. (d) | 3,758,978 | | 26,966 |
TOTAL BRITISH VIRGIN ISLANDS | | 34,686 |
Canada - 1.8% |
First Quantum Minerals Ltd. | 249,300 | | 21,831 |
InterOil Corp. (a)(d) | 247,600 | | 17,624 |
Niko Resources Ltd. | 483,100 | | 46,088 |
Open Text Corp. (a) | 769,600 | | 34,047 |
Common Stocks - continued |
| Shares | | Value (000s) |
Canada - continued |
Pan American Silver Corp. | 843,000 | | $ 26,909 |
Petrobank Energy & Resources Ltd. (a) | 813,500 | | 32,376 |
TOTAL CANADA | | 178,875 |
Cayman Islands - 2.4% |
Belle International Holdings Ltd. | 9,430,000 | | 17,032 |
Bosideng International Holdings Ltd. | 81,544,000 | | 41,239 |
China Lodging Group Ltd. ADR (d) | 344,759 | | 8,381 |
Ctrip.com International Ltd. sponsored ADR (a) | 505,000 | | 26,295 |
Eurasia Drilling Co. Ltd. GDR (f) | 257,900 | | 6,576 |
Hengdeli Holdings Ltd. | 75,304,000 | | 41,775 |
Mongolian Mining Corp. | 15,168,000 | | 16,418 |
Perfect World Co. Ltd. sponsored ADR Class B (a) | 771,187 | | 24,986 |
Shenguan Holdings Group Ltd. | 21,268,000 | | 27,713 |
TPK Holdings Co. | 25,000 | | 413 |
Want Want China Holdings Ltd. | 36,693,000 | | 33,847 |
TOTAL CAYMAN ISLANDS | | 244,675 |
China - 1.2% |
Baidu.com, Inc. sponsored ADR (a) | 348,900 | | 38,382 |
China Merchants Bank Co. Ltd. (H Shares) | 18,516,200 | | 52,554 |
Comba Telecom Systems Holdings Ltd. (d) | 7,504,420 | | 8,520 |
Minth Group Ltd. | 2,146,000 | | 4,014 |
Zhaojin Mining Industry Co. Ltd. (H Shares) | 2,492,000 | | 7,748 |
ZTE Corp. (H Shares) (d) | 2,362,096 | | 8,776 |
TOTAL CHINA | | 119,994 |
Cyprus - 0.0% |
Aisi Realty Public Ltd. (a)(e) | 21,633,000 | | 607 |
Denmark - 3.3% |
Carlsberg AS Series B | 673,200 | | 73,612 |
Novo Nordisk AS Series B | 1,311,389 | | 137,673 |
Pandora A/S | 758,300 | | 36,789 |
William Demant Holding AS (a) | 1,094,900 | | 82,070 |
TOTAL DENMARK | | 330,144 |
Egypt - 0.2% |
Orascom Construction Industries SAE GDR | 443,300 | | 20,525 |
France - 8.8% |
Accor SA | 732,241 | | 30,021 |
Atos Origin SA (a) | 1,202,978 | | 55,615 |
AXA SA | 2,162,866 | | 39,365 |
Common Stocks - continued |
| Shares | | Value (000s) |
France - continued |
BNP Paribas SA | 983,966 | | $ 71,948 |
Carrefour SA | 973,625 | | 52,537 |
Compagnie Generale de Geophysique SA (a) | 1,085,600 | | 25,352 |
Edenred (a) | 552,100 | | 11,562 |
Essilor International SA | 566,366 | | 37,812 |
GDF Suez | 760,000 | | 30,329 |
Iliad Group SA (d) | 509,521 | | 57,356 |
LVMH Moet Hennessy - Louis Vuitton | 797,092 | | 124,886 |
Pernod-Ricard SA | 388,925 | | 34,478 |
PPR SA | 664,000 | | 108,838 |
Sanofi-Aventis | 317,944 | | 22,270 |
Schneider Electric SA | 588,962 | | 83,590 |
Societe Generale Series A | 1,175,263 | | 70,360 |
Unibail-Rodamco | 118,400 | | 24,663 |
TOTAL FRANCE | | 880,982 |
Germany - 5.2% |
Bayerische Motoren Werke AG (BMW) | 1,818,327 | | 130,326 |
Fresenius Medical Care AG & Co. KGaA | 964,000 | | 61,394 |
GEA Group AG | 2,030,727 | | 53,094 |
HeidelbergCement AG | 245,167 | | 12,822 |
Kabel Deutschland Holding AG | 1,258,000 | | 56,636 |
MAN SE | 529,280 | | 58,181 |
Metro AG | 439,200 | | 30,776 |
Siemens AG | 1,089,506 | | 124,433 |
TOTAL GERMANY | | 527,662 |
Greece - 0.2% |
Coca-Cola Hellenic Bottling Co. SA | 692,200 | | 17,915 |
Hong Kong - 1.6% |
AIA Group Ltd. | 5,311,400 | | 15,795 |
Henderson Land Development Co. Ltd. | 3,760,700 | | 26,709 |
I.T Ltd. | 21,016,000 | | 17,732 |
Techtronic Industries Co. Ltd. | 65,201,500 | | 66,032 |
Wharf Holdings Ltd. | 4,890,000 | | 32,111 |
TOTAL HONG KONG | | 158,379 |
India - 2.8% |
Adani Enterprises Ltd. | 1,982,014 | | 31,500 |
Gitanjali Gems Ltd. | 2,506,415 | | 16,763 |
Housing Development Finance Corp. Ltd. | 1,506,925 | | 23,380 |
IndusInd Bank Ltd. | 2,074,982 | | 12,340 |
Common Stocks - continued |
| Shares | | Value (000s) |
India - continued |
INFO Edge India Ltd. | 679,326 | | $ 10,427 |
Infrastructure Development Finance Co. Ltd. | 3,122,908 | | 14,094 |
Larsen & Toubro Ltd. | 783,228 | | 35,831 |
LIC Housing Finance Ltd. | 1,481,322 | | 44,801 |
Reliance Industries Ltd. | 903,416 | | 22,343 |
Rural Electrification Corp. Ltd. | 2,750,582 | | 23,001 |
Shriram Transport Finance Co. Ltd. | 621,359 | | 12,356 |
State Bank of India | 217,944 | | 15,491 |
The Jammu & Kashmir Bank Ltd. | 545,569 | | 11,206 |
Titan Industries Ltd. | 160,588 | | 12,869 |
TOTAL INDIA | | 286,402 |
Indonesia - 0.7% |
PT Bank Rakyat Indonesia Tbk | 19,678,500 | | 25,100 |
PT Tower Bersama Infrastructure Tbk | 4,813,500 | | 1,373 |
PT XL Axiata Tbk (a) | 67,983,500 | | 43,738 |
TOTAL INDONESIA | | 70,211 |
Ireland - 0.5% |
Ingersoll-Rand Co. Ltd. | 731,600 | | 28,759 |
James Hardie Industries NV unit (a) | 3,882,491 | | 20,501 |
TOTAL IRELAND | | 49,260 |
Israel - 0.2% |
Israel Chemicals Ltd. | 1,513,500 | | 23,150 |
Italy - 1.4% |
Intesa Sanpaolo SpA | 5,602,109 | | 19,702 |
Intesa Sanpaolo SpA (Risparmio Shares) | 6,681,302 | | 18,305 |
Prysmian SpA | 964,200 | | 18,689 |
Saipem SpA | 1,876,915 | | 83,389 |
TOTAL ITALY | | 140,085 |
Japan - 12.1% |
ABC-Mart, Inc. | 1,529,000 | | 52,005 |
Asics Corp. | 2,858,000 | | 30,864 |
Canon, Inc. | 1,331,350 | | 61,286 |
Cosmos Pharmaceutical Corp. | 543,200 | | 17,099 |
Denso Corp. | 1,577,500 | | 49,057 |
Don Quijote Co. Ltd. | 808,400 | | 22,091 |
eAccess Ltd. | 24,546 | | 17,905 |
Fast Retailing Co. Ltd. | 89,100 | | 11,671 |
Goldcrest Co. Ltd. | 161,770 | | 3,492 |
Common Stocks - continued |
| Shares | | Value (000s) |
Japan - continued |
Honda Motor Co. Ltd. | 1,736,200 | | $ 62,588 |
JSR Corp. | 2,283,400 | | 39,527 |
Keyence Corp. | 192,600 | | 47,749 |
Komatsu Ltd. | 1,833,900 | | 44,823 |
Mazda Motor Corp. | 14,841,000 | | 37,718 |
Misumi Group, Inc. | 825,300 | | 17,692 |
Mitsubishi Corp. | 1,980,200 | | 47,564 |
Mitsubishi UFJ Financial Group, Inc. | 12,527,700 | | 58,141 |
Mitsui & Co. Ltd. | 2,230,900 | | 35,086 |
Mizuho Financial Group, Inc. | 17,803,700 | | 25,821 |
Nichi-iko Pharmaceutical Co. Ltd. | 932,200 | | 32,877 |
Nintendo Co. Ltd. | 88,400 | | 22,905 |
Omron Corp. | 1,439,900 | | 33,425 |
ORIX Corp. | 1,209,560 | | 110,329 |
Osaka Securities Exchange Co. Ltd. | 1,866 | | 9,391 |
Rakuten, Inc. | 80,045 | | 61,673 |
Ricoh Co. Ltd. | 3,021,000 | | 42,260 |
Sawai Pharmaceutical Co. Ltd. (d) | 160,300 | | 14,004 |
SOFTBANK CORP. | 4,003,100 | | 128,560 |
Sony Financial Holdings, Inc. | 7,099 | | 24,701 |
Start Today Co. Ltd. | 7,249 | | 22,548 |
Sumitomo Mitsui Financial Group, Inc. | 1,151,300 | | 34,364 |
TOTAL JAPAN | | 1,219,216 |
Korea (South) - 1.5% |
Hyundai Motor Co. | 192,345 | | 29,078 |
Kia Motors Corp. | 912,890 | | 36,451 |
NCsoft Corp. | 97,952 | | 21,559 |
NHN Corp. (a) | 123,150 | | 21,848 |
Samsung Electronics Co. Ltd. | 38,175 | | 25,292 |
Shinhan Financial Group Co. Ltd. | 421,030 | | 16,306 |
TOTAL KOREA (SOUTH) | | 150,534 |
Luxembourg - 0.3% |
Millicom International Cellular SA | 282,400 | | 26,715 |
Mauritius - 0.2% |
MakeMyTrip Ltd. | 456,425 | | 16,500 |
Mexico - 0.4% |
Wal-Mart de Mexico SA de CV Series V | 14,883,600 | | 40,708 |
Netherlands - 2.2% |
AEGON NV (a) | 3,601,200 | | 22,818 |
Gemalto NV (d) | 704,193 | | 32,061 |
Common Stocks - continued |
| Shares | | Value (000s) |
Netherlands - continued |
ING Groep NV (Certificaten Van Aandelen) unit (a) | 4,878,900 | | $ 52,185 |
Koninklijke Philips Electronics NV | 2,283,638 | | 69,639 |
LyondellBasell Industries NV Class A (a) | 1,230,700 | | 33,057 |
Randstad Holdings NV (a) | 229,781 | | 10,935 |
TOTAL NETHERLANDS | | 220,695 |
Norway - 1.6% |
Aker Solutions ASA | 1,903,800 | | 28,983 |
DnB NOR ASA | 5,226,955 | | 71,723 |
Telenor ASA | 1,549,800 | | 24,982 |
Yara International ASA | 620,300 | | 32,607 |
TOTAL NORWAY | | 158,295 |
Poland - 0.1% |
Eurocash SA | 980,199 | | 9,009 |
Qatar - 0.2% |
Commercial Bank of Qatar GDR (Reg. S) | 5,094,802 | | 23,345 |
Singapore - 0.3% |
Keppel Corp. Ltd. | 4,295,000 | | 33,118 |
South Africa - 2.2% |
African Rainbow Minerals Ltd. | 607,700 | | 15,503 |
AngloGold Ashanti Ltd. sponsored ADR | 816,100 | | 38,446 |
Clicks Group Ltd. | 7,968,139 | | 51,983 |
Mr Price Group Ltd. | 3,702,400 | | 33,646 |
Sanlam Ltd. | 7,188,000 | | 26,946 |
Standard Bank Group Ltd. | 1,349,000 | | 19,893 |
Woolworths Holdings Ltd. | 9,804,233 | | 38,419 |
TOTAL SOUTH AFRICA | | 224,836 |
Spain - 3.8% |
Antena 3 Television SA | 2,176,200 | | 22,226 |
Banco Bilbao Vizcaya Argentaria SA | 4,146,934 | | 54,620 |
Banco Santander SA | 8,695,646 | | 111,585 |
Gestevision Telecinco SA | 2,269,700 | | 28,948 |
Inditex SA (d) | 398,393 | | 33,266 |
Prosegur Compania de Seguridad SA (Reg.) | 479,200 | | 28,712 |
Telefonica SA | 3,645,705 | | 98,491 |
TOTAL SPAIN | | 377,848 |
Sweden - 1.7% |
Elekta AB (B Shares) | 2,194,000 | | 83,011 |
Common Stocks - continued |
| Shares | | Value (000s) |
Sweden - continued |
H&M Hennes & Mauritz AB (B Shares) | 1,301,280 | | $ 45,846 |
Modern Times Group MTG AB (B Shares) | 579,300 | | 41,538 |
TOTAL SWEDEN | | 170,395 |
Switzerland - 7.0% |
Adecco SA (Reg.) | 243,346 | | 13,597 |
Compagnie Financiere Richemont SA Series A | 692,855 | | 34,546 |
Credit Suisse Group | 644,315 | | 26,666 |
Kuehne & Nagel International AG | 197,400 | | 24,406 |
Lonza Group AG | 349,225 | | 30,564 |
Nestle SA | 2,845,723 | | 155,823 |
Novartis AG | 2,677,083 | | 155,070 |
Partners Group Holding | 176,756 | | 32,322 |
Schindler Holding AG (participation certificate) | 228,540 | | 24,494 |
Sonova Holding AG Class B | 213,178 | | 24,689 |
The Swatch Group AG (Bearer) | 175,550 | | 67,074 |
UBS AG (a) | 3,459,090 | | 58,744 |
Zurich Financial Services AG | 251,733 | | 61,607 |
TOTAL SWITZERLAND | | 709,602 |
Taiwan - 0.5% |
HTC Corp. | 2,247,850 | | 50,752 |
Thailand - 0.4% |
Bangkok Bank Public Co. Ltd. (For. Reg.) | 8,336,000 | | 43,016 |
Turkey - 0.7% |
Boyner Buyuk Magazacilik AS (a)(e) | 4,833,645 | | 11,256 |
Dogus Otomotiv Servis ve Ticaret AS (a) | 2,849,000 | | 21,452 |
Turkiye Garanti Bankasi AS | 6,816,000 | | 41,819 |
TOTAL TURKEY | | 74,527 |
United Kingdom - 20.9% |
Aberdeen Asset Management PLC | 12,139,132 | | 34,580 |
Aegis Group PLC | 12,834,711 | | 25,848 |
Anglo American PLC (United Kingdom) | 1,583,300 | | 73,767 |
AstraZeneca PLC (United Kingdom) | 1,776,034 | | 89,327 |
Barclays PLC | 20,242,493 | | 88,943 |
BG Group PLC | 943,475 | | 18,373 |
BHP Billiton PLC | 5,343,392 | | 189,262 |
BP PLC | 24,342,500 | | 165,439 |
British Land Co. PLC | 2,363,434 | | 19,293 |
Britvic PLC | 5,435,800 | | 42,012 |
Burberry Group PLC | 2,391,800 | | 39,048 |
Common Stocks - continued |
| Shares | | Value (000s) |
United Kingdom - continued |
Carphone Warehouse Group PLC (a) | 15,119,465 | | $ 73,761 |
Cookson Group PLC (a) | 1,543,760 | | 12,738 |
GlaxoSmithKline PLC | 6,239,100 | | 121,819 |
HSBC Holdings PLC (United Kingdom) | 12,868,660 | | 133,916 |
IG Group Holdings PLC | 6,526,105 | | 55,259 |
InterContinental Hotel Group PLC | 2,054,000 | | 39,664 |
International Personal Finance PLC | 9,411,888 | | 46,896 |
International Power PLC | 3,956,720 | | 26,454 |
Legal & General Group PLC | 18,411,796 | | 29,616 |
Lloyds Banking Group PLC (a) | 49,557,364 | | 54,463 |
Micro Focus International PLC | 2,166,900 | | 13,255 |
Ocado Group PLC (a)(d) | 14,388,400 | | 32,204 |
Reckitt Benckiser Group PLC | 1,415,031 | | 79,144 |
Rio Tinto PLC | 1,536,344 | | 99,773 |
Royal Dutch Shell PLC Class B | 5,903,573 | | 188,900 |
Schroders PLC | 1,532,400 | | 38,767 |
SuperGroup PLC | 101,212 | | 1,832 |
TalkTalk Telecom Group PLC (a) | 18,424,592 | | 38,936 |
Ultra Electronics Holdings PLC | 614,667 | | 18,327 |
Vodafone Group PLC | 42,989,943 | | 117,503 |
Wolseley PLC (a) | 1,389,264 | | 37,015 |
Xstrata PLC | 3,171,800 | | 61,463 |
TOTAL UNITED KINGDOM | | 2,107,597 |
United States of America - 2.9% |
AsiaInfo Holdings, Inc. (a)(d) | 717,700 | | 15,947 |
CF Industries Holdings, Inc. | 273,800 | | 33,549 |
Freeport-McMoRan Copper & Gold, Inc. | 420,100 | | 39,775 |
NII Holdings, Inc. (a) | 1,802,500 | | 75,363 |
The Mosaic Co. | 376,200 | | 27,523 |
Virgin Media, Inc. (d) | 2,966,300 | | 75,433 |
Walter Energy, Inc. | 286,800 | | 25,227 |
TOTAL UNITED STATES OF AMERICA | | 292,817 |
TOTAL COMMON STOCKS (Cost $8,518,349) | 9,789,364 |
Nonconvertible Preferred Stocks - 1.4% |
| Shares | | Value (000s) |
Germany - 1.4% |
ProSiebenSat.1 Media AG | 783,800 | | $ 20,711 |
Volkswagen AG | 789,800 | | 118,688 |
TOTAL NONCONVERTIBLE PREFERRED STOCKS (Cost $105,062) | 139,399 |
Money Market Funds - 2.2% |
| | | |
Fidelity Cash Central Fund, 0.23% (b) | 100,758,575 | | 100,759 |
Fidelity Securities Lending Cash Central Fund, 0.24% (b)(c) | 123,571,582 | | 123,572 |
TOTAL MONEY MARKET FUNDS (Cost $224,331) | 224,331 |
Cash Equivalents - 0.2% |
| Maturity Amount (000s) | | |
Investments in repurchase agreements in a joint trading account at 0.22%, dated 10/29/10 due 11/1/10 (Collateralized by U.S. Treasury Obligations) #
(Cost $18,662) | $ 18,662 | | 18,662 |
TOTAL INVESTMENT PORTFOLIO - 101.0% (Cost $8,866,404) | | 10,171,756 |
NET OTHER ASSETS (LIABILITIES) - (1.0)% | | (99,606) |
NET ASSETS - 100% | $ 10,072,150 |
Legend |
(a) Non-income producing |
(b) Affiliated fund that is available only to investment companies and other accounts managed by Fidelity Investments. The rate quoted is the annualized seven-day yield of the fund at period end. A complete unaudited listing of the fund's holdings as of its most recent quarter end is available upon request. In addition, each Fidelity Central Fund's financial statements, which are not covered by the Fund's report of Independent Registered Public Accounting Firm, are available on the SEC's website or upon request. |
(c) Investment made with cash collateral received from securities on loan. |
(d) Security or a portion of the security is on loan at period end. |
(e) Affiliated company |
(f) Security exempt from registration under Rule 144A of the Securities Act of 1933. These securities may be resold in transactions exempt from registration, normally to qualified institutional buyers. At the end of the period, the value of these securities amounted to $6,576,000 or 0.1% of net assets. |
# Additional information on each counterparty to the repurchase agreement is as follows: |
Repurchase Agreement / Counterparty | Value
(Amounts in thousands) |
$18,662,000 due 11/01/10 at 0.22% |
BNP Paribas Securities Corp. | $ 8,683 |
Banc of America Securities LLC | 3,254 |
Barclays Capital, Inc. | 6,725 |
| $ 18,662 |
Affiliated Central Funds |
Information regarding fiscal year to date income earned by the Fund from investments in Fidelity Central Funds is as follows: |
Fund | Income earned
(Amounts in thousands) |
Fidelity Cash Central Fund | $ 127 |
Fidelity Securities Lending Cash Central Fund | 6,155 |
Total | $ 6,282 |
Other Affiliated Issuers |
An affiliated company is a company in which the Fund has ownership of at least 5% of the voting securities. Fiscal year to date transactions with companies which are or were affiliates are as follows: |
Affiliate
(Amounts in thousands) | Value, beginning of period | Purchases | Sales Proceeds | Dividend Income | Value,
end of
period |
Aisi Realty Public Ltd. | $ 1,243 | $ - | $ - | $ - | $ 607 |
Boyner Buyuk Magazacilik AS | - | 11,785 | - | - | 11,256 |
Total | $ 1,243 | $ 11,785 | $ - | $ - | $ 11,863 |
Other Information |
The following is a summary of the inputs used, as of October 31, 2010, involving the Fund's assets and liabilities carried at fair value. The inputs or methodology used for valuing securities may not be an indication of the risk associated with investing in those securities. For more information on valuation inputs, and their aggregation into the levels used in the tables below, please refer to the Security Valuation section in the accompanying Notes to Financial Statements. |
Valuation Inputs at Reporting Date: |
Description
(Amounts in thousands) | Total | Level 1 | Level 2 | Level 3 |
Investments in Securities: | | | | |
Equities: | | | | |
United Kingdom | $ 2,107,597 | $ 818,588 | $ 1,289,009 | $ - |
Japan | 1,219,216 | 580,277 | 638,939 | - |
France | 880,982 | 833,360 | 47,622 | - |
Switzerland | 709,602 | 469,122 | 240,480 | - |
Germany | 667,061 | 481,234 | 185,827 | - |
Spain | 377,848 | 113,152 | 264,696 | - |
Denmark | 330,144 | 192,471 | 137,673 | - |
Australia | 302,335 | 302,335 | - | - |
United States of America | 292,817 | 292,817 | - | - |
Cyprus | 607 | - | - | 607 |
Other | 3,040,554 | 2,895,912 | 144,642 | - |
Money Market Funds | 224,331 | 224,331 | - | - |
Cash Equivalents | 18,662 | - | 18,662 | - |
Total Investments in Securities: | $ 10,171,756 | $ 7,203,599 | $ 2,967,550 | $ 607 |
The following is a reconciliation of Investments in Securities for which Level 3 inputs were used in determining value: |
(Amounts in thousands) | |
Investments in Securities: | |
Beginning Balance | $ - |
Total Realized Gain (Loss) | - |
Total Unrealized Gain (Loss) | (636) |
Cost of Purchases | - |
Proceeds of Sales | - |
Amortization/Accretion | - |
Transfers in to Level 3 | 1,243 |
Transfers out of Level 3 | - |
Ending Balance | $ 607 |
The change in unrealized gain (loss) for the period attributable to Level 3 securities held at October 31, 2010 | $ (636) |
The information used in the above reconciliation represents fiscal year to date activity for any Investments in Securities identified as using Level 3 inputs at either the beginning or the end of the current fiscal period. Transfers in or out of Level 3 represent the beginning value of any Security or Instrument where a change in the pricing level occurred from the beginning to the end of the period. The cost of purchases and the proceeds of sales may include securities received or delivered through corporate actions or exchanges. Realized and unrealized gains (losses) disclosed in the reconciliation are included in Net Gain (Loss) on the Fund's Statement of Operations. |
Income Tax Information |
At October 31, 2010, the Fund had a capital loss carryforward of approximately $1,803,058,000 of which $163,224,000 and $1,639,834,000 will expire on October 31, 2016 and 2017, respectively. Capital loss carryforwards are only available to offset future capital gains of the Fund to the extent provided by regulations and may be limited. |
See accompanying notes which are an integral part of the financial statements.
Annual Report
Statement of Assets and Liabilities
Amounts in thousands (except per-share amounts) | October 31, 2010 |
| | |
Assets | | |
Investment in securities, at value (including securities loaned of $117,688 and repurchase agreements of $18,662) - See accompanying schedule: Unaffiliated issuers (cost $8,623,386) | $ 9,935,562 | |
Fidelity Central Funds (cost $224,331) | 224,331 | |
Other affiliated issuers (cost $18,687) | 11,863 | |
Total Investments (cost $8,866,404) | | $ 10,171,756 |
Cash | | 1 |
Foreign currency held at value (cost $1,005) | | 1,005 |
Receivable for investments sold | | 74,676 |
Receivable for fund shares sold | | 8,906 |
Dividends receivable | | 27,141 |
Distributions receivable from Fidelity Central Funds | | 250 |
Other receivables | | 3,906 |
Total assets | | 10,287,641 |
| | |
Liabilities | | |
Payable for investments purchased | $ 61,924 | |
Payable for fund shares redeemed | 12,106 | |
Accrued management fee | 5,716 | |
Distribution and service plan fees payable | 169 | |
Other affiliated payables | 1,920 | |
Other payables and accrued expenses | 10,084 | |
Collateral on securities loaned, at value | 123,572 | |
Total liabilities | | 215,491 |
| | |
Net Assets | | $ 10,072,150 |
Net Assets consist of: | | |
Paid in capital | | $ 10,604,504 |
Undistributed net investment income | | 120,198 |
Accumulated undistributed net realized gain (loss) on investments and foreign currency transactions | | (1,950,098) |
Net unrealized appreciation (depreciation) on investments and assets and liabilities in foreign currencies | | 1,297,546 |
Net Assets | | $ 10,072,150 |
See accompanying notes which are an integral part of the financial statements.
Annual Report
Statement of Assets and Liabilities - continued
Amounts in thousands (except per-share amounts) | October 31, 2010 |
| | |
Calculation of Maximum Offering Price Class A:
Net Asset Value and redemption price per share ($391,603 ÷ 12,210.4 shares) | | $ 32.07 |
| | |
Maximum offering price per share (100/94.25 of $32.07) | | $ 34.03 |
Class T:
Net Asset Value and redemption price per share ($91,992 ÷ 2,892.1 shares) | | $ 31.81 |
| | |
Maximum offering price per share (100/96.50 of $31.81) | | $ 32.96 |
Class B:
Net Asset Value and offering price per share ($14,434 ÷ 456.7 shares)A | | $ 31.60 |
| | |
Class C:
Net Asset Value and offering price per share ($43,557 ÷ 1,374.7 shares)A | | $ 31.68 |
| | |
International Discovery:
Net Asset Value, offering price and redemption price per share ($8,133,121 ÷ 251,479.5 shares) | | $ 32.34 |
| | |
Class K:
Net Asset Value, offering price and redemption price per share ($1,078,333 ÷ 33,361.2 shares) | | $ 32.32 |
| | |
Institutional Class:
Net Asset Value, offering price and redemption price per share ($319,110 ÷ 9,877.0 shares) | | $ 32.31 |
A Redemption price per share is equal to net asset value less any applicable contingent deferred sales charge.
See accompanying notes which are an integral part of the financial statements.
Annual Report
Financial Statements - continued
Statement of Operations
Amounts in thousands | Year ended October 31, 2010 |
| | |
Investment Income | | |
Dividends | | $ 239,834 |
Interest | | 2 |
Income from Fidelity Central Funds | | 6,282 |
Income before foreign taxes withheld | | 246,118 |
Less foreign taxes withheld | | (17,979) |
Total income | | 228,139 |
| | |
Expenses | | |
Management fee
Basic fee | $ 68,970 | |
Performance adjustment | 3,660 | |
Transfer agent fees | 23,371 | |
Distribution and service plan fees | 2,084 | |
Accounting and security lending fees | 1,801 | |
Custodian fees and expenses | 1,632 | |
Independent trustees' compensation | 55 | |
Registration fees | 223 | |
Audit | 117 | |
Legal | 49 | |
Interest | 12 | |
Miscellaneous | 132 | |
Total expenses before reductions | 102,106 | |
Expense reductions | (4,562) | 97,544 |
Net investment income (loss) | | 130,595 |
Realized and Unrealized Gain (Loss) Net realized gain (loss) on: | | |
Investment securities: | | |
Unaffiliated issuers (net of foreign taxes of $141) | 488,568 | |
Foreign currency transactions | (6,761) | |
Capital gain distributions from Fidelity Central Funds | 14 | |
Total net realized gain (loss) | | 481,821 |
Change in net unrealized appreciation (depreciation) on: Investment securities (net of increase in deferred foreign taxes of $8,661) | 637,812 | |
Assets and liabilities in foreign currencies | 968 | |
Total change in net unrealized appreciation (depreciation) | | 638,780 |
Net gain (loss) | | 1,120,601 |
Net increase (decrease) in net assets resulting from operations | | $ 1,251,196 |
See accompanying notes which are an integral part of the financial statements.
Annual Report
Statement of Changes in Net Assets
Amounts in thousands | Year ended
October 31,
2010 | Year ended
October 31,
2009 |
Increase (Decrease) in Net Assets | | |
Operations | | |
Net investment income (loss) | $ 130,595 | $ 120,477 |
Net realized gain (loss) | 481,821 | (1,782,481) |
Change in net unrealized appreciation (depreciation) | 638,780 | 3,333,708 |
Net increase (decrease) in net assets resulting
from operations | 1,251,196 | 1,671,704 |
Distributions to shareholders from net investment income | (116,422) | (107,705) |
Distributions to shareholders from net realized gain | (13,374) | - |
Total distributions | (129,796) | (107,705) |
Share transactions - net increase (decrease) | (662,032) | 250,490 |
Redemption fees | 291 | 345 |
Total increase (decrease) in net assets | 459,659 | 1,814,834 |
| | |
Net Assets | | |
Beginning of period | 9,612,491 | 7,797,657 |
End of period (including undistributed net investment income of $120,198 and undistributed net investment income of $106,024, respectively) | $ 10,072,150 | $ 9,612,491 |
See accompanying notes which are an integral part of the financial statements.
Annual Report
Financial Highlights - Class A
Years ended October 31, | 2010 | 2009 | 2008 | 2007 | 2006 |
Selected Per-Share Data | | | | | |
Net asset value, beginning of period | $ 28.57 | $ 23.68 | $ 47.34 | $ 36.47 | $ 30.57 |
Income from Investment Operations | | | | | |
Net investment income (loss)C | .31 | .31 | .46 | .44 | .42 |
Net realized and unrealized gain (loss) | 3.51 | 4.84 | (22.08) | 11.76 | 7.19 |
Total from investment operations | 3.82 | 5.15 | (21.62) | 12.20 | 7.61 |
Distributions from net investment income | (.28) | (.26) | (.37) | (.35) | (.31) |
Distributions from net realized gain | (.04) | - | (1.67) | (.98) | (1.40) |
Total distributions | (.32) | (.26) | (2.04) | (1.33) | (1.71) |
Redemption fees added to paid in capital C,G | - | - | - | - | - |
Net asset value, end of period | $ 32.07 | $ 28.57 | $ 23.68 | $ 47.34 | $ 36.47 |
Total ReturnA,B | 13.43% | 22.14% | (47.65)% | 34.54% | 26.01% |
Ratios to Average Net Assets D, F | | | | | |
Expenses before reductions | 1.33% | 1.37% | 1.32% | 1.25% | 1.27% |
Expenses net of fee waivers, if any | 1.33% | 1.37% | 1.32% | 1.25% | 1.27% |
Expenses net of all reductions | 1.28% | 1.32% | 1.29% | 1.22% | 1.21% |
Net investment income (loss) | 1.06% | 1.28% | 1.27% | 1.08% | 1.22% |
Supplemental Data | | | | | |
Net assets, end of period (in millions) | $ 392 | $ 414 | $ 380 | $ 417 | $ 140 |
Portfolio turnover rate E | 82% | 98% | 79% | 56% | 56% |
A Total returns would have been lower had certain expenses not been reduced during the periods shown.
B Total returns do not include the effect of the sales charges.
C Calculated based on average shares outstanding during the period.
D Fees and expenses of the underlying Fidelity Central Funds are not included in the Fund's expense ratio. The Fund indirectly bears its proportionate share of the expenses of any underlying Fidelity Central Funds.
E Amount does not include the portfolio activity of any underlying Fidelity Central Funds.
F Expense ratios reflect operating expenses of the class. Expenses before reductions do not reflect amounts reimbursed by the investment adviser or reductions from brokerage service arrangements or reductions from other expense offset arrangements and do not represent the amount paid by the class during periods when reimbursements or reductions occur. Expenses net of fee waivers reflect expenses after reimbursement by the investment adviser but prior to reductions from brokerage service arrangements or other expense offset arrangements. Expenses net of all reductions represent the net expenses paid by the class.
G Amount represents less than $.01 per share.
See accompanying notes which are an integral part of the financial statements.
Annual Report
Financial Highlights - Class T
Years ended October 31, | 2010 | 2009 | 2008 | 2007 | 2006 |
Selected Per-Share Data | | | | | |
Net asset value, beginning of period | $ 28.35 | $ 23.49 | $ 47.06 | $ 36.30 | $ 30.49 |
Income from Investment Operations | | | | | |
Net investment income (loss) C | .23 | .24 | .33 | .29 | .27 |
Net realized and unrealized gain (loss) | 3.48 | 4.81 | (21.94) | 11.71 | 7.18 |
Total from investment operations | 3.71 | 5.05 | (21.61) | 12.00 | 7.45 |
Distributions from net investment income | (.21) | (.19) | (.29) | (.26) | (.24) |
Distributions from net realized gain | (.04) | - | (1.67) | (.98) | (1.40) |
Total distributions | (.25) | (.19) | (1.96) | (1.24) | (1.64) |
Redemption fees added to paid in capital C,G | - | - | - | - | - |
Net asset value, end of period | $ 31.81 | $ 28.35 | $ 23.49 | $ 47.06 | $ 36.30 |
Total Return A,B | 13.14% | 21.79% | (47.84)% | 34.08% | 25.49% |
Ratios to Average Net AssetsD, F | | | | | |
Expenses before reductions | 1.60% | 1.65% | 1.68% | 1.63% | 1.71% |
Expenses net of fee waivers, if any | 1.60% | 1.65% | 1.68% | 1.63% | 1.71% |
Expenses net of all reductions | 1.56% | 1.60% | 1.64% | 1.60% | 1.65% |
Net investment income (loss) | .79% | 1.00% | .91% | .70% | .78% |
Supplemental Data | | | | | |
Net assets, end of period (in millions) | $ 92 | $ 83 | $ 64 | $ 53 | $ 10 |
Portfolio turnover rate E | 82% | 98% | 79% | 56% | 56% |
A Total returns would have been lower had certain expenses not been reduced during the periods shown.
B Total returns do not include the effect of the sales charges.
C Calculated based on average shares outstanding during the period.
D Fees and expenses of the underlying Fidelity Central Funds are not included in the Fund's expense ratio. The Fund indirectly bears its proportionate share of the expenses of any underlying Fidelity Central Funds.
E Amount does not include the portfolio activity of any underlying Fidelity Central Funds.
F Expense ratios reflect operating expenses of the class. Expenses before reductions do not reflect amounts reimbursed by the investment adviser or reductions from brokerage service arrangements or reductions from other expense offset arrangements and do not represent the amount paid by the class during periods when reimbursements or reductions occur. Expenses net of fee waivers reflect expenses after reimbursement by the investment adviser but prior to reductions from brokerage service arrangements or other expense offset arrangements. Expenses net of all reductions represent the net expenses paid by the class.
G Amount represents less than $.01 per share.
See accompanying notes which are an integral part of the financial statements.
Annual Report
Financial Highlights - Class B
Years ended October 31, | 2010 | 2009 | 2008 | 2007 | 2006 |
Selected Per-Share Data | | | | | |
Net asset value, beginning of period | $ 28.18 | $ 23.25 | $ 46.70 | $ 36.12 | $ 30.36 |
Income from Investment Operations | | | | | |
Net investment income (loss)C | .08 | .12 | .15 | .08 | .08 |
Net realized and unrealized gain (loss) | 3.44 | 4.81 | (21.77) | 11.64 | 7.19 |
Total from investment operations | 3.52 | 4.93 | (21.62) | 11.72 | 7.27 |
Distributions from net investment income | (.06) | - | (.16) | (.16) | (.11) |
Distributions from net realized gain | (.04) | - | (1.67) | (.98) | (1.40) |
Total distributions | (.10) | - | (1.83) | (1.14) | (1.51) |
Redemption fees added to paid in capital C,G | - | - | - | - | - |
Net asset value, end of period | $ 31.60 | $ 28.18 | $ 23.25 | $ 46.70 | $ 36.12 |
Total ReturnA,B | 12.52% | 21.20% | (48.11)% | 33.37% | 24.91% |
Ratios to Average Net Assets D, F | | | | | |
Expenses before reductions | 2.12% | 2.16% | 2.19% | 2.14% | 2.27% |
Expenses net of fee waivers, if any | 2.12% | 2.16% | 2.19% | 2.14% | 2.25% |
Expenses net of all reductions | 2.08% | 2.11% | 2.15% | 2.10% | 2.19% |
Net investment income (loss) | .27% | .49% | .40% | .19% | .24% |
Supplemental Data | | | | | |
Net assets, end of period (in millions) | $ 14 | $ 16 | $ 15 | $ 17 | $ 4 |
Portfolio turnover rate E | 82% | 98% | 79% | 56% | 56% |
A Total returns would have been lower had certain expenses not been reduced during the periods shown.
B Total returns do not include the effect of the contingent deferred sales charge.
C Calculated based on average shares outstanding during the period.
D Fees and expenses of the underlying Fidelity Central Funds are not included in the Fund's expense ratio. The Fund indirectly bears its proportionate share of the expenses of any underlying Fidelity Central Funds.
E Amount does not include the portfolio activity of any underlying Fidelity Central Funds.
F Expense ratios reflect operating expenses of the class. Expenses before reductions do not reflect amounts reimbursed by the investment adviser or reductions from brokerage service arrangements or reductions from other expense offset arrangements and do not represent the amount paid by the class during periods when reimbursements or reductions occur. Expenses net of fee waivers reflect expenses after reimbursement by the investment adviser but prior to reductions from brokerage service arrangements or other expense offset arrangements. Expenses net of all reductions represent the net expenses paid by the class.
G Amount represents less than $.01 per share.
See accompanying notes which are an integral part of the financial statements.
Annual Report
Financial Highlights - Class C
Years ended October 31, | 2010 | 2009 | 2008 | 2007 | 2006 |
Selected Per-Share Data | | | | | |
Net asset value, beginning of period | $ 28.23 | $ 23.31 | $ 46.82 | $ 36.19 | $ 30.41 |
Income from Investment Operations | | | | | |
Net investment income (loss) C | .09 | .12 | .15 | .09 | .11 |
Net realized and unrealized gain (loss) | 3.45 | 4.82 | (21.82) | 11.66 | 7.19 |
Total from investment operations | 3.54 | 4.94 | (21.67) | 11.75 | 7.30 |
Distributions from net investment income | (.05) | (.02) | (.17) | (.14) | (.12) |
Distributions from net realized gain | (.04) | - | (1.67) | (.98) | (1.40) |
Total distributions | (.09) | (.02) | (1.84) | (1.12) | (1.52) |
Redemption fees added to paid in capital C,G | - | - | - | - | - |
Net asset value, end of period | $ 31.68 | $ 28.23 | $ 23.31 | $ 46.82 | $ 36.19 |
Total Return A,B | 12.54% | 21.22% | (48.10)% | 33.38% | 24.97% |
Ratios to Average Net Assets D, F | | | | | |
Expenses before reductions | 2.09% | 2.14% | 2.17% | 2.11% | 2.16% |
Expenses net of fee waivers, if any | 2.09% | 2.14% | 2.17% | 2.11% | 2.16% |
Expenses net of all reductions | 2.05% | 2.09% | 2.13% | 2.08% | 2.11% |
Net investment income (loss) | .30% | .51% | .42% | .22% | .33% |
Supplemental Data | | | | | |
Net assets, end of period (in millions) | $ 44 | $ 43 | $ 36 | $ 28 | $ 6 |
Portfolio turnover rate E | 82% | 98% | 79% | 56% | 56% |
A Total returns would have been lower had certain expenses not been reduced during the periods shown.
B Total returns do not include the effect of the contingent deferred sales charge.
C Calculated based on average shares outstanding during the period.
D Fees and expenses of the underlying Fidelity Central Funds are not included in the Fund's expense ratio. The Fund indirectly bears its proportionate share of the expenses of any underlying Fidelity Central Funds.
E Amount does not include the portfolio activity of any underlying Fidelity Central Funds.
F Expense ratios reflect operating expenses of the class. Expenses before reductions do not reflect amounts reimbursed by the investment adviser or reductions from brokerage service arrangements or reductions from other expense offset arrangements and do not represent the amount paid by the class during periods when reimbursements or reductions occur. Expenses net of fee waivers reflect expenses after reimbursement by the investment adviser but prior to reductions from brokerage service arrangements or other expense offset arrangements. Expenses net of all reductions represent the net expenses paid by the class.
G Amount represents less than $.01 per share.
See accompanying notes which are an integral part of the financial statements.
Annual Report
Financial Highlights - International Discovery
Years ended October 31, | 2010 | 2009 | 2008 | 2007 | 2006 |
Selected Per-Share Data | | | | | |
Net asset value, beginning of period | $ 28.79 | $ 23.88 | $ 47.68 | $ 36.67 | $ 30.65 |
Income from Investment Operations | | | | | |
Net investment income (loss) B | .40 | .37 | .57 | .53 | .48 |
Net realized and unrealized gain (loss) | 3.54 | 4.88 | (22.29) | 11.84 | 7.25 |
Total from investment operations | 3.94 | 5.25 | (21.72) | 12.37 | 7.73 |
Distributions from net investment income | (.35) | (.34) | (.41) | (.38) | (.31) |
Distributions from net realized gain | (.04) | - | (1.67) | (.98) | (1.40) |
Total distributions | (.39) | (.34) | (2.08) | (1.36) | (1.71) |
Redemption fees added to paid in capital B,F | - | - | - | - | - |
Net asset value, end of period | $ 32.34 | $ 28.79 | $ 23.88 | $ 47.68 | $ 36.67 |
Total Return A | 13.76% | 22.47% | (47.55)% | 34.85% | 26.34% |
Ratios to Average Net Assets C,E | | | | | |
Expenses before reductions | 1.05% | 1.12% | 1.09% | 1.04% | 1.09% |
Expenses net of fee waivers, if any | 1.05% | 1.12% | 1.09% | 1.04% | 1.08% |
Expenses net of all reductions | 1.00% | 1.07% | 1.05% | 1.00% | 1.03% |
Net investment income (loss) | 1.35% | 1.53% | 1.51% | 1.30% | 1.41% |
Supplemental Data | | | | | |
Net assets, end of period (in millions) | $ 8,133 | $ 8,114 | $ 6,999 | $ 14,176 | $ 8,054 |
Portfolio turnover rateD | 82% | 98% | 79% | 56% | 56% |
A Total returns would have been lower had certain expenses not been reduced during the periods shown.
B Calculated based on average shares outstanding during the period.
C Fees and expenses of the underlying Fidelity Central Funds are not included in the Fund's expense ratio. The Fund indirectly bears its proportionate share of the expenses of any underlying Fidelity Central Funds.
D Amount does not include the portfolio activity of any underlying Fidelity Central Funds.
E Expense ratios reflect operating expenses of the class. Expenses before reductions do not reflect amounts reimbursed by the investment adviser or reductions from brokerage service arrangements or reductions from other expense offset arrangements and do not represent the amount paid by the class during periods when reimbursements or reductions occur. Expenses net of fee waivers reflect expenses after reimbursement by the investment adviser but prior to reductions from brokerage service arrangements or other expense offset arrangements. Expenses net of all reductions represent the net expenses paid by the class.
F Amount represents less than $.01 per share.
See accompanying notes which are an integral part of the financial statements.
Annual Report
Financial Highlights - Class K
Years ended October 31, | 2010 | 2009 | 2008G |
Selected Per-Share Data | | | |
Net asset value, beginning of period | $ 28.78 | $ 23.90 | $ 40.32 |
Income from Investment Operations | | | |
Net investment income (loss)D | .46 | .44 | .10 |
Net realized and unrealized gain (loss) | 3.53 | 4.86 | (16.52) |
Total from investment operations | 3.99 | 5.30 | (16.42) |
Distributions from net investment income | (.41) | (.42) | - |
Distributions from net realized gain | (.04) | - | - |
Total distributions | (.45) | (.42) | - |
Redemption fees added to paid in capital D,I | - | - | - |
Net asset value, end of period | $ 32.32 | $ 28.78 | $ 23.90 |
Total ReturnB,C | 13.96% | 22.80% | (40.72)% |
Ratios to Average Net AssetsE,H | | | |
Expenses before reductions | .84% | .88% | .93%A |
Expenses net of fee waivers, if any | .84% | .88% | .93%A |
Expenses net of all reductions | .79% | .83% | .89%A |
Net investment income (loss) | 1.55% | 1.77% | .83%A |
Supplemental Data | | | |
Net assets, end of period (in millions) | $ 1,078 | $ 674 | $ 145 |
Portfolio turnover rateF | 82% | 98% | 79% |
A Annualized
B Total returns for period of less than one year are not annualized.
C Total returns would have been lower had certain expenses not been reduced during the periods shown.
D Calculated based on average shares outstanding during the period.
E Fees and expenses of the underlying Fidelity Central Funds are not included in the Fund's expense ratio. The Fund indirectly bears its proportionate share of the expenses of any underlying Fidelity Central Funds.
F Amount does not include the portfolio activity of any underlying Fidelity Central Funds.
G For the period May 9, 2008 (commencement of sale of shares) to October 31, 2008.
H Expense ratios reflect operating expenses of the class. Expenses before reductions do not reflect amounts reimbursed by the investment adviser or reductions from brokerage service arrangements or reductions from other expense offset arrangements and do not represent the amount paid by the class during periods when reimbursements or reductions occur. Expense ratios before reductions for start-up periods may not be representative of longer-term operating periods. Expenses net of fee waivers reflect expenses after reimbursement by the investment adviser but prior to reductions from brokerage service arrangements or other expense offset arrangements. Expenses net of all reductions represent the net expenses paid by the class.
I Amount represents less than $.01 per share.
See accompanying notes which are an integral part of the financial statements.
Annual Report
Financial Highlights - Institutional Class
Years ended October 31, | 2010 | 2009 | 2008 | 2007 | 2006 |
Selected Per-Share Data | | | | | |
Net asset value, beginning of period | $ 28.77 | $ 23.91 | $ 47.73 | $ 36.71 | $ 30.68 |
Income from Investment Operations | | | | | |
Net investment income (loss) B | .41 | .39 | .53 | .55 | .51 |
Net realized and unrealized gain (loss) | 3.55 | 4.86 | (22.24) | 11.85 | 7.25 |
Total from investment operations | 3.96 | 5.25 | (21.71) | 12.40 | 7.76 |
Distributions from net investment income | (.38) | (.39) | (.44) | (.40) | (.33) |
Distributions from net realized gain | (.04) | - | (1.67) | (.98) | (1.40) |
Total distributions | (.42) | (.39) | (2.11) | (1.38) | (1.73) |
Redemption fees added to paid in capital B,F | - | - | - | - | - |
Net asset value, end of period | $ 32.31 | $ 28.77 | $ 23.91 | $ 47.73 | $ 36.71 |
Total Return A | 13.84% | 22.52% | (47.51)% | 34.93% | 26.45% |
Ratios to Average Net Assets C,E | | | | | |
Expenses before reductions | .99% | 1.05% | 1.05% | .97% | 1.00% |
Expenses net of fee waivers, if any | .99% | 1.05% | 1.05% | .97% | 1.00% |
Expenses net of all reductions | .95% | 1.00% | 1.01% | .94% | .95% |
Net investment income (loss) | 1.40% | 1.60% | 1.54% | 1.36% | 1.49% |
Supplemental Data | | | | | |
Net assets, end of period (in millions) | $ 319 | $ 267 | $ 159 | $ 58 | $ 28 |
Portfolio turnover rateD | 82% | 98% | 79% | 56% | 56% |
A Total returns would have been lower had certain expenses not been reduced during the periods shown.
B Calculated based on average shares outstanding during the period.
C Fees and expenses of the underlying Fidelity Central Funds are not included in the Fund's expense ratio. The Fund indirectly bears its proportionate share of the expenses of any underlying Fidelity Central Funds.
D Amount does not include the portfolio activity of any underlying Fidelity Central Funds.
E Expense ratios reflect operating expenses of the class. Expenses before reductions do not reflect amounts reimbursed by the investment adviser or reductions from brokerage service arrangements or reductions from other expense offset arrangements and do not represent the amount paid by the class during periods when reimbursements or reductions occur. Expenses net of fee waivers reflect expenses after reimbursement by the investment adviser but prior to reductions from brokerage service arrangements or other expense offset arrangements. Expenses net of all reductions represent the net expenses paid by the class.
F Amount represents less than $.01 per share.
See accompanying notes which are an integral part of the financial statements.
Annual Report
Notes to Financial Statements
For the period ended October 31, 2010
(Amounts in thousands except ratios)
1. Organization.
Fidelity International Discovery Fund (the Fund) is a fund of Fidelity Investment Trust (the Trust) and is authorized to issue an unlimited number of shares. The Trust is registered under the Investment Company Act of 1940, as amended (the 1940 Act), as an open-end management investment company organized as a Massachusetts business trust. The Fund offers Class A, Class T, Class C, International Discovery, Class K and Institutional Class shares, each of which has equal rights as to assets and voting privileges. Effective after the close of business on September 1, 2010, Class B shares were closed to new accounts and additional purchases by existing shareholders. Each class has exclusive voting rights with respect to matters that affect that class. Class B shares will automatically convert to Class A shares after a holding period of seven years from the initial date of purchase. Investment income, realized and unrealized capital gains and losses, the common expenses of the Fund, and certain fund-level expense reductions, if any, are allocated on a pro-rata basis to each class based on the relative net assets of each class to the total net assets of the Fund. Each class differs with respect to transfer agent and distribution and service plan fees incurred. Certain expense reductions also differ by class. The Fund's investments in emerging markets can be subject to social, economic, regulatory, and political uncertainties and can be extremely volatile.
2. Investments in Fidelity Central Funds.
The Fund may invest in Fidelity Central Funds, which are open-end investment companies available only to other investment companies and accounts managed by Fidelity Management & Research Company (FMR) and its affiliates. The Fund's Schedule of Investments lists each of the Fidelity Central Funds held as of period end, if any, as an investment of the Fund, but does not include the underlying holdings of each Fidelity Central Fund. As an Investing Fund, the Fund indirectly bears its proportionate share of the expenses of the underlying Fidelity Central Funds.
The Money Market Central Funds seek preservation of capital and current income and are managed by Fidelity Investments Money Management, Inc. (FIMM), an affiliate of FMR.
A complete unaudited list of holdings for each Fidelity Central Fund is available upon request or at the Securities and Exchange Commission (the SEC) web site at www.sec.gov. In addition, the financial statements of the Fidelity Central Funds, which are not covered by the Fund's Report of Independent Registered Public Accounting Firm, are available on the SEC web site or upon request.
Annual Report
Notes to Financial Statements - continued
(Amounts in thousands except ratios)
3. Significant Accounting Policies.
The financial statements have been prepared in conformity with accounting principles generally accepted in the United States of America (GAAP), which require management to make certain estimates and assumptions at the date of the financial statements.
Actual results could differ from those estimates. The following summarizes the significant accounting policies of the Fund:
Security Valuation. Investments are valued as of 4:00 p.m. Eastern time on the last calendar day of the period. The Fund uses independent pricing services approved by the Board of Trustees to value its investments. When current market prices or quotations are not readily available or reliable, valuations may be determined in good faith in accordance with procedures adopted by the Board of Trustees. Factors used in determining value may include market or security specific events. The frequency with which these procedures are used cannot be predicted and they may be utilized to a significant extent. The value used for net asset value (NAV) calculation under these procedures may differ from published prices for the same securities.
The Fund categorizes the inputs to valuation techniques used to value its investments into a disclosure hierarchy consisting of three levels as shown below.
Level 1 - quoted prices in active markets for identical investments
Level 2 - other significant observable inputs (including quoted prices for similar investments, interest rates, prepayment speeds, etc.)
Level 3 - unobservable inputs (including the fund's own assumptions based on the best information available)
Changes in valuation techniques may result in transfers in or out of an assigned level within the disclosure hierarchy. The aggregate value of investments by input level, as of October 31, 2010, as well as a roll forward of Level 3 securities, is included at the end of the Fund's Schedule of Investments. Valuation techniques used to value the Fund's investments by major category are as follows.
Equity securities, including restricted securities, for which market quotations are readily available, are valued at the last reported sale price or official closing price as reported by an independent pricing service on the primary market or exchange on which they are traded and are categorized as Level 1 in the hierarchy. In the event there were no sales during the day or closing prices are not available, securities are valued at the last quoted bid price or may be valued using the last available price and are generally categorized as Level 2 in the hierarchy. For foreign equity securities, when significant market or security specific events arise, comparisons to the valuation of American Depositary Receipts
Annual Report
3. Significant Accounting Policies - continued
Security Valuation - continued
(ADRs), futures contracts, Exchange-traded funds (ETFs) and certain indexes as well as quoted prices for similar securities are used and are categorized as Level 2 in the hierarchy in these circumstances. Utilizing these techniques may result in significant transfers between Level 1 and Level 2. For restricted equity securities and private placements where observable inputs are limited, assumptions about market activity and risk are used and are categorized as Level 3 in the hierarchy.
Investments in open-end mutual funds,including the Fidelity Central Funds, are valued at their closing net asset value each business day and are categorized as Level 1 in the hierarchy. Short-term securities with remaining maturities of sixty days or less for which quotations are not readily available are valued at amortized cost, which approximates fair value and are categorized as Level 2 in the hierarchy.
Foreign Currency. The Fund uses foreign currency contracts to facilitate transactions in foreign-denominated securities. Gains and losses from these transactions may arise from changes in the value of the foreign currency or if the counterparties do not perform under the contracts' terms.
Foreign-denominated assets, including investment securities, and liabilities are translated into U.S. dollars at the exchange rate at period end. Purchases and sales of investment securities, income and dividends received and expenses denominated in foreign currencies are translated into U.S. dollars at the exchange rate in effect on the transaction date.
The effects of exchange rate fluctuations on investments are included with the net realized and unrealized gain (loss) on investment securities. Other foreign currency transactions resulting in realized and unrealized gain (loss) are disclosed separately.
Investment Transactions and Income. For financial reporting purposes, the Fund's investment holdings and NAV include trades executed through the end of the last business day of the period. The NAV per share for processing shareholder transactions is calculated as of the close of business of the New York Stock Exchange (NYSE), normally 4:00 p.m. Eastern time and includes trades executed through the end of the prior business day. Gains and losses on securities sold are determined on the basis of identified cost and may include proceeds received from litigation. Dividend income is recorded on the ex-dividend date, except for certain dividends from foreign securities where the ex-dividend date may have passed, which are recorded as soon as the Fund is informed of the ex-dividend date. Non-cash dividends included in dividend income, if any, are recorded at the fair market value of the securities received. Distributions received on securities that represent a return of capital or capital gain are recorded as a reduction of cost of investments and/or as a realized gain. The Fund estimates the components of
Annual Report
Notes to Financial Statements - continued
(Amounts in thousands except ratios)
3. Significant Accounting Policies - continued
Investment Transactions and Income - continued
distributions received that may be considered return of capital distributions or capital gain distributions. Interest income and distributions from the Fidelity Central Funds are accrued as earned. Interest income includes coupon interest and amortization of premium and accretion of discount on debt securities. Investment income is recorded net of foreign taxes withheld where recovery of such taxes is uncertain.
Expenses. Most expenses of the Trust can be directly attributed to a fund. Expenses which cannot be directly attributed are apportioned amongst each fund in the Trust. Expense estimates are accrued in the period to which they relate and adjustments are made when actual amounts are known.
Deferred Trustee Compensation. Under a Deferred Compensation Plan (the Plan), independent Trustees may elect to defer receipt of a portion of their annual compensation. Deferred amounts are invested in a cross-section of Fidelity funds, are marked-to-market and remain in the Fund until distributed in accordance with the Plan. The investment of deferred amounts and the offsetting payable to the Trustees are included in the accompanying Statement of Assets and Liabilities.
Income Tax Information and Distributions to Shareholders. Each year the Fund intends to qualify as a regulated investment company, including distributing substantially all of its taxable income and realized gains under Subchapter M of the Internal Revenue Code and filing its U.S. federal tax return. As a result, no provision for income taxes is required. As of October 31, 2010, the Fund did not have any unrecognized tax benefits in the accompanying financial statements. A fund's federal tax return is subject to examination by the Internal Revenue Service (IRS) for a period of three years. Foreign taxes are provided for based on the Fund's understanding of the tax rules and rates that exist in the foreign markets in which it invests. The Fund is subject to a tax imposed on short term capital gains on securities of certain issuers domiciled in India. The Fund records an estimated deferred tax liability included in Other payables and accrued expenses in the accompanying Statement of Assets & Liabilities for net unrealized gains on these securities in an amount that would be payable if the securities were disposed of at period end.
Distributions are declared and recorded on the ex-dividend date. Income dividends and capital gain distributions are declared separately for each class. Income and capital gain distributions are determined in accordance with income tax regulations, which may differ from GAAP.
Annual Report
3. Significant Accounting Policies - continued
Income Tax Information and Distributions to Shareholders - continued
Capital accounts within the financial statements are adjusted for permanent book-tax differences. These adjustments have no impact on net assets or the results of operations. Temporary book-tax differences will reverse in a subsequent period.
Book-tax differences are primarily due to the short-term gain distributions from the Fidelity Central Funds, foreign currency transactions, certain foreign taxes, passive foreign investment companies (PFIC), deferred trustees compensation, capital loss carryforwards and losses deferred due to wash sales.
The federal tax cost of investment securities and unrealized appreciation (depreciation) as of period end were as follows:
Gross unrealized appreciation | $ 1,665,347 |
Gross unrealized depreciation | (554,558) |
Net unrealized appreciation (depreciation) | $ 1,110,789 |
| |
Tax Cost | $ 9,060,967 |
The tax-based components of distributable earnings as of period end were as follows:
Undistributed ordinary income | $ 167,811 |
Capital loss carryforward | $ (1,803,058) |
Net unrealized appreciation (depreciation) | $ 1,112,591 |
The tax character of distributions paid was as follows:
| October 31, 2010 | October 31, 2009 |
Ordinary Income | $ 129,796 | $ 107,705 |
Short-Term Trading (Redemption) Fees. Shares held by investors in the Fund less than 30 days are subject to a redemption fee equal to 1.00% of the net asset value of shares redeemed. All redemption fees, which reduce the proceeds of the shareholder redemption, are retained by the Fund and accounted for as an addition to paid in capital.
4. Operating Policies.
Repurchase Agreements. FMR has received an Exemptive Order from the SEC which permits the Fund and other affiliated entities of FMR to transfer uninvested cash balances into joint trading accounts which are then invested in repurchase agreements.
Annual Report
Notes to Financial Statements - continued
(Amounts in thousands except ratios)
4. Operating Policies - continued
Repurchase Agreements - continued
The Fund may also invest directly with institutions in repurchase agreements. Repurchase agreements are collateralized by government or non-government securities. Upon settlement date, collateral is held in segregated accounts with custodian banks and may be obtained in the event of a default of the counterparty. The Fund monitors, on a daily basis, the value of the collateral to ensure it is at least equal to the principal amount of the repurchase agreement (including accrued interest). In the event of a default by the counterparty, realization of the collateral proceeds could be delayed, during which time the value of the collateral may decline.
Restricted Securities. The Fund may invest in securities that are subject to legal or contractual restrictions on resale. These securities generally may be resold in transactions exempt from registration or to the public if the securities are registered. Disposal of these securities may involve time-consuming negotiations and expense, and prompt sale at an acceptable price may be difficult. Information regarding restricted securities is included at the end of the Fund's Schedule of Investments.
5. Purchases and Sales of Investments.
Purchases and sales of securities, other than short-term securities, aggregated $7,811,097 and $8,569,062, respectively.
6. Fees and Other Transactions with Affiliates.
Management Fee. FMR and its affiliates provide the Fund with investment management related services for which the Fund pays a monthly management fee. The management fee is the sum of an individual fund fee rate that is based on an annual rate of .45% of the Fund's average net assets and a group fee rate that averaged .26% during the period. The group fee rate is based upon the average net assets of all the mutual funds advised by FMR. The group fee rate decreases as assets under management increase and increases as assets under management decrease. In addition, the management fee is subject to a performance adjustment (up to a maximum of ± 20% of the Fund's average net assets over a 36 month performance period). The upward or downward adjustment to the management fee is based on the relative investment performance of International Discovery share class as compared to an appropriate benchmark index. For the period, the total annual management fee rate, including the performance adjustment, was .75% of the Fund's average net assets.
Annual Report
6. Fees and Other Transactions with Affiliates - continued
Distribution and Service Plan Fees. In accordance with Rule 12b-1 of the 1940 Act, the Fund has adopted separate Distribution and Service Plans for each class of shares. Certain classes pay Fidelity Distributors Corporation (FDC), an affiliate of FMR, separate Distribution and Service Fees, each of which is based on an annual percentage of each class' average net assets. In addition, FDC may pay financial intermediaries for selling shares of the Fund and providing shareholder support services. For the period, the Distribution and Service Fee rates, total fees and amounts retained by FDC were as follows:
| Distribution
Fee | Service
Fee | Total
Fees | Retained
by FDC |
Class A | -% | .25% | $ 1,036 | $ 43 |
Class T | .25% | .25% | 447 | -* |
Class B | .75% | .25% | 156 | 117 |
Class C | .75% | .25% | 445 | 40 |
| | | $ 2,084 | $ 200 |
* Amount represents four hundred sixty dollars.
Sales Load. FDC receives a front-end sales charge of up to 5.75% for selling Class A shares, and 3.50% for selling Class T shares, some of which is paid to financial intermediaries for selling shares of the Fund. FDC receives the proceeds of contingent deferred sales charges levied on Class A, Class T, Class B, and Class C redemptions. These charges depend on the holding period. The deferred sales charges range from 5% to 1% for Class B, 1% for Class C, 1.00% for certain purchases of Class A shares (1.00% to .50% prior to July 12, 2010) and .25% for certain purchases of Class T shares.
For the period, sales charge amounts retained by FDC were as follows:
| Retained
by FDC |
Class A | $ 65 |
Class T | 12 |
Class B* | 31 |
Class C* | 2 |
| $ 110 |
* When Class B and Class C shares are initially sold, FDC pays commissions from its own resources to financial intermediaries through which the sales are made.
Transfer Agent Fees. Fidelity Investments Institutional Operations Company, Inc. (FIIOC), an affiliate of FMR, is the transfer, dividend disbursing and shareholder servicing agent for each class of the Fund. FIIOC receives account fees and asset-based fees that vary according to the account size and type of account of the shareholders of the respective classes of the Fund, except for Class K. FIIOC receives an asset-based fee of Class K's average net assets. FIIOC pays for typesetting, printing and mailing of
Annual Report
Notes to Financial Statements - continued
(Amounts in thousands except ratios)
6. Fees and Other Transactions with Affiliates - continued
Transfer Agent Fees - continued
shareholder reports, except proxy statements. For the period, transfer agent fees for each class were as follows:
| Amount | % of
Average
Net Assets |
Class A | $ 1,216 | .29 |
Class T | 281 | .31 |
Class B | 52 | .33 |
Class C | 136 | .31 |
International Discovery | 20,622 | .26 |
Class K | 437 | .05 |
Institutional Class | 627 | .20 |
| $ 23,371 | |
Accounting and Security Lending Fees. Fidelity Service Company, Inc. (FSC), an affiliate of FMR, maintains the Fund's accounting records. The accounting fee is based on the level of average net assets for the month. Under a separate contract, FSC administers the security lending program. The security lending fee is based on the number and duration of lending transactions.
Brokerage Commissions. The Fund placed a portion of its portfolio transactions with brokerage firms which are affiliates of the investment adviser. The commissions paid to these affiliated firms were $10 for the period.
Interfund Lending Program. Pursuant to an Exemptive Order issued by the SEC, the Fund, along with other registered investment companies having management contracts with FMR, may participate in an interfund lending program. This program provides an alternative credit facility allowing the funds to borrow from, or lend money to, other participating affiliated funds. At period end there was no interfund loans outstanding. The Fund's activity in this program during the period for which loans were outstanding was as follows:
Borrower or Lender | Average Daily
Loan Balance | Weighted Average
Interest Rate | Interest
Expense |
Borrower | $ 31,133 | .45% | $ 12 |
Annual Report
7. Committed Line of Credit.
The Fund participates with other funds managed by FMR or an affiliate in a $3.75 billion credit facility (the "line of credit") to be utilized for temporary or emergency purposes to fund shareholder redemptions or for other short-term liquidity purposes. The Fund has agreed to pay commitment fees on its pro-rata portion of the line of credit, which amounted to $38 and is reflected in Miscellaneous expenses on the Statement of Operations. During the period, there were no borrowings on this line of credit.
8. Security Lending.
The Fund lends portfolio securities through a lending agent from time to time in order to earn additional income. The lending agent may loan securities to certain qualified borrowers, including Fidelity Capital Markets (FCM), a broker-dealer affiliated with the Fund. On the settlement date of the loan, the Fund receives collateral (in the form of U.S. Treasury obligations, letters of credit and/or cash) against the loaned securities and maintains collateral in an amount not less than 100% of the market value of the loaned securities during the period of the loan. The market value of the loaned securities is determined at the close of business of the Fund and any additional required collateral is delivered to the Fund on the next business day. If the borrower defaults on its obligation to return the securities loaned because of insolvency or other reasons, a fund could experience delays and costs in recovering the securities loaned or in gaining access to the collateral. Any cash collateral received is invested in the Fidelity Securities Lending Cash Central Fund. The value of loaned securities and cash collateral at period end are disclosed on the Fund's Statement of Assets and Liabilities. Security lending income represents the income earned on investing cash collateral, less rebates paid to borrowers and lending agent fees associated with the loan, plus any premium payments received for lending certain types of securities. Security lending income is presented in the Statement of Operations as a component of income from Fidelity Central Funds. Total security lending income during the period amounted to $6,155. During the period, there were no securities loaned to FCM.
9. Bank Borrowings.
The Fund is permitted to have bank borrowings for temporary or emergency purposes to fund shareholder redemptions. The Fund has established borrowing arrangements with certain banks. The interest rate on the borrowings is the bank's base rate, as revised from time to time. The average daily loan balance during the period for which loans were outstanding amounted to $8,212. The weighted average interest rate was .71%. The interest expense amounted to one hundred sixty-two dollars under the bank borrowing program. At period end, there were no bank borrowings outstanding.
Annual Report
Notes to Financial Statements - continued
(Amounts in thousands except ratios)
10. Expense Reductions.
Many of the brokers with whom FMR places trades on behalf of the Fund provided services to the Fund in addition to trade execution. These services included payments of certain expenses on behalf of the Fund totaling $4,562 for the period.
11. Distributions to Shareholders.
Distributions to shareholders of each class were as follows:
Years ended October 31, | 2010 | 2009 |
From net investment income | | |
Class A | $ 3,889 | $ 3,982 |
Class T | 633 | 533 |
Class B | 37 | - |
Class C | 71 | 30 |
International Discovery | 98,508 | 96,783 |
Class K | 9,602 | 3,616 |
Institutional Class | 3,682 | 2,761 |
Total | $ 116,422 | $ 107,705 |
From net realized gain | | |
Class A | $ 555 | $ - |
Class T | 119 | - |
Class B | 23 | - |
Class C | 61 | - |
International Discovery | 11,290 | - |
Class K | 935 | - |
Institutional Class | 391 | - |
Total | $ 13,374 | $ - |
12. Share Transactions.
Transactions for each class of shares were as follows:
| Shares | Dollars |
Years ended October 31, | 2010 | 2009A | 2010 | 2009A |
Class A | | | | |
Shares sold | 4,849 | 5,354 | $ 142,203 | $ 128,318 |
Reinvestment of distributions | 120 | 132 | 3,654 | 2,786 |
Shares redeemed | (7,259) | (7,017) | (215,574) | (163,223) |
Net increase (decrease) | (2,290) | (1,531) | $ (69,717) | $ (32,119) |
Annual Report
12. Share Transactions - continued
| Shares | Dollars |
Years ended October 31, | 2010 | 2009A | 2010 | 2009A |
Class T | | | | |
Shares sold | 1,165 | 1,335 | $ 34,154 | $ 31,263 |
Reinvestment of distributions | 24 | 24 | 716 | 507 |
Shares redeemed | (1,228) | (1,140) | (35,631) | (25,765) |
Net increase (decrease) | (39) | 219 | $ (761) | $ 6,005 |
Class B | | | | |
Shares sold | 105 | 161 | $ 3,047 | $ 3,835 |
Reinvestment of distributions | 2 | - | 54 | - |
Shares redeemed | (227) | (227) | (6,544) | (5,155) |
Net increase (decrease) | (120) | (66) | $ (3,443) | $ (1,320) |
Class C | | | | |
Shares sold | 356 | 920 | $ 10,567 | $ 20,539 |
Reinvestment of distributions | 4 | 1 | 116 | 26 |
Shares redeemed | (515) | (953) | (14,926) | (22,201) |
Net increase (decrease) | (155) | (32) | $ (4,243) | $ (1,636) |
International Discovery | | | | |
Shares sold | 55,460 | 74,803 | $ 1,640,231 | $ 1,831,653 |
Conversion to Class K | - | (12,549) | - | (279,461) |
Reinvestment of distributions | 3,453 | 4,362 | 105,461 | 92,471 |
Shares redeemed | (89,239) | (77,871) | (2,636,183) | (1,831,786) |
Net increase (decrease) | (30,326) | (11,255) | $ (890,491) | $ (187,123) |
Class K | | | | |
Shares sold | 16,961 | 10,015 | $ 491,304 | $ 246,074 |
Conversion from International Discovery | - | 12,572 | - | 279,461 |
Reinvestment of distributions | 346 | 171 | 10,537 | 3,616 |
Shares redeemed | (7,377) | (5,401) | (215,813) | (128,754) |
Net increase (decrease) | 9,930 | 17,357 | $ 286,028 | $ 400,397 |
Institutional Class | | | | |
Shares sold | 4,322 | 10,440 | $ 127,580 | $ 235,326 |
Reinvestment of distributions | 36 | 41 | 1,083 | 875 |
Shares redeemed | (3,773) | (7,843) | (108,068) | (169,915) |
Net increase (decrease) | 585 | 2,638 | $ 20,595 | $ 66,286 |
A Conversion transactions for Class K and International Discovery are for the period November 1, 2008 though August 31, 2009.
Annual Report
Notes to Financial Statements - continued
(Amounts in thousands except ratios)
13. Other.
The Fund's organizational documents provide former and current trustees and officers with a limited indemnification against liabilities arising in connection with the performance of their duties to the Fund. In the normal course of business, the Fund may also enter into contracts that provide general indemnifications. The Fund's maximum exposure under these arrangements is unknown as this would be dependent on future claims that may be made against the Fund. The risk of material loss from such claims is considered remote.
Annual Report
To the Trustees of Fidelity Investment Trust and the Shareholders of Fidelity International Discovery Fund:
In our opinion, the accompanying statement of assets and liabilities, including the schedule of investments, and the related statements of operations and of changes in net assets and the financial highlights present fairly, in all material respects, the financial position of Fidelity International Discovery Fund (a fund of Fidelity Investment Trust) at October 31, 2010, the results of its operations for the year then ended, the changes in its net assets for each of the two years in the period then ended and the financial highlights for each of the five years in the period then ended, in conformity with accounting principles generally accepted in the United States of America. These financial statements and financial highlights (hereafter referred to as "financial statements") are the responsibility of the Fidelity International Discovery Fund's management. Our responsibility is to express an opinion on these financial statements based on our audits. We conducted our audits of these financial statements in accordance with the standards of the Public Company Accounting Oversight Board (United States). Those standards require that we plan and perform the audit to obtain reasonable assurance about whether the financial statements are free of material misstatement. An audit includes examining, on a test basis, evidence supporting the amounts and disclosures in the financial statements, assessing the accounting principles used and significant estimates made by management, and evaluating the overall financial statement presentation. We believe that our audits, which included confirmation of securities at October 31, 2010 by correspondence with the custodian and brokers, provide a reasonable basis for our opinion.
/s/ PricewaterhouseCoopers LLP
PricewaterhouseCoopers LLP
Boston, Massachusetts
December 17, 2010
Annual Report
The Trustees, Member of the Advisory Board, and executive officers of the trust and fund, as applicable, are listed below. The Board of Trustees governs the fund and is responsible for protecting the interests of shareholders. The Trustees are experienced executives who meet periodically throughout the year to oversee the fund's activities, review contractual arrangements with companies that provide services to the fund, oversee management of the risks associated with such activities and contractual arrangements, and review the fund's performance. Except for James C. Curvey, each of the Trustees oversees 221 funds advised by FMR or an affiliate. Mr. Curvey oversees 410 funds advised by FMR or an affiliate.
The Trustees hold office without limit in time except that (a) any Trustee may resign; (b) any Trustee may be removed by written instrument, signed by at least two-thirds of the number of Trustees prior to such removal; (c) any Trustee who requests to be retired or who has become incapacitated by illness or injury may be retired by written instrument signed by a majority of the other Trustees; and (d) any Trustee may be removed at any special meeting of shareholders by a two-thirds vote of the outstanding voting securities of the trust. Each Trustee who is not an interested person (as defined in the 1940 Act) (Independent Trustee), shall retire not later than the last day of the calendar year in which his or her 72nd birthday occurs. The Independent Trustees may waive this mandatory retirement age policy with respect to individual Trustees. The executive officers and Advisory Board Member hold office without limit in time, except that any officer and Advisory Board Member may resign or may be removed by a vote of a majority of the Trustees at any regular meeting or any special meeting of the Trustees. Except as indicated, each individual has held the office shown or other offices in the same company for the past five years.
Experience, Skills, Attributes, and Qualifications of the Fund's Trustees. The Governance and Nominating Committee has adopted a statement of policy that describes the experience, qualifications, attributes, and skills that are necessary and desirable for potential Independent Trustee candidates (Statement of Policy). The Board believes that each Trustee satisfied at the time he or she was initially elected or appointed a Trustee, and continues to satisfy, the standards contemplated by the Statement of Policy. The Governance and Nominating Committee also engages professional search firms to help identify potential Independent Trustee candidates who have the experience, qualifications, attributes, and skills consistent with the Statement of Policy. From time to time, additional criteria based on the composition and skills of the current Independent Trustees, as well as experience or skills that may be appropriate in light of future changes to board composition, business conditions, and regulatory or other developments, have also been considered by the professional search firms and the Governance and Nominating Committee. In addition, the Board takes into account the Trustees' commitment and participation in Board and committee meetings, as well as their leadership of standing and ad hoc committees throughout their tenure.
In determining that a particular Trustee was and continues to be qualified to serve as a Trustee, the Board has considered a variety of criteria, none of which, in isolation, was controlling. The Board believes that, collectively, the Trustees have balanced and diverse experience, qualifications, attributes, and skills, which allow the Board to operate effectively in governing the fund and protecting the interests of shareholders. Information about the specific experience, skills, attributes, and qualifications of each Trustee, which in each case led to the Board's conclusion that the Trustee should serve (or continue to serve) as a trustee of the fund, is provided below.
Annual Report
Trustees and Officers - continued
Board Structure and Oversight Function. Edward C. Johnson 3d is an interested person (as defined in the 1940 Act) and currently serves as Chairman. The Trustees have determined that an interested Chairman is appropriate and benefits shareholders because an interested Chairman has a personal and professional stake in the quality and continuity of services provided to the fund. Independent Trustees exercise their informed business judgment to appoint an individual of their choosing to serve as Chairman, regardless of whether the Trustee happens to be independent or a member of management. The Independent Trustees have determined that they can act independently and effectively without having an Independent Trustee serve as Chairman and that a key structural component for assuring that they are in a position to do so is for the Independent Trustees to constitute a substantial majority for the Board. The Independent Trustees also regularly meet in executive session. Ned C. Lautenbach serves as Chairman of the Independent Trustees and as such (i) acts as a liaison between the Independent Trustees and management with respect to matters important to the Independent Trustees and (ii) with management prepares agendas for Board meetings.
Fidelity funds are overseen by different Boards of Trustees. The fund's Board oversees Fidelity's equity and high income funds and another Board oversees Fidelity's investment-grade bond, money market, and asset allocation funds. The asset allocation funds may invest in Fidelity funds overseen by the fund's Board. The use of separate Boards, each with its own committee structure, allows the Trustees of each group of Fidelity funds to focus on the unique issues of the funds they oversee, including common research, investment, and operational issues. On occasion, the separate Boards establish joint committees to address issues of overlapping consequences for the Fidelity funds overseen by each Board.
The Trustees operate using a system of committees to facilitate the timely and efficient consideration of all matters of importance to the Trustees, the fund, and fund shareholders and to facilitate compliance with legal and regulatory requirements and oversight of the fund's activities and associated risks. The Board, acting through its committees, has charged FMR and its affiliates with (i) identifying events or circumstances the occurrence of which could have demonstrably adverse effects on the fund's business and/or reputation; (ii) implementing processes and controls to lessen the possibility that such events or circumstances occur or to mitigate the effects of such events or circumstances if they do occur; and (iii) creating and maintaining a system designed to evaluate continuously business and market conditions in order to facilitate the identification and implementation processes described in (i) and (ii) above. Because the day-to-day operations and activities of the fund are carried out by or through FMR, its affiliates and other service providers, the fund's exposure to risks is mitigated but not eliminated by the processes overseen by the Trustees. While each of the Board's committees has responsibility for overseeing different aspects of the fund's activities, oversight is exercised primarily through the Operations, Audit, and Compliance Committees. Appropriate personnel, including but not limited to the fund's Chief Compliance Officer (CCO), FMR's internal auditor, the independent accountants, the fund's Treasurer and portfolio management personnel, make periodic reports to the Board's committees, as appropriate. The responsibilities of each committee, including their oversight responsibilities, are described further under "Standing Committees of the Fund's Trustees."
Annual Report
The fund's Statement of Additional Information (SAI) includes more information about the Trustees. To request a free copy, call Fidelity at 1-800-544-8544.
Interested Trustees*:
Correspondence intended for each Trustee who is an interested person may be sent to Fidelity Investments, 82 Devonshire Street, Boston, Massachusetts 02109.
Name, Age; Principal Occupations and Other Relevant Experience+ |
Edward C. Johnson 3d (80) |
| Year of Election or Appointment: 1984 Mr. Johnson is Trustee and Chairman of the Board of Trustees of certain Trusts. Mr. Johnson serves as Chief Executive Officer, Chairman, and a Director of FMR LLC; Chairman and a Director of FMR; Chairman and a Director of Fidelity Research & Analysis Company (FRAC); Chairman and a Director of Fidelity Investments Money Management, Inc.; and Chairman and a Director of FMR Co., Inc. In addition, Mr. Johnson serves as Chairman and Director of FIL Limited. Previously, Mr. Johnson served as President of FMR LLC (2006-2007). |
James C. Curvey (75) |
| Year of Election or Appointment: 2007 Mr. Curvey also serves as Trustee (2007-present) of other investment companies advised by FMR. Mr. Curvey is a Director of Fidelity Investments Money Management, Inc. (2009-present), Director of Fidelity Research & Analysis Co. (2009-present) and Director of FMR and FMR Co., Inc. (2007-present). Mr. Curvey is also Vice Chairman (2007-present) and Director of FMR LLC. In addition, Mr. Curvey serves as an Overseer for the Boston Symphony Orchestra and a member of the Trustees of Villanova University. Previously, Mr. Curvey was the Vice Chairman (2006-2007) and Director (2000-2007) of FMR Corp. |
* Trustees have been determined to be "Interested Trustees" by virtue of, among other things, their affiliation with the trust or various entities under common control with FMR.
Annual Report
Trustees and Officers - continued
+ The information above includes each Trustee's principal occupation during the last five years and other information relating to the experience, attributes, and skills relevant to each Trustee's qualifications to serve as a Trustee, which led to the conclusion that each Trustee should serve as a Trustee for the fund.
Independent Trustees:
Correspondence intended for each Independent Trustee (that is, the Trustees other than the Interested Trustees) may be sent to Fidelity Investments, P.O. Box 55235, Boston, Massachusetts 02205-5235.
Name, Age; Principal Occupations and Other Relevant Experience+ |
Dennis J. Dirks (62) |
| Year of Election or Appointment: 2005 Prior to his retirement in May 2003, Mr. Dirks was Chief Operating Officer and a member of the Board of The Depository Trust & Clearing Corporation (DTCC). He also served as President, Chief Operating Officer, and Board member of The Depository Trust Company (DTC) and President and Board member of the National Securities Clearing Corporation (NSCC). In addition, Mr. Dirks served as Chief Executive Officer and Board member of the Government Securities Clearing Corporation, Chief Executive Officer and Board member of the Mortgage-Backed Securities Clearing Corporation, as a Trustee and a member of the Finance Committee of Manhattan College (2005-2008), and as a Trustee and a member of the Finance Committee of AHRC of Nassau County (2006-2008). Mr. Dirks is a member of the Independent Directors Council (IDC) Governing Council (2010-Present) and Board of Directors for The Brookville Center for Children's Services, Inc. (2009-present). |
Alan J. Lacy (57) |
| Year of Election or Appointment: 2008 Mr. Lacy serves as Senior Adviser (2007-present) of Oak Hill Capital Partners, L.P. (private equity). Mr. Lacy also served as Chief Executive Officer (2000-2005) and Vice Chairman (2005-2006) of Sears Holdings Corporation and Sears, Roebuck and Co. (retail). In addition, Mr. Lacy serves as a member of the Board of Directors of The Western Union Company (global money transfer, 2006-present) and Bristol-Myers Squibb Company (global pharmaceuticals, 2007-present). Mr. Lacy is Chairman (2008-present) and a member (2006-present) of the Board of Trustees of The National Parks Conservation Association. |
Ned C. Lautenbach (66) |
| Year of Election or Appointment: 2000 Mr. Lautenbach is Chairman of the Independent Trustees of the Equity and High Income Funds (2006-present). Mr. Lautenbach currently serves as the Lead Director of the Eaton Corporation Board of Directors (diversified industrial, 1997-present). Mr. Lautenbach is also a member of the Board of Directors of the Philharmonic Center for the Arts in Naples, Florida (1999-present); a member of the Board of Trustees of Fairfield University (2005-present); and a member of the Council on Foreign Relations (1994-present). Previously, Mr. Lautenbach was a Partner/Advisory Partner at Clayton, Dubilier & Rice, Inc. (private equity investment, 1998-2010), as well as a Director of Sony Corporation (2006-2007). |
Joseph Mauriello (66) |
| Year of Election or Appointment: 2008 Prior to his retirement in January 2006, Mr. Mauriello served in numerous senior management positions including Deputy Chairman and Chief Operating Officer (2004-2005), and Vice Chairman of Financial Services (2002-2004) of KPMG LLP US (professional services, 1965-2005). Mr. Mauriello currently serves as a member of the Board of Directors of XL Group plc. (global insurance and re-insurance, 2006-present) and of Arcadia Resources Inc. (health care services and products, 2007-present). Previously, Mr. Mauriello served as a Director of the Hamilton Funds of the Bank of New York (2006-2007). |
Cornelia M. Small (66) |
| Year of Election or Appointment: 2005 Ms. Small is a member of the Board of Directors of the Teagle Foundation (2009-present). Ms. Small is also a member of the Investment Committee, and Chair (2008-present) and a member of the Board of Trustees of Smith College. In addition, Ms. Small serves on the Investment Committee of the Berkshire Taconic Community Foundation (2008-present). Previously, Ms. Small served as Chairperson of the Investment Committee (2002- 2008) of Smith College. In addition, Ms. Small served as Chief Investment Officer, Director of Global Equity Investments, and a member of the Board of Directors of Scudder, Stevens & Clark and Scudder Kemper Investments. |
William S. Stavropoulos (71) |
| Year of Election or Appointment: 2001 Mr. Stavropoulos is Vice Chairman of the Independent Trustees of the Equity and High Income Funds (2006-present). Mr. Stavropoulos serves as President and Founder of the Michigan Baseball Foundation, the Great Lakes Loons (2007-present). Mr. Stavropoulos is Chairman Emeritus of the Board of Directors of The Dow Chemical Company, where he previously served in numerous senior management positions, including President, CEO (1995-2000; 2002-2004), Chairman of the Executive Committee (2000-2006), and as a member of the Board of Directors (1990-2006). Currently, Mr. Stavropoulos is Chairman of Univar (global distributor of commodity and specialty chemicals, 2010-present), a Director of Teradata Corporation (data warehousing and technology solutions, 2008-present), Chemical Financial Corporation, Maersk Inc. (industrial conglomerate), Tyco International, Inc. (multinational manufacturing and services, 2007-present), and a member of the Advisory Board for Metalmark Capital (private equity investment, 2005-present). Mr. Stavropoulos is a special advisor to Clayton, Dubilier & Rice, Inc. (private equity investment). In addition, Mr. Stavropoulos is a member of the University of Notre Dame Advisory Council for the College of Science. |
David M. Thomas (61) |
| Year of Election or Appointment: 2008 Previously, Mr. Thomas served as Executive Chairman (2005-2006) and Chairman and Chief Executive Officer (2000-2005) of IMS Health, Inc. (pharmaceutical and healthcare information solutions). In addition, Mr. Thomas serves as a member of the Board of Directors of Fortune Brands, Inc. (consumer products), and Interpublic Group of Companies, Inc. (marketing communication, 2004-present). |
Michael E. Wiley (60) |
| Year of Election or Appointment: 2008 Mr. Wiley also serves as a Director of Asia Pacific Exploration Consolidated (international oil and gas exploration and production, 2008-present). Mr. Wiley serves as a Director of Tesoro Corporation (independent oil refiner and marketer, 2005-present), and a Director of Bill Barrett Corporation (exploration and production, 2005-present). In addition, Mr. Wiley also serves as a Director of Post Oak Bank (privately-held bank, 2004-present). Previously, Mr. Wiley served as a member of the Board of Trustees of the University of Tulsa (2000-2006; 2007- 2010), as a Senior Energy Advisor of Katzenbach Partners, LLC (consulting, 2006-2007), as an Advisory Director of Riverstone Holdings (private investment), Chairman, President, and CEO of Baker Hughes, Inc. (oilfield services, 2000-2004), and as Director of Spinnaker Exploration Company (exploration and production, 2001-2005). |
Annual Report
+ The information above includes each Trustee's principal occupation during the last five years and other information relating to the experience, attributes, and skills relevant to each Trustee's qualifications to serve as a Trustee, which led to the conclusion that each Trustee should serve as a Trustee for the fund.
Advisory Board Member and Executive Officers:
Correspondence intended for each executive officer and Peter S. Lynch may be sent to Fidelity Investments, 82 Devonshire Street, Boston, Massachusetts 02109.
Name, Age; Principal Occupation |
Peter S. Lynch (66) |
| Year of Election or Appointment: 2003 Member of the Advisory Board of Fidelity's Equity and High Income Funds. Mr. Lynch is Vice Chairman and a Director of FMR and FMR Co., Inc. In addition, Mr. Lynch serves as a Trustee of Boston College and as the Chairman of the Inner-City Scholarship Fund. Previously, Mr. Lynch served on the Special Olympics International Board of Directors (1997-2006). |
Kenneth B. Robins (41) |
| Year of Election or Appointment: 2008 President and Treasurer of Fidelity's Equity and High Income Funds. Mr. Robins also serves as President and Treasurer (2010-present) and Assistant Treasurer (2009-present) of other Fidelity funds and is an employee of Fidelity Investments (2004-present). Previously, Mr. Robins served as Deputy Treasurer of the Fidelity funds (2005-2008) and Treasurer and Chief Financial Officer of The North Carolina Capital Management Trust: Cash and Term Portfolios (2006-2008). |
Bruce T. Herring (45) |
| Year of Election or Appointment: 2006 Vice President of certain Equity Funds. Mr. Herring also serves as Chief Investment Officer and Director of Fidelity Management & Research (U.K.) Inc. (2010-present) and Group Chief Investments Officer of FMR. Previously, Mr. Herring served as Vice President (2005-2006) and Senior Vice President (2006-2007) of Fidelity Management & Research Company, Vice President of FMR Co., Inc. (2001-2007) and as a portfolio manager for Fidelity U.S. Equity Funds. |
Brian B. Hogan (46) |
| Year of Election or Appointment: 2009 Vice President of certain Equity Funds and Vice President of Sector Funds. Mr. Hogan also serves as President of FMR's Equity Division (2009-present). Previously, Mr. Hogan served as Senior Vice President, Equity Research of FMR (2006-2009) and as a portfolio manager. |
Scott C. Goebel (42) |
| Year of Election or Appointment: 2008 Secretary and Chief Legal Officer (CLO) of the Fidelity funds. Mr. Goebel also serves as Secretary and CLO of The North Carolina Capital Management Trust: Cash and Term Portfolio (2008-present); General Counsel, Secretary, and Senior Vice President of FMR (2008-present) and FMR Co., Inc. (2008-present); Deputy General Counsel of FMR LLC; Chief Legal Officer of Fidelity Management & Research (Hong Kong) Limited (2008-present) and Assistant Secretary of Fidelity Management & Research (Japan) Inc. (2008-present), Fidelity Investments Money Management, Inc. (2008-present), Fidelity Management & Research (U.K.) Inc. (2008-present), and Fidelity Research and Analysis Company (2008-present). Previously, Mr. Goebel served as Assistant Secretary of the Funds (2007-2008) and as Vice President and Secretary of Fidelity Distributors Corporation (FDC) (2005-2007). |
William C. Coffey (41) |
| Year of Election or Appointment: 2009 Assistant Secretary of Fidelity's Equity and High Income Funds. Mr. Coffey also serves as Senior Vice President and Deputy General Counsel of FMR LLC (2010-present), and is an employee of Fidelity Investments. Previously, Mr. Coffey served as Vice President and Associate General Counsel of FMR LLC (2005-2009). |
Holly C. Laurent (56) |
| Year of Election or Appointment: 2008 Anti-Money Laundering (AML) Officer of the Fidelity funds. Ms. Laurent also serves as AML Officer of The North Carolina Capital Management Trust: Cash and Term Portfolio (2008-present) and is an employee of Fidelity Investments. Previously, Ms. Laurent was Senior Vice President and Head of Legal for Fidelity Business Services India Pvt. Ltd. (2006-2008), and Senior Vice President, Deputy General Counsel and Group Head for FMR LLC (2005-2006). |
Christine Reynolds (52) |
| Year of Election or Appointment: 2008 Chief Financial Officer of the Fidelity funds. Ms. Reynolds became President of Fidelity Pricing and Cash Management Services (FPCMS) in August 2008. Ms. Reynolds served as Chief Operating Officer of FPCMS (2007-2008). Previously, Ms. Reynolds served as President, Treasurer, and Anti-Money Laundering officer of the Fidelity funds (2004-2007). |
Kenneth A. Rathgeber (63) |
| Year of Election or Appointment: 2004 Chief Compliance Officer of Fidelity's Equity and High Income Funds. Mr. Rathgeber is Chief Compliance Officer of Fidelity Management & Research (Hong Kong) Limited (2008-present), Fidelity Management & Research (Japan) Inc. (2008-present), FMR (2005-present), FMR Co., Inc. (2005-present), Fidelity Management & Research (U.K.) Inc. (2005-present), Fidelity Research & Analysis Company (2005-present), Fidelity Investments Money Management, Inc. (2005-present), Pyramis Global Advisors, LLC (2005-present), and Strategic Advisers, Inc. (2005-present). |
Jeffrey S. Christian (49) |
| Year of Election or Appointment: 2009 Deputy Treasurer of the Fidelity funds. Mr. Christian is an employee of Fidelity Investments. Previously, Mr. Christian served as Chief Financial Officer (2008-2009) of certain Fidelity funds and Senior Vice President of Fidelity Pricing and Cash Management Services (FPCMS) (2004-2009). |
Bryan A. Mehrmann (49) |
| Year of Election or Appointment: 2005 Deputy Treasurer of the Fidelity funds. Mr. Mehrmann is an employee of Fidelity Investments. |
Adrien E. Deberghes (43) |
| Year of Election or Appointment: 2008 Deputy Treasurer of Fidelity's Equity and High Income Funds. Mr. Deberghes also serves as Assistant Treasurer of other Fidelity funds (2010-present) and is an employee of Fidelity Investments (2008-present). Previously, Mr. Deberghes served as Senior Vice President of Mutual Fund Administration at State Street Corporation (2007-2008), Senior Director of Mutual Fund Administration at Investors Bank & Trust (2005-2007), and Director of Finance for Dunkin' Brands (2000-2005). |
Stephanie J. Dorsey (41) |
| Year of Election or Appointment: 2010 Assistant Treasurer of Fidelity's Equity and High Income Funds. Ms. Dorsey also serves as Deputy Treasurer of other Fidelity funds (2008-present) and is an employee of Fidelity Investments (2008-present). Previously, Ms. Dorsey served as Treasurer (2004-2008) of the JPMorgan Mutual Funds and Vice President (2004-2008) of JPMorgan Chase Bank. |
John R. Hebble (52) |
| Year of Election or Appointment: 2009 Assistant Treasurer of Fidelity's Equity and High Income Funds. Mr. Hebble also serves as Treasurer and Chief Financial Officer of The North Carolina Capital Management Trust: Cash and Term Portfolio (2008-present), President and Treasurer of other Fidelity funds (2008-present) and is an employee of Fidelity Investments. |
Gary W. Ryan (52) |
| Year of Election or Appointment: 2005 Assistant Treasurer of the Fidelity funds. Mr. Ryan is an employee of Fidelity Investments. Previously, Mr. Ryan served as Vice President of Fund Reporting in Fidelity Pricing and Cash Management Services (FPCMS) (1999-2005). |
Jonathan Davis (42) |
| Year of Election or Appointment: 2010 Assistant Treasurer of the Fidelity funds. Mr. Davis is an employee of Fidelity Investments. Previously, Mr. Davis served as Vice President and Associate General Counsel of FMR LLC (2003-2010). |
Annual Report
The Board of Trustees of Fidelity International Discovery Fund voted to pay to shareholders of record at the opening of business on record date, the following distributions per share derived from capital gains realized from sales of portfolio securities, and dividends derived from net investment income:
| Pay Date | Record Date | Dividends | Capital Gains |
Fidelity International
Discovery Fund | 12/06/10 | 12/03/10 | $0.423 | $0.155 |
Fidelity International Discovery Fund designates 100% of the dividend distributed in December during the fiscal year as amounts which may be taken into account as a dividend for purposes of the maximum rate under section 1(h)(11) of the Internal Revenue Code.
The amounts per share which represent income derived from sources within, and taxes paid to, foreign countries or possessions of the United States are as follows:
| Pay Date | Income | Taxes |
Fidelity International
Discovery Fund | 12/07/09 | $0.346 | $0.0296 |
The fund will notify shareholders in January 2011 of amounts for use in preparing 2010 income tax returns.
Annual Report
Board Approval of Investment Advisory Contracts and Management Fees
Fidelity International Discovery Fund
Each year, the Board of Trustees, including the Independent Trustees (together, the Board), votes on the renewal of the management contract and sub-advisory agreements (together, the Advisory Contracts) for the fund. The Board, assisted by the advice of fund counsel and Independent Trustees' counsel, requests and considers a broad range of information relevant to the renewal of the Advisory Contracts throughout the year.
The Board meets regularly and considers at each of its meetings factors that are relevant to its annual consideration of the renewal of the fund's Advisory Contracts, including the services and support provided to the fund and its shareholders. The Board has established various standing committees, each composed of Independent Trustees with varying backgrounds, to which the Board has assigned specific subject matter responsibilities in order to enhance effective decision-making by the Board. The Board, acting directly and through its Committees, requests and receives information concerning the annual consideration of the renewal of the fund's Advisory Contracts. The Board also meets as needed to consider matters specifically related to the Board's annual consideration of the renewal of Advisory Contracts. Members of the Board may also meet with trustees of other Fidelity funds through ad hoc joint committees to discuss certain matters relevant to the Fidelity funds.
At its July 2010 meeting, the Board of Trustees, including the Independent Trustees, unanimously determined to renew the fund's Advisory Contracts. In reaching its determination, the Board considered all factors it believed relevant, including (i) the nature, extent, and quality of the services to be provided to the fund and its shareholders (including the investment performance of the fund); (ii) the competitiveness of the fund's management fee and total expenses; (iii) the total costs of the services to be provided by and the profits to be realized by Fidelity from its relationship with the fund; (iv) the extent to which economies of scale would be realized as the fund grows; and (v) whether fee levels reflect these economies of scale, if any, for the benefit of fund shareholders.
In considering whether to renew the Advisory Contracts for the fund, the Board reached a determination, with the assistance of fund counsel and Independent Trustees' counsel and through the exercise of its business judgment, that the renewal of the Advisory Contracts is in the best interests of fund shareholders and that the compensation to be received by Fidelity under the management contract is fair and reasonable. The Board's decision to renew the Advisory Contracts was not based on any single factor noted above, but rather was based on a comprehensive consideration of all the information provided to the Board at its meetings throughout the year. The Board, in reaching its determination to renew the Advisory Contracts, is aware that shareholders in the fund have a broad range of investment choices available to them, including a wide choice among mutual funds offered by Fidelity's competitors, and that the fund's shareholders, with the opportunity to review and weigh the disclosure provided by the fund in its prospectus and other public disclosures, have chosen to invest in this fund, managed by Fidelity.
Annual Report
Nature, Extent, and Quality of Services Provided. The Board considered the staffing within the investment adviser, FMR, and the sub-advisers (together, the Investment Advisers), including the backgrounds of the fund's investment personnel and the fund's investment objective and discipline. The Independent Trustees also had discussions with senior management of Fidelity's investment operations and investment groups. The Board considered the structure of the portfolio manager compensation program and whether this structure provides appropriate incentives to act in the best interest of the fund.
Resources Dedicated to Investment Management and Support Services. The Board and the equity research subcommittee of the Board's Fund Oversight Committee reviewed the size, education, and experience of the Investment Advisers' investment staff, their use of technology, and the Investment Advisers' approach to recruiting, training, and retaining portfolio managers and other research, advisory, and management personnel. The Board noted that Fidelity's analysts have access to a variety of technological tools and market and securities data that enable them to perform both fundamental and quantitative analysis and to specialize in various disciplines. The Board considered Fidelity's extensive global research capabilities that enable the Investment Advisers to aggregate data from various sources in an effort to produce positive investment results. The Board also considered that Fidelity's portfolio managers and analysts have access to daily portfolio attribution that allows for monitoring of a fund's portfolio, as well as an electronic communication system that provides immediate real-time access to research concerning issuers and credit enhancers. The Board noted FMR's continued focus on strengthening the organization and discipline of equity portfolio management and research.
Shareholder and Administrative Services. The Board considered (i) the nature, extent, quality, and cost of advisory, administrative, and shareholder services performed by the Investment Advisers and their affiliates under the Advisory Contracts and under separate agreements covering transfer agency, pricing and bookkeeping, and securities lending services for the fund; (ii) the nature and extent of the investment adviser's supervision of third party service providers, principally custodians and subcustodians; and (iii) the resources devoted to, and the record of compliance with, the fund's compliance policies and procedures. The Board also reviewed the allocation of fund brokerage, including allocations to brokers affiliated with the Investment Advisers, the use of brokerage commissions to pay fund expenses, and the use of "soft" commission dollars to pay for research services.
The Board noted that the growth of fund assets over time across the complex allows Fidelity to reinvest in the development of services designed to enhance the value or convenience of the Fidelity funds as investment vehicles. These services include 24-hour access to account information and market information through phone representatives and over the Internet, and investor education materials and asset allocation tools.
Annual Report
Board Approval of Investment Advisory Contracts and
Management Fees - continued
Investment in a Large Fund Family. The Board considered the benefits to shareholders of investing in a Fidelity fund, including the benefits of investing in a fund that is part of a large family of funds offering a variety of investment disciplines and providing a large variety of mutual fund investor services. The Board noted that Fidelity had taken, or had made recommendations that resulted in the Fidelity funds taking, a number of actions over the previous year that benefited particular funds, including (i) dedicating additional resources to investment research and restructuring and broadening the focus of the investment research teams; (ii) bolstering the senior management team that oversees asset management; (iii) launching Class F of certain funds as a lower-fee class available to Freedom K and Freedom Index Funds; (iv) lowering the initial investment minimums and ongoing balance requirements for Real Estate High Income Fund; (v) eliminating subsequent purchase minimums for all funds and adding a waiver of the investment minimum requirement for new accounts opened with the proceeds of a systematic withdrawal plan; (vi) eliminating the withdrawal minimum and maximum limits for systematic withdrawals from Advisor funds; (vii) expanding sales load waivers on Class A shares for Destiny Planholders and expanding Institutional Class eligibility for Class O Destiny Planholders; and (viii) changing certain Class A and Class T sales charge structures to further align them with industry practices.
Investment Performance. The Board considered whether the fund has operated in accordance with its investment objective, as well as its record of compliance with its investment restrictions. It also reviewed the fund's absolute investment performance for each class, as well as the fund's relative investment performance for each class measured over multiple periods against (i) a broad-based securities market index, and (ii) a peer group of mutual funds deemed appropriate by Fidelity and reviewed by the Board. The following charts considered by the Board show, over the one-, three-, and five-year periods ended December 31, 2009, as available, the cumulative total returns of Institutional Class (Class I) and the retail class of the fund, the cumulative total returns of a broad-based securities market index ("benchmark"), and a range of cumulative total returns of a peer group of mutual funds identified by Morningstar, Inc. as having an investment style similar to that of the fund based on underlying portfolio holdings. The returns of the retail class and Class B show the performance of the highest performing class (based on five-year performance) and the lowest performing class (based on three-year performance), respectively. The box within each chart shows the 25th percentile return (bottom of box) and the 75th percentile return (top of box) of the peer group. Returns shown above the box are in the first quartile and returns shown below the box are in the fourth quartile. The percentage beaten numbers noted below each chart correspond to the percentile box and represent the percentage of funds in the peer group whose performance was equal to or lower than that of the class indicated.
Annual Report
Fidelity International Discovery Fund
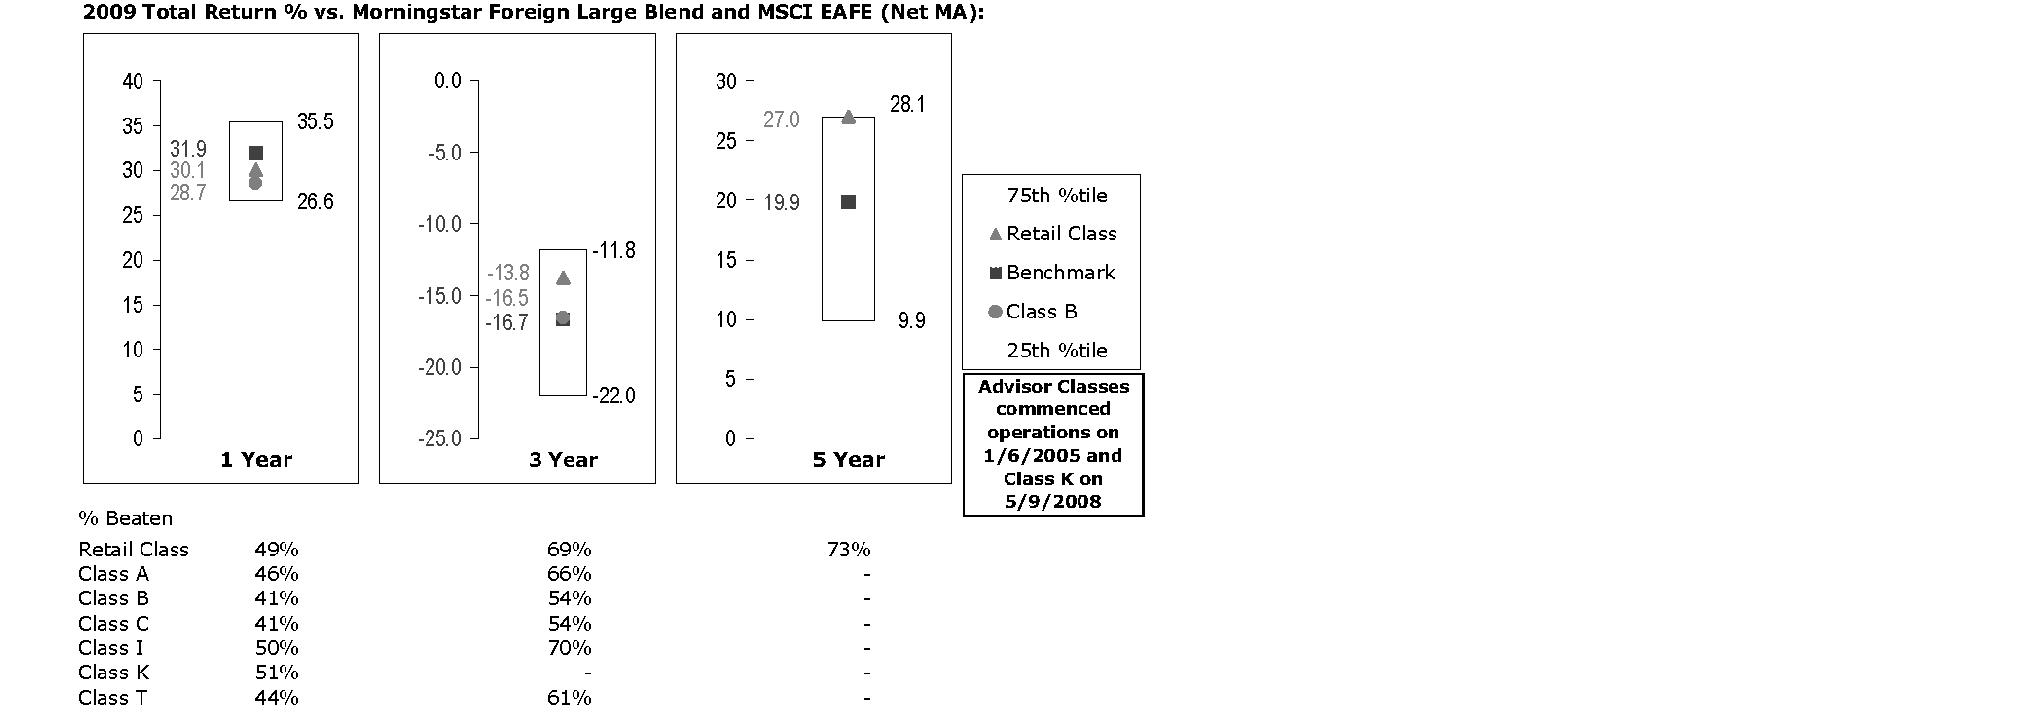
The Board reviewed the fund's relative investment performance against its peer group and noted that the performance of the retail class of the fund (the class with the longer performance record) was in the third quartile for the one-year period and the second quartile for the three- and five-year periods. The Board also noted that the investment performance of the retail class of the fund compared favorably to its benchmark for the three- and five-year periods, although the fund's one-year cumulative total return was lower than its benchmark. The Board considered that the variations in performance among the fund's classes reflect the variations in class expenses, which result in lower performance for higher expense classes. The Board also reviewed the fund's performance since inception as well as performance in the current year.
The Board also considered that the fund's management fee is subject to upward or downward adjustment depending upon whether, and to what extent, the fund's investment performance for the performance period exceeds, or is exceeded by, the record (over the same period) of a Board-approved performance adjustment index. The Board realizes that the performance adjustment provides FMR with a strong economic incentive to seek to achieve superior performance for the fund's shareholders and helps to more closely align the interests of FMR and the fund's shareholders.
Based on its review, and giving particular weight to the nature and quality of the resources dedicated by the Investment Advisers to maintain and improve relative performance and factoring in the unprecedented market events in recent years, the Board concluded that the nature, extent, and quality of investment management and support services and of shareholder and administrative services provided to the fund will benefit the fund's shareholders, particularly in light of the Board's view that the fund's shareholders benefit from investing in a fund that is part of a large family of funds offering a variety of investment disciplines and services.
Annual Report
Board Approval of Investment Advisory Contracts and
Management Fees - continued
Competitiveness of Management Fee and Total Fund Expenses. The Board considered the fund's management fee and total expenses compared to "mapped groups" of competitive funds and classes. Fidelity creates "mapped groups" by combining similar Lipper investment objective categories that have comparable management fee characteristics. Combining Lipper investment objective categories aids the Board's management fee and total expense comparisons by broadening the competitive group used for comparison and by reducing the number of universes to which various Fidelity funds are compared.
Management Fee. The Board considered two proprietary management fee comparisons for the 12-month periods shown in the chart below. The group of Lipper funds used by the Board for management fee comparisons is referred to below as the "Total Mapped Group." The Total Mapped Group comparison focuses on a fund's standing relative to the total universe of comparable funds available to investors, in terms of gross management fees before expense reimbursements or caps, and without giving effect to the fund's performance adjustment. "TMG %" represents the percentage of funds in the Total Mapped Group that had management fees that were lower than the fund's. For example, a TMG % of 15% means that 85% of the funds in the Total Mapped Group had higher management fees than the fund. The "Asset-Size Peer Group" (ASPG) comparison focuses on a fund's standing relative to non-Fidelity funds similar in size to the fund within the Total Mapped Group. The ASPG represents at least 15% of the funds in the Total Mapped Group with comparable asset size and management fee characteristics, subject to a minimum of 50 funds (or all funds in the Total Mapped Group if fewer than 50). Additional information, such as the ASPG quartile in which the fund's management fee ranked and the impact of the fund's performance adjustment, is also included in the chart and considered by the Board.
Annual Report
Fidelity International Discovery Fund
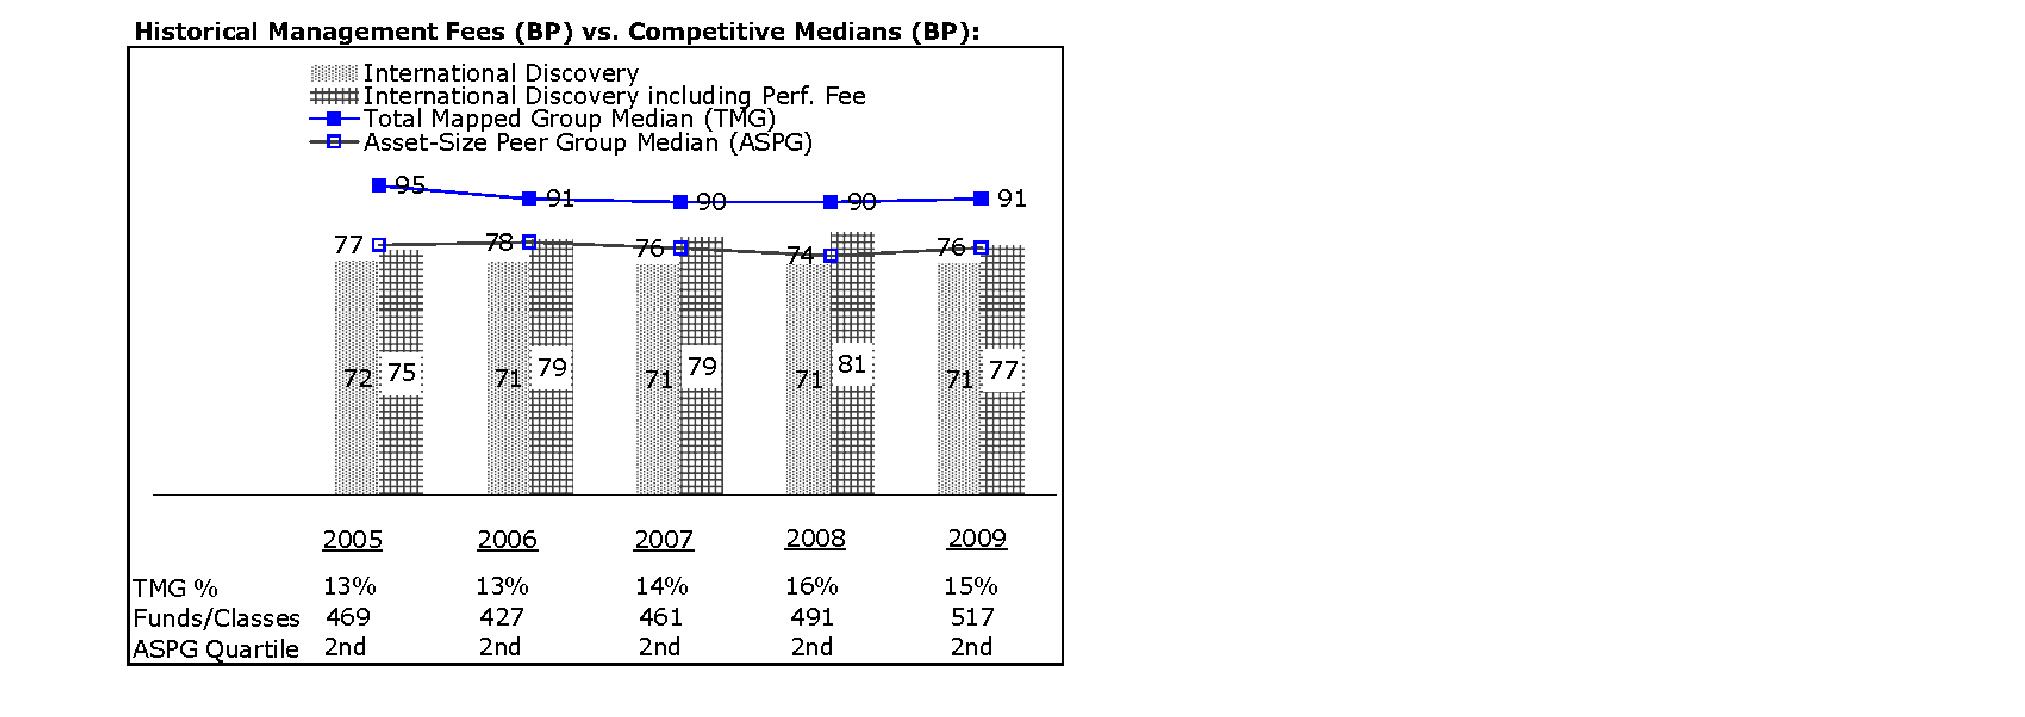
The Board noted that the fund's management fee ranked below the median of its Total Mapped Group and below the median of its ASPG for 2009. The Board also noted the effect of the fund's positive performance adjustment on the fund's management fee ranking. The Board noted that the performance adjustment for each year represents calculations for performance periods that differ from the periods shown in the performance charts above.
Based on its review, the Board concluded that the fund's management fee is fair and reasonable in light of the services that the fund receives and the other factors considered.
Total Expenses. In its review of each class's total expenses, the Board considered the fund's management fee as well as other fund or class expenses, as applicable, such as transfer agent fees, pricing and bookkeeping fees, fund-paid 12b-1 fees, and custodial, legal, and audit fees. The Board also noted the effects of any waivers and reimbursements on fees and expenses, as well as the impact of the fund's performance adjustment. As part of its review, the Board also considered current and historical total expenses of each class of the fund compared to competitive fund median expenses. Each class of the fund is compared to those funds and classes in the Total Mapped Group (used by the Board for management fee comparisons) that have a similar sales load structure.
The Board noted that the total expenses of each of Class A, Class B, Class C, Institutional Class, the retail class, and Class K ranked below its competitive median for 2009 and the total expenses of Class T ranked above its competitive median for 2009. The Board considered that the total expenses for Class T were above the median primarily because its 12b-1 fee is higher than the typical front-end load class. The Board noted that the fund offers multiple classes, each of which has a different sales load and 12b-1 fee structure, and that the multiple structures are intended to offer a range of pricing options for the intermediary market. The Board also noted that the total expenses of the classes vary primarily by the level of their 12b-1 fees, although differences in transfer agent fees may also cause expenses to vary from class to class.
Annual Report
Board Approval of Investment Advisory Contracts and
Management Fees - continued
Fees Charged to Other Fidelity Clients. The Board also considered Fidelity fee structures and other information with respect to clients of FMR and its affiliates, such as other mutual funds advised or subadvised by FMR or its affiliates, pension plan clients, and other institutional clients. In March 2010, the Board created an ad hoc joint committee with the board of other Fidelity funds (the Committee) to review and compare Fidelity's institutional investment advisory business with its business of providing services to the Fidelity funds, including the differences in services provided, fees charged, and costs incurred, as well as competition in their respective marketplaces.
Based on its review of total expenses and fees charged to other Fidelity clients, the Board concluded that the total expenses of each class of the fund were reasonable, although in one case above the median of the universe presented for comparison, in light of the services that the fund and its shareholders receive and the other factors considered, including the findings of the Committee.
Costs of the Services and Profitability. The Board considered the revenues earned and the expenses incurred by Fidelity in conducting the business of developing, marketing, distributing, managing, administering and servicing the fund and its shareholders. The Board also considered the level of Fidelity's profits in respect of all the Fidelity funds.
On an annual basis, FMR presents to the Board Fidelity's profitability for the fund. Fidelity calculates the profitability for each fund, as well as aggregate profitability for groups of Fidelity funds and all Fidelity funds, using a series of detailed revenue and cost allocation methodologies which originate with the audited books and records of Fidelity. The Audit Committee of the Board reviews any significant changes from the prior year's methodologies.
PricewaterhouseCoopers LLP (PwC), independent registered public accounting firm and auditor to Fidelity and certain Fidelity funds, has been engaged annually by the Board as part of the Board's assessment of Fidelity's profitability analysis. PwC's engagement includes the review and assessment of Fidelity's methodologies used in determining the revenues and expenses attributable to Fidelity's mutual fund business, and completion of agreed-upon procedures surrounding the mathematical accuracy of fund profitability and its conformity to allocation methodologies. After considering PwC's reports issued under the engagement and information provided by Fidelity, the Board believes that while other allocation methods may also be reasonable, Fidelity's profitability methodologies are reasonable in all material respects.
Annual Report
The Board has also reviewed Fidelity's non-fund businesses and fall-out benefits related to the mutual fund business as well as cases where Fidelity's affiliates may benefit from or be related to the fund's business.
The Board considered the costs of the services provided by and the profits realized by Fidelity in connection with the operation of the fund and were satisfied that the profitability was not excessive in the circumstances.
Economies of Scale. The Board considered whether there have been economies of scale in respect of the management of the Fidelity funds, whether the Fidelity funds (including the fund) have appropriately benefited from any such economies of scale, and whether there is potential for realization of any further economies of scale. The Board considered the extent to which the fund will benefit from economies of scale through increased services to the fund, through waivers or reimbursements, or through fee or expense reductions.
In February 2009, the Board and the board of other Fidelity funds created an ad hoc committee (the Economies of Scale Committee) to analyze whether FMR attains economies of scale in respect of the management and servicing of the Fidelity funds, whether the Fidelity funds have appropriately benefited from such economies of scale, and whether there is potential for realization of any further economies of scale.
The Board recognized that the fund's management contract incorporates a "group fee" structure, which provides for lower group fee rates as total fund assets under FMR's management increase, and for higher group fee rates as total fund assets under FMR's management decrease. FMR calculates the group fee rates based on a tiered asset "breakpoint" schedule that varies based on asset class. The Board considered that the group fee is designed to deliver the benefits of economies of scale to fund shareholders when total Fidelity fund assets increase, even if assets of any particular fund are unchanged or have declined, because some portion of Fidelity's costs are attributable to services provided to all Fidelity funds, and all funds benefit if those costs can be allocated among more assets. The Board concluded that, given the group fee structure, fund shareholders will benefit from lower management fees as assets under FMR's management increase at the fund complex level, regardless of whether Fidelity achieves any such economies of scale.
The Board concluded, considering the findings of the Economies of Scale Committee, that any potential economies of scale are being appropriately shared between fund shareholders and Fidelity.
Additional Information Requested by the Board. In order to develop fully the factual basis for consideration of the Fidelity funds' Advisory Contracts, the Board requested and received additional information on certain topics, including (i) fund performance trends, actions to be taken by FMR to improve certain funds' overall performance, and Fidelity's long-term strategies for certain funds; (ii) portfolio manager changes that have occurred during the past year and length of portfolio manager tenure for different categories of funds over time; (iii) Fidelity's compensation structure for portfolio managers, research analysts, and other key personnel, the rationale for the compensation structure, and how the compensation structure provides appropriate performance incentives; (iv) the amount of the investment that each portfolio manager has made in the Fidelity fund(s) that he or she manages; (v) management and other fees paid by FMR to affiliated sub-advisers on behalf of the Fidelity funds; (vi) Fidelity's fee structures and rationale for recommending different fees among different categories of funds; (vii) Fidelity's rationale for recommending which funds should have a performance adjustment component as part of their management fees; (viii) the rationale for any differences between fund fee structures and fee structures in place for other Fidelity clients; and (ix) explanations regarding the relative total expenses borne by certain funds and classes, total expense competitive trends, and actions that might be taken by FMR to reduce total expenses for certain funds and classes.
Annual Report
Board Approval of Investment Advisory Contracts and
Management Fees - continued
Based on its evaluation of all of the conclusions noted above, and after considering all factors it believed relevant, the Board ultimately concluded that the advisory fee structures are fair and reasonable, and that the fund's Advisory Contracts should be renewed.
Annual Report
Managing Your Investments
Fidelity offers several ways to conveniently manage your personal investments via your telephone or PC. You can access your account information, conduct trades and research your investments 24 hours a day.
By Phone
Fidelity Automated Service Telephone provides a single toll-free number to access account balances, positions, quotes and trading. It's easy to navigate the service, and on your first call, the system will help you create a personal identification number (PIN) for security.
(phone_graphic)
Fidelity Automated
Service Telephone (FAST®)
1-800-544-5555
Press
For mutual fund and brokerage trading.
For quotes.*
For account balances and holdings.
To review orders and mutual
fund activity.
To change your PIN.
To speak to a Fidelity representative.
By PC
Fidelity's web site on the Internet provides a wide range of information, including daily financial news, fund performance, interactive planning tools and news about Fidelity products and services.
(computer_graphic)
Fidelity's Web Site
www.fidelity.com
* When you call the quotes line, please remember that a fund's yield and return will vary and, except for money market funds, share price will also vary. This means that you may have a gain or loss when you sell your shares. There is no assurance that money market funds will be able to maintain a stable $1 share price; an investment in a money market fund is not insured or guaranteed by the U.S. government. Total returns are historical and include changes in share price, reinvestment of dividends and capital gains, and the effects of any sales charges.
Annual Report
To Visit Fidelity
For directions and hours,
please call 1-800-544-9797.
Arizona
7001 West Ray Road
Chandler, AZ
15445 N. Scottsdale Road
Scottsdale, AZ
17550 North 75th Avenue
Glendale, AZ
5330 E. Broadway Blvd
Tucson, AZ
California
815 East Birch Street
Brea, CA
1411 Chapin Avenue
Burlingame, CA
851 East Hamilton Avenue
Campbell, CA
601 Larkspur Landing Circle
Larkspur, CA
2000 Avenue of the Stars
Los Angeles, CA
27101 Puerta Real
Mission Viejo, CA
73575 El Paseo
Palm Desert, CA
251 University Avenue
Palo Alto, CA
123 South Lake Avenue
Pasadena, CA
16656 Bernardo Ctr. Drive
Rancho Bernardo, CA
1220 Roseville Parkway
Roseville, CA
1740 Arden Way
Sacramento, CA
7676 Hazard Center Drive
San Diego, CA
11943 El Camino Real
San Diego, CA
8 Montgomery Street
San Francisco, CA
3793 State Street
Santa Barbara, CA
1200 Wilshire Boulevard
Santa Monica, CA
398 West El Camino Real
Sunnyvale, CA
111 South Westlake Blvd
Thousand Oaks, CA
21701 Hawthorne Boulevard
Torrance, CA
2001 North Main Street
Walnut Creek, CA
6326 Canoga Avenue
Woodland Hills, CA
2211 Michelson Drive
Irvine, CA
Colorado
281 East Flatiron Circle
Broomfield, CO
1625 Broadway
Denver, CO
9185 Westview Road
Lone Tree, CO
Connecticut
48 West Putnam Avenue
Greenwich, CT
265 Church Street
New Haven, CT
300 Atlantic Street
Stamford, CT
29 South Main Street
West Hartford, CT
1261 Post Road
Fairfield, CT
Delaware
400 Delaware Avenue
Wilmington, DE
Florida
175 East Altamonte Drive
Altamonte Springs, FL
1400 Glades Road
Boca Raton, FL
121 Alhambra Plaza
Coral Gables, FL
2948 N. Federal Highway
Ft. Lauderdale, FL
4671 Town Center Parkway
Jacksonville, FL
8880 Tamiami Trail, North
Naples, FL
230 Royal Palm Way
Palm Beach, FL
3501 PGA Boulevard
Palm Beach Gardens, FL
3550 Tamiami Trail, South
Sarasota, FL
1502 N. Westshore Blvd.
Tampa, FL
2465 State Road 7
Wellington, FL
Georgia
3242 Peachtree Road
Atlanta, GA
1000 Abernathy Road
Atlanta, GA
Illinois
One North LaSalle Street
Chicago, IL
401 North Michigan Avenue
Chicago, IL
One Skokie Valley Road
Highland Park, IL
1415 West 22nd Street
Oak Brook, IL
15105 S LaGrange Road
Orland Park, IL
1572 East Golf Road
Schaumburg, IL
1823 Freedom Drive
Naperville, IL
Indiana
8480 Keystone Crossing
Indianapolis, IN
Kansas
5400 College Boulevard
Overland Park, KS
Maine
Three Canal Plaza
Portland, ME
Maryland
7315 Wisconsin Avenue
Bethesda, MD
610 York Road
Towson, MD
Massachusetts
801 Boylston Street
Boston, MA
155 Congress Street
Boston, MA
300 Granite Street
Braintree, MA
44 Mall Road
Burlington, MA
238 Main Street
Cambridge, MA
200 Endicott Street
Danvers, MA
Fidelity Brokerage Services, Inc., 100 Summer St., Boston, MA 02110 Member NYSE/SIPC
Annual Report
405 Cochituate Road
Framingham, MA
551 Boston Turnpike
Shrewsbury, MA
Michigan
500 E. Eisenhower Pkwy.
Ann Arbor, MI
280 N. Old Woodward Ave.
Birmingham, MI
30200 Northwestern Hwy.
Farmington Hills, MI
43420 Grand River Avenue
Novi, MI
3480 28th Street
Grand Rapids, MI
2425 S. Linden Road STE E
Flint, MI
Minnesota
7740 France Avenue South
Edina, MN
8342 3rd Street North
Oakdale, MN
Missouri
1524 South Lindbergh Blvd.
St. Louis, MO
Nevada
2225 Village Walk Drive
Henderson, NV
New Jersey
501 Route 73 South
Marlton, NJ
150 Essex Street
Millburn, NJ
35 Morris Street
Morristown, NJ
396 Route 17, North
Paramus, NJ
3518 Route 1 North
Princeton, NJ
530 Broad Street
Shrewsbury, NJ
New Mexico
2261 Q Street NE
Albuquerque, NM
New York
1130 Franklin Avenue
Garden City, NY
37 West Jericho Turnpike
Huntington Station, NY
1271 Avenue of the Americas
New York, NY
980 Madison Avenue
New York, NY
61 Broadway
New York, NY
350 Park Avenue
New York, NY
200 Fifth Avenue
New York, NY
733 Third Avenue
New York, NY
2070 Broadway
New York, NY
1075 Northern Blvd.
Roslyn, NY
799 Central Park Avenue
Scarsdale, NY
3349 Monroe Avenue
Rochester, NY
North Carolina
4611 Sharon Road
Charlotte, NC
7011 Fayetteville Road
Durham, NC
Ohio
3805 Edwards Road
Cincinnati, OH
1324 Polaris Parkway
Columbus, OH
1800 Crocker Road
Westlake, OH
28699 Chagrin Boulevard
Woodmere Village, OH
Oregon
7493 SW Bridgeport Road
Tigard, OR
Pennsylvania
600 West DeKalb Pike
King of Prussia, PA
1735 Market Street
Philadelphia, PA
12001 Perry Highway
Wexford, PA
Rhode Island
10 Memorial Boulevard
Providence, RI
Tennessee
3018 Peoples Street
Johnson City, TN
7628 West Farmington Blvd.
Germantown, TN
2035 Mallory Lane
Franklin, TN
Texas
10000 Research Boulevard
Austin, TX
4001 Northwest Parkway
Dallas, TX
12532 Memorial Drive
Houston, TX
2701 Drexel Drive
Houston, TX
6560 Fannin Street
Houston, TX
1701 Lake Robbins Drive
The Woodlands, TX
6500 N. MacArthur Blvd.
Irving, TX
6005 West Park Boulevard
Plano, TX
1576 East Southlake Blvd.
Southlake, TX
15600 Southwest Freeway
Sugar Land, TX
139 N. Loop 1604 East
San Antonio, TX
Utah
279 West South Temple
Salt Lake City, UT
Virginia
1861 International Drive
McLean, VA
11957 Democracy Drive
Reston, VA
Washington
10500 NE 8th Street
Bellevue, WA
1518 6th Avenue
Seattle, WA
304 Strander Blvd
Tukwila, WA
Washington, DC
1900 K Street, N.W.
Washington, DC
Wisconsin
16020 West Bluemound Road
Brookfield, WI
Annual Report
To Write Fidelity
We'll give your correspondence immediate attention and send you written confirmation upon completion of your request.
(letter_graphic)
Making Changes
To Your Account
(such as changing name, address, bank, etc.)
Fidelity Investments
P.O. Box 770001
Cincinnati, OH 45277-0002
(letter_graphic)
For Non-Retirement
Accounts
Buying shares
Fidelity Investments
P.O. Box 770001
Cincinnati, OH 45277-0003
Overnight Express
Fidelity Investments
Attn: Distribution Services
100 Crosby Parkway - KC1H
Covington, KY 41015
Selling shares
Fidelity Investments
P.O. Box 770001
Cincinnati, OH 45277-0035
Overnight Express
Fidelity Investments
Attn: Distribution Services
100 Crosby Parkway - KC1H
Covington, KY 41015
General Correspondence
Fidelity Investments
P.O. Box 500
Merrimack, NH 03054-0500
(letter_graphic)
For Retirement
Accounts
Buying shares
Fidelity Investments
P.O. Box 770001
Cincinnati, OH 45277-0003
Selling shares
Fidelity Investments
P.O. Box 770001
Cincinnati, OH 45277-0035
Overnight Express
Fidelity Investments
Attn: Distribution Services
100 Crosby Parkway - KC1H
Covington, KY 41015
General Correspondence
Fidelity Investments
P.O. Box 500
Merrimack, NH 03054-0500
Annual Report
Investment Adviser
Fidelity Management & Research Company
Boston, MA
Investment Sub-Advisers
FMR Co., Inc.
Fidelity Management & Research
(U.K.) Inc.
Fidelity Research & Analysis Company
FIL Investment Advisors
FIL Investments (Japan) Limited
FIL Investment Advisors (U.K.) Limited
Fidelity Management & Research
(Hong Kong) Limited
Fidelity Management & Research
(Japan) Inc.
General Distributor
Fidelity Distributors Corporation
Boston, MA
Transfer and Service Agents
Fidelity Investments Institutional
Operations Company, Inc.
Boston, MA
Fidelity Service Company, Inc.
Boston, MA
Custodian
The Northern Trust Company
Chicago, IL
The Fidelity Telephone Connection
Mutual Fund 24-Hour Service
Exchanges/Redemptions
and Account Assistance 1-800-544-6666
Product Information 1-800-544-8888
Retirement Accounts 1-800-544-4774
(8 a.m. - 9 p.m.)
TDD Service 1-800-544-0118
for the deaf and hearing impaired
(9 a.m. - 9 p.m. Eastern time)
Fidelity Automated Service
Telephone (FAST®)
1-800-544-5555
Automated line for quickest service
IGI-UANN-1210
1.807257.106

Fidelity®
International Discovery
Fund -
Class K
Annual Report
October 31, 2010
(2_fidelity_logos) (Registered_Trademark)
Contents
Chairman's Message | <Click Here> | The Chairman's message to shareholders. |
Performance | <Click Here> | How the fund has done over time. |
Management's Discussion of Fund Performance | <Click Here> | The Portfolio Manager's review of fund performance and strategy. |
Shareholder Expense Example | <Click Here> | An example of shareholder expenses. |
Investment Changes | <Click Here> | A summary of major shifts in the fund's investments over the past six months. |
Investments | <Click Here> | A complete list of the fund's investments with their market values. |
Financial Statements | <Click Here> | Statements of assets and liabilities, operations, and changes in net assets, as well as financial highlights. |
Notes | <Click Here> | Notes to the financial statements. |
Report of Independent Registered Public Accounting Firm | <Click Here> | |
Trustees and Officers | <Click Here> | |
Distributions | <Click Here> | |
Board Approval of Investment Advisory Contracts and Management Fees | <Click Here> | |
To view a fund's proxy voting guidelines and proxy voting record for the 12-month period ended June 30, visit http://www.fidelity.com/proxyvotingresults or visit the Securities and Exchange Commission's (SEC) web site at http://www.sec.gov. You may also call 1-800-835-5092 to request a free copy of the proxy voting guidelines.
Standard & Poor's, S&P and S&P 500 are registered service marks of The McGraw-Hill Companies, Inc. and have been licensed for use by Fidelity Distributors Corporation.
Other third party marks appearing herein are the property of their respective owners.
All other marks appearing herein are registered or unregistered trademarks or service marks of FMR LLC or an affiliated company.
Annual Report
This report and the financial statements contained herein are submitted for the general information of the shareholders of the fund. This report is not authorized for distribution to prospective investors in the fund unless preceded or accompanied by an effective prospectus.
A fund files its complete schedule of portfolio holdings with the SEC for the first and third quarters of each fiscal year on Form N-Q. Forms N-Q are available on the SEC's web site at http://www.sec.gov. A fund's Forms N-Q may be reviewed and copied at the SEC's Public Reference Room in Washington, DC. Information regarding the operation of the SEC's Public Reference Room may be obtained by calling 1-800-SEC-0330. For a complete list of a fund's portfolio holdings, view the most recent holdings listing, semiannual report, or annual report on Fidelity's web site at http://www.fidelity.com or http://www.advisor.fidelity.com, as applicable.
NOT FDIC INSURED • MAY LOSE VALUE • NO BANK GUARANTEE
Neither the fund nor Fidelity Distributors Corporation is a bank.
Annual Report
(photo_of_Edward_C_Johnson_3d)
Dear Shareholder:
Equities have staged a rally in the second half of 2010, shaking off concerns about the European debt crisis and the possibility of a double-dip recession in the U.S. Although the short-term surge pushed major equity indexes back into positive territory for the year, several questions remain about the longer-term outlook, including lackluster economic growth and persistently high unemployment. Financial markets are always unpredictable, of course, but there also are several time-tested investment principles that can help put the odds in your favor.
One of the basic tenets is to invest for the long term. Over time, riding out the markets' inevitable ups and downs has proven much more effective than selling into panic or chasing the hottest trend. Even missing only a few of the markets' best days can significantly diminish investor returns. Patience also affords the benefits of compounding - of earning interest on additional income or reinvested dividends and capital gains. There can be tax advantages and cost benefits to consider as well. While staying the course doesn't eliminate risk, it can considerably lessen the effect of short-term declines.
You can further manage your investing risk through diversification. And today, more than ever, geographic diversification should be taken into account. Studies indicate that asset allocation is the single most important determinant of a portfolio's long-term success. The right mix of stocks, bonds and cash - aligned to your particular risk tolerance and investment objective - is very important. Age-appropriate rebalancing is also an essential aspect of asset allocation. For younger investors, an emphasis on equities - which historically have been the best-performing asset class over time - is encouraged. As investors near their specific goal, such as retirement or sending a child to college, consideration may be given to replacing volatile assets (e.g. common stocks) with more-stable fixed investments (bonds or savings plans).
A third principle - investing regularly - can help lower the average cost of your purchases. Investing a certain amount of money each month or quarter helps ensure you won't pay for all your shares at market highs. This strategy - known as dollar cost averaging - also reduces "emotion" from investing, helping shareholders avoid selling weak performers just prior to an upswing, or chasing a hot performer just before a correction.
We invite you to contact us via the Internet, through our Investor Centers or by phone. It is our privilege to provide you the information you need to make the investments that are right for you.
Sincerely,
(The chairman's signature appears here.)
Edward C. Johnson 3d
Annual Report
Average annual total return reflects the change in the value of an investment, assuming reinvestment of the class' distributions from dividend income and capital gains (the profits earned upon the sale of securities that have grown in value, if any) and assuming a constant rate of performance each year. The $10,000 table and the fund's returns do not reflect the deduction of taxes that a shareholder would pay on fund distributions or the redemption of fund shares. During periods of reimbursement by Fidelity, a fund's total return will be greater than it would be had the reimbursement not occurred. How a fund did yesterday is no guarantee of how it will do tomorrow.
Average Annual Total Returns
Periods ended October 31, 2010 | Past 1
year | Past 5
years | Past 10
years |
Class KA,B | 13.96% | 4.59% | 5.29% |
A The initial offering of Class K shares took place on May 9, 2008. Returns prior to May 9, 2008 are those of Fidelity® International Discovery Fund, the original class of the fund.
B Prior to October 1, 2004, the fund operated under certain different investment policies. The fund's historical performances may not represent its current investment policies.
$10,000 Over 10 Years
Let's say hypothetically that $10,000 was invested in Fidelity® International Discovery Fund - Class K on October 31, 2000. The chart shows how the value of your investment would have changed, and also shows how the MSCI® EAFE ® (Europe, Australasia, Far East) Index performed over the same period. The initial offering of Class K took place on May 9, 2008. See above for additional information regarding the performance of Class K.
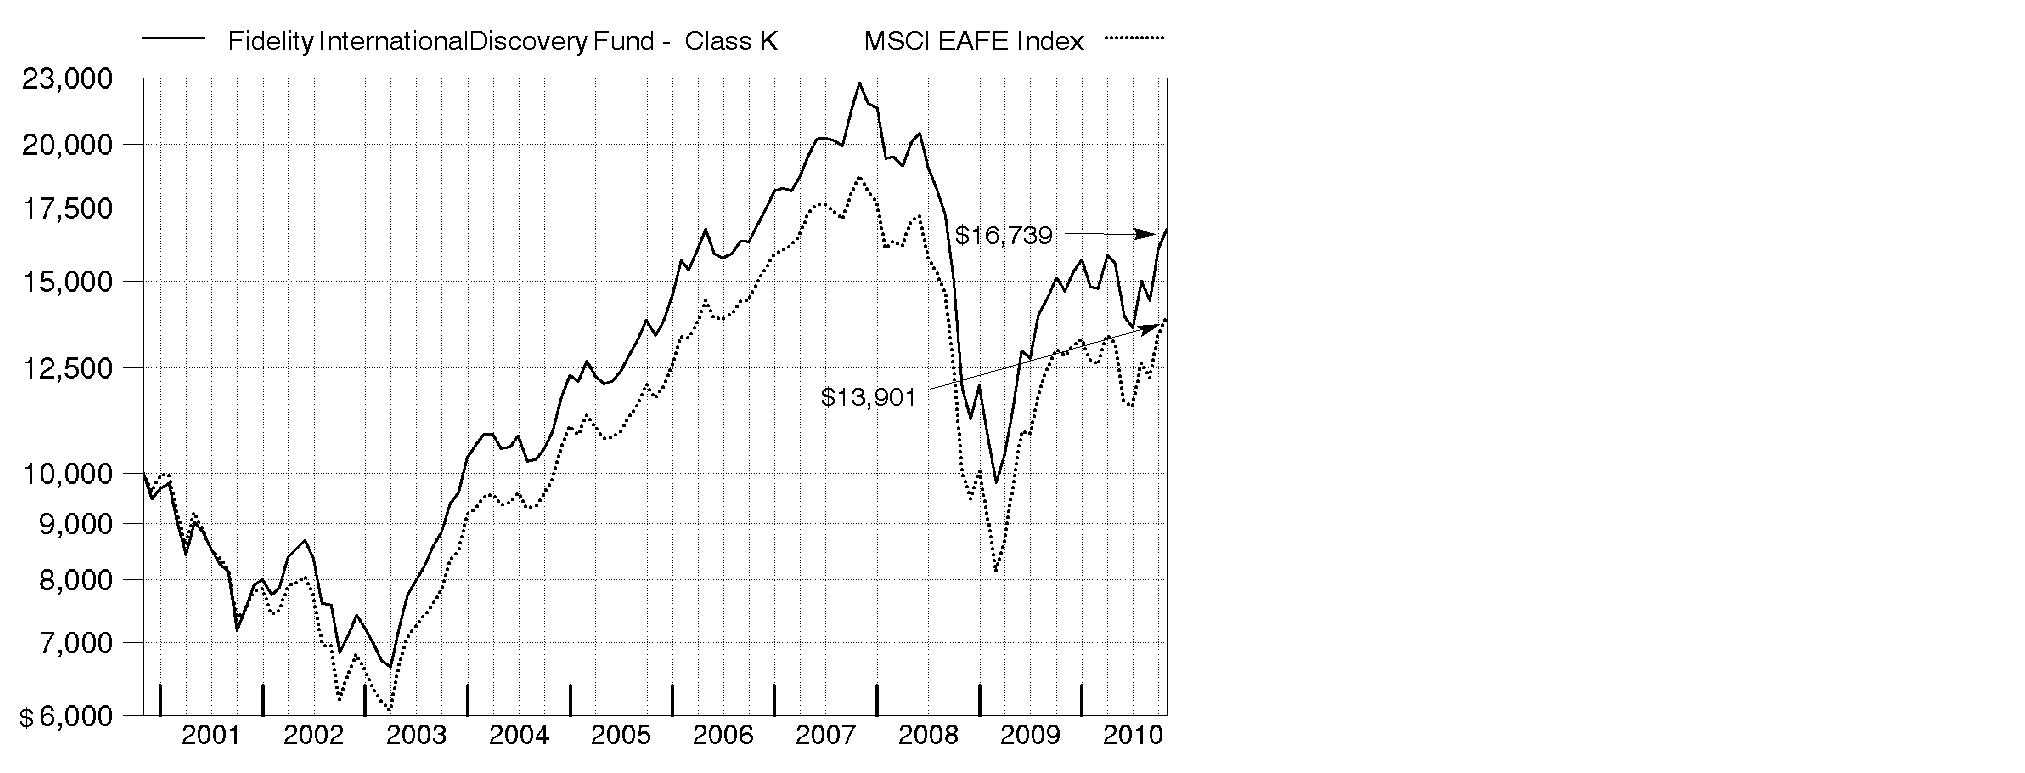
Annual Report
Market Recap: International stocks rode a wave of volatility similar to that of their U.S. counterparts during the 12 months ending October 31, 2010. Stocks gained modestly in the first half of the period, despite growing concerns about the European debt crisis. Sentiment turned decidedly negative in May and June, however, and the market suffered a precipitous decline. These losses were more than offset during the last four months of the period, when signs of economic growth and subsiding debt fears helped propel international stocks about 21%. For the full year, the MSCI® ACWI® (All Country World Index) ex USA Index gained 12.76%, boosted in part by a generally depreciating U.S. dollar. Within the index, Canada and emerging markets were standouts, returning 23% and 24%, respectively. Results in the latter group were led by strong-performing India, Mexico and South Africa, while China fell short of the MSCI benchmark due to cooling economic growth. The developed Asia ex Japan segment rose 16% for the period, lifted by solid results from Singapore and Hong Kong. Meanwhile, Europe rose just 9%, held back mainly by debt-riddled Spain and Italy, as well as lagging major constituent France. Japan returned only 5%, a result of that nation's continued weak economy.
Comments from William Kennedy, Portfolio Manager of Fidelity® International Discovery Fund: For the 12 months ending October 31, 2010, the fund's Class K shares returned 13.96%, beating the 8.49% return of the MSCI EAFE® (Europe, Australasia, Far East) Index. Stock selection drove relative performance, with particularly strong gains coming from investments in emerging markets, as well as the consumer discretionary, information technology, health care and industrials sectors. Top contributors included Elekta, a Swedish manufacturer of radiation-therapy equipment that benefited from successful product launches and an increase in capital spending by hospitals, and SSL International, a U.K. health care company that received a handsome buyout offer. I sold SSL. In consumer discretionary - which increased as a percentage of fund assets - strong gains at Carphone Warehouse Group, a U.K. cell phone retailer, were fueled in part by an expanding partnership with big-box electronics retailer Best Buy. All three holdings were out-of-index positions. Detractors were minimal, with underweightings in consumer staples and materials just nicking results. Stock disappointments included HeidelbergCement, a German cement company whose U.S. business was hurt by the weak housing market, and Swiss investment bank UBS, whose revenue slowed more than expected.
The views expressed above reflect those of the portfolio manager(s) only through the end of the period as stated on the cover of this report and do not necessarily represent the views of Fidelity or any other person in the Fidelity organization. Any such views are subject to change at any time based upon market or other conditions and Fidelity disclaims any responsibility to update such views. These views may not be relied on as investment advice and, because investment decisions for a Fidelity fund are based on numerous factors, may not be relied on as an indication of trading intent on behalf of any Fidelity fund.
Annual Report
Shareholder Expense Example
As a shareholder of the Fund, you incur two types of costs: (1) transaction costs, including sales charges (loads) on purchase payments or redemption proceeds, redemption fees, and (2) ongoing costs, including management fees, distribution and/or service (12b-1) fees and other Fund expenses. This Example is intended to help you understand your ongoing costs (in dollars) of investing in the Fund and to compare these costs with the ongoing costs of investing in other mutual funds.
The Example is based on an investment of $1,000 invested at the beginning of the period and held for the entire period (May 1, 2010 to October 31, 2010).
Actual Expenses
The first line of the accompanying table for each class of the Fund provides information about actual account values and actual expenses. You may use the information in this line, together with the amount you invested, to estimate the expenses that you paid over the period. Simply divide your account value by $1,000.00 (for example, an $8,600 account value divided by $1,000.00 = 8.6), then multiply the result by the number in the first line for a class of the Fund under the heading entitled "Expenses Paid During Period" to estimate the expenses you paid on your account during this period. A small balance maintenance fee of $12.00 that is charged once a year may apply for certain accounts with a value of less than $2,000. This fee is not included in the table below. If it was, the estimate of expenses you paid during the period would be higher, and your ending account value lower, by this amount. In addition, the Fund, as a shareholder in the underlying Fidelity Central Funds, will indirectly bear its pro-rata share of the fees and expenses incurred by the underlying Fidelity Central Funds. These fees and expenses are not included in the Fund's annualized expense ratio used to calculate the expense estimate in the table below.
Hypothetical Example for Comparison Purposes
The second line of the accompanying table for each class of the Fund provides information about hypothetical account values and hypothetical expenses based on a Class' actual expense ratio and an assumed rate of return of 5% per year before expenses, which is not the Class' actual return. The hypothetical account values and expenses may not be used to estimate the actual ending account balance or expenses you paid for the period. You may use this information to compare the ongoing costs of investing in the Fund and other funds. To do so, compare this 5% hypothetical example with the 5% hypothetical examples that appear in the shareholder reports of the other funds. A small balance maintenance fee of $12.00 that is charged once a year may apply for certain accounts with a value of less than $2,000. This fee is not included in the table below. If it was, the estimate of expenses you paid during the period would be higher, and your ending account value lower, by this amount. In addition, the Fund, as a shareholder in the underlying Fidelity Central Funds, will indirectly bear its pro-rata share of the fees and expenses incurred by the underlying Fidelity Central Funds. These fees and expenses are not included in the Fund's annualized expense ratio used to calculate the expense estimate in the table below.
Annual Report
Please note that the expenses shown in the table are meant to highlight your ongoing costs only and do not reflect any transaction costs. Therefore, the second line of the table is useful in comparing ongoing costs only, and will not help you determine the relative total costs of owning different funds. In addition, if these transactional costs were included, your costs would have been higher.
| Annualized
Expense Ratio | Beginning
Account Value
May 1, 2010 | Ending
Account Value
October 31, 2010 | Expenses Paid
During Period*
May 1, 2009 to October 31, 2010 |
Class A | 1.32% | | | |
Actual | | $ 1,000.00 | $ 1,071.90 | $ 6.89 |
Hypothetical A | | $ 1,000.00 | $ 1,018.55 | $ 6.72 |
Class T | 1.57% | | | |
Actual | | $ 1,000.00 | $ 1,070.70 | $ 8.19 |
Hypothetical A | | $ 1,000.00 | $ 1,017.29 | $ 7.98 |
Class B | 2.08% | | | |
Actual | | $ 1,000.00 | $ 1,067.90 | $ 10.84 |
Hypothetical A | | $ 1,000.00 | $ 1,014.72 | $ 10.56 |
Class C | 2.07% | | | |
Actual | | $ 1,000.00 | $ 1,067.70 | $ 10.79 |
Hypothetical A | | $ 1,000.00 | $ 1,014.77 | $ 10.51 |
International Discovery | 1.02% | | | |
Actual | | $ 1,000.00 | $ 1,073.70 | $ 5.33 |
Hypothetical A | | $ 1,000.00 | $ 1,020.06 | $ 5.19 |
Class K | .82% | | | |
Actual | | $ 1,000.00 | $ 1,074.80 | $ 4.29 |
Hypothetical A | | $ 1,000.00 | $ 1,021.07 | $ 4.18 |
Institutional Class | .97% | | | |
Actual | | $ 1,000.00 | $ 1,074.10 | $ 5.07 |
Hypothetical A | | $ 1,000.00 | $ 1,020.32 | $ 4.94 |
A 5% return per year before expenses
*Expenses are equal to each Class' annualized expense ratio, multiplied by the average account value over the period, multiplied by 184/365 (to reflect the one-half year period).
Annual Report
Investment Changes (Unaudited)
Geographic Diversification (% of fund's net assets) |
As of October 31, 2010 |
| United Kingdom 20.9% | |
| Japan 12.1% | |
| France 8.8% | |
| Switzerland 7.0% | |
| Germany 6.6% | |
| United States of America 4.3% | |
| Spain 3.8% | |
| Denmark 3.3% | |
| Australia 3.0% | |
| Other 30.2% | |

Percentages are adjusted for the effect of futures contracts, if applicable. |
As of April 30, 2010 |
| United Kingdom 20.0% | |
| Japan 18.7% | |
| France 9.6% | |
| Switzerland 7.2% | |
| Germany 6.7% | |
| Netherlands 3.8% | |
| Australia 3.0% | |
| Spain 3.0% | |
| United States of America 2.3% | |
| Other 25.7% | |

Percentages are adjusted for the effect of futures contracts, if applicable. |
Asset Allocation (% of fund's net assets) |
| As of
October 31, 2010 | As of
April 30, 2010 |
Stocks | 98.6 | 99.3 |
Short-Term Investments and Net Other Assets | 1.4 | 0.7 |
Top Ten Stocks as of October 31, 2010 |
| % of fund's
net assets | % of fund's net assets
6 months ago |
BHP Billiton PLC (United Kingdom, Metals & Mining) | 1.9 | 1.3 |
Royal Dutch Shell PLC Class B (United Kingdom, Oil, Gas & Consumable Fuels) | 1.9 | 2.0 |
BP PLC (United Kingdom, Oil, Gas & Consumable Fuels) | 1.6 | 1.2 |
Nestle SA (Switzerland, Food Products) | 1.6 | 1.4 |
Novartis AG (Switzerland, Pharmaceuticals) | 1.5 | 1.2 |
Novo Nordisk AS Series B (Denmark, Pharmaceuticals) | 1.4 | 0.9 |
HSBC Holdings PLC (United Kingdom) (United Kingdom, Commercial Banks) | 1.3 | 1.9 |
Bayerische Motoren Werke AG (BMW) (Germany, Automobiles) | 1.3 | 0.9 |
SOFTBANK CORP. (Japan, Wireless Telecommunication Services) | 1.3 | 0.8 |
LVMH Moet Hennessy - Louis Vuitton (France, Textiles, Apparel & Luxury Goods) | 1.2 | 0.6 |
| 15.0 | |
Market Sectors as of October 31, 2010 |
| % of fund's
net assets | % of fund's net assets
6 months ago |
Financials | 22.0 | 21.6 |
Consumer Discretionary | 20.8 | 15.7 |
Industrials | 9.5 | 11.0 |
Materials | 9.3 | 9.6 |
Health Care | 9.1 | 9.1 |
Consumer Staples | 8.6 | 7.8 |
Energy | 6.4 | 7.8 |
Information Technology | 6.1 | 11.1 |
Telecommunication Services | 6.2 | 4.0 |
Utilities | 0.6 | 1.6 |
Annual Report
Investments October 31, 2010
Showing Percentage of Net Assets
Common Stocks - 97.2% |
| Shares | | Value (000s) |
Australia - 3.0% |
Australia & New Zealand Banking Group Ltd. | 4,456,031 | | $ 108,304 |
JB Hi-Fi Ltd. (d) | 1,401,880 | | 27,302 |
Macquarie Group Ltd. | 1,446,043 | | 51,282 |
Newcrest Mining Ltd. | 1,300,681 | | 50,918 |
Wesfarmers Ltd. | 1,097,894 | | 35,644 |
Westfield Group unit | 2,381,694 | | 28,885 |
TOTAL AUSTRALIA | | 302,335 |
Bailiwick of Jersey - 0.6% |
Experian PLC | 3,677,200 | | 42,742 |
Informa PLC | 2,335,767 | | 16,316 |
TOTAL BAILIWICK OF JERSEY | | 59,058 |
Belgium - 1.2% |
Anheuser-Busch InBev SA NV | 1,791,980 | | 112,293 |
EVS Broadcast Equipment SA | 89,263 | | 5,602 |
TOTAL BELGIUM | | 117,895 |
Bermuda - 1.1% |
Huabao International Holdings Ltd. | 27,748,000 | | 41,812 |
Li & Fung Ltd. | 4,808,000 | | 25,401 |
Noble Group Ltd. | 26,477,364 | | 38,050 |
Sihuan Pharmaceutical Holdings Group Ltd. | 496,000 | | 360 |
TOTAL BERMUDA | | 105,623 |
Brazil - 1.7% |
Banco ABC Brasil SA | 572,000 | | 5,635 |
Banco Santander (Brasil) SA ADR | 1,896,000 | | 27,302 |
Diagnosticos da America SA | 2,508,000 | | 30,959 |
Drogasil SA | 1,040,700 | | 26,323 |
Souza Cruz Industria Comerico | 1,579,500 | | 81,157 |
TOTAL BRAZIL | | 171,376 |
British Virgin Islands - 0.3% |
HLS Systems International Ltd. (a)(d) | 610,767 | | 7,720 |
Playtech Ltd. (d) | 3,758,978 | | 26,966 |
TOTAL BRITISH VIRGIN ISLANDS | | 34,686 |
Canada - 1.8% |
First Quantum Minerals Ltd. | 249,300 | | 21,831 |
InterOil Corp. (a)(d) | 247,600 | | 17,624 |
Niko Resources Ltd. | 483,100 | | 46,088 |
Open Text Corp. (a) | 769,600 | | 34,047 |
Common Stocks - continued |
| Shares | | Value (000s) |
Canada - continued |
Pan American Silver Corp. | 843,000 | | $ 26,909 |
Petrobank Energy & Resources Ltd. (a) | 813,500 | | 32,376 |
TOTAL CANADA | | 178,875 |
Cayman Islands - 2.4% |
Belle International Holdings Ltd. | 9,430,000 | | 17,032 |
Bosideng International Holdings Ltd. | 81,544,000 | | 41,239 |
China Lodging Group Ltd. ADR (d) | 344,759 | | 8,381 |
Ctrip.com International Ltd. sponsored ADR (a) | 505,000 | | 26,295 |
Eurasia Drilling Co. Ltd. GDR (f) | 257,900 | | 6,576 |
Hengdeli Holdings Ltd. | 75,304,000 | | 41,775 |
Mongolian Mining Corp. | 15,168,000 | | 16,418 |
Perfect World Co. Ltd. sponsored ADR Class B (a) | 771,187 | | 24,986 |
Shenguan Holdings Group Ltd. | 21,268,000 | | 27,713 |
TPK Holdings Co. | 25,000 | | 413 |
Want Want China Holdings Ltd. | 36,693,000 | | 33,847 |
TOTAL CAYMAN ISLANDS | | 244,675 |
China - 1.2% |
Baidu.com, Inc. sponsored ADR (a) | 348,900 | | 38,382 |
China Merchants Bank Co. Ltd. (H Shares) | 18,516,200 | | 52,554 |
Comba Telecom Systems Holdings Ltd. (d) | 7,504,420 | | 8,520 |
Minth Group Ltd. | 2,146,000 | | 4,014 |
Zhaojin Mining Industry Co. Ltd. (H Shares) | 2,492,000 | | 7,748 |
ZTE Corp. (H Shares) (d) | 2,362,096 | | 8,776 |
TOTAL CHINA | | 119,994 |
Cyprus - 0.0% |
Aisi Realty Public Ltd. (a)(e) | 21,633,000 | | 607 |
Denmark - 3.3% |
Carlsberg AS Series B | 673,200 | | 73,612 |
Novo Nordisk AS Series B | 1,311,389 | | 137,673 |
Pandora A/S | 758,300 | | 36,789 |
William Demant Holding AS (a) | 1,094,900 | | 82,070 |
TOTAL DENMARK | | 330,144 |
Egypt - 0.2% |
Orascom Construction Industries SAE GDR | 443,300 | | 20,525 |
France - 8.8% |
Accor SA | 732,241 | | 30,021 |
Atos Origin SA (a) | 1,202,978 | | 55,615 |
AXA SA | 2,162,866 | | 39,365 |
Common Stocks - continued |
| Shares | | Value (000s) |
France - continued |
BNP Paribas SA | 983,966 | | $ 71,948 |
Carrefour SA | 973,625 | | 52,537 |
Compagnie Generale de Geophysique SA (a) | 1,085,600 | | 25,352 |
Edenred (a) | 552,100 | | 11,562 |
Essilor International SA | 566,366 | | 37,812 |
GDF Suez | 760,000 | | 30,329 |
Iliad Group SA (d) | 509,521 | | 57,356 |
LVMH Moet Hennessy - Louis Vuitton | 797,092 | | 124,886 |
Pernod-Ricard SA | 388,925 | | 34,478 |
PPR SA | 664,000 | | 108,838 |
Sanofi-Aventis | 317,944 | | 22,270 |
Schneider Electric SA | 588,962 | | 83,590 |
Societe Generale Series A | 1,175,263 | | 70,360 |
Unibail-Rodamco | 118,400 | | 24,663 |
TOTAL FRANCE | | 880,982 |
Germany - 5.2% |
Bayerische Motoren Werke AG (BMW) | 1,818,327 | | 130,326 |
Fresenius Medical Care AG & Co. KGaA | 964,000 | | 61,394 |
GEA Group AG | 2,030,727 | | 53,094 |
HeidelbergCement AG | 245,167 | | 12,822 |
Kabel Deutschland Holding AG | 1,258,000 | | 56,636 |
MAN SE | 529,280 | | 58,181 |
Metro AG | 439,200 | | 30,776 |
Siemens AG | 1,089,506 | | 124,433 |
TOTAL GERMANY | | 527,662 |
Greece - 0.2% |
Coca-Cola Hellenic Bottling Co. SA | 692,200 | | 17,915 |
Hong Kong - 1.6% |
AIA Group Ltd. | 5,311,400 | | 15,795 |
Henderson Land Development Co. Ltd. | 3,760,700 | | 26,709 |
I.T Ltd. | 21,016,000 | | 17,732 |
Techtronic Industries Co. Ltd. | 65,201,500 | | 66,032 |
Wharf Holdings Ltd. | 4,890,000 | | 32,111 |
TOTAL HONG KONG | | 158,379 |
India - 2.8% |
Adani Enterprises Ltd. | 1,982,014 | | 31,500 |
Gitanjali Gems Ltd. | 2,506,415 | | 16,763 |
Housing Development Finance Corp. Ltd. | 1,506,925 | | 23,380 |
IndusInd Bank Ltd. | 2,074,982 | | 12,340 |
Common Stocks - continued |
| Shares | | Value (000s) |
India - continued |
INFO Edge India Ltd. | 679,326 | | $ 10,427 |
Infrastructure Development Finance Co. Ltd. | 3,122,908 | | 14,094 |
Larsen & Toubro Ltd. | 783,228 | | 35,831 |
LIC Housing Finance Ltd. | 1,481,322 | | 44,801 |
Reliance Industries Ltd. | 903,416 | | 22,343 |
Rural Electrification Corp. Ltd. | 2,750,582 | | 23,001 |
Shriram Transport Finance Co. Ltd. | 621,359 | | 12,356 |
State Bank of India | 217,944 | | 15,491 |
The Jammu & Kashmir Bank Ltd. | 545,569 | | 11,206 |
Titan Industries Ltd. | 160,588 | | 12,869 |
TOTAL INDIA | | 286,402 |
Indonesia - 0.7% |
PT Bank Rakyat Indonesia Tbk | 19,678,500 | | 25,100 |
PT Tower Bersama Infrastructure Tbk | 4,813,500 | | 1,373 |
PT XL Axiata Tbk (a) | 67,983,500 | | 43,738 |
TOTAL INDONESIA | | 70,211 |
Ireland - 0.5% |
Ingersoll-Rand Co. Ltd. | 731,600 | | 28,759 |
James Hardie Industries NV unit (a) | 3,882,491 | | 20,501 |
TOTAL IRELAND | | 49,260 |
Israel - 0.2% |
Israel Chemicals Ltd. | 1,513,500 | | 23,150 |
Italy - 1.4% |
Intesa Sanpaolo SpA | 5,602,109 | | 19,702 |
Intesa Sanpaolo SpA (Risparmio Shares) | 6,681,302 | | 18,305 |
Prysmian SpA | 964,200 | | 18,689 |
Saipem SpA | 1,876,915 | | 83,389 |
TOTAL ITALY | | 140,085 |
Japan - 12.1% |
ABC-Mart, Inc. | 1,529,000 | | 52,005 |
Asics Corp. | 2,858,000 | | 30,864 |
Canon, Inc. | 1,331,350 | | 61,286 |
Cosmos Pharmaceutical Corp. | 543,200 | | 17,099 |
Denso Corp. | 1,577,500 | | 49,057 |
Don Quijote Co. Ltd. | 808,400 | | 22,091 |
eAccess Ltd. | 24,546 | | 17,905 |
Fast Retailing Co. Ltd. | 89,100 | | 11,671 |
Goldcrest Co. Ltd. | 161,770 | | 3,492 |
Common Stocks - continued |
| Shares | | Value (000s) |
Japan - continued |
Honda Motor Co. Ltd. | 1,736,200 | | $ 62,588 |
JSR Corp. | 2,283,400 | | 39,527 |
Keyence Corp. | 192,600 | | 47,749 |
Komatsu Ltd. | 1,833,900 | | 44,823 |
Mazda Motor Corp. | 14,841,000 | | 37,718 |
Misumi Group, Inc. | 825,300 | | 17,692 |
Mitsubishi Corp. | 1,980,200 | | 47,564 |
Mitsubishi UFJ Financial Group, Inc. | 12,527,700 | | 58,141 |
Mitsui & Co. Ltd. | 2,230,900 | | 35,086 |
Mizuho Financial Group, Inc. | 17,803,700 | | 25,821 |
Nichi-iko Pharmaceutical Co. Ltd. | 932,200 | | 32,877 |
Nintendo Co. Ltd. | 88,400 | | 22,905 |
Omron Corp. | 1,439,900 | | 33,425 |
ORIX Corp. | 1,209,560 | | 110,329 |
Osaka Securities Exchange Co. Ltd. | 1,866 | | 9,391 |
Rakuten, Inc. | 80,045 | | 61,673 |
Ricoh Co. Ltd. | 3,021,000 | | 42,260 |
Sawai Pharmaceutical Co. Ltd. (d) | 160,300 | | 14,004 |
SOFTBANK CORP. | 4,003,100 | | 128,560 |
Sony Financial Holdings, Inc. | 7,099 | | 24,701 |
Start Today Co. Ltd. | 7,249 | | 22,548 |
Sumitomo Mitsui Financial Group, Inc. | 1,151,300 | | 34,364 |
TOTAL JAPAN | | 1,219,216 |
Korea (South) - 1.5% |
Hyundai Motor Co. | 192,345 | | 29,078 |
Kia Motors Corp. | 912,890 | | 36,451 |
NCsoft Corp. | 97,952 | | 21,559 |
NHN Corp. (a) | 123,150 | | 21,848 |
Samsung Electronics Co. Ltd. | 38,175 | | 25,292 |
Shinhan Financial Group Co. Ltd. | 421,030 | | 16,306 |
TOTAL KOREA (SOUTH) | | 150,534 |
Luxembourg - 0.3% |
Millicom International Cellular SA | 282,400 | | 26,715 |
Mauritius - 0.2% |
MakeMyTrip Ltd. | 456,425 | | 16,500 |
Mexico - 0.4% |
Wal-Mart de Mexico SA de CV Series V | 14,883,600 | | 40,708 |
Netherlands - 2.2% |
AEGON NV (a) | 3,601,200 | | 22,818 |
Gemalto NV (d) | 704,193 | | 32,061 |
Common Stocks - continued |
| Shares | | Value (000s) |
Netherlands - continued |
ING Groep NV (Certificaten Van Aandelen) unit (a) | 4,878,900 | | $ 52,185 |
Koninklijke Philips Electronics NV | 2,283,638 | | 69,639 |
LyondellBasell Industries NV Class A (a) | 1,230,700 | | 33,057 |
Randstad Holdings NV (a) | 229,781 | | 10,935 |
TOTAL NETHERLANDS | | 220,695 |
Norway - 1.6% |
Aker Solutions ASA | 1,903,800 | | 28,983 |
DnB NOR ASA | 5,226,955 | | 71,723 |
Telenor ASA | 1,549,800 | | 24,982 |
Yara International ASA | 620,300 | | 32,607 |
TOTAL NORWAY | | 158,295 |
Poland - 0.1% |
Eurocash SA | 980,199 | | 9,009 |
Qatar - 0.2% |
Commercial Bank of Qatar GDR (Reg. S) | 5,094,802 | | 23,345 |
Singapore - 0.3% |
Keppel Corp. Ltd. | 4,295,000 | | 33,118 |
South Africa - 2.2% |
African Rainbow Minerals Ltd. | 607,700 | | 15,503 |
AngloGold Ashanti Ltd. sponsored ADR | 816,100 | | 38,446 |
Clicks Group Ltd. | 7,968,139 | | 51,983 |
Mr Price Group Ltd. | 3,702,400 | | 33,646 |
Sanlam Ltd. | 7,188,000 | | 26,946 |
Standard Bank Group Ltd. | 1,349,000 | | 19,893 |
Woolworths Holdings Ltd. | 9,804,233 | | 38,419 |
TOTAL SOUTH AFRICA | | 224,836 |
Spain - 3.8% |
Antena 3 Television SA | 2,176,200 | | 22,226 |
Banco Bilbao Vizcaya Argentaria SA | 4,146,934 | | 54,620 |
Banco Santander SA | 8,695,646 | | 111,585 |
Gestevision Telecinco SA | 2,269,700 | | 28,948 |
Inditex SA (d) | 398,393 | | 33,266 |
Prosegur Compania de Seguridad SA (Reg.) | 479,200 | | 28,712 |
Telefonica SA | 3,645,705 | | 98,491 |
TOTAL SPAIN | | 377,848 |
Sweden - 1.7% |
Elekta AB (B Shares) | 2,194,000 | | 83,011 |
Common Stocks - continued |
| Shares | | Value (000s) |
Sweden - continued |
H&M Hennes & Mauritz AB (B Shares) | 1,301,280 | | $ 45,846 |
Modern Times Group MTG AB (B Shares) | 579,300 | | 41,538 |
TOTAL SWEDEN | | 170,395 |
Switzerland - 7.0% |
Adecco SA (Reg.) | 243,346 | | 13,597 |
Compagnie Financiere Richemont SA Series A | 692,855 | | 34,546 |
Credit Suisse Group | 644,315 | | 26,666 |
Kuehne & Nagel International AG | 197,400 | | 24,406 |
Lonza Group AG | 349,225 | | 30,564 |
Nestle SA | 2,845,723 | | 155,823 |
Novartis AG | 2,677,083 | | 155,070 |
Partners Group Holding | 176,756 | | 32,322 |
Schindler Holding AG (participation certificate) | 228,540 | | 24,494 |
Sonova Holding AG Class B | 213,178 | | 24,689 |
The Swatch Group AG (Bearer) | 175,550 | | 67,074 |
UBS AG (a) | 3,459,090 | | 58,744 |
Zurich Financial Services AG | 251,733 | | 61,607 |
TOTAL SWITZERLAND | | 709,602 |
Taiwan - 0.5% |
HTC Corp. | 2,247,850 | | 50,752 |
Thailand - 0.4% |
Bangkok Bank Public Co. Ltd. (For. Reg.) | 8,336,000 | | 43,016 |
Turkey - 0.7% |
Boyner Buyuk Magazacilik AS (a)(e) | 4,833,645 | | 11,256 |
Dogus Otomotiv Servis ve Ticaret AS (a) | 2,849,000 | | 21,452 |
Turkiye Garanti Bankasi AS | 6,816,000 | | 41,819 |
TOTAL TURKEY | | 74,527 |
United Kingdom - 20.9% |
Aberdeen Asset Management PLC | 12,139,132 | | 34,580 |
Aegis Group PLC | 12,834,711 | | 25,848 |
Anglo American PLC (United Kingdom) | 1,583,300 | | 73,767 |
AstraZeneca PLC (United Kingdom) | 1,776,034 | | 89,327 |
Barclays PLC | 20,242,493 | | 88,943 |
BG Group PLC | 943,475 | | 18,373 |
BHP Billiton PLC | 5,343,392 | | 189,262 |
BP PLC | 24,342,500 | | 165,439 |
British Land Co. PLC | 2,363,434 | | 19,293 |
Britvic PLC | 5,435,800 | | 42,012 |
Burberry Group PLC | 2,391,800 | | 39,048 |
Common Stocks - continued |
| Shares | | Value (000s) |
United Kingdom - continued |
Carphone Warehouse Group PLC (a) | 15,119,465 | | $ 73,761 |
Cookson Group PLC (a) | 1,543,760 | | 12,738 |
GlaxoSmithKline PLC | 6,239,100 | | 121,819 |
HSBC Holdings PLC (United Kingdom) | 12,868,660 | | 133,916 |
IG Group Holdings PLC | 6,526,105 | | 55,259 |
InterContinental Hotel Group PLC | 2,054,000 | | 39,664 |
International Personal Finance PLC | 9,411,888 | | 46,896 |
International Power PLC | 3,956,720 | | 26,454 |
Legal & General Group PLC | 18,411,796 | | 29,616 |
Lloyds Banking Group PLC (a) | 49,557,364 | | 54,463 |
Micro Focus International PLC | 2,166,900 | | 13,255 |
Ocado Group PLC (a)(d) | 14,388,400 | | 32,204 |
Reckitt Benckiser Group PLC | 1,415,031 | | 79,144 |
Rio Tinto PLC | 1,536,344 | | 99,773 |
Royal Dutch Shell PLC Class B | 5,903,573 | | 188,900 |
Schroders PLC | 1,532,400 | | 38,767 |
SuperGroup PLC | 101,212 | | 1,832 |
TalkTalk Telecom Group PLC (a) | 18,424,592 | | 38,936 |
Ultra Electronics Holdings PLC | 614,667 | | 18,327 |
Vodafone Group PLC | 42,989,943 | | 117,503 |
Wolseley PLC (a) | 1,389,264 | | 37,015 |
Xstrata PLC | 3,171,800 | | 61,463 |
TOTAL UNITED KINGDOM | | 2,107,597 |
United States of America - 2.9% |
AsiaInfo Holdings, Inc. (a)(d) | 717,700 | | 15,947 |
CF Industries Holdings, Inc. | 273,800 | | 33,549 |
Freeport-McMoRan Copper & Gold, Inc. | 420,100 | | 39,775 |
NII Holdings, Inc. (a) | 1,802,500 | | 75,363 |
The Mosaic Co. | 376,200 | | 27,523 |
Virgin Media, Inc. (d) | 2,966,300 | | 75,433 |
Walter Energy, Inc. | 286,800 | | 25,227 |
TOTAL UNITED STATES OF AMERICA | | 292,817 |
TOTAL COMMON STOCKS (Cost $8,518,349) | 9,789,364 |
Nonconvertible Preferred Stocks - 1.4% |
| Shares | | Value (000s) |
Germany - 1.4% |
ProSiebenSat.1 Media AG | 783,800 | | $ 20,711 |
Volkswagen AG | 789,800 | | 118,688 |
TOTAL NONCONVERTIBLE PREFERRED STOCKS (Cost $105,062) | 139,399 |
Money Market Funds - 2.2% |
| | | |
Fidelity Cash Central Fund, 0.23% (b) | 100,758,575 | | 100,759 |
Fidelity Securities Lending Cash Central Fund, 0.24% (b)(c) | 123,571,582 | | 123,572 |
TOTAL MONEY MARKET FUNDS (Cost $224,331) | 224,331 |
Cash Equivalents - 0.2% |
| Maturity Amount (000s) | | |
Investments in repurchase agreements in a joint trading account at 0.22%, dated 10/29/10 due 11/1/10 (Collateralized by U.S. Treasury Obligations) #
(Cost $18,662) | $ 18,662 | | 18,662 |
TOTAL INVESTMENT PORTFOLIO - 101.0% (Cost $8,866,404) | | 10,171,756 |
NET OTHER ASSETS (LIABILITIES) - (1.0)% | | (99,606) |
NET ASSETS - 100% | $ 10,072,150 |
Legend |
(a) Non-income producing |
(b) Affiliated fund that is available only to investment companies and other accounts managed by Fidelity Investments. The rate quoted is the annualized seven-day yield of the fund at period end. A complete unaudited listing of the fund's holdings as of its most recent quarter end is available upon request. In addition, each Fidelity Central Fund's financial statements, which are not covered by the Fund's report of Independent Registered Public Accounting Firm, are available on the SEC's website or upon request. |
(c) Investment made with cash collateral received from securities on loan. |
(d) Security or a portion of the security is on loan at period end. |
(e) Affiliated company |
(f) Security exempt from registration under Rule 144A of the Securities Act of 1933. These securities may be resold in transactions exempt from registration, normally to qualified institutional buyers. At the end of the period, the value of these securities amounted to $6,576,000 or 0.1% of net assets. |
# Additional information on each counterparty to the repurchase agreement is as follows: |
Repurchase Agreement / Counterparty | Value
(Amounts in thousands) |
$18,662,000 due 11/01/10 at 0.22% |
BNP Paribas Securities Corp. | $ 8,683 |
Banc of America Securities LLC | 3,254 |
Barclays Capital, Inc. | 6,725 |
| $ 18,662 |
Affiliated Central Funds |
Information regarding fiscal year to date income earned by the Fund from investments in Fidelity Central Funds is as follows: |
Fund | Income earned
(Amounts in thousands) |
Fidelity Cash Central Fund | $ 127 |
Fidelity Securities Lending Cash Central Fund | 6,155 |
Total | $ 6,282 |
Other Affiliated Issuers |
An affiliated company is a company in which the Fund has ownership of at least 5% of the voting securities. Fiscal year to date transactions with companies which are or were affiliates are as follows: |
Affiliate
(Amounts in thousands) | Value, beginning of period | Purchases | Sales Proceeds | Dividend Income | Value,
end of
period |
Aisi Realty Public Ltd. | $ 1,243 | $ - | $ - | $ - | $ 607 |
Boyner Buyuk Magazacilik AS | - | 11,785 | - | - | 11,256 |
Total | $ 1,243 | $ 11,785 | $ - | $ - | $ 11,863 |
Other Information |
The following is a summary of the inputs used, as of October 31, 2010, involving the Fund's assets and liabilities carried at fair value. The inputs or methodology used for valuing securities may not be an indication of the risk associated with investing in those securities. For more information on valuation inputs, and their aggregation into the levels used in the tables below, please refer to the Security Valuation section in the accompanying Notes to Financial Statements. |
Valuation Inputs at Reporting Date: |
Description
(Amounts in thousands) | Total | Level 1 | Level 2 | Level 3 |
Investments in Securities: | | | | |
Equities: | | | | |
United Kingdom | $ 2,107,597 | $ 818,588 | $ 1,289,009 | $ - |
Japan | 1,219,216 | 580,277 | 638,939 | - |
France | 880,982 | 833,360 | 47,622 | - |
Switzerland | 709,602 | 469,122 | 240,480 | - |
Germany | 667,061 | 481,234 | 185,827 | - |
Spain | 377,848 | 113,152 | 264,696 | - |
Denmark | 330,144 | 192,471 | 137,673 | - |
Australia | 302,335 | 302,335 | - | - |
United States of America | 292,817 | 292,817 | - | - |
Cyprus | 607 | - | - | 607 |
Other | 3,040,554 | 2,895,912 | 144,642 | - |
Money Market Funds | 224,331 | 224,331 | - | - |
Cash Equivalents | 18,662 | - | 18,662 | - |
Total Investments in Securities: | $ 10,171,756 | $ 7,203,599 | $ 2,967,550 | $ 607 |
The following is a reconciliation of Investments in Securities for which Level 3 inputs were used in determining value: |
(Amounts in thousands) | |
Investments in Securities: | |
Beginning Balance | $ - |
Total Realized Gain (Loss) | - |
Total Unrealized Gain (Loss) | (636) |
Cost of Purchases | - |
Proceeds of Sales | - |
Amortization/Accretion | - |
Transfers in to Level 3 | 1,243 |
Transfers out of Level 3 | - |
Ending Balance | $ 607 |
The change in unrealized gain (loss) for the period attributable to Level 3 securities held at October 31, 2010 | $ (636) |
The information used in the above reconciliation represents fiscal year to date activity for any Investments in Securities identified as using Level 3 inputs at either the beginning or the end of the current fiscal period. Transfers in or out of Level 3 represent the beginning value of any Security or Instrument where a change in the pricing level occurred from the beginning to the end of the period. The cost of purchases and the proceeds of sales may include securities received or delivered through corporate actions or exchanges. Realized and unrealized gains (losses) disclosed in the reconciliation are included in Net Gain (Loss) on the Fund's Statement of Operations. |
Income Tax Information |
At October 31, 2010, the Fund had a capital loss carryforward of approximately $1,803,058,000 of which $163,224,000 and $1,639,834,000 will expire on October 31, 2016 and 2017, respectively. Capital loss carryforwards are only available to offset future capital gains of the Fund to the extent provided by regulations and may be limited. |
See accompanying notes which are an integral part of the financial statements.
Annual Report
Statement of Assets and Liabilities
Amounts in thousands (except per-share amounts) | October 31, 2010 |
| | |
Assets | | |
Investment in securities, at value (including securities loaned of $117,688 and repurchase agreements of $18,662) - See accompanying schedule: Unaffiliated issuers (cost $8,623,386) | $ 9,935,562 | |
Fidelity Central Funds (cost $224,331) | 224,331 | |
Other affiliated issuers (cost $18,687) | 11,863 | |
Total Investments (cost $8,866,404) | | $ 10,171,756 |
Cash | | 1 |
Foreign currency held at value (cost $1,005) | | 1,005 |
Receivable for investments sold | | 74,676 |
Receivable for fund shares sold | | 8,906 |
Dividends receivable | | 27,141 |
Distributions receivable from Fidelity Central Funds | | 250 |
Other receivables | | 3,906 |
Total assets | | 10,287,641 |
| | |
Liabilities | | |
Payable for investments purchased | $ 61,924 | |
Payable for fund shares redeemed | 12,106 | |
Accrued management fee | 5,716 | |
Distribution and service plan fees payable | 169 | |
Other affiliated payables | 1,920 | |
Other payables and accrued expenses | 10,084 | |
Collateral on securities loaned, at value | 123,572 | |
Total liabilities | | 215,491 |
| | |
Net Assets | | $ 10,072,150 |
Net Assets consist of: | | |
Paid in capital | | $ 10,604,504 |
Undistributed net investment income | | 120,198 |
Accumulated undistributed net realized gain (loss) on investments and foreign currency transactions | | (1,950,098) |
Net unrealized appreciation (depreciation) on investments and assets and liabilities in foreign currencies | | 1,297,546 |
Net Assets | | $ 10,072,150 |
See accompanying notes which are an integral part of the financial statements.
Annual Report
Statement of Assets and Liabilities - continued
Amounts in thousands (except per-share amounts) | October 31, 2010 |
| | |
Calculation of Maximum Offering Price Class A:
Net Asset Value and redemption price per share ($391,603 ÷ 12,210.4 shares) | | $ 32.07 |
| | |
Maximum offering price per share (100/94.25 of $32.07) | | $ 34.03 |
Class T:
Net Asset Value and redemption price per share ($91,992 ÷ 2,892.1 shares) | | $ 31.81 |
| | |
Maximum offering price per share (100/96.50 of $31.81) | | $ 32.96 |
Class B:
Net Asset Value and offering price per share ($14,434 ÷ 456.7 shares)A | | $ 31.60 |
| | |
Class C:
Net Asset Value and offering price per share ($43,557 ÷ 1,374.7 shares)A | | $ 31.68 |
| | |
International Discovery:
Net Asset Value, offering price and redemption price per share ($8,133,121 ÷ 251,479.5 shares) | | $ 32.34 |
| | |
Class K:
Net Asset Value, offering price and redemption price per share ($1,078,333 ÷ 33,361.2 shares) | | $ 32.32 |
| | |
Institutional Class:
Net Asset Value, offering price and redemption price per share ($319,110 ÷ 9,877.0 shares) | | $ 32.31 |
A Redemption price per share is equal to net asset value less any applicable contingent deferred sales charge.
See accompanying notes which are an integral part of the financial statements.
Annual Report
Financial Statements - continued
Statement of Operations
Amounts in thousands | Year ended October 31, 2010 |
| | |
Investment Income | | |
Dividends | | $ 239,834 |
Interest | | 2 |
Income from Fidelity Central Funds | | 6,282 |
Income before foreign taxes withheld | | 246,118 |
Less foreign taxes withheld | | (17,979) |
Total income | | 228,139 |
| | |
Expenses | | |
Management fee
Basic fee | $ 68,970 | |
Performance adjustment | 3,660 | |
Transfer agent fees | 23,371 | |
Distribution and service plan fees | 2,084 | |
Accounting and security lending fees | 1,801 | |
Custodian fees and expenses | 1,632 | |
Independent trustees' compensation | 55 | |
Registration fees | 223 | |
Audit | 117 | |
Legal | 49 | |
Interest | 12 | |
Miscellaneous | 132 | |
Total expenses before reductions | 102,106 | |
Expense reductions | (4,562) | 97,544 |
Net investment income (loss) | | 130,595 |
Realized and Unrealized Gain (Loss) Net realized gain (loss) on: | | |
Investment securities: | | |
Unaffiliated issuers (net of foreign taxes of $141) | 488,568 | |
Foreign currency transactions | (6,761) | |
Capital gain distributions from Fidelity Central Funds | 14 | |
Total net realized gain (loss) | | 481,821 |
Change in net unrealized appreciation (depreciation) on: Investment securities (net of increase in deferred foreign taxes of $8,661) | 637,812 | |
Assets and liabilities in foreign currencies | 968 | |
Total change in net unrealized appreciation (depreciation) | | 638,780 |
Net gain (loss) | | 1,120,601 |
Net increase (decrease) in net assets resulting from operations | | $ 1,251,196 |
See accompanying notes which are an integral part of the financial statements.
Annual Report
Statement of Changes in Net Assets
Amounts in thousands | Year ended
October 31,
2010 | Year ended
October 31,
2009 |
Increase (Decrease) in Net Assets | | |
Operations | | |
Net investment income (loss) | $ 130,595 | $ 120,477 |
Net realized gain (loss) | 481,821 | (1,782,481) |
Change in net unrealized appreciation (depreciation) | 638,780 | 3,333,708 |
Net increase (decrease) in net assets resulting
from operations | 1,251,196 | 1,671,704 |
Distributions to shareholders from net investment income | (116,422) | (107,705) |
Distributions to shareholders from net realized gain | (13,374) | - |
Total distributions | (129,796) | (107,705) |
Share transactions - net increase (decrease) | (662,032) | 250,490 |
Redemption fees | 291 | 345 |
Total increase (decrease) in net assets | 459,659 | 1,814,834 |
| | |
Net Assets | | |
Beginning of period | 9,612,491 | 7,797,657 |
End of period (including undistributed net investment income of $120,198 and undistributed net investment income of $106,024, respectively) | $ 10,072,150 | $ 9,612,491 |
See accompanying notes which are an integral part of the financial statements.
Annual Report
Financial Highlights - Class A
Years ended October 31, | 2010 | 2009 | 2008 | 2007 | 2006 |
Selected Per-Share Data | | | | | |
Net asset value, beginning of period | $ 28.57 | $ 23.68 | $ 47.34 | $ 36.47 | $ 30.57 |
Income from Investment Operations | | | | | |
Net investment income (loss)C | .31 | .31 | .46 | .44 | .42 |
Net realized and unrealized gain (loss) | 3.51 | 4.84 | (22.08) | 11.76 | 7.19 |
Total from investment operations | 3.82 | 5.15 | (21.62) | 12.20 | 7.61 |
Distributions from net investment income | (.28) | (.26) | (.37) | (.35) | (.31) |
Distributions from net realized gain | (.04) | - | (1.67) | (.98) | (1.40) |
Total distributions | (.32) | (.26) | (2.04) | (1.33) | (1.71) |
Redemption fees added to paid in capital C,G | - | - | - | - | - |
Net asset value, end of period | $ 32.07 | $ 28.57 | $ 23.68 | $ 47.34 | $ 36.47 |
Total ReturnA,B | 13.43% | 22.14% | (47.65)% | 34.54% | 26.01% |
Ratios to Average Net Assets D, F | | | | | |
Expenses before reductions | 1.33% | 1.37% | 1.32% | 1.25% | 1.27% |
Expenses net of fee waivers, if any | 1.33% | 1.37% | 1.32% | 1.25% | 1.27% |
Expenses net of all reductions | 1.28% | 1.32% | 1.29% | 1.22% | 1.21% |
Net investment income (loss) | 1.06% | 1.28% | 1.27% | 1.08% | 1.22% |
Supplemental Data | | | | | |
Net assets, end of period (in millions) | $ 392 | $ 414 | $ 380 | $ 417 | $ 140 |
Portfolio turnover rate E | 82% | 98% | 79% | 56% | 56% |
A Total returns would have been lower had certain expenses not been reduced during the periods shown.
B Total returns do not include the effect of the sales charges.
C Calculated based on average shares outstanding during the period.
D Fees and expenses of the underlying Fidelity Central Funds are not included in the Fund's expense ratio. The Fund indirectly bears its proportionate share of the expenses of any underlying Fidelity Central Funds.
E Amount does not include the portfolio activity of any underlying Fidelity Central Funds.
F Expense ratios reflect operating expenses of the class. Expenses before reductions do not reflect amounts reimbursed by the investment adviser or reductions from brokerage service arrangements or reductions from other expense offset arrangements and do not represent the amount paid by the class during periods when reimbursements or reductions occur. Expenses net of fee waivers reflect expenses after reimbursement by the investment adviser but prior to reductions from brokerage service arrangements or other expense offset arrangements. Expenses net of all reductions represent the net expenses paid by the class.
G Amount represents less than $.01 per share.
See accompanying notes which are an integral part of the financial statements.
Annual Report
Financial Highlights - Class T
Years ended October 31, | 2010 | 2009 | 2008 | 2007 | 2006 |
Selected Per-Share Data | | | | | |
Net asset value, beginning of period | $ 28.35 | $ 23.49 | $ 47.06 | $ 36.30 | $ 30.49 |
Income from Investment Operations | | | | | |
Net investment income (loss) C | .23 | .24 | .33 | .29 | .27 |
Net realized and unrealized gain (loss) | 3.48 | 4.81 | (21.94) | 11.71 | 7.18 |
Total from investment operations | 3.71 | 5.05 | (21.61) | 12.00 | 7.45 |
Distributions from net investment income | (.21) | (.19) | (.29) | (.26) | (.24) |
Distributions from net realized gain | (.04) | - | (1.67) | (.98) | (1.40) |
Total distributions | (.25) | (.19) | (1.96) | (1.24) | (1.64) |
Redemption fees added to paid in capital C,G | - | - | - | - | - |
Net asset value, end of period | $ 31.81 | $ 28.35 | $ 23.49 | $ 47.06 | $ 36.30 |
Total Return A,B | 13.14% | 21.79% | (47.84)% | 34.08% | 25.49% |
Ratios to Average Net AssetsD, F | | | | | |
Expenses before reductions | 1.60% | 1.65% | 1.68% | 1.63% | 1.71% |
Expenses net of fee waivers, if any | 1.60% | 1.65% | 1.68% | 1.63% | 1.71% |
Expenses net of all reductions | 1.56% | 1.60% | 1.64% | 1.60% | 1.65% |
Net investment income (loss) | .79% | 1.00% | .91% | .70% | .78% |
Supplemental Data | | | | | |
Net assets, end of period (in millions) | $ 92 | $ 83 | $ 64 | $ 53 | $ 10 |
Portfolio turnover rate E | 82% | 98% | 79% | 56% | 56% |
A Total returns would have been lower had certain expenses not been reduced during the periods shown.
B Total returns do not include the effect of the sales charges.
C Calculated based on average shares outstanding during the period.
D Fees and expenses of the underlying Fidelity Central Funds are not included in the Fund's expense ratio. The Fund indirectly bears its proportionate share of the expenses of any underlying Fidelity Central Funds.
E Amount does not include the portfolio activity of any underlying Fidelity Central Funds.
F Expense ratios reflect operating expenses of the class. Expenses before reductions do not reflect amounts reimbursed by the investment adviser or reductions from brokerage service arrangements or reductions from other expense offset arrangements and do not represent the amount paid by the class during periods when reimbursements or reductions occur. Expenses net of fee waivers reflect expenses after reimbursement by the investment adviser but prior to reductions from brokerage service arrangements or other expense offset arrangements. Expenses net of all reductions represent the net expenses paid by the class.
G Amount represents less than $.01 per share.
See accompanying notes which are an integral part of the financial statements.
Annual Report
Financial Highlights - Class B
Years ended October 31, | 2010 | 2009 | 2008 | 2007 | 2006 |
Selected Per-Share Data | | | | | |
Net asset value, beginning of period | $ 28.18 | $ 23.25 | $ 46.70 | $ 36.12 | $ 30.36 |
Income from Investment Operations | | | | | |
Net investment income (loss)C | .08 | .12 | .15 | .08 | .08 |
Net realized and unrealized gain (loss) | 3.44 | 4.81 | (21.77) | 11.64 | 7.19 |
Total from investment operations | 3.52 | 4.93 | (21.62) | 11.72 | 7.27 |
Distributions from net investment income | (.06) | - | (.16) | (.16) | (.11) |
Distributions from net realized gain | (.04) | - | (1.67) | (.98) | (1.40) |
Total distributions | (.10) | - | (1.83) | (1.14) | (1.51) |
Redemption fees added to paid in capital C,G | - | - | - | - | - |
Net asset value, end of period | $ 31.60 | $ 28.18 | $ 23.25 | $ 46.70 | $ 36.12 |
Total ReturnA,B | 12.52% | 21.20% | (48.11)% | 33.37% | 24.91% |
Ratios to Average Net Assets D, F | | | | | |
Expenses before reductions | 2.12% | 2.16% | 2.19% | 2.14% | 2.27% |
Expenses net of fee waivers, if any | 2.12% | 2.16% | 2.19% | 2.14% | 2.25% |
Expenses net of all reductions | 2.08% | 2.11% | 2.15% | 2.10% | 2.19% |
Net investment income (loss) | .27% | .49% | .40% | .19% | .24% |
Supplemental Data | | | | | |
Net assets, end of period (in millions) | $ 14 | $ 16 | $ 15 | $ 17 | $ 4 |
Portfolio turnover rate E | 82% | 98% | 79% | 56% | 56% |
A Total returns would have been lower had certain expenses not been reduced during the periods shown.
B Total returns do not include the effect of the contingent deferred sales charge.
C Calculated based on average shares outstanding during the period.
D Fees and expenses of the underlying Fidelity Central Funds are not included in the Fund's expense ratio. The Fund indirectly bears its proportionate share of the expenses of any underlying Fidelity Central Funds.
E Amount does not include the portfolio activity of any underlying Fidelity Central Funds.
F Expense ratios reflect operating expenses of the class. Expenses before reductions do not reflect amounts reimbursed by the investment adviser or reductions from brokerage service arrangements or reductions from other expense offset arrangements and do not represent the amount paid by the class during periods when reimbursements or reductions occur. Expenses net of fee waivers reflect expenses after reimbursement by the investment adviser but prior to reductions from brokerage service arrangements or other expense offset arrangements. Expenses net of all reductions represent the net expenses paid by the class.
G Amount represents less than $.01 per share.
See accompanying notes which are an integral part of the financial statements.
Annual Report
Financial Highlights - Class C
Years ended October 31, | 2010 | 2009 | 2008 | 2007 | 2006 |
Selected Per-Share Data | | | | | |
Net asset value, beginning of period | $ 28.23 | $ 23.31 | $ 46.82 | $ 36.19 | $ 30.41 |
Income from Investment Operations | | | | | |
Net investment income (loss) C | .09 | .12 | .15 | .09 | .11 |
Net realized and unrealized gain (loss) | 3.45 | 4.82 | (21.82) | 11.66 | 7.19 |
Total from investment operations | 3.54 | 4.94 | (21.67) | 11.75 | 7.30 |
Distributions from net investment income | (.05) | (.02) | (.17) | (.14) | (.12) |
Distributions from net realized gain | (.04) | - | (1.67) | (.98) | (1.40) |
Total distributions | (.09) | (.02) | (1.84) | (1.12) | (1.52) |
Redemption fees added to paid in capital C,G | - | - | - | - | - |
Net asset value, end of period | $ 31.68 | $ 28.23 | $ 23.31 | $ 46.82 | $ 36.19 |
Total Return A,B | 12.54% | 21.22% | (48.10)% | 33.38% | 24.97% |
Ratios to Average Net Assets D, F | | | | | |
Expenses before reductions | 2.09% | 2.14% | 2.17% | 2.11% | 2.16% |
Expenses net of fee waivers, if any | 2.09% | 2.14% | 2.17% | 2.11% | 2.16% |
Expenses net of all reductions | 2.05% | 2.09% | 2.13% | 2.08% | 2.11% |
Net investment income (loss) | .30% | .51% | .42% | .22% | .33% |
Supplemental Data | | | | | |
Net assets, end of period (in millions) | $ 44 | $ 43 | $ 36 | $ 28 | $ 6 |
Portfolio turnover rate E | 82% | 98% | 79% | 56% | 56% |
A Total returns would have been lower had certain expenses not been reduced during the periods shown.
B Total returns do not include the effect of the contingent deferred sales charge.
C Calculated based on average shares outstanding during the period.
D Fees and expenses of the underlying Fidelity Central Funds are not included in the Fund's expense ratio. The Fund indirectly bears its proportionate share of the expenses of any underlying Fidelity Central Funds.
E Amount does not include the portfolio activity of any underlying Fidelity Central Funds.
F Expense ratios reflect operating expenses of the class. Expenses before reductions do not reflect amounts reimbursed by the investment adviser or reductions from brokerage service arrangements or reductions from other expense offset arrangements and do not represent the amount paid by the class during periods when reimbursements or reductions occur. Expenses net of fee waivers reflect expenses after reimbursement by the investment adviser but prior to reductions from brokerage service arrangements or other expense offset arrangements. Expenses net of all reductions represent the net expenses paid by the class.
G Amount represents less than $.01 per share.
See accompanying notes which are an integral part of the financial statements.
Annual Report
Financial Highlights - International Discovery
Years ended October 31, | 2010 | 2009 | 2008 | 2007 | 2006 |
Selected Per-Share Data | | | | | |
Net asset value, beginning of period | $ 28.79 | $ 23.88 | $ 47.68 | $ 36.67 | $ 30.65 |
Income from Investment Operations | | | | | |
Net investment income (loss) B | .40 | .37 | .57 | .53 | .48 |
Net realized and unrealized gain (loss) | 3.54 | 4.88 | (22.29) | 11.84 | 7.25 |
Total from investment operations | 3.94 | 5.25 | (21.72) | 12.37 | 7.73 |
Distributions from net investment income | (.35) | (.34) | (.41) | (.38) | (.31) |
Distributions from net realized gain | (.04) | - | (1.67) | (.98) | (1.40) |
Total distributions | (.39) | (.34) | (2.08) | (1.36) | (1.71) |
Redemption fees added to paid in capital B,F | - | - | - | - | - |
Net asset value, end of period | $ 32.34 | $ 28.79 | $ 23.88 | $ 47.68 | $ 36.67 |
Total Return A | 13.76% | 22.47% | (47.55)% | 34.85% | 26.34% |
Ratios to Average Net Assets C,E | | | | | |
Expenses before reductions | 1.05% | 1.12% | 1.09% | 1.04% | 1.09% |
Expenses net of fee waivers, if any | 1.05% | 1.12% | 1.09% | 1.04% | 1.08% |
Expenses net of all reductions | 1.00% | 1.07% | 1.05% | 1.00% | 1.03% |
Net investment income (loss) | 1.35% | 1.53% | 1.51% | 1.30% | 1.41% |
Supplemental Data | | | | | |
Net assets, end of period (in millions) | $ 8,133 | $ 8,114 | $ 6,999 | $ 14,176 | $ 8,054 |
Portfolio turnover rateD | 82% | 98% | 79% | 56% | 56% |
A Total returns would have been lower had certain expenses not been reduced during the periods shown.
B Calculated based on average shares outstanding during the period.
C Fees and expenses of the underlying Fidelity Central Funds are not included in the Fund's expense ratio. The Fund indirectly bears its proportionate share of the expenses of any underlying Fidelity Central Funds.
D Amount does not include the portfolio activity of any underlying Fidelity Central Funds.
E Expense ratios reflect operating expenses of the class. Expenses before reductions do not reflect amounts reimbursed by the investment adviser or reductions from brokerage service arrangements or reductions from other expense offset arrangements and do not represent the amount paid by the class during periods when reimbursements or reductions occur. Expenses net of fee waivers reflect expenses after reimbursement by the investment adviser but prior to reductions from brokerage service arrangements or other expense offset arrangements. Expenses net of all reductions represent the net expenses paid by the class.
F Amount represents less than $.01 per share.
See accompanying notes which are an integral part of the financial statements.
Annual Report
Financial Highlights - Class K
Years ended October 31, | 2010 | 2009 | 2008G |
Selected Per-Share Data | | | |
Net asset value, beginning of period | $ 28.78 | $ 23.90 | $ 40.32 |
Income from Investment Operations | | | |
Net investment income (loss)D | .46 | .44 | .10 |
Net realized and unrealized gain (loss) | 3.53 | 4.86 | (16.52) |
Total from investment operations | 3.99 | 5.30 | (16.42) |
Distributions from net investment income | (.41) | (.42) | - |
Distributions from net realized gain | (.04) | - | - |
Total distributions | (.45) | (.42) | - |
Redemption fees added to paid in capital D,I | - | - | - |
Net asset value, end of period | $ 32.32 | $ 28.78 | $ 23.90 |
Total ReturnB,C | 13.96% | 22.80% | (40.72)% |
Ratios to Average Net AssetsE,H | | | |
Expenses before reductions | .84% | .88% | .93%A |
Expenses net of fee waivers, if any | .84% | .88% | .93%A |
Expenses net of all reductions | .79% | .83% | .89%A |
Net investment income (loss) | 1.55% | 1.77% | .83%A |
Supplemental Data | | | |
Net assets, end of period (in millions) | $ 1,078 | $ 674 | $ 145 |
Portfolio turnover rateF | 82% | 98% | 79% |
A Annualized
B Total returns for period of less than one year are not annualized.
C Total returns would have been lower had certain expenses not been reduced during the periods shown.
D Calculated based on average shares outstanding during the period.
E Fees and expenses of the underlying Fidelity Central Funds are not included in the Fund's expense ratio. The Fund indirectly bears its proportionate share of the expenses of any underlying Fidelity Central Funds.
F Amount does not include the portfolio activity of any underlying Fidelity Central Funds.
G For the period May 9, 2008 (commencement of sale of shares) to October 31, 2008.
H Expense ratios reflect operating expenses of the class. Expenses before reductions do not reflect amounts reimbursed by the investment adviser or reductions from brokerage service arrangements or reductions from other expense offset arrangements and do not represent the amount paid by the class during periods when reimbursements or reductions occur. Expense ratios before reductions for start-up periods may not be representative of longer-term operating periods. Expenses net of fee waivers reflect expenses after reimbursement by the investment adviser but prior to reductions from brokerage service arrangements or other expense offset arrangements. Expenses net of all reductions represent the net expenses paid by the class.
I Amount represents less than $.01 per share.
See accompanying notes which are an integral part of the financial statements.
Annual Report
Financial Highlights - Institutional Class
Years ended October 31, | 2010 | 2009 | 2008 | 2007 | 2006 |
Selected Per-Share Data | | | | | |
Net asset value, beginning of period | $ 28.77 | $ 23.91 | $ 47.73 | $ 36.71 | $ 30.68 |
Income from Investment Operations | | | | | |
Net investment income (loss) B | .41 | .39 | .53 | .55 | .51 |
Net realized and unrealized gain (loss) | 3.55 | 4.86 | (22.24) | 11.85 | 7.25 |
Total from investment operations | 3.96 | 5.25 | (21.71) | 12.40 | 7.76 |
Distributions from net investment income | (.38) | (.39) | (.44) | (.40) | (.33) |
Distributions from net realized gain | (.04) | - | (1.67) | (.98) | (1.40) |
Total distributions | (.42) | (.39) | (2.11) | (1.38) | (1.73) |
Redemption fees added to paid in capital B,F | - | - | - | - | - |
Net asset value, end of period | $ 32.31 | $ 28.77 | $ 23.91 | $ 47.73 | $ 36.71 |
Total Return A | 13.84% | 22.52% | (47.51)% | 34.93% | 26.45% |
Ratios to Average Net Assets C,E | | | | | |
Expenses before reductions | .99% | 1.05% | 1.05% | .97% | 1.00% |
Expenses net of fee waivers, if any | .99% | 1.05% | 1.05% | .97% | 1.00% |
Expenses net of all reductions | .95% | 1.00% | 1.01% | .94% | .95% |
Net investment income (loss) | 1.40% | 1.60% | 1.54% | 1.36% | 1.49% |
Supplemental Data | | | | | |
Net assets, end of period (in millions) | $ 319 | $ 267 | $ 159 | $ 58 | $ 28 |
Portfolio turnover rateD | 82% | 98% | 79% | 56% | 56% |
A Total returns would have been lower had certain expenses not been reduced during the periods shown.
B Calculated based on average shares outstanding during the period.
C Fees and expenses of the underlying Fidelity Central Funds are not included in the Fund's expense ratio. The Fund indirectly bears its proportionate share of the expenses of any underlying Fidelity Central Funds.
D Amount does not include the portfolio activity of any underlying Fidelity Central Funds.
E Expense ratios reflect operating expenses of the class. Expenses before reductions do not reflect amounts reimbursed by the investment adviser or reductions from brokerage service arrangements or reductions from other expense offset arrangements and do not represent the amount paid by the class during periods when reimbursements or reductions occur. Expenses net of fee waivers reflect expenses after reimbursement by the investment adviser but prior to reductions from brokerage service arrangements or other expense offset arrangements. Expenses net of all reductions represent the net expenses paid by the class.
F Amount represents less than $.01 per share.
See accompanying notes which are an integral part of the financial statements.
Annual Report
Notes to Financial Statements
For the period ended October 31, 2010
(Amounts in thousands except ratios)
1. Organization.
Fidelity International Discovery Fund (the Fund) is a fund of Fidelity Investment Trust (the Trust) and is authorized to issue an unlimited number of shares. The Trust is registered under the Investment Company Act of 1940, as amended (the 1940 Act), as an open-end management investment company organized as a Massachusetts business trust. The Fund offers Class A, Class T, Class C, International Discovery, Class K and Institutional Class shares, each of which has equal rights as to assets and voting privileges. Effective after the close of business on September 1, 2010, Class B shares were closed to new accounts and additional purchases by existing shareholders. Each class has exclusive voting rights with respect to matters that affect that class. Class B shares will automatically convert to Class A shares after a holding period of seven years from the initial date of purchase. Investment income, realized and unrealized capital gains and losses, the common expenses of the Fund, and certain fund-level expense reductions, if any, are allocated on a pro-rata basis to each class based on the relative net assets of each class to the total net assets of the Fund. Each class differs with respect to transfer agent and distribution and service plan fees incurred. Certain expense reductions also differ by class. The Fund's investments in emerging markets can be subject to social, economic, regulatory, and political uncertainties and can be extremely volatile.
2. Investments in Fidelity Central Funds.
The Fund may invest in Fidelity Central Funds, which are open-end investment companies available only to other investment companies and accounts managed by Fidelity Management & Research Company (FMR) and its affiliates. The Fund's Schedule of Investments lists each of the Fidelity Central Funds held as of period end, if any, as an investment of the Fund, but does not include the underlying holdings of each Fidelity Central Fund. As an Investing Fund, the Fund indirectly bears its proportionate share of the expenses of the underlying Fidelity Central Funds.
The Money Market Central Funds seek preservation of capital and current income and are managed by Fidelity Investments Money Management, Inc. (FIMM), an affiliate of FMR.
A complete unaudited list of holdings for each Fidelity Central Fund is available upon request or at the Securities and Exchange Commission (the SEC) web site at www.sec.gov. In addition, the financial statements of the Fidelity Central Funds, which are not covered by the Fund's Report of Independent Registered Public Accounting Firm, are available on the SEC web site or upon request.
Annual Report
Notes to Financial Statements - continued
(Amounts in thousands except ratios)
3. Significant Accounting Policies.
The financial statements have been prepared in conformity with accounting principles generally accepted in the United States of America (GAAP), which require management to make certain estimates and assumptions at the date of the financial statements.
Actual results could differ from those estimates. The following summarizes the significant accounting policies of the Fund:
Security Valuation. Investments are valued as of 4:00 p.m. Eastern time on the last calendar day of the period. The Fund uses independent pricing services approved by the Board of Trustees to value its investments. When current market prices or quotations are not readily available or reliable, valuations may be determined in good faith in accordance with procedures adopted by the Board of Trustees. Factors used in determining value may include market or security specific events. The frequency with which these procedures are used cannot be predicted and they may be utilized to a significant extent. The value used for net asset value (NAV) calculation under these procedures may differ from published prices for the same securities.
The Fund categorizes the inputs to valuation techniques used to value its investments into a disclosure hierarchy consisting of three levels as shown below.
Level 1 - quoted prices in active markets for identical investments
Level 2 - other significant observable inputs (including quoted prices for similar investments, interest rates, prepayment speeds, etc.)
Level 3 - unobservable inputs (including the fund's own assumptions based on the best information available)
Changes in valuation techniques may result in transfers in or out of an assigned level within the disclosure hierarchy. The aggregate value of investments by input level, as of October 31, 2010, as well as a roll forward of Level 3 securities, is included at the end of the Fund's Schedule of Investments. Valuation techniques used to value the Fund's investments by major category are as follows.
Equity securities, including restricted securities, for which market quotations are readily available, are valued at the last reported sale price or official closing price as reported by an independent pricing service on the primary market or exchange on which they are traded and are categorized as Level 1 in the hierarchy. In the event there were no sales during the day or closing prices are not available, securities are valued at the last quoted bid price or may be valued using the last available price and are generally categorized as Level 2 in the hierarchy. For foreign equity securities, when significant market or security specific events arise, comparisons to the valuation of American Depositary Receipts
Annual Report
3. Significant Accounting Policies - continued
Security Valuation - continued
(ADRs), futures contracts, Exchange-traded funds (ETFs) and certain indexes as well as quoted prices for similar securities are used and are categorized as Level 2 in the hierarchy in these circumstances. Utilizing these techniques may result in significant transfers between Level 1 and Level 2. For restricted equity securities and private placements where observable inputs are limited, assumptions about market activity and risk are used and are categorized as Level 3 in the hierarchy.
Investments in open-end mutual funds,including the Fidelity Central Funds, are valued at their closing net asset value each business day and are categorized as Level 1 in the hierarchy. Short-term securities with remaining maturities of sixty days or less for which quotations are not readily available are valued at amortized cost, which approximates fair value and are categorized as Level 2 in the hierarchy.
Foreign Currency. The Fund uses foreign currency contracts to facilitate transactions in foreign-denominated securities. Gains and losses from these transactions may arise from changes in the value of the foreign currency or if the counterparties do not perform under the contracts' terms.
Foreign-denominated assets, including investment securities, and liabilities are translated into U.S. dollars at the exchange rate at period end. Purchases and sales of investment securities, income and dividends received and expenses denominated in foreign currencies are translated into U.S. dollars at the exchange rate in effect on the transaction date.
The effects of exchange rate fluctuations on investments are included with the net realized and unrealized gain (loss) on investment securities. Other foreign currency transactions resulting in realized and unrealized gain (loss) are disclosed separately.
Investment Transactions and Income. For financial reporting purposes, the Fund's investment holdings and NAV include trades executed through the end of the last business day of the period. The NAV per share for processing shareholder transactions is calculated as of the close of business of the New York Stock Exchange (NYSE), normally 4:00 p.m. Eastern time and includes trades executed through the end of the prior business day. Gains and losses on securities sold are determined on the basis of identified cost and may include proceeds received from litigation. Dividend income is recorded on the ex-dividend date, except for certain dividends from foreign securities where the ex-dividend date may have passed, which are recorded as soon as the Fund is informed of the ex-dividend date. Non-cash dividends included in dividend income, if any, are recorded at the fair market value of the securities received. Distributions received on securities that represent a return of capital or capital gain are recorded as a reduction of cost of investments and/or as a realized gain. The Fund estimates the components of
Annual Report
Notes to Financial Statements - continued
(Amounts in thousands except ratios)
3. Significant Accounting Policies - continued
Investment Transactions and Income - continued
distributions received that may be considered return of capital distributions or capital gain distributions. Interest income and distributions from the Fidelity Central Funds are accrued as earned. Interest income includes coupon interest and amortization of premium and accretion of discount on debt securities. Investment income is recorded net of foreign taxes withheld where recovery of such taxes is uncertain.
Expenses. Most expenses of the Trust can be directly attributed to a fund. Expenses which cannot be directly attributed are apportioned amongst each fund in the Trust. Expense estimates are accrued in the period to which they relate and adjustments are made when actual amounts are known.
Deferred Trustee Compensation. Under a Deferred Compensation Plan (the Plan), independent Trustees may elect to defer receipt of a portion of their annual compensation. Deferred amounts are invested in a cross-section of Fidelity funds, are marked-to-market and remain in the Fund until distributed in accordance with the Plan. The investment of deferred amounts and the offsetting payable to the Trustees are included in the accompanying Statement of Assets and Liabilities.
Income Tax Information and Distributions to Shareholders. Each year the Fund intends to qualify as a regulated investment company, including distributing substantially all of its taxable income and realized gains under Subchapter M of the Internal Revenue Code and filing its U.S. federal tax return. As a result, no provision for income taxes is required. As of October 31, 2010, the Fund did not have any unrecognized tax benefits in the accompanying financial statements. A fund's federal tax return is subject to examination by the Internal Revenue Service (IRS) for a period of three years. Foreign taxes are provided for based on the Fund's understanding of the tax rules and rates that exist in the foreign markets in which it invests. The Fund is subject to a tax imposed on short term capital gains on securities of certain issuers domiciled in India. The Fund records an estimated deferred tax liability included in Other payables and accrued expenses in the accompanying Statement of Assets & Liabilities for net unrealized gains on these securities in an amount that would be payable if the securities were disposed of at period end.
Distributions are declared and recorded on the ex-dividend date. Income dividends and capital gain distributions are declared separately for each class. Income and capital gain distributions are determined in accordance with income tax regulations, which may differ from GAAP.
Annual Report
3. Significant Accounting Policies - continued
Income Tax Information and Distributions to Shareholders - continued
Capital accounts within the financial statements are adjusted for permanent book-tax differences. These adjustments have no impact on net assets or the results of operations. Temporary book-tax differences will reverse in a subsequent period.
Book-tax differences are primarily due to the short-term gain distributions from the Fidelity Central Funds, foreign currency transactions, certain foreign taxes, passive foreign investment companies (PFIC), deferred trustees compensation, capital loss carryforwards and losses deferred due to wash sales.
The federal tax cost of investment securities and unrealized appreciation (depreciation) as of period end were as follows:
Gross unrealized appreciation | $ 1,665,347 |
Gross unrealized depreciation | (554,558) |
Net unrealized appreciation (depreciation) | $ 1,110,789 |
| |
Tax Cost | $ 9,060,967 |
The tax-based components of distributable earnings as of period end were as follows:
Undistributed ordinary income | $ 167,811 |
Capital loss carryforward | $ (1,803,058) |
Net unrealized appreciation (depreciation) | $ 1,112,591 |
The tax character of distributions paid was as follows:
| October 31, 2010 | October 31, 2009 |
Ordinary Income | $ 129,796 | $ 107,705 |
Short-Term Trading (Redemption) Fees. Shares held by investors in the Fund less than 30 days are subject to a redemption fee equal to 1.00% of the net asset value of shares redeemed. All redemption fees, which reduce the proceeds of the shareholder redemption, are retained by the Fund and accounted for as an addition to paid in capital.
4. Operating Policies.
Repurchase Agreements. FMR has received an Exemptive Order from the SEC which permits the Fund and other affiliated entities of FMR to transfer uninvested cash balances into joint trading accounts which are then invested in repurchase agreements.
Annual Report
Notes to Financial Statements - continued
(Amounts in thousands except ratios)
4. Operating Policies - continued
Repurchase Agreements - continued
The Fund may also invest directly with institutions in repurchase agreements. Repurchase agreements are collateralized by government or non-government securities. Upon settlement date, collateral is held in segregated accounts with custodian banks and may be obtained in the event of a default of the counterparty. The Fund monitors, on a daily basis, the value of the collateral to ensure it is at least equal to the principal amount of the repurchase agreement (including accrued interest). In the event of a default by the counterparty, realization of the collateral proceeds could be delayed, during which time the value of the collateral may decline.
Restricted Securities. The Fund may invest in securities that are subject to legal or contractual restrictions on resale. These securities generally may be resold in transactions exempt from registration or to the public if the securities are registered. Disposal of these securities may involve time-consuming negotiations and expense, and prompt sale at an acceptable price may be difficult. Information regarding restricted securities is included at the end of the Fund's Schedule of Investments.
5. Purchases and Sales of Investments.
Purchases and sales of securities, other than short-term securities, aggregated $7,811,097 and $8,569,062, respectively.
6. Fees and Other Transactions with Affiliates.
Management Fee. FMR and its affiliates provide the Fund with investment management related services for which the Fund pays a monthly management fee. The management fee is the sum of an individual fund fee rate that is based on an annual rate of .45% of the Fund's average net assets and a group fee rate that averaged .26% during the period. The group fee rate is based upon the average net assets of all the mutual funds advised by FMR. The group fee rate decreases as assets under management increase and increases as assets under management decrease. In addition, the management fee is subject to a performance adjustment (up to a maximum of ± 20% of the Fund's average net assets over a 36 month performance period). The upward or downward adjustment to the management fee is based on the relative investment performance of International Discovery share class as compared to an appropriate benchmark index. For the period, the total annual management fee rate, including the performance adjustment, was .75% of the Fund's average net assets.
Annual Report
6. Fees and Other Transactions with Affiliates - continued
Distribution and Service Plan Fees. In accordance with Rule 12b-1 of the 1940 Act, the Fund has adopted separate Distribution and Service Plans for each class of shares. Certain classes pay Fidelity Distributors Corporation (FDC), an affiliate of FMR, separate Distribution and Service Fees, each of which is based on an annual percentage of each class' average net assets. In addition, FDC may pay financial intermediaries for selling shares of the Fund and providing shareholder support services. For the period, the Distribution and Service Fee rates, total fees and amounts retained by FDC were as follows:
| Distribution
Fee | Service
Fee | Total
Fees | Retained
by FDC |
Class A | -% | .25% | $ 1,036 | $ 43 |
Class T | .25% | .25% | 447 | -* |
Class B | .75% | .25% | 156 | 117 |
Class C | .75% | .25% | 445 | 40 |
| | | $ 2,084 | $ 200 |
* Amount represents four hundred sixty dollars.
Sales Load. FDC receives a front-end sales charge of up to 5.75% for selling Class A shares, and 3.50% for selling Class T shares, some of which is paid to financial intermediaries for selling shares of the Fund. FDC receives the proceeds of contingent deferred sales charges levied on Class A, Class T, Class B, and Class C redemptions. These charges depend on the holding period. The deferred sales charges range from 5% to 1% for Class B, 1% for Class C, 1.00% for certain purchases of Class A shares (1.00% to .50% prior to July 12, 2010) and .25% for certain purchases of Class T shares.
For the period, sales charge amounts retained by FDC were as follows:
| Retained
by FDC |
Class A | $ 65 |
Class T | 12 |
Class B* | 31 |
Class C* | 2 |
| $ 110 |
* When Class B and Class C shares are initially sold, FDC pays commissions from its own resources to financial intermediaries through which the sales are made.
Transfer Agent Fees. Fidelity Investments Institutional Operations Company, Inc. (FIIOC), an affiliate of FMR, is the transfer, dividend disbursing and shareholder servicing agent for each class of the Fund. FIIOC receives account fees and asset-based fees that vary according to the account size and type of account of the shareholders of the respective classes of the Fund, except for Class K. FIIOC receives an asset-based fee of Class K's average net assets. FIIOC pays for typesetting, printing and mailing of
Annual Report
Notes to Financial Statements - continued
(Amounts in thousands except ratios)
6. Fees and Other Transactions with Affiliates - continued
Transfer Agent Fees - continued
shareholder reports, except proxy statements. For the period, transfer agent fees for each class were as follows:
| Amount | % of
Average
Net Assets |
Class A | $ 1,216 | .29 |
Class T | 281 | .31 |
Class B | 52 | .33 |
Class C | 136 | .31 |
International Discovery | 20,622 | .26 |
Class K | 437 | .05 |
Institutional Class | 627 | .20 |
| $ 23,371 | |
Accounting and Security Lending Fees. Fidelity Service Company, Inc. (FSC), an affiliate of FMR, maintains the Fund's accounting records. The accounting fee is based on the level of average net assets for the month. Under a separate contract, FSC administers the security lending program. The security lending fee is based on the number and duration of lending transactions.
Brokerage Commissions. The Fund placed a portion of its portfolio transactions with brokerage firms which are affiliates of the investment adviser. The commissions paid to these affiliated firms were $10 for the period.
Interfund Lending Program. Pursuant to an Exemptive Order issued by the SEC, the Fund, along with other registered investment companies having management contracts with FMR, may participate in an interfund lending program. This program provides an alternative credit facility allowing the funds to borrow from, or lend money to, other participating affiliated funds. At period end there was no interfund loans outstanding. The Fund's activity in this program during the period for which loans were outstanding was as follows:
Borrower or Lender | Average Daily
Loan Balance | Weighted Average
Interest Rate | Interest
Expense |
Borrower | $ 31,133 | .45% | $ 12 |
Annual Report
7. Committed Line of Credit.
The Fund participates with other funds managed by FMR or an affiliate in a $3.75 billion credit facility (the "line of credit") to be utilized for temporary or emergency purposes to fund shareholder redemptions or for other short-term liquidity purposes. The Fund has agreed to pay commitment fees on its pro-rata portion of the line of credit, which amounted to $38 and is reflected in Miscellaneous expenses on the Statement of Operations. During the period, there were no borrowings on this line of credit.
8. Security Lending.
The Fund lends portfolio securities through a lending agent from time to time in order to earn additional income. The lending agent may loan securities to certain qualified borrowers, including Fidelity Capital Markets (FCM), a broker-dealer affiliated with the Fund. On the settlement date of the loan, the Fund receives collateral (in the form of U.S. Treasury obligations, letters of credit and/or cash) against the loaned securities and maintains collateral in an amount not less than 100% of the market value of the loaned securities during the period of the loan. The market value of the loaned securities is determined at the close of business of the Fund and any additional required collateral is delivered to the Fund on the next business day. If the borrower defaults on its obligation to return the securities loaned because of insolvency or other reasons, a fund could experience delays and costs in recovering the securities loaned or in gaining access to the collateral. Any cash collateral received is invested in the Fidelity Securities Lending Cash Central Fund. The value of loaned securities and cash collateral at period end are disclosed on the Fund's Statement of Assets and Liabilities. Security lending income represents the income earned on investing cash collateral, less rebates paid to borrowers and lending agent fees associated with the loan, plus any premium payments received for lending certain types of securities. Security lending income is presented in the Statement of Operations as a component of income from Fidelity Central Funds. Total security lending income during the period amounted to $6,155. During the period, there were no securities loaned to FCM.
9. Bank Borrowings.
The Fund is permitted to have bank borrowings for temporary or emergency purposes to fund shareholder redemptions. The Fund has established borrowing arrangements with certain banks. The interest rate on the borrowings is the bank's base rate, as revised from time to time. The average daily loan balance during the period for which loans were outstanding amounted to $8,212. The weighted average interest rate was .71%. The interest expense amounted to one hundred sixty-two dollars under the bank borrowing program. At period end, there were no bank borrowings outstanding.
Annual Report
Notes to Financial Statements - continued
(Amounts in thousands except ratios)
10. Expense Reductions.
Many of the brokers with whom FMR places trades on behalf of the Fund provided services to the Fund in addition to trade execution. These services included payments of certain expenses on behalf of the Fund totaling $4,562 for the period.
11. Distributions to Shareholders.
Distributions to shareholders of each class were as follows:
Years ended October 31, | 2010 | 2009 |
From net investment income | | |
Class A | $ 3,889 | $ 3,982 |
Class T | 633 | 533 |
Class B | 37 | - |
Class C | 71 | 30 |
International Discovery | 98,508 | 96,783 |
Class K | 9,602 | 3,616 |
Institutional Class | 3,682 | 2,761 |
Total | $ 116,422 | $ 107,705 |
From net realized gain | | |
Class A | $ 555 | $ - |
Class T | 119 | - |
Class B | 23 | - |
Class C | 61 | - |
International Discovery | 11,290 | - |
Class K | 935 | - |
Institutional Class | 391 | - |
Total | $ 13,374 | $ - |
12. Share Transactions.
Transactions for each class of shares were as follows:
| Shares | Dollars |
Years ended October 31, | 2010 | 2009A | 2010 | 2009A |
Class A | | | | |
Shares sold | 4,849 | 5,354 | $ 142,203 | $ 128,318 |
Reinvestment of distributions | 120 | 132 | 3,654 | 2,786 |
Shares redeemed | (7,259) | (7,017) | (215,574) | (163,223) |
Net increase (decrease) | (2,290) | (1,531) | $ (69,717) | $ (32,119) |
Annual Report
12. Share Transactions - continued
| Shares | Dollars |
Years ended October 31, | 2010 | 2009A | 2010 | 2009A |
Class T | | | | |
Shares sold | 1,165 | 1,335 | $ 34,154 | $ 31,263 |
Reinvestment of distributions | 24 | 24 | 716 | 507 |
Shares redeemed | (1,228) | (1,140) | (35,631) | (25,765) |
Net increase (decrease) | (39) | 219 | $ (761) | $ 6,005 |
Class B | | | | |
Shares sold | 105 | 161 | $ 3,047 | $ 3,835 |
Reinvestment of distributions | 2 | - | 54 | - |
Shares redeemed | (227) | (227) | (6,544) | (5,155) |
Net increase (decrease) | (120) | (66) | $ (3,443) | $ (1,320) |
Class C | | | | |
Shares sold | 356 | 920 | $ 10,567 | $ 20,539 |
Reinvestment of distributions | 4 | 1 | 116 | 26 |
Shares redeemed | (515) | (953) | (14,926) | (22,201) |
Net increase (decrease) | (155) | (32) | $ (4,243) | $ (1,636) |
International Discovery | | | | |
Shares sold | 55,460 | 74,803 | $ 1,640,231 | $ 1,831,653 |
Conversion to Class K | - | (12,549) | - | (279,461) |
Reinvestment of distributions | 3,453 | 4,362 | 105,461 | 92,471 |
Shares redeemed | (89,239) | (77,871) | (2,636,183) | (1,831,786) |
Net increase (decrease) | (30,326) | (11,255) | $ (890,491) | $ (187,123) |
Class K | | | | |
Shares sold | 16,961 | 10,015 | $ 491,304 | $ 246,074 |
Conversion from International Discovery | - | 12,572 | - | 279,461 |
Reinvestment of distributions | 346 | 171 | 10,537 | 3,616 |
Shares redeemed | (7,377) | (5,401) | (215,813) | (128,754) |
Net increase (decrease) | 9,930 | 17,357 | $ 286,028 | $ 400,397 |
Institutional Class | | | | |
Shares sold | 4,322 | 10,440 | $ 127,580 | $ 235,326 |
Reinvestment of distributions | 36 | 41 | 1,083 | 875 |
Shares redeemed | (3,773) | (7,843) | (108,068) | (169,915) |
Net increase (decrease) | 585 | 2,638 | $ 20,595 | $ 66,286 |
A Conversion transactions for Class K and International Discovery are for the period November 1, 2008 though August 31, 2009.
Annual Report
Notes to Financial Statements - continued
(Amounts in thousands except ratios)
13. Other.
The Fund's organizational documents provide former and current trustees and officers with a limited indemnification against liabilities arising in connection with the performance of their duties to the Fund. In the normal course of business, the Fund may also enter into contracts that provide general indemnifications. The Fund's maximum exposure under these arrangements is unknown as this would be dependent on future claims that may be made against the Fund. The risk of material loss from such claims is considered remote.
Annual Report
To the Trustees of Fidelity Investment Trust and the Shareholders of Fidelity International Discovery Fund:
In our opinion, the accompanying statement of assets and liabilities, including the schedule of investments, and the related statements of operations and of changes in net assets and the financial highlights present fairly, in all material respects, the financial position of Fidelity International Discovery Fund (a fund of Fidelity Investment Trust) at October 31, 2010, the results of its operations for the year then ended, the changes in its net assets for each of the two years in the period then ended and the financial highlights for each of the five years in the period then ended, in conformity with accounting principles generally accepted in the United States of America. These financial statements and financial highlights (hereafter referred to as "financial statements") are the responsibility of the Fidelity International Discovery Fund's management. Our responsibility is to express an opinion on these financial statements based on our audits. We conducted our audits of these financial statements in accordance with the standards of the Public Company Accounting Oversight Board (United States). Those standards require that we plan and perform the audit to obtain reasonable assurance about whether the financial statements are free of material misstatement. An audit includes examining, on a test basis, evidence supporting the amounts and disclosures in the financial statements, assessing the accounting principles used and significant estimates made by management, and evaluating the overall financial statement presentation. We believe that our audits, which included confirmation of securities at October 31, 2010 by correspondence with the custodian and brokers, provide a reasonable basis for our opinion.
/s/ PricewaterhouseCoopers LLP
PricewaterhouseCoopers LLP
Boston, Massachusetts
December 17, 2010
Annual Report
The Trustees, Member of the Advisory Board, and executive officers of the trust and fund, as applicable, are listed below. The Board of Trustees governs the fund and is responsible for protecting the interests of shareholders. The Trustees are experienced executives who meet periodically throughout the year to oversee the fund's activities, review contractual arrangements with companies that provide services to the fund, oversee management of the risks associated with such activities and contractual arrangements, and review the fund's performance. Except for James C. Curvey, each of the Trustees oversees 221 funds advised by FMR or an affiliate. Mr. Curvey oversees 410 funds advised by FMR or an affiliate.
The Trustees hold office without limit in time except that (a) any Trustee may resign; (b) any Trustee may be removed by written instrument, signed by at least two-thirds of the number of Trustees prior to such removal; (c) any Trustee who requests to be retired or who has become incapacitated by illness or injury may be retired by written instrument signed by a majority of the other Trustees; and (d) any Trustee may be removed at any special meeting of shareholders by a two-thirds vote of the outstanding voting securities of the trust. Each Trustee who is not an interested person (as defined in the 1940 Act) (Independent Trustee), shall retire not later than the last day of the calendar year in which his or her 72nd birthday occurs. The Independent Trustees may waive this mandatory retirement age policy with respect to individual Trustees. The executive officers and Advisory Board Member hold office without limit in time, except that any officer and Advisory Board Member may resign or may be removed by a vote of a majority of the Trustees at any regular meeting or any special meeting of the Trustees. Except as indicated, each individual has held the office shown or other offices in the same company for the past five years.
Experience, Skills, Attributes, and Qualifications of the Fund's Trustees. The Governance and Nominating Committee has adopted a statement of policy that describes the experience, qualifications, attributes, and skills that are necessary and desirable for potential Independent Trustee candidates (Statement of Policy). The Board believes that each Trustee satisfied at the time he or she was initially elected or appointed a Trustee, and continues to satisfy, the standards contemplated by the Statement of Policy. The Governance and Nominating Committee also engages professional search firms to help identify potential Independent Trustee candidates who have the experience, qualifications, attributes, and skills consistent with the Statement of Policy. From time to time, additional criteria based on the composition and skills of the current Independent Trustees, as well as experience or skills that may be appropriate in light of future changes to board composition, business conditions, and regulatory or other developments, have also been considered by the professional search firms and the Governance and Nominating Committee. In addition, the Board takes into account the Trustees' commitment and participation in Board and committee meetings, as well as their leadership of standing and ad hoc committees throughout their tenure.
In determining that a particular Trustee was and continues to be qualified to serve as a Trustee, the Board has considered a variety of criteria, none of which, in isolation, was controlling. The Board believes that, collectively, the Trustees have balanced and diverse experience, qualifications, attributes, and skills, which allow the Board to operate effectively in governing the fund and protecting the interests of shareholders. Information about the specific experience, skills, attributes, and qualifications of each Trustee, which in each case led to the Board's conclusion that the Trustee should serve (or continue to serve) as a trustee of the fund, is provided below.
Annual Report
Trustees and Officers - continued
Board Structure and Oversight Function. Edward C. Johnson 3d is an interested person (as defined in the 1940 Act) and currently serves as Chairman. The Trustees have determined that an interested Chairman is appropriate and benefits shareholders because an interested Chairman has a personal and professional stake in the quality and continuity of services provided to the fund. Independent Trustees exercise their informed business judgment to appoint an individual of their choosing to serve as Chairman, regardless of whether the Trustee happens to be independent or a member of management. The Independent Trustees have determined that they can act independently and effectively without having an Independent Trustee serve as Chairman and that a key structural component for assuring that they are in a position to do so is for the Independent Trustees to constitute a substantial majority for the Board. The Independent Trustees also regularly meet in executive session. Ned C. Lautenbach serves as Chairman of the Independent Trustees and as such (i) acts as a liaison between the Independent Trustees and management with respect to matters important to the Independent Trustees and (ii) with management prepares agendas for Board meetings.
Fidelity funds are overseen by different Boards of Trustees. The fund's Board oversees Fidelity's equity and high income funds and another Board oversees Fidelity's investment-grade bond, money market, and asset allocation funds. The asset allocation funds may invest in Fidelity funds overseen by the fund's Board. The use of separate Boards, each with its own committee structure, allows the Trustees of each group of Fidelity funds to focus on the unique issues of the funds they oversee, including common research, investment, and operational issues. On occasion, the separate Boards establish joint committees to address issues of overlapping consequences for the Fidelity funds overseen by each Board.
The Trustees operate using a system of committees to facilitate the timely and efficient consideration of all matters of importance to the Trustees, the fund, and fund shareholders and to facilitate compliance with legal and regulatory requirements and oversight of the fund's activities and associated risks. The Board, acting through its committees, has charged FMR and its affiliates with (i) identifying events or circumstances the occurrence of which could have demonstrably adverse effects on the fund's business and/or reputation; (ii) implementing processes and controls to lessen the possibility that such events or circumstances occur or to mitigate the effects of such events or circumstances if they do occur; and (iii) creating and maintaining a system designed to evaluate continuously business and market conditions in order to facilitate the identification and implementation processes described in (i) and (ii) above. Because the day-to-day operations and activities of the fund are carried out by or through FMR, its affiliates and other service providers, the fund's exposure to risks is mitigated but not eliminated by the processes overseen by the Trustees. While each of the Board's committees has responsibility for overseeing different aspects of the fund's activities, oversight is exercised primarily through the Operations, Audit, and Compliance Committees. Appropriate personnel, including but not limited to the fund's Chief Compliance Officer (CCO), FMR's internal auditor, the independent accountants, the fund's Treasurer and portfolio management personnel, make periodic reports to the Board's committees, as appropriate. The responsibilities of each committee, including their oversight responsibilities, are described further under "Standing Committees of the Fund's Trustees."
Annual Report
The fund's Statement of Additional Information (SAI) includes more information about the Trustees. To request a free copy, call Fidelity at 1-800-835-5092.
Interested Trustees*:
Correspondence intended for each Trustee who is an interested person may be sent to Fidelity Investments, 82 Devonshire Street, Boston, Massachusetts 02109.
Name, Age; Principal Occupations and Other Relevant Experience+ |
Edward C. Johnson 3d (80) |
| Year of Election or Appointment: 1984 Mr. Johnson is Trustee and Chairman of the Board of Trustees of certain Trusts. Mr. Johnson serves as Chief Executive Officer, Chairman, and a Director of FMR LLC; Chairman and a Director of FMR; Chairman and a Director of Fidelity Research & Analysis Company (FRAC); Chairman and a Director of Fidelity Investments Money Management, Inc.; and Chairman and a Director of FMR Co., Inc. In addition, Mr. Johnson serves as Chairman and Director of FIL Limited. Previously, Mr. Johnson served as President of FMR LLC (2006-2007). |
James C. Curvey (75) |
| Year of Election or Appointment: 2007 Mr. Curvey also serves as Trustee (2007-present) of other investment companies advised by FMR. Mr. Curvey is a Director of Fidelity Investments Money Management, Inc. (2009-present), Director of Fidelity Research & Analysis Co. (2009-present) and Director of FMR and FMR Co., Inc. (2007-present). Mr. Curvey is also Vice Chairman (2007-present) and Director of FMR LLC. In addition, Mr. Curvey serves as an Overseer for the Boston Symphony Orchestra and a member of the Trustees of Villanova University. Previously, Mr. Curvey was the Vice Chairman (2006-2007) and Director (2000-2007) of FMR Corp. |
Annual Report
Trustees and Officers - continued
* Trustees have been determined to be "Interested Trustees" by virtue of, among other things, their affiliation with the trust or various entities under common control with FMR.
+ The information above includes each Trustee's principal occupation during the last five years and other information relating to the experience, attributes, and skills relevant to each Trustee's qualifications to serve as a Trustee, which led to the conclusion that each Trustee should serve as a Trustee for the fund.
Independent Trustees:
Correspondence intended for each Independent Trustee (that is, the Trustees other than the Interested Trustees) may be sent to Fidelity Investments, P.O. Box 55235, Boston, Massachusetts 02205-5235.
Name, Age; Principal Occupations and Other Relevant Experience+ |
Dennis J. Dirks (62) |
| Year of Election or Appointment: 2005 Prior to his retirement in May 2003, Mr. Dirks was Chief Operating Officer and a member of the Board of The Depository Trust & Clearing Corporation (DTCC). He also served as President, Chief Operating Officer, and Board member of The Depository Trust Company (DTC) and President and Board member of the National Securities Clearing Corporation (NSCC). In addition, Mr. Dirks served as Chief Executive Officer and Board member of the Government Securities Clearing Corporation, Chief Executive Officer and Board member of the Mortgage-Backed Securities Clearing Corporation, as a Trustee and a member of the Finance Committee of Manhattan College (2005-2008), and as a Trustee and a member of the Finance Committee of AHRC of Nassau County (2006-2008). Mr. Dirks is a member of the Independent Directors Council (IDC) Governing Council (2010-Present) and Board of Directors for The Brookville Center for Children's Services, Inc. (2009-present). |
Alan J. Lacy (57) |
| Year of Election or Appointment: 2008 Mr. Lacy serves as Senior Adviser (2007-present) of Oak Hill Capital Partners, L.P. (private equity). Mr. Lacy also served as Chief Executive Officer (2000-2005) and Vice Chairman (2005-2006) of Sears Holdings Corporation and Sears, Roebuck and Co. (retail). In addition, Mr. Lacy serves as a member of the Board of Directors of The Western Union Company (global money transfer, 2006-present) and Bristol-Myers Squibb Company (global pharmaceuticals, 2007-present). Mr. Lacy is Chairman (2008-present) and a member (2006-present) of the Board of Trustees of The National Parks Conservation Association. |
Ned C. Lautenbach (66) |
| Year of Election or Appointment: 2000 Mr. Lautenbach is Chairman of the Independent Trustees of the Equity and High Income Funds (2006-present). Mr. Lautenbach currently serves as the Lead Director of the Eaton Corporation Board of Directors (diversified industrial, 1997-present). Mr. Lautenbach is also a member of the Board of Directors of the Philharmonic Center for the Arts in Naples, Florida (1999-present); a member of the Board of Trustees of Fairfield University (2005-present); and a member of the Council on Foreign Relations (1994-present). Previously, Mr. Lautenbach was a Partner/Advisory Partner at Clayton, Dubilier & Rice, Inc. (private equity investment, 1998-2010), as well as a Director of Sony Corporation (2006-2007). |
Joseph Mauriello (66) |
| Year of Election or Appointment: 2008 Prior to his retirement in January 2006, Mr. Mauriello served in numerous senior management positions including Deputy Chairman and Chief Operating Officer (2004-2005), and Vice Chairman of Financial Services (2002-2004) of KPMG LLP US (professional services, 1965-2005). Mr. Mauriello currently serves as a member of the Board of Directors of XL Group plc. (global insurance and re-insurance, 2006-present) and of Arcadia Resources Inc. (health care services and products, 2007-present). Previously, Mr. Mauriello served as a Director of the Hamilton Funds of the Bank of New York (2006-2007). |
Cornelia M. Small (66) |
| Year of Election or Appointment: 2005 Ms. Small is a member of the Board of Directors of the Teagle Foundation (2009-present). Ms. Small is also a member of the Investment Committee, and Chair (2008-present) and a member of the Board of Trustees of Smith College. In addition, Ms. Small serves on the Investment Committee of the Berkshire Taconic Community Foundation (2008-present). Previously, Ms. Small served as Chairperson of the Investment Committee (2002-2008) of Smith College. In addition, Ms. Small served as Chief Investment Officer, Director of Global Equity Investments, and a member of the Board of Directors of Scudder, Stevens & Clark and Scudder Kemper Investments. |
William S. Stavropoulos (71) |
| Year of Election or Appointment: 2001 Mr. Stavropoulos is Vice Chairman of the Independent Trustees of the Equity and High Income Funds (2006-present). Mr. Stavropoulos serves as President and Founder of the Michigan Baseball Foundation, the Great Lakes Loons (2007-present). Mr. Stavropoulos is Chairman Emeritus of the Board of Directors of The Dow Chemical Company, where he previously served in numerous senior management positions, including President, CEO (1995-2000; 2002-2004), Chairman of the Executive Committee (2000-2006), and as a member of the Board of Directors (1990-2006). Currently, Mr. Stavropoulos is Chairman of Univar (global distributor of commodity and specialty chemicals, 2010-present), a Director of Teradata Corporation (data warehousing and technology solutions, 2008-present), Chemical Financial Corporation, Maersk Inc. (industrial conglomerate), Tyco International, Inc. (multinational manufacturing and services, 2007-present), and a member of the Advisory Board for Metalmark Capital (private equity investment, 2005-present). Mr. Stavropoulos is a special advisor to Clayton, Dubilier & Rice, Inc. (private equity investment). In addition, Mr. Stavropoulos is a member of the University of Notre Dame Advisory Council for the College of Science. |
David M. Thomas (61) |
| Year of Election or Appointment: 2008 Previously, Mr. Thomas served as Executive Chairman (2005-2006) and Chairman and Chief Executive Officer (2000-2005) of IMS Health, Inc. (pharmaceutical and healthcare information solutions). In addition, Mr. Thomas serves as a member of the Board of Directors of Fortune Brands, Inc. (consumer products), and Interpublic Group of Companies, Inc. (marketing communication, 2004-present). |
Michael E. Wiley (60) |
| Year of Election or Appointment: 2008 Mr. Wiley also serves as a Director of Asia Pacific Exploration Consolidated (international oil and gas exploration and production, 2008-present). Mr. Wiley serves as a Director of Tesoro Corporation (independent oil refiner and marketer, 2005-present), and a Director of Bill Barrett Corporation (exploration and production, 2005-present). In addition, Mr. Wiley also serves as a Director of Post Oak Bank (privately-held bank, 2004-present). Previously, Mr. Wiley served as a member of the Board of Trustees of the University of Tulsa (2000-2006; 2007-2010), as a Senior Energy Advisor of Katzenbach Partners, LLC (consulting, 2006-2007), as an Advisory Director of Riverstone Holdings (private investment), Chairman, President, and CEO of Baker Hughes, Inc. (oilfield services, 2000-2004), and as Director of Spinnaker Exploration Company (exploration and production, 2001-2005). |
Annual Report
+ The information above includes each Trustee's principal occupation during the last five years and other information relating to the experience, attributes, and skills relevant to each Trustee's qualifications to serve as a Trustee, which led to the conclusion that each Trustee should serve as a Trustee for the fund.
Advisory Board Member and Executive Officers:
Correspondence intended for each executive officer and Peter S. Lynch may be sent to Fidelity Investments, 82 Devonshire Street, Boston, Massachusetts 02109.
Name, Age; Principal Occupation |
Peter S. Lynch (66) |
| Year of Election or Appointment: 2003 Member of the Advisory Board of Fidelity's Equity and High Income Funds. Mr. Lynch is Vice Chairman and a Director of FMR and FMR Co., Inc. In addition, Mr. Lynch serves as a Trustee of Boston College and as the Chairman of the Inner-City Scholarship Fund. Previously, Mr. Lynch served on the Special Olympics International Board of Directors (1997-2006). |
Kenneth B. Robins (41) |
| Year of Election or Appointment: 2008 President and Treasurer of Fidelity's Equity and High Income Funds. Mr. Robins also serves as President and Treasurer (2010-present) and Assistant Treasurer (2009-present) of other Fidelity funds and is an employee of Fidelity Investments (2004-present). Previously, Mr. Robins served as Deputy Treasurer of the Fidelity funds (2005-2008) and Treasurer and Chief Financial Officer of The North Carolina Capital Management Trust: Cash and Term Portfolios (2006-2008). |
Bruce T. Herring (45) |
| Year of Election or Appointment: 2006 Vice President of certain Equity Funds. Mr. Herring also serves as Chief Investment Officer and Director of Fidelity Management & Research (U.K.) Inc. (2010-present) and Group Chief Investments Officer of FMR. Previously, Mr. Herring served as Vice President (2005-2006) and Senior Vice President (2006-2007) of Fidelity Management & Research Company, Vice President of FMR Co., Inc. (2001-2007) and as a portfolio manager for Fidelity U.S. Equity Funds. |
Brian B. Hogan (46) |
| Year of Election or Appointment: 2009 Vice President of certain Equity Funds and Vice President of Sector Funds. Mr. Hogan also serves as President of FMR's Equity Division (2009-present). Previously, Mr. Hogan served as Senior Vice President, Equity Research of FMR (2006-2009) and as a portfolio manager. |
Scott C. Goebel (42) |
| Year of Election or Appointment: 2008 Secretary and Chief Legal Officer (CLO) of the Fidelity funds. Mr. Goebel also serves as Secretary and CLO of The North Carolina Capital Management Trust: Cash and Term Portfolio (2008-present); General Counsel, Secretary, and Senior Vice President of FMR (2008-present) and FMR Co., Inc. (2008-present); Deputy General Counsel of FMR LLC; Chief Legal Officer of Fidelity Management & Research (Hong Kong) Limited (2008-present) and Assistant Secretary of Fidelity Management & Research (Japan) Inc. (2008-present), Fidelity Investments Money Management, Inc. (2008-present), Fidelity Management & Research (U.K.) Inc. (2008-present), and Fidelity Research and Analysis Company (2008-present). Previously, Mr. Goebel served as Assistant Secretary of the Funds (2007-2008) and as Vice President and Secretary of Fidelity Distributors Corporation (FDC) (2005-2007). |
William C. Coffey (41) |
| Year of Election or Appointment: 2009 Assistant Secretary of Fidelity's Equity and High Income Funds. Mr. Coffey also serves as Senior Vice President and Deputy General Counsel of FMR LLC (2010-present), and is an employee of Fidelity Investments. Previously, Mr. Coffey served as Vice President and Associate General Counsel of FMR LLC (2005-2009). |
Holly C. Laurent (56) |
| Year of Election or Appointment: 2008 Anti-Money Laundering (AML) Officer of the Fidelity funds. Ms. Laurent also serves as AML Officer of The North Carolina Capital Management Trust: Cash and Term Portfolio (2008-present) and is an employee of Fidelity Investments. Previously, Ms. Laurent was Senior Vice President and Head of Legal for Fidelity Business Services India Pvt. Ltd. (2006-2008), and Senior Vice President, Deputy General Counsel and Group Head for FMR LLC (2005-2006). |
Christine Reynolds (52) |
| Year of Election or Appointment: 2008 Chief Financial Officer of the Fidelity funds. Ms. Reynolds became President of Fidelity Pricing and Cash Management Services (FPCMS) in August 2008. Ms. Reynolds served as Chief Operating Officer of FPCMS (2007-2008). Previously, Ms. Reynolds served as President, Treasurer, and Anti-Money Laundering officer of the Fidelity funds (2004-2007). |
Kenneth A. Rathgeber (63) |
| Year of Election or Appointment: 2004 Chief Compliance Officer of Fidelity's Equity and High Income Funds. Mr. Rathgeber is Chief Compliance Officer of Fidelity Management & Research (Hong Kong) Limited (2008-present), Fidelity Management & Research (Japan) Inc. (2008-present), FMR (2005-present), FMR Co., Inc. (2005-present), Fidelity Management & Research (U.K.) Inc. (2005-present), Fidelity Research & Analysis Company (2005-present), Fidelity Investments Money Management, Inc. (2005-present), Pyramis Global Advisors, LLC (2005-present), and Strategic Advisers, Inc. (2005-present). |
Jeffrey S. Christian (49) |
| Year of Election or Appointment: 2009 Deputy Treasurer of the Fidelity funds. Mr. Christian is an employee of Fidelity Investments. Previously, Mr. Christian served as Chief Financial Officer (2008-2009) of certain Fidelity funds and Senior Vice President of Fidelity Pricing and Cash Management Services (FPCMS) (2004-2009). |
Bryan A. Mehrmann (49) |
| Year of Election or Appointment: 2005 Deputy Treasurer of the Fidelity funds. Mr. Mehrmann is an employee of Fidelity Investments. |
Adrien E. Deberghes (43) |
| Year of Election or Appointment: 2008 Deputy Treasurer of Fidelity's Equity and High Income Funds. Mr. Deberghes also serves as Assistant Treasurer of other Fidelity funds (2010-present) and is an employee of Fidelity Investments (2008-present). Previously, Mr. Deberghes served as Senior Vice President of Mutual Fund Administration at State Street Corporation (2007-2008), Senior Director of Mutual Fund Administration at Investors Bank & Trust (2005-2007), and Director of Finance for Dunkin' Brands (2000-2005). |
Stephanie J. Dorsey (41) |
| Year of Election or Appointment: 2010 Assistant Treasurer of Fidelity's Equity and High Income Funds. Ms. Dorsey also serves as Deputy Treasurer of other Fidelity funds (2008-present) and is an employee of Fidelity Investments (2008-present). Previously, Ms. Dorsey served as Treasurer (2004-2008) of the JPMorgan Mutual Funds and Vice President (2004-2008) of JPMorgan Chase Bank. |
John R. Hebble (52) |
| Year of Election or Appointment: 2009 Assistant Treasurer of Fidelity's Equity and High Income Funds. Mr. Hebble also serves as Treasurer and Chief Financial Officer of The North Carolina Capital Management Trust: Cash and Term Portfolio (2008-present), President and Treasurer of other Fidelity funds (2008-present) and is an employee of Fidelity Investments. |
Gary W. Ryan (52) |
| Year of Election or Appointment: 2005 Assistant Treasurer of the Fidelity funds. Mr. Ryan is an employee of Fidelity Investments. Previously, Mr. Ryan served as Vice President of Fund Reporting in Fidelity Pricing and Cash Management Services (FPCMS) (1999-2005). |
Jonathan Davis (42) |
| Year of Election or Appointment: 2010 Assistant Treasurer of the Fidelity funds. Mr. Davis is an employee of Fidelity Investments. Previously, Mr. Davis served as Vice President and Associate General Counsel of FMR LLC (2003-2010). |
Annual Report
The Board of Trustees of Fidelity International Discovery Fund voted to pay to shareholders of record at the opening of business on record date, the following distributions per share derived from capital gains realized from sales of portfolio securities, and dividends derived from net investment income:
| Pay Date | Record Date | Dividends | Capital Gains |
K Class | 12/06/10 | 12/03/10 | $0.488 | $0.155 |
K Class designates 100% of the dividend distributed in December during the fiscal year as amounts which may be taken into account as a dividend for purposes of the maximum rate under section 1(h)(11) of the Internal Revenue Code.
The amounts per share which represent income derived from sources within, and taxes paid to, foreign countries or possessions of the United States are as follows:
| Pay Date | Income | Taxes |
K Class | 12/07/09 | $0.398 | $0.0296 |
The fund will notify shareholders in January 2011 of amounts for use in preparing 2010 income tax returns.
Annual Report
Board Approval of Investment Advisory Contracts and Management Fees
Fidelity International Discovery Fund
Each year, the Board of Trustees, including the Independent Trustees (together, the Board), votes on the renewal of the management contract and sub-advisory agreements (together, the Advisory Contracts) for the fund. The Board, assisted by the advice of fund counsel and Independent Trustees' counsel, requests and considers a broad range of information relevant to the renewal of the Advisory Contracts throughout the year.
The Board meets regularly and considers at each of its meetings factors that are relevant to its annual consideration of the renewal of the fund's Advisory Contracts, including the services and support provided to the fund and its shareholders. The Board has established various standing committees, each composed of Independent Trustees with varying backgrounds, to which the Board has assigned specific subject matter responsibilities in order to enhance effective decision-making by the Board. The Board, acting directly and through its Committees, requests and receives information concerning the annual consideration of the renewal of the fund's Advisory Contracts. The Board also meets as needed to consider matters specifically related to the Board's annual consideration of the renewal of Advisory Contracts. Members of the Board may also meet with trustees of other Fidelity funds through ad hoc joint committees to discuss certain matters relevant to the Fidelity funds.
At its July 2010 meeting, the Board of Trustees, including the Independent Trustees, unanimously determined to renew the fund's Advisory Contracts. In reaching its determination, the Board considered all factors it believed relevant, including (i) the nature, extent, and quality of the services to be provided to the fund and its shareholders (including the investment performance of the fund); (ii) the competitiveness of the fund's management fee and total expenses; (iii) the total costs of the services to be provided by and the profits to be realized by Fidelity from its relationship with the fund; (iv) the extent to which economies of scale would be realized as the fund grows; and (v) whether fee levels reflect these economies of scale, if any, for the benefit of fund shareholders.
In considering whether to renew the Advisory Contracts for the fund, the Board reached a determination, with the assistance of fund counsel and Independent Trustees' counsel and through the exercise of its business judgment, that the renewal of the Advisory Contracts is in the best interests of fund shareholders and that the compensation to be received by Fidelity under the management contract is fair and reasonable. The Board's decision to renew the Advisory Contracts was not based on any single factor noted above, but rather was based on a comprehensive consideration of all the information provided to the Board at its meetings throughout the year. The Board, in reaching its determination to renew the Advisory Contracts, is aware that shareholders in the fund have a broad range of investment choices available to them, including a wide choice among mutual funds offered by Fidelity's competitors, and that the fund's shareholders, with the opportunity to review and weigh the disclosure provided by the fund in its prospectus and other public disclosures, have chosen to invest in this fund, managed by Fidelity.
Annual Report
Board Approval of Investment Advisory Contracts and
Management Fees - continued
Nature, Extent, and Quality of Services Provided. The Board considered the staffing within the investment adviser, FMR, and the sub-advisers (together, the Investment Advisers), including the backgrounds of the fund's investment personnel and the fund's investment objective and discipline. The Independent Trustees also had discussions with senior management of Fidelity's investment operations and investment groups. The Board considered the structure of the portfolio manager compensation program and whether this structure provides appropriate incentives to act in the best interest of the fund.
Resources Dedicated to Investment Management and Support Services. The Board and the equity research subcommittee of the Board's Fund Oversight Committee reviewed the size, education, and experience of the Investment Advisers' investment staff, their use of technology, and the Investment Advisers' approach to recruiting, training, and retaining portfolio managers and other research, advisory, and management personnel. The Board noted that Fidelity's analysts have access to a variety of technological tools and market and securities data that enable them to perform both fundamental and quantitative analysis and to specialize in various disciplines. The Board considered Fidelity's extensive global research capabilities that enable the Investment Advisers to aggregate data from various sources in an effort to produce positive investment results. The Board also considered that Fidelity's portfolio managers and analysts have access to daily portfolio attribution that allows for monitoring of a fund's portfolio, as well as an electronic communication system that provides immediate real-time access to research concerning issuers and credit enhancers. The Board noted FMR's continued focus on strengthening the organization and discipline of equity portfolio management and research.
Shareholder and Administrative Services. The Board considered (i) the nature, extent, quality, and cost of advisory, administrative, and shareholder services performed by the Investment Advisers and their affiliates under the Advisory Contracts and under separate agreements covering transfer agency, pricing and bookkeeping, and securities lending services for the fund; (ii) the nature and extent of the investment adviser's supervision of third party service providers, principally custodians and subcustodians; and (iii) the resources devoted to, and the record of compliance with, the fund's compliance policies and procedures. The Board also reviewed the allocation of fund brokerage, including allocations to brokers affiliated with the Investment Advisers, the use of brokerage commissions to pay fund expenses, and the use of "soft" commission dollars to pay for research services.
The Board noted that the growth of fund assets over time across the complex allows Fidelity to reinvest in the development of services designed to enhance the value or convenience of the Fidelity funds as investment vehicles. These services include 24-hour access to account information and market information through phone representatives and over the Internet, and investor education materials and asset allocation tools.
Annual Report
Investment in a Large Fund Family. The Board considered the benefits to shareholders of investing in a Fidelity fund, including the benefits of investing in a fund that is part of a large family of funds offering a variety of investment disciplines and providing a large variety of mutual fund investor services. The Board noted that Fidelity had taken, or had made recommendations that resulted in the Fidelity funds taking, a number of actions over the previous year that benefited particular funds, including (i) dedicating additional resources to investment research and restructuring and broadening the focus of the investment research teams; (ii) bolstering the senior management team that oversees asset management; (iii) launching Class F of certain funds as a lower-fee class available to Freedom K and Freedom Index Funds; (iv) lowering the initial investment minimums and ongoing balance requirements for Real Estate High Income Fund; (v) eliminating subsequent purchase minimums for all funds and adding a waiver of the investment minimum requirement for new accounts opened with the proceeds of a systematic withdrawal plan; (vi) eliminating the withdrawal minimum and maximum limits for systematic withdrawals from Advisor funds; (vii) expanding sales load waivers on Class A shares for Destiny Planholders and expanding Institutional Class eligibility for Class O Destiny Planholders; and (viii) changing certain Class A and Class T sales charge structures to further align them with industry practices.
Investment Performance. The Board considered whether the fund has operated in accordance with its investment objective, as well as its record of compliance with its investment restrictions. It also reviewed the fund's absolute investment performance for each class, as well as the fund's relative investment performance for each class measured over multiple periods against (i) a broad-based securities market index, and (ii) a peer group of mutual funds deemed appropriate by Fidelity and reviewed by the Board. The following charts considered by the Board show, over the one-, three-, and five-year periods ended December 31, 2009, as available, the cumulative total returns of Institutional Class (Class I) and the retail class of the fund, the cumulative total returns of a broad-based securities market index ("benchmark"), and a range of cumulative total returns of a peer group of mutual funds identified by Morningstar, Inc. as having an investment style similar to that of the fund based on underlying portfolio holdings. The returns of the retail class and Class B show the performance of the highest performing class (based on five-year performance) and the lowest performing class (based on three-year performance), respectively. The box within each chart shows the 25th percentile return (bottom of box) and the 75th percentile return (top of box) of the peer group. Returns shown above the box are in the first quartile and returns shown below the box are in the fourth quartile. The percentage beaten numbers noted below each chart correspond to the percentile box and represent the percentage of funds in the peer group whose performance was equal to or lower than that of the class indicated.
Annual Report
Board Approval of Investment Advisory Contracts and
Management Fees - continued
Fidelity International Discovery Fund

The Board reviewed the fund's relative investment performance against its peer group and noted that the performance of the retail class of the fund (the class with the longer performance record) was in the third quartile for the one-year period and the second quartile for the three- and five-year periods. The Board also noted that the investment performance of the retail class of the fund compared favorably to its benchmark for the three- and five-year periods, although the fund's one-year cumulative total return was lower than its benchmark. The Board considered that the variations in performance among the fund's classes reflect the variations in class expenses, which result in lower performance for higher expense classes. The Board also reviewed the fund's performance since inception as well as performance in the current year.
The Board also considered that the fund's management fee is subject to upward or downward adjustment depending upon whether, and to what extent, the fund's investment performance for the performance period exceeds, or is exceeded by, the record (over the same period) of a Board-approved performance adjustment index. The Board realizes that the performance adjustment provides FMR with a strong economic incentive to seek to achieve superior performance for the fund's shareholders and helps to more closely align the interests of FMR and the fund's shareholders.
Based on its review, and giving particular weight to the nature and quality of the resources dedicated by the Investment Advisers to maintain and improve relative performance and factoring in the unprecedented market events in recent years, the Board concluded that the nature, extent, and quality of investment management and support services and of shareholder and administrative services provided to the fund will benefit the fund's shareholders, particularly in light of the Board's view that the fund's shareholders benefit from investing in a fund that is part of a large family of funds offering a variety of investment disciplines and services.
Annual Report
Competitiveness of Management Fee and Total Fund Expenses. The Board considered the fund's management fee and total expenses compared to "mapped groups" of competitive funds and classes. Fidelity creates "mapped groups" by combining similar Lipper investment objective categories that have comparable management fee characteristics. Combining Lipper investment objective categories aids the Board's management fee and total expense comparisons by broadening the competitive group used for comparison and by reducing the number of universes to which various Fidelity funds are compared.
Management Fee. The Board considered two proprietary management fee comparisons for the 12-month periods shown in the chart below. The group of Lipper funds used by the Board for management fee comparisons is referred to below as the "Total Mapped Group." The Total Mapped Group comparison focuses on a fund's standing relative to the total universe of comparable funds available to investors, in terms of gross management fees before expense reimbursements or caps, and without giving effect to the fund's performance adjustment. "TMG %" represents the percentage of funds in the Total Mapped Group that had management fees that were lower than the fund's. For example, a TMG % of 15% means that 85% of the funds in the Total Mapped Group had higher management fees than the fund. The "Asset-Size Peer Group" (ASPG) comparison focuses on a fund's standing relative to non-Fidelity funds similar in size to the fund within the Total Mapped Group. The ASPG represents at least 15% of the funds in the Total Mapped Group with comparable asset size and management fee characteristics, subject to a minimum of 50 funds (or all funds in the Total Mapped Group if fewer than 50). Additional information, such as the ASPG quartile in which the fund's management fee ranked and the impact of the fund's performance adjustment, is also included in the chart and considered by the Board.
Annual Report
Board Approval of Investment Advisory Contracts and
Management Fees - continued
Fidelity International Discovery Fund

The Board noted that the fund's management fee ranked below the median of its Total Mapped Group and below the median of its ASPG for 2009. The Board also noted the effect of the fund's positive performance adjustment on the fund's management fee ranking. The Board noted that the performance adjustment for each year represents calculations for performance periods that differ from the periods shown in the performance charts above.
Based on its review, the Board concluded that the fund's management fee is fair and reasonable in light of the services that the fund receives and the other factors considered.
Total Expenses. In its review of each class's total expenses, the Board considered the fund's management fee as well as other fund or class expenses, as applicable, such as transfer agent fees, pricing and bookkeeping fees, fund-paid 12b-1 fees, and custodial, legal, and audit fees. The Board also noted the effects of any waivers and reimbursements on fees and expenses, as well as the impact of the fund's performance adjustment. As part of its review, the Board also considered current and historical total expenses of each class of the fund compared to competitive fund median expenses. Each class of the fund is compared to those funds and classes in the Total Mapped Group (used by the Board for management fee comparisons) that have a similar sales load structure.
The Board noted that the total expenses of each of Class A, Class B, Class C, Institutional Class, the retail class, and Class K ranked below its competitive median for 2009 and the total expenses of Class T ranked above its competitive median for 2009. The Board considered that the total expenses for Class T were above the median primarily because its 12b-1 fee is higher than the typical front-end load class. The Board noted that the fund offers multiple classes, each of which has a different sales load and 12b-1 fee structure, and that the multiple structures are intended to offer a range of pricing options for the intermediary market. The Board also noted that the total expenses of the classes vary primarily by the level of their 12b-1 fees, although differences in transfer agent fees may also cause expenses to vary from class to class.
Annual Report
Fees Charged to Other Fidelity Clients. The Board also considered Fidelity fee structures and other information with respect to clients of FMR and its affiliates, such as other mutual funds advised or subadvised by FMR or its affiliates, pension plan clients, and other institutional clients. In March 2010, the Board created an ad hoc joint committee with the board of other Fidelity funds (the Committee) to review and compare Fidelity's institutional investment advisory business with its business of providing services to the Fidelity funds, including the differences in services provided, fees charged, and costs incurred, as well as competition in their respective marketplaces.
Based on its review of total expenses and fees charged to other Fidelity clients, the Board concluded that the total expenses of each class of the fund were reasonable, although in one case above the median of the universe presented for comparison, in light of the services that the fund and its shareholders receive and the other factors considered, including the findings of the Committee.
Costs of the Services and Profitability. The Board considered the revenues earned and the expenses incurred by Fidelity in conducting the business of developing, marketing, distributing, managing, administering and servicing the fund and its shareholders. The Board also considered the level of Fidelity's profits in respect of all the Fidelity funds.
On an annual basis, FMR presents to the Board Fidelity's profitability for the fund. Fidelity calculates the profitability for each fund, as well as aggregate profitability for groups of Fidelity funds and all Fidelity funds, using a series of detailed revenue and cost allocation methodologies which originate with the audited books and records of Fidelity. The Audit Committee of the Board reviews any significant changes from the prior year's methodologies.
PricewaterhouseCoopers LLP (PwC), independent registered public accounting firm and auditor to Fidelity and certain Fidelity funds, has been engaged annually by the Board as part of the Board's assessment of Fidelity's profitability analysis. PwC's engagement includes the review and assessment of Fidelity's methodologies used in determining the revenues and expenses attributable to Fidelity's mutual fund business, and completion of agreed-upon procedures surrounding the mathematical accuracy of fund profitability and its conformity to allocation methodologies. After considering PwC's reports issued under the engagement and information provided by Fidelity, the Board believes that while other allocation methods may also be reasonable, Fidelity's profitability methodologies are reasonable in all material respects.
Annual Report
Board Approval of Investment Advisory Contracts and
Management Fees - continued
The Board has also reviewed Fidelity's non-fund businesses and fall-out benefits related to the mutual fund business as well as cases where Fidelity's affiliates may benefit from or be related to the fund's business.
The Board considered the costs of the services provided by and the profits realized by Fidelity in connection with the operation of the fund and were satisfied that the profitability was not excessive in the circumstances.
Economies of Scale. The Board considered whether there have been economies of scale in respect of the management of the Fidelity funds, whether the Fidelity funds (including the fund) have appropriately benefited from any such economies of scale, and whether there is potential for realization of any further economies of scale. The Board considered the extent to which the fund will benefit from economies of scale through increased services to the fund, through waivers or reimbursements, or through fee or expense reductions.
In February 2009, the Board and the board of other Fidelity funds created an ad hoc committee (the Economies of Scale Committee) to analyze whether FMR attains economies of scale in respect of the management and servicing of the Fidelity funds, whether the Fidelity funds have appropriately benefited from such economies of scale, and whether there is potential for realization of any further economies of scale.
The Board recognized that the fund's management contract incorporates a "group fee" structure, which provides for lower group fee rates as total fund assets under FMR's management increase, and for higher group fee rates as total fund assets under FMR's management decrease. FMR calculates the group fee rates based on a tiered asset "breakpoint" schedule that varies based on asset class. The Board considered that the group fee is designed to deliver the benefits of economies of scale to fund shareholders when total Fidelity fund assets increase, even if assets of any particular fund are unchanged or have declined, because some portion of Fidelity's costs are attributable to services provided to all Fidelity funds, and all funds benefit if those costs can be allocated among more assets. The Board concluded that, given the group fee structure, fund shareholders will benefit from lower management fees as assets under FMR's management increase at the fund complex level, regardless of whether Fidelity achieves any such economies of scale.
The Board concluded, considering the findings of the Economies of Scale Committee, that any potential economies of scale are being appropriately shared between fund shareholders and Fidelity.
Additional Information Requested by the Board. In order to develop fully the factual basis for consideration of the Fidelity funds' Advisory Contracts, the Board requested and received additional information on certain topics, including (i) fund performance trends, actions to be taken by FMR to improve certain funds' overall performance, and Fidelity's long-term strategies for certain funds; (ii) portfolio manager changes that have occurred during the past year and length of portfolio manager tenure for different categories of funds over time; (iii) Fidelity's compensation structure for portfolio managers, research analysts, and other key personnel, the rationale for the compensation structure, and how the compensation structure provides appropriate performance incentives; (iv) the amount of the investment that each portfolio manager has made in the Fidelity fund(s) that he or she manages; (v) management and other fees paid by FMR to affiliated sub-advisers on behalf of the Fidelity funds; (vi) Fidelity's fee structures and rationale for recommending different fees among different categories of funds; (vii) Fidelity's rationale for recommending which funds should have a performance adjustment component as part of their management fees; (viii) the rationale for any differences between fund fee structures and fee structures in place for other Fidelity clients; and (ix) explanations regarding the relative total expenses borne by certain funds and classes, total expense competitive trends, and actions that might be taken by FMR to reduce total expenses for certain funds and classes.
Annual Report
Based on its evaluation of all of the conclusions noted above, and after considering all factors it believed relevant, the Board ultimately concluded that the advisory fee structures are fair and reasonable, and that the fund's Advisory Contracts should be renewed.
Annual Report
Managing Your Investments
Fidelity offers several ways to conveniently manage your workplace benefits (including your workplace savings plan, investments, and additional services) via your telephone or PC. You can access your plan and account information and research your investments 24 hours a day.
By Phone
Fidelity provides a single toll-free number to access plan information, account balances, positions, and quotes*. It's easy to navigate the service, and on your first call, the system will help you create a personal identification number (PIN) for security.
(phone_graphic)
Fidelity Workplace
Investing
1-800-835-5092
By PC
Fidelity's web site on the Internet provides a wide range of information, including plan information, daily financial news, fund performance, interactive planning tools, and news about Fidelity products and services.
(computer_graphic)
Fidelity's Web Site
www.401k.com
* When you call the quotes line, please remember that a fund's yield and return will vary and, except for money market funds, share price will also vary. This means that you may have a gain or loss when you sell your shares. There is no assurance that money market funds will be able to maintain a stable $1 share price; an investment in a money market fund is not insured or guaranteed by the U.S. government. Total returns are historical and include changes in share price, reinvestment of dividends and capital gains, and the effects of any sales charges.
Annual Report
To Write Fidelity
We'll give your correspondence immediate attention and send you written confirmation upon completion of your request.
(letter_graphic)
For Non-Retirement
Accounts
Buying shares
Fidelity Investments
P.O. Box 770001
Cincinnati, OH 45277-0003
Overnight Express
Fidelity Investments
Attn: Distribution Services
100 Crosby Parkway - KC1H
Covington, KY 41015
Selling shares
Fidelity Investments
P.O. Box 770001
Cincinnati, OH 45277-0035
Overnight Express
Fidelity Investments
Attn: Distribution Services
100 Crosby Parkway - KC1H
Covington, KY 41015
General Correspondence
Fidelity Investments
P.O. Box 500
Merrimack, NH 03054-0500
(letter_graphic)
For Retirement
Accounts
Buying shares
Fidelity Investments
P.O. Box 770001
Cincinnati, OH 45277-0003
Selling shares
Fidelity Investments
P.O. Box 770001
Cincinnati, OH 45277-0035
Overnight Express
Fidelity Investments
Attn: Distribution Services
100 Crosby Parkway - KC1H
Covington, KY 41015
General Correspondence
Fidelity Investments
P.O. Box 500
Merrimack, NH 03054-0500
Annual Report
Investment Adviser
Fidelity Management & Research Company
Boston, MA
Investment Sub-Advisers
FMR Co., Inc.
Fidelity Management & Research
(U.K.) Inc.
Fidelity Research & Analysis Company
FIL Investments (Japan) Limited
FIL Investment Advisors
FIL Investment Advisors
(U.K.) Limited
Fidelity Management & Research
(Hong Kong) Limited
Fidelity Management & Research
(Japan) Inc.
General Distributor
Fidelity Distributors Corporation
Boston, MA
Transfer and Service Agents
Fidelity Investments Institutional
Operations Company, Inc.
Boston, MA
Fidelity Service Company, Inc.
Boston, MA
Custodian
The Northern Trust Company
Chicago, IL
IGI-K-UANN-1210
1.863305.102
(Fidelity Investment logo)(registered trademark)
Fidelity AdvisorSM
International Discovery
Fund - Class A, Class T, Class B
and Class C
Annual Report
October 31, 2010
Class A, Class T, Class B, and Class C are classes of Fidelity® International Discovery Fund
(2_fidelity_logos) (Registered_Trademark)
Contents
Chairman's Message | <Click Here> | The Chairman's message to shareholders. |
Performance | <Click Here> | How the fund has done over time. |
Management's Discussion of Fund Performance | <Click Here> | The Portfolio Manager's review of fund performance and strategy. |
Shareholder Expense Example | <Click Here> | An example of shareholder expenses. |
Investment Changes | <Click Here> | A summary of major shifts in the fund's investments over the past six months. |
Investments | <Click Here> | A complete list of the fund's investments with their market values. |
Financial Statements | <Click Here> | Statements of assets and liabilities, operations, and changes in net assets, as well as financial highlights. |
Notes | <Click Here> | Notes to financial statements. |
Report of Independent Registered Public Accounting Firm | <Click Here> | |
Trustees and Officers | <Click Here> | |
Distributions | <Click Here> | |
Board Approval of Investment Advisory Contracts and Management Fees | <Click Here> | |
To view a fund's proxy voting guidelines and proxy voting record for the 12-month period ended June 30, visit http://www.fidelity.com/proxyvotingresults or visit the Securities and Exchange Commission's (SEC) web site at http://www.sec.gov. You may also call 1-877-208-0098 to request a free copy of the proxy voting guidelines.
Standard & Poor's, S&P and S&P 500 are registered service marks of The McGraw-Hill Companies, Inc. and have been licensed for use by Fidelity Distributors Corporation.
Other third party marks appearing herein are the property of their respective owners.
All other marks appearing herein are registered or unregistered trademarks or service marks of FMR LLC or an affiliated company.
Annual Report
This report and the financial statements contained herein are submitted for the general information of the shareholders of the fund. This report is not authorized for distribution to prospective investors in the fund unless preceded or accompanied by an effective prospectus.
A fund files its complete schedule of portfolio holdings with the SEC for the first and third quarters of each fiscal year on Form N-Q. Forms N-Q are available on the SEC's web site at http://www.sec.gov. A fund's Forms N-Q may be reviewed and copied at the SEC's Public Reference Room in Washington, DC. Information regarding the operation of the SEC's Public Reference Room may be obtained by calling 1-800-SEC-0330. For a complete list of a fund's portfolio holdings, view the most recent holdings listing, semiannual report, or annual report on Fidelity's web site at http://www.fidelity.com or http://www.advisor.fidelity.com, as applicable.
NOT FDIC INSURED • MAY LOSE VALUE • NO BANK GUARANTEE
Neither the fund nor Fidelity Distributors Corporation is a bank.
Annual Report
(photo_of_Edward_C_Johnson_3d)
Dear Shareholder:
Equities have staged a rally in the second half of 2010, shaking off concerns about the European debt crisis and the possibility of a double-dip recession in the U.S. Although the short-term surge pushed major equity indexes back into positive territory for the year, several questions remain about the longer-term outlook, including lackluster economic growth and persistently high unemployment. Financial markets are always unpredictable, of course, but there also are several time-tested investment principles that can help put the odds in your favor.
One of the basic tenets is to invest for the long term. Over time, riding out the markets' inevitable ups and downs has proven much more effective than selling into panic or chasing the hottest trend. Even missing only a few of the markets' best days can significantly diminish investor returns. Patience also affords the benefits of compounding - of earning interest on additional income or reinvested dividends and capital gains. There can be tax advantages and cost benefits to consider as well. While staying the course doesn't eliminate risk, it can considerably lessen the effect of short-term declines.
You can further manage your investing risk through diversification. And today, more than ever, geographic diversification should be taken into account. Studies indicate that asset allocation is the single most important determinant of a portfolio's long-term success. The right mix of stocks, bonds and cash - aligned to your particular risk tolerance and investment objective - is very important. Age-appropriate rebalancing is also an essential aspect of asset allocation. For younger investors, an emphasis on equities - which historically have been the best-performing asset class over time - is encouraged. As investors near their specific goal, such as retirement or sending a child to college, consideration may be given to replacing volatile assets (e.g. common stocks) with more-stable fixed investments (bonds or savings plans).
A third principle - investing regularly - can help lower the average cost of your purchases. Investing a certain amount of money each month or quarter helps ensure you won't pay for all your shares at market highs. This strategy - known as dollar cost averaging - also reduces "emotion" from investing, helping shareholders avoid selling weak performers just prior to an upswing, or chasing a hot performer just before a correction.
We invite you to contact us via the Internet, through our Investor Centers or by phone. It is our privilege to provide you the information you need to make the investments that are right for you.
Sincerely,
(The chairman's signature appears here.)
Edward C. Johnson 3d
Annual Report
Average annual total return reflects the change in the value of an investment, assuming reinvestment of the class' distributions from dividend income and capital gains (the profits earned upon the sale of securities that have grown in value, if any) and assuming a constant rate of performance each year. The $10,000 table and the fund's returns do not reflect the deduction of taxes that a shareholder would pay on fund distributions or the redemption of fund shares. During periods of reimbursement by Fidelity, a fund's total return will be greater than it would be had the reimbursement not occurred. How a fund did yesterday is no guarantee of how it will do tomorrow.
Average Annual Total Returns
Periods ended October 31, 2010 | Past 1
year | Past 5
years | Past 10
years |
Class A (incl. 5.75% sales charge) A, E | 6.91% | 2.99% | 4.45% |
Class T (incl. 3.50% sales charge) B, E | 9.18% | 3.14% | 4.50% |
Class B (incl. contingent deferred sales charge) C, E | 7.52% | 2.99% | 4.56% |
Class C (incl. contingent deferred sales charge) D , E | 11.54% | 3.37% | 4.59% |
A Class A shares bear a 0.25% 12b-1 fee. The initial offering of Class A shares took place on Janu-ary 6, 2005. Returns prior to January 6, 2005 are those of Fidelity® International Discovery Fund, the original class of the fund, which has no 12b-1 fee. Had Class A shares' 12b-1 fee been reflected, returns prior to January 6, 2005 would have been lower.
B Class T shares bear a 0.50% 12b-1 fee. The initial offering of Class T shares took place on Janu-ary 6, 2005. Returns prior to January 6, 2005 are those of Fidelity International Discovery Fund, the original class of the fund, which has no 12b-1 fee. Had Class T shares' 12b-1 fee been reflected, returns prior to January 6, 2005 would have been lower.
C Class B shares bear a 1.00% 12b-1 fee. The initial offering of Class B shares took place on Janu-ary 6, 2005. Returns prior to January 6, 2005 are those of Fidelity International Discovery Fund, the original class of the fund, which has no 12b-1 fee. Had Class B shares' 12b-1 fee been reflected, returns prior to January 6, 2005 would have been lower. Class B shares' contingent deferred sales charges included in the past one year, past five year, and past 10 year total return figures are 5%, 2%, and 0% respectively.
D Class C shares bear a 1.00% 12b-1 fee. The initial offering of Class C shares took place on Janu-ary 6, 2005. Returns prior to January 6, 2005 are those of Fidelity International Discovery Fund, the original class of the fund, which has no 12b-1 fee. Had Class C shares' 12b-1 fee been reflected, returns prior to January 6, 2005 would have been lower. Class C shares' contingent deferred sales charges included in the past one year, past five year, and past 10 year total return figures are 1%, 0%, and 0% respectively.
E Prior to October 1, 2004, the fund operated under certain different investment policies. The fund's historical performance may not represent its current investment policies.
Annual Report
$10,000 Over 10 Years
Let's say hypothetically that $10,000 was invested in Fidelity AdvisorSM International Discovery Fund - Class A on October 31, 2000 and the current 5.75% sales charge was paid. The chart shows how the value of your investment would have changed, and also shows how the MSCI® EAFE® (Europe, Australasia, Far East) Index performed over the same period. The initial offering of Class A took place on January 6, 2005. See the previous page for additional information regarding the performance of Class A.
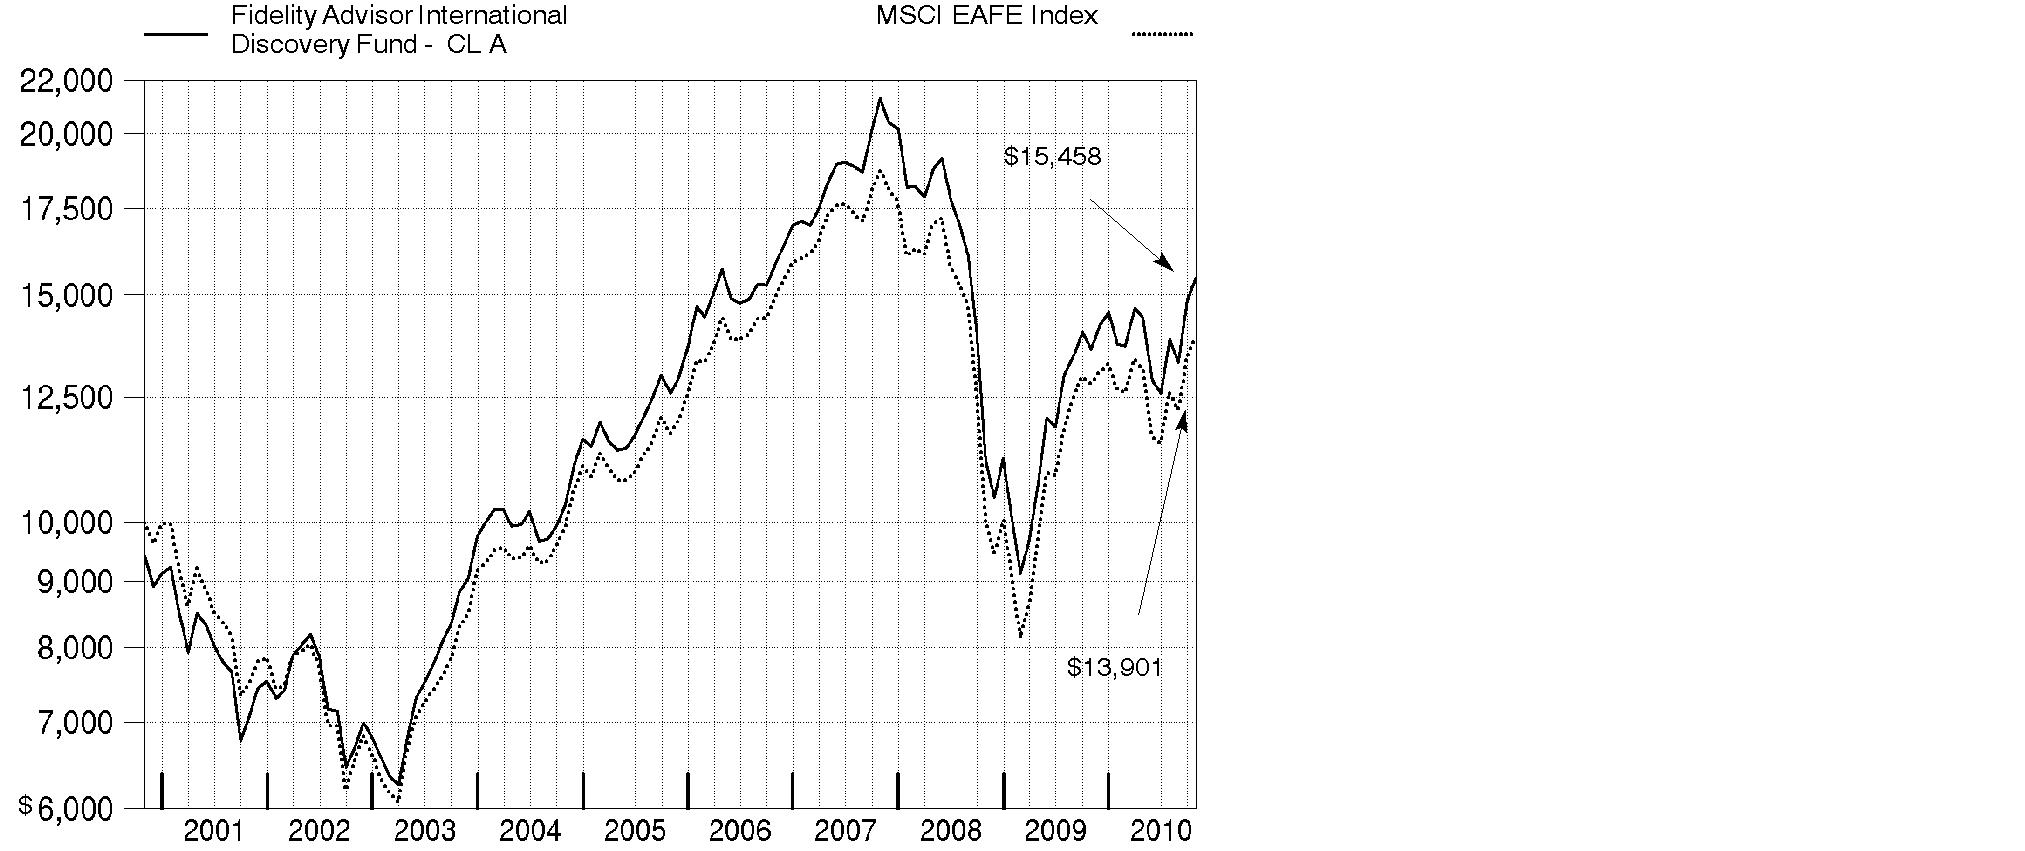
Annual Report
Market Recap: International stocks rode a wave of volatility similar to that of their U.S. counterparts during the 12 months ending October 31, 2010. Stocks gained modestly in the first half of the period, despite growing concerns about the European debt crisis. Sentiment turned decidedly negative in May and June, however, and the market suffered a precipitous decline. These losses were more than offset during the last four months of the period, when signs of economic growth and subsiding debt fears helped propel international stocks about 21%. For the full year, the MSCI® ACWI® (All Country World Index) ex USA Index gained 12.76%, boosted in part by a generally depreciating U.S. dollar. Within the index, Canada and emerging markets were standouts, returning 23% and 24%, respectively. Results in the latter group were led by strong-performing India, Mexico and South Africa, while China fell short of the MSCI benchmark due to cooling economic growth. The developed Asia ex Japan segment rose 16% for the period, lifted by solid results from Singapore and Hong Kong. Meanwhile, Europe rose just 9%, held back mainly by debt-riddled Spain and Italy, as well as lagging major constituent France. Japan returned only 5%, a result of that nation's continued weak economy.
Comments from William Kennedy, Portfolio Manager of Fidelity AdvisorSM International Discovery Fund: For the 12 months ending October 31, 2010, the fund's Class A, Class T, Class B and Class C shares returned 13.43%, 13.14%, 12.52%, and 12.54%, respectively (excluding sales charges), beating the 8.49% return of the MSCI EAFE® (Europe, Australasia, Far East) Index. Stock selection drove relative performance, with particularly strong gains coming from investments in emerging markets, as well as the consumer discretionary, information technology, health care and industrials sectors. Top contributors included Elekta, a Swedish manufacturer of radiation-therapy equipment that benefited from successful product launches and an increase in capital spending by hospitals, and SSL International, a U.K. health care company that received a handsome buyout offer. I sold SSL. In consumer discretionary - which increased as a percentage of fund assets - strong gains at Carphone Warehouse Group, a U.K. cell phone retailer, were fueled in part by an expanding partnership with big-box electronics retailer Best Buy. All three holdings were out-of-index positions. Detractors were minimal, with underweightings in consumer staples and materials just nicking results. Stock disappointments included HeidelbergCement, a German cement company whose U.S. business was hurt by the weak housing market, and Swiss investment bank UBS, whose revenue slowed more than expected.
The views expressed above reflect those of the portfolio manager(s) only through the end of the period as stated on the cover of this report and do not necessarily represent the views of Fidelity or any other person in the Fidelity organization. Any such views are subject to change at any time based upon market or other conditions and Fidelity disclaims any responsibility to update such views. These views may not be relied on as investment advice and, because investment decisions for a Fidelity fund are based on numerous factors, may not be relied on as an indication of trading intent on behalf of any Fidelity fund.
Annual Report
Shareholder Expense Example
As a shareholder of the Fund, you incur two types of costs: (1) transaction costs, including sales charges (loads) on purchase payments or redemption proceeds, redemption fees, and (2) ongoing costs, including management fees, distribution and/or service (12b-1) fees and other Fund expenses. This Example is intended to help you understand your ongoing costs (in dollars) of investing in the Fund and to compare these costs with the ongoing costs of investing in other mutual funds.
The Example is based on an investment of $1,000 invested at the beginning of the period and held for the entire period (May 1, 2010 to October 31, 2010).
Actual Expenses
The first line of the accompanying table for each class of the Fund provides information about actual account values and actual expenses. You may use the information in this line, together with the amount you invested, to estimate the expenses that you paid over the period. Simply divide your account value by $1,000.00 (for example, an $8,600 account value divided by $1,000.00 = 8.6), then multiply the result by the number in the first line for a class of the Fund under the heading entitled "Expenses Paid During Period" to estimate the expenses you paid on your account during this period. A small balance maintenance fee of $12.00 that is charged once a year may apply for certain accounts with a value of less than $2,000. This fee is not included in the table below. If it was, the estimate of expenses you paid during the period would be higher, and your ending account value lower, by this amount. In addition, the Fund, as a shareholder in the underlying Fidelity Central Funds, will indirectly bear its pro-rata share of the fees and expenses incurred by the underlying Fidelity Central Funds. These fees and expenses are not included in the Fund's annualized expense ratio used to calculate the expense estimate in the table below.
Hypothetical Example for Comparison Purposes
The second line of the accompanying table for each class of the Fund provides information about hypothetical account values and hypothetical expenses based on a Class' actual expense ratio and an assumed rate of return of 5% per year before expenses, which is not the Class' actual return. The hypothetical account values and expenses may not be used to estimate the actual ending account balance or expenses you paid for the period. You may use this information to compare the ongoing costs of investing in the Fund and other funds. To do so, compare this 5% hypothetical example with the 5% hypothetical examples that appear in the shareholder reports of the other funds. A small balance maintenance fee of $12.00 that is charged once a year may apply for certain accounts with a value of less than $2,000. This fee is not included in the table below. If it was, the estimate of expenses you paid during the period would be higher, and your ending account value lower, by this amount. In addition, the Fund, as a shareholder in the underlying Fidelity Central Funds, will indirectly bear its pro-rata share of the fees and expenses incurred by the underlying Fidelity Central Funds. These fees and expenses are not included in the Fund's annualized expense ratio used to calculate the expense estimate in the table below.
Annual Report
Please note that the expenses shown in the table are meant to highlight your ongoing costs only and do not reflect any transaction costs. Therefore, the second line of the table is useful in comparing ongoing costs only, and will not help you determine the relative total costs of owning different funds. In addition, if these transactional costs were included, your costs would have been higher.
| Annualized
Expense Ratio | Beginning
Account Value
May 1, 2010 | Ending
Account Value
October 31, 2010 | Expenses Paid
During Period*
May 1, 2009 to October 31, 2010 |
Class A | 1.32% | | | |
Actual | | $ 1,000.00 | $ 1,071.90 | $ 6.89 |
Hypothetical A | | $ 1,000.00 | $ 1,018.55 | $ 6.72 |
Class T | 1.57% | | | |
Actual | | $ 1,000.00 | $ 1,070.70 | $ 8.19 |
Hypothetical A | | $ 1,000.00 | $ 1,017.29 | $ 7.98 |
Class B | 2.08% | | | |
Actual | | $ 1,000.00 | $ 1,067.90 | $ 10.84 |
Hypothetical A | | $ 1,000.00 | $ 1,014.72 | $ 10.56 |
Class C | 2.07% | | | |
Actual | | $ 1,000.00 | $ 1,067.70 | $ 10.79 |
Hypothetical A | | $ 1,000.00 | $ 1,014.77 | $ 10.51 |
International Discovery | 1.02% | | | |
Actual | | $ 1,000.00 | $ 1,073.70 | $ 5.33 |
Hypothetical A | | $ 1,000.00 | $ 1,020.06 | $ 5.19 |
Class K | .82% | | | |
Actual | | $ 1,000.00 | $ 1,074.80 | $ 4.29 |
Hypothetical A | | $ 1,000.00 | $ 1,021.07 | $ 4.18 |
Institutional Class | .97% | | | |
Actual | | $ 1,000.00 | $ 1,074.10 | $ 5.07 |
Hypothetical A | | $ 1,000.00 | $ 1,020.32 | $ 4.94 |
A 5% return per year before expenses
*Expenses are equal to each Class' annualized expense ratio, multiplied by the average account value over the period, multiplied by 184/365 (to reflect the one-half year period).
Annual Report
Investment Changes (Unaudited)
Geographic Diversification (% of fund's net assets) |
As of October 31, 2010 |
| United Kingdom 20.9% | |
| Japan 12.1% | |
| France 8.8% | |
| Switzerland 7.0% | |
| Germany 6.6% | |
| United States of America 4.3% | |
| Spain 3.8% | |
| Denmark 3.3% | |
| Australia 3.0% | |
| Other 30.2% | |

Percentages are adjusted for the effect of futures contracts, if applicable. |
As of April 30, 2010 |
| United Kingdom 20.0% | |
| Japan 18.7% | |
| France 9.6% | |
| Switzerland 7.2% | |
| Germany 6.7% | |
| Netherlands 3.8% | |
| Australia 3.0% | |
| Spain 3.0% | |
| United States of America 2.3% | |
| Other 25.7% | |

Percentages are adjusted for the effect of futures contracts, if applicable. |
Asset Allocation (% of fund's net assets) |
| As of
October 31, 2010 | As of
April 30, 2010 |
Stocks | 98.6 | 99.3 |
Short-Term Investments and Net Other Assets | 1.4 | 0.7 |
Top Ten Stocks as of October 31, 2010 |
| % of fund's
net assets | % of fund's net assets
6 months ago |
BHP Billiton PLC (United Kingdom, Metals & Mining) | 1.9 | 1.3 |
Royal Dutch Shell PLC Class B (United Kingdom, Oil, Gas & Consumable Fuels) | 1.9 | 2.0 |
BP PLC (United Kingdom, Oil, Gas & Consumable Fuels) | 1.6 | 1.2 |
Nestle SA (Switzerland, Food Products) | 1.6 | 1.4 |
Novartis AG (Switzerland, Pharmaceuticals) | 1.5 | 1.2 |
Novo Nordisk AS Series B (Denmark, Pharmaceuticals) | 1.4 | 0.9 |
HSBC Holdings PLC (United Kingdom) (United Kingdom, Commercial Banks) | 1.3 | 1.9 |
Bayerische Motoren Werke AG (BMW) (Germany, Automobiles) | 1.3 | 0.9 |
SOFTBANK CORP. (Japan, Wireless Telecommunication Services) | 1.3 | 0.8 |
LVMH Moet Hennessy - Louis Vuitton (France, Textiles, Apparel & Luxury Goods) | 1.2 | 0.6 |
| 15.0 | |
Market Sectors as of October 31, 2010 |
| % of fund's
net assets | % of fund's net assets
6 months ago |
Financials | 22.0 | 21.6 |
Consumer Discretionary | 20.8 | 15.7 |
Industrials | 9.5 | 11.0 |
Materials | 9.3 | 9.6 |
Health Care | 9.1 | 9.1 |
Consumer Staples | 8.6 | 7.8 |
Energy | 6.4 | 7.8 |
Information Technology | 6.1 | 11.1 |
Telecommunication Services | 6.2 | 4.0 |
Utilities | 0.6 | 1.6 |
Annual Report
Investments October 31, 2010
Showing Percentage of Net Assets
Common Stocks - 97.2% |
| Shares | | Value (000s) |
Australia - 3.0% |
Australia & New Zealand Banking Group Ltd. | 4,456,031 | | $ 108,304 |
JB Hi-Fi Ltd. (d) | 1,401,880 | | 27,302 |
Macquarie Group Ltd. | 1,446,043 | | 51,282 |
Newcrest Mining Ltd. | 1,300,681 | | 50,918 |
Wesfarmers Ltd. | 1,097,894 | | 35,644 |
Westfield Group unit | 2,381,694 | | 28,885 |
TOTAL AUSTRALIA | | 302,335 |
Bailiwick of Jersey - 0.6% |
Experian PLC | 3,677,200 | | 42,742 |
Informa PLC | 2,335,767 | | 16,316 |
TOTAL BAILIWICK OF JERSEY | | 59,058 |
Belgium - 1.2% |
Anheuser-Busch InBev SA NV | 1,791,980 | | 112,293 |
EVS Broadcast Equipment SA | 89,263 | | 5,602 |
TOTAL BELGIUM | | 117,895 |
Bermuda - 1.1% |
Huabao International Holdings Ltd. | 27,748,000 | | 41,812 |
Li & Fung Ltd. | 4,808,000 | | 25,401 |
Noble Group Ltd. | 26,477,364 | | 38,050 |
Sihuan Pharmaceutical Holdings Group Ltd. | 496,000 | | 360 |
TOTAL BERMUDA | | 105,623 |
Brazil - 1.7% |
Banco ABC Brasil SA | 572,000 | | 5,635 |
Banco Santander (Brasil) SA ADR | 1,896,000 | | 27,302 |
Diagnosticos da America SA | 2,508,000 | | 30,959 |
Drogasil SA | 1,040,700 | | 26,323 |
Souza Cruz Industria Comerico | 1,579,500 | | 81,157 |
TOTAL BRAZIL | | 171,376 |
British Virgin Islands - 0.3% |
HLS Systems International Ltd. (a)(d) | 610,767 | | 7,720 |
Playtech Ltd. (d) | 3,758,978 | | 26,966 |
TOTAL BRITISH VIRGIN ISLANDS | | 34,686 |
Canada - 1.8% |
First Quantum Minerals Ltd. | 249,300 | | 21,831 |
InterOil Corp. (a)(d) | 247,600 | | 17,624 |
Niko Resources Ltd. | 483,100 | | 46,088 |
Open Text Corp. (a) | 769,600 | | 34,047 |
Common Stocks - continued |
| Shares | | Value (000s) |
Canada - continued |
Pan American Silver Corp. | 843,000 | | $ 26,909 |
Petrobank Energy & Resources Ltd. (a) | 813,500 | | 32,376 |
TOTAL CANADA | | 178,875 |
Cayman Islands - 2.4% |
Belle International Holdings Ltd. | 9,430,000 | | 17,032 |
Bosideng International Holdings Ltd. | 81,544,000 | | 41,239 |
China Lodging Group Ltd. ADR (d) | 344,759 | | 8,381 |
Ctrip.com International Ltd. sponsored ADR (a) | 505,000 | | 26,295 |
Eurasia Drilling Co. Ltd. GDR (f) | 257,900 | | 6,576 |
Hengdeli Holdings Ltd. | 75,304,000 | | 41,775 |
Mongolian Mining Corp. | 15,168,000 | | 16,418 |
Perfect World Co. Ltd. sponsored ADR Class B (a) | 771,187 | | 24,986 |
Shenguan Holdings Group Ltd. | 21,268,000 | | 27,713 |
TPK Holdings Co. | 25,000 | | 413 |
Want Want China Holdings Ltd. | 36,693,000 | | 33,847 |
TOTAL CAYMAN ISLANDS | | 244,675 |
China - 1.2% |
Baidu.com, Inc. sponsored ADR (a) | 348,900 | | 38,382 |
China Merchants Bank Co. Ltd. (H Shares) | 18,516,200 | | 52,554 |
Comba Telecom Systems Holdings Ltd. (d) | 7,504,420 | | 8,520 |
Minth Group Ltd. | 2,146,000 | | 4,014 |
Zhaojin Mining Industry Co. Ltd. (H Shares) | 2,492,000 | | 7,748 |
ZTE Corp. (H Shares) (d) | 2,362,096 | | 8,776 |
TOTAL CHINA | | 119,994 |
Cyprus - 0.0% |
Aisi Realty Public Ltd. (a)(e) | 21,633,000 | | 607 |
Denmark - 3.3% |
Carlsberg AS Series B | 673,200 | | 73,612 |
Novo Nordisk AS Series B | 1,311,389 | | 137,673 |
Pandora A/S | 758,300 | | 36,789 |
William Demant Holding AS (a) | 1,094,900 | | 82,070 |
TOTAL DENMARK | | 330,144 |
Egypt - 0.2% |
Orascom Construction Industries SAE GDR | 443,300 | | 20,525 |
France - 8.8% |
Accor SA | 732,241 | | 30,021 |
Atos Origin SA (a) | 1,202,978 | | 55,615 |
AXA SA | 2,162,866 | | 39,365 |
Common Stocks - continued |
| Shares | | Value (000s) |
France - continued |
BNP Paribas SA | 983,966 | | $ 71,948 |
Carrefour SA | 973,625 | | 52,537 |
Compagnie Generale de Geophysique SA (a) | 1,085,600 | | 25,352 |
Edenred (a) | 552,100 | | 11,562 |
Essilor International SA | 566,366 | | 37,812 |
GDF Suez | 760,000 | | 30,329 |
Iliad Group SA (d) | 509,521 | | 57,356 |
LVMH Moet Hennessy - Louis Vuitton | 797,092 | | 124,886 |
Pernod-Ricard SA | 388,925 | | 34,478 |
PPR SA | 664,000 | | 108,838 |
Sanofi-Aventis | 317,944 | | 22,270 |
Schneider Electric SA | 588,962 | | 83,590 |
Societe Generale Series A | 1,175,263 | | 70,360 |
Unibail-Rodamco | 118,400 | | 24,663 |
TOTAL FRANCE | | 880,982 |
Germany - 5.2% |
Bayerische Motoren Werke AG (BMW) | 1,818,327 | | 130,326 |
Fresenius Medical Care AG & Co. KGaA | 964,000 | | 61,394 |
GEA Group AG | 2,030,727 | | 53,094 |
HeidelbergCement AG | 245,167 | | 12,822 |
Kabel Deutschland Holding AG | 1,258,000 | | 56,636 |
MAN SE | 529,280 | | 58,181 |
Metro AG | 439,200 | | 30,776 |
Siemens AG | 1,089,506 | | 124,433 |
TOTAL GERMANY | | 527,662 |
Greece - 0.2% |
Coca-Cola Hellenic Bottling Co. SA | 692,200 | | 17,915 |
Hong Kong - 1.6% |
AIA Group Ltd. | 5,311,400 | | 15,795 |
Henderson Land Development Co. Ltd. | 3,760,700 | | 26,709 |
I.T Ltd. | 21,016,000 | | 17,732 |
Techtronic Industries Co. Ltd. | 65,201,500 | | 66,032 |
Wharf Holdings Ltd. | 4,890,000 | | 32,111 |
TOTAL HONG KONG | | 158,379 |
India - 2.8% |
Adani Enterprises Ltd. | 1,982,014 | | 31,500 |
Gitanjali Gems Ltd. | 2,506,415 | | 16,763 |
Housing Development Finance Corp. Ltd. | 1,506,925 | | 23,380 |
IndusInd Bank Ltd. | 2,074,982 | | 12,340 |
Common Stocks - continued |
| Shares | | Value (000s) |
India - continued |
INFO Edge India Ltd. | 679,326 | | $ 10,427 |
Infrastructure Development Finance Co. Ltd. | 3,122,908 | | 14,094 |
Larsen & Toubro Ltd. | 783,228 | | 35,831 |
LIC Housing Finance Ltd. | 1,481,322 | | 44,801 |
Reliance Industries Ltd. | 903,416 | | 22,343 |
Rural Electrification Corp. Ltd. | 2,750,582 | | 23,001 |
Shriram Transport Finance Co. Ltd. | 621,359 | | 12,356 |
State Bank of India | 217,944 | | 15,491 |
The Jammu & Kashmir Bank Ltd. | 545,569 | | 11,206 |
Titan Industries Ltd. | 160,588 | | 12,869 |
TOTAL INDIA | | 286,402 |
Indonesia - 0.7% |
PT Bank Rakyat Indonesia Tbk | 19,678,500 | | 25,100 |
PT Tower Bersama Infrastructure Tbk | 4,813,500 | | 1,373 |
PT XL Axiata Tbk (a) | 67,983,500 | | 43,738 |
TOTAL INDONESIA | | 70,211 |
Ireland - 0.5% |
Ingersoll-Rand Co. Ltd. | 731,600 | | 28,759 |
James Hardie Industries NV unit (a) | 3,882,491 | | 20,501 |
TOTAL IRELAND | | 49,260 |
Israel - 0.2% |
Israel Chemicals Ltd. | 1,513,500 | | 23,150 |
Italy - 1.4% |
Intesa Sanpaolo SpA | 5,602,109 | | 19,702 |
Intesa Sanpaolo SpA (Risparmio Shares) | 6,681,302 | | 18,305 |
Prysmian SpA | 964,200 | | 18,689 |
Saipem SpA | 1,876,915 | | 83,389 |
TOTAL ITALY | | 140,085 |
Japan - 12.1% |
ABC-Mart, Inc. | 1,529,000 | | 52,005 |
Asics Corp. | 2,858,000 | | 30,864 |
Canon, Inc. | 1,331,350 | | 61,286 |
Cosmos Pharmaceutical Corp. | 543,200 | | 17,099 |
Denso Corp. | 1,577,500 | | 49,057 |
Don Quijote Co. Ltd. | 808,400 | | 22,091 |
eAccess Ltd. | 24,546 | | 17,905 |
Fast Retailing Co. Ltd. | 89,100 | | 11,671 |
Goldcrest Co. Ltd. | 161,770 | | 3,492 |
Common Stocks - continued |
| Shares | | Value (000s) |
Japan - continued |
Honda Motor Co. Ltd. | 1,736,200 | | $ 62,588 |
JSR Corp. | 2,283,400 | | 39,527 |
Keyence Corp. | 192,600 | | 47,749 |
Komatsu Ltd. | 1,833,900 | | 44,823 |
Mazda Motor Corp. | 14,841,000 | | 37,718 |
Misumi Group, Inc. | 825,300 | | 17,692 |
Mitsubishi Corp. | 1,980,200 | | 47,564 |
Mitsubishi UFJ Financial Group, Inc. | 12,527,700 | | 58,141 |
Mitsui & Co. Ltd. | 2,230,900 | | 35,086 |
Mizuho Financial Group, Inc. | 17,803,700 | | 25,821 |
Nichi-iko Pharmaceutical Co. Ltd. | 932,200 | | 32,877 |
Nintendo Co. Ltd. | 88,400 | | 22,905 |
Omron Corp. | 1,439,900 | | 33,425 |
ORIX Corp. | 1,209,560 | | 110,329 |
Osaka Securities Exchange Co. Ltd. | 1,866 | | 9,391 |
Rakuten, Inc. | 80,045 | | 61,673 |
Ricoh Co. Ltd. | 3,021,000 | | 42,260 |
Sawai Pharmaceutical Co. Ltd. (d) | 160,300 | | 14,004 |
SOFTBANK CORP. | 4,003,100 | | 128,560 |
Sony Financial Holdings, Inc. | 7,099 | | 24,701 |
Start Today Co. Ltd. | 7,249 | | 22,548 |
Sumitomo Mitsui Financial Group, Inc. | 1,151,300 | | 34,364 |
TOTAL JAPAN | | 1,219,216 |
Korea (South) - 1.5% |
Hyundai Motor Co. | 192,345 | | 29,078 |
Kia Motors Corp. | 912,890 | | 36,451 |
NCsoft Corp. | 97,952 | | 21,559 |
NHN Corp. (a) | 123,150 | | 21,848 |
Samsung Electronics Co. Ltd. | 38,175 | | 25,292 |
Shinhan Financial Group Co. Ltd. | 421,030 | | 16,306 |
TOTAL KOREA (SOUTH) | | 150,534 |
Luxembourg - 0.3% |
Millicom International Cellular SA | 282,400 | | 26,715 |
Mauritius - 0.2% |
MakeMyTrip Ltd. | 456,425 | | 16,500 |
Mexico - 0.4% |
Wal-Mart de Mexico SA de CV Series V | 14,883,600 | | 40,708 |
Netherlands - 2.2% |
AEGON NV (a) | 3,601,200 | | 22,818 |
Gemalto NV (d) | 704,193 | | 32,061 |
Common Stocks - continued |
| Shares | | Value (000s) |
Netherlands - continued |
ING Groep NV (Certificaten Van Aandelen) unit (a) | 4,878,900 | | $ 52,185 |
Koninklijke Philips Electronics NV | 2,283,638 | | 69,639 |
LyondellBasell Industries NV Class A (a) | 1,230,700 | | 33,057 |
Randstad Holdings NV (a) | 229,781 | | 10,935 |
TOTAL NETHERLANDS | | 220,695 |
Norway - 1.6% |
Aker Solutions ASA | 1,903,800 | | 28,983 |
DnB NOR ASA | 5,226,955 | | 71,723 |
Telenor ASA | 1,549,800 | | 24,982 |
Yara International ASA | 620,300 | | 32,607 |
TOTAL NORWAY | | 158,295 |
Poland - 0.1% |
Eurocash SA | 980,199 | | 9,009 |
Qatar - 0.2% |
Commercial Bank of Qatar GDR (Reg. S) | 5,094,802 | | 23,345 |
Singapore - 0.3% |
Keppel Corp. Ltd. | 4,295,000 | | 33,118 |
South Africa - 2.2% |
African Rainbow Minerals Ltd. | 607,700 | | 15,503 |
AngloGold Ashanti Ltd. sponsored ADR | 816,100 | | 38,446 |
Clicks Group Ltd. | 7,968,139 | | 51,983 |
Mr Price Group Ltd. | 3,702,400 | | 33,646 |
Sanlam Ltd. | 7,188,000 | | 26,946 |
Standard Bank Group Ltd. | 1,349,000 | | 19,893 |
Woolworths Holdings Ltd. | 9,804,233 | | 38,419 |
TOTAL SOUTH AFRICA | | 224,836 |
Spain - 3.8% |
Antena 3 Television SA | 2,176,200 | | 22,226 |
Banco Bilbao Vizcaya Argentaria SA | 4,146,934 | | 54,620 |
Banco Santander SA | 8,695,646 | | 111,585 |
Gestevision Telecinco SA | 2,269,700 | | 28,948 |
Inditex SA (d) | 398,393 | | 33,266 |
Prosegur Compania de Seguridad SA (Reg.) | 479,200 | | 28,712 |
Telefonica SA | 3,645,705 | | 98,491 |
TOTAL SPAIN | | 377,848 |
Sweden - 1.7% |
Elekta AB (B Shares) | 2,194,000 | | 83,011 |
Common Stocks - continued |
| Shares | | Value (000s) |
Sweden - continued |
H&M Hennes & Mauritz AB (B Shares) | 1,301,280 | | $ 45,846 |
Modern Times Group MTG AB (B Shares) | 579,300 | | 41,538 |
TOTAL SWEDEN | | 170,395 |
Switzerland - 7.0% |
Adecco SA (Reg.) | 243,346 | | 13,597 |
Compagnie Financiere Richemont SA Series A | 692,855 | | 34,546 |
Credit Suisse Group | 644,315 | | 26,666 |
Kuehne & Nagel International AG | 197,400 | | 24,406 |
Lonza Group AG | 349,225 | | 30,564 |
Nestle SA | 2,845,723 | | 155,823 |
Novartis AG | 2,677,083 | | 155,070 |
Partners Group Holding | 176,756 | | 32,322 |
Schindler Holding AG (participation certificate) | 228,540 | | 24,494 |
Sonova Holding AG Class B | 213,178 | | 24,689 |
The Swatch Group AG (Bearer) | 175,550 | | 67,074 |
UBS AG (a) | 3,459,090 | | 58,744 |
Zurich Financial Services AG | 251,733 | | 61,607 |
TOTAL SWITZERLAND | | 709,602 |
Taiwan - 0.5% |
HTC Corp. | 2,247,850 | | 50,752 |
Thailand - 0.4% |
Bangkok Bank Public Co. Ltd. (For. Reg.) | 8,336,000 | | 43,016 |
Turkey - 0.7% |
Boyner Buyuk Magazacilik AS (a)(e) | 4,833,645 | | 11,256 |
Dogus Otomotiv Servis ve Ticaret AS (a) | 2,849,000 | | 21,452 |
Turkiye Garanti Bankasi AS | 6,816,000 | | 41,819 |
TOTAL TURKEY | | 74,527 |
United Kingdom - 20.9% |
Aberdeen Asset Management PLC | 12,139,132 | | 34,580 |
Aegis Group PLC | 12,834,711 | | 25,848 |
Anglo American PLC (United Kingdom) | 1,583,300 | | 73,767 |
AstraZeneca PLC (United Kingdom) | 1,776,034 | | 89,327 |
Barclays PLC | 20,242,493 | | 88,943 |
BG Group PLC | 943,475 | | 18,373 |
BHP Billiton PLC | 5,343,392 | | 189,262 |
BP PLC | 24,342,500 | | 165,439 |
British Land Co. PLC | 2,363,434 | | 19,293 |
Britvic PLC | 5,435,800 | | 42,012 |
Burberry Group PLC | 2,391,800 | | 39,048 |
Common Stocks - continued |
| Shares | | Value (000s) |
United Kingdom - continued |
Carphone Warehouse Group PLC (a) | 15,119,465 | | $ 73,761 |
Cookson Group PLC (a) | 1,543,760 | | 12,738 |
GlaxoSmithKline PLC | 6,239,100 | | 121,819 |
HSBC Holdings PLC (United Kingdom) | 12,868,660 | | 133,916 |
IG Group Holdings PLC | 6,526,105 | | 55,259 |
InterContinental Hotel Group PLC | 2,054,000 | | 39,664 |
International Personal Finance PLC | 9,411,888 | | 46,896 |
International Power PLC | 3,956,720 | | 26,454 |
Legal & General Group PLC | 18,411,796 | | 29,616 |
Lloyds Banking Group PLC (a) | 49,557,364 | | 54,463 |
Micro Focus International PLC | 2,166,900 | | 13,255 |
Ocado Group PLC (a)(d) | 14,388,400 | | 32,204 |
Reckitt Benckiser Group PLC | 1,415,031 | | 79,144 |
Rio Tinto PLC | 1,536,344 | | 99,773 |
Royal Dutch Shell PLC Class B | 5,903,573 | | 188,900 |
Schroders PLC | 1,532,400 | | 38,767 |
SuperGroup PLC | 101,212 | | 1,832 |
TalkTalk Telecom Group PLC (a) | 18,424,592 | | 38,936 |
Ultra Electronics Holdings PLC | 614,667 | | 18,327 |
Vodafone Group PLC | 42,989,943 | | 117,503 |
Wolseley PLC (a) | 1,389,264 | | 37,015 |
Xstrata PLC | 3,171,800 | | 61,463 |
TOTAL UNITED KINGDOM | | 2,107,597 |
United States of America - 2.9% |
AsiaInfo Holdings, Inc. (a)(d) | 717,700 | | 15,947 |
CF Industries Holdings, Inc. | 273,800 | | 33,549 |
Freeport-McMoRan Copper & Gold, Inc. | 420,100 | | 39,775 |
NII Holdings, Inc. (a) | 1,802,500 | | 75,363 |
The Mosaic Co. | 376,200 | | 27,523 |
Virgin Media, Inc. (d) | 2,966,300 | | 75,433 |
Walter Energy, Inc. | 286,800 | | 25,227 |
TOTAL UNITED STATES OF AMERICA | | 292,817 |
TOTAL COMMON STOCKS (Cost $8,518,349) | 9,789,364 |
Nonconvertible Preferred Stocks - 1.4% |
| Shares | | Value (000s) |
Germany - 1.4% |
ProSiebenSat.1 Media AG | 783,800 | | $ 20,711 |
Volkswagen AG | 789,800 | | 118,688 |
TOTAL NONCONVERTIBLE PREFERRED STOCKS (Cost $105,062) | 139,399 |
Money Market Funds - 2.2% |
| | | |
Fidelity Cash Central Fund, 0.23% (b) | 100,758,575 | | 100,759 |
Fidelity Securities Lending Cash Central Fund, 0.24% (b)(c) | 123,571,582 | | 123,572 |
TOTAL MONEY MARKET FUNDS (Cost $224,331) | 224,331 |
Cash Equivalents - 0.2% |
| Maturity Amount (000s) | | |
Investments in repurchase agreements in a joint trading account at 0.22%, dated 10/29/10 due 11/1/10 (Collateralized by U.S. Treasury Obligations) #
(Cost $18,662) | $ 18,662 | | 18,662 |
TOTAL INVESTMENT PORTFOLIO - 101.0% (Cost $8,866,404) | | 10,171,756 |
NET OTHER ASSETS (LIABILITIES) - (1.0)% | | (99,606) |
NET ASSETS - 100% | $ 10,072,150 |
Legend |
(a) Non-income producing |
(b) Affiliated fund that is available only to investment companies and other accounts managed by Fidelity Investments. The rate quoted is the annualized seven-day yield of the fund at period end. A complete unaudited listing of the fund's holdings as of its most recent quarter end is available upon request. In addition, each Fidelity Central Fund's financial statements, which are not covered by the Fund's report of Independent Registered Public Accounting Firm, are available on the SEC's website or upon request. |
(c) Investment made with cash collateral received from securities on loan. |
(d) Security or a portion of the security is on loan at period end. |
(e) Affiliated company |
(f) Security exempt from registration under Rule 144A of the Securities Act of 1933. These securities may be resold in transactions exempt from registration, normally to qualified institutional buyers. At the end of the period, the value of these securities amounted to $6,576,000 or 0.1% of net assets. |
# Additional information on each counterparty to the repurchase agreement is as follows: |
Repurchase Agreement / Counterparty | Value
(Amounts in thousands) |
$18,662,000 due 11/01/10 at 0.22% |
BNP Paribas Securities Corp. | $ 8,683 |
Banc of America Securities LLC | 3,254 |
Barclays Capital, Inc. | 6,725 |
| $ 18,662 |
Affiliated Central Funds |
Information regarding fiscal year to date income earned by the Fund from investments in Fidelity Central Funds is as follows: |
Fund | Income earned
(Amounts in thousands) |
Fidelity Cash Central Fund | $ 127 |
Fidelity Securities Lending Cash Central Fund | 6,155 |
Total | $ 6,282 |
Other Affiliated Issuers |
An affiliated company is a company in which the Fund has ownership of at least 5% of the voting securities. Fiscal year to date transactions with companies which are or were affiliates are as follows: |
Affiliate
(Amounts in thousands) | Value, beginning of period | Purchases | Sales Proceeds | Dividend Income | Value,
end of
period |
Aisi Realty Public Ltd. | $ 1,243 | $ - | $ - | $ - | $ 607 |
Boyner Buyuk Magazacilik AS | - | 11,785 | - | - | 11,256 |
Total | $ 1,243 | $ 11,785 | $ - | $ - | $ 11,863 |
Other Information |
The following is a summary of the inputs used, as of October 31, 2010, involving the Fund's assets and liabilities carried at fair value. The inputs or methodology used for valuing securities may not be an indication of the risk associated with investing in those securities. For more information on valuation inputs, and their aggregation into the levels used in the tables below, please refer to the Security Valuation section in the accompanying Notes to Financial Statements. |
Valuation Inputs at Reporting Date: |
Description
(Amounts in thousands) | Total | Level 1 | Level 2 | Level 3 |
Investments in Securities: | | | | |
Equities: | | | | |
United Kingdom | $ 2,107,597 | $ 818,588 | $ 1,289,009 | $ - |
Japan | 1,219,216 | 580,277 | 638,939 | - |
France | 880,982 | 833,360 | 47,622 | - |
Switzerland | 709,602 | 469,122 | 240,480 | - |
Germany | 667,061 | 481,234 | 185,827 | - |
Spain | 377,848 | 113,152 | 264,696 | - |
Denmark | 330,144 | 192,471 | 137,673 | - |
Australia | 302,335 | 302,335 | - | - |
United States of America | 292,817 | 292,817 | - | - |
Cyprus | 607 | - | - | 607 |
Other | 3,040,554 | 2,895,912 | 144,642 | - |
Money Market Funds | 224,331 | 224,331 | - | - |
Cash Equivalents | 18,662 | - | 18,662 | - |
Total Investments in Securities: | $ 10,171,756 | $ 7,203,599 | $ 2,967,550 | $ 607 |
The following is a reconciliation of Investments in Securities for which Level 3 inputs were used in determining value: |
(Amounts in thousands) | |
Investments in Securities: | |
Beginning Balance | $ - |
Total Realized Gain (Loss) | - |
Total Unrealized Gain (Loss) | (636) |
Cost of Purchases | - |
Proceeds of Sales | - |
Amortization/Accretion | - |
Transfers in to Level 3 | 1,243 |
Transfers out of Level 3 | - |
Ending Balance | $ 607 |
The change in unrealized gain (loss) for the period attributable to Level 3 securities held at October 31, 2010 | $ (636) |
The information used in the above reconciliation represents fiscal year to date activity for any Investments in Securities identified as using Level 3 inputs at either the beginning or the end of the current fiscal period. Transfers in or out of Level 3 represent the beginning value of any Security or Instrument where a change in the pricing level occurred from the beginning to the end of the period. The cost of purchases and the proceeds of sales may include securities received or delivered through corporate actions or exchanges. Realized and unrealized gains (losses) disclosed in the reconciliation are included in Net Gain (Loss) on the Fund's Statement of Operations. |
Income Tax Information |
At October 31, 2010, the Fund had a capital loss carryforward of approximately $1,803,058,000 of which $163,224,000 and $1,639,834,000 will expire on October 31, 2016 and 2017, respectively. Capital loss carryforwards are only available to offset future capital gains of the Fund to the extent provided by regulations and may be limited. |
See accompanying notes which are an integral part of the financial statements.
Annual Report
Statement of Assets and Liabilities
Amounts in thousands (except per-share amounts) | October 31, 2010 |
| | |
Assets | | |
Investment in securities, at value (including securities loaned of $117,688 and repurchase agreements of $18,662) - See accompanying schedule: Unaffiliated issuers (cost $8,623,386) | $ 9,935,562 | |
Fidelity Central Funds (cost $224,331) | 224,331 | |
Other affiliated issuers (cost $18,687) | 11,863 | |
Total Investments (cost $8,866,404) | | $ 10,171,756 |
Cash | | 1 |
Foreign currency held at value (cost $1,005) | | 1,005 |
Receivable for investments sold | | 74,676 |
Receivable for fund shares sold | | 8,906 |
Dividends receivable | | 27,141 |
Distributions receivable from Fidelity Central Funds | | 250 |
Other receivables | | 3,906 |
Total assets | | 10,287,641 |
| | |
Liabilities | | |
Payable for investments purchased | $ 61,924 | |
Payable for fund shares redeemed | 12,106 | |
Accrued management fee | 5,716 | |
Distribution and service plan fees payable | 169 | |
Other affiliated payables | 1,920 | |
Other payables and accrued expenses | 10,084 | |
Collateral on securities loaned, at value | 123,572 | |
Total liabilities | | 215,491 |
| | |
Net Assets | | $ 10,072,150 |
Net Assets consist of: | | |
Paid in capital | | $ 10,604,504 |
Undistributed net investment income | | 120,198 |
Accumulated undistributed net realized gain (loss) on investments and foreign currency transactions | | (1,950,098) |
Net unrealized appreciation (depreciation) on investments and assets and liabilities in foreign currencies | | 1,297,546 |
Net Assets | | $ 10,072,150 |
See accompanying notes which are an integral part of the financial statements.
Annual Report
Statement of Assets and Liabilities - continued
Amounts in thousands (except per-share amounts) | October 31, 2010 |
| | |
Calculation of Maximum Offering Price Class A:
Net Asset Value and redemption price per share ($391,603 ÷ 12,210.4 shares) | | $ 32.07 |
| | |
Maximum offering price per share (100/94.25 of $32.07) | | $ 34.03 |
Class T:
Net Asset Value and redemption price per share ($91,992 ÷ 2,892.1 shares) | | $ 31.81 |
| | |
Maximum offering price per share (100/96.50 of $31.81) | | $ 32.96 |
Class B:
Net Asset Value and offering price per share ($14,434 ÷ 456.7 shares)A | | $ 31.60 |
| | |
Class C:
Net Asset Value and offering price per share ($43,557 ÷ 1,374.7 shares)A | | $ 31.68 |
| | |
International Discovery:
Net Asset Value, offering price and redemption price per share ($8,133,121 ÷ 251,479.5 shares) | | $ 32.34 |
| | |
Class K:
Net Asset Value, offering price and redemption price per share ($1,078,333 ÷ 33,361.2 shares) | | $ 32.32 |
| | |
Institutional Class:
Net Asset Value, offering price and redemption price per share ($319,110 ÷ 9,877.0 shares) | | $ 32.31 |
A Redemption price per share is equal to net asset value less any applicable contingent deferred sales charge.
See accompanying notes which are an integral part of the financial statements.
Annual Report
Financial Statements - continued
Statement of Operations
Amounts in thousands | Year ended October 31, 2010 |
| | |
Investment Income | | |
Dividends | | $ 239,834 |
Interest | | 2 |
Income from Fidelity Central Funds | | 6,282 |
Income before foreign taxes withheld | | 246,118 |
Less foreign taxes withheld | | (17,979) |
Total income | | 228,139 |
| | |
Expenses | | |
Management fee
Basic fee | $ 68,970 | |
Performance adjustment | 3,660 | |
Transfer agent fees | 23,371 | |
Distribution and service plan fees | 2,084 | |
Accounting and security lending fees | 1,801 | |
Custodian fees and expenses | 1,632 | |
Independent trustees' compensation | 55 | |
Registration fees | 223 | |
Audit | 117 | |
Legal | 49 | |
Interest | 12 | |
Miscellaneous | 132 | |
Total expenses before reductions | 102,106 | |
Expense reductions | (4,562) | 97,544 |
Net investment income (loss) | | 130,595 |
Realized and Unrealized Gain (Loss) Net realized gain (loss) on: | | |
Investment securities: | | |
Unaffiliated issuers (net of foreign taxes of $141) | 488,568 | |
Foreign currency transactions | (6,761) | |
Capital gain distributions from Fidelity Central Funds | 14 | |
Total net realized gain (loss) | | 481,821 |
Change in net unrealized appreciation (depreciation) on: Investment securities (net of increase in deferred foreign taxes of $8,661) | 637,812 | |
Assets and liabilities in foreign currencies | 968 | |
Total change in net unrealized appreciation (depreciation) | | 638,780 |
Net gain (loss) | | 1,120,601 |
Net increase (decrease) in net assets resulting from operations | | $ 1,251,196 |
See accompanying notes which are an integral part of the financial statements.
Annual Report
Statement of Changes in Net Assets
Amounts in thousands | Year ended
October 31,
2010 | Year ended
October 31,
2009 |
Increase (Decrease) in Net Assets | | |
Operations | | |
Net investment income (loss) | $ 130,595 | $ 120,477 |
Net realized gain (loss) | 481,821 | (1,782,481) |
Change in net unrealized appreciation (depreciation) | 638,780 | 3,333,708 |
Net increase (decrease) in net assets resulting
from operations | 1,251,196 | 1,671,704 |
Distributions to shareholders from net investment income | (116,422) | (107,705) |
Distributions to shareholders from net realized gain | (13,374) | - |
Total distributions | (129,796) | (107,705) |
Share transactions - net increase (decrease) | (662,032) | 250,490 |
Redemption fees | 291 | 345 |
Total increase (decrease) in net assets | 459,659 | 1,814,834 |
| | |
Net Assets | | |
Beginning of period | 9,612,491 | 7,797,657 |
End of period (including undistributed net investment income of $120,198 and undistributed net investment income of $106,024, respectively) | $ 10,072,150 | $ 9,612,491 |
See accompanying notes which are an integral part of the financial statements.
Annual Report
Financial Highlights - Class A
Years ended October 31, | 2010 | 2009 | 2008 | 2007 | 2006 |
Selected Per-Share Data | | | | | |
Net asset value, beginning of period | $ 28.57 | $ 23.68 | $ 47.34 | $ 36.47 | $ 30.57 |
Income from Investment Operations | | | | | |
Net investment income (loss)C | .31 | .31 | .46 | .44 | .42 |
Net realized and unrealized gain (loss) | 3.51 | 4.84 | (22.08) | 11.76 | 7.19 |
Total from investment operations | 3.82 | 5.15 | (21.62) | 12.20 | 7.61 |
Distributions from net investment income | (.28) | (.26) | (.37) | (.35) | (.31) |
Distributions from net realized gain | (.04) | - | (1.67) | (.98) | (1.40) |
Total distributions | (.32) | (.26) | (2.04) | (1.33) | (1.71) |
Redemption fees added to paid in capital C,G | - | - | - | - | - |
Net asset value, end of period | $ 32.07 | $ 28.57 | $ 23.68 | $ 47.34 | $ 36.47 |
Total ReturnA,B | 13.43% | 22.14% | (47.65)% | 34.54% | 26.01% |
Ratios to Average Net Assets D, F | | | | | |
Expenses before reductions | 1.33% | 1.37% | 1.32% | 1.25% | 1.27% |
Expenses net of fee waivers, if any | 1.33% | 1.37% | 1.32% | 1.25% | 1.27% |
Expenses net of all reductions | 1.28% | 1.32% | 1.29% | 1.22% | 1.21% |
Net investment income (loss) | 1.06% | 1.28% | 1.27% | 1.08% | 1.22% |
Supplemental Data | | | | | |
Net assets, end of period (in millions) | $ 392 | $ 414 | $ 380 | $ 417 | $ 140 |
Portfolio turnover rate E | 82% | 98% | 79% | 56% | 56% |
A Total returns would have been lower had certain expenses not been reduced during the periods shown.
B Total returns do not include the effect of the sales charges.
C Calculated based on average shares outstanding during the period.
D Fees and expenses of the underlying Fidelity Central Funds are not included in the Fund's expense ratio. The Fund indirectly bears its proportionate share of the expenses of any underlying Fidelity Central Funds.
E Amount does not include the portfolio activity of any underlying Fidelity Central Funds.
F Expense ratios reflect operating expenses of the class. Expenses before reductions do not reflect amounts reimbursed by the investment adviser or reductions from brokerage service arrangements or reductions from other expense offset arrangements and do not represent the amount paid by the class during periods when reimbursements or reductions occur. Expenses net of fee waivers reflect expenses after reimbursement by the investment adviser but prior to reductions from brokerage service arrangements or other expense offset arrangements. Expenses net of all reductions represent the net expenses paid by the class.
G Amount represents less than $.01 per share.
See accompanying notes which are an integral part of the financial statements.
Annual Report
Financial Highlights - Class T
Years ended October 31, | 2010 | 2009 | 2008 | 2007 | 2006 |
Selected Per-Share Data | | | | | |
Net asset value, beginning of period | $ 28.35 | $ 23.49 | $ 47.06 | $ 36.30 | $ 30.49 |
Income from Investment Operations | | | | | |
Net investment income (loss) C | .23 | .24 | .33 | .29 | .27 |
Net realized and unrealized gain (loss) | 3.48 | 4.81 | (21.94) | 11.71 | 7.18 |
Total from investment operations | 3.71 | 5.05 | (21.61) | 12.00 | 7.45 |
Distributions from net investment income | (.21) | (.19) | (.29) | (.26) | (.24) |
Distributions from net realized gain | (.04) | - | (1.67) | (.98) | (1.40) |
Total distributions | (.25) | (.19) | (1.96) | (1.24) | (1.64) |
Redemption fees added to paid in capital C,G | - | - | - | - | - |
Net asset value, end of period | $ 31.81 | $ 28.35 | $ 23.49 | $ 47.06 | $ 36.30 |
Total Return A,B | 13.14% | 21.79% | (47.84)% | 34.08% | 25.49% |
Ratios to Average Net AssetsD, F | | | | | |
Expenses before reductions | 1.60% | 1.65% | 1.68% | 1.63% | 1.71% |
Expenses net of fee waivers, if any | 1.60% | 1.65% | 1.68% | 1.63% | 1.71% |
Expenses net of all reductions | 1.56% | 1.60% | 1.64% | 1.60% | 1.65% |
Net investment income (loss) | .79% | 1.00% | .91% | .70% | .78% |
Supplemental Data | | | | | |
Net assets, end of period (in millions) | $ 92 | $ 83 | $ 64 | $ 53 | $ 10 |
Portfolio turnover rate E | 82% | 98% | 79% | 56% | 56% |
A Total returns would have been lower had certain expenses not been reduced during the periods shown.
B Total returns do not include the effect of the sales charges.
C Calculated based on average shares outstanding during the period.
D Fees and expenses of the underlying Fidelity Central Funds are not included in the Fund's expense ratio. The Fund indirectly bears its proportionate share of the expenses of any underlying Fidelity Central Funds.
E Amount does not include the portfolio activity of any underlying Fidelity Central Funds.
F Expense ratios reflect operating expenses of the class. Expenses before reductions do not reflect amounts reimbursed by the investment adviser or reductions from brokerage service arrangements or reductions from other expense offset arrangements and do not represent the amount paid by the class during periods when reimbursements or reductions occur. Expenses net of fee waivers reflect expenses after reimbursement by the investment adviser but prior to reductions from brokerage service arrangements or other expense offset arrangements. Expenses net of all reductions represent the net expenses paid by the class.
G Amount represents less than $.01 per share.
See accompanying notes which are an integral part of the financial statements.
Annual Report
Financial Highlights - Class B
Years ended October 31, | 2010 | 2009 | 2008 | 2007 | 2006 |
Selected Per-Share Data | | | | | |
Net asset value, beginning of period | $ 28.18 | $ 23.25 | $ 46.70 | $ 36.12 | $ 30.36 |
Income from Investment Operations | | | | | |
Net investment income (loss)C | .08 | .12 | .15 | .08 | .08 |
Net realized and unrealized gain (loss) | 3.44 | 4.81 | (21.77) | 11.64 | 7.19 |
Total from investment operations | 3.52 | 4.93 | (21.62) | 11.72 | 7.27 |
Distributions from net investment income | (.06) | - | (.16) | (.16) | (.11) |
Distributions from net realized gain | (.04) | - | (1.67) | (.98) | (1.40) |
Total distributions | (.10) | - | (1.83) | (1.14) | (1.51) |
Redemption fees added to paid in capital C,G | - | - | - | - | - |
Net asset value, end of period | $ 31.60 | $ 28.18 | $ 23.25 | $ 46.70 | $ 36.12 |
Total ReturnA,B | 12.52% | 21.20% | (48.11)% | 33.37% | 24.91% |
Ratios to Average Net Assets D, F | | | | | |
Expenses before reductions | 2.12% | 2.16% | 2.19% | 2.14% | 2.27% |
Expenses net of fee waivers, if any | 2.12% | 2.16% | 2.19% | 2.14% | 2.25% |
Expenses net of all reductions | 2.08% | 2.11% | 2.15% | 2.10% | 2.19% |
Net investment income (loss) | .27% | .49% | .40% | .19% | .24% |
Supplemental Data | | | | | |
Net assets, end of period (in millions) | $ 14 | $ 16 | $ 15 | $ 17 | $ 4 |
Portfolio turnover rate E | 82% | 98% | 79% | 56% | 56% |
A Total returns would have been lower had certain expenses not been reduced during the periods shown.
B Total returns do not include the effect of the contingent deferred sales charge.
C Calculated based on average shares outstanding during the period.
D Fees and expenses of the underlying Fidelity Central Funds are not included in the Fund's expense ratio. The Fund indirectly bears its proportionate share of the expenses of any underlying Fidelity Central Funds.
E Amount does not include the portfolio activity of any underlying Fidelity Central Funds.
F Expense ratios reflect operating expenses of the class. Expenses before reductions do not reflect amounts reimbursed by the investment adviser or reductions from brokerage service arrangements or reductions from other expense offset arrangements and do not represent the amount paid by the class during periods when reimbursements or reductions occur. Expenses net of fee waivers reflect expenses after reimbursement by the investment adviser but prior to reductions from brokerage service arrangements or other expense offset arrangements. Expenses net of all reductions represent the net expenses paid by the class.
G Amount represents less than $.01 per share.
See accompanying notes which are an integral part of the financial statements.
Annual Report
Financial Highlights - Class C
Years ended October 31, | 2010 | 2009 | 2008 | 2007 | 2006 |
Selected Per-Share Data | | | | | |
Net asset value, beginning of period | $ 28.23 | $ 23.31 | $ 46.82 | $ 36.19 | $ 30.41 |
Income from Investment Operations | | | | | |
Net investment income (loss) C | .09 | .12 | .15 | .09 | .11 |
Net realized and unrealized gain (loss) | 3.45 | 4.82 | (21.82) | 11.66 | 7.19 |
Total from investment operations | 3.54 | 4.94 | (21.67) | 11.75 | 7.30 |
Distributions from net investment income | (.05) | (.02) | (.17) | (.14) | (.12) |
Distributions from net realized gain | (.04) | - | (1.67) | (.98) | (1.40) |
Total distributions | (.09) | (.02) | (1.84) | (1.12) | (1.52) |
Redemption fees added to paid in capital C,G | - | - | - | - | - |
Net asset value, end of period | $ 31.68 | $ 28.23 | $ 23.31 | $ 46.82 | $ 36.19 |
Total Return A,B | 12.54% | 21.22% | (48.10)% | 33.38% | 24.97% |
Ratios to Average Net Assets D, F | | | | | |
Expenses before reductions | 2.09% | 2.14% | 2.17% | 2.11% | 2.16% |
Expenses net of fee waivers, if any | 2.09% | 2.14% | 2.17% | 2.11% | 2.16% |
Expenses net of all reductions | 2.05% | 2.09% | 2.13% | 2.08% | 2.11% |
Net investment income (loss) | .30% | .51% | .42% | .22% | .33% |
Supplemental Data | | | | | |
Net assets, end of period (in millions) | $ 44 | $ 43 | $ 36 | $ 28 | $ 6 |
Portfolio turnover rate E | 82% | 98% | 79% | 56% | 56% |
A Total returns would have been lower had certain expenses not been reduced during the periods shown.
B Total returns do not include the effect of the contingent deferred sales charge.
C Calculated based on average shares outstanding during the period.
D Fees and expenses of the underlying Fidelity Central Funds are not included in the Fund's expense ratio. The Fund indirectly bears its proportionate share of the expenses of any underlying Fidelity Central Funds.
E Amount does not include the portfolio activity of any underlying Fidelity Central Funds.
F Expense ratios reflect operating expenses of the class. Expenses before reductions do not reflect amounts reimbursed by the investment adviser or reductions from brokerage service arrangements or reductions from other expense offset arrangements and do not represent the amount paid by the class during periods when reimbursements or reductions occur. Expenses net of fee waivers reflect expenses after reimbursement by the investment adviser but prior to reductions from brokerage service arrangements or other expense offset arrangements. Expenses net of all reductions represent the net expenses paid by the class.
G Amount represents less than $.01 per share.
See accompanying notes which are an integral part of the financial statements.
Annual Report
Financial Highlights - International Discovery
Years ended October 31, | 2010 | 2009 | 2008 | 2007 | 2006 |
Selected Per-Share Data | | | | | |
Net asset value, beginning of period | $ 28.79 | $ 23.88 | $ 47.68 | $ 36.67 | $ 30.65 |
Income from Investment Operations | | | | | |
Net investment income (loss) B | .40 | .37 | .57 | .53 | .48 |
Net realized and unrealized gain (loss) | 3.54 | 4.88 | (22.29) | 11.84 | 7.25 |
Total from investment operations | 3.94 | 5.25 | (21.72) | 12.37 | 7.73 |
Distributions from net investment income | (.35) | (.34) | (.41) | (.38) | (.31) |
Distributions from net realized gain | (.04) | - | (1.67) | (.98) | (1.40) |
Total distributions | (.39) | (.34) | (2.08) | (1.36) | (1.71) |
Redemption fees added to paid in capital B,F | - | - | - | - | - |
Net asset value, end of period | $ 32.34 | $ 28.79 | $ 23.88 | $ 47.68 | $ 36.67 |
Total Return A | 13.76% | 22.47% | (47.55)% | 34.85% | 26.34% |
Ratios to Average Net Assets C,E | | | | | |
Expenses before reductions | 1.05% | 1.12% | 1.09% | 1.04% | 1.09% |
Expenses net of fee waivers, if any | 1.05% | 1.12% | 1.09% | 1.04% | 1.08% |
Expenses net of all reductions | 1.00% | 1.07% | 1.05% | 1.00% | 1.03% |
Net investment income (loss) | 1.35% | 1.53% | 1.51% | 1.30% | 1.41% |
Supplemental Data | | | | | |
Net assets, end of period (in millions) | $ 8,133 | $ 8,114 | $ 6,999 | $ 14,176 | $ 8,054 |
Portfolio turnover rateD | 82% | 98% | 79% | 56% | 56% |
A Total returns would have been lower had certain expenses not been reduced during the periods shown.
B Calculated based on average shares outstanding during the period.
C Fees and expenses of the underlying Fidelity Central Funds are not included in the Fund's expense ratio. The Fund indirectly bears its proportionate share of the expenses of any underlying Fidelity Central Funds.
D Amount does not include the portfolio activity of any underlying Fidelity Central Funds.
E Expense ratios reflect operating expenses of the class. Expenses before reductions do not reflect amounts reimbursed by the investment adviser or reductions from brokerage service arrangements or reductions from other expense offset arrangements and do not represent the amount paid by the class during periods when reimbursements or reductions occur. Expenses net of fee waivers reflect expenses after reimbursement by the investment adviser but prior to reductions from brokerage service arrangements or other expense offset arrangements. Expenses net of all reductions represent the net expenses paid by the class.
F Amount represents less than $.01 per share.
See accompanying notes which are an integral part of the financial statements.
Annual Report
Financial Highlights - Class K
Years ended October 31, | 2010 | 2009 | 2008G |
Selected Per-Share Data | | | |
Net asset value, beginning of period | $ 28.78 | $ 23.90 | $ 40.32 |
Income from Investment Operations | | | |
Net investment income (loss)D | .46 | .44 | .10 |
Net realized and unrealized gain (loss) | 3.53 | 4.86 | (16.52) |
Total from investment operations | 3.99 | 5.30 | (16.42) |
Distributions from net investment income | (.41) | (.42) | - |
Distributions from net realized gain | (.04) | - | - |
Total distributions | (.45) | (.42) | - |
Redemption fees added to paid in capital D,I | - | - | - |
Net asset value, end of period | $ 32.32 | $ 28.78 | $ 23.90 |
Total ReturnB,C | 13.96% | 22.80% | (40.72)% |
Ratios to Average Net AssetsE,H | | | |
Expenses before reductions | .84% | .88% | .93%A |
Expenses net of fee waivers, if any | .84% | .88% | .93%A |
Expenses net of all reductions | .79% | .83% | .89%A |
Net investment income (loss) | 1.55% | 1.77% | .83%A |
Supplemental Data | | | |
Net assets, end of period (in millions) | $ 1,078 | $ 674 | $ 145 |
Portfolio turnover rateF | 82% | 98% | 79% |
A Annualized
B Total returns for period of less than one year are not annualized.
C Total returns would have been lower had certain expenses not been reduced during the periods shown.
D Calculated based on average shares outstanding during the period.
E Fees and expenses of the underlying Fidelity Central Funds are not included in the Fund's expense ratio. The Fund indirectly bears its proportionate share of the expenses of any underlying Fidelity Central Funds.
F Amount does not include the portfolio activity of any underlying Fidelity Central Funds.
G For the period May 9, 2008 (commencement of sale of shares) to October 31, 2008.
H Expense ratios reflect operating expenses of the class. Expenses before reductions do not reflect amounts reimbursed by the investment adviser or reductions from brokerage service arrangements or reductions from other expense offset arrangements and do not represent the amount paid by the class during periods when reimbursements or reductions occur. Expense ratios before reductions for start-up periods may not be representative of longer-term operating periods. Expenses net of fee waivers reflect expenses after reimbursement by the investment adviser but prior to reductions from brokerage service arrangements or other expense offset arrangements. Expenses net of all reductions represent the net expenses paid by the class.
I Amount represents less than $.01 per share.
See accompanying notes which are an integral part of the financial statements.
Annual Report
Financial Highlights - Institutional Class
Years ended October 31, | 2010 | 2009 | 2008 | 2007 | 2006 |
Selected Per-Share Data | | | | | |
Net asset value, beginning of period | $ 28.77 | $ 23.91 | $ 47.73 | $ 36.71 | $ 30.68 |
Income from Investment Operations | | | | | |
Net investment income (loss) B | .41 | .39 | .53 | .55 | .51 |
Net realized and unrealized gain (loss) | 3.55 | 4.86 | (22.24) | 11.85 | 7.25 |
Total from investment operations | 3.96 | 5.25 | (21.71) | 12.40 | 7.76 |
Distributions from net investment income | (.38) | (.39) | (.44) | (.40) | (.33) |
Distributions from net realized gain | (.04) | - | (1.67) | (.98) | (1.40) |
Total distributions | (.42) | (.39) | (2.11) | (1.38) | (1.73) |
Redemption fees added to paid in capital B,F | - | - | - | - | - |
Net asset value, end of period | $ 32.31 | $ 28.77 | $ 23.91 | $ 47.73 | $ 36.71 |
Total Return A | 13.84% | 22.52% | (47.51)% | 34.93% | 26.45% |
Ratios to Average Net Assets C,E | | | | | |
Expenses before reductions | .99% | 1.05% | 1.05% | .97% | 1.00% |
Expenses net of fee waivers, if any | .99% | 1.05% | 1.05% | .97% | 1.00% |
Expenses net of all reductions | .95% | 1.00% | 1.01% | .94% | .95% |
Net investment income (loss) | 1.40% | 1.60% | 1.54% | 1.36% | 1.49% |
Supplemental Data | | | | | |
Net assets, end of period (in millions) | $ 319 | $ 267 | $ 159 | $ 58 | $ 28 |
Portfolio turnover rateD | 82% | 98% | 79% | 56% | 56% |
A Total returns would have been lower had certain expenses not been reduced during the periods shown.
B Calculated based on average shares outstanding during the period.
C Fees and expenses of the underlying Fidelity Central Funds are not included in the Fund's expense ratio. The Fund indirectly bears its proportionate share of the expenses of any underlying Fidelity Central Funds.
D Amount does not include the portfolio activity of any underlying Fidelity Central Funds.
E Expense ratios reflect operating expenses of the class. Expenses before reductions do not reflect amounts reimbursed by the investment adviser or reductions from brokerage service arrangements or reductions from other expense offset arrangements and do not represent the amount paid by the class during periods when reimbursements or reductions occur. Expenses net of fee waivers reflect expenses after reimbursement by the investment adviser but prior to reductions from brokerage service arrangements or other expense offset arrangements. Expenses net of all reductions represent the net expenses paid by the class.
F Amount represents less than $.01 per share.
See accompanying notes which are an integral part of the financial statements.
Annual Report
Notes to Financial Statements
For the period ended October 31, 2010
(Amounts in thousands except ratios)
1. Organization.
Fidelity International Discovery Fund (the Fund) is a fund of Fidelity Investment Trust (the Trust) and is authorized to issue an unlimited number of shares. The Trust is registered under the Investment Company Act of 1940, as amended (the 1940 Act), as an open-end management investment company organized as a Massachusetts business trust. The Fund offers Class A, Class T, Class C, International Discovery, Class K and Institutional Class shares, each of which has equal rights as to assets and voting privileges. Effective after the close of business on September 1, 2010, Class B shares were closed to new accounts and additional purchases by existing shareholders. Each class has exclusive voting rights with respect to matters that affect that class. Class B shares will automatically convert to Class A shares after a holding period of seven years from the initial date of purchase. Investment income, realized and unrealized capital gains and losses, the common expenses of the Fund, and certain fund-level expense reductions, if any, are allocated on a pro-rata basis to each class based on the relative net assets of each class to the total net assets of the Fund. Each class differs with respect to transfer agent and distribution and service plan fees incurred. Certain expense reductions also differ by class. The Fund's investments in emerging markets can be subject to social, economic, regulatory, and political uncertainties and can be extremely volatile.
2. Investments in Fidelity Central Funds.
The Fund may invest in Fidelity Central Funds, which are open-end investment companies available only to other investment companies and accounts managed by Fidelity Management & Research Company (FMR) and its affiliates. The Fund's Schedule of Investments lists each of the Fidelity Central Funds held as of period end, if any, as an investment of the Fund, but does not include the underlying holdings of each Fidelity Central Fund. As an Investing Fund, the Fund indirectly bears its proportionate share of the expenses of the underlying Fidelity Central Funds.
The Money Market Central Funds seek preservation of capital and current income and are managed by Fidelity Investments Money Management, Inc. (FIMM), an affiliate of FMR.
A complete unaudited list of holdings for each Fidelity Central Fund is available upon request or at the Securities and Exchange Commission (the SEC) web site at www.sec.gov. In addition, the financial statements of the Fidelity Central Funds, which are not covered by the Fund's Report of Independent Registered Public Accounting Firm, are available on the SEC web site or upon request.
Annual Report
Notes to Financial Statements - continued
(Amounts in thousands except ratios)
3. Significant Accounting Policies.
The financial statements have been prepared in conformity with accounting principles generally accepted in the United States of America (GAAP), which require management to make certain estimates and assumptions at the date of the financial statements.
Actual results could differ from those estimates. The following summarizes the significant accounting policies of the Fund:
Security Valuation. Investments are valued as of 4:00 p.m. Eastern time on the last calendar day of the period. The Fund uses independent pricing services approved by the Board of Trustees to value its investments. When current market prices or quotations are not readily available or reliable, valuations may be determined in good faith in accordance with procedures adopted by the Board of Trustees. Factors used in determining value may include market or security specific events. The frequency with which these procedures are used cannot be predicted and they may be utilized to a significant extent. The value used for net asset value (NAV) calculation under these procedures may differ from published prices for the same securities.
The Fund categorizes the inputs to valuation techniques used to value its investments into a disclosure hierarchy consisting of three levels as shown below.
Level 1 - quoted prices in active markets for identical investments
Level 2 - other significant observable inputs (including quoted prices for similar investments, interest rates, prepayment speeds, etc.)
Level 3 - unobservable inputs (including the fund's own assumptions based on the best information available)
Changes in valuation techniques may result in transfers in or out of an assigned level within the disclosure hierarchy. The aggregate value of investments by input level, as of October 31, 2010, as well as a roll forward of Level 3 securities, is included at the end of the Fund's Schedule of Investments. Valuation techniques used to value the Fund's investments by major category are as follows.
Equity securities, including restricted securities, for which market quotations are readily available, are valued at the last reported sale price or official closing price as reported by an independent pricing service on the primary market or exchange on which they are traded and are categorized as Level 1 in the hierarchy. In the event there were no sales during the day or closing prices are not available, securities are valued at the last quoted bid price or may be valued using the last available price and are generally categorized as Level 2 in the hierarchy. For foreign equity securities, when significant market or security specific events arise, comparisons to the valuation of American Depositary Receipts
Annual Report
3. Significant Accounting Policies - continued
Security Valuation - continued
(ADRs), futures contracts, Exchange-traded funds (ETFs) and certain indexes as well as quoted prices for similar securities are used and are categorized as Level 2 in the hierarchy in these circumstances. Utilizing these techniques may result in significant transfers between Level 1 and Level 2. For restricted equity securities and private placements where observable inputs are limited, assumptions about market activity and risk are used and are categorized as Level 3 in the hierarchy.
Investments in open-end mutual funds,including the Fidelity Central Funds, are valued at their closing net asset value each business day and are categorized as Level 1 in the hierarchy. Short-term securities with remaining maturities of sixty days or less for which quotations are not readily available are valued at amortized cost, which approximates fair value and are categorized as Level 2 in the hierarchy.
Foreign Currency. The Fund uses foreign currency contracts to facilitate transactions in foreign-denominated securities. Gains and losses from these transactions may arise from changes in the value of the foreign currency or if the counterparties do not perform under the contracts' terms.
Foreign-denominated assets, including investment securities, and liabilities are translated into U.S. dollars at the exchange rate at period end. Purchases and sales of investment securities, income and dividends received and expenses denominated in foreign currencies are translated into U.S. dollars at the exchange rate in effect on the transaction date.
The effects of exchange rate fluctuations on investments are included with the net realized and unrealized gain (loss) on investment securities. Other foreign currency transactions resulting in realized and unrealized gain (loss) are disclosed separately.
Investment Transactions and Income. For financial reporting purposes, the Fund's investment holdings and NAV include trades executed through the end of the last business day of the period. The NAV per share for processing shareholder transactions is calculated as of the close of business of the New York Stock Exchange (NYSE), normally 4:00 p.m. Eastern time and includes trades executed through the end of the prior business day. Gains and losses on securities sold are determined on the basis of identified cost and may include proceeds received from litigation. Dividend income is recorded on the ex-dividend date, except for certain dividends from foreign securities where the ex-dividend date may have passed, which are recorded as soon as the Fund is informed of the ex-dividend date. Non-cash dividends included in dividend income, if any, are recorded at the fair market value of the securities received. Distributions received on securities that represent a return of capital or capital gain are recorded as a reduction of cost of investments and/or as a realized gain. The Fund estimates the components of
Annual Report
Notes to Financial Statements - continued
(Amounts in thousands except ratios)
3. Significant Accounting Policies - continued
Investment Transactions and Income - continued
distributions received that may be considered return of capital distributions or capital gain distributions. Interest income and distributions from the Fidelity Central Funds are accrued as earned. Interest income includes coupon interest and amortization of premium and accretion of discount on debt securities. Investment income is recorded net of foreign taxes withheld where recovery of such taxes is uncertain.
Expenses. Most expenses of the Trust can be directly attributed to a fund. Expenses which cannot be directly attributed are apportioned amongst each fund in the Trust. Expense estimates are accrued in the period to which they relate and adjustments are made when actual amounts are known.
Deferred Trustee Compensation. Under a Deferred Compensation Plan (the Plan), independent Trustees may elect to defer receipt of a portion of their annual compensation. Deferred amounts are invested in a cross-section of Fidelity funds, are marked-to-market and remain in the Fund until distributed in accordance with the Plan. The investment of deferred amounts and the offsetting payable to the Trustees are included in the accompanying Statement of Assets and Liabilities.
Income Tax Information and Distributions to Shareholders. Each year the Fund intends to qualify as a regulated investment company, including distributing substantially all of its taxable income and realized gains under Subchapter M of the Internal Revenue Code and filing its U.S. federal tax return. As a result, no provision for income taxes is required. As of October 31, 2010, the Fund did not have any unrecognized tax benefits in the accompanying financial statements. A fund's federal tax return is subject to examination by the Internal Revenue Service (IRS) for a period of three years. Foreign taxes are provided for based on the Fund's understanding of the tax rules and rates that exist in the foreign markets in which it invests. The Fund is subject to a tax imposed on short term capital gains on securities of certain issuers domiciled in India. The Fund records an estimated deferred tax liability included in Other payables and accrued expenses in the accompanying Statement of Assets & Liabilities for net unrealized gains on these securities in an amount that would be payable if the securities were disposed of at period end.
Distributions are declared and recorded on the ex-dividend date. Income dividends and capital gain distributions are declared separately for each class. Income and capital gain distributions are determined in accordance with income tax regulations, which may differ from GAAP.
Annual Report
3. Significant Accounting Policies - continued
Income Tax Information and Distributions to Shareholders - continued
Capital accounts within the financial statements are adjusted for permanent book-tax differences. These adjustments have no impact on net assets or the results of operations. Temporary book-tax differences will reverse in a subsequent period.
Book-tax differences are primarily due to the short-term gain distributions from the Fidelity Central Funds, foreign currency transactions, certain foreign taxes, passive foreign investment companies (PFIC), deferred trustees compensation, capital loss carryforwards and losses deferred due to wash sales.
The federal tax cost of investment securities and unrealized appreciation (depreciation) as of period end were as follows:
Gross unrealized appreciation | $ 1,665,347 |
Gross unrealized depreciation | (554,558) |
Net unrealized appreciation (depreciation) | $ 1,110,789 |
| |
Tax Cost | $ 9,060,967 |
The tax-based components of distributable earnings as of period end were as follows:
Undistributed ordinary income | $ 167,811 |
Capital loss carryforward | $ (1,803,058) |
Net unrealized appreciation (depreciation) | $ 1,112,591 |
The tax character of distributions paid was as follows:
| October 31, 2010 | October 31, 2009 |
Ordinary Income | $ 129,796 | $ 107,705 |
Short-Term Trading (Redemption) Fees. Shares held by investors in the Fund less than 30 days are subject to a redemption fee equal to 1.00% of the net asset value of shares redeemed. All redemption fees, which reduce the proceeds of the shareholder redemption, are retained by the Fund and accounted for as an addition to paid in capital.
4. Operating Policies.
Repurchase Agreements. FMR has received an Exemptive Order from the SEC which permits the Fund and other affiliated entities of FMR to transfer uninvested cash balances into joint trading accounts which are then invested in repurchase agreements.
Annual Report
Notes to Financial Statements - continued
(Amounts in thousands except ratios)
4. Operating Policies - continued
Repurchase Agreements - continued
The Fund may also invest directly with institutions in repurchase agreements. Repurchase agreements are collateralized by government or non-government securities. Upon settlement date, collateral is held in segregated accounts with custodian banks and may be obtained in the event of a default of the counterparty. The Fund monitors, on a daily basis, the value of the collateral to ensure it is at least equal to the principal amount of the repurchase agreement (including accrued interest). In the event of a default by the counterparty, realization of the collateral proceeds could be delayed, during which time the value of the collateral may decline.
Restricted Securities. The Fund may invest in securities that are subject to legal or contractual restrictions on resale. These securities generally may be resold in transactions exempt from registration or to the public if the securities are registered. Disposal of these securities may involve time-consuming negotiations and expense, and prompt sale at an acceptable price may be difficult. Information regarding restricted securities is included at the end of the Fund's Schedule of Investments.
5. Purchases and Sales of Investments.
Purchases and sales of securities, other than short-term securities, aggregated $7,811,097 and $8,569,062, respectively.
6. Fees and Other Transactions with Affiliates.
Management Fee. FMR and its affiliates provide the Fund with investment management related services for which the Fund pays a monthly management fee. The management fee is the sum of an individual fund fee rate that is based on an annual rate of .45% of the Fund's average net assets and a group fee rate that averaged .26% during the period. The group fee rate is based upon the average net assets of all the mutual funds advised by FMR. The group fee rate decreases as assets under management increase and increases as assets under management decrease. In addition, the management fee is subject to a performance adjustment (up to a maximum of ± 20% of the Fund's average net assets over a 36 month performance period). The upward or downward adjustment to the management fee is based on the relative investment performance of International Discovery share class as compared to an appropriate benchmark index. For the period, the total annual management fee rate, including the performance adjustment, was .75% of the Fund's average net assets.
Annual Report
6. Fees and Other Transactions with Affiliates - continued
Distribution and Service Plan Fees. In accordance with Rule 12b-1 of the 1940 Act, the Fund has adopted separate Distribution and Service Plans for each class of shares. Certain classes pay Fidelity Distributors Corporation (FDC), an affiliate of FMR, separate Distribution and Service Fees, each of which is based on an annual percentage of each class' average net assets. In addition, FDC may pay financial intermediaries for selling shares of the Fund and providing shareholder support services. For the period, the Distribution and Service Fee rates, total fees and amounts retained by FDC were as follows:
| Distribution
Fee | Service
Fee | Total
Fees | Retained
by FDC |
Class A | -% | .25% | $ 1,036 | $ 43 |
Class T | .25% | .25% | 447 | -* |
Class B | .75% | .25% | 156 | 117 |
Class C | .75% | .25% | 445 | 40 |
| | | $ 2,084 | $ 200 |
* Amount represents four hundred sixty dollars.
Sales Load. FDC receives a front-end sales charge of up to 5.75% for selling Class A shares, and 3.50% for selling Class T shares, some of which is paid to financial intermediaries for selling shares of the Fund. FDC receives the proceeds of contingent deferred sales charges levied on Class A, Class T, Class B, and Class C redemptions. These charges depend on the holding period. The deferred sales charges range from 5% to 1% for Class B, 1% for Class C, 1.00% for certain purchases of Class A shares (1.00% to .50% prior to July 12, 2010) and .25% for certain purchases of Class T shares.
For the period, sales charge amounts retained by FDC were as follows:
| Retained
by FDC |
Class A | $ 65 |
Class T | 12 |
Class B* | 31 |
Class C* | 2 |
| $ 110 |
* When Class B and Class C shares are initially sold, FDC pays commissions from its own resources to financial intermediaries through which the sales are made.
Transfer Agent Fees. Fidelity Investments Institutional Operations Company, Inc. (FIIOC), an affiliate of FMR, is the transfer, dividend disbursing and shareholder servicing agent for each class of the Fund. FIIOC receives account fees and asset-based fees that vary according to the account size and type of account of the shareholders of the respective classes of the Fund, except for Class K. FIIOC receives an asset-based fee of Class K's average net assets. FIIOC pays for typesetting, printing and mailing of
Annual Report
Notes to Financial Statements - continued
(Amounts in thousands except ratios)
6. Fees and Other Transactions with Affiliates - continued
Transfer Agent Fees - continued
shareholder reports, except proxy statements. For the period, transfer agent fees for each class were as follows:
| Amount | % of
Average
Net Assets |
Class A | $ 1,216 | .29 |
Class T | 281 | .31 |
Class B | 52 | .33 |
Class C | 136 | .31 |
International Discovery | 20,622 | .26 |
Class K | 437 | .05 |
Institutional Class | 627 | .20 |
| $ 23,371 | |
Accounting and Security Lending Fees. Fidelity Service Company, Inc. (FSC), an affiliate of FMR, maintains the Fund's accounting records. The accounting fee is based on the level of average net assets for the month. Under a separate contract, FSC administers the security lending program. The security lending fee is based on the number and duration of lending transactions.
Brokerage Commissions. The Fund placed a portion of its portfolio transactions with brokerage firms which are affiliates of the investment adviser. The commissions paid to these affiliated firms were $10 for the period.
Interfund Lending Program. Pursuant to an Exemptive Order issued by the SEC, the Fund, along with other registered investment companies having management contracts with FMR, may participate in an interfund lending program. This program provides an alternative credit facility allowing the funds to borrow from, or lend money to, other participating affiliated funds. At period end there was no interfund loans outstanding. The Fund's activity in this program during the period for which loans were outstanding was as follows:
Borrower or Lender | Average Daily
Loan Balance | Weighted Average
Interest Rate | Interest
Expense |
Borrower | $ 31,133 | .45% | $ 12 |
Annual Report
7. Committed Line of Credit.
The Fund participates with other funds managed by FMR or an affiliate in a $3.75 billion credit facility (the "line of credit") to be utilized for temporary or emergency purposes to fund shareholder redemptions or for other short-term liquidity purposes. The Fund has agreed to pay commitment fees on its pro-rata portion of the line of credit, which amounted to $38 and is reflected in Miscellaneous expenses on the Statement of Operations. During the period, there were no borrowings on this line of credit.
8. Security Lending.
The Fund lends portfolio securities through a lending agent from time to time in order to earn additional income. The lending agent may loan securities to certain qualified borrowers, including Fidelity Capital Markets (FCM), a broker-dealer affiliated with the Fund. On the settlement date of the loan, the Fund receives collateral (in the form of U.S. Treasury obligations, letters of credit and/or cash) against the loaned securities and maintains collateral in an amount not less than 100% of the market value of the loaned securities during the period of the loan. The market value of the loaned securities is determined at the close of business of the Fund and any additional required collateral is delivered to the Fund on the next business day. If the borrower defaults on its obligation to return the securities loaned because of insolvency or other reasons, a fund could experience delays and costs in recovering the securities loaned or in gaining access to the collateral. Any cash collateral received is invested in the Fidelity Securities Lending Cash Central Fund. The value of loaned securities and cash collateral at period end are disclosed on the Fund's Statement of Assets and Liabilities. Security lending income represents the income earned on investing cash collateral, less rebates paid to borrowers and lending agent fees associated with the loan, plus any premium payments received for lending certain types of securities. Security lending income is presented in the Statement of Operations as a component of income from Fidelity Central Funds. Total security lending income during the period amounted to $6,155. During the period, there were no securities loaned to FCM.
9. Bank Borrowings.
The Fund is permitted to have bank borrowings for temporary or emergency purposes to fund shareholder redemptions. The Fund has established borrowing arrangements with certain banks. The interest rate on the borrowings is the bank's base rate, as revised from time to time. The average daily loan balance during the period for which loans were outstanding amounted to $8,212. The weighted average interest rate was .71%. The interest expense amounted to one hundred sixty-two dollars under the bank borrowing program. At period end, there were no bank borrowings outstanding.
Annual Report
Notes to Financial Statements - continued
(Amounts in thousands except ratios)
10. Expense Reductions.
Many of the brokers with whom FMR places trades on behalf of the Fund provided services to the Fund in addition to trade execution. These services included payments of certain expenses on behalf of the Fund totaling $4,562 for the period.
11. Distributions to Shareholders.
Distributions to shareholders of each class were as follows:
Years ended October 31, | 2010 | 2009 |
From net investment income | | |
Class A | $ 3,889 | $ 3,982 |
Class T | 633 | 533 |
Class B | 37 | - |
Class C | 71 | 30 |
International Discovery | 98,508 | 96,783 |
Class K | 9,602 | 3,616 |
Institutional Class | 3,682 | 2,761 |
Total | $ 116,422 | $ 107,705 |
From net realized gain | | |
Class A | $ 555 | $ - |
Class T | 119 | - |
Class B | 23 | - |
Class C | 61 | - |
International Discovery | 11,290 | - |
Class K | 935 | - |
Institutional Class | 391 | - |
Total | $ 13,374 | $ - |
12. Share Transactions.
Transactions for each class of shares were as follows:
| Shares | Dollars |
Years ended October 31, | 2010 | 2009A | 2010 | 2009A |
Class A | | | | |
Shares sold | 4,849 | 5,354 | $ 142,203 | $ 128,318 |
Reinvestment of distributions | 120 | 132 | 3,654 | 2,786 |
Shares redeemed | (7,259) | (7,017) | (215,574) | (163,223) |
Net increase (decrease) | (2,290) | (1,531) | $ (69,717) | $ (32,119) |
Annual Report
12. Share Transactions - continued
| Shares | Dollars |
Years ended October 31, | 2010 | 2009A | 2010 | 2009A |
Class T | | | | |
Shares sold | 1,165 | 1,335 | $ 34,154 | $ 31,263 |
Reinvestment of distributions | 24 | 24 | 716 | 507 |
Shares redeemed | (1,228) | (1,140) | (35,631) | (25,765) |
Net increase (decrease) | (39) | 219 | $ (761) | $ 6,005 |
Class B | | | | |
Shares sold | 105 | 161 | $ 3,047 | $ 3,835 |
Reinvestment of distributions | 2 | - | 54 | - |
Shares redeemed | (227) | (227) | (6,544) | (5,155) |
Net increase (decrease) | (120) | (66) | $ (3,443) | $ (1,320) |
Class C | | | | |
Shares sold | 356 | 920 | $ 10,567 | $ 20,539 |
Reinvestment of distributions | 4 | 1 | 116 | 26 |
Shares redeemed | (515) | (953) | (14,926) | (22,201) |
Net increase (decrease) | (155) | (32) | $ (4,243) | $ (1,636) |
International Discovery | | | | |
Shares sold | 55,460 | 74,803 | $ 1,640,231 | $ 1,831,653 |
Conversion to Class K | - | (12,549) | - | (279,461) |
Reinvestment of distributions | 3,453 | 4,362 | 105,461 | 92,471 |
Shares redeemed | (89,239) | (77,871) | (2,636,183) | (1,831,786) |
Net increase (decrease) | (30,326) | (11,255) | $ (890,491) | $ (187,123) |
Class K | | | | |
Shares sold | 16,961 | 10,015 | $ 491,304 | $ 246,074 |
Conversion from International Discovery | - | 12,572 | - | 279,461 |
Reinvestment of distributions | 346 | 171 | 10,537 | 3,616 |
Shares redeemed | (7,377) | (5,401) | (215,813) | (128,754) |
Net increase (decrease) | 9,930 | 17,357 | $ 286,028 | $ 400,397 |
Institutional Class | | | | |
Shares sold | 4,322 | 10,440 | $ 127,580 | $ 235,326 |
Reinvestment of distributions | 36 | 41 | 1,083 | 875 |
Shares redeemed | (3,773) | (7,843) | (108,068) | (169,915) |
Net increase (decrease) | 585 | 2,638 | $ 20,595 | $ 66,286 |
A Conversion transactions for Class K and International Discovery are for the period November 1, 2008 though August 31, 2009.
Annual Report
Notes to Financial Statements - continued
(Amounts in thousands except ratios)
13. Other.
The Fund's organizational documents provide former and current trustees and officers with a limited indemnification against liabilities arising in connection with the performance of their duties to the Fund. In the normal course of business, the Fund may also enter into contracts that provide general indemnifications. The Fund's maximum exposure under these arrangements is unknown as this would be dependent on future claims that may be made against the Fund. The risk of material loss from such claims is considered remote.
Annual Report
To the Trustees of Fidelity Investment Trust and the Shareholders of Fidelity International Discovery Fund:
In our opinion, the accompanying statement of assets and liabilities, including the schedule of investments, and the related statements of operations and of changes in net assets and the financial highlights present fairly, in all material respects, the financial position of Fidelity International Discovery Fund (a fund of Fidelity Investment Trust) at October 31, 2010, the results of its operations for the year then ended, the changes in its net assets for each of the two years in the period then ended and the financial highlights for each of the five years in the period then ended, in conformity with accounting principles generally accepted in the United States of America. These financial statements and financial highlights (hereafter referred to as "financial statements") are the responsibility of the Fidelity International Discovery Fund's management. Our responsibility is to express an opinion on these financial statements based on our audits. We conducted our audits of these financial statements in accordance with the standards of the Public Company Accounting Oversight Board (United States). Those standards require that we plan and perform the audit to obtain reasonable assurance about whether the financial statements are free of material misstatement. An audit includes examining, on a test basis, evidence supporting the amounts and disclosures in the financial statements, assessing the accounting principles used and significant estimates made by management, and evaluating the overall financial statement presentation. We believe that our audits, which included confirmation of securities at October 31, 2010 by correspondence with the custodian and brokers, provide a reasonable basis for our opinion.
/s/ PricewaterhouseCoopers LLP
PricewaterhouseCoopers LLP
Boston, Massachusetts
December 17, 2010
Annual Report
The Trustees, Member of the Advisory Board, and executive officers of the trust and fund, as applicable, are listed below. The Board of Trustees governs the fund and is responsible for protecting the interests of shareholders. The Trustees are experienced executives who meet periodically throughout the year to oversee the fund's activities, review contractual arrangements with companies that provide services to the fund, oversee management of the risks associated with such activities and contractual arrangements, and review the fund's performance. Except for James C. Curvey, each of the Trustees oversees 221 funds advised by FMR or an affiliate. Mr. Curvey oversees 410 funds advised by FMR or an affiliate.
The Trustees hold office without limit in time except that (a) any Trustee may resign; (b) any Trustee may be removed by written instrument, signed by at least two-thirds of the number of Trustees prior to such removal; (c) any Trustee who requests to be retired or who has become incapacitated by illness or injury may be retired by written instrument signed by a majority of the other Trustees; and (d) any Trustee may be removed at any special meeting of shareholders by a two-thirds vote of the outstanding voting securities of the trust. Each Trustee who is not an interested person (as defined in the 1940 Act) (Independent Trustee), shall retire not later than the last day of the calendar year in which his or her 72nd birthday occurs. The Independent Trustees may waive this mandatory retirement age policy with respect to individual Trustees. The executive officers and Advisory Board Member hold office without limit in time, except that any officer and Advisory Board Member may resign or may be removed by a vote of a majority of the Trustees at any regular meeting or any special meeting of the Trustees. Except as indicated, each individual has held the office shown or other offices in the same company for the past five years.
Experience, Skills, Attributes, and Qualifications of the Fund's Trustees. The Governance and Nominating Committee has adopted a statement of policy that describes the experience, qualifications, attributes, and skills that are necessary and desirable for potential Independent Trustee candidates (Statement of Policy). The Board believes that each Trustee satisfied at the time he or she was initially elected or appointed a Trustee, and continues to satisfy, the standards contemplated by the Statement of Policy. The Governance and Nominating Committee also engages professional search firms to help identify potential Independent Trustee candidates who have the experience, qualifications, attributes, and skills consistent with the Statement of Policy. From time to time, additional criteria based on the composition and skills of the current Independent Trustees, as well as experience or skills that may be appropriate in light of future changes to board composition, business conditions, and regulatory or other developments, have also been considered by the professional search firms and the Governance and Nominating Committee. In addition, the Board takes into account the Trustees' commitment and participation in Board and committee meetings, as well as their leadership of standing and ad hoc committees throughout their tenure.
In determining that a particular Trustee was and continues to be qualified to serve as a Trustee, the Board has considered a variety of criteria, none of which, in isolation, was controlling. The Board believes that, collectively, the Trustees have balanced and diverse experience, qualifications, attributes, and skills, which allow the Board to operate effectively in governing the fund and protecting the interests of shareholders. Information about the specific experience, skills, attributes, and qualifications of each Trustee, which in each case led to the Board's conclusion that the Trustee should serve (or continue to serve) as a trustee of the fund, is provided below.
Annual Report
Trustees and Officers - continued
Board Structure and Oversight Function. Edward C. Johnson 3d is an interested person (as defined in the 1940 Act) and currently serves as Chairman. The Trustees have determined that an interested Chairman is appropriate and benefits shareholders because an interested Chairman has a personal and professional stake in the quality and continuity of services provided to the fund. Independent Trustees exercise their informed business judgment to appoint an individual of their choosing to serve as Chairman, regardless of whether the Trustee happens to be independent or a member of management. The Independent Trustees have determined that they can act independently and effectively without having an Independent Trustee serve as Chairman and that a key structural component for assuring that they are in a position to do so is for the Independent Trustees to constitute a substantial majority for the Board. The Independent Trustees also regularly meet in executive session. Ned C. Lautenbach serves as Chairman of the Independent Trustees and as such (i) acts as a liaison between the Independent Trustees and management with respect to matters important to the Independent Trustees and (ii) with management prepares agendas for Board meetings.
Fidelity funds are overseen by different Boards of Trustees. The fund's Board oversees Fidelity's equity and high income funds and another Board oversees Fidelity's investment-grade bond, money market, and asset allocation funds. The asset allocation funds may invest in Fidelity funds overseen by the fund's Board. The use of separate Boards, each with its own committee structure, allows the Trustees of each group of Fidelity funds to focus on the unique issues of the funds they oversee, including common research, investment, and operational issues. On occasion, the separate Boards establish joint committees to address issues of overlapping consequences for the Fidelity funds overseen by each Board.
The Trustees operate using a system of committees to facilitate the timely and efficient consideration of all matters of importance to the Trustees, the fund, and fund shareholders and to facilitate compliance with legal and regulatory requirements and oversight of the fund's activities and associated risks. The Board, acting through its committees, has charged FMR and its affiliates with (i) identifying events or circumstances the occurrence of which could have demonstrably adverse effects on the fund's business and/or reputation; (ii) implementing processes and controls to lessen the possibility that such events or circumstances occur or to mitigate the effects of such events or circumstances if they do occur; and (iii) creating and maintaining a system designed to evaluate continuously business and market conditions in order to facilitate the identification and implementation processes described in (i) and (ii) above. Because the day-to-day operations and activities of the fund are carried out by or through FMR, its affiliates and other service providers, the fund's exposure to risks is mitigated but not eliminated by the processes overseen by the Trustees. While each of the Board's committees has responsibility for overseeing different aspects of the fund's activities, oversight is exercised primarily through the Operations, Audit, and Compliance Committees. Appropriate personnel, including but not limited to the fund's Chief Compliance Officer (CCO), FMR's internal auditor, the independent accountants, the fund's Treasurer and portfolio management personnel, make periodic reports to the Board's committees, as appropriate. The responsibilities of each committee, including their oversight responsibilities, are described further under "Standing Committees of the Fund's Trustees."
Annual Report
The fund's Statement of Additional Information (SAI) includes more information about the Trustees. To request a free copy, call Fidelity at 1-877-208-0098.
Interested Trustees*:
Correspondence intended for each Trustee who is an interested person may be sent to Fidelity Investments, 82 Devonshire Street, Boston, Massachusetts 02109.
Name, Age; Principal Occupations and Other Relevant Experience+ |
Edward C. Johnson 3d (80) |
| Year of Election or Appointment: 1984 Mr. Johnson is Trustee and Chairman of the Board of Trustees of certain Trusts. Mr. Johnson serves as Chief Executive Officer, Chairman, and a Director of FMR LLC; Chairman and a Director of FMR; Chairman and a Director of Fidelity Research & Analysis Company (FRAC); Chairman and a Director of Fidelity Investments Money Management, Inc.; and Chairman and a Director of FMR Co., Inc. In addition, Mr. Johnson serves as Chairman and Director of FIL Limited. Previously, Mr. Johnson served as President of FMR LLC (2006-2007). |
James C. Curvey (75) |
| Year of Election or Appointment: 2007 Mr. Curvey also serves as Trustee (2007-present) of other investment companies advised by FMR. Mr. Curvey is a Director of Fidelity Investments Money Management, Inc. (2009-present), Director of Fidelity Research & Analysis Co. (2009-present) and Director of FMR and FMR Co., Inc. (2007-present). Mr. Curvey is also Vice Chairman (2007-present) and Director of FMR LLC. In addition, Mr. Curvey serves as an Overseer for the Boston Symphony Orchestra and a member of the Trustees of Villanova University. Previously, Mr. Curvey was the Vice Chairman (2006-2007) and Director (2000-2007) of FMR Corp. |
Annual Report
Trustees and Officers - continued
* Trustees have been determined to be "Interested Trustees" by virtue of, among other things, their affiliation with the trust or various entities under common control with FMR.
+ The information above includes each Trustee's principal occupation during the last five years and other information relating to the experience, attributes, and skills relevant to each Trustee's qualifications to serve as a Trustee, which led to the conclusion that each Trustee should serve as a Trustee for the fund.
Independent Trustees:
Correspondence intended for each Independent Trustee (that is, the Trustees other than the Interested Trustees) may be sent to Fidelity Investments, P.O. Box 55235, Boston, Massachusetts 02205-5235.
Name, Age; Principal Occupations and Other Relevant Experience+ |
Dennis J. Dirks (62) |
| Year of Election or Appointment: 2005 Prior to his retirement in May 2003, Mr. Dirks was Chief Operating Officer and a member of the Board of The Depository Trust & Clearing Corporation (DTCC). He also served as President, Chief Operating Officer, and Board member of The Depository Trust Company (DTC) and President and Board member of the National Securities Clearing Corporation (NSCC). In addition, Mr. Dirks served as Chief Executive Officer and Board member of the Government Securities Clearing Corporation, Chief Executive Officer and Board member of the Mortgage-Backed Securities Clearing Corporation, as a Trustee and a member of the Finance Committee of Manhattan College (2005-2008), and as a Trustee and a member of the Finance Committee of AHRC of Nassau County (2006-2008). Mr. Dirks is a member of the Independent Directors Council (IDC) Governing Council (2010-Present) and Board of Directors for The Brookville Center for Children's Services, Inc. (2009-present). |
Alan J. Lacy (57) |
| Year of Election or Appointment: 2008 Mr. Lacy serves as Senior Adviser (2007-present) of Oak Hill Capital Partners, L.P. (private equity). Mr. Lacy also served as Chief Executive Officer (2000-2005) and Vice Chairman (2005-2006) of Sears Holdings Corporation and Sears, Roebuck and Co. (retail). In addition, Mr. Lacy serves as a member of the Board of Directors of The Western Union Company (global money transfer, 2006-present) and Bristol-Myers Squibb Company (global pharmaceuticals, 2007-present). Mr. Lacy is Chairman (2008-present) and a member (2006-present) of the Board of Trustees of The National Parks Conservation Association. |
Ned C. Lautenbach (66) |
| Year of Election or Appointment: 2000 Mr. Lautenbach is Chairman of the Independent Trustees of the Equity and High Income Funds (2006-present). Mr. Lautenbach currently serves as the Lead Director of the Eaton Corporation Board of Directors (diversified industrial, 1997-present). Mr. Lautenbach is also a member of the Board of Directors of the Philharmonic Center for the Arts in Naples, Florida (1999-present); a member of the Board of Trustees of Fairfield University (2005-present); and a member of the Council on Foreign Relations (1994-present). Previously, Mr. Lautenbach was a Partner/Advisory Partner at Clayton, Dubilier & Rice, Inc. (private equity investment, 1998-2010), as well as a Director of Sony Corporation (2006-2007). |
Joseph Mauriello (66) |
| Year of Election or Appointment: 2008 Prior to his retirement in January 2006, Mr. Mauriello served in numerous senior management positions including Deputy Chairman and Chief Operating Officer (2004-2005), and Vice Chairman of Financial Services (2002-2004) of KPMG LLP US (professional services, 1965-2005). Mr. Mauriello currently serves as a member of the Board of Directors of XL Group plc. (global insurance and re-insurance, 2006-present) and of Arcadia Resources Inc. (health care services and products, 2007-present). Previously, Mr. Mauriello served as a Director of the Hamilton Funds of the Bank of New York (2006-2007). |
Cornelia M. Small (66) |
| Year of Election or Appointment: 2005 Ms. Small is a member of the Board of Directors of the Teagle Foundation (2009-present). Ms. Small is also a member of the Investment Committee, and Chair (2008-present) and a member of the Board of Trustees of Smith College. In addition, Ms. Small serves on the Investment Committee of the Berkshire Taconic Community Foundation (2008-present). Previously, Ms. Small served as Chairperson of the Investment Committee (2002- 2008) of Smith College. In addition, Ms. Small served as Chief Investment Officer, Director of Global Equity Investments, and a member of the Board of Directors of Scudder, Stevens & Clark and Scudder Kemper Investments. |
William S. Stavropoulos (71) |
| Year of Election or Appointment: 2001 Mr. Stavropoulos is Vice Chairman of the Independent Trustees of the Equity and High Income Funds (2006-present). Mr. Stavropoulos serves as President and Founder of the Michigan Baseball Foundation, the Great Lakes Loons (2007-present). Mr. Stavropoulos is Chairman Emeritus of the Board of Directors of The Dow Chemical Company, where he previously served in numerous senior management positions, including President, CEO (1995-2000; 2002-2004), Chairman of the Executive Committee (2000-2006), and as a member of the Board of Directors (1990-2006). Currently, Mr. Stavropoulos is Chairman of Univar (global distributor of commodity and specialty chemicals, 2010-present), a Director of Teradata Corporation (data warehousing and technology solutions, 2008-present), Chemical Financial Corporation, Maersk Inc. (industrial conglomerate), Tyco International, Inc. (multinational manufacturing and services, 2007-present), and a member of the Advisory Board for Metalmark Capital (private equity investment, 2005-present). Mr. Stavropoulos is a special advisor to Clayton, Dubilier & Rice, Inc. (private equity investment). In addition, Mr. Stavropoulos is a member of the University of Notre Dame Advisory Council for the College of Science. |
David M. Thomas (61) |
| Year of Election or Appointment: 2008 Previously, Mr. Thomas served as Executive Chairman (2005-2006) and Chairman and Chief Executive Officer (2000-2005) of IMS Health, Inc. (pharmaceutical and healthcare information solutions). In addition, Mr. Thomas serves as a member of the Board of Directors of Fortune Brands, Inc. (consumer products), and Interpublic Group of Companies, Inc. (marketing communication, 2004-present). |
Michael E. Wiley (60) |
| Year of Election or Appointment: 2008 Mr. Wiley also serves as a Director of Asia Pacific Exploration Consolidated (international oil and gas exploration and production, 2008-
present). Mr. Wiley serves as a Director of Tesoro Corporation (independent oil refiner and marketer, 2005-present), and a Director of Bill Barrett Corporation (exploration and production, 2005-present). In addition, Mr. Wiley also serves as a Director of Post Oak Bank (privately-held bank, 2004-present). Previously, Mr. Wiley served as a member of the Board of Trustees of the University of Tulsa (2000-2006; 2007-2010), as a Senior Energy Advisor of Katzenbach Partners, LLC (consulting, 2006-2007), as an Advisory Director of Riverstone Holdings (private investment), Chairman, President, and CEO of Baker Hughes, Inc. (oilfield services, 2000-2004), and as Director of Spinnaker Exploration Company (exploration and production, 2001-2005). |
Annual Report
+ The information above includes each Trustee's principal occupation during the last five years and other information relating to the experience, attributes, and skills relevant to each Trustee's qualifications to serve as a Trustee, which led to the conclusion that each Trustee should serve as a Trustee for the fund.
Advisory Board Member and Executive Officers:
Correspondence intended for each executive officer and Peter S. Lynch may be sent to Fidelity Investments, 82 Devonshire Street, Boston, Massachusetts 02109.
Name, Age; Principal Occupation |
Peter S. Lynch (66) |
| Year of Election or Appointment: 2003 Member of the Advisory Board of Fidelity's Equity and High Income Funds. Mr. Lynch is Vice Chairman and a Director of FMR and FMR Co., Inc. In addition, Mr. Lynch serves as a Trustee of Boston College and as the Chairman of the Inner-City Scholarship Fund. Previously, Mr. Lynch served on the Special Olympics International Board of Directors (1997-2006). |
Kenneth B. Robins (41) |
| Year of Election or Appointment: 2008 President and Treasurer of Fidelity's Equity and High Income Funds. Mr. Robins also serves as President and Treasurer (2010-present) and Assistant Treasurer (2009-present) of other Fidelity funds and is an employee of Fidelity Investments (2004-present). Previously, Mr. Robins served as Deputy Treasurer of the Fidelity funds (2005-2008) and Treasurer and Chief Financial Officer of The North Carolina Capital Management Trust: Cash and Term Portfolios (2006-2008). |
Bruce T. Herring (45) |
| Year of Election or Appointment: 2006 Vice President of certain Equity Funds. Mr. Herring also serves as Chief Investment Officer and Director of Fidelity Management & Research (U.K.) Inc. (2010-present) and Group Chief Investments Officer of FMR. Previously, Mr. Herring served as Vice President (2005-2006) and Senior Vice President (2006-2007) of Fidelity Management & Research Company, Vice President of FMR Co., Inc. (2001-2007) and as a portfolio manager for Fidelity U.S. Equity Funds. |
Brian B. Hogan (46) |
| Year of Election or Appointment: 2009 Vice President of certain Equity Funds and Vice President of Sector Funds. Mr. Hogan also serves as President of FMR's Equity Division (2009-present). Previously, Mr. Hogan served as Senior Vice President, Equity Research of FMR (2006-2009) and as a portfolio manager. |
Scott C. Goebel (42) |
| Year of Election or Appointment: 2008 Secretary and Chief Legal Officer (CLO) of the Fidelity funds. Mr. Goebel also serves as Secretary and CLO of The North Carolina Capital Management Trust: Cash and Term Portfolio (2008-present); General Counsel, Secretary, and Senior Vice President of FMR (2008-present) and FMR Co., Inc. (2008-present); Deputy General Counsel of FMR LLC; Chief Legal Officer of Fidelity Management & Research (Hong Kong) Limited (2008-present) and Assistant Secretary of Fidelity Management & Research (Japan) Inc. (2008-present), Fidelity Investments Money Management, Inc. (2008-present), Fidelity Management & Research (U.K.) Inc. (2008-present), and Fidelity Research and Analysis Company (2008- present). Previously, Mr. Goebel served as Assistant Secretary of the Funds (2007-2008) and as Vice President and Secretary of Fidelity Distributors Corporation (FDC) (2005-2007). |
William C. Coffey (41) |
| Year of Election or Appointment: 2009 Assistant Secretary of Fidelity's Equity and High Income Funds. Mr. Coffey also serves as Senior Vice President and Deputy General Counsel of FMR LLC (2010-present), and is an employee of Fidelity Investments. Previously, Mr. Coffey served as Vice President and Associate General Counsel of FMR LLC (2005-2009). |
Holly C. Laurent (56) |
| Year of Election or Appointment: 2008 Anti-Money Laundering (AML) Officer of the Fidelity funds. Ms. Laurent also serves as AML Officer of The North Carolina Capital Management Trust: Cash and Term Portfolio (2008-present) and is an employee of Fidelity Investments. Previously, Ms. Laurent was Senior Vice President and Head of Legal for Fidelity Business Services India Pvt. Ltd. (2006-2008), and Senior Vice President, Deputy General Counsel and Group Head for FMR LLC (2005-2006). |
Christine Reynolds (52) |
| Year of Election or Appointment: 2008 Chief Financial Officer of the Fidelity funds. Ms. Reynolds became President of Fidelity Pricing and Cash Management Services (FPCMS) in August 2008. Ms. Reynolds served as Chief Operating Officer of FPCMS (2007-2008). Previously, Ms. Reynolds served as President, Treasurer, and Anti-Money Laundering officer of the Fidelity funds (2004-2007). |
Kenneth A. Rathgeber (63) |
| Year of Election or Appointment: 2004 Chief Compliance Officer of Fidelity's Equity and High Income Funds. Mr. Rathgeber is Chief Compliance Officer of Fidelity Management & Research (Hong Kong) Limited (2008-present), Fidelity Management & Research (Japan) Inc. (2008-present), FMR (2005-present), FMR Co., Inc. (2005-present), Fidelity Management & Research (U.K.) Inc. (2005-present), Fidelity Research & Analysis Company (2005-present), Fidelity Investments Money Management, Inc. (2005-present), Pyramis Global Advisors, LLC (2005-present), and Strategic Advisers, Inc. (2005-present). |
Jeffrey S. Christian (49) |
| Year of Election or Appointment: 2009 Deputy Treasurer of the Fidelity funds. Mr. Christian is an employee of Fidelity Investments. Previously, Mr. Christian served as Chief Financial Officer (2008-2009) of certain Fidelity funds and Senior Vice President of Fidelity Pricing and Cash Management Services (FPCMS) (2004-2009). |
Bryan A. Mehrmann (49) |
| Year of Election or Appointment: 2005 Deputy Treasurer of the Fidelity funds. Mr. Mehrmann is an employee of Fidelity Investments. |
Adrien E. Deberghes (43) |
| Year of Election or Appointment: 2008 Deputy Treasurer of Fidelity's Equity and High Income Funds. Mr. Deberghes also serves as Assistant Treasurer of other Fidelity funds (2010-present) and is an employee of Fidelity Investments (2008-present). Previously, Mr. Deberghes served as Senior Vice President of Mutual Fund Administration at State Street Corporation (2007-2008), Senior Director of Mutual Fund Administration at Investors Bank & Trust (2005-2007), and Director of Finance for Dunkin' Brands (2000-2005). |
Stephanie J. Dorsey (41) |
| Year of Election or Appointment: 2010 Assistant Treasurer of Fidelity's Equity and High Income Funds. Ms. Dorsey also serves as Deputy Treasurer of other Fidelity funds (2008-present) and is an employee of Fidelity Investments (2008-present). Previously, Ms. Dorsey served as Treasurer (2004-2008) of the JPMorgan Mutual Funds and Vice President (2004-2008) of JPMorgan Chase Bank. |
John R. Hebble (52) |
| Year of Election or Appointment: 2009 Assistant Treasurer of Fidelity's Equity and High Income Funds. Mr. Hebble also serves as Treasurer and Chief Financial Officer of The North Carolina Capital Management Trust: Cash and Term Portfolio (2008-present), President and Treasurer of other Fidelity funds (2008-present) and is an employee of Fidelity Investments. |
Gary W. Ryan (52) |
| Year of Election or Appointment: 2005 Assistant Treasurer of the Fidelity funds. Mr. Ryan is an employee of Fidelity Investments. Previously, Mr. Ryan served as Vice President of Fund Reporting in Fidelity Pricing and Cash Management Services (FPCMS) (1999-2005). |
Jonathan Davis (42) |
| Year of Election or Appointment: 2010 Assistant Treasurer of the Fidelity funds. Mr. Davis is an employee of Fidelity Investments. Previously, Mr. Davis served as Vice President and Associate General Counsel of FMR LLC (2003-2010). |
Annual Report
The Board of Trustees of Fidelity International Discovery Fund voted to pay to shareholders of record at the opening of business on record date, the following distributions per share derived from capital gains realized from sales of portfolio securities, and dividends derived from net investment income:
| Pay Date | Record Date | Dividends | Capital Gains |
Class A | 12/06/10 | 12/03/10 | $0.32 | $0.155 |
Class T | 12/06/10 | 12/03/10 | $0.243 | $0.155 |
Class B | 12/06/10 | 12/03/10 | $0.055 | $0.155 |
Class C | 12/06/10 | 12/03/10 | $0.077 | $0.155 |
Class A, T, B and C designate 100% of the dividend distributed in December during the fiscal year as amounts which may be taken into account as a dividend for purposes of the maximum rate under section 1(h)(11) of the Internal Revenue Code.
The amounts per share which represent income derived from sources within, and taxes paid to, foreign countries or possessions of the United States are as follows:
| Pay Date | Income | Taxes |
Class A | 12/07/09 | $0.289 | $0.0296 |
Class T | 12/07/09 | $0.234 | $0.0296 |
Class B | 12/07/09 | $0.111 | $0.0296 |
Class C | 12/07/09 | $0.096 | $0.0296 |
The fund will notify shareholders in January 20101of amounts for use in preparing 2010 income tax returns.
Annual Report
Board Approval of Investment Advisory Contracts and Management Fees
Fidelity International Discovery Fund
Each year, the Board of Trustees, including the Independent Trustees (together, the Board), votes on the renewal of the management contract and sub-advisory agreements (together, the Advisory Contracts) for the fund. The Board, assisted by the advice of fund counsel and Independent Trustees' counsel, requests and considers a broad range of information relevant to the renewal of the Advisory Contracts throughout the year.
The Board meets regularly and considers at each of its meetings factors that are relevant to its annual consideration of the renewal of the fund's Advisory Contracts, including the services and support provided to the fund and its shareholders. The Board has established various standing committees, each composed of Independent Trustees with varying backgrounds, to which the Board has assigned specific subject matter responsibilities in order to enhance effective decision-making by the Board. The Board, acting directly and through its Committees, requests and receives information concerning the annual consideration of the renewal of the fund's Advisory Contracts. The Board also meets as needed to consider matters specifically related to the Board's annual consideration of the renewal of Advisory Contracts. Members of the Board may also meet with trustees of other Fidelity funds through ad hoc joint committees to discuss certain matters relevant to the Fidelity funds.
At its July 2010 meeting, the Board of Trustees, including the Independent Trustees, unanimously determined to renew the fund's Advisory Contracts. In reaching its determination, the Board considered all factors it believed relevant, including (i) the nature, extent, and quality of the services to be provided to the fund and its shareholders (including the investment performance of the fund); (ii) the competitiveness of the fund's management fee and total expenses; (iii) the total costs of the services to be provided by and the profits to be realized by Fidelity from its relationship with the fund; (iv) the extent to which economies of scale would be realized as the fund grows; and (v) whether fee levels reflect these economies of scale, if any, for the benefit of fund shareholders.
In considering whether to renew the Advisory Contracts for the fund, the Board reached a determination, with the assistance of fund counsel and Independent Trustees' counsel and through the exercise of its business judgment, that the renewal of the Advisory Contracts is in the best interests of fund shareholders and that the compensation to be received by Fidelity under the management contract is fair and reasonable. The Board's decision to renew the Advisory Contracts was not based on any single factor noted above, but rather was based on a comprehensive consideration of all the information provided to the Board at its meetings throughout the year. The Board, in reaching its determination to renew the Advisory Contracts, is aware that shareholders in the fund have a broad range of investment choices available to them, including a wide choice among mutual funds offered by Fidelity's competitors, and that the fund's shareholders, with the opportunity to review and weigh the disclosure provided by the fund in its prospectus and other public disclosures, have chosen to invest in this fund, managed by Fidelity.
Annual Report
Board Approval of Investment Advisory Contracts and
Management Fees - continued
Nature, Extent, and Quality of Services Provided. The Board considered the staffing within the investment adviser, FMR, and the sub-advisers (together, the Investment Advisers), including the backgrounds of the fund's investment personnel and the fund's investment objective and discipline. The Independent Trustees also had discussions with senior management of Fidelity's investment operations and investment groups. The Board considered the structure of the portfolio manager compensation program and whether this structure provides appropriate incentives to act in the best interest of the fund.
Resources Dedicated to Investment Management and Support Services. The Board and the equity research subcommittee of the Board's Fund Oversight Committee reviewed the size, education, and experience of the Investment Advisers' investment staff, their use of technology, and the Investment Advisers' approach to recruiting, training, and retaining portfolio managers and other research, advisory, and management personnel. The Board noted that Fidelity's analysts have access to a variety of technological tools and market and securities data that enable them to perform both fundamental and quantitative analysis and to specialize in various disciplines. The Board considered Fidelity's extensive global research capabilities that enable the Investment Advisers to aggregate data from various sources in an effort to produce positive investment results. The Board also considered that Fidelity's portfolio managers and analysts have access to daily portfolio attribution that allows for monitoring of a fund's portfolio, as well as an electronic communication system that provides immediate real-time access to research concerning issuers and credit enhancers. The Board noted FMR's continued focus on strengthening the organization and discipline of equity portfolio management and research.
Shareholder and Administrative Services. The Board considered (i) the nature, extent, quality, and cost of advisory, administrative, and shareholder services performed by the Investment Advisers and their affiliates under the Advisory Contracts and under separate agreements covering transfer agency, pricing and bookkeeping, and securities lending services for the fund; (ii) the nature and extent of the investment adviser's supervision of third party service providers, principally custodians and subcustodians; and (iii) the resources devoted to, and the record of compliance with, the fund's compliance policies and procedures. The Board also reviewed the allocation of fund brokerage, including allocations to brokers affiliated with the Investment Advisers, the use of brokerage commissions to pay fund expenses, and the use of "soft" commission dollars to pay for research services.
The Board noted that the growth of fund assets over time across the complex allows Fidelity to reinvest in the development of services designed to enhance the value or convenience of the Fidelity funds as investment vehicles. These services include 24-hour access to account information and market information through phone representatives and over the Internet, and investor education materials and asset allocation tools.
Annual Report
Investment in a Large Fund Family. The Board considered the benefits to shareholders of investing in a Fidelity fund, including the benefits of investing in a fund that is part of a large family of funds offering a variety of investment disciplines and providing a large variety of mutual fund investor services. The Board noted that Fidelity had taken, or had made recommendations that resulted in the Fidelity funds taking, a number of actions over the previous year that benefited particular funds, including (i) dedicating additional resources to investment research and restructuring and broadening the focus of the investment research teams; (ii) bolstering the senior management team that oversees asset management; (iii) launching Class F of certain funds as a lower-fee class available to Freedom K and Freedom Index Funds; (iv) lowering the initial investment minimums and ongoing balance requirements for Real Estate High Income Fund; (v) eliminating subsequent purchase minimums for all funds and adding a waiver of the investment minimum requirement for new accounts opened with the proceeds of a systematic withdrawal plan; (vi) eliminating the withdrawal minimum and maximum limits for systematic withdrawals from Advisor funds; (vii) expanding sales load waivers on Class A shares for Destiny Planholders and expanding Institutional Class eligibility for Class O Destiny Planholders; and (viii) changing certain Class A and Class T sales charge structures to further align them with industry practices.
Investment Performance. The Board considered whether the fund has operated in accordance with its investment objective, as well as its record of compliance with its investment restrictions. It also reviewed the fund's absolute investment performance for each class, as well as the fund's relative investment performance for each class measured over multiple periods against (i) a broad-based securities market index, and (ii) a peer group of mutual funds deemed appropriate by Fidelity and reviewed by the Board. The following charts considered by the Board show, over the one-, three-, and five-year periods ended December 31, 2009, as available, the cumulative total returns of Institutional Class (Class I) and the retail class of the fund, the cumulative total returns of a broad-based securities market index ("benchmark"), and a range of cumulative total returns of a peer group of mutual funds identified by Morningstar, Inc. as having an investment style similar to that of the fund based on underlying portfolio holdings. The returns of the retail class and Class B show the performance of the highest performing class (based on five-year performance) and the lowest performing class (based on three-year performance), respectively. The box within each chart shows the 25th percentile return (bottom of box) and the 75th percentile return (top of box) of the peer group. Returns shown above the box are in the first quartile and returns shown below the box are in the fourth quartile. The percentage beaten numbers noted below each chart correspond to the percentile box and represent the percentage of funds in the peer group whose performance was equal to or lower than that of the class indicated.
Annual Report
Board Approval of Investment Advisory Contracts and
Management Fees - continued
Fidelity International Discovery Fund

The Board reviewed the fund's relative investment performance against its peer group and noted that the performance of the retail class of the fund (the class with the longer performance record) was in the third quartile for the one-year period and the second quartile for the three- and five-year periods. The Board also noted that the investment performance of the retail class of the fund compared favorably to its benchmark for the three- and five-year periods, although the fund's one-year cumulative total return was lower than its benchmark. The Board considered that the variations in performance among the fund's classes reflect the variations in class expenses, which result in lower performance for higher expense classes. The Board also reviewed the fund's performance since inception as well as performance in the current year.
The Board also considered that the fund's management fee is subject to upward or downward adjustment depending upon whether, and to what extent, the fund's investment performance for the performance period exceeds, or is exceeded by, the record (over the same period) of a Board-approved performance adjustment index. The Board realizes that the performance adjustment provides FMR with a strong economic incentive to seek to achieve superior performance for the fund's shareholders and helps to more closely align the interests of FMR and the fund's shareholders.
Based on its review, and giving particular weight to the nature and quality of the resources dedicated by the Investment Advisers to maintain and improve relative performance and factoring in the unprecedented market events in recent years, the Board concluded that the nature, extent, and quality of investment management and support services and of shareholder and administrative services provided to the fund will benefit the fund's shareholders, particularly in light of the Board's view that the fund's shareholders benefit from investing in a fund that is part of a large family of funds offering a variety of investment disciplines and services.
Annual Report
Competitiveness of Management Fee and Total Fund Expenses. The Board considered the fund's management fee and total expenses compared to "mapped groups" of competitive funds and classes. Fidelity creates "mapped groups" by combining similar Lipper investment objective categories that have comparable management fee characteristics. Combining Lipper investment objective categories aids the Board's management fee and total expense comparisons by broadening the competitive group used for comparison and by reducing the number of universes to which various Fidelity funds are compared.
Management Fee. The Board considered two proprietary management fee comparisons for the 12-month periods shown in the chart below. The group of Lipper funds used by the Board for management fee comparisons is referred to below as the "Total Mapped Group." The Total Mapped Group comparison focuses on a fund's standing relative to the total universe of comparable funds available to investors, in terms of gross management fees before expense reimbursements or caps, and without giving effect to the fund's performance adjustment. "TMG %" represents the percentage of funds in the Total Mapped Group that had management fees that were lower than the fund's. For example, a TMG % of 15% means that 85% of the funds in the Total Mapped Group had higher management fees than the fund. The "Asset-Size Peer Group" (ASPG) comparison focuses on a fund's standing relative to non-Fidelity funds similar in size to the fund within the Total Mapped Group. The ASPG represents at least 15% of the funds in the Total Mapped Group with comparable asset size and management fee characteristics, subject to a minimum of 50 funds (or all funds in the Total Mapped Group if fewer than 50). Additional information, such as the ASPG quartile in which the fund's management fee ranked and the impact of the fund's performance adjustment, is also included in the chart and considered by the Board.
Annual Report
Board Approval of Investment Advisory Contracts and
Management Fees - continued
Fidelity International Discovery Fund

The Board noted that the fund's management fee ranked below the median of its Total Mapped Group and below the median of its ASPG for 2009. The Board also noted the effect of the fund's positive performance adjustment on the fund's management fee ranking. The Board noted that the performance adjustment for each year represents calculations for performance periods that differ from the periods shown in the performance charts above.
Based on its review, the Board concluded that the fund's management fee is fair and reasonable in light of the services that the fund receives and the other factors considered.
Total Expenses. In its review of each class's total expenses, the Board considered the fund's management fee as well as other fund or class expenses, as applicable, such as transfer agent fees, pricing and bookkeeping fees, fund-paid 12b-1 fees, and custodial, legal, and audit fees. The Board also noted the effects of any waivers and reimbursements on fees and expenses, as well as the impact of the fund's performance adjustment. As part of its review, the Board also considered current and historical total expenses of each class of the fund compared to competitive fund median expenses. Each class of the fund is compared to those funds and classes in the Total Mapped Group (used by the Board for management fee comparisons) that have a similar sales load structure.
The Board noted that the total expenses of each of Class A, Class B, Class C, Institutional Class, the retail class, and Class K ranked below its competitive median for 2009 and the total expenses of Class T ranked above its competitive median for 2009. The Board considered that the total expenses for Class T were above the median primarily because its 12b-1 fee is higher than the typical front-end load class. The Board noted that the fund offers multiple classes, each of which has a different sales load and 12b-1 fee structure, and that the multiple structures are intended to offer a range of pricing options for the intermediary market. The Board also noted that the total expenses of the classes vary primarily by the level of their 12b-1 fees, although differences in transfer agent fees may also cause expenses to vary from class to class.
Annual Report
Fees Charged to Other Fidelity Clients. The Board also considered Fidelity fee structures and other information with respect to clients of FMR and its affiliates, such as other mutual funds advised or subadvised by FMR or its affiliates, pension plan clients, and other institutional clients. In March 2010, the Board created an ad hoc joint committee with the board of other Fidelity funds (the Committee) to review and compare Fidelity's institutional investment advisory business with its business of providing services to the Fidelity funds, including the differences in services provided, fees charged, and costs incurred, as well as competition in their respective marketplaces.
Based on its review of total expenses and fees charged to other Fidelity clients, the Board concluded that the total expenses of each class of the fund were reasonable, although in one case above the median of the universe presented for comparison, in light of the services that the fund and its shareholders receive and the other factors considered, including the findings of the Committee.
Costs of the Services and Profitability. The Board considered the revenues earned and the expenses incurred by Fidelity in conducting the business of developing, marketing, distributing, managing, administering and servicing the fund and its shareholders. The Board also considered the level of Fidelity's profits in respect of all the Fidelity funds.
On an annual basis, FMR presents to the Board Fidelity's profitability for the fund. Fidelity calculates the profitability for each fund, as well as aggregate profitability for groups of Fidelity funds and all Fidelity funds, using a series of detailed revenue and cost allocation methodologies which originate with the audited books and records of Fidelity. The Audit Committee of the Board reviews any significant changes from the prior year's methodologies.
PricewaterhouseCoopers LLP (PwC), independent registered public accounting firm and auditor to Fidelity and certain Fidelity funds, has been engaged annually by the Board as part of the Board's assessment of Fidelity's profitability analysis. PwC's engagement includes the review and assessment of Fidelity's methodologies used in determining the revenues and expenses attributable to Fidelity's mutual fund business, and completion of agreed-upon procedures surrounding the mathematical accuracy of fund profitability and its conformity to allocation methodologies. After considering PwC's reports issued under the engagement and information provided by Fidelity, the Board believes that while other allocation methods may also be reasonable, Fidelity's profitability methodologies are reasonable in all material respects.
Annual Report
Board Approval of Investment Advisory Contracts and
Management Fees - continued
The Board has also reviewed Fidelity's non-fund businesses and fall-out benefits related to the mutual fund business as well as cases where Fidelity's affiliates may benefit from or be related to the fund's business.
The Board considered the costs of the services provided by and the profits realized by Fidelity in connection with the operation of the fund and were satisfied that the profitability was not excessive in the circumstances.
Economies of Scale. The Board considered whether there have been economies of scale in respect of the management of the Fidelity funds, whether the Fidelity funds (including the fund) have appropriately benefited from any such economies of scale, and whether there is potential for realization of any further economies of scale. The Board considered the extent to which the fund will benefit from economies of scale through increased services to the fund, through waivers or reimbursements, or through fee or expense reductions.
In February 2009, the Board and the board of other Fidelity funds created an ad hoc committee (the Economies of Scale Committee) to analyze whether FMR attains economies of scale in respect of the management and servicing of the Fidelity funds, whether the Fidelity funds have appropriately benefited from such economies of scale, and whether there is potential for realization of any further economies of scale.
The Board recognized that the fund's management contract incorporates a "group fee" structure, which provides for lower group fee rates as total fund assets under FMR's management increase, and for higher group fee rates as total fund assets under FMR's management decrease. FMR calculates the group fee rates based on a tiered asset "breakpoint" schedule that varies based on asset class. The Board considered that the group fee is designed to deliver the benefits of economies of scale to fund shareholders when total Fidelity fund assets increase, even if assets of any particular fund are unchanged or have declined, because some portion of Fidelity's costs are attributable to services provided to all Fidelity funds, and all funds benefit if those costs can be allocated among more assets. The Board concluded that, given the group fee structure, fund shareholders will benefit from lower management fees as assets under FMR's management increase at the fund complex level, regardless of whether Fidelity achieves any such economies of scale.
The Board concluded, considering the findings of the Economies of Scale Committee, that any potential economies of scale are being appropriately shared between fund shareholders and Fidelity.
Additional Information Requested by the Board. In order to develop fully the factual basis for consideration of the Fidelity funds' Advisory Contracts, the Board requested and received additional information on certain topics, including (i) fund performance trends, actions to be taken by FMR to improve certain funds' overall performance, and Fidelity's long-term strategies for certain funds; (ii) portfolio manager changes that have occurred during the past year and length of portfolio manager tenure for different categories of funds over time; (iii) Fidelity's compensation structure for portfolio managers, research analysts, and other key personnel, the rationale for the compensation structure, and how the compensation structure provides appropriate performance incentives; (iv) the amount of the investment that each portfolio manager has made in the Fidelity fund(s) that he or she manages; (v) management and other fees paid by FMR to affiliated sub-advisers on behalf of the Fidelity funds; (vi) Fidelity's fee structures and rationale for recommending different fees among different categories of funds; (vii) Fidelity's rationale for recommending which funds should have a performance adjustment component as part of their management fees; (viii) the rationale for any differences between fund fee structures and fee structures in place for other Fidelity clients; and (ix) explanations regarding the relative total expenses borne by certain funds and classes, total expense competitive trends, and actions that might be taken by FMR to reduce total expenses for certain funds and classes.
Annual Report
Based on its evaluation of all of the conclusions noted above, and after considering all factors it believed relevant, the Board ultimately concluded that the advisory fee structures are fair and reasonable, and that the fund's Advisory Contracts should be renewed.
Annual Report
Investment Adviser
Fidelity Management & Research Company
Boston, MA
Investment Sub-Advisers
FMR Co., Inc.
Fidelity Management & Research
(U.K.) Inc.
Fidelity Research & Analysis Company
FIL Investment Advisors
FIL Investments (Japan) Limited
FIL Investment Advisors (U.K.) Limited
Fidelity Management & Research
(Hong Kong) Limited
Fidelity Management & Research
(Japan) Inc.
General Distributor
Fidelity Distributors Corporation
Boston, MA
Transfer and Service Agents
Fidelity Investments Institutional Operations Company, Inc.
Boston, MA
Fidelity Service Company, Inc.
Boston, MA
Custodian
The Northern Trust Company
Chicago, IL
AID-UANN-1210
1.806656.105
(Fidelity Investment logo)(registered trademark)
Fidelity AdvisorSM
International Discovery
Fund - Institutional Class
Annual Report
October 31, 2010
Institutional Class is
a class of Fidelity®
International Discovery Fund
(2_fidelity_logos) (Registered_Trademark)
Contents
Chairman's Message | <Click Here> | The Chairman's message to shareholders. |
Performance | <Click Here> | How the fund has done over time. |
Management's Discussion of Fund Performance | <Click Here> | The Portfolio Manager's review of fund performance and strategy. |
Shareholder Expense Example | <Click Here> | An example of shareholder expenses. |
Investment Changes | <Click Here> | A summary of major shifts in the fund's investments over the past six months. |
Investments | <Click Here> | A complete list of the fund's investments with their market values. |
Financial Statements | <Click Here> | Statements of assets and liabilities, operations, and changes in net assets, as well as financial highlights. |
Notes | <Click Here> | Notes to financial statements. |
Report of Independent Registered Public Accounting Firm | <Click Here> | |
Trustees and Officers | <Click Here> | |
Distributions | <Click Here> | |
Board Approval of Investment Advisory Contracts and Management Fees | <Click Here> | |
To view a fund's proxy voting guidelines and proxy voting record for the 12-month period ended June 30, visit http://www.fidelity.com/proxyvotingresults or visit the Securities and Exchange Commission's (SEC) web site at http://www.sec.gov. You may also call 1-877-208-0098 to request a free copy of the proxy voting guidelines.
Standard & Poor's, S&P and S&P 500 are registered service marks of The McGraw-Hill Companies, Inc. and have been licensed for use by Fidelity Distributors Corporation.
Other third party marks appearing herein are the property of their respective owners.
All other marks appearing herein are registered or unregistered trademarks or service marks of FMR LLC or an affiliated company.
Annual Report
This report and the financial statements contained herein are submitted for the general information of the shareholders of the fund. This report is not authorized for distribution to prospective investors in the fund unless preceded or accompanied by an effective prospectus.
A fund files its complete schedule of portfolio holdings with the SEC for the first and third quarters of each fiscal year on Form N-Q. Forms N-Q are available on the SEC's web site at http://www.sec.gov. A fund's Forms N-Q may be reviewed and copied at the SEC's Public Reference Room in Washington, DC. Information regarding the operation of the SEC's Public Reference Room may be obtained by calling 1-800-SEC-0330. For a complete list of a fund's portfolio holdings, view the fund's most recent holdings listing, semiannual report, or annual report on Fidelity's web site at http://www.fidelity.com or http://www.advisor.fidelity.com, as applicable.
NOT FDIC INSURED • MAY LOSE VALUE • NO BANK GUARANTEE
Neither the fund nor Fidelity Distributors Corporation is a bank.
Annual Report
(photo_of_Edward_C_Johnson_3d)
Dear Shareholder:
Equities have staged a rally in the second half of 2010, shaking off concerns about the European debt crisis and the possibility of a double-dip recession in the U.S. Although the short-term surge pushed major equity indexes back into positive territory for the year, several questions remain about the longer-term outlook, including lackluster economic growth and persistently high unemployment. Financial markets are always unpredictable, of course, but there also are several time-tested investment principles that can help put the odds in your favor.
One of the basic tenets is to invest for the long term. Over time, riding out the markets' inevitable ups and downs has proven much more effective than selling into panic or chasing the hottest trend. Even missing only a few of the markets' best days can significantly diminish investor returns. Patience also affords the benefits of compounding - of earning interest on additional income or reinvested dividends and capital gains. There can be tax advantages and cost benefits to consider as well. While staying the course doesn't eliminate risk, it can considerably lessen the effect of short-term declines.
You can further manage your investing risk through diversification. And today, more than ever, geographic diversification should be taken into account. Studies indicate that asset allocation is the single most important determinant of a portfolio's long-term success. The right mix of stocks, bonds and cash - aligned to your particular risk tolerance and investment objective - is very important. Age-appropriate rebalancing is also an essential aspect of asset allocation. For younger investors, an emphasis on equities - which historically have been the best-performing asset class over time - is encouraged. As investors near their specific goal, such as retirement or sending a child to college, consideration may be given to replacing volatile assets (e.g. common stocks) with more-stable fixed investments (bonds or savings plans).
A third principle - investing regularly - can help lower the average cost of your purchases. Investing a certain amount of money each month or quarter helps ensure you won't pay for all your shares at market highs. This strategy - known as dollar cost averaging - also reduces "emotion" from investing, helping shareholders avoid selling weak performers just prior to an upswing, or chasing a hot performer just before a correction.
We invite you to contact us via the Internet, through our Investor Centers or by phone. It is our privilege to provide you the information you need to make the investments that are right for you.
Sincerely,
(The chairman's signature appears here.)
Edward C. Johnson 3d
Annual Report
Average annual total return reflects the change in the value of an investment, assuming reinvestment of the class' distributions from dividend income and capital gains (the profits earned upon the sale of securities that have grown in value, if any) and assuming a constant rate of performance each year. The $10,000 table and the fund's returns do not reflect the deduction of taxes that a shareholder would pay on fund distributions or the redemption of fund shares. During periods of reimbursement by Fidelity, a fund's total return will be greater than it would be had the reimbursement not occurred. How a fund did yesterday is no guarantee of how it will do tomorrow.
Average Annual Total Returns
Periods ended October 31, 2010 | Past 1
year | Past 5
years | Past 10 years |
Institutional Class A, B | 13.84% | 4.55% | 5.28% |
A The initial offering of Institutional Class shares took place on January 6, 2005. Returns prior to January 6, 2005 are those of Fidelity® International Discovery Fund, the original class of the fund.
B Prior to October 1, 2004, the fund operated under certain different investment policies. The fund's historical performance may not represent its current investment policies.
$10,000 Over 10 Years
Let's say hypothetically that $10,000 was invested in Fidelity AdvisorSM International Discovery Fund - Institutional Class on October 31, 2000. The chart shows how the value of your investment would have changed, and also shows how the MSCI® EAFE® (Europe, Australasia, Far East) Index performed over the same period. The initial offering of Institutional Class took place on January 6, 2005. See above for additional information regarding the performance of Institutional Class.
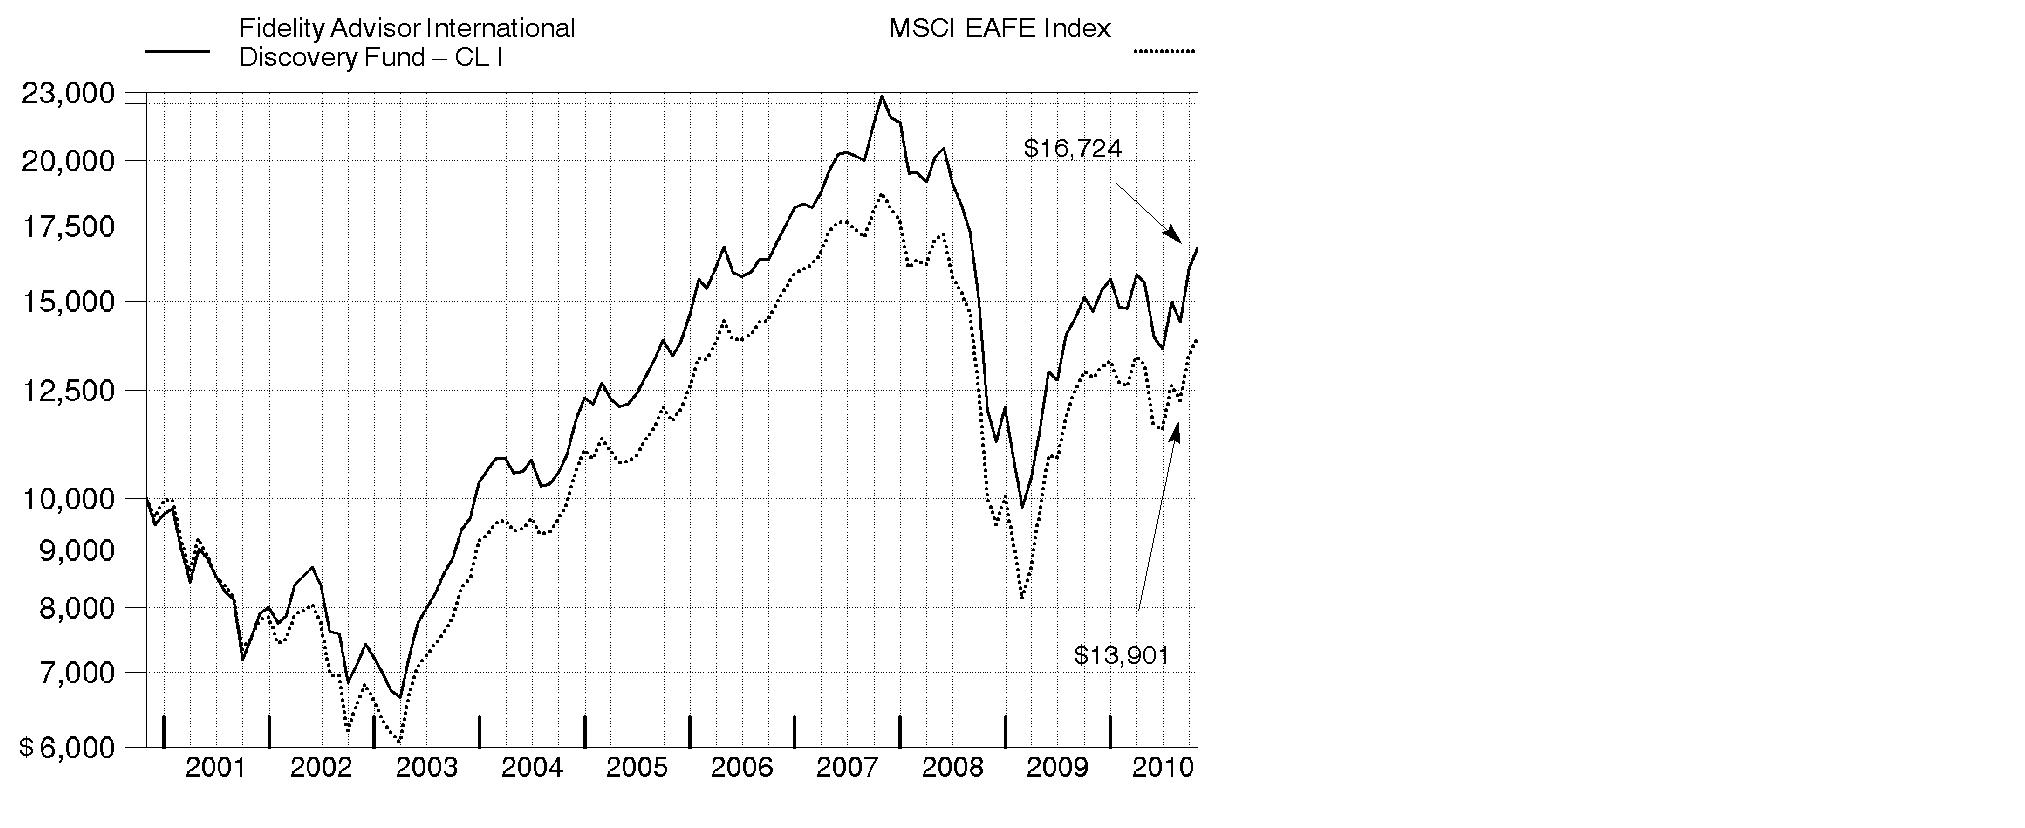
Annual Report
Market Recap: International stocks rode a wave of volatility similar to that of their U.S. counterparts during the 12 months ending October 31, 2010. Stocks gained modestly in the first half of the period, despite growing concerns about the European debt crisis. Sentiment turned decidedly negative in May and June, however, and the market suffered a precipitous decline. These losses were more than offset during the last four months of the period, when signs of economic growth and subsiding debt fears helped propel international stocks about 21%. For the full year, the MSCI® ACWI® (All Country World Index) ex USA Index gained 12.76%, boosted in part by a generally depreciating U.S. dollar. Within the index, Canada and emerging markets were standouts, returning 23% and 24%, respectively. Results in the latter group were led by strong-performing India, Mexico and South Africa, while China fell short of the MSCI benchmark due to cooling economic growth. The developed Asia ex Japan segment rose 16% for the period, lifted by solid results from Singapore and Hong Kong. Meanwhile, Europe rose just 9%, held back mainly by debt-riddled Spain and Italy, as well as lagging major constituent France. Japan returned only 5%, a result of that nation's continued weak economy.
Comments from William Kennedy, Portfolio Manager of Fidelity AdvisorSM International Discovery Fund: For the 12 months ending October 31, 2010, the fund's Institutional Class shares returned 13.84%, beating the 8.49% return of the MSCI EAFE® (Europe, Australasia, Far East) Index. Stock selection drove relative performance, with particularly strong gains coming from investments in emerging markets, as well as the consumer discretionary, information technology, health care and industrials sectors. Top contributors included Elekta, a Swedish manufacturer of radiation- therapy equipment that benefited from successful product launches and an increase in capital spending by hospitals, and SSL International, a U.K. health care company that received a handsome buyout offer. I sold SSL. In consumer discretionary - which increased as a percentage of fund assets - strong gains at Carphone Warehouse Group, a U.K. cell phone retailer, were fueled in part by an expanding partnership with big-box electronics retailer Best Buy. All three holdings were out-of-index positions. Detractors were minimal, with underweightings in consumer staples and materials just nicking results. Stock disappointments included HeidelbergCement, a German cement company whose U.S. business was hurt by the weak housing market, and Swiss investment bank UBS, whose revenue slowed more than expected.
The views expressed above reflect those of the portfolio manager(s) only through the end of the period as stated on the cover of this report and do not necessarily represent the views of Fidelity or any other person in the Fidelity organization. Any such views are subject to change at any time based upon market or other conditions and Fidelity disclaims any responsibility to update such views. These views may not be relied on as investment advice and, because investment decisions for a Fidelity fund are based on numerous factors, may not be relied on as an indication of trading intent on behalf of any Fidelity fund.
Annual Report
Shareholder Expense Example
As a shareholder of the Fund, you incur two types of costs: (1) transaction costs, including sales charges (loads) on purchase payments or redemption proceeds, redemption fees, and (2) ongoing costs, including management fees, distribution and/or service (12b-1) fees and other Fund expenses. This Example is intended to help you understand your ongoing costs (in dollars) of investing in the Fund and to compare these costs with the ongoing costs of investing in other mutual funds.
The Example is based on an investment of $1,000 invested at the beginning of the period and held for the entire period (May 1, 2010 to October 31, 2010).
Actual Expenses
The first line of the accompanying table for each class of the Fund provides information about actual account values and actual expenses. You may use the information in this line, together with the amount you invested, to estimate the expenses that you paid over the period. Simply divide your account value by $1,000.00 (for example, an $8,600 account value divided by $1,000.00 = 8.6), then multiply the result by the number in the first line for a class of the Fund under the heading entitled "Expenses Paid During Period" to estimate the expenses you paid on your account during this period. A small balance maintenance fee of $12.00 that is charged once a year may apply for certain accounts with a value of less than $2,000. This fee is not included in the table below. If it was, the estimate of expenses you paid during the period would be higher, and your ending account value lower, by this amount. In addition, the Fund, as a shareholder in the underlying Fidelity Central Funds, will indirectly bear its pro-rata share of the fees and expenses incurred by the underlying Fidelity Central Funds. These fees and expenses are not included in the Fund's annualized expense ratio used to calculate the expense estimate in the table below.
Hypothetical Example for Comparison Purposes
The second line of the accompanying table for each class of the Fund provides information about hypothetical account values and hypothetical expenses based on a Class' actual expense ratio and an assumed rate of return of 5% per year before expenses, which is not the Class' actual return. The hypothetical account values and expenses may not be used to estimate the actual ending account balance or expenses you paid for the period. You may use this information to compare the ongoing costs of investing in the Fund and other funds. To do so, compare this 5% hypothetical example with the 5% hypothetical examples that appear in the shareholder reports of the other funds. A small balance maintenance fee of $12.00 that is charged once a year may apply for certain accounts with a value of less than $2,000. This fee is not included in the table below. If it was, the estimate of expenses you paid during the period would be higher, and your ending account value lower, by this amount. In addition, the Fund, as a shareholder in the underlying Fidelity Central Funds, will indirectly bear its pro-rata share of the fees and expenses incurred by the underlying Fidelity Central Funds. These fees and expenses are not included in the Fund's annualized expense ratio used to calculate the expense estimate in the table below.
Annual Report
Please note that the expenses shown in the table are meant to highlight your ongoing costs only and do not reflect any transaction costs. Therefore, the second line of the table is useful in comparing ongoing costs only, and will not help you determine the relative total costs of owning different funds. In addition, if these transactional costs were included, your costs would have been higher.
| Annualized
Expense Ratio | Beginning
Account Value
May 1, 2010 | Ending
Account Value
October 31, 2010 | Expenses Paid
During Period*
May 1, 2009 to October 31, 2010 |
Class A | 1.32% | | | |
Actual | | $ 1,000.00 | $ 1,071.90 | $ 6.89 |
Hypothetical A | | $ 1,000.00 | $ 1,018.55 | $ 6.72 |
Class T | 1.57% | | | |
Actual | | $ 1,000.00 | $ 1,070.70 | $ 8.19 |
Hypothetical A | | $ 1,000.00 | $ 1,017.29 | $ 7.98 |
Class B | 2.08% | | | |
Actual | | $ 1,000.00 | $ 1,067.90 | $ 10.84 |
Hypothetical A | | $ 1,000.00 | $ 1,014.72 | $ 10.56 |
Class C | 2.07% | | | |
Actual | | $ 1,000.00 | $ 1,067.70 | $ 10.79 |
Hypothetical A | | $ 1,000.00 | $ 1,014.77 | $ 10.51 |
International Discovery | 1.02% | | | |
Actual | | $ 1,000.00 | $ 1,073.70 | $ 5.33 |
Hypothetical A | | $ 1,000.00 | $ 1,020.06 | $ 5.19 |
Class K | .82% | | | |
Actual | | $ 1,000.00 | $ 1,074.80 | $ 4.29 |
Hypothetical A | | $ 1,000.00 | $ 1,021.07 | $ 4.18 |
Institutional Class | .97% | | | |
Actual | | $ 1,000.00 | $ 1,074.10 | $ 5.07 |
Hypothetical A | | $ 1,000.00 | $ 1,020.32 | $ 4.94 |
A 5% return per year before expenses
*Expenses are equal to each Class' annualized expense ratio, multiplied by the average account value over the period, multiplied by 184/365 (to reflect the one-half year period).
Annual Report
Investment Changes (Unaudited)
Geographic Diversification (% of fund's net assets) |
As of October 31, 2010 |
| United Kingdom 20.9% | |
| Japan 12.1% | |
| France 8.8% | |
| Switzerland 7.0% | |
| Germany 6.6% | |
| United States of America 4.3% | |
| Spain 3.8% | |
| Denmark 3.3% | |
| Australia 3.0% | |
| Other 30.2% | |

Percentages are adjusted for the effect of futures contracts, if applicable. |
As of April 30, 2010 |
| United Kingdom 20.0% | |
| Japan 18.7% | |
| France 9.6% | |
| Switzerland 7.2% | |
| Germany 6.7% | |
| Netherlands 3.8% | |
| Australia 3.0% | |
| Spain 3.0% | |
| United States of America 2.3% | |
| Other 25.7% | |

Percentages are adjusted for the effect of futures contracts, if applicable. |
Asset Allocation (% of fund's net assets) |
| As of
October 31, 2010 | As of
April 30, 2010 |
Stocks | 98.6 | 99.3 |
Short-Term Investments and Net Other Assets | 1.4 | 0.7 |
Top Ten Stocks as of October 31, 2010 |
| % of fund's
net assets | % of fund's net assets
6 months ago |
BHP Billiton PLC (United Kingdom, Metals & Mining) | 1.9 | 1.3 |
Royal Dutch Shell PLC Class B (United Kingdom, Oil, Gas & Consumable Fuels) | 1.9 | 2.0 |
BP PLC (United Kingdom, Oil, Gas & Consumable Fuels) | 1.6 | 1.2 |
Nestle SA (Switzerland, Food Products) | 1.6 | 1.4 |
Novartis AG (Switzerland, Pharmaceuticals) | 1.5 | 1.2 |
Novo Nordisk AS Series B (Denmark, Pharmaceuticals) | 1.4 | 0.9 |
HSBC Holdings PLC (United Kingdom) (United Kingdom, Commercial Banks) | 1.3 | 1.9 |
Bayerische Motoren Werke AG (BMW) (Germany, Automobiles) | 1.3 | 0.9 |
SOFTBANK CORP. (Japan, Wireless Telecommunication Services) | 1.3 | 0.8 |
LVMH Moet Hennessy - Louis Vuitton (France, Textiles, Apparel & Luxury Goods) | 1.2 | 0.6 |
| 15.0 | |
Market Sectors as of October 31, 2010 |
| % of fund's
net assets | % of fund's net assets
6 months ago |
Financials | 22.0 | 21.6 |
Consumer Discretionary | 20.8 | 15.7 |
Industrials | 9.5 | 11.0 |
Materials | 9.3 | 9.6 |
Health Care | 9.1 | 9.1 |
Consumer Staples | 8.6 | 7.8 |
Energy | 6.4 | 7.8 |
Information Technology | 6.1 | 11.1 |
Telecommunication Services | 6.2 | 4.0 |
Utilities | 0.6 | 1.6 |
Annual Report
Investments October 31, 2010
Showing Percentage of Net Assets
Common Stocks - 97.2% |
| Shares | | Value (000s) |
Australia - 3.0% |
Australia & New Zealand Banking Group Ltd. | 4,456,031 | | $ 108,304 |
JB Hi-Fi Ltd. (d) | 1,401,880 | | 27,302 |
Macquarie Group Ltd. | 1,446,043 | | 51,282 |
Newcrest Mining Ltd. | 1,300,681 | | 50,918 |
Wesfarmers Ltd. | 1,097,894 | | 35,644 |
Westfield Group unit | 2,381,694 | | 28,885 |
TOTAL AUSTRALIA | | 302,335 |
Bailiwick of Jersey - 0.6% |
Experian PLC | 3,677,200 | | 42,742 |
Informa PLC | 2,335,767 | | 16,316 |
TOTAL BAILIWICK OF JERSEY | | 59,058 |
Belgium - 1.2% |
Anheuser-Busch InBev SA NV | 1,791,980 | | 112,293 |
EVS Broadcast Equipment SA | 89,263 | | 5,602 |
TOTAL BELGIUM | | 117,895 |
Bermuda - 1.1% |
Huabao International Holdings Ltd. | 27,748,000 | | 41,812 |
Li & Fung Ltd. | 4,808,000 | | 25,401 |
Noble Group Ltd. | 26,477,364 | | 38,050 |
Sihuan Pharmaceutical Holdings Group Ltd. | 496,000 | | 360 |
TOTAL BERMUDA | | 105,623 |
Brazil - 1.7% |
Banco ABC Brasil SA | 572,000 | | 5,635 |
Banco Santander (Brasil) SA ADR | 1,896,000 | | 27,302 |
Diagnosticos da America SA | 2,508,000 | | 30,959 |
Drogasil SA | 1,040,700 | | 26,323 |
Souza Cruz Industria Comerico | 1,579,500 | | 81,157 |
TOTAL BRAZIL | | 171,376 |
British Virgin Islands - 0.3% |
HLS Systems International Ltd. (a)(d) | 610,767 | | 7,720 |
Playtech Ltd. (d) | 3,758,978 | | 26,966 |
TOTAL BRITISH VIRGIN ISLANDS | | 34,686 |
Canada - 1.8% |
First Quantum Minerals Ltd. | 249,300 | | 21,831 |
InterOil Corp. (a)(d) | 247,600 | | 17,624 |
Niko Resources Ltd. | 483,100 | | 46,088 |
Open Text Corp. (a) | 769,600 | | 34,047 |
Common Stocks - continued |
| Shares | | Value (000s) |
Canada - continued |
Pan American Silver Corp. | 843,000 | | $ 26,909 |
Petrobank Energy & Resources Ltd. (a) | 813,500 | | 32,376 |
TOTAL CANADA | | 178,875 |
Cayman Islands - 2.4% |
Belle International Holdings Ltd. | 9,430,000 | | 17,032 |
Bosideng International Holdings Ltd. | 81,544,000 | | 41,239 |
China Lodging Group Ltd. ADR (d) | 344,759 | | 8,381 |
Ctrip.com International Ltd. sponsored ADR (a) | 505,000 | | 26,295 |
Eurasia Drilling Co. Ltd. GDR (f) | 257,900 | | 6,576 |
Hengdeli Holdings Ltd. | 75,304,000 | | 41,775 |
Mongolian Mining Corp. | 15,168,000 | | 16,418 |
Perfect World Co. Ltd. sponsored ADR Class B (a) | 771,187 | | 24,986 |
Shenguan Holdings Group Ltd. | 21,268,000 | | 27,713 |
TPK Holdings Co. | 25,000 | | 413 |
Want Want China Holdings Ltd. | 36,693,000 | | 33,847 |
TOTAL CAYMAN ISLANDS | | 244,675 |
China - 1.2% |
Baidu.com, Inc. sponsored ADR (a) | 348,900 | | 38,382 |
China Merchants Bank Co. Ltd. (H Shares) | 18,516,200 | | 52,554 |
Comba Telecom Systems Holdings Ltd. (d) | 7,504,420 | | 8,520 |
Minth Group Ltd. | 2,146,000 | | 4,014 |
Zhaojin Mining Industry Co. Ltd. (H Shares) | 2,492,000 | | 7,748 |
ZTE Corp. (H Shares) (d) | 2,362,096 | | 8,776 |
TOTAL CHINA | | 119,994 |
Cyprus - 0.0% |
Aisi Realty Public Ltd. (a)(e) | 21,633,000 | | 607 |
Denmark - 3.3% |
Carlsberg AS Series B | 673,200 | | 73,612 |
Novo Nordisk AS Series B | 1,311,389 | | 137,673 |
Pandora A/S | 758,300 | | 36,789 |
William Demant Holding AS (a) | 1,094,900 | | 82,070 |
TOTAL DENMARK | | 330,144 |
Egypt - 0.2% |
Orascom Construction Industries SAE GDR | 443,300 | | 20,525 |
France - 8.8% |
Accor SA | 732,241 | | 30,021 |
Atos Origin SA (a) | 1,202,978 | | 55,615 |
AXA SA | 2,162,866 | | 39,365 |
Common Stocks - continued |
| Shares | | Value (000s) |
France - continued |
BNP Paribas SA | 983,966 | | $ 71,948 |
Carrefour SA | 973,625 | | 52,537 |
Compagnie Generale de Geophysique SA (a) | 1,085,600 | | 25,352 |
Edenred (a) | 552,100 | | 11,562 |
Essilor International SA | 566,366 | | 37,812 |
GDF Suez | 760,000 | | 30,329 |
Iliad Group SA (d) | 509,521 | | 57,356 |
LVMH Moet Hennessy - Louis Vuitton | 797,092 | | 124,886 |
Pernod-Ricard SA | 388,925 | | 34,478 |
PPR SA | 664,000 | | 108,838 |
Sanofi-Aventis | 317,944 | | 22,270 |
Schneider Electric SA | 588,962 | | 83,590 |
Societe Generale Series A | 1,175,263 | | 70,360 |
Unibail-Rodamco | 118,400 | | 24,663 |
TOTAL FRANCE | | 880,982 |
Germany - 5.2% |
Bayerische Motoren Werke AG (BMW) | 1,818,327 | | 130,326 |
Fresenius Medical Care AG & Co. KGaA | 964,000 | | 61,394 |
GEA Group AG | 2,030,727 | | 53,094 |
HeidelbergCement AG | 245,167 | | 12,822 |
Kabel Deutschland Holding AG | 1,258,000 | | 56,636 |
MAN SE | 529,280 | | 58,181 |
Metro AG | 439,200 | | 30,776 |
Siemens AG | 1,089,506 | | 124,433 |
TOTAL GERMANY | | 527,662 |
Greece - 0.2% |
Coca-Cola Hellenic Bottling Co. SA | 692,200 | | 17,915 |
Hong Kong - 1.6% |
AIA Group Ltd. | 5,311,400 | | 15,795 |
Henderson Land Development Co. Ltd. | 3,760,700 | | 26,709 |
I.T Ltd. | 21,016,000 | | 17,732 |
Techtronic Industries Co. Ltd. | 65,201,500 | | 66,032 |
Wharf Holdings Ltd. | 4,890,000 | | 32,111 |
TOTAL HONG KONG | | 158,379 |
India - 2.8% |
Adani Enterprises Ltd. | 1,982,014 | | 31,500 |
Gitanjali Gems Ltd. | 2,506,415 | | 16,763 |
Housing Development Finance Corp. Ltd. | 1,506,925 | | 23,380 |
IndusInd Bank Ltd. | 2,074,982 | | 12,340 |
Common Stocks - continued |
| Shares | | Value (000s) |
India - continued |
INFO Edge India Ltd. | 679,326 | | $ 10,427 |
Infrastructure Development Finance Co. Ltd. | 3,122,908 | | 14,094 |
Larsen & Toubro Ltd. | 783,228 | | 35,831 |
LIC Housing Finance Ltd. | 1,481,322 | | 44,801 |
Reliance Industries Ltd. | 903,416 | | 22,343 |
Rural Electrification Corp. Ltd. | 2,750,582 | | 23,001 |
Shriram Transport Finance Co. Ltd. | 621,359 | | 12,356 |
State Bank of India | 217,944 | | 15,491 |
The Jammu & Kashmir Bank Ltd. | 545,569 | | 11,206 |
Titan Industries Ltd. | 160,588 | | 12,869 |
TOTAL INDIA | | 286,402 |
Indonesia - 0.7% |
PT Bank Rakyat Indonesia Tbk | 19,678,500 | | 25,100 |
PT Tower Bersama Infrastructure Tbk | 4,813,500 | | 1,373 |
PT XL Axiata Tbk (a) | 67,983,500 | | 43,738 |
TOTAL INDONESIA | | 70,211 |
Ireland - 0.5% |
Ingersoll-Rand Co. Ltd. | 731,600 | | 28,759 |
James Hardie Industries NV unit (a) | 3,882,491 | | 20,501 |
TOTAL IRELAND | | 49,260 |
Israel - 0.2% |
Israel Chemicals Ltd. | 1,513,500 | | 23,150 |
Italy - 1.4% |
Intesa Sanpaolo SpA | 5,602,109 | | 19,702 |
Intesa Sanpaolo SpA (Risparmio Shares) | 6,681,302 | | 18,305 |
Prysmian SpA | 964,200 | | 18,689 |
Saipem SpA | 1,876,915 | | 83,389 |
TOTAL ITALY | | 140,085 |
Japan - 12.1% |
ABC-Mart, Inc. | 1,529,000 | | 52,005 |
Asics Corp. | 2,858,000 | | 30,864 |
Canon, Inc. | 1,331,350 | | 61,286 |
Cosmos Pharmaceutical Corp. | 543,200 | | 17,099 |
Denso Corp. | 1,577,500 | | 49,057 |
Don Quijote Co. Ltd. | 808,400 | | 22,091 |
eAccess Ltd. | 24,546 | | 17,905 |
Fast Retailing Co. Ltd. | 89,100 | | 11,671 |
Goldcrest Co. Ltd. | 161,770 | | 3,492 |
Common Stocks - continued |
| Shares | | Value (000s) |
Japan - continued |
Honda Motor Co. Ltd. | 1,736,200 | | $ 62,588 |
JSR Corp. | 2,283,400 | | 39,527 |
Keyence Corp. | 192,600 | | 47,749 |
Komatsu Ltd. | 1,833,900 | | 44,823 |
Mazda Motor Corp. | 14,841,000 | | 37,718 |
Misumi Group, Inc. | 825,300 | | 17,692 |
Mitsubishi Corp. | 1,980,200 | | 47,564 |
Mitsubishi UFJ Financial Group, Inc. | 12,527,700 | | 58,141 |
Mitsui & Co. Ltd. | 2,230,900 | | 35,086 |
Mizuho Financial Group, Inc. | 17,803,700 | | 25,821 |
Nichi-iko Pharmaceutical Co. Ltd. | 932,200 | | 32,877 |
Nintendo Co. Ltd. | 88,400 | | 22,905 |
Omron Corp. | 1,439,900 | | 33,425 |
ORIX Corp. | 1,209,560 | | 110,329 |
Osaka Securities Exchange Co. Ltd. | 1,866 | | 9,391 |
Rakuten, Inc. | 80,045 | | 61,673 |
Ricoh Co. Ltd. | 3,021,000 | | 42,260 |
Sawai Pharmaceutical Co. Ltd. (d) | 160,300 | | 14,004 |
SOFTBANK CORP. | 4,003,100 | | 128,560 |
Sony Financial Holdings, Inc. | 7,099 | | 24,701 |
Start Today Co. Ltd. | 7,249 | | 22,548 |
Sumitomo Mitsui Financial Group, Inc. | 1,151,300 | | 34,364 |
TOTAL JAPAN | | 1,219,216 |
Korea (South) - 1.5% |
Hyundai Motor Co. | 192,345 | | 29,078 |
Kia Motors Corp. | 912,890 | | 36,451 |
NCsoft Corp. | 97,952 | | 21,559 |
NHN Corp. (a) | 123,150 | | 21,848 |
Samsung Electronics Co. Ltd. | 38,175 | | 25,292 |
Shinhan Financial Group Co. Ltd. | 421,030 | | 16,306 |
TOTAL KOREA (SOUTH) | | 150,534 |
Luxembourg - 0.3% |
Millicom International Cellular SA | 282,400 | | 26,715 |
Mauritius - 0.2% |
MakeMyTrip Ltd. | 456,425 | | 16,500 |
Mexico - 0.4% |
Wal-Mart de Mexico SA de CV Series V | 14,883,600 | | 40,708 |
Netherlands - 2.2% |
AEGON NV (a) | 3,601,200 | | 22,818 |
Gemalto NV (d) | 704,193 | | 32,061 |
Common Stocks - continued |
| Shares | | Value (000s) |
Netherlands - continued |
ING Groep NV (Certificaten Van Aandelen) unit (a) | 4,878,900 | | $ 52,185 |
Koninklijke Philips Electronics NV | 2,283,638 | | 69,639 |
LyondellBasell Industries NV Class A (a) | 1,230,700 | | 33,057 |
Randstad Holdings NV (a) | 229,781 | | 10,935 |
TOTAL NETHERLANDS | | 220,695 |
Norway - 1.6% |
Aker Solutions ASA | 1,903,800 | | 28,983 |
DnB NOR ASA | 5,226,955 | | 71,723 |
Telenor ASA | 1,549,800 | | 24,982 |
Yara International ASA | 620,300 | | 32,607 |
TOTAL NORWAY | | 158,295 |
Poland - 0.1% |
Eurocash SA | 980,199 | | 9,009 |
Qatar - 0.2% |
Commercial Bank of Qatar GDR (Reg. S) | 5,094,802 | | 23,345 |
Singapore - 0.3% |
Keppel Corp. Ltd. | 4,295,000 | | 33,118 |
South Africa - 2.2% |
African Rainbow Minerals Ltd. | 607,700 | | 15,503 |
AngloGold Ashanti Ltd. sponsored ADR | 816,100 | | 38,446 |
Clicks Group Ltd. | 7,968,139 | | 51,983 |
Mr Price Group Ltd. | 3,702,400 | | 33,646 |
Sanlam Ltd. | 7,188,000 | | 26,946 |
Standard Bank Group Ltd. | 1,349,000 | | 19,893 |
Woolworths Holdings Ltd. | 9,804,233 | | 38,419 |
TOTAL SOUTH AFRICA | | 224,836 |
Spain - 3.8% |
Antena 3 Television SA | 2,176,200 | | 22,226 |
Banco Bilbao Vizcaya Argentaria SA | 4,146,934 | | 54,620 |
Banco Santander SA | 8,695,646 | | 111,585 |
Gestevision Telecinco SA | 2,269,700 | | 28,948 |
Inditex SA (d) | 398,393 | | 33,266 |
Prosegur Compania de Seguridad SA (Reg.) | 479,200 | | 28,712 |
Telefonica SA | 3,645,705 | | 98,491 |
TOTAL SPAIN | | 377,848 |
Sweden - 1.7% |
Elekta AB (B Shares) | 2,194,000 | | 83,011 |
Common Stocks - continued |
| Shares | | Value (000s) |
Sweden - continued |
H&M Hennes & Mauritz AB (B Shares) | 1,301,280 | | $ 45,846 |
Modern Times Group MTG AB (B Shares) | 579,300 | | 41,538 |
TOTAL SWEDEN | | 170,395 |
Switzerland - 7.0% |
Adecco SA (Reg.) | 243,346 | | 13,597 |
Compagnie Financiere Richemont SA Series A | 692,855 | | 34,546 |
Credit Suisse Group | 644,315 | | 26,666 |
Kuehne & Nagel International AG | 197,400 | | 24,406 |
Lonza Group AG | 349,225 | | 30,564 |
Nestle SA | 2,845,723 | | 155,823 |
Novartis AG | 2,677,083 | | 155,070 |
Partners Group Holding | 176,756 | | 32,322 |
Schindler Holding AG (participation certificate) | 228,540 | | 24,494 |
Sonova Holding AG Class B | 213,178 | | 24,689 |
The Swatch Group AG (Bearer) | 175,550 | | 67,074 |
UBS AG (a) | 3,459,090 | | 58,744 |
Zurich Financial Services AG | 251,733 | | 61,607 |
TOTAL SWITZERLAND | | 709,602 |
Taiwan - 0.5% |
HTC Corp. | 2,247,850 | | 50,752 |
Thailand - 0.4% |
Bangkok Bank Public Co. Ltd. (For. Reg.) | 8,336,000 | | 43,016 |
Turkey - 0.7% |
Boyner Buyuk Magazacilik AS (a)(e) | 4,833,645 | | 11,256 |
Dogus Otomotiv Servis ve Ticaret AS (a) | 2,849,000 | | 21,452 |
Turkiye Garanti Bankasi AS | 6,816,000 | | 41,819 |
TOTAL TURKEY | | 74,527 |
United Kingdom - 20.9% |
Aberdeen Asset Management PLC | 12,139,132 | | 34,580 |
Aegis Group PLC | 12,834,711 | | 25,848 |
Anglo American PLC (United Kingdom) | 1,583,300 | | 73,767 |
AstraZeneca PLC (United Kingdom) | 1,776,034 | | 89,327 |
Barclays PLC | 20,242,493 | | 88,943 |
BG Group PLC | 943,475 | | 18,373 |
BHP Billiton PLC | 5,343,392 | | 189,262 |
BP PLC | 24,342,500 | | 165,439 |
British Land Co. PLC | 2,363,434 | | 19,293 |
Britvic PLC | 5,435,800 | | 42,012 |
Burberry Group PLC | 2,391,800 | | 39,048 |
Common Stocks - continued |
| Shares | | Value (000s) |
United Kingdom - continued |
Carphone Warehouse Group PLC (a) | 15,119,465 | | $ 73,761 |
Cookson Group PLC (a) | 1,543,760 | | 12,738 |
GlaxoSmithKline PLC | 6,239,100 | | 121,819 |
HSBC Holdings PLC (United Kingdom) | 12,868,660 | | 133,916 |
IG Group Holdings PLC | 6,526,105 | | 55,259 |
InterContinental Hotel Group PLC | 2,054,000 | | 39,664 |
International Personal Finance PLC | 9,411,888 | | 46,896 |
International Power PLC | 3,956,720 | | 26,454 |
Legal & General Group PLC | 18,411,796 | | 29,616 |
Lloyds Banking Group PLC (a) | 49,557,364 | | 54,463 |
Micro Focus International PLC | 2,166,900 | | 13,255 |
Ocado Group PLC (a)(d) | 14,388,400 | | 32,204 |
Reckitt Benckiser Group PLC | 1,415,031 | | 79,144 |
Rio Tinto PLC | 1,536,344 | | 99,773 |
Royal Dutch Shell PLC Class B | 5,903,573 | | 188,900 |
Schroders PLC | 1,532,400 | | 38,767 |
SuperGroup PLC | 101,212 | | 1,832 |
TalkTalk Telecom Group PLC (a) | 18,424,592 | | 38,936 |
Ultra Electronics Holdings PLC | 614,667 | | 18,327 |
Vodafone Group PLC | 42,989,943 | | 117,503 |
Wolseley PLC (a) | 1,389,264 | | 37,015 |
Xstrata PLC | 3,171,800 | | 61,463 |
TOTAL UNITED KINGDOM | | 2,107,597 |
United States of America - 2.9% |
AsiaInfo Holdings, Inc. (a)(d) | 717,700 | | 15,947 |
CF Industries Holdings, Inc. | 273,800 | | 33,549 |
Freeport-McMoRan Copper & Gold, Inc. | 420,100 | | 39,775 |
NII Holdings, Inc. (a) | 1,802,500 | | 75,363 |
The Mosaic Co. | 376,200 | | 27,523 |
Virgin Media, Inc. (d) | 2,966,300 | | 75,433 |
Walter Energy, Inc. | 286,800 | | 25,227 |
TOTAL UNITED STATES OF AMERICA | | 292,817 |
TOTAL COMMON STOCKS (Cost $8,518,349) | 9,789,364 |
Nonconvertible Preferred Stocks - 1.4% |
| Shares | | Value (000s) |
Germany - 1.4% |
ProSiebenSat.1 Media AG | 783,800 | | $ 20,711 |
Volkswagen AG | 789,800 | | 118,688 |
TOTAL NONCONVERTIBLE PREFERRED STOCKS (Cost $105,062) | 139,399 |
Money Market Funds - 2.2% |
| | | |
Fidelity Cash Central Fund, 0.23% (b) | 100,758,575 | | 100,759 |
Fidelity Securities Lending Cash Central Fund, 0.24% (b)(c) | 123,571,582 | | 123,572 |
TOTAL MONEY MARKET FUNDS (Cost $224,331) | 224,331 |
Cash Equivalents - 0.2% |
| Maturity Amount (000s) | | |
Investments in repurchase agreements in a joint trading account at 0.22%, dated 10/29/10 due 11/1/10 (Collateralized by U.S. Treasury Obligations) #
(Cost $18,662) | $ 18,662 | | 18,662 |
TOTAL INVESTMENT PORTFOLIO - 101.0% (Cost $8,866,404) | | 10,171,756 |
NET OTHER ASSETS (LIABILITIES) - (1.0)% | | (99,606) |
NET ASSETS - 100% | $ 10,072,150 |
Legend |
(a) Non-income producing |
(b) Affiliated fund that is available only to investment companies and other accounts managed by Fidelity Investments. The rate quoted is the annualized seven-day yield of the fund at period end. A complete unaudited listing of the fund's holdings as of its most recent quarter end is available upon request. In addition, each Fidelity Central Fund's financial statements, which are not covered by the Fund's report of Independent Registered Public Accounting Firm, are available on the SEC's website or upon request. |
(c) Investment made with cash collateral received from securities on loan. |
(d) Security or a portion of the security is on loan at period end. |
(e) Affiliated company |
(f) Security exempt from registration under Rule 144A of the Securities Act of 1933. These securities may be resold in transactions exempt from registration, normally to qualified institutional buyers. At the end of the period, the value of these securities amounted to $6,576,000 or 0.1% of net assets. |
# Additional information on each counterparty to the repurchase agreement is as follows: |
Repurchase Agreement / Counterparty | Value
(Amounts in thousands) |
$18,662,000 due 11/01/10 at 0.22% |
BNP Paribas Securities Corp. | $ 8,683 |
Banc of America Securities LLC | 3,254 |
Barclays Capital, Inc. | 6,725 |
| $ 18,662 |
Affiliated Central Funds |
Information regarding fiscal year to date income earned by the Fund from investments in Fidelity Central Funds is as follows: |
Fund | Income earned
(Amounts in thousands) |
Fidelity Cash Central Fund | $ 127 |
Fidelity Securities Lending Cash Central Fund | 6,155 |
Total | $ 6,282 |
Other Affiliated Issuers |
An affiliated company is a company in which the Fund has ownership of at least 5% of the voting securities. Fiscal year to date transactions with companies which are or were affiliates are as follows: |
Affiliate
(Amounts in thousands) | Value, beginning of period | Purchases | Sales Proceeds | Dividend Income | Value,
end of
period |
Aisi Realty Public Ltd. | $ 1,243 | $ - | $ - | $ - | $ 607 |
Boyner Buyuk Magazacilik AS | - | 11,785 | - | - | 11,256 |
Total | $ 1,243 | $ 11,785 | $ - | $ - | $ 11,863 |
Other Information |
The following is a summary of the inputs used, as of October 31, 2010, involving the Fund's assets and liabilities carried at fair value. The inputs or methodology used for valuing securities may not be an indication of the risk associated with investing in those securities. For more information on valuation inputs, and their aggregation into the levels used in the tables below, please refer to the Security Valuation section in the accompanying Notes to Financial Statements. |
Valuation Inputs at Reporting Date: |
Description
(Amounts in thousands) | Total | Level 1 | Level 2 | Level 3 |
Investments in Securities: | | | | |
Equities: | | | | |
United Kingdom | $ 2,107,597 | $ 818,588 | $ 1,289,009 | $ - |
Japan | 1,219,216 | 580,277 | 638,939 | - |
France | 880,982 | 833,360 | 47,622 | - |
Switzerland | 709,602 | 469,122 | 240,480 | - |
Germany | 667,061 | 481,234 | 185,827 | - |
Spain | 377,848 | 113,152 | 264,696 | - |
Denmark | 330,144 | 192,471 | 137,673 | - |
Australia | 302,335 | 302,335 | - | - |
United States of America | 292,817 | 292,817 | - | - |
Cyprus | 607 | - | - | 607 |
Other | 3,040,554 | 2,895,912 | 144,642 | - |
Money Market Funds | 224,331 | 224,331 | - | - |
Cash Equivalents | 18,662 | - | 18,662 | - |
Total Investments in Securities: | $ 10,171,756 | $ 7,203,599 | $ 2,967,550 | $ 607 |
The following is a reconciliation of Investments in Securities for which Level 3 inputs were used in determining value: |
(Amounts in thousands) | |
Investments in Securities: | |
Beginning Balance | $ - |
Total Realized Gain (Loss) | - |
Total Unrealized Gain (Loss) | (636) |
Cost of Purchases | - |
Proceeds of Sales | - |
Amortization/Accretion | - |
Transfers in to Level 3 | 1,243 |
Transfers out of Level 3 | - |
Ending Balance | $ 607 |
The change in unrealized gain (loss) for the period attributable to Level 3 securities held at October 31, 2010 | $ (636) |
The information used in the above reconciliation represents fiscal year to date activity for any Investments in Securities identified as using Level 3 inputs at either the beginning or the end of the current fiscal period. Transfers in or out of Level 3 represent the beginning value of any Security or Instrument where a change in the pricing level occurred from the beginning to the end of the period. The cost of purchases and the proceeds of sales may include securities received or delivered through corporate actions or exchanges. Realized and unrealized gains (losses) disclosed in the reconciliation are included in Net Gain (Loss) on the Fund's Statement of Operations. |
Income Tax Information |
At October 31, 2010, the Fund had a capital loss carryforward of approximately $1,803,058,000 of which $163,224,000 and $1,639,834,000 will expire on October 31, 2016 and 2017, respectively. Capital loss carryforwards are only available to offset future capital gains of the Fund to the extent provided by regulations and may be limited. |
See accompanying notes which are an integral part of the financial statements.
Annual Report
Statement of Assets and Liabilities
Amounts in thousands (except per-share amounts) | October 31, 2010 |
| | |
Assets | | |
Investment in securities, at value (including securities loaned of $117,688 and repurchase agreements of $18,662) - See accompanying schedule: Unaffiliated issuers (cost $8,623,386) | $ 9,935,562 | |
Fidelity Central Funds (cost $224,331) | 224,331 | |
Other affiliated issuers (cost $18,687) | 11,863 | |
Total Investments (cost $8,866,404) | | $ 10,171,756 |
Cash | | 1 |
Foreign currency held at value (cost $1,005) | | 1,005 |
Receivable for investments sold | | 74,676 |
Receivable for fund shares sold | | 8,906 |
Dividends receivable | | 27,141 |
Distributions receivable from Fidelity Central Funds | | 250 |
Other receivables | | 3,906 |
Total assets | | 10,287,641 |
| | |
Liabilities | | |
Payable for investments purchased | $ 61,924 | |
Payable for fund shares redeemed | 12,106 | |
Accrued management fee | 5,716 | |
Distribution and service plan fees payable | 169 | |
Other affiliated payables | 1,920 | |
Other payables and accrued expenses | 10,084 | |
Collateral on securities loaned, at value | 123,572 | |
Total liabilities | | 215,491 |
| | |
Net Assets | | $ 10,072,150 |
Net Assets consist of: | | |
Paid in capital | | $ 10,604,504 |
Undistributed net investment income | | 120,198 |
Accumulated undistributed net realized gain (loss) on investments and foreign currency transactions | | (1,950,098) |
Net unrealized appreciation (depreciation) on investments and assets and liabilities in foreign currencies | | 1,297,546 |
Net Assets | | $ 10,072,150 |
See accompanying notes which are an integral part of the financial statements.
Annual Report
Statement of Assets and Liabilities - continued
Amounts in thousands (except per-share amounts) | October 31, 2010 |
| | |
Calculation of Maximum Offering Price Class A:
Net Asset Value and redemption price per share ($391,603 ÷ 12,210.4 shares) | | $ 32.07 |
| | |
Maximum offering price per share (100/94.25 of $32.07) | | $ 34.03 |
Class T:
Net Asset Value and redemption price per share ($91,992 ÷ 2,892.1 shares) | | $ 31.81 |
| | |
Maximum offering price per share (100/96.50 of $31.81) | | $ 32.96 |
Class B:
Net Asset Value and offering price per share ($14,434 ÷ 456.7 shares)A | | $ 31.60 |
| | |
Class C:
Net Asset Value and offering price per share ($43,557 ÷ 1,374.7 shares)A | | $ 31.68 |
| | |
International Discovery:
Net Asset Value, offering price and redemption price per share ($8,133,121 ÷ 251,479.5 shares) | | $ 32.34 |
| | |
Class K:
Net Asset Value, offering price and redemption price per share ($1,078,333 ÷ 33,361.2 shares) | | $ 32.32 |
| | |
Institutional Class:
Net Asset Value, offering price and redemption price per share ($319,110 ÷ 9,877.0 shares) | | $ 32.31 |
A Redemption price per share is equal to net asset value less any applicable contingent deferred sales charge.
See accompanying notes which are an integral part of the financial statements.
Annual Report
Financial Statements - continued
Statement of Operations
Amounts in thousands | Year ended October 31, 2010 |
| | |
Investment Income | | |
Dividends | | $ 239,834 |
Interest | | 2 |
Income from Fidelity Central Funds | | 6,282 |
Income before foreign taxes withheld | | 246,118 |
Less foreign taxes withheld | | (17,979) |
Total income | | 228,139 |
| | |
Expenses | | |
Management fee
Basic fee | $ 68,970 | |
Performance adjustment | 3,660 | |
Transfer agent fees | 23,371 | |
Distribution and service plan fees | 2,084 | |
Accounting and security lending fees | 1,801 | |
Custodian fees and expenses | 1,632 | |
Independent trustees' compensation | 55 | |
Registration fees | 223 | |
Audit | 117 | |
Legal | 49 | |
Interest | 12 | |
Miscellaneous | 132 | |
Total expenses before reductions | 102,106 | |
Expense reductions | (4,562) | 97,544 |
Net investment income (loss) | | 130,595 |
Realized and Unrealized Gain (Loss) Net realized gain (loss) on: | | |
Investment securities: | | |
Unaffiliated issuers (net of foreign taxes of $141) | 488,568 | |
Foreign currency transactions | (6,761) | |
Capital gain distributions from Fidelity Central Funds | 14 | |
Total net realized gain (loss) | | 481,821 |
Change in net unrealized appreciation (depreciation) on: Investment securities (net of increase in deferred foreign taxes of $8,661) | 637,812 | |
Assets and liabilities in foreign currencies | 968 | |
Total change in net unrealized appreciation (depreciation) | | 638,780 |
Net gain (loss) | | 1,120,601 |
Net increase (decrease) in net assets resulting from operations | | $ 1,251,196 |
See accompanying notes which are an integral part of the financial statements.
Annual Report
Statement of Changes in Net Assets
Amounts in thousands | Year ended
October 31,
2010 | Year ended
October 31,
2009 |
Increase (Decrease) in Net Assets | | |
Operations | | |
Net investment income (loss) | $ 130,595 | $ 120,477 |
Net realized gain (loss) | 481,821 | (1,782,481) |
Change in net unrealized appreciation (depreciation) | 638,780 | 3,333,708 |
Net increase (decrease) in net assets resulting
from operations | 1,251,196 | 1,671,704 |
Distributions to shareholders from net investment income | (116,422) | (107,705) |
Distributions to shareholders from net realized gain | (13,374) | - |
Total distributions | (129,796) | (107,705) |
Share transactions - net increase (decrease) | (662,032) | 250,490 |
Redemption fees | 291 | 345 |
Total increase (decrease) in net assets | 459,659 | 1,814,834 |
| | |
Net Assets | | |
Beginning of period | 9,612,491 | 7,797,657 |
End of period (including undistributed net investment income of $120,198 and undistributed net investment income of $106,024, respectively) | $ 10,072,150 | $ 9,612,491 |
See accompanying notes which are an integral part of the financial statements.
Annual Report
Financial Highlights - Class A
Years ended October 31, | 2010 | 2009 | 2008 | 2007 | 2006 |
Selected Per-Share Data | | | | | |
Net asset value, beginning of period | $ 28.57 | $ 23.68 | $ 47.34 | $ 36.47 | $ 30.57 |
Income from Investment Operations | | | | | |
Net investment income (loss)C | .31 | .31 | .46 | .44 | .42 |
Net realized and unrealized gain (loss) | 3.51 | 4.84 | (22.08) | 11.76 | 7.19 |
Total from investment operations | 3.82 | 5.15 | (21.62) | 12.20 | 7.61 |
Distributions from net investment income | (.28) | (.26) | (.37) | (.35) | (.31) |
Distributions from net realized gain | (.04) | - | (1.67) | (.98) | (1.40) |
Total distributions | (.32) | (.26) | (2.04) | (1.33) | (1.71) |
Redemption fees added to paid in capital C,G | - | - | - | - | - |
Net asset value, end of period | $ 32.07 | $ 28.57 | $ 23.68 | $ 47.34 | $ 36.47 |
Total ReturnA,B | 13.43% | 22.14% | (47.65)% | 34.54% | 26.01% |
Ratios to Average Net Assets D, F | | | | | |
Expenses before reductions | 1.33% | 1.37% | 1.32% | 1.25% | 1.27% |
Expenses net of fee waivers, if any | 1.33% | 1.37% | 1.32% | 1.25% | 1.27% |
Expenses net of all reductions | 1.28% | 1.32% | 1.29% | 1.22% | 1.21% |
Net investment income (loss) | 1.06% | 1.28% | 1.27% | 1.08% | 1.22% |
Supplemental Data | | | | | |
Net assets, end of period (in millions) | $ 392 | $ 414 | $ 380 | $ 417 | $ 140 |
Portfolio turnover rate E | 82% | 98% | 79% | 56% | 56% |
A Total returns would have been lower had certain expenses not been reduced during the periods shown.
B Total returns do not include the effect of the sales charges.
C Calculated based on average shares outstanding during the period.
D Fees and expenses of the underlying Fidelity Central Funds are not included in the Fund's expense ratio. The Fund indirectly bears its proportionate share of the expenses of any underlying Fidelity Central Funds.
E Amount does not include the portfolio activity of any underlying Fidelity Central Funds.
F Expense ratios reflect operating expenses of the class. Expenses before reductions do not reflect amounts reimbursed by the investment adviser or reductions from brokerage service arrangements or reductions from other expense offset arrangements and do not represent the amount paid by the class during periods when reimbursements or reductions occur. Expenses net of fee waivers reflect expenses after reimbursement by the investment adviser but prior to reductions from brokerage service arrangements or other expense offset arrangements. Expenses net of all reductions represent the net expenses paid by the class.
G Amount represents less than $.01 per share.
See accompanying notes which are an integral part of the financial statements.
Annual Report
Financial Highlights - Class T
Years ended October 31, | 2010 | 2009 | 2008 | 2007 | 2006 |
Selected Per-Share Data | | | | | |
Net asset value, beginning of period | $ 28.35 | $ 23.49 | $ 47.06 | $ 36.30 | $ 30.49 |
Income from Investment Operations | | | | | |
Net investment income (loss) C | .23 | .24 | .33 | .29 | .27 |
Net realized and unrealized gain (loss) | 3.48 | 4.81 | (21.94) | 11.71 | 7.18 |
Total from investment operations | 3.71 | 5.05 | (21.61) | 12.00 | 7.45 |
Distributions from net investment income | (.21) | (.19) | (.29) | (.26) | (.24) |
Distributions from net realized gain | (.04) | - | (1.67) | (.98) | (1.40) |
Total distributions | (.25) | (.19) | (1.96) | (1.24) | (1.64) |
Redemption fees added to paid in capital C,G | - | - | - | - | - |
Net asset value, end of period | $ 31.81 | $ 28.35 | $ 23.49 | $ 47.06 | $ 36.30 |
Total Return A,B | 13.14% | 21.79% | (47.84)% | 34.08% | 25.49% |
Ratios to Average Net AssetsD, F | | | | | |
Expenses before reductions | 1.60% | 1.65% | 1.68% | 1.63% | 1.71% |
Expenses net of fee waivers, if any | 1.60% | 1.65% | 1.68% | 1.63% | 1.71% |
Expenses net of all reductions | 1.56% | 1.60% | 1.64% | 1.60% | 1.65% |
Net investment income (loss) | .79% | 1.00% | .91% | .70% | .78% |
Supplemental Data | | | | | |
Net assets, end of period (in millions) | $ 92 | $ 83 | $ 64 | $ 53 | $ 10 |
Portfolio turnover rate E | 82% | 98% | 79% | 56% | 56% |
A Total returns would have been lower had certain expenses not been reduced during the periods shown.
B Total returns do not include the effect of the sales charges.
C Calculated based on average shares outstanding during the period.
D Fees and expenses of the underlying Fidelity Central Funds are not included in the Fund's expense ratio. The Fund indirectly bears its proportionate share of the expenses of any underlying Fidelity Central Funds.
E Amount does not include the portfolio activity of any underlying Fidelity Central Funds.
F Expense ratios reflect operating expenses of the class. Expenses before reductions do not reflect amounts reimbursed by the investment adviser or reductions from brokerage service arrangements or reductions from other expense offset arrangements and do not represent the amount paid by the class during periods when reimbursements or reductions occur. Expenses net of fee waivers reflect expenses after reimbursement by the investment adviser but prior to reductions from brokerage service arrangements or other expense offset arrangements. Expenses net of all reductions represent the net expenses paid by the class.
G Amount represents less than $.01 per share.
See accompanying notes which are an integral part of the financial statements.
Annual Report
Financial Highlights - Class B
Years ended October 31, | 2010 | 2009 | 2008 | 2007 | 2006 |
Selected Per-Share Data | | | | | |
Net asset value, beginning of period | $ 28.18 | $ 23.25 | $ 46.70 | $ 36.12 | $ 30.36 |
Income from Investment Operations | | | | | |
Net investment income (loss)C | .08 | .12 | .15 | .08 | .08 |
Net realized and unrealized gain (loss) | 3.44 | 4.81 | (21.77) | 11.64 | 7.19 |
Total from investment operations | 3.52 | 4.93 | (21.62) | 11.72 | 7.27 |
Distributions from net investment income | (.06) | - | (.16) | (.16) | (.11) |
Distributions from net realized gain | (.04) | - | (1.67) | (.98) | (1.40) |
Total distributions | (.10) | - | (1.83) | (1.14) | (1.51) |
Redemption fees added to paid in capital C,G | - | - | - | - | - |
Net asset value, end of period | $ 31.60 | $ 28.18 | $ 23.25 | $ 46.70 | $ 36.12 |
Total ReturnA,B | 12.52% | 21.20% | (48.11)% | 33.37% | 24.91% |
Ratios to Average Net Assets D, F | | | | | |
Expenses before reductions | 2.12% | 2.16% | 2.19% | 2.14% | 2.27% |
Expenses net of fee waivers, if any | 2.12% | 2.16% | 2.19% | 2.14% | 2.25% |
Expenses net of all reductions | 2.08% | 2.11% | 2.15% | 2.10% | 2.19% |
Net investment income (loss) | .27% | .49% | .40% | .19% | .24% |
Supplemental Data | | | | | |
Net assets, end of period (in millions) | $ 14 | $ 16 | $ 15 | $ 17 | $ 4 |
Portfolio turnover rate E | 82% | 98% | 79% | 56% | 56% |
A Total returns would have been lower had certain expenses not been reduced during the periods shown.
B Total returns do not include the effect of the contingent deferred sales charge.
C Calculated based on average shares outstanding during the period.
D Fees and expenses of the underlying Fidelity Central Funds are not included in the Fund's expense ratio. The Fund indirectly bears its proportionate share of the expenses of any underlying Fidelity Central Funds.
E Amount does not include the portfolio activity of any underlying Fidelity Central Funds.
F Expense ratios reflect operating expenses of the class. Expenses before reductions do not reflect amounts reimbursed by the investment adviser or reductions from brokerage service arrangements or reductions from other expense offset arrangements and do not represent the amount paid by the class during periods when reimbursements or reductions occur. Expenses net of fee waivers reflect expenses after reimbursement by the investment adviser but prior to reductions from brokerage service arrangements or other expense offset arrangements. Expenses net of all reductions represent the net expenses paid by the class.
G Amount represents less than $.01 per share.
See accompanying notes which are an integral part of the financial statements.
Annual Report
Financial Highlights - Class C
Years ended October 31, | 2010 | 2009 | 2008 | 2007 | 2006 |
Selected Per-Share Data | | | | | |
Net asset value, beginning of period | $ 28.23 | $ 23.31 | $ 46.82 | $ 36.19 | $ 30.41 |
Income from Investment Operations | | | | | |
Net investment income (loss) C | .09 | .12 | .15 | .09 | .11 |
Net realized and unrealized gain (loss) | 3.45 | 4.82 | (21.82) | 11.66 | 7.19 |
Total from investment operations | 3.54 | 4.94 | (21.67) | 11.75 | 7.30 |
Distributions from net investment income | (.05) | (.02) | (.17) | (.14) | (.12) |
Distributions from net realized gain | (.04) | - | (1.67) | (.98) | (1.40) |
Total distributions | (.09) | (.02) | (1.84) | (1.12) | (1.52) |
Redemption fees added to paid in capital C,G | - | - | - | - | - |
Net asset value, end of period | $ 31.68 | $ 28.23 | $ 23.31 | $ 46.82 | $ 36.19 |
Total Return A,B | 12.54% | 21.22% | (48.10)% | 33.38% | 24.97% |
Ratios to Average Net Assets D, F | | | | | |
Expenses before reductions | 2.09% | 2.14% | 2.17% | 2.11% | 2.16% |
Expenses net of fee waivers, if any | 2.09% | 2.14% | 2.17% | 2.11% | 2.16% |
Expenses net of all reductions | 2.05% | 2.09% | 2.13% | 2.08% | 2.11% |
Net investment income (loss) | .30% | .51% | .42% | .22% | .33% |
Supplemental Data | | | | | |
Net assets, end of period (in millions) | $ 44 | $ 43 | $ 36 | $ 28 | $ 6 |
Portfolio turnover rate E | 82% | 98% | 79% | 56% | 56% |
A Total returns would have been lower had certain expenses not been reduced during the periods shown.
B Total returns do not include the effect of the contingent deferred sales charge.
C Calculated based on average shares outstanding during the period.
D Fees and expenses of the underlying Fidelity Central Funds are not included in the Fund's expense ratio. The Fund indirectly bears its proportionate share of the expenses of any underlying Fidelity Central Funds.
E Amount does not include the portfolio activity of any underlying Fidelity Central Funds.
F Expense ratios reflect operating expenses of the class. Expenses before reductions do not reflect amounts reimbursed by the investment adviser or reductions from brokerage service arrangements or reductions from other expense offset arrangements and do not represent the amount paid by the class during periods when reimbursements or reductions occur. Expenses net of fee waivers reflect expenses after reimbursement by the investment adviser but prior to reductions from brokerage service arrangements or other expense offset arrangements. Expenses net of all reductions represent the net expenses paid by the class.
G Amount represents less than $.01 per share.
See accompanying notes which are an integral part of the financial statements.
Annual Report
Financial Highlights - International Discovery
Years ended October 31, | 2010 | 2009 | 2008 | 2007 | 2006 |
Selected Per-Share Data | | | | | |
Net asset value, beginning of period | $ 28.79 | $ 23.88 | $ 47.68 | $ 36.67 | $ 30.65 |
Income from Investment Operations | | | | | |
Net investment income (loss) B | .40 | .37 | .57 | .53 | .48 |
Net realized and unrealized gain (loss) | 3.54 | 4.88 | (22.29) | 11.84 | 7.25 |
Total from investment operations | 3.94 | 5.25 | (21.72) | 12.37 | 7.73 |
Distributions from net investment income | (.35) | (.34) | (.41) | (.38) | (.31) |
Distributions from net realized gain | (.04) | - | (1.67) | (.98) | (1.40) |
Total distributions | (.39) | (.34) | (2.08) | (1.36) | (1.71) |
Redemption fees added to paid in capital B,F | - | - | - | - | - |
Net asset value, end of period | $ 32.34 | $ 28.79 | $ 23.88 | $ 47.68 | $ 36.67 |
Total Return A | 13.76% | 22.47% | (47.55)% | 34.85% | 26.34% |
Ratios to Average Net Assets C,E | | | | | |
Expenses before reductions | 1.05% | 1.12% | 1.09% | 1.04% | 1.09% |
Expenses net of fee waivers, if any | 1.05% | 1.12% | 1.09% | 1.04% | 1.08% |
Expenses net of all reductions | 1.00% | 1.07% | 1.05% | 1.00% | 1.03% |
Net investment income (loss) | 1.35% | 1.53% | 1.51% | 1.30% | 1.41% |
Supplemental Data | | | | | |
Net assets, end of period (in millions) | $ 8,133 | $ 8,114 | $ 6,999 | $ 14,176 | $ 8,054 |
Portfolio turnover rateD | 82% | 98% | 79% | 56% | 56% |
A Total returns would have been lower had certain expenses not been reduced during the periods shown.
B Calculated based on average shares outstanding during the period.
C Fees and expenses of the underlying Fidelity Central Funds are not included in the Fund's expense ratio. The Fund indirectly bears its proportionate share of the expenses of any underlying Fidelity Central Funds.
D Amount does not include the portfolio activity of any underlying Fidelity Central Funds.
E Expense ratios reflect operating expenses of the class. Expenses before reductions do not reflect amounts reimbursed by the investment adviser or reductions from brokerage service arrangements or reductions from other expense offset arrangements and do not represent the amount paid by the class during periods when reimbursements or reductions occur. Expenses net of fee waivers reflect expenses after reimbursement by the investment adviser but prior to reductions from brokerage service arrangements or other expense offset arrangements. Expenses net of all reductions represent the net expenses paid by the class.
F Amount represents less than $.01 per share.
See accompanying notes which are an integral part of the financial statements.
Annual Report
Financial Highlights - Class K
Years ended October 31, | 2010 | 2009 | 2008G |
Selected Per-Share Data | | | |
Net asset value, beginning of period | $ 28.78 | $ 23.90 | $ 40.32 |
Income from Investment Operations | | | |
Net investment income (loss)D | .46 | .44 | .10 |
Net realized and unrealized gain (loss) | 3.53 | 4.86 | (16.52) |
Total from investment operations | 3.99 | 5.30 | (16.42) |
Distributions from net investment income | (.41) | (.42) | - |
Distributions from net realized gain | (.04) | - | - |
Total distributions | (.45) | (.42) | - |
Redemption fees added to paid in capital D,I | - | - | - |
Net asset value, end of period | $ 32.32 | $ 28.78 | $ 23.90 |
Total ReturnB,C | 13.96% | 22.80% | (40.72)% |
Ratios to Average Net AssetsE,H | | | |
Expenses before reductions | .84% | .88% | .93%A |
Expenses net of fee waivers, if any | .84% | .88% | .93%A |
Expenses net of all reductions | .79% | .83% | .89%A |
Net investment income (loss) | 1.55% | 1.77% | .83%A |
Supplemental Data | | | |
Net assets, end of period (in millions) | $ 1,078 | $ 674 | $ 145 |
Portfolio turnover rateF | 82% | 98% | 79% |
A Annualized
B Total returns for period of less than one year are not annualized.
C Total returns would have been lower had certain expenses not been reduced during the periods shown.
D Calculated based on average shares outstanding during the period.
E Fees and expenses of the underlying Fidelity Central Funds are not included in the Fund's expense ratio. The Fund indirectly bears its proportionate share of the expenses of any underlying Fidelity Central Funds.
F Amount does not include the portfolio activity of any underlying Fidelity Central Funds.
G For the period May 9, 2008 (commencement of sale of shares) to October 31, 2008.
H Expense ratios reflect operating expenses of the class. Expenses before reductions do not reflect amounts reimbursed by the investment adviser or reductions from brokerage service arrangements or reductions from other expense offset arrangements and do not represent the amount paid by the class during periods when reimbursements or reductions occur. Expense ratios before reductions for start-up periods may not be representative of longer-term operating periods. Expenses net of fee waivers reflect expenses after reimbursement by the investment adviser but prior to reductions from brokerage service arrangements or other expense offset arrangements. Expenses net of all reductions represent the net expenses paid by the class.
I Amount represents less than $.01 per share.
See accompanying notes which are an integral part of the financial statements.
Annual Report
Financial Highlights - Institutional Class
Years ended October 31, | 2010 | 2009 | 2008 | 2007 | 2006 |
Selected Per-Share Data | | | | | |
Net asset value, beginning of period | $ 28.77 | $ 23.91 | $ 47.73 | $ 36.71 | $ 30.68 |
Income from Investment Operations | | | | | |
Net investment income (loss) B | .41 | .39 | .53 | .55 | .51 |
Net realized and unrealized gain (loss) | 3.55 | 4.86 | (22.24) | 11.85 | 7.25 |
Total from investment operations | 3.96 | 5.25 | (21.71) | 12.40 | 7.76 |
Distributions from net investment income | (.38) | (.39) | (.44) | (.40) | (.33) |
Distributions from net realized gain | (.04) | - | (1.67) | (.98) | (1.40) |
Total distributions | (.42) | (.39) | (2.11) | (1.38) | (1.73) |
Redemption fees added to paid in capital B,F | - | - | - | - | - |
Net asset value, end of period | $ 32.31 | $ 28.77 | $ 23.91 | $ 47.73 | $ 36.71 |
Total Return A | 13.84% | 22.52% | (47.51)% | 34.93% | 26.45% |
Ratios to Average Net Assets C,E | | | | | |
Expenses before reductions | .99% | 1.05% | 1.05% | .97% | 1.00% |
Expenses net of fee waivers, if any | .99% | 1.05% | 1.05% | .97% | 1.00% |
Expenses net of all reductions | .95% | 1.00% | 1.01% | .94% | .95% |
Net investment income (loss) | 1.40% | 1.60% | 1.54% | 1.36% | 1.49% |
Supplemental Data | | | | | |
Net assets, end of period (in millions) | $ 319 | $ 267 | $ 159 | $ 58 | $ 28 |
Portfolio turnover rateD | 82% | 98% | 79% | 56% | 56% |
A Total returns would have been lower had certain expenses not been reduced during the periods shown.
B Calculated based on average shares outstanding during the period.
C Fees and expenses of the underlying Fidelity Central Funds are not included in the Fund's expense ratio. The Fund indirectly bears its proportionate share of the expenses of any underlying Fidelity Central Funds.
D Amount does not include the portfolio activity of any underlying Fidelity Central Funds.
E Expense ratios reflect operating expenses of the class. Expenses before reductions do not reflect amounts reimbursed by the investment adviser or reductions from brokerage service arrangements or reductions from other expense offset arrangements and do not represent the amount paid by the class during periods when reimbursements or reductions occur. Expenses net of fee waivers reflect expenses after reimbursement by the investment adviser but prior to reductions from brokerage service arrangements or other expense offset arrangements. Expenses net of all reductions represent the net expenses paid by the class.
F Amount represents less than $.01 per share.
See accompanying notes which are an integral part of the financial statements.
Annual Report
Notes to Financial Statements
For the period ended October 31, 2010
(Amounts in thousands except ratios)
1. Organization.
Fidelity International Discovery Fund (the Fund) is a fund of Fidelity Investment Trust (the Trust) and is authorized to issue an unlimited number of shares. The Trust is registered under the Investment Company Act of 1940, as amended (the 1940 Act), as an open-end management investment company organized as a Massachusetts business trust. The Fund offers Class A, Class T, Class C, International Discovery, Class K and Institutional Class shares, each of which has equal rights as to assets and voting privileges. Effective after the close of business on September 1, 2010, Class B shares were closed to new accounts and additional purchases by existing shareholders. Each class has exclusive voting rights with respect to matters that affect that class. Class B shares will automatically convert to Class A shares after a holding period of seven years from the initial date of purchase. Investment income, realized and unrealized capital gains and losses, the common expenses of the Fund, and certain fund-level expense reductions, if any, are allocated on a pro-rata basis to each class based on the relative net assets of each class to the total net assets of the Fund. Each class differs with respect to transfer agent and distribution and service plan fees incurred. Certain expense reductions also differ by class. The Fund's investments in emerging markets can be subject to social, economic, regulatory, and political uncertainties and can be extremely volatile.
2. Investments in Fidelity Central Funds.
The Fund may invest in Fidelity Central Funds, which are open-end investment companies available only to other investment companies and accounts managed by Fidelity Management & Research Company (FMR) and its affiliates. The Fund's Schedule of Investments lists each of the Fidelity Central Funds held as of period end, if any, as an investment of the Fund, but does not include the underlying holdings of each Fidelity Central Fund. As an Investing Fund, the Fund indirectly bears its proportionate share of the expenses of the underlying Fidelity Central Funds.
The Money Market Central Funds seek preservation of capital and current income and are managed by Fidelity Investments Money Management, Inc. (FIMM), an affiliate of FMR.
A complete unaudited list of holdings for each Fidelity Central Fund is available upon request or at the Securities and Exchange Commission (the SEC) web site at www.sec.gov. In addition, the financial statements of the Fidelity Central Funds, which are not covered by the Fund's Report of Independent Registered Public Accounting Firm, are available on the SEC web site or upon request.
Annual Report
Notes to Financial Statements - continued
(Amounts in thousands except ratios)
3. Significant Accounting Policies.
The financial statements have been prepared in conformity with accounting principles generally accepted in the United States of America (GAAP), which require management to make certain estimates and assumptions at the date of the financial statements.
Actual results could differ from those estimates. The following summarizes the significant accounting policies of the Fund:
Security Valuation. Investments are valued as of 4:00 p.m. Eastern time on the last calendar day of the period. The Fund uses independent pricing services approved by the Board of Trustees to value its investments. When current market prices or quotations are not readily available or reliable, valuations may be determined in good faith in accordance with procedures adopted by the Board of Trustees. Factors used in determining value may include market or security specific events. The frequency with which these procedures are used cannot be predicted and they may be utilized to a significant extent. The value used for net asset value (NAV) calculation under these procedures may differ from published prices for the same securities.
The Fund categorizes the inputs to valuation techniques used to value its investments into a disclosure hierarchy consisting of three levels as shown below.
Level 1 - quoted prices in active markets for identical investments
Level 2 - other significant observable inputs (including quoted prices for similar investments, interest rates, prepayment speeds, etc.)
Level 3 - unobservable inputs (including the fund's own assumptions based on the best information available)
Changes in valuation techniques may result in transfers in or out of an assigned level within the disclosure hierarchy. The aggregate value of investments by input level, as of October 31, 2010, as well as a roll forward of Level 3 securities, is included at the end of the Fund's Schedule of Investments. Valuation techniques used to value the Fund's investments by major category are as follows.
Equity securities, including restricted securities, for which market quotations are readily available, are valued at the last reported sale price or official closing price as reported by an independent pricing service on the primary market or exchange on which they are traded and are categorized as Level 1 in the hierarchy. In the event there were no sales during the day or closing prices are not available, securities are valued at the last quoted bid price or may be valued using the last available price and are generally categorized as Level 2 in the hierarchy. For foreign equity securities, when significant market or security specific events arise, comparisons to the valuation of American Depositary Receipts
Annual Report
3. Significant Accounting Policies - continued
Security Valuation - continued
(ADRs), futures contracts, Exchange-traded funds (ETFs) and certain indexes as well as quoted prices for similar securities are used and are categorized as Level 2 in the hierarchy in these circumstances. Utilizing these techniques may result in significant transfers between Level 1 and Level 2. For restricted equity securities and private placements where observable inputs are limited, assumptions about market activity and risk are used and are categorized as Level 3 in the hierarchy.
Investments in open-end mutual funds,including the Fidelity Central Funds, are valued at their closing net asset value each business day and are categorized as Level 1 in the hierarchy. Short-term securities with remaining maturities of sixty days or less for which quotations are not readily available are valued at amortized cost, which approximates fair value and are categorized as Level 2 in the hierarchy.
Foreign Currency. The Fund uses foreign currency contracts to facilitate transactions in foreign-denominated securities. Gains and losses from these transactions may arise from changes in the value of the foreign currency or if the counterparties do not perform under the contracts' terms.
Foreign-denominated assets, including investment securities, and liabilities are translated into U.S. dollars at the exchange rate at period end. Purchases and sales of investment securities, income and dividends received and expenses denominated in foreign currencies are translated into U.S. dollars at the exchange rate in effect on the transaction date.
The effects of exchange rate fluctuations on investments are included with the net realized and unrealized gain (loss) on investment securities. Other foreign currency transactions resulting in realized and unrealized gain (loss) are disclosed separately.
Investment Transactions and Income. For financial reporting purposes, the Fund's investment holdings and NAV include trades executed through the end of the last business day of the period. The NAV per share for processing shareholder transactions is calculated as of the close of business of the New York Stock Exchange (NYSE), normally 4:00 p.m. Eastern time and includes trades executed through the end of the prior business day. Gains and losses on securities sold are determined on the basis of identified cost and may include proceeds received from litigation. Dividend income is recorded on the ex-dividend date, except for certain dividends from foreign securities where the ex-dividend date may have passed, which are recorded as soon as the Fund is informed of the ex-dividend date. Non-cash dividends included in dividend income, if any, are recorded at the fair market value of the securities received. Distributions received on securities that represent a return of capital or capital gain are recorded as a reduction of cost of investments and/or as a realized gain. The Fund estimates the components of
Annual Report
Notes to Financial Statements - continued
(Amounts in thousands except ratios)
3. Significant Accounting Policies - continued
Investment Transactions and Income - continued
distributions received that may be considered return of capital distributions or capital gain distributions. Interest income and distributions from the Fidelity Central Funds are accrued as earned. Interest income includes coupon interest and amortization of premium and accretion of discount on debt securities. Investment income is recorded net of foreign taxes withheld where recovery of such taxes is uncertain.
Expenses. Most expenses of the Trust can be directly attributed to a fund. Expenses which cannot be directly attributed are apportioned amongst each fund in the Trust. Expense estimates are accrued in the period to which they relate and adjustments are made when actual amounts are known.
Deferred Trustee Compensation. Under a Deferred Compensation Plan (the Plan), independent Trustees may elect to defer receipt of a portion of their annual compensation. Deferred amounts are invested in a cross-section of Fidelity funds, are marked-to-market and remain in the Fund until distributed in accordance with the Plan. The investment of deferred amounts and the offsetting payable to the Trustees are included in the accompanying Statement of Assets and Liabilities.
Income Tax Information and Distributions to Shareholders. Each year the Fund intends to qualify as a regulated investment company, including distributing substantially all of its taxable income and realized gains under Subchapter M of the Internal Revenue Code and filing its U.S. federal tax return. As a result, no provision for income taxes is required. As of October 31, 2010, the Fund did not have any unrecognized tax benefits in the accompanying financial statements. A fund's federal tax return is subject to examination by the Internal Revenue Service (IRS) for a period of three years. Foreign taxes are provided for based on the Fund's understanding of the tax rules and rates that exist in the foreign markets in which it invests. The Fund is subject to a tax imposed on short term capital gains on securities of certain issuers domiciled in India. The Fund records an estimated deferred tax liability included in Other payables and accrued expenses in the accompanying Statement of Assets & Liabilities for net unrealized gains on these securities in an amount that would be payable if the securities were disposed of at period end.
Distributions are declared and recorded on the ex-dividend date. Income dividends and capital gain distributions are declared separately for each class. Income and capital gain distributions are determined in accordance with income tax regulations, which may differ from GAAP.
Annual Report
3. Significant Accounting Policies - continued
Income Tax Information and Distributions to Shareholders - continued
Capital accounts within the financial statements are adjusted for permanent book-tax differences. These adjustments have no impact on net assets or the results of operations. Temporary book-tax differences will reverse in a subsequent period.
Book-tax differences are primarily due to the short-term gain distributions from the Fidelity Central Funds, foreign currency transactions, certain foreign taxes, passive foreign investment companies (PFIC), deferred trustees compensation, capital loss carryforwards and losses deferred due to wash sales.
The federal tax cost of investment securities and unrealized appreciation (depreciation) as of period end were as follows:
Gross unrealized appreciation | $ 1,665,347 |
Gross unrealized depreciation | (554,558) |
Net unrealized appreciation (depreciation) | $ 1,110,789 |
| |
Tax Cost | $ 9,060,967 |
The tax-based components of distributable earnings as of period end were as follows:
Undistributed ordinary income | $ 167,811 |
Capital loss carryforward | $ (1,803,058) |
Net unrealized appreciation (depreciation) | $ 1,112,591 |
The tax character of distributions paid was as follows:
| October 31, 2010 | October 31, 2009 |
Ordinary Income | $ 129,796 | $ 107,705 |
Short-Term Trading (Redemption) Fees. Shares held by investors in the Fund less than 30 days are subject to a redemption fee equal to 1.00% of the net asset value of shares redeemed. All redemption fees, which reduce the proceeds of the shareholder redemption, are retained by the Fund and accounted for as an addition to paid in capital.
4. Operating Policies.
Repurchase Agreements. FMR has received an Exemptive Order from the SEC which permits the Fund and other affiliated entities of FMR to transfer uninvested cash balances into joint trading accounts which are then invested in repurchase agreements.
Annual Report
Notes to Financial Statements - continued
(Amounts in thousands except ratios)
4. Operating Policies - continued
Repurchase Agreements - continued
The Fund may also invest directly with institutions in repurchase agreements. Repurchase agreements are collateralized by government or non-government securities. Upon settlement date, collateral is held in segregated accounts with custodian banks and may be obtained in the event of a default of the counterparty. The Fund monitors, on a daily basis, the value of the collateral to ensure it is at least equal to the principal amount of the repurchase agreement (including accrued interest). In the event of a default by the counterparty, realization of the collateral proceeds could be delayed, during which time the value of the collateral may decline.
Restricted Securities. The Fund may invest in securities that are subject to legal or contractual restrictions on resale. These securities generally may be resold in transactions exempt from registration or to the public if the securities are registered. Disposal of these securities may involve time-consuming negotiations and expense, and prompt sale at an acceptable price may be difficult. Information regarding restricted securities is included at the end of the Fund's Schedule of Investments.
5. Purchases and Sales of Investments.
Purchases and sales of securities, other than short-term securities, aggregated $7,811,097 and $8,569,062, respectively.
6. Fees and Other Transactions with Affiliates.
Management Fee. FMR and its affiliates provide the Fund with investment management related services for which the Fund pays a monthly management fee. The management fee is the sum of an individual fund fee rate that is based on an annual rate of .45% of the Fund's average net assets and a group fee rate that averaged .26% during the period. The group fee rate is based upon the average net assets of all the mutual funds advised by FMR. The group fee rate decreases as assets under management increase and increases as assets under management decrease. In addition, the management fee is subject to a performance adjustment (up to a maximum of ± 20% of the Fund's average net assets over a 36 month performance period). The upward or downward adjustment to the management fee is based on the relative investment performance of International Discovery share class as compared to an appropriate benchmark index. For the period, the total annual management fee rate, including the performance adjustment, was .75% of the Fund's average net assets.
Annual Report
6. Fees and Other Transactions with Affiliates - continued
Distribution and Service Plan Fees. In accordance with Rule 12b-1 of the 1940 Act, the Fund has adopted separate Distribution and Service Plans for each class of shares. Certain classes pay Fidelity Distributors Corporation (FDC), an affiliate of FMR, separate Distribution and Service Fees, each of which is based on an annual percentage of each class' average net assets. In addition, FDC may pay financial intermediaries for selling shares of the Fund and providing shareholder support services. For the period, the Distribution and Service Fee rates, total fees and amounts retained by FDC were as follows:
| Distribution
Fee | Service
Fee | Total
Fees | Retained
by FDC |
Class A | -% | .25% | $ 1,036 | $ 43 |
Class T | .25% | .25% | 447 | -* |
Class B | .75% | .25% | 156 | 117 |
Class C | .75% | .25% | 445 | 40 |
| | | $ 2,084 | $ 200 |
* Amount represents four hundred sixty dollars.
Sales Load. FDC receives a front-end sales charge of up to 5.75% for selling Class A shares, and 3.50% for selling Class T shares, some of which is paid to financial intermediaries for selling shares of the Fund. FDC receives the proceeds of contingent deferred sales charges levied on Class A, Class T, Class B, and Class C redemptions. These charges depend on the holding period. The deferred sales charges range from 5% to 1% for Class B, 1% for Class C, 1.00% for certain purchases of Class A shares (1.00% to .50% prior to July 12, 2010) and .25% for certain purchases of Class T shares.
For the period, sales charge amounts retained by FDC were as follows:
| Retained
by FDC |
Class A | $ 65 |
Class T | 12 |
Class B* | 31 |
Class C* | 2 |
| $ 110 |
* When Class B and Class C shares are initially sold, FDC pays commissions from its own resources to financial intermediaries through which the sales are made.
Transfer Agent Fees. Fidelity Investments Institutional Operations Company, Inc. (FIIOC), an affiliate of FMR, is the transfer, dividend disbursing and shareholder servicing agent for each class of the Fund. FIIOC receives account fees and asset-based fees that vary according to the account size and type of account of the shareholders of the respective classes of the Fund, except for Class K. FIIOC receives an asset-based fee of Class K's average net assets. FIIOC pays for typesetting, printing and mailing of
Annual Report
Notes to Financial Statements - continued
(Amounts in thousands except ratios)
6. Fees and Other Transactions with Affiliates - continued
Transfer Agent Fees - continued
shareholder reports, except proxy statements. For the period, transfer agent fees for each class were as follows:
| Amount | % of
Average
Net Assets |
Class A | $ 1,216 | .29 |
Class T | 281 | .31 |
Class B | 52 | .33 |
Class C | 136 | .31 |
International Discovery | 20,622 | .26 |
Class K | 437 | .05 |
Institutional Class | 627 | .20 |
| $ 23,371 | |
Accounting and Security Lending Fees. Fidelity Service Company, Inc. (FSC), an affiliate of FMR, maintains the Fund's accounting records. The accounting fee is based on the level of average net assets for the month. Under a separate contract, FSC administers the security lending program. The security lending fee is based on the number and duration of lending transactions.
Brokerage Commissions. The Fund placed a portion of its portfolio transactions with brokerage firms which are affiliates of the investment adviser. The commissions paid to these affiliated firms were $10 for the period.
Interfund Lending Program. Pursuant to an Exemptive Order issued by the SEC, the Fund, along with other registered investment companies having management contracts with FMR, may participate in an interfund lending program. This program provides an alternative credit facility allowing the funds to borrow from, or lend money to, other participating affiliated funds. At period end there was no interfund loans outstanding. The Fund's activity in this program during the period for which loans were outstanding was as follows:
Borrower or Lender | Average Daily
Loan Balance | Weighted Average
Interest Rate | Interest
Expense |
Borrower | $ 31,133 | .45% | $ 12 |
Annual Report
7. Committed Line of Credit.
The Fund participates with other funds managed by FMR or an affiliate in a $3.75 billion credit facility (the "line of credit") to be utilized for temporary or emergency purposes to fund shareholder redemptions or for other short-term liquidity purposes. The Fund has agreed to pay commitment fees on its pro-rata portion of the line of credit, which amounted to $38 and is reflected in Miscellaneous expenses on the Statement of Operations. During the period, there were no borrowings on this line of credit.
8. Security Lending.
The Fund lends portfolio securities through a lending agent from time to time in order to earn additional income. The lending agent may loan securities to certain qualified borrowers, including Fidelity Capital Markets (FCM), a broker-dealer affiliated with the Fund. On the settlement date of the loan, the Fund receives collateral (in the form of U.S. Treasury obligations, letters of credit and/or cash) against the loaned securities and maintains collateral in an amount not less than 100% of the market value of the loaned securities during the period of the loan. The market value of the loaned securities is determined at the close of business of the Fund and any additional required collateral is delivered to the Fund on the next business day. If the borrower defaults on its obligation to return the securities loaned because of insolvency or other reasons, a fund could experience delays and costs in recovering the securities loaned or in gaining access to the collateral. Any cash collateral received is invested in the Fidelity Securities Lending Cash Central Fund. The value of loaned securities and cash collateral at period end are disclosed on the Fund's Statement of Assets and Liabilities. Security lending income represents the income earned on investing cash collateral, less rebates paid to borrowers and lending agent fees associated with the loan, plus any premium payments received for lending certain types of securities. Security lending income is presented in the Statement of Operations as a component of income from Fidelity Central Funds. Total security lending income during the period amounted to $6,155. During the period, there were no securities loaned to FCM.
9. Bank Borrowings.
The Fund is permitted to have bank borrowings for temporary or emergency purposes to fund shareholder redemptions. The Fund has established borrowing arrangements with certain banks. The interest rate on the borrowings is the bank's base rate, as revised from time to time. The average daily loan balance during the period for which loans were outstanding amounted to $8,212. The weighted average interest rate was .71%. The interest expense amounted to one hundred sixty-two dollars under the bank borrowing program. At period end, there were no bank borrowings outstanding.
Annual Report
Notes to Financial Statements - continued
(Amounts in thousands except ratios)
10. Expense Reductions.
Many of the brokers with whom FMR places trades on behalf of the Fund provided services to the Fund in addition to trade execution. These services included payments of certain expenses on behalf of the Fund totaling $4,562 for the period.
11. Distributions to Shareholders.
Distributions to shareholders of each class were as follows:
Years ended October 31, | 2010 | 2009 |
From net investment income | | |
Class A | $ 3,889 | $ 3,982 |
Class T | 633 | 533 |
Class B | 37 | - |
Class C | 71 | 30 |
International Discovery | 98,508 | 96,783 |
Class K | 9,602 | 3,616 |
Institutional Class | 3,682 | 2,761 |
Total | $ 116,422 | $ 107,705 |
From net realized gain | | |
Class A | $ 555 | $ - |
Class T | 119 | - |
Class B | 23 | - |
Class C | 61 | - |
International Discovery | 11,290 | - |
Class K | 935 | - |
Institutional Class | 391 | - |
Total | $ 13,374 | $ - |
12. Share Transactions.
Transactions for each class of shares were as follows:
| Shares | Dollars |
Years ended October 31, | 2010 | 2009A | 2010 | 2009A |
Class A | | | | |
Shares sold | 4,849 | 5,354 | $ 142,203 | $ 128,318 |
Reinvestment of distributions | 120 | 132 | 3,654 | 2,786 |
Shares redeemed | (7,259) | (7,017) | (215,574) | (163,223) |
Net increase (decrease) | (2,290) | (1,531) | $ (69,717) | $ (32,119) |
Annual Report
12. Share Transactions - continued
| Shares | Dollars |
Years ended October 31, | 2010 | 2009A | 2010 | 2009A |
Class T | | | | |
Shares sold | 1,165 | 1,335 | $ 34,154 | $ 31,263 |
Reinvestment of distributions | 24 | 24 | 716 | 507 |
Shares redeemed | (1,228) | (1,140) | (35,631) | (25,765) |
Net increase (decrease) | (39) | 219 | $ (761) | $ 6,005 |
Class B | | | | |
Shares sold | 105 | 161 | $ 3,047 | $ 3,835 |
Reinvestment of distributions | 2 | - | 54 | - |
Shares redeemed | (227) | (227) | (6,544) | (5,155) |
Net increase (decrease) | (120) | (66) | $ (3,443) | $ (1,320) |
Class C | | | | |
Shares sold | 356 | 920 | $ 10,567 | $ 20,539 |
Reinvestment of distributions | 4 | 1 | 116 | 26 |
Shares redeemed | (515) | (953) | (14,926) | (22,201) |
Net increase (decrease) | (155) | (32) | $ (4,243) | $ (1,636) |
International Discovery | | | | |
Shares sold | 55,460 | 74,803 | $ 1,640,231 | $ 1,831,653 |
Conversion to Class K | - | (12,549) | - | (279,461) |
Reinvestment of distributions | 3,453 | 4,362 | 105,461 | 92,471 |
Shares redeemed | (89,239) | (77,871) | (2,636,183) | (1,831,786) |
Net increase (decrease) | (30,326) | (11,255) | $ (890,491) | $ (187,123) |
Class K | | | | |
Shares sold | 16,961 | 10,015 | $ 491,304 | $ 246,074 |
Conversion from International Discovery | - | 12,572 | - | 279,461 |
Reinvestment of distributions | 346 | 171 | 10,537 | 3,616 |
Shares redeemed | (7,377) | (5,401) | (215,813) | (128,754) |
Net increase (decrease) | 9,930 | 17,357 | $ 286,028 | $ 400,397 |
Institutional Class | | | | |
Shares sold | 4,322 | 10,440 | $ 127,580 | $ 235,326 |
Reinvestment of distributions | 36 | 41 | 1,083 | 875 |
Shares redeemed | (3,773) | (7,843) | (108,068) | (169,915) |
Net increase (decrease) | 585 | 2,638 | $ 20,595 | $ 66,286 |
A Conversion transactions for Class K and International Discovery are for the period November 1, 2008 though August 31, 2009.
Annual Report
Notes to Financial Statements - continued
(Amounts in thousands except ratios)
13. Other.
The Fund's organizational documents provide former and current trustees and officers with a limited indemnification against liabilities arising in connection with the performance of their duties to the Fund. In the normal course of business, the Fund may also enter into contracts that provide general indemnifications. The Fund's maximum exposure under these arrangements is unknown as this would be dependent on future claims that may be made against the Fund. The risk of material loss from such claims is considered remote.
Annual Report
To the Trustees of Fidelity Investment Trust and the Shareholders of Fidelity International Discovery Fund:
In our opinion, the accompanying statement of assets and liabilities, including the schedule of investments, and the related statements of operations and of changes in net assets and the financial highlights present fairly, in all material respects, the financial position of Fidelity International Discovery Fund (a fund of Fidelity Investment Trust) at October 31, 2010, the results of its operations for the year then ended, the changes in its net assets for each of the two years in the period then ended and the financial highlights for each of the five years in the period then ended, in conformity with accounting principles generally accepted in the United States of America. These financial statements and financial highlights (hereafter referred to as "financial statements") are the responsibility of the Fidelity International Discovery Fund's management. Our responsibility is to express an opinion on these financial statements based on our audits. We conducted our audits of these financial statements in accordance with the standards of the Public Company Accounting Oversight Board (United States). Those standards require that we plan and perform the audit to obtain reasonable assurance about whether the financial statements are free of material misstatement. An audit includes examining, on a test basis, evidence supporting the amounts and disclosures in the financial statements, assessing the accounting principles used and significant estimates made by management, and evaluating the overall financial statement presentation. We believe that our audits, which included confirmation of securities at October 31, 2010 by correspondence with the custodian and brokers, provide a reasonable basis for our opinion.
/s/ PricewaterhouseCoopers LLP
PricewaterhouseCoopers LLP
Boston, Massachusetts
December 17, 2010
Annual Report
The Trustees, Member of the Advisory Board, and executive officers of the trust and fund, as applicable, are listed below. The Board of Trustees governs the fund and is responsible for protecting the interests of shareholders. The Trustees are experienced executives who meet periodically throughout the year to oversee the fund's activities, review contractual arrangements with companies that provide services to the fund, oversee management of the risks associated with such activities and contractual arrangements, and review the fund's performance. Except for James C. Curvey, each of the Trustees oversees 221 funds advised by FMR or an affiliate. Mr. Curvey oversees 410 funds advised by FMR or an affiliate.
The Trustees hold office without limit in time except that (a) any Trustee may resign; (b) any Trustee may be removed by written instrument, signed by at least two-thirds of the number of Trustees prior to such removal; (c) any Trustee who requests to be retired or who has become incapacitated by illness or injury may be retired by written instrument signed by a majority of the other Trustees; and (d) any Trustee may be removed at any special meeting of shareholders by a two-thirds vote of the outstanding voting securities of the trust. Each Trustee who is not an interested person (as defined in the 1940 Act) (Independent Trustee), shall retire not later than the last day of the calendar year in which his or her 72nd birthday occurs. The Independent Trustees may waive this mandatory retirement age policy with respect to individual Trustees. The executive officers and Advisory Board Member hold office without limit in time, except that any officer and Advisory Board Member may resign or may be removed by a vote of a majority of the Trustees at any regular meeting or any special meeting of the Trustees. Except as indicated, each individual has held the office shown or other offices in the same company for the past five years.
Experience, Skills, Attributes, and Qualifications of the Fund's Trustees. The Governance and Nominating Committee has adopted a statement of policy that describes the experience, qualifications, attributes, and skills that are necessary and desirable for potential Independent Trustee candidates (Statement of Policy). The Board believes that each Trustee satisfied at the time he or she was initially elected or appointed a Trustee, and continues to satisfy, the standards contemplated by the Statement of Policy. The Governance and Nominating Committee also engages professional search firms to help identify potential Independent Trustee candidates who have the experience, qualifications, attributes, and skills consistent with the Statement of Policy. From time to time, additional criteria based on the composition and skills of the current Independent Trustees, as well as experience or skills that may be appropriate in light of future changes to board composition, business conditions, and regulatory or other developments, have also been considered by the professional search firms and the Governance and Nominating Committee. In addition, the Board takes into account the Trustees' commitment and participation in Board and committee meetings, as well as their leadership of standing and ad hoc committees throughout their tenure.
In determining that a particular Trustee was and continues to be qualified to serve as a Trustee, the Board has considered a variety of criteria, none of which, in isolation, was controlling. The Board believes that, collectively, the Trustees have balanced and diverse experience, qualifications, attributes, and skills, which allow the Board to operate effectively in governing the fund and protecting the interests of shareholders. Information about the specific experience, skills, attributes, and qualifications of each Trustee, which in each case led to the Board's conclusion that the Trustee should serve (or continue to serve) as a trustee of the fund, is provided below.
Annual Report
Trustees and Officers - continued
Board Structure and Oversight Function. Edward C. Johnson 3d is an interested person (as defined in the 1940 Act) and currently serves as Chairman. The Trustees have determined that an interested Chairman is appropriate and benefits shareholders because an interested Chairman has a personal and professional stake in the quality and continuity of services provided to the fund. Independent Trustees exercise their informed business judgment to appoint an individual of their choosing to serve as Chairman, regardless of whether the Trustee happens to be independent or a member of management. The Independent Trustees have determined that they can act independently and effectively without having an Independent Trustee serve as Chairman and that a key structural component for assuring that they are in a position to do so is for the Independent Trustees to constitute a substantial majority for the Board. The Independent Trustees also regularly meet in executive session. Ned C. Lautenbach serves as Chairman of the Independent Trustees and as such (i) acts as a liaison between the Independent Trustees and management with respect to matters important to the Independent Trustees and (ii) with management prepares agendas for Board meetings.
Fidelity funds are overseen by different Boards of Trustees. The fund's Board oversees Fidelity's equity and high income funds and another Board oversees Fidelity's investment-grade bond, money market, and asset allocation funds. The asset allocation funds may invest in Fidelity funds overseen by the fund's Board. The use of separate Boards, each with its own committee structure, allows the Trustees of each group of Fidelity funds to focus on the unique issues of the funds they oversee, including common research, investment, and operational issues. On occasion, the separate Boards establish joint committees to address issues of overlapping consequences for the Fidelity funds overseen by each Board.
The Trustees operate using a system of committees to facilitate the timely and efficient consideration of all matters of importance to the Trustees, the fund, and fund shareholders and to facilitate compliance with legal and regulatory requirements and oversight of the fund's activities and associated risks. The Board, acting through its committees, has charged FMR and its affiliates with (i) identifying events or circumstances the occurrence of which could have demonstrably adverse effects on the fund's business and/or reputation; (ii) implementing processes and controls to lessen the possibility that such events or circumstances occur or to mitigate the effects of such events or circumstances if they do occur; and (iii) creating and maintaining a system designed to evaluate continuously business and market conditions in order to facilitate the identification and implementation processes described in (i) and (ii) above. Because the day-to-day operations and activities of the fund are carried out by or through FMR, its affiliates and other service providers, the fund's exposure to risks is mitigated but not eliminated by the processes overseen by the Trustees. While each of the Board's committees has responsibility for overseeing different aspects of the fund's activities, oversight is exercised primarily through the Operations, Audit, and Compliance Committees. Appropriate personnel, including but not limited to the fund's Chief Compliance Officer (CCO), FMR's internal auditor, the independent accountants, the fund's Treasurer and portfolio management personnel, make periodic reports to the Board's committees, as appropriate. The responsibilities of each committee, including their oversight responsibilities, are described further under "Standing Committees of the Fund's Trustees."
Annual Report
The fund's Statement of Additional Information (SAI) includes more information about the Trustees. To request a free copy, call Fidelity at 1-877-208-0098.
Interested Trustees*:
Correspondence intended for each Trustee who is an interested person may be sent to Fidelity Investments, 82 Devonshire Street, Boston, Massachusetts 02109.
Name, Age; Principal Occupations and Other Relevant Experience+ |
Edward C. Johnson 3d (80) |
| Year of Election or Appointment: 1984 Mr. Johnson is Trustee and Chairman of the Board of Trustees of certain Trusts. Mr. Johnson serves as Chief Executive Officer, Chairman, and a Director of FMR LLC; Chairman and a Director of FMR; Chairman and a Director of Fidelity Research & Analysis Company (FRAC); Chairman and a Director of Fidelity Investments Money Management, Inc.; and Chairman and a Director of FMR Co., Inc. In addition, Mr. Johnson serves as Chairman and Director of FIL Limited. Previously, Mr. Johnson served as President of FMR LLC (2006-2007). |
James C. Curvey (75) |
| Year of Election or Appointment: 2007 Mr. Curvey also serves as Trustee (2007-present) of other investment companies advised by FMR. Mr. Curvey is a Director of Fidelity Investments Money Management, Inc. (2009-present), Director of Fidelity Research & Analysis Co. (2009-present) and Director of FMR and FMR Co., Inc. (2007-present). Mr. Curvey is also Vice Chairman (2007-present) and Director of FMR LLC. In addition, Mr. Curvey serves as an Overseer for the Boston Symphony Orchestra and a member of the Trustees of Villanova University. Previously, Mr. Curvey was the Vice Chairman (2006-2007) and Director (2000-2007) of FMR Corp. |
Annual Report
Trustees and Officers - continued
* Trustees have been determined to be "Interested Trustees" by virtue of, among other things, their affiliation with the trust or various entities under common control with FMR.
+ The information above includes each Trustee's principal occupation during the last five years and other information relating to the experience, attributes, and skills relevant to each Trustee's qualifications to serve as a Trustee, which led to the conclusion that each Trustee should serve as a Trustee for the fund.
Independent Trustees:
Correspondence intended for each Independent Trustee (that is, the Trustees other than the Interested Trustees) may be sent to Fidelity Investments, P.O. Box 55235, Boston, Massachusetts 02205-5235.
Name, Age; Principal Occupations and Other Relevant Experience+ |
Dennis J. Dirks (62) |
| Year of Election or Appointment: 2005 Prior to his retirement in May 2003, Mr. Dirks was Chief Operating Officer and a member of the Board of The Depository Trust & Clearing Corporation (DTCC). He also served as President, Chief Operating Officer, and Board member of The Depository Trust Company (DTC) and President and Board member of the National Securities Clearing Corporation (NSCC). In addition, Mr. Dirks served as Chief Executive Officer and Board member of the Government Securities Clearing Corporation, Chief Executive Officer and Board member of the Mortgage-Backed Securities Clearing Corporation, as a Trustee and a member of the Finance Committee of Manhattan College (2005-2008), and as a Trustee and a member of the Finance Committee of AHRC of Nassau County (2006-2008). Mr. Dirks is a member of the Independent Directors Council (IDC) Governing Council (2010-Present) and Board of Directors for The Brookville Center for Children's Services, Inc. (2009-present). |
Alan J. Lacy (57) |
| Year of Election or Appointment: 2008 Mr. Lacy serves as Senior Adviser (2007-present) of Oak Hill Capital Partners, L.P. (private equity). Mr. Lacy also served as Chief Executive Officer (2000-2005) and Vice Chairman (2005-2006) of Sears Holdings Corporation and Sears, Roebuck and Co. (retail). In addition, Mr. Lacy serves as a member of the Board of Directors of The Western Union Company (global money transfer, 2006-present) and Bristol-Myers Squibb Company (global pharmaceuticals, 2007-present). Mr. Lacy is Chairman (2008-present) and a member (2006-present) of the Board of Trustees of The National Parks Conservation Association. |
Ned C. Lautenbach (66) |
| Year of Election or Appointment: 2000 Mr. Lautenbach is Chairman of the Independent Trustees of the Equity and High Income Funds (2006-present). Mr. Lautenbach currently serves as the Lead Director of the Eaton Corporation Board of Directors (diversified industrial, 1997-present). Mr. Lautenbach is also a member of the Board of Directors of the Philharmonic Center for the Arts in Naples, Florida (1999-present); a member of the Board of Trustees of Fairfield University (2005-present); and a member of the Council on Foreign Relations (1994-present). Previously, Mr. Lautenbach was a Partner/Advisory Partner at Clayton, Dubilier & Rice, Inc. (private equity investment, 1998-2010), as well as a Director of Sony Corporation (2006-2007). |
Joseph Mauriello (66) |
| Year of Election or Appointment: 2008 Prior to his retirement in January 2006, Mr. Mauriello served in numerous senior management positions including Deputy Chairman and Chief Operating Officer (2004-2005), and Vice Chairman of Financial Services (2002-2004) of KPMG LLP US (professional services, 1965-2005). Mr. Mauriello currently serves as a member of the Board of Directors of XL Group plc. (global insurance and re-insurance, 2006-present) and of Arcadia Resources Inc. (health care services and products, 2007-present). Previously, Mr. Mauriello served as a Director of the Hamilton Funds of the Bank of New York (2006-2007). |
Cornelia M. Small (66) |
| Year of Election or Appointment: 2005 Ms. Small is a member of the Board of Directors of the Teagle Foundation (2009-present). Ms. Small is also a member of the Investment Committee, and Chair (2008-present) and a member of the Board of Trustees of Smith College. In addition, Ms. Small serves on the Investment Committee of the Berkshire Taconic Community Foundation (2008-present). Previously, Ms. Small served as Chairperson of the Investment Committee (2002- 2008) of Smith College. In addition, Ms. Small served as Chief Investment Officer, Director of Global Equity Investments, and a member of the Board of Directors of Scudder, Stevens & Clark and Scudder Kemper Investments. |
William S. Stavropoulos (71) |
| Year of Election or Appointment: 2001 Mr. Stavropoulos is Vice Chairman of the Independent Trustees of the Equity and High Income Funds (2006-present). Mr. Stavropoulos serves as President and Founder of the Michigan Baseball Foundation, the Great Lakes Loons (2007-present). Mr. Stavropoulos is Chairman Emeritus of the Board of Directors of The Dow Chemical Company, where he previously served in numerous senior management positions, including President, CEO (1995-2000; 2002-2004), Chairman of the Executive Committee (2000-2006), and as a member of the Board of Directors (1990-2006). Currently, Mr. Stavropoulos is Chairman of Univar (global distributor of commodity and specialty chemicals, 2010-present), a Director of Teradata Corporation (data warehousing and technology solutions, 2008-present), Chemical Financial Corporation, Maersk Inc. (industrial conglomerate), Tyco International, Inc. (multinational manufacturing and services, 2007-present), and a member of the Advisory Board for Metalmark Capital (private equity investment, 2005-present). Mr. Stavropoulos is a special advisor to Clayton, Dubilier & Rice, Inc. (private equity investment). In addition, Mr. Stavropoulos is a member of the University of Notre Dame Advisory Council for the College of Science. |
David M. Thomas (61) |
| Year of Election or Appointment: 2008 Previously, Mr. Thomas served as Executive Chairman (2005-2006) and Chairman and Chief Executive Officer (2000-2005) of IMS Health, Inc. (pharmaceutical and healthcare information solutions). In addition, Mr. Thomas serves as a member of the Board of Directors of Fortune Brands, Inc. (consumer products), and Interpublic Group of Companies, Inc. (marketing communication, 2004-present). |
Michael E. Wiley (60) |
| Year of Election or Appointment: 2008 Mr. Wiley also serves as a Director of Asia Pacific Exploration Consolidated (international oil and gas exploration and production, 2008-
present). Mr. Wiley serves as a Director of Tesoro Corporation (independent oil refiner and marketer, 2005-present), and a Director of Bill Barrett Corporation (exploration and production, 2005-present). In addition, Mr. Wiley also serves as a Director of Post Oak Bank (privately-held bank, 2004-present). Previously, Mr. Wiley served as a member of the Board of Trustees of the University of Tulsa (2000-2006; 2007-2010), as a Senior Energy Advisor of Katzenbach Partners, LLC (consulting, 2006-2007), as an Advisory Director of Riverstone Holdings (private investment), Chairman, President, and CEO of Baker Hughes, Inc. (oilfield services, 2000-2004), and as Director of Spinnaker Exploration Company (exploration and production, 2001-2005). |
Annual Report
+ The information above includes each Trustee's principal occupation during the last five years and other information relating to the experience, attributes, and skills relevant to each Trustee's qualifications to serve as a Trustee, which led to the conclusion that each Trustee should serve as a Trustee for the fund.
Advisory Board Member and Executive Officers:
Correspondence intended for each executive officer and Peter S. Lynch may be sent to Fidelity Investments, 82 Devonshire Street, Boston, Massachusetts 02109.
Name, Age; Principal Occupation |
Peter S. Lynch (66) |
| Year of Election or Appointment: 2003 Member of the Advisory Board of Fidelity's Equity and High Income Funds. Mr. Lynch is Vice Chairman and a Director of FMR and FMR Co., Inc. In addition, Mr. Lynch serves as a Trustee of Boston College and as the Chairman of the Inner-City Scholarship Fund. Previously, Mr. Lynch served on the Special Olympics International Board of Directors (1997-2006). |
Kenneth B. Robins (41) |
| Year of Election or Appointment: 2008 President and Treasurer of Fidelity's Equity and High Income Funds. Mr. Robins also serves as President and Treasurer (2010-present) and Assistant Treasurer (2009-present) of other Fidelity funds and is an employee of Fidelity Investments (2004-present). Previously, Mr. Robins served as Deputy Treasurer of the Fidelity funds (2005-2008) and Treasurer and Chief Financial Officer of The North Carolina Capital Management Trust: Cash and Term Portfolios (2006-2008). |
Bruce T. Herring (45) |
| Year of Election or Appointment: 2006 Vice President of certain Equity Funds. Mr. Herring also serves as Chief Investment Officer and Director of Fidelity Management & Research (U.K.) Inc. (2010-present) and Group Chief Investments Officer of FMR. Previously, Mr. Herring served as Vice President (2005-2006) and Senior Vice President (2006-2007) of Fidelity Management & Research Company, Vice President of FMR Co., Inc. (2001-2007) and as a portfolio manager for Fidelity U.S. Equity Funds. |
Brian B. Hogan (46) |
| Year of Election or Appointment: 2009 Vice President of certain Equity Funds and Vice President of Sector Funds. Mr. Hogan also serves as President of FMR's Equity Division (2009-present). Previously, Mr. Hogan served as Senior Vice President, Equity Research of FMR (2006-2009) and as a portfolio manager. |
Scott C. Goebel (42) |
| Year of Election or Appointment: 2008 Secretary and Chief Legal Officer (CLO) of the Fidelity funds. Mr. Goebel also serves as Secretary and CLO of The North Carolina Capital Management Trust: Cash and Term Portfolio (2008-present); General Counsel, Secretary, and Senior Vice President of FMR (2008-present) and FMR Co., Inc. (2008-present); Deputy General Counsel of FMR LLC; Chief Legal Officer of Fidelity Management & Research (Hong Kong) Limited (2008-present) and Assistant Secretary of Fidelity Management & Research (Japan) Inc. (2008-present), Fidelity Investments Money Management, Inc. (2008-present), Fidelity Management & Research (U.K.) Inc. (2008-present), and Fidelity Research and Analysis Company (2008- present). Previously, Mr. Goebel served as Assistant Secretary of the Funds (2007-2008) and as Vice President and Secretary of Fidelity Distributors Corporation (FDC) (2005-2007). |
William C. Coffey (41) |
| Year of Election or Appointment: 2009 Assistant Secretary of Fidelity's Equity and High Income Funds. Mr. Coffey also serves as Senior Vice President and Deputy General Counsel of FMR LLC (2010-present), and is an employee of Fidelity Investments. Previously, Mr. Coffey served as Vice President and Associate General Counsel of FMR LLC (2005-2009). |
Holly C. Laurent (56) |
| Year of Election or Appointment: 2008 Anti-Money Laundering (AML) Officer of the Fidelity funds. Ms. Laurent also serves as AML Officer of The North Carolina Capital Management Trust: Cash and Term Portfolio (2008-present) and is an employee of Fidelity Investments. Previously, Ms. Laurent was Senior Vice President and Head of Legal for Fidelity Business Services India Pvt. Ltd. (2006-2008), and Senior Vice President, Deputy General Counsel and Group Head for FMR LLC (2005-2006). |
Christine Reynolds (52) |
| Year of Election or Appointment: 2008 Chief Financial Officer of the Fidelity funds. Ms. Reynolds became President of Fidelity Pricing and Cash Management Services (FPCMS) in August 2008. Ms. Reynolds served as Chief Operating Officer of FPCMS (2007-2008). Previously, Ms. Reynolds served as President, Treasurer, and Anti-Money Laundering officer of the Fidelity funds (2004-2007). |
Kenneth A. Rathgeber (63) |
| Year of Election or Appointment: 2004 Chief Compliance Officer of Fidelity's Equity and High Income Funds. Mr. Rathgeber is Chief Compliance Officer of Fidelity Management & Research (Hong Kong) Limited (2008-present), Fidelity Management & Research (Japan) Inc. (2008-present), FMR (2005-present), FMR Co., Inc. (2005-present), Fidelity Management & Research (U.K.) Inc. (2005-present), Fidelity Research & Analysis Company (2005-present), Fidelity Investments Money Management, Inc. (2005-present), Pyramis Global Advisors, LLC (2005-present), and Strategic Advisers, Inc. (2005-present). |
Jeffrey S. Christian (49) |
| Year of Election or Appointment: 2009 Deputy Treasurer of the Fidelity funds. Mr. Christian is an employee of Fidelity Investments. Previously, Mr. Christian served as Chief Financial Officer (2008-2009) of certain Fidelity funds and Senior Vice President of Fidelity Pricing and Cash Management Services (FPCMS) (2004-2009). |
Bryan A. Mehrmann (49) |
| Year of Election or Appointment: 2005 Deputy Treasurer of the Fidelity funds. Mr. Mehrmann is an employee of Fidelity Investments. |
Adrien E. Deberghes (43) |
| Year of Election or Appointment: 2008 Deputy Treasurer of Fidelity's Equity and High Income Funds. Mr. Deberghes also serves as Assistant Treasurer of other Fidelity funds (2010-present) and is an employee of Fidelity Investments (2008-present). Previously, Mr. Deberghes served as Senior Vice President of Mutual Fund Administration at State Street Corporation (2007-2008), Senior Director of Mutual Fund Administration at Investors Bank & Trust (2005-2007), and Director of Finance for Dunkin' Brands (2000-2005). |
Stephanie J. Dorsey (41) |
| Year of Election or Appointment: 2010 Assistant Treasurer of Fidelity's Equity and High Income Funds. Ms. Dorsey also serves as Deputy Treasurer of other Fidelity funds (2008-present) and is an employee of Fidelity Investments (2008-present). Previously, Ms. Dorsey served as Treasurer (2004-2008) of the JPMorgan Mutual Funds and Vice President (2004-2008) of JPMorgan Chase Bank. |
John R. Hebble (52) |
| Year of Election or Appointment: 2009 Assistant Treasurer of Fidelity's Equity and High Income Funds. Mr. Hebble also serves as Treasurer and Chief Financial Officer of The North Carolina Capital Management Trust: Cash and Term Portfolio (2008-present), President and Treasurer of other Fidelity funds (2008-present) and is an employee of Fidelity Investments. |
Gary W. Ryan (52) |
| Year of Election or Appointment: 2005 Assistant Treasurer of the Fidelity funds. Mr. Ryan is an employee of Fidelity Investments. Previously, Mr. Ryan served as Vice President of Fund Reporting in Fidelity Pricing and Cash Management Services (FPCMS) (1999-2005). |
Jonathan Davis (42) |
| Year of Election or Appointment: 2010 Assistant Treasurer of the Fidelity funds. Mr. Davis is an employee of Fidelity Investments. Previously, Mr. Davis served as Vice President and Associate General Counsel of FMR LLC (2003-2010). |
Annual Report
The Board of Trustees of Fidelity International Discovery Fund voted to pay to shareholders of record at the opening of business on record date, the following distributions per share derived from capital gains realized from sales of portfolio securities, and dividends derived from net investment income:
| Pay Date | Record Date | Dividends | Capital Gains |
Institutional Class | 12/06/10 | 12/03/10 | $0.437 | $0.155 |
Class designates 100% of the dividend distributed in December during the fiscal year as amounts which may be taken into account as a dividend for purposes of the maximum rate under section 1(h)(11) of the Internal Revenue Code.
The amounts per share which represent income derived from sources within, and taxes paid to, foreign countries or possessions of the United States are as follows:
| Pay Date | Income | Taxes |
Institutional Class | 12/07/09 | $0.37 | $0.0296 |
The fund will notify shareholders in January 2011 of amounts for use in preparing 2010 income tax returns.
Annual Report
Board Approval of Investment Advisory Contracts and Management Fees
Fidelity International Discovery Fund
Each year, the Board of Trustees, including the Independent Trustees (together, the Board), votes on the renewal of the management contract and sub-advisory agreements (together, the Advisory Contracts) for the fund. The Board, assisted by the advice of fund counsel and Independent Trustees' counsel, requests and considers a broad range of information relevant to the renewal of the Advisory Contracts throughout the year.
The Board meets regularly and considers at each of its meetings factors that are relevant to its annual consideration of the renewal of the fund's Advisory Contracts, including the services and support provided to the fund and its shareholders. The Board has established various standing committees, each composed of Independent Trustees with varying backgrounds, to which the Board has assigned specific subject matter responsibilities in order to enhance effective decision-making by the Board. The Board, acting directly and through its Committees, requests and receives information concerning the annual consideration of the renewal of the fund's Advisory Contracts. The Board also meets as needed to consider matters specifically related to the Board's annual consideration of the renewal of Advisory Contracts. Members of the Board may also meet with trustees of other Fidelity funds through ad hoc joint committees to discuss certain matters relevant to the Fidelity funds.
At its July 2010 meeting, the Board of Trustees, including the Independent Trustees, unanimously determined to renew the fund's Advisory Contracts. In reaching its determination, the Board considered all factors it believed relevant, including (i) the nature, extent, and quality of the services to be provided to the fund and its shareholders (including the investment performance of the fund); (ii) the competitiveness of the fund's management fee and total expenses; (iii) the total costs of the services to be provided by and the profits to be realized by Fidelity from its relationship with the fund; (iv) the extent to which economies of scale would be realized as the fund grows; and (v) whether fee levels reflect these economies of scale, if any, for the benefit of fund shareholders.
In considering whether to renew the Advisory Contracts for the fund, the Board reached a determination, with the assistance of fund counsel and Independent Trustees' counsel and through the exercise of its business judgment, that the renewal of the Advisory Contracts is in the best interests of fund shareholders and that the compensation to be received by Fidelity under the management contract is fair and reasonable. The Board's decision to renew the Advisory Contracts was not based on any single factor noted above, but rather was based on a comprehensive consideration of all the information provided to the Board at its meetings throughout the year. The Board, in reaching its determination to renew the Advisory Contracts, is aware that shareholders in the fund have a broad range of investment choices available to them, including a wide choice among mutual funds offered by Fidelity's competitors, and that the fund's shareholders, with the opportunity to review and weigh the disclosure provided by the fund in its prospectus and other public disclosures, have chosen to invest in this fund, managed by Fidelity.
Annual Report
Board Approval of Investment Advisory Contracts and
Management Fees - continued
Nature, Extent, and Quality of Services Provided. The Board considered the staffing within the investment adviser, FMR, and the sub-advisers (together, the Investment Advisers), including the backgrounds of the fund's investment personnel and the fund's investment objective and discipline. The Independent Trustees also had discussions with senior management of Fidelity's investment operations and investment groups. The Board considered the structure of the portfolio manager compensation program and whether this structure provides appropriate incentives to act in the best interest of the fund.
Resources Dedicated to Investment Management and Support Services. The Board and the equity research subcommittee of the Board's Fund Oversight Committee reviewed the size, education, and experience of the Investment Advisers' investment staff, their use of technology, and the Investment Advisers' approach to recruiting, training, and retaining portfolio managers and other research, advisory, and management personnel. The Board noted that Fidelity's analysts have access to a variety of technological tools and market and securities data that enable them to perform both fundamental and quantitative analysis and to specialize in various disciplines. The Board considered Fidelity's extensive global research capabilities that enable the Investment Advisers to aggregate data from various sources in an effort to produce positive investment results. The Board also considered that Fidelity's portfolio managers and analysts have access to daily portfolio attribution that allows for monitoring of a fund's portfolio, as well as an electronic communication system that provides immediate real-time access to research concerning issuers and credit enhancers. The Board noted FMR's continued focus on strengthening the organization and discipline of equity portfolio management and research.
Shareholder and Administrative Services. The Board considered (i) the nature, extent, quality, and cost of advisory, administrative, and shareholder services performed by the Investment Advisers and their affiliates under the Advisory Contracts and under separate agreements covering transfer agency, pricing and bookkeeping, and securities lending services for the fund; (ii) the nature and extent of the investment adviser's supervision of third party service providers, principally custodians and subcustodians; and (iii) the resources devoted to, and the record of compliance with, the fund's compliance policies and procedures. The Board also reviewed the allocation of fund brokerage, including allocations to brokers affiliated with the Investment Advisers, the use of brokerage commissions to pay fund expenses, and the use of "soft" commission dollars to pay for research services.
The Board noted that the growth of fund assets over time across the complex allows Fidelity to reinvest in the development of services designed to enhance the value or convenience of the Fidelity funds as investment vehicles. These services include 24-hour access to account information and market information through phone representatives and over the Internet, and investor education materials and asset allocation tools.
Annual Report
Investment in a Large Fund Family. The Board considered the benefits to shareholders of investing in a Fidelity fund, including the benefits of investing in a fund that is part of a large family of funds offering a variety of investment disciplines and providing a large variety of mutual fund investor services. The Board noted that Fidelity had taken, or had made recommendations that resulted in the Fidelity funds taking, a number of actions over the previous year that benefited particular funds, including (i) dedicating additional resources to investment research and restructuring and broadening the focus of the investment research teams; (ii) bolstering the senior management team that oversees asset management; (iii) launching Class F of certain funds as a lower-fee class available to Freedom K and Freedom Index Funds; (iv) lowering the initial investment minimums and ongoing balance requirements for Real Estate High Income Fund; (v) eliminating subsequent purchase minimums for all funds and adding a waiver of the investment minimum requirement for new accounts opened with the proceeds of a systematic withdrawal plan; (vi) eliminating the withdrawal minimum and maximum limits for systematic withdrawals from Advisor funds; (vii) expanding sales load waivers on Class A shares for Destiny Planholders and expanding Institutional Class eligibility for Class O Destiny Planholders; and (viii) changing certain Class A and Class T sales charge structures to further align them with industry practices.
Investment Performance. The Board considered whether the fund has operated in accordance with its investment objective, as well as its record of compliance with its investment restrictions. It also reviewed the fund's absolute investment performance for each class, as well as the fund's relative investment performance for each class measured over multiple periods against (i) a broad-based securities market index, and (ii) a peer group of mutual funds deemed appropriate by Fidelity and reviewed by the Board. The following charts considered by the Board show, over the one-, three-, and five-year periods ended December 31, 2009, as available, the cumulative total returns of Institutional Class (Class I) and the retail class of the fund, the cumulative total returns of a broad-based securities market index ("benchmark"), and a range of cumulative total returns of a peer group of mutual funds identified by Morningstar, Inc. as having an investment style similar to that of the fund based on underlying portfolio holdings. The returns of the retail class and Class B show the performance of the highest performing class (based on five-year performance) and the lowest performing class (based on three-year performance), respectively. The box within each chart shows the 25th percentile return (bottom of box) and the 75th percentile return (top of box) of the peer group. Returns shown above the box are in the first quartile and returns shown below the box are in the fourth quartile. The percentage beaten numbers noted below each chart correspond to the percentile box and represent the percentage of funds in the peer group whose performance was equal to or lower than that of the class indicated.
Annual Report
Board Approval of Investment Advisory Contracts and
Management Fees - continued
Fidelity International Discovery Fund

The Board reviewed the fund's relative investment performance against its peer group and noted that the performance of the retail class of the fund (the class with the longer performance record) was in the third quartile for the one-year period and the second quartile for the three- and five-year periods. The Board also noted that the investment performance of the retail class of the fund compared favorably to its benchmark for the three- and five-year periods, although the fund's one-year cumulative total return was lower than its benchmark. The Board considered that the variations in performance among the fund's classes reflect the variations in class expenses, which result in lower performance for higher expense classes. The Board also reviewed the fund's performance since inception as well as performance in the current year.
The Board also considered that the fund's management fee is subject to upward or downward adjustment depending upon whether, and to what extent, the fund's investment performance for the performance period exceeds, or is exceeded by, the record (over the same period) of a Board-approved performance adjustment index. The Board realizes that the performance adjustment provides FMR with a strong economic incentive to seek to achieve superior performance for the fund's shareholders and helps to more closely align the interests of FMR and the fund's shareholders.
Based on its review, and giving particular weight to the nature and quality of the resources dedicated by the Investment Advisers to maintain and improve relative performance and factoring in the unprecedented market events in recent years, the Board concluded that the nature, extent, and quality of investment management and support services and of shareholder and administrative services provided to the fund will benefit the fund's shareholders, particularly in light of the Board's view that the fund's shareholders benefit from investing in a fund that is part of a large family of funds offering a variety of investment disciplines and services.
Annual Report
Competitiveness of Management Fee and Total Fund Expenses. The Board considered the fund's management fee and total expenses compared to "mapped groups" of competitive funds and classes. Fidelity creates "mapped groups" by combining similar Lipper investment objective categories that have comparable management fee characteristics. Combining Lipper investment objective categories aids the Board's management fee and total expense comparisons by broadening the competitive group used for comparison and by reducing the number of universes to which various Fidelity funds are compared.
Management Fee. The Board considered two proprietary management fee comparisons for the 12-month periods shown in the chart below. The group of Lipper funds used by the Board for management fee comparisons is referred to below as the "Total Mapped Group." The Total Mapped Group comparison focuses on a fund's standing relative to the total universe of comparable funds available to investors, in terms of gross management fees before expense reimbursements or caps, and without giving effect to the fund's performance adjustment. "TMG %" represents the percentage of funds in the Total Mapped Group that had management fees that were lower than the fund's. For example, a TMG % of 15% means that 85% of the funds in the Total Mapped Group had higher management fees than the fund. The "Asset-Size Peer Group" (ASPG) comparison focuses on a fund's standing relative to non-Fidelity funds similar in size to the fund within the Total Mapped Group. The ASPG represents at least 15% of the funds in the Total Mapped Group with comparable asset size and management fee characteristics, subject to a minimum of 50 funds (or all funds in the Total Mapped Group if fewer than 50). Additional information, such as the ASPG quartile in which the fund's management fee ranked and the impact of the fund's performance adjustment, is also included in the chart and considered by the Board.
Annual Report
Board Approval of Investment Advisory Contracts and
Management Fees - continued
Fidelity International Discovery Fund

The Board noted that the fund's management fee ranked below the median of its Total Mapped Group and below the median of its ASPG for 2009. The Board also noted the effect of the fund's positive performance adjustment on the fund's management fee ranking. The Board noted that the performance adjustment for each year represents calculations for performance periods that differ from the periods shown in the performance charts above.
Based on its review, the Board concluded that the fund's management fee is fair and reasonable in light of the services that the fund receives and the other factors considered.
Total Expenses. In its review of each class's total expenses, the Board considered the fund's management fee as well as other fund or class expenses, as applicable, such as transfer agent fees, pricing and bookkeeping fees, fund-paid 12b-1 fees, and custodial, legal, and audit fees. The Board also noted the effects of any waivers and reimbursements on fees and expenses, as well as the impact of the fund's performance adjustment. As part of its review, the Board also considered current and historical total expenses of each class of the fund compared to competitive fund median expenses. Each class of the fund is compared to those funds and classes in the Total Mapped Group (used by the Board for management fee comparisons) that have a similar sales load structure.
The Board noted that the total expenses of each of Class A, Class B, Class C, Institutional Class, the retail class, and Class K ranked below its competitive median for 2009 and the total expenses of Class T ranked above its competitive median for 2009. The Board considered that the total expenses for Class T were above the median primarily because its 12b-1 fee is higher than the typical front-end load class. The Board noted that the fund offers multiple classes, each of which has a different sales load and 12b-1 fee structure, and that the multiple structures are intended to offer a range of pricing options for the intermediary market. The Board also noted that the total expenses of the classes vary primarily by the level of their 12b-1 fees, although differences in transfer agent fees may also cause expenses to vary from class to class.
Annual Report
Fees Charged to Other Fidelity Clients. The Board also considered Fidelity fee structures and other information with respect to clients of FMR and its affiliates, such as other mutual funds advised or subadvised by FMR or its affiliates, pension plan clients, and other institutional clients. In March 2010, the Board created an ad hoc joint committee with the board of other Fidelity funds (the Committee) to review and compare Fidelity's institutional investment advisory business with its business of providing services to the Fidelity funds, including the differences in services provided, fees charged, and costs incurred, as well as competition in their respective marketplaces.
Based on its review of total expenses and fees charged to other Fidelity clients, the Board concluded that the total expenses of each class of the fund were reasonable, although in one case above the median of the universe presented for comparison, in light of the services that the fund and its shareholders receive and the other factors considered, including the findings of the Committee.
Costs of the Services and Profitability. The Board considered the revenues earned and the expenses incurred by Fidelity in conducting the business of developing, marketing, distributing, managing, administering and servicing the fund and its shareholders. The Board also considered the level of Fidelity's profits in respect of all the Fidelity funds.
On an annual basis, FMR presents to the Board Fidelity's profitability for the fund. Fidelity calculates the profitability for each fund, as well as aggregate profitability for groups of Fidelity funds and all Fidelity funds, using a series of detailed revenue and cost allocation methodologies which originate with the audited books and records of Fidelity. The Audit Committee of the Board reviews any significant changes from the prior year's methodologies.
PricewaterhouseCoopers LLP (PwC), independent registered public accounting firm and auditor to Fidelity and certain Fidelity funds, has been engaged annually by the Board as part of the Board's assessment of Fidelity's profitability analysis. PwC's engagement includes the review and assessment of Fidelity's methodologies used in determining the revenues and expenses attributable to Fidelity's mutual fund business, and completion of agreed-upon procedures surrounding the mathematical accuracy of fund profitability and its conformity to allocation methodologies. After considering PwC's reports issued under the engagement and information provided by Fidelity, the Board believes that while other allocation methods may also be reasonable, Fidelity's profitability methodologies are reasonable in all material respects.
Annual Report
Board Approval of Investment Advisory Contracts and
Management Fees - continued
The Board has also reviewed Fidelity's non-fund businesses and fall-out benefits related to the mutual fund business as well as cases where Fidelity's affiliates may benefit from or be related to the fund's business.
The Board considered the costs of the services provided by and the profits realized by Fidelity in connection with the operation of the fund and were satisfied that the profitability was not excessive in the circumstances.
Economies of Scale. The Board considered whether there have been economies of scale in respect of the management of the Fidelity funds, whether the Fidelity funds (including the fund) have appropriately benefited from any such economies of scale, and whether there is potential for realization of any further economies of scale. The Board considered the extent to which the fund will benefit from economies of scale through increased services to the fund, through waivers or reimbursements, or through fee or expense reductions.
In February 2009, the Board and the board of other Fidelity funds created an ad hoc committee (the Economies of Scale Committee) to analyze whether FMR attains economies of scale in respect of the management and servicing of the Fidelity funds, whether the Fidelity funds have appropriately benefited from such economies of scale, and whether there is potential for realization of any further economies of scale.
The Board recognized that the fund's management contract incorporates a "group fee" structure, which provides for lower group fee rates as total fund assets under FMR's management increase, and for higher group fee rates as total fund assets under FMR's management decrease. FMR calculates the group fee rates based on a tiered asset "breakpoint" schedule that varies based on asset class. The Board considered that the group fee is designed to deliver the benefits of economies of scale to fund shareholders when total Fidelity fund assets increase, even if assets of any particular fund are unchanged or have declined, because some portion of Fidelity's costs are attributable to services provided to all Fidelity funds, and all funds benefit if those costs can be allocated among more assets. The Board concluded that, given the group fee structure, fund shareholders will benefit from lower management fees as assets under FMR's management increase at the fund complex level, regardless of whether Fidelity achieves any such economies of scale.
The Board concluded, considering the findings of the Economies of Scale Committee, that any potential economies of scale are being appropriately shared between fund shareholders and Fidelity.
Additional Information Requested by the Board. In order to develop fully the factual basis for consideration of the Fidelity funds' Advisory Contracts, the Board requested and received additional information on certain topics, including (i) fund performance trends, actions to be taken by FMR to improve certain funds' overall performance, and Fidelity's long-term strategies for certain funds; (ii) portfolio manager changes that have occurred during the past year and length of portfolio manager tenure for different categories of funds over time; (iii) Fidelity's compensation structure for portfolio managers, research analysts, and other key personnel, the rationale for the compensation structure, and how the compensation structure provides appropriate performance incentives; (iv) the amount of the investment that each portfolio manager has made in the Fidelity fund(s) that he or she manages; (v) management and other fees paid by FMR to affiliated sub-advisers on behalf of the Fidelity funds; (vi) Fidelity's fee structures and rationale for recommending different fees among different categories of funds; (vii) Fidelity's rationale for recommending which funds should have a performance adjustment component as part of their management fees; (viii) the rationale for any differences between fund fee structures and fee structures in place for other Fidelity clients; and (ix) explanations regarding the relative total expenses borne by certain funds and classes, total expense competitive trends, and actions that might be taken by FMR to reduce total expenses for certain funds and classes.
Annual Report
Based on its evaluation of all of the conclusions noted above, and after considering all factors it believed relevant, the Board ultimately concluded that the advisory fee structures are fair and reasonable, and that the fund's Advisory Contracts should be renewed.
Annual Report
Investment Adviser
Fidelity Management & Research Company
Boston, MA
Investment Sub-Advisers
FMR Co., Inc.
Fidelity Management & Research
(U.K.) Inc.
Fidelity Research & Analysis Company
FIL Investment Advisors
FIL Investments (Japan) Limited
FIL Investment Advisors (U.K.) Limited
Fidelity Management & Research
(Hong Kong) Limited
Fidelity Management & Research
(Japan) Inc.
General Distributor
Fidelity Distributors Corporation
Boston, MA
Transfer and Service Agents
Fidelity Investments Institutional Operations Company, Inc.
Boston, MA
Fidelity Service Company, Inc.
Boston, MA
Custodian
The Northern Trust Company
Chicago, IL
AIDI-UANN-1210
1.806657.105
Fidelity®
International Growth Fund
Annual Report
October 31, 2010
(2_fidelity_logos) (Registered_Trademark)
Contents
Chairman's Message | <Click Here> | The Chairman's message to shareholders. |
Performance | <Click Here> | How the fund has done over time. |
Management's Discussion of Fund Performance | <Click Here> | The Portfolio Manager's review of fund performance, strategy and outlook. |
Shareholder Expense Example | <Click Here> | An example of shareholder expenses. |
Investment Changes | <Click Here> | A summary of major shifts in the fund's investments over the past six months. |
Investments | <Click Here> | A complete list of the fund's investments with their market values. |
Financial Statements | <Click Here> | Statements of assets and liabilities, operations, and changes in net assets, as well as financial highlights. |
Notes | <Click Here> | Notes to financial statements. |
Report of Independent Registered Public Accounting Firm | <Click Here> | |
Trustees and Officers | <Click Here> | |
Distributions | <Click Here> | |
Board Approval of Investment Advisory Contracts and Management Fees | <Click Here> | |
To view a fund's proxy voting guidelines and proxy voting record for the 12-month period ended June 30, visit http://www.fidelity.com/proxyvotingresults or visit the Securities and Exchange Commission's (SEC) web site at http://www.sec.gov. You may also call 1-800-544-8544 to request a free copy of the proxy voting guidelines.
Standard & Poor's, S&P and S&P 500 are registered service marks of The McGraw-Hill Companies, Inc. and have been licensed for use by Fidelity Distributors Corporation.
Other third party marks appearing herein are the property of their respective owners.
All other marks appearing herein are registered or unregistered trademarks or service marks of FMR LLC or an affiliated company.
Annual Report
This report and the financial statements contained herein are submitted for the general information of the shareholders of the fund. This report is not authorized for distribution to prospective investors in the fund unless preceded or accompanied by an effective prospectus.
A fund files its complete schedule of portfolio holdings with the SEC for the first and third quarters of each fiscal year on Form N-Q. Forms N-Q are available on the SEC's web site at http://www.sec.gov. A fund's Forms N-Q may be reviewed and copied at the SEC's Public Reference Room in Washington, DC. Information regarding the operation of the SEC's Public Reference Room may be obtained by calling 1-800-SEC-0330. For a complete list of a fund's portfolio holdings, view the most recent holdings listing, semiannual report, or annual report on Fidelity's web site at http://www.fidelity.com or http://www.advisor.fidelity.com, as applicable.
NOT FDIC INSURED • MAY LOSE VALUE • NO BANK GUARANTEE
Neither the fund nor Fidelity Distributors Corporation is a bank.
Annual Report
(photo_of_Edward_C_Johnson_3d)
Dear Shareholder:
Equities have staged a rally in the second half of 2010, shaking off concerns about the European debt crisis and the possibility of a double-dip recession in the U.S. Although the short-term surge pushed major equity indexes back into positive territory for the year, several questions remain about the longer-term outlook, including lackluster economic growth and persistently high unemployment. Financial markets are always unpredictable, of course, but there also are several time-tested investment principles that can help put the odds in your favor.
One of the basic tenets is to invest for the long term. Over time, riding out the markets' inevitable ups and downs has proven much more effective than selling into panic or chasing the hottest trend. Even missing only a few of the markets' best days can significantly diminish investor returns. Patience also affords the benefits of compounding - of earning interest on additional income or reinvested dividends and capital gains. There can be tax advantages and cost benefits to consider as well. While staying the course doesn't eliminate risk, it can considerably lessen the effect of short-term declines.
You can further manage your investing risk through diversification. And today, more than ever, geographic diversification should be taken into account. Studies indicate that asset allocation is the single most important determinant of a portfolio's long-term success. The right mix of stocks, bonds and cash - aligned to your particular risk tolerance and investment objective - is very important. Age-appropriate rebalancing is also an essential aspect of asset allocation. For younger investors, an emphasis on equities - which historically have been the best-performing asset class over time - is encouraged. As investors near their specific goal, such as retirement or sending a child to college, consideration may be given to replacing volatile assets (e.g. common stocks) with more-stable fixed investments (bonds or savings plans).
A third principle - investing regularly - can help lower the average cost of your purchases. Investing a certain amount of money each month or quarter helps ensure you won't pay for all your shares at market highs. This strategy - known as dollar cost averaging - also reduces "emotion" from investing, helping shareholders avoid selling weak performers just prior to an upswing, or chasing a hot performer just before a correction.
We invite you to contact us via the Internet, through our Investor Centers or by phone. It is our privilege to provide you the information you need to make the investments that are right for you.
Sincerely,
(The chairman's signature appears here.)
Edward C. Johnson 3d
Annual Report
Average annual total return reflects the change in the value of an investment, assuming reinvestment of the class' distributions from dividend income and capital gains (the profits earned upon the sale of securities that have grown in value, if any) and assuming a constant rate of performance each year. The $10,000 table and the fund's returns do not reflect the deduction of taxes that a shareholder would pay on fund distributions or the redemption of fund shares. During periods of reimbursement by Fidelity, a fund's total return will be greater than it would be had the reimbursement not occurred. How a fund did yesterday is no guarantee of how it will do tomorrow.
Average Annual Total Returns
Periods ended October 31, 2010 | Past 1
year | Life of
fundA |
Fidelity International Growth Fund | 20.97% | -4.88% |
A From November 1, 2007.
$10,000 Over Life of Fund
Let's say hypothetically that $10,000 was invested in Fidelity International Growth Fund, a class of the fund, on November 1, 2007, when the fund started. The chart shows how the value of your investment would have changed, and also shows how the MSCI® EAFE® (Europe, Australasia, Far East) Growth Index performed over the same period.
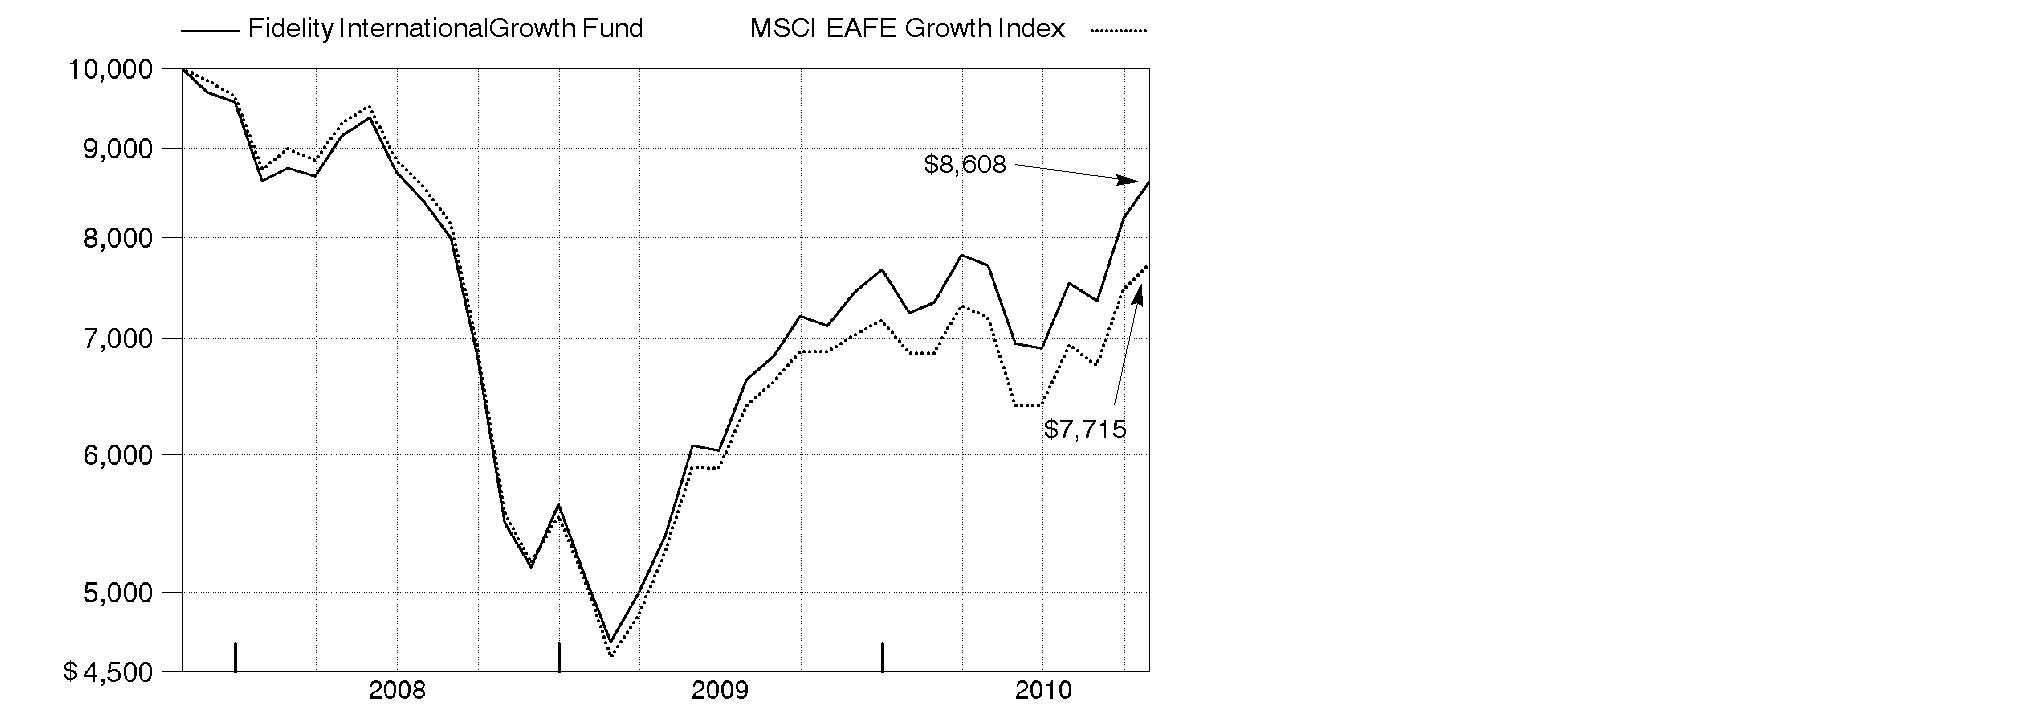
Annual Report
Market Recap: International stocks rode a wave of volatility similar to that of their U.S. counterparts during the 12 months ending October 31, 2010. Stocks gained modestly in the first half of the period, despite growing concerns about the European debt crisis. Sentiment turned decidedly negative in May and June, however, and the market suffered a precipitous decline. These losses were more than offset during the last four months of the period, when signs of economic growth and subsiding debt fears helped propel international stocks about 21%. For the full year, the MSCI® ACWI® (All Country World Index) ex USA Index gained 12.76%, boosted in part by a generally depreciating U.S. dollar. Within the index, Canada and emerging markets were standouts, returning 23% and 24%, respectively. Results in the latter group were led by strong-performing India, Mexico and South Africa, while China fell short of the MSCI benchmark due to cooling economic growth. The developed Asia ex Japan segment rose 16% for the period, lifted by solid results from Singapore and Hong Kong. Meanwhile, Europe rose just 9%, held back mainly by debt-riddled Spain and Italy, as well as lagging major constituent France. Japan returned only 5%, a result of that nation's continued weak economy.
Comments from Jed Weiss, Portfolio Manager of Fidelity® International Growth Fund: For the year, the fund's Retail Class shares gained 20.97%, significantly outpacing the 12.24% return of the MSCI EAFE® (Europe, Australasia, Far East) Growth Index. Stock picking in almost every sector was favorable, most notably financials and consumer discretionary, followed by materials, industrials and consumer staples. Positioning in telecommunication services and utilities detracted modestly. In country terms, positioning in emerging markets - especially stock picking in Brazil, Turkey and South Africa - was helpful. Successful positioning in Japan and Hong Kong also contributed. In Europe, good security selection in Denmark, Spain and the U.K. outweighed weakness in Switzerland. Elsewhere, the fund's modest stake in global U.S. companies proved helpful. Top individual contributors included Autoliv, a U.S.-listed and Sweden-based auto-safety equipment maker; Novo Nordisk, a Danish health care company; and Belgian brewer Anheuser-Busch InBev. Also of note, among emerging-markets stocks, were Turkish bank Turkiye Garanti Bankasi and Brazilian chemicals company Braskem. Several of these stocks were not in the index. In terms of notable detractors, we lacked exposure to French luxury consumer goods companies LVMH and Richemont Cie Financiere - two strong-performing index components - and overweighted lagging Swiss drug maker Roche Holding.
The views expressed above reflect those of the portfolio manager(s) only through the end of the period as stated on the cover of this report and do not necessarily represent the views of Fidelity or any other person in the Fidelity organization. Any such views are subject to change at any time based upon market or other conditions and Fidelity disclaims any responsibility to update such views. These views may not be relied on as investment advice and, because investment decisions for a Fidelity fund are based on numerous factors, may not be relied on as an indication of trading intent on behalf of any Fidelity fund.
Annual Report
Shareholder Expense Example
As a shareholder of the Fund, you incur two types of costs: (1) transaction costs, including sales charges (loads) on purchase payments or redemption proceeds, redemption fees, and (2) ongoing costs, including management fees, distribution and/or service (12b-1) fees and other Fund expenses. This Example is intended to help you understand your ongoing costs (in dollars) of investing in the Fund and to compare these costs with the ongoing costs of investing in other mutual funds.
The Example is based on an investment of $1,000 invested at the beginning of the period and held for the entire period (May 1, 2010 to October 31, 2010).
Actual Expenses
The first line of the accompanying table for each class of the Fund provides information about actual account values and actual expenses. You may use the information in this line, together with the amount you invested, to estimate the expenses that you paid over the period. Simply divide your account value by $1,000.00 (for example, an $8,600 account value divided by $1,000.00 = 8.6), then multiply the result by the number in the first line for a class of the Fund under the heading entitled "Expenses Paid During Period" to estimate the expenses you paid on your account during this period. A small balance maintenance fee of $12.00 that is charged once a year may apply for certain accounts with a value of less than $2,000. This fee is not included in the table below. If it was, the estimate of expenses you paid during the period would be higher, and your ending account value lower, by this amount. In addition, the Fund, as a shareholder in the underlying Fidelity Central Funds, will indirectly bear its pro-rata share of the fees and expenses incurred by the underlying Fidelity Central Funds. These fees and expenses are not included in the Fund's annualized expense ratio used to calculate the expense estimate in the table below.
Hypothetical Example for Comparison Purposes
The second line of the accompanying table for each class of the Fund provides information about hypothetical account values and hypothetical expenses based on a Class' actual expense ratio and an assumed rate of return of 5% per year before expenses, which is not the Class' actual return. The hypothetical account values and expenses may not be used to estimate the actual ending account balance or expenses you paid for the period. You may use this information to compare the ongoing costs of investing in the Fund and other funds. To do so, compare this 5% hypothetical example with the 5% hypothetical examples that appear in the shareholder reports of the other funds. A small balance maintenance fee of $12.00 that is charged once a year may apply for certain accounts with a value of less than $2,000. This fee is not included in the table below. If it was, the estimate of expenses you paid during the period would be higher, and your ending account value lower, by this amount. In addition, the Fund, as a shareholder in the underlying Fidelity Central Funds, will indirectly bear its pro-rata share of the fees and expenses incurred by the underlying Fidelity Central Funds. These fees and expenses are not included in the Fund's annualized expense ratio used to calculate the expense estimate in the table below.
Annual Report
Shareholder Expense Example - continued
Please note that the expenses shown in the table are meant to highlight your ongoing costs only and do not reflect any transaction costs. Therefore, the second line of the table is useful in comparing ongoing costs only, and will not help you determine the relative total costs of owning different funds. In addition, if these transactional costs were included, your costs would have been higher.
| Annualized
Expense Ratio | Beginning
Account Value
May 1, 2010 | Ending
Account Value
October 31, 2010 | Expenses Paid
During Period*
May 1, 2010 to October 31, 2010 |
Class A | 1.50%** | | | |
Actual | | $ 1,000.00 | $ 1,115.80 | $ 8.00** |
Hypothetical A | | $ 1,000.00 | $ 1,017.64 | $ 7.63** |
Class T | 1.75%** | | | |
Actual | | $ 1,000.00 | $ 1,114.40 | $ 9.33** |
Hypothetical A | | $ 1,000.00 | $ 1,016.38 | $ 8.89** |
Class B | 2.25%** | | | |
Actual | | $ 1,000.00 | $ 1,111.70 | $ 11.98** |
Hypothetical A | | $ 1,000.00 | $ 1,013.86 | $ 11.42** |
Class C | 2.25%** | | | |
Actual | | $ 1,000.00 | $ 1,112.00 | $ 11.98** |
Hypothetical A | | $ 1,000.00 | $ 1,013.86 | $ 11.42** |
International Growth | 1.25%** | | | |
Actual | | $ 1,000.00 | $ 1,117.00 | $ 6.67** |
Hypothetical A | | $ 1,000.00 | $ 1,018.90 | $ 6.36** |
Institutional Class | 1.25%** | | | |
Actual | | $ 1,000.00 | $ 1,117.00 | $ 6.67** |
Hypothetical A | | $ 1,000.00 | $ 1,018.90 | $ 6.36** |
A 5% return per year before expenses
* Expenses are equal to each Class' annualized expense ratio, multiplied by the average account value over the period, multiplied by 184/365 (to reflect the one-half year period).
Annual Report
** If changes to voluntary expense limitations, effective November 1, 2010, had been in effect during the entire period, the annualized expense ratios and the expenses paid in the actual and hypothetical examples above would have been as follows:
| Annualized
Expense Ratio | Expenses Paid |
Class A | 1.45% | |
Actual | | $ 7.73 |
Hypothetical A | | $ 7.38 |
Class T | 1.70% | |
Actual | | $ 9.06 |
Hypothetical A | | $ 8.64 |
Class B | 2.20% | |
Actual | | $ 11.71 |
Hypothetical A | | $ 11.17 |
Class C | 2.20% | |
Actual | | $ 11.71 |
Hypothetical A | | $ 11.17 |
International Growth | 1.20% | |
Actual | | $ 6.40 |
Hypothetical A | | $ 6.11 |
Institutional Class | 1.20% | |
Actual | | $ 6.40 |
Hypothetical A | | $ 6.11 |
A 5% return per year before expenses
Annual Report
Investment Changes (Unaudited)
Geographic Diversification (% of fund's net assets) |
As of October 31, 2010 |
| United Kingdom 19.7% | |
| United States of America 12.9% | |
| Switzerland 11.8% | |
| Japan 8.1% | |
| Australia 5.3% | |
| Germany 4.1% | |
| Belgium 3.5% | |
| Brazil 3.1% | |
| France 2.9% | |
| Other 28.6% | |

Percentages are adjusted for the effect of futures contracts, if applicable. |
As of April 30, 2010 |
| United Kingdom 19.0% | |
| Switzerland 13.0% | |
| United States of America 11.7% | |
| Japan 9.3% | |
| Australia 4.2% | |
| Brazil 3.7% | |
| Spain 3.6% | |
| Belgium 3.3% | |
| Germany 3.0% | |
| Other 29.2% | |

Percentages are adjusted for the effect of futures contracts, if applicable. |
Asset Allocation |
| % of fund's
net assets | % of fund's net assets
6 months ago |
Stocks and Investment Companies | 98.2 | 98.1 |
Short-Term Investments and Net Other Assets | 1.8 | 1.9 |
Top Ten Stocks as of October 31, 2010 |
| % of fund's
net assets | % of fund's net assets
6 months ago |
Nestle SA (Switzerland, Food Products) | 4.6 | 4.0 |
BHP Billiton PLC ADR (United Kingdom, Metals & Mining) | 4.4 | 3.4 |
Anheuser-Busch InBev SA NV (Belgium, Beverages) | 2.9 | 2.7 |
Rio Tinto PLC (United Kingdom, Metals & Mining) | 2.1 | 2.3 |
Roche Holding AG (participation certificate) (Switzerland, Pharmaceuticals) | 2.1 | 3.0 |
Novo Nordisk AS Series B sponsored ADR (Denmark, Pharmaceuticals) | 2.0 | 1.6 |
BG Group PLC (United Kingdom, Oil, Gas & Consumable Fuels) | 1.9 | 1.8 |
Visa, Inc. Class A (United States of America, IT Services) | 1.9 | 2.0 |
Siemens AG sponsored ADR (Germany, Industrial Conglomerates) | 1.9 | 0.4 |
Standard Chartered PLC (United Kingdom, Commercial Banks) | 1.9 | 1.7 |
| 25.7 | |
Market Sectors as of October 31, 2010 |
| % of fund's
net assets | % of fund's net assets
6 months ago |
Consumer Staples | 17.8 | 17.1 |
Materials | 16.9 | 16.2 |
Financials | 13.4 | 16.4 |
Industrials | 12.3 | 10.7 |
Consumer Discretionary | 11.8 | 11.3 |
Health Care | 11.3 | 10.9 |
Information Technology | 8.4 | 6.6 |
Energy | 4.8 | 4.6 |
Telecommunication Services | 0.5 | 2.8 |
Utilities | 0.0 | 0.3 |
Annual Report
Investments October 31, 2010
Showing Percentage of Net Assets
Common Stocks - 97.2% |
| Shares | | Value |
Australia - 5.3% |
CSL Ltd. | 11,708 | | $ 376,551 |
Leighton Holdings Ltd. (d) | 9,176 | | 329,906 |
MAp Group unit | 21,718 | | 64,892 |
Newcrest Mining Ltd. | 1,155 | | 45,215 |
Newcrest Mining Ltd. sponsored ADR | 6,907 | | 272,136 |
OZ Minerals Ltd. | 134,053 | | 205,524 |
Woolworths Ltd. | 12,499 | | 347,136 |
Worleyparsons Ltd. | 7,835 | | 176,154 |
TOTAL AUSTRALIA | | 1,817,514 |
Austria - 0.4% |
Andritz AG | 2,000 | | 153,171 |
Bailiwick of Guernsey - 0.5% |
Resolution Ltd. | 44,093 | | 185,016 |
Bailiwick of Jersey - 0.9% |
Informa PLC | 17,433 | | 121,776 |
Randgold Resources Ltd. sponsored ADR | 1,835 | | 172,343 |
TOTAL BAILIWICK OF JERSEY | | 294,119 |
Belgium - 3.5% |
Anheuser-Busch InBev SA NV | 15,920 | | 997,610 |
Umicore SA | 4,480 | | 210,824 |
TOTAL BELGIUM | | 1,208,434 |
Bermuda - 1.2% |
Lazard Ltd. Class A | 3,800 | | 140,220 |
Seadrill Ltd. (d) | 6,900 | | 208,909 |
Trinity Ltd. | 70,000 | | 69,989 |
TOTAL BERMUDA | | 419,118 |
Brazil - 3.1% |
Banco ABC Brasil SA | 13,000 | | 128,074 |
BM&F Bovespa SA | 25,700 | | 215,274 |
BR Malls Participacoes SA | 9,300 | | 88,834 |
Braskem SA Class A sponsored ADR (d) | 12,300 | | 256,455 |
Fibria Celulose SA sponsored ADR (a) | 3,903 | | 70,098 |
Iguatemi Empresa de Shopping Centers SA | 2,800 | | 65,342 |
Itau Unibanco Banco Multiplo SA ADR | 7,030 | | 172,657 |
Multiplan Empreendimentos Imobiliarios SA | 3,300 | | 75,652 |
TOTAL BRAZIL | | 1,072,386 |
Common Stocks - continued |
| Shares | | Value |
Canada - 2.8% |
Agnico-Eagle Mines Ltd. (Canada) | 2,300 | | $ 178,380 |
Fairfax Financial Holdings Ltd. (sub. vtg.) | 150 | | 61,357 |
Goldcorp, Inc. | 1,500 | | 66,977 |
Niko Resources Ltd. | 2,700 | | 257,584 |
Open Text Corp. (a) | 2,700 | | 119,447 |
Pan American Silver Corp. | 4,200 | | 134,064 |
Petrobank Energy & Resources Ltd. (a) | 3,400 | | 135,313 |
TOTAL CANADA | | 953,122 |
Cayman Islands - 0.9% |
Alibaba.com Ltd. (a) | 37,000 | | 72,270 |
China Lilang Ltd. | 46,000 | | 71,926 |
Wynn Macau Ltd. | 69,200 | | 153,019 |
TOTAL CAYMAN ISLANDS | | 297,215 |
Chile - 0.5% |
Banco Santander Chile sponsored ADR | 1,900 | | 176,016 |
China - 0.5% |
Baidu.com, Inc. sponsored ADR (a) | 1,680 | | 184,817 |
Denmark - 2.5% |
Novo Nordisk AS Series B sponsored ADR | 6,500 | | 681,200 |
William Demant Holding AS (a) | 2,300 | | 172,400 |
TOTAL DENMARK | | 853,600 |
Finland - 1.9% |
Metso Corp. | 4,400 | | 208,589 |
Nokian Tyres PLC | 7,300 | | 252,924 |
Outotec OYJ | 4,000 | | 186,677 |
TOTAL FINLAND | | 648,190 |
France - 2.9% |
Alstom SA | 3,613 | | 182,290 |
Danone | 5,852 | | 370,292 |
Remy Cointreau SA | 2,190 | | 153,766 |
Safran SA | 9,600 | | 304,293 |
TOTAL FRANCE | | 1,010,641 |
Germany - 4.1% |
Bayerische Motoren Werke AG (BMW) | 1,255 | | 89,950 |
Linde AG | 3,266 | | 470,126 |
Common Stocks - continued |
| Shares | | Value |
Germany - continued |
MAN SE | 1,702 | | $ 187,092 |
Siemens AG sponsored ADR | 5,800 | | 662,998 |
TOTAL GERMANY | | 1,410,166 |
Hong Kong - 1.2% |
Hong Kong Exchanges and Clearing Ltd. | 18,300 | | 402,771 |
Ireland - 1.0% |
CRH PLC sponsored ADR (d) | 11,300 | | 199,671 |
James Hardie Industries NV sponsored ADR (a) | 5,000 | | 132,900 |
TOTAL IRELAND | | 332,571 |
Italy - 1.8% |
Azimut Holdings SpA | 16,215 | | 165,382 |
Fiat SpA | 18,900 | | 319,789 |
Saipem SpA | 3,325 | | 147,726 |
TOTAL ITALY | | 632,897 |
Japan - 8.1% |
Autobacs Seven Co. Ltd. | 3,900 | | 146,123 |
Denso Corp. | 9,100 | | 282,993 |
Fanuc Ltd. | 3,000 | | 434,309 |
Fast Retailing Co. Ltd. | 1,300 | | 170,289 |
Japan Steel Works Ltd. | 17,000 | | 162,198 |
Keyence Corp. | 1,220 | | 302,461 |
Kobayashi Pharmaceutical Co. Ltd. | 3,900 | | 181,745 |
MS&AD Insurance Group Holdings, Inc. | 5,300 | | 126,972 |
Nippon Thompson Co. Ltd. | 19,000 | | 131,751 |
Osaka Securities Exchange Co. Ltd. | 28 | | 140,922 |
Shiseido Co. Ltd. | 9,100 | | 189,986 |
SHO-BOND Holdings Co. Ltd. | 3,500 | | 74,898 |
USS Co. Ltd. | 3,340 | | 259,828 |
Yamato Kogyo Co. Ltd. | 7,600 | | 194,935 |
TOTAL JAPAN | | 2,799,410 |
Korea (South) - 0.7% |
NHN Corp. (a) | 1,444 | | 256,183 |
Mexico - 1.0% |
Wal-Mart de Mexico SA de CV Series V | 130,600 | | 357,206 |
Netherlands - 2.2% |
ASM International NV unit (a) | 6,100 | | 155,855 |
ASML Holding NV | 8,300 | | 275,477 |
Common Stocks - continued |
| Shares | | Value |
Netherlands - continued |
Koninklijke KPN NV | 10,886 | | $ 181,768 |
QIAGEN NV (a) | 7,500 | | 141,075 |
TOTAL NETHERLANDS | | 754,175 |
Peru - 0.2% |
Compania de Minas Buenaventura SA sponsored ADR | 1,500 | | 79,560 |
Portugal - 0.5% |
Jeronimo Martins SGPS SA | 12,375 | | 185,623 |
Singapore - 1.1% |
City Developments Ltd. | 10,000 | | 98,277 |
Singapore Exchange Ltd. | 32,000 | | 217,569 |
Wing Tai Holdings Ltd. | 44,000 | | 59,492 |
TOTAL SINGAPORE | | 375,338 |
South Africa - 2.1% |
African Rainbow Minerals Ltd. | 9,939 | | 253,560 |
Clicks Group Ltd. | 26,686 | | 174,096 |
JSE Ltd. | 11,000 | | 124,053 |
Mr Price Group Ltd. | 20,200 | | 183,572 |
TOTAL SOUTH AFRICA | | 735,281 |
Spain - 1.3% |
Inditex SA (d) | 3,515 | | 293,506 |
Prosegur Compania de Seguridad SA (Reg.) | 2,600 | | 155,781 |
TOTAL SPAIN | | 449,287 |
Sweden - 1.5% |
H&M Hennes & Mauritz AB (B Shares) | 11,217 | | 395,187 |
Swedish Match Co. | 4,300 | | 120,152 |
TOTAL SWEDEN | | 515,339 |
Switzerland - 11.8% |
Credit Suisse Group sponsored ADR | 4,320 | | 179,280 |
Nestle SA | 28,730 | | 1,573,166 |
Novartis AG sponsored ADR (d) | 11,200 | | 649,040 |
Roche Holding AG (participation certificate) | 4,835 | | 709,765 |
Sonova Holding AG Class B | 3,225 | | 373,495 |
The Swatch Group AG: | | | |
(Bearer) | 910 | | 347,692 |
(Reg.) | 228 | | 15,843 |
Common Stocks - continued |
| Shares | | Value |
Switzerland - continued |
UBS AG (a) | 4,483 | | $ 76,132 |
UBS AG (NY Shares) (a) | 8,700 | | 148,074 |
TOTAL SWITZERLAND | | 4,072,487 |
Turkey - 1.9% |
Anadolu Efes Biracilik ve Malt Sanayii AS | 7,800 | | 124,535 |
Asya Katilim Bankasi AS | 27,000 | | 69,651 |
Coca-Cola Icecek AS | 10,000 | | 128,286 |
Turkiye Garanti Bankasi AS | 53,500 | | 328,244 |
TOTAL TURKEY | | 650,716 |
United Kingdom - 19.7% |
Anglo American PLC: | | | |
ADR | 9,800 | | 227,850 |
(United Kingdom) | 1,800 | | 83,863 |
Babcock International Group PLC | 18,100 | | 168,194 |
BAE Systems PLC | 20,800 | | 114,870 |
BG Group PLC | 34,652 | | 674,818 |
BHP Billiton PLC ADR | 21,300 | | 1,508,040 |
Cobham PLC | 27,100 | | 100,557 |
GlaxoSmithKline PLC sponsored ADR | 11,300 | | 441,152 |
Imperial Tobacco Group PLC | 4,318 | | 138,293 |
InterContinental Hotel Group PLC ADR (d) | 13,755 | | 266,159 |
Johnson Matthey PLC | 6,924 | | 212,326 |
Mothercare PLC | 8,900 | | 74,932 |
Reckitt Benckiser Group PLC | 6,045 | | 338,103 |
Rio Tinto PLC | 2,735 | | 177,617 |
Rio Tinto PLC sponsored ADR (d) | 8,700 | | 566,544 |
Serco Group PLC | 30,103 | | 296,129 |
Shaftesbury PLC | 19,733 | | 141,004 |
Standard Chartered PLC: | | | |
rights 11/5/10 (a) | 2,619 | | 22,050 |
(United Kingdom) | 21,917 | | 633,989 |
Tesco PLC | 71,253 | | 487,283 |
Unite Group PLC (a) | 18,800 | | 62,650 |
Victrex PLC | 3,600 | | 74,462 |
TOTAL UNITED KINGDOM | | 6,810,885 |
United States of America - 10.1% |
Allergan, Inc. | 1,900 | | 137,579 |
Autoliv, Inc. | 4,300 | | 306,590 |
Berkshire Hathaway, Inc. Class B (a) | 2,000 | | 159,120 |
Cymer, Inc. (a) | 2,000 | | 73,900 |
Common Stocks - continued |
| Shares | | Value |
United States of America - continued |
eBay, Inc. (a) | 2,600 | | $ 77,506 |
Google, Inc. Class A (a) | 220 | | 134,858 |
ION Geophysical Corp. (a) | 14,800 | | 72,372 |
JPMorgan Chase & Co. | 3,818 | | 143,671 |
Juniper Networks, Inc. (a) | 18,600 | | 602,454 |
Martin Marietta Materials, Inc. | 900 | | 72,432 |
Mead Johnson Nutrition Co. Class A | 4,500 | | 264,690 |
Mohawk Industries, Inc. (a) | 2,600 | | 149,084 |
Philip Morris International, Inc. | 3,100 | | 181,350 |
ResMed, Inc. (a) | 5,500 | | 175,285 |
Union Pacific Corp. | 2,900 | | 254,272 |
Visa, Inc. Class A | 8,500 | | 664,445 |
TOTAL UNITED STATES OF AMERICA | | 3,469,608 |
TOTAL COMMON STOCKS (Cost $28,745,190) | 33,562,862 |
Investment Companies - 1.0% |
| | | |
United States of America - 1.0% |
iShares MSCI EAFE Growth Index ETF
(Cost $352,099) | 6,000 | | 352,800 |
Money Market Funds - 7.1% |
| | | |
Fidelity Securities Lending Cash Central Fund, 0.24% (b)(c)
(Cost $2,457,002) | 2,457,002 | | 2,457,002 |
Cash Equivalents - 2.0% |
| Maturity Amount | | Value |
Investments in repurchase agreements in a joint trading account at 0.22%, dated 10/29/10 due 11/1/10 (Collateralized by U.S. Treasury Obligations) #
(Cost $685,000) | $ 685,012 | | $ 685,000 |
TOTAL INVESTMENT PORTFOLIO - 107.3% (Cost $32,239,291) | | 37,057,664 |
NET OTHER ASSETS (LIABILITIES) - (7.3)% | | (2,530,931) |
NET ASSETS - 100% | $ 34,526,733 |
Security Type Abbreviations |
ETF | - | Exchange-Traded Funds |
Legend |
(a) Non-income producing |
(b) Affiliated fund that is available only to investment companies and other accounts managed by Fidelity Investments. The rate quoted is the annualized seven-day yield of the fund at period end. A complete unaudited listing of the fund's holdings as of its most recent quarter end is available upon request. In addition, each Fidelity Central Fund's financial statements, which are not covered by the Fund's report of Independent Registered Public Accounting Firm, are available on the SEC's website or upon request. |
(c) Investment made with cash collateral received from securities on loan. |
(d) Security or a portion of the security is on loan at period end. |
# Additional information on each counterparty to the repurchase agreement is as follows: |
Repurchase Agreement / Counterparty | Value |
$685,000 due 11/01/10 at 0.22% |
BNP Paribas Securities Corp. | $ 114,147 |
Barclays Capital, Inc. | 171,114 |
Credit Agricole Securities (USA), Inc. | 29,506 |
Credit Suisse Securities (USA) LLC | 31,533 |
Deutsche Bank Securities, Inc. | 52,922 |
HSBC Securities (USA), Inc. | 52,922 |
J.P. Morgan Securities,
Inc. | 141,125 |
Mizuho Securities USA, Inc. | 35,281 |
Societe Generale, New York Branch | 35,281 |
UBS Securities LLC | 17,641 |
Wells Fargo Securities LLC | 3,528 |
| $ 685,000 |
Affiliated Central Funds |
Information regarding fiscal year to date income earned by the Fund from investments in Fidelity Central Funds is as follows: |
Fund | Income earned |
Fidelity Securities Lending Cash Central Fund | $ 13,302 |
Other Information |
The following is a summary of the inputs used, as of October 31, 2010, involving the Fund's assets and liabilities carried at fair value. The inputs or methodology used for valuing securities may not be an indication of the risk associated with investing in those securities. For more information on valuation inputs, and their aggregation into the levels used in the table below, please refer to the Security Valuation section in the accompanying Notes to Financial Statements. |
Valuation Inputs at Reporting Date: |
Description | Total | Level 1 | Level 2 | Level 3 |
Investments in Securities: | | | | |
Equities: | | | | |
United Kingdom | $ 6,810,885 | $ 6,633,268 | $ 177,617 | $ - |
Switzerland | 4,072,487 | 3,996,355 | 76,132 | - |
United States of America | 3,469,608 | 3,469,608 | - | - |
Japan | 2,799,410 | 1,432,663 | 1,366,747 | - |
Australia | 1,817,514 | 1,817,514 | - | - |
Germany | 1,410,166 | 1,410,166 | - | - |
Belgium | 1,208,434 | 1,208,434 | - | - |
Brazil | 1,072,386 | 1,072,386 | - | - |
France | 1,010,641 | 1,010,641 | - | - |
Other | 9,891,331 | 9,891,331 | - | - |
Investment Companies | 352,800 | 352,800 | - | - |
Money Market Funds | 2,457,002 | 2,457,002 | - | - |
Cash Equivalents | 685,000 | - | 685,000 | - |
Total Investments in Securities: | $ 37,057,664 | $ 34,752,168 | $ 2,305,496 | $ - |
Income Tax Information |
At October 31, 2010, the Fund had a capital loss carryforward of approximately $6,290,360 of which $3,493,858 and $2,796,502 will expire on October 31, 2016 and 2017, respectively. Capital loss carryforwards are only available to offset future capital gains of the Fund to the extent provided by regulations and may be limited. |
See accompanying notes which are an integral part of the financial statements.
Annual Report
Statement of Assets and Liabilities
| October 31, 2010 |
| | |
Assets | | |
Investment in securities, at value (including securities loaned of $2,381,885 and repurchase agreements of $685,000) - See accompanying schedule: Unaffiliated issuers (cost $29,782,289) | $ 34,600,662 | |
Fidelity Central Funds (cost $2,457,002) | 2,457,002 | |
Total Investments (cost $32,239,291) | | $ 37,057,664 |
Cash | | 677 |
Foreign currency held at value (cost $212) | | 212 |
Receivable for investments sold | | 253,142 |
Receivable for fund shares sold | | 115,106 |
Dividends receivable | | 73,680 |
Distributions receivable from Fidelity Central Funds | | 943 |
Receivable from investment adviser for expense reductions | | 42,846 |
Other receivables | | 1,353 |
Total assets | | 37,545,623 |
| | |
Liabilities | | |
Payable for investments purchased | $ 442,776 | |
Payable for fund shares redeemed | 30,235 | |
Accrued management fee | 23,253 | |
Distribution and service plan fees payable | 2,473 | |
Other affiliated payables | 8,855 | |
Other payables and accrued expenses | 54,296 | |
Collateral on securities loaned, at value | 2,457,002 | |
Total liabilities | | 3,018,890 |
| | |
Net Assets | | $ 34,526,733 |
Net Assets consist of: | | |
Paid in capital | | $ 36,253,596 |
Undistributed net investment income | | 237,573 |
Accumulated undistributed net realized gain (loss) on investments and foreign currency transactions | | (6,786,731) |
Net unrealized appreciation (depreciation) on investments and assets and liabilities in foreign currencies | | 4,822,295 |
Net Assets | | $ 34,526,733 |
See accompanying notes which are an integral part of the financial statements.
Annual Report
Statement of Assets and Liabilities - continued
| October 31, 2010 |
| | |
Calculation of Maximum Offering Price Class A:
Net Asset Value and redemption price per share ($3,083,779 ÷ 367,982 shares) | | $ 8.38 |
| | |
Maximum offering price per share (100/94.25 of $8.38) | | $ 8.89 |
Class T:
Net Asset Value and redemption price per share ($1,033,538 ÷ 123,323 shares) | | $ 8.38 |
| | |
Maximum offering price per share (100/96.50 of $8.38) | | $ 8.68 |
Class B:
Net Asset Value and offering price per share ($581,201 ÷ 69,527 shares)A | | $ 8.36 |
| | |
Class C:
Net Asset Value and offering price per share ($1,260,789 ÷ 151,261 shares)A | | $ 8.34 |
| | |
International Growth:
Net Asset Value, offering price and redemption price per share ($28,454,384 ÷ 3,385,414 shares) | | $ 8.40 |
| | |
Institutional Class:
Net Asset Value, offering price and redemption price per share ($113,042 ÷ 13,455 shares) | | $ 8.40 |
A Redemption price per share is equal to net asset value less any applicable contingent deferred sales charge.
See accompanying notes which are an integral part of the financial statements.
Annual Report
Financial Statements - continued
Statement of Operations
| Year ended October 31, 2010 |
| | |
Investment Income | | |
Dividends | | $ 637,165 |
Interest | | 706 |
Income from Fidelity Central Funds | | 13,302 |
Income before foreign taxes withheld | | 651,173 |
Less foreign taxes withheld | | (47,674) |
Total income | | 603,499 |
| | |
Expenses | | |
Management fee
Basic fee | $ 192,364 | |
Performance adjustment | 29,103 | |
Transfer agent fees | 85,306 | |
Distribution and service plan fees | 24,292 | |
Accounting and security lending fees | 14,333 | |
Custodian fees and expenses | 55,804 | |
Independent trustees' compensation | 148 | |
Registration fees | 73,332 | |
Audit | 62,652 | |
Legal | 191 | |
Miscellaneous | 300 | |
Total expenses before reductions | 537,825 | |
Expense reductions | (178,649) | 359,176 |
Net investment income (loss) | | 244,323 |
Realized and Unrealized Gain (Loss) Net realized gain (loss) on: | | |
Investment securities: | | |
Unaffiliated issuers | 1,690,565 | |
Foreign currency transactions | (561) | |
Total net realized gain (loss) | | 1,690,004 |
Change in net unrealized appreciation (depreciation) on: Investment securities | 3,219,080 | |
Assets and liabilities in foreign currencies | 2,715 | |
Total change in net unrealized appreciation (depreciation) | | 3,221,795 |
Net gain (loss) | | 4,911,799 |
Net increase (decrease) in net assets resulting from operations | | $ 5,156,122 |
See accompanying notes which are an integral part of the financial statements.
Annual Report
Statement of Changes in Net Assets
| Year ended
October 31,
2010 | Year ended
October 31,
2009 |
Increase (Decrease) in Net Assets | | |
Operations | | |
Net investment income (loss) | $ 244,323 | $ 175,103 |
Net realized gain (loss) | 1,690,004 | (2,934,897) |
Change in net unrealized appreciation (depreciation) | 3,221,795 | 7,705,769 |
Net increase (decrease) in net assets resulting
from operations | 5,156,122 | 4,945,975 |
Distributions to shareholders from net investment income | (167,219) | (188,551) |
Distributions to shareholders from net realized gain | (78,510) | - |
Total distributions | (245,729) | (188,551) |
Share transactions - net increase (decrease) | 8,231,990 | 1,563,086 |
Redemption fees | 2,560 | 3,195 |
Total increase (decrease) in net assets | 13,144,943 | 6,323,705 |
| | |
Net Assets | | |
Beginning of period | 21,381,790 | 15,058,085 |
End of period (including undistributed net investment income of $237,573 and undistributed net investment income of $167,884, respectively) | $ 34,526,733 | $ 21,381,790 |
See accompanying notes which are an integral part of the financial statements.
Annual Report
Financial Highlights - Class A
Years ended October 31, | 2010 | 2009 | 2008 F |
Selected Per-Share Data | | | |
Net asset value, beginning of period | $ 7.01 | $ 5.46 | $ 10.00 |
Income from Investment Operations | | | |
Net investment income (loss) C | .05 | .05 | .07 |
Net realized and unrealized gain (loss) | 1.39 | 1.55 | (4.61) |
Total from investment operations | 1.44 | 1.60 | (4.54) |
Distributions from net investment income | (.05) | (.05) | - |
Distributions from net realized gain | (.03) | - | - |
Total distributions | (.07) I | (.05) | - |
Redemption fees added to paid in capital C,H | - | - | - |
Net asset value, end of period | $ 8.38 | $ 7.01 | $ 5.46 |
Total Return A,B | 20.68% | 29.72% | (45.40)% |
Ratios to Average Net Assets D,G | | | |
Expenses before reductions | 2.13% | 2.46% | 2.88% |
Expenses net of fee waivers, if any | 1.50% | 1.50% | 1.50% |
Expenses net of all reductions | 1.48% | 1.47% | 1.48% |
Net investment income (loss) | .74% | .85% | .80% |
Supplemental Data | | | |
Net assets, end of period (000 omitted) | $ 3,084 | $ 1,452 | $ 820 |
Portfolio turnover rate E | 87% | 116% | 115% |
A Total returns would have been lower had certain expenses not been reduced during the periods shown.
B Total returns do not include the effect of the sales charges.
C Calculated based on average shares outstanding during the period.
D Fees and expenses of the underlying Fidelity Central Funds are not included in the Fund's expense ratio. The Fund indirectly bears its proportionate share of the expenses of any underlying Fidelity Central Funds.
E Amount does not include the portfolio activity of any underlying Fidelity Central Funds.
F For the period November 1, 2007 (commencement of operations) to October 31, 2008.
G Expense ratios reflect operating expenses of the class. Expenses before reductions do not reflect amounts reimbursed by the investment adviser or reductions from brokerage service arrangements or reductions from other expense offset arrangements and do not represent the amount paid by the class during periods when reimbursements or reductions occur. Expense ratios before reductions for start-up periods may not be representative of longer-term operating periods. Expenses net of fee waivers reflect expenses after reimbursement by the investment adviser but prior to reductions from brokerage service arrangements or other expense offset arrangements. Expenses net of all reductions represent the net expenses paid by the class.
H Amount represents less than $.01 per share.
I Total distributions of $.07 per share is comprised of distributions from net investment income of $.046 and distributions from net realized gain of $.025 per share.
See accompanying notes which are an integral part of the financial statements.
Annual Report
Financial Highlights - Class T
Years ended October 31, | 2010 | 2009 | 2008 F |
Selected Per-Share Data | | | |
Net asset value, beginning of period | $ 7.00 | $ 5.45 | $ 10.00 |
Income from Investment Operations | | | |
Net investment income (loss) C | .04 | .03 | .05 |
Net realized and unrealized gain (loss) | 1.39 | 1.55 | (4.60) |
Total from investment operations | 1.43 | 1.58 | (4.55) |
Distributions from net investment income | (.02) | (.03) | - |
Distributions from net realized gain | (.03) | - | - |
Total distributions | (.05) | (.03) | - |
Redemption fees added to paid in capital C,H | - | - | - |
Net asset value, end of period | $ 8.38 | $ 7.00 | $ 5.45 |
Total Return A,B | 20.47% | 29.22% | (45.50)% |
Ratios to Average Net Assets D,G | | | |
Expenses before reductions | 2.41% | 2.67% | 3.07% |
Expenses net of fee waivers, if any | 1.75% | 1.75% | 1.75% |
Expenses net of all reductions | 1.73% | 1.73% | 1.73% |
Net investment income (loss) | .49% | .59% | .55% |
Supplemental Data | | | |
Net assets, end of period (000 omitted) | $ 1,034 | $ 532 | $ 507 |
Portfolio turnover rate E | 87% | 116% | 115% |
A Total returns would have been lower had certain expenses not been reduced during the periods shown.
B Total returns do not include the effect of the sales charges.
C Calculated based on average shares outstanding during the period.
D Fees and expenses of the underlying Fidelity Central Funds are not included in the Fund's expense ratio. The Fund indirectly bears its proportionate share of the expenses of any underlying Fidelity Central Funds.
E Amount does not include the portfolio activity of any underlying Fidelity Central Funds.
F For the period November 1, 2007 (commencement of operations) to October 31, 2008.
G Expense ratios reflect operating expenses of the class. Expenses before reductions do not reflect amounts reimbursed by the investment adviser or reductions from brokerage service arrangements or reductions from other expense offset arrangements and do not represent the amount paid by the class during periods when reimbursements or reductions occur. Expense ratios before reductions for start-up periods may not be representative of longer-term operating periods. Expenses net of fee waivers reflect expenses after reimbursement by the investment adviser but prior to reductions from brokerage service arrangements or other expense offset arrangements. Expenses net of all reductions represent the net expenses paid by the class.
H Amount represents less than $.01 per share.
See accompanying notes which are an integral part of the financial statements.
Annual Report
Financial Highlights - Class B
Years ended October 31, | 2010 | 2009 | 2008 F |
Selected Per-Share Data | | | |
Net asset value, beginning of period | $ 6.98 | $ 5.42 | $ 10.00 |
Income from Investment Operations | | | |
Net investment income (loss) C | - H | .01 | - H |
Net realized and unrealized gain (loss) | 1.38 | 1.55 | (4.58) |
Total from investment operations | 1.38 | 1.56 | (4.58) |
Redemption fees added to paid in capital C,H | - | - | - |
Net asset value, end of period | $ 8.36 | $ 6.98 | $ 5.42 |
Total Return A,B | 19.77% | 28.78% | (45.80)% |
Ratios to Average Net Assets D,G | | | |
Expenses before reductions | 2.87% | 3.17% | 3.55% |
Expenses net of fee waivers, if any | 2.25% | 2.25% | 2.25% |
Expenses net of all reductions | 2.23% | 2.23% | 2.23% |
Net investment income (loss) | (.01)% | .09% | .05% |
Supplemental Data | | | |
Net assets, end of period (000 omitted) | $ 581 | $ 328 | $ 642 |
Portfolio turnover rate E | 87% | 116% | 115% |
A Total returns would have been lower had certain expenses not been reduced during the periods shown.
B Total returns do not include the effect of the contingent deferred sales charge.
C Calculated based on average shares outstanding during the period.
D Fees and expenses of the underlying Fidelity Central Funds are not included in the Fund's expense ratio. The Fund indirectly bears its proportionate share of the expenses of any underlying Fidelity Central Funds.
E Amount does not include the portfolio activity of any underlying Fidelity Central Funds.
F For the period November 1, 2007 (commencement of operations) to October 31, 2008.
G Expense ratios reflect operating expenses of the class. Expenses before reductions do not reflect amounts reimbursed by the investment adviser or reductions from brokerage service arrangements or reductions from other expense offset arrangements and do not represent the amount paid by the class during periods when reimbursements or reductions occur. Expense ratios before reductions for start-up periods may not be representative of longer-term operating periods. Expenses net of fee waivers reflect expenses after reimbursement by the investment adviser but prior to reductions from brokerage service arrangements or other expense offset arrangements. Expenses net of all reductions represent the net expenses paid by the class.
H Amount represents less than $.01 per share.
See accompanying notes which are an integral part of the financial statements.
Annual Report
Financial Highlights - Class C
Years ended October 31, | 2010 | 2009 | 2008 F |
Selected Per-Share Data | | | |
Net asset value, beginning of period | $ 6.98 | $ 5.42 | $ 10.00 |
Income from Investment Operations | | | |
Net investment income (loss) C | - H | .01 | - H |
Net realized and unrealized gain (loss) | 1.38 | 1.55 | (4.58) |
Total from investment operations | 1.38 | 1.56 | (4.58) |
Distributions from net realized gain | (.02) | - | - |
Redemption fees added to paid in capital C,H | - | - | - |
Net asset value, end of period | $ 8.34 | $ 6.98 | $ 5.42 |
Total Return A,B | 19.82% | 28.78% | (45.80)% |
Ratios to Average Net Assets D,G | | | |
Expenses before reductions | 2.89% | 3.21% | 3.52% |
Expenses net of fee waivers, if any | 2.25% | 2.25% | 2.25% |
Expenses net of all reductions | 2.24% | 2.23% | 2.23% |
Net investment income (loss) | (.01)% | .09% | .05% |
Supplemental Data | | | |
Net assets, end of period (000 omitted) | $ 1,261 | $ 780 | $ 684 |
Portfolio turnover rate E | 87% | 116% | 115% |
A Total returns would have been lower had certain expenses not been reduced during the periods shown.
B Total returns do not include the effect of the contingent deferred sales charge.
C Calculated based on average shares outstanding during the period.
D Fees and expenses of the underlying Fidelity Central Funds are not included in the Fund's expense ratio. The Fund indirectly bears its proportionate share of the expenses of any underlying Fidelity Central Funds.
E Amount does not include the portfolio activity of any underlying Fidelity Central Funds.
F For the period November 1, 2007 (commencement of operations) to October 31, 2008.
G Expense ratios reflect operating expenses of the class. Expenses before reductions do not reflect amounts reimbursed by the investment adviser or reductions from brokerage service arrangements or reductions from other expense offset arrangements and do not represent the amount paid by the class during periods when reimbursements or reductions occur. Expense ratios before reductions for start-up periods may not be representative of longer-term operating periods. Expenses net of fee waivers reflect expenses after reimbursement by the investment adviser but prior to reductions from brokerage service arrangements or other expense offset arrangements. Expenses net of all reductions represent the net expenses paid by the class.
H Amount represents less than $.01 per share.
See accompanying notes which are an integral part of the financial statements.
Annual Report
Financial Highlights - International Growth
Years ended October 31, | 2010 | 2009 | 2008 E |
Selected Per-Share Data | | | |
Net asset value, beginning of period | $ 7.02 | $ 5.48 | $ 10.00 |
Income from Investment Operations | | | |
Net investment income (loss) B | .07 | .06 | .09 |
Net realized and unrealized gain (loss) | 1.39 | 1.54 | (4.60) |
Total from investment operations | 1.46 | 1.60 | (4.51) |
Distributions from net investment income | (.06) | (.06) | (.01) |
Distributions from net realized gain | (.03) | - | - |
Total distributions | (.08) H | (.06) | (.01) |
Redemption fees added to paid in capital B,G | - | - | - |
Net asset value, end of period | $ 8.40 | $ 7.02 | $ 5.48 |
Total Return A | 20.97% | 29.77% | (45.17)% |
Ratios to Average Net Assets C,F | | | |
Expenses before reductions | 1.89% | 2.19% | 2.35% |
Expenses net of fee waivers, if any | 1.25% | 1.25% | 1.25% |
Expenses net of all reductions | 1.23% | 1.23% | 1.23% |
Net investment income (loss) | .99% | 1.09% | 1.05% |
Supplemental Data | | | |
Net assets, end of period (000 omitted) | $ 28,454 | $ 18,254 | $ 11,884 |
Portfolio turnover rate D | 87% | 116% | 115% |
A Total returns would have been lower had certain expenses not been reduced during the periods shown.
B Calculated based on average shares outstanding during the period.
C Fees and expenses of the underlying Fidelity Central Funds are not included in the Fund's expense ratio. The Fund indirectly bears its proportionate share of the expenses of any underlying Fidelity Central Funds.
D Amount does not include the portfolio activity of any underlying Fidelity Central Funds.
E For the period November 1, 2007 (commencement of operations) to October 31, 2008.
F Expense ratios reflect operating expenses of the class. Expenses before reductions do not reflect amounts reimbursed by the investment adviser or reductions from brokerage service arrangements or reductions from other expense offset arrangements and do not represent the amount paid by the class during periods when reimbursements or reductions occur. Expense ratios before reductions for start-up periods may not be representative of longer-term operating periods. Expenses net of fee waivers reflect expenses after reimbursement by the investment adviser but prior to reductions from brokerage service arrangements or other expense offset arrangements. Expenses net of all reductions represent the net expenses paid by the class.
G Amount represents less than $.01 per share.
H Total distributions of $.08 per share is comprised of distributions from net investment income of $.057 and distributions from net realized gain of $.025 per share.
See accompanying notes which are an integral part of the financial statements.
Annual Report
Financial Highlights - Institutional Class
Years ended October 31, | 2010 | 2009 | 2008 E |
Selected Per-Share Data | | | |
Net asset value, beginning of period | $ 7.02 | $ 5.48 | $ 10.00 |
Income from Investment Operations | | | |
Net investment income (loss) B | .07 | .06 | .09 |
Net realized and unrealized gain (loss) | 1.39 | 1.54 | (4.60) |
Total from investment operations | 1.46 | 1.60 | (4.51) |
Distributions from net investment income | (.06) | (.06) | (.01) |
Distributions from net realized gain | (.03) | - | - |
Total distributions | (.08) H | (.06) | (.01) |
Redemption fees added to paid in capital B,G | - | - | - |
Net asset value, end of period | $ 8.40 | $ 7.02 | $ 5.48 |
Total Return A | 20.97% | 29.77% | (45.17)% |
Ratios to Average Net Assets C,F | | | |
Expenses before reductions | 1.92% | 2.01% | 2.56% |
Expenses net of fee waivers, if any | 1.25% | 1.25% | 1.25% |
Expenses net of all reductions | 1.23% | 1.23% | 1.23% |
Net investment income (loss) | .99% | 1.09% | 1.05% |
Supplemental Data | | | |
Net assets, end of period (000 omitted) | $ 113 | $ 36 | $ 521 |
Portfolio turnover rate D | 87% | 116% | 115% |
A Total returns would have been lower had certain expenses not been reduced during the periods shown.
B Calculated based on average shares outstanding during the period.
C Fees and expenses of the underlying Fidelity Central Funds are not included in the Fund's expense ratio. The Fund indirectly bears its proportionate share of the expenses of any underlying Fidelity Central Funds.
D Amount does not include the portfolio activity of any underlying Fidelity Central Funds.
E For the period November 1, 2007 (commencement of operations) to October 31, 2008.
F Expense ratios reflect operating expenses of the class. Expenses before reductions do not reflect amounts reimbursed by the investment adviser or reductions from brokerage service arrangements or reductions from other expense offset arrangements and do not represent the amount paid by the class during periods when reimbursements or reductions occur. Expense ratios before reductions for start-up periods may not be representative of longer-term operating periods. Expenses net of fee waivers reflect expenses after reimbursement by the investment adviser but prior to reductions from brokerage service arrangements or other expense offset arrangements. Expenses net of all reductions represent the net expenses paid by the class.
G Amount represents less than $.01 per share.
H Total distributions of $.08 per share is comprised of distributions from net investment income of $.057 and distributions from net realized gain of $.025 per share.
See accompanying notes which are an integral part of the financial statements.
Annual Report
Notes to Financial Statements
For the period ended October 31, 2010
1. Organization.
Fidelity International Growth Fund (the Fund) is a fund of Fidelity Investment Trust (the Trust) and is authorized to issue an unlimited number of shares. The Trust is registered under the Investment Company Act of 1940, as amended (the 1940 Act), as an open-end management investment company organized as a Massachusetts business trust. The Fund offers Class A, Class T, Class C, International Growth and Institutional Class shares, each of which has equal rights as to assets and voting privileges. Effective after the close of business on September 1, 2010, Class B shares were closed to new accounts and additional purchases by existing shareholders. Each class has exclusive voting rights with respect to matters that affect that class. Class B shares will automatically convert to Class A shares after a holding period of seven years from the initial date of purchase. Investment income, realized and unrealized capital gains and losses, the common expenses of the Fund, and certain fund-level expense reductions, if any, are allocated on a pro-rata basis to each class based on the relative net assets of each class to the total net assets of the Fund. Each class differs with respect to transfer agent and distribution and service plan fees incurred. Certain expense reductions also differ by class. The Fund's investments in emerging markets can be subject to social, economic, regulatory, and political uncertainties and can be extremely volatile.
2. Investments in Fidelity Central Funds.
The Fund may invest in Fidelity Central Funds, which are open-end investment companies available only to other investment companies and accounts managed by Fidelity Management & Research Company (FMR) and its affiliates. The Fund's Schedule of Investments lists each of the Fidelity Central Funds held as of period end, if any, as an investment of the Fund, but does not include the underlying holdings of each Fidelity Central Fund. As an Investing Fund, the Fund indirectly bears its proportionate share of the expenses of the underlying Fidelity Central Funds.
The Money Market Central Funds seek preservation of capital and current income and are managed by Fidelity Investments Money Management, Inc. (FIMM), an affiliate of FMR.
A complete unaudited list of holdings for each Fidelity Central Fund is available upon request or at the Securities and Exchange Commission (the SEC) web site at www.sec.gov. In addition, the financial statements of the Fidelity Central Funds, which are not covered by the Fund's Report of Independent Registered Public Accounting Firm, are available on the SEC web site or upon request.
3. Significant Accounting Policies.
The financial statements have been prepared in conformity with accounting principles generally accepted in the United States of America (GAAP), which require management
Annual Report
3. Significant Accounting Policies - continued
to make certain estimates and assumptions at the date of the financial statements. Actual results could differ from those estimates. The following summarizes the significant accounting policies of the Fund:
Security Valuation. Investments are valued as of 4:00 p.m. Eastern time on the last calendar day of the period. The Fund uses independent pricing services approved by the Board of Trustees to value its investments. When current market prices or quotations are not readily available or reliable, valuations may be determined in good faith in accordance with procedures adopted by the Board of Trustees. Factors used in determining value may include market or security specific events. The frequency with which these procedures are used cannot be predicted and they may be utilized to a significant extent. The value used for net asset value (NAV) calculation under these procedures may differ from published prices for the same securities.
The Fund categorizes the inputs to valuation techniques used to value its investments into a disclosure hierarchy consisting of three levels as shown below.
Level 1 - quoted prices in active markets for identical investments
Level 2 - other significant observable inputs (including quoted prices for similar investments, interest rates, prepayment speeds, etc.)
Level 3 - unobservable inputs (including the fund's own assumptions based on the best information available)
Changes in valuation techniques may result in transfers in or out of an assigned level within the disclosure hierarchy. The aggregate value of investments by input level, as of October 31, 2010 is included at the end of the Fund's Schedule of Investments. Valuation techniques used to value the Fund's investments by major category are as follows.
Equity securities, including restricted securities, for which market quotations are readily available, are valued at the last reported sale price or official closing price as reported by an independent pricing service on the primary market or exchange on which they are traded and are categorized as Level 1 in the hierarchy. In the event there were no sales during the day or closing prices are not available, securities are valued at the last quoted bid price or may be valued using the last available price and are generally categorized as Level 2 in the hierarchy. For foreign equity securities, when significant market or security specific events arise, comparisons to the valuation of American Depositary Receipts (ADRs), futures contracts, Exchange-traded funds (ETFs) and certain indexes as well as quoted prices for similar securities are used and are categorized as Level 2 in the hierarchy in these circumstances. Utilizing these techniques may result in transfers between Level 1 and Level 2. For restricted equity securities and private placements where
Annual Report
Notes to Financial Statements - continued
3. Significant Accounting Policies - continued
Security Valuation - continued
observable inputs are limited, assumptions about market activity and risk are used and are categorized as Level 3 in the hierarchy.
ETFs are valued at their last sale price or official closing price as reported by an independent pricing service on the primary market or exchange on which they are traded and are categorized as Level 1 in the hierarchy. In the event there were no sales during the day but the exchange reports a closing bid level, ETFs are valued at the closing bid and would be categorized as Level 1 in the hierarchy. In the event there was no closing bid, ETFs may be valued by another method that the Board of Trustees believes reflects fair value in accordance with the Board's fair value pricing policies and may be categorized as Level 2 in the hierarchy.
Investments in open-end mutual funds, including the Fidelity Central Funds, are valued at their closing net asset value each business day and are categorized as Level 1 in the hierarchy. Short-term securities with remaining maturities of sixty days or less for which quotations are not readily available are valued at amortized cost, which approximates fair value and are categorized as Level 2 in the hierarchy.
Foreign Currency. The Fund uses foreign currency contracts to facilitate transactions in foreign-denominated securities. Gains and losses from these transactions may arise from changes in the value of the foreign currency or if the counterparties do not perform under the contracts' terms.
Foreign-denominated assets, including investment securities, and liabilities are translated into U.S. dollars at the exchange rate at period end. Purchases and sales of investment securities, income and dividends received and expenses denominated in foreign currencies are translated into U.S. dollars at the exchange rate in effect on the transaction date.
The effects of exchange rate fluctuations on investments are included with the net realized and unrealized gain (loss) on investment securities. Other foreign currency transactions resulting in realized and unrealized gain (loss) are disclosed separately.
Investment Transactions and Income. For financial reporting purposes, the Fund's investment holdings and NAV include trades executed through the end of the last business day of the period. The NAV per share for processing shareholder transactions is calculated as of the close of business of the New York Stock Exchange (NYSE), normally 4:00 p.m. Eastern time and includes trades executed through the end of the prior business day. Gains and losses on securities sold are determined on the basis of identified cost. Dividend income is recorded on the ex-dividend date, except for certain dividends from foreign securities where the ex-dividend date may have passed, which are recorded
Annual Report
3. Significant Accounting Policies - continued
Investment Transactions and Income - continued
as soon as the Fund is informed of the ex-dividend date. Non-cash dividends included in dividend income, if any, are recorded at the fair market value of the securities received. Distributions received on securities that represent a return of capital or capital gain are recorded as a reduction of cost of investments and/or as a realized gain. The Fund estimates the components of distributions received that may be considered return of capital distributions or capital gain distributions. Interest income and distributions from the Fidelity Central Funds are accrued as earned. Interest income includes coupon interest and amortization of premium and accretion of discount on debt securities. Investment income is recorded net of foreign taxes withheld where recovery of such taxes is uncertain.
Expenses. Most expenses of the Trust can be directly attributed to a fund. Expenses which cannot be directly attributed are apportioned amongst each fund in the Trust. Expense estimates are accrued in the period to which they relate and adjustments are made when actual amounts are known.
Income Tax Information and Distributions to Shareholders. Each year the Fund intends to qualify as a regulated investment company, including distributing substantially all of its taxable income and realized gains under Subchapter M of the Internal Revenue Code and filing its U.S. federal tax return. As a result, no provision for income taxes is required. As of October 31, 2010, the Fund did not have any unrecognized tax benefits in the accompanying financial statements. A fund's federal tax return is subject to examination by the Internal Revenue Service (IRS) for a period of three years. Foreign taxes are provided for based on the Fund's understanding of the tax rules and rates that exist in the foreign markets in which it invests.
Distributions are declared and recorded on the ex-dividend date. Income dividends and capital gain distributions are declared separately for each class. Income and capital gain distributions are determined in accordance with income tax regulations, which may differ from GAAP.
Capital accounts within the financial statements are adjusted for permanent book-tax differences. These adjustments have no impact on net assets or the results of operations. Temporary book-tax differences will reverse in a subsequent period.
Book-tax differences are primarily due to the short-term gain distributions from the Fidelity Central Funds, foreign currency transactions, passive foreign investment companies (PFIC), partnerships, capital loss carryforwards and losses deferred due to wash sales.
Annual Report
Notes to Financial Statements - continued
3. Significant Accounting Policies - continued
Income Tax Information and Distributions to Shareholders - continued
The federal tax cost of investment securities and unrealized appreciation (depreciation) as of period end were as follows:
Gross unrealized appreciation | $ 5,209,031 |
Gross unrealized depreciation | (928,317) |
Net unrealized appreciation (depreciation) | $ 4,280,714 |
| |
Tax Cost | $ 32,776,950 |
The tax-based components of distributable earnings as of period end were as follows:
Undistributed ordinary income | $ 278,863 |
Capital loss carryforward | $ (6,290,360) |
Net unrealized appreciation (depreciation) | $ 4,284,636 |
The tax character of distributions paid was as follows:
| October 31, 2010 | October 31, 2009 |
Ordinary Income | $ 245,729 | $ 188,551 |
Short-Term Trading (Redemption) Fees. Shares held by investors in the Fund less than 30 days are subject to a redemption fee equal to 1.00% of the net asset value of shares redeemed. All redemption fees, which reduce the proceeds of the shareholder redemption, are retained by the Fund and accounted for as an addition to paid in capital.
4. Operating Policies.
Repurchase Agreements. FMR has received an Exemptive Order from the SEC which permits the Fund and other affiliated entities of FMR to transfer uninvested cash balances into joint trading accounts which are then invested in repurchase agreements. The Fund may also invest directly with institutions in repurchase agreements. Repurchase agreements are collateralized by government or non-government securities. Upon settlement date, collateral is held in segregated accounts with custodian banks and may be obtained in the event of a default of the counterparty. The Fund monitors, on a daily basis, the value of the collateral to ensure it is at least equal to the principal amount of the repurchase agreement (including accrued interest). In the event of a default by the counterparty, realization of the collateral proceeds could be delayed, during which time the value of the collateral may decline.
Annual Report
5. Purchases and Sales of Investments.
Purchases and sales of securities, other than short-term securities, aggregated $31,048,448 and $23,131,685, respectively.
6. Fees and Other Transactions with Affiliates.
Management Fee. FMR and its affiliates provide the Fund with investment management related services for which the Fund pays a monthly management fee. The management fee is the sum of an individual fund fee rate that is based on an annual rate of .45% of the Fund's average net assets and a group fee rate that averaged .26% during the period. The group fee rate is based upon the average net assets of all the mutual funds advised by FMR. The group fee rate decreases as assets under management increase and increases as assets under management decrease. In addition, the management fee is subject to a performance adjustment (up to a maximum of ± .20% of the Fund's average net assets over a 36 month performance period). The upward or downward adjustment to the management fee is based on the relative investment performance of International Growth as compared to an appropriate benchmark index. The Fund's performance adjustment took effect in November 2008. Subsequent months will be added until the performance period includes 36 months. For the period, the total annual management fee rate, including the performance adjustment, was .82% of the Fund's average net assets.
Distribution and Service Plan Fees. In accordance with Rule 12b-1 of the 1940 Act, the Fund has adopted separate Distribution and Service Plans for each class of shares. Certain classes pay Fidelity Distributors Corporation (FDC), an affiliate of FMR, separate Distribution and Service Fees, each of which is based on an annual percentage of each class' average net assets. In addition, FDC may pay financial intermediaries for selling shares of the Fund and providing shareholder support services. For the period, the Distribution and Service Fee rates, total fees and amounts retained by FDC were as follows:
| Distribution
Fee | Service
Fee | Total Fees | Retained
by FDC |
Class A | -% | .25% | $ 5,536 | $ 860 |
Class T | .25% | .25% | 3,576 | - |
Class B | .75% | .25% | 4,625 | 3,483 |
Class C | .75% | .25% | 10,555 | 3,617 |
| | | $ 24,292 | $ 7,960 |
Sales Load. FDC receives a front-end sales charge of up to 5.75% for selling Class A shares, and 3.50% for selling Class T shares, some of which is paid to financial intermediaries for selling shares of the Fund. FDC receives the proceeds of contingent deferred sales charges levied on Class A, Class T, Class B, and Class C redemptions. These charges depend on the holding period. The deferred sales charges range from 5% to 1% for
Annual Report
Notes to Financial Statements - continued
6. Fees and Other Transactions with Affiliates - continued
Sales Load - continued
Class B, 1% for Class C, 1.00% for certain purchases of Class A shares (1.00% to .50% prior to July 12, 2010) and .25% for certain purchases of Class T shares.
For the period, sales charge amounts retained by FDC were as follows:
| Retained
by FDC |
Class A | $ 4,989 |
Class T | 569 |
Class B* | 583 |
Class C* | 125 |
| $ 6,266 |
* When Class B and Class C shares are initially sold, FDC pays commissions from its own resources to financial intermediaries through which the sales are made.
Transfer Agent Fees. Fidelity Investments Institutional Operations Company, Inc. (FIIOC), an affiliate of FMR, is the transfer, dividend disbursing and shareholder servicing agent for each class of the Fund. FIIOC receives account fees and asset-based fees that vary according to the account size and type of account of the shareholders of the respective classes of the Fund. FIIOC pays for typesetting, printing and mailing of shareholder reports, except proxy statements. For the period, transfer agent fees for each class were as follows:
| Amount | % of
Average
Net Assets |
Class A | $ 7,042 | .32 |
Class T | 2,357 | .33 |
Class B | 1,462 | .31 |
Class C | 3,330 | .32 |
International Growth | 70,950 | .31 |
Institutional Class | 165 | .30 |
| $ 85,306 | |
Accounting and Security Lending Fees. Fidelity Service Company, Inc. (FSC), an affiliate of FMR, maintains the Fund's accounting records. The accounting fee is based on the level of average net assets for the month. Under a separate contract, FSC administers the security lending program. The security lending fee is based on the number and duration of lending transactions.
Annual Report
6. Fees and Other Transactions with Affiliates - continued
Brokerage Commissions. The Fund placed a portion of its portfolio transactions with brokerage firms which are affiliates of the investment adviser. The commissions paid to these affiliated firms were $380 for the period.
7. Committed Line of Credit.
The Fund participates with other funds managed by FMR or an affiliate in a $3.75 billion credit facility (the "line of credit") to be utilized for temporary or emergency purposes to fund shareholder redemptions or for other short-term liquidity purposes. The Fund has agreed to pay commitment fees on its pro-rata portion of the line of credit, which amounted to $103 and is reflected in Miscellaneous expenses on the Statement of Operations. During the period, there were no borrowings on this line of credit.
8. Security Lending.
The Fund lends portfolio securities through a lending agent from time to time in order to earn additional income. The lending agent may loan securities to certain qualified borrowers, including Fidelity Capital Markets (FCM), a broker-dealer affiliated with the Fund. On the settlement date of the loan, the Fund receives collateral (in the form of U.S. Treasury obligations, letters of credit and/or cash) against the loaned securities and maintains collateral in an amount not less than 100% of the market value of the loaned securities during the period of the loan. The market value of the loaned securities is determined at the close of business of the Fund and any additional required collateral is delivered to the Fund on the next business day. If the borrower defaults on its obligation to return the securities loaned because of insolvency or other reasons, a fund could experience delays and costs in recovering the securities loaned or in gaining access to the collateral. Any cash collateral received is invested in the Fidelity Securities Lending Cash Central Fund. The value of loaned securities and cash collateral at period end are disclosed on the Fund's Statement of Assets and Liabilities. Security lending income represents the income earned on investing cash collateral, less rebates paid to borrowers and lending agent fees associated with the loan, plus any premium payments received for lending certain types of securities. Security lending income is presented in the Statement of Operations as a component of income from Fidelity Central Funds. Total security lending income during the period amounted to $13,302. During the period, there were no securities loaned to FCM.
Annual Report
Notes to Financial Statements - continued
9. Expense Reductions.
FMR voluntarily agreed to reimburse each class to the extent annual operating expenses exceeded certain levels of average net assets as noted in the table below. Some expenses, for example interest expense, including commitment fees, are excluded from this reimbursement.
The following classes were in reimbursement during the period:
| Expense
Limitations | Reimbursement
from adviser |
Class A | 1.50% | $ 13,958 |
Class T | 1.75% | 4,759 |
Class B | 2.25% | 2,895 |
Class C | 2.25% | 6,772 |
International Growth | 1.25% | 145,483 |
Institutional Class | 1.25% | 371 |
| | $ 174,238 |
Effective November 1, 2010 the expense limitations will be changed to 1.45%, 1.70%, 2.20%, 2.20%, 1.20%, and 1.20% for Class A, T, B, C, International Growth, and Institutional, respectively.
Many of the brokers with whom FMR places trades on behalf of the Fund provided services to the Fund in addition to trade execution. These services included payments of certain expenses on behalf of the Fund totaling $4,411 for the period.
10. Distributions to Shareholders.
Distributions to shareholders of each class were as follows:
Years ended October 31, | 2010 | 2009 |
From net investment income | | |
Class A | $ 10,514 | $ 7,994 |
Class T | 1,819 | 2,991 |
International Growth | 154,599 | 171,473 |
Institutional Class | 287 | 6,093 |
Total | $ 167,219 | $ 188,551 |
From net realized gain | | |
Class A | $ 5,713 | $ - |
Class T | 2,067 | - |
Class C | 2,797 | - |
International Growth | 67,807 | - |
Institutional Class | 126 | - |
Total | $ 78,510 | $ - |
Annual Report
11. Share Transactions.
Transactions for each class of shares were as follows:
| Shares | Dollars |
Years ended October 31, | 2010 | 2009 | 2010 | 2009 |
Class A | | | | |
Shares sold | 247,866 | 249,117 | $ 1,869,390 | $ 1,499,324 |
Reinvestment of distributions | 2,011 | 1,620 | 14,999 | 7,954 |
Shares redeemed | (88,980) | (193,639) | (650,197) | (1,109,207) |
Net increase (decrease) | 160,897 | 57,098 | $ 1,234,192 | $ 398,071 |
Class T | | | | |
Shares sold | 73,695 | 78,248 | $ 554,529 | $ 453,244 |
Reinvestment of distributions | 513 | 606 | 3,840 | 2,982 |
Shares redeemed | (26,780) | (96,008) | (194,364) | (616,841) |
Net increase (decrease) | 47,428 | (17,154) | $ 364,005 | $ (160,615) |
Class B | | | | |
Shares sold | 37,806 | 35,907 | $ 276,981 | $ 202,014 |
Shares redeemed | (15,339) | (107,260) | (113,063) | (656,068) |
Net increase (decrease) | 22,467 | (71,353) | $ 163,918 | $ (454,054) |
Class C | | | | |
Shares sold | 110,505 | 147,440 | $ 831,229 | $ 796,649 |
Reinvestment of distributions | 369 | - | 2,760 | - |
Shares redeemed | (71,336) | (161,828) | (504,821) | (850,523) |
Net increase (decrease) | 39,538 | (14,388) | $ 329,168 | $ (53,874) |
International Growth | | | | |
Shares sold | 1,971,246 | 1,976,158 | $ 14,829,454 | $ 11,124,182 |
Reinvestment of distributions | 28,518 | 27,149 | 212,744 | 133,303 |
Shares redeemed | (1,213,664) | (1,574,393) | (8,965,012) | (8,834,160) |
Net increase (decrease) | 786,100 | 428,914 | $ 6,077,186 | $ 2,423,325 |
Institutional Class | | | | |
Shares sold | 11,311 | 6,125 | $ 86,413 | $ 37,094 |
Reinvestment of distributions | 55 | 1,241 | 412 | 6,093 |
Shares redeemed | (3,097) | (97,389) | (23,304) | (632,954) |
Net increase (decrease) | 8,269 | (90,023) | $ 63,521 | $ (589,767) |
12. Other.
The Fund's organizational documents provide former and current trustees and officers with a limited indemnification against liabilities arising in connection with the performance of their duties to the Fund. In the normal course of business, the Fund may also enter into contracts that provide general indemnifications. The Fund's maximum exposure under these arrangements is unknown as this would be dependent on future claims that may be made against the Fund. The risk of material loss from such claims is considered remote.
Annual Report
To the Trustees of Fidelity Investment Trust and the Shareholders of Fidelity International Growth Fund:
In our opinion, the accompanying statement of assets and liabilities, including the schedule of investments, and the related statements of operations and of changes in net assets and the financial highlights present fairly, in all material respects, the financial position of Fidelity International Growth Fund (a fund of Fidelity Investment Trust) at October 31, 2010, the results of its operations for the year then ended, the changes in its net assets for each of the two years in the period then ended and the financial highlights for each of the periods indicated, in conformity with accounting principles generally accepted in the United States of America. These financial statements and financial highlights (hereafter referred to as "financial statements") are the responsibility of the Fidelity International Growth Fund's management. Our responsibility is to express an opinion on these financial statements based on our audits. We conducted our audits of these financial statements in accordance with the standards of the Public Company Accounting Oversight Board (United States). Those standards require that we plan and perform the audit to obtain reasonable assurance about whether the financial statements are free of material misstatement. An audit includes examining, on a test basis, evidence supporting the amounts and disclosures in the financial statements, assessing the accounting principles used and significant estimates made by management, and evaluating the overall financial statement presentation. We believe that our audits, which included confirmation of securities at October 31, 2010 by correspondence with the custodian and brokers, provide a reasonable basis for our opinion.
/s/ PricewaterhouseCoopers LLP
PricewaterhouseCoopers LLP
Boston, Massachusetts
December 15, 2010
Annual Report
The Trustees, Member of the Advisory Board, and executive officers of the trust and fund, as applicable, are listed below. The Board of Trustees governs the fund and is responsible for protecting the interests of shareholders. The Trustees are experienced executives who meet periodically throughout the year to oversee the fund's activities, review contractual arrangements with companies that provide services to the fund, oversee management of the risks associated with such activities and contractual arrangements, and review the fund's performance. Except for James C. Curvey, each of the Trustees oversees 221 funds advised by FMR or an affiliate. Mr. Curvey oversees 410 funds advised by FMR or an affiliate.
The Trustees hold office without limit in time except that (a) any Trustee may resign; (b) any Trustee may be removed by written instrument, signed by at least two-thirds of the number of Trustees prior to such removal; (c) any Trustee who requests to be retired or who has become incapacitated by illness or injury may be retired by written instrument signed by a majority of the other Trustees; and (d) any Trustee may be removed at any special meeting of shareholders by a two-thirds vote of the outstanding voting securities of the trust. Each Trustee who is not an interested person (as defined in the 1940 Act) (Independent Trustee), shall retire not later than the last day of the calendar year in which his or her 72nd birthday occurs. The Independent Trustees may waive this mandatory retirement age policy with respect to individual Trustees. The executive officers and Advisory Board Member hold office without limit in time, except that any officer and Advisory Board Member may resign or may be removed by a vote of a majority of the Trustees at any regular meeting or any special meeting of the Trustees. Except as indicated, each individual has held the office shown or other offices in the same company for the past five years.
Experience, Skills, Attributes, and Qualifications of the Fund's Trustees. The Governance and Nominating Committee has adopted a statement of policy that describes the experience, qualifications, attributes, and skills that are necessary and desirable for potential Independent Trustee candidates (Statement of Policy). The Board believes that each Trustee satisfied at the time he or she was initially elected or appointed a Trustee, and continues to satisfy, the standards contemplated by the Statement of Policy. The Governance and Nominating Committee also engages professional search firms to help identify potential Independent Trustee candidates who have the experience, qualifications, attributes, and skills consistent with the Statement of Policy. From time to time, additional criteria based on the composition and skills of the current Independent Trustees, as well as experience or skills that may be appropriate in light of future changes to board composition, business conditions, and regulatory or other developments, have also been considered by the professional search firms and the Governance and Nominating Committee. In addition, the Board takes into account the Trustees' commitment and participation in Board and committee meetings, as well as their leadership of standing and ad hoc committees throughout their tenure.
In determining that a particular Trustee was and continues to be qualified to serve as a Trustee, the Board has considered a variety of criteria, none of which, in isolation, was controlling. The Board believes that, collectively, the Trustees have balanced and diverse experience, qualifications, attributes, and skills, which allow the Board to operate effectively in governing the fund and protecting the interests of shareholders. Information about the specific experience, skills, attributes, and qualifications of each Trustee, which in each case led to the Board's conclusion that the Trustee should serve (or continue to serve) as a trustee of the fund, is provided below.
Annual Report
Trustees and Officers - continued
Board Structure and Oversight Function. Edward C. Johnson 3d is an interested person (as defined in the 1940 Act) and currently serves as Chairman. The Trustees have determined that an interested Chairman is appropriate and benefits shareholders because an interested Chairman has a personal and professional stake in the quality and continuity of services provided to the fund. Independent Trustees exercise their informed business judgment to appoint an individual of their choosing to serve as Chairman, regardless of whether the Trustee happens to be independent or a member of management. The Independent Trustees have determined that they can act independently and effectively without having an Independent Trustee serve as Chairman and that a key structural component for assuring that they are in a position to do so is for the Independent Trustees to constitute a substantial majority for the Board. The Independent Trustees also regularly meet in executive session. Ned C. Lautenbach serves as Chairman of the Independent Trustees and as such (i) acts as a liaison between the Independent Trustees and management with respect to matters important to the Independent Trustees and (ii) with management prepares agendas for Board meetings.
Fidelity funds are overseen by different Boards of Trustees. The fund's Board oversees Fidelity's equity and high income funds and another Board oversees Fidelity's investment-grade bond, money market, and asset allocation funds. The asset allocation funds may invest in Fidelity funds overseen by the fund's Board. The use of separate Boards, each with its own committee structure, allows the Trustees of each group of Fidelity funds to focus on the unique issues of the funds they oversee, including common research, investment, and operational issues. On occasion, the separate Boards establish joint committees to address issues of overlapping consequences for the Fidelity funds overseen by each Board.
The Trustees operate using a system of committees to facilitate the timely and efficient consideration of all matters of importance to the Trustees, the fund, and fund shareholders and to facilitate compliance with legal and regulatory requirements and oversight of the fund's activities and associated risks. The Board, acting through its committees, has charged FMR and its affiliates with (i) identifying events or circumstances the occurrence of which could have demonstrably adverse effects on the fund's business and/or reputation; (ii) implementing processes and controls to lessen the possibility that such events or circumstances occur or to mitigate the effects of such events or circumstances if they do occur; and (iii) creating and maintaining a system designed to evaluate continuously business and market conditions in order to facilitate the identification and implementation processes described in (i) and (ii) above. Because the day-to-day operations and activities of the fund are carried out by or through FMR, its affiliates and other service providers, the fund's exposure to risks is mitigated but not eliminated by the processes overseen by the Trustees. While each of the Board's committees has responsibility for overseeing different aspects of the fund's activities, oversight is exercised primarily through the Operations, Audit, and Compliance Committees. Appropriate personnel, including but not limited to the fund's Chief Compliance Officer (CCO), FMR's internal auditor, the independent accountants, the fund's Treasurer and portfolio management personnel, make periodic reports to the Board's committees, as appropriate. The responsibilities of each committee, including their oversight responsibilities, are described further under "Standing Committees of the Fund's Trustees."
Annual Report
The fund's Statement of Additional Information (SAI) includes more information about the Trustees. To request a free copy, call Fidelity at 1-800-544-8544.
Interested Trustees*:
Correspondence intended for each Trustee who is an interested person may be sent to Fidelity Investments, 82 Devonshire Street, Boston, Massachusetts 02109.
Name, Age; Principal Occupations and Other Relevant Experience+ |
Edward C. Johnson 3d (80) |
| Year of Election or Appointment: 1984 Mr. Johnson is Trustee and Chairman of the Board of Trustees of certain Trusts. Mr. Johnson serves as Chief Executive Officer, Chairman, and a Director of FMR LLC; Chairman and a Director of FMR; Chairman and a Director of Fidelity Research & Analysis Company (FRAC); Chairman and a Director of Fidelity Investments Money Management, Inc.; and Chairman and a Director of FMR Co., Inc. In addition, Mr. Johnson serves as Chairman and Director of FIL Limited. Previously, Mr. Johnson served as President of FMR LLC (2006-2007). |
James C. Curvey (75) |
| Year of Election or Appointment: 2007 Mr. Curvey also serves as Trustee (2007-present) of other investment companies advised by FMR. Mr. Curvey is a Director of Fidelity Investments Money Management, Inc. (2009-present), Director of Fidelity Research & Analysis Co. (2009-present) and Director of FMR and FMR Co., Inc. (2007-present). Mr. Curvey is also Vice Chairman (2007-
present) and Director of FMR LLC. In addition, Mr. Curvey serves as an Overseer for the Boston Symphony Orchestra and a member of the Trustees of Villanova University. Previously, Mr. Curvey was the Vice Chairman (2006-2007) and Director (2000-2007) of FMR Corp. |
* Trustees have been determined to be "Interested Trustees" by virtue of, among other things, their affiliation with the trust or various entities under common control with FMR.
Annual Report
Trustees and Officers - continued
+ The information above includes each Trustee's principal occupation during the last five years and other information relating to the experience, attributes, and skills relevant to each Trustee's qualifications to serve as a Trustee, which led to the conclusion that each Trustee should serve as a Trustee for the fund.
Independent Trustees:
Correspondence intended for each Independent Trustee (that is, the Trustees other than the Interested Trustees) may be sent to Fidelity Investments, P.O. Box 55235, Boston, Massachusetts 02205-5235.
Name, Age; Principal Occupations and Other Relevant Experience+ |
Dennis J. Dirks (62) |
| Year of Election or Appointment: 2005 Prior to his retirement in May 2003, Mr. Dirks was Chief Operating Officer and a member of the Board of The Depository Trust & Clearing Corporation (DTCC). He also served as President, Chief Operating Officer, and Board member of The Depository Trust Company (DTC) and President and Board member of the National Securities Clearing Corporation (NSCC). In addition, Mr. Dirks served as Chief Executive Officer and Board member of the Government Securities Clearing Corporation, Chief Executive Officer and Board member of the Mortgage-Backed Securities Clearing Corporation, as a Trustee and a member of the Finance Committee of Manhattan College (2005-2008), and as a Trustee and a member of the Finance Committee of AHRC of Nassau County (2006-2008). Mr. Dirks is a member of the Independent Directors Council (IDC) Governing Council (2010-Present) and Board of Directors for The Brookville Center for Children's Services, Inc. (2009-present). |
Alan J. Lacy (57) |
| Year of Election or Appointment: 2008 Mr. Lacy serves as Senior Adviser (2007-present) of Oak Hill Capital Partners, L.P. (private equity). Mr. Lacy also served as Chief Executive Officer (2000-2005) and Vice Chairman (2005-2006) of Sears Holdings Corporation and Sears, Roebuck and Co. (retail). In addition, Mr. Lacy serves as a member of the Board of Directors of The Western Union Company (global money transfer, 2006-present) and Bristol-Myers Squibb Company (global pharmaceuticals, 2007-present). Mr. Lacy is Chairman (2008-present) and a member (2006-present) of the Board of Trustees of The National Parks Conservation Association. |
Ned C. Lautenbach (66) |
| Year of Election or Appointment: 2000 Mr. Lautenbach is Chairman of the Independent Trustees of the Equity and High Income Funds (2006-present). Mr. Lautenbach currently serves as the Lead Director of the Eaton Corporation Board of Directors (diversified industrial, 1997-present). Mr. Lautenbach is also a member of the Board of Directors of the Philharmonic Center for the Arts in Naples, Florida (1999-present); a member of the Board of Trustees of Fairfield University (2005-present); and a member of the Council on Foreign Relations (1994-present). Previously, Mr. Lautenbach was a Partner/Advisory Partner at Clayton, Dubilier & Rice, Inc. (private equity investment, 1998-2010), as well as a Director of Sony Corporation (2006-2007). |
Joseph Mauriello (66) |
| Year of Election or Appointment: 2008 Prior to his retirement in January 2006, Mr. Mauriello served in numerous senior management positions including Deputy Chairman and Chief Operating Officer (2004-2005), and Vice Chairman of Financial Services (2002-2004) of KPMG LLP US (professional services, 1965-2005). Mr. Mauriello currently serves as a member of the Board of Directors of XL Group plc. (global insurance and re-insurance, 2006-present) and of Arcadia Resources Inc. (health care services and products, 2007-
present). Previously, Mr. Mauriello served as a Director of the Hamilton Funds of the Bank of New York (2006-2007). |
Cornelia M. Small (66) |
| Year of Election or Appointment: 2005 Ms. Small is a member of the Board of Directors of the Teagle Foundation (2009-present). Ms. Small is also a member of the Investment Committee, and Chair (2008-present) and a member of the Board of Trustees of Smith College. In addition, Ms. Small serves on the Investment Committee of the Berkshire Taconic Community Foundation (2008-
present). Previously, Ms. Small served as Chairperson of the Investment Committee (2002-2008) of Smith College. In addition, Ms. Small served as Chief Investment Officer, Director of Global Equity Investments, and a member of the Board of Directors of Scudder, Stevens & Clark and Scudder Kemper Investments. |
William S. Stavropoulos (71) |
| Year of Election or Appointment: 2001 Mr. Stavropoulos is Vice Chairman of the Independent Trustees of the Equity and High Income Funds (2006-present). Mr. Stavropoulos serves as President and Founder of the Michigan Baseball Foundation, the Great Lakes Loons (2007-present). Mr. Stavropoulos is Chairman Emeritus of the Board of Directors of The Dow Chemical Company, where he previously served in numerous senior management positions, including President, CEO (1995-2000; 2002-2004), Chairman of the Executive Committee (2000-2006), and as a member of the Board of Directors (1990-2006). Currently, Mr. Stavropoulos is Chairman of Univar (global distributor of commodity and specialty chemicals, 2010-present), a Director of Teradata Corporation (data warehousing and technology solutions, 2008-present), Chemical Financial Corporation, Maersk Inc. (industrial conglomerate), Tyco International, Inc. (multinational manufacturing and services, 2007-present), and a member of the Advisory Board for Metalmark Capital (private equity investment, 2005-
present). Mr. Stavropoulos is a special advisor to Clayton, Dubilier & Rice, Inc. (private equity investment). In addition, Mr. Stavropoulos is a member of the University of Notre Dame Advisory Council for the College of Science. |
David M. Thomas (61) |
| Year of Election or Appointment: 2008 Previously, Mr. Thomas served as Executive Chairman (2005-2006) and Chairman and Chief Executive Officer (2000-2005) of IMS Health, Inc. (pharmaceutical and healthcare information solutions). In addition, Mr. Thomas serves as a member of the Board of Directors of Fortune Brands, Inc. (consumer products), and Interpublic Group of Companies, Inc. (marketing communication, 2004-present). |
Michael E. Wiley (60) |
| Year of Election or Appointment: 2008 Mr. Wiley also serves as a Director of Asia Pacific Exploration Consolidated (international oil and gas exploration and production, 2008-
present). Mr. Wiley serves as a Director of Tesoro Corporation (independent oil refiner and marketer, 2005-present), and a Director of Bill Barrett Corporation (exploration and production, 2005-present). In addition, Mr. Wiley also serves as a Director of Post Oak Bank (privately-held bank, 2004-present). Previously, Mr. Wiley served as a member of the Board of Trustees of the University of Tulsa (2000-2006; 2007-2010), as a Senior Energy Advisor of Katzenbach Partners, LLC (consulting, 2006-2007), as an Advisory Director of Riverstone Holdings (private investment), Chairman, President, and CEO of Baker Hughes, Inc. (oilfield services, 2000-2004), and as Director of Spinnaker Exploration Company (exploration and production, 2001-2005). |
Annual Report
+ The information above includes each Trustee's principal occupation during the last five years and other information relating to the experience, attributes, and skills relevant to each Trustee's qualifications to serve as a Trustee, which led to the conclusion that each Trustee should serve as a Trustee for the fund.
Advisory Board Member and Executive Officers:
Correspondence intended for each executive officer and Peter S. Lynch may be sent to Fidelity Investments, 82 Devonshire Street, Boston, Massachusetts 02109.
Name, Age; Principal Occupation |
Peter S. Lynch (66) |
| Year of Election or Appointment: 2003 Member of the Advisory Board of Fidelity's Equity and High Income Funds. Mr. Lynch is Vice Chairman and a Director of FMR and FMR Co., Inc. In addition, Mr. Lynch serves as a Trustee of Boston College and as the Chairman of the Inner-City Scholarship Fund. Previously, Mr. Lynch served on the Special Olympics International Board of Directors (1997-2006). |
Kenneth B. Robins (41) |
| Year of Election or Appointment: 2008 President and Treasurer of Fidelity's Equity and High Income Funds. Mr. Robins also serves as President and Treasurer (2010-present) and Assistant Treasurer (2009-present) of other Fidelity funds and is an employee of Fidelity Investments (2004-present). Previously, Mr. Robins served as Deputy Treasurer of the Fidelity funds (2005-2008) and Treasurer and Chief Financial Officer of The North Carolina Capital Management Trust: Cash and Term Portfolios (2006-2008). |
Bruce T. Herring (45) |
| Year of Election or Appointment: 2006 Vice President of certain Equity Funds. Mr. Herring also serves as Chief Investment Officer and Director of Fidelity Management & Research (U.K.) Inc. (2010-present) and Group Chief Investments Officer of FMR. Previously, Mr. Herring served as Vice President (2005-2006) and Senior Vice President (2006-2007) of Fidelity Management & Research Company, Vice President of FMR Co., Inc. (2001-2007) and as a portfolio manager for Fidelity U.S. Equity Funds. |
Brian B. Hogan (46) |
| Year of Election or Appointment: 2009 Vice President of certain Equity Funds and Vice President of Sector Funds. Mr. Hogan also serves as President of FMR's Equity Division (2009-present). Previously, Mr. Hogan served as Senior Vice President, Equity Research of FMR (2006-2009) and as a portfolio manager. |
Scott C. Goebel (42) |
| Year of Election or Appointment: 2008 Secretary and Chief Legal Officer (CLO) of the Fidelity funds. Mr. Goebel also serves as Secretary and CLO of The North Carolina Capital Management Trust: Cash and Term Portfolio (2008-present); General Counsel, Secretary, and Senior Vice President of FMR (2008-present) and FMR Co., Inc. (2008-present); Deputy General Counsel of FMR LLC; Chief Legal Officer of Fidelity Management & Research (Hong Kong) Limited (2008-present) and Assistant Secretary of Fidelity Management & Research (Japan) Inc. (2008-present), Fidelity Investments Money Management, Inc. (2008-present), Fidelity Management & Research (U.K.) Inc. (2008-present), and Fidelity Research and Analysis Company (2008-present). Previously, Mr. Goebel served as Assistant Secretary of the Funds (2007-2008) and as Vice President and Secretary of Fidelity Distributors Corporation (FDC) (2005-2007). |
William C. Coffey (41) |
| Year of Election or Appointment: 2009 Assistant Secretary of Fidelity's Equity and High Income Funds. Mr. Coffey also serves as Senior Vice President and Deputy General Counsel of FMR LLC (2010-present), and is an employee of Fidelity Investments. Previously, Mr. Coffey served as Vice President and Associate General Counsel of FMR LLC (2005-2009). |
Holly C. Laurent (56) |
| Year of Election or Appointment: 2008 Anti-Money Laundering (AML) Officer of the Fidelity funds. Ms. Laurent also serves as AML Officer of The North Carolina Capital Management Trust: Cash and Term Portfolio (2008-present) and is an employee of Fidelity Investments. Previously, Ms. Laurent was Senior Vice President and Head of Legal for Fidelity Business Services India Pvt. Ltd. (2006-
2008), and Senior Vice President, Deputy General Counsel and Group Head for FMR LLC (2005-2006). |
Christine Reynolds (52) |
| Year of Election or Appointment: 2008 Chief Financial Officer of the Fidelity funds. Ms. Reynolds became President of Fidelity Pricing and Cash Management Services (FPCMS) in August 2008. Ms. Reynolds served as Chief Operating Officer of FPCMS (2007-2008). Previously, Ms. Reynolds served as President, Treasurer, and Anti-Money Laundering officer of the Fidelity funds (2004-2007). |
Kenneth A. Rathgeber (63) |
| Year of Election or Appointment: 2004 Chief Compliance Officer of Fidelity's Equity and High Income Funds. Mr. Rathgeber is Chief Compliance Officer of Fidelity Management & Research (Hong Kong) Limited (2008-present), Fidelity Management & Research (Japan) Inc. (2008-present), FMR (2005-present), FMR Co., Inc. (2005-present), Fidelity Management & Research (U.K.) Inc. (2005-
present), Fidelity Research & Analysis Company (2005-present), Fidelity Investments Money Management, Inc. (2005-present), Pyramis Global Advisors, LLC (2005-present), and Strategic Advisers, Inc.
(2005-present). |
Jeffrey S. Christian (49) |
| Year of Election or Appointment: 2009 Deputy Treasurer of the Fidelity funds. Mr. Christian is an employee of Fidelity Investments. Previously, Mr. Christian served as Chief Financial Officer (2008-2009) of certain Fidelity funds and Senior Vice President of Fidelity Pricing and Cash Management Services (FPCMS) (2004-2009). |
Bryan A. Mehrmann (49) |
| Year of Election or Appointment: 2005 Deputy Treasurer of the Fidelity funds. Mr. Mehrmann is an employee of Fidelity Investments. |
Adrien E. Deberghes (43) |
| Year of Election or Appointment: 2008 Deputy Treasurer of Fidelity's Equity and High Income Funds. Mr. Deberghes also serves as Assistant Treasurer of other Fidelity funds (2010-present) and is an employee of Fidelity Investments (2008-
present). Previously, Mr. Deberghes served as Senior Vice President of Mutual Fund Administration at State Street Corporation (2007-2008), Senior Director of Mutual Fund Administration at Investors Bank & Trust (2005-2007), and Director of Finance for Dunkin' Brands (2000-2005). |
Stephanie J. Dorsey (41) |
| Year of Election or Appointment: 2010 Assistant Treasurer of Fidelity's Equity and High Income Funds. Ms. Dorsey also serves as Deputy Treasurer of other Fidelity funds (2008-
present) and is an employee of Fidelity Investments (2008-present). Previously, Ms. Dorsey served as Treasurer (2004-2008) of the JPMorgan Mutual Funds and Vice President (2004-2008) of JPMorgan Chase Bank. |
John R. Hebble (52) |
| Year of Election or Appointment: 2009 Assistant Treasurer of Fidelity's Equity and High Income Funds. Mr. Hebble also serves as Treasurer and Chief Financial Officer of The North Carolina Capital Management Trust: Cash and Term Portfolio (2008-present), President and Treasurer of other Fidelity funds (2008-
present) and is an employee of Fidelity Investments. |
Gary W. Ryan (52) |
| Year of Election or Appointment: 2005 Assistant Treasurer of the Fidelity funds. Mr. Ryan is an employee of Fidelity Investments. Previously, Mr. Ryan served as Vice President of Fund Reporting in Fidelity Pricing and Cash Management Services (FPCMS) (1999-2005). |
Jonathan Davis (42) |
| Year of Election or Appointment: 2010 Assistant Treasurer of the Fidelity funds. Mr. Davis is an employee of Fidelity Investments. Previously, Mr. Davis served as Vice President and Associate General Counsel of FMR LLC (2003-2010). |
Annual Report
The Board of Trustees of Fidelity International Growth Fund voted to pay shareholders of record at the opening of business on record date, the following distributions per share derived from capital gains realized from sales of portfolio securities, and dividends derived from net investment income:
| Pay Date | Record Date | Dividends | Capital Gains |
Fidelity International Growth Fund | 12/06/10 | 12/03/10 | $0.057 | $0.011 |
The Fidelity International Growth Fund designates 100% of the dividends distributed during the fiscal year as amounts which may be taken into account as a dividend for the purposes of the maximum rate under section 1(h)(11) of the Internal Revenue Code.
The amounts per share which represent income derived from sources within, and taxes paid to, foreign countries or possessions of the United States are as follows:
| Pay Date | Income | Taxes |
International Value Fund | 12/7/2009 | $0.063 | $0.0099 |
The fund will notify shareholders in January 2011 of amounts for use in preparing 2010 income tax returns.
Annual Report
Board Approval of Investment Advisory Contracts and Management Fees
Fidelity International Growth Fund
Each year, the Board of Trustees, including the Independent Trustees (together, the Board), votes on the renewal of the management contract and sub-advisory agreements (together, the Advisory Contracts) for the fund. The Board, assisted by the advice of fund counsel and Independent Trustees' counsel, requests and considers a broad range of information relevant to the renewal of the Advisory Contracts throughout the year.
The Board meets regularly and considers at each of its meetings factors that are relevant to its annual consideration of the renewal of the fund's Advisory Contracts, including the services and support provided to the fund and its shareholders. The Board has established various standing committees, each composed of Independent Trustees with varying backgrounds, to which the Board has assigned specific subject matter responsibilities in order to enhance effective decision-making by the Board. The Board, acting directly and through its Committees, requests and receives information concerning the annual consideration of the renewal of the fund's Advisory Contracts. The Board also meets as needed to consider matters specifically related to the Board's annual consideration of the renewal of Advisory Contracts. Members of the Board may also meet with trustees of other Fidelity funds through ad hoc joint committees to discuss certain matters relevant to the Fidelity funds.
At its July 2010 meeting, the Board of Trustees, including the Independent Trustees, unanimously determined to renew the fund's Advisory Contracts. In reaching its determination, the Board considered all factors it believed relevant, including (i) the nature, extent, and quality of the services to be provided to the fund and its shareholders (including the investment performance of the fund); (ii) the competitiveness of the fund's management fee and total expenses; (iii) the total costs of the services to be provided by and the profits to be realized by Fidelity from its relationship with the fund; (iv) the extent to which economies of scale would be realized as the fund grows; and (v) whether fee levels reflect these economies of scale, if any, for the benefit of fund shareholders.
In considering whether to renew the Advisory Contracts for the fund, the Board reached a determination, with the assistance of fund counsel and Independent Trustees' counsel and through the exercise of its business judgment, that the renewal of the Advisory Contracts is in the best interests of fund shareholders and that the compensation to be received by Fidelity under the management contract is fair and reasonable. The Board's decision to renew the Advisory Contracts was not based on any single factor noted above, but rather was based on a comprehensive consideration of all the information provided to the Board at its meetings throughout the year. The Board, in reaching its determination to renew the Advisory Contracts, is aware that shareholders in the fund have a broad range of investment choices available to them, including a wide choice among mutual funds offered by Fidelity's competitors, and that the fund's shareholders, with the opportunity to review and weigh the disclosure provided by the fund in its prospectus and other public disclosures, have chosen to invest in this fund, managed by Fidelity.
Annual Report
Nature, Extent, and Quality of Services Provided. The Board considered the staffing within the investment adviser, FMR, and the sub-advisers (together, the Investment Advisers), including the backgrounds of the fund's investment personnel and the fund's investment objective and discipline. The Independent Trustees also had discussions with senior management of Fidelity's investment operations and investment groups. The Board considered the structure of the portfolio manager compensation program and whether this structure provides appropriate incentives to act in the best interest of the fund.
Resources Dedicated to Investment Management and Support Services. The Board and the equity research subcommittee of the Board's Fund Oversight Committee reviewed the size, education, and experience of the Investment Advisers' investment staff, their use of technology, and the Investment Advisers' approach to recruiting, training, and retaining portfolio managers and other research, advisory, and management personnel. The Board noted that Fidelity's analysts have access to a variety of technological tools and market and securities data that enable them to perform both fundamental and quantitative analysis and to specialize in various disciplines. The Board considered Fidelity's extensive global research capabilities that enable the Investment Advisers to aggregate data from various sources in an effort to produce positive investment results. The Board also considered that Fidelity's portfolio managers and analysts have access to daily portfolio attribution that allows for monitoring of a fund's portfolio, as well as an electronic communication system that provides immediate real-time access to research concerning issuers and credit enhancers. The Board noted FMR's continued focus on strengthening the organization and discipline of equity portfolio management and research.
Shareholder and Administrative Services. The Board considered (i) the nature, extent, quality, and cost of advisory, administrative, and shareholder services performed by the Investment Advisers and their affiliates under the Advisory Contracts and under separate agreements covering transfer agency, pricing and bookkeeping, and securities lending services for the fund; (ii) the nature and extent of the investment adviser's supervision of third party service providers, principally custodians and subcustodians; and (iii) the resources devoted to, and the record of compliance with, the fund's compliance policies and procedures. The Board also reviewed the allocation of fund brokerage, including allocations to brokers affiliated with the Investment Advisers, the use of brokerage commissions to pay fund expenses, and the use of "soft" commission dollars to pay for research services.
The Board noted that the growth of fund assets over time across the complex allows Fidelity to reinvest in the development of services designed to enhance the value or convenience of the Fidelity funds as investment vehicles. These services include 24-hour access to account information and market information through phone representatives and over the Internet, and investor education materials and asset allocation tools.
Annual Report
Board Approval of Investment Advisory Contracts and
Management Fees - continued
Investment in a Large Fund Family. The Board considered the benefits to shareholders of investing in a Fidelity fund, including the benefits of investing in a fund that is part of a large family of funds offering a variety of investment disciplines and providing a large variety of mutual fund investor services. The Board noted that Fidelity had taken, or had made recommendations that resulted in the Fidelity funds taking, a number of actions over the previous year that benefited particular funds, including (i) dedicating additional resources to investment research and restructuring and broadening the focus of the investment research teams; (ii) bolstering the senior management team that oversees asset management; (iii) launching Class F of certain funds as a lower-fee class available to Freedom K and Freedom Index Funds; (iv) lowering the initial investment minimums and ongoing balance requirements for Real Estate High Income Fund; (v) eliminating subsequent purchase minimums for all funds and adding a waiver of the investment minimum requirement for new accounts opened with the proceeds of a systematic withdrawal plan; (vi) eliminating the withdrawal minimum and maximum limits for systematic withdrawals from Advisor funds; (vii) expanding sales load waivers on Class A shares for Destiny Planholders and expanding Institutional Class eligibility for Class O Destiny Planholders; and (viii) changing certain Class A and Class T sales charge structures to further align them with industry practices.
Investment Performance. The Board considered whether the fund has operated in accordance with its investment objective, as well as its record of compliance with its investment restrictions. It also reviewed the fund's absolute investment performance for each class, as well as the fund's relative investment performance for each class measured against (i) a broad-based securities market index, and (ii) a custom peer group of mutual funds deemed appropriate by Fidelity and reviewed by the Board. Because the fund had been in existence less than three calendar years, the following chart considered by the Board shows, for the one-year period ended December 31, 2009, the total returns of the retail class and Class B of the fund, the total return of a broad-based securities market index ("benchmark"), and a range of total returns of a custom peer group of mutual funds defined by FMR based on categories assigned by Morningstar, Inc. The returns of the retail class and Class B show the performance of the highest and lowest performing classes, respectively. The box within the chart shows the 25th percentile return (bottom of box) and the 75th percentile return (top of box) of the peer group. Returns shown above the box are in the first quartile and returns shown below the box are in the fourth quartile. The percentage beaten numbers noted below the chart correspond to the percentile box and represent the percentage of funds in the peer group whose performance was equal to or lower than that of the class indicated. The fund's custom peer group, defined by FMR, is a peer group that FMR believes provides a more meaningful performance comparison than the peer group assigned by Morningstar, Inc., which assigns mutual funds to categories based on their investment styles as measured by their underlying portfolio holdings.
Annual Report
Fidelity International Growth Fund

The Board reviewed the fund's relative investment performance against its peer group and noted that the performance of the retail class of the fund was in the third quartile for the period shown. The Board also noted that the investment performance of the retail class of the fund compared favorably to its benchmark for the period shown. The Board considered that the variations in performance among the fund's classes reflect the variations in class expenses, which result in lower performance for higher expense classes. The Board also reviewed the fund's performance since inception as well as performance in the current year. The Board noted that it is difficult to evaluate in any comprehensive fashion the performance of the fund, in light of its relatively recent commencement of operations.
The Board also considered that the fund's management fee is subject to upward or downward adjustment depending upon whether, and to what extent, the fund's investment performance for the performance period exceeds, or is exceeded by, the record (over the same period) of a Board-approved performance adjustment index. The Board realizes that the performance adjustment provides FMR with a strong economic incentive to seek to achieve superior performance for the fund's shareholders and helps to more closely align the interests of FMR and the fund's shareholders.
Based on its review, and giving particular weight to the nature and quality of the resources dedicated by the Investment Advisers to maintain and improve relative performance and factoring in the unprecedented market events in recent years, the Board concluded that the nature, extent, and quality of investment management and support services and of shareholder and administrative services provided to the fund will benefit the fund's shareholders, particularly in light of the Board's view that the fund's shareholders benefit from investing in a fund that is part of a large family of funds offering a variety of investment disciplines and services.
Annual Report
Board Approval of Investment Advisory Contracts and
Management Fees - continued
Competitiveness of Management Fee and Total Fund Expenses. The Board considered the fund's management fee and total expenses compared to "mapped groups" of competitive funds and classes. Fidelity creates "mapped groups" by combining similar Lipper investment objective categories that have comparable management fee characteristics. Combining Lipper investment objective categories aids the Board's management fee and total expense comparisons by broadening the competitive group used for comparison and by reducing the number of universes to which various Fidelity funds are compared.
Management Fee. The Board considered two proprietary management fee comparisons for the 12-month (or shorter) periods shown in the chart below. The group of Lipper funds used by the Board for management fee comparisons is referred to below as the "Total Mapped Group." The Total Mapped Group comparison focuses on a fund's standing relative to the total universe of comparable funds available to investors, in terms of gross management fees before expense reimbursements or caps, and without giving effect to the fund's performance adjustment. "TMG %" represents the percentage of funds in the Total Mapped Group that had management fees that were lower than the fund's. For example, a TMG % of 15% means that 85% of the funds in the Total Mapped Group had higher management fees than the fund. The "Asset-Size Peer Group" (ASPG) comparison focuses on a fund's standing relative to non-Fidelity funds similar in size to the fund within the Total Mapped Group. The ASPG represents at least 15% of the funds in the Total Mapped Group with comparable asset size and management fee characteristics, subject to a minimum of 50 funds (or all funds in the Total Mapped Group if fewer than 50). Additional information, such as the ASPG quartile in which the fund's management fee ranked and the impact of the fund's performance adjustment, is also included in the chart and considered by the Board.
Annual Report
Fidelity International Growth Fund

The Board noted that the fund's management fee ranked below the median of its Total Mapped Group and below the median of its ASPG for 2009. The Board also noted the effect of the fund's positive performance adjustment on the fund's management fee ranking. The Board noted that the performance adjustment for each year represents calculations for performance periods that differ from the periods shown in the performance charts above.
Based on its review, the Board concluded that the fund's management fee is fair and reasonable in light of the services that the fund receives and the other factors considered.
Total Expenses. In its review of each class's total expenses, the Board considered the fund's management fee as well as other fund or class expenses, as applicable, such as transfer agent fees, pricing and bookkeeping fees, fund-paid 12b-1 fees, and custodial, legal, and audit fees. The Board also noted the effects of any waivers and reimbursements on fees and expenses, as well as the impact of the fund's performance adjustment. As part of its review, the Board also considered current and historical total expenses of each class of the fund compared to competitive fund median expenses. Each class of the fund is compared to those funds and classes in the Total Mapped Group (used by the Board for management fee comparisons) that have a similar sales load structure.
The Board noted that the total expenses of each of Class A and the retail class ranked below its competitive median for 2009, the total expenses of Class B ranked equal to its competitive median for 2009, and the total expenses of each of Class T, Class C, and Institutional Class ranked above its competitive median for 2009. The Board considered that the total expenses for Class T were above the median primarily because its 12b-1 fee is higher than the typical front-end load class. The Board noted that the fund offers multiple classes, each of which has a different sales load and 12b-1 fee structure, and that the multiple structures are intended to offer a range of pricing options for the intermediary market. The Board also noted that the total expenses of the classes vary primarily by the level of their 12b-1 fees, although differences in transfer agent fees may also cause expenses to vary from class to class.
Annual Report
Board Approval of Investment Advisory Contracts and
Management Fees - continued
Fees Charged to Other Fidelity Clients. The Board also considered Fidelity fee structures and other information with respect to clients of FMR and its affiliates, such as other mutual funds advised or subadvised by FMR or its affiliates, pension plan clients, and other institutional clients. In March 2010, the Board created an ad hoc joint committee with the board of other Fidelity funds (the Committee) to review and compare Fidelity's institutional investment advisory business with its business of providing services to the Fidelity funds, including the differences in services provided, fees charged, and costs incurred, as well as competition in their respective marketplaces.
Based on its review of total expenses and fees charged to other Fidelity clients, the Board concluded that the total expenses of each class of the fund were reasonable, although in some cases above the median of the universe presented for comparison, in light of the services that the fund and its shareholders receive and the other factors considered, including the findings of the Committee.
Costs of the Services and Profitability. The Board considered the revenues earned and the expenses incurred by Fidelity in conducting the business of developing, marketing, distributing, managing, administering and servicing the fund and its shareholders. The Board also considered the level of Fidelity's profits in respect of all the Fidelity funds.
On an annual basis, FMR presents to the Board Fidelity's profitability for the fund. Fidelity calculates the profitability for each fund, as well as aggregate profitability for groups of Fidelity funds and all Fidelity funds, using a series of detailed revenue and cost allocation methodologies which originate with the audited books and records of Fidelity. The Audit Committee of the Board reviews any significant changes from the prior year's methodologies.
PricewaterhouseCoopers LLP (PwC), independent registered public accounting firm and auditor to Fidelity and certain Fidelity funds, has been engaged annually by the Board as part of the Board's assessment of Fidelity's profitability analysis. PwC's engagement includes the review and assessment of Fidelity's methodologies used in determining the revenues and expenses attributable to Fidelity's mutual fund business, and completion of agreed-upon procedures surrounding the mathematical accuracy of fund profitability and its conformity to allocation methodologies. After considering PwC's reports issued under the engagement and information provided by Fidelity, the Board believes that while other allocation methods may also be reasonable, Fidelity's profitability methodologies are reasonable in all material respects.
Annual Report
The Board has also reviewed Fidelity's non-fund businesses and fall-out benefits related to the mutual fund business as well as cases where Fidelity's affiliates may benefit from or be related to the fund's business.
The Board considered the costs of the services provided by and the profits realized by Fidelity in connection with the operation of the fund and were satisfied that the profitability was not excessive in the circumstances.
Economies of Scale. The Board considered whether there have been economies of scale in respect of the management of the Fidelity funds, whether the Fidelity funds (including the fund) have appropriately benefited from any such economies of scale, and whether there is potential for realization of any further economies of scale. The Board considered the extent to which the fund will benefit from economies of scale through increased services to the fund, through waivers or reimbursements, or through fee or expense reductions.
In February 2009, the Board and the board of other Fidelity funds created an ad hoc committee (the Economies of Scale Committee) to analyze whether FMR attains economies of scale in respect of the management and servicing of the Fidelity funds, whether the Fidelity funds have appropriately benefited from such economies of scale, and whether there is potential for realization of any further economies of scale.
The Board recognized that the fund's management contract incorporates a "group fee" structure, which provides for lower group fee rates as total fund assets under FMR's management increase, and for higher group fee rates as total fund assets under FMR's management decrease. FMR calculates the group fee rates based on a tiered asset "breakpoint" schedule that varies based on asset class. The Board considered that the group fee is designed to deliver the benefits of economies of scale to fund shareholders when total Fidelity fund assets increase, even if assets of any particular fund are unchanged or have declined, because some portion of Fidelity's costs are attributable to services provided to all Fidelity funds, and all funds benefit if those costs can be allocated among more assets. The Board concluded that, given the group fee structure, fund shareholders will benefit from lower management fees as assets under FMR's management increase at the fund complex level, regardless of whether Fidelity achieves any such economies of scale.
The Board concluded, considering the findings of the Economies of Scale Committee, that any potential economies of scale are being appropriately shared between fund shareholders and Fidelity.
Additional Information Requested by the Board. In order to develop fully the factual basis for consideration of the Fidelity funds' Advisory Contracts, the Board requested and received additional information on certain topics, including (i) fund performance trends, actions to be taken by FMR to improve certain funds' overall performance, and Fidelity's long-term strategies for certain funds; (ii) portfolio manager changes that have occurred during the past year and length of portfolio manager tenure for different categories of funds over time; (iii) Fidelity's compensation structure for portfolio managers, research analysts, and other key personnel, the rationale for the compensation structure, and how the compensation structure provides appropriate performance incentives; (iv) the amount of the investment that each portfolio manager has made in the Fidelity fund(s) that he or she manages; (v) management and other fees paid by FMR to affiliated sub-advisers on behalf of the Fidelity funds; (vi) Fidelity's fee structures and rationale for recommending different fees among different categories of funds; (vii) Fidelity's rationale for recommending which funds should have a performance adjustment component as part of their management fees; (viii) the rationale for any differences between fund fee structures and fee structures in place for other Fidelity clients; and (ix) explanations regarding the relative total expenses borne by certain funds and classes, total expense competitive trends, and actions that might be taken by FMR to reduce total expenses for certain funds and classes.
Annual Report
Board Approval of Investment Advisory Contracts and
Management Fees - continued
Based on its evaluation of all of the conclusions noted above, and after considering all factors it believed relevant, the Board ultimately concluded that the advisory fee structures are fair and reasonable, and that the fund's Advisory Contracts should be renewed.
Annual Report
Managing Your Investments
Fidelity offers several ways to conveniently manage your personal investments via your telephone or PC. You can access your account information, conduct trades and research your investments 24 hours a day.
By Phone
Fidelity Automated Service Telephone provides a single toll-free number to access account balances, positions, quotes and trading. It's easy to navigate the service, and on your first call, the system will help you create a personal identification number (PIN) for security.
(phone_graphic)
Fidelity Automated
Service Telephone (FAST®)
1-800-544-5555
Press
For mutual fund and brokerage trading.
For quotes.*
For account balances and holdings.
To review orders and mutual
fund activity.
To change your PIN.
To speak to a Fidelity representative.
By PC
Fidelity's web site on the Internet provides a wide range of information, including daily financial news, fund performance, interactive planning tools and news about Fidelity products and services.
(computer_graphic)
Fidelity's Web Site
www.fidelity.com
* When you call the quotes line, please remember that a fund's yield and return will vary and, except for money market funds, share price will also vary. This means that you may have a gain or loss when you sell your shares. There is no assurance that money market funds will be able to maintain a stable $1 share price; an investment in a money market fund is not insured or guaranteed by the U.S. government. Total returns are historical and include changes in share price, reinvestment of dividends and capital gains, and the effects of any sales charges.
Annual Report
To Write Fidelity
We'll give your correspondence immediate attention and send you written confirmation upon completion of your request.
(letter_graphic)
Making Changes
To Your Account
(such as changing name, address, bank, etc.)
Fidelity Investments
P.O. Box 770001
Cincinnati, OH 45277-0002
(letter_graphic)
For Non-Retirement
Accounts
Buying shares
Fidelity Investments
P.O. Box 770001
Cincinnati, OH 45277-0003
Overnight Express
Fidelity Investments
Attn: Distribution Services
100 Crosby Parkway - KC1H
Covington, KY 41015
Selling shares
Fidelity Investments
P.O. Box 770001
Cincinnati, OH 45277-0035
Overnight Express
Fidelity Investments
Attn: Distribution Services
100 Crosby Parkway - KC1H
Covington, KY 41015
General Correspondence
Fidelity Investments
P.O. Box 500
Merrimack, NH 03054-0500
(letter_graphic)
For Retirement
Accounts
Buying shares
Fidelity Investments
P.O. Box 770001
Cincinnati, OH 45277-0003
Selling shares
Fidelity Investments
P.O. Box 770001
Cincinnati, OH 45277-0035
Overnight Express
Fidelity Investments
Attn: Distribution Services
100 Crosby Parkway - KC1H
Covington, KY 41015
General Correspondence
Fidelity Investments
P.O. Box 500
Merrimack, NH 03054-0500
Annual Report
Investment Adviser
Fidelity Management & Research Company
Boston, MA
Investment Sub-Advisers
FMR Co., Inc.
Fidelity Management & Research
(U.K.) Inc.
Fidelity Management & Research
(Hong Kong) Limited
Fidelity Management & Research
(Japan) Inc.
Fidelity Research & Analysis Company
FIL Investment Advisors
FIL Investments (Japan) Limited
FIL Investment Advisors (U.K.) Ltd.
General Distributor
Fidelity Distributors Corporation
Boston, MA
Transfer and Service Agent
Fidelity Investments Institutional
Operations Company, Inc.
Boston, MA
Fidelity Service Company, Inc.
Boston, MA
Custodian
State Street Bank and Trust Company
Quincy, MA
The Fidelity Telephone Connection
Mutual Fund 24-Hour Service
Exchanges/Redemptions
and Account Assistance 1-800-544-6666
Product Information 1-800-544-8888
Retirement Accounts 1-800-544-4774
(8 a.m. - 9 p.m.)
TDD Service 1-800-544-0118
for the deaf and hearing impaired
(9 a.m. - 9 p.m. Eastern time)
Fidelity Automated Service
Telephone (FAST)
1-800-544-5555
Automated line for quickest service
IGF-UANN-1210
1.912349.100
(Fidelity Investment logo)(registered trademark)
Fidelity AdvisorSM
International Growth
Fund - Class A, Class T, Class B
and Class C
Annual Report
October 31, 2010
Class A, Class T,
Class B, and Class C are
classes of Fidelity®
International Growth Fund
(2_fidelity_logos) (Registered_Trademark)
Contents
Chairman's Message | <Click Here> | The Chairman's message to shareholders. |
Performance | <Click Here> | How the fund has done over time. |
Management's Discussion of Fund Performance | <Click Here> | The Portfolio Manager's review of fund performance, strategy and outlook. |
Shareholder Expense Example | <Click Here> | An example of shareholder expenses. |
Investment Changes | <Click Here> | A summary of major shifts in the fund's investments over the past six months. |
Investments | <Click Here> | A complete list of the fund's investments with their market values. |
Financial Statements | <Click Here> | Statements of assets and liabilities, operations, and changes in net assets, as well as financial highlights. |
Notes | <Click Here> | Notes to financial statements. |
Report of Independent Registered Public Accounting Firm | <Click Here> | |
Trustees and Officers | <Click Here> | |
Distributions | <Click Here> | |
Board Approval of Investment Advisory Contracts and Management Fees | <Click Here> | |
To view a fund's proxy voting guidelines and proxy voting record for the 12-month period ended June 30, visit http://www.fidelity.com/proxyvotingresults or visit the Securities and Exchange Commission's (SEC) web site at http://www.sec.gov. You may also call 1-877-208-0098 to request a free copy of the proxy voting guidelines.
Standard & Poor's, S&P and S&P 500 are registered service marks of The McGraw-Hill Companies, Inc. and have been licensed for use by Fidelity Distributors Corporation.
Other third party marks appearing herein are the property of their respective owners.
All other marks appearing herein are registered or unregistered trademarks or service marks of FMR LLC or an affiliated company.
Annual Report
This report and the financial statements contained herein are submitted for the general information of the shareholders of the fund. This report is not authorized for distribution to prospective investors in the fund unless preceded or accompanied by an effective prospectus.
A fund files its complete schedule of portfolio holdings with the SEC for the first and third quarters of each fiscal year on Form N-Q. Forms N-Q are available on the SEC's web site at http://www.sec.gov. A fund's Forms N-Q may be reviewed and copied at the SEC's Public Reference Room in Washington, DC. Information regarding the operation of the SEC's Public Reference Room may be obtained by calling 1-800-SEC-0330. For a complete list of a fund's portfolio holdings, view the most recent holdings listing, semiannual report, or annual report on Fidelity's web site at http://www.fidelity.com or http://www.advisor.fidelity.com, as applicable.
NOT FDIC INSURED • MAY LOSE VALUE • NO BANK GUARANTEE
Neither the fund nor Fidelity Distributors Corporation is a bank.
Annual Report
(photo_of_Edward_C_Johnson_3d)
Dear Shareholder:
Equities have staged a rally in the second half of 2010, shaking off concerns about the European debt crisis and the possibility of a double-dip recession in the U.S. Although the short-term surge pushed major equity indexes back into positive territory for the year, several questions remain about the longer-term outlook, including lackluster economic growth and persistently high unemployment. Financial markets are always unpredictable, of course, but there also are several time-tested investment principles that can help put the odds in your favor.
One of the basic tenets is to invest for the long term. Over time, riding out the markets' inevitable ups and downs has proven much more effective than selling into panic or chasing the hottest trend. Even missing only a few of the markets' best days can significantly diminish investor returns. Patience also affords the benefits of compounding - of earning interest on additional income or reinvested dividends and capital gains. There can be tax advantages and cost benefits to consider as well. While staying the course doesn't eliminate risk, it can considerably lessen the effect of short-term declines.
You can further manage your investing risk through diversification. And today, more than ever, geographic diversification should be taken into account. Studies indicate that asset allocation is the single most important determinant of a portfolio's long-term success. The right mix of stocks, bonds and cash - aligned to your particular risk tolerance and investment objective - is very important. Age-appropriate rebalancing is also an essential aspect of asset allocation. For younger investors, an emphasis on equities - which historically have been the best-performing asset class over time - is encouraged. As investors near their specific goal, such as retirement or sending a child to college, consideration may be given to replacing volatile assets (e.g. common stocks) with more-stable fixed investments (bonds or savings plans).
A third principle - investing regularly - can help lower the average cost of your purchases. Investing a certain amount of money each month or quarter helps ensure you won't pay for all your shares at market highs. This strategy - known as dollar cost averaging - also reduces "emotion" from investing, helping shareholders avoid selling weak performers just prior to an upswing, or chasing a hot performer just before a correction.
We invite you to contact us via the Internet, through our Investor Centers or by phone. It is our privilege to provide you the information you need to make the investments that are right for you.
Sincerely,
(The chairman's signature appears here.)
Edward C. Johnson 3d
Annual Report
Average annual total return reflects the change in the value of an investment, assuming reinvestment of the class' distributions from dividend income and capital gains (the profits earned upon the sale of securities that have grown in value, if any) and assuming a constant rate of performance each year. The $10,000 table and the fund's returns do not reflect the deduction of taxes that a shareholder would pay on fund distributions or the redemption of fund shares. During periods of reimbursement by Fidelity, a fund's total return will be greater than it would be had the reimbursement not occurred. How a fund did yesterday is no guarantee of how it will do tomorrow.
Average Annual Total Returns
Periods ended October 31, 2010 | Past 1
year | Life of
fund A |
Class A (incl. 5.75% sales charge) | 13.74% | -6.95% |
Class T (incl. 3.50% sales charge) | 16.25% | -6.45% |
Class B (incl. contingent deferred sales charge) B | 14.77% | -6.75% |
Class C (incl. contingent deferred sales charge) C | 18.82% | -5.78% |
A From November 1, 2007.
B Class B shares' contingent deferred sales charge included in the past one year and life of class total return figures are 5% and 3%, respectively.
C Class C shares' contingent deferred sales charge included in the past one year and life of class total return figures are 1% and 0%, respectively.
Annual Report
$10,000 Over Life of Fund
Let's say hypothetically that $10,000 was invested in Fidelity AdvisorSM International Growth Fund - Class A on November 1, 2007, when the fund started, and the current 5.75% sales charge was paid. The chart shows how the value of your investment would have changed, and also shows how the MSCI® EAFE® (Europe, Australasia, Far East) Growth Index performed over the same period.
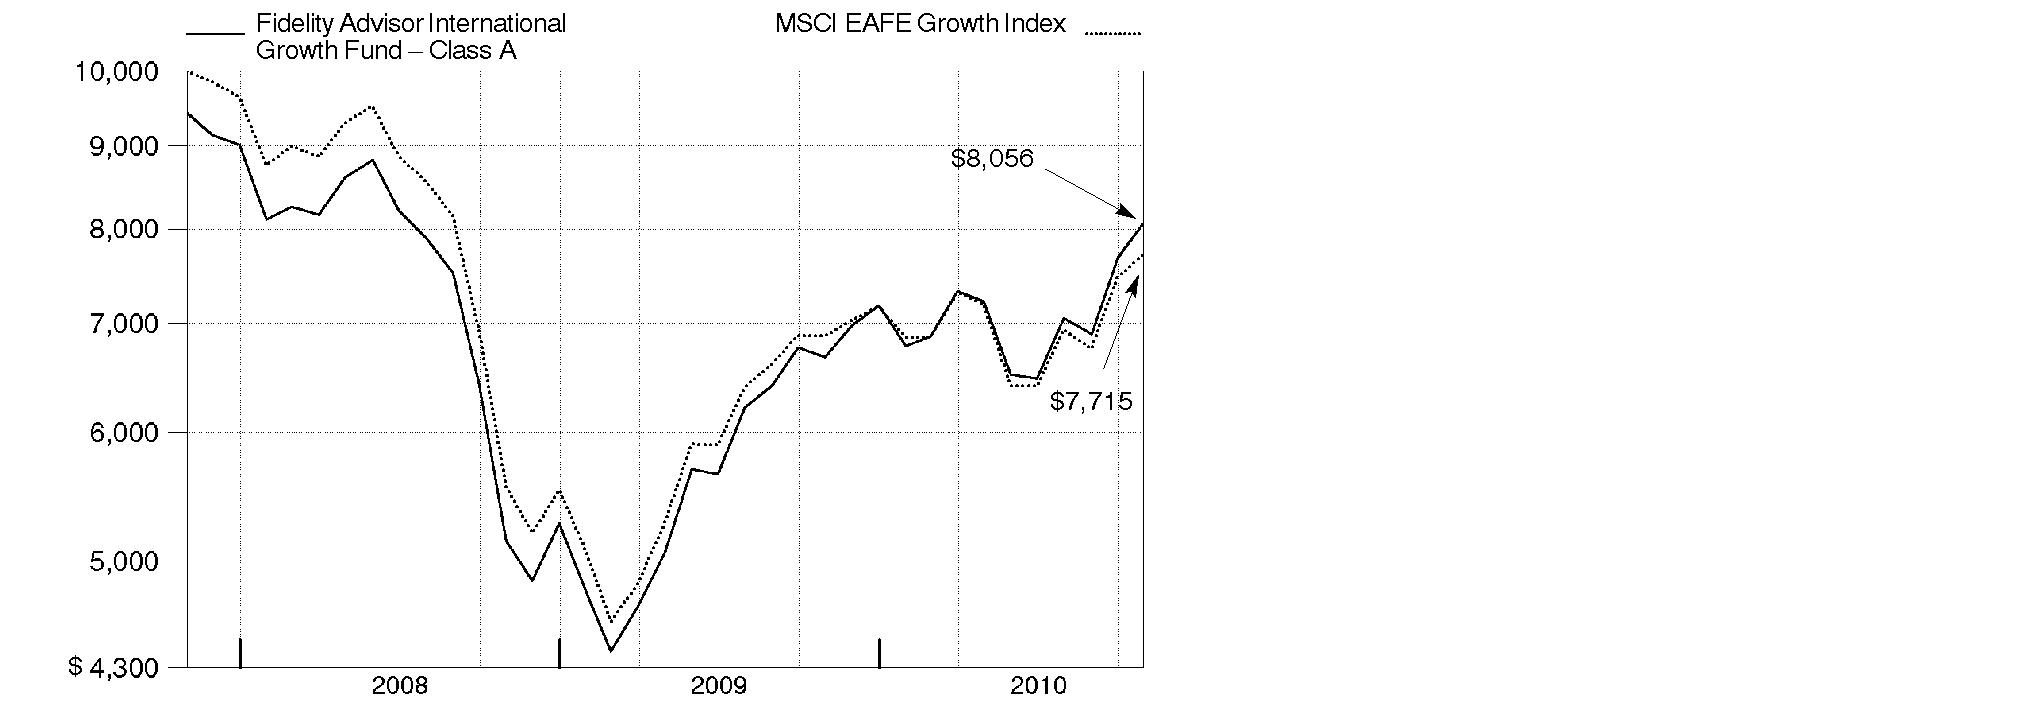
Annual Report
Market Recap: International stocks rode a wave of volatility similar to that of their U.S. counterparts during the 12 months ending October 31, 2010. Stocks gained modestly in the first half of the period, despite growing concerns about the European debt crisis. Sentiment turned decidedly negative in May and June, however, and the market suffered a precipitous decline. These losses were more than offset during the last four months of the period, when signs of economic growth and subsiding debt fears helped propel international stocks about 21%. For the full year, the MSCI® ACWI® (All Country World Index) ex USA Index gained 12.76%, boosted in part by a generally depreciating U.S. dollar. Within the index, Canada and emerging markets were standouts, returning 23% and 24%, respectively. Results in the latter group were led by strong-performing India, Mexico and South Africa, while China fell short of the MSCI benchmark due to cooling economic growth. The developed Asia ex Japan segment rose 16% for the period, lifted by solid results from Singapore and Hong Kong. Meanwhile, Europe rose just 9%, held back mainly by debt-riddled Spain and Italy, as well as lagging major constituent France. Japan returned only 5%, a result of that nation's continued weak economy.
Comments from Jed Weiss, Portfolio Manager of Fidelity AdvisorSM International Growth Fund: For the year, the fund's Class A, Class T, Class B and Class C shares returned 20.68%, 20.47%, 19.77% and 19.82%, respectively (excluding sales charges), significantly outpacing the 12.24% return of the MSCI EAFE® (Europe, Australasia, Far East) Growth Index. Stock picking in almost every sector was favorable, most notably financials and consumer discretionary, followed by materials, industrials and consumer staples. Positioning in telecommunication services and utilities detracted modestly. In country terms, the fund's positioning in emerging markets - especially stock picking in Brazil, Turkey and South Africa - was helpful. Successful positioning in Japan and Hong Kong also contributed. In Europe, good security selection in Denmark, Spain and the U.K. outweighed weakness in Switzerland. Elsewhere, the fund's modest stake in global U.S. companies proved helpful. Top individual contributors included Autoliv, a U.S.-listed and Sweden-based auto-safety equipment maker; Novo Nordisk, a Danish health care company; and Belgian brewer Anheuser-Busch InBev. Also of note, among emerging-markets stocks, were Turkish bank Turkiye Garanti Bankasi and Brazilian chemicals company Braskem. Several of these stocks were not in the index. In terms of notable detractors, we lacked exposure to French luxury consumer goods companies LVMH and Richemont Cie Financiere - two strong-performing index components - and overweighted lagging Swiss drug maker Roche Holding.
The views expressed above reflect those of the portfolio manager(s) only through the end of the period as stated on the cover of this report and do not necessarily represent the views of Fidelity or any other person in the Fidelity organization. Any such views are subject to change at any time based upon market or other conditions and Fidelity disclaims any responsibility to update such views. These views may not be relied on as investment advice and, because investment decisions for a Fidelity fund are based on numerous factors, may not be relied on as an indication of trading intent on behalf of any Fidelity fund.
Annual Report
Shareholder Expense Example
As a shareholder of the Fund, you incur two types of costs: (1) transaction costs, including sales charges (loads) on purchase payments or redemption proceeds, redemption fees, and (2) ongoing costs, including management fees, distribution and/or service (12b-1) fees and other Fund expenses. This Example is intended to help you understand your ongoing costs (in dollars) of investing in the Fund and to compare these costs with the ongoing costs of investing in other mutual funds.
The Example is based on an investment of $1,000 invested at the beginning of the period and held for the entire period (May 1, 2010 to October 31, 2010).
Actual Expenses
The first line of the accompanying table for each class of the Fund provides information about actual account values and actual expenses. You may use the information in this line, together with the amount you invested, to estimate the expenses that you paid over the period. Simply divide your account value by $1,000.00 (for example, an $8,600 account value divided by $1,000.00 = 8.6), then multiply the result by the number in the first line for a class of the Fund under the heading entitled "Expenses Paid During Period" to estimate the expenses you paid on your account during this period. A small balance maintenance fee of $12.00 that is charged once a year may apply for certain accounts with a value of less than $2,000. This fee is not included in the table below. If it was, the estimate of expenses you paid during the period would be higher, and your ending account value lower, by this amount. In addition, the Fund, as a shareholder in the underlying Fidelity Central Funds, will indirectly bear its pro-rata share of the fees and expenses incurred by the underlying Fidelity Central Funds. These fees and expenses are not included in the Fund's annualized expense ratio used to calculate the expense estimate in the table below.
Hypothetical Example for Comparison Purposes
The second line of the accompanying table for each class of the Fund provides information about hypothetical account values and hypothetical expenses based on a Class' actual expense ratio and an assumed rate of return of 5% per year before expenses, which is not the Class' actual return. The hypothetical account values and expenses may not be used to estimate the actual ending account balance or expenses you paid for the period. You may use this information to compare the ongoing costs of investing in the Fund and other funds. To do so, compare this 5% hypothetical example with the 5% hypothetical examples that appear in the shareholder reports of the other funds. A small balance maintenance fee of $12.00 that is charged once a year may apply for certain accounts with a value of less than $2,000. This fee is not included in the table below. If it was, the estimate of expenses you paid during the period would be higher, and your ending account value lower, by this amount. In addition, the Fund, as a shareholder in the underlying Fidelity Central Funds, will indirectly bear its pro-rata share of the fees and expenses incurred by the underlying Fidelity Central Funds. These fees and expenses are not included in the Fund's annualized expense ratio used to calculate the expense estimate in the table below.
Annual Report
Please note that the expenses shown in the table are meant to highlight your ongoing costs only and do not reflect any transaction costs. Therefore, the second line of the table is useful in comparing ongoing costs only, and will not help you determine the relative total costs of owning different funds. In addition, if these transactional costs were included, your costs would have been higher.
| Annualized
Expense Ratio | Beginning
Account Value
May 1, 2010 | Ending
Account Value
October 31, 2010 | Expenses Paid
During Period*
May 1, 2010 to October 31, 2010 |
Class A | 1.50%** | | | |
Actual | | $ 1,000.00 | $ 1,115.80 | $ 8.00** |
Hypothetical A | | $ 1,000.00 | $ 1,017.64 | $ 7.63** |
Class T | 1.75%** | | | |
Actual | | $ 1,000.00 | $ 1,114.40 | $ 9.33** |
Hypothetical A | | $ 1,000.00 | $ 1,016.38 | $ 8.89** |
Class B | 2.25%** | | | |
Actual | | $ 1,000.00 | $ 1,111.70 | $ 11.98** |
Hypothetical A | | $ 1,000.00 | $ 1,013.86 | $ 11.42** |
Class C | 2.25%** | | | |
Actual | | $ 1,000.00 | $ 1,112.00 | $ 11.98** |
Hypothetical A | | $ 1,000.00 | $ 1,013.86 | $ 11.42** |
International Growth | 1.25%** | | | |
Actual | | $ 1,000.00 | $ 1,117.00 | $ 6.67** |
Hypothetical A | | $ 1,000.00 | $ 1,018.90 | $ 6.36** |
Institutional Class | 1.25%** | | | |
Actual | | $ 1,000.00 | $ 1,117.00 | $ 6.67** |
Hypothetical A | | $ 1,000.00 | $ 1,018.90 | $ 6.36** |
A 5% return per year before expenses
* Expenses are equal to each Class' annualized expense ratio, multiplied by the average account value over the period, multiplied by 184/365 (to reflect the one-half year period).
Annual Report
Shareholder Expense Example - continued
** If changes to voluntary expense limitations, effective November 1, 2010, had been in effect during the entire period, the annualized expense ratios and the expenses paid in the actual and hypothetical examples above would have been as follows:
| Annualized
Expense Ratio | Expenses Paid |
Class A | 1.45% | |
Actual | | $ 7.73 |
Hypothetical A | | $ 7.38 |
Class T | 1.70% | |
Actual | | $ 9.06 |
Hypothetical A | | $ 8.64 |
Class B | 2.20% | |
Actual | | $ 11.71 |
Hypothetical A | | $ 11.17 |
Class C | 2.20% | |
Actual | | $ 11.71 |
Hypothetical A | | $ 11.17 |
International Growth | 1.20% | |
Actual | | $ 6.40 |
Hypothetical A | | $ 6.11 |
Institutional Class | 1.20% | |
Actual | | $ 6.40 |
Hypothetical A | | $ 6.11 |
A 5% return per year before expenses
Annual Report
Investment Changes (Unaudited)
Geographic Diversification (% of fund's net assets) |
As of October 31, 2010 |
| United Kingdom 19.7% | |
| United States of America 12.9% | |
| Switzerland 11.8% | |
| Japan 8.1% | |
| Australia 5.3% | |
| Germany 4.1% | |
| Belgium 3.5% | |
| Brazil 3.1% | |
| France 2.9% | |
| Other 28.6% | |

Percentages are adjusted for the effect of futures contracts, if applicable. |
As of April 30, 2010 |
| United Kingdom 19.0% | |
| Switzerland 13.0% | |
| United States of America 11.7% | |
| Japan 9.3% | |
| Australia 4.2% | |
| Brazil 3.7% | |
| Spain 3.6% | |
| Belgium 3.3% | |
| Germany 3.0% | |
| Other 29.2% | |

Percentages are adjusted for the effect of futures contracts, if applicable. |
Asset Allocation |
| % of fund's
net assets | % of fund's net assets
6 months ago |
Stocks and Investment Companies | 98.2 | 98.1 |
Short-Term Investments and Net Other Assets | 1.8 | 1.9 |
Top Ten Stocks as of October 31, 2010 |
| % of fund's
net assets | % of fund's net assets
6 months ago |
Nestle SA (Switzerland, Food Products) | 4.6 | 4.0 |
BHP Billiton PLC ADR (United Kingdom, Metals & Mining) | 4.4 | 3.4 |
Anheuser-Busch InBev SA NV (Belgium, Beverages) | 2.9 | 2.7 |
Rio Tinto PLC (United Kingdom, Metals & Mining) | 2.1 | 2.3 |
Roche Holding AG (participation certificate) (Switzerland, Pharmaceuticals) | 2.1 | 3.0 |
Novo Nordisk AS Series B sponsored ADR (Denmark, Pharmaceuticals) | 2.0 | 1.6 |
BG Group PLC (United Kingdom, Oil, Gas & Consumable Fuels) | 1.9 | 1.8 |
Visa, Inc. Class A (United States of America, IT Services) | 1.9 | 2.0 |
Siemens AG sponsored ADR (Germany, Industrial Conglomerates) | 1.9 | 0.4 |
Standard Chartered PLC (United Kingdom, Commercial Banks) | 1.9 | 1.7 |
| 25.7 | |
Market Sectors as of October 31, 2010 |
| % of fund's
net assets | % of fund's net assets
6 months ago |
Consumer Staples | 17.8 | 17.1 |
Materials | 16.9 | 16.2 |
Financials | 13.4 | 16.4 |
Industrials | 12.3 | 10.7 |
Consumer Discretionary | 11.8 | 11.3 |
Health Care | 11.3 | 10.9 |
Information Technology | 8.4 | 6.6 |
Energy | 4.8 | 4.6 |
Telecommunication Services | 0.5 | 2.8 |
Utilities | 0.0 | 0.3 |
Annual Report
Investments October 31, 2010
Showing Percentage of Net Assets
Common Stocks - 97.2% |
| Shares | | Value |
Australia - 5.3% |
CSL Ltd. | 11,708 | | $ 376,551 |
Leighton Holdings Ltd. (d) | 9,176 | | 329,906 |
MAp Group unit | 21,718 | | 64,892 |
Newcrest Mining Ltd. | 1,155 | | 45,215 |
Newcrest Mining Ltd. sponsored ADR | 6,907 | | 272,136 |
OZ Minerals Ltd. | 134,053 | | 205,524 |
Woolworths Ltd. | 12,499 | | 347,136 |
Worleyparsons Ltd. | 7,835 | | 176,154 |
TOTAL AUSTRALIA | | 1,817,514 |
Austria - 0.4% |
Andritz AG | 2,000 | | 153,171 |
Bailiwick of Guernsey - 0.5% |
Resolution Ltd. | 44,093 | | 185,016 |
Bailiwick of Jersey - 0.9% |
Informa PLC | 17,433 | | 121,776 |
Randgold Resources Ltd. sponsored ADR | 1,835 | | 172,343 |
TOTAL BAILIWICK OF JERSEY | | 294,119 |
Belgium - 3.5% |
Anheuser-Busch InBev SA NV | 15,920 | | 997,610 |
Umicore SA | 4,480 | | 210,824 |
TOTAL BELGIUM | | 1,208,434 |
Bermuda - 1.2% |
Lazard Ltd. Class A | 3,800 | | 140,220 |
Seadrill Ltd. (d) | 6,900 | | 208,909 |
Trinity Ltd. | 70,000 | | 69,989 |
TOTAL BERMUDA | | 419,118 |
Brazil - 3.1% |
Banco ABC Brasil SA | 13,000 | | 128,074 |
BM&F Bovespa SA | 25,700 | | 215,274 |
BR Malls Participacoes SA | 9,300 | | 88,834 |
Braskem SA Class A sponsored ADR (d) | 12,300 | | 256,455 |
Fibria Celulose SA sponsored ADR (a) | 3,903 | | 70,098 |
Iguatemi Empresa de Shopping Centers SA | 2,800 | | 65,342 |
Itau Unibanco Banco Multiplo SA ADR | 7,030 | | 172,657 |
Multiplan Empreendimentos Imobiliarios SA | 3,300 | | 75,652 |
TOTAL BRAZIL | | 1,072,386 |
Common Stocks - continued |
| Shares | | Value |
Canada - 2.8% |
Agnico-Eagle Mines Ltd. (Canada) | 2,300 | | $ 178,380 |
Fairfax Financial Holdings Ltd. (sub. vtg.) | 150 | | 61,357 |
Goldcorp, Inc. | 1,500 | | 66,977 |
Niko Resources Ltd. | 2,700 | | 257,584 |
Open Text Corp. (a) | 2,700 | | 119,447 |
Pan American Silver Corp. | 4,200 | | 134,064 |
Petrobank Energy & Resources Ltd. (a) | 3,400 | | 135,313 |
TOTAL CANADA | | 953,122 |
Cayman Islands - 0.9% |
Alibaba.com Ltd. (a) | 37,000 | | 72,270 |
China Lilang Ltd. | 46,000 | | 71,926 |
Wynn Macau Ltd. | 69,200 | | 153,019 |
TOTAL CAYMAN ISLANDS | | 297,215 |
Chile - 0.5% |
Banco Santander Chile sponsored ADR | 1,900 | | 176,016 |
China - 0.5% |
Baidu.com, Inc. sponsored ADR (a) | 1,680 | | 184,817 |
Denmark - 2.5% |
Novo Nordisk AS Series B sponsored ADR | 6,500 | | 681,200 |
William Demant Holding AS (a) | 2,300 | | 172,400 |
TOTAL DENMARK | | 853,600 |
Finland - 1.9% |
Metso Corp. | 4,400 | | 208,589 |
Nokian Tyres PLC | 7,300 | | 252,924 |
Outotec OYJ | 4,000 | | 186,677 |
TOTAL FINLAND | | 648,190 |
France - 2.9% |
Alstom SA | 3,613 | | 182,290 |
Danone | 5,852 | | 370,292 |
Remy Cointreau SA | 2,190 | | 153,766 |
Safran SA | 9,600 | | 304,293 |
TOTAL FRANCE | | 1,010,641 |
Germany - 4.1% |
Bayerische Motoren Werke AG (BMW) | 1,255 | | 89,950 |
Linde AG | 3,266 | | 470,126 |
Common Stocks - continued |
| Shares | | Value |
Germany - continued |
MAN SE | 1,702 | | $ 187,092 |
Siemens AG sponsored ADR | 5,800 | | 662,998 |
TOTAL GERMANY | | 1,410,166 |
Hong Kong - 1.2% |
Hong Kong Exchanges and Clearing Ltd. | 18,300 | | 402,771 |
Ireland - 1.0% |
CRH PLC sponsored ADR (d) | 11,300 | | 199,671 |
James Hardie Industries NV sponsored ADR (a) | 5,000 | | 132,900 |
TOTAL IRELAND | | 332,571 |
Italy - 1.8% |
Azimut Holdings SpA | 16,215 | | 165,382 |
Fiat SpA | 18,900 | | 319,789 |
Saipem SpA | 3,325 | | 147,726 |
TOTAL ITALY | | 632,897 |
Japan - 8.1% |
Autobacs Seven Co. Ltd. | 3,900 | | 146,123 |
Denso Corp. | 9,100 | | 282,993 |
Fanuc Ltd. | 3,000 | | 434,309 |
Fast Retailing Co. Ltd. | 1,300 | | 170,289 |
Japan Steel Works Ltd. | 17,000 | | 162,198 |
Keyence Corp. | 1,220 | | 302,461 |
Kobayashi Pharmaceutical Co. Ltd. | 3,900 | | 181,745 |
MS&AD Insurance Group Holdings, Inc. | 5,300 | | 126,972 |
Nippon Thompson Co. Ltd. | 19,000 | | 131,751 |
Osaka Securities Exchange Co. Ltd. | 28 | | 140,922 |
Shiseido Co. Ltd. | 9,100 | | 189,986 |
SHO-BOND Holdings Co. Ltd. | 3,500 | | 74,898 |
USS Co. Ltd. | 3,340 | | 259,828 |
Yamato Kogyo Co. Ltd. | 7,600 | | 194,935 |
TOTAL JAPAN | | 2,799,410 |
Korea (South) - 0.7% |
NHN Corp. (a) | 1,444 | | 256,183 |
Mexico - 1.0% |
Wal-Mart de Mexico SA de CV Series V | 130,600 | | 357,206 |
Netherlands - 2.2% |
ASM International NV unit (a) | 6,100 | | 155,855 |
ASML Holding NV | 8,300 | | 275,477 |
Common Stocks - continued |
| Shares | | Value |
Netherlands - continued |
Koninklijke KPN NV | 10,886 | | $ 181,768 |
QIAGEN NV (a) | 7,500 | | 141,075 |
TOTAL NETHERLANDS | | 754,175 |
Peru - 0.2% |
Compania de Minas Buenaventura SA sponsored ADR | 1,500 | | 79,560 |
Portugal - 0.5% |
Jeronimo Martins SGPS SA | 12,375 | | 185,623 |
Singapore - 1.1% |
City Developments Ltd. | 10,000 | | 98,277 |
Singapore Exchange Ltd. | 32,000 | | 217,569 |
Wing Tai Holdings Ltd. | 44,000 | | 59,492 |
TOTAL SINGAPORE | | 375,338 |
South Africa - 2.1% |
African Rainbow Minerals Ltd. | 9,939 | | 253,560 |
Clicks Group Ltd. | 26,686 | | 174,096 |
JSE Ltd. | 11,000 | | 124,053 |
Mr Price Group Ltd. | 20,200 | | 183,572 |
TOTAL SOUTH AFRICA | | 735,281 |
Spain - 1.3% |
Inditex SA (d) | 3,515 | | 293,506 |
Prosegur Compania de Seguridad SA (Reg.) | 2,600 | | 155,781 |
TOTAL SPAIN | | 449,287 |
Sweden - 1.5% |
H&M Hennes & Mauritz AB (B Shares) | 11,217 | | 395,187 |
Swedish Match Co. | 4,300 | | 120,152 |
TOTAL SWEDEN | | 515,339 |
Switzerland - 11.8% |
Credit Suisse Group sponsored ADR | 4,320 | | 179,280 |
Nestle SA | 28,730 | | 1,573,166 |
Novartis AG sponsored ADR (d) | 11,200 | | 649,040 |
Roche Holding AG (participation certificate) | 4,835 | | 709,765 |
Sonova Holding AG Class B | 3,225 | | 373,495 |
The Swatch Group AG: | | | |
(Bearer) | 910 | | 347,692 |
(Reg.) | 228 | | 15,843 |
Common Stocks - continued |
| Shares | | Value |
Switzerland - continued |
UBS AG (a) | 4,483 | | $ 76,132 |
UBS AG (NY Shares) (a) | 8,700 | | 148,074 |
TOTAL SWITZERLAND | | 4,072,487 |
Turkey - 1.9% |
Anadolu Efes Biracilik ve Malt Sanayii AS | 7,800 | | 124,535 |
Asya Katilim Bankasi AS | 27,000 | | 69,651 |
Coca-Cola Icecek AS | 10,000 | | 128,286 |
Turkiye Garanti Bankasi AS | 53,500 | | 328,244 |
TOTAL TURKEY | | 650,716 |
United Kingdom - 19.7% |
Anglo American PLC: | | | |
ADR | 9,800 | | 227,850 |
(United Kingdom) | 1,800 | | 83,863 |
Babcock International Group PLC | 18,100 | | 168,194 |
BAE Systems PLC | 20,800 | | 114,870 |
BG Group PLC | 34,652 | | 674,818 |
BHP Billiton PLC ADR | 21,300 | | 1,508,040 |
Cobham PLC | 27,100 | | 100,557 |
GlaxoSmithKline PLC sponsored ADR | 11,300 | | 441,152 |
Imperial Tobacco Group PLC | 4,318 | | 138,293 |
InterContinental Hotel Group PLC ADR (d) | 13,755 | | 266,159 |
Johnson Matthey PLC | 6,924 | | 212,326 |
Mothercare PLC | 8,900 | | 74,932 |
Reckitt Benckiser Group PLC | 6,045 | | 338,103 |
Rio Tinto PLC | 2,735 | | 177,617 |
Rio Tinto PLC sponsored ADR (d) | 8,700 | | 566,544 |
Serco Group PLC | 30,103 | | 296,129 |
Shaftesbury PLC | 19,733 | | 141,004 |
Standard Chartered PLC: | | | |
rights 11/5/10 (a) | 2,619 | | 22,050 |
(United Kingdom) | 21,917 | | 633,989 |
Tesco PLC | 71,253 | | 487,283 |
Unite Group PLC (a) | 18,800 | | 62,650 |
Victrex PLC | 3,600 | | 74,462 |
TOTAL UNITED KINGDOM | | 6,810,885 |
United States of America - 10.1% |
Allergan, Inc. | 1,900 | | 137,579 |
Autoliv, Inc. | 4,300 | | 306,590 |
Berkshire Hathaway, Inc. Class B (a) | 2,000 | | 159,120 |
Cymer, Inc. (a) | 2,000 | | 73,900 |
Common Stocks - continued |
| Shares | | Value |
United States of America - continued |
eBay, Inc. (a) | 2,600 | | $ 77,506 |
Google, Inc. Class A (a) | 220 | | 134,858 |
ION Geophysical Corp. (a) | 14,800 | | 72,372 |
JPMorgan Chase & Co. | 3,818 | | 143,671 |
Juniper Networks, Inc. (a) | 18,600 | | 602,454 |
Martin Marietta Materials, Inc. | 900 | | 72,432 |
Mead Johnson Nutrition Co. Class A | 4,500 | | 264,690 |
Mohawk Industries, Inc. (a) | 2,600 | | 149,084 |
Philip Morris International, Inc. | 3,100 | | 181,350 |
ResMed, Inc. (a) | 5,500 | | 175,285 |
Union Pacific Corp. | 2,900 | | 254,272 |
Visa, Inc. Class A | 8,500 | | 664,445 |
TOTAL UNITED STATES OF AMERICA | | 3,469,608 |
TOTAL COMMON STOCKS (Cost $28,745,190) | 33,562,862 |
Investment Companies - 1.0% |
| | | |
United States of America - 1.0% |
iShares MSCI EAFE Growth Index ETF
(Cost $352,099) | 6,000 | | 352,800 |
Money Market Funds - 7.1% |
| | | |
Fidelity Securities Lending Cash Central Fund, 0.24% (b)(c)
(Cost $2,457,002) | 2,457,002 | | 2,457,002 |
Cash Equivalents - 2.0% |
| Maturity Amount | | Value |
Investments in repurchase agreements in a joint trading account at 0.22%, dated 10/29/10 due 11/1/10 (Collateralized by U.S. Treasury Obligations) #
(Cost $685,000) | $ 685,012 | | $ 685,000 |
TOTAL INVESTMENT PORTFOLIO - 107.3% (Cost $32,239,291) | | 37,057,664 |
NET OTHER ASSETS (LIABILITIES) - (7.3)% | | (2,530,931) |
NET ASSETS - 100% | $ 34,526,733 |
Security Type Abbreviations |
ETF | - | Exchange-Traded Funds |
Legend |
(a) Non-income producing |
(b) Affiliated fund that is available only to investment companies and other accounts managed by Fidelity Investments. The rate quoted is the annualized seven-day yield of the fund at period end. A complete unaudited listing of the fund's holdings as of its most recent quarter end is available upon request. In addition, each Fidelity Central Fund's financial statements, which are not covered by the Fund's report of Independent Registered Public Accounting Firm, are available on the SEC's website or upon request. |
(c) Investment made with cash collateral received from securities on loan. |
(d) Security or a portion of the security is on loan at period end. |
# Additional information on each counterparty to the repurchase agreement is as follows: |
Repurchase Agreement / Counterparty | Value |
$685,000 due 11/01/10 at 0.22% |
BNP Paribas Securities Corp. | $ 114,147 |
Barclays Capital, Inc. | 171,114 |
Credit Agricole Securities (USA), Inc. | 29,506 |
Credit Suisse Securities (USA) LLC | 31,533 |
Deutsche Bank Securities, Inc. | 52,922 |
HSBC Securities (USA), Inc. | 52,922 |
J.P. Morgan Securities,
Inc. | 141,125 |
Mizuho Securities USA, Inc. | 35,281 |
Societe Generale, New York Branch | 35,281 |
UBS Securities LLC | 17,641 |
Wells Fargo Securities LLC | 3,528 |
| $ 685,000 |
Affiliated Central Funds |
Information regarding fiscal year to date income earned by the Fund from investments in Fidelity Central Funds is as follows: |
Fund | Income earned |
Fidelity Securities Lending Cash Central Fund | $ 13,302 |
Other Information |
The following is a summary of the inputs used, as of October 31, 2010, involving the Fund's assets and liabilities carried at fair value. The inputs or methodology used for valuing securities may not be an indication of the risk associated with investing in those securities. For more information on valuation inputs, and their aggregation into the levels used in the table below, please refer to the Security Valuation section in the accompanying Notes to Financial Statements. |
Valuation Inputs at Reporting Date: |
Description | Total | Level 1 | Level 2 | Level 3 |
Investments in Securities: | | | | |
Equities: | | | | |
United Kingdom | $ 6,810,885 | $ 6,633,268 | $ 177,617 | $ - |
Switzerland | 4,072,487 | 3,996,355 | 76,132 | - |
United States of America | 3,469,608 | 3,469,608 | - | - |
Japan | 2,799,410 | 1,432,663 | 1,366,747 | - |
Australia | 1,817,514 | 1,817,514 | - | - |
Germany | 1,410,166 | 1,410,166 | - | - |
Belgium | 1,208,434 | 1,208,434 | - | - |
Brazil | 1,072,386 | 1,072,386 | - | - |
France | 1,010,641 | 1,010,641 | - | - |
Other | 9,891,331 | 9,891,331 | - | - |
Investment Companies | 352,800 | 352,800 | - | - |
Money Market Funds | 2,457,002 | 2,457,002 | - | - |
Cash Equivalents | 685,000 | - | 685,000 | - |
Total Investments in Securities: | $ 37,057,664 | $ 34,752,168 | $ 2,305,496 | $ - |
Income Tax Information |
At October 31, 2010, the Fund had a capital loss carryforward of approximately $6,290,360 of which $3,493,858 and $2,796,502 will expire on October 31, 2016 and 2017, respectively. Capital loss carryforwards are only available to offset future capital gains of the Fund to the extent provided by regulations and may be limited. |
See accompanying notes which are an integral part of the financial statements.
Annual Report
Statement of Assets and Liabilities
| October 31, 2010 |
| | |
Assets | | |
Investment in securities, at value (including securities loaned of $2,381,885 and repurchase agreements of $685,000) - See accompanying schedule: Unaffiliated issuers (cost $29,782,289) | $ 34,600,662 | |
Fidelity Central Funds (cost $2,457,002) | 2,457,002 | |
Total Investments (cost $32,239,291) | | $ 37,057,664 |
Cash | | 677 |
Foreign currency held at value (cost $212) | | 212 |
Receivable for investments sold | | 253,142 |
Receivable for fund shares sold | | 115,106 |
Dividends receivable | | 73,680 |
Distributions receivable from Fidelity Central Funds | | 943 |
Receivable from investment adviser for expense reductions | | 42,846 |
Other receivables | | 1,353 |
Total assets | | 37,545,623 |
| | |
Liabilities | | |
Payable for investments purchased | $ 442,776 | |
Payable for fund shares redeemed | 30,235 | |
Accrued management fee | 23,253 | |
Distribution and service plan fees payable | 2,473 | |
Other affiliated payables | 8,855 | |
Other payables and accrued expenses | 54,296 | |
Collateral on securities loaned, at value | 2,457,002 | |
Total liabilities | | 3,018,890 |
| | |
Net Assets | | $ 34,526,733 |
Net Assets consist of: | | |
Paid in capital | | $ 36,253,596 |
Undistributed net investment income | | 237,573 |
Accumulated undistributed net realized gain (loss) on investments and foreign currency transactions | | (6,786,731) |
Net unrealized appreciation (depreciation) on investments and assets and liabilities in foreign currencies | | 4,822,295 |
Net Assets | | $ 34,526,733 |
See accompanying notes which are an integral part of the financial statements.
Annual Report
Financial Statements - continued
Statement of Assets and Liabilities - continued
| October 31, 2010 |
| | |
Calculation of Maximum Offering Price Class A:
Net Asset Value and redemption price per share ($3,083,779 ÷ 367,982 shares) | | $ 8.38 |
| | |
Maximum offering price per share (100/94.25 of $8.38) | | $ 8.89 |
Class T:
Net Asset Value and redemption price per share ($1,033,538 ÷ 123,323 shares) | | $ 8.38 |
| | |
Maximum offering price per share (100/96.50 of $8.38) | | $ 8.68 |
Class B:
Net Asset Value and offering price per share ($581,201 ÷ 69,527 shares)A | | $ 8.36 |
| | |
Class C:
Net Asset Value and offering price per share ($1,260,789 ÷ 151,261 shares)A | | $ 8.34 |
| | |
International Growth:
Net Asset Value, offering price and redemption price per share ($28,454,384 ÷ 3,385,414 shares) | | $ 8.40 |
| | |
Institutional Class:
Net Asset Value, offering price and redemption price per share ($113,042 ÷ 13,455 shares) | | $ 8.40 |
A Redemption price per share is equal to net asset value less any applicable contingent deferred sales charge.
See accompanying notes which are an integral part of the financial statements.
Annual Report
Statement of Operations
| Year ended October 31, 2010 |
| | |
Investment Income | | |
Dividends | | $ 637,165 |
Interest | | 706 |
Income from Fidelity Central Funds | | 13,302 |
Income before foreign taxes withheld | | 651,173 |
Less foreign taxes withheld | | (47,674) |
Total income | | 603,499 |
| | |
Expenses | | |
Management fee
Basic fee | $ 192,364 | |
Performance adjustment | 29,103 | |
Transfer agent fees | 85,306 | |
Distribution and service plan fees | 24,292 | |
Accounting and security lending fees | 14,333 | |
Custodian fees and expenses | 55,804 | |
Independent trustees' compensation | 148 | |
Registration fees | 73,332 | |
Audit | 62,652 | |
Legal | 191 | |
Miscellaneous | 300 | |
Total expenses before reductions | 537,825 | |
Expense reductions | (178,649) | 359,176 |
Net investment income (loss) | | 244,323 |
Realized and Unrealized Gain (Loss) Net realized gain (loss) on: | | |
Investment securities: | | |
Unaffiliated issuers | 1,690,565 | |
Foreign currency transactions | (561) | |
Total net realized gain (loss) | | 1,690,004 |
Change in net unrealized appreciation (depreciation) on: Investment securities | 3,219,080 | |
Assets and liabilities in foreign currencies | 2,715 | |
Total change in net unrealized appreciation (depreciation) | | 3,221,795 |
Net gain (loss) | | 4,911,799 |
Net increase (decrease) in net assets resulting from operations | | $ 5,156,122 |
See accompanying notes which are an integral part of the financial statements.
Annual Report
Financial Statements - continued
Statement of Changes in Net Assets
| Year ended
October 31,
2010 | Year ended
October 31,
2009 |
Increase (Decrease) in Net Assets | | |
Operations | | |
Net investment income (loss) | $ 244,323 | $ 175,103 |
Net realized gain (loss) | 1,690,004 | (2,934,897) |
Change in net unrealized appreciation (depreciation) | 3,221,795 | 7,705,769 |
Net increase (decrease) in net assets resulting
from operations | 5,156,122 | 4,945,975 |
Distributions to shareholders from net investment income | (167,219) | (188,551) |
Distributions to shareholders from net realized gain | (78,510) | - |
Total distributions | (245,729) | (188,551) |
Share transactions - net increase (decrease) | 8,231,990 | 1,563,086 |
Redemption fees | 2,560 | 3,195 |
Total increase (decrease) in net assets | 13,144,943 | 6,323,705 |
| | |
Net Assets | | |
Beginning of period | 21,381,790 | 15,058,085 |
End of period (including undistributed net investment income of $237,573 and undistributed net investment income of $167,884, respectively) | $ 34,526,733 | $ 21,381,790 |
See accompanying notes which are an integral part of the financial statements.
Annual Report
Financial Highlights - Class A
Years ended October 31, | 2010 | 2009 | 2008 F |
Selected Per-Share Data | | | |
Net asset value, beginning of period | $ 7.01 | $ 5.46 | $ 10.00 |
Income from Investment Operations | | | |
Net investment income (loss) C | .05 | .05 | .07 |
Net realized and unrealized gain (loss) | 1.39 | 1.55 | (4.61) |
Total from investment operations | 1.44 | 1.60 | (4.54) |
Distributions from net investment income | (.05) | (.05) | - |
Distributions from net realized gain | (.03) | - | - |
Total distributions | (.07) I | (.05) | - |
Redemption fees added to paid in capital C,H | - | - | - |
Net asset value, end of period | $ 8.38 | $ 7.01 | $ 5.46 |
Total Return A,B | 20.68% | 29.72% | (45.40)% |
Ratios to Average Net Assets D,G | | | |
Expenses before reductions | 2.13% | 2.46% | 2.88% |
Expenses net of fee waivers, if any | 1.50% | 1.50% | 1.50% |
Expenses net of all reductions | 1.48% | 1.47% | 1.48% |
Net investment income (loss) | .74% | .85% | .80% |
Supplemental Data | | | |
Net assets, end of period (000 omitted) | $ 3,084 | $ 1,452 | $ 820 |
Portfolio turnover rate E | 87% | 116% | 115% |
A Total returns would have been lower had certain expenses not been reduced during the periods shown.
B Total returns do not include the effect of the sales charges.
C Calculated based on average shares outstanding during the period.
D Fees and expenses of the underlying Fidelity Central Funds are not included in the Fund's expense ratio. The Fund indirectly bears its proportionate share of the expenses of any underlying Fidelity Central Funds.
E Amount does not include the portfolio activity of any underlying Fidelity Central Funds.
F For the period November 1, 2007 (commencement of operations) to October 31, 2008.
G Expense ratios reflect operating expenses of the class. Expenses before reductions do not reflect amounts reimbursed by the investment adviser or reductions from brokerage service arrangements or reductions from other expense offset arrangements and do not represent the amount paid by the class during periods when reimbursements or reductions occur. Expense ratios before reductions for start-up periods may not be representative of longer-term operating periods. Expenses net of fee waivers reflect expenses after reimbursement by the investment adviser but prior to reductions from brokerage service arrangements or other expense offset arrangements. Expenses net of all reductions represent the net expenses paid by the class.
H Amount represents less than $.01 per share.
I Total distributions of $.07 per share is comprised of distributions from net investment income of $.046 and distributions from net realized gain of $.025 per share.
See accompanying notes which are an integral part of the financial statements.
Annual Report
Financial Highlights - Class T
Years ended October 31, | 2010 | 2009 | 2008 F |
Selected Per-Share Data | | | |
Net asset value, beginning of period | $ 7.00 | $ 5.45 | $ 10.00 |
Income from Investment Operations | | | |
Net investment income (loss) C | .04 | .03 | .05 |
Net realized and unrealized gain (loss) | 1.39 | 1.55 | (4.60) |
Total from investment operations | 1.43 | 1.58 | (4.55) |
Distributions from net investment income | (.02) | (.03) | - |
Distributions from net realized gain | (.03) | - | - |
Total distributions | (.05) | (.03) | - |
Redemption fees added to paid in capital C,H | - | - | - |
Net asset value, end of period | $ 8.38 | $ 7.00 | $ 5.45 |
Total Return A,B | 20.47% | 29.22% | (45.50)% |
Ratios to Average Net Assets D,G | | | |
Expenses before reductions | 2.41% | 2.67% | 3.07% |
Expenses net of fee waivers, if any | 1.75% | 1.75% | 1.75% |
Expenses net of all reductions | 1.73% | 1.73% | 1.73% |
Net investment income (loss) | .49% | .59% | .55% |
Supplemental Data | | | |
Net assets, end of period (000 omitted) | $ 1,034 | $ 532 | $ 507 |
Portfolio turnover rate E | 87% | 116% | 115% |
A Total returns would have been lower had certain expenses not been reduced during the periods shown.
B Total returns do not include the effect of the sales charges.
C Calculated based on average shares outstanding during the period.
D Fees and expenses of the underlying Fidelity Central Funds are not included in the Fund's expense ratio. The Fund indirectly bears its proportionate share of the expenses of any underlying Fidelity Central Funds.
E Amount does not include the portfolio activity of any underlying Fidelity Central Funds.
F For the period November 1, 2007 (commencement of operations) to October 31, 2008.
G Expense ratios reflect operating expenses of the class. Expenses before reductions do not reflect amounts reimbursed by the investment adviser or reductions from brokerage service arrangements or reductions from other expense offset arrangements and do not represent the amount paid by the class during periods when reimbursements or reductions occur. Expense ratios before reductions for start-up periods may not be representative of longer-term operating periods. Expenses net of fee waivers reflect expenses after reimbursement by the investment adviser but prior to reductions from brokerage service arrangements or other expense offset arrangements. Expenses net of all reductions represent the net expenses paid by the class.
H Amount represents less than $.01 per share.
See accompanying notes which are an integral part of the financial statements.
Annual Report
Financial Highlights - Class B
Years ended October 31, | 2010 | 2009 | 2008 F |
Selected Per-Share Data | | | |
Net asset value, beginning of period | $ 6.98 | $ 5.42 | $ 10.00 |
Income from Investment Operations | | | |
Net investment income (loss) C | - H | .01 | - H |
Net realized and unrealized gain (loss) | 1.38 | 1.55 | (4.58) |
Total from investment operations | 1.38 | 1.56 | (4.58) |
Redemption fees added to paid in capital C,H | - | - | - |
Net asset value, end of period | $ 8.36 | $ 6.98 | $ 5.42 |
Total Return A,B | 19.77% | 28.78% | (45.80)% |
Ratios to Average Net Assets D,G | | | |
Expenses before reductions | 2.87% | 3.17% | 3.55% |
Expenses net of fee waivers, if any | 2.25% | 2.25% | 2.25% |
Expenses net of all reductions | 2.23% | 2.23% | 2.23% |
Net investment income (loss) | (.01)% | .09% | .05% |
Supplemental Data | | | |
Net assets, end of period (000 omitted) | $ 581 | $ 328 | $ 642 |
Portfolio turnover rate E | 87% | 116% | 115% |
A Total returns would have been lower had certain expenses not been reduced during the periods shown.
B Total returns do not include the effect of the contingent deferred sales charge.
C Calculated based on average shares outstanding during the period.
D Fees and expenses of the underlying Fidelity Central Funds are not included in the Fund's expense ratio. The Fund indirectly bears its proportionate share of the expenses of any underlying Fidelity Central Funds.
E Amount does not include the portfolio activity of any underlying Fidelity Central Funds.
F For the period November 1, 2007 (commencement of operations) to October 31, 2008.
G Expense ratios reflect operating expenses of the class. Expenses before reductions do not reflect amounts reimbursed by the investment adviser or reductions from brokerage service arrangements or reductions from other expense offset arrangements and do not represent the amount paid by the class during periods when reimbursements or reductions occur. Expense ratios before reductions for start-up periods may not be representative of longer-term operating periods. Expenses net of fee waivers reflect expenses after reimbursement by the investment adviser but prior to reductions from brokerage service arrangements or other expense offset arrangements. Expenses net of all reductions represent the net expenses paid by the class.
H Amount represents less than $.01 per share.
See accompanying notes which are an integral part of the financial statements.
Annual Report
Financial Highlights - Class C
Years ended October 31, | 2010 | 2009 | 2008 F |
Selected Per-Share Data | | | |
Net asset value, beginning of period | $ 6.98 | $ 5.42 | $ 10.00 |
Income from Investment Operations | | | |
Net investment income (loss) C | - H | .01 | - H |
Net realized and unrealized gain (loss) | 1.38 | 1.55 | (4.58) |
Total from investment operations | 1.38 | 1.56 | (4.58) |
Distributions from net realized gain | (.02) | - | - |
Redemption fees added to paid in capital C,H | - | - | - |
Net asset value, end of period | $ 8.34 | $ 6.98 | $ 5.42 |
Total Return A,B | 19.82% | 28.78% | (45.80)% |
Ratios to Average Net Assets D,G | | | |
Expenses before reductions | 2.89% | 3.21% | 3.52% |
Expenses net of fee waivers, if any | 2.25% | 2.25% | 2.25% |
Expenses net of all reductions | 2.24% | 2.23% | 2.23% |
Net investment income (loss) | (.01)% | .09% | .05% |
Supplemental Data | | | |
Net assets, end of period (000 omitted) | $ 1,261 | $ 780 | $ 684 |
Portfolio turnover rate E | 87% | 116% | 115% |
A Total returns would have been lower had certain expenses not been reduced during the periods shown.
B Total returns do not include the effect of the contingent deferred sales charge.
C Calculated based on average shares outstanding during the period.
D Fees and expenses of the underlying Fidelity Central Funds are not included in the Fund's expense ratio. The Fund indirectly bears its proportionate share of the expenses of any underlying Fidelity Central Funds.
E Amount does not include the portfolio activity of any underlying Fidelity Central Funds.
F For the period November 1, 2007 (commencement of operations) to October 31, 2008.
G Expense ratios reflect operating expenses of the class. Expenses before reductions do not reflect amounts reimbursed by the investment adviser or reductions from brokerage service arrangements or reductions from other expense offset arrangements and do not represent the amount paid by the class during periods when reimbursements or reductions occur. Expense ratios before reductions for start-up periods may not be representative of longer-term operating periods. Expenses net of fee waivers reflect expenses after reimbursement by the investment adviser but prior to reductions from brokerage service arrangements or other expense offset arrangements. Expenses net of all reductions represent the net expenses paid by the class.
H Amount represents less than $.01 per share.
See accompanying notes which are an integral part of the financial statements.
Annual Report
Financial Highlights - International Growth
Years ended October 31, | 2010 | 2009 | 2008 E |
Selected Per-Share Data | | | |
Net asset value, beginning of period | $ 7.02 | $ 5.48 | $ 10.00 |
Income from Investment Operations | | | |
Net investment income (loss) B | .07 | .06 | .09 |
Net realized and unrealized gain (loss) | 1.39 | 1.54 | (4.60) |
Total from investment operations | 1.46 | 1.60 | (4.51) |
Distributions from net investment income | (.06) | (.06) | (.01) |
Distributions from net realized gain | (.03) | - | - |
Total distributions | (.08) H | (.06) | (.01) |
Redemption fees added to paid in capital B,G | - | - | - |
Net asset value, end of period | $ 8.40 | $ 7.02 | $ 5.48 |
Total Return A | 20.97% | 29.77% | (45.17)% |
Ratios to Average Net Assets C,F | | | |
Expenses before reductions | 1.89% | 2.19% | 2.35% |
Expenses net of fee waivers, if any | 1.25% | 1.25% | 1.25% |
Expenses net of all reductions | 1.23% | 1.23% | 1.23% |
Net investment income (loss) | .99% | 1.09% | 1.05% |
Supplemental Data | | | |
Net assets, end of period (000 omitted) | $ 28,454 | $ 18,254 | $ 11,884 |
Portfolio turnover rate D | 87% | 116% | 115% |
A Total returns would have been lower had certain expenses not been reduced during the periods shown.
B Calculated based on average shares outstanding during the period.
C Fees and expenses of the underlying Fidelity Central Funds are not included in the Fund's expense ratio. The Fund indirectly bears its proportionate share of the expenses of any underlying Fidelity Central Funds.
D Amount does not include the portfolio activity of any underlying Fidelity Central Funds.
E For the period November 1, 2007 (commencement of operations) to October 31, 2008.
F Expense ratios reflect operating expenses of the class. Expenses before reductions do not reflect amounts reimbursed by the investment adviser or reductions from brokerage service arrangements or reductions from other expense offset arrangements and do not represent the amount paid by the class during periods when reimbursements or reductions occur. Expense ratios before reductions for start-up periods may not be representative of longer-term operating periods. Expenses net of fee waivers reflect expenses after reimbursement by the investment adviser but prior to reductions from brokerage service arrangements or other expense offset arrangements. Expenses net of all reductions represent the net expenses paid by the class.
G Amount represents less than $.01 per share.
H Total distributions of $.08 per share is comprised of distributions from net investment income of $.057 and distributions from net realized gain of $.025 per share.
See accompanying notes which are an integral part of the financial statements.
Annual Report
Financial Highlights - Institutional Class
Years ended October 31, | 2010 | 2009 | 2008 E |
Selected Per-Share Data | | | |
Net asset value, beginning of period | $ 7.02 | $ 5.48 | $ 10.00 |
Income from Investment Operations | | | |
Net investment income (loss) B | .07 | .06 | .09 |
Net realized and unrealized gain (loss) | 1.39 | 1.54 | (4.60) |
Total from investment operations | 1.46 | 1.60 | (4.51) |
Distributions from net investment income | (.06) | (.06) | (.01) |
Distributions from net realized gain | (.03) | - | - |
Total distributions | (.08) H | (.06) | (.01) |
Redemption fees added to paid in capital B,G | - | - | - |
Net asset value, end of period | $ 8.40 | $ 7.02 | $ 5.48 |
Total Return A | 20.97% | 29.77% | (45.17)% |
Ratios to Average Net Assets C,F | | | |
Expenses before reductions | 1.92% | 2.01% | 2.56% |
Expenses net of fee waivers, if any | 1.25% | 1.25% | 1.25% |
Expenses net of all reductions | 1.23% | 1.23% | 1.23% |
Net investment income (loss) | .99% | 1.09% | 1.05% |
Supplemental Data | | | |
Net assets, end of period (000 omitted) | $ 113 | $ 36 | $ 521 |
Portfolio turnover rate D | 87% | 116% | 115% |
A Total returns would have been lower had certain expenses not been reduced during the periods shown.
B Calculated based on average shares outstanding during the period.
C Fees and expenses of the underlying Fidelity Central Funds are not included in the Fund's expense ratio. The Fund indirectly bears its proportionate share of the expenses of any underlying Fidelity Central Funds.
D Amount does not include the portfolio activity of any underlying Fidelity Central Funds.
E For the period November 1, 2007 (commencement of operations) to October 31, 2008.
F Expense ratios reflect operating expenses of the class. Expenses before reductions do not reflect amounts reimbursed by the investment adviser or reductions from brokerage service arrangements or reductions from other expense offset arrangements and do not represent the amount paid by the class during periods when reimbursements or reductions occur. Expense ratios before reductions for start-up periods may not be representative of longer-term operating periods. Expenses net of fee waivers reflect expenses after reimbursement by the investment adviser but prior to reductions from brokerage service arrangements or other expense offset arrangements. Expenses net of all reductions represent the net expenses paid by the class.
G Amount represents less than $.01 per share.
H Total distributions of $.08 per share is comprised of distributions from net investment income of $.057 and distributions from net realized gain of $.025 per share.
See accompanying notes which are an integral part of the financial statements.
Annual Report
Notes to Financial Statements
For the period ended October 31, 2010
1. Organization.
Fidelity International Growth Fund (the Fund) is a fund of Fidelity Investment Trust (the Trust) and is authorized to issue an unlimited number of shares. The Trust is registered under the Investment Company Act of 1940, as amended (the 1940 Act), as an open-end management investment company organized as a Massachusetts business trust. The Fund offers Class A, Class T, Class C, International Growth and Institutional Class shares, each of which has equal rights as to assets and voting privileges. Effective after the close of business on September 1, 2010, Class B shares were closed to new accounts and additional purchases by existing shareholders. Each class has exclusive voting rights with respect to matters that affect that class. Class B shares will automatically convert to Class A shares after a holding period of seven years from the initial date of purchase. Investment income, realized and unrealized capital gains and losses, the common expenses of the Fund, and certain fund-level expense reductions, if any, are allocated on a pro-rata basis to each class based on the relative net assets of each class to the total net assets of the Fund. Each class differs with respect to transfer agent and distribution and service plan fees incurred. Certain expense reductions also differ by class. The Fund's investments in emerging markets can be subject to social, economic, regulatory, and political uncertainties and can be extremely volatile.
2. Investments in Fidelity Central Funds.
The Fund may invest in Fidelity Central Funds, which are open-end investment companies available only to other investment companies and accounts managed by Fidelity Management & Research Company (FMR) and its affiliates. The Fund's Schedule of Investments lists each of the Fidelity Central Funds held as of period end, if any, as an investment of the Fund, but does not include the underlying holdings of each Fidelity Central Fund. As an Investing Fund, the Fund indirectly bears its proportionate share of the expenses of the underlying Fidelity Central Funds.
The Money Market Central Funds seek preservation of capital and current income and are managed by Fidelity Investments Money Management, Inc. (FIMM), an affiliate of FMR.
A complete unaudited list of holdings for each Fidelity Central Fund is available upon request or at the Securities and Exchange Commission (the SEC) web site at www.sec.gov. In addition, the financial statements of the Fidelity Central Funds, which are not covered by the Fund's Report of Independent Registered Public Accounting Firm, are available on the SEC web site or upon request.
3. Significant Accounting Policies.
The financial statements have been prepared in conformity with accounting principles generally accepted in the United States of America (GAAP), which require management
Annual Report
3. Significant Accounting Policies - continued
to make certain estimates and assumptions at the date of the financial statements. Actual results could differ from those estimates. The following summarizes the significant accounting policies of the Fund:
Security Valuation. Investments are valued as of 4:00 p.m. Eastern time on the last calendar day of the period. The Fund uses independent pricing services approved by the Board of Trustees to value its investments. When current market prices or quotations are not readily available or reliable, valuations may be determined in good faith in accordance with procedures adopted by the Board of Trustees. Factors used in determining value may include market or security specific events. The frequency with which these procedures are used cannot be predicted and they may be utilized to a significant extent. The value used for net asset value (NAV) calculation under these procedures may differ from published prices for the same securities.
The Fund categorizes the inputs to valuation techniques used to value its investments into a disclosure hierarchy consisting of three levels as shown below.
Level 1 - quoted prices in active markets for identical investments
Level 2 - other significant observable inputs (including quoted prices for similar investments, interest rates, prepayment speeds, etc.)
Level 3 - unobservable inputs (including the fund's own assumptions based on the best information available)
Changes in valuation techniques may result in transfers in or out of an assigned level within the disclosure hierarchy. The aggregate value of investments by input level, as of October 31, 2010 is included at the end of the Fund's Schedule of Investments. Valuation techniques used to value the Fund's investments by major category are as follows.
Equity securities, including restricted securities, for which market quotations are readily available, are valued at the last reported sale price or official closing price as reported by an independent pricing service on the primary market or exchange on which they are traded and are categorized as Level 1 in the hierarchy. In the event there were no sales during the day or closing prices are not available, securities are valued at the last quoted bid price or may be valued using the last available price and are generally categorized as Level 2 in the hierarchy. For foreign equity securities, when significant market or security specific events arise, comparisons to the valuation of American Depositary Receipts (ADRs), futures contracts, Exchange-traded funds (ETFs) and certain indexes as well as quoted prices for similar securities are used and are categorized as Level 2 in the hierarchy in these circumstances. Utilizing these techniques may result in transfers between Level 1 and Level 2. For restricted equity securities and private placements where
Annual Report
Notes to Financial Statements - continued
3. Significant Accounting Policies - continued
Security Valuation - continued
observable inputs are limited, assumptions about market activity and risk are used and are categorized as Level 3 in the hierarchy.
ETFs are valued at their last sale price or official closing price as reported by an independent pricing service on the primary market or exchange on which they are traded and are categorized as Level 1 in the hierarchy. In the event there were no sales during the day but the exchange reports a closing bid level, ETFs are valued at the closing bid and would be categorized as Level 1 in the hierarchy. In the event there was no closing bid, ETFs may be valued by another method that the Board of Trustees believes reflects fair value in accordance with the Board's fair value pricing policies and may be categorized as Level 2 in the hierarchy.
Investments in open-end mutual funds, including the Fidelity Central Funds, are valued at their closing net asset value each business day and are categorized as Level 1 in the hierarchy. Short-term securities with remaining maturities of sixty days or less for which quotations are not readily available are valued at amortized cost, which approximates fair value and are categorized as Level 2 in the hierarchy.
Foreign Currency. The Fund uses foreign currency contracts to facilitate transactions in foreign-denominated securities. Gains and losses from these transactions may arise from changes in the value of the foreign currency or if the counterparties do not perform under the contracts' terms.
Foreign-denominated assets, including investment securities, and liabilities are translated into U.S. dollars at the exchange rate at period end. Purchases and sales of investment securities, income and dividends received and expenses denominated in foreign currencies are translated into U.S. dollars at the exchange rate in effect on the transaction date.
The effects of exchange rate fluctuations on investments are included with the net realized and unrealized gain (loss) on investment securities. Other foreign currency transactions resulting in realized and unrealized gain (loss) are disclosed separately.
Investment Transactions and Income. For financial reporting purposes, the Fund's investment holdings and NAV include trades executed through the end of the last business day of the period. The NAV per share for processing shareholder transactions is calculated as of the close of business of the New York Stock Exchange (NYSE), normally 4:00 p.m. Eastern time and includes trades executed through the end of the prior business day. Gains and losses on securities sold are determined on the basis of identified cost. Dividend income is recorded on the ex-dividend date, except for certain dividends from foreign securities where the ex-dividend date may have passed, which are recorded
Annual Report
3. Significant Accounting Policies - continued
Investment Transactions and Income - continued
as soon as the Fund is informed of the ex-dividend date. Non-cash dividends included in dividend income, if any, are recorded at the fair market value of the securities received. Distributions received on securities that represent a return of capital or capital gain are recorded as a reduction of cost of investments and/or as a realized gain. The Fund estimates the components of distributions received that may be considered return of capital distributions or capital gain distributions. Interest income and distributions from the Fidelity Central Funds are accrued as earned. Interest income includes coupon interest and amortization of premium and accretion of discount on debt securities. Investment income is recorded net of foreign taxes withheld where recovery of such taxes is uncertain.
Expenses. Most expenses of the Trust can be directly attributed to a fund. Expenses which cannot be directly attributed are apportioned amongst each fund in the Trust. Expense estimates are accrued in the period to which they relate and adjustments are made when actual amounts are known.
Income Tax Information and Distributions to Shareholders. Each year the Fund intends to qualify as a regulated investment company, including distributing substantially all of its taxable income and realized gains under Subchapter M of the Internal Revenue Code and filing its U.S. federal tax return. As a result, no provision for income taxes is required. As of October 31, 2010, the Fund did not have any unrecognized tax benefits in the accompanying financial statements. A fund's federal tax return is subject to examination by the Internal Revenue Service (IRS) for a period of three years. Foreign taxes are provided for based on the Fund's understanding of the tax rules and rates that exist in the foreign markets in which it invests.
Distributions are declared and recorded on the ex-dividend date. Income dividends and capital gain distributions are declared separately for each class. Income and capital gain distributions are determined in accordance with income tax regulations, which may differ from GAAP.
Capital accounts within the financial statements are adjusted for permanent book-tax differences. These adjustments have no impact on net assets or the results of operations. Temporary book-tax differences will reverse in a subsequent period.
Book-tax differences are primarily due to the short-term gain distributions from the Fidelity Central Funds, foreign currency transactions, passive foreign investment companies (PFIC), partnerships, capital loss carryforwards and losses deferred due to wash sales.
Annual Report
Notes to Financial Statements - continued
3. Significant Accounting Policies - continued
Income Tax Information and Distributions to Shareholders - continued
The federal tax cost of investment securities and unrealized appreciation (depreciation) as of period end were as follows:
Gross unrealized appreciation | $ 5,209,031 |
Gross unrealized depreciation | (928,317) |
Net unrealized appreciation (depreciation) | $ 4,280,714 |
| |
Tax Cost | $ 32,776,950 |
The tax-based components of distributable earnings as of period end were as follows:
Undistributed ordinary income | $ 278,863 |
Capital loss carryforward | $ (6,290,360) |
Net unrealized appreciation (depreciation) | $ 4,284,636 |
The tax character of distributions paid was as follows:
| October 31, 2010 | October 31, 2009 |
Ordinary Income | $ 245,729 | $ 188,551 |
Short-Term Trading (Redemption) Fees. Shares held by investors in the Fund less than 30 days are subject to a redemption fee equal to 1.00% of the net asset value of shares redeemed. All redemption fees, which reduce the proceeds of the shareholder redemption, are retained by the Fund and accounted for as an addition to paid in capital.
4. Operating Policies.
Repurchase Agreements. FMR has received an Exemptive Order from the SEC which permits the Fund and other affiliated entities of FMR to transfer uninvested cash balances into joint trading accounts which are then invested in repurchase agreements. The Fund may also invest directly with institutions in repurchase agreements. Repurchase agreements are collateralized by government or non-government securities. Upon settlement date, collateral is held in segregated accounts with custodian banks and may be obtained in the event of a default of the counterparty. The Fund monitors, on a daily basis, the value of the collateral to ensure it is at least equal to the principal amount of the repurchase agreement (including accrued interest). In the event of a default by the counterparty, realization of the collateral proceeds could be delayed, during which time the value of the collateral may decline.
Annual Report
5. Purchases and Sales of Investments.
Purchases and sales of securities, other than short-term securities, aggregated $31,048,448 and $23,131,685, respectively.
6. Fees and Other Transactions with Affiliates.
Management Fee. FMR and its affiliates provide the Fund with investment management related services for which the Fund pays a monthly management fee. The management fee is the sum of an individual fund fee rate that is based on an annual rate of .45% of the Fund's average net assets and a group fee rate that averaged .26% during the period. The group fee rate is based upon the average net assets of all the mutual funds advised by FMR. The group fee rate decreases as assets under management increase and increases as assets under management decrease. In addition, the management fee is subject to a performance adjustment (up to a maximum of ± .20% of the Fund's average net assets over a 36 month performance period). The upward or downward adjustment to the management fee is based on the relative investment performance of International Growth as compared to an appropriate benchmark index. The Fund's performance adjustment took effect in November 2008. Subsequent months will be added until the performance period includes 36 months. For the period, the total annual management fee rate, including the performance adjustment, was .82% of the Fund's average net assets.
Distribution and Service Plan Fees. In accordance with Rule 12b-1 of the 1940 Act, the Fund has adopted separate Distribution and Service Plans for each class of shares. Certain classes pay Fidelity Distributors Corporation (FDC), an affiliate of FMR, separate Distribution and Service Fees, each of which is based on an annual percentage of each class' average net assets. In addition, FDC may pay financial intermediaries for selling shares of the Fund and providing shareholder support services. For the period, the Distribution and Service Fee rates, total fees and amounts retained by FDC were as follows:
| Distribution
Fee | Service
Fee | Total Fees | Retained
by FDC |
Class A | -% | .25% | $ 5,536 | $ 860 |
Class T | .25% | .25% | 3,576 | - |
Class B | .75% | .25% | 4,625 | 3,483 |
Class C | .75% | .25% | 10,555 | 3,617 |
| | | $ 24,292 | $ 7,960 |
Sales Load. FDC receives a front-end sales charge of up to 5.75% for selling Class A shares, and 3.50% for selling Class T shares, some of which is paid to financial intermediaries for selling shares of the Fund. FDC receives the proceeds of contingent deferred sales charges levied on Class A, Class T, Class B, and Class C redemptions. These charges depend on the holding period. The deferred sales charges range from 5% to 1% for
Annual Report
Notes to Financial Statements - continued
6. Fees and Other Transactions with Affiliates - continued
Sales Load - continued
Class B, 1% for Class C, 1.00% for certain purchases of Class A shares (1.00% to .50% prior to July 12, 2010) and .25% for certain purchases of Class T shares.
For the period, sales charge amounts retained by FDC were as follows:
| Retained
by FDC |
Class A | $ 4,989 |
Class T | 569 |
Class B* | 583 |
Class C* | 125 |
| $ 6,266 |
* When Class B and Class C shares are initially sold, FDC pays commissions from its own resources to financial intermediaries through which the sales are made.
Transfer Agent Fees. Fidelity Investments Institutional Operations Company, Inc. (FIIOC), an affiliate of FMR, is the transfer, dividend disbursing and shareholder servicing agent for each class of the Fund. FIIOC receives account fees and asset-based fees that vary according to the account size and type of account of the shareholders of the respective classes of the Fund. FIIOC pays for typesetting, printing and mailing of shareholder reports, except proxy statements. For the period, transfer agent fees for each class were as follows:
| Amount | % of
Average
Net Assets |
Class A | $ 7,042 | .32 |
Class T | 2,357 | .33 |
Class B | 1,462 | .31 |
Class C | 3,330 | .32 |
International Growth | 70,950 | .31 |
Institutional Class | 165 | .30 |
| $ 85,306 | |
Accounting and Security Lending Fees. Fidelity Service Company, Inc. (FSC), an affiliate of FMR, maintains the Fund's accounting records. The accounting fee is based on the level of average net assets for the month. Under a separate contract, FSC administers the security lending program. The security lending fee is based on the number and duration of lending transactions.
Annual Report
6. Fees and Other Transactions with Affiliates - continued
Brokerage Commissions. The Fund placed a portion of its portfolio transactions with brokerage firms which are affiliates of the investment adviser. The commissions paid to these affiliated firms were $380 for the period.
7. Committed Line of Credit.
The Fund participates with other funds managed by FMR or an affiliate in a $3.75 billion credit facility (the "line of credit") to be utilized for temporary or emergency purposes to fund shareholder redemptions or for other short-term liquidity purposes. The Fund has agreed to pay commitment fees on its pro-rata portion of the line of credit, which amounted to $103 and is reflected in Miscellaneous expenses on the Statement of Operations. During the period, there were no borrowings on this line of credit.
8. Security Lending.
The Fund lends portfolio securities through a lending agent from time to time in order to earn additional income. The lending agent may loan securities to certain qualified borrowers, including Fidelity Capital Markets (FCM), a broker-dealer affiliated with the Fund. On the settlement date of the loan, the Fund receives collateral (in the form of U.S. Treasury obligations, letters of credit and/or cash) against the loaned securities and maintains collateral in an amount not less than 100% of the market value of the loaned securities during the period of the loan. The market value of the loaned securities is determined at the close of business of the Fund and any additional required collateral is delivered to the Fund on the next business day. If the borrower defaults on its obligation to return the securities loaned because of insolvency or other reasons, a fund could experience delays and costs in recovering the securities loaned or in gaining access to the collateral. Any cash collateral received is invested in the Fidelity Securities Lending Cash Central Fund. The value of loaned securities and cash collateral at period end are disclosed on the Fund's Statement of Assets and Liabilities. Security lending income represents the income earned on investing cash collateral, less rebates paid to borrowers and lending agent fees associated with the loan, plus any premium payments received for lending certain types of securities. Security lending income is presented in the Statement of Operations as a component of income from Fidelity Central Funds. Total security lending income during the period amounted to $13,302. During the period, there were no securities loaned to FCM.
Annual Report
Notes to Financial Statements - continued
9. Expense Reductions.
FMR voluntarily agreed to reimburse each class to the extent annual operating expenses exceeded certain levels of average net assets as noted in the table below. Some expenses, for example interest expense, including commitment fees, are excluded from this reimbursement.
The following classes were in reimbursement during the period:
| Expense
Limitations | Reimbursement
from adviser |
Class A | 1.50% | $ 13,958 |
Class T | 1.75% | 4,759 |
Class B | 2.25% | 2,895 |
Class C | 2.25% | 6,772 |
International Growth | 1.25% | 145,483 |
Institutional Class | 1.25% | 371 |
| | $ 174,238 |
Effective November 1, 2010 the expense limitations will be changed to 1.45%, 1.70%, 2.20%, 2.20%, 1.20%, and 1.20% for Class A, T, B, C, International Growth, and Institutional, respectively.
Many of the brokers with whom FMR places trades on behalf of the Fund provided services to the Fund in addition to trade execution. These services included payments of certain expenses on behalf of the Fund totaling $4,411 for the period.
10. Distributions to Shareholders.
Distributions to shareholders of each class were as follows:
Years ended October 31, | 2010 | 2009 |
From net investment income | | |
Class A | $ 10,514 | $ 7,994 |
Class T | 1,819 | 2,991 |
International Growth | 154,599 | 171,473 |
Institutional Class | 287 | 6,093 |
Total | $ 167,219 | $ 188,551 |
From net realized gain | | |
Class A | $ 5,713 | $ - |
Class T | 2,067 | - |
Class C | 2,797 | - |
International Growth | 67,807 | - |
Institutional Class | 126 | - |
Total | $ 78,510 | $ - |
Annual Report
11. Share Transactions.
Transactions for each class of shares were as follows:
| Shares | Dollars |
Years ended October 31, | 2010 | 2009 | 2010 | 2009 |
Class A | | | | |
Shares sold | 247,866 | 249,117 | $ 1,869,390 | $ 1,499,324 |
Reinvestment of distributions | 2,011 | 1,620 | 14,999 | 7,954 |
Shares redeemed | (88,980) | (193,639) | (650,197) | (1,109,207) |
Net increase (decrease) | 160,897 | 57,098 | $ 1,234,192 | $ 398,071 |
Class T | | | | |
Shares sold | 73,695 | 78,248 | $ 554,529 | $ 453,244 |
Reinvestment of distributions | 513 | 606 | 3,840 | 2,982 |
Shares redeemed | (26,780) | (96,008) | (194,364) | (616,841) |
Net increase (decrease) | 47,428 | (17,154) | $ 364,005 | $ (160,615) |
Class B | | | | |
Shares sold | 37,806 | 35,907 | $ 276,981 | $ 202,014 |
Shares redeemed | (15,339) | (107,260) | (113,063) | (656,068) |
Net increase (decrease) | 22,467 | (71,353) | $ 163,918 | $ (454,054) |
Class C | | | | |
Shares sold | 110,505 | 147,440 | $ 831,229 | $ 796,649 |
Reinvestment of distributions | 369 | - | 2,760 | - |
Shares redeemed | (71,336) | (161,828) | (504,821) | (850,523) |
Net increase (decrease) | 39,538 | (14,388) | $ 329,168 | $ (53,874) |
International Growth | | | | |
Shares sold | 1,971,246 | 1,976,158 | $ 14,829,454 | $ 11,124,182 |
Reinvestment of distributions | 28,518 | 27,149 | 212,744 | 133,303 |
Shares redeemed | (1,213,664) | (1,574,393) | (8,965,012) | (8,834,160) |
Net increase (decrease) | 786,100 | 428,914 | $ 6,077,186 | $ 2,423,325 |
Institutional Class | | | | |
Shares sold | 11,311 | 6,125 | $ 86,413 | $ 37,094 |
Reinvestment of distributions | 55 | 1,241 | 412 | 6,093 |
Shares redeemed | (3,097) | (97,389) | (23,304) | (632,954) |
Net increase (decrease) | 8,269 | (90,023) | $ 63,521 | $ (589,767) |
12. Other.
The Fund's organizational documents provide former and current trustees and officers with a limited indemnification against liabilities arising in connection with the performance of their duties to the Fund. In the normal course of business, the Fund may also enter into contracts that provide general indemnifications. The Fund's maximum exposure under these arrangements is unknown as this would be dependent on future claims that may be made against the Fund. The risk of material loss from such claims is considered remote.
Annual Report
To the Trustees of Fidelity Investment Trust and the Shareholders of Fidelity International Growth Fund:
In our opinion, the accompanying statement of assets and liabilities, including the schedule of investments, and the related statements of operations and of changes in net assets and the financial highlights present fairly, in all material respects, the financial position of Fidelity International Growth Fund (a fund of Fidelity Investment Trust) at October 31, 2010, the results of its operations for the year then ended, the changes in its net assets for each of the two years in the period then ended and the financial highlights for each of the periods indicated, in conformity with accounting principles generally accepted in the United States of America. These financial statements and financial highlights (hereafter referred to as "financial statements") are the responsibility of the Fidelity International Growth Fund's management. Our responsibility is to express an opinion on these financial statements based on our audits. We conducted our audits of these financial statements in accordance with the standards of the Public Company Accounting Oversight Board (United States). Those standards require that we plan and perform the audit to obtain reasonable assurance about whether the financial statements are free of material misstatement. An audit includes examining, on a test basis, evidence supporting the amounts and disclosures in the financial statements, assessing the accounting principles used and significant estimates made by management, and evaluating the overall financial statement presentation. We believe that our audits, which included confirmation of securities at October 31, 2010 by correspondence with the custodian and brokers, provide a reasonable basis for our opinion.
/s/ PricewaterhouseCoopers LLP
PricewaterhouseCoopers LLP
Boston, Massachusetts
December 15, 2010
Annual Report
The Trustees, Member of the Advisory Board, and executive officers of the trust and fund, as applicable, are listed below. The Board of Trustees governs the fund and is responsible for protecting the interests of shareholders. The Trustees are experienced executives who meet periodically throughout the year to oversee the fund's activities, review contractual arrangements with companies that provide services to the fund, oversee management of the risks associated with such activities and contractual arrangements, and review the fund's performance. Except for James C. Curvey, each of the Trustees oversees 221 funds advised by FMR or an affiliate. Mr. Curvey oversees 410 funds advised by FMR or an affiliate.
The Trustees hold office without limit in time except that (a) any Trustee may resign; (b) any Trustee may be removed by written instrument, signed by at least two-thirds of the number of Trustees prior to such removal; (c) any Trustee who requests to be retired or who has become incapacitated by illness or injury may be retired by written instrument signed by a majority of the other Trustees; and (d) any Trustee may be removed at any special meeting of shareholders by a two-thirds vote of the outstanding voting securities of the trust. Each Trustee who is not an interested person (as defined in the 1940 Act) (Independent Trustee), shall retire not later than the last day of the calendar year in which his or her 72nd birthday occurs. The Independent Trustees may waive this mandatory retirement age policy with respect to individual Trustees. The executive officers and Advisory Board Member hold office without limit in time, except that any officer and Advisory Board Member may resign or may be removed by a vote of a majority of the Trustees at any regular meeting or any special meeting of the Trustees. Except as indicated, each individual has held the office shown or other offices in the same company for the past five years.
Experience, Skills, Attributes, and Qualifications of the Fund's Trustees. The Governance and Nominating Committee has adopted a statement of policy that describes the experience, qualifications, attributes, and skills that are necessary and desirable for potential Independent Trustee candidates (Statement of Policy). The Board believes that each Trustee satisfied at the time he or she was initially elected or appointed a Trustee, and continues to satisfy, the standards contemplated by the Statement of Policy. The Governance and Nominating Committee also engages professional search firms to help identify potential Independent Trustee candidates who have the experience, qualifications, attributes, and skills consistent with the Statement of Policy. From time to time, additional criteria based on the composition and skills of the current Independent Trustees, as well as experience or skills that may be appropriate in light of future changes to board composition, business conditions, and regulatory or other developments, have also been considered by the professional search firms and the Governance and Nominating Committee. In addition, the Board takes into account the Trustees' commitment and participation in Board and committee meetings, as well as their leadership of standing and ad hoc committees throughout their tenure.
In determining that a particular Trustee was and continues to be qualified to serve as a Trustee, the Board has considered a variety of criteria, none of which, in isolation, was controlling. The Board believes that, collectively, the Trustees have balanced and diverse experience, qualifications, attributes, and skills, which allow the Board to operate effectively in governing the fund and protecting the interests of shareholders. Information about the specific experience, skills, attributes, and qualifications of each Trustee, which in each case led to the Board's conclusion that the Trustee should serve (or continue to serve) as a trustee of the fund, is provided below.
Annual Report
Trustees and Officers - continued
Board Structure and Oversight Function. Edward C. Johnson 3d is an interested person (as defined in the 1940 Act) and currently serves as Chairman. The Trustees have determined that an interested Chairman is appropriate and benefits shareholders because an interested Chairman has a personal and professional stake in the quality and continuity of services provided to the fund. Independent Trustees exercise their informed business judgment to appoint an individual of their choosing to serve as Chairman, regardless of whether the Trustee happens to be independent or a member of management. The Independent Trustees have determined that they can act independently and effectively without having an Independent Trustee serve as Chairman and that a key structural component for assuring that they are in a position to do so is for the Independent Trustees to constitute a substantial majority for the Board. The Independent Trustees also regularly meet in executive session. Ned C. Lautenbach serves as Chairman of the Independent Trustees and as such (i) acts as a liaison between the Independent Trustees and management with respect to matters important to the Independent Trustees and (ii) with management prepares agendas for Board meetings.
Fidelity funds are overseen by different Boards of Trustees. The fund's Board oversees Fidelity's equity and high income funds and another Board oversees Fidelity's investment-grade bond, money market, and asset allocation funds. The asset allocation funds may invest in Fidelity funds overseen by the fund's Board. The use of separate Boards, each with its own committee structure, allows the Trustees of each group of Fidelity funds to focus on the unique issues of the funds they oversee, including common research, investment, and operational issues. On occasion, the separate Boards establish joint committees to address issues of overlapping consequences for the Fidelity funds overseen by each Board.
The Trustees operate using a system of committees to facilitate the timely and efficient consideration of all matters of importance to the Trustees, the fund, and fund shareholders and to facilitate compliance with legal and regulatory requirements and oversight of the fund's activities and associated risks. The Board, acting through its committees, has charged FMR and its affiliates with (i) identifying events or circumstances the occurrence of which could have demonstrably adverse effects on the fund's business and/or reputation; (ii) implementing processes and controls to lessen the possibility that such events or circumstances occur or to mitigate the effects of such events or circumstances if they do occur; and (iii) creating and maintaining a system designed to evaluate continuously business and market conditions in order to facilitate the identification and implementation processes described in (i) and (ii) above. Because the day-to-day operations and activities of the fund are carried out by or through FMR, its affiliates and other service providers, the fund's exposure to risks is mitigated but not eliminated by the processes overseen by the Trustees. While each of the Board's committees has responsibility for overseeing different aspects of the fund's activities, oversight is exercised primarily through the Operations, Audit, and Compliance Committees. Appropriate personnel, including but not limited to the fund's Chief Compliance Officer (CCO), FMR's internal auditor, the independent accountants, the fund's Treasurer and portfolio management personnel, make periodic reports to the Board's committees, as appropriate. The responsibilities of each committee, including their oversight responsibilities, are described further under "Standing Committees of the Fund's Trustees."
Annual Report
The fund's Statement of Additional Information (SAI) includes more information about the Trustees. To request a free copy, call Fidelity at 1-877-208-0098.
Interested Trustees*:
Correspondence intended for each Trustee who is an interested person may be sent to Fidelity Investments, 82 Devonshire Street, Boston, Massachusetts 02109.
Name, Age; Principal Occupations and Other Relevant Experience+ |
Edward C. Johnson 3d (80) |
| Year of Election or Appointment: 1984 Mr. Johnson is Trustee and Chairman of the Board of Trustees of certain Trusts. Mr. Johnson serves as Chief Executive Officer, Chairman, and a Director of FMR LLC; Chairman and a Director of FMR; Chairman and a Director of Fidelity Research & Analysis Company (FRAC); Chairman and a Director of Fidelity Investments Money Management, Inc.; and Chairman and a Director of FMR Co., Inc. In addition, Mr. Johnson serves as Chairman and Director of FIL Limited. Previously, Mr. Johnson served as President of FMR LLC (2006-2007). |
James C. Curvey (75) |
| Year of Election or Appointment: 2007 Mr. Curvey also serves as Trustee (2007-present) of other investment companies advised by FMR. Mr. Curvey is a Director of Fidelity Investments Money Management, Inc. (2009-present), Director of Fidelity Research & Analysis Co. (2009-present) and Director of FMR and FMR Co., Inc. (2007-present). Mr. Curvey is also Vice Chairman (2007-
present) and Director of FMR LLC. In addition, Mr. Curvey serves as an Overseer for the Boston Symphony Orchestra and a member of the Trustees of Villanova University. Previously, Mr. Curvey was the Vice Chairman (2006-2007) and Director (2000-2007) of FMR Corp. |
* Trustees have been determined to be "Interested Trustees" by virtue of, among other things, their affiliation with the trust or various entities under common control with FMR.
Annual Report
Trustees and Officers - continued
+ The information above includes each Trustee's principal occupation during the last five years and other information relating to the experience, attributes, and skills relevant to each Trustee's qualifications to serve as a Trustee, which led to the conclusion that each Trustee should serve as a Trustee for the fund.
Independent Trustees:
Correspondence intended for each Independent Trustee (that is, the Trustees other than the Interested Trustees) may be sent to Fidelity Investments, P.O. Box 55235, Boston, Massachusetts 02205-5235.
Name, Age; Principal Occupations and Other Relevant Experience+ |
Dennis J. Dirks (62) |
| Year of Election or Appointment: 2005 Prior to his retirement in May 2003, Mr. Dirks was Chief Operating Officer and a member of the Board of The Depository Trust & Clearing Corporation (DTCC). He also served as President, Chief Operating Officer, and Board member of The Depository Trust Company (DTC) and President and Board member of the National Securities Clearing Corporation (NSCC). In addition, Mr. Dirks served as Chief Executive Officer and Board member of the Government Securities Clearing Corporation, Chief Executive Officer and Board member of the Mortgage-Backed Securities Clearing Corporation, as a Trustee and a member of the Finance Committee of Manhattan College (2005-2008), and as a Trustee and a member of the Finance Committee of AHRC of Nassau County (2006-2008). Mr. Dirks is a member of the Independent Directors Council (IDC) Governing Council (2010-Present) and Board of Directors for The Brookville Center for Children's Services, Inc. (2009-present). |
Alan J. Lacy (57) |
| Year of Election or Appointment: 2008 Mr. Lacy serves as Senior Adviser (2007-present) of Oak Hill Capital Partners, L.P. (private equity). Mr. Lacy also served as Chief Executive Officer (2000-2005) and Vice Chairman (2005-2006) of Sears Holdings Corporation and Sears, Roebuck and Co. (retail). In addition, Mr. Lacy serves as a member of the Board of Directors of The Western Union Company (global money transfer, 2006-present) and Bristol-Myers Squibb Company (global pharmaceuticals, 2007-present). Mr. Lacy is Chairman (2008-present) and a member (2006-present) of the Board of Trustees of The National Parks Conservation Association. |
Ned C. Lautenbach (66) |
| Year of Election or Appointment: 2000 Mr. Lautenbach is Chairman of the Independent Trustees of the Equity and High Income Funds (2006-present). Mr. Lautenbach currently serves as the Lead Director of the Eaton Corporation Board of Directors (diversified industrial, 1997-present). Mr. Lautenbach is also a member of the Board of Directors of the Philharmonic Center for the Arts in Naples, Florida (1999-present); a member of the Board of Trustees of Fairfield University (2005-present); and a member of the Council on Foreign Relations (1994-present). Previously, Mr. Lautenbach was a Partner/Advisory Partner at Clayton, Dubilier & Rice, Inc. (private equity investment, 1998-2010), as well as a Director of Sony Corporation (2006-2007). |
Joseph Mauriello (66) |
| Year of Election or Appointment: 2008 Prior to his retirement in January 2006, Mr. Mauriello served in numerous senior management positions including Deputy Chairman and Chief Operating Officer (2004-2005), and Vice Chairman of Financial Services (2002-2004) of KPMG LLP US (professional services, 1965-2005). Mr. Mauriello currently serves as a member of the Board of Directors of XL Group plc. (global insurance and re-insurance, 2006-present) and of Arcadia Resources Inc. (health care services and products, 2007-
present). Previously, Mr. Mauriello served as a Director of the Hamilton Funds of the Bank of New York (2006-2007). |
Cornelia M. Small (66) |
| Year of Election or Appointment: 2005 Ms. Small is a member of the Board of Directors of the Teagle Foundation (2009-present). Ms. Small is also a member of the Investment Committee, and Chair (2008-present) and a member of the Board of Trustees of Smith College. In addition, Ms. Small serves on the Investment Committee of the Berkshire Taconic Community Foundation (2008-
present). Previously, Ms. Small served as Chairperson of the Investment Committee (2002-2008) of Smith College. In addition, Ms. Small served as Chief Investment Officer, Director of Global Equity Investments, and a member of the Board of Directors of Scudder, Stevens & Clark and Scudder Kemper Investments. |
William S. Stavropoulos (71) |
| Year of Election or Appointment: 2001 Mr. Stavropoulos is Vice Chairman of the Independent Trustees of the Equity and High Income Funds (2006-present). Mr. Stavropoulos serves as President and Founder of the Michigan Baseball Foundation, the Great Lakes Loons (2007-present). Mr. Stavropoulos is Chairman Emeritus of the Board of Directors of The Dow Chemical Company, where he previously served in numerous senior management positions, including President, CEO (1995-2000; 2002-2004), Chairman of the Executive Committee (2000-2006), and as a member of the Board of Directors (1990-2006). Currently, Mr. Stavropoulos is Chairman of Univar (global distributor of commodity and specialty chemicals, 2010-present), a Director of Teradata Corporation (data warehousing and technology solutions, 2008-present), Chemical Financial Corporation, Maersk Inc. (industrial conglomerate), Tyco International, Inc. (multinational manufacturing and services, 2007-present), and a member of the Advisory Board for Metalmark Capital (private equity investment, 2005-
present). Mr. Stavropoulos is a special advisor to Clayton, Dubilier & Rice, Inc. (private equity investment). In addition, Mr. Stavropoulos is a member of the University of Notre Dame Advisory Council for the College of Science. |
David M. Thomas (61) |
| Year of Election or Appointment: 2008 Previously, Mr. Thomas served as Executive Chairman (2005-2006) and Chairman and Chief Executive Officer (2000-2005) of IMS Health, Inc. (pharmaceutical and healthcare information solutions). In addition, Mr. Thomas serves as a member of the Board of Directors of Fortune Brands, Inc. (consumer products), and Interpublic Group of Companies, Inc. (marketing communication, 2004-present). |
Michael E. Wiley (60) |
| Year of Election or Appointment: 2008 Mr. Wiley also serves as a Director of Asia Pacific Exploration Consolidated (international oil and gas exploration and production, 2008-
present). Mr. Wiley serves as a Director of Tesoro Corporation (independent oil refiner and marketer, 2005-present), and a Director of Bill Barrett Corporation (exploration and production, 2005-present). In addition, Mr. Wiley also serves as a Director of Post Oak Bank (privately-held bank, 2004-present). Previously, Mr. Wiley served as a member of the Board of Trustees of the University of Tulsa (2000-2006; 2007-2010), as a Senior Energy Advisor of Katzenbach Partners, LLC (consulting, 2006-2007), as an Advisory Director of Riverstone Holdings (private investment), Chairman, President, and CEO of Baker Hughes, Inc. (oilfield services, 2000-2004), and as Director of Spinnaker Exploration Company (exploration and production, 2001-2005). |
Annual Report
+ The information above includes each Trustee's principal occupation during the last five years and other information relating to the experience, attributes, and skills relevant to each Trustee's qualifications to serve as a Trustee, which led to the conclusion that each Trustee should serve as a Trustee for the fund.
Advisory Board Member and Executive Officers:
Correspondence intended for each executive officer and Peter S. Lynch may be sent to Fidelity Investments, 82 Devonshire Street, Boston, Massachusetts 02109.
Name, Age; Principal Occupation |
Peter S. Lynch (66) |
| Year of Election or Appointment: 2003 Member of the Advisory Board of Fidelity's Equity and High Income Funds. Mr. Lynch is Vice Chairman and a Director of FMR and FMR Co., Inc. In addition, Mr. Lynch serves as a Trustee of Boston College and as the Chairman of the Inner-City Scholarship Fund. Previously, Mr. Lynch served on the Special Olympics International Board of Directors (1997-2006). |
Kenneth B. Robins (41) |
| Year of Election or Appointment: 2008 President and Treasurer of Fidelity's Equity and High Income Funds. Mr. Robins also serves as President and Treasurer (2010-present) and Assistant Treasurer (2009-present) of other Fidelity funds and is an employee of Fidelity Investments (2004-present). Previously, Mr. Robins served as Deputy Treasurer of the Fidelity funds (2005-2008) and Treasurer and Chief Financial Officer of The North Carolina Capital Management Trust: Cash and Term Portfolios (2006-2008). |
Bruce T. Herring (45) |
| Year of Election or Appointment: 2006 Vice President of certain Equity Funds. Mr. Herring also serves as Chief Investment Officer and Director of Fidelity Management & Research (U.K.) Inc. (2010-present) and Group Chief Investments Officer of FMR. Previously, Mr. Herring served as Vice President (2005-2006) and Senior Vice President (2006-2007) of Fidelity Management & Research Company, Vice President of FMR Co., Inc. (2001-2007) and as a portfolio manager for Fidelity U.S. Equity Funds. |
Brian B. Hogan (46) |
| Year of Election or Appointment: 2009 Vice President of certain Equity Funds and Vice President of Sector Funds. Mr. Hogan also serves as President of FMR's Equity Division (2009-present). Previously, Mr. Hogan served as Senior Vice President, Equity Research of FMR (2006-2009) and as a portfolio manager. |
Scott C. Goebel (42) |
| Year of Election or Appointment: 2008 Secretary and Chief Legal Officer (CLO) of the Fidelity funds. Mr. Goebel also serves as Secretary and CLO of The North Carolina Capital Management Trust: Cash and Term Portfolio (2008-present); General Counsel, Secretary, and Senior Vice President of FMR (2008-present) and FMR Co., Inc. (2008-present); Deputy General Counsel of FMR LLC; Chief Legal Officer of Fidelity Management & Research (Hong Kong) Limited (2008-present) and Assistant Secretary of Fidelity Management & Research (Japan) Inc. (2008-present), Fidelity Investments Money Management, Inc. (2008-present), Fidelity Management & Research (U.K.) Inc. (2008-present), and Fidelity Research and Analysis Company (2008-present). Previously, Mr. Goebel served as Assistant Secretary of the Funds (2007-2008) and as Vice President and Secretary of Fidelity Distributors Corporation (FDC) (2005-2007). |
William C. Coffey (41) |
| Year of Election or Appointment: 2009 Assistant Secretary of Fidelity's Equity and High Income Funds. Mr. Coffey also serves as Senior Vice President and Deputy General Counsel of FMR LLC (2010-present), and is an employee of Fidelity Investments. Previously, Mr. Coffey served as Vice President and Associate General Counsel of FMR LLC (2005-2009). |
Holly C. Laurent (56) |
| Year of Election or Appointment: 2008 Anti-Money Laundering (AML) Officer of the Fidelity funds. Ms. Laurent also serves as AML Officer of The North Carolina Capital Management Trust: Cash and Term Portfolio (2008-present) and is an employee of Fidelity Investments. Previously, Ms. Laurent was Senior Vice President and Head of Legal for Fidelity Business Services India Pvt. Ltd. (2006-
2008), and Senior Vice President, Deputy General Counsel and Group Head for FMR LLC (2005-2006). |
Christine Reynolds (52) |
| Year of Election or Appointment: 2008 Chief Financial Officer of the Fidelity funds. Ms. Reynolds became President of Fidelity Pricing and Cash Management Services (FPCMS) in August 2008. Ms. Reynolds served as Chief Operating Officer of FPCMS (2007-2008). Previously, Ms. Reynolds served as President, Treasurer, and Anti-Money Laundering officer of the Fidelity funds (2004-2007). |
Kenneth A. Rathgeber (63) |
| Year of Election or Appointment: 2004 Chief Compliance Officer of Fidelity's Equity and High Income Funds. Mr. Rathgeber is Chief Compliance Officer of Fidelity Management & Research (Hong Kong) Limited (2008-present), Fidelity Management & Research (Japan) Inc. (2008-present), FMR (2005-present), FMR Co., Inc. (2005-present), Fidelity Management & Research (U.K.) Inc. (2005-
present), Fidelity Research & Analysis Company (2005-present), Fidelity Investments Money Management, Inc. (2005-present), Pyramis Global Advisors, LLC (2005-present), and Strategic Advisers, Inc. (2005-
present). |
Jeffrey S. Christian (49) |
| Year of Election or Appointment: 2009 Deputy Treasurer of the Fidelity funds. Mr. Christian is an employee of Fidelity Investments. Previously, Mr. Christian served as Chief Financial Officer (2008-2009) of certain Fidelity funds and Senior Vice President of Fidelity Pricing and Cash Management Services (FPCMS) (2004-2009). |
Bryan A. Mehrmann (49) |
| Year of Election or Appointment: 2005 Deputy Treasurer of the Fidelity funds. Mr. Mehrmann is an employee of Fidelity Investments. |
Adrien E. Deberghes (43) |
| Year of Election or Appointment: 2008 Deputy Treasurer of Fidelity's Equity and High Income Funds. Mr. Deberghes also serves as Assistant Treasurer of other Fidelity funds (2010-present) and is an employee of Fidelity Investments (2008-
present). Previously, Mr. Deberghes served as Senior Vice President of Mutual Fund Administration at State Street Corporation (2007-2008), Senior Director of Mutual Fund Administration at Investors Bank & Trust (2005-2007), and Director of Finance for Dunkin' Brands (2000-2005). |
Stephanie J. Dorsey (41) |
| Year of Election or Appointment: 2010 Assistant Treasurer of Fidelity's Equity and High Income Funds. Ms. Dorsey also serves as Deputy Treasurer of other Fidelity funds (2008-
present) and is an employee of Fidelity Investments (2008-present). Previously, Ms. Dorsey served as Treasurer (2004-2008) of the JPMorgan Mutual Funds and Vice President (2004-2008) of JPMorgan Chase Bank. |
John R. Hebble (52) |
| Year of Election or Appointment: 2009 Assistant Treasurer of Fidelity's Equity and High Income Funds. Mr. Hebble also serves as Treasurer and Chief Financial Officer of The North Carolina Capital Management Trust: Cash and Term Portfolio (2008-present), President and Treasurer of other Fidelity funds (2008-present) and is an employee of Fidelity Investments. |
Gary W. Ryan (52) |
| Year of Election or Appointment: 2005 Assistant Treasurer of the Fidelity funds. Mr. Ryan is an employee of Fidelity Investments. Previously, Mr. Ryan served as Vice President of Fund Reporting in Fidelity Pricing and Cash Management Services (FPCMS) (1999-2005). |
Jonathan Davis (42) |
| Year of Election or Appointment: 2010 Assistant Treasurer of the Fidelity funds. Mr. Davis is an employee of Fidelity Investments. Previously, Mr. Davis served as Vice President and Associate General Counsel of FMR LLC (2003-2010). |
Annual Report
The Board of Trustees of Fidelity International Growth Fund voted to pay to shareholders of record at the opening of business on record date, the following distributions per share derived from capital gains realized from sales of portfolio securities, and dividends derived from net investment income:
| Pay Date | Record Date | Dividends | Capital Gains |
Class A | 12/06/10 | 12/03/10 | $0.043 | $0.011 |
Class T | 12/06/10 | 12/03/10 | $0.03 | $0.011 |
Class B | 12/06/10 | 12/03/10 | $- | $0.003 |
Class C | 12/06/10 | 12/03/10 | $- | $0.005 |
Class A, Class T, and Class C designates 100% of the dividends distributed during the fiscal year as amounts which may be taken into account as a dividend for purposes of the maximum rate under section 1(h)(11) of the Internal Revenue Code.
The amounts per share which represent income derived from sources within, and taxes paid to, foreign countries or possessions of the United States are as follows:
| Pay Date | Income | Taxes |
Class A | 12/7/09 | $0.056 | $0.0099 |
Class T | 12/7/09 | $0.039 | $0.0099 |
Class C | 12/7/09 | $0.021 | $0.0099 |
The fund will notify shareholders in January 2011 of amounts for use in preparing 2010 income tax returns.
Annual Report
Board Approval of Investment Advisory Contracts and Management Fees
Fidelity International Growth Fund
Each year, the Board of Trustees, including the Independent Trustees (together, the Board), votes on the renewal of the management contract and sub-advisory agreements (together, the Advisory Contracts) for the fund. The Board, assisted by the advice of fund counsel and Independent Trustees' counsel, requests and considers a broad range of information relevant to the renewal of the Advisory Contracts throughout the year.
The Board meets regularly and considers at each of its meetings factors that are relevant to its annual consideration of the renewal of the fund's Advisory Contracts, including the services and support provided to the fund and its shareholders. The Board has established various standing committees, each composed of Independent Trustees with varying backgrounds, to which the Board has assigned specific subject matter responsibilities in order to enhance effective decision-making by the Board. The Board, acting directly and through its Committees, requests and receives information concerning the annual consideration of the renewal of the fund's Advisory Contracts. The Board also meets as needed to consider matters specifically related to the Board's annual consideration of the renewal of Advisory Contracts. Members of the Board may also meet with trustees of other Fidelity funds through ad hoc joint committees to discuss certain matters relevant to the Fidelity funds.
At its July 2010 meeting, the Board of Trustees, including the Independent Trustees, unanimously determined to renew the fund's Advisory Contracts. In reaching its determination, the Board considered all factors it believed relevant, including (i) the nature, extent, and quality of the services to be provided to the fund and its shareholders (including the investment performance of the fund); (ii) the competitiveness of the fund's management fee and total expenses; (iii) the total costs of the services to be provided by and the profits to be realized by Fidelity from its relationship with the fund; (iv) the extent to which economies of scale would be realized as the fund grows; and (v) whether fee levels reflect these economies of scale, if any, for the benefit of fund shareholders.
In considering whether to renew the Advisory Contracts for the fund, the Board reached a determination, with the assistance of fund counsel and Independent Trustees' counsel and through the exercise of its business judgment, that the renewal of the Advisory Contracts is in the best interests of fund shareholders and that the compensation to be received by Fidelity under the management contract is fair and reasonable. The Board's decision to renew the Advisory Contracts was not based on any single factor noted above, but rather was based on a comprehensive consideration of all the information provided to the Board at its meetings throughout the year. The Board, in reaching its determination to renew the Advisory Contracts, is aware that shareholders in the fund have a broad range of investment choices available to them, including a wide choice among mutual funds offered by Fidelity's competitors, and that the fund's shareholders, with the opportunity to review and weigh the disclosure provided by the fund in its prospectus and other public disclosures, have chosen to invest in this fund, managed by Fidelity.
Annual Report
Nature, Extent, and Quality of Services Provided. The Board considered the staffing within the investment adviser, FMR, and the sub-advisers (together, the Investment Advisers), including the backgrounds of the fund's investment personnel and the fund's investment objective and discipline. The Independent Trustees also had discussions with senior management of Fidelity's investment operations and investment groups. The Board considered the structure of the portfolio manager compensation program and whether this structure provides appropriate incentives to act in the best interest of the fund.
Resources Dedicated to Investment Management and Support Services. The Board and the equity research subcommittee of the Board's Fund Oversight Committee reviewed the size, education, and experience of the Investment Advisers' investment staff, their use of technology, and the Investment Advisers' approach to recruiting, training, and retaining portfolio managers and other research, advisory, and management personnel. The Board noted that Fidelity's analysts have access to a variety of technological tools and market and securities data that enable them to perform both fundamental and quantitative analysis and to specialize in various disciplines. The Board considered Fidelity's extensive global research capabilities that enable the Investment Advisers to aggregate data from various sources in an effort to produce positive investment results. The Board also considered that Fidelity's portfolio managers and analysts have access to daily portfolio attribution that allows for monitoring of a fund's portfolio, as well as an electronic communication system that provides immediate real-time access to research concerning issuers and credit enhancers. The Board noted FMR's continued focus on strengthening the organization and discipline of equity portfolio management and research.
Shareholder and Administrative Services. The Board considered (i) the nature, extent, quality, and cost of advisory, administrative, and shareholder services performed by the Investment Advisers and their affiliates under the Advisory Contracts and under separate agreements covering transfer agency, pricing and bookkeeping, and securities lending services for the fund; (ii) the nature and extent of the investment adviser's supervision of third party service providers, principally custodians and subcustodians; and (iii) the resources devoted to, and the record of compliance with, the fund's compliance policies and procedures. The Board also reviewed the allocation of fund brokerage, including allocations to brokers affiliated with the Investment Advisers, the use of brokerage commissions to pay fund expenses, and the use of "soft" commission dollars to pay for research services.
The Board noted that the growth of fund assets over time across the complex allows Fidelity to reinvest in the development of services designed to enhance the value or convenience of the Fidelity funds as investment vehicles. These services include 24-hour access to account information and market information through phone representatives and over the Internet, and investor education materials and asset allocation tools.
Annual Report
Board Approval of Investment Advisory Contracts and
Management Fees - continued
Investment in a Large Fund Family. The Board considered the benefits to shareholders of investing in a Fidelity fund, including the benefits of investing in a fund that is part of a large family of funds offering a variety of investment disciplines and providing a large variety of mutual fund investor services. The Board noted that Fidelity had taken, or had made recommendations that resulted in the Fidelity funds taking, a number of actions over the previous year that benefited particular funds, including (i) dedicating additional resources to investment research and restructuring and broadening the focus of the investment research teams; (ii) bolstering the senior management team that oversees asset management; (iii) launching Class F of certain funds as a lower-fee class available to Freedom K and Freedom Index Funds; (iv) lowering the initial investment minimums and ongoing balance requirements for Real Estate High Income Fund; (v) eliminating subsequent purchase minimums for all funds and adding a waiver of the investment minimum requirement for new accounts opened with the proceeds of a systematic withdrawal plan; (vi) eliminating the withdrawal minimum and maximum limits for systematic withdrawals from Advisor funds; (vii) expanding sales load waivers on Class A shares for Destiny Planholders and expanding Institutional Class eligibility for Class O Destiny Planholders; and (viii) changing certain Class A and Class T sales charge structures to further align them with industry practices.
Investment Performance. The Board considered whether the fund has operated in accordance with its investment objective, as well as its record of compliance with its investment restrictions. It also reviewed the fund's absolute investment performance for each class, as well as the fund's relative investment performance for each class measured against (i) a broad-based securities market index, and (ii) a custom peer group of mutual funds deemed appropriate by Fidelity and reviewed by the Board. Because the fund had been in existence less than three calendar years, the following chart considered by the Board shows, for the one-year period ended December 31, 2009, the total returns of the retail class and Class B of the fund, the total return of a broad-based securities market index ("benchmark"), and a range of total returns of a custom peer group of mutual funds defined by FMR based on categories assigned by Morningstar, Inc. The returns of the retail class and Class B show the performance of the highest and lowest performing classes, respectively. The box within the chart shows the 25th percentile return (bottom of box) and the 75th percentile return (top of box) of the peer group. Returns shown above the box are in the first quartile and returns shown below the box are in the fourth quartile. The percentage beaten numbers noted below the chart correspond to the percentile box and represent the percentage of funds in the peer group whose performance was equal to or lower than that of the class indicated. The fund's custom peer group, defined by FMR, is a peer group that FMR believes provides a more meaningful performance comparison than the peer group assigned by Morningstar, Inc., which assigns mutual funds to categories based on their investment styles as measured by their underlying portfolio holdings.
Annual Report
Fidelity International Growth Fund

The Board reviewed the fund's relative investment performance against its peer group and noted that the performance of the retail class of the fund was in the third quartile for the period shown. The Board also noted that the investment performance of the retail class of the fund compared favorably to its benchmark for the period shown. The Board considered that the variations in performance among the fund's classes reflect the variations in class expenses, which result in lower performance for higher expense classes. The Board also reviewed the fund's performance since inception as well as performance in the current year. The Board noted that it is difficult to evaluate in any comprehensive fashion the performance of the fund, in light of its relatively recent commencement of operations.
The Board also considered that the fund's management fee is subject to upward or downward adjustment depending upon whether, and to what extent, the fund's investment performance for the performance period exceeds, or is exceeded by, the record (over the same period) of a Board-approved performance adjustment index. The Board realizes that the performance adjustment provides FMR with a strong economic incentive to seek to achieve superior performance for the fund's shareholders and helps to more closely align the interests of FMR and the fund's shareholders.
Based on its review, and giving particular weight to the nature and quality of the resources dedicated by the Investment Advisers to maintain and improve relative performance and factoring in the unprecedented market events in recent years, the Board concluded that the nature, extent, and quality of investment management and support services and of shareholder and administrative services provided to the fund will benefit the fund's shareholders, particularly in light of the Board's view that the fund's shareholders benefit from investing in a fund that is part of a large family of funds offering a variety of investment disciplines and services.
Annual Report
Board Approval of Investment Advisory Contracts and
Management Fees - continued
Competitiveness of Management Fee and Total Fund Expenses. The Board considered the fund's management fee and total expenses compared to "mapped groups" of competitive funds and classes. Fidelity creates "mapped groups" by combining similar Lipper investment objective categories that have comparable management fee characteristics. Combining Lipper investment objective categories aids the Board's management fee and total expense comparisons by broadening the competitive group used for comparison and by reducing the number of universes to which various Fidelity funds are compared.
Management Fee. The Board considered two proprietary management fee comparisons for the 12-month (or shorter) periods shown in the chart below. The group of Lipper funds used by the Board for management fee comparisons is referred to below as the "Total Mapped Group." The Total Mapped Group comparison focuses on a fund's standing relative to the total universe of comparable funds available to investors, in terms of gross management fees before expense reimbursements or caps, and without giving effect to the fund's performance adjustment. "TMG %" represents the percentage of funds in the Total Mapped Group that had management fees that were lower than the fund's. For example, a TMG % of 15% means that 85% of the funds in the Total Mapped Group had higher management fees than the fund. The "Asset-Size Peer Group" (ASPG) comparison focuses on a fund's standing relative to non-Fidelity funds similar in size to the fund within the Total Mapped Group. The ASPG represents at least 15% of the funds in the Total Mapped Group with comparable asset size and management fee characteristics, subject to a minimum of 50 funds (or all funds in the Total Mapped Group if fewer than 50). Additional information, such as the ASPG quartile in which the fund's management fee ranked and the impact of the fund's performance adjustment, is also included in the chart and considered by the Board.
Annual Report
Fidelity International Growth Fund

The Board noted that the fund's management fee ranked below the median of its Total Mapped Group and below the median of its ASPG for 2009. The Board also noted the effect of the fund's positive performance adjustment on the fund's management fee ranking. The Board noted that the performance adjustment for each year represents calculations for performance periods that differ from the periods shown in the performance charts above.
Based on its review, the Board concluded that the fund's management fee is fair and reasonable in light of the services that the fund receives and the other factors considered.
Total Expenses. In its review of each class's total expenses, the Board considered the fund's management fee as well as other fund or class expenses, as applicable, such as transfer agent fees, pricing and bookkeeping fees, fund-paid 12b-1 fees, and custodial, legal, and audit fees. The Board also noted the effects of any waivers and reimbursements on fees and expenses, as well as the impact of the fund's performance adjustment. As part of its review, the Board also considered current and historical total expenses of each class of the fund compared to competitive fund median expenses. Each class of the fund is compared to those funds and classes in the Total Mapped Group (used by the Board for management fee comparisons) that have a similar sales load structure.
The Board noted that the total expenses of each of Class A and the retail class ranked below its competitive median for 2009, the total expenses of Class B ranked equal to its competitive median for 2009, and the total expenses of each of Class T, Class C, and Institutional Class ranked above its competitive median for 2009. The Board considered that the total expenses for Class T were above the median primarily because its 12b-1 fee is higher than the typical front-end load class. The Board noted that the fund offers multiple classes, each of which has a different sales load and 12b-1 fee structure, and that the multiple structures are intended to offer a range of pricing options for the intermediary market. The Board also noted that the total expenses of the classes vary primarily by the level of their 12b-1 fees, although differences in transfer agent fees may also cause expenses to vary from class to class.
Annual Report
Board Approval of Investment Advisory Contracts and
Management Fees - continued
Fees Charged to Other Fidelity Clients. The Board also considered Fidelity fee structures and other information with respect to clients of FMR and its affiliates, such as other mutual funds advised or subadvised by FMR or its affiliates, pension plan clients, and other institutional clients. In March 2010, the Board created an ad hoc joint committee with the board of other Fidelity funds (the Committee) to review and compare Fidelity's institutional investment advisory business with its business of providing services to the Fidelity funds, including the differences in services provided, fees charged, and costs incurred, as well as competition in their respective marketplaces.
Based on its review of total expenses and fees charged to other Fidelity clients, the Board concluded that the total expenses of each class of the fund were reasonable, although in some cases above the median of the universe presented for comparison, in light of the services that the fund and its shareholders receive and the other factors considered, including the findings of the Committee.
Costs of the Services and Profitability. The Board considered the revenues earned and the expenses incurred by Fidelity in conducting the business of developing, marketing, distributing, managing, administering and servicing the fund and its shareholders. The Board also considered the level of Fidelity's profits in respect of all the Fidelity funds.
On an annual basis, FMR presents to the Board Fidelity's profitability for the fund. Fidelity calculates the profitability for each fund, as well as aggregate profitability for groups of Fidelity funds and all Fidelity funds, using a series of detailed revenue and cost allocation methodologies which originate with the audited books and records of Fidelity. The Audit Committee of the Board reviews any significant changes from the prior year's methodologies.
PricewaterhouseCoopers LLP (PwC), independent registered public accounting firm and auditor to Fidelity and certain Fidelity funds, has been engaged annually by the Board as part of the Board's assessment of Fidelity's profitability analysis. PwC's engagement includes the review and assessment of Fidelity's methodologies used in determining the revenues and expenses attributable to Fidelity's mutual fund business, and completion of agreed-upon procedures surrounding the mathematical accuracy of fund profitability and its conformity to allocation methodologies. After considering PwC's reports issued under the engagement and information provided by Fidelity, the Board believes that while other allocation methods may also be reasonable, Fidelity's profitability methodologies are reasonable in all material respects.
Annual Report
The Board has also reviewed Fidelity's non-fund businesses and fall-out benefits related to the mutual fund business as well as cases where Fidelity's affiliates may benefit from or be related to the fund's business.
The Board considered the costs of the services provided by and the profits realized by Fidelity in connection with the operation of the fund and were satisfied that the profitability was not excessive in the circumstances.
Economies of Scale. The Board considered whether there have been economies of scale in respect of the management of the Fidelity funds, whether the Fidelity funds (including the fund) have appropriately benefited from any such economies of scale, and whether there is potential for realization of any further economies of scale. The Board considered the extent to which the fund will benefit from economies of scale through increased services to the fund, through waivers or reimbursements, or through fee or expense reductions.
In February 2009, the Board and the board of other Fidelity funds created an ad hoc committee (the Economies of Scale Committee) to analyze whether FMR attains economies of scale in respect of the management and servicing of the Fidelity funds, whether the Fidelity funds have appropriately benefited from such economies of scale, and whether there is potential for realization of any further economies of scale.
The Board recognized that the fund's management contract incorporates a "group fee" structure, which provides for lower group fee rates as total fund assets under FMR's management increase, and for higher group fee rates as total fund assets under FMR's management decrease. FMR calculates the group fee rates based on a tiered asset "breakpoint" schedule that varies based on asset class. The Board considered that the group fee is designed to deliver the benefits of economies of scale to fund shareholders when total Fidelity fund assets increase, even if assets of any particular fund are unchanged or have declined, because some portion of Fidelity's costs are attributable to services provided to all Fidelity funds, and all funds benefit if those costs can be allocated among more assets. The Board concluded that, given the group fee structure, fund shareholders will benefit from lower management fees as assets under FMR's management increase at the fund complex level, regardless of whether Fidelity achieves any such economies of scale.
The Board concluded, considering the findings of the Economies of Scale Committee, that any potential economies of scale are being appropriately shared between fund shareholders and Fidelity.
Additional Information Requested by the Board. In order to develop fully the factual basis for consideration of the Fidelity funds' Advisory Contracts, the Board requested and received additional information on certain topics, including (i) fund performance trends, actions to be taken by FMR to improve certain funds' overall performance, and Fidelity's long-term strategies for certain funds; (ii) portfolio manager changes that have occurred during the past year and length of portfolio manager tenure for different categories of funds over time; (iii) Fidelity's compensation structure for portfolio managers, research analysts, and other key personnel, the rationale for the compensation structure, and how the compensation structure provides appropriate performance incentives; (iv) the amount of the investment that each portfolio manager has made in the Fidelity fund(s) that he or she manages; (v) management and other fees paid by FMR to affiliated sub-advisers on behalf of the Fidelity funds; (vi) Fidelity's fee structures and rationale for recommending different fees among different categories of funds; (vii) Fidelity's rationale for recommending which funds should have a performance adjustment component as part of their management fees; (viii) the rationale for any differences between fund fee structures and fee structures in place for other Fidelity clients; and (ix) explanations regarding the relative total expenses borne by certain funds and classes, total expense competitive trends, and actions that might be taken by FMR to reduce total expenses for certain funds and classes.
Annual Report
Board Approval of Investment Advisory Contracts and
Management Fees - continued
Based on its evaluation of all of the conclusions noted above, and after considering all factors it believed relevant, the Board ultimately concluded that the advisory fee structures are fair and reasonable, and that the fund's Advisory Contracts should be renewed.
Annual Report
Investment Adviser
Fidelity Management & Research Company
Boston, MA
Investment Sub-Advisers
FMR Co., Inc.
Fidelity Management & Research
(U.K.) Inc.
Fidelity Management & Research
(Hong Kong) Limited
Fidelity Management & Research
(Japan) Inc.
Fidelity Research & Analysis Company
FIL Investment Advisors
FIL Investments (Japan) Limited
FIL Investment Advisors (UK) Ltd.
General Distributor
Fidelity Distributors Corporation
Boston, MA
Transfer and Service Agents
Fidelity Investments Institutional Operations Company, Inc.
Boston, MA
Fidelity Service Company, Inc.
Boston, MA
Custodian
State Street Bank and Trust Company
Quincy, MA
AIGF-UANN-1210
1.853348.102
(Fidelity Investment logo)(registered trademark)
Fidelity AdvisorSM
International Growth
Fund - Institutional Class
Annual Report
October 31, 2010
Institutional Class is
a class of Fidelity®
International Growth Fund
(2_fidelity_logos) (Registered_Trademark)
Contents
Chairman's Message | <Click Here> | The Chairman's message to shareholders. |
Performance | <Click Here> | How the fund has done over time. |
Management's Discussion of Fund Performance | <Click Here> | The Portfolio Manager's review of fund performance, strategy and outlook. |
Shareholder Expense Example | <Click Here> | An example of shareholder expenses. |
Investment Changes | <Click Here> | A summary of major shifts in the fund's investments over the past six months. |
Investments | <Click Here> | A complete list of the fund's investments with their market values. |
Financial Statements | <Click Here> | Statements of assets and liabilities, operations, and changes in net assets, as well as financial highlights. |
Notes | <Click Here> | Notes to financial statements. |
Report of Independent Registered Public Accounting Firm | <Click Here> | |
Trustees and Officers | <Click Here> | |
Distributions | <Click Here> | |
Board Approval of Investment Advisory Contracts and Management Fees | <Click Here> | |
To view a fund's proxy voting guidelines and proxy voting record for the 12-month period ended June 30, visit http://www.fidelity.com/proxyvotingresults or visit the Securities and Exchange Commission's (SEC) web site at http://www.sec.gov. You may also call 1-877-208-0098 to request a free copy of the proxy voting guidelines.
Standard & Poor's, S&P and S&P 500 are registered service marks of The McGraw-Hill Companies, Inc. and have been licensed for use by Fidelity Distributors Corporation.
Other third party marks appearing herein are the property of their respective owners.
All other marks appearing herein are registered or unregistered trademarks or service marks of FMR LLC or an affiliated company.
Annual Report
This report and the financial statements contained herein are submitted for the general information of the shareholders of the fund. This report is not authorized for distribution to prospective investors in the fund unless preceded or accompanied by an effective prospectus.
A fund files its complete schedule of portfolio holdings with the SEC for the first and third quarters of each fiscal year on Form N-Q. Forms N-Q are available on the SEC's web site at http://www.sec.gov. A fund's Forms N-Q may be reviewed and copied at the SEC's Public Reference Room in Washington, DC. Information regarding the operation of the SEC's Public Reference Room may be obtained by calling 1-800-SEC-0330. For a complete list of a fund's portfolio holdings, view the most recent holdings listing, semiannual report, or annual report on Fidelity's web site at http://www.fidelity.com or http://www.advisor.fidelity.com, as applicable.
NOT FDIC INSURED • MAY LOSE VALUE • NO BANK GUARANTEE
Neither the fund nor Fidelity Distributors Corporation is a bank.
Annual Report
(photo_of_Edward_C_Johnson_3d)
Dear Shareholder:
Equities have staged a rally in the second half of 2010, shaking off concerns about the European debt crisis and the possibility of a double-dip recession in the U.S. Although the short-term surge pushed major equity indexes back into positive territory for the year, several questions remain about the longer-term outlook, including lackluster economic growth and persistently high unemployment. Financial markets are always unpredictable, of course, but there also are several time-tested investment principles that can help put the odds in your favor.
One of the basic tenets is to invest for the long term. Over time, riding out the markets' inevitable ups and downs has proven much more effective than selling into panic or chasing the hottest trend. Even missing only a few of the markets' best days can significantly diminish investor returns. Patience also affords the benefits of compounding - of earning interest on additional income or reinvested dividends and capital gains. There can be tax advantages and cost benefits to consider as well. While staying the course doesn't eliminate risk, it can considerably lessen the effect of short-term declines.
You can further manage your investing risk through diversification. And today, more than ever, geographic diversification should be taken into account. Studies indicate that asset allocation is the single most important determinant of a portfolio's long-term success. The right mix of stocks, bonds and cash - aligned to your particular risk tolerance and investment objective - is very important. Age-appropriate rebalancing is also an essential aspect of asset allocation. For younger investors, an emphasis on equities - which historically have been the best-performing asset class over time - is encouraged. As investors near their specific goal, such as retirement or sending a child to college, consideration may be given to replacing volatile assets (e.g. common stocks) with more-stable fixed investments (bonds or savings plans).
A third principle - investing regularly - can help lower the average cost of your purchases. Investing a certain amount of money each month or quarter helps ensure you won't pay for all your shares at market highs. This strategy - known as dollar cost averaging - also reduces "emotion" from investing, helping shareholders avoid selling weak performers just prior to an upswing, or chasing a hot performer just before a correction.
We invite you to contact us via the Internet, through our Investor Centers or by phone. It is our privilege to provide you the information you need to make the investments that are right for you.
Sincerely,
(The chairman's signature appears here.)
Edward C. Johnson 3d
Annual Report
Average annual total return reflects the change in the value of an investment, assuming reinvestment of the class' distributions from dividend income and capital gains (the profits earned upon the sale of securities that have grown in value, if any) and assuming a constant rate of performance each year. The $10,000 table and the fund's returns do not reflect the deduction of taxes that a shareholder would pay on fund distributions or the redemption of fund shares. During periods of reimbursement by Fidelity, a fund's total return will be greater than it would be had the reimbursement not occurred. How a fund did yesterday is no guarantee of how it will do tomorrow.
Average Annual Total Returns
Periods ended October 31, 2010 | Past 1
year | Life of
fund A |
Institutional Class | 20.97% | -4.88% |
A From November 1, 2007.
$10,000 Over Life of Fund
Let's say hypothetically that $10,000 was invested in Fidelity AdvisorSM International Growth Fund - Institutional Class on November 1, 2007, when the fund started. The chart shows how the value of your investment would have changed, and also shows how the MSCI® EAFE® (Europe, Australasia, Far East) Growth Index performed over the same period.
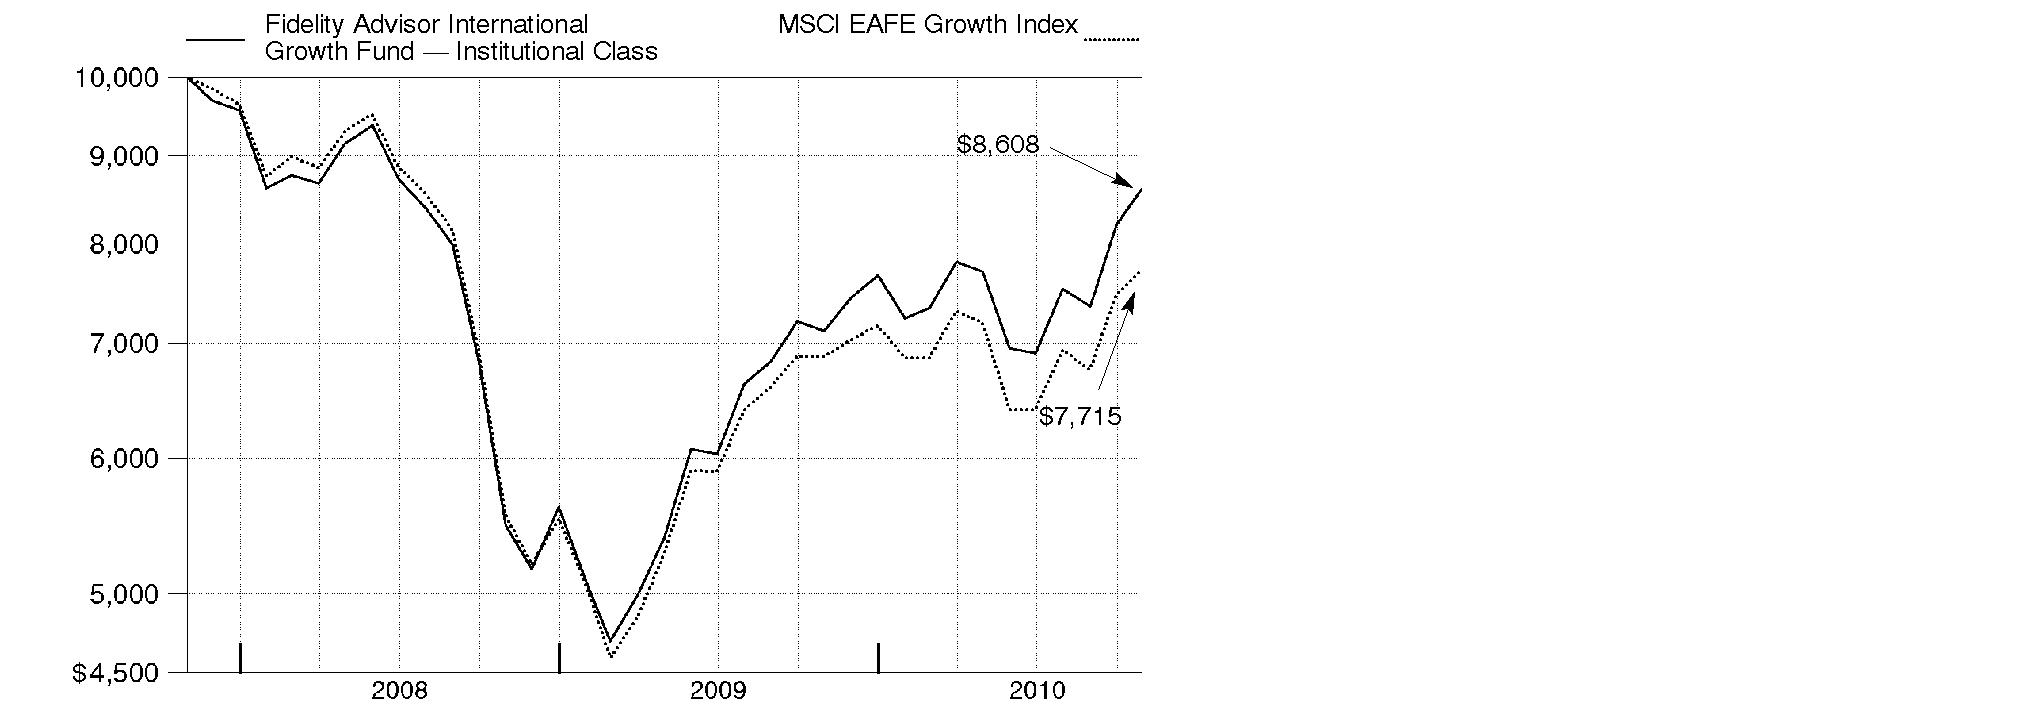
Annual Report
Market Recap: International stocks rode a wave of volatility similar to that of their U.S. counterparts during the 12 months ending October 31, 2010. Stocks gained modestly in the first half of the period, despite growing concerns about the European debt crisis. Sentiment turned decidedly negative in May and June, however, and the market suffered a precipitous decline. These losses were more than offset during the last four months of the period, when signs of economic growth and subsiding debt fears helped propel international stocks about 21%. For the full year, the MSCI® ACWI® (All Country World Index) ex USA Index gained 12.76%, boosted in part by a generally depreciating U.S. dollar. Within the index, Canada and emerging markets were standouts, returning 23% and 24%, respectively. Results in the latter group were led by strong-performing India, Mexico and South Africa, while China fell short of the MSCI benchmark due to cooling economic growth. The developed Asia ex Japan segment rose 16% for the period, lifted by solid results from Singapore and Hong Kong. Meanwhile, Europe rose just 9%, held back mainly by debt-riddled Spain and Italy, as well as lagging major constituent France. Japan returned only 5%, a result of that nation's continued weak economy.
Comments from Jed Weiss, Portfolio Manager of Fidelity AdvisorSM International Growth Fund: For the year, the fund's Institutional Class shares returned 20.97%, significantly outpacing the 12.24% return of the MSCI EAFE® (Europe, Australasia, Far East) Growth Index. Stock picking in almost every sector was favorable, most notably financials and consumer discretionary, followed by materials, industrials and consumer staples. Positioning in telecommunication services and utilities detracted modestly. In country terms, the fund's positioning in emerging markets - especially stock picking in Brazil, Turkey and South Africa - was helpful. Successful positioning in Japan and Hong Kong also contributed. In Europe, good security selection in Denmark, Spain and the U.K. outweighed weakness in Switzerland. Elsewhere, the fund's modest stake in global U.S. companies proved helpful. Top individual contributors included Autoliv, a U.S.-listed and Sweden-based auto-safety equipment maker; Novo Nordisk, a Danish health care company; and Belgian brewer Anheuser-Busch InBev. Also of note, among emerging-markets stocks, were Turkish bank Turkiye Garanti Bankasi and Brazilian chemicals company Braskem. Several of these stocks were not in the index. In terms of notable detractors, we lacked exposure to French luxury consumer goods companies LVMH and Richemont Cie Financiere - two strong-performing index components - and overweighted lagging Swiss drug maker Roche Holding.
The views expressed above reflect those of the portfolio manager(s) only through the end of the period as stated on the cover of this report and do not necessarily represent the views of Fidelity or any other person in the Fidelity organization. Any such views are subject to change at any time based upon market or other conditions and Fidelity disclaims any responsibility to update such views. These views may not be relied on as investment advice and, because investment decisions for a Fidelity fund are based on numerous factors, may not be relied on as an indication of trading intent on behalf of any Fidelity fund.
Annual Report
Shareholder Expense Example
As a shareholder of the Fund, you incur two types of costs: (1) transaction costs, including sales charges (loads) on purchase payments or redemption proceeds, redemption fees, and (2) ongoing costs, including management fees, distribution and/or service (12b-1) fees and other Fund expenses. This Example is intended to help you understand your ongoing costs (in dollars) of investing in the Fund and to compare these costs with the ongoing costs of investing in other mutual funds.
The Example is based on an investment of $1,000 invested at the beginning of the period and held for the entire period (May 1, 2010 to October 31, 2010).
Actual Expenses
The first line of the accompanying table for each class of the Fund provides information about actual account values and actual expenses. You may use the information in this line, together with the amount you invested, to estimate the expenses that you paid over the period. Simply divide your account value by $1,000.00 (for example, an $8,600 account value divided by $1,000.00 = 8.6), then multiply the result by the number in the first line for a class of the Fund under the heading entitled "Expenses Paid During Period" to estimate the expenses you paid on your account during this period. A small balance maintenance fee of $12.00 that is charged once a year may apply for certain accounts with a value of less than $2,000. This fee is not included in the table below. If it was, the estimate of expenses you paid during the period would be higher, and your ending account value lower, by this amount. In addition, the Fund, as a shareholder in the underlying Fidelity Central Funds, will indirectly bear its pro-rata share of the fees and expenses incurred by the underlying Fidelity Central Funds. These fees and expenses are not included in the Fund's annualized expense ratio used to calculate the expense estimate in the table below.
Hypothetical Example for Comparison Purposes
The second line of the accompanying table for each class of the Fund provides information about hypothetical account values and hypothetical expenses based on a Class' actual expense ratio and an assumed rate of return of 5% per year before expenses, which is not the Class' actual return. The hypothetical account values and expenses may not be used to estimate the actual ending account balance or expenses you paid for the period. You may use this information to compare the ongoing costs of investing in the Fund and other funds. To do so, compare this 5% hypothetical example with the 5% hypothetical examples that appear in the shareholder reports of the other funds. A small balance maintenance fee of $12.00 that is charged once a year may apply for certain accounts with a value of less than $2,000. This fee is not included in the table below. If it was, the estimate of expenses you paid during the period would be higher, and your ending account value lower, by this amount. In addition, the Fund, as a shareholder in the underlying Fidelity Central Funds, will indirectly bear its pro-rata share of the fees and expenses incurred by the underlying Fidelity Central Funds. These fees and expenses are not included in the Fund's annualized expense ratio used to calculate the expense estimate in the table below.
Annual Report
Shareholder Expense Example - continued
Please note that the expenses shown in the table are meant to highlight your ongoing costs only and do not reflect any transaction costs. Therefore, the second line of the table is useful in comparing ongoing costs only, and will not help you determine the relative total costs of owning different funds. In addition, if these transactional costs were included, your costs would have been higher.
| Annualized
Expense Ratio | Beginning
Account Value
May 1, 2010 | Ending
Account Value
October 31, 2010 | Expenses Paid
During Period*
May 1, 2010 to October 31, 2010 |
Class A | 1.50%** | | | |
Actual | | $ 1,000.00 | $ 1,115.80 | $ 8.00** |
Hypothetical A | | $ 1,000.00 | $ 1,017.64 | $ 7.63** |
Class T | 1.75%** | | | |
Actual | | $ 1,000.00 | $ 1,114.40 | $ 9.33** |
Hypothetical A | | $ 1,000.00 | $ 1,016.38 | $ 8.89** |
Class B | 2.25%** | | | |
Actual | | $ 1,000.00 | $ 1,111.70 | $ 11.98** |
Hypothetical A | | $ 1,000.00 | $ 1,013.86 | $ 11.42** |
Class C | 2.25%** | | | |
Actual | | $ 1,000.00 | $ 1,112.00 | $ 11.98** |
Hypothetical A | | $ 1,000.00 | $ 1,013.86 | $ 11.42** |
International Growth | 1.25%** | | | |
Actual | | $ 1,000.00 | $ 1,117.00 | $ 6.67** |
Hypothetical A | | $ 1,000.00 | $ 1,018.90 | $ 6.36** |
Institutional Class | 1.25%** | | | |
Actual | | $ 1,000.00 | $ 1,117.00 | $ 6.67** |
Hypothetical A | | $ 1,000.00 | $ 1,018.90 | $ 6.36** |
A 5% return per year before expenses
* Expenses are equal to each Class' annualized expense ratio, multiplied by the average account value over the period, multiplied by 184/365 (to reflect the one-half year period).
Annual Report
** If changes to voluntary expense limitations, effective November 1, 2010, had been in effect during the entire period, the annualized expense ratios and the expenses paid in the actual and hypothetical examples above would have been as follows:
| Annualized
Expense Ratio | Expenses Paid |
Class A | 1.45% | |
Actual | | $ 7.73 |
Hypothetical A | | $ 7.38 |
Class T | 1.70% | |
Actual | | $ 9.06 |
Hypothetical A | | $ 8.64 |
Class B | 2.20% | |
Actual | | $ 11.71 |
Hypothetical A | | $ 11.17 |
Class C | 2.20% | |
Actual | | $ 11.71 |
Hypothetical A | | $ 11.17 |
International Growth | 1.20% | |
Actual | | $ 6.40 |
Hypothetical A | | $ 6.11 |
Institutional Class | 1.20% | |
Actual | | $ 6.40 |
Hypothetical A | | $ 6.11 |
A 5% return per year before expenses
Annual Report
Investment Changes (Unaudited)
Geographic Diversification (% of fund's net assets) |
As of October 31, 2010 |
| United Kingdom 19.7% | |
| United States of America 12.9% | |
| Switzerland 11.8% | |
| Japan 8.1% | |
| Australia 5.3% | |
| Germany 4.1% | |
| Belgium 3.5% | |
| Brazil 3.1% | |
| France 2.9% | |
| Other 28.6% | |

Percentages are adjusted for the effect of futures contracts, if applicable. |
As of April 30, 2010 |
| United Kingdom 19.0% | |
| Switzerland 13.0% | |
| United States of America 11.7% | |
| Japan 9.3% | |
| Australia 4.2% | |
| Brazil 3.7% | |
| Spain 3.6% | |
| Belgium 3.3% | |
| Germany 3.0% | |
| Other 29.2% | |

Percentages are adjusted for the effect of futures contracts, if applicable. |
Asset Allocation |
| % of fund's
net assets | % of fund's net assets
6 months ago |
Stocks and Investment Companies | 98.2 | 98.1 |
Short-Term Investments and Net Other Assets | 1.8 | 1.9 |
Top Ten Stocks as of October 31, 2010 |
| % of fund's
net assets | % of fund's net assets
6 months ago |
Nestle SA (Switzerland, Food Products) | 4.6 | 4.0 |
BHP Billiton PLC ADR (United Kingdom, Metals & Mining) | 4.4 | 3.4 |
Anheuser-Busch InBev SA NV (Belgium, Beverages) | 2.9 | 2.7 |
Rio Tinto PLC (United Kingdom, Metals & Mining) | 2.1 | 2.3 |
Roche Holding AG (participation certificate) (Switzerland, Pharmaceuticals) | 2.1 | 3.0 |
Novo Nordisk AS Series B sponsored ADR (Denmark, Pharmaceuticals) | 2.0 | 1.6 |
BG Group PLC (United Kingdom, Oil, Gas & Consumable Fuels) | 1.9 | 1.8 |
Visa, Inc. Class A (United States of America, IT Services) | 1.9 | 2.0 |
Siemens AG sponsored ADR (Germany, Industrial Conglomerates) | 1.9 | 0.4 |
Standard Chartered PLC (United Kingdom, Commercial Banks) | 1.9 | 1.7 |
| 25.7 | |
Market Sectors as of October 31, 2010 |
| % of fund's
net assets | % of fund's net assets
6 months ago |
Consumer Staples | 17.8 | 17.1 |
Materials | 16.9 | 16.2 |
Financials | 13.4 | 16.4 |
Industrials | 12.3 | 10.7 |
Consumer Discretionary | 11.8 | 11.3 |
Health Care | 11.3 | 10.9 |
Information Technology | 8.4 | 6.6 |
Energy | 4.8 | 4.6 |
Telecommunication Services | 0.5 | 2.8 |
Utilities | 0.0 | 0.3 |
Annual Report
Investments October 31, 2010
Showing Percentage of Net Assets
Common Stocks - 97.2% |
| Shares | | Value |
Australia - 5.3% |
CSL Ltd. | 11,708 | | $ 376,551 |
Leighton Holdings Ltd. (d) | 9,176 | | 329,906 |
MAp Group unit | 21,718 | | 64,892 |
Newcrest Mining Ltd. | 1,155 | | 45,215 |
Newcrest Mining Ltd. sponsored ADR | 6,907 | | 272,136 |
OZ Minerals Ltd. | 134,053 | | 205,524 |
Woolworths Ltd. | 12,499 | | 347,136 |
Worleyparsons Ltd. | 7,835 | | 176,154 |
TOTAL AUSTRALIA | | 1,817,514 |
Austria - 0.4% |
Andritz AG | 2,000 | | 153,171 |
Bailiwick of Guernsey - 0.5% |
Resolution Ltd. | 44,093 | | 185,016 |
Bailiwick of Jersey - 0.9% |
Informa PLC | 17,433 | | 121,776 |
Randgold Resources Ltd. sponsored ADR | 1,835 | | 172,343 |
TOTAL BAILIWICK OF JERSEY | | 294,119 |
Belgium - 3.5% |
Anheuser-Busch InBev SA NV | 15,920 | | 997,610 |
Umicore SA | 4,480 | | 210,824 |
TOTAL BELGIUM | | 1,208,434 |
Bermuda - 1.2% |
Lazard Ltd. Class A | 3,800 | | 140,220 |
Seadrill Ltd. (d) | 6,900 | | 208,909 |
Trinity Ltd. | 70,000 | | 69,989 |
TOTAL BERMUDA | | 419,118 |
Brazil - 3.1% |
Banco ABC Brasil SA | 13,000 | | 128,074 |
BM&F Bovespa SA | 25,700 | | 215,274 |
BR Malls Participacoes SA | 9,300 | | 88,834 |
Braskem SA Class A sponsored ADR (d) | 12,300 | | 256,455 |
Fibria Celulose SA sponsored ADR (a) | 3,903 | | 70,098 |
Iguatemi Empresa de Shopping Centers SA | 2,800 | | 65,342 |
Itau Unibanco Banco Multiplo SA ADR | 7,030 | | 172,657 |
Multiplan Empreendimentos Imobiliarios SA | 3,300 | | 75,652 |
TOTAL BRAZIL | | 1,072,386 |
Common Stocks - continued |
| Shares | | Value |
Canada - 2.8% |
Agnico-Eagle Mines Ltd. (Canada) | 2,300 | | $ 178,380 |
Fairfax Financial Holdings Ltd. (sub. vtg.) | 150 | | 61,357 |
Goldcorp, Inc. | 1,500 | | 66,977 |
Niko Resources Ltd. | 2,700 | | 257,584 |
Open Text Corp. (a) | 2,700 | | 119,447 |
Pan American Silver Corp. | 4,200 | | 134,064 |
Petrobank Energy & Resources Ltd. (a) | 3,400 | | 135,313 |
TOTAL CANADA | | 953,122 |
Cayman Islands - 0.9% |
Alibaba.com Ltd. (a) | 37,000 | | 72,270 |
China Lilang Ltd. | 46,000 | | 71,926 |
Wynn Macau Ltd. | 69,200 | | 153,019 |
TOTAL CAYMAN ISLANDS | | 297,215 |
Chile - 0.5% |
Banco Santander Chile sponsored ADR | 1,900 | | 176,016 |
China - 0.5% |
Baidu.com, Inc. sponsored ADR (a) | 1,680 | | 184,817 |
Denmark - 2.5% |
Novo Nordisk AS Series B sponsored ADR | 6,500 | | 681,200 |
William Demant Holding AS (a) | 2,300 | | 172,400 |
TOTAL DENMARK | | 853,600 |
Finland - 1.9% |
Metso Corp. | 4,400 | | 208,589 |
Nokian Tyres PLC | 7,300 | | 252,924 |
Outotec OYJ | 4,000 | | 186,677 |
TOTAL FINLAND | | 648,190 |
France - 2.9% |
Alstom SA | 3,613 | | 182,290 |
Danone | 5,852 | | 370,292 |
Remy Cointreau SA | 2,190 | | 153,766 |
Safran SA | 9,600 | | 304,293 |
TOTAL FRANCE | | 1,010,641 |
Germany - 4.1% |
Bayerische Motoren Werke AG (BMW) | 1,255 | | 89,950 |
Linde AG | 3,266 | | 470,126 |
Common Stocks - continued |
| Shares | | Value |
Germany - continued |
MAN SE | 1,702 | | $ 187,092 |
Siemens AG sponsored ADR | 5,800 | | 662,998 |
TOTAL GERMANY | | 1,410,166 |
Hong Kong - 1.2% |
Hong Kong Exchanges and Clearing Ltd. | 18,300 | | 402,771 |
Ireland - 1.0% |
CRH PLC sponsored ADR (d) | 11,300 | | 199,671 |
James Hardie Industries NV sponsored ADR (a) | 5,000 | | 132,900 |
TOTAL IRELAND | | 332,571 |
Italy - 1.8% |
Azimut Holdings SpA | 16,215 | | 165,382 |
Fiat SpA | 18,900 | | 319,789 |
Saipem SpA | 3,325 | | 147,726 |
TOTAL ITALY | | 632,897 |
Japan - 8.1% |
Autobacs Seven Co. Ltd. | 3,900 | | 146,123 |
Denso Corp. | 9,100 | | 282,993 |
Fanuc Ltd. | 3,000 | | 434,309 |
Fast Retailing Co. Ltd. | 1,300 | | 170,289 |
Japan Steel Works Ltd. | 17,000 | | 162,198 |
Keyence Corp. | 1,220 | | 302,461 |
Kobayashi Pharmaceutical Co. Ltd. | 3,900 | | 181,745 |
MS&AD Insurance Group Holdings, Inc. | 5,300 | | 126,972 |
Nippon Thompson Co. Ltd. | 19,000 | | 131,751 |
Osaka Securities Exchange Co. Ltd. | 28 | | 140,922 |
Shiseido Co. Ltd. | 9,100 | | 189,986 |
SHO-BOND Holdings Co. Ltd. | 3,500 | | 74,898 |
USS Co. Ltd. | 3,340 | | 259,828 |
Yamato Kogyo Co. Ltd. | 7,600 | | 194,935 |
TOTAL JAPAN | | 2,799,410 |
Korea (South) - 0.7% |
NHN Corp. (a) | 1,444 | | 256,183 |
Mexico - 1.0% |
Wal-Mart de Mexico SA de CV Series V | 130,600 | | 357,206 |
Netherlands - 2.2% |
ASM International NV unit (a) | 6,100 | | 155,855 |
ASML Holding NV | 8,300 | | 275,477 |
Common Stocks - continued |
| Shares | | Value |
Netherlands - continued |
Koninklijke KPN NV | 10,886 | | $ 181,768 |
QIAGEN NV (a) | 7,500 | | 141,075 |
TOTAL NETHERLANDS | | 754,175 |
Peru - 0.2% |
Compania de Minas Buenaventura SA sponsored ADR | 1,500 | | 79,560 |
Portugal - 0.5% |
Jeronimo Martins SGPS SA | 12,375 | | 185,623 |
Singapore - 1.1% |
City Developments Ltd. | 10,000 | | 98,277 |
Singapore Exchange Ltd. | 32,000 | | 217,569 |
Wing Tai Holdings Ltd. | 44,000 | | 59,492 |
TOTAL SINGAPORE | | 375,338 |
South Africa - 2.1% |
African Rainbow Minerals Ltd. | 9,939 | | 253,560 |
Clicks Group Ltd. | 26,686 | | 174,096 |
JSE Ltd. | 11,000 | | 124,053 |
Mr Price Group Ltd. | 20,200 | | 183,572 |
TOTAL SOUTH AFRICA | | 735,281 |
Spain - 1.3% |
Inditex SA (d) | 3,515 | | 293,506 |
Prosegur Compania de Seguridad SA (Reg.) | 2,600 | | 155,781 |
TOTAL SPAIN | | 449,287 |
Sweden - 1.5% |
H&M Hennes & Mauritz AB (B Shares) | 11,217 | | 395,187 |
Swedish Match Co. | 4,300 | | 120,152 |
TOTAL SWEDEN | | 515,339 |
Switzerland - 11.8% |
Credit Suisse Group sponsored ADR | 4,320 | | 179,280 |
Nestle SA | 28,730 | | 1,573,166 |
Novartis AG sponsored ADR (d) | 11,200 | | 649,040 |
Roche Holding AG (participation certificate) | 4,835 | | 709,765 |
Sonova Holding AG Class B | 3,225 | | 373,495 |
The Swatch Group AG: | | | |
(Bearer) | 910 | | 347,692 |
(Reg.) | 228 | | 15,843 |
Common Stocks - continued |
| Shares | | Value |
Switzerland - continued |
UBS AG (a) | 4,483 | | $ 76,132 |
UBS AG (NY Shares) (a) | 8,700 | | 148,074 |
TOTAL SWITZERLAND | | 4,072,487 |
Turkey - 1.9% |
Anadolu Efes Biracilik ve Malt Sanayii AS | 7,800 | | 124,535 |
Asya Katilim Bankasi AS | 27,000 | | 69,651 |
Coca-Cola Icecek AS | 10,000 | | 128,286 |
Turkiye Garanti Bankasi AS | 53,500 | | 328,244 |
TOTAL TURKEY | | 650,716 |
United Kingdom - 19.7% |
Anglo American PLC: | | | |
ADR | 9,800 | | 227,850 |
(United Kingdom) | 1,800 | | 83,863 |
Babcock International Group PLC | 18,100 | | 168,194 |
BAE Systems PLC | 20,800 | | 114,870 |
BG Group PLC | 34,652 | | 674,818 |
BHP Billiton PLC ADR | 21,300 | | 1,508,040 |
Cobham PLC | 27,100 | | 100,557 |
GlaxoSmithKline PLC sponsored ADR | 11,300 | | 441,152 |
Imperial Tobacco Group PLC | 4,318 | | 138,293 |
InterContinental Hotel Group PLC ADR (d) | 13,755 | | 266,159 |
Johnson Matthey PLC | 6,924 | | 212,326 |
Mothercare PLC | 8,900 | | 74,932 |
Reckitt Benckiser Group PLC | 6,045 | | 338,103 |
Rio Tinto PLC | 2,735 | | 177,617 |
Rio Tinto PLC sponsored ADR (d) | 8,700 | | 566,544 |
Serco Group PLC | 30,103 | | 296,129 |
Shaftesbury PLC | 19,733 | | 141,004 |
Standard Chartered PLC: | | | |
rights 11/5/10 (a) | 2,619 | | 22,050 |
(United Kingdom) | 21,917 | | 633,989 |
Tesco PLC | 71,253 | | 487,283 |
Unite Group PLC (a) | 18,800 | | 62,650 |
Victrex PLC | 3,600 | | 74,462 |
TOTAL UNITED KINGDOM | | 6,810,885 |
United States of America - 10.1% |
Allergan, Inc. | 1,900 | | 137,579 |
Autoliv, Inc. | 4,300 | | 306,590 |
Berkshire Hathaway, Inc. Class B (a) | 2,000 | | 159,120 |
Cymer, Inc. (a) | 2,000 | | 73,900 |
Common Stocks - continued |
| Shares | | Value |
United States of America - continued |
eBay, Inc. (a) | 2,600 | | $ 77,506 |
Google, Inc. Class A (a) | 220 | | 134,858 |
ION Geophysical Corp. (a) | 14,800 | | 72,372 |
JPMorgan Chase & Co. | 3,818 | | 143,671 |
Juniper Networks, Inc. (a) | 18,600 | | 602,454 |
Martin Marietta Materials, Inc. | 900 | | 72,432 |
Mead Johnson Nutrition Co. Class A | 4,500 | | 264,690 |
Mohawk Industries, Inc. (a) | 2,600 | | 149,084 |
Philip Morris International, Inc. | 3,100 | | 181,350 |
ResMed, Inc. (a) | 5,500 | | 175,285 |
Union Pacific Corp. | 2,900 | | 254,272 |
Visa, Inc. Class A | 8,500 | | 664,445 |
TOTAL UNITED STATES OF AMERICA | | 3,469,608 |
TOTAL COMMON STOCKS (Cost $28,745,190) | 33,562,862 |
Investment Companies - 1.0% |
| | | |
United States of America - 1.0% |
iShares MSCI EAFE Growth Index ETF
(Cost $352,099) | 6,000 | | 352,800 |
Money Market Funds - 7.1% |
| | | |
Fidelity Securities Lending Cash Central Fund, 0.24% (b)(c)
(Cost $2,457,002) | 2,457,002 | | 2,457,002 |
Cash Equivalents - 2.0% |
| Maturity Amount | | Value |
Investments in repurchase agreements in a joint trading account at 0.22%, dated 10/29/10 due 11/1/10 (Collateralized by U.S. Treasury Obligations) #
(Cost $685,000) | $ 685,012 | | $ 685,000 |
TOTAL INVESTMENT PORTFOLIO - 107.3% (Cost $32,239,291) | | 37,057,664 |
NET OTHER ASSETS (LIABILITIES) - (7.3)% | | (2,530,931) |
NET ASSETS - 100% | $ 34,526,733 |
Security Type Abbreviations |
ETF | - | Exchange-Traded Funds |
Legend |
(a) Non-income producing |
(b) Affiliated fund that is available only to investment companies and other accounts managed by Fidelity Investments. The rate quoted is the annualized seven-day yield of the fund at period end. A complete unaudited listing of the fund's holdings as of its most recent quarter end is available upon request. In addition, each Fidelity Central Fund's financial statements, which are not covered by the Fund's report of Independent Registered Public Accounting Firm, are available on the SEC's website or upon request. |
(c) Investment made with cash collateral received from securities on loan. |
(d) Security or a portion of the security is on loan at period end. |
# Additional information on each counterparty to the repurchase agreement is as follows: |
Repurchase Agreement / Counterparty | Value |
$685,000 due 11/01/10 at 0.22% |
BNP Paribas Securities Corp. | $ 114,147 |
Barclays Capital, Inc. | 171,114 |
Credit Agricole Securities (USA), Inc. | 29,506 |
Credit Suisse Securities (USA) LLC | 31,533 |
Deutsche Bank Securities, Inc. | 52,922 |
HSBC Securities (USA), Inc. | 52,922 |
J.P. Morgan Securities,
Inc. | 141,125 |
Mizuho Securities USA, Inc. | 35,281 |
Societe Generale, New York Branch | 35,281 |
UBS Securities LLC | 17,641 |
Wells Fargo Securities LLC | 3,528 |
| $ 685,000 |
Affiliated Central Funds |
Information regarding fiscal year to date income earned by the Fund from investments in Fidelity Central Funds is as follows: |
Fund | Income earned |
Fidelity Securities Lending Cash Central Fund | $ 13,302 |
Other Information |
The following is a summary of the inputs used, as of October 31, 2010, involving the Fund's assets and liabilities carried at fair value. The inputs or methodology used for valuing securities may not be an indication of the risk associated with investing in those securities. For more information on valuation inputs, and their aggregation into the levels used in the table below, please refer to the Security Valuation section in the accompanying Notes to Financial Statements. |
Valuation Inputs at Reporting Date: |
Description | Total | Level 1 | Level 2 | Level 3 |
Investments in Securities: | | | | |
Equities: | | | | |
United Kingdom | $ 6,810,885 | $ 6,633,268 | $ 177,617 | $ - |
Switzerland | 4,072,487 | 3,996,355 | 76,132 | - |
United States of America | 3,469,608 | 3,469,608 | - | - |
Japan | 2,799,410 | 1,432,663 | 1,366,747 | - |
Australia | 1,817,514 | 1,817,514 | - | - |
Germany | 1,410,166 | 1,410,166 | - | - |
Belgium | 1,208,434 | 1,208,434 | - | - |
Brazil | 1,072,386 | 1,072,386 | - | - |
France | 1,010,641 | 1,010,641 | - | - |
Other | 9,891,331 | 9,891,331 | - | - |
Investment Companies | 352,800 | 352,800 | - | - |
Money Market Funds | 2,457,002 | 2,457,002 | - | - |
Cash Equivalents | 685,000 | - | 685,000 | - |
Total Investments in Securities: | $ 37,057,664 | $ 34,752,168 | $ 2,305,496 | $ - |
Income Tax Information |
At October 31, 2010, the Fund had a capital loss carryforward of approximately $6,290,360 of which $3,493,858 and $2,796,502 will expire on October 31, 2016 and 2017, respectively. Capital loss carryforwards are only available to offset future capital gains of the Fund to the extent provided by regulations and may be limited. |
See accompanying notes which are an integral part of the financial statements.
Annual Report
Statement of Assets and Liabilities
| October 31, 2010 |
| | |
Assets | | |
Investment in securities, at value (including securities loaned of $2,381,885 and repurchase agreements of $685,000) - See accompanying schedule: Unaffiliated issuers (cost $29,782,289) | $ 34,600,662 | |
Fidelity Central Funds (cost $2,457,002) | 2,457,002 | |
Total Investments (cost $32,239,291) | | $ 37,057,664 |
Cash | | 677 |
Foreign currency held at value (cost $212) | | 212 |
Receivable for investments sold | | 253,142 |
Receivable for fund shares sold | | 115,106 |
Dividends receivable | | 73,680 |
Distributions receivable from Fidelity Central Funds | | 943 |
Receivable from investment adviser for expense reductions | | 42,846 |
Other receivables | | 1,353 |
Total assets | | 37,545,623 |
| | |
Liabilities | | |
Payable for investments purchased | $ 442,776 | |
Payable for fund shares redeemed | 30,235 | |
Accrued management fee | 23,253 | |
Distribution and service plan fees payable | 2,473 | |
Other affiliated payables | 8,855 | |
Other payables and accrued expenses | 54,296 | |
Collateral on securities loaned, at value | 2,457,002 | |
Total liabilities | | 3,018,890 |
| | |
Net Assets | | $ 34,526,733 |
Net Assets consist of: | | |
Paid in capital | | $ 36,253,596 |
Undistributed net investment income | | 237,573 |
Accumulated undistributed net realized gain (loss) on investments and foreign currency transactions | | (6,786,731) |
Net unrealized appreciation (depreciation) on investments and assets and liabilities in foreign currencies | | 4,822,295 |
Net Assets | | $ 34,526,733 |
See accompanying notes which are an integral part of the financial statements.
Annual Report
Statement of Assets and Liabilities - continued
| October 31, 2010 |
| | |
Calculation of Maximum Offering Price Class A:
Net Asset Value and redemption price per share ($3,083,779 ÷ 367,982 shares) | | $ 8.38 |
| | |
Maximum offering price per share (100/94.25 of $8.38) | | $ 8.89 |
Class T:
Net Asset Value and redemption price per share ($1,033,538 ÷ 123,323 shares) | | $ 8.38 |
| | |
Maximum offering price per share (100/96.50 of $8.38) | | $ 8.68 |
Class B:
Net Asset Value and offering price per share ($581,201 ÷ 69,527 shares)A | | $ 8.36 |
| | |
Class C:
Net Asset Value and offering price per share ($1,260,789 ÷ 151,261 shares)A | | $ 8.34 |
| | |
International Growth:
Net Asset Value, offering price and redemption price per share ($28,454,384 ÷ 3,385,414 shares) | | $ 8.40 |
| | |
Institutional Class:
Net Asset Value, offering price and redemption price per share ($113,042 ÷ 13,455 shares) | | $ 8.40 |
A Redemption price per share is equal to net asset value less any applicable contingent deferred sales charge.
See accompanying notes which are an integral part of the financial statements.
Annual Report
Financial Statements - continued
Statement of Operations
| Year ended October 31, 2010 |
| | |
Investment Income | | |
Dividends | | $ 637,165 |
Interest | | 706 |
Income from Fidelity Central Funds | | 13,302 |
Income before foreign taxes withheld | | 651,173 |
Less foreign taxes withheld | | (47,674) |
Total income | | 603,499 |
| | |
Expenses | | |
Management fee
Basic fee | $ 192,364 | |
Performance adjustment | 29,103 | |
Transfer agent fees | 85,306 | |
Distribution and service plan fees | 24,292 | |
Accounting and security lending fees | 14,333 | |
Custodian fees and expenses | 55,804 | |
Independent trustees' compensation | 148 | |
Registration fees | 73,332 | |
Audit | 62,652 | |
Legal | 191 | |
Miscellaneous | 300 | |
Total expenses before reductions | 537,825 | |
Expense reductions | (178,649) | 359,176 |
Net investment income (loss) | | 244,323 |
Realized and Unrealized Gain (Loss) Net realized gain (loss) on: | | |
Investment securities: | | |
Unaffiliated issuers | 1,690,565 | |
Foreign currency transactions | (561) | |
Total net realized gain (loss) | | 1,690,004 |
Change in net unrealized appreciation (depreciation) on: Investment securities | 3,219,080 | |
Assets and liabilities in foreign currencies | 2,715 | |
Total change in net unrealized appreciation (depreciation) | | 3,221,795 |
Net gain (loss) | | 4,911,799 |
Net increase (decrease) in net assets resulting from operations | | $ 5,156,122 |
See accompanying notes which are an integral part of the financial statements.
Annual Report
Statement of Changes in Net Assets
| Year ended
October 31,
2010 | Year ended
October 31,
2009 |
Increase (Decrease) in Net Assets | | |
Operations | | |
Net investment income (loss) | $ 244,323 | $ 175,103 |
Net realized gain (loss) | 1,690,004 | (2,934,897) |
Change in net unrealized appreciation (depreciation) | 3,221,795 | 7,705,769 |
Net increase (decrease) in net assets resulting
from operations | 5,156,122 | 4,945,975 |
Distributions to shareholders from net investment income | (167,219) | (188,551) |
Distributions to shareholders from net realized gain | (78,510) | - |
Total distributions | (245,729) | (188,551) |
Share transactions - net increase (decrease) | 8,231,990 | 1,563,086 |
Redemption fees | 2,560 | 3,195 |
Total increase (decrease) in net assets | 13,144,943 | 6,323,705 |
| | |
Net Assets | | |
Beginning of period | 21,381,790 | 15,058,085 |
End of period (including undistributed net investment income of $237,573 and undistributed net investment income of $167,884, respectively) | $ 34,526,733 | $ 21,381,790 |
See accompanying notes which are an integral part of the financial statements.
Annual Report
Financial Highlights - Class A
Years ended October 31, | 2010 | 2009 | 2008 F |
Selected Per-Share Data | | | |
Net asset value, beginning of period | $ 7.01 | $ 5.46 | $ 10.00 |
Income from Investment Operations | | | |
Net investment income (loss) C | .05 | .05 | .07 |
Net realized and unrealized gain (loss) | 1.39 | 1.55 | (4.61) |
Total from investment operations | 1.44 | 1.60 | (4.54) |
Distributions from net investment income | (.05) | (.05) | - |
Distributions from net realized gain | (.03) | - | - |
Total distributions | (.07) I | (.05) | - |
Redemption fees added to paid in capital C,H | - | - | - |
Net asset value, end of period | $ 8.38 | $ 7.01 | $ 5.46 |
Total Return A,B | 20.68% | 29.72% | (45.40)% |
Ratios to Average Net Assets D,G | | | |
Expenses before reductions | 2.13% | 2.46% | 2.88% |
Expenses net of fee waivers, if any | 1.50% | 1.50% | 1.50% |
Expenses net of all reductions | 1.48% | 1.47% | 1.48% |
Net investment income (loss) | .74% | .85% | .80% |
Supplemental Data | | | |
Net assets, end of period (000 omitted) | $ 3,084 | $ 1,452 | $ 820 |
Portfolio turnover rate E | 87% | 116% | 115% |
A Total returns would have been lower had certain expenses not been reduced during the periods shown.
B Total returns do not include the effect of the sales charges.
C Calculated based on average shares outstanding during the period.
D Fees and expenses of the underlying Fidelity Central Funds are not included in the Fund's expense ratio. The Fund indirectly bears its proportionate share of the expenses of any underlying Fidelity Central Funds.
E Amount does not include the portfolio activity of any underlying Fidelity Central Funds.
F For the period November 1, 2007 (commencement of operations) to October 31, 2008.
G Expense ratios reflect operating expenses of the class. Expenses before reductions do not reflect amounts reimbursed by the investment adviser or reductions from brokerage service arrangements or reductions from other expense offset arrangements and do not represent the amount paid by the class during periods when reimbursements or reductions occur. Expense ratios before reductions for start-up periods may not be representative of longer-term operating periods. Expenses net of fee waivers reflect expenses after reimbursement by the investment adviser but prior to reductions from brokerage service arrangements or other expense offset arrangements. Expenses net of all reductions represent the net expenses paid by the class.
H Amount represents less than $.01 per share.
I Total distributions of $.07 per share is comprised of distributions from net investment income of $.046 and distributions from net realized gain of $.025 per share.
See accompanying notes which are an integral part of the financial statements.
Annual Report
Financial Highlights - Class T
Years ended October 31, | 2010 | 2009 | 2008 F |
Selected Per-Share Data | | | |
Net asset value, beginning of period | $ 7.00 | $ 5.45 | $ 10.00 |
Income from Investment Operations | | | |
Net investment income (loss) C | .04 | .03 | .05 |
Net realized and unrealized gain (loss) | 1.39 | 1.55 | (4.60) |
Total from investment operations | 1.43 | 1.58 | (4.55) |
Distributions from net investment income | (.02) | (.03) | - |
Distributions from net realized gain | (.03) | - | - |
Total distributions | (.05) | (.03) | - |
Redemption fees added to paid in capital C,H | - | - | - |
Net asset value, end of period | $ 8.38 | $ 7.00 | $ 5.45 |
Total Return A,B | 20.47% | 29.22% | (45.50)% |
Ratios to Average Net Assets D,G | | | |
Expenses before reductions | 2.41% | 2.67% | 3.07% |
Expenses net of fee waivers, if any | 1.75% | 1.75% | 1.75% |
Expenses net of all reductions | 1.73% | 1.73% | 1.73% |
Net investment income (loss) | .49% | .59% | .55% |
Supplemental Data | | | |
Net assets, end of period (000 omitted) | $ 1,034 | $ 532 | $ 507 |
Portfolio turnover rate E | 87% | 116% | 115% |
A Total returns would have been lower had certain expenses not been reduced during the periods shown.
B Total returns do not include the effect of the sales charges.
C Calculated based on average shares outstanding during the period.
D Fees and expenses of the underlying Fidelity Central Funds are not included in the Fund's expense ratio. The Fund indirectly bears its proportionate share of the expenses of any underlying Fidelity Central Funds.
E Amount does not include the portfolio activity of any underlying Fidelity Central Funds.
F For the period November 1, 2007 (commencement of operations) to October 31, 2008.
G Expense ratios reflect operating expenses of the class. Expenses before reductions do not reflect amounts reimbursed by the investment adviser or reductions from brokerage service arrangements or reductions from other expense offset arrangements and do not represent the amount paid by the class during periods when reimbursements or reductions occur. Expense ratios before reductions for start-up periods may not be representative of longer-term operating periods. Expenses net of fee waivers reflect expenses after reimbursement by the investment adviser but prior to reductions from brokerage service arrangements or other expense offset arrangements. Expenses net of all reductions represent the net expenses paid by the class.
H Amount represents less than $.01 per share.
See accompanying notes which are an integral part of the financial statements.
Annual Report
Financial Highlights - Class B
Years ended October 31, | 2010 | 2009 | 2008 F |
Selected Per-Share Data | | | |
Net asset value, beginning of period | $ 6.98 | $ 5.42 | $ 10.00 |
Income from Investment Operations | | | |
Net investment income (loss) C | - H | .01 | - H |
Net realized and unrealized gain (loss) | 1.38 | 1.55 | (4.58) |
Total from investment operations | 1.38 | 1.56 | (4.58) |
Redemption fees added to paid in capital C,H | - | - | - |
Net asset value, end of period | $ 8.36 | $ 6.98 | $ 5.42 |
Total Return A,B | 19.77% | 28.78% | (45.80)% |
Ratios to Average Net Assets D,G | | | |
Expenses before reductions | 2.87% | 3.17% | 3.55% |
Expenses net of fee waivers, if any | 2.25% | 2.25% | 2.25% |
Expenses net of all reductions | 2.23% | 2.23% | 2.23% |
Net investment income (loss) | (.01)% | .09% | .05% |
Supplemental Data | | | |
Net assets, end of period (000 omitted) | $ 581 | $ 328 | $ 642 |
Portfolio turnover rate E | 87% | 116% | 115% |
A Total returns would have been lower had certain expenses not been reduced during the periods shown.
B Total returns do not include the effect of the contingent deferred sales charge.
C Calculated based on average shares outstanding during the period.
D Fees and expenses of the underlying Fidelity Central Funds are not included in the Fund's expense ratio. The Fund indirectly bears its proportionate share of the expenses of any underlying Fidelity Central Funds.
E Amount does not include the portfolio activity of any underlying Fidelity Central Funds.
F For the period November 1, 2007 (commencement of operations) to October 31, 2008.
G Expense ratios reflect operating expenses of the class. Expenses before reductions do not reflect amounts reimbursed by the investment adviser or reductions from brokerage service arrangements or reductions from other expense offset arrangements and do not represent the amount paid by the class during periods when reimbursements or reductions occur. Expense ratios before reductions for start-up periods may not be representative of longer-term operating periods. Expenses net of fee waivers reflect expenses after reimbursement by the investment adviser but prior to reductions from brokerage service arrangements or other expense offset arrangements. Expenses net of all reductions represent the net expenses paid by the class.
H Amount represents less than $.01 per share.
See accompanying notes which are an integral part of the financial statements.
Annual Report
Financial Highlights - Class C
Years ended October 31, | 2010 | 2009 | 2008 F |
Selected Per-Share Data | | | |
Net asset value, beginning of period | $ 6.98 | $ 5.42 | $ 10.00 |
Income from Investment Operations | | | |
Net investment income (loss) C | - H | .01 | - H |
Net realized and unrealized gain (loss) | 1.38 | 1.55 | (4.58) |
Total from investment operations | 1.38 | 1.56 | (4.58) |
Distributions from net realized gain | (.02) | - | - |
Redemption fees added to paid in capital C,H | - | - | - |
Net asset value, end of period | $ 8.34 | $ 6.98 | $ 5.42 |
Total Return A,B | 19.82% | 28.78% | (45.80)% |
Ratios to Average Net Assets D,G | | | |
Expenses before reductions | 2.89% | 3.21% | 3.52% |
Expenses net of fee waivers, if any | 2.25% | 2.25% | 2.25% |
Expenses net of all reductions | 2.24% | 2.23% | 2.23% |
Net investment income (loss) | (.01)% | .09% | .05% |
Supplemental Data | | | |
Net assets, end of period (000 omitted) | $ 1,261 | $ 780 | $ 684 |
Portfolio turnover rate E | 87% | 116% | 115% |
A Total returns would have been lower had certain expenses not been reduced during the periods shown.
B Total returns do not include the effect of the contingent deferred sales charge.
C Calculated based on average shares outstanding during the period.
D Fees and expenses of the underlying Fidelity Central Funds are not included in the Fund's expense ratio. The Fund indirectly bears its proportionate share of the expenses of any underlying Fidelity Central Funds.
E Amount does not include the portfolio activity of any underlying Fidelity Central Funds.
F For the period November 1, 2007 (commencement of operations) to October 31, 2008.
G Expense ratios reflect operating expenses of the class. Expenses before reductions do not reflect amounts reimbursed by the investment adviser or reductions from brokerage service arrangements or reductions from other expense offset arrangements and do not represent the amount paid by the class during periods when reimbursements or reductions occur. Expense ratios before reductions for start-up periods may not be representative of longer-term operating periods. Expenses net of fee waivers reflect expenses after reimbursement by the investment adviser but prior to reductions from brokerage service arrangements or other expense offset arrangements. Expenses net of all reductions represent the net expenses paid by the class.
H Amount represents less than $.01 per share.
See accompanying notes which are an integral part of the financial statements.
Annual Report
Financial Highlights - International Growth
Years ended October 31, | 2010 | 2009 | 2008 E |
Selected Per-Share Data | | | |
Net asset value, beginning of period | $ 7.02 | $ 5.48 | $ 10.00 |
Income from Investment Operations | | | |
Net investment income (loss) B | .07 | .06 | .09 |
Net realized and unrealized gain (loss) | 1.39 | 1.54 | (4.60) |
Total from investment operations | 1.46 | 1.60 | (4.51) |
Distributions from net investment income | (.06) | (.06) | (.01) |
Distributions from net realized gain | (.03) | - | - |
Total distributions | (.08) H | (.06) | (.01) |
Redemption fees added to paid in capital B,G | - | - | - |
Net asset value, end of period | $ 8.40 | $ 7.02 | $ 5.48 |
Total Return A | 20.97% | 29.77% | (45.17)% |
Ratios to Average Net Assets C,F | | | |
Expenses before reductions | 1.89% | 2.19% | 2.35% |
Expenses net of fee waivers, if any | 1.25% | 1.25% | 1.25% |
Expenses net of all reductions | 1.23% | 1.23% | 1.23% |
Net investment income (loss) | .99% | 1.09% | 1.05% |
Supplemental Data | | | |
Net assets, end of period (000 omitted) | $ 28,454 | $ 18,254 | $ 11,884 |
Portfolio turnover rate D | 87% | 116% | 115% |
A Total returns would have been lower had certain expenses not been reduced during the periods shown.
B Calculated based on average shares outstanding during the period.
C Fees and expenses of the underlying Fidelity Central Funds are not included in the Fund's expense ratio. The Fund indirectly bears its proportionate share of the expenses of any underlying Fidelity Central Funds.
D Amount does not include the portfolio activity of any underlying Fidelity Central Funds.
E For the period November 1, 2007 (commencement of operations) to October 31, 2008.
F Expense ratios reflect operating expenses of the class. Expenses before reductions do not reflect amounts reimbursed by the investment adviser or reductions from brokerage service arrangements or reductions from other expense offset arrangements and do not represent the amount paid by the class during periods when reimbursements or reductions occur. Expense ratios before reductions for start-up periods may not be representative of longer-term operating periods. Expenses net of fee waivers reflect expenses after reimbursement by the investment adviser but prior to reductions from brokerage service arrangements or other expense offset arrangements. Expenses net of all reductions represent the net expenses paid by the class.
G Amount represents less than $.01 per share.
H Total distributions of $.08 per share is comprised of distributions from net investment income of $.057 and distributions from net realized gain of $.025 per share.
See accompanying notes which are an integral part of the financial statements.
Annual Report
Financial Highlights - Institutional Class
Years ended October 31, | 2010 | 2009 | 2008 E |
Selected Per-Share Data | | | |
Net asset value, beginning of period | $ 7.02 | $ 5.48 | $ 10.00 |
Income from Investment Operations | | | |
Net investment income (loss) B | .07 | .06 | .09 |
Net realized and unrealized gain (loss) | 1.39 | 1.54 | (4.60) |
Total from investment operations | 1.46 | 1.60 | (4.51) |
Distributions from net investment income | (.06) | (.06) | (.01) |
Distributions from net realized gain | (.03) | - | - |
Total distributions | (.08) H | (.06) | (.01) |
Redemption fees added to paid in capital B,G | - | - | - |
Net asset value, end of period | $ 8.40 | $ 7.02 | $ 5.48 |
Total Return A | 20.97% | 29.77% | (45.17)% |
Ratios to Average Net Assets C,F | | | |
Expenses before reductions | 1.92% | 2.01% | 2.56% |
Expenses net of fee waivers, if any | 1.25% | 1.25% | 1.25% |
Expenses net of all reductions | 1.23% | 1.23% | 1.23% |
Net investment income (loss) | .99% | 1.09% | 1.05% |
Supplemental Data | | | |
Net assets, end of period (000 omitted) | $ 113 | $ 36 | $ 521 |
Portfolio turnover rate D | 87% | 116% | 115% |
A Total returns would have been lower had certain expenses not been reduced during the periods shown.
B Calculated based on average shares outstanding during the period.
C Fees and expenses of the underlying Fidelity Central Funds are not included in the Fund's expense ratio. The Fund indirectly bears its proportionate share of the expenses of any underlying Fidelity Central Funds.
D Amount does not include the portfolio activity of any underlying Fidelity Central Funds.
E For the period November 1, 2007 (commencement of operations) to October 31, 2008.
F Expense ratios reflect operating expenses of the class. Expenses before reductions do not reflect amounts reimbursed by the investment adviser or reductions from brokerage service arrangements or reductions from other expense offset arrangements and do not represent the amount paid by the class during periods when reimbursements or reductions occur. Expense ratios before reductions for start-up periods may not be representative of longer-term operating periods. Expenses net of fee waivers reflect expenses after reimbursement by the investment adviser but prior to reductions from brokerage service arrangements or other expense offset arrangements. Expenses net of all reductions represent the net expenses paid by the class.
G Amount represents less than $.01 per share.
H Total distributions of $.08 per share is comprised of distributions from net investment income of $.057 and distributions from net realized gain of $.025 per share.
See accompanying notes which are an integral part of the financial statements.
Annual Report
Notes to Financial Statements
For the period ended October 31, 2010
1. Organization.
Fidelity International Growth Fund (the Fund) is a fund of Fidelity Investment Trust (the Trust) and is authorized to issue an unlimited number of shares. The Trust is registered under the Investment Company Act of 1940, as amended (the 1940 Act), as an open-end management investment company organized as a Massachusetts business trust. The Fund offers Class A, Class T, Class C, International Growth and Institutional Class shares, each of which has equal rights as to assets and voting privileges. Effective after the close of business on September 1, 2010, Class B shares were closed to new accounts and additional purchases by existing shareholders. Each class has exclusive voting rights with respect to matters that affect that class. Class B shares will automatically convert to Class A shares after a holding period of seven years from the initial date of purchase. Investment income, realized and unrealized capital gains and losses, the common expenses of the Fund, and certain fund-level expense reductions, if any, are allocated on a pro-rata basis to each class based on the relative net assets of each class to the total net assets of the Fund. Each class differs with respect to transfer agent and distribution and service plan fees incurred. Certain expense reductions also differ by class. The Fund's investments in emerging markets can be subject to social, economic, regulatory, and political uncertainties and can be extremely volatile.
2. Investments in Fidelity Central Funds.
The Fund may invest in Fidelity Central Funds, which are open-end investment companies available only to other investment companies and accounts managed by Fidelity Management & Research Company (FMR) and its affiliates. The Fund's Schedule of Investments lists each of the Fidelity Central Funds held as of period end, if any, as an investment of the Fund, but does not include the underlying holdings of each Fidelity Central Fund. As an Investing Fund, the Fund indirectly bears its proportionate share of the expenses of the underlying Fidelity Central Funds.
The Money Market Central Funds seek preservation of capital and current income and are managed by Fidelity Investments Money Management, Inc. (FIMM), an affiliate of FMR.
A complete unaudited list of holdings for each Fidelity Central Fund is available upon request or at the Securities and Exchange Commission (the SEC) web site at www.sec.gov. In addition, the financial statements of the Fidelity Central Funds, which are not covered by the Fund's Report of Independent Registered Public Accounting Firm, are available on the SEC web site or upon request.
3. Significant Accounting Policies.
The financial statements have been prepared in conformity with accounting principles generally accepted in the United States of America (GAAP), which require management
Annual Report
3. Significant Accounting Policies - continued
to make certain estimates and assumptions at the date of the financial statements. Actual results could differ from those estimates. The following summarizes the significant accounting policies of the Fund:
Security Valuation. Investments are valued as of 4:00 p.m. Eastern time on the last calendar day of the period. The Fund uses independent pricing services approved by the Board of Trustees to value its investments. When current market prices or quotations are not readily available or reliable, valuations may be determined in good faith in accordance with procedures adopted by the Board of Trustees. Factors used in determining value may include market or security specific events. The frequency with which these procedures are used cannot be predicted and they may be utilized to a significant extent. The value used for net asset value (NAV) calculation under these procedures may differ from published prices for the same securities.
The Fund categorizes the inputs to valuation techniques used to value its investments into a disclosure hierarchy consisting of three levels as shown below.
Level 1 - quoted prices in active markets for identical investments
Level 2 - other significant observable inputs (including quoted prices for similar investments, interest rates, prepayment speeds, etc.)
Level 3 - unobservable inputs (including the fund's own assumptions based on the best information available)
Changes in valuation techniques may result in transfers in or out of an assigned level within the disclosure hierarchy. The aggregate value of investments by input level, as of October 31, 2010 is included at the end of the Fund's Schedule of Investments. Valuation techniques used to value the Fund's investments by major category are as follows.
Equity securities, including restricted securities, for which market quotations are readily available, are valued at the last reported sale price or official closing price as reported by an independent pricing service on the primary market or exchange on which they are traded and are categorized as Level 1 in the hierarchy. In the event there were no sales during the day or closing prices are not available, securities are valued at the last quoted bid price or may be valued using the last available price and are generally categorized as Level 2 in the hierarchy. For foreign equity securities, when significant market or security specific events arise, comparisons to the valuation of American Depositary Receipts (ADRs), futures contracts, Exchange-traded funds (ETFs) and certain indexes as well as quoted prices for similar securities are used and are categorized as Level 2 in the hierarchy in these circumstances. Utilizing these techniques may result in transfers between Level 1 and Level 2. For restricted equity securities and private placements where
Annual Report
Notes to Financial Statements - continued
3. Significant Accounting Policies - continued
Security Valuation - continued
observable inputs are limited, assumptions about market activity and risk are used and are categorized as Level 3 in the hierarchy.
ETFs are valued at their last sale price or official closing price as reported by an independent pricing service on the primary market or exchange on which they are traded and are categorized as Level 1 in the hierarchy. In the event there were no sales during the day but the exchange reports a closing bid level, ETFs are valued at the closing bid and would be categorized as Level 1 in the hierarchy. In the event there was no closing bid, ETFs may be valued by another method that the Board of Trustees believes reflects fair value in accordance with the Board's fair value pricing policies and may be categorized as Level 2 in the hierarchy.
Investments in open-end mutual funds, including the Fidelity Central Funds, are valued at their closing net asset value each business day and are categorized as Level 1 in the hierarchy. Short-term securities with remaining maturities of sixty days or less for which quotations are not readily available are valued at amortized cost, which approximates fair value and are categorized as Level 2 in the hierarchy.
Foreign Currency. The Fund uses foreign currency contracts to facilitate transactions in foreign-denominated securities. Gains and losses from these transactions may arise from changes in the value of the foreign currency or if the counterparties do not perform under the contracts' terms.
Foreign-denominated assets, including investment securities, and liabilities are translated into U.S. dollars at the exchange rate at period end. Purchases and sales of investment securities, income and dividends received and expenses denominated in foreign currencies are translated into U.S. dollars at the exchange rate in effect on the transaction date.
The effects of exchange rate fluctuations on investments are included with the net realized and unrealized gain (loss) on investment securities. Other foreign currency transactions resulting in realized and unrealized gain (loss) are disclosed separately.
Investment Transactions and Income. For financial reporting purposes, the Fund's investment holdings and NAV include trades executed through the end of the last business day of the period. The NAV per share for processing shareholder transactions is calculated as of the close of business of the New York Stock Exchange (NYSE), normally 4:00 p.m. Eastern time and includes trades executed through the end of the prior business day. Gains and losses on securities sold are determined on the basis of identified cost. Dividend income is recorded on the ex-dividend date, except for certain dividends from foreign securities where the ex-dividend date may have passed, which are recorded
Annual Report
3. Significant Accounting Policies - continued
Investment Transactions and Income - continued
as soon as the Fund is informed of the ex-dividend date. Non-cash dividends included in dividend income, if any, are recorded at the fair market value of the securities received. Distributions received on securities that represent a return of capital or capital gain are recorded as a reduction of cost of investments and/or as a realized gain. The Fund estimates the components of distributions received that may be considered return of capital distributions or capital gain distributions. Interest income and distributions from the Fidelity Central Funds are accrued as earned. Interest income includes coupon interest and amortization of premium and accretion of discount on debt securities. Investment income is recorded net of foreign taxes withheld where recovery of such taxes is uncertain.
Expenses. Most expenses of the Trust can be directly attributed to a fund. Expenses which cannot be directly attributed are apportioned amongst each fund in the Trust. Expense estimates are accrued in the period to which they relate and adjustments are made when actual amounts are known.
Income Tax Information and Distributions to Shareholders. Each year the Fund intends to qualify as a regulated investment company, including distributing substantially all of its taxable income and realized gains under Subchapter M of the Internal Revenue Code and filing its U.S. federal tax return. As a result, no provision for income taxes is required. As of October 31, 2010, the Fund did not have any unrecognized tax benefits in the accompanying financial statements. A fund's federal tax return is subject to examination by the Internal Revenue Service (IRS) for a period of three years. Foreign taxes are provided for based on the Fund's understanding of the tax rules and rates that exist in the foreign markets in which it invests.
Distributions are declared and recorded on the ex-dividend date. Income dividends and capital gain distributions are declared separately for each class. Income and capital gain distributions are determined in accordance with income tax regulations, which may differ from GAAP.
Capital accounts within the financial statements are adjusted for permanent book-tax differences. These adjustments have no impact on net assets or the results of operations. Temporary book-tax differences will reverse in a subsequent period.
Book-tax differences are primarily due to the short-term gain distributions from the Fidelity Central Funds, foreign currency transactions, passive foreign investment companies (PFIC), partnerships, capital loss carryforwards and losses deferred due to wash sales.
Annual Report
Notes to Financial Statements - continued
3. Significant Accounting Policies - continued
Income Tax Information and Distributions to Shareholders - continued
The federal tax cost of investment securities and unrealized appreciation (depreciation) as of period end were as follows:
Gross unrealized appreciation | $ 5,209,031 |
Gross unrealized depreciation | (928,317) |
Net unrealized appreciation (depreciation) | $ 4,280,714 |
| |
Tax Cost | $ 32,776,950 |
The tax-based components of distributable earnings as of period end were as follows:
Undistributed ordinary income | $ 278,863 |
Capital loss carryforward | $ (6,290,360) |
Net unrealized appreciation (depreciation) | $ 4,284,636 |
The tax character of distributions paid was as follows:
| October 31, 2010 | October 31, 2009 |
Ordinary Income | $ 245,729 | $ 188,551 |
Short-Term Trading (Redemption) Fees. Shares held by investors in the Fund less than 30 days are subject to a redemption fee equal to 1.00% of the net asset value of shares redeemed. All redemption fees, which reduce the proceeds of the shareholder redemption, are retained by the Fund and accounted for as an addition to paid in capital.
4. Operating Policies.
Repurchase Agreements. FMR has received an Exemptive Order from the SEC which permits the Fund and other affiliated entities of FMR to transfer uninvested cash balances into joint trading accounts which are then invested in repurchase agreements. The Fund may also invest directly with institutions in repurchase agreements. Repurchase agreements are collateralized by government or non-government securities. Upon settlement date, collateral is held in segregated accounts with custodian banks and may be obtained in the event of a default of the counterparty. The Fund monitors, on a daily basis, the value of the collateral to ensure it is at least equal to the principal amount of the repurchase agreement (including accrued interest). In the event of a default by the counterparty, realization of the collateral proceeds could be delayed, during which time the value of the collateral may decline.
Annual Report
5. Purchases and Sales of Investments.
Purchases and sales of securities, other than short-term securities, aggregated $31,048,448 and $23,131,685, respectively.
6. Fees and Other Transactions with Affiliates.
Management Fee. FMR and its affiliates provide the Fund with investment management related services for which the Fund pays a monthly management fee. The management fee is the sum of an individual fund fee rate that is based on an annual rate of .45% of the Fund's average net assets and a group fee rate that averaged .26% during the period. The group fee rate is based upon the average net assets of all the mutual funds advised by FMR. The group fee rate decreases as assets under management increase and increases as assets under management decrease. In addition, the management fee is subject to a performance adjustment (up to a maximum of ± .20% of the Fund's average net assets over a 36 month performance period). The upward or downward adjustment to the management fee is based on the relative investment performance of International Growth as compared to an appropriate benchmark index. The Fund's performance adjustment took effect in November 2008. Subsequent months will be added until the performance period includes 36 months. For the period, the total annual management fee rate, including the performance adjustment, was .82% of the Fund's average net assets.
Distribution and Service Plan Fees. In accordance with Rule 12b-1 of the 1940 Act, the Fund has adopted separate Distribution and Service Plans for each class of shares. Certain classes pay Fidelity Distributors Corporation (FDC), an affiliate of FMR, separate Distribution and Service Fees, each of which is based on an annual percentage of each class' average net assets. In addition, FDC may pay financial intermediaries for selling shares of the Fund and providing shareholder support services. For the period, the Distribution and Service Fee rates, total fees and amounts retained by FDC were as follows:
| Distribution
Fee | Service
Fee | Total Fees | Retained
by FDC |
Class A | -% | .25% | $ 5,536 | $ 860 |
Class T | .25% | .25% | 3,576 | - |
Class B | .75% | .25% | 4,625 | 3,483 |
Class C | .75% | .25% | 10,555 | 3,617 |
| | | $ 24,292 | $ 7,960 |
Sales Load. FDC receives a front-end sales charge of up to 5.75% for selling Class A shares, and 3.50% for selling Class T shares, some of which is paid to financial intermediaries for selling shares of the Fund. FDC receives the proceeds of contingent deferred sales charges levied on Class A, Class T, Class B, and Class C redemptions. These charges depend on the holding period. The deferred sales charges range from 5% to 1% for
Annual Report
Notes to Financial Statements - continued
6. Fees and Other Transactions with Affiliates - continued
Sales Load - continued
Class B, 1% for Class C, 1.00% for certain purchases of Class A shares (1.00% to .50% prior to July 12, 2010) and .25% for certain purchases of Class T shares.
For the period, sales charge amounts retained by FDC were as follows:
| Retained
by FDC |
Class A | $ 4,989 |
Class T | 569 |
Class B* | 583 |
Class C* | 125 |
| $ 6,266 |
* When Class B and Class C shares are initially sold, FDC pays commissions from its own resources to financial intermediaries through which the sales are made.
Transfer Agent Fees. Fidelity Investments Institutional Operations Company, Inc. (FIIOC), an affiliate of FMR, is the transfer, dividend disbursing and shareholder servicing agent for each class of the Fund. FIIOC receives account fees and asset-based fees that vary according to the account size and type of account of the shareholders of the respective classes of the Fund. FIIOC pays for typesetting, printing and mailing of shareholder reports, except proxy statements. For the period, transfer agent fees for each class were as follows:
| Amount | % of
Average
Net Assets |
Class A | $ 7,042 | .32 |
Class T | 2,357 | .33 |
Class B | 1,462 | .31 |
Class C | 3,330 | .32 |
International Growth | 70,950 | .31 |
Institutional Class | 165 | .30 |
| $ 85,306 | |
Accounting and Security Lending Fees. Fidelity Service Company, Inc. (FSC), an affiliate of FMR, maintains the Fund's accounting records. The accounting fee is based on the level of average net assets for the month. Under a separate contract, FSC administers the security lending program. The security lending fee is based on the number and duration of lending transactions.
Annual Report
6. Fees and Other Transactions with Affiliates - continued
Brokerage Commissions. The Fund placed a portion of its portfolio transactions with brokerage firms which are affiliates of the investment adviser. The commissions paid to these affiliated firms were $380 for the period.
7. Committed Line of Credit.
The Fund participates with other funds managed by FMR or an affiliate in a $3.75 billion credit facility (the "line of credit") to be utilized for temporary or emergency purposes to fund shareholder redemptions or for other short-term liquidity purposes. The Fund has agreed to pay commitment fees on its pro-rata portion of the line of credit, which amounted to $103 and is reflected in Miscellaneous expenses on the Statement of Operations. During the period, there were no borrowings on this line of credit.
8. Security Lending.
The Fund lends portfolio securities through a lending agent from time to time in order to earn additional income. The lending agent may loan securities to certain qualified borrowers, including Fidelity Capital Markets (FCM), a broker-dealer affiliated with the Fund. On the settlement date of the loan, the Fund receives collateral (in the form of U.S. Treasury obligations, letters of credit and/or cash) against the loaned securities and maintains collateral in an amount not less than 100% of the market value of the loaned securities during the period of the loan. The market value of the loaned securities is determined at the close of business of the Fund and any additional required collateral is delivered to the Fund on the next business day. If the borrower defaults on its obligation to return the securities loaned because of insolvency or other reasons, a fund could experience delays and costs in recovering the securities loaned or in gaining access to the collateral. Any cash collateral received is invested in the Fidelity Securities Lending Cash Central Fund. The value of loaned securities and cash collateral at period end are disclosed on the Fund's Statement of Assets and Liabilities. Security lending income represents the income earned on investing cash collateral, less rebates paid to borrowers and lending agent fees associated with the loan, plus any premium payments received for lending certain types of securities. Security lending income is presented in the Statement of Operations as a component of income from Fidelity Central Funds. Total security lending income during the period amounted to $13,302. During the period, there were no securities loaned to FCM.
Annual Report
Notes to Financial Statements - continued
9. Expense Reductions.
FMR voluntarily agreed to reimburse each class to the extent annual operating expenses exceeded certain levels of average net assets as noted in the table below. Some expenses, for example interest expense, including commitment fees, are excluded from this reimbursement.
The following classes were in reimbursement during the period:
| Expense
Limitations | Reimbursement
from adviser |
Class A | 1.50% | $ 13,958 |
Class T | 1.75% | 4,759 |
Class B | 2.25% | 2,895 |
Class C | 2.25% | 6,772 |
International Growth | 1.25% | 145,483 |
Institutional Class | 1.25% | 371 |
| | $ 174,238 |
Effective November 1, 2010 the expense limitations will be changed to 1.45%, 1.70%, 2.20%, 2.20%, 1.20%, and 1.20% for Class A, T, B, C, International Growth, and Institutional, respectively.
Many of the brokers with whom FMR places trades on behalf of the Fund provided services to the Fund in addition to trade execution. These services included payments of certain expenses on behalf of the Fund totaling $4,411 for the period.
10. Distributions to Shareholders.
Distributions to shareholders of each class were as follows:
Years ended October 31, | 2010 | 2009 |
From net investment income | | |
Class A | $ 10,514 | $ 7,994 |
Class T | 1,819 | 2,991 |
International Growth | 154,599 | 171,473 |
Institutional Class | 287 | 6,093 |
Total | $ 167,219 | $ 188,551 |
From net realized gain | | |
Class A | $ 5,713 | $ - |
Class T | 2,067 | - |
Class C | 2,797 | - |
International Growth | 67,807 | - |
Institutional Class | 126 | - |
Total | $ 78,510 | $ - |
Annual Report
11. Share Transactions.
Transactions for each class of shares were as follows:
| Shares | Dollars |
Years ended October 31, | 2010 | 2009 | 2010 | 2009 |
Class A | | | | |
Shares sold | 247,866 | 249,117 | $ 1,869,390 | $ 1,499,324 |
Reinvestment of distributions | 2,011 | 1,620 | 14,999 | 7,954 |
Shares redeemed | (88,980) | (193,639) | (650,197) | (1,109,207) |
Net increase (decrease) | 160,897 | 57,098 | $ 1,234,192 | $ 398,071 |
Class T | | | | |
Shares sold | 73,695 | 78,248 | $ 554,529 | $ 453,244 |
Reinvestment of distributions | 513 | 606 | 3,840 | 2,982 |
Shares redeemed | (26,780) | (96,008) | (194,364) | (616,841) |
Net increase (decrease) | 47,428 | (17,154) | $ 364,005 | $ (160,615) |
Class B | | | | |
Shares sold | 37,806 | 35,907 | $ 276,981 | $ 202,014 |
Shares redeemed | (15,339) | (107,260) | (113,063) | (656,068) |
Net increase (decrease) | 22,467 | (71,353) | $ 163,918 | $ (454,054) |
Class C | | | | |
Shares sold | 110,505 | 147,440 | $ 831,229 | $ 796,649 |
Reinvestment of distributions | 369 | - | 2,760 | - |
Shares redeemed | (71,336) | (161,828) | (504,821) | (850,523) |
Net increase (decrease) | 39,538 | (14,388) | $ 329,168 | $ (53,874) |
International Growth | | | | |
Shares sold | 1,971,246 | 1,976,158 | $ 14,829,454 | $ 11,124,182 |
Reinvestment of distributions | 28,518 | 27,149 | 212,744 | 133,303 |
Shares redeemed | (1,213,664) | (1,574,393) | (8,965,012) | (8,834,160) |
Net increase (decrease) | 786,100 | 428,914 | $ 6,077,186 | $ 2,423,325 |
Institutional Class | | | | |
Shares sold | 11,311 | 6,125 | $ 86,413 | $ 37,094 |
Reinvestment of distributions | 55 | 1,241 | 412 | 6,093 |
Shares redeemed | (3,097) | (97,389) | (23,304) | (632,954) |
Net increase (decrease) | 8,269 | (90,023) | $ 63,521 | $ (589,767) |
12. Other.
The Fund's organizational documents provide former and current trustees and officers with a limited indemnification against liabilities arising in connection with the performance of their duties to the Fund. In the normal course of business, the Fund may also enter into contracts that provide general indemnifications. The Fund's maximum exposure under these arrangements is unknown as this would be dependent on future claims that may be made against the Fund. The risk of material loss from such claims is considered remote.
Annual Report
To the Trustees of Fidelity Investment Trust and the Shareholders of Fidelity International Growth Fund:
In our opinion, the accompanying statement of assets and liabilities, including the schedule of investments, and the related statements of operations and of changes in net assets and the financial highlights present fairly, in all material respects, the financial position of Fidelity International Growth Fund (a fund of Fidelity Investment Trust) at October 31, 2010, the results of its operations for the year then ended, the changes in its net assets for each of the two years in the period then ended and the financial highlights for each of the periods indicated, in conformity with accounting principles generally accepted in the United States of America. These financial statements and financial highlights (hereafter referred to as "financial statements") are the responsibility of the Fidelity International Growth Fund's management. Our responsibility is to express an opinion on these financial statements based on our audits. We conducted our audits of these financial statements in accordance with the standards of the Public Company Accounting Oversight Board (United States). Those standards require that we plan and perform the audit to obtain reasonable assurance about whether the financial statements are free of material misstatement. An audit includes examining, on a test basis, evidence supporting the amounts and disclosures in the financial statements, assessing the accounting principles used and significant estimates made by management, and evaluating the overall financial statement presentation. We believe that our audits, which included confirmation of securities at October 31, 2010 by correspondence with the custodian and brokers, provide a reasonable basis for our opinion.
/s/ PricewaterhouseCoopers LLP
PricewaterhouseCoopers LLP
Boston, Massachusetts
December 15, 2010
Annual Report
The Trustees, Member of the Advisory Board, and executive officers of the trust and fund, as applicable, are listed below. The Board of Trustees governs the fund and is responsible for protecting the interests of shareholders. The Trustees are experienced executives who meet periodically throughout the year to oversee the fund's activities, review contractual arrangements with companies that provide services to the fund, oversee management of the risks associated with such activities and contractual arrangements, and review the fund's performance. Except for James C. Curvey, each of the Trustees oversees 221 funds advised by FMR or an affiliate. Mr. Curvey oversees 410 funds advised by FMR or an affiliate.
The Trustees hold office without limit in time except that (a) any Trustee may resign; (b) any Trustee may be removed by written instrument, signed by at least two-thirds of the number of Trustees prior to such removal; (c) any Trustee who requests to be retired or who has become incapacitated by illness or injury may be retired by written instrument signed by a majority of the other Trustees; and (d) any Trustee may be removed at any special meeting of shareholders by a two-thirds vote of the outstanding voting securities of the trust. Each Trustee who is not an interested person (as defined in the 1940 Act) (Independent Trustee), shall retire not later than the last day of the calendar year in which his or her 72nd birthday occurs. The Independent Trustees may waive this mandatory retirement age policy with respect to individual Trustees. The executive officers and Advisory Board Member hold office without limit in time, except that any officer and Advisory Board Member may resign or may be removed by a vote of a majority of the Trustees at any regular meeting or any special meeting of the Trustees. Except as indicated, each individual has held the office shown or other offices in the same company for the past five years.
Experience, Skills, Attributes, and Qualifications of the Fund's Trustees. The Governance and Nominating Committee has adopted a statement of policy that describes the experience, qualifications, attributes, and skills that are necessary and desirable for potential Independent Trustee candidates (Statement of Policy). The Board believes that each Trustee satisfied at the time he or she was initially elected or appointed a Trustee, and continues to satisfy, the standards contemplated by the Statement of Policy. The Governance and Nominating Committee also engages professional search firms to help identify potential Independent Trustee candidates who have the experience, qualifications, attributes, and skills consistent with the Statement of Policy. From time to time, additional criteria based on the composition and skills of the current Independent Trustees, as well as experience or skills that may be appropriate in light of future changes to board composition, business conditions, and regulatory or other developments, have also been considered by the professional search firms and the Governance and Nominating Committee. In addition, the Board takes into account the Trustees' commitment and participation in Board and committee meetings, as well as their leadership of standing and ad hoc committees throughout their tenure.
In determining that a particular Trustee was and continues to be qualified to serve as a Trustee, the Board has considered a variety of criteria, none of which, in isolation, was controlling. The Board believes that, collectively, the Trustees have balanced and diverse experience, qualifications, attributes, and skills, which allow the Board to operate effectively in governing the fund and protecting the interests of shareholders. Information about the specific experience, skills, attributes, and qualifications of each Trustee, which in each case led to the Board's conclusion that the Trustee should serve (or continue to serve) as a trustee of the fund, is provided below.
Annual Report
Trustees and Officers - continued
Board Structure and Oversight Function. Edward C. Johnson 3d is an interested person (as defined in the 1940 Act) and currently serves as Chairman. The Trustees have determined that an interested Chairman is appropriate and benefits shareholders because an interested Chairman has a personal and professional stake in the quality and continuity of services provided to the fund. Independent Trustees exercise their informed business judgment to appoint an individual of their choosing to serve as Chairman, regardless of whether the Trustee happens to be independent or a member of management. The Independent Trustees have determined that they can act independently and effectively without having an Independent Trustee serve as Chairman and that a key structural component for assuring that they are in a position to do so is for the Independent Trustees to constitute a substantial majority for the Board. The Independent Trustees also regularly meet in executive session. Ned C. Lautenbach serves as Chairman of the Independent Trustees and as such (i) acts as a liaison between the Independent Trustees and management with respect to matters important to the Independent Trustees and (ii) with management prepares agendas for Board meetings.
Fidelity funds are overseen by different Boards of Trustees. The fund's Board oversees Fidelity's equity and high income funds and another Board oversees Fidelity's investment-grade bond, money market, and asset allocation funds. The asset allocation funds may invest in Fidelity funds overseen by the fund's Board. The use of separate Boards, each with its own committee structure, allows the Trustees of each group of Fidelity funds to focus on the unique issues of the funds they oversee, including common research, investment, and operational issues. On occasion, the separate Boards establish joint committees to address issues of overlapping consequences for the Fidelity funds overseen by each Board.
The Trustees operate using a system of committees to facilitate the timely and efficient consideration of all matters of importance to the Trustees, the fund, and fund shareholders and to facilitate compliance with legal and regulatory requirements and oversight of the fund's activities and associated risks. The Board, acting through its committees, has charged FMR and its affiliates with (i) identifying events or circumstances the occurrence of which could have demonstrably adverse effects on the fund's business and/or reputation; (ii) implementing processes and controls to lessen the possibility that such events or circumstances occur or to mitigate the effects of such events or circumstances if they do occur; and (iii) creating and maintaining a system designed to evaluate continuously business and market conditions in order to facilitate the identification and implementation processes described in (i) and (ii) above. Because the day-to-day operations and activities of the fund are carried out by or through FMR, its affiliates and other service providers, the fund's exposure to risks is mitigated but not eliminated by the processes overseen by the Trustees. While each of the Board's committees has responsibility for overseeing different aspects of the fund's activities, oversight is exercised primarily through the Operations, Audit, and Compliance Committees. Appropriate personnel, including but not limited to the fund's Chief Compliance Officer (CCO), FMR's internal auditor, the independent accountants, the fund's Treasurer and portfolio management personnel, make periodic reports to the Board's committees, as appropriate. The responsibilities of each committee, including their oversight responsibilities, are described further under "Standing Committees of the Fund's Trustees."
Annual Report
The fund's Statement of Additional Information (SAI) includes more information about the Trustees. To request a free copy, call Fidelity at 1-877-208-0098.
Interested Trustees*:
Correspondence intended for each Trustee who is an interested person may be sent to Fidelity Investments, 82 Devonshire Street, Boston, Massachusetts 02109.
Name, Age; Principal Occupations and Other Relevant Experience+ |
Edward C. Johnson 3d (80) |
| Year of Election or Appointment: 1984 Mr. Johnson is Trustee and Chairman of the Board of Trustees of certain Trusts. Mr. Johnson serves as Chief Executive Officer, Chairman, and a Director of FMR LLC; Chairman and a Director of FMR; Chairman and a Director of Fidelity Research & Analysis Company (FRAC); Chairman and a Director of Fidelity Investments Money Management, Inc.; and Chairman and a Director of FMR Co., Inc. In addition, Mr. Johnson serves as Chairman and Director of FIL Limited. Previously, Mr. Johnson served as President of FMR LLC (2006-2007). |
James C. Curvey (75) |
| Year of Election or Appointment: 2007 Mr. Curvey also serves as Trustee (2007-present) of other investment companies advised by FMR. Mr. Curvey is a Director of Fidelity Investments Money Management, Inc. (2009-present), Director of Fidelity Research & Analysis Co. (2009-present) and Director of FMR and FMR Co., Inc. (2007-present). Mr. Curvey is also Vice Chairman (2007-
present) and Director of FMR LLC. In addition, Mr. Curvey serves as an Overseer for the Boston Symphony Orchestra and a member of the Trustees of Villanova University. Previously, Mr. Curvey was the Vice Chairman (2006-2007) and Director (2000-2007) of FMR Corp. |
* Trustees have been determined to be "Interested Trustees" by virtue of, among other things, their affiliation with the trust or various entities under common control with FMR.
Annual Report
Trustees and Officers - continued
+ The information above includes each Trustee's principal occupation during the last five years and other information relating to the experience, attributes, and skills relevant to each Trustee's qualifications to serve as a Trustee, which led to the conclusion that each Trustee should serve as a Trustee for the fund.
Independent Trustees:
Correspondence intended for each Independent Trustee (that is, the Trustees other than the Interested Trustees) may be sent to Fidelity Investments, P.O. Box 55235, Boston, Massachusetts 02205-5235.
Name, Age; Principal Occupations and Other Relevant Experience+ |
Dennis J. Dirks (62) |
| Year of Election or Appointment: 2005 Prior to his retirement in May 2003, Mr. Dirks was Chief Operating Officer and a member of the Board of The Depository Trust & Clearing Corporation (DTCC). He also served as President, Chief Operating Officer, and Board member of The Depository Trust Company (DTC) and President and Board member of the National Securities Clearing Corporation (NSCC). In addition, Mr. Dirks served as Chief Executive Officer and Board member of the Government Securities Clearing Corporation, Chief Executive Officer and Board member of the Mortgage-Backed Securities Clearing Corporation, as a Trustee and a member of the Finance Committee of Manhattan College (2005-2008), and as a Trustee and a member of the Finance Committee of AHRC of Nassau County (2006-2008). Mr. Dirks is a member of the Independent Directors Council (IDC) Governing Council (2010-Present) and Board of Directors for The Brookville Center for Children's Services, Inc. (2009-present). |
Alan J. Lacy (57) |
| Year of Election or Appointment: 2008 Mr. Lacy serves as Senior Adviser (2007-present) of Oak Hill Capital Partners, L.P. (private equity). Mr. Lacy also served as Chief Executive Officer (2000-2005) and Vice Chairman (2005-2006) of Sears Holdings Corporation and Sears, Roebuck and Co. (retail). In addition, Mr. Lacy serves as a member of the Board of Directors of The Western Union Company (global money transfer, 2006-present) and Bristol-Myers Squibb Company (global pharmaceuticals, 2007-present). Mr. Lacy is Chairman (2008-present) and a member (2006-present) of the Board of Trustees of The National Parks Conservation Association. |
Ned C. Lautenbach (66) |
| Year of Election or Appointment: 2000 Mr. Lautenbach is Chairman of the Independent Trustees of the Equity and High Income Funds (2006-present). Mr. Lautenbach currently serves as the Lead Director of the Eaton Corporation Board of Directors (diversified industrial, 1997-present). Mr. Lautenbach is also a member of the Board of Directors of the Philharmonic Center for the Arts in Naples, Florida (1999-present); a member of the Board of Trustees of Fairfield University (2005-present); and a member of the Council on Foreign Relations (1994-present). Previously, Mr. Lautenbach was a Partner/Advisory Partner at Clayton, Dubilier & Rice, Inc. (private equity investment, 1998-2010), as well as a Director of Sony Corporation (2006-2007). |
Joseph Mauriello (66) |
| Year of Election or Appointment: 2008 Prior to his retirement in January 2006, Mr. Mauriello served in numerous senior management positions including Deputy Chairman and Chief Operating Officer (2004-2005), and Vice Chairman of Financial Services (2002-2004) of KPMG LLP US (professional services, 1965-2005). Mr. Mauriello currently serves as a member of the Board of Directors of XL Group plc. (global insurance and re-insurance, 2006-present) and of Arcadia Resources Inc. (health care services and products, 2007-
present). Previously, Mr. Mauriello served as a Director of the Hamilton Funds of the Bank of New York (2006-2007). |
Cornelia M. Small (66) |
| Year of Election or Appointment: 2005 Ms. Small is a member of the Board of Directors of the Teagle Foundation (2009-present). Ms. Small is also a member of the Investment Committee, and Chair (2008-present) and a member of the Board of Trustees of Smith College. In addition, Ms. Small serves on the Investment Committee of the Berkshire Taconic Community Foundation (2008-
present). Previously, Ms. Small served as Chairperson of the Investment Committee (2002-2008) of Smith College. In addition, Ms. Small served as Chief Investment Officer, Director of Global Equity Investments, and a member of the Board of Directors of Scudder, Stevens & Clark and Scudder Kemper Investments. |
William S. Stavropoulos (71) |
| Year of Election or Appointment: 2001 Mr. Stavropoulos is Vice Chairman of the Independent Trustees of the Equity and High Income Funds (2006-present). Mr. Stavropoulos serves as President and Founder of the Michigan Baseball Foundation, the Great Lakes Loons (2007-present). Mr. Stavropoulos is Chairman Emeritus of the Board of Directors of The Dow Chemical Company, where he previously served in numerous senior management positions, including President, CEO (1995-2000; 2002-2004), Chairman of the Executive Committee (2000-2006), and as a member of the Board of Directors (1990-2006). Currently, Mr. Stavropoulos is Chairman of Univar (global distributor of commodity and specialty chemicals, 2010-present), a Director of Teradata Corporation (data warehousing and technology solutions, 2008-present), Chemical Financial Corporation, Maersk Inc. (industrial conglomerate), Tyco International, Inc. (multinational manufacturing and services, 2007-present), and a member of the Advisory Board for Metalmark Capital (private equity investment, 2005-
present). Mr. Stavropoulos is a special advisor to Clayton, Dubilier & Rice, Inc. (private equity investment). In addition, Mr. Stavropoulos is a member of the University of Notre Dame Advisory Council for the College of Science. |
David M. Thomas (61) |
| Year of Election or Appointment: 2008 Previously, Mr. Thomas served as Executive Chairman (2005-2006) and Chairman and Chief Executive Officer (2000-2005) of IMS Health, Inc. (pharmaceutical and healthcare information solutions). In addition, Mr. Thomas serves as a member of the Board of Directors of Fortune Brands, Inc. (consumer products), and Interpublic Group of Companies, Inc. (marketing communication, 2004-present). |
Michael E. Wiley (60) |
| Year of Election or Appointment: 2008 Mr. Wiley also serves as a Director of Asia Pacific Exploration Consolidated (international oil and gas exploration and production, 2008-
present). Mr. Wiley serves as a Director of Tesoro Corporation (independent oil refiner and marketer, 2005-present), and a Director of Bill Barrett Corporation (exploration and production, 2005-present). In addition, Mr. Wiley also serves as a Director of Post Oak Bank (privately-held bank, 2004-present). Previously, Mr. Wiley served as a member of the Board of Trustees of the University of Tulsa (2000-2006; 2007-2010), as a Senior Energy Advisor of Katzenbach Partners, LLC (consulting, 2006-2007), as an Advisory Director of Riverstone Holdings (private investment), Chairman, President, and CEO of Baker Hughes, Inc. (oilfield services, 2000-2004), and as Director of Spinnaker Exploration Company (exploration and production, 2001-2005). |
Annual Report
+ The information above includes each Trustee's principal occupation during the last five years and other information relating to the experience, attributes, and skills relevant to each Trustee's qualifications to serve as a Trustee, which led to the conclusion that each Trustee should serve as a Trustee for the fund.
Advisory Board Member and Executive Officers:
Correspondence intended for each executive officer and Peter S. Lynch may be sent to Fidelity Investments, 82 Devonshire Street, Boston, Massachusetts 02109.
Name, Age; Principal Occupation |
Peter S. Lynch (66) |
| Year of Election or Appointment: 2003 Member of the Advisory Board of Fidelity's Equity and High Income Funds. Mr. Lynch is Vice Chairman and a Director of FMR and FMR Co., Inc. In addition, Mr. Lynch serves as a Trustee of Boston College and as the Chairman of the Inner-City Scholarship Fund. Previously, Mr. Lynch served on the Special Olympics International Board of Directors (1997-2006). |
Kenneth B. Robins (41) |
| Year of Election or Appointment: 2008 President and Treasurer of Fidelity's Equity and High Income Funds. Mr. Robins also serves as President and Treasurer (2010-present) and Assistant Treasurer (2009-present) of other Fidelity funds and is an employee of Fidelity Investments (2004-present). Previously, Mr. Robins served as Deputy Treasurer of the Fidelity funds (2005-2008) and Treasurer and Chief Financial Officer of The North Carolina Capital Management Trust: Cash and Term Portfolios (2006-2008). |
Bruce T. Herring (45) |
| Year of Election or Appointment: 2006 Vice President of certain Equity Funds. Mr. Herring also serves as Chief Investment Officer and Director of Fidelity Management & Research (U.K.) Inc. (2010-present) and Group Chief Investments Officer of FMR. Previously, Mr. Herring served as Vice President (2005-2006) and Senior Vice President (2006-2007) of Fidelity Management & Research Company, Vice President of FMR Co., Inc. (2001-2007) and as a portfolio manager for Fidelity U.S. Equity Funds. |
Brian B. Hogan (46) |
| Year of Election or Appointment: 2009 Vice President of certain Equity Funds and Vice President of Sector Funds. Mr. Hogan also serves as President of FMR's Equity Division (2009-present). Previously, Mr. Hogan served as Senior Vice President, Equity Research of FMR (2006-2009) and as a portfolio manager. |
Scott C. Goebel (42) |
| Year of Election or Appointment: 2008 Secretary and Chief Legal Officer (CLO) of the Fidelity funds. Mr. Goebel also serves as Secretary and CLO of The North Carolina Capital Management Trust: Cash and Term Portfolio (2008-present); General Counsel, Secretary, and Senior Vice President of FMR (2008-present) and FMR Co., Inc. (2008-present); Deputy General Counsel of FMR LLC; Chief Legal Officer of Fidelity Management & Research (Hong Kong) Limited (2008-present) and Assistant Secretary of Fidelity Management & Research (Japan) Inc. (2008-present), Fidelity Investments Money Management, Inc. (2008-present), Fidelity Management & Research (U.K.) Inc. (2008-present), and Fidelity Research and Analysis Company (2008-present). Previously, Mr. Goebel served as Assistant Secretary of the Funds (2007-2008) and as Vice President and Secretary of Fidelity Distributors Corporation (FDC) (2005-2007). |
William C. Coffey (41) |
| Year of Election or Appointment: 2009 Assistant Secretary of Fidelity's Equity and High Income Funds. Mr. Coffey also serves as Senior Vice President and Deputy General Counsel of FMR LLC (2010-present), and is an employee of Fidelity Investments. Previously, Mr. Coffey served as Vice President and Associate General Counsel of FMR LLC (2005-2009). |
Holly C. Laurent (56) |
| Year of Election or Appointment: 2008 Anti-Money Laundering (AML) Officer of the Fidelity funds. Ms. Laurent also serves as AML Officer of The North Carolina Capital Management Trust: Cash and Term Portfolio (2008-present) and is an employee of Fidelity Investments. Previously, Ms. Laurent was Senior Vice President and Head of Legal for Fidelity Business Services India Pvt. Ltd. (2006-
2008), and Senior Vice President, Deputy General Counsel and Group Head for FMR LLC (2005-2006). |
Christine Reynolds (52) |
| Year of Election or Appointment: 2008 Chief Financial Officer of the Fidelity funds. Ms. Reynolds became President of Fidelity Pricing and Cash Management Services (FPCMS) in August 2008. Ms. Reynolds served as Chief Operating Officer of FPCMS (2007-2008). Previously, Ms. Reynolds served as President, Treasurer, and Anti-Money Laundering officer of the Fidelity funds (2004-2007). |
Kenneth A. Rathgeber (63) |
| Year of Election or Appointment: 2004 Chief Compliance Officer of Fidelity's Equity and High Income Funds. Mr. Rathgeber is Chief Compliance Officer of Fidelity Management & Research (Hong Kong) Limited (2008-present), Fidelity Management & Research (Japan) Inc. (2008-present), FMR (2005-present), FMR Co., Inc. (2005-present), Fidelity Management & Research (U.K.) Inc. (2005-
present), Fidelity Research & Analysis Company (2005-present), Fidelity Investments Money Management, Inc. (2005-present), Pyramis Global Advisors, LLC (2005-present), and Strategic Advisers, Inc. (2005-
present). |
Jeffrey S. Christian (49) |
| Year of Election or Appointment: 2009 Deputy Treasurer of the Fidelity funds. Mr. Christian is an employee of Fidelity Investments. Previously, Mr. Christian served as Chief Financial Officer (2008-2009) of certain Fidelity funds and Senior Vice President of Fidelity Pricing and Cash Management Services (FPCMS) (2004-2009). |
Bryan A. Mehrmann (49) |
| Year of Election or Appointment: 2005 Deputy Treasurer of the Fidelity funds. Mr. Mehrmann is an employee of Fidelity Investments. |
Adrien E. Deberghes (43) |
| Year of Election or Appointment: 2008 Deputy Treasurer of Fidelity's Equity and High Income Funds. Mr. Deberghes also serves as Assistant Treasurer of other Fidelity funds (2010-present) and is an employee of Fidelity Investments (2008-
present). Previously, Mr. Deberghes served as Senior Vice President of Mutual Fund Administration at State Street Corporation (2007-2008), Senior Director of Mutual Fund Administration at Investors Bank & Trust (2005-2007), and Director of Finance for Dunkin' Brands (2000-2005). |
Stephanie J. Dorsey (41) |
| Year of Election or Appointment: 2010 Assistant Treasurer of Fidelity's Equity and High Income Funds. Ms. Dorsey also serves as Deputy Treasurer of other Fidelity funds (2008-
present) and is an employee of Fidelity Investments (2008-present). Previously, Ms. Dorsey served as Treasurer (2004-2008) of the JPMorgan Mutual Funds and Vice President (2004-2008) of JPMorgan Chase Bank. |
John R. Hebble (52) |
| Year of Election or Appointment: 2009 Assistant Treasurer of Fidelity's Equity and High Income Funds. Mr. Hebble also serves as Treasurer and Chief Financial Officer of The North Carolina Capital Management Trust: Cash and Term Portfolio (2008-present), President and Treasurer of other Fidelity funds (2008-present) and is an employee of Fidelity Investments. |
Gary W. Ryan (52) |
| Year of Election or Appointment: 2005 Assistant Treasurer of the Fidelity funds. Mr. Ryan is an employee of Fidelity Investments. Previously, Mr. Ryan served as Vice President of Fund Reporting in Fidelity Pricing and Cash Management Services (FPCMS) (1999-2005). |
Jonathan Davis (42) |
| Year of Election or Appointment: 2010 Assistant Treasurer of the Fidelity funds. Mr. Davis is an employee of Fidelity Investments. Previously, Mr. Davis served as Vice President and Associate General Counsel of FMR LLC (2003-2010). |
Annual Report
The Board of Trustees of Fidelity International Growth Fund voted to pay to shareholders of record at the opening of business on record date, the following distributions per share derived from capital gains realized from sales of portfolio securities, and dividends derived from net investment income:
| Pay Date | Record Date | Dividends | Capital Gains |
Institutional Class | 12/06/10 | 12/03/10 | $0.057 | $0.011 |
Institutional Class designates 100% of the dividends distributed during the fiscal year as amounts which may be taken into account as a dividend for purposes of the maximum rate under section 1(h)(11) of the Internal Revenue Code.
The amounts per share which represent income derived from sources within, and taxes paid to, foreign countries or possessions of the United States are as follows:
| Pay Date | Income | Taxes |
Institutional Class | 12/7/2009 | $0.063 | $0.0099 |
The fund will notify shareholders in January 2011 of amounts for use in preparing 2010 income tax returns.
Annual Report
Board Approval of Investment Advisory Contracts and Management Fees
Fidelity International Growth Fund
Each year, the Board of Trustees, including the Independent Trustees (together, the Board), votes on the renewal of the management contract and sub-advisory agreements (together, the Advisory Contracts) for the fund. The Board, assisted by the advice of fund counsel and Independent Trustees' counsel, requests and considers a broad range of information relevant to the renewal of the Advisory Contracts throughout the year.
The Board meets regularly and considers at each of its meetings factors that are relevant to its annual consideration of the renewal of the fund's Advisory Contracts, including the services and support provided to the fund and its shareholders. The Board has established various standing committees, each composed of Independent Trustees with varying backgrounds, to which the Board has assigned specific subject matter responsibilities in order to enhance effective decision-making by the Board. The Board, acting directly and through its Committees, requests and receives information concerning the annual consideration of the renewal of the fund's Advisory Contracts. The Board also meets as needed to consider matters specifically related to the Board's annual consideration of the renewal of Advisory Contracts. Members of the Board may also meet with trustees of other Fidelity funds through ad hoc joint committees to discuss certain matters relevant to the Fidelity funds.
At its July 2010 meeting, the Board of Trustees, including the Independent Trustees, unanimously determined to renew the fund's Advisory Contracts. In reaching its determination, the Board considered all factors it believed relevant, including (i) the nature, extent, and quality of the services to be provided to the fund and its shareholders (including the investment performance of the fund); (ii) the competitiveness of the fund's management fee and total expenses; (iii) the total costs of the services to be provided by and the profits to be realized by Fidelity from its relationship with the fund; (iv) the extent to which economies of scale would be realized as the fund grows; and (v) whether fee levels reflect these economies of scale, if any, for the benefit of fund shareholders.
In considering whether to renew the Advisory Contracts for the fund, the Board reached a determination, with the assistance of fund counsel and Independent Trustees' counsel and through the exercise of its business judgment, that the renewal of the Advisory Contracts is in the best interests of fund shareholders and that the compensation to be received by Fidelity under the management contract is fair and reasonable. The Board's decision to renew the Advisory Contracts was not based on any single factor noted above, but rather was based on a comprehensive consideration of all the information provided to the Board at its meetings throughout the year. The Board, in reaching its determination to renew the Advisory Contracts, is aware that shareholders in the fund have a broad range of investment choices available to them, including a wide choice among mutual funds offered by Fidelity's competitors, and that the fund's shareholders, with the opportunity to review and weigh the disclosure provided by the fund in its prospectus and other public disclosures, have chosen to invest in this fund, managed by Fidelity.
Annual Report
Nature, Extent, and Quality of Services Provided. The Board considered the staffing within the investment adviser, FMR, and the sub-advisers (together, the Investment Advisers), including the backgrounds of the fund's investment personnel and the fund's investment objective and discipline. The Independent Trustees also had discussions with senior management of Fidelity's investment operations and investment groups. The Board considered the structure of the portfolio manager compensation program and whether this structure provides appropriate incentives to act in the best interest of the fund.
Resources Dedicated to Investment Management and Support Services. The Board and the equity research subcommittee of the Board's Fund Oversight Committee reviewed the size, education, and experience of the Investment Advisers' investment staff, their use of technology, and the Investment Advisers' approach to recruiting, training, and retaining portfolio managers and other research, advisory, and management personnel. The Board noted that Fidelity's analysts have access to a variety of technological tools and market and securities data that enable them to perform both fundamental and quantitative analysis and to specialize in various disciplines. The Board considered Fidelity's extensive global research capabilities that enable the Investment Advisers to aggregate data from various sources in an effort to produce positive investment results. The Board also considered that Fidelity's portfolio managers and analysts have access to daily portfolio attribution that allows for monitoring of a fund's portfolio, as well as an electronic communication system that provides immediate real-time access to research concerning issuers and credit enhancers. The Board noted FMR's continued focus on strengthening the organization and discipline of equity portfolio management and research.
Shareholder and Administrative Services. The Board considered (i) the nature, extent, quality, and cost of advisory, administrative, and shareholder services performed by the Investment Advisers and their affiliates under the Advisory Contracts and under separate agreements covering transfer agency, pricing and bookkeeping, and securities lending services for the fund; (ii) the nature and extent of the investment adviser's supervision of third party service providers, principally custodians and subcustodians; and (iii) the resources devoted to, and the record of compliance with, the fund's compliance policies and procedures. The Board also reviewed the allocation of fund brokerage, including allocations to brokers affiliated with the Investment Advisers, the use of brokerage commissions to pay fund expenses, and the use of "soft" commission dollars to pay for research services.
The Board noted that the growth of fund assets over time across the complex allows Fidelity to reinvest in the development of services designed to enhance the value or convenience of the Fidelity funds as investment vehicles. These services include 24-hour access to account information and market information through phone representatives and over the Internet, and investor education materials and asset allocation tools.
Annual Report
Board Approval of Investment Advisory Contracts and
Management Fees - continued
Investment in a Large Fund Family. The Board considered the benefits to shareholders of investing in a Fidelity fund, including the benefits of investing in a fund that is part of a large family of funds offering a variety of investment disciplines and providing a large variety of mutual fund investor services. The Board noted that Fidelity had taken, or had made recommendations that resulted in the Fidelity funds taking, a number of actions over the previous year that benefited particular funds, including (i) dedicating additional resources to investment research and restructuring and broadening the focus of the investment research teams; (ii) bolstering the senior management team that oversees asset management; (iii) launching Class F of certain funds as a lower-fee class available to Freedom K and Freedom Index Funds; (iv) lowering the initial investment minimums and ongoing balance requirements for Real Estate High Income Fund; (v) eliminating subsequent purchase minimums for all funds and adding a waiver of the investment minimum requirement for new accounts opened with the proceeds of a systematic withdrawal plan; (vi) eliminating the withdrawal minimum and maximum limits for systematic withdrawals from Advisor funds; (vii) expanding sales load waivers on Class A shares for Destiny Planholders and expanding Institutional Class eligibility for Class O Destiny Planholders; and (viii) changing certain Class A and Class T sales charge structures to further align them with industry practices.
Investment Performance. The Board considered whether the fund has operated in accordance with its investment objective, as well as its record of compliance with its investment restrictions. It also reviewed the fund's absolute investment performance for each class, as well as the fund's relative investment performance for each class measured against (i) a broad-based securities market index, and (ii) a custom peer group of mutual funds deemed appropriate by Fidelity and reviewed by the Board. Because the fund had been in existence less than three calendar years, the following chart considered by the Board shows, for the one-year period ended December 31, 2009, the total returns of the retail class and Class B of the fund, the total return of a broad-based securities market index ("benchmark"), and a range of total returns of a custom peer group of mutual funds defined by FMR based on categories assigned by Morningstar, Inc. The returns of the retail class and Class B show the performance of the highest and lowest performing classes, respectively. The box within the chart shows the 25th percentile return (bottom of box) and the 75th percentile return (top of box) of the peer group. Returns shown above the box are in the first quartile and returns shown below the box are in the fourth quartile. The percentage beaten numbers noted below the chart correspond to the percentile box and represent the percentage of funds in the peer group whose performance was equal to or lower than that of the class indicated. The fund's custom peer group, defined by FMR, is a peer group that FMR believes provides a more meaningful performance comparison than the peer group assigned by Morningstar, Inc., which assigns mutual funds to categories based on their investment styles as measured by their underlying portfolio holdings.
Annual Report
Fidelity International Growth Fund

The Board reviewed the fund's relative investment performance against its peer group and noted that the performance of the retail class of the fund was in the third quartile for the period shown. The Board also noted that the investment performance of the retail class of the fund compared favorably to its benchmark for the period shown. The Board considered that the variations in performance among the fund's classes reflect the variations in class expenses, which result in lower performance for higher expense classes. The Board also reviewed the fund's performance since inception as well as performance in the current year. The Board noted that it is difficult to evaluate in any comprehensive fashion the performance of the fund, in light of its relatively recent commencement of operations.
The Board also considered that the fund's management fee is subject to upward or downward adjustment depending upon whether, and to what extent, the fund's investment performance for the performance period exceeds, or is exceeded by, the record (over the same period) of a Board-approved performance adjustment index. The Board realizes that the performance adjustment provides FMR with a strong economic incentive to seek to achieve superior performance for the fund's shareholders and helps to more closely align the interests of FMR and the fund's shareholders.
Based on its review, and giving particular weight to the nature and quality of the resources dedicated by the Investment Advisers to maintain and improve relative performance and factoring in the unprecedented market events in recent years, the Board concluded that the nature, extent, and quality of investment management and support services and of shareholder and administrative services provided to the fund will benefit the fund's shareholders, particularly in light of the Board's view that the fund's shareholders benefit from investing in a fund that is part of a large family of funds offering a variety of investment disciplines and services.
Annual Report
Board Approval of Investment Advisory Contracts and
Management Fees - continued
Competitiveness of Management Fee and Total Fund Expenses. The Board considered the fund's management fee and total expenses compared to "mapped groups" of competitive funds and classes. Fidelity creates "mapped groups" by combining similar Lipper investment objective categories that have comparable management fee characteristics. Combining Lipper investment objective categories aids the Board's management fee and total expense comparisons by broadening the competitive group used for comparison and by reducing the number of universes to which various Fidelity funds are compared.
Management Fee. The Board considered two proprietary management fee comparisons for the 12-month (or shorter) periods shown in the chart below. The group of Lipper funds used by the Board for management fee comparisons is referred to below as the "Total Mapped Group." The Total Mapped Group comparison focuses on a fund's standing relative to the total universe of comparable funds available to investors, in terms of gross management fees before expense reimbursements or caps, and without giving effect to the fund's performance adjustment. "TMG %" represents the percentage of funds in the Total Mapped Group that had management fees that were lower than the fund's. For example, a TMG % of 15% means that 85% of the funds in the Total Mapped Group had higher management fees than the fund. The "Asset-Size Peer Group" (ASPG) comparison focuses on a fund's standing relative to non-Fidelity funds similar in size to the fund within the Total Mapped Group. The ASPG represents at least 15% of the funds in the Total Mapped Group with comparable asset size and management fee characteristics, subject to a minimum of 50 funds (or all funds in the Total Mapped Group if fewer than 50). Additional information, such as the ASPG quartile in which the fund's management fee ranked and the impact of the fund's performance adjustment, is also included in the chart and considered by the Board.
Annual Report
Fidelity International Growth Fund

The Board noted that the fund's management fee ranked below the median of its Total Mapped Group and below the median of its ASPG for 2009. The Board also noted the effect of the fund's positive performance adjustment on the fund's management fee ranking. The Board noted that the performance adjustment for each year represents calculations for performance periods that differ from the periods shown in the performance charts above.
Based on its review, the Board concluded that the fund's management fee is fair and reasonable in light of the services that the fund receives and the other factors considered.
Total Expenses. In its review of each class's total expenses, the Board considered the fund's management fee as well as other fund or class expenses, as applicable, such as transfer agent fees, pricing and bookkeeping fees, fund-paid 12b-1 fees, and custodial, legal, and audit fees. The Board also noted the effects of any waivers and reimbursements on fees and expenses, as well as the impact of the fund's performance adjustment. As part of its review, the Board also considered current and historical total expenses of each class of the fund compared to competitive fund median expenses. Each class of the fund is compared to those funds and classes in the Total Mapped Group (used by the Board for management fee comparisons) that have a similar sales load structure.
The Board noted that the total expenses of each of Class A and the retail class ranked below its competitive median for 2009, the total expenses of Class B ranked equal to its competitive median for 2009, and the total expenses of each of Class T, Class C, and Institutional Class ranked above its competitive median for 2009. The Board considered that the total expenses for Class T were above the median primarily because its 12b-1 fee is higher than the typical front-end load class. The Board noted that the fund offers multiple classes, each of which has a different sales load and 12b-1 fee structure, and that the multiple structures are intended to offer a range of pricing options for the intermediary market. The Board also noted that the total expenses of the classes vary primarily by the level of their 12b-1 fees, although differences in transfer agent fees may also cause expenses to vary from class to class.
Annual Report
Board Approval of Investment Advisory Contracts and
Management Fees - continued
Fees Charged to Other Fidelity Clients. The Board also considered Fidelity fee structures and other information with respect to clients of FMR and its affiliates, such as other mutual funds advised or subadvised by FMR or its affiliates, pension plan clients, and other institutional clients. In March 2010, the Board created an ad hoc joint committee with the board of other Fidelity funds (the Committee) to review and compare Fidelity's institutional investment advisory business with its business of providing services to the Fidelity funds, including the differences in services provided, fees charged, and costs incurred, as well as competition in their respective marketplaces.
Based on its review of total expenses and fees charged to other Fidelity clients, the Board concluded that the total expenses of each class of the fund were reasonable, although in some cases above the median of the universe presented for comparison, in light of the services that the fund and its shareholders receive and the other factors considered, including the findings of the Committee.
Costs of the Services and Profitability. The Board considered the revenues earned and the expenses incurred by Fidelity in conducting the business of developing, marketing, distributing, managing, administering and servicing the fund and its shareholders. The Board also considered the level of Fidelity's profits in respect of all the Fidelity funds.
On an annual basis, FMR presents to the Board Fidelity's profitability for the fund. Fidelity calculates the profitability for each fund, as well as aggregate profitability for groups of Fidelity funds and all Fidelity funds, using a series of detailed revenue and cost allocation methodologies which originate with the audited books and records of Fidelity. The Audit Committee of the Board reviews any significant changes from the prior year's methodologies.
PricewaterhouseCoopers LLP (PwC), independent registered public accounting firm and auditor to Fidelity and certain Fidelity funds, has been engaged annually by the Board as part of the Board's assessment of Fidelity's profitability analysis. PwC's engagement includes the review and assessment of Fidelity's methodologies used in determining the revenues and expenses attributable to Fidelity's mutual fund business, and completion of agreed-upon procedures surrounding the mathematical accuracy of fund profitability and its conformity to allocation methodologies. After considering PwC's reports issued under the engagement and information provided by Fidelity, the Board believes that while other allocation methods may also be reasonable, Fidelity's profitability methodologies are reasonable in all material respects.
Annual Report
The Board has also reviewed Fidelity's non-fund businesses and fall-out benefits related to the mutual fund business as well as cases where Fidelity's affiliates may benefit from or be related to the fund's business.
The Board considered the costs of the services provided by and the profits realized by Fidelity in connection with the operation of the fund and were satisfied that the profitability was not excessive in the circumstances.
Economies of Scale. The Board considered whether there have been economies of scale in respect of the management of the Fidelity funds, whether the Fidelity funds (including the fund) have appropriately benefited from any such economies of scale, and whether there is potential for realization of any further economies of scale. The Board considered the extent to which the fund will benefit from economies of scale through increased services to the fund, through waivers or reimbursements, or through fee or expense reductions.
In February 2009, the Board and the board of other Fidelity funds created an ad hoc committee (the Economies of Scale Committee) to analyze whether FMR attains economies of scale in respect of the management and servicing of the Fidelity funds, whether the Fidelity funds have appropriately benefited from such economies of scale, and whether there is potential for realization of any further economies of scale.
The Board recognized that the fund's management contract incorporates a "group fee" structure, which provides for lower group fee rates as total fund assets under FMR's management increase, and for higher group fee rates as total fund assets under FMR's management decrease. FMR calculates the group fee rates based on a tiered asset "breakpoint" schedule that varies based on asset class. The Board considered that the group fee is designed to deliver the benefits of economies of scale to fund shareholders when total Fidelity fund assets increase, even if assets of any particular fund are unchanged or have declined, because some portion of Fidelity's costs are attributable to services provided to all Fidelity funds, and all funds benefit if those costs can be allocated among more assets. The Board concluded that, given the group fee structure, fund shareholders will benefit from lower management fees as assets under FMR's management increase at the fund complex level, regardless of whether Fidelity achieves any such economies of scale.
The Board concluded, considering the findings of the Economies of Scale Committee, that any potential economies of scale are being appropriately shared between fund shareholders and Fidelity.
Additional Information Requested by the Board. In order to develop fully the factual basis for consideration of the Fidelity funds' Advisory Contracts, the Board requested and received additional information on certain topics, including (i) fund performance trends, actions to be taken by FMR to improve certain funds' overall performance, and Fidelity's long-term strategies for certain funds; (ii) portfolio manager changes that have occurred during the past year and length of portfolio manager tenure for different categories of funds over time; (iii) Fidelity's compensation structure for portfolio managers, research analysts, and other key personnel, the rationale for the compensation structure, and how the compensation structure provides appropriate performance incentives; (iv) the amount of the investment that each portfolio manager has made in the Fidelity fund(s) that he or she manages; (v) management and other fees paid by FMR to affiliated sub-advisers on behalf of the Fidelity funds; (vi) Fidelity's fee structures and rationale for recommending different fees among different categories of funds; (vii) Fidelity's rationale for recommending which funds should have a performance adjustment component as part of their management fees; (viii) the rationale for any differences between fund fee structures and fee structures in place for other Fidelity clients; and (ix) explanations regarding the relative total expenses borne by certain funds and classes, total expense competitive trends, and actions that might be taken by FMR to reduce total expenses for certain funds and classes.
Annual Report
Board Approval of Investment Advisory Contracts and
Management Fees - continued
Based on its evaluation of all of the conclusions noted above, and after considering all factors it believed relevant, the Board ultimately concluded that the advisory fee structures are fair and reasonable, and that the fund's Advisory Contracts should be renewed.
Annual Report
Investment Adviser
Fidelity Management & Research Company
Boston, MA
Investment Sub-Advisers
FMR Co., Inc.
Fidelity Management & Research
(U.K.) Inc.
Fidelity Management & Research
(Hong Kong) Limited
Fidelity Management & Research
(Japan) Inc.
Fidelity Research & Analysis Company
FIL Investment Advisors
FIL Investments (Japan) Limited
FIL Investment Advisors (UK) Ltd.
General Distributor
Fidelity Distributors Corporation
Boston, MA
Transfer and Service Agents
Fidelity Investments Institutional Operations Company, Inc.
Boston, MA
Fidelity Service Company, Inc.
Boston, MA
Custodian
State Street Bank and Trust Company
Quincy, MA
AIGFI-UANN-1210
1.853341.102
Fidelity®
International Small Cap
Fund
Annual Report
October 31, 2010
(2_fidelity_logos) (Registered_Trademark)
Contents
Chairman's Message | <Click Here> | The Chairman's message to shareholders. |
Performance | <Click Here> | How the fund has done over time. |
Management's Discussion of Fund Performance | <Click Here> | The Portfolio Managers' review of fund performance and strategy. |
Shareholder Expense Example | <Click Here> | An example of shareholder expenses. |
Investment Changes | <Click Here> | A summary of major shifts in the fund's investments over the past six months. |
Investments | <Click Here> | A complete list of the fund's investments with their market values. |
Financial Statements | <Click Here> | Statements of assets and liabilities, operations, and changes in net assets, as well as financial highlights. |
Notes | <Click Here> | Notes to financial statements. |
Report of Independent Registered Public Accounting Firm | <Click Here> | |
Trustees and Officers | <Click Here> | |
Distributions | <Click Here> | |
Board Approval of Investment Advisory Contracts and Management Fees | <Click Here> | |
To view a fund's proxy voting guidelines and proxy voting record for the 12-month period ended June 30, visit http://www.fidelity.com/proxyvotingresults or visit the Securities and Exchange Commission's (SEC) web site at http://www.sec.gov. You may also call 1-800-544-8544 to request a free copy of the proxy voting guidelines.
Standard & Poor's, S&P and S&P 500 are registered service marks of The McGraw-Hill Companies, Inc. and have been licensed for use by Fidelity Distributors Corporation.
Other third party marks appearing herein are the property of their respective owners.
All other marks appearing herein are registered or unregistered trademarks or service marks of FMR LLC or an affiliated company.
Annual Report
This report and the financial statements contained herein are submitted for the general information of the shareholders of the fund. This report is not authorized for distribution to prospective investors in the fund unless preceded or accompanied by an effective prospectus.
A fund files its complete schedule of portfolio holdings with the SEC for the first and third quarters of each fiscal year on Form N-Q. Forms N-Q are available on the SEC's web site at http://www.sec.gov. A fund's Forms N-Q may be reviewed and copied at the SEC's Public Reference Room in Washington, DC. Information regarding the operation of the SEC's Public Reference Room may be obtained by calling 1-800-SEC-0330. For a complete list of a fund's portfolio holdings, view the most recent holdings listing, semiannual report, or annual report on Fidelity's web site at http://www.fidelity.com or http://www.advisor.fidelity.com, as applicable.
NOT FDIC INSURED • MAY LOSE VALUE • NO BANK GUARANTEE
Neither the fund nor Fidelity Distributors Corporation is a bank.
Annual Report
(photo_of_Edward_C_Johnson_3d)
Dear Shareholder:
Equities have staged a rally in the second half of 2010, shaking off concerns about the European debt crisis and the possibility of a double-dip recession in the U.S. Although the short-term surge pushed major equity indexes back into positive territory for the year, several questions remain about the longer-term outlook, including lackluster economic growth and persistently high unemployment. Financial markets are always unpredictable, of course, but there also are several time-tested investment principles that can help put the odds in your favor.
One of the basic tenets is to invest for the long term. Over time, riding out the markets' inevitable ups and downs has proven much more effective than selling into panic or chasing the hottest trend. Even missing only a few of the markets' best days can significantly diminish investor returns. Patience also affords the benefits of compounding - of earning interest on additional income or reinvested dividends and capital gains. There can be tax advantages and cost benefits to consider as well. While staying the course doesn't eliminate risk, it can considerably lessen the effect of short-term declines.
You can further manage your investing risk through diversification. And today, more than ever, geographic diversification should be taken into account. Studies indicate that asset allocation is the single most important determinant of a portfolio's long-term success. The right mix of stocks, bonds and cash - aligned to your particular risk tolerance and investment objective - is very important. Age-appropriate rebalancing is also an essential aspect of asset allocation. For younger investors, an emphasis on equities - which historically have been the best-performing asset class over time - is encouraged. As investors near their specific goal, such as retirement or sending a child to college, consideration may be given to replacing volatile assets (e.g. common stocks) with more-stable fixed investments (bonds or savings plans).
A third principle - investing regularly - can help lower the average cost of your purchases. Investing a certain amount of money each month or quarter helps ensure you won't pay for all your shares at market highs. This strategy - known as dollar cost averaging - also reduces "emotion" from investing, helping shareholders avoid selling weak performers just prior to an upswing, or chasing a hot performer just before a correction.
We invite you to contact us via the Internet, through our Investor Centers or by phone. It is our privilege to provide you the information you need to make the investments that are right for you.
Sincerely,
(The chairman's signature appears here.)
Edward C. Johnson 3d
Annual Report
Average annual total return reflects the change in the value of an investment, assuming reinvestment of the class' distributions from dividend income and capital gains (the profits earned upon the sale of securities that have grown in value, if any) and assuming a constant rate of performance each year. The $10,000 table and the fund's returns do not reflect the deduction of taxes that a shareholder would pay on fund distributions or the redemption of fund shares. During periods of reimbursement by Fidelity, a fund's total return will be greater than it would be had the reimbursement not occurred. How a fund did yesterday is no guarantee of how it will do tomorrow.
Average Annual Total Returns
Periods ended October 31, 2010 | Past 1
year | Past 5
years | Life of
class A |
Fidelity® International Small Cap Fund | 21.02% | 5.82% | 17.79% |
A From September 18, 2002.
$10,000 Over Life of Fund
Let's say hypothetically that $10,000 was invested in Fidelity International Small Cap Fund, a class of the fund, on September 18, 2002, when the fund started. The chart shows how the value of your investment would have changed, and also shows how the MSCI® EAFE® Small Cap Index performed over the same period.
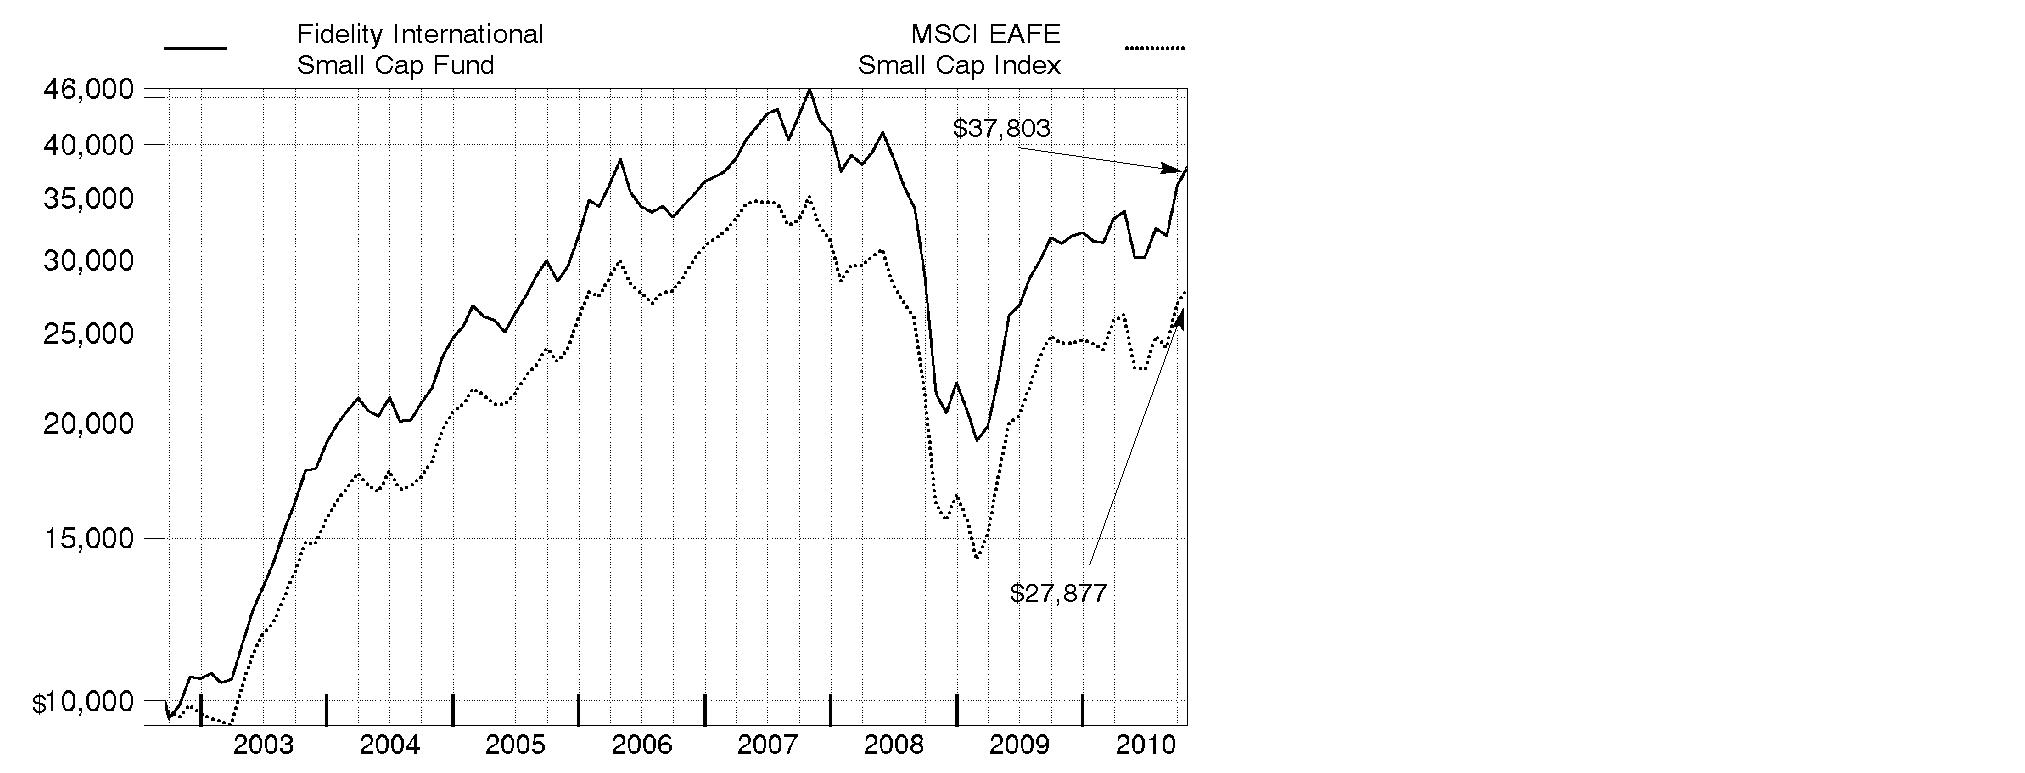
Annual Report
Market Recap: International stocks rode a wave of volatility similar to that of their U.S. counterparts during the 12 months ending October 31, 2010. Stocks gained modestly in the first half of the period, despite growing concerns about the European debt crisis. Sentiment turned decidedly negative in May and June, however, and the market suffered a precipitous decline. These losses were more than offset during the last four months of the period, when signs of economic growth and subsiding debt fears helped propel international stocks about 21%. For the full year, the MSCI® ACWI® (All Country World Index) ex USA Index gained 12.76%, boosted in part by a generally depreciating U.S. dollar. Within the index, Canada and emerging markets were standouts, returning 23% and 24%, respectively. Results in the latter group were led by strong-performing India, Mexico and South Africa, while China fell short of the MSCI benchmark due to cooling economic growth. The developed Asia ex Japan segment rose 16% for the period, lifted by solid results from Singapore and Hong Kong. Meanwhile, Europe rose just 9%, held back mainly by debt-riddled Spain and Italy, as well as lagging major constituent France. Japan returned only 5%, a result of that nation's continued weak economy.
Comments from Colin Stone, Noriko Takahashi and Dale Nicholls, Co-Portfolio Managers of Fidelity® International Small Cap Fund: During the year, the fund's Retail Class shares gained 21.02%, topping the 14.31% mark of the MSCI EAFE® (Europe, Australasia, Far East) Small Cap Index. The biggest boost to relative performance came from stock selection in consumer discretionary. Among countries, performance benefited the most from favorable picks in China and Australia as well as a large overweighting and solid picks in Germany. On the negative side, stock selection in industrials significantly dampened the fund's gain. Geographically, stock picking in the United Kingdom and France hampered performance. All three subportfolios solidly beat their respective benchmarks. The Asia-Pacific ex Japan "sub" was boosted by Hong Kong holding Sino Prosper State Gold Resources Holdings, while Australian oil/gas exploration holding AWE detracted. The Europe/Africa/Middle East sub was lifted by Canada's European Goldfields. Connaught - a U.K. provider of housing-related services - curbed results. In the Japanese subportfolio, the top contributor was auto transmission maker Exedy. Conversely, an out-of-benchmark stake in Ibiden, which makes printed circuit boards, hurt.
Note to shareholders: The fund reopened to new accounts on November 10, 2009.
The views expressed above reflect those of the portfolio manager(s) only through the end of the period as stated on the cover of this report and do not necessarily represent the views of Fidelity or any other person in the Fidelity organization. Any such views are subject to change at any time based upon market or other conditions and Fidelity disclaims any responsibility to update such views. These views may not be relied on as investment advice and, because investment decisions for a Fidelity fund are based on numerous factors, may not be relied on as an indication of trading intent on behalf of any Fidelity fund.
Annual Report
Shareholder Expense Example
As a shareholder of the Fund, you incur two types of costs: (1) transaction costs, including sales charges (loads) on purchase payments or redemption proceeds, redemption fees, and (2) ongoing costs, including management fees, distribution and/or service (12b-1) fees and other Fund expenses. This Example is intended to help you understand your ongoing costs (in dollars) of investing in the Fund and to compare these costs with the ongoing costs of investing in other mutual funds.
The Example is based on an investment of $1,000 invested at the beginning of the period and held for the entire period (May 1, 2010 to October 31, 2010).
Actual Expenses
The first line of the accompanying table for each class of the Fund provides information about actual account values and actual expenses. You may use the information in this line, together with the amount you invested, to estimate the expenses that you paid over the period. Simply divide your account value by $1,000.00 (for example, an $8,600 account value divided by $1,000.00 = 8.6), then multiply the result by the number in the first line for a class of the Fund under the heading entitled "Expenses Paid During Period" to estimate the expenses you paid on your account during this period. A small balance maintenance fee of $12.00 that is charged once a year may apply for certain accounts with a value of less than $2,000. This fee is not included in the table below. If it was, the estimate of expenses you paid during the period would be higher, and your ending account value lower, by this amount. In addition, the Fund, as a shareholder in the underlying Fidelity Central Funds, will indirectly bear its pro-rata share of the fees and expenses incurred by the underlying Fidelity Central Funds. These fees and expenses are not included in the Fund's annualized expense ratio used to calculate the expense estimate in the table below.
Hypothetical Example for Comparison Purposes
The second line of the accompanying table for each class of the Fund provides information about hypothetical account values and hypothetical expenses based on a Class' actual expense ratio and an assumed rate of return of 5% per year before expenses, which is not the Class' actual return. The hypothetical account values and expenses may not be used to estimate the actual ending account balance or expenses you paid for the period. You may use this information to compare the ongoing costs of investing in the Fund and other funds. To do so, compare this 5% hypothetical example with the 5% hypothetical examples that appear in the shareholder reports of the other funds. A small balance maintenance fee of $12.00 that is charged once a year may apply for certain accounts with a value of less than $2,000. This fee is not included in the table below. If it was, the estimate of expenses you paid during the period would be higher, and your ending account value lower, by this amount. In addition, the Fund, as a shareholder in the underlying Fidelity Central Funds, will indirectly bear its pro-rata share of the fees and expenses incurred by the underlying Fidelity Central Funds. These fees and expenses are not included in the Fund's annualized expense ratio used to calculate the expense estimate in the table below.
Please note that the expenses shown in the table are meant to highlight your ongoing costs only and do not reflect any transaction costs. Therefore, the second line of the table is useful in comparing ongoing costs only, and will not help you determine the relative total costs of owning different funds. In addition, if these transactional costs were included, your costs would have been higher.
Annual Report
| Annualized
Expense
Ratio | Beginning
Account Value
May 1, 2010 | Ending
Account Value
October 31, 2010 | Expenses Paid
During Period*
May 1, 2010 to October 31, 2010 |
Class A | 1.65% | | | |
Actual | | $ 1,000.00 | $ 1,114.00 | $ 8.79 |
HypotheticalA | | $ 1,000.00 | $ 1,016.89 | $ 8.39 |
Class T | 1.90% | | | |
Actual | | $ 1,000.00 | $ 1,112.10 | $ 10.11 |
HypotheticalA | | $ 1,000.00 | $ 1,015.63 | $ 9.65 |
Class B | 2.40% | | | |
Actual | | $ 1,000.00 | $ 1,109.90 | $ 12.76 |
HypotheticalA | | $ 1,000.00 | $ 1,013.11 | $ 12.18 |
Class C | 2.40% | | | |
Actual | | $ 1,000.00 | $ 1,109.60 | $ 12.76 |
HypotheticalA | | $ 1,000.00 | $ 1,013.11 | $ 12.18 |
International Small Cap | 1.36% | | | |
Actual | | $ 1,000.00 | $ 1,115.60 | $ 7.25 |
HypotheticalA | | $ 1,000.00 | $ 1,018.35 | $ 6.92 |
Institutional Class | 1.31% | | | |
Actual | | $ 1,000.00 | $ 1,116.20 | $ 6.99 |
HypotheticalA | | $ 1,000.00 | $ 1,018.60 | $ 6.67 |
A 5% return per year before expenses
*Expenses are equal to each Class' annualized expense ratio, multiplied by the average account value over the period, multiplied by 184/365 (to reflect the one-half year period).
Annual Report
Investment Changes (Unaudited)
Geographic Diversification (% of fund's net assets) |
As of October 31, 2010 |
 | Japan 23.4% | |
 | United Kingdom 16.7% | |
 | Germany 9.5% | |
 | France 8.8% | |
 | Australia 7.4% | |
 | United States of America 4.2% | |
 | Cayman Islands 2.7% | |
 | Canada 2.2% | |
 | Norway 2.0% | |
 | Other 23.1% | |

Percentages are adjusted for the effect of futures contracts, if applicable. |
As of April 30, 2010 |
| Japan 25.6% | |
| United Kingdom 15.7% | |
| Germany 10.7% | |
| France 9.3% | |
| Australia 7.4% | |
| United States of America 3.5% | |
| Netherlands 2.9% | |
| Bermuda 2.4% | |
| Cayman Islands 1.8% | |
| Other 20.7% | |

Percentages are adjusted for the effect of futures contracts, if applicable. |
Asset Allocation |
| % of fund's
net assets | % of fund's net assets
6 months ago |
Stocks, Investment Companies and Equity Futures | 96.1 | 96.8 |
Short-Term Investments and Net Other Assets | 3.9 | 3.2 |
Top Ten Stocks as of October 31, 2010 |
| % of fund's
net assets | % of fund's net assets
6 months ago |
European Goldfields Ltd. (Canada, Metals & Mining) | 1.3 | 0.8 |
IG Group Holdings PLC (United Kingdom, Diversified Financial Services) | 1.2 | 1.0 |
SeLoger.com (France, Media) | 1.1 | 1.0 |
Elekta AB (B Shares) (Sweden, Health Care Equipment & Supplies) | 1.1 | 0.9 |
Ipsos SA (France, Media) | 1.0 | 0.8 |
Gemalto NV (Netherlands, Computers & Peripherals) | 1.0 | 1.1 |
Lanxess AG (Germany, Chemicals) | 1.0 | 0.8 |
Wacker Chemie AG (Germany, Chemicals) | 1.0 | 0.5 |
Craneware PLC (United Kingdom, Health Care Technology) | 0.9 | 0.7 |
Pertama Holdings Ltd. (Singapore, Specialty Retail) | 0.8 | 0.0 |
| 10.4 | |
Market Sectors as of October 31, 2010 |
| % of fund's
net assets | % of fund's net assets
6 months ago |
Consumer Discretionary | 19.2 | 18.6 |
Information Technology | 16.8 | 17.0 |
Industrials | 15.1 | 19.3 |
Materials | 12.8 | 10.8 |
Financials | 10.5 | 10.9 |
Health Care | 9.5 | 9.6 |
Energy | 5.9 | 5.3 |
Telecommunication Services | 2.1 | 2.1 |
Consumer Staples | 1.7 | 1.6 |
Utilities | 0.8 | 0.9 |
Annual Report
Investments October 31, 2010
Showing Percentage of Net Assets
Common Stocks - 94.4% |
| Shares | | Value |
Australia - 7.4% |
Allied Gold Ltd. (a) | 12,713,939 | | $ 5,667,121 |
Allied Gold Ltd. (United Kingdom) (a) | 4,914,800 | | 2,145,732 |
Ausenco Ltd. | 305,858 | | 764,066 |
Austal Ltd. | 1,095,023 | | 2,628,211 |
Australian Worldwide Exploration Ltd. (a) | 922,101 | | 1,359,521 |
BlueScope Steel Ltd. | 214,319 | | 418,865 |
carsales.com Ltd. | 151,787 | | 706,316 |
Centamin Egypt Ltd. (United Kingdom) (a) | 1,924,214 | | 5,333,381 |
Charter Hall Group unit | 2,530,982 | | 1,388,507 |
Discovery Metals Ltd. (a) | 875,240 | | 1,007,479 |
DUET Group | 688,657 | | 1,170,505 |
Goodman Group unit | 6,343,283 | | 3,914,944 |
Industrea Ltd. | 2,671,615 | | 1,203,934 |
Iress Market Technology Ltd. | 142,341 | | 1,220,138 |
Ironbark Zinc Ltd. (a) | 2,305,831 | | 564,727 |
Kingsgate Consolidated NL (d) | 99,427 | | 976,959 |
Lynas Corp. Ltd. (a) | 1,537,632 | | 2,206,790 |
MAp Group unit | 226,044 | | 675,404 |
Medusa Mining Ltd. | 239,743 | | 1,308,194 |
Mineral Deposits Ltd. (a) | 5,620,000 | | 6,391,999 |
Monto Minerals Ltd. (a) | 273,551 | | 2,412 |
Navitas Ltd. | 871,259 | | 3,269,016 |
Northern Iron Ltd. (a)(d) | 423,362 | | 638,710 |
Panaust Ltd. (a) | 2,277,343 | | 1,662,094 |
Ramsay Health Care Ltd. | 179,829 | | 2,757,052 |
realestate.com.au Ltd. | 82,531 | | 871,579 |
SAI Global Ltd. | 1,018,293 | | 4,369,360 |
SomnoMed Ltd. (a) | 331,849 | | 334,849 |
Spark Infrastructure Group unit (f) | 1,461,561 | | 1,603,636 |
Super Cheap Auto Group Ltd. | 296,366 | | 1,936,534 |
Tiger Resources Ltd. (a) | 14,407,421 | | 5,151,694 |
Wotif.com Holdings Ltd. | 255,354 | | 1,170,737 |
TOTAL AUSTRALIA | | 64,820,466 |
Bailiwick of Jersey - 0.2% |
Renewable Energy Generation Ltd. | 1,777,200 | | 1,409,434 |
Belgium - 0.3% |
EVS Broadcast Equipment SA | 7,700 | | 483,209 |
Hansen Transmissions International NV (a) | 2,639,400 | | 1,889,813 |
TOTAL BELGIUM | | 2,373,022 |
Common Stocks - continued |
| Shares | | Value |
Bermuda - 1.9% |
Asia Satellite Telecommunications Holdings Ltd. | 271,000 | | $ 489,469 |
Asian Citrus Holdings Ltd. | 615,000 | | 708,524 |
Biosensors International Group Ltd. (a) | 1,769,000 | | 1,530,773 |
China Animal Healthcare Ltd. | 4,707,000 | | 1,236,483 |
China LotSynergy Holdings Ltd. (a) | 7,324,000 | | 283,464 |
China Water Affairs Group Ltd. | 1,134,000 | | 434,508 |
Luk Fook Holdings International Ltd. | 1,162,000 | | 2,851,313 |
Man Wah Holdings Ltd. | 260,000 | | 364,948 |
Mingyuan Medicare Development Co. Ltd. | 2,870,000 | | 399,884 |
Noble Group Ltd. | 315,272 | | 453,068 |
Oakley Capital Investments Ltd. (a) | 1,285,000 | | 2,655,804 |
Sihuan Pharmaceutical Holdings Group Ltd. | 42,000 | | 30,506 |
Texwinca Holdings Ltd. | 1,402,000 | | 1,530,194 |
Vtech Holdings Ltd. | 349,700 | | 3,638,549 |
TOTAL BERMUDA | | 16,607,487 |
British Virgin Islands - 0.7% |
Albidon Ltd. CDI (a) | 1,469,000 | | 208,670 |
Kalahari Energy (a)(h) | 1,451,000 | | 15 |
Playtech Ltd. | 845,876 | | 6,067,999 |
TOTAL BRITISH VIRGIN ISLANDS | | 6,276,684 |
Canada - 2.2% |
AirSea Lines (a)(h) | 1,893,338 | | 26 |
AirSea Lines warrants 8/4/11 (a)(h) | 1,862,300 | | 26 |
Banro Corp. (a) | 637,400 | | 1,874,890 |
Equinox Minerals Ltd. unit (a)(d) | 306,097 | | 1,673,263 |
European Goldfields Ltd. (a) | 854,800 | | 11,549,303 |
Platmin Ltd. (a) | 3,649,900 | | 3,888,712 |
Rock Well Petroleum, Inc. (a)(h) | 770,400 | | 8 |
Starfield Resources, Inc. (a) | 4,328,075 | | 233,399 |
TOTAL CANADA | | 19,219,627 |
Cayman Islands - 2.7% |
AirMedia Group, Inc. ADR (a) | 28,300 | | 195,553 |
China Automation Group Ltd. | 405,000 | | 316,633 |
China Dongxiang Group Co. Ltd. | 657,000 | | 367,861 |
China Forestry Holdings Co. Ltd. | 814,000 | | 386,456 |
China Haidian Holdings Ltd. | 2,154,000 | | 358,479 |
China High Precision Automation Group Ltd. | 712,000 | | 453,769 |
China Lilang Ltd. | 340,000 | | 531,630 |
China Metal International Holdings, Inc. | 1,036,000 | | 264,639 |
China Real Estate Information Corp. ADR (d) | 65,100 | | 645,141 |
Common Stocks - continued |
| Shares | | Value |
Cayman Islands - continued |
CNinsure, Inc. ADR (d) | 31,900 | | $ 819,830 |
Ctrip.com International Ltd. sponsored ADR (a) | 39,300 | | 2,046,351 |
Daphne International Holdings Ltd. | 1,392,000 | | 1,555,197 |
EVA Precision Industrial Holdings Ltd. | 5,562,000 | | 4,613,922 |
Fook Woo Group Holdings Ltd. | 1,099,000 | | 388,487 |
Global Dairy Holdings Ltd. | 197,000 | | 97,849 |
Global Education & Technology Group Ltd. ADR (a) | 3,300 | | 32,769 |
Hengdeli Holdings Ltd. | 1,124,000 | | 623,538 |
Kingdee International Software Group Co. Ltd. | 1,406,000 | | 741,886 |
Little Sheep Group Ltd. | 614,000 | | 400,026 |
Maoye International Holdings Ltd. | 938,000 | | 404,183 |
Marwyn Value Investors II Ltd. (a) | 1,846,800 | | 2,515,023 |
Neo-Neon Holdings Ltd. | 804,000 | | 489,583 |
Orchid Developments Group Ltd. (a) | 1,211,000 | | 523,855 |
PCD Stores Group Ltd. | 1,046,000 | | 337,365 |
Perfect World Co. Ltd. sponsored ADR Class B (a) | 28,400 | | 920,160 |
Sino-Life Group Ltd. (a) | 2,608,000 | | 306,180 |
TAL Education Group ADR (a) | 6,600 | | 117,480 |
TPK Holdings Co. | 2,000 | | 33,001 |
VST Holdings Ltd. (a) | 1,582,000 | | 404,110 |
Xingda International Holdings Ltd. | 1,656,000 | | 1,728,372 |
Yip's Chemical Holdings Ltd. | 592,000 | | 704,175 |
TOTAL CAYMAN ISLANDS | | 23,323,503 |
China - 1.5% |
51job, Inc. sponsored ADR (a) | 12,800 | | 577,024 |
AMVIG Holdings Ltd. | 764,000 | | 620,958 |
Baidu.com, Inc. sponsored ADR (a) | 9,200 | | 1,012,092 |
China Metal Recycling (Holdings) Ltd. | 333,600 | | 371,420 |
Dalian Port (PDA) Co. Ltd. (H Shares) | 1,786,000 | | 771,888 |
Digital China Holdings Ltd. (H Shares) | 239,000 | | 431,672 |
Focus Media Holding Ltd. ADR (a)(d) | 15,300 | | 378,675 |
Global Bio-Chem Technology Group Co. Ltd. (a) | 2,672,800 | | 434,475 |
Harbin Power Equipment Co. Ltd. (H Shares) | 492,000 | | 662,665 |
Minth Group Ltd. | 596,000 | | 1,114,917 |
People's Food Holdings Ltd. | 992,000 | | 536,506 |
Royale Furniture Holdings Ltd. | 1,854,000 | | 676,900 |
Sino Prosper State Gold Resources Holdings, Ltd. (a) | 74,820,000 | | 3,764,528 |
Weiqiao Textile Co. Ltd. (H Shares) | 2,055,500 | | 1,620,268 |
Zhaojin Mining Industry Co. Ltd. (H Shares) | 58,500 | | 181,887 |
TOTAL CHINA | | 13,155,875 |
Common Stocks - continued |
| Shares | | Value |
Cyprus - 0.8% |
Buried Hill Energy (Cyprus) PCL (a)(h) | 1,947,000 | | $ 4,867,500 |
Mirland Development Corp. PLC (a) | 781,900 | | 2,242,371 |
TOTAL CYPRUS | | 7,109,871 |
Denmark - 0.9% |
DSV de Sammensluttede Vognmaend AS | 250,000 | | 5,122,129 |
Pandora A/S | 52,300 | | 2,537,366 |
William Demant Holding AS (a) | 200 | | 14,991 |
TOTAL DENMARK | | 7,674,486 |
France - 8.8% |
Altamir Amboise (a) | 544,400 | | 4,264,755 |
ALTEN | 114,000 | | 3,806,214 |
Audika SA | 113,113 | | 2,762,214 |
Compagnie Generale de Geophysique SA (a) | 188,400 | | 4,399,670 |
Delachaux SA | 80,541 | | 6,569,472 |
Devoteam SA | 38,800 | | 1,071,667 |
Faiveley Transport | 50,672 | | 4,283,334 |
Iliad Group SA | 46,742 | | 5,261,668 |
Ipsos SA | 184,600 | | 8,875,855 |
Laurent-Perrier Group | 20,860 | | 2,350,787 |
LeGuide.com SA (a) | 85,800 | | 3,261,637 |
Maisons France Confort (d) | 89,444 | | 3,895,500 |
Meetic | 187,600 | | 5,599,223 |
Sartorius Stedim Biotech | 53,700 | | 2,464,294 |
SeLoger.com | 198,800 | | 9,985,991 |
Sopra Group SA | 37,800 | | 3,146,867 |
SR Teleperformance SA | 131,700 | | 4,152,535 |
Trigano SA (a) | 22,591 | | 581,534 |
TOTAL FRANCE | | 76,733,217 |
Germany - 9.3% |
CENTROTEC Sustainable AG (a) | 131,581 | | 3,097,855 |
CTS Eventim AG | 111,908 | | 6,315,776 |
Delticom AG | 70,400 | | 5,612,998 |
Drillisch AG | 679,100 | | 5,802,838 |
ElringKlinger AG | 184,000 | | 6,130,562 |
Freenet AG | 164,700 | | 2,086,839 |
GFK AG | 142,601 | | 6,020,128 |
HeidelbergCement AG | 119,666 | | 6,258,250 |
KROMI Logistik AG | 118,100 | | 1,331,075 |
Lanxess AG | 121,885 | | 8,479,844 |
Rational AG (d) | 15,920 | | 3,557,593 |
Common Stocks - continued |
| Shares | | Value |
Germany - continued |
SMA Solar Technology AG (d) | 31,200 | | $ 3,681,443 |
STRATEC Biomedical Systems AG | 77,910 | | 2,931,891 |
Tom Tailor Holding AG | 204,300 | | 4,335,167 |
United Internet AG | 390,613 | | 6,997,800 |
Wacker Chemie AG | 40,000 | | 8,251,299 |
TOTAL GERMANY | | 80,891,358 |
Greece - 0.2% |
Babis Vovos International Technical SA (a) | 149,200 | | 506,555 |
Jumbo SA | 161,000 | | 1,238,850 |
TOTAL GREECE | | 1,745,405 |
Hong Kong - 1.0% |
Dah Sing Financial Holdings Ltd. | 102,400 | | 710,740 |
GZI Transport Ltd. | 950,000 | | 495,146 |
I.T Ltd. | 2,064,000 | | 1,741,469 |
Magnificent Estates Ltd. | 18,070,000 | | 582,809 |
REXCAPITAL Financial Holdings Ltd. | 4,600,000 | | 427,286 |
Singamas Container Holdings Ltd. (a) | 3,966,000 | | 895,404 |
Techtronic Industries Co. Ltd. | 3,251,000 | | 3,292,417 |
Tian An China Investments Co. Ltd. | 669,000 | | 516,989 |
TOTAL HONG KONG | | 8,662,260 |
Iceland - 0.7% |
Ossur hf (a) | 3,457,100 | | 6,515,406 |
India - 0.2% |
Educomp Solutions Ltd. | 24,874 | | 308,898 |
Geodesic Ltd. | 256,340 | | 676,055 |
Grasim Industries Ltd. | 6,876 | | 361,522 |
Indian Overseas Bank | 110,621 | | 398,810 |
The Jammu & Kashmir Bank Ltd. | 14,265 | | 293,008 |
TOTAL INDIA | | 2,038,293 |
Indonesia - 0.4% |
AKR Corporindo Tbk PT | 5,225,000 | | 882,768 |
PT Ciputra Development Tbk (a) | 12,376,500 | | 581,608 |
PT Lippo Karawaci Tbk | 9,290,500 | | 644,487 |
PT Mayora Indah Tbk | 372,500 | | 502,223 |
PT Mitra Adiperkasa Tbk | 1,436,000 | | 409,711 |
PT Tower Bersama Infrastructure Tbk | 402,500 | | 114,839 |
TOTAL INDONESIA | | 3,135,636 |
Common Stocks - continued |
| Shares | | Value |
Ireland - 0.9% |
James Hardie Industries NV unit (a) | 132,009 | | $ 697,049 |
Kenmare Resources PLC (a) | 14,887,700 | | 4,627,352 |
Petroceltic International PLC (a) | 11,142,200 | | 2,008,291 |
Petroneft Resources PLC (a) | 952,400 | | 715,617 |
Vimio PLC (a) | 867,300 | | 14 |
TOTAL IRELAND | | 8,048,323 |
Isle of Man - 1.5% |
Exillon Energy PLC | 1,511,200 | | 6,343,463 |
IBS Group Holding Ltd. GDR (Reg. S) (a) | 317,700 | | 7,028,812 |
TOTAL ISLE OF MAN | | 13,372,275 |
Italy - 0.8% |
Seldovia Native Association, Inc. (SNAI) (a) | 209,590 | | 831,157 |
Tod's SpA | 60,255 | | 5,841,260 |
TOTAL ITALY | | 6,672,417 |
Japan - 23.4% |
ABC-Mart, Inc. | 50,700 | | 1,724,443 |
Air Water, Inc. | 190,000 | | 2,217,099 |
Aozora Bank Ltd. | 1,390,000 | | 2,331,925 |
AQ Interactive, Inc. (d) | 705 | | 876,979 |
ARCS Co. Ltd. | 133,600 | | 1,731,637 |
Arnest One Corp. | 44,100 | | 466,374 |
Asahi Co. Ltd. | 58,000 | | 857,711 |
Asahi Intecc Co. Ltd. | 262,100 | | 4,390,590 |
ASKUL Corp. | 96,000 | | 1,994,681 |
Bank of Kyoto Ltd. | 231,000 | | 2,066,857 |
Cellseed, Inc. (d) | 11,700 | | 104,976 |
Central Glass Co. Ltd. | 248,000 | | 1,069,417 |
Chiba Bank Ltd. | 325,000 | | 2,006,499 |
Chiyoda Corp. | 318,000 | | 2,634,174 |
Cosmos Pharmaceutical Corp. | 27,200 | | 856,190 |
Create SD Holdings Co. Ltd. | 48,200 | | 1,051,212 |
Credit Saison Co. Ltd. | 173,200 | | 2,456,617 |
Culture Convenience Club Co. Ltd. (d) | 175,100 | | 778,996 |
CyberAgent, Inc. (d) | 2,722 | | 4,522,572 |
Dai-ichi Seiko Co. Ltd. (d) | 56,700 | | 2,783,211 |
Daihen Corp. | 456,000 | | 2,057,015 |
Digital Garage, Inc. | 994 | | 1,731,811 |
Don Quijote Co. Ltd. | 77,900 | | 2,128,770 |
Ebara Corp. (a) | 559,000 | | 2,393,964 |
EPS Co. Ltd. (d) | 742 | | 1,825,724 |
Common Stocks - continued |
| Shares | | Value |
Japan - continued |
Exedy Corp. | 147,000 | | $ 4,599,801 |
Ferrotec Corp. | 145,900 | | 1,620,910 |
FreeBit Co., Ltd. (d) | 358 | | 742,960 |
Fuji Oil Co. Ltd. | 191,400 | | 2,751,955 |
Furuya Metal Co. Ltd. | 33,400 | | 2,108,512 |
Glory Ltd. | 25,900 | | 571,300 |
GREE, Inc. (d) | 212,000 | | 2,676,674 |
Hoshizaki Electric Co. Ltd. | 62,400 | | 1,229,855 |
Ibiden Co. Ltd. | 97,300 | | 2,396,528 |
Isetan Mitsukoshi Holdings Ltd. | 170,800 | | 1,884,573 |
Japan Steel Works Ltd. | 110,000 | | 1,049,519 |
JP-Holdings, Inc. | 91,600 | | 1,871,386 |
JTEKT Corp. | 159,200 | | 1,595,028 |
Kandenko Co. Ltd. | 243,000 | | 1,416,267 |
Kenedix Realty Investment Corp. | 573 | | 2,275,053 |
Kimoto Co. Ltd. | 228,600 | | 1,693,123 |
KOMERI Co. Ltd. | 66,600 | | 1,385,465 |
Kuraray Co. Ltd. | 283,500 | | 4,060,360 |
Maeda Corp. | 319,000 | | 864,198 |
Makino Milling Machine Co. Ltd. (a) | 302,000 | | 2,079,135 |
Marui Group Co. Ltd. | 175,800 | | 1,381,481 |
Maruwa Ceramic Co. Ltd. | 77,000 | | 1,863,999 |
McDonald's Holdings Co. (Japan) Ltd. | 122,500 | | 3,110,072 |
Meiko Electronics Co. Ltd. | 96,300 | | 1,793,882 |
Message Co. Ltd. | 1,629 | | 4,149,932 |
Micronics Japan Co. Ltd. | 60,500 | | 488,691 |
Minebea Ltd. | 381,000 | | 2,092,244 |
Mitsubishi UFJ Lease & Finance Co. Ltd. | 96,270 | | 3,220,565 |
Mitsumi Electric Co. Ltd. | 104,800 | | 1,781,933 |
mixi, Inc. (d) | 355 | | 2,064,620 |
Nabtesco Corp. | 238,200 | | 4,218,156 |
Nichi-iko Pharmaceutical Co. Ltd. | 32,900 | | 1,160,311 |
Nichicon Corp. | 89,200 | | 995,422 |
Nihon M&A Center, Inc. (d) | 426 | | 1,540,524 |
Nippon Ceramic Co. Ltd. | 27,700 | | 468,150 |
Nippon Denko Co. Ltd. | 109,000 | | 808,662 |
Nippon Shinyaku Co. Ltd. | 208,000 | | 2,946,688 |
Nomura Real Estate Holdings, Inc. | 77,500 | | 1,189,418 |
Nomura Real Estate Residential Fund, Inc. | 400 | | 1,946,067 |
NTT Urban Development Co. | 1,081 | | 991,398 |
Osaka Securities Exchange Co. Ltd. | 154 | | 775,071 |
OSAKA Titanium technologies Co. Ltd. (d) | 48,800 | | 2,286,268 |
Common Stocks - continued |
| Shares | | Value |
Japan - continued |
Otsuka Corp. | 54,900 | | $ 3,486,256 |
Pigeon Corp. | 45,900 | | 1,366,676 |
Rensas Electronics Corp. (a)(d) | 312,700 | | 2,350,982 |
Riso Kagaku Corp. | 147,700 | | 2,011,671 |
Rohto Pharmaceutical Co. Ltd. | 196,000 | | 2,428,383 |
Sanken Electric Co. Ltd. (a) | 138,000 | | 493,898 |
Sankyu, Inc. | 264,000 | | 1,108,885 |
Santen Pharmaceutical Co. Ltd. | 78,600 | | 2,713,443 |
Sawada Holdings Co. Ltd. (a) | 214,800 | | 1,321,312 |
Sekisui Chemical Co. Ltd. | 303,000 | | 1,927,874 |
Shimadzu Corp. | 426,000 | | 3,202,808 |
Shimamura Co. Ltd. | 29,400 | | 2,820,529 |
Shin-Kobe Electric Machinery Co. Ltd. (d) | 244,000 | | 2,498,521 |
Shindengen Electric Co. Ltd. (a) | 155,000 | | 624,083 |
Shizuoka Gas Co. Ltd. | 88,000 | | 516,168 |
SHO-BOND Holdings Co. Ltd. | 132,500 | | 2,835,404 |
Simplex Holdings, Inc. | 1,189 | | 542,268 |
So-net M3, Inc. (d) | 227 | | 1,038,101 |
Sony Financial Holdings, Inc. | 843 | | 2,933,267 |
SRI Sports Ltd. | 1,276 | | 1,389,059 |
Start Today Co. Ltd. | 435 | | 1,353,057 |
Stella Chemifa Corp. | 9,500 | | 409,656 |
Sumitomo Osaka Cement Co. Ltd. | 789,000 | | 1,529,060 |
Sumitomo Trust & Banking Co. Ltd. | 577,000 | | 3,150,307 |
Sysmex Corp. | 20,300 | | 1,392,519 |
SystemPro Co. Ltd. (d) | 1,445 | | 1,136,678 |
Taisho Pharmaceutical Co. Ltd. | 75,000 | | 1,576,985 |
Takata Corp. | 92,600 | | 2,273,861 |
Takeei Corp. | 67,900 | | 658,158 |
The Suruga Bank Ltd. | 221,000 | | 1,993,861 |
Toho Co. Ltd. | 109,300 | | 1,689,347 |
Tokyu Livable, Inc. | 271,300 | | 3,128,699 |
Toto Ltd. (d) | 474,000 | | 3,149,173 |
Towa Corp. (a) | 297,200 | | 1,968,530 |
Toyo Tanso Co. Ltd. (d) | 42,500 | | 2,437,399 |
Toyota Boshoku Corp. | 37,100 | | 628,860 |
Ulvac, Inc. | 96,100 | | 1,938,242 |
Yamatake Corp. | 165,800 | | 4,036,314 |
Yamato Kogyo Co. Ltd. | 80,000 | | 2,051,945 |
Yokohama Rubber Co. Ltd. | 367,000 | | 1,834,507 |
TOTAL JAPAN | | 203,152,346 |
Common Stocks - continued |
| Shares | | Value |
Korea (South) - 0.8% |
Daou Technology, Inc. | 197,150 | | $ 1,577,901 |
Hyosung Corp. | 6,493 | | 721,765 |
Interpark Corp. (a) | 75,279 | | 298,572 |
KC Tech Co. Ltd. | 126,140 | | 682,020 |
Lock & Lock Co. Ltd. | 19,170 | | 634,170 |
MNTECH Co. Ltd. | 76,840 | | 755,075 |
Power Logics Co. Ltd. (a) | 57,033 | | 442,266 |
Sodiff Advanced Materials Co. Ltd. | 3,940 | | 358,787 |
The Basic House Co. Ltd. (a) | 66,650 | | 1,345,447 |
TK Corp. (a) | 17,649 | | 407,285 |
TOTAL KOREA (SOUTH) | | 7,223,288 |
Luxembourg - 0.3% |
GlobeOp Financial Services SA | 594,385 | | 2,906,877 |
Malaysia - 0.3% |
JobStreet Corp. Bhd | 1,223,100 | | 1,045,788 |
Lion Industries Corp. Bhd | 808,200 | | 514,380 |
Masterskill Education Group Bhd | 478,400 | | 444,415 |
Top Glove Corp. Bhd | 222,000 | | 392,478 |
TOTAL MALAYSIA | | 2,397,061 |
Netherlands - 1.8% |
Gemalto NV | 190,440 | | 8,670,399 |
SMARTRAC NV (a) | 104,600 | | 2,899,270 |
Wavin NV (a) | 273,912 | | 3,778,571 |
TOTAL NETHERLANDS | | 15,348,240 |
Norway - 2.0% |
Aker Solutions ASA | 339,300 | | 5,165,388 |
Renewable Energy Corp. ASA (a)(d) | 1,111,942 | | 3,870,628 |
Schibsted ASA (B Shares) | 221,000 | | 6,072,568 |
Sevan Marine ASA (a) | 2,000,000 | | 2,694,861 |
TOTAL NORWAY | | 17,803,445 |
Philippines - 0.1% |
Alliance Global Group, Inc. | 2,595,000 | | 685,951 |
Singapore - 1.8% |
CSE Global Ltd. | 1,069,000 | | 875,485 |
Goodpack Ltd. | 1,569,000 | | 2,472,966 |
Hyflux Ltd. | 398,000 | | 968,632 |
Mapletree Industrial (REIT) (a) | 207,000 | | 171,127 |
Oceanus Group Ltd. (a) | 2,071,000 | | 512,030 |
Common Stocks - continued |
| Shares | | Value |
Singapore - continued |
Pertama Holdings Ltd. (e) | 21,312,000 | | $ 7,080,399 |
Petra Foods Ltd. | 279,000 | | 344,897 |
Raffles Medical Group Ltd. | 431,000 | | 725,937 |
Straits Asia Resources Ltd. | 739,000 | | 1,307,510 |
Yanlord Land Group Ltd. | 608,000 | | 807,973 |
TOTAL SINGAPORE | | 15,266,956 |
South Africa - 0.6% |
Blue Label Telecoms Ltd. | 4,787,200 | | 4,920,427 |
Spain - 0.3% |
Obrascon Huarte Lain SA | 73,400 | | 2,401,133 |
Sweden - 1.5% |
Elekta AB (B Shares) | 252,800 | | 9,564,751 |
Modern Times Group MTG AB (B Shares) | 44,100 | | 3,162,163 |
XCounter AB (a) | 1,108,000 | | 48,818 |
TOTAL SWEDEN | | 12,775,732 |
Switzerland - 1.9% |
Bank Sarasin & Co. Ltd. Series B (Reg.) | 18,166 | | 664,373 |
Basilea Pharmaceutica AG (a) | 9,770 | | 684,848 |
Lonza Group AG | 58,029 | | 5,078,680 |
Panalpina Welttransport Holding AG (a) | 42,760 | | 5,338,756 |
VZ Holding AG | 42,690 | | 4,532,031 |
TOTAL SWITZERLAND | | 16,298,688 |
United Kingdom - 16.7% |
Abcam PLC | 196,100 | | 5,403,924 |
Ashmore Group PLC | 1,109,700 | | 6,804,046 |
Asset Realisation Co. PLC (a) | 340,000 | | 5 |
Aurelian Oil & Gas PLC (a) | 3,923,800 | | 3,834,775 |
Avanti Communications Group PLC (a) | 403,000 | | 3,796,519 |
Aveva Group PLC | 188,500 | | 4,499,879 |
Blinkx PLC (a)(d) | 1,303,000 | | 1,826,651 |
Bond International Software PLC | 617,066 | | 598,123 |
Borders & Southern Petroleum PLC (a) | 698,500 | | 783,371 |
Cadogan Petroleum PLC (a) | 1,406,300 | | 439,355 |
Central Asia Metals PLC (a) | 1,464,000 | | 2,023,035 |
Centurion Electronics PLC (a)(e) | 748,299 | | 12 |
Ceres Power Holdings PLC (a)(d) | 406,200 | | 532,024 |
China Goldmines PLC (a) | 669,353 | | 257,377 |
Connaught PLC | 429,800 | | 7 |
Conygar Investment Co. PLC (a) | 2,333,700 | | 3,916,537 |
Common Stocks - continued |
| Shares | | Value |
United Kingdom - continued |
Cove Energy PLC (a) | 2,629,300 | | $ 3,190,994 |
Craneware PLC | 877,400 | | 8,244,585 |
DTZ Holdings PLC (a) | 1,804,400 | | 1,315,368 |
EMIS Group PLC | 382,345 | | 2,603,440 |
European Nickel PLC (a) | 2,276,950 | | 1,386,246 |
Faroe Petroleum PLC (a) | 458,447 | | 1,432,277 |
GoIndustry-DoveBid PLC (a) | 22,589 | | 32,029 |
Hays PLC | 2,007,843 | | 3,554,637 |
Icap PLC | 514,900 | | 3,763,408 |
Ideal Shopping Direct PLC | 234,592 | | 719,756 |
IG Group Holdings PLC | 1,264,300 | | 10,705,287 |
Inchcape PLC (a) | 778,720 | | 4,350,473 |
Jubilee Platinum PLC (a) | 2,729,847 | | 1,366,758 |
Keronite PLC (a)(h) | 13,620,267 | | 218 |
Melrose Resources PLC | 266,200 | | 1,385,247 |
Moneysupermarket.com Group PLC | 1,822,600 | | 2,441,186 |
Monitise PLC (a) | 4,154,500 | | 1,397,788 |
Mothercare PLC | 501,800 | | 4,224,804 |
NCC Group Ltd. | 228,315 | | 1,755,815 |
Northgate PLC (a) | 493,500 | | 1,937,120 |
Ocado Group PLC (a)(d) | 1,125,700 | | 2,519,546 |
Pureprofile Media PLC (a)(h) | 1,108,572 | | 444,025 |
Redhall Group PLC | 519,600 | | 1,057,246 |
Regenersis PLC (a) | 1,367,300 | | 1,106,263 |
Rockhopper Exploration PLC (a)(i) | 654,100 | | 3,337,773 |
Royalblue Group PLC | 197,842 | | 5,071,561 |
SDL PLC (a) | 691,862 | | 6,661,885 |
Serco Group PLC | 447,430 | | 4,401,459 |
SIG PLC (a) | 1,479,300 | | 2,690,019 |
Silverdell PLC (a) | 4,958,000 | | 615,618 |
Sinclair Pharma PLC (a) | 4,246,949 | | 1,837,147 |
Sphere Medical Holding PLC (a)(h) | 555,599 | | 1,513,260 |
SR Pharma PLC (a) | 5,388,700 | | 837,450 |
Sthree PLC | 541,709 | | 2,542,944 |
Synergy Health PLC | 274,953 | | 3,464,658 |
Ted Baker PLC | 293,100 | | 2,887,980 |
TMO Biotec (a)(h) | 1,000,000 | | 400,538 |
Travis Perkins PLC | 248,700 | | 3,301,197 |
Valiant Petroleum PLC (a) | 156,200 | | 1,485,268 |
Wellstream Holdings PLC | 434,600 | | 5,152,578 |
Common Stocks - continued |
| Shares | | Value |
United Kingdom - continued |
Xchanging PLC | 1,521,100 | | $ 3,165,702 |
Zenergy Power PLC (a) | 855,520 | | 387,215 |
TOTAL UNITED KINGDOM | | 145,404,408 |
United States of America - 0.5% |
CTC Media, Inc. | 183,400 | | 4,328,240 |
Mudalla Technology, Inc. (a) | 996,527 | | 16 |
XL TechGroup, Inc. (a) | 1,329,250 | | 21 |
TOTAL UNITED STATES OF AMERICA | | 4,328,277 |
TOTAL COMMON STOCKS (Cost $718,968,030) | 820,697,874 |
Investment Companies - 0.0% |
| | | |
Bailiwick of Guernsey - 0.0% |
Brookwell Ltd. Class A
(Cost $621,868) | 213,047 | | 110,933 |
Government Obligations - 0.2% |
| Principal Amount (j) | | |
Germany - 0.2% |
German Federal Republic 0.2535% to 0.6185% 11/24/10 to 2/9/11 (g)
(Cost $1,499,792) | EUR | 1,100,000 | | 1,529,062 |
Money Market Funds - 8.4% |
| Shares | | |
Fidelity Cash Central Fund, 0.23% (b) | 46,383,073 | | 46,383,073 |
Fidelity Securities Lending Cash Central Fund, 0.24% (b)(c) | 26,860,023 | | 26,860,023 |
TOTAL MONEY MARKET FUNDS (Cost $73,243,096) | 73,243,096 |
TOTAL INVESTMENT PORTFOLIO - 103.0% (Cost $794,332,786) | | 895,580,965 |
NET OTHER ASSETS (LIABILITIES) - (3.0)% | | (26,101,299) |
NET ASSETS - 100% | $ 869,479,666 |
Futures Contracts |
| Expiration Date | | Underlying
Face Amount
at Value | | Unrealized
Appreciation/
(Depreciation) |
Purchased |
Equity Index Contracts |
366 Dow Jones Euro Stoxx 50 Index Contracts (Germany) | Dec. 2010 | | $ 14,458,195 | | $ 53,183 |
|
The face value of futures purchased as a percentage of net assets is 1.7% |
Currency Abbreviations |
EUR | - | European Monetary Unit |
Legend |
(a) Non-income producing |
(b) Affiliated fund that is available only to investment companies and other accounts managed by Fidelity Investments. The rate quoted is the annualized seven-day yield of the fund at period end. A complete unaudited listing of the fund's holdings as of its most recent quarter end is available upon request. In addition, each Fidelity Central Fund's financial statements, which are not covered by the Fund's report of Independent Registered Public Accounting Firm, are available on the SEC's website or upon request. |
(c) Investment made with cash collateral received from securities on loan. |
(d) Security or a portion of the security is on loan at period end. |
(e) Affiliated company |
(f) Security exempt from registration under Rule 144A of the Securities Act of 1933. These securities may be resold in transactions exempt from registration, normally to qualified institutional buyers. At the end of the period, the value of these securities amounted to $1,603,636 or 0.2% of net assets. |
(g) Security or a portion of the security was pledged to cover margin requirements for futures contracts. At the period end, the value of securities pledged amounted to $236,310. |
(h) Restricted securities - Investment in securities not registered under the Securities Act of 1933 (excluding 144A issues). At the end of the period, the value of restricted securities (excluding 144A issues) amounted to $7,225,615 or 0.8% of net assets. |
Additional information on each holding is as follows: |
Security | Acquisition Date | Acquisition Cost |
AirSea Lines | 8/4/06 | $ 931,150 |
AirSea Lines warrants 8/4/11 | 8/4/06 | $ 2 |
Buried Hill Energy (Cyprus) PCL | 8/18/06 | $ 2,141,700 |
Kalahari Energy | 9/1/06 | $ 1,813,750 |
Keronite PLC | 8/16/06 | $ 817,216 |
Pureprofile Media PLC | 5/3/05 - 1/11/06 | $ 640,000 |
Rock Well Petroleum, Inc. | 4/13/06 | $ 1,155,600 |
Sphere Medical Holding PLC | 8/27/08 - 3/16/10 | $ 944,518 |
TMO Biotec | 10/27/05 | $ 300,000 |
(i) Security or a portion of the security purchased on a delayed delivery or when-issued basis. |
(j) Principal amount is stated in United States dollars unless otherwise noted. |
Affiliated Central Funds |
Information regarding fiscal year to date income earned by the Fund from investments in Fidelity Central Funds is as follows: |
Fund | Income earned |
Fidelity Cash Central Fund | $ 50,101 |
Fidelity Securities Lending Cash Central Fund | 829,746 |
Total | $ 879,847 |
Other Affiliated Issuers |
An affiliated company is a company in which the Fund has ownership of at least 5% of the voting securities. Fiscal year to date transactions with companies which are or were affiliates are as follows: |
Affiliates | Value,
beginning
of period | Purchases | Sales
Proceeds | Dividend
Income | Value,
end
of period |
Brookwell Ltd. Class A | $ 1,078,606 | $ - | $ 724,601 | $ - | $ - |
Centurion Electronics PLC | 12 | - | - | - | 12 |
Pertama Holdings Ltd. | - | 5,470,243 | 107,724 | 659,049 | 7,080,399 |
Total | $ 1,078,618 | $ 5,470,243 | $ 832,325 | $ 659,049 | $ 7,080,411 |
Other Information |
The following is a summary of the inputs used, as of October 31, 2010, involving the Fund's assets and liabilities carried at fair value. The inputs or methodology used for valuing securities may not be an indication of the risk associated with investing in those securities. For more information on valuation inputs, and their aggregation into the levels used in the tables below, please refer to the Security Valuation section in the accompanying Notes to Financial Statements. |
Valuation Inputs at Reporting Date: |
Description | Total | Level 1 | Level 2 | Level 3 |
Investments in Securities: | | | | |
Equities: | | | | |
Japan | $ 203,152,346 | $ 168,463,560 | $ 34,688,786 | $ - |
United Kingdom | 145,404,408 | 142,756,937 | 32,029 | 2,615,442 |
Germany | 80,891,358 | 80,891,358 | - | - |
France | 76,733,217 | 72,333,547 | 4,399,670 | - |
Australia | 64,820,466 | 64,820,466 | - | - |
Cayman Islands | 23,323,503 | 22,799,648 | - | 523,855 |
Canada | 19,219,627 | 19,219,567 | - | 60 |
Norway | 17,803,445 | 17,803,445 | - | - |
Bermuda | 16,607,487 | 16,607,487 | - | - |
Sweden | 12,775,732 | 12,726,914 | - | 48,818 |
Ireland | 8,048,323 | 8,048,309 | - | 14 |
Cyprus | 7,109,871 | 2,242,371 | - | 4,867,500 |
British Virgin Islands | 6,276,684 | 6,276,669 | - | 15 |
United States of America | 4,328,277 | 4,328,240 | - | 37 |
Other | 134,203,130 | 133,841,608 | 361,522 | - |
Investment Companies | 110,933 | - | - | 110,933 |
Government Obligations | 1,529,062 | - | 1,529,062 | - |
Money Market Funds | 73,243,096 | 73,243,096 | - | - |
Total Investments in Securities: | $ 895,580,965 | $ 846,403,222 | $ 41,011,069 | $ 8,166,674 |
Derivative Instruments: | | | | |
Assets | | | | |
Futures Contracts | $ 53,183 | $ 53,183 | $ - | $ - |
Other Information - continued |
The following is a reconciliation of Investments in Securities for which Level 3 inputs were used in determining value: |
Investments in Securities: | |
Beginning Balance | $ 8,316,240 |
Total Realized Gain (Loss) | (8,917,345) |
Total Unrealized Gain (Loss) | 4,243,114 |
Cost of Purchases | 1,804,796 |
Proceeds of Sales | (1,263,414) |
Amortization/Accretion | - |
Transfers in to Level 3 | 5,146,203 |
Transfers out of Level 3 | (1,162,920) |
Ending Balance | $ 8,166,674 |
The change in unrealized gain (loss) for the period attributable to Level 3 securities held at October 31, 2010 | $ 777,510 |
The information used in the above reconciliation represents fiscal year to date activity for any Investments in Securities identified as using Level 3 inputs at either the beginning or the end of the current fiscal period. Transfers in or out of Level 3 represent the beginning value of any Security or Instrument where a change in the pricing level occurred from the beginning to the end of the period. The cost of purchases and the proceeds of sales may include securities received or delivered through corporate actions or exchanges. Realized and unrealized gains (losses) disclosed in the reconciliation are included in Net Gain (Loss) on the Fund's Statement of Operations. |
Value of Derivative Instruments |
The following table is a summary of the Fund's value of derivative instruments by risk exposure as of October 31, 2010. For additional information on derivative instruments, please refer to the Derivative Instruments section in the accompanying Notes to Financial Statements. |
Risk Exposure /
Derivative Type | Value |
| Asset | Liability |
Equity Risk | | |
Futures Contracts (a) | $ 53,183 | $ - |
(a) Reflects cumulative appreciation/(depreciation) on futures contracts as disclosed on the Schedule of Investments. Only the period end variation margin is separately disclosed on the Statement of Assets and Liabilities. |
Income Tax Information |
At October 31, 2010, the Fund had a capital loss carryforward of approximately $78,127,356 all of which will expire on October 31, 2017. Capital loss carryforwards are only available to offset future capital gains of the Fund to the extent provided by regulations and may be limited. |
See accompanying notes which are an integral part of the financial statements.
Annual Report
Statement of Assets and Liabilities
| October 31, 2010 |
| | |
Assets | | |
Investment in securities, at value (including securities loaned of $25,207,989) - See accompanying schedule: Unaffiliated issuers (cost $715,388,858) | $ 815,257,458 | |
Fidelity Central Funds (cost $73,243,096) | 73,243,096 | |
Other affiliated issuers (cost $5,700,832) | 7,080,411 | |
Total Investments (cost $794,332,786) | | $ 895,580,965 |
Cash | | 2 |
Foreign currency held at value (cost $70,040) | | 70,287 |
Receivable for investments sold | | 2,674,189 |
Receivable for fund shares sold | | 2,467,902 |
Dividends receivable | | 2,081,418 |
Distributions receivable from Fidelity Central Funds | | 90,243 |
Receivable for daily variation on futures contracts | | 5,554 |
Other receivables | | 142,637 |
Total assets | | 903,113,197 |
| | |
Liabilities | | |
Payable for investments purchased | | |
Regular delivery | $ 1,182,254 | |
Delayed delivery | 1,689,050 | |
Payable for fund shares redeemed | 2,886,835 | |
Accrued management fee | 652,945 | |
Distribution and service plan fees payable | 24,970 | |
Other affiliated payables | 211,160 | |
Other payables and accrued expenses | 126,294 | |
Collateral on securities loaned, at value | 26,860,023 | |
Total liabilities | | 33,633,531 |
| | |
Net Assets | | $ 869,479,666 |
Net Assets consist of: | | |
Paid in capital | | $ 851,358,414 |
Undistributed net investment income | | 2,441,101 |
Accumulated undistributed net realized gain (loss) on investments and foreign currency transactions | | (85,653,683) |
Net unrealized appreciation (depreciation) on investments and assets and liabilities in foreign currencies | | 101,333,834 |
Net Assets | | $ 869,479,666 |
See accompanying notes which are an integral part of the financial statements.
Annual Report
Financial Statements - continued
Statement of Assets and Liabilities - continued
| October 31, 2010 |
| | |
Calculation of Maximum Offering Price
Class A:
Net Asset Value and redemption price per share
($19,720,315 ÷ 965,882 shares) | | $ 20.42 |
| | |
Maximum offering price per share (100/94.25 of $20.42) | | $ 21.67 |
Class T:
Net Asset Value and redemption price per share ($16,092,042 ÷ 795,270 shares) | | $ 20.23 |
| | |
Maximum offering price per share (100/96.50 of $20.23) | | $ 20.96 |
Class B:
Net Asset Value and offering price per share ($3,457,061 ÷ 174,710 shares)A | | $ 19.79 |
| | |
Class C:
Net Asset Value and offering price per share ($13,501,307 ÷ 680,118 shares)A | | $ 19.85 |
| | |
International Small Cap:
Net Asset Value, offering price and redemption price per share ($808,478,028 ÷ 39,124,218 shares) | | $ 20.66 |
| | |
Institutional Class:
Net Asset Value, offering price and redemption price per share ($8,230,913 ÷ 398,399 shares) | | $ 20.66 |
A Redemption price per share is equal to net asset value less any applicable contingent deferred sales charge.
See accompanying notes which are an integral part of the financial statements.
Annual Report
Statement of Operations
| Year ended October 31, 2010 |
Investment Income | | |
Dividends (including $659,049 earned from other affiliated issuers) | | $ 13,399,968 |
Interest | | 2,449 |
Income from Fidelity Central Funds (including $829,746 from security lending) | | 879,847 |
Income before foreign taxes withheld | | 14,282,264 |
Less foreign taxes withheld | | (840,519) |
Total income | | 13,441,745 |
| | |
Expenses | | |
Management fee
Basic fee | $ 6,469,279 | |
Performance adjustment | 1,311,370 | |
Transfer agent fees | 2,167,890 | |
Distribution and service plan fees | 254,737 | |
Accounting and security lending fees | 371,480 | |
Custodian fees and expenses | 294,480 | |
Independent trustees' compensation | 4,208 | |
Registration fees | 88,212 | |
Audit | 141,668 | |
Legal | 3,656 | |
Miscellaneous | 10,051 | |
Total expenses before reductions | 11,117,031 | |
Expense reductions | (199,347) | 10,917,684 |
Net investment income (loss) | | 2,524,061 |
Realized and Unrealized Gain (Loss) Net realized gain (loss) on: | | |
Investment securities: | | |
Unaffiliated issuers (net of foreign taxes of $39,190) | 48,923,650 | |
Other affiliated issuers | (1,945,619) | |
Foreign currency transactions | 7,621 | |
Futures contracts | (1,268,507) | |
Capital gain distributions from Fidelity Central Funds | 1,843 | |
Total net realized gain (loss) | | 45,718,988 |
Change in net unrealized appreciation (depreciation) on: Investment securities (net of decrease in deferred foreign taxes of $17,326) | 97,289,267 | |
Assets and liabilities in foreign currencies | 34,009 | |
Futures contracts | 53,183 | |
Total change in net unrealized appreciation (depreciation) | | 97,376,459 |
Net gain (loss) | | 143,095,447 |
Net increase (decrease) in net assets resulting from operations | | $ 145,619,508 |
See accompanying notes which are an integral part of the financial statements.
Annual Report
Financial Statements - continued
Statement of Changes in Net Assets
| Year ended
October 31,
2010 | Year ended
October 31,
2009 |
Increase (Decrease) in Net Assets | | |
Operations | | |
Net investment income (loss) | $ 2,524,061 | $ 3,237,964 |
Net realized gain (loss) | 45,718,988 | (79,176,066) |
Change in net unrealized appreciation (depreciation) | 97,376,459 | 297,287,070 |
Net increase (decrease) in net assets resulting from operations | 145,619,508 | 221,348,968 |
Distributions to shareholders from net investment income | (3,368,409) | - |
Distributions to shareholders from net realized gain | (14,323,742) | - |
Total distributions | (17,692,151) | - |
Share transactions - net increase (decrease) | 26,936,768 | (81,370,441) |
Redemption fees | 118,859 | 67,796 |
Total increase (decrease) in net assets | 154,982,984 | 140,046,323 |
| | |
Net Assets | | |
Beginning of period | 714,496,682 | 574,450,359 |
End of period (including undistributed net investment income of $2,441,101 and undistributed net investment income of $3,237,964, respectively) | $ 869,479,666 | $ 714,496,682 |
See accompanying notes which are an integral part of the financial statements.
Annual Report
Financial Highlights - Class A
Years ended October 31, | 2010 | 2009 | 2008 | 2007 | 2006 |
Selected Per-Share Data | | | | | |
Net asset value, beginning of period | $ 17.28 | $ 11.91 | $ 31.14 | $ 28.79 | $ 26.69 |
Income from Investment Operations | | | | | |
Net investment income (loss) C | .03 | .06 | - H | .03 | (.02) |
Net realized and unrealized gain (loss) | 3.51 | 5.31 | (14.03) | 7.97 | 5.05 |
Total from investment operations | 3.54 | 5.37 | (14.03) | 8.00 | 5.03 |
Distributions from net investment income | (.06) | - | (.03) | - | (.05) |
Distributions from net realized gain | (.34) | - | (5.18) | (5.65) | (2.89) |
Total distributions | (.40) | - | (5.20) I | (5.65) | (2.94) |
Redemption fees added to paid in capital C | - H | - H | - H | - H | .01 |
Net asset value, end of period | $ 20.42 | $ 17.28 | $ 11.91 | $ 31.14 | $ 28.79 |
Total Return A,B | 20.85% | 45.09% | (53.35)% | 33.43% | 20.22% |
Ratios to Average Net Assets D,G | | | | | |
Expenses before reductions | 1.71% | 1.75% | 1.82% | 1.53% | 1.64% |
Expenses net of fee waivers, if any | 1.65% | 1.65% | 1.65% | 1.53% | 1.64% |
Expenses net of all reductions | 1.63% | 1.62% | 1.60% | 1.49% | 1.58% |
Net investment income (loss) | .16% | .41% | -% F | .10% | (.08)% |
Supplemental Data | | | | | |
Net assets, end of period (000 omitted) | $ 19,720 | $ 17,590 | $ 13,561 | $ 38,585 | $ 36,701 |
Portfolio turnover rate E | 66% | 81% | 113% | 70% | 84% |
A Total returns would have been lower had certain expenses not been reduced during the periods shown.
B Total returns do not include the effect of the sales charges.
C Calculated based on average shares outstanding during the period.
D Fees and expenses of the underlying Fidelity Central Funds are not included in the Fund's expense ratio. The Fund indirectly bears its proportionate share of the expenses of any underlying Fidelity Central Funds.
E Amount does not include the portfolio activity of any underlying Fidelity Central Funds.
F Amount represents less than .01%.
G Expense ratios reflect operating expenses of the class. Expenses before reductions do not reflect amounts reimbursed by the investment adviser or reductions from brokerage service arrangements or reductions from other expense offset arrangements and do not represent the amount paid by the class during periods when reimbursements or reductions occur. Expenses net of fee waivers reflect expenses after reimbursement by the investment adviser but prior to reductions from brokerage service arrangements or other expense offset arrangements. Expenses net of all reductions represent the net expenses paid by the class.
H Amount represents less than $.01 per share.
I Total distributions of $5.20 per share is comprised of distributions from net investment income of $.026 and distributions from net realized gain of $5.176 per share.
See accompanying notes which are an integral part of the financial statements.
Annual Report
Financial Highlights - Class T
Years ended October 31, | 2010 | 2009 | 2008 | 2007 | 2006 |
Selected Per-Share Data | | | | | |
Net asset value, beginning of period | $ 17.14 | $ 11.84 | $ 30.96 | $ 28.64 | $ 26.57 |
Income from Investment Operations | | | | | |
Net investment income (loss) C | (.02) | .02 | (.05) | (.04) | (.09) |
Net realized and unrealized gain (loss) | 3.47 | 5.28 | (13.95) | 7.93 | 5.03 |
Total from investment operations | 3.45 | 5.30 | (14.00) | 7.89 | 4.94 |
Distributions from net investment income | (.02) | - | - | - | - |
Distributions from net realized gain | (.34) | - | (5.12) | (5.57) | (2.88) |
Total distributions | (.36) | - | (5.12) | (5.57) | (2.88) |
Redemption fees added to paid in capital C | - G | - G | - G | - G | .01 |
Net asset value, end of period | $ 20.23 | $ 17.14 | $ 11.84 | $ 30.96 | $ 28.64 |
Total Return A,B | 20.46% | 44.76% | (53.46)% | 33.07% | 19.93% |
Ratios to Average Net Assets D,F | | | | | |
Expenses before reductions | 1.97% | 2.00% | 2.07% | 1.77% | 1.89% |
Expenses net of fee waivers, if any | 1.90% | 1.90% | 1.90% | 1.77% | 1.89% |
Expenses net of all reductions | 1.88% | 1.86% | 1.86% | 1.73% | 1.83% |
Net investment income (loss) | (.09)% | .16% | (.25)% | (.14)% | (.32)% |
Supplemental Data | | | | | |
Net assets, end of period (000 omitted) | $ 16,092 | $ 15,760 | $ 13,493 | $ 40,823 | $ 41,982 |
Portfolio turnover rate E | 66% | 81% | 113% | 70% | 84% |
A Total returns would have been lower had certain expenses not been reduced during the periods shown.
B Total returns do not include the effect of the sales charges.
C Calculated based on average shares outstanding during the period.
D Fees and expenses of the underlying Fidelity Central Funds are not included in the Fund's expense ratio. The Fund indirectly bears its proportionate share of the expenses of any underlying Fidelity Central Funds.
E Amount does not include the portfolio activity of any underlying Fidelity Central Funds.
F Expense ratios reflect operating expenses of the class. Expenses before reductions do not reflect amounts reimbursed by the investment adviser or reductions from brokerage service arrangements or reductions from other expense offset arrangements and do not represent the amount paid by the class during periods when reimbursements or reductions occur. Expenses net of fee waivers reflect expenses after reimbursement by the investment adviser but prior to reductions from brokerage service arrangements or other expense offset arrangements. Expenses net of all reductions represent the net expenses paid by the class.
G Amount represents less than $.01 per share.
See accompanying notes which are an integral part of the financial statements.
Annual Report
Financial Highlights - Class B
Years ended October 31, | 2010 | 2009 | 2008 | 2007 | 2006 |
Selected Per-Share Data | | | | | |
Net asset value, beginning of period | $ 16.78 | $ 11.65 | $ 30.49 | $ 28.26 | $ 26.24 |
Income from Investment Operations | | | | | |
Net investment income (loss)C | (.10) | (.04) | (.16) | (.18) | (.24) |
Net realized and unrealized gain (loss) | 3.39 | 5.17 | (13.73) | 7.82 | 4.98 |
Total from investment operations | 3.29 | 5.13 | (13.89) | 7.64 | 4.74 |
Distributions from net realized gain | (.28) | - | (4.95) | (5.41) | (2.73) |
Redemption fees added to paid in capitalC | - G | - G | - G | - G | .01 |
Net asset value, end of period | $ 19.79 | $ 16.78 | $ 11.65 | $ 30.49 | $ 28.26 |
Total Return A,B | 19.90% | 44.03% | (53.68)% | 32.38% | 19.28% |
Ratios to Average Net Assets D,F | | | | | |
Expenses before reductions | 2.47% | 2.49% | 2.58% | 2.30% | 2.48% |
Expenses net of fee waivers, if any | 2.40% | 2.40% | 2.40% | 2.30% | 2.40% |
Expenses net of all reductions | 2.38% | 2.36% | 2.36% | 2.26% | 2.34% |
Net investment income (loss) | (.59)% | (.33)% | (.75)% | (.66)% | (.84)% |
Supplemental Data | | | | | |
Net assets, end of period (000 omitted) | $ 3,457 | $ 3,601 | $ 3,230 | $ 10,704 | $ 11,354 |
Portfolio turnover rate E | 66% | 81% | 113% | 70% | 84% |
A Total returns would have been lower had certain expenses not been reduced during the periods shown.
B Total returns do not include the effect of the contingent deferred sales charge.
C Calculated based on average shares outstanding during the period.
D Fees and expenses of the underlying Fidelity Central Funds are not included in the Fund's expense ratio. The Fund indirectly bears its proportionate share of the expenses of any underlying Fidelity Central Funds.
E Amount does not include the portfolio activity of any underlying Fidelity Central Funds.
F Expense ratios reflect operating expenses of the class. Expenses before reductions do not reflect amounts reimbursed by the investment adviser or reductions from brokerage service arrangements or reductions from other expense offset arrangements and do not represent the amount paid by the class during periods when reimbursements or reductions occur. Expenses net of fee waivers reflect expenses after reimbursement by the investment adviser but prior to reductions from brokerage service arrangements or other expense offset arrangements. Expenses net of all reductions represent the net expenses paid by the class.
G Amount represents less than $.01 per share.
See accompanying notes which are an integral part of the financial statements.
Annual Report
Financial Highlights - Class C
Years ended October 31, | 2010 | 2009 | 2008 | 2007 | 2006 |
Selected Per-Share Data | | | | | |
Net asset value, beginning of period | $ 16.85 | $ 11.70 | $ 30.62 | $ 28.33 | $ 26.31 |
Income from Investment Operations | | | | | |
Net investment income (loss) C | (.10) | (.04) | (.16) | (.17) | (.23) |
Net realized and unrealized gain (loss) | 3.40 | 5.19 | (13.78) | 7.85 | 4.99 |
Total from investment operations | 3.30 | 5.15 | (13.94) | 7.68 | 4.76 |
Distributions from net realized gain | (.30) | - | (4.98) | (5.39) | (2.75) |
Redemption fees added to paid in capital C | - G | - G | - G | - G | .01 |
Net asset value, end of period | $ 19.85 | $ 16.85 | $ 11.70 | $ 30.62 | $ 28.33 |
Total Return A,B | 19.86% | 44.02% | (53.67)% | 32.39% | 19.34% |
Ratios to Average Net Assets D,F | | | | | |
Expenses before reductions | 2.42% | 2.49% | 2.57% | 2.26% | 2.38% |
Expenses net of fee waivers, if any | 2.40% | 2.40% | 2.40% | 2.26% | 2.38% |
Expenses net of all reductions | 2.37% | 2.36% | 2.36% | 2.22% | 2.32% |
Net investment income (loss) | (.59)% | (.33)% | (.76)% | (.62)% | (.81)% |
Supplemental Data | | | | | |
Net assets, end of period (000 omitted) | $ 13,501 | $ 5,814 | $ 5,658 | $ 20,094 | $ 21,335 |
Portfolio turnover rate E | 66% | 81% | 113% | 70% | 84% |
A Total returns would have been lower had certain expenses not been reduced during the periods shown.
B Total returns do not include the effect of the contingent deferred sales charge.
C Calculated based on average shares outstanding during the period.
D Fees and expenses of the underlying Fidelity Central Funds are not included in the Fund's expense ratio. The Fund indirectly bears its proportionate share of the expenses of any underlying Fidelity Central Funds.
E Amount does not include the portfolio activity of any underlying Fidelity Central Funds.
F Expense ratios reflect operating expenses of the class. Expenses before reductions do not reflect amounts reimbursed by the investment adviser or reductions from brokerage service arrangements or reductions from other expense offset arrangements and do not represent the amount paid by the class during periods when reimbursements or reductions occur. Expenses net of fee waivers reflect expenses after reimbursement by the investment adviser but prior to reductions from brokerage service arrangements or other expense offset arrangements. Expenses net of all reductions represent the net expenses paid by the class.
G Amount represents less than $.01 per share.
See accompanying notes which are an integral part of the financial statements.
Annual Report
Financial Highlights - International Small Cap
Years ended October 31, | 2010 | 2009 | 2008 | 2007 | 2006 |
Selected Per-Share Data | | | | | |
Net asset value, beginning of period | $ 17.48 | $ 12.03 | $ 31.44 | $ 29.03 | $ 26.89 |
Income from Investment Operations | | | | | |
Net investment income (loss) B | .07 | .08 | .03 | .12 | .08 |
Net realized and unrealized gain (loss) | 3.53 | 5.37 | (14.14) | 8.03 | 5.08 |
Total from investment operations | 3.60 | 5.45 | (14.11) | 8.15 | 5.16 |
Distributions from net investment income | (.08) | - | (.12) | (.07) | (.14) |
Distributions from net realized gain | (.34) | - | (5.18) | (5.67) | (2.89) |
Total distributions | (.42) | - | (5.30) | (5.74) | (3.03) |
Redemption fees added to paid in capital B | - F | - F | - F | - F | .01 |
Net asset value, end of period | $ 20.66 | $ 17.48 | $ 12.03 | $ 31.44 | $ 29.03 |
Total Return A | 21.02% | 45.30% | (53.25)% | 33.82% | 20.65% |
Ratios to Average Net Assets C,E | | | | | |
Expenses before reductions | 1.44% | 1.48% | 1.49% | 1.19% | 1.28% |
Expenses net of fee waivers, if any | 1.44% | 1.48% | 1.49% | 1.19% | 1.28% |
Expenses net of all reductions | 1.42% | 1.44% | 1.44% | 1.15% | 1.22% |
Net investment income (loss) | .37% | .58% | .16% | .45% | .29% |
Supplemental Data | | | | | |
Net assets, end of period (000 omitted) | $ 808,478 | $ 669,035 | $ 536,291 | $ 1,663,761 | $ 1,816,059 |
Portfolio turnover rate D | 66% | 81% | 113% | 70% | 84% |
A Total returns would have been lower had certain expenses not been reduced during the periods shown.
B Calculated based on average shares outstanding during the period.
C Fees and expenses of the underlying Fidelity Central Funds are not included in the Fund's expense ratio. The Fund indirectly bears its proportionate share of the expenses of any underlying Fidelity Central Funds.
D Amount does not include the portfolio activity of any underlying Fidelity Central Funds.
E Expense ratios reflect operating expenses of the class. Expenses before reductions do not reflect amounts reimbursed by the investment adviser or reductions from brokerage service arrangements or reductions from other expense offset arrangements and do not represent the amount paid by the class during periods when reimbursements or reductions occur. Expenses net of fee waivers reflect expenses after reimbursement by the investment adviser but prior to reductions from brokerage service arrangements or other expense offset arrangements. Expenses net of all reductions represent the net expenses paid by the class.
F Amount represents less than $.01 per share.
See accompanying notes which are an integral part of the financial statements.
Annual Report
Financial Highlights - Institutional Class
Years ended October 31, | 2010 | 2009 | 2008 | 2007 | 2006 |
Selected Per-Share Data | | | | | |
Net asset value, beginning of period | $ 17.47 | $ 12.01 | $ 31.38 | $ 28.99 | $ 26.86 |
Income from Investment Operations | | | | | |
Net investment income (loss) B | .09 | .09 | .05 | .12 | .08 |
Net realized and unrealized gain (loss) | 3.53 | 5.37 | (14.12) | 8.02 | 5.07 |
Total from investment operations | 3.62 | 5.46 | (14.07) | 8.14 | 5.15 |
Distributions from net investment income | (.09) | - | (.12) | (.07) | (.14) |
Distributions from net realized gain | (.34) | - | (5.18) | (5.68) | (2.89) |
Total distributions | (.43) | - | (5.30) | (5.75) | (3.03) |
Redemption fees added to paid in capital B | - F | - F | - F | - F | .01 |
Net asset value, end of period | $ 20.66 | $ 17.47 | $ 12.01 | $ 31.38 | $ 28.99 |
Total Return A | 21.15% | 45.46% | (53.22)% | 33.84% | 20.65% |
Ratios to Average Net Assets C,E | | | | | |
Expenses before reductions | 1.34% | 1.45% | 1.49% | 1.18% | 1.29% |
Expenses net of fee waivers, if any | 1.34% | 1.40% | 1.40% | 1.18% | 1.29% |
Expenses net of all reductions | 1.31% | 1.37% | 1.35% | 1.14% | 1.23% |
Net investment income (loss) | .47% | .66% | .25% | .45% | .28% |
Supplemental Data | | | | | |
Net assets, end of period (000 omitted) | $ 8,231 | $ 2,696 | $ 2,217 | $ 7,774 | $ 9,050 |
Portfolio turnover rate D | 66% | 81% | 113% | 70% | 84% |
A Total returns would have been lower had certain expenses not been reduced during the periods shown.
B Calculated based on average shares outstanding during the period.
C Fees and expenses of the underlying Fidelity Central Funds are not included in the Fund's expense ratio. The Fund indirectly bears its proportionate share of the expenses of any underlying Fidelity Central Funds.
D Amount does not include the portfolio activity of any underlying Fidelity Central Funds.
E Expense ratios reflect operating expenses of the class. Expenses before reductions do not reflect amounts reimbursed by the investment adviser or reductions from brokerage service arrangements or reductions from other expense offset arrangements and do not represent the amount paid by the class during periods when reimbursements or reductions occur. Expenses net of fee waivers reflect expenses after reimbursement by the investment adviser but prior to reductions from brokerage service arrangements or other expense offset arrangements. Expenses net of all reductions represent the net expenses paid by the class.
F Amount represents less than $.01 per share.
See accompanying notes which are an integral part of the financial statements.
Annual Report
Notes to Financial Statements
For the period ended October 31, 2010
1. Organization.
Fidelity International Small Cap Fund (the Fund) is a fund of Fidelity Investment Trust (the Trust) and is authorized to issue an unlimited number of shares. The Trust is registered under the Investment Company Act of 1940, as amended (the 1940 Act), as an open-end management investment company organized as a Massachusetts business trust. The Fund offers Class A, Class T, Class C, International Small Cap and Institutional Class shares, each of which has equal rights as to assets and voting privileges. Effective after the close of business on September 1, 2010, Class B shares were closed to new accounts and additional purchases by existing shareholders. Each class has exclusive voting rights with respect to matters that affect that class. Class B shares will automatically convert to Class A shares after a holding period of seven years from the initial date of purchase. Investment income, realized and unrealized capital gains and losses, the common expenses of the Fund, and certain fund-level expense reductions, if any, are allocated on a pro-rata basis to each class based on the relative net assets of each class to the total net assets of the Fund. Each class differs with respect to transfer agent and distribution and service plan fees incurred. Certain expense reductions also differ by class.
2. Investments in Fidelity Central Funds.
The Fund may invest in Fidelity Central Funds, which are open-end investment companies available only to other investment companies and accounts managed by Fidelity Management & Research Company (FMR) and its affiliates. The Fund's Schedule of Investments lists each of the Fidelity Central Funds held as of period end, if any, as an investment of the Fund, but does not include the underlying holdings of each Fidelity Central Fund. As an Investing Fund, the Fund indirectly bears its proportionate share of the expenses of the underlying Fidelity Central Funds.
The Money Market Central Funds seek preservation of capital and current income and are managed by Fidelity Investments Money Management, Inc. (FIMM), an affiliate of FMR.
A complete unaudited list of holdings for each Fidelity Central Fund is available upon request or at the Securities and Exchange Commission (the SEC) web site at www.sec.gov. In addition, the financial statements of the Fidelity Central Funds which are not covered by the Fund's Report of Independent Registered Public Accounting Firm, are available on the SEC web site or upon request.
Annual Report
Notes to Financial Statements - continued
3. Significant Accounting Policies.
The financial statements have been prepared in conformity with accounting principles generally accepted in the United States of America (GAAP), which require management to make certain estimates and assumptions at the date of the financial statements. Actual results could differ from those estimates. The following summarizes the significant accounting policies of the Fund:
Security Valuation. Investments are valued as of 4:00 p.m. Eastern time on the last calendar day of the period. The Fund uses independent pricing services approved by the Board of Trustees to value its investments. When current market prices or quotations are not readily available or reliable, valuations may be determined in good faith in accordance with procedures adopted by the Board of Trustees. Factors used in determining value may include market or security specific events, changes in interest rates and credit quality. The frequency with which these procedures are used cannot be predicted and they may be utilized to a significant extent. The value used for net asset value (NAV) calculation under these procedures may differ from published prices for the same securities.
The Fund categorizes the inputs to valuation techniques used to value its investments into a disclosure hierarchy consisting of three levels as shown below.
Level 1 - quoted prices in active markets for identical investments
Level 2 - other significant observable inputs (including quoted prices for similar investments, interest rates, prepayment speeds, etc.)
Level 3 - unobservable inputs (including the fund's own assumptions based on the best information available)
Changes in valuation techniques may result in transfers in or out of an assigned level within the disclosure hierarchy. The aggregate value of investments by input level, as of October 31, 2010, as well as a roll forward of Level 3 securities, is included at the end of the Fund's Schedule of Investments. Valuation techniques used to value the Fund's investments by major category are as follows.
Equity securities, including restricted securities, for which market quotations are readily available, are valued at the last reported sale price or official closing price as reported by an independent pricing service on the primary market or exchange on which they are traded and are categorized as Level 1 in the hierarchy. In the event there were no sales during the day or closing prices are not available, securities are valued at the last quoted bid price or may be valued using the last available price and are generally categorized as Level 2 in the hierarchy. For foreign equity securities, when significant market or security specific events arise, comparisons to the valuation of American Depositary Receipts
Annual Report
3. Significant Accounting Policies - continued
Security Valuation - continued
(ADRs), futures contracts, Exchange-traded funds (ETFs) and certain indexes as well as quoted prices for similar securities are used and are categorized as Level 2 in the hierarchy in these circumstances. Utilizing these techniques may result in significant transfers between Level 1 and Level 2. For restricted equity securities and private placements where observable inputs are limited, assumptions about market activity and risk are used and are categorized as Level 3 in the hierarchy.
Debt securities, including restricted securities, are valued based on evaluated prices received from independent pricing services or from dealers who make markets in such securities. For foreign government and government agency obligations, pricing services utilize matrix pricing which considers yield or price of bonds of comparable quality, coupon, maturity and type as well as dealer supplied prices and are generally categorized as Level 2 in the hierarchy.
Futures contracts are valued at the settlement price established each day by the board of trade or exchange on which they are traded and are categorized as Level 1 in the hierarchy. Investments in open-end mutual funds, including the Fidelity Central Funds, are valued at their closing net asset value each business day and are categorized as Level 1 in the hierarchy. Short-term securities with remaining maturities of sixty days or less for which quotations are not readily available are valued at amortized cost, which approximates fair value and are categorized as Level 2 in the hierarchy.
When independent prices are unavailable or unreliable, debt securities may be valued utilizing pricing matrices which consider similar factors that would be used by independent pricing services. These are generally categorized as Level 2 in the hierarchy but may be Level 3 depending on the circumstances.
Foreign Currency. The Fund uses foreign currency contracts to facilitate transactions in foreign-denominated securities. Gains and losses from these transactions may arise from changes in the value of the foreign currency or if the counterparties do not perform under the contracts' terms.
Foreign-denominated assets, including investment securities, and liabilities are translated into U.S. dollars at the exchange rate at period end. Purchases and sales of investment securities, income and dividends received and expenses denominated in foreign currencies are translated into U.S. dollars at the exchange rate in effect on the transaction date.
The effects of exchange rate fluctuations on investments are included with the net realized and unrealized gain (loss) on investment securities. Other foreign currency transactions resulting in realized and unrealized gain (loss) are disclosed separately.
Annual Report
Notes to Financial Statements - continued
3. Significant Accounting Policies - continued
Investment Transactions and Income. For financial reporting purposes, the Fund's investment holdings and NAV include trades executed through the end of the last business day of the period. The NAV per share for processing shareholder transactions is calculated as of the close of business of the New York Stock Exchange (NYSE), normally 4:00 p.m. Eastern time and includes trades executed through the end of the prior business day. Gains and losses on securities sold are determined on the basis of identified cost and may include proceeds received from litigation. Dividend income is recorded on the ex-dividend date, except for certain dividends from foreign securities where the ex-dividend date may have passed, which are recorded as soon as the Fund is informed of the ex-dividend date. Non-cash dividends included in dividend income, if any, are recorded at the fair market value of the securities received. Distributions received on securities that represent a return of capital or capital gain are recorded as a reduction of cost of investments and/or as a realized gain. The Fund estimates the components of distributions received that may be considered return of capital distributions or capital gain distributions. Interest income and distributions from the Fidelity Central Funds are accrued as earned. Interest income includes coupon interest and amortization of premium and accretion of discount on debt securities. Investment income is recorded net of foreign taxes withheld where recovery of such taxes is uncertain.
Expenses. Most expenses of the Trust can be directly attributed to a fund. Expenses which cannot be directly attributed are apportioned amongst each fund in the Trust. Expense estimates are accrued in the period to which they relate and adjustments are made when actual amounts are known.
Income Tax Information and Distributions to Shareholders. Each year the Fund intends to qualify as a regulated investment company, including distributing substantially all of its taxable income and realized gains under Subchapter M of the Internal Revenue Code and filing its U.S. federal tax return. As a result, no provision for income taxes is required. As of October 31, 2010, the Fund did not have any unrecognized tax benefits in the accompanying financial statements. A fund's federal tax return is subject to examination by the Internal Revenue Service (IRS) for a period of three years. Foreign taxes are provided for based on the Fund's understanding of the tax rules and rates that exist in the foreign markets in which it invests. The Fund is subject to a tax imposed on short term capital gains on securities of certain issuers domiciled in India. The Fund records an estimated deferred tax liability included in Other payables and accrued expenses in the accompanying Statement of Assets & Liabilities for net unrealized gains on these securities in an amount that would be payable if the securities were disposed of at period end.
Annual Report
3. Significant Accounting Policies - continued
Income Tax Information and Distributions to Shareholders - continued
Distributions are declared and recorded on the ex-dividend date. Income dividends and capital gain distributions are declared separately for each class. Income and capital gain distributions are determined in accordance with income tax regulations, which may differ from GAAP.
Capital accounts within the financial statements are adjusted for permanent book-tax differences. These adjustments have no impact on net assets or the results of operations. Temporary book-tax differences will reverse in a subsequent period.
Book-tax differences are primarily due to the short-term gain distributions from the Fidelity Central Funds, futures transactions, certain foreign taxes, foreign currency transactions, passive foreign investment companies (PFIC), capital loss carryforwards and losses deferred due to wash sales.
The federal tax cost of investment securities and unrealized appreciation (depreciation) as of period end were as follows:
Gross unrealized appreciation | $ 176,930,918 |
Gross unrealized depreciation | (111,385,171) |
Net unrealized appreciation (depreciation) | $ 65,545,747 |
| |
Tax Cost | $ 830,035,218 |
The tax-based components of distributable earnings as of period end were as follows:
Undistributed ordinary income | $ 30,617,208 |
Capital loss carryforward | $ (78,127,356) |
Net unrealized appreciation (depreciation) | $ 65,646,142 |
The tax character of distributions paid was as follows:
| October 31,
2010 | October 31,
2009 |
Ordinary Income | $ 17,692,151 | $ - |
Short-Term Trading (Redemption) Fees. Shares held by investors in the Fund less than 90 days are subject to a redemption fee equal to 2.00% of the net asset value of shares redeemed. All redemption fees, which reduce the proceeds of the shareholder redemption, are retained by the Fund and accounted for as an addition to paid in capital.
Annual Report
Notes to Financial Statements - continued
4. Operating Policies.
Delayed Delivery Transactions and When-Issued Securities. The Fund may purchase or sell securities on a delayed delivery or when-issued basis. Payment and delivery may take place after the customary settlement period for that security. The price of the underlying securities and the date when the securities will be delivered and paid for are fixed at the time the transaction is negotiated. During the time a delayed delivery sell is outstanding, the contract is marked-to-market daily and equivalent deliverable securities are held for the transaction. The securities purchased on a delayed delivery or when-issued basis are identified as such in the Fund's Schedule of Investments. The Fund may receive compensation for interest forgone in the purchase of a delayed delivery or when-issued security. With respect to purchase commitments, the Fund identifies securities as segregated in its records with a value at least equal to the amount of the commitment. Losses may arise due to changes in the value of the underlying securities or if the counterparty does not perform under the contract's terms, or if the issuer does not issue the securities due to political, economic, or other factors.
Restricted Securities. The Fund may invest in securities that are subject to legal or contractual restrictions on resale. These securities generally may be resold in transactions exempt from registration or to the public if the securities are registered. Disposal of these securities may involve time-consuming negotiations and expense, and prompt sale at an acceptable price may be difficult. Information regarding restricted securities is included at the end of the Fund's Schedule of Investments.
5. Derivative Instruments.
Risk Exposures and the Use of Derivative Instruments. The Fund uses derivative instruments (derivatives), including futures contracts, in order to meet its investment objectives. The strategy is to use derivatives to increase returns, to gain exposure to certain types of assets and to manage exposure to certain risks as defined below. The success of any strategy involving derivatives depends on analysis of numerous economic factors, and if the strategies for investment do not work as intended, the Fund may not achieve its objectives.
The Fund's use of derivatives may increase or decrease its exposure to the following risk:
Equity Risk | Equity risk relates to the fluctuations in the value of financial instruments as a result of changes in market prices (other than those arising from interest rate risk or foreign exchange risk), whether caused by factors specific to an individual investment, its issuer, or all factors affecting all instruments traded in a market or market segment. |
Annual Report
5. Derivative Instruments - continued
Risk Exposures and the Use of Derivative Instruments - continued
The Fund is also exposed to additional risks from investing in derivatives, such as liquidity risk and counterparty credit risk. Liquidity risk is the risk that the Fund will be unable to sell the derivative in the open market in a timely manner. Counterparty credit risk is the risk that the counterparty will not be able to fulfill its obligation to the Fund. The Fund's maximum risk of loss from counterparty credit risk is generally the aggregate unrealized appreciation and unpaid counterparty fees in excess of any collateral pledged by the counterparty to the Fund. Counterparty risk related to exchange-traded futures contracts is minimal because of the protection provided by the exchange on which they trade. Risk of loss may exceed the amounts recognized in the Statement of Assets and Liabilities.
Net Realized Gain (Loss) and Change in Net Unrealized Appreciation (Depreciation) on Derivatives. The table below, which reflects the impacts of derivatives on the financial performance of the Fund, summarizes the net realized gain (loss) and change in net unrealized appreciation (depreciation) for derivatives during the period.
Risk Exposure / Derivative Type | Net Realized
Gain (Loss) | Change in
Net Unrealized
Appreciation (Depreciation) |
Equity Risk | | |
Futures Contracts (a) | $ (1,268,507) | $ 53,183 |
(a) A summary of the value of derivatives by risk exposure as of period end, if any, is included at the end of the Schedule of Investments and is representative of activity for the period.
Futures Contracts. A futures contract is an agreement between two parties to buy or sell a specified underlying instrument for a fixed price at a specified future date. The Fund uses futures contracts to manage its exposure to the stock market.
Upon entering into a futures contract, a fund is required to deposit either cash or securities (initial margin) with a clearing broker in an amount equal to a certain percentage of the face value of the contract. Futures contracts are marked-to-market daily and subsequent payments (variation margin) are made or received by a fund depending on the daily fluctuations in the value of the futures contracts and are recorded as unrealized appreciation or (depreciation). Realized gain or (loss) is recorded upon the expiration or closing of a futures contract. The net realized gain (loss) and change in net unrealized appreciation (depreciation) on futures contracts during the period is included in the Statement of Operations.
Annual Report
Notes to Financial Statements - continued
5. Derivative Instruments - continued
Futures Contracts - continued
The underlying face amount at value of open futures contracts at period end is shown in the Schedule of Investments under the caption "Futures Contracts." This amount reflects each contract's exposure to the underlying instrument at period end. Securities deposited to meet initial margin requirements are identified in the Schedule of Investments. The receivable and/or payable for the variation margin are reflected in the Statement of Assets and Liabilities.
Certain risks may arise upon entering into futures contracts, including the risk that an illiquid market may limit the ability to close out a futures contract prior to settlement date.
6. Purchases and Sales of Investments.
Purchases and sales of securities, other than short-term securities, aggregated $476,133,271 and $487,415,757, respectively.
7. Fees and Other Transactions with Affiliates.
Management Fee. FMR and its affiliates provide the Fund with investment management related services for which the Fund pays a monthly management fee. The management fee is the sum of an individual fund fee rate that is based on an annual rate of .60% of the Fund's average net assets and a group fee rate that averaged .26% during the period. The group fee rate is based upon the average net assets of all the mutual funds advised by FMR. The group fee rate decreases as assets under management increase and increases as assets under management decrease. In addition, the management fee is subject to a performance adjustment (up to a maximum of ±.20% of the Fund's average net assets over a 36 month performance period). The upward or downward adjustment to the management fee is based on the relative investment performance of International Small Cap as compared to an appropriate benchmark index. For the period, the total annual management fee rate, including the performance adjustment, was 1.03% of the Fund's average net assets.
Distribution and Service Plan Fees. In accordance with Rule 12b-1 of the 1940 Act, the Fund has adopted separate Distribution and Service Plans for each class of shares. Certain classes pay Fidelity Distributors Corporation (FDC), an affiliate of FMR, separate Distribution and Service Fees, each of which is based on an annual percentage of each class' average net assets. In addition, FDC may pay financial intermediaries for selling shares of the Fund and providing shareholder support services. For the
Annual Report
7. Fees and Other Transactions with Affiliates - continued
Distribution and Service Plan Fees - continued
period, the Distribution and Service Fee rates, total fees and amounts retained by FDC were as follows:
| Distribution
Fee | Service
Fee | Total Fees | Retained
by FDC |
Class A | -% | .25% | $ 46,378 | $ 908 |
Class T | .25% | .25% | 77,108 | - |
Class B | .75% | .25% | 33,825 | 25,398 |
Class C | .75% | .25% | 97,426 | 5,162 |
| | | $ 254,737 | $ 31,468 |
Sales Load. FDC receives a front-end sales charge of up to 5.75% for selling Class A shares, and 3.50% for selling Class T shares, some of which is paid to financial intermediaries for selling shares of the Fund. FDC receives the proceeds of contingent deferred sales charges levied on Class A, Class T, Class B, and Class C redemptions. These charges depend on the holding period. The deferred sales charges range from 5% to 1% for Class B, 1% for Class C, 1.00% for certain purchases of Class A shares (1.00% to .50% prior to July 12, 2010) and .25% for certain purchases of Class T shares.
For the period, sales charge amounts retained by FDC were as follows:
| Retained
by FDC |
Class A | $ 5,297 |
Class T | 1,916 |
Class B* | 3,454 |
Class C* | 33 |
| $ 10,700 |
* When Class B and Class C shares are initially sold, FDC pays commissions from its own resources to financial intermediaries through which the sales are made.
Transfer Agent Fees. Fidelity Investments Institutional Operations Company, Inc. (FIIOC), an affiliate of FMR, is the transfer, dividend disbursing and shareholder servicing agent for each class of the Fund. FIIOC receives account fees and asset-based fees
Annual Report
Notes to Financial Statements - continued
7. Fees and Other Transactions with Affiliates - continued
Transfer Agent Fees - continued
that vary according to the account size and type of account of the shareholders of the respective classes of the Fund. FIIOC pays for typesetting, printing and mailing of shareholder reports, except proxy statements. For the period, transfer agent fees for each class were as follows:
| Amount | % of
Average
Net Assets |
Class A | $ 57,208 | .31 |
Class T | 48,466 | .31 |
Class B | 10,550 | .31 |
Class C | 27,486 | .28 |
International Small Cap | 2,013,385 | .29 |
Institutional Class | 10,795 | .22 |
| $ 2,167,890 | |
Accounting and Security Lending Fees. Fidelity Service Company, Inc. (FSC), an affiliate of FMR, maintains the Fund's accounting records. The accounting fee is based on the level of average net assets for the month. Under a separate contract, FSC administers the security lending program. The security lending fee is based on the number and duration of lending transactions.
Brokerage Commissions. The Fund placed a portion of its portfolio transactions with brokerage firms which are affiliates of the investment adviser. The commissions paid to these affiliated firms were $11 for the period.
8. Committed Line of Credit.
The Fund participates with other funds managed by FMR or an affiliate in a $3.75 billion credit facility (the "line of credit") to be utilized for temporary or emergency purposes to fund shareholder redemptions or for other short-term liquidity purposes. The Fund has agreed to pay commitment fees on its pro-rata portion of the line of credit, which amounted to $2,930 and is reflected in Miscellaneous expenses on the Statement of Operations. During the period, there were no borrowings on this line of credit.
Annual Report
9. Security Lending.
The Fund lends portfolio securities through a lending agent from time to time in order to earn additional income. The lending agent may loan securities to certain qualified borrowers, including Fidelity Capital Markets (FCM), a broker-dealer affiliated with the Fund. On the settlement date of the loan, the Fund receives collateral (in the form of U.S. Treasury obligations, letters of credit and/or cash) against the loaned securities and maintains collateral in an amount not less than 100% of the market value of the loaned securities during the period of the loan. The market value of the loaned securities is determined at the close of business of the Fund and any additional required collateral is delivered to the Fund on the next business day. If the borrower defaults on its obligation to return the securities loaned because of insolvency or other reasons, a fund could experience delays and costs in recovering the securities loaned or in gaining access to the collateral. Any cash collateral received is invested in the Fidelity Securities Lending Cash Central Fund. The value of loaned securities and cash collateral at period end are disclosed on the Fund's Statement of Assets and Liabilities. The value of securities loaned to FCM at period end was $280,736. Security lending income represents the income earned on investing cash collateral, less rebates paid to borrowers and lending agent fees associated with the loan, plus any premium payments received for lending certain types of securities. Security lending income is presented in the Statement of Operations as a component of income from Fidelity Central Funds and includes $792 from securities loaned to FCM.
10. Expense Reductions.
FMR voluntarily agreed to reimburse each class to the extent annual operating expenses exceeded certain levels of average net assets as noted in the table below. Some expenses, for example interest expense, including commitment fees, are excluded from this reimbursement.
The following classes were in reimbursement during the period:
| Expense
Limitations | Reimbursement
from adviser |
Class A | 1.65% | $ 11,149 |
Class T | 1.90% | 11,145 |
Class B | 2.40% | 2,441 |
Class C | 2.40% | 2,105 |
| | $ 26,840 |
Effective January 1, 2011 the expense limitations will be eliminated.
Many of the brokers with whom FMR places trades on behalf of the Fund provided services to the Fund in addition to trade execution. These services included payments of certain expenses on behalf of the Fund totaling $172,507 for the period.
Annual Report
Notes to Financial Statements - continued
11. Distributions to Shareholders.
Distributions to shareholders of each class were as follows:
Years ended October 31, | 2010 | 2009 |
From net investment income | | |
Class A | $ 59,453 | $ - |
Class T | 16,412 | - |
International Small Cap | 3,278,578 | - |
Institutional Class | 13,966 | - |
Total | $ 3,368,409 | $ - |
From net realized gain | | |
Class A | $ 354,632 | $ - |
Class T | 310,013 | - |
Class B | 60,241 | - |
Class C | 116,929 | - |
International Small Cap | 13,430,315 | - |
Institutional Class | 51,612 | - |
Total | $ 14,323,742 | $ - |
12. Share Transactions.
Transactions for each class of shares were as follows:
| Shares | Dollars |
Years ended October 31, | 2010 | 2009 | 2010 | 2009 |
Class A | | | | |
Shares sold | 380,659 | 269,227 | $ 6,723,746 | $ 3,575,375 |
Reinvestment of distributions | 22,435 | - | 393,061 | - |
Shares redeemed | (454,943) | (389,847) | (8,359,905) | (5,330,857) |
Net increase (decrease) | (51,849) | (120,620) | $ (1,243,098) | $ (1,755,482) |
Class T | | | | |
Shares sold | 143,286 | 158,075 | $ 2,532,790 | $ 2,173,778 |
Reinvestment of distributions | 18,371 | - | 319,658 | - |
Shares redeemed | (286,001) | (377,899) | (4,986,007) | (4,876,919) |
Net increase (decrease) | (124,344) | (219,824) | $ (2,133,559) | $ (2,703,141) |
Class B | | | | |
Shares sold | 14,694 | 8,564 | $ 256,700 | $ 108,038 |
Reinvestment of distributions | 3,302 | - | 56,465 | - |
Shares redeemed | (57,958) | (71,172) | (990,211) | (857,564) |
Net increase (decrease) | (39,962) | (62,608) | $ (677,046) | $ (749,526) |
Class C | | | | |
Shares sold | 430,838 | 21,018 | $ 7,671,593 | $ 275,491 |
Reinvestment of distributions | 6,001 | - | 102,910 | - |
Shares redeemed | (101,847) | (159,519) | (1,759,170) | (1,999,518) |
Net increase (decrease) | 334,992 | (138,501) | $ 6,015,333 | $ (1,724,027) |
Annual Report
12. Share Transactions - continued
Transactions for each class of shares were as follows: - continued
| Shares | Dollars |
Years ended October 31, | 2010 | 2009 | 2010 | 2009 |
International Small Cap | | | | |
Shares sold | 10,330,000 | 4,989,568 | $ 188,548,758 | $ 69,926,221 |
Reinvestment of distributions | 888,440 | - | 15,725,385 | - |
Shares redeemed | (10,371,667) | (11,303,255) | (183,663,034) | (144,001,202) |
Net increase (decrease) | 846,773 | (6,313,687) | $ 20,611,109 | $ (74,074,981) |
Institutional Class | | | | |
Shares sold | 288,839 | 28,026 | $ 5,178,797 | $ 355,084 |
Reinvestment of distributions | 2,890 | - | 51,087 | - |
Shares redeemed | (47,677) | (58,235) | (865,855) | (718,368) |
Net increase (decrease) | 244,052 | (30,209) | $ 4,364,029 | $ (363,284) |
13. Other.
The Fund's organizational documents provide former and current trustees and officers with a limited indemnification against liabilities arising in connection with the performance of their duties to the Fund. In the normal course of business, the Fund may also enter into contracts that provide general indemnifications. The Fund's maximum exposure under these arrangements is unknown as this would be dependent on future claims that may be made against the Fund. The risk of material loss from such claims is considered remote.
Annual Report
To the Trustees of Fidelity Investment Trust and Shareholders of Fidelity International Small Cap Fund:
We have audited the accompanying statement of assets and liabilities of Fidelity International Small Cap Fund (the Fund), a fund of Fidelity Investment Trust, including the schedule of investments, as of October 31, 2010, and the related statement of operations for the year then ended, the statement of changes in net assets for each of the two years in the period then ended, and the financial highlights for each of the five years in the period then ended. These financial statements and financial highlights are the responsibility of the Fund's management. Our responsibility is to express an opinion on these financial statements and financial highlights based on our audits.
We conducted our audits in accordance with standards of the Public Company Accounting Oversight Board (United States). Those standards require that we plan and perform the audit to obtain reasonable assurance about whether the financial statements and financial highlights are free of material misstatement. The Fund is not required to have, nor were we engaged to perform, an audit of its internal control over financial reporting. Our audits included consideration of internal control over financial reporting as a basis for designing audit procedures that are appropriate in the circumstances, but not for the purpose of expressing an opinion on the effectiveness of the Fund's internal control over financial reporting. Accordingly, we express no such opinion. An audit also includes examining, on a test basis, evidence supporting the amounts and disclosures in the financial statements, assessing the accounting principles used and significant estimates made by management, as well as evaluating the overall financial statement presentation. Our procedures included confirmation of securities owned as of October 31, 2010, by correspondence with the custodians and brokers; where replies were not received from brokers, we performed other auditing procedures. We believe that our audits provide a reasonable basis for our opinion.
In our opinion, the financial statements and financial highlights referred to above present fairly, in all material respects, the financial position of Fidelity International Small Cap Fund as of October 31, 2010, the results of its operations for the year then ended, the changes in its net assets for each of the two years in the period then ended, and the financial highlights for each of the five years in the period then ended, in conformity with accounting principles generally accepted in the United States of America.
/s/ Deloitte & Touche LLP
DELOITTE & TOUCHE LLP
Boston, Massachusetts
December 17, 2010
Annual Report
The Trustees, Member of the Advisory Board, and executive officers of the trust and fund, as applicable, are listed below. The Board of Trustees governs the fund and is responsible for protecting the interests of shareholders. The Trustees are experienced executives who meet periodically throughout the year to oversee the fund's activities, review contractual arrangements with companies that provide services to the fund, oversee management of the risks associated with such activities and contractual arrangements, and review the fund's performance. Except for James C. Curvey, each of the Trustees oversees 221 funds advised by FMR or an affiliate. Mr. Curvey oversees 410 funds advised by FMR or an affiliate.
The Trustees hold office without limit in time except that (a) any Trustee may resign; (b) any Trustee may be removed by written instrument, signed by at least two-thirds of the number of Trustees prior to such removal; (c) any Trustee who requests to be retired or who has become incapacitated by illness or injury may be retired by written instrument signed by a majority of the other Trustees; and (d) any Trustee may be removed at any special meeting of shareholders by a two-thirds vote of the outstanding voting securities of the trust. Each Trustee who is not an interested person (as defined in the 1940 Act) (Independent Trustee), shall retire not later than the last day of the calendar year in which his or her 72nd birthday occurs. The Independent Trustees may waive this mandatory retirement age policy with respect to individual Trustees. The executive officers and Advisory Board Member hold office without limit in time, except that any officer and Advisory Board Member may resign or may be removed by a vote of a majority of the Trustees at any regular meeting or any special meeting of the Trustees. Except as indicated, each individual has held the office shown or other offices in the same company for the past five years.
Experience, Skills, Attributes, and Qualifications of the Fund's Trustees. The Governance and Nominating Committee has adopted a statement of policy that describes the experience, qualifications, attributes, and skills that are necessary and desirable for potential Independent Trustee candidates (Statement of Policy). The Board believes that each Trustee satisfied at the time he or she was initially elected or appointed a Trustee, and continues to satisfy, the standards contemplated by the Statement of Policy. The Governance and Nominating Committee also engages professional search firms to help identify potential Independent Trustee candidates who have the experience, qualifications, attributes, and skills consistent with the Statement of Policy. From time to time, additional criteria based on the composition and skills of the current Independent Trustees, as well as experience or skills that may be appropriate in light of future changes to board composition, business conditions, and regulatory or other developments, have also been considered by the professional search firms and the Governance and Nominating Committee. In addition, the Board takes into account the Trustees' commitment and participation in Board and committee meetings, as well as their leadership of standing and ad hoc committees throughout their tenure.
In determining that a particular Trustee was and continues to be qualified to serve as a Trustee, the Board has considered a variety of criteria, none of which, in isolation, was controlling. The Board believes that, collectively, the Trustees have balanced and diverse experience, qualifications, attributes, and skills, which allow the Board to operate effectively in governing the fund and protecting the interests of shareholders. Information about the specific experience, skills, attributes, and qualifications of each Trustee, which in each case led to the Board's conclusion that the Trustee should serve (or continue to serve) as a trustee of the fund, is provided below.
Annual Report
Trustees and Officers - continued
Board Structure and Oversight Function. Edward C. Johnson 3d is an interested person (as defined in the 1940 Act) and currently serves as Chairman. The Trustees have determined that an interested Chairman is appropriate and benefits shareholders because an interested Chairman has a personal and professional stake in the quality and continuity of services provided to the fund. Independent Trustees exercise their informed business judgment to appoint an individual of their choosing to serve as Chairman, regardless of whether the Trustee happens to be independent or a member of management. The Independent Trustees have determined that they can act independently and effectively without having an Independent Trustee serve as Chairman and that a key structural component for assuring that they are in a position to do so is for the Independent Trustees to constitute a substantial majority for the Board. The Independent Trustees also regularly meet in executive session. Ned C. Lautenbach serves as Chairman of the Independent Trustees and as such (i) acts as a liaison between the Independent Trustees and management with respect to matters important to the Independent Trustees and (ii) with management prepares agendas for Board meetings.
Fidelity funds are overseen by different Boards of Trustees. The fund's Board oversees Fidelity's equity and high income funds and another Board oversees Fidelity's investment-grade bond, money market, and asset allocation funds. The asset allocation funds may invest in Fidelity funds overseen by the fund's Board. The use of separate Boards, each with its own committee structure, allows the Trustees of each group of Fidelity funds to focus on the unique issues of the funds they oversee, including common research, investment, and operational issues. On occasion, the separate Boards establish joint committees to address issues of overlapping consequences for the Fidelity funds overseen by each Board.
The Trustees operate using a system of committees to facilitate the timely and efficient consideration of all matters of importance to the Trustees, the fund, and fund shareholders and to facilitate compliance with legal and regulatory requirements and oversight of the fund's activities and associated risks. The Board, acting through its committees, has charged FMR and its affiliates with (i) identifying events or circumstances the occurrence of which could have demonstrably adverse effects on the fund's business and/or reputation; (ii) implementing processes and controls to lessen the possibility that such events or circumstances occur or to mitigate the effects of such events or circumstances if they do occur; and (iii) creating and maintaining a system designed to evaluate continuously business and market conditions in order to facilitate the identification and implementation processes described in (i) and (ii) above. Because the day-to-day operations and activities of the fund are carried out by or through FMR, its affiliates and other service providers, the fund's exposure to risks is mitigated but not eliminated by the processes overseen by the Trustees. While each of the Board's committees has responsibility for overseeing different aspects of the fund's activities, oversight is exercised primarily through the Operations, Audit, and Compliance Committees. Appropriate personnel, including but not limited to the fund's Chief Compliance Officer (CCO), FMR's internal auditor, the independent accountants, the fund's Treasurer and portfolio management personnel, make periodic reports to the Board's committees, as appropriate. The responsibilities of each committee, including their oversight responsibilities, are described further under "Standing Committees of the Fund's Trustees."
Annual Report
The fund's Statement of Additional Information (SAI) includes more information about the Trustees. To request a free copy, call Fidelity at 1-800-544-8544.
Interested Trustees*:
Correspondence intended for each Trustee who is an interested person may be sent to Fidelity Investments, 82 Devonshire Street, Boston, Massachusetts 02109.
Name, Age; Principal Occupations and Other Relevant Experience+ |
Edward C. Johnson 3d (80) |
| Year of Election or Appointment: 1984 Mr. Johnson is Trustee and Chairman of the Board of Trustees of certain Trusts. Mr. Johnson serves as Chief Executive Officer, Chairman, and a Director of FMR LLC; Chairman and a Director of FMR; Chairman and a Director of Fidelity Research & Analysis Company (FRAC); Chairman and a Director of Fidelity Investments Money Management, Inc.; and Chairman and a Director of FMR Co., Inc. In addition, Mr. Johnson serves as Chairman and Director of FIL Limited. Previously, Mr. Johnson served as President of FMR LLC (2006-2007). |
James C. Curvey (75) |
| Year of Election or Appointment: 2007 Mr. Curvey also serves as Trustee (2007-present) of other investment companies advised by FMR. Mr. Curvey is a Director of Fidelity Investments Money Management, Inc. (2009-present), Director of Fidelity Research & Analysis Co. (2009-present) and Director of FMR and FMR Co., Inc. (2007-present). Mr. Curvey is also Vice Chairman (2007-present) and Director of FMR LLC. In addition, Mr. Curvey serves as an Overseer for the Boston Symphony Orchestra and a member of the Trustees of Villanova University. Previously, Mr. Curvey was the Vice Chairman (2006-2007) and Director (2000-2007) of FMR Corp. |
* Trustees have been determined to be "Interested Trustees" by virtue of, among other things, their affiliation with the trust or various entities under common control with FMR.
+ The information above includes each Trustee's principal occupation during the last five years and other information relating to the experience, attributes, and skills relevant to each Trustee's qualifications to serve as a Trustee, which led to the conclusion that each Trustee should serve as a Trustee for the fund.
Annual Report
Trustees and Officers - continued
Independent Trustees:
Correspondence intended for each Independent Trustee (that is, the Trustees other than the Interested Trustees) may be sent to Fidelity Investments, P.O. Box 55235, Boston, Massachusetts 02205-5235.
Name, Age; Principal Occupations and Other Relevant Experience+ |
Dennis J. Dirks (62) |
| Year of Election or Appointment: 2005 Prior to his retirement in May 2003, Mr. Dirks was Chief Operating Officer and a member of the Board of The Depository Trust & Clearing Corporation (DTCC). He also served as President, Chief Operating Officer, and Board member of The Depository Trust Company (DTC) and President and Board member of the National Securities Clearing Corporation (NSCC). In addition, Mr. Dirks served as Chief Executive Officer and Board member of the Government Securities Clearing Corporation, Chief Executive Officer and Board member of the Mortgage-Backed Securities Clearing Corporation, as a Trustee and a member of the Finance Committee of Manhattan College (2005-2008), and as a Trustee and a member of the Finance Committee of AHRC of Nassau County (2006-2008). Mr. Dirks is a member of the Independent Directors Council (IDC) Governing Council (2010-Present) and Board of Directors for The Brookville Center for Children's Services, Inc. (2009-present). |
Alan J. Lacy (57) |
| Year of Election or Appointment: 2008 Mr. Lacy serves as Senior Adviser (2007-present) of Oak Hill Capital Partners, L.P. (private equity). Mr. Lacy also served as Chief Executive Officer (2000-2005) and Vice Chairman (2005-2006) of Sears Holdings Corporation and Sears, Roebuck and Co. (retail). In addition, Mr. Lacy serves as a member of the Board of Directors of The Western Union Company (global money transfer, 2006-present) and Bristol-Myers Squibb Company (global pharmaceuticals, 2007-present). Mr. Lacy is Chairman (2008-present) and a member (2006-present) of the Board of Trustees of The National Parks Conservation Association. |
Ned C. Lautenbach (66) |
| Year of Election or Appointment: 2000 Mr. Lautenbach is Chairman of the Independent Trustees of the Equity and High Income Funds (2006-present). Mr. Lautenbach currently serves as the Lead Director of the Eaton Corporation Board of Directors (diversified industrial, 1997-present). Mr. Lautenbach is also a member of the Board of Directors of the Philharmonic Center for the Arts in Naples, Florida (1999-present); a member of the Board of Trustees of Fairfield University (2005-present); and a member of the Council on Foreign Relations (1994-present). Previously, Mr. Lautenbach was a Partner/Advisory Partner at Clayton, Dubilier & Rice, Inc. (private equity investment, 1998-2010), as well as a Director of Sony Corporation (2006-2007). |
Joseph Mauriello (66) |
| Year of Election or Appointment: 2008 Prior to his retirement in January 2006, Mr. Mauriello served in numerous senior management positions including Deputy Chairman and Chief Operating Officer (2004-2005), and Vice Chairman of Financial Services (2002-2004) of KPMG LLP US (professional services, 1965-2005). Mr. Mauriello currently serves as a member of the Board of Directors of XL Group plc. (global insurance and re-insurance, 2006-present) and of Arcadia Resources Inc. (health care services and products, 2007-present). Previously, Mr. Mauriello served as a Director of the Hamilton Funds of the Bank of New York (2006-2007). |
Cornelia M. Small (66) |
| Year of Election or Appointment: 2005 Ms. Small is a member of the Board of Directors of the Teagle Foundation (2009-present). Ms. Small is also a member of the Investment Committee, and Chair (2008-present) and a member of the Board of Trustees of Smith College. In addition, Ms. Small serves on the Investment Committee of the Berkshire Taconic Community Foundation (2008-present). Previously, Ms. Small served as Chairperson of the Investment Committee (2002-2008) of Smith College. In addition, Ms. Small served as Chief Investment Officer, Director of Global Equity Investments, and a member of the Board of Directors of Scudder, Stevens & Clark and Scudder Kemper Investments. |
William S. Stavropoulos (71) |
| Year of Election or Appointment: 2001 Mr. Stavropoulos is Vice Chairman of the Independent Trustees of the Equity and High Income Funds (2006-present). Mr. Stavropoulos serves as President and Founder of the Michigan Baseball Foundation, the Great Lakes Loons (2007-present). Mr. Stavropoulos is Chairman Emeritus of the Board of Directors of The Dow Chemical Company, where he previously served in numerous senior management positions, including President, CEO (1995-2000; 2002-2004), Chairman of the Executive Committee (2000-2006), and as a member of the Board of Directors (1990-2006). Currently, Mr. Stavropoulos is Chairman of Univar (global distributor of commodity and specialty chemicals, 2010-present), a Director of Teradata Corporation (data warehousing and technology solutions, 2008-present), Chemical Financial Corporation, Maersk Inc. (industrial conglomerate), Tyco International, Inc. (multinational manufacturing and services, 2007-present), and a member of the Advisory Board for Metalmark Capital (private equity investment, 2005-present). Mr. Stavropoulos is a special advisor to Clayton, Dubilier & Rice, Inc. (private equity investment). In addition, Mr. Stavropoulos is a member of the University of Notre Dame Advisory Council for the College of Science. |
David M. Thomas (61) |
| Year of Election or Appointment: 2008 Previously, Mr. Thomas served as Executive Chairman (2005-2006) and Chairman and Chief Executive Officer (2000-2005) of IMS Health, Inc. (pharmaceutical and healthcare information solutions). In addition, Mr. Thomas serves as a member of the Board of Directors of Fortune Brands, Inc. (consumer products), and Interpublic Group of Companies, Inc. (marketing communication, 2004-present). |
Michael E. Wiley (60) |
| Year of Election or Appointment: 2008 Mr. Wiley also serves as a Director of Asia Pacific Exploration Consolidated (international oil and gas exploration and production, 2008-present). Mr. Wiley serves as a Director of Tesoro Corporation (independent oil refiner and marketer, 2005-present), and a Director of Bill Barrett Corporation (exploration and production, 2005-present). In addition, Mr. Wiley also serves as a Director of Post Oak Bank (privately-held bank, 2004-present). Previously, Mr. Wiley served as a member of the Board of Trustees of the University of Tulsa (2000-2006; 2007-2010), as a Senior Energy Advisor of Katzenbach Partners, LLC (consulting, 2006-2007), as an Advisory Director of Riverstone Holdings (private investment), Chairman, President, and CEO of Baker Hughes, Inc. (oilfield services, 2000-2004), and as Director of Spinnaker Exploration Company (exploration and production, 2001-2005). |
+ The information above includes each Trustee's principal occupation during the last five years and other information relating to the experience, attributes, and skills relevant to each Trustee's qualifications to serve as a Trustee, which led to the conclusion that each Trustee should serve as a Trustee for the fund.
Advisory Board Member and Executive Officers:
Correspondence intended for each executive officer and Peter S. Lynch may be sent to Fidelity Investments, 82 Devonshire Street, Boston, Massachusetts 02109.
Name, Age; Principal Occupation |
Peter S. Lynch (66) |
| Year of Election or Appointment: 2003 Member of the Advisory Board of Fidelity's Equity and High Income Funds. Mr. Lynch is Vice Chairman and a Director of FMR and FMR Co., Inc. In addition, Mr. Lynch serves as a Trustee of Boston College and as the Chairman of the Inner-City Scholarship Fund. Previously, Mr. Lynch served on the Special Olympics International Board of Directors (1997-2006). |
Kenneth B. Robins (41) |
| Year of Election or Appointment: 2008 President and Treasurer of Fidelity's Equity and High Income Funds. Mr. Robins also serves as President and Treasurer (2010-present) and Assistant Treasurer (2009-present) of other Fidelity funds and is an employee of Fidelity Investments (2004-present). Previously, Mr. Robins served as Deputy Treasurer of the Fidelity funds (2005-2008) and Treasurer and Chief Financial Officer of The North Carolina Capital Management Trust: Cash and Term Portfolios (2006-2008). |
Brian B. Hogan (46) |
| Year of Election or Appointment: 2009 Vice President of certain Equity Funds and Vice President of Sector Funds. Mr. Hogan also serves as President of FMR's Equity Division (2009-present). Previously, Mr. Hogan served as Senior Vice President, Equity Research of FMR (2006-2009) and as a portfolio manager. |
Thomas C. Hense (46) |
| Year of Election or Appointment: 2008 or 2010 Vice President of Fidelity's High Income (2008), Small Cap (2008), and Value (2010) Funds. Previously, Mr. Hense served as a portfolio manager for Fidelity's Institutional Money Management Group (Pyramis) (2003-2008). |
Scott C. Goebel (42) |
| Year of Election or Appointment: 2008 Secretary and Chief Legal Officer (CLO) of the Fidelity funds. Mr. Goebel also serves as Secretary and CLO of The North Carolina Capital Management Trust: Cash and Term Portfolio (2008-present); General Counsel, Secretary, and Senior Vice President of FMR (2008-present) and FMR Co., Inc. (2008-present); Deputy General Counsel of FMR LLC; Chief Legal Officer of Fidelity Management & Research (Hong Kong) Limited (2008-present) and Assistant Secretary of Fidelity Management & Research (Japan) Inc. (2008-present), Fidelity Investments Money Management, Inc. (2008-present), Fidelity Management & Research (U.K.) Inc. (2008-present), and Fidelity Research and Analysis Company (2008-present). Previously, Mr. Goebel served as Assistant Secretary of the Funds (2007-2008) and as Vice President and Secretary of Fidelity Distributors Corporation (FDC) (2005-2007). |
William C. Coffey (41) |
| Year of Election or Appointment: 2009 Assistant Secretary of Fidelity's Equity and High Income Funds. Mr. Coffey also serves as Senior Vice President and Deputy General Counsel of FMR LLC (2010-present), and is an employee of Fidelity Investments. Previously, Mr. Coffey served as Vice President and Associate General Counsel of FMR LLC (2005-2009). |
Holly C. Laurent (56) |
| Year of Election or Appointment: 2008 Anti-Money Laundering (AML) Officer of the Fidelity funds. Ms. Laurent also serves as AML Officer of The North Carolina Capital Management Trust: Cash and Term Portfolio (2008-present) and is an employee of Fidelity Investments. Previously, Ms. Laurent was Senior Vice President and Head of Legal for Fidelity Business Services India Pvt. Ltd. (2006-2008), and Senior Vice President, Deputy General Counsel and Group Head for FMR LLC (2005-2006). |
Christine Reynolds (52) |
| Year of Election or Appointment: 2008 Chief Financial Officer of the Fidelity funds. Ms. Reynolds became President of Fidelity Pricing and Cash Management Services (FPCMS) in August 2008. Ms. Reynolds served as Chief Operating Officer of FPCMS (2007-2008). Previously, Ms. Reynolds served as President, Treasurer, and Anti-Money Laundering officer of the Fidelity funds (2004-2007). |
Kenneth A. Rathgeber (63) |
| Year of Election or Appointment: 2004 Chief Compliance Officer of Fidelity's Equity and High Income Funds. Mr. Rathgeber is Chief Compliance Officer of Fidelity Management & Research (Hong Kong) Limited (2008-present), Fidelity Management & Research (Japan) Inc. (2008-present), FMR (2005-present), FMR Co., Inc. (2005-present), Fidelity Management & Research (U.K.) Inc. (2005-present), Fidelity Research & Analysis Company (2005-present), Fidelity Investments Money Management, Inc. (2005-present), Pyramis Global Advisors, LLC (2005-present), and Strategic Advisers, Inc. (2005-present). |
Jeffrey S. Christian (49) |
| Year of Election or Appointment: 2009 Deputy Treasurer of the Fidelity funds. Mr. Christian is an employee of Fidelity Investments. Previously, Mr. Christian served as Chief Financial Officer (2008-2009) of certain Fidelity funds and Senior Vice President of Fidelity Pricing and Cash Management Services (FPCMS) (2004-2009). |
Bryan A. Mehrmann (49) |
| Year of Election or Appointment: 2005 Deputy Treasurer of the Fidelity funds. Mr. Mehrmann is an employee of Fidelity Investments. |
Adrien E. Deberghes (43) |
| Year of Election or Appointment: 2008 Deputy Treasurer of Fidelity's Equity and High Income Funds. Mr. Deberghes also serves as Assistant Treasurer of other Fidelity funds (2010-present) and is an employee of Fidelity Investments (2008-present). Previously, Mr. Deberghes served as Senior Vice President of Mutual Fund Administration at State Street Corporation (2007-2008), Senior Director of Mutual Fund Administration at Investors Bank & Trust (2005-2007), and Director of Finance for Dunkin' Brands (2000-2005). |
Stephanie J. Dorsey (41) |
| Year of Election or Appointment: 2010 Assistant Treasurer of Fidelity's Equity and High Income Funds. Ms. Dorsey also serves as Deputy Treasurer of other Fidelity funds (2008-present) and is an employee of Fidelity Investments (2008-present). Previously, Ms. Dorsey served as Treasurer (2004-2008) of the JPMorgan Mutual Funds and Vice President (2004-2008) of JPMorgan Chase Bank. |
John R. Hebble (52) |
| Year of Election or Appointment: 2009 Assistant Treasurer of Fidelity's Equity and High Income Funds. Mr. Hebble also serves as Treasurer and Chief Financial Officer of The North Carolina Capital Management Trust: Cash and Term Portfolio (2008-present), President and Treasurer of other Fidelity funds (2008-present) and is an employee of Fidelity Investments. |
Gary W. Ryan (52) |
| Year of Election or Appointment: 2005 Assistant Treasurer of the Fidelity funds. Mr. Ryan is an employee of Fidelity Investments. Previously, Mr. Ryan served as Vice President of Fund Reporting in Fidelity Pricing and Cash Management Services (FPCMS) (1999-2005). |
Jonathan Davis (42) |
| Year of Election or Appointment: 2010 Assistant Treasurer of the Fidelity funds. Mr. Davis is an employee of Fidelity Investments. Previously, Mr. Davis served as Vice President and Associate General Counsel of FMR LLC (2003-2010). |
Annual Report
The Board of Trustees of Fidelity International Small Cap Fund voted to pay to shareholders of record at the opening of business on record date, the following distributions per share derived from capital gains realized from sales of portfolio securities, and dividends derived from net investment income:
| Pay Date | Record Date | Dividends | Capital Gains |
International Small Cap Fund | 12/06/10 | 12/03/10 | $0.06 | $0.661 |
The amounts per share which represent income derived from sources within, and taxes paid to, foreign countries or possessions of the United States are as follows:
| Pay Date | Income | Taxes |
International Small Cap Fund | 12/7/09 | $0.162 | $0.0141 |
The fund will notify shareholders in January 2011 of amounts for use in preparing 2010 income tax returns.
Annual Report
Board Approval of Investment Advisory Contracts and Management Fees
Fidelity International Small Cap Fund
Each year, the Board of Trustees, including the Independent Trustees (together, the Board), votes on the renewal of the management contract and sub-advisory agreements (together, the Advisory Contracts) for the fund. The Board, assisted by the advice of fund counsel and Independent Trustees' counsel, requests and considers a broad range of information relevant to the renewal of the Advisory Contracts throughout the year.
The Board meets regularly and considers at each of its meetings factors that are relevant to its annual consideration of the renewal of the fund's Advisory Contracts, including the services and support provided to the fund and its shareholders. The Board has established various standing committees, each composed of Independent Trustees with varying backgrounds, to which the Board has assigned specific subject matter responsibilities in order to enhance effective decision-making by the Board. The Board, acting directly and through its Committees, requests and receives information concerning the annual consideration of the renewal of the fund's Advisory Contracts. The Board also meets as needed to consider matters specifically related to the Board's annual consideration of the renewal of Advisory Contracts. Members of the Board may also meet with trustees of other Fidelity funds through ad hoc joint committees to discuss certain matters relevant to the Fidelity funds.
At its July 2010 meeting, the Board of Trustees, including the Independent Trustees, unanimously determined to renew the fund's Advisory Contracts. In reaching its determination, the Board considered all factors it believed relevant, including (i) the nature, extent, and quality of the services to be provided to the fund and its shareholders (including the investment performance of the fund); (ii) the competitiveness of the fund's management fee and total expenses; (iii) the total costs of the services to be provided by and the profits to be realized by Fidelity from its relationship with the fund; (iv) the extent to which economies of scale would be realized as the fund grows; and (v) whether fee levels reflect these economies of scale, if any, for the benefit of fund shareholders.
In considering whether to renew the Advisory Contracts for the fund, the Board reached a determination, with the assistance of fund counsel and Independent Trustees' counsel and through the exercise of its business judgment, that the renewal of the Advisory Contracts is in the best interests of fund shareholders and that the compensation to be received by Fidelity under the management contract is fair and reasonable. The Board's decision to renew the Advisory Contracts was not based on any single factor noted above, but rather was based on a comprehensive consideration of all the information provided to the Board at its meetings throughout the year. The Board, in reaching its determination to renew the Advisory Contracts, is aware that shareholders in the fund have a broad range of investment choices available to them, including a wide choice among mutual funds offered by Fidelity's competitors, and that the fund's shareholders, with the opportunity to review and weigh the disclosure provided by the fund in its prospectus and other public disclosures, have chosen to invest in this fund, managed by Fidelity.
Annual Report
Nature, Extent, and Quality of Services Provided. The Board considered the staffing within the investment adviser, FMR, and the sub-advisers (together, the Investment Advisers), including the backgrounds of the fund's investment personnel and the fund's investment objective and discipline. The Independent Trustees also had discussions with senior management of Fidelity's investment operations and investment groups. The Board considered the structure of the portfolio manager compensation program and whether this structure provides appropriate incentives to act in the best interest of the fund.
Resources Dedicated to Investment Management and Support Services. The Board and the equity research subcommittee of the Board's Fund Oversight Committee reviewed the size, education, and experience of the Investment Advisers' investment staff, their use of technology, and the Investment Advisers' approach to recruiting, training, and retaining portfolio managers and other research, advisory, and management personnel. The Board noted that Fidelity's analysts have access to a variety of technological tools and market and securities data that enable them to perform both fundamental and quantitative analysis and to specialize in various disciplines. The Board considered Fidelity's extensive global research capabilities that enable the Investment Advisers to aggregate data from various sources in an effort to produce positive investment results. The Board also considered that Fidelity's portfolio managers and analysts have access to daily portfolio attribution that allows for monitoring of a fund's portfolio, as well as an electronic communication system that provides immediate real-time access to research concerning issuers and credit enhancers. The Board noted FMR's continued focus on strengthening the organization and discipline of equity portfolio management and research.
Shareholder and Administrative Services. The Board considered (i) the nature, extent, quality, and cost of advisory, administrative, and shareholder services performed by the Investment Advisers and their affiliates under the Advisory Contracts and under separate agreements covering transfer agency, pricing and bookkeeping, and securities lending services for the fund; (ii) the nature and extent of the investment adviser's supervision of third party service providers, principally custodians and subcustodians; and (iii) the resources devoted to, and the record of compliance with, the fund's compliance policies and procedures. The Board also reviewed the allocation of fund brokerage, including allocations to brokers affiliated with the Investment Advisers, the use of brokerage commissions to pay fund expenses, and the use of "soft" commission dollars to pay for research services.
The Board noted that the growth of fund assets over time across the complex allows Fidelity to reinvest in the development of services designed to enhance the value or convenience of the Fidelity funds as investment vehicles. These services include 24-hour access to account information and market information through phone representatives and over the Internet, and investor education materials and asset allocation tools.
Annual Report
Board Approval of Investment Advisory Contracts and
Management Fees - continued
Investment in a Large Fund Family. The Board considered the benefits to shareholders of investing in a Fidelity fund, including the benefits of investing in a fund that is part of a large family of funds offering a variety of investment disciplines and providing a large variety of mutual fund investor services. The Board noted that Fidelity had taken, or had made recommendations that resulted in the Fidelity funds taking, a number of actions over the previous year that benefited particular funds, including (i) dedicating additional resources to investment research and restructuring and broadening the focus of the investment research teams; (ii) bolstering the senior management team that oversees asset management; (iii) launching Class F of certain funds as a lower-fee class available to Freedom K and Freedom Index Funds; (iv) lowering the initial investment minimums and ongoing balance requirements for Real Estate High Income Fund; (v) eliminating subsequent purchase minimums for all funds and adding a waiver of the investment minimum requirement for new accounts opened with the proceeds of a systematic withdrawal plan; (vi) eliminating the withdrawal minimum and maximum limits for systematic withdrawals from Advisor funds; (vii) expanding sales load waivers on Class A shares for Destiny Planholders and expanding Institutional Class eligibility for Class O Destiny Planholders; and (viii) changing certain Class A and Class T sales charge structures to further align them with industry practices.
Investment Performance. The Board considered whether the fund has operated in accordance with its investment objective, as well as its record of compliance with its investment restrictions. It also reviewed the fund's absolute investment performance for each class, as well as the fund's relative investment performance for each class measured over multiple periods against (i) a broad-based securities market index, and (ii) a peer group of mutual funds deemed appropriate by Fidelity and reviewed by the Board. The following charts considered by the Board show, over the one-, three-, and five-year periods ended December 31, 2009, the cumulative total returns of Institutional Class (Class I) and Class B of the fund, the cumulative total returns of a broad-based securities market index ("benchmark"), and a range of cumulative total returns of a peer group of mutual funds identified by Lipper Inc. as having an investment objective similar to that of the fund. The returns of Institutional Class (Class I) and Class B show the performance of the highest and lowest performing classes, respectively (based on five-year performance). The box within each chart shows the 25th percentile return (bottom of box) and the 75th percentile return (top of box) of the peer group. Returns shown above the box are in the first quartile and returns shown below the box are in the fourth quartile. The percentage beaten numbers noted below each chart correspond to the percentile box and represent the percentage of funds in the peer group whose performance was equal to or lower than that of the class indicated.
Annual Report
Fidelity International Small Cap Fund
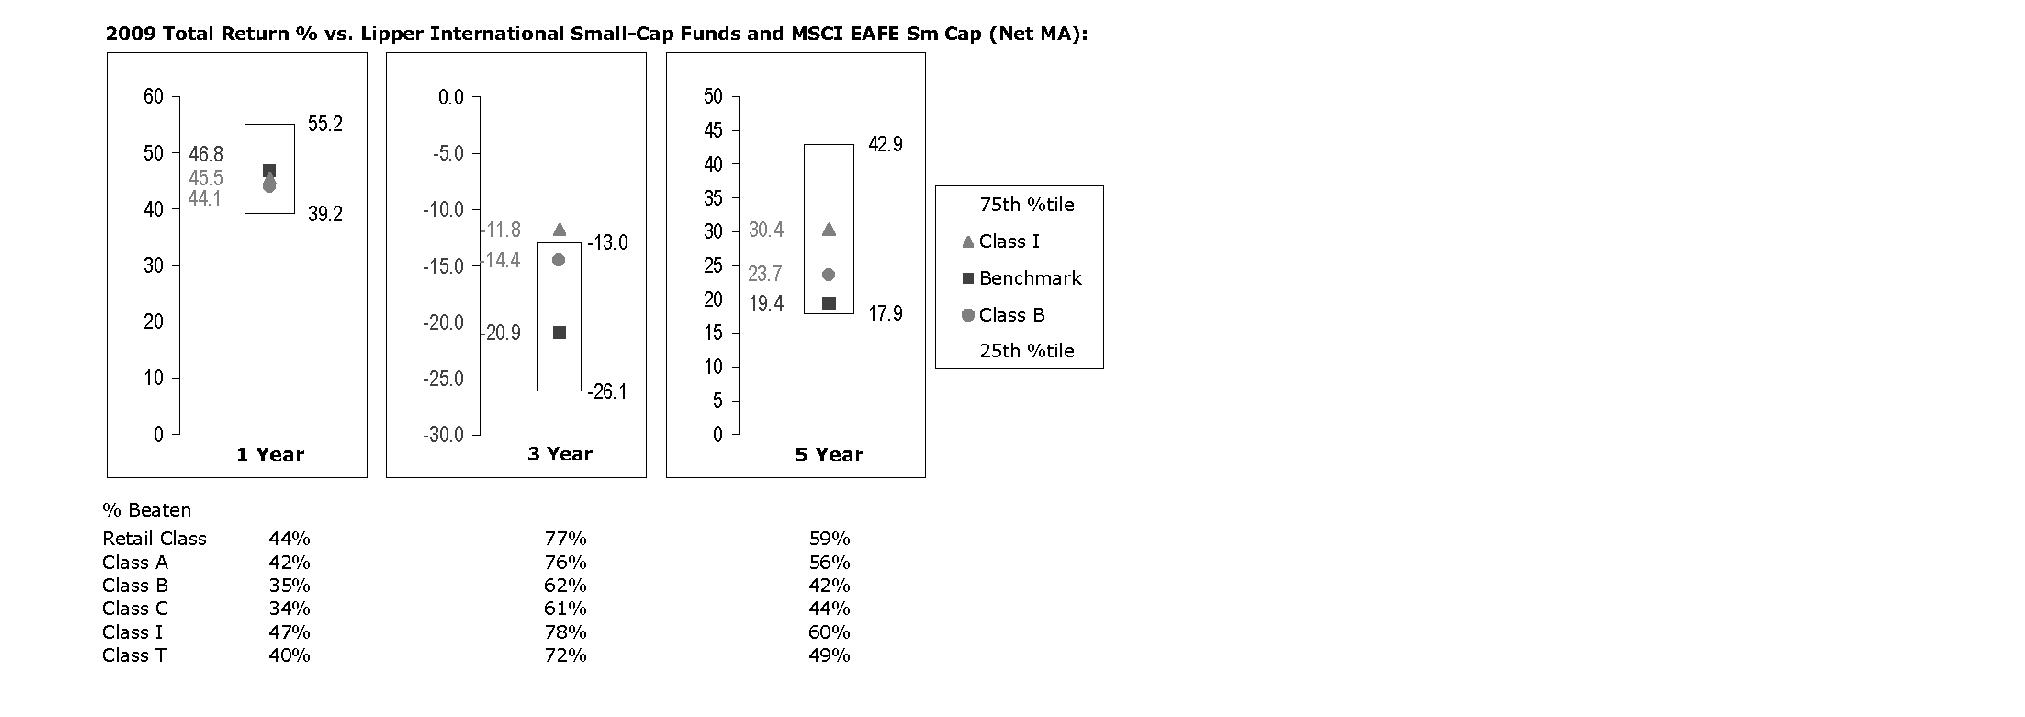
The Board reviewed the fund's relative investment performance against its peer group and noted that the performance of Institutional Class (Class I) of the fund was in the third quartile for the one-year period, the first quartile for the three-year period, and the second quartile for the five-year period. The Board also noted that the investment performance of Institutional Class (Class I) of the fund compared favorably to its benchmark for the three- and five-year periods, although the fund's one-year cumulative total return was lower than its benchmark. The Board considered that the variations in performance among the fund's classes reflect the variations in class expenses, which result in lower performance for higher expense classes. The Board also reviewed the fund's performance since inception as well as performance in the current year.
The Board also considered that the fund's management fee is subject to upward or downward adjustment depending upon whether, and to what extent, the fund's investment performance for the performance period exceeds, or is exceeded by, the record (over the same period) of a Board-approved performance adjustment index. The Board realizes that the performance adjustment provides FMR with a strong economic incentive to seek to achieve superior performance for the fund's shareholders and helps to more closely align the interests of FMR and the fund's shareholders.
Based on its review, and giving particular weight to the nature and quality of the resources dedicated by the Investment Advisers to maintain and improve relative performance and factoring in the unprecedented market events in recent years, the Board concluded that the nature, extent, and quality of investment management and support services and of shareholder and administrative services provided to the fund will benefit the fund's shareholders, particularly in light of the Board's view that the fund's shareholders benefit from investing in a fund that is part of a large family of funds offering a variety of investment disciplines and services.
Annual Report
Board Approval of Investment Advisory Contracts and
Management Fees - continued
Competitiveness of Management Fee and Total Fund Expenses. The Board considered the fund's management fee and total expenses compared to "mapped groups" of competitive funds and classes. Fidelity creates "mapped groups" by combining similar Lipper investment objective categories that have comparable management fee characteristics. Combining Lipper investment objective categories aids the Board's management fee and total expense comparisons by broadening the competitive group used for comparison and by reducing the number of universes to which various Fidelity funds are compared.
Management Fee. The Board considered two proprietary management fee comparisons for the 12-month periods shown in the chart below. The group of Lipper funds used by the Board for management fee comparisons is referred to below as the "Total Mapped Group." The Total Mapped Group is broader than the Lipper peer group used by the Board for performance comparisons because the Total Mapped Group combines several Lipper investment objective categories while the Lipper peer group does not. The Total Mapped Group comparison focuses on a fund's standing relative to the total universe of comparable funds available to investors, in terms of gross management fees before expense reimbursements or caps, and without giving effect to the fund's performance adjustment. "TMG %" represents the percentage of funds in the Total Mapped Group that had management fees that were lower than the fund's. For example, a TMG % of 19% means that 81% of the funds in the Total Mapped Group had higher management fees than the fund. The "Asset-Size Peer Group" (ASPG) comparison focuses on a fund's standing relative to non-Fidelity funds similar in size to the fund within the Total Mapped Group. The ASPG represents at least 15% of the funds in the Total Mapped Group with comparable asset size and management fee characteristics, subject to a minimum of 50 funds (or all funds in the Total Mapped Group if fewer than 50). Additional information, such as the ASPG quartile in which the fund's management fee ranked and the impact of the fund's performance adjustment, is also included in the chart and considered by the Board.
Annual Report
Fidelity International Small Cap Fund

The Board noted that the fund's management fee ranked below the median of its Total Mapped Group and below the median of its ASPG for 2009. The Board also noted the effect of the fund's positive performance adjustment on the fund's management fee ranking. The Board noted that the performance adjustment for each year represents calculations for performance periods that differ from the periods shown in the performance charts above.
Based on its review, the Board concluded that the fund's management fee is fair and reasonable in light of the services that the fund receives and the other factors considered.
Total Expenses. In its review of each class's total expenses, the Board considered the fund's management fee as well as other fund or class expenses, as applicable, such as transfer agent fees, pricing and bookkeeping fees, fund-paid 12b-1 fees, and custodial, legal, and audit fees. The Board also noted the effects of any waivers and reimbursements on fees and expenses, as well as the impact of the fund's performance adjustment. As part of its review, the Board also considered current and historical total expenses of each class of the fund compared to competitive fund median expenses. Each class of the fund is compared to those funds and classes in the Total Mapped Group (used by the Board for management fee comparisons) that have a similar sales load structure.
The Board noted that the total expenses of each of Class A, Class B, Class C, and the retail class ranked below its competitive median for 2009, the total expenses of Institutional Class ranked equal to its competitive median for 2009, and the total expenses of Class T ranked above its competitive median for 2009. The Board considered that the total expenses for Class T were above the median primarily because its 12b-1 fee is higher than the typical front-end load class. The Board noted that the fund offers multiple classes, each of which has a different sales load and 12b-1 fee structure, and that the multiple structures are intended to offer a range of pricing options for the intermediary market. The Board also noted that the total expenses of the classes vary primarily by the level of their 12b-1 fees, although differences in transfer agent fees may also cause expenses to vary from class to class.
Annual Report
Board Approval of Investment Advisory Contracts and
Management Fees - continued
Fees Charged to Other Fidelity Clients. The Board also considered Fidelity fee structures and other information with respect to clients of FMR and its affiliates, such as other mutual funds advised or subadvised by FMR or its affiliates, pension plan clients, and other institutional clients. In March 2010, the Board created an ad hoc joint committee with the board of other Fidelity funds (the Committee) to review and compare Fidelity's institutional investment advisory business with its business of providing services to the Fidelity funds, including the differences in services provided, fees charged, and costs incurred, as well as competition in their respective marketplaces.
Based on its review of total expenses and fees charged to other Fidelity clients, the Board concluded that the total expenses of each class of the fund were reasonable, although in one case above the median of the universe presented for comparison, in light of the services that the fund and its shareholders receive and the other factors considered, including the findings of the Committee.
Costs of the Services and Profitability. The Board considered the revenues earned and the expenses incurred by Fidelity in conducting the business of developing, marketing, distributing, managing, administering and servicing the fund and its shareholders. The Board also considered the level of Fidelity's profits in respect of all the Fidelity funds.
On an annual basis, FMR presents to the Board Fidelity's profitability for the fund. Fidelity calculates the profitability for each fund, as well as aggregate profitability for groups of Fidelity funds and all Fidelity funds, using a series of detailed revenue and cost allocation methodologies which originate with the audited books and records of Fidelity. The Audit Committee of the Board reviews any significant changes from the prior year's methodologies.
PricewaterhouseCoopers LLP (PwC), independent registered public accounting firm and auditor to Fidelity and certain Fidelity funds, has been engaged annually by the Board as part of the Board's assessment of Fidelity's profitability analysis. PwC's engagement includes the review and assessment of Fidelity's methodologies used in determining the revenues and expenses attributable to Fidelity's mutual fund business, and completion of agreed-upon procedures surrounding the mathematical accuracy of fund profitability and its conformity to allocation methodologies. After considering PwC's reports issued under the engagement and information provided by Fidelity, the Board believes that while other allocation methods may also be reasonable, Fidelity's profitability methodologies are reasonable in all material respects.
Annual Report
The Board has also reviewed Fidelity's non-fund businesses and fall-out benefits related to the mutual fund business as well as cases where Fidelity's affiliates may benefit from or be related to the fund's business.
The Board considered the costs of the services provided by and the profits realized by Fidelity in connection with the operation of the fund and were satisfied that the profitability was not excessive in the circumstances.
Economies of Scale. The Board considered whether there have been economies of scale in respect of the management of the Fidelity funds, whether the Fidelity funds (including the fund) have appropriately benefited from any such economies of scale, and whether there is potential for realization of any further economies of scale. The Board considered the extent to which the fund will benefit from economies of scale through increased services to the fund, through waivers or reimbursements, or through fee or expense reductions.
In February 2009, the Board and the board of other Fidelity funds created an ad hoc committee (the Economies of Scale Committee) to analyze whether FMR attains economies of scale in respect of the management and servicing of the Fidelity funds, whether the Fidelity funds have appropriately benefited from such economies of scale, and whether there is potential for realization of any further economies of scale.
The Board recognized that the fund's management contract incorporates a "group fee" structure, which provides for lower group fee rates as total fund assets under FMR's management increase, and for higher group fee rates as total fund assets under FMR's management decrease. FMR calculates the group fee rates based on a tiered asset "breakpoint" schedule that varies based on asset class. The Board considered that the group fee is designed to deliver the benefits of economies of scale to fund shareholders when total Fidelity fund assets increase, even if assets of any particular fund are unchanged or have declined, because some portion of Fidelity's costs are attributable to services provided to all Fidelity funds, and all funds benefit if those costs can be allocated among more assets. The Board concluded that, given the group fee structure, fund shareholders will benefit from lower management fees as assets under FMR's management increase at the fund complex level, regardless of whether Fidelity achieves any such economies of scale.
The Board concluded, considering the findings of the Economies of Scale Committee, that any potential economies of scale are being appropriately shared between fund shareholders and Fidelity.
Additional Information Requested by the Board. In order to develop fully the factual basis for consideration of the Fidelity funds' Advisory Contracts, the Board requested and received additional information on certain topics, including (i) fund performance trends, actions to be taken by FMR to improve certain funds' overall performance, and Fidelity's long-term strategies for certain funds; (ii) portfolio manager changes that have occurred during the past year and length of portfolio manager tenure for different categories of funds over time; (iii) Fidelity's compensation structure for portfolio managers, research analysts, and other key personnel, the rationale for the compensation structure, and how the compensation structure provides appropriate performance incentives; (iv) the amount of the investment that each portfolio manager has made in the Fidelity fund(s) that he or she manages; (v) management and other fees paid by FMR to affiliated sub-advisers on behalf of the Fidelity funds; (vi) Fidelity's fee structures and rationale for recommending different fees among different categories of funds; (vii) Fidelity's rationale for recommending which funds should have a performance adjustment component as part of their management fees; (viii) the rationale for any differences between fund fee structures and fee structures in place for other Fidelity clients; and (ix) explanations regarding the relative total expenses borne by certain funds and classes, total expense competitive trends, and actions that might be taken by FMR to reduce total expenses for certain funds and classes.
Annual Report
Board Approval of Investment Advisory Contracts and
Management Fees - continued
Based on its evaluation of all of the conclusions noted above, and after considering all factors it believed relevant, the Board ultimately concluded that the advisory fee structures are fair and reasonable, and that the fund's Advisory Contracts should be renewed.
Annual Report
Managing Your Investments
Fidelity offers several ways to conveniently manage your personal investments via your telephone or PC. You can access your account information, conduct trades and research your investments 24 hours a day.
By Phone
Fidelity Automated Service Telephone provides a single toll-free number to access account balances, positions, quotes and trading. It's easy to navigate the service, and on your first call, the system will help you create a personal identification number (PIN) for security.
(phone_graphic)
Fidelity Automated
Service Telephone (FAST®)
1-800-544-5555
Press
 For mutual fund and brokerage trading.
 For quotes.*
 For account balances and holdings.
 To review orders and mutual
fund activity.
 To change your PIN.

 To speak to a Fidelity representative.
By PC
Fidelity's web site on the Internet provides a wide range of information, including daily financial news, fund performance, interactive planning tools and news about Fidelity products and services.
(computer_graphic)
Fidelity's Web Site
www.fidelity.com
* When you call the quotes line, please remember that a fund's yield and return will vary and, except for money market funds, share price will also vary. This means that you may have a gain or loss when you sell your shares. There is no assurance that money market funds will be able to maintain a stable $1 share price; an investment in a money market fund is not insured or guaranteed by the U.S. government. Total returns are historical and include changes in share price, reinvestment of dividends and capital gains, and the effects of any sales charges.
Annual Report
Investment Adviser
Fidelity Management & Research Company
Boston, MA
Investment Sub-Advisers
FMR Co., Inc.
Fidelity Management & Research
(U.K.) Inc.
Fidelity Research & Analysis
Company
FIL Investment Advisors
FIL Investments (Japan) Limited
FIL Investment Advisors (UK) Ltd.
Fidelity Management & Research
(Hong Kong) Limited
Fidelity Management & Research
(Japan) Inc.
General Distributor
Fidelity Distributors Corporation
Boston, MA
Transfer and Service Agents
Fidelity Investments Institutional
Operations Company, Inc.
Boston, MA
Fidelity Service Company, Inc.
Boston, MA
Custodian
The Bank of New York Mellon
New York, NY
The Fidelity Telephone Connection
Mutual Fund 24-Hour Service
Exchanges/Redemptions
and Account Assistance 1-800-544-6666
Product Information 1-800-544-8888
Retirement Accounts 1-800-544-4774
(8 a.m. - 9 p.m.)
TDD Service 1-800-544-0118
for the deaf and hearing impaired
(9 a.m. - 9 p.m. Eastern time)
Fidelity Automated Service
Telephone (FAST®)
1-800-544-5555
Automated line for quickest service
ISC-UANN-1210
1.793584.107

(Fidelity Investment logo)(registered trademark)
Fidelity AdvisorSM
International Small Cap
Fund - Class A, Class T, Class B
and Class C
Annual Report
October 31, 2010
Class A, Class T, Class B, and Class C are classes of Fidelity®
International Small Cap Fund
(2_fidelity_logos) (Registered_Trademark)
Contents
Chairman's Message | <Click Here> | The Chairman's message to shareholders. |
Performance | <Click Here> | How the fund has done over time. |
Management's Discussion of Fund Performance | <Click Here> | The Portfolio Managers' review of fund performance and strategy. |
Shareholder Expense Example | <Click Here> | An example of shareholder expenses. |
Investment Changes | <Click Here> | A summary of major shifts in the fund's investments over the past six months. |
Investments | <Click Here> | A complete list of the fund's investments with their market values. |
Financial Statements | <Click Here> | Statements of assets and liabilities, operations, and changes in net assets, as well as financial highlights. |
Notes | <Click Here> | Notes to financial statements. |
Report of Independent Registered Public Accounting Firm | <Click Here> | |
Trustees and Officers | <Click Here> | |
Distributions | <Click Here> | |
Board Approval of Investment Advisory Contracts and Management Fees | <Click Here> | |
To view a fund's proxy voting guidelines and proxy voting record for the 12-month period ended June 30, visit http://www.fidelity.com/proxyvotingresults or visit the Securities and Exchange Commission's (SEC) web site at http://www.sec.gov. You may also call 1-877-208-0098 to request a free copy of the proxy voting guidelines.
Standard & Poor's, S&P and S&P 500 are registered service marks of The McGraw-Hill Companies, Inc. and have been licensed for use by Fidelity Distributors Corporation.
Other third party marks appearing herein are the property of their respective owners.
All other marks appearing herein are registered or unregistered trademarks or service marks of FMR LLC or an affiliated company.
Annual Report
This report and the financial statements contained herein are submitted for the general information of the shareholders of the fund. This report is not authorized for distribution to prospective investors in the fund unless preceded or accompanied by an effective prospectus.
A fund files its complete schedule of portfolio holdings with the SEC for the first and third quarters of each fiscal year on Form N-Q. Forms N-Q are available on the SEC's web site at http://www.sec.gov. A fund's Forms N-Q may be reviewed and copied at the SEC's Public Reference Room in Washington, DC. Information regarding the operation of the SEC's Public Reference Room may be obtained by calling 1-800-SEC-0330. For a complete list of a fund's portfolio holdings, view the most recent holdings listing, semiannual report, or annual report on Fidelity's web site at http://www.fidelity.com or http://www.advisor.fidelity.com, as applicable.
NOT FDIC INSURED • MAY LOSE VALUE • NO BANK GUARANTEE
Neither the fund nor Fidelity Distributors Corporation is a bank.
Annual Report
(photo_of_Edward_C_Johnson_3d)
Dear Shareholder:
Equities have staged a rally in the second half of 2010, shaking off concerns about the European debt crisis and the possibility of a double-dip recession in the U.S. Although the short-term surge pushed major equity indexes back into positive territory for the year, several questions remain about the longer-term outlook, including lackluster economic growth and persistently high unemployment. Financial markets are always unpredictable, of course, but there also are several time-tested investment principles that can help put the odds in your favor.
One of the basic tenets is to invest for the long term. Over time, riding out the markets' inevitable ups and downs has proven much more effective than selling into panic or chasing the hottest trend. Even missing only a few of the markets' best days can significantly diminish investor returns. Patience also affords the benefits of compounding - of earning interest on additional income or reinvested dividends and capital gains. There can be tax advantages and cost benefits to consider as well. While staying the course doesn't eliminate risk, it can considerably lessen the effect of short-term declines.
You can further manage your investing risk through diversification. And today, more than ever, geographic diversification should be taken into account. Studies indicate that asset allocation is the single most important determinant of a portfolio's long-term success. The right mix of stocks, bonds and cash - aligned to your particular risk tolerance and investment objective - is very important. Age-appropriate rebalancing is also an essential aspect of asset allocation. For younger investors, an emphasis on equities - which historically have been the best-performing asset class over time - is encouraged. As investors near their specific goal, such as retirement or sending a child to college, consideration may be given to replacing volatile assets (e.g. common stocks) with more-stable fixed investments (bonds or savings plans).
A third principle - investing regularly - can help lower the average cost of your purchases. Investing a certain amount of money each month or quarter helps ensure you won't pay for all your shares at market highs. This strategy - known as dollar cost averaging - also reduces "emotion" from investing, helping shareholders avoid selling weak performers just prior to an upswing, or chasing a hot performer just before a correction.
We invite you to contact us via the Internet, through our Investor Centers or by phone. It is our privilege to provide you the information you need to make the investments that are right for you.
Sincerely,
(The chairman's signature appears here.)
Edward C. Johnson 3d
Annual Report
Average annual total return reflects the change in the value of an investment, assuming reinvestment of the class' distributions from dividend income and capital gains (the profits earned upon the sale of securities that have grown in value, if any) and assuming a constant rate of performance each year. The $10,000 table and the fund's returns do not reflect the deduction of taxes that a shareholder would pay on fund distributions or the redemption of fund shares. During periods of reimbursement by Fidelity, a fund's total return will be greater than it would be had the reimbursement not occurred. How a fund did yesterday is no guarantee of how it will do tomorrow.
Average Annual Total Returns
Periods ended October 31, 2010 | Past 1
year | Past 5
years | Life of
fund A |
Class A (incl. 5.75% sales charge) B | 13.90% | 4.34% | 16.63% |
Class T (incl. 3.50% sales charge) C | 16.24% | 4.56% | 16.70% |
Class B (incl. contingent deferred sales charge) D | 14.90% | 4.53% | 16.68% |
Class C (incl. contingent deferred sales charge) E | 18.86% | 4.79% | 16.69% |
A From September 18, 2002.
B Class A shares bear a 0.25% 12b-1 fee. The initial offering of Class A shares took place on May 27, 2003. Returns prior to May 27, 2003 are those of Fidelity® International Small Cap Fund, the original class of the fund, which has no 12b-1 fee. Had Class A shares' 12b-1 fee been reflected, returns prior to May 27, 2003 would have been lower.
C Class T shares bear a 0.50% 12b-1 fee. The initial offering of Class T shares took place on May 27, 2003. Returns prior to May 27, 2003 are those of Fidelity International Small Cap Fund, the original class of the fund, which has no 12b-1 fee. Had Class T shares' 12b-1 fee been reflected, returns prior to May 27, 2003 would have been lower.
D Class B shares bear a 1.00% 12b-1 fee. The initial offering of Class B shares took place on May 27, 2003. Returns prior to May 27, 2003 are those of Fidelity International Small Cap Fund, the original class of the fund, which has no 12b-1 fee. Had Class B shares' 12b-1 fee been reflected, returns prior to May 27, 2003 would have been lower. Class B shares' contingent deferred sales charge included in the past one year, five years, and life of fund total return figures are 5%, 2%, and 0%, respectively.
E Class C shares bear a 1.00% 12b-1 fee. The initial offering of Class C shares took place on May 27, 2003. Returns prior to May 27, 2003 are those of Fidelity International Small Cap Fund, the original class of the fund, which has no 12b-1 fee. Had Class C shares' 12b-1 fee been reflected, returns prior to May 27, 2003 would have been lower. Class C shares' contingent deferred sales charge included in the past one year, five years, and life of fund total return figures are 1%, 0%, and 0%, respectively.
Annual Report
$10,000 Over Life of Fund
Let's say hypothetically that $10,000 was invested in Fidelity AdvisorSM International Small Cap Fund - Class A, a class of the fund, on September 18, 2002, when the fund started, and the current 5.75% sales charge was paid. The chart shows how the value of your investment would have changed, and also shows how the MSCI® EAFE® Small Cap Index performed over the same period. The initial offering of Class A took place on May 27, 2003. See the previous page for additional information regarding the performance of Class A.
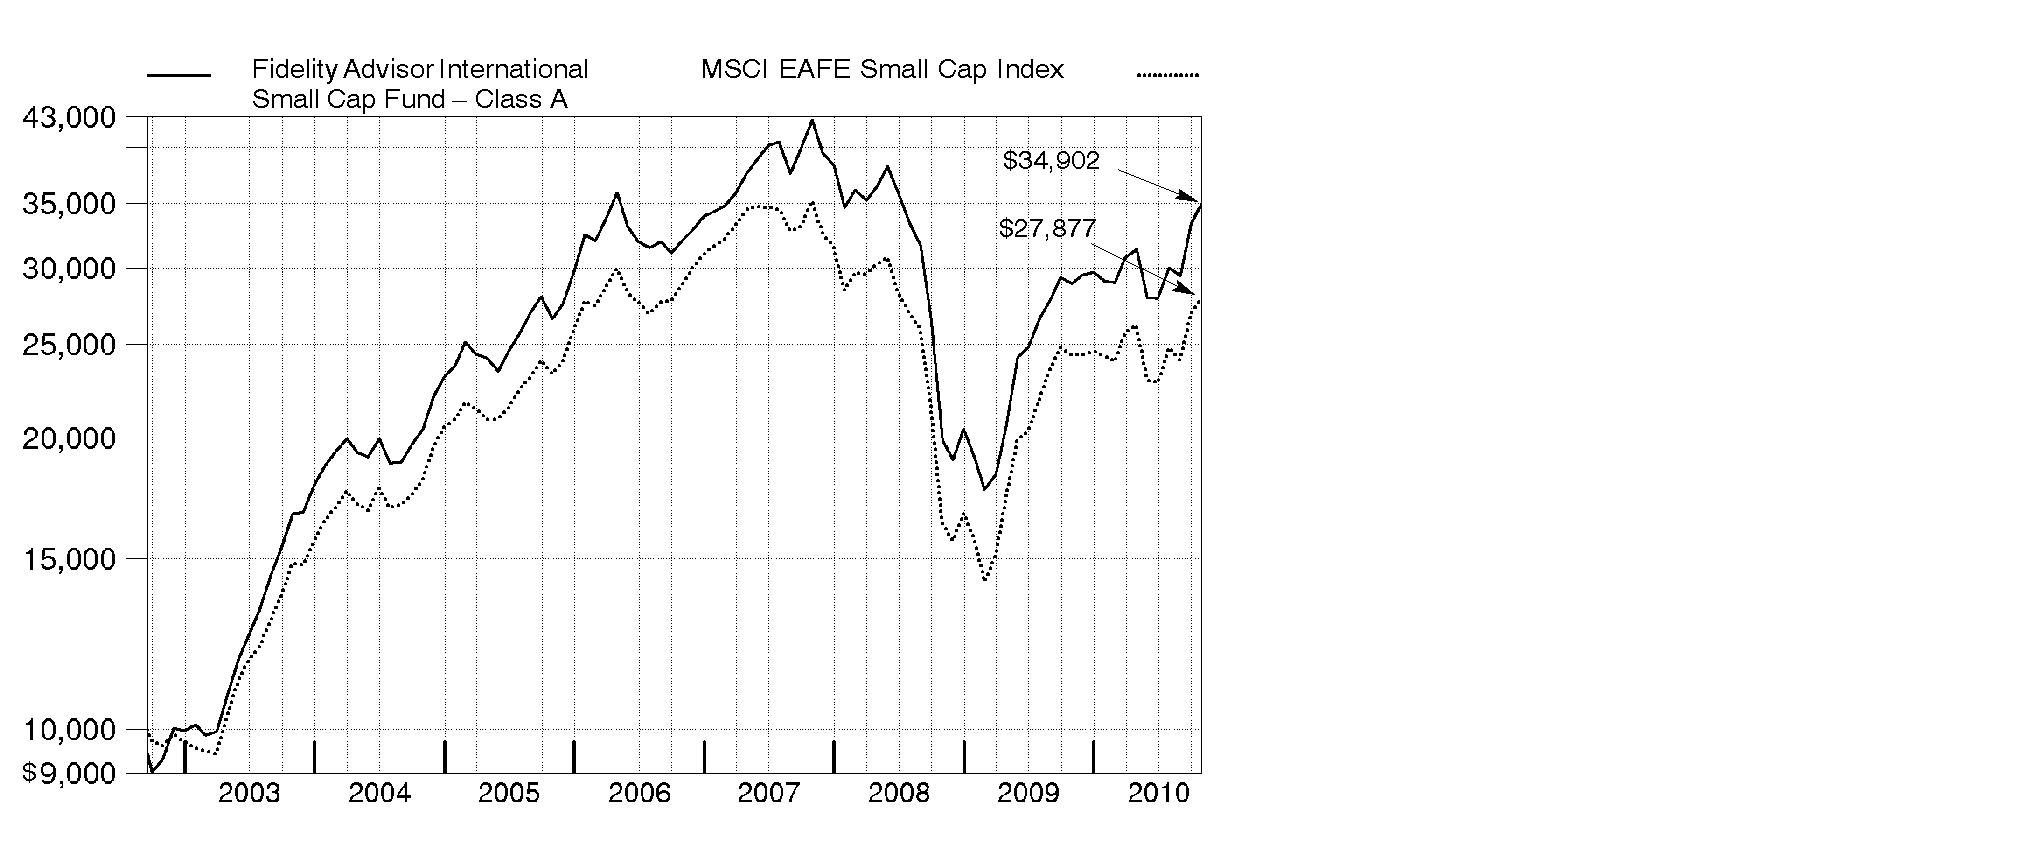
Annual Report
Market Recap: International stocks rode a wave of volatility similar to that of their U.S. counterparts during the 12 months ending October 31, 2010. Stocks gained modestly in the first half of the period, despite growing concerns about the European debt crisis. Sentiment turned decidedly negative in May and June, however, and the market suffered a precipitous decline. These losses were more than offset during the last four months of the period, when signs of economic growth and subsiding debt fears helped propel international stocks about 21%. For the full year, the MSCI® ACWI® (All Country World Index) ex USA Index gained 12.76%, boosted in part by a generally depreciating U.S. dollar. Within the index, Canada and emerging markets were standouts, returning 23% and 24%, respectively. Results in the latter group were led by strong-performing India, Mexico and South Africa, while China fell short of the MSCI benchmark due to cooling economic growth. The developed Asia ex Japan segment rose 16% for the period, lifted by solid results from Singapore and Hong Kong. Meanwhile, Europe rose just 9%, held back mainly by debt-riddled Spain and Italy, as well as lagging major constituent France. Japan returned only 5%, a result of that nation's continued weak economy.
Comments from Colin Stone, Noriko Takahashi and Dale Nicholls, Co-Portfolio Managers of Fidelity AdvisorSM International Small Cap Fund: During the year, the fund's Class A, Class T, Class B and Class C shares gained 20.85%, 20.46%, 19.90% and 19.86%, respectively (excluding sales charges), topping the 14.31% mark of the MSCI EAFE® (Europe, Australasia, Far East) Small Cap Index. The biggest boost to relative performance came from stock selection in consumer discretionary. Among countries, performance benefited the most from favorable picks in China and Australia as well as a large overweighting and solid picks in Germany. On the negative side, stock selection in industrials significantly dampened the fund's gain. Geographically, stock picking in the United Kingdom and France hampered performance. All three subportfolios solidly beat their respective benchmarks. The Asia-Pacific ex Japan "sub" was boosted by Hong Kong holding Sino Prosper State Gold Resources Holdings, while Australian oil/gas exploration holding AWE detracted. The Europe/Africa/Middle East sub was lifted by Canada's European Goldfields. Connaught - a U.K. provider of housing-related services - curbed results. In the Japanese subportfolio, the top contributor was auto transmission maker Exedy. Conversely, an out-of-benchmark stake in Ibiden, which makes printed circuit boards, hurt.
Note to shareholders: The fund reopened to new accounts on November 10, 2009.
The views expressed above reflect those of the portfolio manager(s) only through the end of the period as stated on the cover of this report and do not necessarily represent the views of Fidelity or any other person in the Fidelity organization. Any such views are subject to change at any time based upon market or other conditions and Fidelity disclaims any responsibility to update such views. These views may not be relied on as investment advice and, because investment decisions for a Fidelity fund are based on numerous factors, may not be relied on as an indication of trading intent on behalf of any Fidelity fund.
Annual Report
Shareholder Expense Example
As a shareholder of the Fund, you incur two types of costs: (1) transaction costs, including sales charges (loads) on purchase payments or redemption proceeds, redemption fees, and (2) ongoing costs, including management fees, distribution and/or service (12b-1) fees and other Fund expenses. This Example is intended to help you understand your ongoing costs (in dollars) of investing in the Fund and to compare these costs with the ongoing costs of investing in other mutual funds.
The Example is based on an investment of $1,000 invested at the beginning of the period and held for the entire period (May 1, 2010 to October 31, 2010).
Actual Expenses
The first line of the accompanying table for each class of the Fund provides information about actual account values and actual expenses. You may use the information in this line, together with the amount you invested, to estimate the expenses that you paid over the period. Simply divide your account value by $1,000.00 (for example, an $8,600 account value divided by $1,000.00 = 8.6), then multiply the result by the number in the first line for a class of the Fund under the heading entitled "Expenses Paid During Period" to estimate the expenses you paid on your account during this period. A small balance maintenance fee of $12.00 that is charged once a year may apply for certain accounts with a value of less than $2,000. This fee is not included in the table below. If it was, the estimate of expenses you paid during the period would be higher, and your ending account value lower, by this amount. In addition, the Fund, as a shareholder in the underlying Fidelity Central Funds, will indirectly bear its pro-rata share of the fees and expenses incurred by the underlying Fidelity Central Funds. These fees and expenses are not included in the Fund's annualized expense ratio used to calculate the expense estimate in the table below.
Hypothetical Example for Comparison Purposes
The second line of the accompanying table for each class of the Fund provides information about hypothetical account values and hypothetical expenses based on a Class' actual expense ratio and an assumed rate of return of 5% per year before expenses, which is not the Class' actual return. The hypothetical account values and expenses may not be used to estimate the actual ending account balance or expenses you paid for the period. You may use this information to compare the ongoing costs of investing in the Fund and other funds. To do so, compare this 5% hypothetical example with the 5% hypothetical examples that appear in the shareholder reports of the other funds. A small balance maintenance fee of $12.00 that is charged once a year may apply for certain accounts with a value of less than $2,000. This fee is not included in the table below. If it was, the estimate of expenses you paid during the period would be higher, and your ending account value lower, by this amount. In addition, the Fund, as a shareholder in the underlying Fidelity Central Funds, will indirectly bear its pro-rata share of the fees and expenses incurred by the underlying Fidelity Central Funds. These fees and expenses are not included in the Fund's annualized expense ratio used to calculate the expense estimate in the table below.
Please note that the expenses shown in the table are meant to highlight your ongoing costs only and do not reflect any transaction costs. Therefore, the second line of the table is useful in comparing ongoing costs only, and will not help you determine the relative total costs of owning different funds. In addition, if these transactional costs were included, your costs would have been higher.
Annual Report
| Annualized
Expense
Ratio | Beginning
Account Value
May 1, 2010 | Ending
Account Value
October 31, 2010 | Expenses Paid
During Period*
May 1, 2010 to October 31, 2010 |
Class A | 1.65% | | | |
Actual | | $ 1,000.00 | $ 1,114.00 | $ 8.79 |
HypotheticalA | | $ 1,000.00 | $ 1,016.89 | $ 8.39 |
Class T | 1.90% | | | |
Actual | | $ 1,000.00 | $ 1,112.10 | $ 10.11 |
HypotheticalA | | $ 1,000.00 | $ 1,015.63 | $ 9.65 |
Class B | 2.40% | | | |
Actual | | $ 1,000.00 | $ 1,109.90 | $ 12.76 |
HypotheticalA | | $ 1,000.00 | $ 1,013.11 | $ 12.18 |
Class C | 2.40% | | | |
Actual | | $ 1,000.00 | $ 1,109.60 | $ 12.76 |
HypotheticalA | | $ 1,000.00 | $ 1,013.11 | $ 12.18 |
International Small Cap | 1.36% | | | |
Actual | | $ 1,000.00 | $ 1,115.60 | $ 7.25 |
HypotheticalA | | $ 1,000.00 | $ 1,018.35 | $ 6.92 |
Institutional Class | 1.31% | | | |
Actual | | $ 1,000.00 | $ 1,116.20 | $ 6.99 |
HypotheticalA | | $ 1,000.00 | $ 1,018.60 | $ 6.67 |
A 5% return per year before expenses
*Expenses are equal to each Class' annualized expense ratio, multiplied by the average account value over the period, multiplied by 184/365 (to reflect the one-half year period).
Annual Report
Investment Changes (Unaudited)
Geographic Diversification (% of fund's net assets) |
As of October 31, 2010 |
| Japan 23.4% | |
| United Kingdom 16.7% | |
| Germany 9.5% | |
| France 8.8% | |
| Australia 7.4% | |
| United States of America 4.2% | |
| Cayman Islands 2.7% | |
| Canada 2.2% | |
| Norway 2.0% | |
| Other 23.1% | |

Percentages are adjusted for the effect of futures contracts, if applicable. |
As of April 30, 2010 |
| Japan 25.6% | |
| United Kingdom 15.7% | |
 | Germany 10.7% | |
| France 9.3% | |
| Australia 7.4% | |
| United States of America 3.5% | |
| Netherlands 2.9% | |
| Bermuda 2.4% | |
| Cayman Islands 1.8% | |
| Other 20.7% | |

Percentages are adjusted for the effect of futures contracts, if applicable. |
Asset Allocation |
| % of fund's
net assets | % of fund's net assets
6 months ago |
Stocks, Investment Companies and Equity Futures | 96.1 | 96.8 |
Short-Term Investments and Net Other Assets | 3.9 | 3.2 |
Top Ten Stocks as of October 31, 2010 |
| % of fund's
net assets | % of fund's net assets
6 months ago |
European Goldfields Ltd. (Canada, Metals & Mining) | 1.3 | 0.8 |
IG Group Holdings PLC (United Kingdom, Diversified Financial Services) | 1.2 | 1.0 |
SeLoger.com (France, Media) | 1.1 | 1.0 |
Elekta AB (B Shares) (Sweden, Health Care Equipment & Supplies) | 1.1 | 0.9 |
Ipsos SA (France, Media) | 1.0 | 0.8 |
Gemalto NV (Netherlands, Computers & Peripherals) | 1.0 | 1.1 |
Lanxess AG (Germany, Chemicals) | 1.0 | 0.8 |
Wacker Chemie AG (Germany, Chemicals) | 1.0 | 0.5 |
Craneware PLC (United Kingdom, Health Care Technology) | 0.9 | 0.7 |
Pertama Holdings Ltd. (Singapore, Specialty Retail) | 0.8 | 0.0 |
| 10.4 | |
Market Sectors as of October 31, 2010 |
| % of fund's
net assets | % of fund's net assets
6 months ago |
Consumer Discretionary | 19.2 | 18.6 |
Information Technology | 16.8 | 17.0 |
Industrials | 15.1 | 19.3 |
Materials | 12.8 | 10.8 |
Financials | 10.5 | 10.9 |
Health Care | 9.5 | 9.6 |
Energy | 5.9 | 5.3 |
Telecommunication Services | 2.1 | 2.1 |
Consumer Staples | 1.7 | 1.6 |
Utilities | 0.8 | 0.9 |
Annual Report
Investments October 31, 2010
Showing Percentage of Net Assets
Common Stocks - 94.4% |
| Shares | | Value |
Australia - 7.4% |
Allied Gold Ltd. (a) | 12,713,939 | | $ 5,667,121 |
Allied Gold Ltd. (United Kingdom) (a) | 4,914,800 | | 2,145,732 |
Ausenco Ltd. | 305,858 | | 764,066 |
Austal Ltd. | 1,095,023 | | 2,628,211 |
Australian Worldwide Exploration Ltd. (a) | 922,101 | | 1,359,521 |
BlueScope Steel Ltd. | 214,319 | | 418,865 |
carsales.com Ltd. | 151,787 | | 706,316 |
Centamin Egypt Ltd. (United Kingdom) (a) | 1,924,214 | | 5,333,381 |
Charter Hall Group unit | 2,530,982 | | 1,388,507 |
Discovery Metals Ltd. (a) | 875,240 | | 1,007,479 |
DUET Group | 688,657 | | 1,170,505 |
Goodman Group unit | 6,343,283 | | 3,914,944 |
Industrea Ltd. | 2,671,615 | | 1,203,934 |
Iress Market Technology Ltd. | 142,341 | | 1,220,138 |
Ironbark Zinc Ltd. (a) | 2,305,831 | | 564,727 |
Kingsgate Consolidated NL (d) | 99,427 | | 976,959 |
Lynas Corp. Ltd. (a) | 1,537,632 | | 2,206,790 |
MAp Group unit | 226,044 | | 675,404 |
Medusa Mining Ltd. | 239,743 | | 1,308,194 |
Mineral Deposits Ltd. (a) | 5,620,000 | | 6,391,999 |
Monto Minerals Ltd. (a) | 273,551 | | 2,412 |
Navitas Ltd. | 871,259 | | 3,269,016 |
Northern Iron Ltd. (a)(d) | 423,362 | | 638,710 |
Panaust Ltd. (a) | 2,277,343 | | 1,662,094 |
Ramsay Health Care Ltd. | 179,829 | | 2,757,052 |
realestate.com.au Ltd. | 82,531 | | 871,579 |
SAI Global Ltd. | 1,018,293 | | 4,369,360 |
SomnoMed Ltd. (a) | 331,849 | | 334,849 |
Spark Infrastructure Group unit (f) | 1,461,561 | | 1,603,636 |
Super Cheap Auto Group Ltd. | 296,366 | | 1,936,534 |
Tiger Resources Ltd. (a) | 14,407,421 | | 5,151,694 |
Wotif.com Holdings Ltd. | 255,354 | | 1,170,737 |
TOTAL AUSTRALIA | | 64,820,466 |
Bailiwick of Jersey - 0.2% |
Renewable Energy Generation Ltd. | 1,777,200 | | 1,409,434 |
Belgium - 0.3% |
EVS Broadcast Equipment SA | 7,700 | | 483,209 |
Hansen Transmissions International NV (a) | 2,639,400 | | 1,889,813 |
TOTAL BELGIUM | | 2,373,022 |
Common Stocks - continued |
| Shares | | Value |
Bermuda - 1.9% |
Asia Satellite Telecommunications Holdings Ltd. | 271,000 | | $ 489,469 |
Asian Citrus Holdings Ltd. | 615,000 | | 708,524 |
Biosensors International Group Ltd. (a) | 1,769,000 | | 1,530,773 |
China Animal Healthcare Ltd. | 4,707,000 | | 1,236,483 |
China LotSynergy Holdings Ltd. (a) | 7,324,000 | | 283,464 |
China Water Affairs Group Ltd. | 1,134,000 | | 434,508 |
Luk Fook Holdings International Ltd. | 1,162,000 | | 2,851,313 |
Man Wah Holdings Ltd. | 260,000 | | 364,948 |
Mingyuan Medicare Development Co. Ltd. | 2,870,000 | | 399,884 |
Noble Group Ltd. | 315,272 | | 453,068 |
Oakley Capital Investments Ltd. (a) | 1,285,000 | | 2,655,804 |
Sihuan Pharmaceutical Holdings Group Ltd. | 42,000 | | 30,506 |
Texwinca Holdings Ltd. | 1,402,000 | | 1,530,194 |
Vtech Holdings Ltd. | 349,700 | | 3,638,549 |
TOTAL BERMUDA | | 16,607,487 |
British Virgin Islands - 0.7% |
Albidon Ltd. CDI (a) | 1,469,000 | | 208,670 |
Kalahari Energy (a)(h) | 1,451,000 | | 15 |
Playtech Ltd. | 845,876 | | 6,067,999 |
TOTAL BRITISH VIRGIN ISLANDS | | 6,276,684 |
Canada - 2.2% |
AirSea Lines (a)(h) | 1,893,338 | | 26 |
AirSea Lines warrants 8/4/11 (a)(h) | 1,862,300 | | 26 |
Banro Corp. (a) | 637,400 | | 1,874,890 |
Equinox Minerals Ltd. unit (a)(d) | 306,097 | | 1,673,263 |
European Goldfields Ltd. (a) | 854,800 | | 11,549,303 |
Platmin Ltd. (a) | 3,649,900 | | 3,888,712 |
Rock Well Petroleum, Inc. (a)(h) | 770,400 | | 8 |
Starfield Resources, Inc. (a) | 4,328,075 | | 233,399 |
TOTAL CANADA | | 19,219,627 |
Cayman Islands - 2.7% |
AirMedia Group, Inc. ADR (a) | 28,300 | | 195,553 |
China Automation Group Ltd. | 405,000 | | 316,633 |
China Dongxiang Group Co. Ltd. | 657,000 | | 367,861 |
China Forestry Holdings Co. Ltd. | 814,000 | | 386,456 |
China Haidian Holdings Ltd. | 2,154,000 | | 358,479 |
China High Precision Automation Group Ltd. | 712,000 | | 453,769 |
China Lilang Ltd. | 340,000 | | 531,630 |
China Metal International Holdings, Inc. | 1,036,000 | | 264,639 |
China Real Estate Information Corp. ADR (d) | 65,100 | | 645,141 |
Common Stocks - continued |
| Shares | | Value |
Cayman Islands - continued |
CNinsure, Inc. ADR (d) | 31,900 | | $ 819,830 |
Ctrip.com International Ltd. sponsored ADR (a) | 39,300 | | 2,046,351 |
Daphne International Holdings Ltd. | 1,392,000 | | 1,555,197 |
EVA Precision Industrial Holdings Ltd. | 5,562,000 | | 4,613,922 |
Fook Woo Group Holdings Ltd. | 1,099,000 | | 388,487 |
Global Dairy Holdings Ltd. | 197,000 | | 97,849 |
Global Education & Technology Group Ltd. ADR (a) | 3,300 | | 32,769 |
Hengdeli Holdings Ltd. | 1,124,000 | | 623,538 |
Kingdee International Software Group Co. Ltd. | 1,406,000 | | 741,886 |
Little Sheep Group Ltd. | 614,000 | | 400,026 |
Maoye International Holdings Ltd. | 938,000 | | 404,183 |
Marwyn Value Investors II Ltd. (a) | 1,846,800 | | 2,515,023 |
Neo-Neon Holdings Ltd. | 804,000 | | 489,583 |
Orchid Developments Group Ltd. (a) | 1,211,000 | | 523,855 |
PCD Stores Group Ltd. | 1,046,000 | | 337,365 |
Perfect World Co. Ltd. sponsored ADR Class B (a) | 28,400 | | 920,160 |
Sino-Life Group Ltd. (a) | 2,608,000 | | 306,180 |
TAL Education Group ADR (a) | 6,600 | | 117,480 |
TPK Holdings Co. | 2,000 | | 33,001 |
VST Holdings Ltd. (a) | 1,582,000 | | 404,110 |
Xingda International Holdings Ltd. | 1,656,000 | | 1,728,372 |
Yip's Chemical Holdings Ltd. | 592,000 | | 704,175 |
TOTAL CAYMAN ISLANDS | | 23,323,503 |
China - 1.5% |
51job, Inc. sponsored ADR (a) | 12,800 | | 577,024 |
AMVIG Holdings Ltd. | 764,000 | | 620,958 |
Baidu.com, Inc. sponsored ADR (a) | 9,200 | | 1,012,092 |
China Metal Recycling (Holdings) Ltd. | 333,600 | | 371,420 |
Dalian Port (PDA) Co. Ltd. (H Shares) | 1,786,000 | | 771,888 |
Digital China Holdings Ltd. (H Shares) | 239,000 | | 431,672 |
Focus Media Holding Ltd. ADR (a)(d) | 15,300 | | 378,675 |
Global Bio-Chem Technology Group Co. Ltd. (a) | 2,672,800 | | 434,475 |
Harbin Power Equipment Co. Ltd. (H Shares) | 492,000 | | 662,665 |
Minth Group Ltd. | 596,000 | | 1,114,917 |
People's Food Holdings Ltd. | 992,000 | | 536,506 |
Royale Furniture Holdings Ltd. | 1,854,000 | | 676,900 |
Sino Prosper State Gold Resources Holdings, Ltd. (a) | 74,820,000 | | 3,764,528 |
Weiqiao Textile Co. Ltd. (H Shares) | 2,055,500 | | 1,620,268 |
Zhaojin Mining Industry Co. Ltd. (H Shares) | 58,500 | | 181,887 |
TOTAL CHINA | | 13,155,875 |
Common Stocks - continued |
| Shares | | Value |
Cyprus - 0.8% |
Buried Hill Energy (Cyprus) PCL (a)(h) | 1,947,000 | | $ 4,867,500 |
Mirland Development Corp. PLC (a) | 781,900 | | 2,242,371 |
TOTAL CYPRUS | | 7,109,871 |
Denmark - 0.9% |
DSV de Sammensluttede Vognmaend AS | 250,000 | | 5,122,129 |
Pandora A/S | 52,300 | | 2,537,366 |
William Demant Holding AS (a) | 200 | | 14,991 |
TOTAL DENMARK | | 7,674,486 |
France - 8.8% |
Altamir Amboise (a) | 544,400 | | 4,264,755 |
ALTEN | 114,000 | | 3,806,214 |
Audika SA | 113,113 | | 2,762,214 |
Compagnie Generale de Geophysique SA (a) | 188,400 | | 4,399,670 |
Delachaux SA | 80,541 | | 6,569,472 |
Devoteam SA | 38,800 | | 1,071,667 |
Faiveley Transport | 50,672 | | 4,283,334 |
Iliad Group SA | 46,742 | | 5,261,668 |
Ipsos SA | 184,600 | | 8,875,855 |
Laurent-Perrier Group | 20,860 | | 2,350,787 |
LeGuide.com SA (a) | 85,800 | | 3,261,637 |
Maisons France Confort (d) | 89,444 | | 3,895,500 |
Meetic | 187,600 | | 5,599,223 |
Sartorius Stedim Biotech | 53,700 | | 2,464,294 |
SeLoger.com | 198,800 | | 9,985,991 |
Sopra Group SA | 37,800 | | 3,146,867 |
SR Teleperformance SA | 131,700 | | 4,152,535 |
Trigano SA (a) | 22,591 | | 581,534 |
TOTAL FRANCE | | 76,733,217 |
Germany - 9.3% |
CENTROTEC Sustainable AG (a) | 131,581 | | 3,097,855 |
CTS Eventim AG | 111,908 | | 6,315,776 |
Delticom AG | 70,400 | | 5,612,998 |
Drillisch AG | 679,100 | | 5,802,838 |
ElringKlinger AG | 184,000 | | 6,130,562 |
Freenet AG | 164,700 | | 2,086,839 |
GFK AG | 142,601 | | 6,020,128 |
HeidelbergCement AG | 119,666 | | 6,258,250 |
KROMI Logistik AG | 118,100 | | 1,331,075 |
Lanxess AG | 121,885 | | 8,479,844 |
Rational AG (d) | 15,920 | | 3,557,593 |
Common Stocks - continued |
| Shares | | Value |
Germany - continued |
SMA Solar Technology AG (d) | 31,200 | | $ 3,681,443 |
STRATEC Biomedical Systems AG | 77,910 | | 2,931,891 |
Tom Tailor Holding AG | 204,300 | | 4,335,167 |
United Internet AG | 390,613 | | 6,997,800 |
Wacker Chemie AG | 40,000 | | 8,251,299 |
TOTAL GERMANY | | 80,891,358 |
Greece - 0.2% |
Babis Vovos International Technical SA (a) | 149,200 | | 506,555 |
Jumbo SA | 161,000 | | 1,238,850 |
TOTAL GREECE | | 1,745,405 |
Hong Kong - 1.0% |
Dah Sing Financial Holdings Ltd. | 102,400 | | 710,740 |
GZI Transport Ltd. | 950,000 | | 495,146 |
I.T Ltd. | 2,064,000 | | 1,741,469 |
Magnificent Estates Ltd. | 18,070,000 | | 582,809 |
REXCAPITAL Financial Holdings Ltd. | 4,600,000 | | 427,286 |
Singamas Container Holdings Ltd. (a) | 3,966,000 | | 895,404 |
Techtronic Industries Co. Ltd. | 3,251,000 | | 3,292,417 |
Tian An China Investments Co. Ltd. | 669,000 | | 516,989 |
TOTAL HONG KONG | | 8,662,260 |
Iceland - 0.7% |
Ossur hf (a) | 3,457,100 | | 6,515,406 |
India - 0.2% |
Educomp Solutions Ltd. | 24,874 | | 308,898 |
Geodesic Ltd. | 256,340 | | 676,055 |
Grasim Industries Ltd. | 6,876 | | 361,522 |
Indian Overseas Bank | 110,621 | | 398,810 |
The Jammu & Kashmir Bank Ltd. | 14,265 | | 293,008 |
TOTAL INDIA | | 2,038,293 |
Indonesia - 0.4% |
AKR Corporindo Tbk PT | 5,225,000 | | 882,768 |
PT Ciputra Development Tbk (a) | 12,376,500 | | 581,608 |
PT Lippo Karawaci Tbk | 9,290,500 | | 644,487 |
PT Mayora Indah Tbk | 372,500 | | 502,223 |
PT Mitra Adiperkasa Tbk | 1,436,000 | | 409,711 |
PT Tower Bersama Infrastructure Tbk | 402,500 | | 114,839 |
TOTAL INDONESIA | | 3,135,636 |
Common Stocks - continued |
| Shares | | Value |
Ireland - 0.9% |
James Hardie Industries NV unit (a) | 132,009 | | $ 697,049 |
Kenmare Resources PLC (a) | 14,887,700 | | 4,627,352 |
Petroceltic International PLC (a) | 11,142,200 | | 2,008,291 |
Petroneft Resources PLC (a) | 952,400 | | 715,617 |
Vimio PLC (a) | 867,300 | | 14 |
TOTAL IRELAND | | 8,048,323 |
Isle of Man - 1.5% |
Exillon Energy PLC | 1,511,200 | | 6,343,463 |
IBS Group Holding Ltd. GDR (Reg. S) (a) | 317,700 | | 7,028,812 |
TOTAL ISLE OF MAN | | 13,372,275 |
Italy - 0.8% |
Seldovia Native Association, Inc. (SNAI) (a) | 209,590 | | 831,157 |
Tod's SpA | 60,255 | | 5,841,260 |
TOTAL ITALY | | 6,672,417 |
Japan - 23.4% |
ABC-Mart, Inc. | 50,700 | | 1,724,443 |
Air Water, Inc. | 190,000 | | 2,217,099 |
Aozora Bank Ltd. | 1,390,000 | | 2,331,925 |
AQ Interactive, Inc. (d) | 705 | | 876,979 |
ARCS Co. Ltd. | 133,600 | | 1,731,637 |
Arnest One Corp. | 44,100 | | 466,374 |
Asahi Co. Ltd. | 58,000 | | 857,711 |
Asahi Intecc Co. Ltd. | 262,100 | | 4,390,590 |
ASKUL Corp. | 96,000 | | 1,994,681 |
Bank of Kyoto Ltd. | 231,000 | | 2,066,857 |
Cellseed, Inc. (d) | 11,700 | | 104,976 |
Central Glass Co. Ltd. | 248,000 | | 1,069,417 |
Chiba Bank Ltd. | 325,000 | | 2,006,499 |
Chiyoda Corp. | 318,000 | | 2,634,174 |
Cosmos Pharmaceutical Corp. | 27,200 | | 856,190 |
Create SD Holdings Co. Ltd. | 48,200 | | 1,051,212 |
Credit Saison Co. Ltd. | 173,200 | | 2,456,617 |
Culture Convenience Club Co. Ltd. (d) | 175,100 | | 778,996 |
CyberAgent, Inc. (d) | 2,722 | | 4,522,572 |
Dai-ichi Seiko Co. Ltd. (d) | 56,700 | | 2,783,211 |
Daihen Corp. | 456,000 | | 2,057,015 |
Digital Garage, Inc. | 994 | | 1,731,811 |
Don Quijote Co. Ltd. | 77,900 | | 2,128,770 |
Ebara Corp. (a) | 559,000 | | 2,393,964 |
EPS Co. Ltd. (d) | 742 | | 1,825,724 |
Common Stocks - continued |
| Shares | | Value |
Japan - continued |
Exedy Corp. | 147,000 | | $ 4,599,801 |
Ferrotec Corp. | 145,900 | | 1,620,910 |
FreeBit Co., Ltd. (d) | 358 | | 742,960 |
Fuji Oil Co. Ltd. | 191,400 | | 2,751,955 |
Furuya Metal Co. Ltd. | 33,400 | | 2,108,512 |
Glory Ltd. | 25,900 | | 571,300 |
GREE, Inc. (d) | 212,000 | | 2,676,674 |
Hoshizaki Electric Co. Ltd. | 62,400 | | 1,229,855 |
Ibiden Co. Ltd. | 97,300 | | 2,396,528 |
Isetan Mitsukoshi Holdings Ltd. | 170,800 | | 1,884,573 |
Japan Steel Works Ltd. | 110,000 | | 1,049,519 |
JP-Holdings, Inc. | 91,600 | | 1,871,386 |
JTEKT Corp. | 159,200 | | 1,595,028 |
Kandenko Co. Ltd. | 243,000 | | 1,416,267 |
Kenedix Realty Investment Corp. | 573 | | 2,275,053 |
Kimoto Co. Ltd. | 228,600 | | 1,693,123 |
KOMERI Co. Ltd. | 66,600 | | 1,385,465 |
Kuraray Co. Ltd. | 283,500 | | 4,060,360 |
Maeda Corp. | 319,000 | | 864,198 |
Makino Milling Machine Co. Ltd. (a) | 302,000 | | 2,079,135 |
Marui Group Co. Ltd. | 175,800 | | 1,381,481 |
Maruwa Ceramic Co. Ltd. | 77,000 | | 1,863,999 |
McDonald's Holdings Co. (Japan) Ltd. | 122,500 | | 3,110,072 |
Meiko Electronics Co. Ltd. | 96,300 | | 1,793,882 |
Message Co. Ltd. | 1,629 | | 4,149,932 |
Micronics Japan Co. Ltd. | 60,500 | | 488,691 |
Minebea Ltd. | 381,000 | | 2,092,244 |
Mitsubishi UFJ Lease & Finance Co. Ltd. | 96,270 | | 3,220,565 |
Mitsumi Electric Co. Ltd. | 104,800 | | 1,781,933 |
mixi, Inc. (d) | 355 | | 2,064,620 |
Nabtesco Corp. | 238,200 | | 4,218,156 |
Nichi-iko Pharmaceutical Co. Ltd. | 32,900 | | 1,160,311 |
Nichicon Corp. | 89,200 | | 995,422 |
Nihon M&A Center, Inc. (d) | 426 | | 1,540,524 |
Nippon Ceramic Co. Ltd. | 27,700 | | 468,150 |
Nippon Denko Co. Ltd. | 109,000 | | 808,662 |
Nippon Shinyaku Co. Ltd. | 208,000 | | 2,946,688 |
Nomura Real Estate Holdings, Inc. | 77,500 | | 1,189,418 |
Nomura Real Estate Residential Fund, Inc. | 400 | | 1,946,067 |
NTT Urban Development Co. | 1,081 | | 991,398 |
Osaka Securities Exchange Co. Ltd. | 154 | | 775,071 |
OSAKA Titanium technologies Co. Ltd. (d) | 48,800 | | 2,286,268 |
Common Stocks - continued |
| Shares | | Value |
Japan - continued |
Otsuka Corp. | 54,900 | | $ 3,486,256 |
Pigeon Corp. | 45,900 | | 1,366,676 |
Rensas Electronics Corp. (a)(d) | 312,700 | | 2,350,982 |
Riso Kagaku Corp. | 147,700 | | 2,011,671 |
Rohto Pharmaceutical Co. Ltd. | 196,000 | | 2,428,383 |
Sanken Electric Co. Ltd. (a) | 138,000 | | 493,898 |
Sankyu, Inc. | 264,000 | | 1,108,885 |
Santen Pharmaceutical Co. Ltd. | 78,600 | | 2,713,443 |
Sawada Holdings Co. Ltd. (a) | 214,800 | | 1,321,312 |
Sekisui Chemical Co. Ltd. | 303,000 | | 1,927,874 |
Shimadzu Corp. | 426,000 | | 3,202,808 |
Shimamura Co. Ltd. | 29,400 | | 2,820,529 |
Shin-Kobe Electric Machinery Co. Ltd. (d) | 244,000 | | 2,498,521 |
Shindengen Electric Co. Ltd. (a) | 155,000 | | 624,083 |
Shizuoka Gas Co. Ltd. | 88,000 | | 516,168 |
SHO-BOND Holdings Co. Ltd. | 132,500 | | 2,835,404 |
Simplex Holdings, Inc. | 1,189 | | 542,268 |
So-net M3, Inc. (d) | 227 | | 1,038,101 |
Sony Financial Holdings, Inc. | 843 | | 2,933,267 |
SRI Sports Ltd. | 1,276 | | 1,389,059 |
Start Today Co. Ltd. | 435 | | 1,353,057 |
Stella Chemifa Corp. | 9,500 | | 409,656 |
Sumitomo Osaka Cement Co. Ltd. | 789,000 | | 1,529,060 |
Sumitomo Trust & Banking Co. Ltd. | 577,000 | | 3,150,307 |
Sysmex Corp. | 20,300 | | 1,392,519 |
SystemPro Co. Ltd. (d) | 1,445 | | 1,136,678 |
Taisho Pharmaceutical Co. Ltd. | 75,000 | | 1,576,985 |
Takata Corp. | 92,600 | | 2,273,861 |
Takeei Corp. | 67,900 | | 658,158 |
The Suruga Bank Ltd. | 221,000 | | 1,993,861 |
Toho Co. Ltd. | 109,300 | | 1,689,347 |
Tokyu Livable, Inc. | 271,300 | | 3,128,699 |
Toto Ltd. (d) | 474,000 | | 3,149,173 |
Towa Corp. (a) | 297,200 | | 1,968,530 |
Toyo Tanso Co. Ltd. (d) | 42,500 | | 2,437,399 |
Toyota Boshoku Corp. | 37,100 | | 628,860 |
Ulvac, Inc. | 96,100 | | 1,938,242 |
Yamatake Corp. | 165,800 | | 4,036,314 |
Yamato Kogyo Co. Ltd. | 80,000 | | 2,051,945 |
Yokohama Rubber Co. Ltd. | 367,000 | | 1,834,507 |
TOTAL JAPAN | | 203,152,346 |
Common Stocks - continued |
| Shares | | Value |
Korea (South) - 0.8% |
Daou Technology, Inc. | 197,150 | | $ 1,577,901 |
Hyosung Corp. | 6,493 | | 721,765 |
Interpark Corp. (a) | 75,279 | | 298,572 |
KC Tech Co. Ltd. | 126,140 | | 682,020 |
Lock & Lock Co. Ltd. | 19,170 | | 634,170 |
MNTECH Co. Ltd. | 76,840 | | 755,075 |
Power Logics Co. Ltd. (a) | 57,033 | | 442,266 |
Sodiff Advanced Materials Co. Ltd. | 3,940 | | 358,787 |
The Basic House Co. Ltd. (a) | 66,650 | | 1,345,447 |
TK Corp. (a) | 17,649 | | 407,285 |
TOTAL KOREA (SOUTH) | | 7,223,288 |
Luxembourg - 0.3% |
GlobeOp Financial Services SA | 594,385 | | 2,906,877 |
Malaysia - 0.3% |
JobStreet Corp. Bhd | 1,223,100 | | 1,045,788 |
Lion Industries Corp. Bhd | 808,200 | | 514,380 |
Masterskill Education Group Bhd | 478,400 | | 444,415 |
Top Glove Corp. Bhd | 222,000 | | 392,478 |
TOTAL MALAYSIA | | 2,397,061 |
Netherlands - 1.8% |
Gemalto NV | 190,440 | | 8,670,399 |
SMARTRAC NV (a) | 104,600 | | 2,899,270 |
Wavin NV (a) | 273,912 | | 3,778,571 |
TOTAL NETHERLANDS | | 15,348,240 |
Norway - 2.0% |
Aker Solutions ASA | 339,300 | | 5,165,388 |
Renewable Energy Corp. ASA (a)(d) | 1,111,942 | | 3,870,628 |
Schibsted ASA (B Shares) | 221,000 | | 6,072,568 |
Sevan Marine ASA (a) | 2,000,000 | | 2,694,861 |
TOTAL NORWAY | | 17,803,445 |
Philippines - 0.1% |
Alliance Global Group, Inc. | 2,595,000 | | 685,951 |
Singapore - 1.8% |
CSE Global Ltd. | 1,069,000 | | 875,485 |
Goodpack Ltd. | 1,569,000 | | 2,472,966 |
Hyflux Ltd. | 398,000 | | 968,632 |
Mapletree Industrial (REIT) (a) | 207,000 | | 171,127 |
Oceanus Group Ltd. (a) | 2,071,000 | | 512,030 |
Common Stocks - continued |
| Shares | | Value |
Singapore - continued |
Pertama Holdings Ltd. (e) | 21,312,000 | | $ 7,080,399 |
Petra Foods Ltd. | 279,000 | | 344,897 |
Raffles Medical Group Ltd. | 431,000 | | 725,937 |
Straits Asia Resources Ltd. | 739,000 | | 1,307,510 |
Yanlord Land Group Ltd. | 608,000 | | 807,973 |
TOTAL SINGAPORE | | 15,266,956 |
South Africa - 0.6% |
Blue Label Telecoms Ltd. | 4,787,200 | | 4,920,427 |
Spain - 0.3% |
Obrascon Huarte Lain SA | 73,400 | | 2,401,133 |
Sweden - 1.5% |
Elekta AB (B Shares) | 252,800 | | 9,564,751 |
Modern Times Group MTG AB (B Shares) | 44,100 | | 3,162,163 |
XCounter AB (a) | 1,108,000 | | 48,818 |
TOTAL SWEDEN | | 12,775,732 |
Switzerland - 1.9% |
Bank Sarasin & Co. Ltd. Series B (Reg.) | 18,166 | | 664,373 |
Basilea Pharmaceutica AG (a) | 9,770 | | 684,848 |
Lonza Group AG | 58,029 | | 5,078,680 |
Panalpina Welttransport Holding AG (a) | 42,760 | | 5,338,756 |
VZ Holding AG | 42,690 | | 4,532,031 |
TOTAL SWITZERLAND | | 16,298,688 |
United Kingdom - 16.7% |
Abcam PLC | 196,100 | | 5,403,924 |
Ashmore Group PLC | 1,109,700 | | 6,804,046 |
Asset Realisation Co. PLC (a) | 340,000 | | 5 |
Aurelian Oil & Gas PLC (a) | 3,923,800 | | 3,834,775 |
Avanti Communications Group PLC (a) | 403,000 | | 3,796,519 |
Aveva Group PLC | 188,500 | | 4,499,879 |
Blinkx PLC��(a)(d) | 1,303,000 | | 1,826,651 |
Bond International Software PLC | 617,066 | | 598,123 |
Borders & Southern Petroleum PLC (a) | 698,500 | | 783,371 |
Cadogan Petroleum PLC (a) | 1,406,300 | | 439,355 |
Central Asia Metals PLC (a) | 1,464,000 | | 2,023,035 |
Centurion Electronics PLC (a)(e) | 748,299 | | 12 |
Ceres Power Holdings PLC (a)(d) | 406,200 | | 532,024 |
China Goldmines PLC (a) | 669,353 | | 257,377 |
Connaught PLC | 429,800 | | 7 |
Conygar Investment Co. PLC (a) | 2,333,700 | | 3,916,537 |
Common Stocks - continued |
| Shares | | Value |
United Kingdom - continued |
Cove Energy PLC (a) | 2,629,300 | | $ 3,190,994 |
Craneware PLC | 877,400 | | 8,244,585 |
DTZ Holdings PLC (a) | 1,804,400 | | 1,315,368 |
EMIS Group PLC | 382,345 | | 2,603,440 |
European Nickel PLC (a) | 2,276,950 | | 1,386,246 |
Faroe Petroleum PLC (a) | 458,447 | | 1,432,277 |
GoIndustry-DoveBid PLC (a) | 22,589 | | 32,029 |
Hays PLC | 2,007,843 | | 3,554,637 |
Icap PLC | 514,900 | | 3,763,408 |
Ideal Shopping Direct PLC | 234,592 | | 719,756 |
IG Group Holdings PLC | 1,264,300 | | 10,705,287 |
Inchcape PLC (a) | 778,720 | | 4,350,473 |
Jubilee Platinum PLC (a) | 2,729,847 | | 1,366,758 |
Keronite PLC (a)(h) | 13,620,267 | | 218 |
Melrose Resources PLC | 266,200 | | 1,385,247 |
Moneysupermarket.com Group PLC | 1,822,600 | | 2,441,186 |
Monitise PLC (a) | 4,154,500 | | 1,397,788 |
Mothercare PLC | 501,800 | | 4,224,804 |
NCC Group Ltd. | 228,315 | | 1,755,815 |
Northgate PLC (a) | 493,500 | | 1,937,120 |
Ocado Group PLC (a)(d) | 1,125,700 | | 2,519,546 |
Pureprofile Media PLC (a)(h) | 1,108,572 | | 444,025 |
Redhall Group PLC | 519,600 | | 1,057,246 |
Regenersis PLC (a) | 1,367,300 | | 1,106,263 |
Rockhopper Exploration PLC (a)(i) | 654,100 | | 3,337,773 |
Royalblue Group PLC | 197,842 | | 5,071,561 |
SDL PLC (a) | 691,862 | | 6,661,885 |
Serco Group PLC | 447,430 | | 4,401,459 |
SIG PLC (a) | 1,479,300 | | 2,690,019 |
Silverdell PLC (a) | 4,958,000 | | 615,618 |
Sinclair Pharma PLC (a) | 4,246,949 | | 1,837,147 |
Sphere Medical Holding PLC (a)(h) | 555,599 | | 1,513,260 |
SR Pharma PLC (a) | 5,388,700 | | 837,450 |
Sthree PLC | 541,709 | | 2,542,944 |
Synergy Health PLC | 274,953 | | 3,464,658 |
Ted Baker PLC | 293,100 | | 2,887,980 |
TMO Biotec (a)(h) | 1,000,000 | | 400,538 |
Travis Perkins PLC | 248,700 | | 3,301,197 |
Valiant Petroleum PLC (a) | 156,200 | | 1,485,268 |
Wellstream Holdings PLC | 434,600 | | 5,152,578 |
Common Stocks - continued |
| Shares | | Value |
United Kingdom - continued |
Xchanging PLC | 1,521,100 | | $ 3,165,702 |
Zenergy Power PLC (a) | 855,520 | | 387,215 |
TOTAL UNITED KINGDOM | | 145,404,408 |
United States of America - 0.5% |
CTC Media, Inc. | 183,400 | | 4,328,240 |
Mudalla Technology, Inc. (a) | 996,527 | | 16 |
XL TechGroup, Inc. (a) | 1,329,250 | | 21 |
TOTAL UNITED STATES OF AMERICA | | 4,328,277 |
TOTAL COMMON STOCKS (Cost $718,968,030) | 820,697,874 |
Investment Companies - 0.0% |
| | | |
Bailiwick of Guernsey - 0.0% |
Brookwell Ltd. Class A
(Cost $621,868) | 213,047 | | 110,933 |
Government Obligations - 0.2% |
| Principal Amount (j) | | |
Germany - 0.2% |
German Federal Republic 0.2535% to 0.6185% 11/24/10 to 2/9/11 (g)
(Cost $1,499,792) | EUR | 1,100,000 | | 1,529,062 |
Money Market Funds - 8.4% |
| Shares | | |
Fidelity Cash Central Fund, 0.23% (b) | 46,383,073 | | 46,383,073 |
Fidelity Securities Lending Cash Central Fund, 0.24% (b)(c) | 26,860,023 | | 26,860,023 |
TOTAL MONEY MARKET FUNDS (Cost $73,243,096) | 73,243,096 |
TOTAL INVESTMENT PORTFOLIO - 103.0% (Cost $794,332,786) | | 895,580,965 |
NET OTHER ASSETS (LIABILITIES) - (3.0)% | | (26,101,299) |
NET ASSETS - 100% | $ 869,479,666 |
Futures Contracts |
| Expiration Date | | Underlying
Face Amount
at Value | | Unrealized
Appreciation/
(Depreciation) |
Purchased |
Equity Index Contracts |
366 Dow Jones Euro Stoxx 50 Index Contracts (Germany) | Dec. 2010 | | $ 14,458,195 | | $ 53,183 |
|
The face value of futures purchased as a percentage of net assets is 1.7% |
Currency Abbreviations |
EUR | - | European Monetary Unit |
Legend |
(a) Non-income producing |
(b) Affiliated fund that is available only to investment companies and other accounts managed by Fidelity Investments. The rate quoted is the annualized seven-day yield of the fund at period end. A complete unaudited listing of the fund's holdings as of its most recent quarter end is available upon request. In addition, each Fidelity Central Fund's financial statements, which are not covered by the Fund's report of Independent Registered Public Accounting Firm, are available on the SEC's website or upon request. |
(c) Investment made with cash collateral received from securities on loan. |
(d) Security or a portion of the security is on loan at period end. |
(e) Affiliated company |
(f) Security exempt from registration under Rule 144A of the Securities Act of 1933. These securities may be resold in transactions exempt from registration, normally to qualified institutional buyers. At the end of the period, the value of these securities amounted to $1,603,636 or 0.2% of net assets. |
(g) Security or a portion of the security was pledged to cover margin requirements for futures contracts. At the period end, the value of securities pledged amounted to $236,310. |
(h) Restricted securities - Investment in securities not registered under the Securities Act of 1933 (excluding 144A issues). At the end of the period, the value of restricted securities (excluding 144A issues) amounted to $7,225,615 or 0.8% of net assets. |
Additional information on each holding is as follows: |
Security | Acquisition Date | Acquisition Cost |
AirSea Lines | 8/4/06 | $ 931,150 |
AirSea Lines warrants 8/4/11 | 8/4/06 | $ 2 |
Buried Hill Energy (Cyprus) PCL | 8/18/06 | $ 2,141,700 |
Kalahari Energy | 9/1/06 | $ 1,813,750 |
Keronite PLC | 8/16/06 | $ 817,216 |
Pureprofile Media PLC | 5/3/05 - 1/11/06 | $ 640,000 |
Rock Well Petroleum, Inc. | 4/13/06 | $ 1,155,600 |
Sphere Medical Holding PLC | 8/27/08 - 3/16/10 | $ 944,518 |
TMO Biotec | 10/27/05 | $ 300,000 |
(i) Security or a portion of the security purchased on a delayed delivery or when-issued basis. |
(j) Principal amount is stated in United States dollars unless otherwise noted. |
Affiliated Central Funds |
Information regarding fiscal year to date income earned by the Fund from investments in Fidelity Central Funds is as follows: |
Fund | Income earned |
Fidelity Cash Central Fund | $ 50,101 |
Fidelity Securities Lending Cash Central Fund | 829,746 |
Total | $ 879,847 |
Other Affiliated Issuers |
An affiliated company is a company in which the Fund has ownership of at least 5% of the voting securities. Fiscal year to date transactions with companies which are or were affiliates are as follows: |
Affiliates | Value,
beginning
of period | Purchases | Sales
Proceeds | Dividend
Income | Value,
end
of period |
Brookwell Ltd. Class A | $ 1,078,606 | $ - | $ 724,601 | $ - | $ - |
Centurion Electronics PLC | 12 | - | - | - | 12 |
Pertama Holdings Ltd. | - | 5,470,243 | 107,724 | 659,049 | 7,080,399 |
Total | $ 1,078,618 | $ 5,470,243 | $ 832,325 | $ 659,049 | $ 7,080,411 |
Other Information |
The following is a summary of the inputs used, as of October 31, 2010, involving the Fund's assets and liabilities carried at fair value. The inputs or methodology used for valuing securities may not be an indication of the risk associated with investing in those securities. For more information on valuation inputs, and their aggregation into the levels used in the tables below, please refer to the Security Valuation section in the accompanying Notes to Financial Statements. |
Valuation Inputs at Reporting Date: |
Description | Total | Level 1 | Level 2 | Level 3 |
Investments in Securities: | | | | |
Equities: | | | | |
Japan | $ 203,152,346 | $ 168,463,560 | $ 34,688,786 | $ - |
United Kingdom | 145,404,408 | 142,756,937 | 32,029 | 2,615,442 |
Germany | 80,891,358 | 80,891,358 | - | - |
France | 76,733,217 | 72,333,547 | 4,399,670 | - |
Australia | 64,820,466 | 64,820,466 | - | - |
Cayman Islands | 23,323,503 | 22,799,648 | - | 523,855 |
Canada | 19,219,627 | 19,219,567 | - | 60 |
Norway | 17,803,445 | 17,803,445 | - | - |
Bermuda | 16,607,487 | 16,607,487 | - | - |
Sweden | 12,775,732 | 12,726,914 | - | 48,818 |
Ireland | 8,048,323 | 8,048,309 | - | 14 |
Cyprus | 7,109,871 | 2,242,371 | - | 4,867,500 |
British Virgin Islands | 6,276,684 | 6,276,669 | - | 15 |
United States of America | 4,328,277 | 4,328,240 | - | 37 |
Other | 134,203,130 | 133,841,608 | 361,522 | - |
Investment Companies | 110,933 | - | - | 110,933 |
Government Obligations | 1,529,062 | - | 1,529,062 | - |
Money Market Funds | 73,243,096 | 73,243,096 | - | - |
Total Investments in Securities: | $ 895,580,965 | $ 846,403,222 | $ 41,011,069 | $ 8,166,674 |
Derivative Instruments: | | | | |
Assets | | | | |
Futures Contracts | $ 53,183 | $ 53,183 | $ - | $ - |
Other Information - continued |
The following is a reconciliation of Investments in Securities for which Level 3 inputs were used in determining value: |
Investments in Securities: | |
Beginning Balance | $ 8,316,240 |
Total Realized Gain (Loss) | (8,917,345) |
Total Unrealized Gain (Loss) | 4,243,114 |
Cost of Purchases | 1,804,796 |
Proceeds of Sales | (1,263,414) |
Amortization/Accretion | - |
Transfers in to Level 3 | 5,146,203 |
Transfers out of Level 3 | (1,162,920) |
Ending Balance | $ 8,166,674 |
The change in unrealized gain (loss) for the period attributable to Level 3 securities held at October 31, 2010 | $ 777,510 |
The information used in the above reconciliation represents fiscal year to date activity for any Investments in Securities identified as using Level 3 inputs at either the beginning or the end of the current fiscal period. Transfers in or out of Level 3 represent the beginning value of any Security or Instrument where a change in the pricing level occurred from the beginning to the end of the period. The cost of purchases and the proceeds of sales may include securities received or delivered through corporate actions or exchanges. Realized and unrealized gains (losses) disclosed in the reconciliation are included in Net Gain (Loss) on the Fund's Statement of Operations. |
Value of Derivative Instruments |
The following table is a summary of the Fund's value of derivative instruments by risk exposure as of October 31, 2010. For additional information on derivative instruments, please refer to the Derivative Instruments section in the accompanying Notes to Financial Statements. |
Risk Exposure /
Derivative Type | Value |
| Asset | Liability |
Equity Risk | | |
Futures Contracts (a) | $ 53,183 | $ - |
(a) Reflects cumulative appreciation/(depreciation) on futures contracts as disclosed on the Schedule of Investments. Only the period end variation margin is separately disclosed on the Statement of Assets and Liabilities. |
Income Tax Information |
At October 31, 2010, the Fund had a capital loss carryforward of approximately $78,127,356 all of which will expire on October 31, 2017. Capital loss carryforwards are only available to offset future capital gains of the Fund to the extent provided by regulations and may be limited. |
See accompanying notes which are an integral part of the financial statements.
Annual Report
Statement of Assets and Liabilities
| October 31, 2010 |
| | |
Assets | | |
Investment in securities, at value (including securities loaned of $25,207,989) - See accompanying schedule: Unaffiliated issuers (cost $715,388,858) | $ 815,257,458 | |
Fidelity Central Funds (cost $73,243,096) | 73,243,096 | |
Other affiliated issuers (cost $5,700,832) | 7,080,411 | |
Total Investments (cost $794,332,786) | | $ 895,580,965 |
Cash | | 2 |
Foreign currency held at value (cost $70,040) | | 70,287 |
Receivable for investments sold | | 2,674,189 |
Receivable for fund shares sold | | 2,467,902 |
Dividends receivable | | 2,081,418 |
Distributions receivable from Fidelity Central Funds | | 90,243 |
Receivable for daily variation on futures contracts | | 5,554 |
Other receivables | | 142,637 |
Total assets | | 903,113,197 |
| | |
Liabilities | | |
Payable for investments purchased | | |
Regular delivery | $ 1,182,254 | |
Delayed delivery | 1,689,050 | |
Payable for fund shares redeemed | 2,886,835 | |
Accrued management fee | 652,945 | |
Distribution and service plan fees payable | 24,970 | |
Other affiliated payables | 211,160 | |
Other payables and accrued expenses | 126,294 | |
Collateral on securities loaned, at value | 26,860,023 | |
Total liabilities | | 33,633,531 |
| | |
Net Assets | | $ 869,479,666 |
Net Assets consist of: | | |
Paid in capital | | $ 851,358,414 |
Undistributed net investment income | | 2,441,101 |
Accumulated undistributed net realized gain (loss) on investments and foreign currency transactions | | (85,653,683) |
Net unrealized appreciation (depreciation) on investments and assets and liabilities in foreign currencies | | 101,333,834 |
Net Assets | | $ 869,479,666 |
See accompanying notes which are an integral part of the financial statements.
Annual Report
Financial Statements - continued
Statement of Assets and Liabilities - continued
| October 31, 2010 |
| | |
Calculation of Maximum Offering Price
Class A:
Net Asset Value and redemption price per share
($19,720,315 ÷ 965,882 shares) | | $ 20.42 |
| | |
Maximum offering price per share (100/94.25 of $20.42) | | $ 21.67 |
Class T:
Net Asset Value and redemption price per share ($16,092,042 ÷ 795,270 shares) | | $ 20.23 |
| | |
Maximum offering price per share (100/96.50 of $20.23) | | $ 20.96 |
Class B:
Net Asset Value and offering price per share ($3,457,061 ÷ 174,710 shares)A | | $ 19.79 |
| | |
Class C:
Net Asset Value and offering price per share ($13,501,307 ÷ 680,118 shares)A | | $ 19.85 |
| | |
International Small Cap:
Net Asset Value, offering price and redemption price per share ($808,478,028 ÷ 39,124,218 shares) | | $ 20.66 |
| | |
Institutional Class:
Net Asset Value, offering price and redemption price per share ($8,230,913 ÷ 398,399 shares) | | $ 20.66 |
A Redemption price per share is equal to net asset value less any applicable contingent deferred sales charge.
See accompanying notes which are an integral part of the financial statements.
Annual Report
Statement of Operations
| Year ended October 31, 2010 |
Investment Income | | |
Dividends (including $659,049 earned from other affiliated issuers) | | $ 13,399,968 |
Interest | | 2,449 |
Income from Fidelity Central Funds (including $829,746 from security lending) | | 879,847 |
Income before foreign taxes withheld | | 14,282,264 |
Less foreign taxes withheld | | (840,519) |
Total income | | 13,441,745 |
| | |
Expenses | | |
Management fee
Basic fee | $ 6,469,279 | |
Performance adjustment | 1,311,370 | |
Transfer agent fees | 2,167,890 | |
Distribution and service plan fees | 254,737 | |
Accounting and security lending fees | 371,480 | |
Custodian fees and expenses | 294,480 | |
Independent trustees' compensation | 4,208 | |
Registration fees | 88,212 | |
Audit | 141,668 | |
Legal | 3,656 | |
Miscellaneous | 10,051 | |
Total expenses before reductions | 11,117,031 | |
Expense reductions | (199,347) | 10,917,684 |
Net investment income (loss) | | 2,524,061 |
Realized and Unrealized Gain (Loss) Net realized gain (loss) on: | | |
Investment securities: | | |
Unaffiliated issuers (net of foreign taxes of $39,190) | 48,923,650 | |
Other affiliated issuers | (1,945,619) | |
Foreign currency transactions | 7,621 | |
Futures contracts | (1,268,507) | |
Capital gain distributions from Fidelity Central Funds | 1,843 | |
Total net realized gain (loss) | | 45,718,988 |
Change in net unrealized appreciation (depreciation) on: Investment securities (net of decrease in deferred foreign taxes of $17,326) | 97,289,267 | |
Assets and liabilities in foreign currencies | 34,009 | |
Futures contracts | 53,183 | |
Total change in net unrealized appreciation (depreciation) | | 97,376,459 |
Net gain (loss) | | 143,095,447 |
Net increase (decrease) in net assets resulting from operations | | $ 145,619,508 |
See accompanying notes which are an integral part of the financial statements.
Annual Report
Financial Statements - continued
Statement of Changes in Net Assets
| Year ended
October 31,
2010 | Year ended
October 31,
2009 |
Increase (Decrease) in Net Assets | | |
Operations | | |
Net investment income (loss) | $ 2,524,061 | $ 3,237,964 |
Net realized gain (loss) | 45,718,988 | (79,176,066) |
Change in net unrealized appreciation (depreciation) | 97,376,459 | 297,287,070 |
Net increase (decrease) in net assets resulting from operations | 145,619,508 | 221,348,968 |
Distributions to shareholders from net investment income | (3,368,409) | - |
Distributions to shareholders from net realized gain | (14,323,742) | - |
Total distributions | (17,692,151) | - |
Share transactions - net increase (decrease) | 26,936,768 | (81,370,441) |
Redemption fees | 118,859 | 67,796 |
Total increase (decrease) in net assets | 154,982,984 | 140,046,323 |
| | |
Net Assets | | |
Beginning of period | 714,496,682 | 574,450,359 |
End of period (including undistributed net investment income of $2,441,101 and undistributed net investment income of $3,237,964, respectively) | $ 869,479,666 | $ 714,496,682 |
See accompanying notes which are an integral part of the financial statements.
Annual Report
Financial Highlights - Class A
Years ended October 31, | 2010 | 2009 | 2008 | 2007 | 2006 |
Selected Per-Share Data | | | | | |
Net asset value, beginning of period | $ 17.28 | $ 11.91 | $ 31.14 | $ 28.79 | $ 26.69 |
Income from Investment Operations | | | | | |
Net investment income (loss) C | .03 | .06 | - H | .03 | (.02) |
Net realized and unrealized gain (loss) | 3.51 | 5.31 | (14.03) | 7.97 | 5.05 |
Total from investment operations | 3.54 | 5.37 | (14.03) | 8.00 | 5.03 |
Distributions from net investment income | (.06) | - | (.03) | - | (.05) |
Distributions from net realized gain | (.34) | - | (5.18) | (5.65) | (2.89) |
Total distributions | (.40) | - | (5.20) I | (5.65) | (2.94) |
Redemption fees added to paid in capital C | - H | - H | - H | - H | .01 |
Net asset value, end of period | $ 20.42 | $ 17.28 | $ 11.91 | $ 31.14 | $ 28.79 |
Total Return A,B | 20.85% | 45.09% | (53.35)% | 33.43% | 20.22% |
Ratios to Average Net Assets D,G | | | | | |
Expenses before reductions | 1.71% | 1.75% | 1.82% | 1.53% | 1.64% |
Expenses net of fee waivers, if any | 1.65% | 1.65% | 1.65% | 1.53% | 1.64% |
Expenses net of all reductions | 1.63% | 1.62% | 1.60% | 1.49% | 1.58% |
Net investment income (loss) | .16% | .41% | -% F | .10% | (.08)% |
Supplemental Data | | | | | |
Net assets, end of period (000 omitted) | $ 19,720 | $ 17,590 | $ 13,561 | $ 38,585 | $ 36,701 |
Portfolio turnover rate E | 66% | 81% | 113% | 70% | 84% |
A Total returns would have been lower had certain expenses not been reduced during the periods shown.
B Total returns do not include the effect of the sales charges.
C Calculated based on average shares outstanding during the period.
D Fees and expenses of the underlying Fidelity Central Funds are not included in the Fund's expense ratio. The Fund indirectly bears its proportionate share of the expenses of any underlying Fidelity Central Funds.
E Amount does not include the portfolio activity of any underlying Fidelity Central Funds.
F Amount represents less than .01%.
G Expense ratios reflect operating expenses of the class. Expenses before reductions do not reflect amounts reimbursed by the investment adviser or reductions from brokerage service arrangements or reductions from other expense offset arrangements and do not represent the amount paid by the class during periods when reimbursements or reductions occur. Expenses net of fee waivers reflect expenses after reimbursement by the investment adviser but prior to reductions from brokerage service arrangements or other expense offset arrangements. Expenses net of all reductions represent the net expenses paid by the class.
H Amount represents less than $.01 per share.
I Total distributions of $5.20 per share is comprised of distributions from net investment income of $.026 and distributions from net realized gain of $5.176 per share.
See accompanying notes which are an integral part of the financial statements.
Annual Report
Financial Highlights - Class T
Years ended October 31, | 2010 | 2009 | 2008 | 2007 | 2006 |
Selected Per-Share Data | | | | | |
Net asset value, beginning of period | $ 17.14 | $ 11.84 | $ 30.96 | $ 28.64 | $ 26.57 |
Income from Investment Operations | | | | | |
Net investment income (loss) C | (.02) | .02 | (.05) | (.04) | (.09) |
Net realized and unrealized gain (loss) | 3.47 | 5.28 | (13.95) | 7.93 | 5.03 |
Total from investment operations | 3.45 | 5.30 | (14.00) | 7.89 | 4.94 |
Distributions from net investment income | (.02) | - | - | - | - |
Distributions from net realized gain | (.34) | - | (5.12) | (5.57) | (2.88) |
Total distributions | (.36) | - | (5.12) | (5.57) | (2.88) |
Redemption fees added to paid in capital C | - G | - G | - G | - G | .01 |
Net asset value, end of period | $ 20.23 | $ 17.14 | $ 11.84 | $ 30.96 | $ 28.64 |
Total Return A,B | 20.46% | 44.76% | (53.46)% | 33.07% | 19.93% |
Ratios to Average Net Assets D,F | | | | | |
Expenses before reductions | 1.97% | 2.00% | 2.07% | 1.77% | 1.89% |
Expenses net of fee waivers, if any | 1.90% | 1.90% | 1.90% | 1.77% | 1.89% |
Expenses net of all reductions | 1.88% | 1.86% | 1.86% | 1.73% | 1.83% |
Net investment income (loss) | (.09)% | .16% | (.25)% | (.14)% | (.32)% |
Supplemental Data | | | | | |
Net assets, end of period (000 omitted) | $ 16,092 | $ 15,760 | $ 13,493 | $ 40,823 | $ 41,982 |
Portfolio turnover rate E | 66% | 81% | 113% | 70% | 84% |
A Total returns would have been lower had certain expenses not been reduced during the periods shown.
B Total returns do not include the effect of the sales charges.
C Calculated based on average shares outstanding during the period.
D Fees and expenses of the underlying Fidelity Central Funds are not included in the Fund's expense ratio. The Fund indirectly bears its proportionate share of the expenses of any underlying Fidelity Central Funds.
E Amount does not include the portfolio activity of any underlying Fidelity Central Funds.
F Expense ratios reflect operating expenses of the class. Expenses before reductions do not reflect amounts reimbursed by the investment adviser or reductions from brokerage service arrangements or reductions from other expense offset arrangements and do not represent the amount paid by the class during periods when reimbursements or reductions occur. Expenses net of fee waivers reflect expenses after reimbursement by the investment adviser but prior to reductions from brokerage service arrangements or other expense offset arrangements. Expenses net of all reductions represent the net expenses paid by the class.
G Amount represents less than $.01 per share.
See accompanying notes which are an integral part of the financial statements.
Annual Report
Financial Highlights - Class B
Years ended October 31, | 2010 | 2009 | 2008 | 2007 | 2006 |
Selected Per-Share Data | | | | | |
Net asset value, beginning of period | $ 16.78 | $ 11.65 | $ 30.49 | $ 28.26 | $ 26.24 |
Income from Investment Operations | | | | | |
Net investment income (loss)C | (.10) | (.04) | (.16) | (.18) | (.24) |
Net realized and unrealized gain (loss) | 3.39 | 5.17 | (13.73) | 7.82 | 4.98 |
Total from investment operations | 3.29 | 5.13 | (13.89) | 7.64 | 4.74 |
Distributions from net realized gain | (.28) | - | (4.95) | (5.41) | (2.73) |
Redemption fees added to paid in capitalC | - G | - G | - G | - G | .01 |
Net asset value, end of period | $ 19.79 | $ 16.78 | $ 11.65 | $ 30.49 | $ 28.26 |
Total Return A,B | 19.90% | 44.03% | (53.68)% | 32.38% | 19.28% |
Ratios to Average Net Assets D,F | | | | | |
Expenses before reductions | 2.47% | 2.49% | 2.58% | 2.30% | 2.48% |
Expenses net of fee waivers, if any | 2.40% | 2.40% | 2.40% | 2.30% | 2.40% |
Expenses net of all reductions | 2.38% | 2.36% | 2.36% | 2.26% | 2.34% |
Net investment income (loss) | (.59)% | (.33)% | (.75)% | (.66)% | (.84)% |
Supplemental Data | | | | | |
Net assets, end of period (000 omitted) | $ 3,457 | $ 3,601 | $ 3,230 | $ 10,704 | $ 11,354 |
Portfolio turnover rate E | 66% | 81% | 113% | 70% | 84% |
A Total returns would have been lower had certain expenses not been reduced during the periods shown.
B Total returns do not include the effect of the contingent deferred sales charge.
C Calculated based on average shares outstanding during the period.
D Fees and expenses of the underlying Fidelity Central Funds are not included in the Fund's expense ratio. The Fund indirectly bears its proportionate share of the expenses of any underlying Fidelity Central Funds.
E Amount does not include the portfolio activity of any underlying Fidelity Central Funds.
F Expense ratios reflect operating expenses of the class. Expenses before reductions do not reflect amounts reimbursed by the investment adviser or reductions from brokerage service arrangements or reductions from other expense offset arrangements and do not represent the amount paid by the class during periods when reimbursements or reductions occur. Expenses net of fee waivers reflect expenses after reimbursement by the investment adviser but prior to reductions from brokerage service arrangements or other expense offset arrangements. Expenses net of all reductions represent the net expenses paid by the class.
G Amount represents less than $.01 per share.
See accompanying notes which are an integral part of the financial statements.
Annual Report
Financial Highlights - Class C
Years ended October 31, | 2010 | 2009 | 2008 | 2007 | 2006 |
Selected Per-Share Data | | | | | |
Net asset value, beginning of period | $ 16.85 | $ 11.70 | $ 30.62 | $ 28.33 | $ 26.31 |
Income from Investment Operations | | | | | |
Net investment income (loss) C | (.10) | (.04) | (.16) | (.17) | (.23) |
Net realized and unrealized gain (loss) | 3.40 | 5.19 | (13.78) | 7.85 | 4.99 |
Total from investment operations | 3.30 | 5.15 | (13.94) | 7.68 | 4.76 |
Distributions from net realized gain | (.30) | - | (4.98) | (5.39) | (2.75) |
Redemption fees added to paid in capital C | - G | - G | - G | - G | .01 |
Net asset value, end of period | $ 19.85 | $ 16.85 | $ 11.70 | $ 30.62 | $ 28.33 |
Total Return A,B | 19.86% | 44.02% | (53.67)% | 32.39% | 19.34% |
Ratios to Average Net Assets D,F | | | | | |
Expenses before reductions | 2.42% | 2.49% | 2.57% | 2.26% | 2.38% |
Expenses net of fee waivers, if any | 2.40% | 2.40% | 2.40% | 2.26% | 2.38% |
Expenses net of all reductions | 2.37% | 2.36% | 2.36% | 2.22% | 2.32% |
Net investment income (loss) | (.59)% | (.33)% | (.76)% | (.62)% | (.81)% |
Supplemental Data | | | | | |
Net assets, end of period (000 omitted) | $ 13,501 | $ 5,814 | $ 5,658 | $ 20,094 | $ 21,335 |
Portfolio turnover rate E | 66% | 81% | 113% | 70% | 84% |
A Total returns would have been lower had certain expenses not been reduced during the periods shown.
B Total returns do not include the effect of the contingent deferred sales charge.
C Calculated based on average shares outstanding during the period.
D Fees and expenses of the underlying Fidelity Central Funds are not included in the Fund's expense ratio. The Fund indirectly bears its proportionate share of the expenses of any underlying Fidelity Central Funds.
E Amount does not include the portfolio activity of any underlying Fidelity Central Funds.
F Expense ratios reflect operating expenses of the class. Expenses before reductions do not reflect amounts reimbursed by the investment adviser or reductions from brokerage service arrangements or reductions from other expense offset arrangements and do not represent the amount paid by the class during periods when reimbursements or reductions occur. Expenses net of fee waivers reflect expenses after reimbursement by the investment adviser but prior to reductions from brokerage service arrangements or other expense offset arrangements. Expenses net of all reductions represent the net expenses paid by the class.
G Amount represents less than $.01 per share.
See accompanying notes which are an integral part of the financial statements.
Annual Report
Financial Highlights - International Small Cap
Years ended October 31, | 2010 | 2009 | 2008 | 2007 | 2006 |
Selected Per-Share Data | | | | | |
Net asset value, beginning of period | $ 17.48 | $ 12.03 | $ 31.44 | $ 29.03 | $ 26.89 |
Income from Investment Operations | | | | | |
Net investment income (loss) B | .07 | .08 | .03 | .12 | .08 |
Net realized and unrealized gain (loss) | 3.53 | 5.37 | (14.14) | 8.03 | 5.08 |
Total from investment operations | 3.60 | 5.45 | (14.11) | 8.15 | 5.16 |
Distributions from net investment income | (.08) | - | (.12) | (.07) | (.14) |
Distributions from net realized gain | (.34) | - | (5.18) | (5.67) | (2.89) |
Total distributions | (.42) | - | (5.30) | (5.74) | (3.03) |
Redemption fees added to paid in capital B | - F | - F | - F | - F | .01 |
Net asset value, end of period | $ 20.66 | $ 17.48 | $ 12.03 | $ 31.44 | $ 29.03 |
Total Return A | 21.02% | 45.30% | (53.25)% | 33.82% | 20.65% |
Ratios to Average Net Assets C,E | | | | | |
Expenses before reductions | 1.44% | 1.48% | 1.49% | 1.19% | 1.28% |
Expenses net of fee waivers, if any | 1.44% | 1.48% | 1.49% | 1.19% | 1.28% |
Expenses net of all reductions | 1.42% | 1.44% | 1.44% | 1.15% | 1.22% |
Net investment income (loss) | .37% | .58% | .16% | .45% | .29% |
Supplemental Data | | | | | |
Net assets, end of period (000 omitted) | $ 808,478 | $ 669,035 | $ 536,291 | $ 1,663,761 | $ 1,816,059 |
Portfolio turnover rate D | 66% | 81% | 113% | 70% | 84% |
A Total returns would have been lower had certain expenses not been reduced during the periods shown.
B Calculated based on average shares outstanding during the period.
C Fees and expenses of the underlying Fidelity Central Funds are not included in the Fund's expense ratio. The Fund indirectly bears its proportionate share of the expenses of any underlying Fidelity Central Funds.
D Amount does not include the portfolio activity of any underlying Fidelity Central Funds.
E Expense ratios reflect operating expenses of the class. Expenses before reductions do not reflect amounts reimbursed by the investment adviser or reductions from brokerage service arrangements or reductions from other expense offset arrangements and do not represent the amount paid by the class during periods when reimbursements or reductions occur. Expenses net of fee waivers reflect expenses after reimbursement by the investment adviser but prior to reductions from brokerage service arrangements or other expense offset arrangements. Expenses net of all reductions represent the net expenses paid by the class.
F Amount represents less than $.01 per share.
See accompanying notes which are an integral part of the financial statements.
Annual Report
Financial Highlights - Institutional Class
Years ended October 31, | 2010 | 2009 | 2008 | 2007 | 2006 |
Selected Per-Share Data | | | | | |
Net asset value, beginning of period | $ 17.47 | $ 12.01 | $ 31.38 | $ 28.99 | $ 26.86 |
Income from Investment Operations | | | | | |
Net investment income (loss) B | .09 | .09 | .05 | .12 | .08 |
Net realized and unrealized gain (loss) | 3.53 | 5.37 | (14.12) | 8.02 | 5.07 |
Total from investment operations | 3.62 | 5.46 | (14.07) | 8.14 | 5.15 |
Distributions from net investment income | (.09) | - | (.12) | (.07) | (.14) |
Distributions from net realized gain | (.34) | - | (5.18) | (5.68) | (2.89) |
Total distributions | (.43) | - | (5.30) | (5.75) | (3.03) |
Redemption fees added to paid in capital B | - F | - F | - F | - F | .01 |
Net asset value, end of period | $ 20.66 | $ 17.47 | $ 12.01 | $ 31.38 | $ 28.99 |
Total Return A | 21.15% | 45.46% | (53.22)% | 33.84% | 20.65% |
Ratios to Average Net Assets C,E | | | | | |
Expenses before reductions | 1.34% | 1.45% | 1.49% | 1.18% | 1.29% |
Expenses net of fee waivers, if any | 1.34% | 1.40% | 1.40% | 1.18% | 1.29% |
Expenses net of all reductions | 1.31% | 1.37% | 1.35% | 1.14% | 1.23% |
Net investment income (loss) | .47% | .66% | .25% | .45% | .28% |
Supplemental Data | | | | | |
Net assets, end of period (000 omitted) | $ 8,231 | $ 2,696 | $ 2,217 | $ 7,774 | $ 9,050 |
Portfolio turnover rate D | 66% | 81% | 113% | 70% | 84% |
A Total returns would have been lower had certain expenses not been reduced during the periods shown.
B Calculated based on average shares outstanding during the period.
C Fees and expenses of the underlying Fidelity Central Funds are not included in the Fund's expense ratio. The Fund indirectly bears its proportionate share of the expenses of any underlying Fidelity Central Funds.
D Amount does not include the portfolio activity of any underlying Fidelity Central Funds.
E Expense ratios reflect operating expenses of the class. Expenses before reductions do not reflect amounts reimbursed by the investment adviser or reductions from brokerage service arrangements or reductions from other expense offset arrangements and do not represent the amount paid by the class during periods when reimbursements or reductions occur. Expenses net of fee waivers reflect expenses after reimbursement by the investment adviser but prior to reductions from brokerage service arrangements or other expense offset arrangements. Expenses net of all reductions represent the net expenses paid by the class.
F Amount represents less than $.01 per share.
See accompanying notes which are an integral part of the financial statements.
Annual Report
Notes to Financial Statements
For the period ended October 31, 2010
1. Organization.
Fidelity International Small Cap Fund (the Fund) is a fund of Fidelity Investment Trust (the Trust) and is authorized to issue an unlimited number of shares. The Trust is registered under the Investment Company Act of 1940, as amended (the 1940 Act), as an open-end management investment company organized as a Massachusetts business trust. The Fund offers Class A, Class T, Class C, International Small Cap and Institutional Class shares, each of which has equal rights as to assets and voting privileges. Effective after the close of business on September 1, 2010, Class B shares were closed to new accounts and additional purchases by existing shareholders. Each class has exclusive voting rights with respect to matters that affect that class. Class B shares will automatically convert to Class A shares after a holding period of seven years from the initial date of purchase. Investment income, realized and unrealized capital gains and losses, the common expenses of the Fund, and certain fund-level expense reductions, if any, are allocated on a pro-rata basis to each class based on the relative net assets of each class to the total net assets of the Fund. Each class differs with respect to transfer agent and distribution and service plan fees incurred. Certain expense reductions also differ by class.
2. Investments in Fidelity Central Funds.
The Fund may invest in Fidelity Central Funds, which are open-end investment companies available only to other investment companies and accounts managed by Fidelity Management & Research Company (FMR) and its affiliates. The Fund's Schedule of Investments lists each of the Fidelity Central Funds held as of period end, if any, as an investment of the Fund, but does not include the underlying holdings of each Fidelity Central Fund. As an Investing Fund, the Fund indirectly bears its proportionate share of the expenses of the underlying Fidelity Central Funds.
The Money Market Central Funds seek preservation of capital and current income and are managed by Fidelity Investments Money Management, Inc. (FIMM), an affiliate of FMR.
A complete unaudited list of holdings for each Fidelity Central Fund is available upon request or at the Securities and Exchange Commission (the SEC) web site at www.sec.gov. In addition, the financial statements of the Fidelity Central Funds which are not covered by the Fund's Report of Independent Registered Public Accounting Firm, are available on the SEC web site or upon request.
Annual Report
Notes to Financial Statements - continued
3. Significant Accounting Policies.
The financial statements have been prepared in conformity with accounting principles generally accepted in the United States of America (GAAP), which require management to make certain estimates and assumptions at the date of the financial statements. Actual results could differ from those estimates. The following summarizes the significant accounting policies of the Fund:
Security Valuation. Investments are valued as of 4:00 p.m. Eastern time on the last calendar day of the period. The Fund uses independent pricing services approved by the Board of Trustees to value its investments. When current market prices or quotations are not readily available or reliable, valuations may be determined in good faith in accordance with procedures adopted by the Board of Trustees. Factors used in determining value may include market or security specific events, changes in interest rates and credit quality. The frequency with which these procedures are used cannot be predicted and they may be utilized to a significant extent. The value used for net asset value (NAV) calculation under these procedures may differ from published prices for the same securities.
The Fund categorizes the inputs to valuation techniques used to value its investments into a disclosure hierarchy consisting of three levels as shown below.
Level 1 - quoted prices in active markets for identical investments
Level 2 - other significant observable inputs (including quoted prices for similar investments, interest rates, prepayment speeds, etc.)
Level 3 - unobservable inputs (including the fund's own assumptions based on the best information available)
Changes in valuation techniques may result in transfers in or out of an assigned level within the disclosure hierarchy. The aggregate value of investments by input level, as of October 31, 2010, as well as a roll forward of Level 3 securities, is included at the end of the Fund's Schedule of Investments. Valuation techniques used to value the Fund's investments by major category are as follows.
Equity securities, including restricted securities, for which market quotations are readily available, are valued at the last reported sale price or official closing price as reported by an independent pricing service on the primary market or exchange on which they are traded and are categorized as Level 1 in the hierarchy. In the event there were no sales during the day or closing prices are not available, securities are valued at the last quoted bid price or may be valued using the last available price and are generally categorized as Level 2 in the hierarchy. For foreign equity securities, when significant market or security specific events arise, comparisons to the valuation of American Depositary Receipts
Annual Report
3. Significant Accounting Policies - continued
Security Valuation - continued
(ADRs), futures contracts, Exchange-traded funds (ETFs) and certain indexes as well as quoted prices for similar securities are used and are categorized as Level 2 in the hierarchy in these circumstances. Utilizing these techniques may result in significant transfers between Level 1 and Level 2. For restricted equity securities and private placements where observable inputs are limited, assumptions about market activity and risk are used and are categorized as Level 3 in the hierarchy.
Debt securities, including restricted securities, are valued based on evaluated prices received from independent pricing services or from dealers who make markets in such securities. For foreign government and government agency obligations, pricing services utilize matrix pricing which considers yield or price of bonds of comparable quality, coupon, maturity and type as well as dealer supplied prices and are generally categorized as Level 2 in the hierarchy.
Futures contracts are valued at the settlement price established each day by the board of trade or exchange on which they are traded and are categorized as Level 1 in the hierarchy. Investments in open-end mutual funds, including the Fidelity Central Funds, are valued at their closing net asset value each business day and are categorized as Level 1 in the hierarchy. Short-term securities with remaining maturities of sixty days or less for which quotations are not readily available are valued at amortized cost, which approximates fair value and are categorized as Level 2 in the hierarchy.
When independent prices are unavailable or unreliable, debt securities may be valued utilizing pricing matrices which consider similar factors that would be used by independent pricing services. These are generally categorized as Level 2 in the hierarchy but may be Level 3 depending on the circumstances.
Foreign Currency. The Fund uses foreign currency contracts to facilitate transactions in foreign-denominated securities. Gains and losses from these transactions may arise from changes in the value of the foreign currency or if the counterparties do not perform under the contracts' terms.
Foreign-denominated assets, including investment securities, and liabilities are translated into U.S. dollars at the exchange rate at period end. Purchases and sales of investment securities, income and dividends received and expenses denominated in foreign currencies are translated into U.S. dollars at the exchange rate in effect on the transaction date.
The effects of exchange rate fluctuations on investments are included with the net realized and unrealized gain (loss) on investment securities. Other foreign currency transactions resulting in realized and unrealized gain (loss) are disclosed separately.
Annual Report
Notes to Financial Statements - continued
3. Significant Accounting Policies - continued
Investment Transactions and Income. For financial reporting purposes, the Fund's investment holdings and NAV include trades executed through the end of the last business day of the period. The NAV per share for processing shareholder transactions is calculated as of the close of business of the New York Stock Exchange (NYSE), normally 4:00 p.m. Eastern time and includes trades executed through the end of the prior business day. Gains and losses on securities sold are determined on the basis of identified cost and may include proceeds received from litigation. Dividend income is recorded on the ex-dividend date, except for certain dividends from foreign securities where the ex-dividend date may have passed, which are recorded as soon as the Fund is informed of the ex-dividend date. Non-cash dividends included in dividend income, if any, are recorded at the fair market value of the securities received. Distributions received on securities that represent a return of capital or capital gain are recorded as a reduction of cost of investments and/or as a realized gain. The Fund estimates the components of distributions received that may be considered return of capital distributions or capital gain distributions. Interest income and distributions from the Fidelity Central Funds are accrued as earned. Interest income includes coupon interest and amortization of premium and accretion of discount on debt securities. Investment income is recorded net of foreign taxes withheld where recovery of such taxes is uncertain.
Expenses. Most expenses of the Trust can be directly attributed to a fund. Expenses which cannot be directly attributed are apportioned amongst each fund in the Trust. Expense estimates are accrued in the period to which they relate and adjustments are made when actual amounts are known.
Income Tax Information and Distributions to Shareholders. Each year the Fund intends to qualify as a regulated investment company, including distributing substantially all of its taxable income and realized gains under Subchapter M of the Internal Revenue Code and filing its U.S. federal tax return. As a result, no provision for income taxes is required. As of October 31, 2010, the Fund did not have any unrecognized tax benefits in the accompanying financial statements. A fund's federal tax return is subject to examination by the Internal Revenue Service (IRS) for a period of three years. Foreign taxes are provided for based on the Fund's understanding of the tax rules and rates that exist in the foreign markets in which it invests. The Fund is subject to a tax imposed on short term capital gains on securities of certain issuers domiciled in India. The Fund records an estimated deferred tax liability included in Other payables and accrued expenses in the accompanying Statement of Assets & Liabilities for net unrealized gains on these securities in an amount that would be payable if the securities were disposed of at period end.
Annual Report
3. Significant Accounting Policies - continued
Income Tax Information and Distributions to Shareholders - continued
Distributions are declared and recorded on the ex-dividend date. Income dividends and capital gain distributions are declared separately for each class. Income and capital gain distributions are determined in accordance with income tax regulations, which may differ from GAAP.
Capital accounts within the financial statements are adjusted for permanent book-tax differences. These adjustments have no impact on net assets or the results of operations. Temporary book-tax differences will reverse in a subsequent period.
Book-tax differences are primarily due to the short-term gain distributions from the Fidelity Central Funds, futures transactions, certain foreign taxes, foreign currency transactions, passive foreign investment companies (PFIC), capital loss carryforwards and losses deferred due to wash sales.
The federal tax cost of investment securities and unrealized appreciation (depreciation) as of period end were as follows:
Gross unrealized appreciation | $ 176,930,918 |
Gross unrealized depreciation | (111,385,171) |
Net unrealized appreciation (depreciation) | $ 65,545,747 |
| |
Tax Cost | $ 830,035,218 |
The tax-based components of distributable earnings as of period end were as follows:
Undistributed ordinary income | $ 30,617,208 |
Capital loss carryforward | $ (78,127,356) |
Net unrealized appreciation (depreciation) | $ 65,646,142 |
The tax character of distributions paid was as follows:
| October 31,
2010 | October 31,
2009 |
Ordinary Income | $ 17,692,151 | $ - |
Short-Term Trading (Redemption) Fees. Shares held by investors in the Fund less than 90 days are subject to a redemption fee equal to 2.00% of the net asset value of shares redeemed. All redemption fees, which reduce the proceeds of the shareholder redemption, are retained by the Fund and accounted for as an addition to paid in capital.
Annual Report
Notes to Financial Statements - continued
4. Operating Policies.
Delayed Delivery Transactions and When-Issued Securities. The Fund may purchase or sell securities on a delayed delivery or when-issued basis. Payment and delivery may take place after the customary settlement period for that security. The price of the underlying securities and the date when the securities will be delivered and paid for are fixed at the time the transaction is negotiated. During the time a delayed delivery sell is outstanding, the contract is marked-to-market daily and equivalent deliverable securities are held for the transaction. The securities purchased on a delayed delivery or when-issued basis are identified as such in the Fund's Schedule of Investments. The Fund may receive compensation for interest forgone in the purchase of a delayed delivery or when-issued security. With respect to purchase commitments, the Fund identifies securities as segregated in its records with a value at least equal to the amount of the commitment. Losses may arise due to changes in the value of the underlying securities or if the counterparty does not perform under the contract's terms, or if the issuer does not issue the securities due to political, economic, or other factors.
Restricted Securities. The Fund may invest in securities that are subject to legal or contractual restrictions on resale. These securities generally may be resold in transactions exempt from registration or to the public if the securities are registered. Disposal of these securities may involve time-consuming negotiations and expense, and prompt sale at an acceptable price may be difficult. Information regarding restricted securities is included at the end of the Fund's Schedule of Investments.
5. Derivative Instruments.
Risk Exposures and the Use of Derivative Instruments. The Fund uses derivative instruments (derivatives), including futures contracts, in order to meet its investment objectives. The strategy is to use derivatives to increase returns, to gain exposure to certain types of assets and to manage exposure to certain risks as defined below. The success of any strategy involving derivatives depends on analysis of numerous economic factors, and if the strategies for investment do not work as intended, the Fund may not achieve its objectives.
The Fund's use of derivatives may increase or decrease its exposure to the following risk:
Equity Risk | Equity risk relates to the fluctuations in the value of financial instruments as a result of changes in market prices (other than those arising from interest rate risk or foreign exchange risk), whether caused by factors specific to an individual investment, its issuer, or all factors affecting all instruments traded in a market or market segment. |
Annual Report
5. Derivative Instruments - continued
Risk Exposures and the Use of Derivative Instruments - continued
The Fund is also exposed to additional risks from investing in derivatives, such as liquidity risk and counterparty credit risk. Liquidity risk is the risk that the Fund will be unable to sell the derivative in the open market in a timely manner. Counterparty credit risk is the risk that the counterparty will not be able to fulfill its obligation to the Fund. The Fund's maximum risk of loss from counterparty credit risk is generally the aggregate unrealized appreciation and unpaid counterparty fees in excess of any collateral pledged by the counterparty to the Fund. Counterparty risk related to exchange-traded futures contracts is minimal because of the protection provided by the exchange on which they trade. Risk of loss may exceed the amounts recognized in the Statement of Assets and Liabilities.
Net Realized Gain (Loss) and Change in Net Unrealized Appreciation (Depreciation) on Derivatives. The table below, which reflects the impacts of derivatives on the financial performance of the Fund, summarizes the net realized gain (loss) and change in net unrealized appreciation (depreciation) for derivatives during the period.
Risk Exposure / Derivative Type | Net Realized
Gain (Loss) | Change in
Net Unrealized
Appreciation (Depreciation) |
Equity Risk | | |
Futures Contracts (a) | $ (1,268,507) | $ 53,183 |
(a) A summary of the value of derivatives by risk exposure as of period end, if any, is included at the end of the Schedule of Investments and is representative of activity for the period.
Futures Contracts. A futures contract is an agreement between two parties to buy or sell a specified underlying instrument for a fixed price at a specified future date. The Fund uses futures contracts to manage its exposure to the stock market.
Upon entering into a futures contract, a fund is required to deposit either cash or securities (initial margin) with a clearing broker in an amount equal to a certain percentage of the face value of the contract. Futures contracts are marked-to-market daily and subsequent payments (variation margin) are made or received by a fund depending on the daily fluctuations in the value of the futures contracts and are recorded as unrealized appreciation or (depreciation). Realized gain or (loss) is recorded upon the expiration or closing of a futures contract. The net realized gain (loss) and change in net unrealized appreciation (depreciation) on futures contracts during the period is included in the Statement of Operations.
Annual Report
Notes to Financial Statements - continued
5. Derivative Instruments - continued
Futures Contracts - continued
The underlying face amount at value of open futures contracts at period end is shown in the Schedule of Investments under the caption "Futures Contracts." This amount reflects each contract's exposure to the underlying instrument at period end. Securities deposited to meet initial margin requirements are identified in the Schedule of Investments. The receivable and/or payable for the variation margin are reflected in the Statement of Assets and Liabilities.
Certain risks may arise upon entering into futures contracts, including the risk that an illiquid market may limit the ability to close out a futures contract prior to settlement date.
6. Purchases and Sales of Investments.
Purchases and sales of securities, other than short-term securities, aggregated $476,133,271 and $487,415,757, respectively.
7. Fees and Other Transactions with Affiliates.
Management Fee. FMR and its affiliates provide the Fund with investment management related services for which the Fund pays a monthly management fee. The management fee is the sum of an individual fund fee rate that is based on an annual rate of .60% of the Fund's average net assets and a group fee rate that averaged .26% during the period. The group fee rate is based upon the average net assets of all the mutual funds advised by FMR. The group fee rate decreases as assets under management increase and increases as assets under management decrease. In addition, the management fee is subject to a performance adjustment (up to a maximum of ±.20% of the Fund's average net assets over a 36 month performance period). The upward or downward adjustment to the management fee is based on the relative investment performance of International Small Cap as compared to an appropriate benchmark index. For the period, the total annual management fee rate, including the performance adjustment, was 1.03% of the Fund's average net assets.
Distribution and Service Plan Fees. In accordance with Rule 12b-1 of the 1940 Act, the Fund has adopted separate Distribution and Service Plans for each class of shares. Certain classes pay Fidelity Distributors Corporation (FDC), an affiliate of FMR, separate Distribution and Service Fees, each of which is based on an annual percentage of each class' average net assets. In addition, FDC may pay financial intermediaries for selling shares of the Fund and providing shareholder support services. For the
Annual Report
7. Fees and Other Transactions with Affiliates - continued
Distribution and Service Plan Fees - continued
period, the Distribution and Service Fee rates, total fees and amounts retained by FDC were as follows:
| Distribution
Fee | Service
Fee | Total Fees | Retained
by FDC |
Class A | -% | .25% | $ 46,378 | $ 908 |
Class T | .25% | .25% | 77,108 | - |
Class B | .75% | .25% | 33,825 | 25,398 |
Class C | .75% | .25% | 97,426 | 5,162 |
| | | $ 254,737 | $ 31,468 |
Sales Load. FDC receives a front-end sales charge of up to 5.75% for selling Class A shares, and 3.50% for selling Class T shares, some of which is paid to financial intermediaries for selling shares of the Fund. FDC receives the proceeds of contingent deferred sales charges levied on Class A, Class T, Class B, and Class C redemptions. These charges depend on the holding period. The deferred sales charges range from 5% to 1% for Class B, 1% for Class C, 1.00% for certain purchases of Class A shares (1.00% to .50% prior to July 12, 2010) and .25% for certain purchases of Class T shares.
For the period, sales charge amounts retained by FDC were as follows:
| Retained
by FDC |
Class A | $ 5,297 |
Class T | 1,916 |
Class B* | 3,454 |
Class C* | 33 |
| $ 10,700 |
* When Class B and Class C shares are initially sold, FDC pays commissions from its own resources to financial intermediaries through which the sales are made.
Transfer Agent Fees. Fidelity Investments Institutional Operations Company, Inc. (FIIOC), an affiliate of FMR, is the transfer, dividend disbursing and shareholder servicing agent for each class of the Fund. FIIOC receives account fees and asset-based fees
Annual Report
Notes to Financial Statements - continued
7. Fees and Other Transactions with Affiliates - continued
Transfer Agent Fees - continued
that vary according to the account size and type of account of the shareholders of the respective classes of the Fund. FIIOC pays for typesetting, printing and mailing of shareholder reports, except proxy statements. For the period, transfer agent fees for each class were as follows:
| Amount | % of
Average
Net Assets |
Class A | $ 57,208 | .31 |
Class T | 48,466 | .31 |
Class B | 10,550 | .31 |
Class C | 27,486 | .28 |
International Small Cap | 2,013,385 | .29 |
Institutional Class | 10,795 | .22 |
| $ 2,167,890 | |
Accounting and Security Lending Fees. Fidelity Service Company, Inc. (FSC), an affiliate of FMR, maintains the Fund's accounting records. The accounting fee is based on the level of average net assets for the month. Under a separate contract, FSC administers the security lending program. The security lending fee is based on the number and duration of lending transactions.
Brokerage Commissions. The Fund placed a portion of its portfolio transactions with brokerage firms which are affiliates of the investment adviser. The commissions paid to these affiliated firms were $11 for the period.
8. Committed Line of Credit.
The Fund participates with other funds managed by FMR or an affiliate in a $3.75 billion credit facility (the "line of credit") to be utilized for temporary or emergency purposes to fund shareholder redemptions or for other short-term liquidity purposes. The Fund has agreed to pay commitment fees on its pro-rata portion of the line of credit, which amounted to $2,930 and is reflected in Miscellaneous expenses on the Statement of Operations. During the period, there were no borrowings on this line of credit.
Annual Report
9. Security Lending.
The Fund lends portfolio securities through a lending agent from time to time in order to earn additional income. The lending agent may loan securities to certain qualified borrowers, including Fidelity Capital Markets (FCM), a broker-dealer affiliated with the Fund. On the settlement date of the loan, the Fund receives collateral (in the form of U.S. Treasury obligations, letters of credit and/or cash) against the loaned securities and maintains collateral in an amount not less than 100% of the market value of the loaned securities during the period of the loan. The market value of the loaned securities is determined at the close of business of the Fund and any additional required collateral is delivered to the Fund on the next business day. If the borrower defaults on its obligation to return the securities loaned because of insolvency or other reasons, a fund could experience delays and costs in recovering the securities loaned or in gaining access to the collateral. Any cash collateral received is invested in the Fidelity Securities Lending Cash Central Fund. The value of loaned securities and cash collateral at period end are disclosed on the Fund's Statement of Assets and Liabilities. The value of securities loaned to FCM at period end was $280,736. Security lending income represents the income earned on investing cash collateral, less rebates paid to borrowers and lending agent fees associated with the loan, plus any premium payments received for lending certain types of securities. Security lending income is presented in the Statement of Operations as a component of income from Fidelity Central Funds and includes $792 from securities loaned to FCM.
10. Expense Reductions.
FMR voluntarily agreed to reimburse each class to the extent annual operating expenses exceeded certain levels of average net assets as noted in the table below. Some expenses, for example interest expense, including commitment fees, are excluded from this reimbursement.
The following classes were in reimbursement during the period:
| Expense
Limitations | Reimbursement
from adviser |
Class A | 1.65% | $ 11,149 |
Class T | 1.90% | 11,145 |
Class B | 2.40% | 2,441 |
Class C | 2.40% | 2,105 |
| | $ 26,840 |
Effective January 1, 2011 the expense limitations will be eliminated.
Many of the brokers with whom FMR places trades on behalf of the Fund provided services to the Fund in addition to trade execution. These services included payments of certain expenses on behalf of the Fund totaling $172,507 for the period.
Annual Report
Notes to Financial Statements - continued
11. Distributions to Shareholders.
Distributions to shareholders of each class were as follows:
Years ended October 31, | 2010 | 2009 |
From net investment income | | |
Class A | $ 59,453 | $ - |
Class T | 16,412 | - |
International Small Cap | 3,278,578 | - |
Institutional Class | 13,966 | - |
Total | $ 3,368,409 | $ - |
From net realized gain | | |
Class A | $ 354,632 | $ - |
Class T | 310,013 | - |
Class B | 60,241 | - |
Class C | 116,929 | - |
International Small Cap | 13,430,315 | - |
Institutional Class | 51,612 | - |
Total | $ 14,323,742 | $ - |
12. Share Transactions.
Transactions for each class of shares were as follows:
| Shares | Dollars |
Years ended October 31, | 2010 | 2009 | 2010 | 2009 |
Class A | | | | |
Shares sold | 380,659 | 269,227 | $ 6,723,746 | $ 3,575,375 |
Reinvestment of distributions | 22,435 | - | 393,061 | - |
Shares redeemed | (454,943) | (389,847) | (8,359,905) | (5,330,857) |
Net increase (decrease) | (51,849) | (120,620) | $ (1,243,098) | $ (1,755,482) |
Class T | | | | |
Shares sold | 143,286 | 158,075 | $ 2,532,790 | $ 2,173,778 |
Reinvestment of distributions | 18,371 | - | 319,658 | - |
Shares redeemed | (286,001) | (377,899) | (4,986,007) | (4,876,919) |
Net increase (decrease) | (124,344) | (219,824) | $ (2,133,559) | $ (2,703,141) |
Class B | | | | |
Shares sold | 14,694 | 8,564 | $ 256,700 | $ 108,038 |
Reinvestment of distributions | 3,302 | - | 56,465 | - |
Shares redeemed | (57,958) | (71,172) | (990,211) | (857,564) |
Net increase (decrease) | (39,962) | (62,608) | $ (677,046) | $ (749,526) |
Class C | | | | |
Shares sold | 430,838 | 21,018 | $ 7,671,593 | $ 275,491 |
Reinvestment of distributions | 6,001 | - | 102,910 | - |
Shares redeemed | (101,847) | (159,519) | (1,759,170) | (1,999,518) |
Net increase (decrease) | 334,992 | (138,501) | $ 6,015,333 | $ (1,724,027) |
Annual Report
12. Share Transactions - continued
Transactions for each class of shares were as follows: - continued
| Shares | Dollars |
Years ended October 31, | 2010 | 2009 | 2010 | 2009 |
International Small Cap | | | | |
Shares sold | 10,330,000 | 4,989,568 | $ 188,548,758 | $ 69,926,221 |
Reinvestment of distributions | 888,440 | - | 15,725,385 | - |
Shares redeemed | (10,371,667) | (11,303,255) | (183,663,034) | (144,001,202) |
Net increase (decrease) | 846,773 | (6,313,687) | $ 20,611,109 | $ (74,074,981) |
Institutional Class | | | | |
Shares sold | 288,839 | 28,026 | $ 5,178,797 | $ 355,084 |
Reinvestment of distributions | 2,890 | - | 51,087 | - |
Shares redeemed | (47,677) | (58,235) | (865,855) | (718,368) |
Net increase (decrease) | 244,052 | (30,209) | $ 4,364,029 | $ (363,284) |
13. Other.
The Fund's organizational documents provide former and current trustees and officers with a limited indemnification against liabilities arising in connection with the performance of their duties to the Fund. In the normal course of business, the Fund may also enter into contracts that provide general indemnifications. The Fund's maximum exposure under these arrangements is unknown as this would be dependent on future claims that may be made against the Fund. The risk of material loss from such claims is considered remote.
Annual Report
To the Trustees of Fidelity Investment Trust and Shareholders of Fidelity International Small Cap Fund:
We have audited the accompanying statement of assets and liabilities of Fidelity International Small Cap Fund (the Fund), a fund of Fidelity Investment Trust, including the schedule of investments, as of October 31, 2010, and the related statement of operations for the year then ended, the statement of changes in net assets for each of the two years in the period then ended, and the financial highlights for each of the five years in the period then ended. These financial statements and financial highlights are the responsibility of the Fund's management. Our responsibility is to express an opinion on these financial statements and financial highlights based on our audits.
We conducted our audits in accordance with standards of the Public Company Accounting Oversight Board (United States). Those standards require that we plan and perform the audit to obtain reasonable assurance about whether the financial statements and financial highlights are free of material misstatement. The Fund is not required to have, nor were we engaged to perform, an audit of its internal control over financial reporting. Our audits included consideration of internal control over financial reporting as a basis for designing audit procedures that are appropriate in the circumstances, but not for the purpose of expressing an opinion on the effectiveness of the Fund's internal control over financial reporting. Accordingly, we express no such opinion. An audit also includes examining, on a test basis, evidence supporting the amounts and disclosures in the financial statements, assessing the accounting principles used and significant estimates made by management, as well as evaluating the overall financial statement presentation. Our procedures included confirmation of securities owned as of October 31, 2010, by correspondence with the custodians and brokers; where replies were not received from brokers, we performed other auditing procedures. We believe that our audits provide a reasonable basis for our opinion.
In our opinion, the financial statements and financial highlights referred to above present fairly, in all material respects, the financial position of Fidelity International Small Cap Fund as of October 31, 2010, the results of its operations for the year then ended, the changes in its net assets for each of the two years in the period then ended, and the financial highlights for each of the five years in the period then ended, in conformity with accounting principles generally accepted in the United States of America.
/s/ Deloitte & Touche LLP
DELOITTE & TOUCHE LLP
Boston, Massachusetts
December 17, 2010
Annual Report
The Trustees, Member of the Advisory Board, and executive officers of the trust and fund, as applicable, are listed below. The Board of Trustees governs the fund and is responsible for protecting the interests of shareholders. The Trustees are experienced executives who meet periodically throughout the year to oversee the fund's activities, review contractual arrangements with companies that provide services to the fund, oversee management of the risks associated with such activities and contractual arrangements, and review the fund's performance. Except for James C. Curvey, each of the Trustees oversees 221 funds advised by FMR or an affiliate. Mr. Curvey oversees 410 funds advised by FMR or an affiliate.
The Trustees hold office without limit in time except that (a) any Trustee may resign; (b) any Trustee may be removed by written instrument, signed by at least two-thirds of the number of Trustees prior to such removal; (c) any Trustee who requests to be retired or who has become incapacitated by illness or injury may be retired by written instrument signed by a majority of the other Trustees; and (d) any Trustee may be removed at any special meeting of shareholders by a two-thirds vote of the outstanding voting securities of the trust. Each Trustee who is not an interested person (as defined in the 1940 Act) (Independent Trustee), shall retire not later than the last day of the calendar year in which his or her 72nd birthday occurs. The Independent Trustees may waive this mandatory retirement age policy with respect to individual Trustees. The executive officers and Advisory Board Member hold office without limit in time, except that any officer and Advisory Board Member may resign or may be removed by a vote of a majority of the Trustees at any regular meeting or any special meeting of the Trustees. Except as indicated, each individual has held the office shown or other offices in the same company for the past five years.
Experience, Skills, Attributes, and Qualifications of the Fund's Trustees. The Governance and Nominating Committee has adopted a statement of policy that describes the experience, qualifications, attributes, and skills that are necessary and desirable for potential Independent Trustee candidates (Statement of Policy). The Board believes that each Trustee satisfied at the time he or she was initially elected or appointed a Trustee, and continues to satisfy, the standards contemplated by the Statement of Policy. The Governance and Nominating Committee also engages professional search firms to help identify potential Independent Trustee candidates who have the experience, qualifications, attributes, and skills consistent with the Statement of Policy. From time to time, additional criteria based on the composition and skills of the current Independent Trustees, as well as experience or skills that may be appropriate in light of future changes to board composition, business conditions, and regulatory or other developments, have also been considered by the professional search firms and the Governance and Nominating Committee. In addition, the Board takes into account the Trustees' commitment and participation in Board and committee meetings, as well as their leadership of standing and ad hoc committees throughout their tenure.
In determining that a particular Trustee was and continues to be qualified to serve as a Trustee, the Board has considered a variety of criteria, none of which, in isolation, was controlling. The Board believes that, collectively, the Trustees have balanced and diverse experience, qualifications, attributes, and skills, which allow the Board to operate effectively in governing the fund and protecting the interests of shareholders. Information about the specific experience, skills, attributes, and qualifications of each Trustee, which in each case led to the Board's conclusion that the Trustee should serve (or continue to serve) as a trustee of the fund, is provided below.
Annual Report
Trustees and Officers - continued
Board Structure and Oversight Function. Edward C. Johnson 3d is an interested person (as defined in the 1940 Act) and currently serves as Chairman. The Trustees have determined that an interested Chairman is appropriate and benefits shareholders because an interested Chairman has a personal and professional stake in the quality and continuity of services provided to the fund. Independent Trustees exercise their informed business judgment to appoint an individual of their choosing to serve as Chairman, regardless of whether the Trustee happens to be independent or a member of management. The Independent Trustees have determined that they can act independently and effectively without having an Independent Trustee serve as Chairman and that a key structural component for assuring that they are in a position to do so is for the Independent Trustees to constitute a substantial majority for the Board. The Independent Trustees also regularly meet in executive session. Ned C. Lautenbach serves as Chairman of the Independent Trustees and as such (i) acts as a liaison between the Independent Trustees and management with respect to matters important to the Independent Trustees and (ii) with management prepares agendas for Board meetings.
Fidelity funds are overseen by different Boards of Trustees. The fund's Board oversees Fidelity's equity and high income funds and another Board oversees Fidelity's investment-grade bond, money market, and asset allocation funds. The asset allocation funds may invest in Fidelity funds overseen by the fund's Board. The use of separate Boards, each with its own committee structure, allows the Trustees of each group of Fidelity funds to focus on the unique issues of the funds they oversee, including common research, investment, and operational issues. On occasion, the separate Boards establish joint committees to address issues of overlapping consequences for the Fidelity funds overseen by each Board.
The Trustees operate using a system of committees to facilitate the timely and efficient consideration of all matters of importance to the Trustees, the fund, and fund shareholders and to facilitate compliance with legal and regulatory requirements and oversight of the fund's activities and associated risks. The Board, acting through its committees, has charged FMR and its affiliates with (i) identifying events or circumstances the occurrence of which could have demonstrably adverse effects on the fund's business and/or reputation; (ii) implementing processes and controls to lessen the possibility that such events or circumstances occur or to mitigate the effects of such events or circumstances if they do occur; and (iii) creating and maintaining a system designed to evaluate continuously business and market conditions in order to facilitate the identification and implementation processes described in (i) and (ii) above. Because the day-to-day operations and activities of the fund are carried out by or through FMR, its affiliates and other service providers, the fund's exposure to risks is mitigated but not eliminated by the processes overseen by the Trustees. While each of the Board's committees has responsibility for overseeing different aspects of the fund's activities, oversight is exercised primarily through the Operations, Audit, and Compliance Committees. Appropriate personnel, including but not limited to the fund's Chief Compliance Officer (CCO), FMR's internal auditor, the independent accountants, the fund's Treasurer and portfolio management personnel, make periodic reports to the Board's committees, as appropriate. The responsibilities of each committee, including their oversight responsibilities, are described further under "Standing Committees of the Fund's Trustees."
Annual Report
The fund's Statement of Additional Information (SAI) includes more information about the Trustees. To request a free copy, call Fidelity at 1-877-208-0098.
Interested Trustees*:
Correspondence intended for each Trustee who is an interested person may be sent to Fidelity Investments, 82 Devonshire Street, Boston, Massachusetts 02109.
Name, Age; Principal Occupations and Other Relevant Experience+ |
Edward C. Johnson 3d (80) |
| Year of Election or Appointment: 1984 Mr. Johnson is Trustee and Chairman of the Board of Trustees of certain Trusts. Mr. Johnson serves as Chief Executive Officer, Chairman, and a Director of FMR LLC; Chairman and a Director of FMR; Chairman and a Director of Fidelity Research & Analysis Company (FRAC); Chairman and a Director of Fidelity Investments Money Management, Inc.; and Chairman and a Director of FMR Co., Inc. In addition, Mr. Johnson serves as Chairman and Director of FIL Limited. Previously, Mr. Johnson served as President of FMR LLC (2006-2007). |
James C. Curvey (75) |
| Year of Election or Appointment: 2007 Mr. Curvey also serves as Trustee (2007-present) of other investment companies advised by FMR. Mr. Curvey is a Director of Fidelity Investments Money Management, Inc. (2009-present), Director of Fidelity Research & Analysis Co. (2009-present) and Director of FMR and FMR Co., Inc. (2007-present). Mr. Curvey is also Vice Chairman (2007-present) and Director of FMR LLC. In addition, Mr. Curvey serves as an Overseer for the Boston Symphony Orchestra and a member of the Trustees of Villanova University. Previously, Mr. Curvey was the Vice Chairman (2006-2007) and Director (2000-2007) of FMR Corp. |
* Trustees have been determined to be "Interested Trustees" by virtue of, among other things, their affiliation with the trust or various entities under common control with FMR.
+ The information above includes each Trustee's principal occupation during the last five years and other information relating to the experience, attributes, and skills relevant to each Trustee's qualifications to serve as a Trustee, which led to the conclusion that each Trustee should serve as a Trustee for the fund.
Independent Trustees:
Correspondence intended for each Independent Trustee (that is, the Trustees other than the Interested Trustees) may be sent to Fidelity Investments, P.O. Box 55235, Boston, Massachusetts 02205-5235.
Name, Age; Principal Occupations and Other Relevant Experience+ |
Dennis J. Dirks (62) |
| Year of Election or Appointment: 2005 Prior to his retirement in May 2003, Mr. Dirks was Chief Operating Officer and a member of the Board of The Depository Trust & Clearing Corporation (DTCC). He also served as President, Chief Operating Officer, and Board member of The Depository Trust Company (DTC) and President and Board member of the National Securities Clearing Corporation (NSCC). In addition, Mr. Dirks served as Chief Executive Officer and Board member of the Government Securities Clearing Corporation, Chief Executive Officer and Board member of the Mortgage-Backed Securities Clearing Corporation, as a Trustee and a member of the Finance Committee of Manhattan College (2005-2008), and as a Trustee and a member of the Finance Committee of AHRC of Nassau County (2006-2008). Mr. Dirks is a member of the Independent Directors Council (IDC) Governing Council (2010-Present) and Board of Directors for The Brookville Center for Children's Services, Inc. (2009-present). |
Alan J. Lacy (57) |
| Year of Election or Appointment: 2008 Mr. Lacy serves as Senior Adviser (2007-present) of Oak Hill Capital Partners, L.P. (private equity). Mr. Lacy also served as Chief Executive Officer (2000-2005) and Vice Chairman (2005-2006) of Sears Holdings Corporation and Sears, Roebuck and Co. (retail). In addition, Mr. Lacy serves as a member of the Board of Directors of The Western Union Company (global money transfer, 2006-present) and Bristol-Myers Squibb Company (global pharmaceuticals, 2007-present). Mr. Lacy is Chairman (2008-present) and a member (2006-present) of the Board of Trustees of The National Parks Conservation Association. |
Ned C. Lautenbach (66) |
| Year of Election or Appointment: 2000 Mr. Lautenbach is Chairman of the Independent Trustees of the Equity and High Income Funds (2006-present). Mr. Lautenbach currently serves as the Lead Director of the Eaton Corporation Board of Directors (diversified industrial, 1997-present). Mr. Lautenbach is also a member of the Board of Directors of the Philharmonic Center for the Arts in Naples, Florida (1999-present); a member of the Board of Trustees of Fairfield University (2005-present); and a member of the Council on Foreign Relations (1994-present). Previously, Mr. Lautenbach was a Partner/Advisory Partner at Clayton, Dubilier & Rice, Inc. (private equity investment, 1998-2010), as well as a Director of Sony Corporation (2006-2007). |
Joseph Mauriello (66) |
| Year of Election or Appointment: 2008 Prior to his retirement in January 2006, Mr. Mauriello served in numerous senior management positions including Deputy Chairman and Chief Operating Officer (2004-2005), and Vice Chairman of Financial Services (2002-2004) of KPMG LLP US (professional services, 1965-2005). Mr. Mauriello currently serves as a member of the Board of Directors of XL Group plc. (global insurance and re-insurance, 2006-present) and of Arcadia Resources Inc. (health care services and products, 2007-present). Previously, Mr. Mauriello served as a Director of the Hamilton Funds of the Bank of New York (2006-2007). |
Cornelia M. Small (66) |
| Year of Election or Appointment: 2005 Ms. Small is a member of the Board of Directors of the Teagle Foundation (2009-present). Ms. Small is also a member of the Investment Committee, and Chair (2008-present) and a member of the Board of Trustees of Smith College. In addition, Ms. Small serves on the Investment Committee of the Berkshire Taconic Community Foundation (2008-present). Previously, Ms. Small served as Chairperson of the Investment Committee (2002-2008) of Smith College. In addition, Ms. Small served as Chief Investment Officer, Director of Global Equity Investments, and a member of the Board of Directors of Scudder, Stevens & Clark and Scudder Kemper Investments. |
William S. Stavropoulos (71) |
| Year of Election or Appointment: 2001 Mr. Stavropoulos is Vice Chairman of the Independent Trustees of the Equity and High Income Funds (2006-present). Mr. Stavropoulos serves as President and Founder of the Michigan Baseball Foundation, the Great Lakes Loons (2007-present). Mr. Stavropoulos is Chairman Emeritus of the Board of Directors of The Dow Chemical Company, where he previously served in numerous senior management positions, including President, CEO (1995-2000; 2002-2004), Chairman of the Executive Committee (2000-2006), and as a member of the Board of Directors (1990-2006). Currently, Mr. Stavropoulos is Chairman of Univar (global distributor of commodity and specialty chemicals, 2010-present), a Director of Teradata Corporation (data warehousing and technology solutions, 2008-present), Chemical Financial Corporation, Maersk Inc. (industrial conglomerate), Tyco International, Inc. (multinational manufacturing and services, 2007-present), and a member of the Advisory Board for Metalmark Capital (private equity investment, 2005-present). Mr. Stavropoulos is a special advisor to Clayton, Dubilier & Rice, Inc. (private equity investment). In addition, Mr. Stavropoulos is a member of the University of Notre Dame Advisory Council for the College of Science. |
David M. Thomas (61) |
| Year of Election or Appointment: 2008 Previously, Mr. Thomas served as Executive Chairman (2005-2006) and Chairman and Chief Executive Officer (2000-2005) of IMS Health, Inc. (pharmaceutical and healthcare information solutions). In addition, Mr. Thomas serves as a member of the Board of Directors of Fortune Brands, Inc. (consumer products), and Interpublic Group of Companies, Inc. (marketing communication, 2004-present). |
Michael E. Wiley (60) |
| Year of Election or Appointment: 2008 Mr. Wiley also serves as a Director of Asia Pacific Exploration Consolidated (international oil and gas exploration and production, 2008-present). Mr. Wiley serves as a Director of Tesoro Corporation (independent oil refiner and marketer, 2005-present), and a Director of Bill Barrett Corporation (exploration and production, 2005-present). In addition, Mr. Wiley also serves as a Director of Post Oak Bank (privately-held bank, 2004-present). Previously, Mr. Wiley served as a member of the Board of Trustees of the University of Tulsa (2000-2006; 2007-2010), as a Senior Energy Advisor of Katzenbach Partners, LLC (consulting, 2006-2007), as an Advisory Director of Riverstone Holdings (private investment), Chairman, President, and CEO of Baker Hughes, Inc. (oilfield services, 2000-2004), and as Director of Spinnaker Exploration Company (exploration and production, 2001-2005). |
+ The information above includes each Trustee's principal occupation during the last five years and other information relating to the experience, attributes, and skills relevant to each Trustee's qualifications to serve as a Trustee, which led to the conclusion that each Trustee should serve as a Trustee for the fund.
Advisory Board Member and Executive Officers:
Correspondence intended for each executive officer and Peter S. Lynch may be sent to Fidelity Investments, 82 Devonshire Street, Boston, Massachusetts 02109.
Name, Age; Principal Occupation |
Peter S. Lynch (66) |
| Year of Election or Appointment: 2003 Member of the Advisory Board of Fidelity's Equity and High Income Funds. Mr. Lynch is Vice Chairman and a Director of FMR and FMR Co., Inc. In addition, Mr. Lynch serves as a Trustee of Boston College and as the Chairman of the Inner-City Scholarship Fund. Previously, Mr. Lynch served on the Special Olympics International Board of Directors (1997-2006). |
Kenneth B. Robins (41) |
| Year of Election or Appointment: 2008 President and Treasurer of Fidelity's Equity and High Income Funds. Mr. Robins also serves as President and Treasurer (2010-present) and Assistant Treasurer (2009-present) of other Fidelity funds and is an employee of Fidelity Investments (2004-present). Previously, Mr. Robins served as Deputy Treasurer of the Fidelity funds (2005-2008) and Treasurer and Chief Financial Officer of The North Carolina Capital Management Trust: Cash and Term Portfolios (2006-2008). |
Brian B. Hogan (46) |
| Year of Election or Appointment: 2009 Vice President of certain Equity Funds and Vice President of Sector Funds. Mr. Hogan also serves as President of FMR's Equity Division (2009-present). Previously, Mr. Hogan served as Senior Vice President, Equity Research of FMR (2006-2009) and as a portfolio manager. |
Thomas C. Hense (46) |
| Year of Election or Appointment: 2008 or 2010 Vice President of Fidelity's High Income (2008), Small Cap (2008), and Value (2010) Funds. Previously, Mr. Hense served as a portfolio manager for Fidelity's Institutional Money Management Group (Pyramis) (2003-2008). |
Scott C. Goebel (42) |
| Year of Election or Appointment: 2008 Secretary and Chief Legal Officer (CLO) of the Fidelity funds. Mr. Goebel also serves as Secretary and CLO of The North Carolina Capital Management Trust: Cash and Term Portfolio (2008-present); General Counsel, Secretary, and Senior Vice President of FMR (2008-present) and FMR Co., Inc. (2008-present); Deputy General Counsel of FMR LLC; Chief Legal Officer of Fidelity Management & Research (Hong Kong) Limited (2008-present) and Assistant Secretary of Fidelity Management & Research (Japan) Inc. (2008-present), Fidelity Investments Money Management, Inc. (2008-present), Fidelity Management & Research (U.K.) Inc. (2008-present), and Fidelity Research and Analysis Company (2008-present). Previously, Mr. Goebel served as Assistant Secretary of the Funds (2007-2008) and as Vice President and Secretary of Fidelity Distributors Corporation (FDC) (2005-2007). |
William C. Coffey (41) |
| Year of Election or Appointment: 2009 Assistant Secretary of Fidelity's Equity and High Income Funds. Mr. Coffey also serves as Senior Vice President and Deputy General Counsel of FMR LLC (2010-present), and is an employee of Fidelity Investments. Previously, Mr. Coffey served as Vice President and Associate General Counsel of FMR LLC (2005-2009). |
Holly C. Laurent (56) |
| Year of Election or Appointment: 2008 Anti-Money Laundering (AML) Officer of the Fidelity funds. Ms. Laurent also serves as AML Officer of The North Carolina Capital Management Trust: Cash and Term Portfolio (2008-present) and is an employee of Fidelity Investments. Previously, Ms. Laurent was Senior Vice President and Head of Legal for Fidelity Business Services India Pvt. Ltd. (2006-2008), and Senior Vice President, Deputy General Counsel and Group Head for FMR LLC (2005-2006). |
Christine Reynolds (52) |
| Year of Election or Appointment: 2008 Chief Financial Officer of the Fidelity funds. Ms. Reynolds became President of Fidelity Pricing and Cash Management Services (FPCMS) in August 2008. Ms. Reynolds served as Chief Operating Officer of FPCMS (2007-2008). Previously, Ms. Reynolds served as President, Treasurer, and Anti-Money Laundering officer of the Fidelity funds (2004-2007). |
Kenneth A. Rathgeber (63) |
| Year of Election or Appointment: 2004 Chief Compliance Officer of Fidelity's Equity and High Income Funds. Mr. Rathgeber is Chief Compliance Officer of Fidelity Management & Research (Hong Kong) Limited (2008-present), Fidelity Management & Research (Japan) Inc. (2008-present), FMR (2005-present), FMR Co., Inc. (2005-present), Fidelity Management & Research (U.K.) Inc. (2005-present), Fidelity Research & Analysis Company (2005-present), Fidelity Investments Money Management, Inc. (2005-present), Pyramis Global Advisors, LLC (2005-present), and Strategic Advisers, Inc. (2005-present). |
Jeffrey S. Christian (49) |
| Year of Election or Appointment: 2009 Deputy Treasurer of the Fidelity funds. Mr. Christian is an employee of Fidelity Investments. Previously, Mr. Christian served as Chief Financial Officer (2008-2009) of certain Fidelity funds and Senior Vice President of Fidelity Pricing and Cash Management Services (FPCMS) (2004-2009). |
Bryan A. Mehrmann (49) |
| Year of Election or Appointment: 2005 Deputy Treasurer of the Fidelity funds. Mr. Mehrmann is an employee of Fidelity Investments. |
Adrien E. Deberghes (43) |
| Year of Election or Appointment: 2008 Deputy Treasurer of Fidelity's Equity and High Income Funds. Mr. Deberghes also serves as Assistant Treasurer of other Fidelity funds (2010-present) and is an employee of Fidelity Investments (2008-present). Previously, Mr. Deberghes served as Senior Vice President of Mutual Fund Administration at State Street Corporation (2007-2008), Senior Director of Mutual Fund Administration at Investors Bank & Trust (2005-2007), and Director of Finance for Dunkin' Brands (2000-2005). |
Stephanie J. Dorsey (41) |
| Year of Election or Appointment: 2010 Assistant Treasurer of Fidelity's Equity and High Income Funds. Ms. Dorsey also serves as Deputy Treasurer of other Fidelity funds (2008-present) and is an employee of Fidelity Investments (2008-present). Previously, Ms. Dorsey served as Treasurer (2004-2008) of the JPMorgan Mutual Funds and Vice President (2004-2008) of JPMorgan Chase Bank. |
John R. Hebble (52) |
| Year of Election or Appointment: 2009 Assistant Treasurer of Fidelity's Equity and High Income Funds. Mr. Hebble also serves as Treasurer and Chief Financial Officer of The North Carolina Capital Management Trust: Cash and Term Portfolio (2008-present), President and Treasurer of other Fidelity funds (2008-present) and is an employee of Fidelity Investments. |
Gary W. Ryan (52) |
| Year of Election or Appointment: 2005 Assistant Treasurer of the Fidelity funds. Mr. Ryan is an employee of Fidelity Investments. Previously, Mr. Ryan served as Vice President of Fund Reporting in Fidelity Pricing and Cash Management Services (FPCMS) (1999-2005). |
Jonathan Davis (42) |
| Year of Election or Appointment: 2010 Assistant Treasurer of the Fidelity funds. Mr. Davis is an employee of Fidelity Investments. Previously, Mr. Davis served as Vice President and Associate General Counsel of FMR LLC (2003-2010). |
Annual Report
The Board of Trustees of Advisor International Small Cap Fund voted to pay to shareholders of record at the opening of business on record date, the following distributions per share derived from capital gains realized from sales of portfolio securities, and dividends derived from net investment income:
| Pay Date | Record Date | Dividends | Capital Gains |
Class A | 12/06/10 | 12/03/10 | $0.016 | $0.661 |
Class T | 12/06/10 | 12/03/10 | $0.000 | $0.627 |
Class B | 12/06/10 | 12/03/10 | $0.000 | $0.521 |
Class C | 12/06/10 | 12/03/10 | $0.000 | $0.591 |
The amounts per share which represent income derived from sources within, and taxes paid to, foreign countries or possessions of the United States are as follows:
| Pay Date | Income | Taxes |
Class A | 12/7/09 | $0.153 | $0.0141 |
Class T | 12/7/09 | $0.138 | $0.0141 |
Class B | 12/7/09 | $0.111 | $0.0141 |
Class C | 12/7/09 | $0.117 | $0.0141 |
The fund will notify shareholders in January 2011 of amounts for use in preparing 2010 income tax returns.
Annual Report
Board Approval of Investment Advisory Contracts and Management Fees
Fidelity International Small Cap Fund
Each year, the Board of Trustees, including the Independent Trustees (together, the Board), votes on the renewal of the management contract and sub-advisory agreements (together, the Advisory Contracts) for the fund. The Board, assisted by the advice of fund counsel and Independent Trustees' counsel, requests and considers a broad range of information relevant to the renewal of the Advisory Contracts throughout the year.
The Board meets regularly and considers at each of its meetings factors that are relevant to its annual consideration of the renewal of the fund's Advisory Contracts, including the services and support provided to the fund and its shareholders. The Board has established various standing committees, each composed of Independent Trustees with varying backgrounds, to which the Board has assigned specific subject matter responsibilities in order to enhance effective decision-making by the Board. The Board, acting directly and through its Committees, requests and receives information concerning the annual consideration of the renewal of the fund's Advisory Contracts. The Board also meets as needed to consider matters specifically related to the Board's annual consideration of the renewal of Advisory Contracts. Members of the Board may also meet with trustees of other Fidelity funds through ad hoc joint committees to discuss certain matters relevant to the Fidelity funds.
At its July 2010 meeting, the Board of Trustees, including the Independent Trustees, unanimously determined to renew the fund's Advisory Contracts. In reaching its determination, the Board considered all factors it believed relevant, including (i) the nature, extent, and quality of the services to be provided to the fund and its shareholders (including the investment performance of the fund); (ii) the competitiveness of the fund's management fee and total expenses; (iii) the total costs of the services to be provided by and the profits to be realized by Fidelity from its relationship with the fund; (iv) the extent to which economies of scale would be realized as the fund grows; and (v) whether fee levels reflect these economies of scale, if any, for the benefit of fund shareholders.
In considering whether to renew the Advisory Contracts for the fund, the Board reached a determination, with the assistance of fund counsel and Independent Trustees' counsel and through the exercise of its business judgment, that the renewal of the Advisory Contracts is in the best interests of fund shareholders and that the compensation to be received by Fidelity under the management contract is fair and reasonable. The Board's decision to renew the Advisory Contracts was not based on any single factor noted above, but rather was based on a comprehensive consideration of all the information provided to the Board at its meetings throughout the year. The Board, in reaching its determination to renew the Advisory Contracts, is aware that shareholders in the fund have a broad range of investment choices available to them, including a wide choice among mutual funds offered by Fidelity's competitors, and that the fund's shareholders, with the opportunity to review and weigh the disclosure provided by the fund in its prospectus and other public disclosures, have chosen to invest in this fund, managed by Fidelity.
Annual Report
Nature, Extent, and Quality of Services Provided. The Board considered the staffing within the investment adviser, FMR, and the sub-advisers (together, the Investment Advisers), including the backgrounds of the fund's investment personnel and the fund's investment objective and discipline. The Independent Trustees also had discussions with senior management of Fidelity's investment operations and investment groups. The Board considered the structure of the portfolio manager compensation program and whether this structure provides appropriate incentives to act in the best interest of the fund.
Resources Dedicated to Investment Management and Support Services. The Board and the equity research subcommittee of the Board's Fund Oversight Committee reviewed the size, education, and experience of the Investment Advisers' investment staff, their use of technology, and the Investment Advisers' approach to recruiting, training, and retaining portfolio managers and other research, advisory, and management personnel. The Board noted that Fidelity's analysts have access to a variety of technological tools and market and securities data that enable them to perform both fundamental and quantitative analysis and to specialize in various disciplines. The Board considered Fidelity's extensive global research capabilities that enable the Investment Advisers to aggregate data from various sources in an effort to produce positive investment results. The Board also considered that Fidelity's portfolio managers and analysts have access to daily portfolio attribution that allows for monitoring of a fund's portfolio, as well as an electronic communication system that provides immediate real-time access to research concerning issuers and credit enhancers. The Board noted FMR's continued focus on strengthening the organization and discipline of equity portfolio management and research.
Shareholder and Administrative Services. The Board considered (i) the nature, extent, quality, and cost of advisory, administrative, and shareholder services performed by the Investment Advisers and their affiliates under the Advisory Contracts and under separate agreements covering transfer agency, pricing and bookkeeping, and securities lending services for the fund; (ii) the nature and extent of the investment adviser's supervision of third party service providers, principally custodians and subcustodians; and (iii) the resources devoted to, and the record of compliance with, the fund's compliance policies and procedures. The Board also reviewed the allocation of fund brokerage, including allocations to brokers affiliated with the Investment Advisers, the use of brokerage commissions to pay fund expenses, and the use of "soft" commission dollars to pay for research services.
The Board noted that the growth of fund assets over time across the complex allows Fidelity to reinvest in the development of services designed to enhance the value or convenience of the Fidelity funds as investment vehicles. These services include 24-hour access to account information and market information through phone representatives and over the Internet, and investor education materials and asset allocation tools.
Annual Report
Board Approval of Investment Advisory Contracts and
Management Fees - continued
Investment in a Large Fund Family. The Board considered the benefits to shareholders of investing in a Fidelity fund, including the benefits of investing in a fund that is part of a large family of funds offering a variety of investment disciplines and providing a large variety of mutual fund investor services. The Board noted that Fidelity had taken, or had made recommendations that resulted in the Fidelity funds taking, a number of actions over the previous year that benefited particular funds, including (i) dedicating additional resources to investment research and restructuring and broadening the focus of the investment research teams; (ii) bolstering the senior management team that oversees asset management; (iii) launching Class F of certain funds as a lower-fee class available to Freedom K and Freedom Index Funds; (iv) lowering the initial investment minimums and ongoing balance requirements for Real Estate High Income Fund; (v) eliminating subsequent purchase minimums for all funds and adding a waiver of the investment minimum requirement for new accounts opened with the proceeds of a systematic withdrawal plan; (vi) eliminating the withdrawal minimum and maximum limits for systematic withdrawals from Advisor funds; (vii) expanding sales load waivers on Class A shares for Destiny Planholders and expanding Institutional Class eligibility for Class O Destiny Planholders; and (viii) changing certain Class A and Class T sales charge structures to further align them with industry practices.
Investment Performance. The Board considered whether the fund has operated in accordance with its investment objective, as well as its record of compliance with its investment restrictions. It also reviewed the fund's absolute investment performance for each class, as well as the fund's relative investment performance for each class measured over multiple periods against (i) a broad-based securities market index, and (ii) a peer group of mutual funds deemed appropriate by Fidelity and reviewed by the Board. The following charts considered by the Board show, over the one-, three-, and five-year periods ended December 31, 2009, the cumulative total returns of Institutional Class (Class I) and Class B of the fund, the cumulative total returns of a broad-based securities market index ("benchmark"), and a range of cumulative total returns of a peer group of mutual funds identified by Lipper Inc. as having an investment objective similar to that of the fund. The returns of Institutional Class (Class I) and Class B show the performance of the highest and lowest performing classes, respectively (based on five-year performance). The box within each chart shows the 25th percentile return (bottom of box) and the 75th percentile return (top of box) of the peer group. Returns shown above the box are in the first quartile and returns shown below the box are in the fourth quartile. The percentage beaten numbers noted below each chart correspond to the percentile box and represent the percentage of funds in the peer group whose performance was equal to or lower than that of the class indicated.
Annual Report
Fidelity International Small Cap Fund

The Board reviewed the fund's relative investment performance against its peer group and noted that the performance of Institutional Class (Class I) of the fund was in the third quartile for the one-year period, the first quartile for the three-year period, and the second quartile for the five-year period. The Board also noted that the investment performance of Institutional Class (Class I) of the fund compared favorably to its benchmark for the three- and five-year periods, although the fund's one-year cumulative total return was lower than its benchmark. The Board considered that the variations in performance among the fund's classes reflect the variations in class expenses, which result in lower performance for higher expense classes. The Board also reviewed the fund's performance since inception as well as performance in the current year.
The Board also considered that the fund's management fee is subject to upward or downward adjustment depending upon whether, and to what extent, the fund's investment performance for the performance period exceeds, or is exceeded by, the record (over the same period) of a Board-approved performance adjustment index. The Board realizes that the performance adjustment provides FMR with a strong economic incentive to seek to achieve superior performance for the fund's shareholders and helps to more closely align the interests of FMR and the fund's shareholders.
Based on its review, and giving particular weight to the nature and quality of the resources dedicated by the Investment Advisers to maintain and improve relative performance and factoring in the unprecedented market events in recent years, the Board concluded that the nature, extent, and quality of investment management and support services and of shareholder and administrative services provided to the fund will benefit the fund's shareholders, particularly in light of the Board's view that the fund's shareholders benefit from investing in a fund that is part of a large family of funds offering a variety of investment disciplines and services.
Annual Report
Board Approval of Investment Advisory Contracts and
Management Fees - continued
Competitiveness of Management Fee and Total Fund Expenses. The Board considered the fund's management fee and total expenses compared to "mapped groups" of competitive funds and classes. Fidelity creates "mapped groups" by combining similar Lipper investment objective categories that have comparable management fee characteristics. Combining Lipper investment objective categories aids the Board's management fee and total expense comparisons by broadening the competitive group used for comparison and by reducing the number of universes to which various Fidelity funds are compared.
Management Fee. The Board considered two proprietary management fee comparisons for the 12-month periods shown in the chart below. The group of Lipper funds used by the Board for management fee comparisons is referred to below as the "Total Mapped Group." The Total Mapped Group is broader than the Lipper peer group used by the Board for performance comparisons because the Total Mapped Group combines several Lipper investment objective categories while the Lipper peer group does not. The Total Mapped Group comparison focuses on a fund's standing relative to the total universe of comparable funds available to investors, in terms of gross management fees before expense reimbursements or caps, and without giving effect to the fund's performance adjustment. "TMG %" represents the percentage of funds in the Total Mapped Group that had management fees that were lower than the fund's. For example, a TMG % of 19% means that 81% of the funds in the Total Mapped Group had higher management fees than the fund. The "Asset-Size Peer Group" (ASPG) comparison focuses on a fund's standing relative to non-Fidelity funds similar in size to the fund within the Total Mapped Group. The ASPG represents at least 15% of the funds in the Total Mapped Group with comparable asset size and management fee characteristics, subject to a minimum of 50 funds (or all funds in the Total Mapped Group if fewer than 50). Additional information, such as the ASPG quartile in which the fund's management fee ranked and the impact of the fund's performance adjustment, is also included in the chart and considered by the Board.
Annual Report
Fidelity International Small Cap Fund
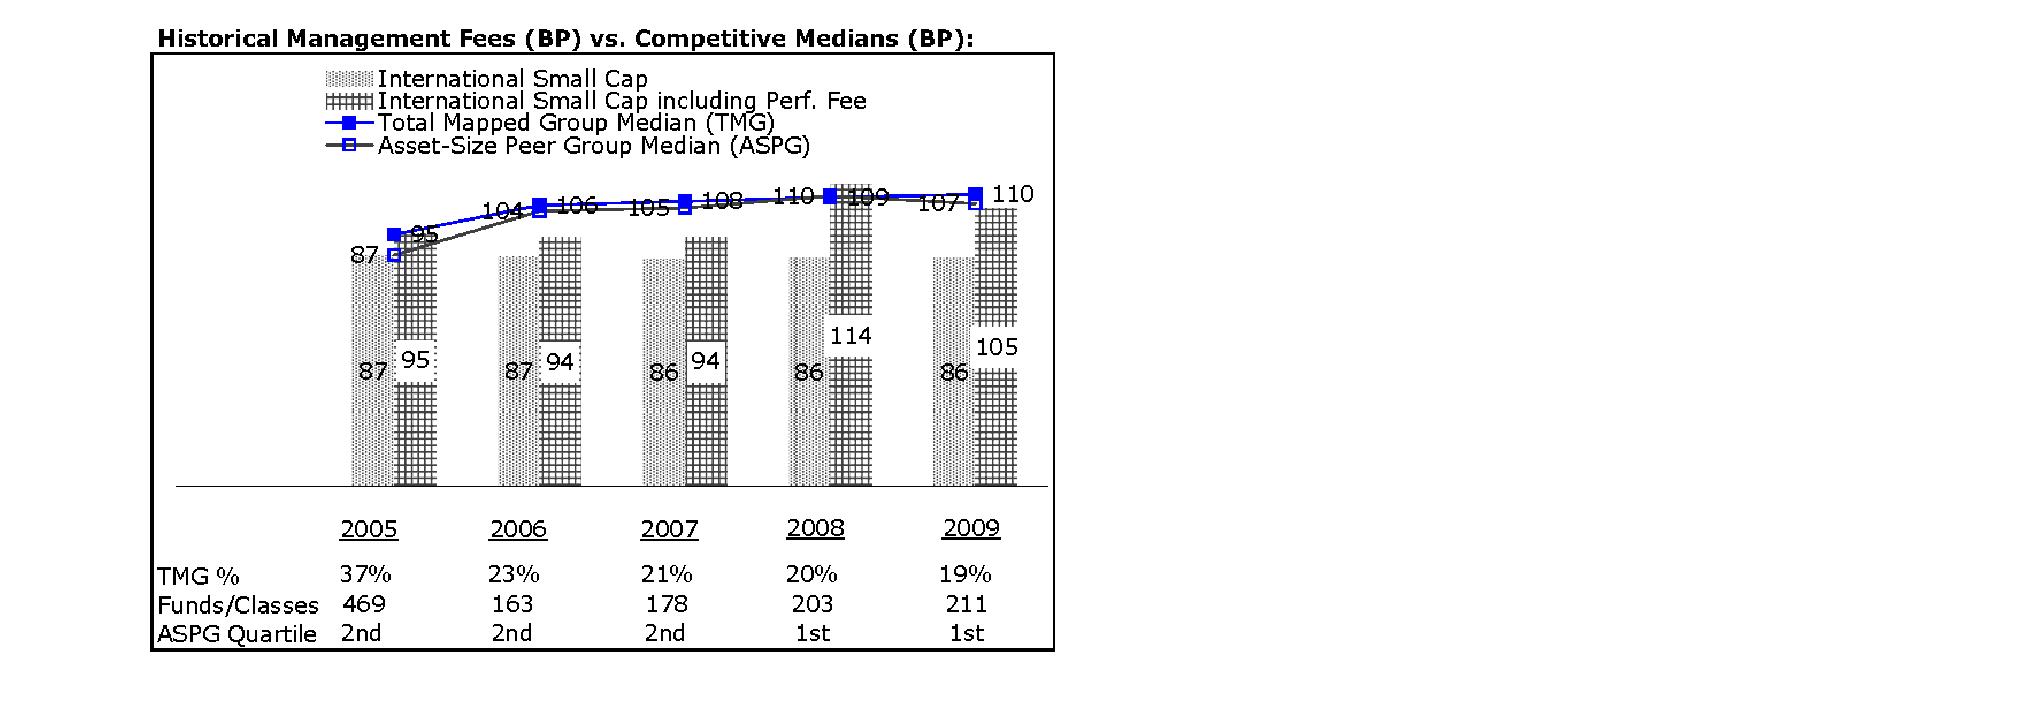
The Board noted that the fund's management fee ranked below the median of its Total Mapped Group and below the median of its ASPG for 2009. The Board also noted the effect of the fund's positive performance adjustment on the fund's management fee ranking. The Board noted that the performance adjustment for each year represents calculations for performance periods that differ from the periods shown in the performance charts above.
Based on its review, the Board concluded that the fund's management fee is fair and reasonable in light of the services that the fund receives and the other factors considered.
Total Expenses. In its review of each class's total expenses, the Board considered the fund's management fee as well as other fund or class expenses, as applicable, such as transfer agent fees, pricing and bookkeeping fees, fund-paid 12b-1 fees, and custodial, legal, and audit fees. The Board also noted the effects of any waivers and reimbursements on fees and expenses, as well as the impact of the fund's performance adjustment. As part of its review, the Board also considered current and historical total expenses of each class of the fund compared to competitive fund median expenses. Each class of the fund is compared to those funds and classes in the Total Mapped Group (used by the Board for management fee comparisons) that have a similar sales load structure.
The Board noted that the total expenses of each of Class A, Class B, Class C, and the retail class ranked below its competitive median for 2009, the total expenses of Institutional Class ranked equal to its competitive median for 2009, and the total expenses of Class T ranked above its competitive median for 2009. The Board considered that the total expenses for Class T were above the median primarily because its 12b-1 fee is higher than the typical front-end load class. The Board noted that the fund offers multiple classes, each of which has a different sales load and 12b-1 fee structure, and that the multiple structures are intended to offer a range of pricing options for the intermediary market. The Board also noted that the total expenses of the classes vary primarily by the level of their 12b-1 fees, although differences in transfer agent fees may also cause expenses to vary from class to class.
Annual Report
Board Approval of Investment Advisory Contracts and
Management Fees - continued
Fees Charged to Other Fidelity Clients. The Board also considered Fidelity fee structures and other information with respect to clients of FMR and its affiliates, such as other mutual funds advised or subadvised by FMR or its affiliates, pension plan clients, and other institutional clients. In March 2010, the Board created an ad hoc joint committee with the board of other Fidelity funds (the Committee) to review and compare Fidelity's institutional investment advisory business with its business of providing services to the Fidelity funds, including the differences in services provided, fees charged, and costs incurred, as well as competition in their respective marketplaces.
Based on its review of total expenses and fees charged to other Fidelity clients, the Board concluded that the total expenses of each class of the fund were reasonable, although in one case above the median of the universe presented for comparison, in light of the services that the fund and its shareholders receive and the other factors considered, including the findings of the Committee.
Costs of the Services and Profitability. The Board considered the revenues earned and the expenses incurred by Fidelity in conducting the business of developing, marketing, distributing, managing, administering and servicing the fund and its shareholders. The Board also considered the level of Fidelity's profits in respect of all the Fidelity funds.
On an annual basis, FMR presents to the Board Fidelity's profitability for the fund. Fidelity calculates the profitability for each fund, as well as aggregate profitability for groups of Fidelity funds and all Fidelity funds, using a series of detailed revenue and cost allocation methodologies which originate with the audited books and records of Fidelity. The Audit Committee of the Board reviews any significant changes from the prior year's methodologies.
PricewaterhouseCoopers LLP (PwC), independent registered public accounting firm and auditor to Fidelity and certain Fidelity funds, has been engaged annually by the Board as part of the Board's assessment of Fidelity's profitability analysis. PwC's engagement includes the review and assessment of Fidelity's methodologies used in determining the revenues and expenses attributable to Fidelity's mutual fund business, and completion of agreed-upon procedures surrounding the mathematical accuracy of fund profitability and its conformity to allocation methodologies. After considering PwC's reports issued under the engagement and information provided by Fidelity, the Board believes that while other allocation methods may also be reasonable, Fidelity's profitability methodologies are reasonable in all material respects.
Annual Report
The Board has also reviewed Fidelity's non-fund businesses and fall-out benefits related to the mutual fund business as well as cases where Fidelity's affiliates may benefit from or be related to the fund's business.
The Board considered the costs of the services provided by and the profits realized by Fidelity in connection with the operation of the fund and were satisfied that the profitability was not excessive in the circumstances.
Economies of Scale. The Board considered whether there have been economies of scale in respect of the management of the Fidelity funds, whether the Fidelity funds (including the fund) have appropriately benefited from any such economies of scale, and whether there is potential for realization of any further economies of scale. The Board considered the extent to which the fund will benefit from economies of scale through increased services to the fund, through waivers or reimbursements, or through fee or expense reductions.
In February 2009, the Board and the board of other Fidelity funds created an ad hoc committee (the Economies of Scale Committee) to analyze whether FMR attains economies of scale in respect of the management and servicing of the Fidelity funds, whether the Fidelity funds have appropriately benefited from such economies of scale, and whether there is potential for realization of any further economies of scale.
The Board recognized that the fund's management contract incorporates a "group fee" structure, which provides for lower group fee rates as total fund assets under FMR's management increase, and for higher group fee rates as total fund assets under FMR's management decrease. FMR calculates the group fee rates based on a tiered asset "breakpoint" schedule that varies based on asset class. The Board considered that the group fee is designed to deliver the benefits of economies of scale to fund shareholders when total Fidelity fund assets increase, even if assets of any particular fund are unchanged or have declined, because some portion of Fidelity's costs are attributable to services provided to all Fidelity funds, and all funds benefit if those costs can be allocated among more assets. The Board concluded that, given the group fee structure, fund shareholders will benefit from lower management fees as assets under FMR's management increase at the fund complex level, regardless of whether Fidelity achieves any such economies of scale.
The Board concluded, considering the findings of the Economies of Scale Committee, that any potential economies of scale are being appropriately shared between fund shareholders and Fidelity.
Additional Information Requested by the Board. In order to develop fully the factual basis for consideration of the Fidelity funds' Advisory Contracts, the Board requested and received additional information on certain topics, including (i) fund performance trends, actions to be taken by FMR to improve certain funds' overall performance, and Fidelity's long-term strategies for certain funds; (ii) portfolio manager changes that have occurred during the past year and length of portfolio manager tenure for different categories of funds over time; (iii) Fidelity's compensation structure for portfolio managers, research analysts, and other key personnel, the rationale for the compensation structure, and how the compensation structure provides appropriate performance incentives; (iv) the amount of the investment that each portfolio manager has made in the Fidelity fund(s) that he or she manages; (v) management and other fees paid by FMR to affiliated sub-advisers on behalf of the Fidelity funds; (vi) Fidelity's fee structures and rationale for recommending different fees among different categories of funds; (vii) Fidelity's rationale for recommending which funds should have a performance adjustment component as part of their management fees; (viii) the rationale for any differences between fund fee structures and fee structures in place for other Fidelity clients; and (ix) explanations regarding the relative total expenses borne by certain funds and classes, total expense competitive trends, and actions that might be taken by FMR to reduce total expenses for certain funds and classes.
Annual Report
Board Approval of Investment Advisory Contracts and
Management Fees - continued
Based on its evaluation of all of the conclusions noted above, and after considering all factors it believed relevant, the Board ultimately concluded that the advisory fee structures are fair and reasonable, and that the fund's Advisory Contracts should be renewed.
Annual Report
Investment Adviser
Fidelity Management & Research Company
Boston, MA
Investment Sub-Advisers
FMR Co., Inc.
Fidelity Management & Research
(U.K.) Inc.
Fidelity Research & Analysis
Company
FIL Investment Advisors
FIL Investments (Japan) Limited
FIL Investment Advisors (UK) Ltd.
Fidelity Management & Research
(Hong Kong) Limited
Fidelity Management & Research
(Japan) Inc.
General Distributor
Fidelity Distributors Corporation
Boston, MA
Transfer and Service Agents
Fidelity Investments Institutional Operations Company, Inc.
Boston, MA
Fidelity Service Company, Inc.
Boston, MA
Custodian
The Bank of New York Mellon
New York, NY
AISC-UANN-1210
1.793568.107

(Fidelity Investment logo)(registered trademark)
Fidelity AdvisorSM
International Small Cap
Fund - Institutional Class
Annual Report
October 31, 2010
Institutional Class is a class of
Fidelity® International Small Cap Fund
(2_fidelity_logos) (Registered_Trademark)
Contents
Chairman's Message | <Click Here> | The Chairman's message to shareholders. |
Performance | <Click Here> | How the fund has done over time. |
Management's Discussion of Fund Performance | <Click Here> | The Portfolio Managers' review of fundperformance and strategy. |
Shareholder Expense Example | <Click Here> | An example of shareholder expenses. |
Investment Changes | <Click Here> | A summary of major shifts in the fund's investments over the past six months. |
Investments | <Click Here> | A complete list of the fund's investments with their market values. |
Financial Statements | <Click Here> | Statements of assets and liabilities, operations, and changes in net assets, as well as financial highlights. |
Notes | <Click Here> | Notes to financial statements. |
Report of Independent Registered Public Accounting Firm | <Click Here> | |
Trustees and Officers | <Click Here> | |
Distributions | <Click Here> | |
Board Approval of Investment Advisory Contracts and Management Fees | <Click Here> | |
To view a fund's proxy voting guidelines and proxy voting record for the 12-month period ended June 30, visit http://www.fidelity.com/proxyvotingresults or visit the Securities and Exchange Commission's (SEC) web site at http://www.sec.gov. You may also call 1-877-208-0098 to request a free copy of the proxy voting guidelines.
Standard & Poor's, S&P and S&P 500 are registered service marks of The McGraw-Hill Companies, Inc. and have been licensed for use by Fidelity Distributors Corporation.
Other third party marks appearing herein are the property of their respective owners.
All other marks appearing herein are registered or unregistered trademarks or service marks of FMR LLC or an affiliated company.
Annual Report
This report and the financial statements contained herein are submitted for the general information of the shareholders of the fund. This report is not authorized for distribution to prospective investors in the fund unless preceded or accompanied by an effective prospectus.
A fund files its complete schedule of portfolio holdings with the SEC for the first and third quarters of each fiscal year on Form N-Q. Forms N-Q are available on the SEC's web site at http://www.sec.gov. A fund's Forms N-Q may be reviewed and copied at the SEC's Public Reference Room in Washington, DC. Information regarding the operation of the SEC's Public Reference Room may be obtained by calling 1-800-SEC-0330. For a complete list of a fund's portfolio holdings, view the most recent holdings listing, semiannual report, or annual report on Fidelity's web site at http://www.fidelity.com or http://www.advisor.fidelity.com, as applicable.
NOT FDIC INSURED • MAY LOSE VALUE • NO BANK GUARANTEE
Neither the fund nor Fidelity Distributors Corporation is a bank.
Annual Report
(photo_of_Edward_C_Johnson_3d)
Dear Shareholder:
Equities have staged a rally in the second half of 2010, shaking off concerns about the European debt crisis and the possibility of a double-dip recession in the U.S. Although the short-term surge pushed major equity indexes back into positive territory for the year, several questions remain about the longer-term outlook, including lackluster economic growth and persistently high unemployment. Financial markets are always unpredictable, of course, but there also are several time-tested investment principles that can help put the odds in your favor.
One of the basic tenets is to invest for the long term. Over time, riding out the markets' inevitable ups and downs has proven much more effective than selling into panic or chasing the hottest trend. Even missing only a few of the markets' best days can significantly diminish investor returns. Patience also affords the benefits of compounding - of earning interest on additional income or reinvested dividends and capital gains. There can be tax advantages and cost benefits to consider as well. While staying the course doesn't eliminate risk, it can considerably lessen the effect of short-term declines.
You can further manage your investing risk through diversification. And today, more than ever, geographic diversification should be taken into account. Studies indicate that asset allocation is the single most important determinant of a portfolio's long-term success. The right mix of stocks, bonds and cash - aligned to your particular risk tolerance and investment objective - is very important. Age-appropriate rebalancing is also an essential aspect of asset allocation. For younger investors, an emphasis on equities - which historically have been the best-performing asset class over time - is encouraged. As investors near their specific goal, such as retirement or sending a child to college, consideration may be given to replacing volatile assets (e.g. common stocks) with more-stable fixed investments (bonds or savings plans).
A third principle - investing regularly - can help lower the average cost of your purchases. Investing a certain amount of money each month or quarter helps ensure you won't pay for all your shares at market highs. This strategy - known as dollar cost averaging - also reduces "emotion" from investing, helping shareholders avoid selling weak performers just prior to an upswing, or chasing a hot performer just before a correction.
We invite you to contact us via the Internet, through our Investor Centers or by phone. It is our privilege to provide you the information you need to make the investments that are right for you.
Sincerely,
(The chairman's signature appears here.)
Edward C. Johnson 3d
Annual Report
Average annual total return reflects the change in the value of an investment, assuming reinvestment of the class' distributions from dividend income and capital gains (the profits earned upon the sale of securities that have grown in value, if any) and assuming a constant rate of performance each year. The $10,000 table and the fund's returns do not reflect the deduction of taxes that a shareholder would pay on fund distributions or the redemption of fund shares. During periods of reimbursement by Fidelity, a fund's total return will be greater than it would be had the reimbursement not occurred. How a fund did yesterday is no guarantee of how it will do tomorrow.
Average Annual Total Returns
Periods ended October 31, 2010 | Past 1
year | Past 5
years | Life of
fundA |
Institutional Class B | 21.15% | 5.89% | 17.83% |
A From September 18, 2002.
B The initial offering of Institutional Class shares took place on May 27, 2003. Returns prior to May 27, 2003 are those of Fidelity® International Small Cap Fund, the original class of the fund.
$10,000 Over Life of Fund
Let's say hypothetically that $10,000 was invested in Fidelity AdvisorSM International Small Cap Fund - Institutional Class, a class of the fund, on September 18, 2002, when the fund started. The chart shows how the value of your investment would have changed, and also shows how the MSCI® EAFE® Small Cap Index performed over the same period. The initial offering of Institutional Class took place on May 27, 2003. See above for additional information regarding the performance of Institutional Class.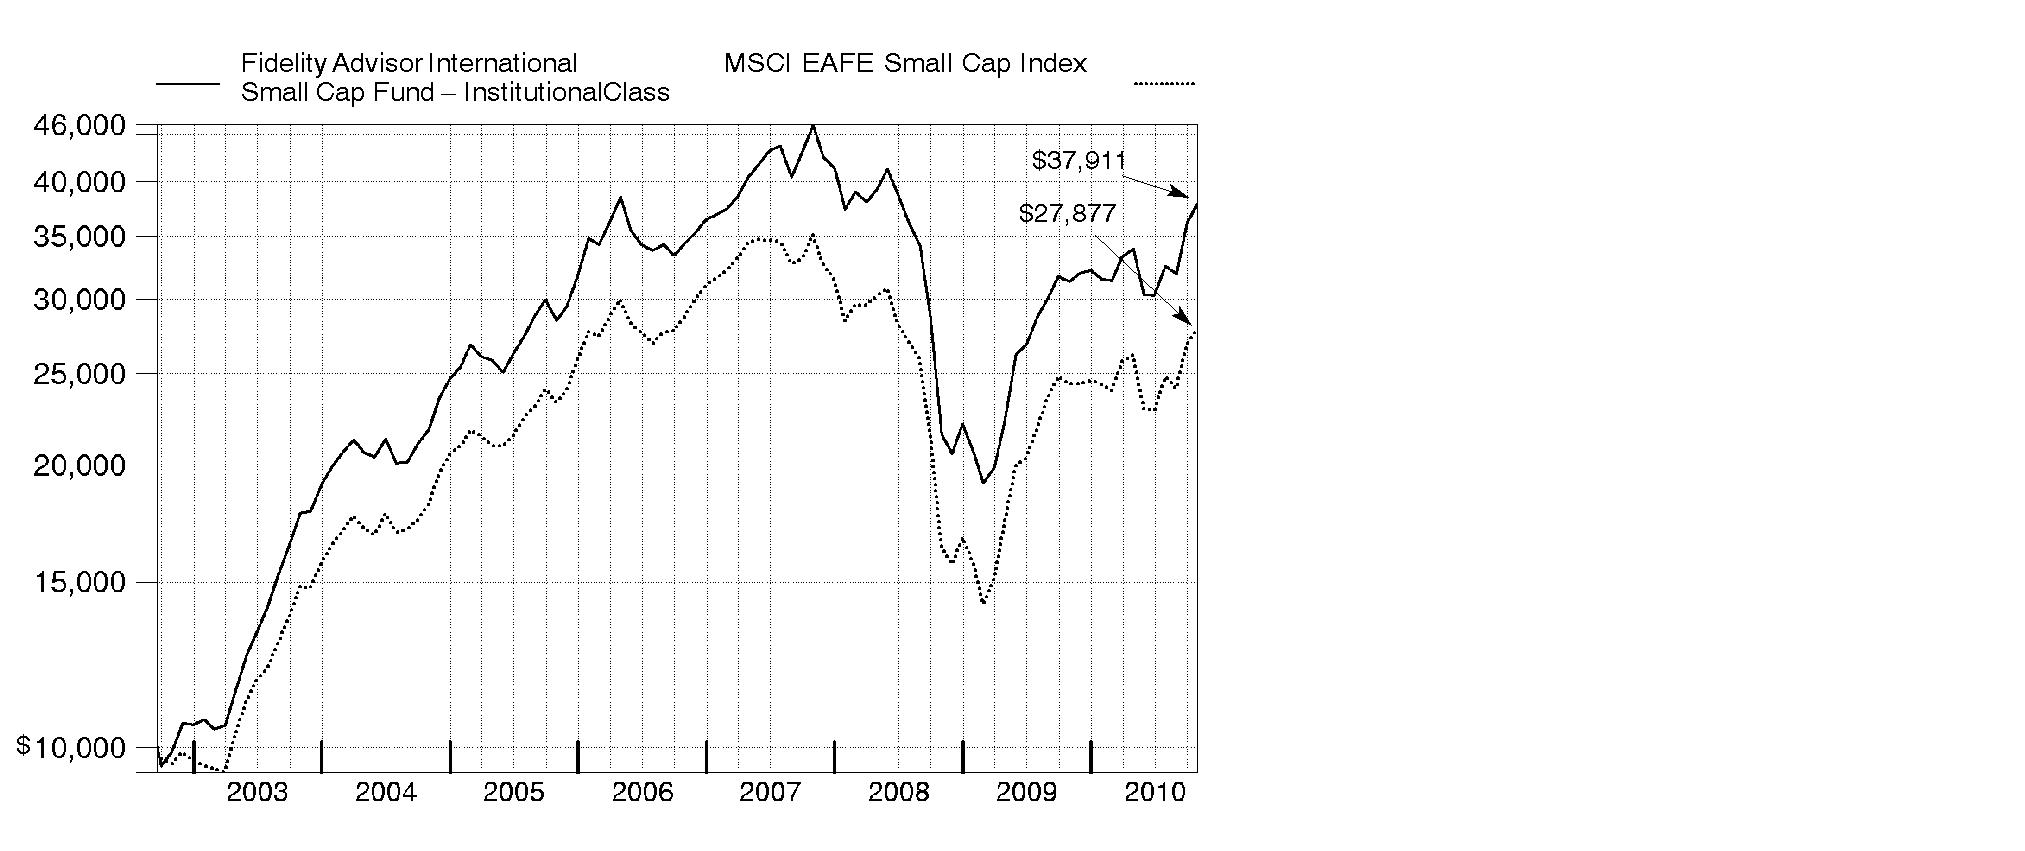
Annual Report
Market Recap: International stocks rode a wave of volatility similar to that of their U.S. counterparts during the 12 months ending October 31, 2010. Stocks gained modestly in the first half of the period, despite growing concerns about the European debt crisis. Sentiment turned decidedly negative in May and June, however, and the market suffered a precipitous decline. These losses were more than offset during the last four months of the period, when signs of economic growth and subsiding debt fears helped propel international stocks about 21%. For the full year, the MSCI® ACWI® (All Country World Index) ex USA Index gained 12.76%, boosted in part by a generally depreciating U.S. dollar. Within the index, Canada and emerging markets were standouts, returning 23% and 24%, respectively. Results in the latter group were led by strong-performing India, Mexico and South Africa, while China fell short of the MSCI benchmark due to cooling economic growth. The developed Asia ex Japan segment rose 16% for the period, lifted by solid results from Singapore and Hong Kong. Meanwhile, Europe rose just 9%, held back mainly by debt-riddled Spain and Italy, as well as lagging major constituent France. Japan returned only 5%, a result of that nation's continued weak economy.
Comments from Colin Stone, Noriko Takahashi and Dale Nicholls, Co-Portfolio Managers of Fidelity AdvisorSM International Small Cap Fund: During the year, the fund's Institutional Class gained 21.15%, topping the 14.31% mark of the MSCI EAFE® (Europe, Australasia, Far East) Small Cap Index. The biggest boost to relative performance came from stock selection in consumer discretionary. Among countries, performance benefited the most from favorable picks in China and Australia as well as a large overweighting and solid picks in Germany. On the negative side, stock selection in industrials significantly dampened the fund's gain. Geographically, stock picking in the United Kingdom and France hampered performance. All three subportfolios solidly beat their respective benchmarks. The Asia-Pacific ex Japan "sub" was boosted by Hong Kong holding Sino Prosper State Gold Resources Holdings, while Australian oil/gas exploration holding AWE detracted. The Europe/Africa/Middle East sub was lifted by Canada's European Goldfields. Connaught - a U.K. provider of housing-related services - curbed results. In the Japanese subportfolio, the top contributor was auto transmission maker Exedy. Conversely, an out-of-benchmark stake in Ibiden, which makes printed circuit boards, hurt.
Note to shareholders: The fund reopened to new accounts on November 10, 2009.
The views expressed above reflect those of the portfolio manager(s) only through the end of the period as stated on the cover of this report and do not necessarily represent the views of Fidelity or any other person in the Fidelity organization. Any such views are subject to change at any time based upon market or other conditions and Fidelity disclaims any responsibility to update such views. These views may not be relied on as investment advice and, because investment decisions for a Fidelity fund are based on numerous factors, may not be relied on as an indication of trading intent on behalf of any Fidelity fund.
Annual Report
Shareholder Expense Example
As a shareholder of the Fund, you incur two types of costs: (1) transaction costs, including sales charges (loads) on purchase payments or redemption proceeds, redemption fees, and (2) ongoing costs, including management fees, distribution and/or service (12b-1) fees and other Fund expenses. This Example is intended to help you understand your ongoing costs (in dollars) of investing in the Fund and to compare these costs with the ongoing costs of investing in other mutual funds.
The Example is based on an investment of $1,000 invested at the beginning of the period and held for the entire period (May 1, 2010 to October 31, 2010).
Actual Expenses
The first line of the accompanying table for each class of the Fund provides information about actual account values and actual expenses. You may use the information in this line, together with the amount you invested, to estimate the expenses that you paid over the period. Simply divide your account value by $1,000.00 (for example, an $8,600 account value divided by $1,000.00 = 8.6), then multiply the result by the number in the first line for a class of the Fund under the heading entitled "Expenses Paid During Period" to estimate the expenses you paid on your account during this period. A small balance maintenance fee of $12.00 that is charged once a year may apply for certain accounts with a value of less than $2,000. This fee is not included in the table below. If it was, the estimate of expenses you paid during the period would be higher, and your ending account value lower, by this amount. In addition, the Fund, as a shareholder in the underlying Fidelity Central Funds, will indirectly bear its pro-rata share of the fees and expenses incurred by the underlying Fidelity Central Funds. These fees and expenses are not included in the Fund's annualized expense ratio used to calculate the expense estimate in the table below.
Hypothetical Example for Comparison Purposes
The second line of the accompanying table for each class of the Fund provides information about hypothetical account values and hypothetical expenses based on a Class' actual expense ratio and an assumed rate of return of 5% per year before expenses, which is not the Class' actual return. The hypothetical account values and expenses may not be used to estimate the actual ending account balance or expenses you paid for the period. You may use this information to compare the ongoing costs of investing in the Fund and other funds. To do so, compare this 5% hypothetical example with the 5% hypothetical examples that appear in the shareholder reports of the other funds. A small balance maintenance fee of $12.00 that is charged once a year may apply for certain accounts with a value of less than $2,000. This fee is not included in the table below. If it was, the estimate of expenses you paid during the period would be higher, and your ending account value lower, by this amount. In addition, the Fund, as a shareholder in the underlying Fidelity Central Funds, will indirectly bear its pro-rata share of the fees and expenses incurred by the underlying Fidelity Central Funds. These fees and expenses are not included in the Fund's annualized expense ratio used to calculate the expense estimate in the table below.
Please note that the expenses shown in the table are meant to highlight your ongoing costs only and do not reflect any transaction costs. Therefore, the second line of the table is useful in comparing ongoing costs only, and will not help you determine the relative total costs of owning different funds. In addition, if these transactional costs were included, your costs would have been higher.
Annual Report
| Annualized
Expense
Ratio | Beginning
Account Value
May 1, 2010 | Ending
Account Value
October 31, 2010 | Expenses Paid
During Period*
May 1, 2010 to October 31, 2010 |
Class A | 1.65% | | | |
Actual | | $ 1,000.00 | $ 1,114.00 | $ 8.79 |
HypotheticalA | | $ 1,000.00 | $ 1,016.89 | $ 8.39 |
Class T | 1.90% | | | |
Actual | | $ 1,000.00 | $ 1,112.10 | $ 10.11 |
HypotheticalA | | $ 1,000.00 | $ 1,015.63 | $ 9.65 |
Class B | 2.40% | | | |
Actual | | $ 1,000.00 | $ 1,109.90 | $ 12.76 |
HypotheticalA | | $ 1,000.00 | $ 1,013.11 | $ 12.18 |
Class C | 2.40% | | | |
Actual | | $ 1,000.00 | $ 1,109.60 | $ 12.76 |
HypotheticalA | | $ 1,000.00 | $ 1,013.11 | $ 12.18 |
International Small Cap | 1.36% | | | |
Actual | | $ 1,000.00 | $ 1,115.60 | $ 7.25 |
HypotheticalA | | $ 1,000.00 | $ 1,018.35 | $ 6.92 |
Institutional Class | 1.31% | | | |
Actual | | $ 1,000.00 | $ 1,116.20 | $ 6.99 |
HypotheticalA | | $ 1,000.00 | $ 1,018.60 | $ 6.67 |
A 5% return per year before expenses
*Expenses are equal to each Class' annualized expense ratio, multiplied by the average account value over the period, multiplied by 184/365 (to reflect the one-half year period).
Annual Report
Investment Changes (Unaudited)
Geographic Diversification (% of fund's net assets) |
As of October 31, 2010 |
| Japan 23.4% | |
| United Kingdom 16.7% | |
| Germany 9.5% | |
| France 8.8% | |
| Australia 7.4% | |
| United States of America 4.2% | |
| Cayman Islands 2.7% | |
| Canada 2.2% | |
| Norway 2.0% | |
| Other 23.1% | |

Percentages are adjusted for the effect of futures contracts, if applicable. |
As of April 30, 2010 |
| Japan 25.6% | |
| United Kingdom 15.7% | |
| Germany 10.7% | |
| France 9.3% | |
| Australia 7.4% | |
| United States of America 3.5% | |
| Netherlands 2.9% | |
| Bermuda 2.4% | |
| Cayman Islands 1.8% | |
| Other 20.7% | |

Percentages are adjusted for the effect of futures contracts, if applicable. |
Asset Allocation |
| % of fund's
net assets | % of fund's net assets
6 months ago |
Stocks, Investment Companies and Equity Futures | 96.1 | 96.8 |
Short-Term Investments and Net Other Assets | 3.9 | 3.2 |
Top Ten Stocks as of October 31, 2010 |
| % of fund's
net assets | % of fund's net assets
6 months ago |
European Goldfields Ltd. (Canada, Metals & Mining) | 1.3 | 0.8 |
IG Group Holdings PLC (United Kingdom, Diversified Financial Services) | 1.2 | 1.0 |
SeLoger.com (France, Media) | 1.1 | 1.0 |
Elekta AB (B Shares) (Sweden, Health Care Equipment & Supplies) | 1.1 | 0.9 |
Ipsos SA (France, Media) | 1.0 | 0.8 |
Gemalto NV (Netherlands, Computers & Peripherals) | 1.0 | 1.1 |
Lanxess AG (Germany, Chemicals) | 1.0 | 0.8 |
Wacker Chemie AG (Germany, Chemicals) | 1.0 | 0.5 |
Craneware PLC (United Kingdom, Health Care Technology) | 0.9 | 0.7 |
Pertama Holdings Ltd. (Singapore, Specialty Retail) | 0.8 | 0.0 |
| 10.4 | |
Market Sectors as of October 31, 2010 |
| % of fund's
net assets | % of fund's net assets
6 months ago |
Consumer Discretionary | 19.2 | 18.6 |
Information Technology | 16.8 | 17.0 |
Industrials | 15.1 | 19.3 |
Materials | 12.8 | 10.8 |
Financials | 10.5 | 10.9 |
Health Care | 9.5 | 9.6 |
Energy | 5.9 | 5.3 |
Telecommunication Services | 2.1 | 2.1 |
Consumer Staples | 1.7 | 1.6 |
Utilities | 0.8 | 0.9 |
Annual Report
Investments October 31, 2010
Showing Percentage of Net Assets
Common Stocks - 94.4% |
| Shares | | Value |
Australia - 7.4% |
Allied Gold Ltd. (a) | 12,713,939 | | $ 5,667,121 |
Allied Gold Ltd. (United Kingdom) (a) | 4,914,800 | | 2,145,732 |
Ausenco Ltd. | 305,858 | | 764,066 |
Austal Ltd. | 1,095,023 | | 2,628,211 |
Australian Worldwide Exploration Ltd. (a) | 922,101 | | 1,359,521 |
BlueScope Steel Ltd. | 214,319 | | 418,865 |
carsales.com Ltd. | 151,787 | | 706,316 |
Centamin Egypt Ltd. (United Kingdom) (a) | 1,924,214 | | 5,333,381 |
Charter Hall Group unit | 2,530,982 | | 1,388,507 |
Discovery Metals Ltd. (a) | 875,240 | | 1,007,479 |
DUET Group | 688,657 | | 1,170,505 |
Goodman Group unit | 6,343,283 | | 3,914,944 |
Industrea Ltd. | 2,671,615 | | 1,203,934 |
Iress Market Technology Ltd. | 142,341 | | 1,220,138 |
Ironbark Zinc Ltd. (a) | 2,305,831 | | 564,727 |
Kingsgate Consolidated NL (d) | 99,427 | | 976,959 |
Lynas Corp. Ltd. (a) | 1,537,632 | | 2,206,790 |
MAp Group unit | 226,044 | | 675,404 |
Medusa Mining Ltd. | 239,743 | | 1,308,194 |
Mineral Deposits Ltd. (a) | 5,620,000 | | 6,391,999 |
Monto Minerals Ltd. (a) | 273,551 | | 2,412 |
Navitas Ltd. | 871,259 | | 3,269,016 |
Northern Iron Ltd. (a)(d) | 423,362 | | 638,710 |
Panaust Ltd. (a) | 2,277,343 | | 1,662,094 |
Ramsay Health Care Ltd. | 179,829 | | 2,757,052 |
realestate.com.au Ltd. | 82,531 | | 871,579 |
SAI Global Ltd. | 1,018,293 | | 4,369,360 |
SomnoMed Ltd. (a) | 331,849 | | 334,849 |
Spark Infrastructure Group unit (f) | 1,461,561 | | 1,603,636 |
Super Cheap Auto Group Ltd. | 296,366 | | 1,936,534 |
Tiger Resources Ltd. (a) | 14,407,421 | | 5,151,694 |
Wotif.com Holdings Ltd. | 255,354 | | 1,170,737 |
TOTAL AUSTRALIA | | 64,820,466 |
Bailiwick of Jersey - 0.2% |
Renewable Energy Generation Ltd. | 1,777,200 | | 1,409,434 |
Belgium - 0.3% |
EVS Broadcast Equipment SA | 7,700 | | 483,209 |
Hansen Transmissions International NV (a) | 2,639,400 | | 1,889,813 |
TOTAL BELGIUM | | 2,373,022 |
Common Stocks - continued |
| Shares | | Value |
Bermuda - 1.9% |
Asia Satellite Telecommunications Holdings Ltd. | 271,000 | | $ 489,469 |
Asian Citrus Holdings Ltd. | 615,000 | | 708,524 |
Biosensors International Group Ltd. (a) | 1,769,000 | | 1,530,773 |
China Animal Healthcare Ltd. | 4,707,000 | | 1,236,483 |
China LotSynergy Holdings Ltd. (a) | 7,324,000 | | 283,464 |
China Water Affairs Group Ltd. | 1,134,000 | | 434,508 |
Luk Fook Holdings International Ltd. | 1,162,000 | | 2,851,313 |
Man Wah Holdings Ltd. | 260,000 | | 364,948 |
Mingyuan Medicare Development Co. Ltd. | 2,870,000 | | 399,884 |
Noble Group Ltd. | 315,272 | | 453,068 |
Oakley Capital Investments Ltd. (a) | 1,285,000 | | 2,655,804 |
Sihuan Pharmaceutical Holdings Group Ltd. | 42,000 | | 30,506 |
Texwinca Holdings Ltd. | 1,402,000 | | 1,530,194 |
Vtech Holdings Ltd. | 349,700 | | 3,638,549 |
TOTAL BERMUDA | | 16,607,487 |
British Virgin Islands - 0.7% |
Albidon Ltd. CDI (a) | 1,469,000 | | 208,670 |
Kalahari Energy (a)(h) | 1,451,000 | | 15 |
Playtech Ltd. | 845,876 | | 6,067,999 |
TOTAL BRITISH VIRGIN ISLANDS | | 6,276,684 |
Canada - 2.2% |
AirSea Lines (a)(h) | 1,893,338 | | 26 |
AirSea Lines warrants 8/4/11 (a)(h) | 1,862,300 | | 26 |
Banro Corp. (a) | 637,400 | | 1,874,890 |
Equinox Minerals Ltd. unit (a)(d) | 306,097 | | 1,673,263 |
European Goldfields Ltd. (a) | 854,800 | | 11,549,303 |
Platmin Ltd. (a) | 3,649,900 | | 3,888,712 |
Rock Well Petroleum, Inc. (a)(h) | 770,400 | | 8 |
Starfield Resources, Inc. (a) | 4,328,075 | | 233,399 |
TOTAL CANADA | | 19,219,627 |
Cayman Islands - 2.7% |
AirMedia Group, Inc. ADR (a) | 28,300 | | 195,553 |
China Automation Group Ltd. | 405,000 | | 316,633 |
China Dongxiang Group Co. Ltd. | 657,000 | | 367,861 |
China Forestry Holdings Co. Ltd. | 814,000 | | 386,456 |
China Haidian Holdings Ltd. | 2,154,000 | | 358,479 |
China High Precision Automation Group Ltd. | 712,000 | | 453,769 |
China Lilang Ltd. | 340,000 | | 531,630 |
China Metal International Holdings, Inc. | 1,036,000 | | 264,639 |
China Real Estate Information Corp. ADR (d) | 65,100 | | 645,141 |
Common Stocks - continued |
| Shares | | Value |
Cayman Islands - continued |
CNinsure, Inc. ADR (d) | 31,900 | | $ 819,830 |
Ctrip.com International Ltd. sponsored ADR (a) | 39,300 | | 2,046,351 |
Daphne International Holdings Ltd. | 1,392,000 | | 1,555,197 |
EVA Precision Industrial Holdings Ltd. | 5,562,000 | | 4,613,922 |
Fook Woo Group Holdings Ltd. | 1,099,000 | | 388,487 |
Global Dairy Holdings Ltd. | 197,000 | | 97,849 |
Global Education & Technology Group Ltd. ADR (a) | 3,300 | | 32,769 |
Hengdeli Holdings Ltd. | 1,124,000 | | 623,538 |
Kingdee International Software Group Co. Ltd. | 1,406,000 | | 741,886 |
Little Sheep Group Ltd. | 614,000 | | 400,026 |
Maoye International Holdings Ltd. | 938,000 | | 404,183 |
Marwyn Value Investors II Ltd. (a) | 1,846,800 | | 2,515,023 |
Neo-Neon Holdings Ltd. | 804,000 | | 489,583 |
Orchid Developments Group Ltd. (a) | 1,211,000 | | 523,855 |
PCD Stores Group Ltd. | 1,046,000 | | 337,365 |
Perfect World Co. Ltd. sponsored ADR Class B (a) | 28,400 | | 920,160 |
Sino-Life Group Ltd. (a) | 2,608,000 | | 306,180 |
TAL Education Group ADR (a) | 6,600 | | 117,480 |
TPK Holdings Co. | 2,000 | | 33,001 |
VST Holdings Ltd. (a) | 1,582,000 | | 404,110 |
Xingda International Holdings Ltd. | 1,656,000 | | 1,728,372 |
Yip's Chemical Holdings Ltd. | 592,000 | | 704,175 |
TOTAL CAYMAN ISLANDS | | 23,323,503 |
China - 1.5% |
51job, Inc. sponsored ADR (a) | 12,800 | | 577,024 |
AMVIG Holdings Ltd. | 764,000 | | 620,958 |
Baidu.com, Inc. sponsored ADR (a) | 9,200 | | 1,012,092 |
China Metal Recycling (Holdings) Ltd. | 333,600 | | 371,420 |
Dalian Port (PDA) Co. Ltd. (H Shares) | 1,786,000 | | 771,888 |
Digital China Holdings Ltd. (H Shares) | 239,000 | | 431,672 |
Focus Media Holding Ltd. ADR (a)(d) | 15,300 | | 378,675 |
Global Bio-Chem Technology Group Co. Ltd. (a) | 2,672,800 | | 434,475 |
Harbin Power Equipment Co. Ltd. (H Shares) | 492,000 | | 662,665 |
Minth Group Ltd. | 596,000 | | 1,114,917 |
People's Food Holdings Ltd. | 992,000 | | 536,506 |
Royale Furniture Holdings Ltd. | 1,854,000 | | 676,900 |
Sino Prosper State Gold Resources Holdings, Ltd. (a) | 74,820,000 | | 3,764,528 |
Weiqiao Textile Co. Ltd. (H Shares) | 2,055,500 | | 1,620,268 |
Zhaojin Mining Industry Co. Ltd. (H Shares) | 58,500 | | 181,887 |
TOTAL CHINA | | 13,155,875 |
Common Stocks - continued |
| Shares | | Value |
Cyprus - 0.8% |
Buried Hill Energy (Cyprus) PCL (a)(h) | 1,947,000 | | $ 4,867,500 |
Mirland Development Corp. PLC (a) | 781,900 | | 2,242,371 |
TOTAL CYPRUS | | 7,109,871 |
Denmark - 0.9% |
DSV de Sammensluttede Vognmaend AS | 250,000 | | 5,122,129 |
Pandora A/S | 52,300 | | 2,537,366 |
William Demant Holding AS (a) | 200 | | 14,991 |
TOTAL DENMARK | | 7,674,486 |
France - 8.8% |
Altamir Amboise (a) | 544,400 | | 4,264,755 |
ALTEN | 114,000 | | 3,806,214 |
Audika SA | 113,113 | | 2,762,214 |
Compagnie Generale de Geophysique SA (a) | 188,400 | | 4,399,670 |
Delachaux SA | 80,541 | | 6,569,472 |
Devoteam SA | 38,800 | | 1,071,667 |
Faiveley Transport | 50,672 | | 4,283,334 |
Iliad Group SA | 46,742 | | 5,261,668 |
Ipsos SA | 184,600 | | 8,875,855 |
Laurent-Perrier Group | 20,860 | | 2,350,787 |
LeGuide.com SA (a) | 85,800 | | 3,261,637 |
Maisons France Confort (d) | 89,444 | | 3,895,500 |
Meetic | 187,600 | | 5,599,223 |
Sartorius Stedim Biotech | 53,700 | | 2,464,294 |
SeLoger.com | 198,800 | | 9,985,991 |
Sopra Group SA | 37,800 | | 3,146,867 |
SR Teleperformance SA | 131,700 | | 4,152,535 |
Trigano SA (a) | 22,591 | | 581,534 |
TOTAL FRANCE | | 76,733,217 |
Germany - 9.3% |
CENTROTEC Sustainable AG (a) | 131,581 | | 3,097,855 |
CTS Eventim AG | 111,908 | | 6,315,776 |
Delticom AG | 70,400 | | 5,612,998 |
Drillisch AG | 679,100 | | 5,802,838 |
ElringKlinger AG | 184,000 | | 6,130,562 |
Freenet AG | 164,700 | | 2,086,839 |
GFK AG | 142,601 | | 6,020,128 |
HeidelbergCement AG | 119,666 | | 6,258,250 |
KROMI Logistik AG | 118,100 | | 1,331,075 |
Lanxess AG | 121,885 | | 8,479,844 |
Rational AG (d) | 15,920 | | 3,557,593 |
Common Stocks - continued |
| Shares | | Value |
Germany - continued |
SMA Solar Technology AG (d) | 31,200 | | $ 3,681,443 |
STRATEC Biomedical Systems AG | 77,910 | | 2,931,891 |
Tom Tailor Holding AG | 204,300 | | 4,335,167 |
United Internet AG | 390,613 | | 6,997,800 |
Wacker Chemie AG | 40,000 | | 8,251,299 |
TOTAL GERMANY | | 80,891,358 |
Greece - 0.2% |
Babis Vovos International Technical SA (a) | 149,200 | | 506,555 |
Jumbo SA | 161,000 | | 1,238,850 |
TOTAL GREECE | | 1,745,405 |
Hong Kong - 1.0% |
Dah Sing Financial Holdings Ltd. | 102,400 | | 710,740 |
GZI Transport Ltd. | 950,000 | | 495,146 |
I.T Ltd. | 2,064,000 | | 1,741,469 |
Magnificent Estates Ltd. | 18,070,000 | | 582,809 |
REXCAPITAL Financial Holdings Ltd. | 4,600,000 | | 427,286 |
Singamas Container Holdings Ltd. (a) | 3,966,000 | | 895,404 |
Techtronic Industries Co. Ltd. | 3,251,000 | | 3,292,417 |
Tian An China Investments Co. Ltd. | 669,000 | | 516,989 |
TOTAL HONG KONG | | 8,662,260 |
Iceland - 0.7% |
Ossur hf (a) | 3,457,100 | | 6,515,406 |
India - 0.2% |
Educomp Solutions Ltd. | 24,874 | | 308,898 |
Geodesic Ltd. | 256,340 | | 676,055 |
Grasim Industries Ltd. | 6,876 | | 361,522 |
Indian Overseas Bank | 110,621 | | 398,810 |
The Jammu & Kashmir Bank Ltd. | 14,265 | | 293,008 |
TOTAL INDIA | | 2,038,293 |
Indonesia - 0.4% |
AKR Corporindo Tbk PT | 5,225,000 | | 882,768 |
PT Ciputra Development Tbk (a) | 12,376,500 | | 581,608 |
PT Lippo Karawaci Tbk | 9,290,500 | | 644,487 |
PT Mayora Indah Tbk | 372,500 | | 502,223 |
PT Mitra Adiperkasa Tbk | 1,436,000 | | 409,711 |
PT Tower Bersama Infrastructure Tbk | 402,500 | | 114,839 |
TOTAL INDONESIA | | 3,135,636 |
Common Stocks - continued |
| Shares | | Value |
Ireland - 0.9% |
James Hardie Industries NV unit (a) | 132,009 | | $ 697,049 |
Kenmare Resources PLC (a) | 14,887,700 | | 4,627,352 |
Petroceltic International PLC (a) | 11,142,200 | | 2,008,291 |
Petroneft Resources PLC (a) | 952,400 | | 715,617 |
Vimio PLC (a) | 867,300 | | 14 |
TOTAL IRELAND | | 8,048,323 |
Isle of Man - 1.5% |
Exillon Energy PLC | 1,511,200 | | 6,343,463 |
IBS Group Holding Ltd. GDR (Reg. S) (a) | 317,700 | | 7,028,812 |
TOTAL ISLE OF MAN | | 13,372,275 |
Italy - 0.8% |
Seldovia Native Association, Inc. (SNAI) (a) | 209,590 | | 831,157 |
Tod's SpA | 60,255 | | 5,841,260 |
TOTAL ITALY | | 6,672,417 |
Japan - 23.4% |
ABC-Mart, Inc. | 50,700 | | 1,724,443 |
Air Water, Inc. | 190,000 | | 2,217,099 |
Aozora Bank Ltd. | 1,390,000 | | 2,331,925 |
AQ Interactive, Inc. (d) | 705 | | 876,979 |
ARCS Co. Ltd. | 133,600 | | 1,731,637 |
Arnest One Corp. | 44,100 | | 466,374 |
Asahi Co. Ltd. | 58,000 | | 857,711 |
Asahi Intecc Co. Ltd. | 262,100 | | 4,390,590 |
ASKUL Corp. | 96,000 | | 1,994,681 |
Bank of Kyoto Ltd. | 231,000 | | 2,066,857 |
Cellseed, Inc. (d) | 11,700 | | 104,976 |
Central Glass Co. Ltd. | 248,000 | | 1,069,417 |
Chiba Bank Ltd. | 325,000 | | 2,006,499 |
Chiyoda Corp. | 318,000 | | 2,634,174 |
Cosmos Pharmaceutical Corp. | 27,200 | | 856,190 |
Create SD Holdings Co. Ltd. | 48,200 | | 1,051,212 |
Credit Saison Co. Ltd. | 173,200 | | 2,456,617 |
Culture Convenience Club Co. Ltd. (d) | 175,100 | | 778,996 |
CyberAgent, Inc. (d) | 2,722 | | 4,522,572 |
Dai-ichi Seiko Co. Ltd. (d) | 56,700 | | 2,783,211 |
Daihen Corp. | 456,000 | | 2,057,015 |
Digital Garage, Inc. | 994 | | 1,731,811 |
Don Quijote Co. Ltd. | 77,900 | | 2,128,770 |
Ebara Corp. (a) | 559,000 | | 2,393,964 |
EPS Co. Ltd. (d) | 742 | | 1,825,724 |
Common Stocks - continued |
| Shares | | Value |
Japan - continued |
Exedy Corp. | 147,000 | | $ 4,599,801 |
Ferrotec Corp. | 145,900 | | 1,620,910 |
FreeBit Co., Ltd. (d) | 358 | | 742,960 |
Fuji Oil Co. Ltd. | 191,400 | | 2,751,955 |
Furuya Metal Co. Ltd. | 33,400 | | 2,108,512 |
Glory Ltd. | 25,900 | | 571,300 |
GREE, Inc. (d) | 212,000 | | 2,676,674 |
Hoshizaki Electric Co. Ltd. | 62,400 | | 1,229,855 |
Ibiden Co. Ltd. | 97,300 | | 2,396,528 |
Isetan Mitsukoshi Holdings Ltd. | 170,800 | | 1,884,573 |
Japan Steel Works Ltd. | 110,000 | | 1,049,519 |
JP-Holdings, Inc. | 91,600 | | 1,871,386 |
JTEKT Corp. | 159,200 | | 1,595,028 |
Kandenko Co. Ltd. | 243,000 | | 1,416,267 |
Kenedix Realty Investment Corp. | 573 | | 2,275,053 |
Kimoto Co. Ltd. | 228,600 | | 1,693,123 |
KOMERI Co. Ltd. | 66,600 | | 1,385,465 |
Kuraray Co. Ltd. | 283,500 | | 4,060,360 |
Maeda Corp. | 319,000 | | 864,198 |
Makino Milling Machine Co. Ltd. (a) | 302,000 | | 2,079,135 |
Marui Group Co. Ltd. | 175,800 | | 1,381,481 |
Maruwa Ceramic Co. Ltd. | 77,000 | | 1,863,999 |
McDonald's Holdings Co. (Japan) Ltd. | 122,500 | | 3,110,072 |
Meiko Electronics Co. Ltd. | 96,300 | | 1,793,882 |
Message Co. Ltd. | 1,629 | | 4,149,932 |
Micronics Japan Co. Ltd. | 60,500 | | 488,691 |
Minebea Ltd. | 381,000 | | 2,092,244 |
Mitsubishi UFJ Lease & Finance Co. Ltd. | 96,270 | | 3,220,565 |
Mitsumi Electric Co. Ltd. | 104,800 | | 1,781,933 |
mixi, Inc. (d) | 355 | | 2,064,620 |
Nabtesco Corp. | 238,200 | | 4,218,156 |
Nichi-iko Pharmaceutical Co. Ltd. | 32,900 | | 1,160,311 |
Nichicon Corp. | 89,200 | | 995,422 |
Nihon M&A Center, Inc. (d) | 426 | | 1,540,524 |
Nippon Ceramic Co. Ltd. | 27,700 | | 468,150 |
Nippon Denko Co. Ltd. | 109,000 | | 808,662 |
Nippon Shinyaku Co. Ltd. | 208,000 | | 2,946,688 |
Nomura Real Estate Holdings, Inc. | 77,500 | | 1,189,418 |
Nomura Real Estate Residential Fund, Inc. | 400 | | 1,946,067 |
NTT Urban Development Co. | 1,081 | | 991,398 |
Osaka Securities Exchange Co. Ltd. | 154 | | 775,071 |
OSAKA Titanium technologies Co. Ltd. (d) | 48,800 | | 2,286,268 |
Common Stocks - continued |
| Shares | | Value |
Japan - continued |
Otsuka Corp. | 54,900 | | $ 3,486,256 |
Pigeon Corp. | 45,900 | | 1,366,676 |
Rensas Electronics Corp. (a)(d) | 312,700 | | 2,350,982 |
Riso Kagaku Corp. | 147,700 | | 2,011,671 |
Rohto Pharmaceutical Co. Ltd. | 196,000 | | 2,428,383 |
Sanken Electric Co. Ltd. (a) | 138,000 | | 493,898 |
Sankyu, Inc. | 264,000 | | 1,108,885 |
Santen Pharmaceutical Co. Ltd. | 78,600 | | 2,713,443 |
Sawada Holdings Co. Ltd. (a) | 214,800 | | 1,321,312 |
Sekisui Chemical Co. Ltd. | 303,000 | | 1,927,874 |
Shimadzu Corp. | 426,000 | | 3,202,808 |
Shimamura Co. Ltd. | 29,400 | | 2,820,529 |
Shin-Kobe Electric Machinery Co. Ltd. (d) | 244,000 | | 2,498,521 |
Shindengen Electric Co. Ltd. (a) | 155,000 | | 624,083 |
Shizuoka Gas Co. Ltd. | 88,000 | | 516,168 |
SHO-BOND Holdings Co. Ltd. | 132,500 | | 2,835,404 |
Simplex Holdings, Inc. | 1,189 | | 542,268 |
So-net M3, Inc. (d) | 227 | | 1,038,101 |
Sony Financial Holdings, Inc. | 843 | | 2,933,267 |
SRI Sports Ltd. | 1,276 | | 1,389,059 |
Start Today Co. Ltd. | 435 | | 1,353,057 |
Stella Chemifa Corp. | 9,500 | | 409,656 |
Sumitomo Osaka Cement Co. Ltd. | 789,000 | | 1,529,060 |
Sumitomo Trust & Banking Co. Ltd. | 577,000 | | 3,150,307 |
Sysmex Corp. | 20,300 | | 1,392,519 |
SystemPro Co. Ltd. (d) | 1,445 | | 1,136,678 |
Taisho Pharmaceutical Co. Ltd. | 75,000 | | 1,576,985 |
Takata Corp. | 92,600 | | 2,273,861 |
Takeei Corp. | 67,900 | | 658,158 |
The Suruga Bank Ltd. | 221,000 | | 1,993,861 |
Toho Co. Ltd. | 109,300 | | 1,689,347 |
Tokyu Livable, Inc. | 271,300 | | 3,128,699 |
Toto Ltd. (d) | 474,000 | | 3,149,173 |
Towa Corp. (a) | 297,200 | | 1,968,530 |
Toyo Tanso Co. Ltd. (d) | 42,500 | | 2,437,399 |
Toyota Boshoku Corp. | 37,100 | | 628,860 |
Ulvac, Inc. | 96,100 | | 1,938,242 |
Yamatake Corp. | 165,800 | | 4,036,314 |
Yamato Kogyo Co. Ltd. | 80,000 | | 2,051,945 |
Yokohama Rubber Co. Ltd. | 367,000 | | 1,834,507 |
TOTAL JAPAN | | 203,152,346 |
Common Stocks - continued |
| Shares | | Value |
Korea (South) - 0.8% |
Daou Technology, Inc. | 197,150 | | $ 1,577,901 |
Hyosung Corp. | 6,493 | | 721,765 |
Interpark Corp. (a) | 75,279 | | 298,572 |
KC Tech Co. Ltd. | 126,140 | | 682,020 |
Lock & Lock Co. Ltd. | 19,170 | | 634,170 |
MNTECH Co. Ltd. | 76,840 | | 755,075 |
Power Logics Co. Ltd. (a) | 57,033 | | 442,266 |
Sodiff Advanced Materials Co. Ltd. | 3,940 | | 358,787 |
The Basic House Co. Ltd. (a) | 66,650 | | 1,345,447 |
TK Corp. (a) | 17,649 | | 407,285 |
TOTAL KOREA (SOUTH) | | 7,223,288 |
Luxembourg - 0.3% |
GlobeOp Financial Services SA | 594,385 | | 2,906,877 |
Malaysia - 0.3% |
JobStreet Corp. Bhd | 1,223,100 | | 1,045,788 |
Lion Industries Corp. Bhd | 808,200 | | 514,380 |
Masterskill Education Group Bhd | 478,400 | | 444,415 |
Top Glove Corp. Bhd | 222,000 | | 392,478 |
TOTAL MALAYSIA | | 2,397,061 |
Netherlands - 1.8% |
Gemalto NV | 190,440 | | 8,670,399 |
SMARTRAC NV (a) | 104,600 | | 2,899,270 |
Wavin NV (a) | 273,912 | | 3,778,571 |
TOTAL NETHERLANDS | | 15,348,240 |
Norway - 2.0% |
Aker Solutions ASA | 339,300 | | 5,165,388 |
Renewable Energy Corp. ASA (a)(d) | 1,111,942 | | 3,870,628 |
Schibsted ASA (B Shares) | 221,000 | | 6,072,568 |
Sevan Marine ASA (a) | 2,000,000 | | 2,694,861 |
TOTAL NORWAY | | 17,803,445 |
Philippines - 0.1% |
Alliance Global Group, Inc. | 2,595,000 | | 685,951 |
Singapore - 1.8% |
CSE Global Ltd. | 1,069,000 | | 875,485 |
Goodpack Ltd. | 1,569,000 | | 2,472,966 |
Hyflux Ltd. | 398,000 | | 968,632 |
Mapletree Industrial (REIT) (a) | 207,000 | | 171,127 |
Oceanus Group Ltd. (a) | 2,071,000 | | 512,030 |
Common Stocks - continued |
| Shares | | Value |
Singapore - continued |
Pertama Holdings Ltd. (e) | 21,312,000 | | $ 7,080,399 |
Petra Foods Ltd. | 279,000 | | 344,897 |
Raffles Medical Group Ltd. | 431,000 | | 725,937 |
Straits Asia Resources Ltd. | 739,000 | | 1,307,510 |
Yanlord Land Group Ltd. | 608,000 | | 807,973 |
TOTAL SINGAPORE | | 15,266,956 |
South Africa - 0.6% |
Blue Label Telecoms Ltd. | 4,787,200 | | 4,920,427 |
Spain - 0.3% |
Obrascon Huarte Lain SA | 73,400 | | 2,401,133 |
Sweden - 1.5% |
Elekta AB (B Shares) | 252,800 | | 9,564,751 |
Modern Times Group MTG AB (B Shares) | 44,100 | | 3,162,163 |
XCounter AB (a) | 1,108,000 | | 48,818 |
TOTAL SWEDEN | | 12,775,732 |
Switzerland - 1.9% |
Bank Sarasin & Co. Ltd. Series B (Reg.) | 18,166 | | 664,373 |
Basilea Pharmaceutica AG (a) | 9,770 | | 684,848 |
Lonza Group AG | 58,029 | | 5,078,680 |
Panalpina Welttransport Holding AG (a) | 42,760 | | 5,338,756 |
VZ Holding AG | 42,690 | | 4,532,031 |
TOTAL SWITZERLAND | | 16,298,688 |
United Kingdom - 16.7% |
Abcam PLC | 196,100 | | 5,403,924 |
Ashmore Group PLC | 1,109,700 | | 6,804,046 |
Asset Realisation Co. PLC (a) | 340,000 | | 5 |
Aurelian Oil & Gas PLC (a) | 3,923,800 | | 3,834,775 |
Avanti Communications Group PLC (a) | 403,000 | | 3,796,519 |
Aveva Group PLC | 188,500 | | 4,499,879 |
Blinkx PLC (a)(d) | 1,303,000 | | 1,826,651 |
Bond International Software PLC | 617,066 | | 598,123 |
Borders & Southern Petroleum PLC (a) | 698,500 | | 783,371 |
Cadogan Petroleum PLC (a) | 1,406,300 | | 439,355 |
Central Asia Metals PLC (a) | 1,464,000 | | 2,023,035 |
Centurion Electronics PLC (a)(e) | 748,299 | | 12 |
Ceres Power Holdings PLC (a)(d) | 406,200 | | 532,024 |
China Goldmines PLC (a) | 669,353 | | 257,377 |
Connaught PLC | 429,800 | | 7 |
Conygar Investment Co. PLC (a) | 2,333,700 | | 3,916,537 |
Common Stocks - continued |
| Shares | | Value |
United Kingdom - continued |
Cove Energy PLC (a) | 2,629,300 | | $ 3,190,994 |
Craneware PLC | 877,400 | | 8,244,585 |
DTZ Holdings PLC (a) | 1,804,400 | | 1,315,368 |
EMIS Group PLC | 382,345 | | 2,603,440 |
European Nickel PLC (a) | 2,276,950 | | 1,386,246 |
Faroe Petroleum PLC (a) | 458,447 | | 1,432,277 |
GoIndustry-DoveBid PLC (a) | 22,589 | | 32,029 |
Hays PLC | 2,007,843 | | 3,554,637 |
Icap PLC | 514,900 | | 3,763,408 |
Ideal Shopping Direct PLC | 234,592 | | 719,756 |
IG Group Holdings PLC | 1,264,300 | | 10,705,287 |
Inchcape PLC (a) | 778,720 | | 4,350,473 |
Jubilee Platinum PLC (a) | 2,729,847 | | 1,366,758 |
Keronite PLC (a)(h) | 13,620,267 | | 218 |
Melrose Resources PLC | 266,200 | | 1,385,247 |
Moneysupermarket.com Group PLC | 1,822,600 | | 2,441,186 |
Monitise PLC (a) | 4,154,500 | | 1,397,788 |
Mothercare PLC | 501,800 | | 4,224,804 |
NCC Group Ltd. | 228,315 | | 1,755,815 |
Northgate PLC (a) | 493,500 | | 1,937,120 |
Ocado Group PLC (a)(d) | 1,125,700 | | 2,519,546 |
Pureprofile Media PLC (a)(h) | 1,108,572 | | 444,025 |
Redhall Group PLC | 519,600 | | 1,057,246 |
Regenersis PLC (a) | 1,367,300 | | 1,106,263 |
Rockhopper Exploration PLC (a)(i) | 654,100 | | 3,337,773 |
Royalblue Group PLC | 197,842 | | 5,071,561 |
SDL PLC (a) | 691,862 | | 6,661,885 |
Serco Group PLC | 447,430 | | 4,401,459 |
SIG PLC (a) | 1,479,300 | | 2,690,019 |
Silverdell PLC (a) | 4,958,000 | | 615,618 |
Sinclair Pharma PLC (a) | 4,246,949 | | 1,837,147 |
Sphere Medical Holding PLC (a)(h) | 555,599 | | 1,513,260 |
SR Pharma PLC (a) | 5,388,700 | | 837,450 |
Sthree PLC | 541,709 | | 2,542,944 |
Synergy Health PLC | 274,953 | | 3,464,658 |
Ted Baker PLC | 293,100 | | 2,887,980 |
TMO Biotec (a)(h) | 1,000,000 | | 400,538 |
Travis Perkins PLC | 248,700 | | 3,301,197 |
Valiant Petroleum PLC (a) | 156,200 | | 1,485,268 |
Wellstream Holdings PLC | 434,600 | | 5,152,578 |
Common Stocks - continued |
| Shares | | Value |
United Kingdom - continued |
Xchanging PLC | 1,521,100 | | $ 3,165,702 |
Zenergy Power PLC (a) | 855,520 | | 387,215 |
TOTAL UNITED KINGDOM | | 145,404,408 |
United States of America - 0.5% |
CTC Media, Inc. | 183,400 | | 4,328,240 |
Mudalla Technology, Inc. (a) | 996,527 | | 16 |
XL TechGroup, Inc. (a) | 1,329,250 | | 21 |
TOTAL UNITED STATES OF AMERICA | | 4,328,277 |
TOTAL COMMON STOCKS (Cost $718,968,030) | 820,697,874 |
Investment Companies - 0.0% |
| | | |
Bailiwick of Guernsey - 0.0% |
Brookwell Ltd. Class A
(Cost $621,868) | 213,047 | | 110,933 |
Government Obligations - 0.2% |
| Principal Amount (j) | | |
Germany - 0.2% |
German Federal Republic 0.2535% to 0.6185% 11/24/10 to 2/9/11 (g)
(Cost $1,499,792) | EUR | 1,100,000 | | 1,529,062 |
Money Market Funds - 8.4% |
| Shares | | |
Fidelity Cash Central Fund, 0.23% (b) | 46,383,073 | | 46,383,073 |
Fidelity Securities Lending Cash Central Fund, 0.24% (b)(c) | 26,860,023 | | 26,860,023 |
TOTAL MONEY MARKET FUNDS (Cost $73,243,096) | 73,243,096 |
TOTAL INVESTMENT PORTFOLIO - 103.0% (Cost $794,332,786) | | 895,580,965 |
NET OTHER ASSETS (LIABILITIES) - (3.0)% | | (26,101,299) |
NET ASSETS - 100% | $ 869,479,666 |
Futures Contracts |
| Expiration Date | | Underlying
Face Amount
at Value | | Unrealized
Appreciation/
(Depreciation) |
Purchased |
Equity Index Contracts |
366 Dow Jones Euro Stoxx 50 Index Contracts (Germany) | Dec. 2010 | | $ 14,458,195 | | $ 53,183 |
|
The face value of futures purchased as a percentage of net assets is 1.7% |
Currency Abbreviations |
EUR | - | European Monetary Unit |
Legend |
(a) Non-income producing |
(b) Affiliated fund that is available only to investment companies and other accounts managed by Fidelity Investments. The rate quoted is the annualized seven-day yield of the fund at period end. A complete unaudited listing of the fund's holdings as of its most recent quarter end is available upon request. In addition, each Fidelity Central Fund's financial statements, which are not covered by the Fund's report of Independent Registered Public Accounting Firm, are available on the SEC's website or upon request. |
(c) Investment made with cash collateral received from securities on loan. |
(d) Security or a portion of the security is on loan at period end. |
(e) Affiliated company |
(f) Security exempt from registration under Rule 144A of the Securities Act of 1933. These securities may be resold in transactions exempt from registration, normally to qualified institutional buyers. At the end of the period, the value of these securities amounted to $1,603,636 or 0.2% of net assets. |
(g) Security or a portion of the security was pledged to cover margin requirements for futures contracts. At the period end, the value of securities pledged amounted to $236,310. |
(h) Restricted securities - Investment in securities not registered under the Securities Act of 1933 (excluding 144A issues). At the end of the period, the value of restricted securities (excluding 144A issues) amounted to $7,225,615 or 0.8% of net assets. |
Additional information on each holding is as follows: |
Security | Acquisition Date | Acquisition Cost |
AirSea Lines | 8/4/06 | $ 931,150 |
AirSea Lines warrants 8/4/11 | 8/4/06 | $ 2 |
Buried Hill Energy (Cyprus) PCL | 8/18/06 | $ 2,141,700 |
Kalahari Energy | 9/1/06 | $ 1,813,750 |
Keronite PLC | 8/16/06 | $ 817,216 |
Pureprofile Media PLC | 5/3/05 - 1/11/06 | $ 640,000 |
Rock Well Petroleum, Inc. | 4/13/06 | $ 1,155,600 |
Sphere Medical Holding PLC | 8/27/08 - 3/16/10 | $ 944,518 |
TMO Biotec | 10/27/05 | $ 300,000 |
(i) Security or a portion of the security purchased on a delayed delivery or when-issued basis. |
(j) Principal amount is stated in United States dollars unless otherwise noted. |
Affiliated Central Funds |
Information regarding fiscal year to date income earned by the Fund from investments in Fidelity Central Funds is as follows: |
Fund | Income earned |
Fidelity Cash Central Fund | $ 50,101 |
Fidelity Securities Lending Cash Central Fund | 829,746 |
Total | $ 879,847 |
Other Affiliated Issuers |
An affiliated company is a company in which the Fund has ownership of at least 5% of the voting securities. Fiscal year to date transactions with companies which are or were affiliates are as follows: |
Affiliates | Value,
beginning
of period | Purchases | Sales
Proceeds | Dividend
Income | Value,
end
of period |
Brookwell Ltd. Class A | $ 1,078,606 | $ - | $ 724,601 | $ - | $ - |
Centurion Electronics PLC | 12 | - | - | - | 12 |
Pertama Holdings Ltd. | - | 5,470,243 | 107,724 | 659,049 | 7,080,399 |
Total | $ 1,078,618 | $ 5,470,243 | $ 832,325 | $ 659,049 | $ 7,080,411 |
Other Information |
The following is a summary of the inputs used, as of October 31, 2010, involving the Fund's assets and liabilities carried at fair value. The inputs or methodology used for valuing securities may not be an indication of the risk associated with investing in those securities. For more information on valuation inputs, and their aggregation into the levels used in the tables below, please refer to the Security Valuation section in the accompanying Notes to Financial Statements. |
Valuation Inputs at Reporting Date: |
Description | Total | Level 1 | Level 2 | Level 3 |
Investments in Securities: | | | | |
Equities: | | | | |
Japan | $ 203,152,346 | $ 168,463,560 | $ 34,688,786 | $ - |
United Kingdom | 145,404,408 | 142,756,937 | 32,029 | 2,615,442 |
Germany | 80,891,358 | 80,891,358 | - | - |
France | 76,733,217 | 72,333,547 | 4,399,670 | - |
Australia | 64,820,466 | 64,820,466 | - | - |
Cayman Islands | 23,323,503 | 22,799,648 | - | 523,855 |
Canada | 19,219,627 | 19,219,567 | - | 60 |
Norway | 17,803,445 | 17,803,445 | - | - |
Bermuda | 16,607,487 | 16,607,487 | - | - |
Sweden | 12,775,732 | 12,726,914 | - | 48,818 |
Ireland | 8,048,323 | 8,048,309 | - | 14 |
Cyprus | 7,109,871 | 2,242,371 | - | 4,867,500 |
British Virgin Islands | 6,276,684 | 6,276,669 | - | 15 |
United States of America | 4,328,277 | 4,328,240 | - | 37 |
Other | 134,203,130 | 133,841,608 | 361,522 | - |
Investment Companies | 110,933 | - | - | 110,933 |
Government Obligations | 1,529,062 | - | 1,529,062 | - |
Money Market Funds | 73,243,096 | 73,243,096 | - | - |
Total Investments in Securities: | $ 895,580,965 | $ 846,403,222 | $ 41,011,069 | $ 8,166,674 |
Derivative Instruments: | | | | |
Assets | | | | |
Futures Contracts | $ 53,183 | $ 53,183 | $ - | $ - |
Other Information - continued |
The following is a reconciliation of Investments in Securities for which Level 3 inputs were used in determining value: |
Investments in Securities: | |
Beginning Balance | $ 8,316,240 |
Total Realized Gain (Loss) | (8,917,345) |
Total Unrealized Gain (Loss) | 4,243,114 |
Cost of Purchases | 1,804,796 |
Proceeds of Sales | (1,263,414) |
Amortization/Accretion | - |
Transfers in to Level 3 | 5,146,203 |
Transfers out of Level 3 | (1,162,920) |
Ending Balance | $ 8,166,674 |
The change in unrealized gain (loss) for the period attributable to Level 3 securities held at October 31, 2010 | $ 777,510 |
The information used in the above reconciliation represents fiscal year to date activity for any Investments in Securities identified as using Level 3 inputs at either the beginning or the end of the current fiscal period. Transfers in or out of Level 3 represent the beginning value of any Security or Instrument where a change in the pricing level occurred from the beginning to the end of the period. The cost of purchases and the proceeds of sales may include securities received or delivered through corporate actions or exchanges. Realized and unrealized gains (losses) disclosed in the reconciliation are included in Net Gain (Loss) on the Fund's Statement of Operations. |
Value of Derivative Instruments |
The following table is a summary of the Fund's value of derivative instruments by risk exposure as of October 31, 2010. For additional information on derivative instruments, please refer to the Derivative Instruments section in the accompanying Notes to Financial Statements. |
Risk Exposure /
Derivative Type | Value |
| Asset | Liability |
Equity Risk | | |
Futures Contracts (a) | $ 53,183 | $ - |
(a) Reflects cumulative appreciation/(depreciation) on futures contracts as disclosed on the Schedule of Investments. Only the period end variation margin is separately disclosed on the Statement of Assets and Liabilities. |
Income Tax Information |
At October 31, 2010, the Fund had a capital loss carryforward of approximately $78,127,356 all of which will expire on October 31, 2017. Capital loss carryforwards are only available to offset future capital gains of the Fund to the extent provided by regulations and may be limited. |
See accompanying notes which are an integral part of the financial statements.
Annual Report
Statement of Assets and Liabilities
| October 31, 2010 |
| | |
Assets | | |
Investment in securities, at value (including securities loaned of $25,207,989) - See accompanying schedule: Unaffiliated issuers (cost $715,388,858) | $ 815,257,458 | |
Fidelity Central Funds (cost $73,243,096) | 73,243,096 | |
Other affiliated issuers (cost $5,700,832) | 7,080,411 | |
Total Investments (cost $794,332,786) | | $ 895,580,965 |
Cash | | 2 |
Foreign currency held at value (cost $70,040) | | 70,287 |
Receivable for investments sold | | 2,674,189 |
Receivable for fund shares sold | | 2,467,902 |
Dividends receivable | | 2,081,418 |
Distributions receivable from Fidelity Central Funds | | 90,243 |
Receivable for daily variation on futures contracts | | 5,554 |
Other receivables | | 142,637 |
Total assets | | 903,113,197 |
| | |
Liabilities | | |
Payable for investments purchased | | |
Regular delivery | $ 1,182,254 | |
Delayed delivery | 1,689,050 | |
Payable for fund shares redeemed | 2,886,835 | |
Accrued management fee | 652,945 | |
Distribution and service plan fees payable | 24,970 | |
Other affiliated payables | 211,160 | |
Other payables and accrued expenses | 126,294 | |
Collateral on securities loaned, at value | 26,860,023 | |
Total liabilities | | 33,633,531 |
| | |
Net Assets | | $ 869,479,666 |
Net Assets consist of: | | |
Paid in capital | | $ 851,358,414 |
Undistributed net investment income | | 2,441,101 |
Accumulated undistributed net realized gain (loss) on investments and foreign currency transactions | | (85,653,683) |
Net unrealized appreciation (depreciation) on investments and assets and liabilities in foreign currencies | | 101,333,834 |
Net Assets | | $ 869,479,666 |
See accompanying notes which are an integral part of the financial statements.
Annual Report
Financial Statements - continued
Statement of Assets and Liabilities - continued
| October 31, 2010 |
| | |
Calculation of Maximum Offering Price
Class A:
Net Asset Value and redemption price per share
($19,720,315 ÷ 965,882 shares) | | $ 20.42 |
| | |
Maximum offering price per share (100/94.25 of $20.42) | | $ 21.67 |
Class T:
Net Asset Value and redemption price per share ($16,092,042 ÷ 795,270 shares) | | $ 20.23 |
| | |
Maximum offering price per share (100/96.50 of $20.23) | | $ 20.96 |
Class B:
Net Asset Value and offering price per share ($3,457,061 ÷ 174,710 shares)A | | $ 19.79 |
| | |
Class C:
Net Asset Value and offering price per share ($13,501,307 ÷ 680,118 shares)A | | $ 19.85 |
| | |
International Small Cap:
Net Asset Value, offering price and redemption price per share ($808,478,028 ÷ 39,124,218 shares) | | $ 20.66 |
| | |
Institutional Class:
Net Asset Value, offering price and redemption price per share ($8,230,913 ÷ 398,399 shares) | | $ 20.66 |
A Redemption price per share is equal to net asset value less any applicable contingent deferred sales charge.
See accompanying notes which are an integral part of the financial statements.
Annual Report
Statement of Operations
| Year ended October 31, 2010 |
Investment Income | | |
Dividends (including $659,049 earned from other affiliated issuers) | | $ 13,399,968 |
Interest | | 2,449 |
Income from Fidelity Central Funds (including $829,746 from security lending) | | 879,847 |
Income before foreign taxes withheld | | 14,282,264 |
Less foreign taxes withheld | | (840,519) |
Total income | | 13,441,745 |
| | |
Expenses | | |
Management fee
Basic fee | $ 6,469,279 | |
Performance adjustment | 1,311,370 | |
Transfer agent fees | 2,167,890 | |
Distribution and service plan fees | 254,737 | |
Accounting and security lending fees | 371,480 | |
Custodian fees and expenses | 294,480 | |
Independent trustees' compensation | 4,208 | |
Registration fees | 88,212 | |
Audit | 141,668 | |
Legal | 3,656 | |
Miscellaneous | 10,051 | |
Total expenses before reductions | 11,117,031 | |
Expense reductions | (199,347) | 10,917,684 |
Net investment income (loss) | | 2,524,061 |
Realized and Unrealized Gain (Loss) Net realized gain (loss) on: | | |
Investment securities: | | |
Unaffiliated issuers (net of foreign taxes of $39,190) | 48,923,650 | |
Other affiliated issuers | (1,945,619) | |
Foreign currency transactions | 7,621 | |
Futures contracts | (1,268,507) | |
Capital gain distributions from Fidelity Central Funds | 1,843 | |
Total net realized gain (loss) | | 45,718,988 |
Change in net unrealized appreciation (depreciation) on: Investment securities (net of decrease in deferred foreign taxes of $17,326) | 97,289,267 | |
Assets and liabilities in foreign currencies | 34,009 | |
Futures contracts | 53,183 | |
Total change in net unrealized appreciation (depreciation) | | 97,376,459 |
Net gain (loss) | | 143,095,447 |
Net increase (decrease) in net assets resulting from operations | | $ 145,619,508 |
See accompanying notes which are an integral part of the financial statements.
Annual Report
Financial Statements - continued
Statement of Changes in Net Assets
| Year ended
October 31,
2010 | Year ended
October 31,
2009 |
Increase (Decrease) in Net Assets | | |
Operations | | |
Net investment income (loss) | $ 2,524,061 | $ 3,237,964 |
Net realized gain (loss) | 45,718,988 | (79,176,066) |
Change in net unrealized appreciation (depreciation) | 97,376,459 | 297,287,070 |
Net increase (decrease) in net assets resulting from operations | 145,619,508 | 221,348,968 |
Distributions to shareholders from net investment income | (3,368,409) | - |
Distributions to shareholders from net realized gain | (14,323,742) | - |
Total distributions | (17,692,151) | - |
Share transactions - net increase (decrease) | 26,936,768 | (81,370,441) |
Redemption fees | 118,859 | 67,796 |
Total increase (decrease) in net assets | 154,982,984 | 140,046,323 |
| | |
Net Assets | | |
Beginning of period | 714,496,682 | 574,450,359 |
End of period (including undistributed net investment income of $2,441,101 and undistributed net investment income of $3,237,964, respectively) | $ 869,479,666 | $ 714,496,682 |
See accompanying notes which are an integral part of the financial statements.
Annual Report
Financial Highlights - Class A
Years ended October 31, | 2010 | 2009 | 2008 | 2007 | 2006 |
Selected Per-Share Data | | | | | |
Net asset value, beginning of period | $ 17.28 | $ 11.91 | $ 31.14 | $ 28.79 | $ 26.69 |
Income from Investment Operations | | | | | |
Net investment income (loss) C | .03 | .06 | - H | .03 | (.02) |
Net realized and unrealized gain (loss) | 3.51 | 5.31 | (14.03) | 7.97 | 5.05 |
Total from investment operations | 3.54 | 5.37 | (14.03) | 8.00 | 5.03 |
Distributions from net investment income | (.06) | - | (.03) | - | (.05) |
Distributions from net realized gain | (.34) | - | (5.18) | (5.65) | (2.89) |
Total distributions | (.40) | - | (5.20) I | (5.65) | (2.94) |
Redemption fees added to paid in capital C | - H | - H | - H | - H | .01 |
Net asset value, end of period | $ 20.42 | $ 17.28 | $ 11.91 | $ 31.14 | $ 28.79 |
Total Return A,B | 20.85% | 45.09% | (53.35)% | 33.43% | 20.22% |
Ratios to Average Net Assets D,G | | | | | |
Expenses before reductions | 1.71% | 1.75% | 1.82% | 1.53% | 1.64% |
Expenses net of fee waivers, if any | 1.65% | 1.65% | 1.65% | 1.53% | 1.64% |
Expenses net of all reductions | 1.63% | 1.62% | 1.60% | 1.49% | 1.58% |
Net investment income (loss) | .16% | .41% | -% F | .10% | (.08)% |
Supplemental Data | | | | | |
Net assets, end of period (000 omitted) | $ 19,720 | $ 17,590 | $ 13,561 | $ 38,585 | $ 36,701 |
Portfolio turnover rate E | 66% | 81% | 113% | 70% | 84% |
A Total returns would have been lower had certain expenses not been reduced during the periods shown.
B Total returns do not include the effect of the sales charges.
C Calculated based on average shares outstanding during the period.
D Fees and expenses of the underlying Fidelity Central Funds are not included in the Fund's expense ratio. The Fund indirectly bears its proportionate share of the expenses of any underlying Fidelity Central Funds.
E Amount does not include the portfolio activity of any underlying Fidelity Central Funds.
F Amount represents less than .01%.
G Expense ratios reflect operating expenses of the class. Expenses before reductions do not reflect amounts reimbursed by the investment adviser or reductions from brokerage service arrangements or reductions from other expense offset arrangements and do not represent the amount paid by the class during periods when reimbursements or reductions occur. Expenses net of fee waivers reflect expenses after reimbursement by the investment adviser but prior to reductions from brokerage service arrangements or other expense offset arrangements. Expenses net of all reductions represent the net expenses paid by the class.
H Amount represents less than $.01 per share.
I Total distributions of $5.20 per share is comprised of distributions from net investment income of $.026 and distributions from net realized gain of $5.176 per share.
See accompanying notes which are an integral part of the financial statements.
Annual Report
Financial Highlights - Class T
Years ended October 31, | 2010 | 2009 | 2008 | 2007 | 2006 |
Selected Per-Share Data | | | | | |
Net asset value, beginning of period | $ 17.14 | $ 11.84 | $ 30.96 | $ 28.64 | $ 26.57 |
Income from Investment Operations | | | | | |
Net investment income (loss) C | (.02) | .02 | (.05) | (.04) | (.09) |
Net realized and unrealized gain (loss) | 3.47 | 5.28 | (13.95) | 7.93 | 5.03 |
Total from investment operations | 3.45 | 5.30 | (14.00) | 7.89 | 4.94 |
Distributions from net investment income | (.02) | - | - | - | - |
Distributions from net realized gain | (.34) | - | (5.12) | (5.57) | (2.88) |
Total distributions | (.36) | - | (5.12) | (5.57) | (2.88) |
Redemption fees added to paid in capital C | - G | - G | - G | - G | .01 |
Net asset value, end of period | $ 20.23 | $ 17.14 | $ 11.84 | $ 30.96 | $ 28.64 |
Total Return A,B | 20.46% | 44.76% | (53.46)% | 33.07% | 19.93% |
Ratios to Average Net Assets D,F | | | | | |
Expenses before reductions | 1.97% | 2.00% | 2.07% | 1.77% | 1.89% |
Expenses net of fee waivers, if any | 1.90% | 1.90% | 1.90% | 1.77% | 1.89% |
Expenses net of all reductions | 1.88% | 1.86% | 1.86% | 1.73% | 1.83% |
Net investment income (loss) | (.09)% | .16% | (.25)% | (.14)% | (.32)% |
Supplemental Data | | | | | |
Net assets, end of period (000 omitted) | $ 16,092 | $ 15,760 | $ 13,493 | $ 40,823 | $ 41,982 |
Portfolio turnover rate E | 66% | 81% | 113% | 70% | 84% |
A Total returns would have been lower had certain expenses not been reduced during the periods shown.
B Total returns do not include the effect of the sales charges.
C Calculated based on average shares outstanding during the period.
D Fees and expenses of the underlying Fidelity Central Funds are not included in the Fund's expense ratio. The Fund indirectly bears its proportionate share of the expenses of any underlying Fidelity Central Funds.
E Amount does not include the portfolio activity of any underlying Fidelity Central Funds.
F Expense ratios reflect operating expenses of the class. Expenses before reductions do not reflect amounts reimbursed by the investment adviser or reductions from brokerage service arrangements or reductions from other expense offset arrangements and do not represent the amount paid by the class during periods when reimbursements or reductions occur. Expenses net of fee waivers reflect expenses after reimbursement by the investment adviser but prior to reductions from brokerage service arrangements or other expense offset arrangements. Expenses net of all reductions represent the net expenses paid by the class.
G Amount represents less than $.01 per share.
See accompanying notes which are an integral part of the financial statements.
Annual Report
Financial Highlights - Class B
Years ended October 31, | 2010 | 2009 | 2008 | 2007 | 2006 |
Selected Per-Share Data | | | | | |
Net asset value, beginning of period | $ 16.78 | $ 11.65 | $ 30.49 | $ 28.26 | $ 26.24 |
Income from Investment Operations | | | | | |
Net investment income (loss)C | (.10) | (.04) | (.16) | (.18) | (.24) |
Net realized and unrealized gain (loss) | 3.39 | 5.17 | (13.73) | 7.82 | 4.98 |
Total from investment operations | 3.29 | 5.13 | (13.89) | 7.64 | 4.74 |
Distributions from net realized gain | (.28) | - | (4.95) | (5.41) | (2.73) |
Redemption fees added to paid in capitalC | - G | - G | - G | - G | .01 |
Net asset value, end of period | $ 19.79 | $ 16.78 | $ 11.65 | $ 30.49 | $ 28.26 |
Total Return A,B | 19.90% | 44.03% | (53.68)% | 32.38% | 19.28% |
Ratios to Average Net Assets D,F | | | | | |
Expenses before reductions | 2.47% | 2.49% | 2.58% | 2.30% | 2.48% |
Expenses net of fee waivers, if any | 2.40% | 2.40% | 2.40% | 2.30% | 2.40% |
Expenses net of all reductions | 2.38% | 2.36% | 2.36% | 2.26% | 2.34% |
Net investment income (loss) | (.59)% | (.33)% | (.75)% | (.66)% | (.84)% |
Supplemental Data | | | | | |
Net assets, end of period (000 omitted) | $ 3,457 | $ 3,601 | $ 3,230 | $ 10,704 | $ 11,354 |
Portfolio turnover rate E | 66% | 81% | 113% | 70% | 84% |
A Total returns would have been lower had certain expenses not been reduced during the periods shown.
B Total returns do not include the effect of the contingent deferred sales charge.
C Calculated based on average shares outstanding during the period.
D Fees and expenses of the underlying Fidelity Central Funds are not included in the Fund's expense ratio. The Fund indirectly bears its proportionate share of the expenses of any underlying Fidelity Central Funds.
E Amount does not include the portfolio activity of any underlying Fidelity Central Funds.
F Expense ratios reflect operating expenses of the class. Expenses before reductions do not reflect amounts reimbursed by the investment adviser or reductions from brokerage service arrangements or reductions from other expense offset arrangements and do not represent the amount paid by the class during periods when reimbursements or reductions occur. Expenses net of fee waivers reflect expenses after reimbursement by the investment adviser but prior to reductions from brokerage service arrangements or other expense offset arrangements. Expenses net of all reductions represent the net expenses paid by the class.
G Amount represents less than $.01 per share.
See accompanying notes which are an integral part of the financial statements.
Annual Report
Financial Highlights - Class C
Years ended October 31, | 2010 | 2009 | 2008 | 2007 | 2006 |
Selected Per-Share Data | | | | | |
Net asset value, beginning of period | $ 16.85 | $ 11.70 | $ 30.62 | $ 28.33 | $ 26.31 |
Income from Investment Operations | | | | | |
Net investment income (loss) C | (.10) | (.04) | (.16) | (.17) | (.23) |
Net realized and unrealized gain (loss) | 3.40 | 5.19 | (13.78) | 7.85 | 4.99 |
Total from investment operations | 3.30 | 5.15 | (13.94) | 7.68 | 4.76 |
Distributions from net realized gain | (.30) | - | (4.98) | (5.39) | (2.75) |
Redemption fees added to paid in capital C | - G | - G | - G | - G | .01 |
Net asset value, end of period | $ 19.85 | $ 16.85 | $ 11.70 | $ 30.62 | $ 28.33 |
Total Return A,B | 19.86% | 44.02% | (53.67)% | 32.39% | 19.34% |
Ratios to Average Net Assets D,F | | | | | |
Expenses before reductions | 2.42% | 2.49% | 2.57% | 2.26% | 2.38% |
Expenses net of fee waivers, if any | 2.40% | 2.40% | 2.40% | 2.26% | 2.38% |
Expenses net of all reductions | 2.37% | 2.36% | 2.36% | 2.22% | 2.32% |
Net investment income (loss) | (.59)% | (.33)% | (.76)% | (.62)% | (.81)% |
Supplemental Data | | | | | |
Net assets, end of period (000 omitted) | $ 13,501 | $ 5,814 | $ 5,658 | $ 20,094 | $ 21,335 |
Portfolio turnover rate E | 66% | 81% | 113% | 70% | 84% |
A Total returns would have been lower had certain expenses not been reduced during the periods shown.
B Total returns do not include the effect of the contingent deferred sales charge.
C Calculated based on average shares outstanding during the period.
D Fees and expenses of the underlying Fidelity Central Funds are not included in the Fund's expense ratio. The Fund indirectly bears its proportionate share of the expenses of any underlying Fidelity Central Funds.
E Amount does not include the portfolio activity of any underlying Fidelity Central Funds.
F Expense ratios reflect operating expenses of the class. Expenses before reductions do not reflect amounts reimbursed by the investment adviser or reductions from brokerage service arrangements or reductions from other expense offset arrangements and do not represent the amount paid by the class during periods when reimbursements or reductions occur. Expenses net of fee waivers reflect expenses after reimbursement by the investment adviser but prior to reductions from brokerage service arrangements or other expense offset arrangements. Expenses net of all reductions represent the net expenses paid by the class.
G Amount represents less than $.01 per share.
See accompanying notes which are an integral part of the financial statements.
Annual Report
Financial Highlights - International Small Cap
Years ended October 31, | 2010 | 2009 | 2008 | 2007 | 2006 |
Selected Per-Share Data | | | | | |
Net asset value, beginning of period | $ 17.48 | $ 12.03 | $ 31.44 | $ 29.03 | $ 26.89 |
Income from Investment Operations | | | | | |
Net investment income (loss) B | .07 | .08 | .03 | .12 | .08 |
Net realized and unrealized gain (loss) | 3.53 | 5.37 | (14.14) | 8.03 | 5.08 |
Total from investment operations | 3.60 | 5.45 | (14.11) | 8.15 | 5.16 |
Distributions from net investment income | (.08) | - | (.12) | (.07) | (.14) |
Distributions from net realized gain | (.34) | - | (5.18) | (5.67) | (2.89) |
Total distributions | (.42) | - | (5.30) | (5.74) | (3.03) |
Redemption fees added to paid in capital B | - F | - F | - F | - F | .01 |
Net asset value, end of period | $ 20.66 | $ 17.48 | $ 12.03 | $ 31.44 | $ 29.03 |
Total Return A | 21.02% | 45.30% | (53.25)% | 33.82% | 20.65% |
Ratios to Average Net Assets C,E | | | | | |
Expenses before reductions | 1.44% | 1.48% | 1.49% | 1.19% | 1.28% |
Expenses net of fee waivers, if any | 1.44% | 1.48% | 1.49% | 1.19% | 1.28% |
Expenses net of all reductions | 1.42% | 1.44% | 1.44% | 1.15% | 1.22% |
Net investment income (loss) | .37% | .58% | .16% | .45% | .29% |
Supplemental Data | | | | | |
Net assets, end of period (000 omitted) | $ 808,478 | $ 669,035 | $ 536,291 | $ 1,663,761 | $ 1,816,059 |
Portfolio turnover rate D | 66% | 81% | 113% | 70% | 84% |
A Total returns would have been lower had certain expenses not been reduced during the periods shown.
B Calculated based on average shares outstanding during the period.
C Fees and expenses of the underlying Fidelity Central Funds are not included in the Fund's expense ratio. The Fund indirectly bears its proportionate share of the expenses of any underlying Fidelity Central Funds.
D Amount does not include the portfolio activity of any underlying Fidelity Central Funds.
E Expense ratios reflect operating expenses of the class. Expenses before reductions do not reflect amounts reimbursed by the investment adviser or reductions from brokerage service arrangements or reductions from other expense offset arrangements and do not represent the amount paid by the class during periods when reimbursements or reductions occur. Expenses net of fee waivers reflect expenses after reimbursement by the investment adviser but prior to reductions from brokerage service arrangements or other expense offset arrangements. Expenses net of all reductions represent the net expenses paid by the class.
F Amount represents less than $.01 per share.
See accompanying notes which are an integral part of the financial statements.
Annual Report
Financial Highlights - Institutional Class
Years ended October 31, | 2010 | 2009 | 2008 | 2007 | 2006 |
Selected Per-Share Data | | | | | |
Net asset value, beginning of period | $ 17.47 | $ 12.01 | $ 31.38 | $ 28.99 | $ 26.86 |
Income from Investment Operations | | | | | |
Net investment income (loss) B | .09 | .09 | .05 | .12 | .08 |
Net realized and unrealized gain (loss) | 3.53 | 5.37 | (14.12) | 8.02 | 5.07 |
Total from investment operations | 3.62 | 5.46 | (14.07) | 8.14 | 5.15 |
Distributions from net investment income | (.09) | - | (.12) | (.07) | (.14) |
Distributions from net realized gain | (.34) | - | (5.18) | (5.68) | (2.89) |
Total distributions | (.43) | - | (5.30) | (5.75) | (3.03) |
Redemption fees added to paid in capital B | - F | - F | - F | - F | .01 |
Net asset value, end of period | $ 20.66 | $ 17.47 | $ 12.01 | $ 31.38 | $ 28.99 |
Total Return A | 21.15% | 45.46% | (53.22)% | 33.84% | 20.65% |
Ratios to Average Net Assets C,E | | | | | |
Expenses before reductions | 1.34% | 1.45% | 1.49% | 1.18% | 1.29% |
Expenses net of fee waivers, if any | 1.34% | 1.40% | 1.40% | 1.18% | 1.29% |
Expenses net of all reductions | 1.31% | 1.37% | 1.35% | 1.14% | 1.23% |
Net investment income (loss) | .47% | .66% | .25% | .45% | .28% |
Supplemental Data | | | | | |
Net assets, end of period (000 omitted) | $ 8,231 | $ 2,696 | $ 2,217 | $ 7,774 | $ 9,050 |
Portfolio turnover rate D | 66% | 81% | 113% | 70% | 84% |
A Total returns would have been lower had certain expenses not been reduced during the periods shown.
B Calculated based on average shares outstanding during the period.
C Fees and expenses of the underlying Fidelity Central Funds are not included in the Fund's expense ratio. The Fund indirectly bears its proportionate share of the expenses of any underlying Fidelity Central Funds.
D Amount does not include the portfolio activity of any underlying Fidelity Central Funds.
E Expense ratios reflect operating expenses of the class. Expenses before reductions do not reflect amounts reimbursed by the investment adviser or reductions from brokerage service arrangements or reductions from other expense offset arrangements and do not represent the amount paid by the class during periods when reimbursements or reductions occur. Expenses net of fee waivers reflect expenses after reimbursement by the investment adviser but prior to reductions from brokerage service arrangements or other expense offset arrangements. Expenses net of all reductions represent the net expenses paid by the class.
F Amount represents less than $.01 per share.
See accompanying notes which are an integral part of the financial statements.
Annual Report
Notes to Financial Statements
For the period ended October 31, 2010
1. Organization.
Fidelity International Small Cap Fund (the Fund) is a fund of Fidelity Investment Trust (the Trust) and is authorized to issue an unlimited number of shares. The Trust is registered under the Investment Company Act of 1940, as amended (the 1940 Act), as an open-end management investment company organized as a Massachusetts business trust. The Fund offers Class A, Class T, Class C, International Small Cap and Institutional Class shares, each of which has equal rights as to assets and voting privileges. Effective after the close of business on September 1, 2010, Class B shares were closed to new accounts and additional purchases by existing shareholders. Each class has exclusive voting rights with respect to matters that affect that class. Class B shares will automatically convert to Class A shares after a holding period of seven years from the initial date of purchase. Investment income, realized and unrealized capital gains and losses, the common expenses of the Fund, and certain fund-level expense reductions, if any, are allocated on a pro-rata basis to each class based on the relative net assets of each class to the total net assets of the Fund. Each class differs with respect to transfer agent and distribution and service plan fees incurred. Certain expense reductions also differ by class.
2. Investments in Fidelity Central Funds.
The Fund may invest in Fidelity Central Funds, which are open-end investment companies available only to other investment companies and accounts managed by Fidelity Management & Research Company (FMR) and its affiliates. The Fund's Schedule of Investments lists each of the Fidelity Central Funds held as of period end, if any, as an investment of the Fund, but does not include the underlying holdings of each Fidelity Central Fund. As an Investing Fund, the Fund indirectly bears its proportionate share of the expenses of the underlying Fidelity Central Funds.
The Money Market Central Funds seek preservation of capital and current income and are managed by Fidelity Investments Money Management, Inc. (FIMM), an affiliate of FMR.
A complete unaudited list of holdings for each Fidelity Central Fund is available upon request or at the Securities and Exchange Commission (the SEC) web site at www.sec.gov. In addition, the financial statements of the Fidelity Central Funds which are not covered by the Fund's Report of Independent Registered Public Accounting Firm, are available on the SEC web site or upon request.
Annual Report
Notes to Financial Statements - continued
3. Significant Accounting Policies.
The financial statements have been prepared in conformity with accounting principles generally accepted in the United States of America (GAAP), which require management to make certain estimates and assumptions at the date of the financial statements. Actual results could differ from those estimates. The following summarizes the significant accounting policies of the Fund:
Security Valuation. Investments are valued as of 4:00 p.m. Eastern time on the last calendar day of the period. The Fund uses independent pricing services approved by the Board of Trustees to value its investments. When current market prices or quotations are not readily available or reliable, valuations may be determined in good faith in accordance with procedures adopted by the Board of Trustees. Factors used in determining value may include market or security specific events, changes in interest rates and credit quality. The frequency with which these procedures are used cannot be predicted and they may be utilized to a significant extent. The value used for net asset value (NAV) calculation under these procedures may differ from published prices for the same securities.
The Fund categorizes the inputs to valuation techniques used to value its investments into a disclosure hierarchy consisting of three levels as shown below.
Level 1 - quoted prices in active markets for identical investments
Level 2 - other significant observable inputs (including quoted prices for similar investments, interest rates, prepayment speeds, etc.)
Level 3 - unobservable inputs (including the fund's own assumptions based on the best information available)
Changes in valuation techniques may result in transfers in or out of an assigned level within the disclosure hierarchy. The aggregate value of investments by input level, as of October 31, 2010, as well as a roll forward of Level 3 securities, is included at the end of the Fund's Schedule of Investments. Valuation techniques used to value the Fund's investments by major category are as follows.
Equity securities, including restricted securities, for which market quotations are readily available, are valued at the last reported sale price or official closing price as reported by an independent pricing service on the primary market or exchange on which they are traded and are categorized as Level 1 in the hierarchy. In the event there were no sales during the day or closing prices are not available, securities are valued at the last quoted bid price or may be valued using the last available price and are generally categorized as Level 2 in the hierarchy. For foreign equity securities, when significant market or security specific events arise, comparisons to the valuation of American Depositary Receipts
Annual Report
3. Significant Accounting Policies - continued
Security Valuation - continued
(ADRs), futures contracts, Exchange-traded funds (ETFs) and certain indexes as well as quoted prices for similar securities are used and are categorized as Level 2 in the hierarchy in these circumstances. Utilizing these techniques may result in significant transfers between Level 1 and Level 2. For restricted equity securities and private placements where observable inputs are limited, assumptions about market activity and risk are used and are categorized as Level 3 in the hierarchy.
Debt securities, including restricted securities, are valued based on evaluated prices received from independent pricing services or from dealers who make markets in such securities. For foreign government and government agency obligations, pricing services utilize matrix pricing which considers yield or price of bonds of comparable quality, coupon, maturity and type as well as dealer supplied prices and are generally categorized as Level 2 in the hierarchy.
Futures contracts are valued at the settlement price established each day by the board of trade or exchange on which they are traded and are categorized as Level 1 in the hierarchy. Investments in open-end mutual funds, including the Fidelity Central Funds, are valued at their closing net asset value each business day and are categorized as Level 1 in the hierarchy. Short-term securities with remaining maturities of sixty days or less for which quotations are not readily available are valued at amortized cost, which approximates fair value and are categorized as Level 2 in the hierarchy.
When independent prices are unavailable or unreliable, debt securities may be valued utilizing pricing matrices which consider similar factors that would be used by independent pricing services. These are generally categorized as Level 2 in the hierarchy but may be Level 3 depending on the circumstances.
Foreign Currency. The Fund uses foreign currency contracts to facilitate transactions in foreign-denominated securities. Gains and losses from these transactions may arise from changes in the value of the foreign currency or if the counterparties do not perform under the contracts' terms.
Foreign-denominated assets, including investment securities, and liabilities are translated into U.S. dollars at the exchange rate at period end. Purchases and sales of investment securities, income and dividends received and expenses denominated in foreign currencies are translated into U.S. dollars at the exchange rate in effect on the transaction date.
The effects of exchange rate fluctuations on investments are included with the net realized and unrealized gain (loss) on investment securities. Other foreign currency transactions resulting in realized and unrealized gain (loss) are disclosed separately.
Annual Report
Notes to Financial Statements - continued
3. Significant Accounting Policies - continued
Investment Transactions and Income. For financial reporting purposes, the Fund's investment holdings and NAV include trades executed through the end of the last business day of the period. The NAV per share for processing shareholder transactions is calculated as of the close of business of the New York Stock Exchange (NYSE), normally 4:00 p.m. Eastern time and includes trades executed through the end of the prior business day. Gains and losses on securities sold are determined on the basis of identified cost and may include proceeds received from litigation. Dividend income is recorded on the ex-dividend date, except for certain dividends from foreign securities where the ex-dividend date may have passed, which are recorded as soon as the Fund is informed of the ex-dividend date. Non-cash dividends included in dividend income, if any, are recorded at the fair market value of the securities received. Distributions received on securities that represent a return of capital or capital gain are recorded as a reduction of cost of investments and/or as a realized gain. The Fund estimates the components of distributions received that may be considered return of capital distributions or capital gain distributions. Interest income and distributions from the Fidelity Central Funds are accrued as earned. Interest income includes coupon interest and amortization of premium and accretion of discount on debt securities. Investment income is recorded net of foreign taxes withheld where recovery of such taxes is uncertain.
Expenses. Most expenses of the Trust can be directly attributed to a fund. Expenses which cannot be directly attributed are apportioned amongst each fund in the Trust. Expense estimates are accrued in the period to which they relate and adjustments are made when actual amounts are known.
Income Tax Information and Distributions to Shareholders. Each year the Fund intends to qualify as a regulated investment company, including distributing substantially all of its taxable income and realized gains under Subchapter M of the Internal Revenue Code and filing its U.S. federal tax return. As a result, no provision for income taxes is required. As of October 31, 2010, the Fund did not have any unrecognized tax benefits in the accompanying financial statements. A fund's federal tax return is subject to examination by the Internal Revenue Service (IRS) for a period of three years. Foreign taxes are provided for based on the Fund's understanding of the tax rules and rates that exist in the foreign markets in which it invests. The Fund is subject to a tax imposed on short term capital gains on securities of certain issuers domiciled in India. The Fund records an estimated deferred tax liability included in Other payables and accrued expenses in the accompanying Statement of Assets & Liabilities for net unrealized gains on these securities in an amount that would be payable if the securities were disposed of at period end.
Annual Report
3. Significant Accounting Policies - continued
Income Tax Information and Distributions to Shareholders - continued
Distributions are declared and recorded on the ex-dividend date. Income dividends and capital gain distributions are declared separately for each class. Income and capital gain distributions are determined in accordance with income tax regulations, which may differ from GAAP.
Capital accounts within the financial statements are adjusted for permanent book-tax differences. These adjustments have no impact on net assets or the results of operations. Temporary book-tax differences will reverse in a subsequent period.
Book-tax differences are primarily due to the short-term gain distributions from the Fidelity Central Funds, futures transactions, certain foreign taxes, foreign currency transactions, passive foreign investment companies (PFIC), capital loss carryforwards and losses deferred due to wash sales.
The federal tax cost of investment securities and unrealized appreciation (depreciation) as of period end were as follows:
Gross unrealized appreciation | $ 176,930,918 |
Gross unrealized depreciation | (111,385,171) |
Net unrealized appreciation (depreciation) | $ 65,545,747 |
| |
Tax Cost | $ 830,035,218 |
The tax-based components of distributable earnings as of period end were as follows:
Undistributed ordinary income | $ 30,617,208 |
Capital loss carryforward | $ (78,127,356) |
Net unrealized appreciation (depreciation) | $ 65,646,142 |
The tax character of distributions paid was as follows:
| October 31,
2010 | October 31,
2009 |
Ordinary Income | $ 17,692,151 | $ - |
Short-Term Trading (Redemption) Fees. Shares held by investors in the Fund less than 90 days are subject to a redemption fee equal to 2.00% of the net asset value of shares redeemed. All redemption fees, which reduce the proceeds of the shareholder redemption, are retained by the Fund and accounted for as an addition to paid in capital.
Annual Report
Notes to Financial Statements - continued
4. Operating Policies.
Delayed Delivery Transactions and When-Issued Securities. The Fund may purchase or sell securities on a delayed delivery or when-issued basis. Payment and delivery may take place after the customary settlement period for that security. The price of the underlying securities and the date when the securities will be delivered and paid for are fixed at the time the transaction is negotiated. During the time a delayed delivery sell is outstanding, the contract is marked-to-market daily and equivalent deliverable securities are held for the transaction. The securities purchased on a delayed delivery or when-issued basis are identified as such in the Fund's Schedule of Investments. The Fund may receive compensation for interest forgone in the purchase of a delayed delivery or when-issued security. With respect to purchase commitments, the Fund identifies securities as segregated in its records with a value at least equal to the amount of the commitment. Losses may arise due to changes in the value of the underlying securities or if the counterparty does not perform under the contract's terms, or if the issuer does not issue the securities due to political, economic, or other factors.
Restricted Securities. The Fund may invest in securities that are subject to legal or contractual restrictions on resale. These securities generally may be resold in transactions exempt from registration or to the public if the securities are registered. Disposal of these securities may involve time-consuming negotiations and expense, and prompt sale at an acceptable price may be difficult. Information regarding restricted securities is included at the end of the Fund's Schedule of Investments.
5. Derivative Instruments.
Risk Exposures and the Use of Derivative Instruments. The Fund uses derivative instruments (derivatives), including futures contracts, in order to meet its investment objectives. The strategy is to use derivatives to increase returns, to gain exposure to certain types of assets and to manage exposure to certain risks as defined below. The success of any strategy involving derivatives depends on analysis of numerous economic factors, and if the strategies for investment do not work as intended, the Fund may not achieve its objectives.
The Fund's use of derivatives may increase or decrease its exposure to the following risk:
Equity Risk | Equity risk relates to the fluctuations in the value of financial instruments as a result of changes in market prices (other than those arising from interest rate risk or foreign exchange risk), whether caused by factors specific to an individual investment, its issuer, or all factors affecting all instruments traded in a market or market segment. |
Annual Report
5. Derivative Instruments - continued
Risk Exposures and the Use of Derivative Instruments - continued
The Fund is also exposed to additional risks from investing in derivatives, such as liquidity risk and counterparty credit risk. Liquidity risk is the risk that the Fund will be unable to sell the derivative in the open market in a timely manner. Counterparty credit risk is the risk that the counterparty will not be able to fulfill its obligation to the Fund. The Fund's maximum risk of loss from counterparty credit risk is generally the aggregate unrealized appreciation and unpaid counterparty fees in excess of any collateral pledged by the counterparty to the Fund. Counterparty risk related to exchange-traded futures contracts is minimal because of the protection provided by the exchange on which they trade. Risk of loss may exceed the amounts recognized in the Statement of Assets and Liabilities.
Net Realized Gain (Loss) and Change in Net Unrealized Appreciation (Depreciation) on Derivatives. The table below, which reflects the impacts of derivatives on the financial performance of the Fund, summarizes the net realized gain (loss) and change in net unrealized appreciation (depreciation) for derivatives during the period.
Risk Exposure / Derivative Type | Net Realized
Gain (Loss) | Change in
Net Unrealized
Appreciation (Depreciation) |
Equity Risk | | |
Futures Contracts (a) | $ (1,268,507) | $ 53,183 |
(a) A summary of the value of derivatives by risk exposure as of period end, if any, is included at the end of the Schedule of Investments and is representative of activity for the period.
Futures Contracts. A futures contract is an agreement between two parties to buy or sell a specified underlying instrument for a fixed price at a specified future date. The Fund uses futures contracts to manage its exposure to the stock market.
Upon entering into a futures contract, a fund is required to deposit either cash or securities (initial margin) with a clearing broker in an amount equal to a certain percentage of the face value of the contract. Futures contracts are marked-to-market daily and subsequent payments (variation margin) are made or received by a fund depending on the daily fluctuations in the value of the futures contracts and are recorded as unrealized appreciation or (depreciation). Realized gain or (loss) is recorded upon the expiration or closing of a futures contract. The net realized gain (loss) and change in net unrealized appreciation (depreciation) on futures contracts during the period is included in the Statement of Operations.
Annual Report
Notes to Financial Statements - continued
5. Derivative Instruments - continued
Futures Contracts - continued
The underlying face amount at value of open futures contracts at period end is shown in the Schedule of Investments under the caption "Futures Contracts." This amount reflects each contract's exposure to the underlying instrument at period end. Securities deposited to meet initial margin requirements are identified in the Schedule of Investments. The receivable and/or payable for the variation margin are reflected in the Statement of Assets and Liabilities.
Certain risks may arise upon entering into futures contracts, including the risk that an illiquid market may limit the ability to close out a futures contract prior to settlement date.
6. Purchases and Sales of Investments.
Purchases and sales of securities, other than short-term securities, aggregated $476,133,271 and $487,415,757, respectively.
7. Fees and Other Transactions with Affiliates.
Management Fee. FMR and its affiliates provide the Fund with investment management related services for which the Fund pays a monthly management fee. The management fee is the sum of an individual fund fee rate that is based on an annual rate of .60% of the Fund's average net assets and a group fee rate that averaged .26% during the period. The group fee rate is based upon the average net assets of all the mutual funds advised by FMR. The group fee rate decreases as assets under management increase and increases as assets under management decrease. In addition, the management fee is subject to a performance adjustment (up to a maximum of ±.20% of the Fund's average net assets over a 36 month performance period). The upward or downward adjustment to the management fee is based on the relative investment performance of International Small Cap as compared to an appropriate benchmark index. For the period, the total annual management fee rate, including the performance adjustment, was 1.03% of the Fund's average net assets.
Distribution and Service Plan Fees. In accordance with Rule 12b-1 of the 1940 Act, the Fund has adopted separate Distribution and Service Plans for each class of shares. Certain classes pay Fidelity Distributors Corporation (FDC), an affiliate of FMR, separate Distribution and Service Fees, each of which is based on an annual percentage of each class' average net assets. In addition, FDC may pay financial intermediaries for selling shares of the Fund and providing shareholder support services. For the
Annual Report
7. Fees and Other Transactions with Affiliates - continued
Distribution and Service Plan Fees - continued
period, the Distribution and Service Fee rates, total fees and amounts retained by FDC were as follows:
| Distribution
Fee | Service
Fee | Total Fees | Retained
by FDC |
Class A | -% | .25% | $ 46,378 | $ 908 |
Class T | .25% | .25% | 77,108 | - |
Class B | .75% | .25% | 33,825 | 25,398 |
Class C | .75% | .25% | 97,426 | 5,162 |
| | | $ 254,737 | $ 31,468 |
Sales Load. FDC receives a front-end sales charge of up to 5.75% for selling Class A shares, and 3.50% for selling Class T shares, some of which is paid to financial intermediaries for selling shares of the Fund. FDC receives the proceeds of contingent deferred sales charges levied on Class A, Class T, Class B, and Class C redemptions. These charges depend on the holding period. The deferred sales charges range from 5% to 1% for Class B, 1% for Class C, 1.00% for certain purchases of Class A shares (1.00% to .50% prior to July 12, 2010) and .25% for certain purchases of Class T shares.
For the period, sales charge amounts retained by FDC were as follows:
| Retained
by FDC |
Class A | $ 5,297 |
Class T | 1,916 |
Class B* | 3,454 |
Class C* | 33 |
| $ 10,700 |
* When Class B and Class C shares are initially sold, FDC pays commissions from its own resources to financial intermediaries through which the sales are made.
Transfer Agent Fees. Fidelity Investments Institutional Operations Company, Inc. (FIIOC), an affiliate of FMR, is the transfer, dividend disbursing and shareholder servicing agent for each class of the Fund. FIIOC receives account fees and asset-based fees
Annual Report
Notes to Financial Statements - continued
7. Fees and Other Transactions with Affiliates - continued
Transfer Agent Fees - continued
that vary according to the account size and type of account of the shareholders of the respective classes of the Fund. FIIOC pays for typesetting, printing and mailing of shareholder reports, except proxy statements. For the period, transfer agent fees for each class were as follows:
| Amount | % of
Average
Net Assets |
Class A | $ 57,208 | .31 |
Class T | 48,466 | .31 |
Class B | 10,550 | .31 |
Class C | 27,486 | .28 |
International Small Cap | 2,013,385 | .29 |
Institutional Class | 10,795 | .22 |
| $ 2,167,890 | |
Accounting and Security Lending Fees. Fidelity Service Company, Inc. (FSC), an affiliate of FMR, maintains the Fund's accounting records. The accounting fee is based on the level of average net assets for the month. Under a separate contract, FSC administers the security lending program. The security lending fee is based on the number and duration of lending transactions.
Brokerage Commissions. The Fund placed a portion of its portfolio transactions with brokerage firms which are affiliates of the investment adviser. The commissions paid to these affiliated firms were $11 for the period.
8. Committed Line of Credit.
The Fund participates with other funds managed by FMR or an affiliate in a $3.75 billion credit facility (the "line of credit") to be utilized for temporary or emergency purposes to fund shareholder redemptions or for other short-term liquidity purposes. The Fund has agreed to pay commitment fees on its pro-rata portion of the line of credit, which amounted to $2,930 and is reflected in Miscellaneous expenses on the Statement of Operations. During the period, there were no borrowings on this line of credit.
Annual Report
9. Security Lending.
The Fund lends portfolio securities through a lending agent from time to time in order to earn additional income. The lending agent may loan securities to certain qualified borrowers, including Fidelity Capital Markets (FCM), a broker-dealer affiliated with the Fund. On the settlement date of the loan, the Fund receives collateral (in the form of U.S. Treasury obligations, letters of credit and/or cash) against the loaned securities and maintains collateral in an amount not less than 100% of the market value of the loaned securities during the period of the loan. The market value of the loaned securities is determined at the close of business of the Fund and any additional required collateral is delivered to the Fund on the next business day. If the borrower defaults on its obligation to return the securities loaned because of insolvency or other reasons, a fund could experience delays and costs in recovering the securities loaned or in gaining access to the collateral. Any cash collateral received is invested in the Fidelity Securities Lending Cash Central Fund. The value of loaned securities and cash collateral at period end are disclosed on the Fund's Statement of Assets and Liabilities. The value of securities loaned to FCM at period end was $280,736. Security lending income represents the income earned on investing cash collateral, less rebates paid to borrowers and lending agent fees associated with the loan, plus any premium payments received for lending certain types of securities. Security lending income is presented in the Statement of Operations as a component of income from Fidelity Central Funds and includes $792 from securities loaned to FCM.
10. Expense Reductions.
FMR voluntarily agreed to reimburse each class to the extent annual operating expenses exceeded certain levels of average net assets as noted in the table below. Some expenses, for example interest expense, including commitment fees, are excluded from this reimbursement.
The following classes were in reimbursement during the period:
| Expense
Limitations | Reimbursement
from adviser |
Class A | 1.65% | $ 11,149 |
Class T | 1.90% | 11,145 |
Class B | 2.40% | 2,441 |
Class C | 2.40% | 2,105 |
| | $ 26,840 |
Effective January 1, 2011 the expense limitations will be eliminated.
Many of the brokers with whom FMR places trades on behalf of the Fund provided services to the Fund in addition to trade execution. These services included payments of certain expenses on behalf of the Fund totaling $172,507 for the period.
Annual Report
Notes to Financial Statements - continued
11. Distributions to Shareholders.
Distributions to shareholders of each class were as follows:
Years ended October 31, | 2010 | 2009 |
From net investment income | | |
Class A | $ 59,453 | $ - |
Class T | 16,412 | - |
International Small Cap | 3,278,578 | - |
Institutional Class | 13,966 | - |
Total | $ 3,368,409 | $ - |
From net realized gain | | |
Class A | $ 354,632 | $ - |
Class T | 310,013 | - |
Class B | 60,241 | - |
Class C | 116,929 | - |
International Small Cap | 13,430,315 | - |
Institutional Class | 51,612 | - |
Total | $ 14,323,742 | $ - |
12. Share Transactions.
Transactions for each class of shares were as follows:
| Shares | Dollars |
Years ended October 31, | 2010 | 2009 | 2010 | 2009 |
Class A | | | | |
Shares sold | 380,659 | 269,227 | $ 6,723,746 | $ 3,575,375 |
Reinvestment of distributions | 22,435 | - | 393,061 | - |
Shares redeemed | (454,943) | (389,847) | (8,359,905) | (5,330,857) |
Net increase (decrease) | (51,849) | (120,620) | $ (1,243,098) | $ (1,755,482) |
Class T | | | | |
Shares sold | 143,286 | 158,075 | $ 2,532,790 | $ 2,173,778 |
Reinvestment of distributions | 18,371 | - | 319,658 | - |
Shares redeemed | (286,001) | (377,899) | (4,986,007) | (4,876,919) |
Net increase (decrease) | (124,344) | (219,824) | $ (2,133,559) | $ (2,703,141) |
Class B | | | | |
Shares sold | 14,694 | 8,564 | $ 256,700 | $ 108,038 |
Reinvestment of distributions | 3,302 | - | 56,465 | - |
Shares redeemed | (57,958) | (71,172) | (990,211) | (857,564) |
Net increase (decrease) | (39,962) | (62,608) | $ (677,046) | $ (749,526) |
Class C | | | | |
Shares sold | 430,838 | 21,018 | $ 7,671,593 | $ 275,491 |
Reinvestment of distributions | 6,001 | - | 102,910 | - |
Shares redeemed | (101,847) | (159,519) | (1,759,170) | (1,999,518) |
Net increase (decrease) | 334,992 | (138,501) | $ 6,015,333 | $ (1,724,027) |
Annual Report
12. Share Transactions - continued
Transactions for each class of shares were as follows: - continued
| Shares | Dollars |
Years ended October 31, | 2010 | 2009 | 2010 | 2009 |
International Small Cap | | | | |
Shares sold | 10,330,000 | 4,989,568 | $ 188,548,758 | $ 69,926,221 |
Reinvestment of distributions | 888,440 | - | 15,725,385 | - |
Shares redeemed | (10,371,667) | (11,303,255) | (183,663,034) | (144,001,202) |
Net increase (decrease) | 846,773 | (6,313,687) | $ 20,611,109 | $ (74,074,981) |
Institutional Class | | | | |
Shares sold | 288,839 | 28,026 | $ 5,178,797 | $ 355,084 |
Reinvestment of distributions | 2,890 | - | 51,087 | - |
Shares redeemed | (47,677) | (58,235) | (865,855) | (718,368) |
Net increase (decrease) | 244,052 | (30,209) | $ 4,364,029 | $ (363,284) |
13. Other.
The Fund's organizational documents provide former and current trustees and officers with a limited indemnification against liabilities arising in connection with the performance of their duties to the Fund. In the normal course of business, the Fund may also enter into contracts that provide general indemnifications. The Fund's maximum exposure under these arrangements is unknown as this would be dependent on future claims that may be made against the Fund. The risk of material loss from such claims is considered remote.
Annual Report
To the Trustees of Fidelity Investment Trust and Shareholders of Fidelity International Small Cap Fund:
We have audited the accompanying statement of assets and liabilities of Fidelity International Small Cap Fund (the Fund), a fund of Fidelity Investment Trust, including the schedule of investments, as of October 31, 2010, and the related statement of operations for the year then ended, the statement of changes in net assets for each of the two years in the period then ended, and the financial highlights for each of the five years in the period then ended. These financial statements and financial highlights are the responsibility of the Fund's management. Our responsibility is to express an opinion on these financial statements and financial highlights based on our audits.
We conducted our audits in accordance with standards of the Public Company Accounting Oversight Board (United States). Those standards require that we plan and perform the audit to obtain reasonable assurance about whether the financial statements and financial highlights are free of material misstatement. The Fund is not required to have, nor were we engaged to perform, an audit of its internal control over financial reporting. Our audits included consideration of internal control over financial reporting as a basis for designing audit procedures that are appropriate in the circumstances, but not for the purpose of expressing an opinion on the effectiveness of the Fund's internal control over financial reporting. Accordingly, we express no such opinion. An audit also includes examining, on a test basis, evidence supporting the amounts and disclosures in the financial statements, assessing the accounting principles used and significant estimates made by management, as well as evaluating the overall financial statement presentation. Our procedures included confirmation of securities owned as of October 31, 2010, by correspondence with the custodians and brokers; where replies were not received from brokers, we performed other auditing procedures. We believe that our audits provide a reasonable basis for our opinion.
In our opinion, the financial statements and financial highlights referred to above present fairly, in all material respects, the financial position of Fidelity International Small Cap Fund as of October 31, 2010, the results of its operations for the year then ended, the changes in its net assets for each of the two years in the period then ended, and the financial highlights for each of the five years in the period then ended, in conformity with accounting principles generally accepted in the United States of America.
/s/ Deloitte & Touche LLP
DELOITTE & TOUCHE LLP
Boston, Massachusetts
December 17, 2010
Annual Report
The Trustees, Member of the Advisory Board, and executive officers of the trust and fund, as applicable, are listed below. The Board of Trustees governs the fund and is responsible for protecting the interests of shareholders. The Trustees are experienced executives who meet periodically throughout the year to oversee the fund's activities, review contractual arrangements with companies that provide services to the fund, oversee management of the risks associated with such activities and contractual arrangements, and review the fund's performance. Except for James C. Curvey, each of the Trustees oversees 221 funds advised by FMR or an affiliate. Mr. Curvey oversees 410 funds advised by FMR or an affiliate.
The Trustees hold office without limit in time except that (a) any Trustee may resign; (b) any Trustee may be removed by written instrument, signed by at least two-thirds of the number of Trustees prior to such removal; (c) any Trustee who requests to be retired or who has become incapacitated by illness or injury may be retired by written instrument signed by a majority of the other Trustees; and (d) any Trustee may be removed at any special meeting of shareholders by a two-thirds vote of the outstanding voting securities of the trust. Each Trustee who is not an interested person (as defined in the 1940 Act) (Independent Trustee), shall retire not later than the last day of the calendar year in which his or her 72nd birthday occurs. The Independent Trustees may waive this mandatory retirement age policy with respect to individual Trustees. The executive officers and Advisory Board Member hold office without limit in time, except that any officer and Advisory Board Member may resign or may be removed by a vote of a majority of the Trustees at any regular meeting or any special meeting of the Trustees. Except as indicated, each individual has held the office shown or other offices in the same company for the past five years.
Experience, Skills, Attributes, and Qualifications of the Fund's Trustees. The Governance and Nominating Committee has adopted a statement of policy that describes the experience, qualifications, attributes, and skills that are necessary and desirable for potential Independent Trustee candidates (Statement of Policy). The Board believes that each Trustee satisfied at the time he or she was initially elected or appointed a Trustee, and continues to satisfy, the standards contemplated by the Statement of Policy. The Governance and Nominating Committee also engages professional search firms to help identify potential Independent Trustee candidates who have the experience, qualifications, attributes, and skills consistent with the Statement of Policy. From time to time, additional criteria based on the composition and skills of the current Independent Trustees, as well as experience or skills that may be appropriate in light of future changes to board composition, business conditions, and regulatory or other developments, have also been considered by the professional search firms and the Governance and Nominating Committee. In addition, the Board takes into account the Trustees' commitment and participation in Board and committee meetings, as well as their leadership of standing and ad hoc committees throughout their tenure.
In determining that a particular Trustee was and continues to be qualified to serve as a Trustee, the Board has considered a variety of criteria, none of which, in isolation, was controlling. The Board believes that, collectively, the Trustees have balanced and diverse experience, qualifications, attributes, and skills, which allow the Board to operate effectively in governing the fund and protecting the interests of shareholders. Information about the specific experience, skills, attributes, and qualifications of each Trustee, which in each case led to the Board's conclusion that the Trustee should serve (or continue to serve) as a trustee of the fund, is provided below.
Annual Report
Trustees and Officers - continued
Board Structure and Oversight Function. Edward C. Johnson 3d is an interested person (as defined in the 1940 Act) and currently serves as Chairman. The Trustees have determined that an interested Chairman is appropriate and benefits shareholders because an interested Chairman has a personal and professional stake in the quality and continuity of services provided to the fund. Independent Trustees exercise their informed business judgment to appoint an individual of their choosing to serve as Chairman, regardless of whether the Trustee happens to be independent or a member of management. The Independent Trustees have determined that they can act independently and effectively without having an Independent Trustee serve as Chairman and that a key structural component for assuring that they are in a position to do so is for the Independent Trustees to constitute a substantial majority for the Board. The Independent Trustees also regularly meet in executive session. Ned C. Lautenbach serves as Chairman of the Independent Trustees and as such (i) acts as a liaison between the Independent Trustees and management with respect to matters important to the Independent Trustees and (ii) with management prepares agendas for Board meetings.
Fidelity funds are overseen by different Boards of Trustees. The fund's Board oversees Fidelity's equity and high income funds and another Board oversees Fidelity's investment-grade bond, money market, and asset allocation funds. The asset allocation funds may invest in Fidelity funds overseen by the fund's Board. The use of separate Boards, each with its own committee structure, allows the Trustees of each group of Fidelity funds to focus on the unique issues of the funds they oversee, including common research, investment, and operational issues. On occasion, the separate Boards establish joint committees to address issues of overlapping consequences for the Fidelity funds overseen by each Board.
The Trustees operate using a system of committees to facilitate the timely and efficient consideration of all matters of importance to the Trustees, the fund, and fund shareholders and to facilitate compliance with legal and regulatory requirements and oversight of the fund's activities and associated risks. The Board, acting through its committees, has charged FMR and its affiliates with (i) identifying events or circumstances the occurrence of which could have demonstrably adverse effects on the fund's business and/or reputation; (ii) implementing processes and controls to lessen the possibility that such events or circumstances occur or to mitigate the effects of such events or circumstances if they do occur; and (iii) creating and maintaining a system designed to evaluate continuously business and market conditions in order to facilitate the identification and implementation processes described in (i) and (ii) above. Because the day-to-day operations and activities of the fund are carried out by or through FMR, its affiliates and other service providers, the fund's exposure to risks is mitigated but not eliminated by the processes overseen by the Trustees. While each of the Board's committees has responsibility for overseeing different aspects of the fund's activities, oversight is exercised primarily through the Operations, Audit, and Compliance Committees. Appropriate personnel, including but not limited to the fund's Chief Compliance Officer (CCO), FMR's internal auditor, the independent accountants, the fund's Treasurer and portfolio management personnel, make periodic reports to the Board's committees, as appropriate. The responsibilities of each committee, including their oversight responsibilities, are described further under "Standing Committees of the Fund's Trustees."
Annual Report
The fund's Statement of Additional Information (SAI) includes more information about the Trustees. To request a free copy, call Fidelity at 1-877-208-0098.
Interested Trustees*:
Correspondence intended for each Trustee who is an interested person may be sent to Fidelity Investments, 82 Devonshire Street, Boston, Massachusetts 02109.
Name, Age; Principal Occupations and Other Relevant Experience+ |
Edward C. Johnson 3d (80) |
| Year of Election or Appointment: 1984 Mr. Johnson is Trustee and Chairman of the Board of Trustees of certain Trusts. Mr. Johnson serves as Chief Executive Officer, Chairman, and a Director of FMR LLC; Chairman and a Director of FMR; Chairman and a Director of Fidelity Research & Analysis Company (FRAC); Chairman and a Director of Fidelity Investments Money Management, Inc.; and Chairman and a Director of FMR Co., Inc. In addition, Mr. Johnson serves as Chairman and Director of FIL Limited. Previously, Mr. Johnson served as President of FMR LLC (2006-2007). |
James C. Curvey (75) |
| Year of Election or Appointment: 2007 Mr. Curvey also serves as Trustee (2007-present) of other investment companies advised by FMR. Mr. Curvey is a Director of Fidelity Investments Money Management, Inc. (2009-present), Director of Fidelity Research & Analysis Co. (2009-present) and Director of FMR and FMR Co., Inc. (2007-present). Mr. Curvey is also Vice Chairman (2007-present) and Director of FMR LLC. In addition, Mr. Curvey serves as an Overseer for the Boston Symphony Orchestra and a member of the Trustees of Villanova University. Previously, Mr. Curvey was the Vice Chairman (2006-2007) and Director (2000-2007) of FMR Corp. |
* Trustees have been determined to be "Interested Trustees" by virtue of, among other things, their affiliation with the trust or various entities under common control with FMR.
+ The information above includes each Trustee's principal occupation during the last five years and other information relating to the experience, attributes, and skills relevant to each Trustee's qualifications to serve as a Trustee, which led to the conclusion that each Trustee should serve as a Trustee for the fund.
Independent Trustees:
Correspondence intended for each Independent Trustee (that is, the Trustees other than the Interested Trustees) may be sent to Fidelity Investments, P.O. Box 55235, Boston, Massachusetts 02205-5235.
Name, Age; Principal Occupations and Other Relevant Experience+ |
Dennis J. Dirks (62) |
| Year of Election or Appointment: 2005 Prior to his retirement in May 2003, Mr. Dirks was Chief Operating Officer and a member of the Board of The Depository Trust & Clearing Corporation (DTCC). He also served as President, Chief Operating Officer, and Board member of The Depository Trust Company (DTC) and President and Board member of the National Securities Clearing Corporation (NSCC). In addition, Mr. Dirks served as Chief Executive Officer and Board member of the Government Securities Clearing Corporation, Chief Executive Officer and Board member of the Mortgage-Backed Securities Clearing Corporation, as a Trustee and a member of the Finance Committee of Manhattan College (2005-2008), and as a Trustee and a member of the Finance Committee of AHRC of Nassau County (2006-2008). Mr. Dirks is a member of the Independent Directors Council (IDC) Governing Council (2010-Present) and Board of Directors for The Brookville Center for Children's Services, Inc. (2009-present). |
Alan J. Lacy (57) |
| Year of Election or Appointment: 2008 Mr. Lacy serves as Senior Adviser (2007-present) of Oak Hill Capital Partners, L.P. (private equity). Mr. Lacy also served as Chief Executive Officer (2000-2005) and Vice Chairman (2005-2006) of Sears Holdings Corporation and Sears, Roebuck and Co. (retail). In addition, Mr. Lacy serves as a member of the Board of Directors of The Western Union Company (global money transfer, 2006-present) and Bristol-Myers Squibb Company (global pharmaceuticals, 2007-present). Mr. Lacy is Chairman (2008-present) and a member (2006-present) of the Board of Trustees of The National Parks Conservation Association. |
Ned C. Lautenbach (66) |
| Year of Election or Appointment: 2000 Mr. Lautenbach is Chairman of the Independent Trustees of the Equity and High Income Funds (2006-present). Mr. Lautenbach currently serves as the Lead Director of the Eaton Corporation Board of Directors (diversified industrial, 1997-present). Mr. Lautenbach is also a member of the Board of Directors of the Philharmonic Center for the Arts in Naples, Florida (1999-present); a member of the Board of Trustees of Fairfield University (2005-present); and a member of the Council on Foreign Relations (1994-present). Previously, Mr. Lautenbach was a Partner/Advisory Partner at Clayton, Dubilier & Rice, Inc. (private equity investment, 1998-2010), as well as a Director of Sony Corporation (2006-2007). |
Joseph Mauriello (66) |
| Year of Election or Appointment: 2008 Prior to his retirement in January 2006, Mr. Mauriello served in numerous senior management positions including Deputy Chairman and Chief Operating Officer (2004-2005), and Vice Chairman of Financial Services (2002-2004) of KPMG LLP US (professional services, 1965-2005). Mr. Mauriello currently serves as a member of the Board of Directors of XL Group plc. (global insurance and re-insurance, 2006-present) and of Arcadia Resources Inc. (health care services and products, 2007-present). Previously, Mr. Mauriello served as a Director of the Hamilton Funds of the Bank of New York (2006-2007). |
Cornelia M. Small (66) |
| Year of Election or Appointment: 2005 Ms. Small is a member of the Board of Directors of the Teagle Foundation (2009-present). Ms. Small is also a member of the Investment Committee, and Chair (2008-present) and a member of the Board of Trustees of Smith College. In addition, Ms. Small serves on the Investment Committee of the Berkshire Taconic Community Foundation (2008-present). Previously, Ms. Small served as Chairperson of the Investment Committee (2002-2008) of Smith College. In addition, Ms. Small served as Chief Investment Officer, Director of Global Equity Investments, and a member of the Board of Directors of Scudder, Stevens & Clark and Scudder Kemper Investments. |
William S. Stavropoulos (71) |
| Year of Election or Appointment: 2001 Mr. Stavropoulos is Vice Chairman of the Independent Trustees of the Equity and High Income Funds (2006-present). Mr. Stavropoulos serves as President and Founder of the Michigan Baseball Foundation, the Great Lakes Loons (2007-present). Mr. Stavropoulos is Chairman Emeritus of the Board of Directors of The Dow Chemical Company, where he previously served in numerous senior management positions, including President, CEO (1995-2000; 2002-2004), Chairman of the Executive Committee (2000-2006), and as a member of the Board of Directors (1990-2006). Currently, Mr. Stavropoulos is Chairman of Univar (global distributor of commodity and specialty chemicals, 2010-present), a Director of Teradata Corporation (data warehousing and technology solutions, 2008-present), Chemical Financial Corporation, Maersk Inc. (industrial conglomerate), Tyco International, Inc. (multinational manufacturing and services, 2007-present), and a member of the Advisory Board for Metalmark Capital (private equity investment, 2005-present). Mr. Stavropoulos is a special advisor to Clayton, Dubilier & Rice, Inc. (private equity investment). In addition, Mr. Stavropoulos is a member of the University of Notre Dame Advisory Council for the College of Science. |
David M. Thomas (61) |
| Year of Election or Appointment: 2008 Previously, Mr. Thomas served as Executive Chairman (2005-2006) and Chairman and Chief Executive Officer (2000-2005) of IMS Health, Inc. (pharmaceutical and healthcare information solutions). In addition, Mr. Thomas serves as a member of the Board of Directors of Fortune Brands, Inc. (consumer products), and Interpublic Group of Companies, Inc. (marketing communication, 2004-present). |
Michael E. Wiley (60) |
| Year of Election or Appointment: 2008 Mr. Wiley also serves as a Director of Asia Pacific Exploration Consolidated (international oil and gas exploration and production, 2008-present). Mr. Wiley serves as a Director of Tesoro Corporation (independent oil refiner and marketer, 2005-present), and a Director of Bill Barrett Corporation (exploration and production, 2005-present). In addition, Mr. Wiley also serves as a Director of Post Oak Bank (privately-held bank, 2004-present). Previously, Mr. Wiley served as a member of the Board of Trustees of the University of Tulsa (2000-2006; 2007-2010), as a Senior Energy Advisor of Katzenbach Partners, LLC (consulting, 2006-2007), as an Advisory Director of Riverstone Holdings (private investment), Chairman, President, and CEO of Baker Hughes, Inc. (oilfield services, 2000-2004), and as Director of Spinnaker Exploration Company (exploration and production, 2001-2005). |
+ The information above includes each Trustee's principal occupation during the last five years and other information relating to the experience, attributes, and skills relevant to each Trustee's qualifications to serve as a Trustee, which led to the conclusion that each Trustee should serve as a Trustee for the fund.
Advisory Board Member and Executive Officers:
Correspondence intended for each executive officer and Peter S. Lynch may be sent to Fidelity Investments, 82 Devonshire Street, Boston, Massachusetts 02109.
Name, Age; Principal Occupation |
Peter S. Lynch (66) |
| Year of Election or Appointment: 2003 Member of the Advisory Board of Fidelity's Equity and High Income Funds. Mr. Lynch is Vice Chairman and a Director of FMR and FMR Co., Inc. In addition, Mr. Lynch serves as a Trustee of Boston College and as the Chairman of the Inner-City Scholarship Fund. Previously, Mr. Lynch served on the Special Olympics International Board of Directors (1997-2006). |
Kenneth B. Robins (41) |
| Year of Election or Appointment: 2008 President and Treasurer of Fidelity's Equity and High Income Funds. Mr. Robins also serves as President and Treasurer (2010-present) and Assistant Treasurer (2009-present) of other Fidelity funds and is an employee of Fidelity Investments (2004-present). Previously, Mr. Robins served as Deputy Treasurer of the Fidelity funds (2005-2008) and Treasurer and Chief Financial Officer of The North Carolina Capital Management Trust: Cash and Term Portfolios (2006-2008). |
Brian B. Hogan (46) |
| Year of Election or Appointment: 2009 Vice President of certain Equity Funds and Vice President of Sector Funds. Mr. Hogan also serves as President of FMR's Equity Division (2009-present). Previously, Mr. Hogan served as Senior Vice President, Equity Research of FMR (2006-2009) and as a portfolio manager. |
Thomas C. Hense (46) |
| Year of Election or Appointment: 2008 or 2010 Vice President of Fidelity's High Income (2008), Small Cap (2008), and Value (2010) Funds. Previously, Mr. Hense served as a portfolio manager for Fidelity's Institutional Money Management Group (Pyramis) (2003-2008). |
Scott C. Goebel (42) |
| Year of Election or Appointment: 2008 Secretary and Chief Legal Officer (CLO) of the Fidelity funds. Mr. Goebel also serves as Secretary and CLO of The North Carolina Capital Management Trust: Cash and Term Portfolio (2008-present); General Counsel, Secretary, and Senior Vice President of FMR (2008-present) and FMR Co., Inc. (2008-present); Deputy General Counsel of FMR LLC; Chief Legal Officer of Fidelity Management & Research (Hong Kong) Limited (2008-present) and Assistant Secretary of Fidelity Management & Research (Japan) Inc. (2008-present), Fidelity Investments Money Management, Inc. (2008-present), Fidelity Management & Research (U.K.) Inc. (2008-present), and Fidelity Research and Analysis Company (2008-present). Previously, Mr. Goebel served as Assistant Secretary of the Funds (2007-2008) and as Vice President and Secretary of Fidelity Distributors Corporation (FDC) (2005-2007). |
William C. Coffey (41) |
| Year of Election or Appointment: 2009 Assistant Secretary of Fidelity's Equity and High Income Funds. Mr. Coffey also serves as Senior Vice President and Deputy General Counsel of FMR LLC (2010-present), and is an employee of Fidelity Investments. Previously, Mr. Coffey served as Vice President and Associate General Counsel of FMR LLC (2005-2009). |
Holly C. Laurent (56) |
| Year of Election or Appointment: 2008 Anti-Money Laundering (AML) Officer of the Fidelity funds. Ms. Laurent also serves as AML Officer of The North Carolina Capital Management Trust: Cash and Term Portfolio (2008-present) and is an employee of Fidelity Investments. Previously, Ms. Laurent was Senior Vice President and Head of Legal for Fidelity Business Services India Pvt. Ltd. (2006-2008), and Senior Vice President, Deputy General Counsel and Group Head for FMR LLC (2005-2006). |
Christine Reynolds (52) |
| Year of Election or Appointment: 2008 Chief Financial Officer of the Fidelity funds. Ms. Reynolds became President of Fidelity Pricing and Cash Management Services (FPCMS) in August 2008. Ms. Reynolds served as Chief Operating Officer of FPCMS (2007-2008). Previously, Ms. Reynolds served as President, Treasurer, and Anti-Money Laundering officer of the Fidelity funds (2004-2007). |
Kenneth A. Rathgeber (63) |
| Year of Election or Appointment: 2004 Chief Compliance Officer of Fidelity's Equity and High Income Funds. Mr. Rathgeber is Chief Compliance Officer of Fidelity Management & Research (Hong Kong) Limited (2008-present), Fidelity Management & Research (Japan) Inc. (2008-present), FMR (2005-present), FMR Co., Inc. (2005-present), Fidelity Management & Research (U.K.) Inc. (2005-present), Fidelity Research & Analysis Company (2005-present), Fidelity Investments Money Management, Inc. (2005-present), Pyramis Global Advisors, LLC (2005-present), and Strategic Advisers, Inc. (2005-present). |
Jeffrey S. Christian (49) |
| Year of Election or Appointment: 2009 Deputy Treasurer of the Fidelity funds. Mr. Christian is an employee of Fidelity Investments. Previously, Mr. Christian served as Chief Financial Officer (2008-2009) of certain Fidelity funds and Senior Vice President of Fidelity Pricing and Cash Management Services (FPCMS) (2004-2009). |
Bryan A. Mehrmann (49) |
| Year of Election or Appointment: 2005 Deputy Treasurer of the Fidelity funds. Mr. Mehrmann is an employee of Fidelity Investments. |
Adrien E. Deberghes (43) |
| Year of Election or Appointment: 2008 Deputy Treasurer of Fidelity's Equity and High Income Funds. Mr. Deberghes also serves as Assistant Treasurer of other Fidelity funds (2010-present) and is an employee of Fidelity Investments (2008-present). Previously, Mr. Deberghes served as Senior Vice President of Mutual Fund Administration at State Street Corporation (2007-2008), Senior Director of Mutual Fund Administration at Investors Bank & Trust (2005-2007), and Director of Finance for Dunkin' Brands (2000-2005). |
Stephanie J. Dorsey (41) |
| Year of Election or Appointment: 2010 Assistant Treasurer of Fidelity's Equity and High Income Funds. Ms. Dorsey also serves as Deputy Treasurer of other Fidelity funds (2008-present) and is an employee of Fidelity Investments (2008-present). Previously, Ms. Dorsey served as Treasurer (2004-2008) of the JPMorgan Mutual Funds and Vice President (2004-2008) of JPMorgan Chase Bank. |
John R. Hebble (52) |
| Year of Election or Appointment: 2009 Assistant Treasurer of Fidelity's Equity and High Income Funds. Mr. Hebble also serves as Treasurer and Chief Financial Officer of The North Carolina Capital Management Trust: Cash and Term Portfolio (2008-present), President and Treasurer of other Fidelity funds (2008-present) and is an employee of Fidelity Investments. |
Gary W. Ryan (52) |
| Year of Election or Appointment: 2005 Assistant Treasurer of the Fidelity funds. Mr. Ryan is an employee of Fidelity Investments. Previously, Mr. Ryan served as Vice President of Fund Reporting in Fidelity Pricing and Cash Management Services (FPCMS) (1999-2005). |
Jonathan Davis (42) |
| Year of Election or Appointment: 2010 Assistant Treasurer of the Fidelity funds. Mr. Davis is an employee of Fidelity Investments. Previously, Mr. Davis served as Vice President and Associate General Counsel of FMR LLC (2003-2010). |
Annual Report
The Board of Trustees of Advisor International Small Cap Fund voted to pay to shareholders of record at the opening of business on record date, the following distributions per share derived from capital gains realized from sales of portfolio securities, and dividends derived from net investment income:
| Pay Date | Record Date | Dividends | Capital Gains |
Institutional Class | 12/06/10 | 12/03/10 | $0.056 | $0.661 |
The amounts per share which represent income derived from sources within, and taxes paid to, foreign countries or possessions of the United States are as follows:
| Pay Date | Income | Taxes |
Institutional Class | 12/7/09 | $0.166 | $0.0141 |
The fund will notify shareholders in January 2011 of amounts for use in preparing 2010 income tax returns.
Annual Report
Board Approval of Investment Advisory Contracts and Management Fees
Fidelity International Small Cap Fund
Each year, the Board of Trustees, including the Independent Trustees (together, the Board), votes on the renewal of the management contract and sub-advisory agreements (together, the Advisory Contracts) for the fund. The Board, assisted by the advice of fund counsel and Independent Trustees' counsel, requests and considers a broad range of information relevant to the renewal of the Advisory Contracts throughout the year.
The Board meets regularly and considers at each of its meetings factors that are relevant to its annual consideration of the renewal of the fund's Advisory Contracts, including the services and support provided to the fund and its shareholders. The Board has established various standing committees, each composed of Independent Trustees with varying backgrounds, to which the Board has assigned specific subject matter responsibilities in order to enhance effective decision-making by the Board. The Board, acting directly and through its Committees, requests and receives information concerning the annual consideration of the renewal of the fund's Advisory Contracts. The Board also meets as needed to consider matters specifically related to the Board's annual consideration of the renewal of Advisory Contracts. Members of the Board may also meet with trustees of other Fidelity funds through ad hoc joint committees to discuss certain matters relevant to the Fidelity funds.
At its July 2010 meeting, the Board of Trustees, including the Independent Trustees, unanimously determined to renew the fund's Advisory Contracts. In reaching its determination, the Board considered all factors it believed relevant, including (i) the nature, extent, and quality of the services to be provided to the fund and its shareholders (including the investment performance of the fund); (ii) the competitiveness of the fund's management fee and total expenses; (iii) the total costs of the services to be provided by and the profits to be realized by Fidelity from its relationship with the fund; (iv) the extent to which economies of scale would be realized as the fund grows; and (v) whether fee levels reflect these economies of scale, if any, for the benefit of fund shareholders.
In considering whether to renew the Advisory Contracts for the fund, the Board reached a determination, with the assistance of fund counsel and Independent Trustees' counsel and through the exercise of its business judgment, that the renewal of the Advisory Contracts is in the best interests of fund shareholders and that the compensation to be received by Fidelity under the management contract is fair and reasonable. The Board's decision to renew the Advisory Contracts was not based on any single factor noted above, but rather was based on a comprehensive consideration of all the information provided to the Board at its meetings throughout the year. The Board, in reaching its determination to renew the Advisory Contracts, is aware that shareholders in the fund have a broad range of investment choices available to them, including a wide choice among mutual funds offered by Fidelity's competitors, and that the fund's shareholders, with the opportunity to review and weigh the disclosure provided by the fund in its prospectus and other public disclosures, have chosen to invest in this fund, managed by Fidelity.
Annual Report
Nature, Extent, and Quality of Services Provided. The Board considered the staffing within the investment adviser, FMR, and the sub-advisers (together, the Investment Advisers), including the backgrounds of the fund's investment personnel and the fund's investment objective and discipline. The Independent Trustees also had discussions with senior management of Fidelity's investment operations and investment groups. The Board considered the structure of the portfolio manager compensation program and whether this structure provides appropriate incentives to act in the best interest of the fund.
Resources Dedicated to Investment Management and Support Services. The Board and the equity research subcommittee of the Board's Fund Oversight Committee reviewed the size, education, and experience of the Investment Advisers' investment staff, their use of technology, and the Investment Advisers' approach to recruiting, training, and retaining portfolio managers and other research, advisory, and management personnel. The Board noted that Fidelity's analysts have access to a variety of technological tools and market and securities data that enable them to perform both fundamental and quantitative analysis and to specialize in various disciplines. The Board considered Fidelity's extensive global research capabilities that enable the Investment Advisers to aggregate data from various sources in an effort to produce positive investment results. The Board also considered that Fidelity's portfolio managers and analysts have access to daily portfolio attribution that allows for monitoring of a fund's portfolio, as well as an electronic communication system that provides immediate real-time access to research concerning issuers and credit enhancers. The Board noted FMR's continued focus on strengthening the organization and discipline of equity portfolio management and research.
Shareholder and Administrative Services. The Board considered (i) the nature, extent, quality, and cost of advisory, administrative, and shareholder services performed by the Investment Advisers and their affiliates under the Advisory Contracts and under separate agreements covering transfer agency, pricing and bookkeeping, and securities lending services for the fund; (ii) the nature and extent of the investment adviser's supervision of third party service providers, principally custodians and subcustodians; and (iii) the resources devoted to, and the record of compliance with, the fund's compliance policies and procedures. The Board also reviewed the allocation of fund brokerage, including allocations to brokers affiliated with the Investment Advisers, the use of brokerage commissions to pay fund expenses, and the use of "soft" commission dollars to pay for research services.
The Board noted that the growth of fund assets over time across the complex allows Fidelity to reinvest in the development of services designed to enhance the value or convenience of the Fidelity funds as investment vehicles. These services include 24-hour access to account information and market information through phone representatives and over the Internet, and investor education materials and asset allocation tools.
Annual Report
Board Approval of Investment Advisory Contracts and
Management Fees - continued
Investment in a Large Fund Family. The Board considered the benefits to shareholders of investing in a Fidelity fund, including the benefits of investing in a fund that is part of a large family of funds offering a variety of investment disciplines and providing a large variety of mutual fund investor services. The Board noted that Fidelity had taken, or had made recommendations that resulted in the Fidelity funds taking, a number of actions over the previous year that benefited particular funds, including (i) dedicating additional resources to investment research and restructuring and broadening the focus of the investment research teams; (ii) bolstering the senior management team that oversees asset management; (iii) launching Class F of certain funds as a lower-fee class available to Freedom K and Freedom Index Funds; (iv) lowering the initial investment minimums and ongoing balance requirements for Real Estate High Income Fund; (v) eliminating subsequent purchase minimums for all funds and adding a waiver of the investment minimum requirement for new accounts opened with the proceeds of a systematic withdrawal plan; (vi) eliminating the withdrawal minimum and maximum limits for systematic withdrawals from Advisor funds; (vii) expanding sales load waivers on Class A shares for Destiny Planholders and expanding Institutional Class eligibility for Class O Destiny Planholders; and (viii) changing certain Class A and Class T sales charge structures to further align them with industry practices.
Investment Performance. The Board considered whether the fund has operated in accordance with its investment objective, as well as its record of compliance with its investment restrictions. It also reviewed the fund's absolute investment performance for each class, as well as the fund's relative investment performance for each class measured over multiple periods against (i) a broad-based securities market index, and (ii) a peer group of mutual funds deemed appropriate by Fidelity and reviewed by the Board. The following charts considered by the Board show, over the one-, three-, and five-year periods ended December 31, 2009, the cumulative total returns of Institutional Class (Class I) and Class B of the fund, the cumulative total returns of a broad-based securities market index ("benchmark"), and a range of cumulative total returns of a peer group of mutual funds identified by Lipper Inc. as having an investment objective similar to that of the fund. The returns of Institutional Class (Class I) and Class B show the performance of the highest and lowest performing classes, respectively (based on five-year performance). The box within each chart shows the 25th percentile return (bottom of box) and the 75th percentile return (top of box) of the peer group. Returns shown above the box are in the first quartile and returns shown below the box are in the fourth quartile. The percentage beaten numbers noted below each chart correspond to the percentile box and represent the percentage of funds in the peer group whose performance was equal to or lower than that of the class indicated.
Annual Report
Fidelity International Small Cap Fund

The Board reviewed the fund's relative investment performance against its peer group and noted that the performance of Institutional Class (Class I) of the fund was in the third quartile for the one-year period, the first quartile for the three-year period, and the second quartile for the five-year period. The Board also noted that the investment performance of Institutional Class (Class I) of the fund compared favorably to its benchmark for the three- and five-year periods, although the fund's one-year cumulative total return was lower than its benchmark. The Board considered that the variations in performance among the fund's classes reflect the variations in class expenses, which result in lower performance for higher expense classes. The Board also reviewed the fund's performance since inception as well as performance in the current year.
The Board also considered that the fund's management fee is subject to upward or downward adjustment depending upon whether, and to what extent, the fund's investment performance for the performance period exceeds, or is exceeded by, the record (over the same period) of a Board-approved performance adjustment index. The Board realizes that the performance adjustment provides FMR with a strong economic incentive to seek to achieve superior performance for the fund's shareholders and helps to more closely align the interests of FMR and the fund's shareholders.
Based on its review, and giving particular weight to the nature and quality of the resources dedicated by the Investment Advisers to maintain and improve relative performance and factoring in the unprecedented market events in recent years, the Board concluded that the nature, extent, and quality of investment management and support services and of shareholder and administrative services provided to the fund will benefit the fund's shareholders, particularly in light of the Board's view that the fund's shareholders benefit from investing in a fund that is part of a large family of funds offering a variety of investment disciplines and services.
Annual Report
Board Approval of Investment Advisory Contracts and
Management Fees - continued
Competitiveness of Management Fee and Total Fund Expenses. The Board considered the fund's management fee and total expenses compared to "mapped groups" of competitive funds and classes. Fidelity creates "mapped groups" by combining similar Lipper investment objective categories that have comparable management fee characteristics. Combining Lipper investment objective categories aids the Board's management fee and total expense comparisons by broadening the competitive group used for comparison and by reducing the number of universes to which various Fidelity funds are compared.
Management Fee. The Board considered two proprietary management fee comparisons for the 12-month periods shown in the chart below. The group of Lipper funds used by the Board for management fee comparisons is referred to below as the "Total Mapped Group." The Total Mapped Group is broader than the Lipper peer group used by the Board for performance comparisons because the Total Mapped Group combines several Lipper investment objective categories while the Lipper peer group does not. The Total Mapped Group comparison focuses on a fund's standing relative to the total universe of comparable funds available to investors, in terms of gross management fees before expense reimbursements or caps, and without giving effect to the fund's performance adjustment. "TMG %" represents the percentage of funds in the Total Mapped Group that had management fees that were lower than the fund's. For example, a TMG % of 19% means that 81% of the funds in the Total Mapped Group had higher management fees than the fund. The "Asset-Size Peer Group" (ASPG) comparison focuses on a fund's standing relative to non-Fidelity funds similar in size to the fund within the Total Mapped Group. The ASPG represents at least 15% of the funds in the Total Mapped Group with comparable asset size and management fee characteristics, subject to a minimum of 50 funds (or all funds in the Total Mapped Group if fewer than 50). Additional information, such as the ASPG quartile in which the fund's management fee ranked and the impact of the fund's performance adjustment, is also included in the chart and considered by the Board.
Annual Report
Fidelity International Small Cap Fund

The Board noted that the fund's management fee ranked below the median of its Total Mapped Group and below the median of its ASPG for 2009. The Board also noted the effect of the fund's positive performance adjustment on the fund's management fee ranking. The Board noted that the performance adjustment for each year represents calculations for performance periods that differ from the periods shown in the performance charts above.
Based on its review, the Board concluded that the fund's management fee is fair and reasonable in light of the services that the fund receives and the other factors considered.
Total Expenses. In its review of each class's total expenses, the Board considered the fund's management fee as well as other fund or class expenses, as applicable, such as transfer agent fees, pricing and bookkeeping fees, fund-paid 12b-1 fees, and custodial, legal, and audit fees. The Board also noted the effects of any waivers and reimbursements on fees and expenses, as well as the impact of the fund's performance adjustment. As part of its review, the Board also considered current and historical total expenses of each class of the fund compared to competitive fund median expenses. Each class of the fund is compared to those funds and classes in the Total Mapped Group (used by the Board for management fee comparisons) that have a similar sales load structure.
The Board noted that the total expenses of each of Class A, Class B, Class C, and the retail class ranked below its competitive median for 2009, the total expenses of Institutional Class ranked equal to its competitive median for 2009, and the total expenses of Class T ranked above its competitive median for 2009. The Board considered that the total expenses for Class T were above the median primarily because its 12b-1 fee is higher than the typical front-end load class. The Board noted that the fund offers multiple classes, each of which has a different sales load and 12b-1 fee structure, and that the multiple structures are intended to offer a range of pricing options for the intermediary market. The Board also noted that the total expenses of the classes vary primarily by the level of their 12b-1 fees, although differences in transfer agent fees may also cause expenses to vary from class to class.
Annual Report
Board Approval of Investment Advisory Contracts and
Management Fees - continued
Fees Charged to Other Fidelity Clients. The Board also considered Fidelity fee structures and other information with respect to clients of FMR and its affiliates, such as other mutual funds advised or subadvised by FMR or its affiliates, pension plan clients, and other institutional clients. In March 2010, the Board created an ad hoc joint committee with the board of other Fidelity funds (the Committee) to review and compare Fidelity's institutional investment advisory business with its business of providing services to the Fidelity funds, including the differences in services provided, fees charged, and costs incurred, as well as competition in their respective marketplaces.
Based on its review of total expenses and fees charged to other Fidelity clients, the Board concluded that the total expenses of each class of the fund were reasonable, although in one case above the median of the universe presented for comparison, in light of the services that the fund and its shareholders receive and the other factors considered, including the findings of the Committee.
Costs of the Services and Profitability. The Board considered the revenues earned and the expenses incurred by Fidelity in conducting the business of developing, marketing, distributing, managing, administering and servicing the fund and its shareholders. The Board also considered the level of Fidelity's profits in respect of all the Fidelity funds.
On an annual basis, FMR presents to the Board Fidelity's profitability for the fund. Fidelity calculates the profitability for each fund, as well as aggregate profitability for groups of Fidelity funds and all Fidelity funds, using a series of detailed revenue and cost allocation methodologies which originate with the audited books and records of Fidelity. The Audit Committee of the Board reviews any significant changes from the prior year's methodologies.
PricewaterhouseCoopers LLP (PwC), independent registered public accounting firm and auditor to Fidelity and certain Fidelity funds, has been engaged annually by the Board as part of the Board's assessment of Fidelity's profitability analysis. PwC's engagement includes the review and assessment of Fidelity's methodologies used in determining the revenues and expenses attributable to Fidelity's mutual fund business, and completion of agreed-upon procedures surrounding the mathematical accuracy of fund profitability and its conformity to allocation methodologies. After considering PwC's reports issued under the engagement and information provided by Fidelity, the Board believes that while other allocation methods may also be reasonable, Fidelity's profitability methodologies are reasonable in all material respects.
Annual Report
The Board has also reviewed Fidelity's non-fund businesses and fall-out benefits related to the mutual fund business as well as cases where Fidelity's affiliates may benefit from or be related to the fund's business.
The Board considered the costs of the services provided by and the profits realized by Fidelity in connection with the operation of the fund and were satisfied that the profitability was not excessive in the circumstances.
Economies of Scale. The Board considered whether there have been economies of scale in respect of the management of the Fidelity funds, whether the Fidelity funds (including the fund) have appropriately benefited from any such economies of scale, and whether there is potential for realization of any further economies of scale. The Board considered the extent to which the fund will benefit from economies of scale through increased services to the fund, through waivers or reimbursements, or through fee or expense reductions.
In February 2009, the Board and the board of other Fidelity funds created an ad hoc committee (the Economies of Scale Committee) to analyze whether FMR attains economies of scale in respect of the management and servicing of the Fidelity funds, whether the Fidelity funds have appropriately benefited from such economies of scale, and whether there is potential for realization of any further economies of scale.
The Board recognized that the fund's management contract incorporates a "group fee" structure, which provides for lower group fee rates as total fund assets under FMR's management increase, and for higher group fee rates as total fund assets under FMR's management decrease. FMR calculates the group fee rates based on a tiered asset "breakpoint" schedule that varies based on asset class. The Board considered that the group fee is designed to deliver the benefits of economies of scale to fund shareholders when total Fidelity fund assets increase, even if assets of any particular fund are unchanged or have declined, because some portion of Fidelity's costs are attributable to services provided to all Fidelity funds, and all funds benefit if those costs can be allocated among more assets. The Board concluded that, given the group fee structure, fund shareholders will benefit from lower management fees as assets under FMR's management increase at the fund complex level, regardless of whether Fidelity achieves any such economies of scale.
The Board concluded, considering the findings of the Economies of Scale Committee, that any potential economies of scale are being appropriately shared between fund shareholders and Fidelity.
Additional Information Requested by the Board. In order to develop fully the factual basis for consideration of the Fidelity funds' Advisory Contracts, the Board requested and received additional information on certain topics, including (i) fund performance trends, actions to be taken by FMR to improve certain funds' overall performance, and Fidelity's long-term strategies for certain funds; (ii) portfolio manager changes that have occurred during the past year and length of portfolio manager tenure for different categories of funds over time; (iii) Fidelity's compensation structure for portfolio managers, research analysts, and other key personnel, the rationale for the compensation structure, and how the compensation structure provides appropriate performance incentives; (iv) the amount of the investment that each portfolio manager has made in the Fidelity fund(s) that he or she manages; (v) management and other fees paid by FMR to affiliated sub-advisers on behalf of the Fidelity funds; (vi) Fidelity's fee structures and rationale for recommending different fees among different categories of funds; (vii) Fidelity's rationale for recommending which funds should have a performance adjustment component as part of their management fees; (viii) the rationale for any differences between fund fee structures and fee structures in place for other Fidelity clients; and (ix) explanations regarding the relative total expenses borne by certain funds and classes, total expense competitive trends, and actions that might be taken by FMR to reduce total expenses for certain funds and classes.
Annual Report
Board Approval of Investment Advisory Contracts and
Management Fees - continued
Based on its evaluation of all of the conclusions noted above, and after considering all factors it believed relevant, the Board ultimately concluded that the advisory fee structures are fair and reasonable, and that the fund's Advisory Contracts should be renewed.
Annual Report
Investment Adviser
Fidelity Management & Research Company
Boston, MA
Investment Sub-Advisers
FMR Co., Inc.
Fidelity Management & Research
(U.K.) Inc.
Fidelity Research & Analysis
Company
FIL Investment Advisors
FIL Investments (Japan) Limited
FIL Investment Advisors (UK) Ltd.
Fidelity Management & Research
(Hong Kong) Limited
Fidelity Management & Research
(Japan) Inc.
General Distributor
Fidelity Distributors Corporation
Boston, MA
Transfer and Service Agents
Fidelity Investments Institutional Operations Company, Inc.
Boston, MA
Fidelity Service Company, Inc.
Boston, MA
Custodian
The Bank of New York Mellon
New York, NY
AISCI-UANN-1210
1.793572.107
Fidelity®
International Small Cap Opportunities
Fund
Annual Report
October 31, 2010
(2_fidelity_logos) (Registered_Trademark)
Contents
Chairman's Message | <Click Here> | The Chairman's message to shareholders. |
Performance | <Click Here> | How the fund has done over time. |
Management's Discussion of Fund Performance | <Click Here> | The Portfolio Manager's review of fund performance and strategy. |
Shareholder Expense Example | <Click Here> | An example of shareholder expenses. |
Investment Changes | <Click Here> | A summary of major shifts in the fund's investments over the past six months. |
Investments | <Click Here> | A complete list of the fund's investments with their market values. |
Financial Statements | <Click Here> | Statements of assets and liabilities, operations, and changes in net assets, as well as financial highlights. |
Notes | <Click Here> | Notes to the financial statements. |
Report of Independent Registered Public Accounting Firm | <Click Here> | |
Trustees and Officers | <Click Here> | |
Distributions | <Click Here> | |
Board Approval of Investment Advisory Contracts and Management Fees | <Click Here> | |
To view a fund's proxy voting guidelines and proxy voting record for the 12-month period ended June 30, visit http://www.fidelity.com/proxyvotingresults or visit the Securities and Exchange Commission's (SEC) web site at http://www.sec.gov. You may also call 1-800-544-8544 to request a free copy of the proxy voting guidelines.
Standard & Poor's, S&P and S&P 500 are registered service marks of The McGraw-Hill Companies, Inc. and have been licensed for use by Fidelity Distributors Corporation.
Other third party marks appearing herein are the property of their respective owners.
All other marks appearing herein are registered or unregistered trademarks or service marks of FMR LLC or an affiliated company.
Annual Report
This report and the financial statements contained herein are submitted for the general information of the shareholders of the fund. This report is not authorized for distribution to prospective investors in the fund unless preceded or accompanied by an effective prospectus.
A fund files its complete schedule of portfolio holdings with the SEC for the first and third quarters of each fiscal year on Form N-Q. Forms N-Q are available on the SEC's web site at http://www.sec.gov. A fund's Forms N-Q may be reviewed and copied at the SEC's Public Reference Room in Washington, DC. Information regarding the operation of the SEC's Public Reference Room may be obtained by calling 1-800-SEC-0330. For a complete list of a fund's portfolio holdings, view the most recent holdings listing, semiannual report, or annual report on Fidelity's web site at http://www.fidelity.com or http://www.advisor.fidelity.com, as applicable.
NOT FDIC INSURED • MAY LOSE VALUE • NO BANK GUARANTEE
Neither the fund nor Fidelity Distributors Corporation is a bank.
Annual Report
(photo_of_Edward_C_Johnson_3d)
Dear Shareholder:
Equities have staged a rally in the second half of 2010, shaking off concerns about the European debt crisis and the possibility of a double-dip recession in the U.S. Although the short-term surge pushed major equity indexes back into positive territory for the year, several questions remain about the longer-term outlook, including lackluster economic growth and persistently high unemployment. Financial markets are always unpredictable, of course, but there also are several time-tested investment principles that can help put the odds in your favor.
One of the basic tenets is to invest for the long term. Over time, riding out the markets' inevitable ups and downs has proven much more effective than selling into panic or chasing the hottest trend. Even missing only a few of the markets' best days can significantly diminish investor returns. Patience also affords the benefits of compounding - of earning interest on additional income or reinvested dividends and capital gains. There can be tax advantages and cost benefits to consider as well. While staying the course doesn't eliminate risk, it can considerably lessen the effect of short-term declines.
You can further manage your investing risk through diversification. And today, more than ever, geographic diversification should be taken into account. Studies indicate that asset allocation is the single most important determinant of a portfolio's long-term success. The right mix of stocks, bonds and cash - aligned to your particular risk tolerance and investment objective - is very important. Age-appropriate rebalancing is also an essential aspect of asset allocation. For younger investors, an emphasis on equities - which historically have been the best-performing asset class over time - is encouraged. As investors near their specific goal, such as retirement or sending a child to college, consideration may be given to replacing volatile assets (e.g. common stocks) with more-stable fixed investments (bonds or savings plans).
A third principle - investing regularly - can help lower the average cost of your purchases. Investing a certain amount of money each month or quarter helps ensure you won't pay for all your shares at market highs. This strategy - known as dollar cost averaging - also reduces "emotion" from investing, helping shareholders avoid selling weak performers just prior to an upswing, or chasing a hot performer just before a correction.
We invite you to contact us via the Internet, through our Investor Centers or by phone. It is our privilege to provide you the information you need to make the investments that are right for you.
Sincerely,
(The chairman's signature appears here.)
Edward C. Johnson 3d
Annual Report
Average annual total return reflects the change in the value of an investment, assuming reinvestment of the class' distributions from dividend income and capital gains (the profits earned upon the sale of securities that have grown in value, if any) and assuming a constant rate of performance each year. The $10,000 table and the fund's returns do not reflect the deduction of taxes that a shareholder would pay on fund distributions or the redemption of fund shares. During periods of reimbursement by Fidelity, a fund's total return will be greater than it would be had the reimbursement not occurred. How a fund did yesterday is no guarantee of how it will do tomorrow.
Average Annual Total Returns
Periods ended October 31, 2010 | Past 1
year | Past 5
years | Life of fund A |
Fidelity® International Small Cap Opportunities Fund | 24.43% | 1.90% | 2.57% |
A From August 2, 2005
$10,000 Over Life of Class
Let's say hypothetically that $10,000 was invested in Fidelity® International Small Cap Opportunities Fund, a class of the fund, on August 2, 2005, when the fund started. The chart shows how the value of your investment would have changed, and also shows how the MSCI® EAFE® Small Cap Index performed over the same period.
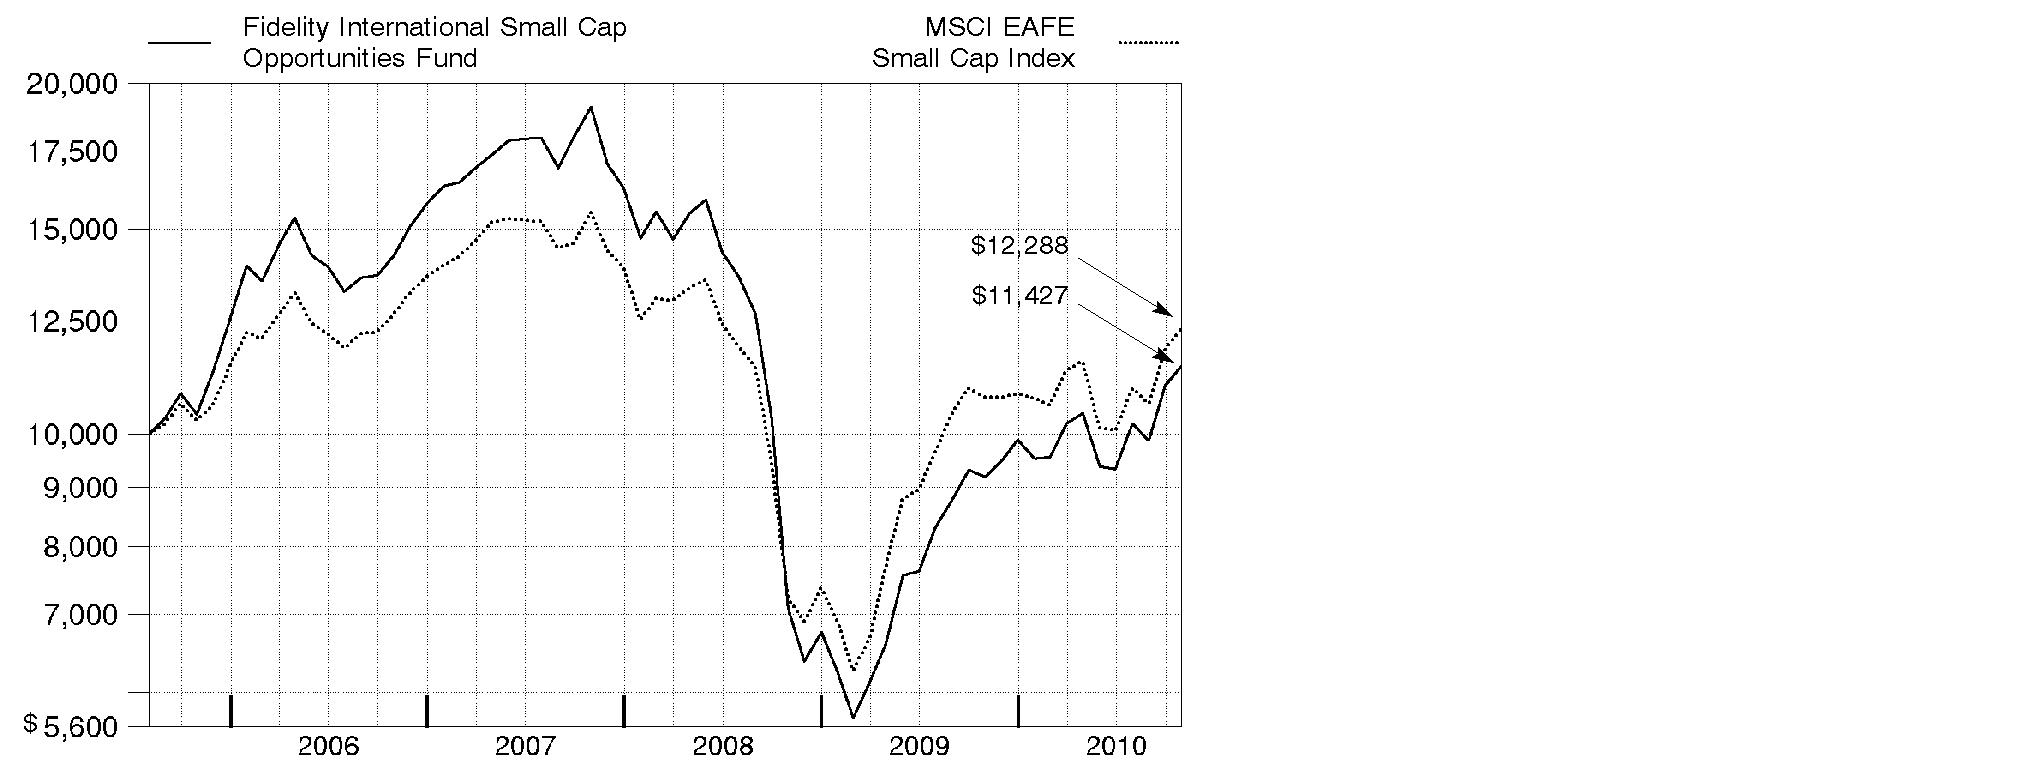
Annual Report
Market Recap: International stocks rode a wave of volatility similar to that of their U.S. counterparts during the 12 months ending October 31, 2010. Stocks gained modestly in the first half of the period, despite growing concerns about the European debt crisis. Sentiment turned decidedly negative in May and June, however, and the market suffered a precipitous decline. These losses were more than offset during the last four months of the period, when signs of economic growth and subsiding debt fears helped propel international stocks about 21%. For the full year, the MSCI® ACWI® (All Country World Index) ex USA Index gained 12.76%, boosted in part by a generally depreciating U.S. dollar. Within the index, Canada and emerging markets were standouts, returning 23% and 24%, respectively. Results in the latter group were led by strong-performing India, Mexico and South Africa, while China fell short of the MSCI benchmark due to cooling economic growth. The developed Asia ex Japan segment rose 16% for the period, lifted by solid results from Singapore and Hong Kong. Meanwhile, Europe rose just 9%, held back mainly by debt-riddled Spain and Italy, as well as lagging major constituent France. Japan returned only 5%, a result of that nation's continued weak economy.
Comments from Jed Weiss, Portfolio Manager of Fidelity® International Small Cap Opportunities Fund: For the year, the fund's Retail Class shares gained 24.43%, significantly outpacing the 14.31% return of the MSCI EAFE® (Europe, Australasia, Far East) Small Cap Index. Stock picking was most favorable in consumer discretionary, industrials and consumer staples, while the fund's utilities holdings and a small cash position detracted modestly. In country terms, successful positioning in Japan and the U.S. contributed, as did security selection in various emerging markets, especially Brazil, Turkey and South Africa. In Europe, good security selection in Finland and the U.K. outweighed weakness in Switzerland. The fund's top individual contributor was SSL International, a U.K.-based health care products company I sold after it agreed to be acquired. Other contributors included out-of-index positions in U.S.-listed and Sweden-based auto-safety equipment maker Autoliv; PriceSmart, a California-based warehouse club retailer operating in Central America; Banco ABC Brasil, a Brazilian bank; and South African discount retailer Mr Price Group. The fund's three biggest detractors were all, to varying degrees, hurt by the European debt crisis last spring - Greek wind utility Terna Energy, Italian asset manager Azimut Holding and U.K.-based student-housing lender Unite Group.
The views expressed above reflect those of the portfolio manager(s) only through the end of the period as stated on the cover of this report and do not necessarily represent the views of Fidelity or any other person in the Fidelity organization. Any such views are subject to change at any time based upon market or other conditions and Fidelity disclaims any responsibility to update such views. These views may not be relied on as investment advice and, because investment decisions for a Fidelity fund are based on numerous factors, may not be relied on as an indication of trading intent on behalf of any Fidelity fund.
Annual Report
Shareholder Expense Example
As a shareholder of the Fund, you incur two types of costs: (1) transaction costs, including sales charges (loads) on purchase payments or redemption proceeds, redemption fees, and (2) ongoing costs, including management fees, distribution and/or service (12b-1) fees and other Fund expenses. This Example is intended to help you understand your ongoing costs (in dollars) of investing in the Fund and to compare these costs with the ongoing costs of investing in other mutual funds.
The Example is based on an investment of $1,000 invested at the beginning of the period and held for the entire period (May 1, 2010 to October 31, 2010).
Actual Expenses
The first line of the accompanying table for each class of the Fund provides information about actual account values and actual expenses. You may use the information in this line, together with the amount you invested, to estimate the expenses that you paid over the period. Simply divide your account value by $1,000.00 (for example, an $8,600 account value divided by $1,000.00 = 8.6), then multiply the result by the number in the first line for a class of the Fund under the heading entitled "Expenses Paid During Period" to estimate the expenses you paid on your account during this period. A small balance maintenance fee of $12.00 that is charged once a year may apply for certain accounts with a value of less than $2,000. This fee is not included in the table below. If it was, the estimate of expenses you paid during the period would be higher, and your ending account value lower, by this amount. In addition, the Fund, as a shareholder in the underlying Fidelity Central Funds, will indirectly bear its pro-rata share of the fees and expenses incurred by the underlying Fidelity Central Funds. These fees and expenses are not included in the Fund's annualized expense ratio used to calculate the expense estimate in the table below.
Hypothetical Example for Comparison Purposes
The second line of the accompanying table for each class of the Fund provides information about hypothetical account values and hypothetical expenses based on a Class' actual expense ratio and an assumed rate of return of 5% per year before expenses, which is not the Class' actual return. The hypothetical account values and expenses may not be used to estimate the actual ending account balance or expenses you paid for the period. You may use this information to compare the ongoing costs of investing in the Fund and other funds. To do so, compare this 5% hypothetical example with the 5% hypothetical examples that appear in the shareholder reports of the other funds. A small balance maintenance fee of $12.00 that is charged once a year may apply for certain accounts with a value of less than $2,000. This fee is not included in the table below. If it was, the estimate of expenses you paid during the period would be higher, and your ending account value lower, by this amount. In addition, the Fund, as a shareholder in the underlying Fidelity Central Funds, will indirectly bear its pro-rata share of the fees and expenses incurred by the underlying Fidelity Central Funds. These fees and expenses are not included in the Fund's annualized expense ratio used to calculate the expense estimate in the table below.
Annual Report
Shareholder Expense Example - continued
Please note that the expenses shown in the table are meant to highlight your ongoing costs only and do not reflect any transaction costs. Therefore, the second line of the table is useful in comparing ongoing costs only, and will not help you determine the relative total costs of owning different funds. In addition, if these transactional costs were included, your costs would have been higher.
| Annualized
Expense Ratio | Beginning
Account Value
May 1, 2010 | Ending
Account Value
October 31, 2010 | Expenses Paid
During Period*
May 1, 2010
to October 31, 2010 |
Class A | 1.23% | | | |
Actual | | $ 1,000.00 | $ 1,096.00 | $ 6.50 |
HypotheticalA | | $ 1,000.00 | $ 1,019.00 | $ 6.26 |
Class T | 1.49% | | | |
Actual | | $ 1,000.00 | $ 1,094.60 | $ 7.87 |
HypotheticalA | | $ 1,000.00 | $ 1,017.69 | $ 7.58 |
Class B | 1.98% | | | |
Actual | | $ 1,000.00 | $ 1,091.50 | $ 10.44 |
HypotheticalA | | $ 1,000.00 | $ 1,015.22 | $ 10.06 |
Class C | 1.98% | | | |
Actual | | $ 1,000.00 | $ 1,091.60 | $ 10.44 |
HypotheticalA | | $ 1,000.00 | $ 1,015.22 | $ 10.06 |
International Small Cap Opportunities | .97% | | | |
Actual | | $ 1,000.00 | $ 1,097.30 | $ 5.13 |
HypotheticalA | | $ 1,000.00 | $ 1,020.32 | $ 4.94 |
Institutional Class | .96% | | | |
Actual | | $ 1,000.00 | $ 1,097.20 | $ 5.07 |
HypotheticalA | | $ 1,000.00 | $ 1,020.37 | $ 4.89 |
A 5% return per year before expenses
* Expenses are equal to each Class' annualized expense ratio, multiplied by the average account value over the period, multiplied by 184/365 (to reflect the one-half year period).
Annual Report
Investment Changes (Unaudited)
Geographic Diversification (% of fund's net assets) |
As of October 31, 2010 |
| Japan 20.9% | |
| United Kingdom 16.1% | |
| United States of America 12.8% | |
| Canada 5.0% | |
| Brazil 4.1% | |
| Germany 3.7% | |
| France 3.5% | |
| South Africa 3.2% | |
| Finland 2.8% | |
| Other 27.9% | |

Percentages are adjusted for the effect of futures contracts, if applicable. |
As of April 30, 2010 |
| Japan 21.9% | |
| United Kingdom 17.7% | |
| United States of America 10.6% | |
| Canada 5.2% | |
| Brazil 3.9% | |
| Netherlands 3.8% | |
| France 3.2% | |
| South Africa 2.9% | |
| Singapore 2.8% | |
| Other 28.0% | |

Percentages are adjusted for the effect of futures contracts, if applicable. |
Asset Allocation |
| % of fund's
net assets | % of fund's net assets
6 months ago |
Stocks and Investment Companies | 97.7 | 98.7 |
Short-Term Investments and Net Other Assets | 2.3 | 1.3 |
Top Ten Stocks as of October 31, 2010 |
| % of fund's
net assets | % of fund's net assets
6 months ago |
USS Co. Ltd. (Japan, Specialty Retail) | 1.6 | 1.6 |
Osaka Securities Exchange Co. Ltd. (Japan, Diversified Financial Services) | 1.6 | 1.7 |
Braskem SA Class A sponsored ADR (Brazil, Chemicals) | 1.5 | 1.0 |
PriceSmart, Inc. (United States of America, Food & Staples Retailing) | 1.5 | 1.6 |
Kobayashi Pharmaceutical Co. Ltd. (Japan, Personal Products) | 1.5 | 1.3 |
Azimut Holdings SpA (Italy, Capital Markets) | 1.4 | 1.6 |
Prosegur Compania de Seguridad SA (Reg.) (Spain, Commercial Services & Supplies) | 1.3 | 1.2 |
Outotec OYJ (Finland, Construction & Engineering) | 1.3 | 1.2 |
Nippon Thompson Co. Ltd. (Japan, Machinery) | 1.3 | 1.4 |
Serco Group PLC (United Kingdom, Commercial Services & Supplies) | 1.3 | 1.2 |
| 14.3 | |
Market Sectors as of October 31, 2010 |
| % of fund's
net assets | % of fund's net assets
6 months ago |
Industrials | 20.8 | 20.2 |
Financials | 19.9 | 21.0 |
Consumer Discretionary | 17.1 | 17.6 |
Materials | 10.8 | 10.6 |
Consumer Staples | 8.5 | 8.0 |
Information Technology | 8.4 | 7.5 |
Health Care | 6.4 | 7.5 |
Energy | 5.4 | 5.6 |
Utilities | 0.4 | 0.5 |
Telecommunication Services | 0.0 | 0.2 |
Annual Report
Investments October 31, 2010
Showing Percentage of Net Assets
Common Stocks - 97.7% |
| Shares | | Value |
Australia - 1.0% |
MAp Group unit | 840,958 | | $ 2,512,726 |
OZ Minerals Ltd. | 1,167,654 | | 1,790,191 |
TOTAL AUSTRALIA | | 4,302,917 |
Austria - 0.8% |
Andritz AG | 44,600 | | 3,415,709 |
Bailiwick of Guernsey - 0.8% |
Resolution Ltd. | 860,273 | | 3,609,732 |
Bailiwick of Jersey - 1.3% |
Informa PLC | 530,236 | | 3,703,897 |
Randgold Resources Ltd. sponsored ADR | 23,600 | | 2,216,512 |
TOTAL BAILIWICK OF JERSEY | | 5,920,409 |
Belgium - 1.4% |
Gimv NV | 39,800 | | 2,200,236 |
Umicore SA | 89,474 | | 4,210,543 |
TOTAL BELGIUM | | 6,410,779 |
Bermuda - 2.0% |
Aquarius Platinum Ltd. (Australia) | 301,589 | | 1,734,301 |
Great Eagle Holdings Ltd. | 857,000 | | 2,565,057 |
Lazard Ltd. Class A | 25,000 | | 922,500 |
Seadrill Ltd. | 34,398 | | 1,041,456 |
Trinity Ltd. | 2,680,000 | | 2,679,568 |
TOTAL BERMUDA | | 8,942,882 |
Brazil - 4.1% |
Banco ABC Brasil SA | 535,300 | | 5,273,706 |
BR Malls Participacoes SA | 181,600 | | 1,734,658 |
Braskem SA Class A sponsored ADR (d) | 324,400 | | 6,763,740 |
Iguatemi Empresa de Shopping Centers SA | 39,800 | | 928,791 |
Multiplan Empreendimentos Imobiliarios SA | 47,800 | | 1,095,815 |
Odontoprev SA | 151,500 | | 2,226,370 |
TOTAL BRAZIL | | 18,023,080 |
Canada - 5.0% |
Agnico-Eagle Mines Ltd. (Canada) | 25,100 | | 1,946,671 |
Eldorado Gold Corp. | 104,600 | | 1,771,195 |
Fairfax Financial Holdings Ltd. (sub. vtg.) | 7,190 | | 2,941,069 |
Niko Resources Ltd. | 54,400 | | 5,189,842 |
Open Text Corp. (a) | 40,500 | | 1,791,705 |
Pan American Silver Corp. | 53,400 | | 1,704,528 |
Common Stocks - continued |
| Shares | | Value |
Canada - continued |
Petrobank Energy & Resources Ltd. (a) | 140,800 | | $ 5,603,561 |
Quadra FNX Mining Ltd. (a) | 76,400 | | 1,078,694 |
TOTAL CANADA | | 22,027,265 |
Cayman Islands - 1.2% |
China Lilang Ltd. | 1,443,000 | | 2,256,302 |
Vantage Drilling Co. (a) | 725,331 | | 1,247,569 |
Wynn Macau Ltd. | 762,000 | | 1,684,977 |
TOTAL CAYMAN ISLANDS | | 5,188,848 |
China - 0.1% |
China Hongxing Sports Ltd. | 4,264,000 | | 576,528 |
Cyprus - 0.1% |
AFI Development PLC GDR (Reg. S) | 470,800 | | 555,544 |
Denmark - 0.5% |
William Demant Holding AS (a) | 28,533 | | 2,138,737 |
Finland - 2.8% |
Metso Corp. | 57,500 | | 2,725,885 |
Nokian Tyres PLC (d) | 111,400 | | 3,859,688 |
Outotec OYJ (d) | 127,800 | | 5,964,328 |
TOTAL FINLAND | | 12,549,901 |
France - 3.5% |
Audika SA | 120,384 | | 2,939,771 |
Laurent-Perrier Group | 25,963 | | 2,925,862 |
Remy Cointreau SA | 47,298 | | 3,320,914 |
Saft Groupe SA | 85,419 | | 3,262,605 |
Vetoquinol SA | 21,539 | | 912,900 |
Virbac SA | 13,000 | | 2,091,976 |
TOTAL FRANCE | | 15,454,028 |
Germany - 3.7% |
alstria office REIT-AG | 75,100 | | 1,046,024 |
Bilfinger Berger Se | 44,776 | | 3,260,346 |
Colonia Real Estate AG (a) | 386,909 | | 2,538,927 |
CTS Eventim AG | 57,996 | | 3,273,133 |
Fielmann AG | 27,537 | | 2,779,852 |
Software AG (Bearer) | 24,227 | | 3,394,663 |
TOTAL GERMANY | | 16,292,945 |
Greece - 0.4% |
Terna Energy SA | 443,751 | | 1,907,943 |
Common Stocks - continued |
| Shares | | Value |
India - 0.7% |
Apollo Tyres Ltd. | 514,796 | | $ 830,991 |
Jyothy Laboratories Ltd. | 351,322 | | 2,187,589 |
TOTAL INDIA | | 3,018,580 |
Ireland - 0.6% |
James Hardie Industries NV sponsored ADR (a) | 106,775 | | 2,838,080 |
Israel - 0.6% |
Azrieli Group | 68,005 | | 1,752,976 |
Ituran Location & Control Ltd. | 70,645 | | 1,098,530 |
TOTAL ISRAEL | | 2,851,506 |
Italy - 2.3% |
Azimut Holdings SpA | 626,773 | | 6,392,664 |
Interpump Group SpA (a) | 590,858 | | 3,853,825 |
TOTAL ITALY | | 10,246,489 |
Japan - 20.9% |
Aozora Bank Ltd. | 1,335,000 | | 2,239,654 |
Asahi Co. Ltd. (d) | 72,000 | | 1,064,745 |
Autobacs Seven Co. Ltd. | 102,200 | | 3,829,166 |
Daikoku Denki Co. Ltd. | 150,800 | | 1,705,331 |
Daikokutenbussan Co. Ltd. | 105,500 | | 3,697,154 |
FCC Co. Ltd. | 147,900 | | 3,174,143 |
Fukuoka (REIT) Investment Fund | 189 | | 1,268,299 |
GCA Savvian Group Corp. (a) | 1,694 | | 1,606,216 |
Glory Ltd. | 58,400 | | 1,288,182 |
Goldcrest Co. Ltd. | 54,690 | | 1,180,521 |
Japan Steel Works Ltd. | 229,000 | | 2,184,908 |
Kamigumi Co. Ltd. | 298,000 | | 2,329,340 |
Kobayashi Pharmaceutical Co. Ltd. | 142,700 | | 6,649,994 |
Kyoto Kimono Yuzen Co. Ltd. | 109,900 | | 1,195,011 |
Meiko Network Japan Co. Ltd. | 120,500 | | 1,004,791 |
Miraial Co. Ltd. | 44,000 | | 1,078,812 |
MS&AD Insurance Group Holdings, Inc. | 38,660 | | 926,174 |
Nabtesco Corp. | 205,000 | | 3,630,235 |
Nachi-Fujikoshi Corp. | 858,000 | | 2,569,628 |
Nagaileben Co. Ltd. | 39,900 | | 946,057 |
Nihon M&A Center, Inc. | 381 | | 1,377,793 |
Nihon Parkerizing Co. Ltd. | 162,000 | | 2,127,923 |
Nippon Seiki Co. Ltd. | 186,000 | | 1,883,808 |
Nippon Thompson Co. Ltd. | 832,000 | | 5,769,305 |
Nitto Kohki Co. Ltd. | 38,900 | | 917,029 |
Common Stocks - continued |
| Shares | | Value |
Japan - continued |
Obic Co. Ltd. | 13,240 | | $ 2,444,966 |
Osaka Securities Exchange Co. Ltd. | 1,381 | | 6,950,478 |
OSG Corp. | 171,600 | | 1,793,409 |
SAZABY, Inc. | 49,300 | | 918,976 |
SHO-BOND Holdings Co. Ltd. | 112,200 | | 2,400,999 |
Shoei Co. Ltd. | 68,800 | | 623,278 |
The Nippon Synthetic Chemical Industry Co. Ltd. | 180,000 | | 1,055,797 |
THK Co. Ltd. | 107,700 | | 2,071,823 |
Toho Holdings Co. Ltd. | 138,600 | | 1,941,123 |
Tsumura & Co. | 75,000 | | 2,307,692 |
Tsutsumi Jewelry Co. Ltd. | 41,400 | | 974,935 |
USS Co. Ltd. | 89,540 | | 6,965,577 |
Yamatake Corp. | 81,000 | | 1,971,903 |
Yamato Kogyo Co. Ltd. | 188,700 | | 4,840,025 |
TOTAL JAPAN | | 92,905,200 |
Korea (South) - 0.8% |
NCsoft Corp. | 4,673 | | 1,028,517 |
NHN Corp. (a) | 13,235 | | 2,348,050 |
TOTAL KOREA (SOUTH) | | 3,376,567 |
Luxembourg - 0.3% |
GlobeOp Financial Services SA | 243,800 | | 1,192,319 |
Netherlands - 2.8% |
Aalberts Industries NV | 192,200 | | 3,510,107 |
ASM International NV unit (a)(d) | 167,800 | | 4,287,290 |
Heijmans NV unit (a) | 81,690 | | 1,540,195 |
QIAGEN NV (a)(d) | 166,200 | | 3,126,222 |
TOTAL NETHERLANDS | | 12,463,814 |
Norway - 0.4% |
Sevan Marine ASA (a) | 1,190,500 | | 1,604,116 |
Papua New Guinea - 0.2% |
Oil Search Ltd. | 164,418 | | 1,027,640 |
Philippines - 0.3% |
Jollibee Food Corp. | 545,210 | | 1,124,734 |
Portugal - 0.6% |
Jeronimo Martins SGPS SA | 179,600 | | 2,693,970 |
Singapore - 2.3% |
Allgreen Properties Ltd. | 2,765,000 | | 2,542,185 |
Keppel Land Ltd. | 321,000 | | 1,098,687 |
Common Stocks - continued |
| Shares | | Value |
Singapore - continued |
Singapore Exchange Ltd. | 622,000 | | $ 4,229,004 |
Wing Tai Holdings Ltd. | 1,817,000 | | 2,456,733 |
TOTAL SINGAPORE | | 10,326,609 |
South Africa - 3.2% |
African Rainbow Minerals Ltd. | 155,700 | | 3,972,155 |
Clicks Group Ltd. | 595,513 | | 3,885,046 |
JSE Ltd. | 219,281 | | 2,472,959 |
Mr Price Group Ltd. | 445,900 | | 4,052,219 |
TOTAL SOUTH AFRICA | | 14,382,379 |
Spain - 1.5% |
Grifols SA (d) | 50,332 | | 814,851 |
Prosegur Compania de Seguridad SA (Reg.) | 100,209 | | 6,004,106 |
TOTAL SPAIN | | 6,818,957 |
Sweden - 1.1% |
Intrum Justitia AB | 166,800 | | 2,296,695 |
Swedish Match Co. | 84,600 | | 2,363,928 |
TOTAL SWEDEN | | 4,660,623 |
Switzerland - 1.8% |
Bank Sarasin & Co. Ltd. Series B (Reg.) | 141,200 | | 5,164,017 |
Sonova Holding AG Class B | 23,726 | | 2,747,767 |
TOTAL SWITZERLAND | | 7,911,784 |
Turkey - 2.0% |
Albaraka Turk Katilim Bankasi AS | 1,230,000 | | 2,469,776 |
Anadolu Efes Biracilik ve Malt Sanayii AS | 113,000 | | 1,804,155 |
Asya Katilim Bankasi AS | 896,000 | | 2,311,371 |
Coca-Cola Icecek AS | 190,000 | | 2,437,426 |
TOTAL TURKEY | | 9,022,728 |
United Kingdom - 16.1% |
AMEC PLC | 135,700 | | 2,361,092 |
Babcock International Group PLC | 314,700 | | 2,924,340 |
Bellway PLC | 223,172 | | 1,909,344 |
Britvic PLC | 391,200 | | 3,023,495 |
Cobham PLC | 499,200 | | 1,852,321 |
Dechra Pharmaceuticals PLC | 173,400 | | 1,472,408 |
Derwent London PLC | 70,900 | | 1,726,605 |
Great Portland Estates PLC | 522,489 | | 2,892,200 |
H&T Group PLC (d) | 371,803 | | 2,078,938 |
Common Stocks - continued |
| Shares | | Value |
United Kingdom - continued |
InterContinental Hotel Group PLC ADR (d) | 195,500 | | $ 3,782,925 |
Johnson Matthey PLC | 132,689 | | 4,068,928 |
Meggitt PLC | 785,545 | | 4,154,510 |
Micro Focus International PLC | 321,800 | | 1,968,453 |
Mothercare PLC | 323,401 | | 2,722,810 |
Persimmon PLC | 256,563 | | 1,401,689 |
Rotork PLC | 65,300 | | 1,752,392 |
Serco Group PLC | 570,476 | | 5,611,887 |
Shaftesbury PLC | 456,732 | | 3,263,619 |
Spectris PLC | 207,487 | | 3,753,082 |
Spirax-Sarco Engineering PLC | 184,230 | | 5,339,519 |
Ted Baker PLC | 249,000 | | 2,453,452 |
Ultra Electronics Holdings PLC | 100,669 | | 3,001,548 |
Unite Group PLC (a) | 1,339,170 | | 4,462,747 |
Victrex PLC | 178,582 | | 3,693,747 |
TOTAL UNITED KINGDOM | | 71,672,051 |
United States of America - 10.5% |
Advanced Energy Industries, Inc. (a) | 210,419 | | 3,021,617 |
Autoliv, Inc. | 66,600 | | 4,748,580 |
Cymer, Inc. (a) | 92,100 | | 3,403,095 |
Dril-Quip, Inc. (a) | 29,100 | | 2,010,810 |
Evercore Partners, Inc. Class A | 42,700 | | 1,296,372 |
ION Geophysical Corp. (a)(d) | 455,889 | | 2,229,297 |
Juniper Networks, Inc. (a) | 108,200 | | 3,504,598 |
Kansas City Southern (a) | 84,300 | | 3,694,026 |
Lam Research Corp. (a) | 23,203 | | 1,062,465 |
Martin Marietta Materials, Inc. (d) | 23,900 | | 1,923,472 |
Mohawk Industries, Inc. (a) | 81,000 | | 4,644,540 |
Oceaneering International, Inc. (a) | 19,400 | | 1,200,278 |
PriceSmart, Inc. | 228,296 | | 6,695,922 |
ResMed, Inc. (a) | 148,200 | | 4,723,134 |
Solera Holdings, Inc. | 22,500 | | 1,081,125 |
Solutia, Inc. (a) | 66,156 | | 1,198,085 |
TOTAL UNITED STATES OF AMERICA | | 46,437,416 |
TOTAL COMMON STOCKS (Cost $328,402,495) | 433,892,809 |
Money Market Funds - 6.3% |
| Shares | | Value |
Fidelity Cash Central Fund, 0.23% (b) | 10,922,935 | | $ 10,922,935 |
Fidelity Securities Lending Cash Central Fund, 0.24% (b)(c) | 17,012,021 | | 17,012,021 |
TOTAL MONEY MARKET FUNDS (Cost $27,934,956) | 27,934,956 |
TOTAL INVESTMENT PORTFOLIO - 104.0% (Cost $356,337,451) | | 461,827,765 |
NET OTHER ASSETS (LIABILITIES) - (4.0)% | | (17,810,509) |
NET ASSETS - 100% | $ 444,017,256 |
Legend |
(a) Non-income producing |
(b) Affiliated fund that is available only to investment companies and other accounts managed by Fidelity Investments. The rate quoted is the annualized seven-day yield of the fund at period end. A complete unaudited listing of the fund's holdings as of its most recent quarter end is available upon request. In addition, each Fidelity Central Fund's financial statements, which are not covered by the Fund's report of Independent Registered Public Accounting Firm, are available on the SEC's website or upon request. |
(c) Investment made with cash collateral received from securities on loan. |
(d) Security or a portion of the security is on loan at period end. |
Affiliated Central Funds |
Information regarding fiscal year to date income earned by the Fund from investments in Fidelity Central Funds is as follows: |
Fund | Income earned |
Fidelity Cash Central Fund | $ 12,535 |
Fidelity Securities Lending Cash Central Fund | 263,176 |
Total | $ 275,711 |
Other Information |
The following is a summary of the inputs used, as of October 31, 2010, involving the Fund's assets and liabilities carried at fair value. The inputs or methodology used for valuing securities may not be an indication of the risk associated with investing in those securities. For more information on valuation inputs, and their aggregation into the levels used in the table below, please refer to the Security Valuation section in the accompanying Notes to Financial Statements. |
Valuation Inputs at Reporting Date: |
Description | Total | Level 1 | Level 2 | Level 3 |
Investments in Securities: | | | | |
Equities: | | | | |
Japan | $ 92,905,200 | $ 89,794,118 | $ 3,111,082 | $ - |
United Kingdom | 71,672,051 | 71,672,051 | - | - |
United States of America | 46,437,416 | 46,437,416 | - | - |
Canada | 22,027,265 | 22,027,265 | - | - |
Brazil | 18,023,080 | 18,023,080 | - | - |
Germany | 16,292,945 | 16,292,945 | - | - |
France | 15,454,028 | 15,454,028 | - | - |
South Africa | 14,382,379 | 14,382,379 | - | - |
Finland | 12,549,901 | 12,549,901 | - | - |
Other | 124,148,544 | 123,317,553 | 830,991 | - |
Money Market Funds | 27,934,956 | 27,934,956 | - | - |
Total Investments in Securities: | $ 461,827,765 | $ 457,885,692 | $ 3,942,073 | $ - |
Income Tax Information |
At October 31, 2010, the Fund had a capital loss carryforward of approximately $420,935,635 of which $90,555,924 and $330,379,711 will expire on October 31, 2016 and 2017, respectively. Capital loss carryforwards are only available to offset future capital gains of the Fund to the extent provided by regulations and may be limited. |
See accompanying notes which are an integral part of the financial statements.
Annual Report
Statement of Assets and Liabilities
| October 31, 2010 |
| | |
Assets | | |
Investment in securities, at value (including securities loaned of $16,477,464) - See accompanying schedule: Unaffiliated issuers (cost $328,402,495) | $ 433,892,809 | |
Fidelity Central Funds (cost $27,934,956) | 27,934,956 | |
Total Investments (cost $356,337,451) | | $ 461,827,765 |
Foreign currency held at value (cost $144,438) | | 144,438 |
Receivable for investments sold | | 3,451,646 |
Receivable for fund shares sold | | 265,800 |
Dividends receivable | | 1,033,772 |
Distributions receivable from Fidelity Central Funds | | 13,747 |
Other receivables | | 16,199 |
Total assets | | 466,753,367 |
| | |
Liabilities | | |
Payable for investments purchased | $ 4,888,295 | |
Payable for fund shares redeemed | 393,945 | |
Accrued management fee | 223,687 | |
Distribution and service plan fees payable | 18,734 | |
Other affiliated payables | 122,810 | |
Other payables and accrued expenses | 76,619 | |
Collateral on securities loaned, at value | 17,012,021 | |
Total liabilities | | 22,736,111 |
| | |
Net Assets | | $ 444,017,256 |
Net Assets consist of: | | |
Paid in capital | | $ 757,537,538 |
Undistributed net investment income | | 3,575,839 |
Accumulated undistributed net realized gain (loss) on investments and foreign currency transactions | | (422,628,442) |
Net unrealized appreciation (depreciation) on investments and assets and liabilities in foreign currencies | | 105,532,321 |
Net Assets | | $ 444,017,256 |
See accompanying notes which are an integral part of the financial statements.
Annual Report
Financial Statements - continued
Statement of Assets and Liabilities - continued
| October 31, 2010 |
| | |
Calculation of Maximum Offering Price Class A:
Net Asset Value and redemption price per share ($20,227,814 ÷ 2,060,269 shares) | | $ 9.82 |
| | |
Maximum offering price per share (100/94.25 of $9.82) | | $ 10.42 |
Class T:
Net Asset Value and redemption price per share ($11,202,002 ÷ 1,152,196 shares) | | $ 9.72 |
| | |
Maximum offering price per share (100/96.50 of $9.72) | | $ 10.07 |
Class B:
Net Asset Value and offering price per share ($2,902,474 ÷ 304,234 shares)A | | $ 9.54 |
| | |
Class C:
Net Asset Value and offering price per share ($8,935,535 ÷ 937,891 shares)A | | $ 9.53 |
| | |
| | |
International Small Cap Opportunities:
Net Asset Value, offering price and redemption price per share ($398,331,167 ÷ 40,172,676 shares) | | $ 9.92 |
| | |
Institutional Class:
Net Asset Value, offering price and redemption price per share ($2,418,264 ÷ 243,597 shares) | | $ 9.93 |
A Redemption price per share is equal to net asset value less any applicable contingent deferred sales charge.
See accompanying notes which are an integral part of the financial statements.
Annual Report
Statement of Operations
| Year ended October 31, 2010 |
| | |
Investment Income | | |
Dividends | | $ 7,608,270 |
Interest | | 5 |
Income from Fidelity Central Funds | | 275,711 |
Income before foreign taxes withheld | | 7,883,986 |
Less foreign taxes withheld | | (520,283) |
Total income | | 7,363,703 |
| | |
Expenses | | |
Management fee
Basic fee | $ 3,343,372 | |
Performance adjustment | (1,495,592) | |
Transfer agent fees | 1,191,720 | |
Distribution and service plan fees | 216,769 | |
Accounting and security lending fees | 206,297 | |
Custodian fees and expenses | 124,178 | |
Independent trustees' compensation | 2,177 | |
Registration fees | 77,687 | |
Audit | 71,763 | |
Legal | 1,903 | |
Miscellaneous | 5,248 | |
Total expenses before reductions | 3,745,522 | |
Expense reductions | (55,920) | 3,689,602 |
Net investment income (loss) | | 3,674,101 |
Realized and Unrealized Gain (Loss) Net realized gain (loss) on: | | |
Investment securities: | | |
Unaffiliated issuers | 58,545,504 | |
Foreign currency transactions | (57,981) | |
Total net realized gain (loss) | | 58,487,523 |
Change in net unrealized appreciation (depreciation) on: Investment securities | 25,226,622 | |
Assets and liabilities in foreign currencies | 27,111 | |
Total change in net unrealized appreciation (depreciation) | | 25,253,733 |
Net gain (loss) | | 83,741,256 |
Net increase (decrease) in net assets resulting from operations | | $ 87,415,357 |
See accompanying notes which are an integral part of the financial statements.
Annual Report
Financial Statements - continued
Statement of Changes in Net Assets
| Year ended
October 31,
2010 | Year ended
October 31,
2009 |
Increase (Decrease) in Net Assets | | |
Operations | | |
Net investment income (loss) | $ 3,674,101 | $ 3,774,364 |
Net realized gain (loss) | 58,487,523 | (316,364,225) |
Change in net unrealized appreciation (depreciation) | 25,253,733 | 391,843,877 |
Net increase (decrease) in net assets resulting
from operations | 87,415,357 | 79,254,016 |
Distributions to shareholders from net investment income | (3,861,178) | (140,700) |
Distributions to shareholders from net realized gain | (4,067,493) | - |
Total distributions | (7,928,671) | (140,700) |
Share transactions - net increase (decrease) | (8,820,184) | (68,133,927) |
Redemption fees | 60,781 | 113,424 |
Total increase (decrease) in net assets | 70,727,283 | 11,092,813 |
| | |
Net Assets | | |
Beginning of period | 373,289,973 | 362,197,160 |
End of period (including undistributed net investment income of $3,575,839 and undistributed net investment income of $3,633,664, respectively) | $ 444,017,256 | $ 373,289,973 |
See accompanying notes which are an integral part of the financial statements.
Annual Report
Financial Highlights - Class A
Years ended October 31, | 2010 | 2009 | 2008 | 2007 | 2006 |
Selected Per-Share Data | | | | | |
Net asset value, beginning of period | $ 8.07 | $ 6.24 | $ 18.97 | $ 14.18 | $ 10.41 |
Income from Investment Operations | | | | | |
Net investment income (loss)C | .06 | .06 | .02 | .02 | -G |
Net realized and unrealized gain (loss) | 1.85 | 1.77 | (10.85) | 4.76 | 3.74 |
Total from investment operations | 1.91 | 1.83 | (10.83) | 4.78 | 3.74 |
Distributions from net investment income | (.07) | - | (.03) | - | - |
Distributions from net realized gain | (.09) | - | (1.88) | - | -G |
Total distributions | (.16) | - | (1.90)H | - | -G |
Redemption fees added to paid in capitalC | -G | -G | -G | .01 | .03 |
Net asset value, end of period | $ 9.82 | $ 8.07 | $ 6.24 | $ 18.97 | $ 14.18 |
Total ReturnA,B | 24.05% | 29.33% | (62.98)% | 33.78% | 36.25% |
Ratios to Average Net AssetsD,F | | | | | |
Expenses before reductions | 1.16% | .94% | 1.75% | 1.63% | 1.63% |
Expenses net of fee waivers, if any | 1.16% | .94% | 1.66% | 1.63% | 1.63% |
Expenses net of all reductions | 1.15% | .89% | 1.62% | 1.59% | 1.51% |
Net investment income (loss) | .74% | 1.00% | .13% | .10% | .02% |
Supplemental Data | | | | | |
Net assets, end of period (000 omitted) | $ 20,228 | $ 18,883 | $ 17,905 | $ 70,785 | $ 35,674 |
Portfolio turnover rateE | 49% | 174% | 61% | 107% | 164% |
A Total returns would have been lower had certain expenses not been reduced during the periods shown.
B Total returns do not include the effect of the sales charges.
C Calculated based on average shares outstanding during the period.
D Fees and expenses of the underlying Fidelity Central Funds are not included in the Fund's expense ratio. The Fund indirectly bears its proportionate share of the expenses of any underlying Fidelity Central Funds.
E Amount does not include the portfolio activity of any underlying Fidelity Central Funds.
F Expense ratios reflect operating expenses of the class. Expenses before reductions do not reflect amounts reimbursed by the investment adviser or reductions from brokerage service arrangements or reductions from other expense offset arrangements and do not represent the amount paid by the class during periods when reimbursements or reductions occur. Expenses net of fee waivers reflect expenses after reimbursement by the investment adviser but prior to reductions from brokerage service arrangements or other expense offset arrangements. Expenses net of all reductions represent the net expenses paid by the class.
G Amount represents less than $.01 per share.
H Total distributions of $1.90 per share is comprised of distributions from net investment income of $.025 and distributions from net realized gain of $1.878 per share.
See accompanying notes which are an integral part of the financial statements.
Annual Report
Financial Highlights - Class T
Years ended October 31, | 2010 | 2009 | 2008 | 2007 | 2006 |
Selected Per-Share Data | | | | | |
Net asset value, beginning of period | $ 8.00 | $ 6.20 | $ 18.85 | $ 14.12 | $ 10.38 |
Income from Investment Operations | | | | | |
Net investment income (loss)C | .04 | .05 | (.02) | (.02) | (.03) |
Net realized and unrealized gain (loss) | 1.83 | 1.75 | (10.78) | 4.74 | 3.74 |
Total from investment operations | 1.87 | 1.80 | (10.80) | 4.72 | 3.71 |
Distributions from net investment income | (.06) | - | - | - | - |
Distributions from net realized gain | (.09) | - | (1.85) | - | - |
Total distributions | (.15) | - | (1.85)H | - | - |
Redemption fees added to paid in capitalC | -G | -G | -G | .01 | .03 |
Net asset value, end of period | $ 9.72 | $ 8.00 | $ 6.20 | $ 18.85 | $ 14.12 |
Total ReturnA,B | 23.65% | 29.03% | (63.08)% | 33.50% | 36.03% |
Ratios to Average Net AssetsD,F | | | | | |
Expenses before reductions | 1.43% | 1.20% | 2.00% | 1.85% | 1.85% |
Expenses net of fee waivers, if any | 1.43% | 1.20% | 1.91% | 1.85% | 1.85% |
Expenses net of all reductions | 1.41% | 1.15% | 1.87% | 1.81% | 1.74% |
Net investment income (loss) | .48% | .74% | (.12)% | (.13)% | (.20)% |
Supplemental Data | | | | | |
Net assets, end of period (000 omitted) | $ 11,202 | $ 11,915 | $ 11,614 | $ 46,568 | $ 28,309 |
Portfolio turnover rateE | 49% | 174% | 61% | 107% | 164% |
A Total returns would have been lower had certain expenses not been reduced during the periods shown.
B Total returns do not include the effect of the sales charges.
C Calculated based on average shares outstanding during the period.
D Fees and expenses of the underlying Fidelity Central Funds are not included in the Fund's expense ratio. The Fund indirectly bears its proportionate share of the expenses of any underlying Fidelity Central Funds.
E Amount does not include the portfolio activity of any underlying Fidelity Central Funds.
F Expense ratios reflect operating expenses of the class. Expenses before reductions do not reflect amounts reimbursed by the investment adviser or reductions from brokerage service arrangements or reductions from other expense offset arrangements and do not represent the amount paid by the class during periods when reimbursements or reductions occur. Expenses net of fee waivers reflect expenses after reimbursement by the investment adviser but prior to reductions from brokerage service arrangements or other expense offset arrangements. Expenses net of all reductions represent the net expenses paid by the class.
G Amount represents less than $.01 per share.
H Total distributions of $1.85 per share is comprised of distributions from net realized gain of $1.852 per share.
See accompanying notes which are an integral part of the financial statements.
Annual Report
Financial Highlights - Class B
Years ended October 31, | 2010 | 2009 | 2008 | 2007 | 2006 |
Selected Per-Share Data | | | | | |
Net asset value, beginning of period | $ 7.87 | $ 6.12 | $ 18.64 | $ 14.04 | $ 10.37 |
Income from Investment Operations | | | | | |
Net investment income (loss)C | (-)G | .02 | (.08) | (.11) | (.10) |
Net realized and unrealized gain (loss) | 1.79 | 1.73 | (10.68) | 4.70 | 3.74 |
Total from investment operations | 1.79 | 1.75 | (10.76) | 4.59 | 3.64 |
Distributions from net investment income | (.03) | - | - | - | - |
Distributions from net realized gain | (.09) | - | (1.76) | - | - |
Total distributions | (.12) | - | (1.76)H | - | - |
Redemption fees added to paid in capitalC | -G | -G | -G | .01 | .03 |
Net asset value, end of period | $ 9.54 | $ 7.87 | $ 6.12 | $ 18.64 | $ 14.04 |
Total ReturnA,B | 23.03% | 28.59% | (63.32)% | 32.76% | 35.39% |
Ratios to Average Net AssetsD,F | | | | | |
Expenses before reductions | 1.91% | 1.69% | 2.51% | 2.40% | 2.45% |
Expenses net of fee waivers, if any | 1.91% | 1.69% | 2.41% | 2.40% | 2.41% |
Expenses net of all reductions | 1.90% | 1.64% | 2.38% | 2.36% | 2.30% |
Net investment income (loss) | (.01)% | .25% | (.62)% | (.67)% | (.76)% |
Supplemental Data | | | | | |
Net assets, end of period (000 omitted) | $ 2,902 | $ 2,799 | $ 2,687 | $ 10,975 | $ 7,709 |
Portfolio turnover rateE | 49% | 174% | 61% | 107% | 164% |
A Total returns would have been lower had certain expenses not been reduced during the periods shown.
B Total returns do not include the effect of the contingent deferred sales charge.
C Calculated based on average shares outstanding during the period.
D Fees and expenses of the underlying Fidelity Central Funds are not included in the Fund's expense ratio. The Fund indirectly bears its proportionate share of the expenses of any underlying Fidelity Central Funds.
E Amount does not include the portfolio activity of any underlying Fidelity Central Funds.
F Expense ratios reflect operating expenses of the class. Expenses before reductions do not reflect amounts reimbursed by the investment adviser or reductions from brokerage service arrangements or reductions from other expense offset arrangements and do not represent the amount paid by the class during periods when reimbursements or reductions occur. Expenses net of fee waivers reflect expenses after reimbursement by the investment adviser but prior to reductions from brokerage service arrangements or other expense offset arrangements. Expenses net of all reductions represent the net expenses paid by the class.
G Amount represents less than $.01 per share.
H Total distributions of $1.76 per share is comprised of distributions from net realized gain of $1.760 per share.
See accompanying notes which are an integral part of the financial statements.
Annual Report
Financial Highlights - Class C
Years ended October 31, | 2010 | 2009 | 2008 | 2007 | 2006 |
Selected Per-Share Data | | | | | |
Net asset value, beginning of period | $ 7.86 | $ 6.11 | $ 18.63 | $ 14.03 | $ 10.37 |
Income from Investment Operations | | | | | |
Net investment income (loss)C | (-)G | .02 | (.08) | (.11) | (.10) |
Net realized and unrealized gain (loss) | 1.79 | 1.73 | (10.66) | 4.70 | 3.73 |
Total from investment operations | 1.79 | 1.75 | (10.74) | 4.59 | 3.63 |
Distributions from net investment income | (.03) | - | - | - | - |
Distributions from net realized gain | (.09) | - | (1.78) | - | - |
Total distributions | (.12) | - | (1.78)H | - | - |
Redemption fees added to paid in capitalC | -G | -G | -G | .01 | .03 |
Net asset value, end of period | $ 9.53 | $ 7.86 | $ 6.11 | $ 18.63 | $ 14.03 |
Total ReturnA,B | 23.06% | 28.64% | (63.32)% | 32.79% | 35.29% |
Ratios to Average Net AssetsD,F | | | | | |
Expenses before reductions | 1.91% | 1.68% | 2.51% | 2.38% | 2.38% |
Expenses net of fee waivers, if any | 1.91% | 1.68% | 2.41% | 2.38% | 2.38% |
Expenses net of all reductions | 1.90% | 1.63% | 2.38% | 2.34% | 2.27% |
Net investment income (loss) | (.01)% | .26% | (.62)% | (.66)% | (.73)% |
Supplemental Data | | | | | |
Net assets, end of period (000 omitted) | $ 8,936 | $ 8,543 | $ 9,497 | $ 40,894 | $ 26,320 |
Portfolio turnover rateE | 49% | 174% | 61% | 107% | 164% |
A Total returns would have been lower had certain expenses not been reduced during the periods shown.
B Total returns do not include the effect of the contingent deferred sales charge.
C Calculated based on average shares outstanding during the period.
D Fees and expenses of the underlying Fidelity Central Funds are not included in the Fund's expense ratio. The Fund indirectly bears its proportionate share of the expenses of any underlying Fidelity Central Funds.
E Amount does not include the portfolio activity of any underlying Fidelity Central Funds.
F Expense ratios reflect operating expenses of the class. Expenses before reductions do not reflect amounts reimbursed by the investment adviser or reductions from brokerage service arrangements or reductions from other expense offset arrangements and do not represent the amount paid by the class during periods when reimbursements or reductions occur. Expenses net of fee waivers reflect expenses after reimbursement by the investment adviser but prior to reductions from brokerage service arrangements or other expense offset arrangements. Expenses net of all reductions represent the net expenses paid by the class.
G Amount represents less than $.01 per share.
H Total distributions of $1.78 per share is comprised of distributions from net realized gain of $1.775 per share.
See accompanying notes which are an integral part of the financial statements.
Annual Report
Financial Highlights - International Small Cap Opportunities
Years ended October 31, | 2010 | 2009 | 2008 | 2007 | 2006 |
Selected Per-Share Data | | | | | |
Net asset value, beginning of period | $ 8.14 | $ 6.28 | $ 19.09 | $ 14.23 | $ 10.40 |
Income from Investment Operations | | | | | |
Net investment income (loss)B | .09 | .08 | .05 | .07 | .05 |
Net realized and unrealized gain (loss) | 1.87 | 1.78 | (10.92) | 4.78 | 3.75 |
Total from investment operations | 1.96 | 1.86 | (10.87) | 4.85 | 3.80 |
Distributions from net investment income | (.09) | -F | (.06) | - | - |
Distributions from net realized gain | (.09) | - | (1.88) | - | -F |
Total distributions | (.18) | -F | (1.94)G | - | -F |
Redemption fees added to paid in capitalB | -F | -F | -F | .01 | .03 |
Net asset value, end of period | $ 9.92 | $ 8.14 | $ 6.28 | $ 19.09 | $ 14.23 |
Total ReturnA | 24.43% | 29.68% | (62.91)% | 34.15% | 36.86% |
Ratios to Average Net AssetsC,E | | | | | |
Expenses before reductions | .91% | .68% | 1.44% | 1.30% | 1.28% |
Expenses net of fee waivers, if any | .91% | .68% | 1.44% | 1.30% | 1.28% |
Expenses net of all reductions | .89% | .64% | 1.40% | 1.25% | 1.16% |
Net investment income (loss) | 1.00% | 1.25% | .36% | .43% | .37% |
Supplemental Data | | | | | |
Net assets, end of period (000 omitted) | $ 398,331 | $ 329,128 | $ 312,376 | $ 1,433,844 | $ 981,210 |
Portfolio turnover rateD | 49% | 174% | 61% | 107% | 164% |
A Total returns would have been lower had certain expenses not been reduced during the periods shown.
B Calculated based on average shares outstanding during the period.
C Fees and expenses of the underlying Fidelity Central Funds are not included in the Fund's expense ratio. The Fund indirectly bears its proportionate share of the expenses of any underlying Fidelity Central Funds.
D Amount does not include the portfolio activity of any underlying Fidelity Central Funds.
E Expense ratios reflect operating expenses of the class. Expenses before reductions do not reflect amounts reimbursed by the investment adviser or reductions from brokerage service arrangements or reductions from other expense offset arrangements and do not represent the amount paid by the class during periods when reimbursements or reductions occur. Expenses net of fee waivers reflect expenses after reimbursement by the investment adviser but prior to reductions from brokerage service arrangements or other expense offset arrangements. Expenses net of all reductions represent the net expenses paid by the class.
F Amount represents less than $.01 per share.
G Total distributions of $1.94 per share is comprised of distributions from net investment income of $.064 and distributions from net realized gain of $1.878 per share.
See accompanying notes which are an integral part of the financial statements.
Annual Report
Financial Highlights - Institutional Class
Years ended October 31, | 2010 | 2009 | 2008 | 2007 | 2006 |
Selected Per-Share Data | | | | | |
Net asset value, beginning of period | $ 8.14 | $ 6.27 | $ 19.09 | $ 14.22 | $ 10.40 |
Income from Investment Operations | | | | | |
Net investment income (loss)B | .09 | .08 | .05 | .08 | .05 |
Net realized and unrealized gain (loss) | 1.86 | 1.79 | (10.92) | 4.78 | 3.74 |
Total from investment operations | 1.95 | 1.87 | (10.87) | 4.86 | 3.79 |
Distributions from net investment income | (.07) | -F | (.07) | - | - |
Distributions from net realized gain | (.09) | - | (1.88) | - | -F |
Total distributions | (.16) | -F | (1.95)G | - | -F |
Redemption fees added to paid in capitalB | -F | -F | -F | .01 | .03 |
Net asset value, end of period | $ 9.93 | $ 8.14 | $ 6.27 | $ 19.09 | $ 14.22 |
Total ReturnA | 24.33% | 29.87% | (62.95)% | 34.25% | 36.77% |
Ratios to Average Net AssetsC,E | | | | | |
Expenses before reductions | .90% | .68% | 1.40% | 1.29% | 1.25% |
Expenses net of fee waivers, if any | .90% | .68% | 1.40% | 1.29% | 1.25% |
Expenses net of all reductions | .88% | .64% | 1.37% | 1.25% | 1.14% |
Net investment income (loss) | 1.01% | 1.25% | .39% | .44% | .40% |
Supplemental Data | | | | | |
Net assets, end of period (000 omitted) | $ 2,418 | $ 2,022 | $ 8,117 | $ 27,609 | $ 13,954 |
Portfolio turnover rateD | 49% | 174% | 61% | 107% | 164% |
A Total returns would have been lower had certain expenses not been reduced during the periods shown.
B Calculated based on average shares outstanding during the period.
C Fees and expenses of the underlying Fidelity Central Funds are not included in the Fund's expense ratio. The Fund indirectly bears its proportionate share of the expenses of any underlying Fidelity Central Funds.
D Amount does not include the portfolio activity of any underlying Fidelity Central Funds.
E Expense ratios reflect operating expenses of the class. Expenses before reductions do not reflect amounts reimbursed by the investment adviser or reductions from brokerage service arrangements or reductions from other expense offset arrangements and do not represent the amount paid by the class during periods when reimbursements or reductions occur. Expenses net of fee waivers reflect expenses after reimbursement by the investment adviser but prior to reductions from brokerage service arrangements or other expense offset arrangements. Expenses net of all reductions represent the net expenses paid by the class.
F Amount represents less than $.01 per share.
G Total distributions of $1.95 per share is comprised of distributions from net investment income of $.074 and distributions from net realized gain of $1.878 per share.
See accompanying notes which are an integral part of the financial statements.
Annual Report
Notes to Financial Statements
For the period ended October 31, 2010
1. Organization.
Fidelity International Small Cap Opportunities Fund (the Fund) is a fund of Fidelity Investment Trust (the Trust) and is authorized to issue an unlimited number of shares. The Trust is registered under the Investment Company Act of 1940, as amended (the 1940 Act), as an open-end management investment company organized as a Massachusetts business trust. The Fund offers Class A, Class T, Class C, International Small Cap Opportunities and Institutional Class shares, each of which has equal rights as to assets and voting privileges. Effective after the close of business on September 1, 2010, Class B shares were closed to new accounts and additional purchases by existing shareholders. Each class has exclusive voting rights with respect to matters that affect that class. Class B shares will automatically convert to Class A shares after a holding period of seven years from the initial date of purchase. Investment income, realized and unrealized capital gains and losses, the common expenses of the Fund, and certain fund-level expense reductions, if any, are allocated on a pro-rata basis to each class based on the relative net assets of each class to the total net assets of the Fund. Each class differs with respect to transfer agent and distribution and service plan fees incurred. Certain expense reductions also differ by class. The Fund's investments in emerging markets can be subject to social, economic, regulatory, and political uncertainties and can be extremely volatile.
2. Investments in Fidelity Central Funds.
The Fund may invest in Fidelity Central Funds, which are open-end investment companies available only to other investment companies and accounts managed by Fidelity Management & Research Company (FMR) and its affiliates. The Fund's Schedule of Investments lists each of the Fidelity Central Funds held as of period end, if any, as an investment of the Fund, but does not include the underlying holdings of each Fidelity Central Fund. As an Investing Fund, the Fund indirectly bears its proportionate share of the expenses of the underlying Fidelity Central Funds.
The Money Market Central Funds seek preservation of capital and current income and are managed by Fidelity Investments Money Management, Inc. (FIMM), an affiliate of FMR.
A complete unaudited list of holdings for each Fidelity Central Fund is available upon request or at the Securities and Exchange Commission (the SEC) web site at www.sec.gov. In addition, the financial statements of the Fidelity Central Funds, which are not covered by the Fund's Report of Independent Registered Public Accounting Firm, are available on the SEC web site or upon request.
3. Significant Accounting Policies.
The financial statements have been prepared in conformity with accounting principles generally accepted in the United States of America (GAAP), which require management
Annual Report
3. Significant Accounting Policies - continued
to make certain estimates and assumptions at the date of the financial statements. Actual results could differ from those estimates. The following summarizes the significant accounting policies of the Fund:
Security Valuation. Investments are valued as of 4:00 p.m. Eastern time on the last calendar day of the period. The Fund uses independent pricing services approved by the Board of Trustees to value its investments. When current market prices or quotations are not readily available or reliable, valuations may be determined in good faith in accordance with procedures adopted by the Board of Trustees. Factors used in determining value may include market or security specific events. The frequency with which these procedures are used cannot be predicted and they may be utilized to a significant extent. The value used for net asset value (NAV) calculation under these procedures may differ from published prices for the same securities.
The Fund categorizes the inputs to valuation techniques used to value its investments into a disclosure hierarchy consisting of three levels as shown below.
Level 1 - quoted prices in active markets for identical investments
Level 2 - other significant observable inputs (including quoted prices for similar investments, interest rates, prepayment speeds, etc.)
Level 3 - unobservable inputs (including the fund's own assumptions based on the best information available)
Changes in valuation techniques may result in transfers in or out of an assigned level within the disclosure hierarchy. The aggregate value of investments by input level, as of October 31, 2010, is included at the end of the Fund's Schedule of Investments. Valuation techniques used to value the Fund's investments by major category are as follows.
Equity securities, including restricted securities, for which market quotations are readily available, are valued at the last reported sale price or official closing price as reported by an independent pricing service on the primary market or exchange on which they are traded and are categorized as Level 1 in the hierarchy. In the event there were no sales during the day or closing prices are not available, securities are valued at the last quoted bid price or may be valued using the last available price and are generally categorized as Level 2 in the hierarchy. For foreign equity securities, when significant market or security specific events arise, comparisons to the valuation of American Depositary Receipts (ADRs), futures contracts, Exchange-traded funds (ETFs) and certain indexes as well as quoted prices for similar securities are used and are categorized as Level 2 in the hierarchy in these circumstances. Utilizing these techniques may result in significant transfers between Level 1 and Level 2. For restricted equity securities and private placements
Annual Report
Notes to Financial Statements - continued
3. Significant Accounting Policies - continued
Security Valuation - continued
where observable inputs are limited, assumptions about market activity and risk are used and are categorized as Level 3 in the hierarchy.
Investments in open-end mutual funds, including the Fidelity Central Funds, are valued at their closing net asset value each business day and are categorized as Level 1 in the hierarchy. Short-term securities with remaining maturities of sixty days or less for which quotations are not readily available are valued at amortized cost, which approximates fair value and are categorized as Level 2 in the hierarchy.
Foreign Currency. The Fund uses foreign currency contracts to facilitate transactions in foreign-denominated securities. Gains and losses from these transactions may arise from changes in the value of the foreign currency or if the counterparties do not perform under the contracts' terms.
Foreign-denominated assets, including investment securities, and liabilities are translated into U.S. dollars at the exchange rate at period end. Purchases and sales of investment securities, income and dividends received and expenses denominated in foreign currencies are translated into U.S. dollars at the exchange rate in effect on the transaction date.
The effects of exchange rate fluctuations on investments are included with the net realized and unrealized gain (loss) on investment securities. Other foreign currency transactions resulting in realized and unrealized gain (loss) are disclosed separately.
Investment Transactions and Income. For financial reporting purposes, the Fund's investment holdings and NAV include trades executed through the end of the last business day of the period. The NAV per share for processing shareholder transactions is calculated as of the close of business of the New York Stock Exchange (NYSE), normally 4:00 p.m. Eastern time and includes trades executed through the end of the prior business day. Gains and losses on securities sold are determined on the basis of identified cost. Dividend income is recorded on the ex-dividend date, except for certain dividends from foreign securities where the ex-dividend date may have passed, which are recorded as soon as the Fund is informed of the ex-dividend date. Non-cash dividends included in dividend income, if any, are recorded at the fair market value of the securities received. Distributions received on securities that represent a return of capital or capital gain are recorded as a reduction of cost of investments and/or as a realized gain. The Fund estimates the components of distributions received that may be considered return of capital distributions or capital gain distributions. Interest income and distributions from the Fidelity Central Funds are accrued as earned. Interest income includes coupon interest and amortization of premium and accretion of discount on debt securities.
Annual Report
3. Significant Accounting Policies - continued
Investment Transactions and Income - continued
Investment income is recorded net of foreign taxes withheld where recovery of such taxes is uncertain.
Expenses. Most expenses of the Trust can be directly attributed to a fund. Expenses which cannot be directly attributed are apportioned amongst each fund in the Trust. Expense estimates are accrued in the period to which they relate and adjustments are made when actual amounts are known.
Income Tax Information and Distributions to Shareholders. Each year the Fund intends to qualify as a regulated investment company, including distributing substantially all of its taxable income and realized gains under Subchapter M of the Internal Revenue Code and filing its U.S. federal tax return. As a result, no provision for income taxes is required. As of October 31, 2010, the Fund did not have any unrecognized tax benefits in the accompanying financial statements. A fund's federal tax return is subject to examination by the Internal Revenue Service (IRS) for a period of three years. Foreign taxes are provided for based on the Fund's understanding of the tax rules and rates that exist in the foreign markets in which it invests.
Distributions are declared and recorded on the ex-dividend date. Income dividends and capital gain distributions are declared separately for each class. Income and capital gain distributions are determined in accordance with income tax regulations, which may differ from GAAP.
Capital accounts within the financial statements are adjusted for permanent book-tax differences. These adjustments have no impact on net assets or the results of operations. Temporary book-tax differences will reverse in a subsequent period.
Book-tax differences are primarily due to the short-term gain distributions from the Fidelity Central Funds, foreign currency transactions, passive foreign investment companies (PFIC), capital loss carryforwards and losses deferred due to wash sales.
The federal tax cost of investment securities and unrealized appreciation (depreciation) as of period end were as follows:
Gross unrealized appreciation | $ 110,936,787 |
Gross unrealized depreciation | (8,823,890) |
Net unrealized appreciation (depreciation) | $ 102,112,897 |
| |
Tax Cost | $ 359,714,868 |
Annual Report
Notes to Financial Statements - continued
3. Significant Accounting Policies - continued
Income Tax Information and Distributions to Shareholders - continued
The tax-based components of distributable earnings as of period end were as follows:
Undistributed ordinary income | $ 5,260,449 |
Capital loss carryforward | $ (420,935,635) |
Net unrealized appreciation (depreciation) | $ 102,154,904 |
The tax character of distributions paid was as follows:
| October 31, 2010 | October 31, 2009 |
Ordinary Income | $ 7,928,671 | $ 140,700 |
Short-Term Trading (Redemption) Fees. Shares held by investors in the Fund less than 90 days are subject to a redemption fee equal to 2.00% of the net asset value of shares redeemed. All redemption fees, which reduce the proceeds of the shareholder redemption, are retained by the Fund and accounted for as an addition to paid in capital.
4. Purchases and Sales of Investments.
Purchases and sales of securities, other than short-term securities, aggregated $186,444,286 and $203,425,442, respectively.
5. Fees and Other Transactions with Affiliates.
Management Fee. FMR and its affiliates provide the Fund with investment management related services for which the Fund pays a monthly management fee. The management fee is the sum of an individual fund fee rate that is based on an annual rate of .60% of the Fund's average net assets and a group fee rate that averaged .26% during the period. The group fee rate is based upon the average net assets of all the mutual funds advised by FMR. The group fee rate decreases as assets under management increase and increases as assets under management decrease. In addition, the management fee is subject to a performance adjustment (up to a maximum of ±.20% of the Fund's average net assets over a 36 month performance period). The upward or downward adjustment to the management fee is based on relative investment performance of International Small Cap Opportunities as compared to an appropriate benchmark index. For the period, the total annual management fee rate, including the performance adjustment, was .47% of the Fund's average net assets.
Distribution and Service Plan Fees. In accordance with Rule 12b-1 of the 1940 Act, the Fund has adopted separate Distribution and Service Plans for each class of shares. Certain classes pay Fidelity Distributors Corporation (FDC), an affiliate of FMR, separate
Annual Report
5. Fees and Other Transactions with Affiliates - continued
Distribution and Service Plan Fees - continued
Distribution and Service Fees, each of which is based on an annual percentage of each class' average net assets. In addition, FDC may pay financial intermediaries for selling shares of the Fund and providing shareholder support services. For the period, the Distribution and Service Fee rates, total fees and amounts retained by FDC were as follows:
| Distribution
Fee | Service
Fee | Total
Fees | Retained
by FDC |
Class A | -% | .25% | $ 47,792 | $ 274 |
Class T | .25% | .25% | 54,808 | - |
Class B | .75% | .25% | 28,142 | 21,120 |
Class C | .75% | .25% | 86,027 | 7,949 |
| | | $ 216,769 | $ 29,343 |
Sales Load. FDC receives a front-end sales charge of up to 5.75% for selling Class A shares and 3.50% for selling Class T shares, some of which is paid to financial intermediaries for selling shares of the Fund. FDC receives the proceeds of contingent deferred sales charges levied on Class A, Class T, Class B, and Class C redemptions. These charges depend on the holding period. The deferred sales charges range from 5% to 1% for Class B, 1% for Class C, 1.00% for certain purchases of Class A shares (1.00% to .50% prior to July 12, 2010) and .25% for certain purchases of Class T shares.
For the period, sales charge amounts retained by FDC were as follows:
| Retained
by FDC |
Class A | $ 7,450 |
Class T | 2,287 |
Class B* | 7,594 |
Class C* | 697 |
| $ 18,028 |
* When Class B and Class C shares are initially sold, FDC pays commissions from its own resources to financial intermediaries through which the sales are made.
Transfer Agent Fees. Fidelity Investments Institutional Operations Company, Inc. (FIIOC), an affiliate of FMR, is the transfer, dividend disbursing and shareholder servicing agent for each class of the Fund. FIIOC receives account fees and asset-based fees that vary according to the account size and type of account of the shareholders of the respective classes of the Fund. FIIOC pays for typesetting, printing and mailing of shareholder reports, except proxy statements. For the period, transfer agent fees for each class were as follows:
Annual Report
Notes to Financial Statements - continued
5. Fees and Other Transactions with Affiliates - continued
Transfer Agent Fees - continued
| Amount | % of
Average
Net Assets |
Class A | $ 59,699 | .31 |
Class T | 35,532 | .32 |
Class B | 8,814 | .31 |
Class C | 26,844 | .31 |
International Small Cap Opportunities | 1,055,328 | .30 |
Institutional Class | 5,503 | .30 |
| $ 1,191,720 | |
Accounting and Security Lending Fees. Fidelity Service Company, Inc. (FSC), an affiliate of FMR, maintains the Fund's accounting records. The accounting fee is based on the level of average net assets for the month. Under a separate contract, FSC administers the security lending program. The security lending fee is based on the number and duration of lending transactions.
Brokerage Commissions. The Fund placed a portion of its portfolio transactions with brokerage firms which are affiliates of the investment adviser. The commissions paid to these affiliated firms were $1,186 for the period.
6. Committed Line of Credit.
The Fund participates with other funds managed by FMR or an affiliate in a $3.75 billion credit facility (the "line of credit") to be utilized for temporary or emergency purposes to fund shareholder redemptions or for other short-term liquidity purposes. The Fund has agreed to pay commitment fees on its pro-rata portion of the line of credit, which amounted to $1,513 and is reflected in Miscellaneous expenses on the Statement of Operations. During the period, there were no borrowings on this line of credit.
7. Security Lending.
The Fund lends portfolio securities through a lending agent from time to time in order to earn additional income. The lending agent may loan securities to certain qualified borrowers, including Fidelity Capital Markets (FCM), a broker-dealer affiliated with the Fund. On the settlement date of the loan, the Fund receives collateral (in the form of U.S. Treasury obligations, letters of credit and/or cash) against the loaned securities and maintains collateral in an amount not less than 100% of the market value of the loaned securities during the period of the loan. The market value of the loaned securities is determined at the close of business of the Fund and any additional required collateral is
Annual Report
7. Security Lending - continued
delivered to the Fund on the next business day. If the borrower defaults on its obligation to return the securities loaned because of insolvency or other reasons, a fund could experience delays and costs in recovering the securities loaned or in gaining access to the collateral. Any cash collateral received is invested in the Fidelity Securities Lending Cash Central Fund. The value of loaned securities and cash collateral at period end are disclosed on the Fund's Statement of Assets and Liabilities. Security lending income represents the income earned on investing cash collateral, less rebates paid to borrowers and lending agent fees associated with the loan, plus any premium payments received for lending certain types of securities. Security lending income is presented in the Statement of Operations as a component of income from Fidelity Central Funds. Total security lending income during the period amounted to $263,176. During the period, there were no securities loaned to FCM.
8. Expense Reductions.
Many of the brokers with whom FMR places trades on behalf of the Fund provided services to the Fund in addition to trade execution. These services included payments of certain expenses on behalf of the Fund totaling $55,920 for the period.
9. Distributions to Shareholders.
Distributions to shareholders of each class were as follows:
Years ended October 31, | 2010 | 2009 |
From net investment income | | |
Class A | $ 167,529 | $ - |
Class T | 81,809 | - |
Class B | 11,651 | - |
Class C | 35,378 | - |
International Small Cap Opportunities | 3,548,259 | 138,653 |
Institutional Class | 16,552 | 2,047 |
Total | $ 3,861,178 | $ 140,700 |
From net realized gain | | |
Class A | $ 203,751 | $ - |
Class T | 126,944 | - |
Class B | 31,778 | - |
Class C | 96,486 | - |
International Small Cap Opportunities | 3,588,127 | - |
Institutional Class | 20,407 | - |
Total | $ 4,067,493 | $ - |
Annual Report
Notes to Financial Statements - continued
10. Share Transactions.
Transactions for each class of shares were as follows:
| Shares | Dollars |
Years ended October 31, | 2010 | 2009 | 2010 | 2009 |
Class A | | | | |
Shares sold | 502,676 | 560,746 | $ 4,331,157 | $ 3,588,317 |
Reinvestment of distributions | 39,668 | - | 334,402 | - |
Shares redeemed | (821,208) | (1,093,254) | (7,086,973) | (6,722,964) |
Net increase (decrease) | (278,864) | (532,508) | $ (2,421,414) | $ (3,134,647) |
Class T | | | | |
Shares sold | 202,721 | 318,902 | $ 1,752,774 | $ 2,064,516 |
Reinvestment of distributions | 24,207 | - | 202,613 | - |
Shares redeemed | (563,942) | (704,037) | (4,787,797) | (4,201,658) |
Net increase (decrease) | (337,014) | (385,135) | $ (2,832,410) | $ (2,137,142) |
Class B | | | | |
Shares sold | 33,509 | 50,745 | $ 282,738 | $ 317,874 |
Reinvestment of distributions | 4,957 | - | 40,893 | - |
Shares redeemed | (89,943) | (133,859) | (751,714) | (788,113) |
Net increase (decrease) | (51,477) | (83,114) | $ (428,083) | $ (470,239) |
Class C | | | | |
Shares sold | 138,774 | 196,866 | $ 1,172,961 | $ 1,233,043 |
Reinvestment of distributions | 13,874 | - | 114,325 | - |
Shares redeemed | (301,965) | (662,831) | (2,545,004) | (3,650,532) |
Net increase (decrease) | (149,317) | (465,965) | $ (1,257,718) | $ (2,417,489) |
International Small Cap Opportunities | | | | |
Shares sold | 11,750,215 | 7,245,986 | $ 101,991,968 | $ 48,782,866 |
Reinvestment of distributions | 792,800 | 21,738 | 6,738,804 | 128,470 |
Shares redeemed | (12,779,026) | (16,613,794) | (110,633,144) | (102,979,613) |
Net increase (decrease) | (236,011) | (9,346,070) | $ (1,902,372) | $ (54,068,277) |
Institutional Class | | | | |
Shares sold | 111,833 | 256,950 | $ 1,028,388 | $ 1,455,739 |
Reinvestment of distributions | 3,263 | 122 | 27,765 | 720 |
Shares redeemed | (119,898) | (1,302,675) | (1,034,340) | (7,362,592) |
Net increase (decrease) | (4,802) | (1,045,603) | $ 21,813 | $ (5,906,133) |
Annual Report
11. Other.
The Fund's organizational documents provide former and current trustees and officers with a limited indemnification against liabilities arising in connection with the performance of their duties to the Fund. In the normal course of business, the Fund may also enter into contracts that provide general indemnifications. The Fund's maximum exposure under these arrangements is unknown as this would be dependent on future claims that may be made against the Fund. The risk of material loss from such claims is considered remote.
Annual Report
To the Trustees of Fidelity Investment Trust and Shareholders of Fidelity International Small Cap Opportunities Fund:
We have audited the accompanying statement of assets and liabilities of Fidelity International Small Cap Opportunities Fund (the Fund), a fund of Fidelity Investment Trust, including the schedule of investments, as of October 31, 2010, and the related statement of operations for the year then ended, the statement of changes in net assets for each of the two years in the period then ended, and the financial highlights for each of the five years in the period then ended. These financial statements and financial highlights are the responsibility of the Fund's management. Our responsibility is to express an opinion on these financial statements and financial highlights based on our audits.
We conducted our audits in accordance with standards of the Public Company Accounting Oversight Board (United States). Those standards require that we plan and perform the audit to obtain reasonable assurance about whether the financial statements and financial highlights are free of material misstatement. The Fund is not required to have, nor were we engaged to perform, an audit of its internal control over financial reporting. Our audits included consideration of internal control over financial reporting as a basis for designing audit procedures that are appropriate in the circumstances, but not for the purpose of expressing an opinion on the effectiveness of the Fund's internal control over financial reporting. Accordingly, we express no such opinion. An audit also includes examining, on a test basis, evidence supporting the amounts and disclosures in the financial statements, assessing the accounting principles used and significant estimates made by management, as well as evaluating the overall financial statement presentation. Our procedures included confirmation of securities owned as of October 31, 2010, by correspondence with the custodians and brokers; where replies were not received from brokers, we performed other auditing procedures. We believe that our audits provide a reasonable basis for our opinion.
In our opinion, the financial statements and financial highlights referred to above present fairly, in all material respects, the financial position of Fidelity International Small Cap Opportunities Fund as of October 31, 2010, the results of its operations for the year then ended, the changes in its net assets for each of the two years in the period then ended, and the financial highlights for each of the five years in the period then ended, in conformity with accounting principles generally accepted in the United States of America.
/s/ Deloitte & Touche LLP
DELOITTE & TOUCHE LLP
Boston, Massachusetts
December 16, 2010
Annual Report
The Trustees, Member of the Advisory Board, and executive officers of the trust and fund, as applicable, are listed below. The Board of Trustees governs the fund and is responsible for protecting the interests of shareholders. The Trustees are experienced executives who meet periodically throughout the year to oversee the fund's activities, review contractual arrangements with companies that provide services to the fund, oversee management of the risks associated with such activities and contractual arrangements, and review the fund's performance. Except for James C. Curvey, each of the Trustees oversees 221 funds advised by FMR or an affiliate. Mr. Curvey oversees 410 funds advised by FMR or an affiliate.
The Trustees hold office without limit in time except that (a) any Trustee may resign; (b) any Trustee may be removed by written instrument, signed by at least two-thirds of the number of Trustees prior to such removal; (c) any Trustee who requests to be retired or who has become incapacitated by illness or injury may be retired by written instrument signed by a majority of the other Trustees; and (d) any Trustee may be removed at any special meeting of shareholders by a two-thirds vote of the outstanding voting securities of the trust. Each Trustee who is not an interested person (as defined in the 1940 Act) (Independent Trustee), shall retire not later than the last day of the calendar year in which his or her 72nd birthday occurs. The Independent Trustees may waive this mandatory retirement age policy with respect to individual Trustees. The executive officers and Advisory Board Member hold office without limit in time, except that any officer and Advisory Board Member may resign or may be removed by a vote of a majority of the Trustees at any regular meeting or any special meeting of the Trustees. Except as indicated, each individual has held the office shown or other offices in the same company for the past five years.
Experience, Skills, Attributes, and Qualifications of the Fund's Trustees. The Governance and Nominating Committee has adopted a statement of policy that describes the experience, qualifications, attributes, and skills that are necessary and desirable for potential Independent Trustee candidates (Statement of Policy). The Board believes that each Trustee satisfied at the time he or she was initially elected or appointed a Trustee, and continues to satisfy, the standards contemplated by the Statement of Policy. The Governance and Nominating Committee also engages professional search firms to help identify potential Independent Trustee candidates who have the experience, qualifications, attributes, and skills consistent with the Statement of Policy. From time to time, additional criteria based on the composition and skills of the current Independent Trustees, as well as experience or skills that may be appropriate in light of future changes to board composition, business conditions, and regulatory or other developments, have also been considered by the professional search firms and the Governance and Nominating Committee. In addition, the Board takes into account the Trustees' commitment and participation in Board and committee meetings, as well as their leadership of standing and ad hoc committees throughout their tenure.
In determining that a particular Trustee was and continues to be qualified to serve as a Trustee, the Board has considered a variety of criteria, none of which, in isolation, was controlling. The Board believes that, collectively, the Trustees have balanced and diverse experience, qualifications, attributes, and skills, which allow the Board to operate effectively in governing the fund and protecting the interests of shareholders. Information about the specific experience, skills, attributes, and qualifications of each Trustee, which in each case led to the Board's conclusion that the Trustee should serve (or continue to serve) as a trustee of the fund, is provided below.
Annual Report
Board Structure and Oversight Function. Edward C. Johnson 3d is an interested person (as defined in the 1940 Act) and currently serves as Chairman. The Trustees have determined that an interested Chairman is appropriate and benefits shareholders because an interested Chairman has a personal and professional stake in the quality and continuity of services provided to the fund. Independent Trustees exercise their informed business judgment to appoint an individual of their choosing to serve as Chairman, regardless of whether the Trustee happens to be independent or a member of management. The Independent Trustees have determined that they can act independently and effectively without having an Independent Trustee serve as Chairman and that a key structural component for assuring that they are in a position to do so is for the Independent Trustees to constitute a substantial majority for the Board. The Independent Trustees also regularly meet in executive session. Ned C. Lautenbach serves as Chairman of the Independent Trustees and as such (i) acts as a liaison between the Independent Trustees and management with respect to matters important to the Independent Trustees and (ii) with management prepares agendas for Board meetings.
Fidelity funds are overseen by different Boards of Trustees. The fund's Board oversees Fidelity's equity and high income funds and another Board oversees Fidelity's investment-grade bond, money market, and asset allocation funds. The asset allocation funds may invest in Fidelity funds overseen by the fund's Board. The use of separate Boards, each with its own committee structure, allows the Trustees of each group of Fidelity funds to focus on the unique issues of the funds they oversee, including common research, investment, and operational issues. On occasion, the separate Boards establish joint committees to address issues of overlapping consequences for the Fidelity funds overseen by each Board.
The Trustees operate using a system of committees to facilitate the timely and efficient consideration of all matters of importance to the Trustees, the fund, and fund shareholders and to facilitate compliance with legal and regulatory requirements and oversight of the fund's activities and associated risks. The Board, acting through its committees, has charged FMR and its affiliates with (i) identifying events or circumstances the occurrence of which could have demonstrably adverse effects on the fund's business and/or reputation; (ii) implementing processes and controls to lessen the possibility that such events or circumstances occur or to mitigate the effects of such events or circumstances if they do occur; and (iii) creating and maintaining a system designed to evaluate continuously business and market conditions in order to facilitate the identification and implementation processes described in (i) and (ii) above. Because the day-to-day operations and activities of the fund are carried out by or through FMR, its affiliates and other service providers, the fund's exposure to risks is mitigated but not eliminated by the processes overseen by the Trustees. While each of the Board's committees has responsibility for overseeing different aspects of the fund's activities, oversight is exercised primarily through the Operations, Audit, and Compliance Committees. Appropriate personnel, including but not limited to the fund's Chief Compliance Officer (CCO), FMR's internal auditor, the independent accountants, the fund's Treasurer and portfolio management personnel, make periodic reports to the Board's committees, as appropriate. The responsibilities of each committee, including their oversight responsibilities, are described further under "Standing Committees of the Fund's Trustees."
Annual Report
Trustees and Officers - continued
The fund's Statement of Additional Information (SAI) includes more information about the Trustees. To request a free copy, call Fidelity at 1-800-544-8544.
Interested Trustees*:
Correspondence intended for each Trustee who is an interested person may be sent to Fidelity Investments, 82 Devonshire Street, Boston, Massachusetts 02109.
Name, Age; Principal Occupations and Other Relevant Experience+ |
Edward C. Johnson 3d (80) |
| Year of Election or Appointment: 1984 Mr. Johnson is Trustee and Chairman of the Board of Trustees of certain Trusts. Mr. Johnson serves as Chief Executive Officer, Chairman, and a Director of FMR LLC; Chairman and a Director of FMR; Chairman and a Director of Fidelity Research & Analysis Company (FRAC); Chairman and a Director of Fidelity Investments Money Management, Inc.; and Chairman and a Director of FMR Co., Inc. In addition, Mr. Johnson serves as Chairman and Director of FIL Limited. Previously, Mr. Johnson served as President of FMR LLC (2006-2007). |
James C. Curvey (75) |
| Year of Election or Appointment: 2007 Mr. Curvey also serves as Trustee (2007-present) of other investment companies advised by FMR. Mr. Curvey is a Director of Fidelity Investments Money Management, Inc. (2009-present), Director of Fidelity Research & Analysis Co. (2009-present) and Director of FMR and FMR Co., Inc. (2007-present). Mr. Curvey is also Vice Chairman (2007-present) and Director of FMR LLC. In addition, Mr. Curvey serves as an Overseer for the Boston Symphony Orchestra and a member of the Trustees of Villanova University. Previously, Mr. Curvey was the Vice Chairman (2006-2007) and Director (2000-2007) of FMR Corp. |
* Trustees have been determined to be "Interested Trustees" by virtue of, among other things, their affiliation with the trust or various entities under common control with FMR.
Annual Report
+ The information above includes each Trustee's principal occupation during the last five years and other information relating to the experience, attributes, and skills relevant to each Trustee's qualifications to serve as a Trustee, which led to the conclusion that each Trustee should serve as a Trustee for the fund.
Independent Trustees:
Correspondence intended for each Independent Trustee (that is, the Trustees other than the Interested Trustees) may be sent to Fidelity Investments, P.O. Box 55235, Boston, Massachusetts 02205-5235.
Name, Age; Principal Occupations and Other Relevant Experience+ |
Dennis J. Dirks (62) |
| Year of Election or Appointment: 2005 Prior to his retirement in May 2003, Mr. Dirks was Chief Operating Officer and a member of the Board of The Depository Trust & Clearing Corporation (DTCC). He also served as President, Chief Operating Officer, and Board member of The Depository Trust Company (DTC) and President and Board member of the National Securities Clearing Corporation (NSCC). In addition, Mr. Dirks served as Chief Executive Officer and Board member of the Government Securities Clearing Corporation, Chief Executive Officer and Board member of the Mortgage-Backed Securities Clearing Corporation, as a Trustee and a member of the Finance Committee of Manhattan College (2005-2008), and as a Trustee and a member of the Finance Committee of AHRC of Nassau County (2006-2008). Mr. Dirks is a member of the Independent Directors Council (IDC) Governing Council (2010-Present) and Board of Directors for The Brookville Center for Children's Services, Inc. (2009-present). |
Alan J. Lacy (57) |
| Year of Election or Appointment: 2008 Mr. Lacy serves as Senior Adviser (2007-present) of Oak Hill Capital Partners, L.P. (private equity). Mr. Lacy also served as Chief Executive Officer (2000-2005) and Vice Chairman (2005-2006) of Sears Holdings Corporation and Sears, Roebuck and Co. (retail). In addition, Mr. Lacy serves as a member of the Board of Directors of The Western Union Company (global money transfer, 2006-present) and Bristol-Myers Squibb Company (global pharmaceuticals, 2007-present). Mr. Lacy is Chairman (2008-present) and a member (2006-present) of the Board of Trustees of The National Parks Conservation Association. |
Ned C. Lautenbach (66) |
| Year of Election or Appointment: 2000 Mr. Lautenbach is Chairman of the Independent Trustees of the Equity and High Income Funds (2006-present). Mr. Lautenbach currently serves as the Lead Director of the Eaton Corporation Board of Directors (diversified industrial, 1997-present). Mr. Lautenbach is also a member of the Board of Directors of the Philharmonic Center for the Arts in Naples, Florida (1999-present); a member of the Board of Trustees of Fairfield University (2005-present); and a member of the Council on Foreign Relations (1994-present). Previously, Mr. Lautenbach was a Partner/Advisory Partner at Clayton, Dubilier & Rice, Inc. (private equity investment, 1998-2010), as well as a Director of Sony Corporation (2006-2007). |
Joseph Mauriello (66) |
| Year of Election or Appointment: 2008 Prior to his retirement in January 2006, Mr. Mauriello served in numerous senior management positions including Deputy Chairman and Chief Operating Officer (2004-2005), and Vice Chairman of Financial Services (2002-2004) of KPMG LLP US (professional services, 1965-2005). Mr. Mauriello currently serves as a member of the Board of Directors of XL Group plc. (global insurance and re-insurance, 2006-present) and of Arcadia Resources Inc. (health care services and products, 2007-present). Previously, Mr. Mauriello served as a Director of the Hamilton Funds of the Bank of New York (2006-2007). |
Cornelia M. Small (66) |
| Year of Election or Appointment: 2005 Ms. Small is a member of the Board of Directors of the Teagle Foundation (2009-present). Ms. Small is also a member of the Investment Committee, and Chair (2008-present) and a member of the Board of Trustees of Smith College. In addition, Ms. Small serves on the Investment Committee of the Berkshire Taconic Community Foundation (2008-present). Previously, Ms. Small served as Chairperson of the Investment Committee (2002-2008) of Smith College. In addition, Ms. Small served as Chief Investment Officer, Director of Global Equity Investments, and a member of the Board of Directors of Scudder, Stevens & Clark and Scudder Kemper Investments. |
William S. Stavropoulos (71) |
| Year of Election or Appointment: 2001 Mr. Stavropoulos is Vice Chairman of the Independent Trustees of the Equity and High Income Funds (2006-present). Mr. Stavropoulos serves as President and Founder of the Michigan Baseball Foundation, the Great Lakes Loons (2007-present). Mr. Stavropoulos is Chairman Emeritus of the Board of Directors of The Dow Chemical Company, where he previously served in numerous senior management positions, including President, CEO (1995-2000; 2002-2004), Chairman of the Executive Committee (2000-2006), and as a member of the Board of Directors (1990-2006). Currently, Mr. Stavropoulos is Chairman of Univar (global distributor of commodity and specialty chemicals, 2010-present), a Director of Teradata Corporation (data warehousing and technology solutions, 2008-present), Chemical Financial Corporation, Maersk Inc. (industrial conglomerate), Tyco International, Inc. (multinational manufacturing and services, 2007-present), and a member of the Advisory Board for Metalmark Capital (private equity investment, 2005-present). Mr. Stavropoulos is a special advisor to Clayton, Dubilier & Rice, Inc. (private equity investment). In addition, Mr. Stavropoulos is a member of the University of Notre Dame Advisory Council for the College of Science. |
David M. Thomas (61) |
| Year of Election or Appointment: 2008 Previously, Mr. Thomas served as Executive Chairman (2005-2006) and Chairman and Chief Executive Officer (2000-2005) of IMS Health, Inc. (pharmaceutical and healthcare information solutions). In addition, Mr. Thomas serves as a member of the Board of Directors of Fortune Brands, Inc. (consumer products), and Interpublic Group of Companies, Inc. (marketing communication, 2004-present). |
Michael E. Wiley (60) |
| Year of Election or Appointment: 2008 Mr. Wiley also serves as a Director of Asia Pacific Exploration Consolidated (international oil and gas exploration and production, 2008-present). Mr. Wiley serves as a Director of Tesoro Corporation (independent oil refiner and marketer, 2005-present), and a Director of Bill Barrett Corporation (exploration and production, 2005-present). In addition, Mr. Wiley also serves as a Director of Post Oak Bank (privately-held bank, 2004-present). Previously, Mr. Wiley served as a member of the Board of Trustees of the University of Tulsa (2000-2006; 2007-2010), as a Senior Energy Advisor of Katzenbach Partners, LLC (consulting, 2006-2007), as an Advisory Director of Riverstone Holdings (private investment), Chairman, President, and CEO of Baker Hughes, Inc. (oilfield services, 2000-2004), and as Director of Spinnaker Exploration Company (exploration and production, 2001-2005). |
Annual Report
Trustees and Officers - continued
+ The information above includes each Trustee's principal occupation during the last five years and other information relating to the experience, attributes, and skills relevant to each Trustee's qualifications to serve as a Trustee, which led to the conclusion that each Trustee should serve as a Trustee for the fund.
Advisory Board Member and Executive Officers:
Correspondence intended for each executive officer and Peter S. Lynch may be sent to Fidelity Investments, 82 Devonshire Street, Boston, Massachusetts 02109.
Name, Age; Principal Occupation |
Peter S. Lynch (66) |
| Year of Election or Appointment: 2003 Member of the Advisory Board of Fidelity's Equity and High Income Funds. Mr. Lynch is Vice Chairman and a Director of FMR and FMR Co., Inc. In addition, Mr. Lynch serves as a Trustee of Boston College and as the Chairman of the Inner-City Scholarship Fund. Previously, Mr. Lynch served on the Special Olympics International Board of Directors (1997-2006). |
Kenneth B. Robins (41) |
| Year of Election or Appointment: 2008 President and Treasurer of Fidelity's Equity and High Income Funds. Mr. Robins also serves as President and Treasurer (2010-present) and Assistant Treasurer (2009-present) of other Fidelity funds and is an employee of Fidelity Investments (2004-present). Previously, Mr. Robins served as Deputy Treasurer of the Fidelity funds (2005-2008) and Treasurer and Chief Financial Officer of The North Carolina Capital Management Trust: Cash and Term Portfolios (2006-2008). |
Thomas C. Hense (46) |
| Year of Election or Appointment: 2008 or 2010 Vice President of Fidelity's High Income (2008), Small Cap (2008), and Value (2010) Funds. Previously, Mr. Hense served as a portfolio manager for Fidelity's Institutional Money Management Group (Pyramis) (2003-2008). |
Brian B. Hogan (46) |
| Year of Election or Appointment: 2009 Vice President of certain Equity Funds and Vice President of Sector Funds. Mr. Hogan also serves as President of FMR's Equity Division (2009-present). Previously, Mr. Hogan served as Senior Vice President, Equity Research of FMR (2006-2009) and as a portfolio manager. |
Scott C. Goebel (42) |
| Year of Election or Appointment: 2008 Secretary and Chief Legal Officer (CLO) of the Fidelity funds. Mr. Goebel also serves as Secretary and CLO of The North Carolina Capital Management Trust: Cash and Term Portfolio (2008-present); General Counsel, Secretary, and Senior Vice President of FMR (2008-present) and FMR Co., Inc. (2008-present); Deputy General Counsel of FMR LLC; Chief Legal Officer of Fidelity Management & Research (Hong Kong) Limited (2008-present) and Assistant Secretary of Fidelity Management & Research (Japan) Inc. (2008-present), Fidelity Investments Money Management, Inc. (2008-present), Fidelity Management & Research (U.K.) Inc. (2008-present), and Fidelity Research and Analysis Company (2008-present). Previously, Mr. Goebel served as Assistant Secretary of the Funds (2007-2008) and as Vice President and Secretary of Fidelity Distributors Corporation (FDC) (2005-2007). |
William C. Coffey (41) |
| Year of Election or Appointment: 2009 Assistant Secretary of Fidelity's Equity and High Income Funds. Mr. Coffey also serves as Senior Vice President and Deputy General Counsel of FMR LLC (2010-present), and is an employee of Fidelity Investments. Previously, Mr. Coffey served as Vice President and Associate General Counsel of FMR LLC (2005-2009). |
Holly C. Laurent (56) |
| Year of Election or Appointment: 2008 Anti-Money Laundering (AML) Officer of the Fidelity funds. Ms. Laurent also serves as AML Officer of The North Carolina Capital Management Trust: Cash and Term Portfolio (2008-present) and is an employee of Fidelity Investments. Previously, Ms. Laurent was Senior Vice President and Head of Legal for Fidelity Business Services India Pvt. Ltd. (2006-2008), and Senior Vice President, Deputy General Counsel and Group Head for FMR LLC (2005-2006). |
Christine Reynolds (52) |
| Year of Election or Appointment: 2008 Chief Financial Officer of the Fidelity funds. Ms. Reynolds became President of Fidelity Pricing and Cash Management Services (FPCMS) in August 2008. Ms. Reynolds served as Chief Operating Officer of FPCMS (2007-2008). Previously, Ms. Reynolds served as President, Treasurer, and Anti-Money Laundering officer of the Fidelity funds (2004-2007). |
Kenneth A. Rathgeber (63) |
| Year of Election or Appointment: 2004 Chief Compliance Officer of Fidelity's Equity and High Income Funds. Mr. Rathgeber is Chief Compliance Officer of Fidelity Management & Research (Hong Kong) Limited (2008-present), Fidelity Management & Research (Japan) Inc. (2008-present), FMR (2005-present), FMR Co., Inc. (2005-present), Fidelity Management & Research (U.K.) Inc. (2005-present), Fidelity Research & Analysis Company (2005-present), Fidelity Investments Money Management, Inc. (2005-present), Pyramis Global Advisors, LLC (2005-present), and Strategic Advisers, Inc. (2005-present). |
Jeffrey S. Christian (49) |
| Year of Election or Appointment: 2009 Deputy Treasurer of the Fidelity funds. Mr. Christian is an employee of Fidelity Investments. Previously, Mr. Christian served as Chief Financial Officer (2008-2009) of certain Fidelity funds and Senior Vice President of Fidelity Pricing and Cash Management Services (FPCMS) (2004-2009). |
Bryan A. Mehrmann (49) |
| Year of Election or Appointment: 2005 Deputy Treasurer of the Fidelity funds. Mr. Mehrmann is an employee of Fidelity Investments. |
Adrien E. Deberghes (43) |
| Year of Election or Appointment: 2008 Deputy Treasurer of Fidelity's Equity and High Income Funds. Mr. Deberghes also serves as Assistant Treasurer of other Fidelity funds (2010-present) and is an employee of Fidelity Investments (2008-present). Previously, Mr. Deberghes served as Senior Vice President of Mutual Fund Administration at State Street Corporation (2007-2008), Senior Director of Mutual Fund Administration at Investors Bank & Trust (2005-2007), and Director of Finance for Dunkin' Brands (2000-2005). |
Stephanie J. Dorsey (41) |
| Year of Election or Appointment: 2010 Assistant Treasurer of Fidelity's Equity and High Income Funds. Ms. Dorsey also serves as Deputy Treasurer of other Fidelity funds (2008-present) and is an employee of Fidelity Investments (2008-present). Previously, Ms. Dorsey served as Treasurer (2004-2008) of the JPMorgan Mutual Funds and Vice President (2004-2008) of JPMorgan Chase Bank. |
John R. Hebble (52) |
| Year of Election or Appointment: 2009 Assistant Treasurer of Fidelity's Equity and High Income Funds. Mr. Hebble also serves as Treasurer and Chief Financial Officer of The North Carolina Capital Management Trust: Cash and Term Portfolio (2008-present), President and Treasurer of other Fidelity funds (2008-present) and is an employee of Fidelity Investments. |
Gary W. Ryan (52) |
| Year of Election or Appointment: 2005 Assistant Treasurer of the Fidelity funds. Mr. Ryan is an employee of Fidelity Investments. Previously, Mr. Ryan served as Vice President of Fund Reporting in Fidelity Pricing and Cash Management Services (FPCMS) (1999-2005). |
Jonathan Davis (42) |
| Year of Election or Appointment: 2010 Assistant Treasurer of the Fidelity funds. Mr. Davis is an employee of Fidelity Investments. Previously, Mr. Davis served as Vice President and Associate General Counsel of FMR LLC (2003-2010). |
Annual Report
The Board of Trustees of International Small Cap Opportunities Fund voted to pay to shareholders of record at the opening of business on record date, the following distributions per share derived from capital gains realized from sales of portfolio securities, and dividends derived from net investment income:
| Pay Date | Record Date | Dividends | Capital Gains |
International Small Cap Opportunities | 12/06/10 | 12/03/10 | $0.086 | $0.04 |
International Small Cap Opportunities designates 48% of the dividends distributed during the fiscal year as amounts which may be taken into account as a dividend for the purposes of the maximum rate under section 1(h)(11) of the Internal Revenue Code.
The amounts per share which represent income derived from sources within, and taxes paid to, foreign countries or possessions of the United States are as follows:
| Pay Date | Income | Taxes |
International Small Cap Opportunities | 12/07/09 | $0.083 | $0.0064 |
The fund will notify shareholders in January 2011 of amounts for use in preparing 2010 income tax returns.
Annual Report
Board Approval of Investment Advisory Contracts and Management Fees
Fidelity International Small Cap Opportunities Fund
Each year, the Board of Trustees, including the Independent Trustees (together, the Board), votes on the renewal of the management contract and sub-advisory agreements (together, the Advisory Contracts) for the fund. The Board, assisted by the advice of fund counsel and Independent Trustees' counsel, requests and considers a broad range of information relevant to the renewal of the Advisory Contracts throughout the year.
The Board meets regularly and considers at each of its meetings factors that are relevant to its annual consideration of the renewal of the fund's Advisory Contracts, including the services and support provided to the fund and its shareholders. The Board has established various standing committees, each composed of Independent Trustees with varying backgrounds, to which the Board has assigned specific subject matter responsibilities in order to enhance effective decision-making by the Board. The Board, acting directly and through its Committees, requests and receives information concerning the annual consideration of the renewal of the fund's Advisory Contracts. The Board also meets as needed to consider matters specifically related to the Board's annual consideration of the renewal of Advisory Contracts. Members of the Board may also meet with trustees of other Fidelity funds through ad hoc joint committees to discuss certain matters relevant to the Fidelity funds.
At its July 2010 meeting, the Board of Trustees, including the Independent Trustees, unanimously determined to renew the fund's Advisory Contracts. In reaching its determination, the Board considered all factors it believed relevant, including (i) the nature, extent, and quality of the services to be provided to the fund and its shareholders (including the investment performance of the fund); (ii) the competitiveness of the fund's management fee and total expenses; (iii) the total costs of the services to be provided by and the profits to be realized by Fidelity from its relationship with the fund; (iv) the extent to which economies of scale would be realized as the fund grows; and (v) whether fee levels reflect these economies of scale, if any, for the benefit of fund shareholders.
In considering whether to renew the Advisory Contracts for the fund, the Board reached a determination, with the assistance of fund counsel and Independent Trustees' counsel and through the exercise of its business judgment, that the renewal of the Advisory Contracts is in the best interests of fund shareholders and that the compensation to be received by Fidelity under the management contract is fair and reasonable. The Board's decision to renew the Advisory Contracts was not based on any single factor noted above, but rather was based on a comprehensive consideration of all the information provided to the Board at its meetings throughout the year. The Board, in reaching its determination to renew the Advisory Contracts, is aware that shareholders in the fund have a broad range of investment choices available to them, including a wide choice among mutual funds offered by Fidelity's competitors, and that the fund's shareholders, with the opportunity to review and weigh the disclosure provided by the fund in its prospectus and other public disclosures, have chosen to invest in this fund, managed by Fidelity.
Annual Report
Board Approval of Investment Advisory Contracts and
Management Fees - continued
Nature, Extent, and Quality of Services Provided. The Board considered the staffing within the investment adviser, FMR, and the sub-advisers (together, the Investment Advisers), including the backgrounds of the fund's investment personnel and the fund's investment objective and discipline. The Independent Trustees also had discussions with senior management of Fidelity's investment operations and investment groups. The Board considered the structure of the portfolio manager compensation program and whether this structure provides appropriate incentives to act in the best interest of the fund.
Resources Dedicated to Investment Management and Support Services. The Board and the equity research subcommittee of the Board's Fund Oversight Committee reviewed the size, education, and experience of the Investment Advisers' investment staff, their use of technology, and the Investment Advisers' approach to recruiting, training, and retaining portfolio managers and other research, advisory, and management personnel. The Board noted that Fidelity's analysts have access to a variety of technological tools and market and securities data that enable them to perform both fundamental and quantitative analysis and to specialize in various disciplines. The Board considered Fidelity's extensive global research capabilities that enable the Investment Advisers to aggregate data from various sources in an effort to produce positive investment results. The Board also considered that Fidelity's portfolio managers and analysts have access to daily portfolio attribution that allows for monitoring of a fund's portfolio, as well as an electronic communication system that provides immediate real-time access to research concerning issuers and credit enhancers. The Board noted FMR's continued focus on strengthening the organization and discipline of equity portfolio management and research.
Shareholder and Administrative Services. The Board considered (i) the nature, extent, quality, and cost of advisory, administrative, and shareholder services performed by the Investment Advisers and their affiliates under the Advisory Contracts and under separate agreements covering transfer agency, pricing and bookkeeping, and securities lending services for the fund; (ii) the nature and extent of the investment adviser's supervision of third party service providers, principally custodians and subcustodians; and (iii) the resources devoted to, and the record of compliance with, the fund's compliance policies and procedures. The Board also reviewed the allocation of fund brokerage, including allocations to brokers affiliated with the Investment Advisers, the use of brokerage commissions to pay fund expenses, and the use of "soft" commission dollars to pay for research services.
The Board noted that the growth of fund assets over time across the complex allows Fidelity to reinvest in the development of services designed to enhance the value or convenience of the Fidelity funds as investment vehicles. These services include 24-hour access to account information and market information through phone representatives and over the Internet, and investor education materials and asset allocation tools.
Annual Report
Investment in a Large Fund Family. The Board considered the benefits to shareholders of investing in a Fidelity fund, including the benefits of investing in a fund that is part of a large family of funds offering a variety of investment disciplines and providing a large variety of mutual fund investor services. The Board noted that Fidelity had taken, or had made recommendations that resulted in the Fidelity funds taking, a number of actions over the previous year that benefited particular funds, including (i) dedicating additional resources to investment research and restructuring and broadening the focus of the investment research teams; (ii) bolstering the senior management team that oversees asset management; (iii) launching Class F of certain funds as a lower-fee class available to Freedom K and Freedom Index Funds; (iv) lowering the initial investment minimums and ongoing balance requirements for Real Estate High Income Fund; (v) eliminating subsequent purchase minimums for all funds and adding a waiver of the investment minimum requirement for new accounts opened with the proceeds of a systematic withdrawal plan; (vi) eliminating the withdrawal minimum and maximum limits for systematic withdrawals from Advisor funds; (vii) expanding sales load waivers on Class A shares for Destiny Planholders and expanding Institutional Class eligibility for Class O Destiny Planholders; and (viii) changing certain Class A and Class T sales charge structures to further align them with industry practices.
Investment Performance. The Board considered whether the fund has operated in accordance with its investment objective, as well as its record of compliance with its investment restrictions. It also reviewed the fund's absolute investment performance for each class, as well as the fund's relative investment performance for each class measured over multiple periods against (i) a broad-based securities market index, and (ii) a peer group of mutual funds deemed appropriate by Fidelity and reviewed by the Board. Because the fund had been in existence less than five calendar years, the following charts considered by the Board show, over the one- and three-year periods ended December 31, 2009, the cumulative total returns of Institutional Class (Class I) and Class B of the fund, the cumulative total returns of a broad-based securities market index ("benchmark"), and a range of cumulative total returns of a peer group of mutual funds identified by Lipper Inc. as having an investment objective similar to that of the fund. The returns of Institutional Class (Class I) and Class B show the performance of the highest and lowest performing classes, respectively (based on three-year performance). The box within each chart shows the 25th percentile return (bottom of box) and the 75th percentile return (top of box) of the peer group. Returns shown above the box are in the first quartile and returns shown below the box are in the fourth quartile. The percentage beaten numbers noted below each chart correspond to the percentile box and represent the percentage of funds in the peer group whose performance was equal to or lower than that of the class indicated.
Annual Report
Board Approval of Investment Advisory Contracts and
Management Fees - continued
Fidelity International Small Cap Opportunities Fund

The Board reviewed the fund's relative investment performance against its peer group and noted that the performance of Institutional Class (Class I) of the fund was in the second quartile for the one-year period and the fourth quartile for the three-year period. The Board also noted that the investment performance of the fund was lower than its benchmark for all the periods shown. The Board considered that the variations in performance among the fund's classes reflect the variations in class expenses, which result in lower performance for higher expense classes. The Board also reviewed the fund's performance since inception as well as performance in the current year.
The Board also considered that the fund's management fee is subject to upward or downward adjustment depending upon whether, and to what extent, the fund's investment performance for the performance period exceeds, or is exceeded by, the record (over the same period) of a Board-approved performance adjustment index. The Board realizes that the performance adjustment provides FMR with a strong economic incentive to seek to achieve superior performance for the fund's shareholders and helps to more closely align the interests of FMR and the fund's shareholders.
Based on its review, and giving particular weight to the nature and quality of the resources dedicated by the Investment Advisers to maintain and improve relative performance and factoring in the unprecedented market events in recent years, the Board concluded that the nature, extent, and quality of investment management and support services and of shareholder and administrative services provided to the fund will benefit the fund's shareholders, particularly in light of the Board's view that the fund's shareholders benefit from investing in a fund that is part of a large family of funds offering a variety of investment disciplines and services.
Annual Report
Competitiveness of Management Fee and Total Fund Expenses. The Board considered the fund's management fee and total expenses compared to "mapped groups" of competitive funds and classes. Fidelity creates "mapped groups" by combining similar Lipper investment objective categories that have comparable management fee characteristics. Combining Lipper investment objective categories aids the Board's management fee and total expense comparisons by broadening the competitive group used for comparison and by reducing the number of universes to which various Fidelity funds are compared.
Management Fee. The Board considered two proprietary management fee comparisons for the 12-month (or shorter) periods shown in the chart below. The group of Lipper funds used by the Board for management fee comparisons is referred to below as the "Total Mapped Group." The Total Mapped Group is broader than the Lipper peer group used by the Board for performance comparisons because the Total Mapped Group combines several Lipper investment objective categories while the Lipper peer group does not. The Total Mapped Group comparison focuses on a fund's standing relative to the total universe of comparable funds available to investors, in terms of gross management fees before expense reimbursements or caps, and without giving effect to the fund's performance adjustment. "TMG %" represents the percentage of funds in the Total Mapped Group that had management fees that were lower than the fund's. For example, a TMG % of 19% means that 81% of the funds in the Total Mapped Group had higher management fees than the fund. The "Asset-Size Peer Group" (ASPG) comparison focuses on a fund's standing relative to non-Fidelity funds similar in size to the fund within the Total Mapped Group. The ASPG represents at least 15% of the funds in the Total Mapped Group with comparable asset size and management fee characteristics, subject to a minimum of 50 funds (or all funds in the Total Mapped Group if fewer than 50). Additional information, such as the ASPG quartile in which the fund's management fee ranked and the impact of the fund's performance adjustment, is also included in the chart and considered by the Board.
Annual Report
Board Approval of Investment Advisory Contracts and
Management Fees - continued
Fidelity International Small Cap Opportunities Fund

The Board noted that the fund's management fee ranked below the median of its Total Mapped Group and below the median of its ASPG for 2009. The Board also noted the effect of the fund's negative performance adjustment on the fund's management fee ranking. The Board noted that the performance adjustment for each year represents calculations for performance periods that differ from the periods shown in the performance charts above.
Based on its review, the Board concluded that the fund's management fee is fair and reasonable in light of the services that the fund receives and the other factors considered.
Total Expenses. In its review of each class's total expenses, the Board considered the fund's management fee as well as other fund or class expenses, as applicable, such as transfer agent fees, pricing and bookkeeping fees, fund-paid 12b-1 fees, and custodial, legal, and audit fees. The Board also noted the effects of any waivers and reimbursements on fees and expenses, as well as the impact of the fund's performance adjustment. As part of its review, the Board also considered current and historical total expenses of each class of the fund compared to competitive fund median expenses. Each class of the fund is compared to those funds and classes in the Total Mapped Group (used by the Board for management fee comparisons) that have a similar sales load structure.
The Board noted that the total expenses of each class ranked below its competitive median for 2009.
Annual Report
Fees Charged to Other Fidelity Clients. The Board also considered Fidelity fee structures and other information with respect to clients of FMR and its affiliates, such as other mutual funds advised or subadvised by FMR or its affiliates, pension plan clients, and other institutional clients. In March 2010, the Board created an ad hoc joint committee with the board of other Fidelity funds (the Committee) to review and compare Fidelity's institutional investment advisory business with its business of providing services to the Fidelity funds, including the differences in services provided, fees charged, and costs incurred, as well as competition in their respective marketplaces.
Based on its review of total expenses and fees charged to other Fidelity clients, the Board concluded that the total expenses of each class of the fund were reasonable in light of the services that the fund and its shareholders receive and the other factors considered, including the findings of the Committee.
Costs of the Services and Profitability. The Board considered the revenues earned and the expenses incurred by Fidelity in conducting the business of developing, marketing, distributing, managing, administering and servicing the fund and its shareholders. The Board also considered the level of Fidelity's profits in respect of all the Fidelity funds.
On an annual basis, FMR presents to the Board Fidelity's profitability for the fund. Fidelity calculates the profitability for each fund, as well as aggregate profitability for groups of Fidelity funds and all Fidelity funds, using a series of detailed revenue and cost allocation methodologies which originate with the audited books and records of Fidelity. The Audit Committee of the Board reviews any significant changes from the prior year's methodologies.
PricewaterhouseCoopers LLP (PwC), independent registered public accounting firm and auditor to Fidelity and certain Fidelity funds, has been engaged annually by the Board as part of the Board's assessment of Fidelity's profitability analysis. PwC's engagement includes the review and assessment of Fidelity's methodologies used in determining the revenues and expenses attributable to Fidelity's mutual fund business, and completion of agreed-upon procedures surrounding the mathematical accuracy of fund profitability and its conformity to allocation methodologies. After considering PwC's reports issued under the engagement and information provided by Fidelity, the Board believes that while other allocation methods may also be reasonable, Fidelity's profitability methodologies are reasonable in all material respects.
The Board has also reviewed Fidelity's non-fund businesses and fall-out benefits related to the mutual fund business as well as cases where Fidelity's affiliates may benefit from or be related to the fund's business.
Annual Report
Board Approval of Investment Advisory Contracts and
Management Fees - continued
The Board considered the costs of the services provided by and the profits realized by Fidelity in connection with the operation of the fund and were satisfied that the profitability was not excessive in the circumstances.
Economies of Scale. The Board considered whether there have been economies of scale in respect of the management of the Fidelity funds, whether the Fidelity funds (including the fund) have appropriately benefited from any such economies of scale, and whether there is potential for realization of any further economies of scale. The Board considered the extent to which the fund will benefit from economies of scale through increased services to the fund, through waivers or reimbursements, or through fee or expense reductions.
In February 2009, the Board and the board of other Fidelity funds created an ad hoc committee (the Economies of Scale Committee) to analyze whether FMR attains economies of scale in respect of the management and servicing of the Fidelity funds, whether the Fidelity funds have appropriately benefited from such economies of scale, and whether there is potential for realization of any further economies of scale.
The Board recognized that the fund's management contract incorporates a "group fee" structure, which provides for lower group fee rates as total fund assets under FMR's management increase, and for higher group fee rates as total fund assets under FMR's management decrease. FMR calculates the group fee rates based on a tiered asset "breakpoint" schedule that varies based on asset class. The Board considered that the group fee is designed to deliver the benefits of economies of scale to fund shareholders when total Fidelity fund assets increase, even if assets of any particular fund are unchanged or have declined, because some portion of Fidelity's costs are attributable to services provided to all Fidelity funds, and all funds benefit if those costs can be allocated among more assets. The Board concluded that, given the group fee structure, fund shareholders will benefit from lower management fees as assets under FMR's management increase at the fund complex level, regardless of whether Fidelity achieves any such economies of scale.
The Board concluded, considering the findings of the Economies of Scale Committee, that any potential economies of scale are being appropriately shared between fund shareholders and Fidelity.
Additional Information Requested by the Board. In order to develop fully the factual basis for consideration of the Fidelity funds' Advisory Contracts, the Board requested and received additional information on certain topics, including (i) fund performance trends, actions to be taken by FMR to improve certain funds' overall performance, and Fidelity's long-term strategies for certain funds; (ii) portfolio manager changes that have occurred during the past year and length of portfolio manager tenure for different categories of funds over time; (iii) Fidelity's compensation structure for portfolio managers, research analysts, and other key personnel, the rationale for the compensation structure, and how the compensation structure provides appropriate performance incentives; (iv) the amount of the investment that each portfolio manager has made in the Fidelity fund(s) that he or she manages; (v) management and other fees paid by FMR to affiliated sub-advisers on behalf of the Fidelity funds; (vi) Fidelity's fee structures and rationale for recommending different fees among different categories of funds; (vii) Fidelity's rationale for recommending which funds should have a performance adjustment component as part of their management fees; (viii) the rationale for any differences between fund fee structures and fee structures in place for other Fidelity clients; and (ix) explanations regarding the relative total expenses borne by certain funds and classes, total expense competitive trends, and actions that might be taken by FMR to reduce total expenses for certain funds and classes.
Annual Report
Based on its evaluation of all of the conclusions noted above, and after considering all factors it believed relevant, the Board ultimately concluded that the advisory fee structures are fair and reasonable, and that the fund's Advisory Contracts should be renewed.
Annual Report
Managing Your Investments
Fidelity offers several ways to conveniently manage your personal investments via your telephone or PC. You can access your account information, conduct trades and research your investments 24 hours a day.
By Phone
Fidelity Automated Service Telephone provides a single toll-free number to access account balances, positions, quotes and trading. It's easy to navigate the service, and on your first call, the system will help you create a personal identification number (PIN) for security.
(phone_graphic)
Fidelity Automated
Service Telephone (FAST®)
1-800-544-5555
Press
For mutual fund and brokerage trading.
For quotes.*
For account balances and holdings.
To review orders and mutual
fund activity.
To change your PIN.
To speak to a Fidelity representative.
By PC
Fidelity's web site on the Internet provides a wide range of information, including daily financial news, fund performance, interactive planning tools and news about Fidelity products and services.
(computer_graphic)
Fidelity's Web Site
www.fidelity.com
* When you call the quotes line, please remember that a fund's yield and return will vary and, except for money market funds, share price will also vary. This means that you may have a gain or loss when you sell your shares. There is no assurance that money market funds will be able to maintain a stable $1 share price; an investment in a money market fund is not insured or guaranteed by the U.S. government. Total returns are historical and include changes in share price, reinvestment of dividends and capital gains, and the effects of any sales charges.
Annual Report
To Write Fidelity
We'll give your correspondence immediate attention and send you written confirmation upon completion of your request.
(letter_graphic)
Making Changes
To Your Account
(such as changing name, address, bank, etc.)
Fidelity Investments
P.O. Box 770001
Cincinnati, OH 45277-0002
(letter_graphic)
For Non-Retirement
Accounts
Buying shares
Fidelity Investments
P.O. Box 770001
Cincinnati, OH 45277-0003
Overnight Express
Fidelity Investments
Attn: Distribution Services
100 Crosby Parkway - KC1H
Covington, KY 41015
Selling shares
Fidelity Investments
P.O. Box 770001
Cincinnati, OH 45277-0035
Overnight Express
Fidelity Investments
Attn: Distribution Services
100 Crosby Parkway - KC1H
Covington, KY 41015
General Correspondence
Fidelity Investments
P.O. Box 500
Merrimack, NH 03054-0500
(letter_graphic)
For Retirement
Accounts
Buying shares
Fidelity Investments
P.O. Box 770001
Cincinnati, OH 45277-0003
Selling shares
Fidelity Investments
P.O. Box 770001
Cincinnati, OH 45277-0035
Overnight Express
Fidelity Investments
Attn: Distribution Services
100 Crosby Parkway - KC1H
Covington, KY 41015
General Correspondence
Fidelity Investments
P.O. Box 500
Merrimack, NH 03054-0500
Annual Report
To Visit Fidelity
For directions and hours,
please call 1-800-544-9797.
Arizona
7001 West Ray Road
Chandler, AZ
15445 N. Scottsdale Road
Scottsdale, AZ
17550 North 75th Avenue
Glendale, AZ
5330 E. Broadway Blvd
Tucson, AZ
California
815 East Birch Street
Brea, CA
1411 Chapin Avenue
Burlingame, CA
851 East Hamilton Avenue
Campbell, CA
601 Larkspur Landing Circle
Larkspur, CA
2000 Avenue of the Stars
Los Angeles, CA
27101 Puerta Real
Mission Viejo, CA
73575 El Paseo
Palm Desert, CA
251 University Avenue
Palo Alto, CA
123 South Lake Avenue
Pasadena, CA
16656 Bernardo Ctr. Drive
Rancho Bernardo, CA
1220 Roseville Parkway
Roseville, CA
1740 Arden Way
Sacramento, CA
7676 Hazard Center Drive
San Diego, CA
11943 El Camino Real
San Diego, CA
8 Montgomery Street
San Francisco, CA
3793 State Street
Santa Barbara, CA
1200 Wilshire Boulevard
Santa Monica, CA
398 West El Camino Real
Sunnyvale, CA
111 South Westlake Blvd
Thousand Oaks, CA
21701 Hawthorne Boulevard
Torrance, CA
2001 North Main Street
Walnut Creek, CA
6326 Canoga Avenue
Woodland Hills, CA
2211 Michelson Drive
Irvine, CA
Colorado
281 East Flatiron Circle
Broomfield, CO
1625 Broadway
Denver, CO
9185 Westview Road
Lone Tree, CO
Connecticut
48 West Putnam Avenue
Greenwich, CT
265 Church Street
New Haven, CT
300 Atlantic Street
Stamford, CT
29 South Main Street
West Hartford, CT
1261 Post Road
Fairfield, CT
Delaware
400 Delaware Avenue
Wilmington, DE
Florida
175 East Altamonte Drive
Altamonte Springs, FL
1400 Glades Road
Boca Raton, FL
121 Alhambra Plaza
Coral Gables, FL
2948 N. Federal Highway
Ft. Lauderdale, FL
4671 Town Center Parkway
Jacksonville, FL
8880 Tamiami Trail, North
Naples, FL
230 Royal Palm Way
Palm Beach, FL
3501 PGA Boulevard
Palm Beach Gardens, FL
3550 Tamiami Trail, South
Sarasota, FL
1502 N. Westshore Blvd.
Tampa, FL
2465 State Road 7
Wellington, FL
Georgia
3242 Peachtree Road
Atlanta, GA
1000 Abernathy Road
Atlanta, GA
Illinois
One North LaSalle Street
Chicago, IL
401 North Michigan Avenue
Chicago, IL
One Skokie Valley Road
Highland Park, IL
1415 West 22nd Street
Oak Brook, IL
15105 S LaGrange Road
Orland Park, IL
1572 East Golf Road
Schaumburg, IL
1823 Freedom Drive
Naperville, IL
Indiana
8480 Keystone Crossing
Indianapolis, IN
Kansas
5400 College Boulevard
Overland Park, KS
Maine
Three Canal Plaza
Portland, ME
Maryland
7315 Wisconsin Avenue
Bethesda, MD
610 York Road
Towson, MD
Massachusetts
801 Boylston Street
Boston, MA
155 Congress Street
Boston, MA
300 Granite Street
Braintree, MA
44 Mall Road
Burlington, MA
238 Main Street
Cambridge, MA
200 Endicott Street
Danvers, MA
Annual Report
405 Cochituate Road
Framingham, MA
551 Boston Turnpike
Shrewsbury, MA
Michigan
500 E. Eisenhower Pkwy.
Ann Arbor, MI
280 N. Old Woodward Ave.
Birmingham, MI
30200 Northwestern Hwy.
Farmington Hills, MI
43420 Grand River Avenue
Novi, MI
3480 28th Street
Grand Rapids, MI
2425 S. Linden Road STE E
Flint, MI
Minnesota
7740 France Avenue South
Edina, MN
8342 3rd Street North
Oakdale, MN
Missouri
1524 South Lindbergh Blvd.
St. Louis, MO
Nevada
2225 Village Walk Drive
Henderson, NV
New Jersey
501 Route 73 South
Marlton, NJ
150 Essex Street
Millburn, NJ
35 Morris Street
Morristown, NJ
396 Route 17, North
Paramus, NJ
3518 Route 1 North
Princeton, NJ
530 Broad Street
Shrewsbury, NJ
New Mexico
2261 Q Street NE
Albuquerque, NM
New York
1130 Franklin Avenue
Garden City, NY
37 West Jericho Turnpike
Huntington Station, NY
1271 Avenue of the Americas
New York, NY
980 Madison Avenue
New York, NY
61 Broadway
New York, NY
350 Park Avenue
New York, NY
200 Fifth Avenue
New York, NY
733 Third Avenue
New York, NY
2070 Broadway
New York, NY
1075 Northern Blvd.
Roslyn, NY
799 Central Park Avenue
Scarsdale, NY
3349 Monroe Avenue
Rochester, NY
North Carolina
4611 Sharon Road
Charlotte, NC
7011 Fayetteville Road
Durham, NC
Ohio
3805 Edwards Road
Cincinnati, OH
1324 Polaris Parkway
Columbus, OH
1800 Crocker Road
Westlake, OH
28699 Chagrin Boulevard
Woodmere Village, OH
Oregon
7493 SW Bridgeport Road
Tigard, OR
Pennsylvania
600 West DeKalb Pike
King of Prussia, PA
1735 Market Street
Philadelphia, PA
12001 Perry Highway
Wexford, PA
Rhode Island
10 Memorial Boulevard
Providence, RI
Tennessee
3018 Peoples Street
Johnson City, TN
7628 West Farmington Blvd.
Germantown, TN
2035 Mallory Lane
Franklin, TN
Texas
10000 Research Boulevard
Austin, TX
4001 Northwest Parkway
Dallas, TX
12532 Memorial Drive
Houston, TX
2701 Drexel Drive
Houston, TX
6560 Fannin Street
Houston, TX
1701 Lake Robbins Drive
The Woodlands, TX
6500 N. MacArthur Blvd.
Irving, TX
6005 West Park Boulevard
Plano, TX
1576 East Southlake Blvd.
Southlake, TX
15600 Southwest Freeway
Sugar Land, TX
139 N. Loop 1604 East
San Antonio, TX
Utah
279 West South Temple
Salt Lake City, UT
Virginia
1861 International Drive
McLean, VA
11957 Democracy Drive
Reston, VA
Washington
10500 NE 8th Street
Bellevue, WA
1518 6th Avenue
Seattle, WA
304 Strander Blvd
Tukwila, WA
Washington, DC
1900 K Street, N.W.
Washington, DC
Wisconsin
16020 West Bluemound Road
Brookfield, WI
Fidelity Brokerage Services, Inc., 100 Summer St., Boston, MA 02110 Member NYSE/SIPC
Annual Report
Investment Adviser
Fidelity Management & Research Company
Boston, MA
Investment Sub-Advisers
FMR Co., Inc.
Fidelity Research & Analysis Company
Fidelity Management & Research
(Hong Kong) Limited
Fidelity Management & Research
(Japan) Inc.
Fidelity Management & Research
(U.K.) Inc.
FIL Investments (Japan) Limited
FIL Investment Advisors
FIL Investment Advisors (U.K.) Limited
General Distributor
Fidelity Distributors Corporation
Boston, MA
Transfer and Service Agents
Fidelity Investments Institutional
Operations Company, Inc.
Boston, MA
Fidelity Service Company, Inc.
Boston, MA
Custodian
The Northern Trust Company
Chicago, IL
The Fidelity Telephone Connection
Mutual Fund 24-Hour Service
Exchanges/Redemptions
and Account Assistance 1-800-544-6666
Product Information 1-800-544-6666
Retirement Accounts 1-800-544-4774
(8 a.m. - 9 p.m.)
TDD Service 1-800-544-0118
for the deaf and hearing impaired
(9 a.m. - 9 p.m. Eastern time)
Fidelity Automated Service
Telephone (FAST®)
1-800-544-5555
Automated line for quickest service
ILS-UANN-1210
1.815061.106

(Fidelity Investment logo)(registered trademark)
Fidelity AdvisorSM
International Small Cap Opportunities
Fund - Class A, Class T, Class B
and Class C
Annual Report
October 31, 2010
Class A, Class T, Class B
and Class C are classes of
Fidelity® International
Small Cap Opportunities Fund
(2_fidelity_logos) (Registered_Trademark)
Contents
Chairman's Message | <Click Here> | The Chairman's message to shareholders. |
Performance | <Click Here> | How the fund has done over time. |
Management's Discussion of Fund Performance | <Click Here> | The Portfolio Manager's review of fund performance and strategy. |
Shareholder Expense Example | <Click Here> | An example of shareholder expenses. |
Investment Changes | <Click Here> | A summary of major shifts in the fund's investments over the past six months. |
Investments | <Click Here> | A complete list of the fund's investments with their market values. |
Financial Statements | <Click Here> | Statements of assets and liabilities, operations, and changes in net assets, as well as financial highlights. |
Notes | <Click Here> | Notes to the financial statements. |
Report of Independent Registered Public Accounting Firm | <Click Here> | |
Trustees and Officers | <Click Here> | |
Distributions | <Click Here> | |
Board Approval of Investment Advisory Contracts and Management Fees | <Click Here> | |
To view a fund's proxy voting guidelines and proxy voting record for the 12-month period ended June 30, visit http://www.fidelity.com/proxyvotingresults or visit the Securities and Exchange Commission's (SEC) web site at http://www.sec.gov. You may also call 1-877-208-0098 to request a free copy of the proxy voting guidelines.
Standard & Poor's, S&P and S&P 500 are registered service marks of The McGraw-Hill Companies, Inc. and have been licensed for use by Fidelity Distributors Corporation.
Other third party marks appearing herein are the property of their respective owners.
All other marks appearing herein are registered or unregistered trademarks or service marks of FMR LLC or an affiliated company.
Annual Report
This report and the financial statements contained herein are submitted for the general information of the shareholders of the fund. This report is not authorized for distribution to prospective investors in the fund unless preceded or accompanied by an effective prospectus.
A fund files its complete schedule of portfolio holdings with the SEC for the first and third quarters of each fiscal year on Form N-Q. Forms N-Q are available on the SEC's web site at http://www.sec.gov. A fund's Forms N-Q may be reviewed and copied at the SEC's Public Reference Room in Washington, DC. Information regarding the operation of the SEC's Public Reference Room may be obtained by calling 1-800-SEC-0330. For a complete list of a fund's portfolio holdings, view the most recent holdings listing, semiannual report, or annual report on Fidelity's web site at http://www.fidelity.com or http://www.advisor.fidelity.com, as applicable.
NOT FDIC INSURED • MAY LOSE VALUE • NO BANK GUARANTEE
Neither the fund nor Fidelity Distributors Corporation is a bank.
Annual Report
(photo_of_Edward_C_Johnson_3d)
Dear Shareholder:
Equities have staged a rally in the second half of 2010, shaking off concerns about the European debt crisis and the possibility of a double-dip recession in the U.S. Although the short-term surge pushed major equity indexes back into positive territory for the year, several questions remain about the longer-term outlook, including lackluster economic growth and persistently high unemployment. Financial markets are always unpredictable, of course, but there also are several time-tested investment principles that can help put the odds in your favor.
One of the basic tenets is to invest for the long term. Over time, riding out the markets' inevitable ups and downs has proven much more effective than selling into panic or chasing the hottest trend. Even missing only a few of the markets' best days can significantly diminish investor returns. Patience also affords the benefits of compounding - of earning interest on additional income or reinvested dividends and capital gains. There can be tax advantages and cost benefits to consider as well. While staying the course doesn't eliminate risk, it can considerably lessen the effect of short-term declines.
You can further manage your investing risk through diversification. And today, more than ever, geographic diversification should be taken into account. Studies indicate that asset allocation is the single most important determinant of a portfolio's long-term success. The right mix of stocks, bonds and cash - aligned to your particular risk tolerance and investment objective - is very important. Age-appropriate rebalancing is also an essential aspect of asset allocation. For younger investors, an emphasis on equities - which historically have been the best-performing asset class over time - is encouraged. As investors near their specific goal, such as retirement or sending a child to college, consideration may be given to replacing volatile assets (e.g. common stocks) with more-stable fixed investments (bonds or savings plans).
A third principle - investing regularly - can help lower the average cost of your purchases. Investing a certain amount of money each month or quarter helps ensure you won't pay for all your shares at market highs. This strategy - known as dollar cost averaging - also reduces "emotion" from investing, helping shareholders avoid selling weak performers just prior to an upswing, or chasing a hot performer just before a correction.
We invite you to contact us via the Internet, through our Investor Centers or by phone. It is our privilege to provide you the information you need to make the investments that are right for you.
Sincerely,
(The chairman's signature appears here.)
Edward C. Johnson 3d
Annual Report
Average annual total return reflects the change in the value of an investment, assuming reinvestment of the class' distributions from dividend income and capital gains (the profits earned upon the sale of securities that have grown in value, if any) and assuming a constant rate of performance each year. The $10,000 table and the fund's returns do not reflect the deduction of taxes that a shareholder would pay on fund distributions or the redemption of fund shares. During periods of reimbursement by Fidelity, a fund's total return will be greater than it would be had the reimbursement not occurred. How a fund did yesterday is no guarantee of how it will do tomorrow.
Average Annual Total Returns
Periods ended October 31, 2010 | Past 1
year | Past 5
years | Life of
fundA |
Class A (incl. 5.75% sales charge) | 16.92% | 0.40% | 1.16% |
Class T (incl. 3.50% sales charge) | 19.32% | 0.64% | 1.33% |
Class B (incl. contingent deferred sales charge) B | 18.03% | 0.49% | 1.34% |
Class C (incl. contingent deferred sales charge) C | 22.06% | 0.85% | 1.51% |
A From August 2, 2005.
B Class B shares' contingent deferred sales charges included in the past one year, past five years, and life of fund total return figures are 5%, 2%, and 1%, respectively.
C Class C shares' contingent deferred sales charge included in the past one year, past five years, and life of fund total return figures are 1%, 0%, and 0%, respectively.
Annual Report
$10,000 Over Life of Class
Let's say hypothetically that $10,000 was invested in Fidelity AdvisorSM International Small Cap Opportunities Fund - Class A on August 2, 2005, when the fund started, and the current 5.75% sales charge was paid. The chart shows how the value of your investment would have changed, and also shows how the MSCI® EAFE® Small Cap Index performed over the same period.
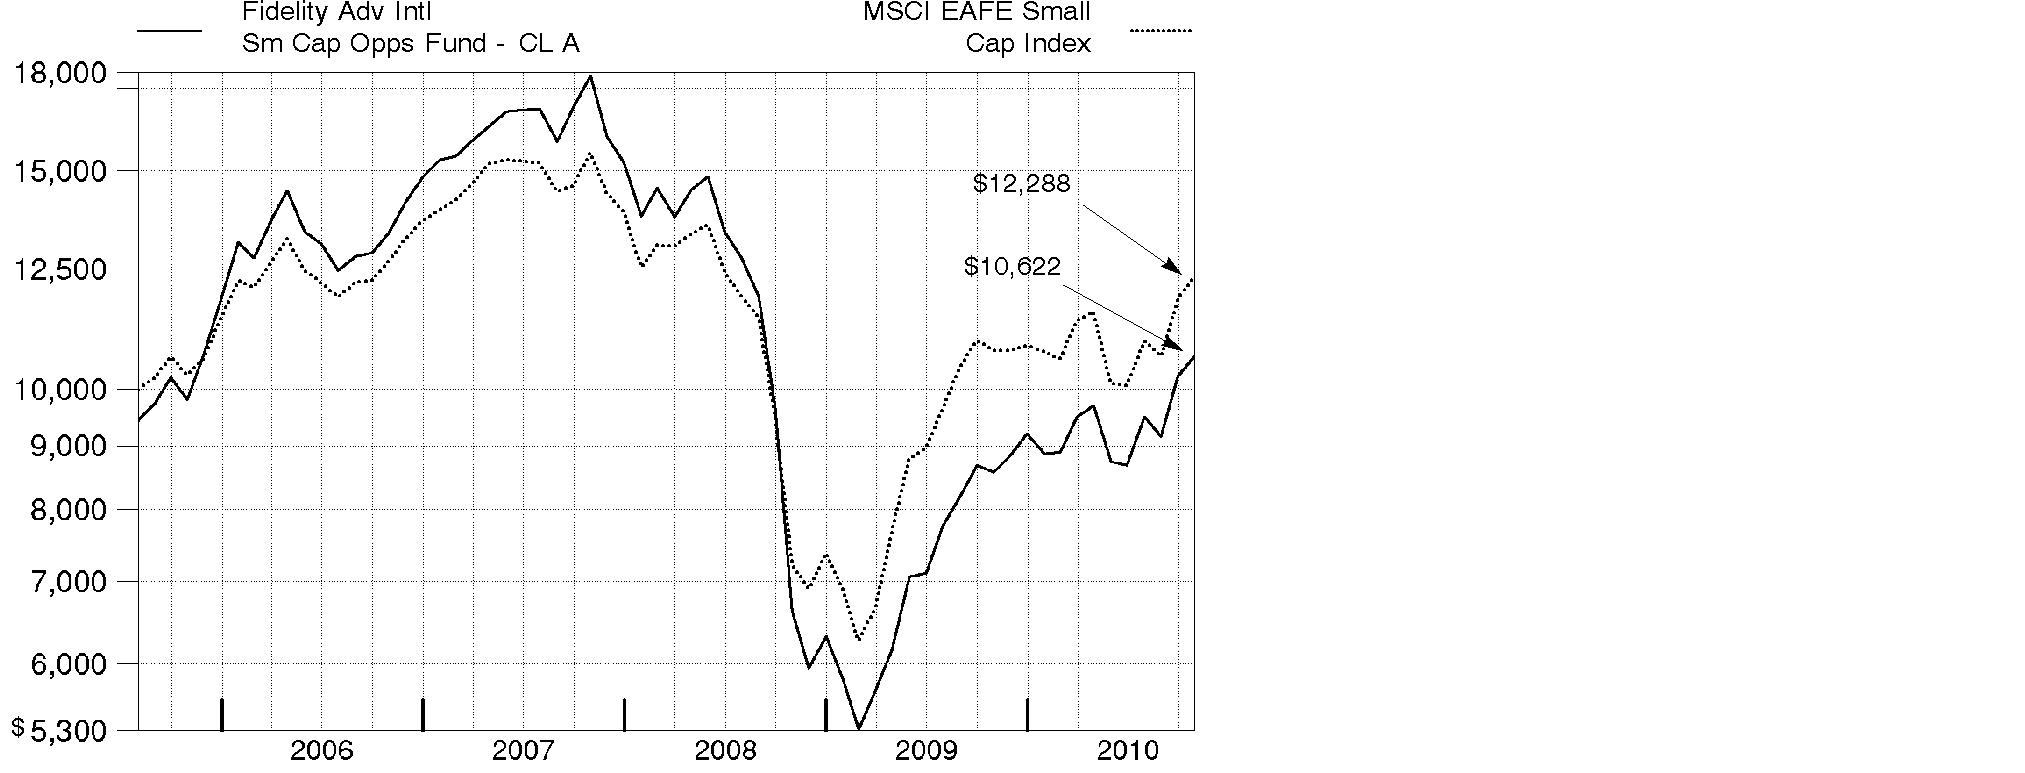
Annual Report
Market Recap: International stocks rode a wave of volatility similar to that of their U.S. counterparts during the 12 months ending October 31, 2010. Stocks gained modestly in the first half of the period, despite growing concerns about the European debt crisis. Sentiment turned decidedly negative in May and June, however, and the market suffered a precipitous decline. These losses were more than offset during the last four months of the period, when signs of economic growth and subsiding debt fears helped propel international stocks about 21%. For the full year, the MSCI® ACWI® (All Country World Index) ex USA Index gained 12.76%, boosted in part by a generally depreciating U.S. dollar. Within the index, Canada and emerging markets were standouts, returning 23% and 24%, respectively. Results in the latter group were led by strong-performing India, Mexico and South Africa, while China fell short of the MSCI benchmark due to cooling economic growth. The developed Asia ex Japan segment rose 16% for the period, lifted by solid results from Singapore and Hong Kong. Meanwhile, Europe rose just 9%, held back mainly by debt-riddled Spain and Italy, as well as lagging major constituent France. Japan returned only 5%, a result of that nation's continued weak economy.
Comments from Jed Weiss, Portfolio Manager of Fidelity AdvisorSM International Small Cap Opportunities Fund: For the year, the fund's Class A, Class T, Class B and Class C shares returned 24.05%, 23.65%, 23.03% and 23.06%, respectively (excluding sales charges), significantly outpacing the 14.31% return of the MSCI EAFE® (Europe, Australasia, Far East) Small Cap Index. Stock picking was most favorable in consumer discretionary, industrials and consumer staples, while the fund's utilities holdings and a small cash position detracted modestly. In country terms, successful positioning in Japan and the U.S. contributed, as did security selection in various emerging markets, especially Brazil, Turkey and South Africa. In Europe, good security selection in Finland and the U.K. outweighed weakness in Switzerland. The fund's top individual contributor was SSL International, a U.K.-based health care products company I sold after it agreed to be acquired. Other contributors included out-of-index positions in U.S.-listed and Sweden-based auto-safety equipment maker Autoliv; PriceSmart, a California-based warehouse club retailer operating in Central America; Banco ABC Brasil, a Brazilian bank; and South African discount retailer Mr Price Group. The fund's three biggest detractors were all, to varying degrees, hurt by the European debt crisis last spring - Greek wind utility Terna Energy, Italian asset manager Azimut Holding and U.K.-based student-housing lender Unite Group.
The views expressed above reflect those of the portfolio manager(s) only through the end of the period as stated on the cover of this report and do not necessarily represent the views of Fidelity or any other person in the Fidelity organization. Any such views are subject to change at any time based upon market or other conditions and Fidelity disclaims any responsibility to update such views. These views may not be relied on as investment advice and, because investment decisions for a Fidelity fund are based on numerous factors, may not be relied on as an indication of trading intent on behalf of any Fidelity fund.
Annual Report
Shareholder Expense Example
As a shareholder of the Fund, you incur two types of costs: (1) transaction costs, including sales charges (loads) on purchase payments or redemption proceeds, redemption fees, and (2) ongoing costs, including management fees, distribution and/or service (12b-1) fees and other Fund expenses. This Example is intended to help you understand your ongoing costs (in dollars) of investing in the Fund and to compare these costs with the ongoing costs of investing in other mutual funds.
The Example is based on an investment of $1,000 invested at the beginning of the period and held for the entire period (May 1, 2010 to October 31, 2010).
Actual Expenses
The first line of the accompanying table for each class of the Fund provides information about actual account values and actual expenses. You may use the information in this line, together with the amount you invested, to estimate the expenses that you paid over the period. Simply divide your account value by $1,000.00 (for example, an $8,600 account value divided by $1,000.00 = 8.6), then multiply the result by the number in the first line for a class of the Fund under the heading entitled "Expenses Paid During Period" to estimate the expenses you paid on your account during this period. A small balance maintenance fee of $12.00 that is charged once a year may apply for certain accounts with a value of less than $2,000. This fee is not included in the table below. If it was, the estimate of expenses you paid during the period would be higher, and your ending account value lower, by this amount. In addition, the Fund, as a shareholder in the underlying Fidelity Central Funds, will indirectly bear its pro-rata share of the fees and expenses incurred by the underlying Fidelity Central Funds. These fees and expenses are not included in the Fund's annualized expense ratio used to calculate the expense estimate in the table below.
Hypothetical Example for Comparison Purposes
The second line of the accompanying table for each class of the Fund provides information about hypothetical account values and hypothetical expenses based on a Class' actual expense ratio and an assumed rate of return of 5% per year before expenses, which is not the Class' actual return. The hypothetical account values and expenses may not be used to estimate the actual ending account balance or expenses you paid for the period. You may use this information to compare the ongoing costs of investing in the Fund and other funds. To do so, compare this 5% hypothetical example with the 5% hypothetical examples that appear in the shareholder reports of the other funds. A small balance maintenance fee of $12.00 that is charged once a year may apply for certain accounts with a value of less than $2,000. This fee is not included in the table below. If it was, the estimate of expenses you paid during the period would be higher, and your ending account value lower, by this amount. In addition, the Fund, as a shareholder in the underlying Fidelity Central Funds, will indirectly bear its pro-rata share of the fees and expenses incurred by the underlying Fidelity Central Funds. These fees and expenses are not included in the Fund's annualized expense ratio used to calculate the expense estimate in the table below.
Annual Report
Please note that the expenses shown in the table are meant to highlight your ongoing costs only and do not reflect any transaction costs. Therefore, the second line of the table is useful in comparing ongoing costs only, and will not help you determine the relative total costs of owning different funds. In addition, if these transactional costs were included, your costs would have been higher.
| Annualized
Expense Ratio | Beginning
Account Value
May 1, 2010 | Ending
Account Value
October 31, 2010 | Expenses Paid
During Period*
May 1, 2010
to October 31, 2010 |
Class A | 1.23% | | | |
Actual | | $ 1,000.00 | $ 1,096.00 | $ 6.50 |
HypotheticalA | | $ 1,000.00 | $ 1,019.00 | $ 6.26 |
Class T | 1.49% | | | |
Actual | | $ 1,000.00 | $ 1,094.60 | $ 7.87 |
HypotheticalA | | $ 1,000.00 | $ 1,017.69 | $ 7.58 |
Class B | 1.98% | | | |
Actual | | $ 1,000.00 | $ 1,091.50 | $ 10.44 |
HypotheticalA | | $ 1,000.00 | $ 1,015.22 | $ 10.06 |
Class C | 1.98% | | | |
Actual | | $ 1,000.00 | $ 1,091.60 | $ 10.44 |
HypotheticalA | | $ 1,000.00 | $ 1,015.22 | $ 10.06 |
International Small Cap Opportunities | .97% | | | |
Actual | | $ 1,000.00 | $ 1,097.30 | $ 5.13 |
HypotheticalA | | $ 1,000.00 | $ 1,020.32 | $ 4.94 |
Institutional Class | .96% | | | |
Actual | | $ 1,000.00 | $ 1,097.20 | $ 5.07 |
HypotheticalA | | $ 1,000.00 | $ 1,020.37 | $ 4.89 |
A 5% return per year before expenses
* Expenses are equal to each Class' annualized expense ratio, multiplied by the average account value over the period, multiplied by 184/365 (to reflect the one-half year period).
Annual Report
Investment Changes (Unaudited)
Geographic Diversification (% of fund's net assets) |
As of October 31, 2010 |
| Japan 20.9% | |
| United Kingdom 16.1% | |
| United States of America 12.8% | |
| Canada 5.0% | |
| Brazil 4.1% | |
| Germany 3.7% | |
| France 3.5% | |
| South Africa 3.2% | |
| Finland 2.8% | |
| Other 27.9% | |

Percentages are adjusted for the effect of futures contracts, if applicable. |
As of April 30, 2010 |
| Japan 21.9% | |
| United Kingdom 17.7% | |
| United States of America 10.6% | |
| Canada 5.2% | |
| Brazil 3.9% | |
| Netherlands 3.8% | |
| France 3.2% | |
| South Africa 2.9% | |
| Singapore 2.8% | |
| Other 28.0% | |

Percentages are adjusted for the effect of futures contracts, if applicable. |
Asset Allocation |
| % of fund's
net assets | % of fund's net assets
6 months ago |
Stocks and Investment Companies | 97.7 | 98.7 |
Short-Term Investments and Net Other Assets | 2.3 | 1.3 |
Top Ten Stocks as of October 31, 2010 |
| % of fund's
net assets | % of fund's net assets
6 months ago |
USS Co. Ltd. (Japan, Specialty Retail) | 1.6 | 1.6 |
Osaka Securities Exchange Co. Ltd. (Japan, Diversified Financial Services) | 1.6 | 1.7 |
Braskem SA Class A sponsored ADR (Brazil, Chemicals) | 1.5 | 1.0 |
PriceSmart, Inc. (United States of America, Food & Staples Retailing) | 1.5 | 1.6 |
Kobayashi Pharmaceutical Co. Ltd. (Japan, Personal Products) | 1.5 | 1.3 |
Azimut Holdings SpA (Italy, Capital Markets) | 1.4 | 1.6 |
Prosegur Compania de Seguridad SA (Reg.) (Spain, Commercial Services & Supplies) | 1.3 | 1.2 |
Outotec OYJ (Finland, Construction & Engineering) | 1.3 | 1.2 |
Nippon Thompson Co. Ltd. (Japan, Machinery) | 1.3 | 1.4 |
Serco Group PLC (United Kingdom, Commercial Services & Supplies) | 1.3 | 1.2 |
| 14.3 | |
Market Sectors as of October 31, 2010 |
| % of fund's
net assets | % of fund's net assets
6 months ago |
Industrials | 20.8 | 20.2 |
Financials | 19.9 | 21.0 |
Consumer Discretionary | 17.1 | 17.6 |
Materials | 10.8 | 10.6 |
Consumer Staples | 8.5 | 8.0 |
Information Technology | 8.4 | 7.5 |
Health Care | 6.4 | 7.5 |
Energy | 5.4 | 5.6 |
Utilities | 0.4 | 0.5 |
Telecommunication Services | 0.0 | 0.2 |
Annual Report
Investments October 31, 2010
Showing Percentage of Net Assets
Common Stocks - 97.7% |
| Shares | | Value |
Australia - 1.0% |
MAp Group unit | 840,958 | | $ 2,512,726 |
OZ Minerals Ltd. | 1,167,654 | | 1,790,191 |
TOTAL AUSTRALIA | | 4,302,917 |
Austria - 0.8% |
Andritz AG | 44,600 | | 3,415,709 |
Bailiwick of Guernsey - 0.8% |
Resolution Ltd. | 860,273 | | 3,609,732 |
Bailiwick of Jersey - 1.3% |
Informa PLC | 530,236 | | 3,703,897 |
Randgold Resources Ltd. sponsored ADR | 23,600 | | 2,216,512 |
TOTAL BAILIWICK OF JERSEY | | 5,920,409 |
Belgium - 1.4% |
Gimv NV | 39,800 | | 2,200,236 |
Umicore SA | 89,474 | | 4,210,543 |
TOTAL BELGIUM | | 6,410,779 |
Bermuda - 2.0% |
Aquarius Platinum Ltd. (Australia) | 301,589 | | 1,734,301 |
Great Eagle Holdings Ltd. | 857,000 | | 2,565,057 |
Lazard Ltd. Class A | 25,000 | | 922,500 |
Seadrill Ltd. | 34,398 | | 1,041,456 |
Trinity Ltd. | 2,680,000 | | 2,679,568 |
TOTAL BERMUDA | | 8,942,882 |
Brazil - 4.1% |
Banco ABC Brasil SA | 535,300 | | 5,273,706 |
BR Malls Participacoes SA | 181,600 | | 1,734,658 |
Braskem SA Class A sponsored ADR (d) | 324,400 | | 6,763,740 |
Iguatemi Empresa de Shopping Centers SA | 39,800 | | 928,791 |
Multiplan Empreendimentos Imobiliarios SA | 47,800 | | 1,095,815 |
Odontoprev SA | 151,500 | | 2,226,370 |
TOTAL BRAZIL | | 18,023,080 |
Canada - 5.0% |
Agnico-Eagle Mines Ltd. (Canada) | 25,100 | | 1,946,671 |
Eldorado Gold Corp. | 104,600 | | 1,771,195 |
Fairfax Financial Holdings Ltd. (sub. vtg.) | 7,190 | | 2,941,069 |
Niko Resources Ltd. | 54,400 | | 5,189,842 |
Open Text Corp. (a) | 40,500 | | 1,791,705 |
Pan American Silver Corp. | 53,400 | | 1,704,528 |
Common Stocks - continued |
| Shares | | Value |
Canada - continued |
Petrobank Energy & Resources Ltd. (a) | 140,800 | | $ 5,603,561 |
Quadra FNX Mining Ltd. (a) | 76,400 | | 1,078,694 |
TOTAL CANADA | | 22,027,265 |
Cayman Islands - 1.2% |
China Lilang Ltd. | 1,443,000 | | 2,256,302 |
Vantage Drilling Co. (a) | 725,331 | | 1,247,569 |
Wynn Macau Ltd. | 762,000 | | 1,684,977 |
TOTAL CAYMAN ISLANDS | | 5,188,848 |
China - 0.1% |
China Hongxing Sports Ltd. | 4,264,000 | | 576,528 |
Cyprus - 0.1% |
AFI Development PLC GDR (Reg. S) | 470,800 | | 555,544 |
Denmark - 0.5% |
William Demant Holding AS (a) | 28,533 | | 2,138,737 |
Finland - 2.8% |
Metso Corp. | 57,500 | | 2,725,885 |
Nokian Tyres PLC (d) | 111,400 | | 3,859,688 |
Outotec OYJ (d) | 127,800 | | 5,964,328 |
TOTAL FINLAND | | 12,549,901 |
France - 3.5% |
Audika SA | 120,384 | | 2,939,771 |
Laurent-Perrier Group | 25,963 | | 2,925,862 |
Remy Cointreau SA | 47,298 | | 3,320,914 |
Saft Groupe SA | 85,419 | | 3,262,605 |
Vetoquinol SA | 21,539 | | 912,900 |
Virbac SA | 13,000 | | 2,091,976 |
TOTAL FRANCE | | 15,454,028 |
Germany - 3.7% |
alstria office REIT-AG | 75,100 | | 1,046,024 |
Bilfinger Berger Se | 44,776 | | 3,260,346 |
Colonia Real Estate AG (a) | 386,909 | | 2,538,927 |
CTS Eventim AG | 57,996 | | 3,273,133 |
Fielmann AG | 27,537 | | 2,779,852 |
Software AG (Bearer) | 24,227 | | 3,394,663 |
TOTAL GERMANY | | 16,292,945 |
Greece - 0.4% |
Terna Energy SA | 443,751 | | 1,907,943 |
Common Stocks - continued |
| Shares | | Value |
India - 0.7% |
Apollo Tyres Ltd. | 514,796 | | $ 830,991 |
Jyothy Laboratories Ltd. | 351,322 | | 2,187,589 |
TOTAL INDIA | | 3,018,580 |
Ireland - 0.6% |
James Hardie Industries NV sponsored ADR (a) | 106,775 | | 2,838,080 |
Israel - 0.6% |
Azrieli Group | 68,005 | | 1,752,976 |
Ituran Location & Control Ltd. | 70,645 | | 1,098,530 |
TOTAL ISRAEL | | 2,851,506 |
Italy - 2.3% |
Azimut Holdings SpA | 626,773 | | 6,392,664 |
Interpump Group SpA (a) | 590,858 | | 3,853,825 |
TOTAL ITALY | | 10,246,489 |
Japan - 20.9% |
Aozora Bank Ltd. | 1,335,000 | | 2,239,654 |
Asahi Co. Ltd. (d) | 72,000 | | 1,064,745 |
Autobacs Seven Co. Ltd. | 102,200 | | 3,829,166 |
Daikoku Denki Co. Ltd. | 150,800 | | 1,705,331 |
Daikokutenbussan Co. Ltd. | 105,500 | | 3,697,154 |
FCC Co. Ltd. | 147,900 | | 3,174,143 |
Fukuoka (REIT) Investment Fund | 189 | | 1,268,299 |
GCA Savvian Group Corp. (a) | 1,694 | | 1,606,216 |
Glory Ltd. | 58,400 | | 1,288,182 |
Goldcrest Co. Ltd. | 54,690 | | 1,180,521 |
Japan Steel Works Ltd. | 229,000 | | 2,184,908 |
Kamigumi Co. Ltd. | 298,000 | | 2,329,340 |
Kobayashi Pharmaceutical Co. Ltd. | 142,700 | | 6,649,994 |
Kyoto Kimono Yuzen Co. Ltd. | 109,900 | | 1,195,011 |
Meiko Network Japan Co. Ltd. | 120,500 | | 1,004,791 |
Miraial Co. Ltd. | 44,000 | | 1,078,812 |
MS&AD Insurance Group Holdings, Inc. | 38,660 | | 926,174 |
Nabtesco Corp. | 205,000 | | 3,630,235 |
Nachi-Fujikoshi Corp. | 858,000 | | 2,569,628 |
Nagaileben Co. Ltd. | 39,900 | | 946,057 |
Nihon M&A Center, Inc. | 381 | | 1,377,793 |
Nihon Parkerizing Co. Ltd. | 162,000 | | 2,127,923 |
Nippon Seiki Co. Ltd. | 186,000 | | 1,883,808 |
Nippon Thompson Co. Ltd. | 832,000 | | 5,769,305 |
Nitto Kohki Co. Ltd. | 38,900 | | 917,029 |
Common Stocks - continued |
| Shares | | Value |
Japan - continued |
Obic Co. Ltd. | 13,240 | | $ 2,444,966 |
Osaka Securities Exchange Co. Ltd. | 1,381 | | 6,950,478 |
OSG Corp. | 171,600 | | 1,793,409 |
SAZABY, Inc. | 49,300 | | 918,976 |
SHO-BOND Holdings Co. Ltd. | 112,200 | | 2,400,999 |
Shoei Co. Ltd. | 68,800 | | 623,278 |
The Nippon Synthetic Chemical Industry Co. Ltd. | 180,000 | | 1,055,797 |
THK Co. Ltd. | 107,700 | | 2,071,823 |
Toho Holdings Co. Ltd. | 138,600 | | 1,941,123 |
Tsumura & Co. | 75,000 | | 2,307,692 |
Tsutsumi Jewelry Co. Ltd. | 41,400 | | 974,935 |
USS Co. Ltd. | 89,540 | | 6,965,577 |
Yamatake Corp. | 81,000 | | 1,971,903 |
Yamato Kogyo Co. Ltd. | 188,700 | | 4,840,025 |
TOTAL JAPAN | | 92,905,200 |
Korea (South) - 0.8% |
NCsoft Corp. | 4,673 | | 1,028,517 |
NHN Corp. (a) | 13,235 | | 2,348,050 |
TOTAL KOREA (SOUTH) | | 3,376,567 |
Luxembourg - 0.3% |
GlobeOp Financial Services SA | 243,800 | | 1,192,319 |
Netherlands - 2.8% |
Aalberts Industries NV | 192,200 | | 3,510,107 |
ASM International NV unit (a)(d) | 167,800 | | 4,287,290 |
Heijmans NV unit (a) | 81,690 | | 1,540,195 |
QIAGEN NV (a)(d) | 166,200 | | 3,126,222 |
TOTAL NETHERLANDS | | 12,463,814 |
Norway - 0.4% |
Sevan Marine ASA (a) | 1,190,500 | | 1,604,116 |
Papua New Guinea - 0.2% |
Oil Search Ltd. | 164,418 | | 1,027,640 |
Philippines - 0.3% |
Jollibee Food Corp. | 545,210 | | 1,124,734 |
Portugal - 0.6% |
Jeronimo Martins SGPS SA | 179,600 | | 2,693,970 |
Singapore - 2.3% |
Allgreen Properties Ltd. | 2,765,000 | | 2,542,185 |
Keppel Land Ltd. | 321,000 | | 1,098,687 |
Common Stocks - continued |
| Shares | | Value |
Singapore - continued |
Singapore Exchange Ltd. | 622,000 | | $ 4,229,004 |
Wing Tai Holdings Ltd. | 1,817,000 | | 2,456,733 |
TOTAL SINGAPORE | | 10,326,609 |
South Africa - 3.2% |
African Rainbow Minerals Ltd. | 155,700 | | 3,972,155 |
Clicks Group Ltd. | 595,513 | | 3,885,046 |
JSE Ltd. | 219,281 | | 2,472,959 |
Mr Price Group Ltd. | 445,900 | | 4,052,219 |
TOTAL SOUTH AFRICA | | 14,382,379 |
Spain - 1.5% |
Grifols SA (d) | 50,332 | | 814,851 |
Prosegur Compania de Seguridad SA (Reg.) | 100,209 | | 6,004,106 |
TOTAL SPAIN | | 6,818,957 |
Sweden - 1.1% |
Intrum Justitia AB | 166,800 | | 2,296,695 |
Swedish Match Co. | 84,600 | | 2,363,928 |
TOTAL SWEDEN | | 4,660,623 |
Switzerland - 1.8% |
Bank Sarasin & Co. Ltd. Series B (Reg.) | 141,200 | | 5,164,017 |
Sonova Holding AG Class B | 23,726 | | 2,747,767 |
TOTAL SWITZERLAND | | 7,911,784 |
Turkey - 2.0% |
Albaraka Turk Katilim Bankasi AS | 1,230,000 | | 2,469,776 |
Anadolu Efes Biracilik ve Malt Sanayii AS | 113,000 | | 1,804,155 |
Asya Katilim Bankasi AS | 896,000 | | 2,311,371 |
Coca-Cola Icecek AS | 190,000 | | 2,437,426 |
TOTAL TURKEY | | 9,022,728 |
United Kingdom - 16.1% |
AMEC PLC | 135,700 | | 2,361,092 |
Babcock International Group PLC | 314,700 | | 2,924,340 |
Bellway PLC | 223,172 | | 1,909,344 |
Britvic PLC | 391,200 | | 3,023,495 |
Cobham PLC | 499,200 | | 1,852,321 |
Dechra Pharmaceuticals PLC | 173,400 | | 1,472,408 |
Derwent London PLC | 70,900 | | 1,726,605 |
Great Portland Estates PLC | 522,489 | | 2,892,200 |
H&T Group PLC (d) | 371,803 | | 2,078,938 |
Common Stocks - continued |
| Shares | | Value |
United Kingdom - continued |
InterContinental Hotel Group PLC ADR (d) | 195,500 | | $ 3,782,925 |
Johnson Matthey PLC | 132,689 | | 4,068,928 |
Meggitt PLC | 785,545 | | 4,154,510 |
Micro Focus International PLC | 321,800 | | 1,968,453 |
Mothercare PLC | 323,401 | | 2,722,810 |
Persimmon PLC | 256,563 | | 1,401,689 |
Rotork PLC | 65,300 | | 1,752,392 |
Serco Group PLC | 570,476 | | 5,611,887 |
Shaftesbury PLC | 456,732 | | 3,263,619 |
Spectris PLC | 207,487 | | 3,753,082 |
Spirax-Sarco Engineering PLC | 184,230 | | 5,339,519 |
Ted Baker PLC | 249,000 | | 2,453,452 |
Ultra Electronics Holdings PLC | 100,669 | | 3,001,548 |
Unite Group PLC (a) | 1,339,170 | | 4,462,747 |
Victrex PLC | 178,582 | | 3,693,747 |
TOTAL UNITED KINGDOM | | 71,672,051 |
United States of America - 10.5% |
Advanced Energy Industries, Inc. (a) | 210,419 | | 3,021,617 |
Autoliv, Inc. | 66,600 | | 4,748,580 |
Cymer, Inc. (a) | 92,100 | | 3,403,095 |
Dril-Quip, Inc. (a) | 29,100 | | 2,010,810 |
Evercore Partners, Inc. Class A | 42,700 | | 1,296,372 |
ION Geophysical Corp. (a)(d) | 455,889 | | 2,229,297 |
Juniper Networks, Inc. (a) | 108,200 | | 3,504,598 |
Kansas City Southern (a) | 84,300 | | 3,694,026 |
Lam Research Corp. (a) | 23,203 | | 1,062,465 |
Martin Marietta Materials, Inc. (d) | 23,900 | | 1,923,472 |
Mohawk Industries, Inc. (a) | 81,000 | | 4,644,540 |
Oceaneering International, Inc. (a) | 19,400 | | 1,200,278 |
PriceSmart, Inc. | 228,296 | | 6,695,922 |
ResMed, Inc. (a) | 148,200 | | 4,723,134 |
Solera Holdings, Inc. | 22,500 | | 1,081,125 |
Solutia, Inc. (a) | 66,156 | | 1,198,085 |
TOTAL UNITED STATES OF AMERICA | | 46,437,416 |
TOTAL COMMON STOCKS (Cost $328,402,495) | 433,892,809 |
Money Market Funds - 6.3% |
| Shares | | Value |
Fidelity Cash Central Fund, 0.23% (b) | 10,922,935 | | $ 10,922,935 |
Fidelity Securities Lending Cash Central Fund, 0.24% (b)(c) | 17,012,021 | | 17,012,021 |
TOTAL MONEY MARKET FUNDS (Cost $27,934,956) | 27,934,956 |
TOTAL INVESTMENT PORTFOLIO - 104.0% (Cost $356,337,451) | | 461,827,765 |
NET OTHER ASSETS (LIABILITIES) - (4.0)% | | (17,810,509) |
NET ASSETS - 100% | $ 444,017,256 |
Legend |
(a) Non-income producing |
(b) Affiliated fund that is available only to investment companies and other accounts managed by Fidelity Investments. The rate quoted is the annualized seven-day yield of the fund at period end. A complete unaudited listing of the fund's holdings as of its most recent quarter end is available upon request. In addition, each Fidelity Central Fund's financial statements, which are not covered by the Fund's report of Independent Registered Public Accounting Firm, are available on the SEC's website or upon request. |
(c) Investment made with cash collateral received from securities on loan. |
(d) Security or a portion of the security is on loan at period end. |
Affiliated Central Funds |
Information regarding fiscal year to date income earned by the Fund from investments in Fidelity Central Funds is as follows: |
Fund | Income earned |
Fidelity Cash Central Fund | $ 12,535 |
Fidelity Securities Lending Cash Central Fund | 263,176 |
Total | $ 275,711 |
Other Information |
The following is a summary of the inputs used, as of October 31, 2010, involving the Fund's assets and liabilities carried at fair value. The inputs or methodology used for valuing securities may not be an indication of the risk associated with investing in those securities. For more information on valuation inputs, and their aggregation into the levels used in the table below, please refer to the Security Valuation section in the accompanying Notes to Financial Statements. |
Valuation Inputs at Reporting Date: |
Description | Total | Level 1 | Level 2 | Level 3 |
Investments in Securities: | | | | |
Equities: | | | | |
Japan | $ 92,905,200 | $ 89,794,118 | $ 3,111,082 | $ - |
United Kingdom | 71,672,051 | 71,672,051 | - | - |
United States of America | 46,437,416 | 46,437,416 | - | - |
Canada | 22,027,265 | 22,027,265 | - | - |
Brazil | 18,023,080 | 18,023,080 | - | - |
Germany | 16,292,945 | 16,292,945 | - | - |
France | 15,454,028 | 15,454,028 | - | - |
South Africa | 14,382,379 | 14,382,379 | - | - |
Finland | 12,549,901 | 12,549,901 | - | - |
Other | 124,148,544 | 123,317,553 | 830,991 | - |
Money Market Funds | 27,934,956 | 27,934,956 | - | - |
Total Investments in Securities: | $ 461,827,765 | $ 457,885,692 | $ 3,942,073 | $ - |
Income Tax Information |
At October 31, 2010, the Fund had a capital loss carryforward of approximately $420,935,635 of which $90,555,924 and $330,379,711 will expire on October 31, 2016 and 2017, respectively. Capital loss carryforwards are only available to offset future capital gains of the Fund to the extent provided by regulations and may be limited. |
See accompanying notes which are an integral part of the financial statements.
Annual Report
Statement of Assets and Liabilities
| October 31, 2010 |
| | |
Assets | | |
Investment in securities, at value (including securities loaned of $16,477,464) - See accompanying schedule: Unaffiliated issuers (cost $328,402,495) | $ 433,892,809 | |
Fidelity Central Funds (cost $27,934,956) | 27,934,956 | |
Total Investments (cost $356,337,451) | | $ 461,827,765 |
Foreign currency held at value (cost $144,438) | | 144,438 |
Receivable for investments sold | | 3,451,646 |
Receivable for fund shares sold | | 265,800 |
Dividends receivable | | 1,033,772 |
Distributions receivable from Fidelity Central Funds | | 13,747 |
Other receivables | | 16,199 |
Total assets | | 466,753,367 |
| | |
Liabilities | | |
Payable for investments purchased | $ 4,888,295 | |
Payable for fund shares redeemed | 393,945 | |
Accrued management fee | 223,687 | |
Distribution and service plan fees payable | 18,734 | |
Other affiliated payables | 122,810 | |
Other payables and accrued expenses | 76,619 | |
Collateral on securities loaned, at value | 17,012,021 | |
Total liabilities | | 22,736,111 |
| | |
Net Assets | | $ 444,017,256 |
Net Assets consist of: | | |
Paid in capital | | $ 757,537,538 |
Undistributed net investment income | | 3,575,839 |
Accumulated undistributed net realized gain (loss) on investments and foreign currency transactions | | (422,628,442) |
Net unrealized appreciation (depreciation) on investments and assets and liabilities in foreign currencies | | 105,532,321 |
Net Assets | | $ 444,017,256 |
See accompanying notes which are an integral part of the financial statements.
Annual Report
Statement of Assets and Liabilities - continued
| October 31, 2010 |
| | |
Calculation of Maximum Offering Price Class A:
Net Asset Value and redemption price per share ($20,227,814 ÷ 2,060,269 shares) | | $ 9.82 |
| | |
Maximum offering price per share (100/94.25 of $9.82) | | $ 10.42 |
Class T:
Net Asset Value and redemption price per share ($11,202,002 ÷ 1,152,196 shares) | | $ 9.72 |
| | |
Maximum offering price per share (100/96.50 of $9.72) | | $ 10.07 |
Class B:
Net Asset Value and offering price per share ($2,902,474 ÷ 304,234 shares)A | | $ 9.54 |
| | |
Class C:
Net Asset Value and offering price per share ($8,935,535 ÷ 937,891 shares)A | | $ 9.53 |
| | |
| | |
International Small Cap Opportunities:
Net Asset Value, offering price and redemption price per share ($398,331,167 ÷ 40,172,676 shares) | | $ 9.92 |
| | |
Institutional Class:
Net Asset Value, offering price and redemption price per share ($2,418,264 ÷ 243,597 shares) | | $ 9.93 |
A Redemption price per share is equal to net asset value less any applicable contingent deferred sales charge.
See accompanying notes which are an integral part of the financial statements.
Annual Report
Financial Statements - continued
Statement of Operations
| Year ended October 31, 2010 |
| | |
Investment Income | | |
Dividends | | $ 7,608,270 |
Interest | | 5 |
Income from Fidelity Central Funds | | 275,711 |
Income before foreign taxes withheld | | 7,883,986 |
Less foreign taxes withheld | | (520,283) |
Total income | | 7,363,703 |
| | |
Expenses | | |
Management fee
Basic fee | $ 3,343,372 | |
Performance adjustment | (1,495,592) | |
Transfer agent fees | 1,191,720 | |
Distribution and service plan fees | 216,769 | |
Accounting and security lending fees | 206,297 | |
Custodian fees and expenses | 124,178 | |
Independent trustees' compensation | 2,177 | |
Registration fees | 77,687 | |
Audit | 71,763 | |
Legal | 1,903 | |
Miscellaneous | 5,248 | |
Total expenses before reductions | 3,745,522 | |
Expense reductions | (55,920) | 3,689,602 |
Net investment income (loss) | | 3,674,101 |
Realized and Unrealized Gain (Loss) Net realized gain (loss) on: | | |
Investment securities: | | |
Unaffiliated issuers | 58,545,504 | |
Foreign currency transactions | (57,981) | |
Total net realized gain (loss) | | 58,487,523 |
Change in net unrealized appreciation (depreciation) on: Investment securities | 25,226,622 | |
Assets and liabilities in foreign currencies | 27,111 | |
Total change in net unrealized appreciation (depreciation) | | 25,253,733 |
Net gain (loss) | | 83,741,256 |
Net increase (decrease) in net assets resulting from operations | | $ 87,415,357 |
See accompanying notes which are an integral part of the financial statements.
Annual Report
Statement of Changes in Net Assets
| Year ended
October 31,
2010 | Year ended
October 31,
2009 |
Increase (Decrease) in Net Assets | | |
Operations | | |
Net investment income (loss) | $ 3,674,101 | $ 3,774,364 |
Net realized gain (loss) | 58,487,523 | (316,364,225) |
Change in net unrealized appreciation (depreciation) | 25,253,733 | 391,843,877 |
Net increase (decrease) in net assets resulting
from operations | 87,415,357 | 79,254,016 |
Distributions to shareholders from net investment income | (3,861,178) | (140,700) |
Distributions to shareholders from net realized gain | (4,067,493) | - |
Total distributions | (7,928,671) | (140,700) |
Share transactions - net increase (decrease) | (8,820,184) | (68,133,927) |
Redemption fees | 60,781 | 113,424 |
Total increase (decrease) in net assets | 70,727,283 | 11,092,813 |
| | |
Net Assets | | |
Beginning of period | 373,289,973 | 362,197,160 |
End of period (including undistributed net investment income of $3,575,839 and undistributed net investment income of $3,633,664, respectively) | $ 444,017,256 | $ 373,289,973 |
See accompanying notes which are an integral part of the financial statements.
Annual Report
Financial Highlights - Class A
Years ended October 31, | 2010 | 2009 | 2008 | 2007 | 2006 |
Selected Per-Share Data | | | | | |
Net asset value, beginning of period | $ 8.07 | $ 6.24 | $ 18.97 | $ 14.18 | $ 10.41 |
Income from Investment Operations | | | | | |
Net investment income (loss)C | .06 | .06 | .02 | .02 | -G |
Net realized and unrealized gain (loss) | 1.85 | 1.77 | (10.85) | 4.76 | 3.74 |
Total from investment operations | 1.91 | 1.83 | (10.83) | 4.78 | 3.74 |
Distributions from net investment income | (.07) | - | (.03) | - | - |
Distributions from net realized gain | (.09) | - | (1.88) | - | -G |
Total distributions | (.16) | - | (1.90)H | - | -G |
Redemption fees added to paid in capitalC | -G | -G | -G | .01 | .03 |
Net asset value, end of period | $ 9.82 | $ 8.07 | $ 6.24 | $ 18.97 | $ 14.18 |
Total ReturnA,B | 24.05% | 29.33% | (62.98)% | 33.78% | 36.25% |
Ratios to Average Net AssetsD,F | | | | | |
Expenses before reductions | 1.16% | .94% | 1.75% | 1.63% | 1.63% |
Expenses net of fee waivers, if any | 1.16% | .94% | 1.66% | 1.63% | 1.63% |
Expenses net of all reductions | 1.15% | .89% | 1.62% | 1.59% | 1.51% |
Net investment income (loss) | .74% | 1.00% | .13% | .10% | .02% |
Supplemental Data | | | | | |
Net assets, end of period (000 omitted) | $ 20,228 | $ 18,883 | $ 17,905 | $ 70,785 | $ 35,674 |
Portfolio turnover rateE | 49% | 174% | 61% | 107% | 164% |
A Total returns would have been lower had certain expenses not been reduced during the periods shown.
B Total returns do not include the effect of the sales charges.
C Calculated based on average shares outstanding during the period.
D Fees and expenses of the underlying Fidelity Central Funds are not included in the Fund's expense ratio. The Fund indirectly bears its proportionate share of the expenses of any underlying Fidelity Central Funds.
E Amount does not include the portfolio activity of any underlying Fidelity Central Funds.
F Expense ratios reflect operating expenses of the class. Expenses before reductions do not reflect amounts reimbursed by the investment adviser or reductions from brokerage service arrangements or reductions from other expense offset arrangements and do not represent the amount paid by the class during periods when reimbursements or reductions occur. Expenses net of fee waivers reflect expenses after reimbursement by the investment adviser but prior to reductions from brokerage service arrangements or other expense offset arrangements. Expenses net of all reductions represent the net expenses paid by the class.
G Amount represents less than $.01 per share.
H Total distributions of $1.90 per share is comprised of distributions from net investment income of $.025 and distributions from net realized gain of $1.878 per share.
See accompanying notes which are an integral part of the financial statements.
Annual Report
Financial Highlights - Class T
Years ended October 31, | 2010 | 2009 | 2008 | 2007 | 2006 |
Selected Per-Share Data | | | | | |
Net asset value, beginning of period | $ 8.00 | $ 6.20 | $ 18.85 | $ 14.12 | $ 10.38 |
Income from Investment Operations | | | | | |
Net investment income (loss)C | .04 | .05 | (.02) | (.02) | (.03) |
Net realized and unrealized gain (loss) | ��1.83 | 1.75 | (10.78) | 4.74 | 3.74 |
Total from investment operations | 1.87 | 1.80 | (10.80) | 4.72 | 3.71 |
Distributions from net investment income | (.06) | - | - | - | - |
Distributions from net realized gain | (.09) | - | (1.85) | - | - |
Total distributions | (.15) | - | (1.85)H | - | - |
Redemption fees added to paid in capitalC | -G | -G | -G | .01 | .03 |
Net asset value, end of period | $ 9.72 | $ 8.00 | $ 6.20 | $ 18.85 | $ 14.12 |
Total ReturnA,B | 23.65% | 29.03% | (63.08)% | 33.50% | 36.03% |
Ratios to Average Net AssetsD,F | | | | | |
Expenses before reductions | 1.43% | 1.20% | 2.00% | 1.85% | 1.85% |
Expenses net of fee waivers, if any | 1.43% | 1.20% | 1.91% | 1.85% | 1.85% |
Expenses net of all reductions | 1.41% | 1.15% | 1.87% | 1.81% | 1.74% |
Net investment income (loss) | .48% | .74% | (.12)% | (.13)% | (.20)% |
Supplemental Data | | | | | |
Net assets, end of period (000 omitted) | $ 11,202 | $ 11,915 | $ 11,614 | $ 46,568 | $ 28,309 |
Portfolio turnover rateE | 49% | 174% | 61% | 107% | 164% |
A Total returns would have been lower had certain expenses not been reduced during the periods shown.
B Total returns do not include the effect of the sales charges.
C Calculated based on average shares outstanding during the period.
D Fees and expenses of the underlying Fidelity Central Funds are not included in the Fund's expense ratio. The Fund indirectly bears its proportionate share of the expenses of any underlying Fidelity Central Funds.
E Amount does not include the portfolio activity of any underlying Fidelity Central Funds.
F Expense ratios reflect operating expenses of the class. Expenses before reductions do not reflect amounts reimbursed by the investment adviser or reductions from brokerage service arrangements or reductions from other expense offset arrangements and do not represent the amount paid by the class during periods when reimbursements or reductions occur. Expenses net of fee waivers reflect expenses after reimbursement by the investment adviser but prior to reductions from brokerage service arrangements or other expense offset arrangements. Expenses net of all reductions represent the net expenses paid by the class.
G Amount represents less than $.01 per share.
H Total distributions of $1.85 per share is comprised of distributions from net realized gain of $1.852 per share.
See accompanying notes which are an integral part of the financial statements.
Annual Report
Financial Highlights - Class B
Years ended October 31, | 2010 | 2009 | 2008 | 2007 | 2006 |
Selected Per-Share Data | | | | | |
Net asset value, beginning of period | $ 7.87 | $ 6.12 | $ 18.64 | $ 14.04 | $ 10.37 |
Income from Investment Operations | | | | | |
Net investment income (loss)C | (-)G | .02 | (.08) | (.11) | (.10) |
Net realized and unrealized gain (loss) | 1.79 | 1.73 | (10.68) | 4.70 | 3.74 |
Total from investment operations | 1.79 | 1.75 | (10.76) | 4.59 | 3.64 |
Distributions from net investment income | (.03) | - | - | - | - |
Distributions from net realized gain | (.09) | - | (1.76) | - | - |
Total distributions | (.12) | - | (1.76)H | - | - |
Redemption fees added to paid in capitalC | -G | -G | -G | .01 | .03 |
Net asset value, end of period | $ 9.54 | $ 7.87 | $ 6.12 | $ 18.64 | $ 14.04 |
Total ReturnA,B | 23.03% | 28.59% | (63.32)% | 32.76% | 35.39% |
Ratios to Average Net AssetsD,F | | | | | |
Expenses before reductions | 1.91% | 1.69% | 2.51% | 2.40% | 2.45% |
Expenses net of fee waivers, if any | 1.91% | 1.69% | 2.41% | 2.40% | 2.41% |
Expenses net of all reductions | 1.90% | 1.64% | 2.38% | 2.36% | 2.30% |
Net investment income (loss) | (.01)% | .25% | (.62)% | (.67)% | (.76)% |
Supplemental Data | | | | | |
Net assets, end of period (000 omitted) | $ 2,902 | $ 2,799 | $ 2,687 | $ 10,975 | $ 7,709 |
Portfolio turnover rateE | 49% | 174% | 61% | 107% | 164% |
A Total returns would have been lower had certain expenses not been reduced during the periods shown.
B Total returns do not include the effect of the contingent deferred sales charge.
C Calculated based on average shares outstanding during the period.
D Fees and expenses of the underlying Fidelity Central Funds are not included in the Fund's expense ratio. The Fund indirectly bears its proportionate share of the expenses of any underlying Fidelity Central Funds.
E Amount does not include the portfolio activity of any underlying Fidelity Central Funds.
F Expense ratios reflect operating expenses of the class. Expenses before reductions do not reflect amounts reimbursed by the investment adviser or reductions from brokerage service arrangements or reductions from other expense offset arrangements and do not represent the amount paid by the class during periods when reimbursements or reductions occur. Expenses net of fee waivers reflect expenses after reimbursement by the investment adviser but prior to reductions from brokerage service arrangements or other expense offset arrangements. Expenses net of all reductions represent the net expenses paid by the class.
G Amount represents less than $.01 per share.
H Total distributions of $1.76 per share is comprised of distributions from net realized gain of $1.760 per share.
See accompanying notes which are an integral part of the financial statements.
Annual Report
Financial Highlights - Class C
Years ended October 31, | 2010 | 2009 | 2008 | 2007 | 2006 |
Selected Per-Share Data | | | | | |
Net asset value, beginning of period | $ 7.86 | $ 6.11 | $ 18.63 | $ 14.03 | $ 10.37 |
Income from Investment Operations | | | | | |
Net investment income (loss)C | (-)G | .02 | (.08) | (.11) | (.10) |
Net realized and unrealized gain (loss) | 1.79 | 1.73 | (10.66) | 4.70 | 3.73 |
Total from investment operations | 1.79 | 1.75 | (10.74) | 4.59 | 3.63 |
Distributions from net investment income | (.03) | - | - | - | - |
Distributions from net realized gain | (.09) | - | (1.78) | - | - |
Total distributions | (.12) | - | (1.78)H | - | - |
Redemption fees added to paid in capitalC | -G | -G | -G | .01 | .03 |
Net asset value, end of period | $ 9.53 | $ 7.86 | $ 6.11 | $ 18.63 | $ 14.03 |
Total ReturnA,B | 23.06% | 28.64% | (63.32)% | 32.79% | 35.29% |
Ratios to Average Net AssetsD,F | | | | | |
Expenses before reductions | 1.91% | 1.68% | 2.51% | 2.38% | 2.38% |
Expenses net of fee waivers, if any | 1.91% | 1.68% | 2.41% | 2.38% | 2.38% |
Expenses net of all reductions | 1.90% | 1.63% | 2.38% | 2.34% | 2.27% |
Net investment income (loss) | (.01)% | .26% | (.62)% | (.66)% | (.73)% |
Supplemental Data | | | | | |
Net assets, end of period (000 omitted) | $ 8,936 | $ 8,543 | $ 9,497 | $ 40,894 | $ 26,320 |
Portfolio turnover rateE | 49% | 174% | 61% | 107% | 164% |
A Total returns would have been lower had certain expenses not been reduced during the periods shown.
B Total returns do not include the effect of the contingent deferred sales charge.
C Calculated based on average shares outstanding during the period.
D Fees and expenses of the underlying Fidelity Central Funds are not included in the Fund's expense ratio. The Fund indirectly bears its proportionate share of the expenses of any underlying Fidelity Central Funds.
E Amount does not include the portfolio activity of any underlying Fidelity Central Funds.
F Expense ratios reflect operating expenses of the class. Expenses before reductions do not reflect amounts reimbursed by the investment adviser or reductions from brokerage service arrangements or reductions from other expense offset arrangements and do not represent the amount paid by the class during periods when reimbursements or reductions occur. Expenses net of fee waivers reflect expenses after reimbursement by the investment adviser but prior to reductions from brokerage service arrangements or other expense offset arrangements. Expenses net of all reductions represent the net expenses paid by the class.
G Amount represents less than $.01 per share.
H Total distributions of $1.78 per share is comprised of distributions from net realized gain of $1.775 per share.
See accompanying notes which are an integral part of the financial statements.
Annual Report
Financial Highlights - International Small Cap Opportunities
Years ended October 31, | 2010 | 2009 | 2008 | 2007 | 2006 |
Selected Per-Share Data | | | | | |
Net asset value, beginning of period | $ 8.14 | $ 6.28 | $ 19.09 | $ 14.23 | $ 10.40 |
Income from Investment Operations | | | | | |
Net investment income (loss)B | .09 | .08 | .05 | .07 | .05 |
Net realized and unrealized gain (loss) | 1.87 | 1.78 | (10.92) | 4.78 | 3.75 |
Total from investment operations | 1.96 | 1.86 | (10.87) | 4.85 | 3.80 |
Distributions from net investment income | (.09) | -F | (.06) | - | - |
Distributions from net realized gain | (.09) | - | (1.88) | - | -F |
Total distributions | (.18) | -F | (1.94)G | - | -F |
Redemption fees added to paid in capitalB | -F | -F | -F | .01 | .03 |
Net asset value, end of period | $ 9.92 | $ 8.14 | $ 6.28 | $ 19.09 | $ 14.23 |
Total ReturnA | 24.43% | 29.68% | (62.91)% | 34.15% | 36.86% |
Ratios to Average Net AssetsC,E | | | | | |
Expenses before reductions | .91% | .68% | 1.44% | 1.30% | 1.28% |
Expenses net of fee waivers, if any | .91% | .68% | 1.44% | 1.30% | 1.28% |
Expenses net of all reductions | .89% | .64% | 1.40% | 1.25% | 1.16% |
Net investment income (loss) | 1.00% | 1.25% | .36% | .43% | .37% |
Supplemental Data | | | | | |
Net assets, end of period (000 omitted) | $ 398,331 | $ 329,128 | $ 312,376 | $ 1,433,844 | $ 981,210 |
Portfolio turnover rateD | 49% | 174% | 61% | 107% | 164% |
A Total returns would have been lower had certain expenses not been reduced during the periods shown.
B Calculated based on average shares outstanding during the period.
C Fees and expenses of the underlying Fidelity Central Funds are not included in the Fund's expense ratio. The Fund indirectly bears its proportionate share of the expenses of any underlying Fidelity Central Funds.
D Amount does not include the portfolio activity of any underlying Fidelity Central Funds.
E Expense ratios reflect operating expenses of the class. Expenses before reductions do not reflect amounts reimbursed by the investment adviser or reductions from brokerage service arrangements or reductions from other expense offset arrangements and do not represent the amount paid by the class during periods when reimbursements or reductions occur. Expenses net of fee waivers reflect expenses after reimbursement by the investment adviser but prior to reductions from brokerage service arrangements or other expense offset arrangements. Expenses net of all reductions represent the net expenses paid by the class.
F Amount represents less than $.01 per share.
G Total distributions of $1.94 per share is comprised of distributions from net investment income of $.064 and distributions from net realized gain of $1.878 per share.
See accompanying notes which are an integral part of the financial statements.
Annual Report
Financial Highlights - Institutional Class
Years ended October 31, | 2010 | 2009 | 2008 | 2007 | 2006 |
Selected Per-Share Data | | | | | |
Net asset value, beginning of period | $ 8.14 | $ 6.27 | $ 19.09 | $ 14.22 | $ 10.40 |
Income from Investment Operations | | | | | |
Net investment income (loss)B | .09 | .08 | .05 | .08 | .05 |
Net realized and unrealized gain (loss) | 1.86 | 1.79 | (10.92) | 4.78 | 3.74 |
Total from investment operations | 1.95 | 1.87 | (10.87) | 4.86 | 3.79 |
Distributions from net investment income | (.07) | -F | (.07) | - | - |
Distributions from net realized gain | (.09) | - | (1.88) | - | -F |
Total distributions | (.16) | -F | (1.95)G | - | -F |
Redemption fees added to paid in capitalB | -F | -F | -F | .01 | .03 |
Net asset value, end of period | $ 9.93 | $ 8.14 | $ 6.27 | $ 19.09 | $ 14.22 |
Total ReturnA | 24.33% | 29.87% | (62.95)% | 34.25% | 36.77% |
Ratios to Average Net AssetsC,E | | | | | |
Expenses before reductions | .90% | .68% | 1.40% | 1.29% | 1.25% |
Expenses net of fee waivers, if any | .90% | .68% | 1.40% | 1.29% | 1.25% |
Expenses net of all reductions | .88% | .64% | 1.37% | 1.25% | 1.14% |
Net investment income (loss) | 1.01% | 1.25% | .39% | .44% | .40% |
Supplemental Data | | | | | |
Net assets, end of period (000 omitted) | $ 2,418 | $ 2,022 | $ 8,117 | $ 27,609 | $ 13,954 |
Portfolio turnover rateD | 49% | 174% | 61% | 107% | 164% |
A Total returns would have been lower had certain expenses not been reduced during the periods shown.
B Calculated based on average shares outstanding during the period.
C Fees and expenses of the underlying Fidelity Central Funds are not included in the Fund's expense ratio. The Fund indirectly bears its proportionate share of the expenses of any underlying Fidelity Central Funds.
D Amount does not include the portfolio activity of any underlying Fidelity Central Funds.
E Expense ratios reflect operating expenses of the class. Expenses before reductions do not reflect amounts reimbursed by the investment adviser or reductions from brokerage service arrangements or reductions from other expense offset arrangements and do not represent the amount paid by the class during periods when reimbursements or reductions occur. Expenses net of fee waivers reflect expenses after reimbursement by the investment adviser but prior to reductions from brokerage service arrangements or other expense offset arrangements. Expenses net of all reductions represent the net expenses paid by the class.
F Amount represents less than $.01 per share.
G Total distributions of $1.95 per share is comprised of distributions from net investment income of $.074 and distributions from net realized gain of $1.878 per share.
See accompanying notes which are an integral part of the financial statements.
Annual Report
Notes to Financial Statements
For the period ended October 31, 2010
1. Organization.
Fidelity International Small Cap Opportunities Fund (the Fund) is a fund of Fidelity Investment Trust (the Trust) and is authorized to issue an unlimited number of shares. The Trust is registered under the Investment Company Act of 1940, as amended (the 1940 Act), as an open-end management investment company organized as a Massachusetts business trust. The Fund offers Class A, Class T, Class C, International Small Cap Opportunities and Institutional Class shares, each of which has equal rights as to assets and voting privileges. Effective after the close of business on September 1, 2010, Class B shares were closed to new accounts and additional purchases by existing shareholders. Each class has exclusive voting rights with respect to matters that affect that class. Class B shares will automatically convert to Class A shares after a holding period of seven years from the initial date of purchase. Investment income, realized and unrealized capital gains and losses, the common expenses of the Fund, and certain fund-level expense reductions, if any, are allocated on a pro-rata basis to each class based on the relative net assets of each class to the total net assets of the Fund. Each class differs with respect to transfer agent and distribution and service plan fees incurred. Certain expense reductions also differ by class. The Fund's investments in emerging markets can be subject to social, economic, regulatory, and political uncertainties and can be extremely volatile.
2. Investments in Fidelity Central Funds.
The Fund may invest in Fidelity Central Funds, which are open-end investment companies available only to other investment companies and accounts managed by Fidelity Management & Research Company (FMR) and its affiliates. The Fund's Schedule of Investments lists each of the Fidelity Central Funds held as of period end, if any, as an investment of the Fund, but does not include the underlying holdings of each Fidelity Central Fund. As an Investing Fund, the Fund indirectly bears its proportionate share of the expenses of the underlying Fidelity Central Funds.
The Money Market Central Funds seek preservation of capital and current income and are managed by Fidelity Investments Money Management, Inc. (FIMM), an affiliate of FMR.
A complete unaudited list of holdings for each Fidelity Central Fund is available upon request or at the Securities and Exchange Commission (the SEC) web site at www.sec.gov. In addition, the financial statements of the Fidelity Central Funds, which are not covered by the Fund's Report of Independent Registered Public Accounting Firm, are available on the SEC web site or upon request.
3. Significant Accounting Policies.
The financial statements have been prepared in conformity with accounting principles generally accepted in the United States of America (GAAP), which require management
Annual Report
3. Significant Accounting Policies - continued
to make certain estimates and assumptions at the date of the financial statements. Actual results could differ from those estimates. The following summarizes the significant accounting policies of the Fund:
Security Valuation. Investments are valued as of 4:00 p.m. Eastern time on the last calendar day of the period. The Fund uses independent pricing services approved by the Board of Trustees to value its investments. When current market prices or quotations are not readily available or reliable, valuations may be determined in good faith in accordance with procedures adopted by the Board of Trustees. Factors used in determining value may include market or security specific events. The frequency with which these procedures are used cannot be predicted and they may be utilized to a significant extent. The value used for net asset value (NAV) calculation under these procedures may differ from published prices for the same securities.
The Fund categorizes the inputs to valuation techniques used to value its investments into a disclosure hierarchy consisting of three levels as shown below.
Level 1 - quoted prices in active markets for identical investments
Level 2 - other significant observable inputs (including quoted prices for similar investments, interest rates, prepayment speeds, etc.)
Level 3 - unobservable inputs (including the fund's own assumptions based on the best information available)
Changes in valuation techniques may result in transfers in or out of an assigned level within the disclosure hierarchy. The aggregate value of investments by input level, as of October 31, 2010, is included at the end of the Fund's Schedule of Investments. Valuation techniques used to value the Fund's investments by major category are as follows.
Equity securities, including restricted securities, for which market quotations are readily available, are valued at the last reported sale price or official closing price as reported by an independent pricing service on the primary market or exchange on which they are traded and are categorized as Level 1 in the hierarchy. In the event there were no sales during the day or closing prices are not available, securities are valued at the last quoted bid price or may be valued using the last available price and are generally categorized as Level 2 in the hierarchy. For foreign equity securities, when significant market or security specific events arise, comparisons to the valuation of American Depositary Receipts (ADRs), futures contracts, Exchange-traded funds (ETFs) and certain indexes as well as quoted prices for similar securities are used and are categorized as Level 2 in the hierarchy in these circumstances. Utilizing these techniques may result in significant transfers between Level 1 and Level 2. For restricted equity securities and private placements
Annual Report
Notes to Financial Statements - continued
3. Significant Accounting Policies - continued
Security Valuation - continued
where observable inputs are limited, assumptions about market activity and risk are used and are categorized as Level 3 in the hierarchy.
Investments in open-end mutual funds, including the Fidelity Central Funds, are valued at their closing net asset value each business day and are categorized as Level 1 in the hierarchy. Short-term securities with remaining maturities of sixty days or less for which quotations are not readily available are valued at amortized cost, which approximates fair value and are categorized as Level 2 in the hierarchy.
Foreign Currency. The Fund uses foreign currency contracts to facilitate transactions in foreign-denominated securities. Gains and losses from these transactions may arise from changes in the value of the foreign currency or if the counterparties do not perform under the contracts' terms.
Foreign-denominated assets, including investment securities, and liabilities are translated into U.S. dollars at the exchange rate at period end. Purchases and sales of investment securities, income and dividends received and expenses denominated in foreign currencies are translated into U.S. dollars at the exchange rate in effect on the transaction date.
The effects of exchange rate fluctuations on investments are included with the net realized and unrealized gain (loss) on investment securities. Other foreign currency transactions resulting in realized and unrealized gain (loss) are disclosed separately.
Investment Transactions and Income. For financial reporting purposes, the Fund's investment holdings and NAV include trades executed through the end of the last business day of the period. The NAV per share for processing shareholder transactions is calculated as of the close of business of the New York Stock Exchange (NYSE), normally 4:00 p.m. Eastern time and includes trades executed through the end of the prior business day. Gains and losses on securities sold are determined on the basis of identified cost. Dividend income is recorded on the ex-dividend date, except for certain dividends from foreign securities where the ex-dividend date may have passed, which are recorded as soon as the Fund is informed of the ex-dividend date. Non-cash dividends included in dividend income, if any, are recorded at the fair market value of the securities received. Distributions received on securities that represent a return of capital or capital gain are recorded as a reduction of cost of investments and/or as a realized gain. The Fund estimates the components of distributions received that may be considered return of capital distributions or capital gain distributions. Interest income and distributions from the Fidelity Central Funds are accrued as earned. Interest income includes coupon interest and amortization of premium and accretion of discount on debt securities.
Annual Report
3. Significant Accounting Policies - continued
Investment Transactions and Income - continued
Investment income is recorded net of foreign taxes withheld where recovery of such taxes is uncertain.
Expenses. Most expenses of the Trust can be directly attributed to a fund. Expenses which cannot be directly attributed are apportioned amongst each fund in the Trust. Expense estimates are accrued in the period to which they relate and adjustments are made when actual amounts are known.
Income Tax Information and Distributions to Shareholders. Each year the Fund intends to qualify as a regulated investment company, including distributing substantially all of its taxable income and realized gains under Subchapter M of the Internal Revenue Code and filing its U.S. federal tax return. As a result, no provision for income taxes is required. As of October 31, 2010, the Fund did not have any unrecognized tax benefits in the accompanying financial statements. A fund's federal tax return is subject to examination by the Internal Revenue Service (IRS) for a period of three years. Foreign taxes are provided for based on the Fund's understanding of the tax rules and rates that exist in the foreign markets in which it invests.
Distributions are declared and recorded on the ex-dividend date. Income dividends and capital gain distributions are declared separately for each class. Income and capital gain distributions are determined in accordance with income tax regulations, which may differ from GAAP.
Capital accounts within the financial statements are adjusted for permanent book-tax differences. These adjustments have no impact on net assets or the results of operations. Temporary book-tax differences will reverse in a subsequent period.
Book-tax differences are primarily due to the short-term gain distributions from the Fidelity Central Funds, foreign currency transactions, passive foreign investment companies (PFIC), capital loss carryforwards and losses deferred due to wash sales.
The federal tax cost of investment securities and unrealized appreciation (depreciation) as of period end were as follows:
Gross unrealized appreciation | $ 110,936,787 |
Gross unrealized depreciation | (8,823,890) |
Net unrealized appreciation (depreciation) | $ 102,112,897 |
| |
Tax Cost | $ 359,714,868 |
Annual Report
Notes to Financial Statements - continued
3. Significant Accounting Policies - continued
Income Tax Information and Distributions to Shareholders - continued
The tax-based components of distributable earnings as of period end were as follows:
Undistributed ordinary income | $ 5,260,449 |
Capital loss carryforward | $ (420,935,635) |
Net unrealized appreciation (depreciation) | $ 102,154,904 |
The tax character of distributions paid was as follows:
| October 31, 2010 | October 31, 2009 |
Ordinary Income | $ 7,928,671 | $ 140,700 |
Short-Term Trading (Redemption) Fees. Shares held by investors in the Fund less than 90 days are subject to a redemption fee equal to 2.00% of the net asset value of shares redeemed. All redemption fees, which reduce the proceeds of the shareholder redemption, are retained by the Fund and accounted for as an addition to paid in capital.
4. Purchases and Sales of Investments.
Purchases and sales of securities, other than short-term securities, aggregated $186,444,286 and $203,425,442, respectively.
5. Fees and Other Transactions with Affiliates.
Management Fee. FMR and its affiliates provide the Fund with investment management related services for which the Fund pays a monthly management fee. The management fee is the sum of an individual fund fee rate that is based on an annual rate of .60% of the Fund's average net assets and a group fee rate that averaged .26% during the period. The group fee rate is based upon the average net assets of all the mutual funds advised by FMR. The group fee rate decreases as assets under management increase and increases as assets under management decrease. In addition, the management fee is subject to a performance adjustment (up to a maximum of ±.20% of the Fund's average net assets over a 36 month performance period). The upward or downward adjustment to the management fee is based on relative investment performance of International Small Cap Opportunities as compared to an appropriate benchmark index. For the period, the total annual management fee rate, including the performance adjustment, was .47% of the Fund's average net assets.
Distribution and Service Plan Fees. In accordance with Rule 12b-1 of the 1940 Act, the Fund has adopted separate Distribution and Service Plans for each class of shares. Certain classes pay Fidelity Distributors Corporation (FDC), an affiliate of FMR, separate
Annual Report
5. Fees and Other Transactions with Affiliates - continued
Distribution and Service Plan Fees - continued
Distribution and Service Fees, each of which is based on an annual percentage of each class' average net assets. In addition, FDC may pay financial intermediaries for selling shares of the Fund and providing shareholder support services. For the period, the Distribution and Service Fee rates, total fees and amounts retained by FDC were as follows:
| Distribution
Fee | Service
Fee | Total
Fees | Retained
by FDC |
Class A | -% | .25% | $ 47,792 | $ 274 |
Class T | .25% | .25% | 54,808 | - |
Class B | .75% | .25% | 28,142 | 21,120 |
Class C | .75% | .25% | 86,027 | 7,949 |
| | | $ 216,769 | $ 29,343 |
Sales Load. FDC receives a front-end sales charge of up to 5.75% for selling Class A shares and 3.50% for selling Class T shares, some of which is paid to financial intermediaries for selling shares of the Fund. FDC receives the proceeds of contingent deferred sales charges levied on Class A, Class T, Class B, and Class C redemptions. These charges depend on the holding period. The deferred sales charges range from 5% to 1% for Class B, 1% for Class C, 1.00% for certain purchases of Class A shares (1.00% to .50% prior to July 12, 2010) and .25% for certain purchases of Class T shares.
For the period, sales charge amounts retained by FDC were as follows:
| Retained
by FDC |
Class A | $ 7,450 |
Class T | 2,287 |
Class B* | 7,594 |
Class C* | 697 |
| $ 18,028 |
* When Class B and Class C shares are initially sold, FDC pays commissions from its own resources to financial intermediaries through which the sales are made.
Transfer Agent Fees. Fidelity Investments Institutional Operations Company, Inc. (FIIOC), an affiliate of FMR, is the transfer, dividend disbursing and shareholder servicing agent for each class of the Fund. FIIOC receives account fees and asset-based fees that vary according to the account size and type of account of the shareholders of the respective classes of the Fund. FIIOC pays for typesetting, printing and mailing of shareholder reports, except proxy statements. For the period, transfer agent fees for each class were as follows:
Annual Report
Notes to Financial Statements - continued
5. Fees and Other Transactions with Affiliates - continued
Transfer Agent Fees - continued
| Amount | % of
Average
Net Assets |
Class A | $ 59,699 | .31 |
Class T | 35,532 | .32 |
Class B | 8,814 | .31 |
Class C | 26,844 | .31 |
International Small Cap Opportunities | 1,055,328 | .30 |
Institutional Class | 5,503 | .30 |
| $ 1,191,720 | |
Accounting and Security Lending Fees. Fidelity Service Company, Inc. (FSC), an affiliate of FMR, maintains the Fund's accounting records. The accounting fee is based on the level of average net assets for the month. Under a separate contract, FSC administers the security lending program. The security lending fee is based on the number and duration of lending transactions.
Brokerage Commissions. The Fund placed a portion of its portfolio transactions with brokerage firms which are affiliates of the investment adviser. The commissions paid to these affiliated firms were $1,186 for the period.
6. Committed Line of Credit.
The Fund participates with other funds managed by FMR or an affiliate in a $3.75 billion credit facility (the "line of credit") to be utilized for temporary or emergency purposes to fund shareholder redemptions or for other short-term liquidity purposes. The Fund has agreed to pay commitment fees on its pro-rata portion of the line of credit, which amounted to $1,513 and is reflected in Miscellaneous expenses on the Statement of Operations. During the period, there were no borrowings on this line of credit.
7. Security Lending.
The Fund lends portfolio securities through a lending agent from time to time in order to earn additional income. The lending agent may loan securities to certain qualified borrowers, including Fidelity Capital Markets (FCM), a broker-dealer affiliated with the Fund. On the settlement date of the loan, the Fund receives collateral (in the form of U.S. Treasury obligations, letters of credit and/or cash) against the loaned securities and maintains collateral in an amount not less than 100% of the market value of the loaned securities during the period of the loan. The market value of the loaned securities is determined at the close of business of the Fund and any additional required collateral is
Annual Report
7. Security Lending - continued
delivered to the Fund on the next business day. If the borrower defaults on its obligation to return the securities loaned because of insolvency or other reasons, a fund could experience delays and costs in recovering the securities loaned or in gaining access to the collateral. Any cash collateral received is invested in the Fidelity Securities Lending Cash Central Fund. The value of loaned securities and cash collateral at period end are disclosed on the Fund's Statement of Assets and Liabilities. Security lending income represents the income earned on investing cash collateral, less rebates paid to borrowers and lending agent fees associated with the loan, plus any premium payments received for lending certain types of securities. Security lending income is presented in the Statement of Operations as a component of income from Fidelity Central Funds. Total security lending income during the period amounted to $263,176. During the period, there were no securities loaned to FCM.
8. Expense Reductions.
Many of the brokers with whom FMR places trades on behalf of the Fund provided services to the Fund in addition to trade execution. These services included payments of certain expenses on behalf of the Fund totaling $55,920 for the period.
9. Distributions to Shareholders.
Distributions to shareholders of each class were as follows:
Years ended October 31, | 2010 | 2009 |
From net investment income | | |
Class A | $ 167,529 | $ - |
Class T | 81,809 | - |
Class B | 11,651 | - |
Class C | 35,378 | - |
International Small Cap Opportunities | 3,548,259 | 138,653 |
Institutional Class | 16,552 | 2,047 |
Total | $ 3,861,178 | $ 140,700 |
From net realized gain | | |
Class A | $ 203,751 | $ - |
Class T | 126,944 | - |
Class B | 31,778 | - |
Class C | 96,486 | - |
International Small Cap Opportunities | 3,588,127 | - |
Institutional Class | 20,407 | - |
Total | $ 4,067,493 | $ - |
Annual Report
Notes to Financial Statements - continued
10. Share Transactions.
Transactions for each class of shares were as follows:
| Shares | Dollars |
Years ended October 31, | 2010 | 2009 | 2010 | 2009 |
Class A | | | | |
Shares sold | 502,676 | 560,746 | $ 4,331,157 | $ 3,588,317 |
Reinvestment of distributions | 39,668 | - | 334,402 | - |
Shares redeemed | (821,208) | (1,093,254) | (7,086,973) | (6,722,964) |
Net increase (decrease) | (278,864) | (532,508) | $ (2,421,414) | $ (3,134,647) |
Class T | | | | |
Shares sold | 202,721 | 318,902 | $ 1,752,774 | $ 2,064,516 |
Reinvestment of distributions | 24,207 | - | 202,613 | - |
Shares redeemed | (563,942) | (704,037) | (4,787,797) | (4,201,658) |
Net increase (decrease) | (337,014) | (385,135) | $ (2,832,410) | $ (2,137,142) |
Class B | | | | |
Shares sold | 33,509 | 50,745 | $ 282,738 | $ 317,874 |
Reinvestment of distributions | 4,957 | - | 40,893 | - |
Shares redeemed | (89,943) | (133,859) | (751,714) | (788,113) |
Net increase (decrease) | (51,477) | (83,114) | $ (428,083) | $ (470,239) |
Class C | | | | |
Shares sold | 138,774 | 196,866 | $ 1,172,961 | $ 1,233,043 |
Reinvestment of distributions | 13,874 | - | 114,325 | - |
Shares redeemed | (301,965) | (662,831) | (2,545,004) | (3,650,532) |
Net increase (decrease) | (149,317) | (465,965) | $ (1,257,718) | $ (2,417,489) |
International Small Cap Opportunities | | | | |
Shares sold | 11,750,215 | 7,245,986 | $ 101,991,968 | $ 48,782,866 |
Reinvestment of distributions | 792,800 | 21,738 | 6,738,804 | 128,470 |
Shares redeemed | (12,779,026) | (16,613,794) | (110,633,144) | (102,979,613) |
Net increase (decrease) | (236,011) | (9,346,070) | $ (1,902,372) | $ (54,068,277) |
Institutional Class | | | | |
Shares sold | 111,833 | 256,950 | $ 1,028,388 | $ 1,455,739 |
Reinvestment of distributions | 3,263 | 122 | 27,765 | 720 |
Shares redeemed | (119,898) | (1,302,675) | (1,034,340) | (7,362,592) |
Net increase (decrease) | (4,802) | (1,045,603) | $ 21,813 | $ (5,906,133) |
Annual Report
11. Other.
The Fund's organizational documents provide former and current trustees and officers with a limited indemnification against liabilities arising in connection with the performance of their duties to the Fund. In the normal course of business, the Fund may also enter into contracts that provide general indemnifications. The Fund's maximum exposure under these arrangements is unknown as this would be dependent on future claims that may be made against the Fund. The risk of material loss from such claims is considered remote.
Annual Report
To the Trustees of Fidelity Investment Trust and Shareholders of Fidelity International Small Cap Opportunities Fund:
We have audited the accompanying statement of assets and liabilities of Fidelity International Small Cap Opportunities Fund (the Fund), a fund of Fidelity Investment Trust, including the schedule of investments, as of October 31, 2010, and the related statement of operations for the year then ended, the statement of changes in net assets for each of the two years in the period then ended, and the financial highlights for each of the five years in the period then ended. These financial statements and financial highlights are the responsibility of the Fund's management. Our responsibility is to express an opinion on these financial statements and financial highlights based on our audits.
We conducted our audits in accordance with standards of the Public Company Accounting Oversight Board (United States). Those standards require that we plan and perform the audit to obtain reasonable assurance about whether the financial statements and financial highlights are free of material misstatement. The Fund is not required to have, nor were we engaged to perform, an audit of its internal control over financial reporting. Our audits included consideration of internal control over financial reporting as a basis for designing audit procedures that are appropriate in the circumstances, but not for the purpose of expressing an opinion on the effectiveness of the Fund's internal control over financial reporting. Accordingly, we express no such opinion. An audit also includes examining, on a test basis, evidence supporting the amounts and disclosures in the financial statements, assessing the accounting principles used and significant estimates made by management, as well as evaluating the overall financial statement presentation. Our procedures included confirmation of securities owned as of October 31, 2010, by correspondence with the custodians and brokers; where replies were not received from brokers, we performed other auditing procedures. We believe that our audits provide a reasonable basis for our opinion.
In our opinion, the financial statements and financial highlights referred to above present fairly, in all material respects, the financial position of Fidelity International Small Cap Opportunities Fund as of October 31, 2010, the results of its operations for the year then ended, the changes in its net assets for each of the two years in the period then ended, and the financial highlights for each of the five years in the period then ended, in conformity with accounting principles generally accepted in the United States of America.
/s/ Deloitte & Touche LLP
DELOITTE & TOUCHE LLP
Boston, Massachusetts
December 16, 2010
Annual Report
The Trustees, Member of the Advisory Board, and executive officers of the trust and fund, as applicable, are listed below. The Board of Trustees governs the fund and is responsible for protecting the interests of shareholders. The Trustees are experienced executives who meet periodically throughout the year to oversee the fund's activities, review contractual arrangements with companies that provide services to the fund, oversee management of the risks associated with such activities and contractual arrangements, and review the fund's performance. Except for James C. Curvey, each of the Trustees oversees 221 funds advised by FMR or an affiliate. Mr. Curvey oversees 410 funds advised by FMR or an affiliate.
The Trustees hold office without limit in time except that (a) any Trustee may resign; (b) any Trustee may be removed by written instrument, signed by at least two-thirds of the number of Trustees prior to such removal; (c) any Trustee who requests to be retired or who has become incapacitated by illness or injury may be retired by written instrument signed by a majority of the other Trustees; and (d) any Trustee may be removed at any special meeting of shareholders by a two-thirds vote of the outstanding voting securities of the trust. Each Trustee who is not an interested person (as defined in the 1940 Act) (Independent Trustee), shall retire not later than the last day of the calendar year in which his or her 72nd birthday occurs. The Independent Trustees may waive this mandatory retirement age policy with respect to individual Trustees. The executive officers and Advisory Board Member hold office without limit in time, except that any officer and Advisory Board Member may resign or may be removed by a vote of a majority of the Trustees at any regular meeting or any special meeting of the Trustees. Except as indicated, each individual has held the office shown or other offices in the same company for the past five years.
Experience, Skills, Attributes, and Qualifications of the Fund's Trustees. The Governance and Nominating Committee has adopted a statement of policy that describes the experience, qualifications, attributes, and skills that are necessary and desirable for potential Independent Trustee candidates (Statement of Policy). The Board believes that each Trustee satisfied at the time he or she was initially elected or appointed a Trustee, and continues to satisfy, the standards contemplated by the Statement of Policy. The Governance and Nominating Committee also engages professional search firms to help identify potential Independent Trustee candidates who have the experience, qualifications, attributes, and skills consistent with the Statement of Policy. From time to time, additional criteria based on the composition and skills of the current Independent Trustees, as well as experience or skills that may be appropriate in light of future changes to board composition, business conditions, and regulatory or other developments, have also been considered by the professional search firms and the Governance and Nominating Committee. In addition, the Board takes into account the Trustees' commitment and participation in Board and committee meetings, as well as their leadership of standing and ad hoc committees throughout their tenure.
In determining that a particular Trustee was and continues to be qualified to serve as a Trustee, the Board has considered a variety of criteria, none of which, in isolation, was controlling. The Board believes that, collectively, the Trustees have balanced and diverse experience, qualifications, attributes, and skills, which allow the Board to operate effectively in governing the fund and protecting the interests of shareholders. Information about the specific experience, skills, attributes, and qualifications of each Trustee, which in each case led to the Board's conclusion that the Trustee should serve (or continue to serve) as a trustee of the fund, is provided below.
Annual Report
Board Structure and Oversight Function. Edward C. Johnson 3d is an interested person (as defined in the 1940 Act) and currently serves as Chairman. The Trustees have determined that an interested Chairman is appropriate and benefits shareholders because an interested Chairman has a personal and professional stake in the quality and continuity of services provided to the fund. Independent Trustees exercise their informed business judgment to appoint an individual of their choosing to serve as Chairman, regardless of whether the Trustee happens to be independent or a member of management. The Independent Trustees have determined that they can act independently and effectively without having an Independent Trustee serve as Chairman and that a key structural component for assuring that they are in a position to do so is for the Independent Trustees to constitute a substantial majority for the Board. The Independent Trustees also regularly meet in executive session. Ned C. Lautenbach serves as Chairman of the Independent Trustees and as such (i) acts as a liaison between the Independent Trustees and management with respect to matters important to the Independent Trustees and (ii) with management prepares agendas for Board meetings.
Fidelity funds are overseen by different Boards of Trustees. The fund's Board oversees Fidelity's equity and high income funds and another Board oversees Fidelity's investment-grade bond, money market, and asset allocation funds. The asset allocation funds may invest in Fidelity funds overseen by the fund's Board. The use of separate Boards, each with its own committee structure, allows the Trustees of each group of Fidelity funds to focus on the unique issues of the funds they oversee, including common research, investment, and operational issues. On occasion, the separate Boards establish joint committees to address issues of overlapping consequences for the Fidelity funds overseen by each Board.
The Trustees operate using a system of committees to facilitate the timely and efficient consideration of all matters of importance to the Trustees, the fund, and fund shareholders and to facilitate compliance with legal and regulatory requirements and oversight of the fund's activities and associated risks. The Board, acting through its committees, has charged FMR and its affiliates with (i) identifying events or circumstances the occurrence of which could have demonstrably adverse effects on the fund's business and/or reputation; (ii) implementing processes and controls to lessen the possibility that such events or circumstances occur or to mitigate the effects of such events or circumstances if they do occur; and (iii) creating and maintaining a system designed to evaluate continuously business and market conditions in order to facilitate the identification and implementation processes described in (i) and (ii) above. Because the day-to-day operations and activities of the fund are carried out by or through FMR, its affiliates and other service providers, the fund's exposure to risks is mitigated but not eliminated by the processes overseen by the Trustees. While each of the Board's committees has responsibility for overseeing different aspects of the fund's activities, oversight is exercised primarily through the Operations, Audit, and Compliance Committees. Appropriate personnel, including but not limited to the fund's Chief Compliance Officer (CCO), FMR's internal auditor, the independent accountants, the fund's Treasurer and portfolio management personnel, make periodic reports to the Board's committees, as appropriate. The responsibilities of each committee, including their oversight responsibilities, are described further under "Standing Committees of the Fund's Trustees."
Annual Report
Trustees and Officers - continued
The fund's Statement of Additional Information (SAI) includes more information about the Trustees. To request a free copy, call Fidelity at 1-877-208-0098.
Interested Trustees*:
Correspondence intended for each Trustee who is an interested person may be sent to Fidelity Investments, 82 Devonshire Street, Boston, Massachusetts 02109.
Name, Age; Principal Occupations and Other Relevant Experience+ |
Edward C. Johnson 3d (80) |
| Year of Election or Appointment: 1984 Mr. Johnson is Trustee and Chairman of the Board of Trustees of certain Trusts. Mr. Johnson serves as Chief Executive Officer, Chairman, and a Director of FMR LLC; Chairman and a Director of FMR; Chairman and a Director of Fidelity Research & Analysis Company (FRAC); Chairman and a Director of Fidelity Investments Money Management, Inc.; and Chairman and a Director of FMR Co., Inc. In addition, Mr. Johnson serves as Chairman and Director of FIL Limited. Previously, Mr. Johnson served as President of FMR LLC (2006-2007). |
James C. Curvey (75) |
| Year of Election or Appointment: 2007 Mr. Curvey also serves as Trustee (2007-present) of other investment companies advised by FMR. Mr. Curvey is a Director of Fidelity Investments Money Management, Inc. (2009-present), Director of Fidelity Research & Analysis Co. (2009-present) and Director of FMR and FMR Co., Inc. (2007-present). Mr. Curvey is also Vice Chairman (2007-
present) and Director of FMR LLC. In addition, Mr. Curvey serves as an Overseer for the Boston Symphony Orchestra and a member of the Trustees of Villanova University. Previously, Mr. Curvey was the Vice Chairman (2006-2007) and Director (2000-2007) of FMR Corp. |
Annual Report
* Trustees have been determined to be "Interested Trustees" by virtue of, among other things, their affiliation with the trust or various entities under common control with FMR.
+ The information above includes each Trustee's principal occupation during the last five years and other information relating to the experience, attributes, and skills relevant to each Trustee's qualifications to serve as a Trustee, which led to the conclusion that each Trustee should serve as a Trustee for the fund.
Independent Trustees:
Correspondence intended for each Independent Trustee (that is, the Trustees other than the Interested Trustees) may be sent to Fidelity Investments, P.O. Box 55235, Boston, Massachusetts 02205-5235.
Name, Age; Principal Occupations and Other Relevant Experience+ |
Dennis J. Dirks (62) |
| Year of Election or Appointment: 2005 Prior to his retirement in May 2003, Mr. Dirks was Chief Operating Officer and a member of the Board of The Depository Trust & Clearing Corporation (DTCC). He also served as President, Chief Operating Officer, and Board member of The Depository Trust Company (DTC) and President and Board member of the National Securities Clearing Corporation (NSCC). In addition, Mr. Dirks served as Chief Executive Officer and Board member of the Government Securities Clearing Corporation, Chief Executive Officer and Board member of the Mortgage-Backed Securities Clearing Corporation, as a Trustee and a member of the Finance Committee of Manhattan College (2005-2008), and as a Trustee and a member of the Finance Committee of AHRC of Nassau County (2006-2008). Mr. Dirks is a member of the Independent Directors Council (IDC) Governing Council (2010-Present) and Board of Directors for The Brookville Center for Children's Services, Inc. (2009-present). |
Alan J. Lacy (57) |
| Year of Election or Appointment: 2008 Mr. Lacy serves as Senior Adviser (2007-present) of Oak Hill Capital Partners, L.P. (private equity). Mr. Lacy also served as Chief Executive Officer (2000-2005) and Vice Chairman (2005-2006) of Sears Holdings Corporation and Sears, Roebuck and Co. (retail). In addition, Mr. Lacy serves as a member of the Board of Directors of The Western Union Company (global money transfer, 2006-present) and Bristol-Myers Squibb Company (global pharmaceuticals, 2007-present). Mr. Lacy is Chairman (2008-present) and a member (2006-present) of the Board of Trustees of The National Parks Conservation Association. |
Ned C. Lautenbach (66) |
| Year of Election or Appointment: 2000 Mr. Lautenbach is Chairman of the Independent Trustees of the Equity and High Income Funds (2006-present). Mr. Lautenbach currently serves as the Lead Director of the Eaton Corporation Board of Directors (diversified industrial, 1997-present). Mr. Lautenbach is also a member of the Board of Directors of the Philharmonic Center for the Arts in Naples, Florida (1999-present); a member of the Board of Trustees of Fairfield University (2005-present); and a member of the Council on Foreign Relations (1994-present). Previously, Mr. Lautenbach was a Partner/Advisory Partner at Clayton, Dubilier & Rice, Inc. (private equity investment, 1998-2010), as well as a Director of Sony Corporation (2006-2007). |
Joseph Mauriello (66) |
| Year of Election or Appointment: 2008 Prior to his retirement in January 2006, Mr. Mauriello served in numerous senior management positions including Deputy Chairman and Chief Operating Officer (2004-2005), and Vice Chairman of Financial Services (2002-2004) of KPMG LLP US (professional services, 1965-2005). Mr. Mauriello currently serves as a member of the Board of Directors of XL Group plc. (global insurance and re-insurance, 2006-present) and of Arcadia Resources Inc. (health care services and products, 2007-present). Previously, Mr. Mauriello served as a Director of the Hamilton Funds of the Bank of New York (2006-2007). |
Cornelia M. Small (66) |
| Year of Election or Appointment: 2005 Ms. Small is a member of the Board of Directors of the Teagle Foundation (2009-present). Ms. Small is also a member of the Investment Committee, and Chair (2008-present) and a member of the Board of Trustees of Smith College. In addition, Ms. Small serves on the Investment Committee of the Berkshire Taconic Community Foundation (2008-present). Previously, Ms. Small served as Chairperson of the Investment Committee (2002-2008) of Smith College. In addition, Ms. Small served as Chief Investment Officer, Director of Global Equity Investments, and a member of the Board of Directors of Scudder, Stevens & Clark and Scudder Kemper Investments. |
William S. Stavropoulos (71) |
| Year of Election or Appointment: 2001 Mr. Stavropoulos is Vice Chairman of the Independent Trustees of the Equity and High Income Funds (2006-present). Mr. Stavropoulos serves as President and Founder of the Michigan Baseball Foundation, the Great Lakes Loons (2007-present). Mr. Stavropoulos is Chairman Emeritus of the Board of Directors of The Dow Chemical Company, where he previously served in numerous senior management positions, including President, CEO (1995-2000; 2002-2004), Chairman of the Executive Committee (2000-2006), and as a member of the Board of Directors (1990-2006). Currently, Mr. Stavropoulos is Chairman of Univar (global distributor of commodity and specialty chemicals, 2010-present), a Director of Teradata Corporation (data warehousing and technology solutions, 2008-present), Chemical Financial Corporation, Maersk Inc. (industrial conglomerate), Tyco International, Inc. (multinational manufacturing and services, 2007-present), and a member of the Advisory Board for Metalmark Capital (private equity investment, 2005-present). Mr. Stavropoulos is a special advisor to Clayton, Dubilier & Rice, Inc. (private equity investment). In addition, Mr. Stavropoulos is a member of the University of Notre Dame Advisory Council for the College of Science. |
David M. Thomas (61) |
| Year of Election or Appointment: 2008 Previously, Mr. Thomas served as Executive Chairman (2005-2006) and Chairman and Chief Executive Officer (2000-2005) of IMS Health, Inc. (pharmaceutical and healthcare information solutions). In addition, Mr. Thomas serves as a member of the Board of Directors of Fortune Brands, Inc. (consumer products), and Interpublic Group of Companies, Inc. (marketing communication, 2004-present). |
Michael E. Wiley (60) |
| Year of Election or Appointment: 2008 Mr. Wiley also serves as a Director of Asia Pacific Exploration Consolidated (international oil and gas exploration and production, 2008-
present). Mr. Wiley serves as a Director of Tesoro Corporation (independent oil refiner and marketer, 2005-present), and a Director of Bill Barrett Corporation (exploration and production, 2005-present). In addition, Mr. Wiley also serves as a Director of Post Oak Bank (privately-held bank, 2004-present). Previously, Mr. Wiley served as a member of the Board of Trustees of the University of Tulsa (2000-2006; 2007-2010), as a Senior Energy Advisor of Katzenbach Partners, LLC (consulting, 2006-2007), as an Advisory Director of Riverstone Holdings (private investment), Chairman, President, and CEO of Baker Hughes, Inc. (oilfield services, 2000- 2004), and as Director of Spinnaker Exploration Company (exploration and production, 2001-2005). |
Annual Report
Trustees and Officers - continued
+ The information above includes each Trustee's principal occupation during the last five years and other information relating to the experience, attributes, and skills relevant to each Trustee's qualifications to serve as a Trustee, which led to the conclusion that each Trustee should serve as a Trustee for the fund.
Advisory Board Member and Executive Officers:
Correspondence intended for each executive officer and Peter S. Lynch may be sent to Fidelity Investments, 82 Devonshire Street, Boston, Massachusetts 02109.
Name, Age; Principal Occupation |
Peter S. Lynch (66) |
| Year of Election or Appointment: 2003 Member of the Advisory Board of Fidelity's Equity and High Income Funds. Mr. Lynch is Vice Chairman and a Director of FMR and FMR Co., Inc. In addition, Mr. Lynch serves as a Trustee of Boston College and as the Chairman of the Inner-City Scholarship Fund. Previously, Mr. Lynch served on the Special Olympics International Board of Directors (1997-2006). |
Kenneth B. Robins (41) |
| Year of Election or Appointment: 2008 President and Treasurer of Fidelity's Equity and High Income Funds. Mr. Robins also serves as President and Treasurer (2010-present) and Assistant Treasurer (2009-present) of other Fidelity funds and is an employee of Fidelity Investments (2004-present). Previously, Mr. Robins served as Deputy Treasurer of the Fidelity funds (2005-2008) and Treasurer and Chief Financial Officer of The North Carolina Capital Management Trust: Cash and Term Portfolios (2006-2008). |
Thomas C. Hense (46) |
| Year of Election or Appointment: 2008 or 2010 Vice President of Fidelity's High Income (2008), Small Cap (2008), and Value (2010) Funds. Previously, Mr. Hense served as a portfolio manager for Fidelity's Institutional Money Management Group (Pyramis) (2003-2008). |
Brian B. Hogan (46) |
| Year of Election or Appointment: 2009 Vice President of certain Equity Funds and Vice President of Sector Funds. Mr. Hogan also serves as President of FMR's Equity Division (2009-present). Previously, Mr. Hogan served as Senior Vice President, Equity Research of FMR (2006-2009) and as a portfolio manager. |
Scott C. Goebel (42) |
| Year of Election or Appointment: 2008 Secretary and Chief Legal Officer (CLO) of the Fidelity funds. Mr. Goebel also serves as Secretary and CLO of The North Carolina Capital Management Trust: Cash and Term Portfolio (2008-present); General Counsel, Secretary, and Senior Vice President of FMR (2008-present) and FMR Co., Inc. (2008-present); Deputy General Counsel of FMR LLC; Chief Legal Officer of Fidelity Management & Research (Hong Kong) Limited (2008-present) and Assistant Secretary of Fidelity Management & Research (Japan) Inc. (2008-present), Fidelity Investments Money Management, Inc. (2008-present), Fidelity Management & Research (U.K.) Inc. (2008-present), and Fidelity Research and Analysis Company (2008- present). Previously, Mr. Goebel served as Assistant Secretary of the Funds (2007-2008) and as Vice President and Secretary of Fidelity Distributors Corporation (FDC) (2005-2007). |
William C. Coffey (41) |
| Year of Election or Appointment: 2009 Assistant Secretary of Fidelity's Equity and High Income Funds. Mr. Coffey also serves as Senior Vice President and Deputy General Counsel of FMR LLC (2010-present), and is an employee of Fidelity Investments. Previously, Mr. Coffey served as Vice President and Associate General Counsel of FMR LLC (2005-2009). |
Holly C. Laurent (56) |
| Year of Election or Appointment: 2008 Anti-Money Laundering (AML) Officer of the Fidelity funds. Ms. Laurent also serves as AML Officer of The North Carolina Capital Management Trust: Cash and Term Portfolio (2008-present) and is an employee of Fidelity Investments. Previously, Ms. Laurent was Senior Vice President and Head of Legal for Fidelity Business Services India Pvt. Ltd. (2006- 2008), and Senior Vice President, Deputy General Counsel and Group Head for FMR LLC (2005-2006). |
Christine Reynolds (52) |
| Year of Election or Appointment: 2008 Chief Financial Officer of the Fidelity funds. Ms. Reynolds became President of Fidelity Pricing and Cash Management Services (FPCMS) in August 2008. Ms. Reynolds served as Chief Operating Officer of FPCMS (2007-2008). Previously, Ms. Reynolds served as President, Treasurer, and Anti-Money Laundering officer of the Fidelity funds (2004-2007). |
Kenneth A. Rathgeber (63) |
| Year of Election or Appointment: 2004 Chief Compliance Officer of Fidelity's Equity and High Income Funds. Mr. Rathgeber is Chief Compliance Officer of Fidelity Management & Research (Hong Kong) Limited (2008-present), Fidelity Management & Research (Japan) Inc. (2008-present), FMR (2005-present), FMR Co., Inc. (2005-present), Fidelity Management & Research (U.K.) Inc. (2005-present), Fidelity Research & Analysis Company (2005-present), Fidelity Investments Money Management, Inc. (2005-present), Pyramis Global Advisors, LLC (2005-present), and Strategic Advisers, Inc. (2005-present). |
Jeffrey S. Christian (49) |
| Year of Election or Appointment: 2009 Deputy Treasurer of the Fidelity funds. Mr. Christian is an employee of Fidelity Investments. Previously, Mr. Christian served as Chief Financial Officer (2008-2009) of certain Fidelity funds and Senior Vice President of Fidelity Pricing and Cash Management Services (FPCMS) (2004-2009). |
Bryan A. Mehrmann (49) |
| Year of Election or Appointment: 2005 Deputy Treasurer of the Fidelity funds. Mr. Mehrmann is an employee of Fidelity Investments. |
Adrien E. Deberghes (43) |
| Year of Election or Appointment: 2008 Deputy Treasurer of Fidelity's Equity and High Income Funds. Mr. Deberghes also serves as Assistant Treasurer of other Fidelity funds (2010-present) and is an employee of Fidelity Investments (2008-
present). Previously, Mr. Deberghes served as Senior Vice President of Mutual Fund Administration at State Street Corporation (2007-2008), Senior Director of Mutual Fund Administration at Investors Bank & Trust (2005-2007), and Director of Finance for Dunkin' Brands (2000-2005). |
Stephanie J. Dorsey (41) |
| Year of Election or Appointment: 2010 Assistant Treasurer of Fidelity's Equity and High Income Funds. Ms. Dorsey also serves as Deputy Treasurer of other Fidelity funds (2008-present) and is an employee of Fidelity Investments (2008-present). Previously, Ms. Dorsey served as Treasurer (2004-2008) of the JPMorgan Mutual Funds and Vice President (2004-2008) of JPMorgan Chase Bank. |
John R. Hebble (52) |
| Year of Election or Appointment: 2009 Assistant Treasurer of Fidelity's Equity and High Income Funds. Mr. Hebble also serves as Treasurer and Chief Financial Officer of The North Carolina Capital Management Trust: Cash and Term Portfolio (2008-present), President and Treasurer of other Fidelity funds (2008-present) and is an employee of Fidelity Investments. |
Gary W. Ryan (52) |
| Year of Election or Appointment: 2005 Assistant Treasurer of the Fidelity funds. Mr. Ryan is an employee of Fidelity Investments. Previously, Mr. Ryan served as Vice President of Fund Reporting in Fidelity Pricing and Cash Management Services (FPCMS) (1999-2005). |
Jonathan Davis (42) |
| Year of Election or Appointment: 2010 Assistant Treasurer of the Fidelity funds. Mr. Davis is an employee of Fidelity Investments. Previously, Mr. Davis served as Vice President and Associate General Counsel of FMR LLC (2003-2010). |
Annual Report
The Board of Trustees of Advisor International Small Cap Opportunities Fund voted to pay to shareholders of record at the opening of business on record date, the following distributions per share derived from capital gains realized from sales of portfolio securities, and dividends derived from net investment income:
| Pay Date | Record Date | Dividends | Capital Gains |
Class A | 12/06/10 | 12/03/10 | $0.056 | $0.04 |
Class T | 12/06/10 | 12/03/10 | $0.025 | $0.04 |
Class B | 12/06/10 | 12/03/10 | $0.00 | $0.015 |
Class C | 12/06/10 | 12/03/10 | $0.00 | $0.015 |
Class A designates 52%, Class T designates 57%, Class B designates 68%, and Class C designates 68% of the dividends distributed in during the fiscal year as amounts which may be taken into account as a dividend for the purposes of the maximum rate under section 1(h)(11) of the Internal Revenue Code.
The amounts per share which represent income derived from sources within, and taxes paid to, foreign countries or possessions of the United States are as follows:
| Pay Date | Income | Taxes |
Class A | 12/07/09 | $0.076 | $0.0064 |
Class T | 12/07/09 | $0.069 | $0.0064 |
Class B | 12/07/09 | $0.058 | $0.0064 |
Class C | 12/07/09 | $0.058 | $0.0064 |
The fund will notify shareholders in January 2011 of amounts for use in preparing 2010 income tax returns.
Annual Report
Board Approval of Investment Advisory Contracts and Management Fees
Fidelity International Small Cap Opportunities Fund
Each year, the Board of Trustees, including the Independent Trustees (together, the Board), votes on the renewal of the management contract and sub-advisory agreements (together, the Advisory Contracts) for the fund. The Board, assisted by the advice of fund counsel and Independent Trustees' counsel, requests and considers a broad range of information relevant to the renewal of the Advisory Contracts throughout the year.
The Board meets regularly and considers at each of its meetings factors that are relevant to its annual consideration of the renewal of the fund's Advisory Contracts, including the services and support provided to the fund and its shareholders. The Board has established various standing committees, each composed of Independent Trustees with varying backgrounds, to which the Board has assigned specific subject matter responsibilities in order to enhance effective decision-making by the Board. The Board, acting directly and through its Committees, requests and receives information concerning the annual consideration of the renewal of the fund's Advisory Contracts. The Board also meets as needed to consider matters specifically related to the Board's annual consideration of the renewal of Advisory Contracts. Members of the Board may also meet with trustees of other Fidelity funds through ad hoc joint committees to discuss certain matters relevant to the Fidelity funds.
At its July 2010 meeting, the Board of Trustees, including the Independent Trustees, unanimously determined to renew the fund's Advisory Contracts. In reaching its determination, the Board considered all factors it believed relevant, including (i) the nature, extent, and quality of the services to be provided to the fund and its shareholders (including the investment performance of the fund); (ii) the competitiveness of the fund's management fee and total expenses; (iii) the total costs of the services to be provided by and the profits to be realized by Fidelity from its relationship with the fund; (iv) the extent to which economies of scale would be realized as the fund grows; and (v) whether fee levels reflect these economies of scale, if any, for the benefit of fund shareholders.
In considering whether to renew the Advisory Contracts for the fund, the Board reached a determination, with the assistance of fund counsel and Independent Trustees' counsel and through the exercise of its business judgment, that the renewal of the Advisory Contracts is in the best interests of fund shareholders and that the compensation to be received by Fidelity under the management contract is fair and reasonable. The Board's decision to renew the Advisory Contracts was not based on any single factor noted above, but rather was based on a comprehensive consideration of all the information provided to the Board at its meetings throughout the year. The Board, in reaching its determination to renew the Advisory Contracts, is aware that shareholders in the fund have a broad range of investment choices available to them, including a wide choice among mutual funds offered by Fidelity's competitors, and that the fund's shareholders, with the opportunity to review and weigh the disclosure provided by the fund in its prospectus and other public disclosures, have chosen to invest in this fund, managed by Fidelity.
Annual Report
Nature, Extent, and Quality of Services Provided. The Board considered the staffing within the investment adviser, FMR, and the sub-advisers (together, the Investment Advisers), including the backgrounds of the fund's investment personnel and the fund's investment objective and discipline. The Independent Trustees also had discussions with senior management of Fidelity's investment operations and investment groups. The Board considered the structure of the portfolio manager compensation program and whether this structure provides appropriate incentives to act in the best interest of the fund.
Resources Dedicated to Investment Management and Support Services. The Board and the equity research subcommittee of the Board's Fund Oversight Committee reviewed the size, education, and experience of the Investment Advisers' investment staff, their use of technology, and the Investment Advisers' approach to recruiting, training, and retaining portfolio managers and other research, advisory, and management personnel. The Board noted that Fidelity's analysts have access to a variety of technological tools and market and securities data that enable them to perform both fundamental and quantitative analysis and to specialize in various disciplines. The Board considered Fidelity's extensive global research capabilities that enable the Investment Advisers to aggregate data from various sources in an effort to produce positive investment results. The Board also considered that Fidelity's portfolio managers and analysts have access to daily portfolio attribution that allows for monitoring of a fund's portfolio, as well as an electronic communication system that provides immediate real-time access to research concerning issuers and credit enhancers. The Board noted FMR's continued focus on strengthening the organization and discipline of equity portfolio management and research.
Shareholder and Administrative Services. The Board considered (i) the nature, extent, quality, and cost of advisory, administrative, and shareholder services performed by the Investment Advisers and their affiliates under the Advisory Contracts and under separate agreements covering transfer agency, pricing and bookkeeping, and securities lending services for the fund; (ii) the nature and extent of the investment adviser's supervision of third party service providers, principally custodians and subcustodians; and (iii) the resources devoted to, and the record of compliance with, the fund's compliance policies and procedures. The Board also reviewed the allocation of fund brokerage, including allocations to brokers affiliated with the Investment Advisers, the use of brokerage commissions to pay fund expenses, and the use of "soft" commission dollars to pay for research services.
The Board noted that the growth of fund assets over time across the complex allows Fidelity to reinvest in the development of services designed to enhance the value or convenience of the Fidelity funds as investment vehicles. These services include 24-hour access to account information and market information through phone representatives and over the Internet, and investor education materials and asset allocation tools.
Annual Report
Board Approval of Investment Advisory Contracts and
Management Fees - continued
Investment in a Large Fund Family. The Board considered the benefits to shareholders of investing in a Fidelity fund, including the benefits of investing in a fund that is part of a large family of funds offering a variety of investment disciplines and providing a large variety of mutual fund investor services. The Board noted that Fidelity had taken, or had made recommendations that resulted in the Fidelity funds taking, a number of actions over the previous year that benefited particular funds, including (i) dedicating additional resources to investment research and restructuring and broadening the focus of the investment research teams; (ii) bolstering the senior management team that oversees asset management; (iii) launching Class F of certain funds as a lower-fee class available to Freedom K and Freedom Index Funds; (iv) lowering the initial investment minimums and ongoing balance requirements for Real Estate High Income Fund; (v) eliminating subsequent purchase minimums for all funds and adding a waiver of the investment minimum requirement for new accounts opened with the proceeds of a systematic withdrawal plan; (vi) eliminating the withdrawal minimum and maximum limits for systematic withdrawals from Advisor funds; (vii) expanding sales load waivers on Class A shares for Destiny Planholders and expanding Institutional Class eligibility for Class O Destiny Planholders; and (viii) changing certain Class A and Class T sales charge structures to further align them with industry practices.
Investment Performance. The Board considered whether the fund has operated in accordance with its investment objective, as well as its record of compliance with its investment restrictions. It also reviewed the fund's absolute investment performance for each class, as well as the fund's relative investment performance for each class measured over multiple periods against (i) a broad-based securities market index, and (ii) a peer group of mutual funds deemed appropriate by Fidelity and reviewed by the Board. Because the fund had been in existence less than five calendar years, the following charts considered by the Board show, over the one- and three-year periods ended December 31, 2009, the cumulative total returns of Institutional Class (Class I) and Class B of the fund, the cumulative total returns of a broad-based securities market index ("benchmark"), and a range of cumulative total returns of a peer group of mutual funds identified by Lipper Inc. as having an investment objective similar to that of the fund. The returns of Institutional Class (Class I) and Class B show the performance of the highest and lowest performing classes, respectively (based on three-year performance). The box within each chart shows the 25th percentile return (bottom of box) and the 75th percentile return (top of box) of the peer group. Returns shown above the box are in the first quartile and returns shown below the box are in the fourth quartile. The percentage beaten numbers noted below each chart correspond to the percentile box and represent the percentage of funds in the peer group whose performance was equal to or lower than that of the class indicated.
Annual Report
Fidelity International Small Cap Opportunities Fund

The Board reviewed the fund's relative investment performance against its peer group and noted that the performance of Institutional Class (Class I) of the fund was in the second quartile for the one-year period and the fourth quartile for the three-year period. The Board also noted that the investment performance of the fund was lower than its benchmark for all the periods shown. The Board considered that the variations in performance among the fund's classes reflect the variations in class expenses, which result in lower performance for higher expense classes. The Board also reviewed the fund's performance since inception as well as performance in the current year.
The Board also considered that the fund's management fee is subject to upward or downward adjustment depending upon whether, and to what extent, the fund's investment performance for the performance period exceeds, or is exceeded by, the record (over the same period) of a Board-approved performance adjustment index. The Board realizes that the performance adjustment provides FMR with a strong economic incentive to seek to achieve superior performance for the fund's shareholders and helps to more closely align the interests of FMR and the fund's shareholders.
Based on its review, and giving particular weight to the nature and quality of the resources dedicated by the Investment Advisers to maintain and improve relative performance and factoring in the unprecedented market events in recent years, the Board concluded that the nature, extent, and quality of investment management and support services and of shareholder and administrative services provided to the fund will benefit the fund's shareholders, particularly in light of the Board's view that the fund's shareholders benefit from investing in a fund that is part of a large family of funds offering a variety of investment disciplines and services.
Annual Report
Board Approval of Investment Advisory Contracts and
Management Fees - continued
Competitiveness of Management Fee and Total Fund Expenses. The Board considered the fund's management fee and total expenses compared to "mapped groups" of competitive funds and classes. Fidelity creates "mapped groups" by combining similar Lipper investment objective categories that have comparable management fee characteristics. Combining Lipper investment objective categories aids the Board's management fee and total expense comparisons by broadening the competitive group used for comparison and by reducing the number of universes to which various Fidelity funds are compared.
Management Fee. The Board considered two proprietary management fee comparisons for the 12-month (or shorter) periods shown in the chart below. The group of Lipper funds used by the Board for management fee comparisons is referred to below as the "Total Mapped Group." The Total Mapped Group is broader than the Lipper peer group used by the Board for performance comparisons because the Total Mapped Group combines several Lipper investment objective categories while the Lipper peer group does not. The Total Mapped Group comparison focuses on a fund's standing relative to the total universe of comparable funds available to investors, in terms of gross management fees before expense reimbursements or caps, and without giving effect to the fund's performance adjustment. "TMG %" represents the percentage of funds in the Total Mapped Group that had management fees that were lower than the fund's. For example, a TMG % of 19% means that 81% of the funds in the Total Mapped Group had higher management fees than the fund. The "Asset-Size Peer Group" (ASPG) comparison focuses on a fund's standing relative to non-Fidelity funds similar in size to the fund within the Total Mapped Group. The ASPG represents at least 15% of the funds in the Total Mapped Group with comparable asset size and management fee characteristics, subject to a minimum of 50 funds (or all funds in the Total Mapped Group if fewer than 50). Additional information, such as the ASPG quartile in which the fund's management fee ranked and the impact of the fund's performance adjustment, is also included in the chart and considered by the Board.
Annual Report
Fidelity International Small Cap Opportunities Fund
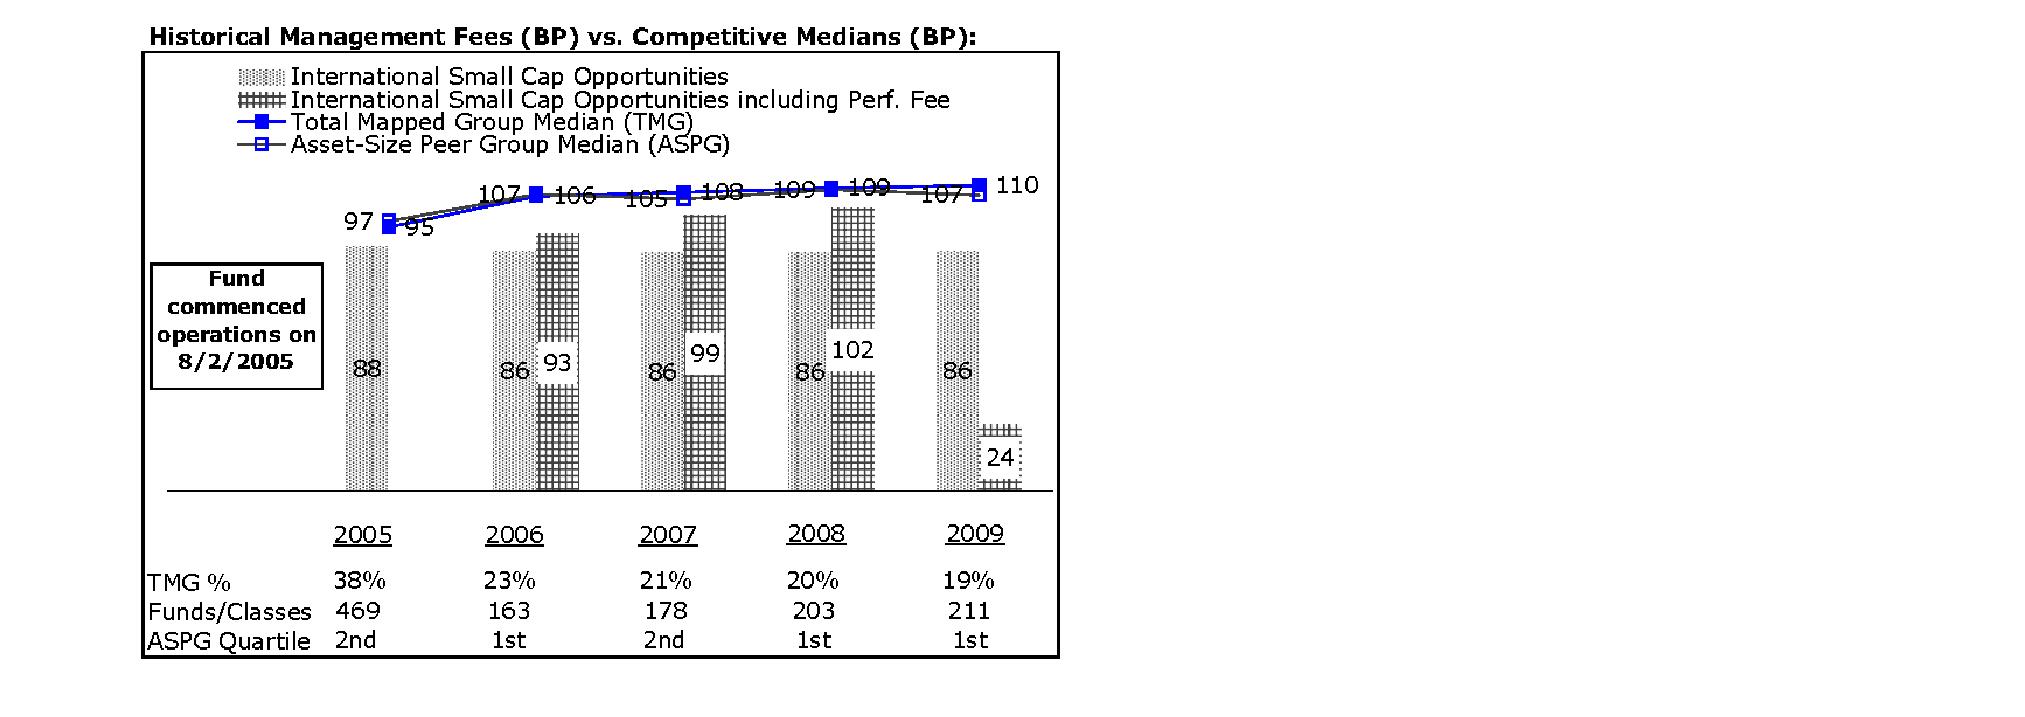
The Board noted that the fund's management fee ranked below the median of its Total Mapped Group and below the median of its ASPG for 2009. The Board also noted the effect of the fund's negative performance adjustment on the fund's management fee ranking. The Board noted that the performance adjustment for each year represents calculations for performance periods that differ from the periods shown in the performance charts above.
Based on its review, the Board concluded that the fund's management fee is fair and reasonable in light of the services that the fund receives and the other factors considered.
Total Expenses. In its review of each class's total expenses, the Board considered the fund's management fee as well as other fund or class expenses, as applicable, such as transfer agent fees, pricing and bookkeeping fees, fund-paid 12b-1 fees, and custodial, legal, and audit fees. The Board also noted the effects of any waivers and reimbursements on fees and expenses, as well as the impact of the fund's performance adjustment. As part of its review, the Board also considered current and historical total expenses of each class of the fund compared to competitive fund median expenses. Each class of the fund is compared to those funds and classes in the Total Mapped Group (used by the Board for management fee comparisons) that have a similar sales load structure.
The Board noted that the total expenses of each class ranked below its competitive median for 2009.
Annual Report
Board Approval of Investment Advisory Contracts and
Management Fees - continued
Fees Charged to Other Fidelity Clients. The Board also considered Fidelity fee structures and other information with respect to clients of FMR and its affiliates, such as other mutual funds advised or subadvised by FMR or its affiliates, pension plan clients, and other institutional clients. In March 2010, the Board created an ad hoc joint committee with the board of other Fidelity funds (the Committee) to review and compare Fidelity's institutional investment advisory business with its business of providing services to the Fidelity funds, including the differences in services provided, fees charged, and costs incurred, as well as competition in their respective marketplaces.
Based on its review of total expenses and fees charged to other Fidelity clients, the Board concluded that the total expenses of each class of the fund were reasonable in light of the services that the fund and its shareholders receive and the other factors considered, including the findings of the Committee.
Costs of the Services and Profitability. The Board considered the revenues earned and the expenses incurred by Fidelity in conducting the business of developing, marketing, distributing, managing, administering and servicing the fund and its shareholders. The Board also considered the level of Fidelity's profits in respect of all the Fidelity funds.
On an annual basis, FMR presents to the Board Fidelity's profitability for the fund. Fidelity calculates the profitability for each fund, as well as aggregate profitability for groups of Fidelity funds and all Fidelity funds, using a series of detailed revenue and cost allocation methodologies which originate with the audited books and records of Fidelity. The Audit Committee of the Board reviews any significant changes from the prior year's methodologies.
PricewaterhouseCoopers LLP (PwC), independent registered public accounting firm and auditor to Fidelity and certain Fidelity funds, has been engaged annually by the Board as part of the Board's assessment of Fidelity's profitability analysis. PwC's engagement includes the review and assessment of Fidelity's methodologies used in determining the revenues and expenses attributable to Fidelity's mutual fund business, and completion of agreed-upon procedures surrounding the mathematical accuracy of fund profitability and its conformity to allocation methodologies. After considering PwC's reports issued under the engagement and information provided by Fidelity, the Board believes that while other allocation methods may also be reasonable, Fidelity's profitability methodologies are reasonable in all material respects.
The Board has also reviewed Fidelity's non-fund businesses and fall-out benefits related to the mutual fund business as well as cases where Fidelity's affiliates may benefit from or be related to the fund's business.
Annual Report
The Board considered the costs of the services provided by and the profits realized by Fidelity in connection with the operation of the fund and were satisfied that the profitability was not excessive in the circumstances.
Economies of Scale. The Board considered whether there have been economies of scale in respect of the management of the Fidelity funds, whether the Fidelity funds (including the fund) have appropriately benefited from any such economies of scale, and whether there is potential for realization of any further economies of scale. The Board considered the extent to which the fund will benefit from economies of scale through increased services to the fund, through waivers or reimbursements, or through fee or expense reductions.
In February 2009, the Board and the board of other Fidelity funds created an ad hoc committee (the Economies of Scale Committee) to analyze whether FMR attains economies of scale in respect of the management and servicing of the Fidelity funds, whether the Fidelity funds have appropriately benefited from such economies of scale, and whether there is potential for realization of any further economies of scale.
The Board recognized that the fund's management contract incorporates a "group fee" structure, which provides for lower group fee rates as total fund assets under FMR's management increase, and for higher group fee rates as total fund assets under FMR's management decrease. FMR calculates the group fee rates based on a tiered asset "breakpoint" schedule that varies based on asset class. The Board considered that the group fee is designed to deliver the benefits of economies of scale to fund shareholders when total Fidelity fund assets increase, even if assets of any particular fund are unchanged or have declined, because some portion of Fidelity's costs are attributable to services provided to all Fidelity funds, and all funds benefit if those costs can be allocated among more assets. The Board concluded that, given the group fee structure, fund shareholders will benefit from lower management fees as assets under FMR's management increase at the fund complex level, regardless of whether Fidelity achieves any such economies of scale.
The Board concluded, considering the findings of the Economies of Scale Committee, that any potential economies of scale are being appropriately shared between fund shareholders and Fidelity.
Additional Information Requested by the Board. In order to develop fully the factual basis for consideration of the Fidelity funds' Advisory Contracts, the Board requested and received additional information on certain topics, including (i) fund performance trends, actions to be taken by FMR to improve certain funds' overall performance, and Fidelity's long-term strategies for certain funds; (ii) portfolio manager changes that have occurred during the past year and length of portfolio manager tenure for different categories of funds over time; (iii) Fidelity's compensation structure for portfolio managers, research analysts, and other key personnel, the rationale for the compensation structure, and how the compensation structure provides appropriate performance incentives; (iv) the amount of the investment that each portfolio manager has made in the Fidelity fund(s) that he or she manages; (v) management and other fees paid by FMR to affiliated sub-advisers on behalf of the Fidelity funds; (vi) Fidelity's fee structures and rationale for recommending different fees among different categories of funds; (vii) Fidelity's rationale for recommending which funds should have a performance adjustment component as part of their management fees; (viii) the rationale for any differences between fund fee structures and fee structures in place for other Fidelity clients; and (ix) explanations regarding the relative total expenses borne by certain funds and classes, total expense competitive trends, and actions that might be taken by FMR to reduce total expenses for certain funds and classes.
Annual Report
Board Approval of Investment Advisory Contracts and
Management Fees - continued
Based on its evaluation of all of the conclusions noted above, and after considering all factors it believed relevant, the Board ultimately concluded that the advisory fee structures are fair and reasonable, and that the fund's Advisory Contracts should be renewed.
Annual Report
Investment Adviser
Fidelity Management & Research Company
Boston, MA
Investment Sub-Advisers
FMR Co., Inc.
Fidelity Management & Research
(Hong Kong) Limited
Fidelity Management & Research
(Japan) Inc.
Fidelity Management & Research
(U.K.) Inc.
Fidelity Research & Analysis Company
FIL Investment Advisors
FIL Investments (Japan) Limited
FIL Investment Advisors (U.K.) Limited
General Distributor
Fidelity Distributors Corporation
Boston, MA
Transfer and Service Agents
Fidelity Investments Institutional
Operations Company, Inc.
Boston, MA
Fidelity Service Company, Inc.
Boston, MA
Custodian
The Northern Trust Company
Chicago, IL
AILS-UANN-1210
1.815089.105
(Fidelity Investment logo)(registered trademark)
Fidelity AdvisorSM
International Small Cap Opportunities
Fund - Institutional Class
Annual Report
October 31, 2010
Institutional Class
is a class of Fidelity®
International Small Cap
Opportunities Fund
(2_fidelity_logos) (Registered_Trademark)
Contents
Chairman's Message | <Click Here> | The Chairman's message to shareholders. |
Performance | <Click Here> | How the fund has done over time. |
Management's Discussion of Fund Performance | <Click Here> | The Portfolio Manager's review of fund performance and strategy. |
Shareholder Expense Example | <Click Here> | An example of shareholder expenses. |
Investment Changes | <Click Here> | A summary of major shifts in the fund's investments over the past six months. |
Investments | <Click Here> | A complete list of the fund's investments with their market values. |
Financial Statements | <Click Here> | Statements of assets and liabilities, operations, and changes in net assets, as well as financial highlights. |
Notes | <Click Here> | Notes to the financial statements. |
Report of Independent Registered Public Accounting Firm | <Click Here> | |
Trustees and Officers | <Click Here> | |
Distributions | <Click Here> | |
Board Approval of Investment Advisory Contracts and Management Fees | <Click Here> | |
To view a fund's proxy voting guidelines and proxy voting record for the 12-month period ended June 30, visit http://www.fidelity.com/proxyvotingresults or visit the Securities and Exchange Commission's (SEC) web site at http://www.sec.gov. You may also call 1-877-208-0098 to request a free copy of the proxy voting guidelines.
Standard & Poor's, S&P and S&P 500 are registered service marks of The McGraw-Hill Companies, Inc. and have been licensed for use by Fidelity Distributors Corporation.
Other third party marks appearing herein are the property of their respective owners.
All other marks appearing herein are registered or unregistered trademarks or service marks of FMR LLC or an affiliated company.
Annual Report
This report and the financial statements contained herein are submitted for the general information of the shareholders of the fund. This report is not authorized for distribution to prospective investors in the fund unless preceded or accompanied by an effective prospectus.
A fund files its complete schedule of portfolio holdings with the SEC for the first and third quarters of each fiscal year on Form N-Q. Forms N-Q are available on the SEC's web site at http://www.sec.gov. A fund's Forms N-Q may be reviewed and copied at the SEC's Public Reference Room in Washington, DC. Information regarding the operation of the SEC's Public Reference Room may be obtained by calling 1-800-SEC-0330. For a complete list of a fund's portfolio holdings, view the most recent holdings listing, semiannual report, or annual report on Fidelity's web site at http://www.fidelity.com or http://www.advisor.fidelity.com, as applicable.
NOT FDIC INSURED • MAY LOSE VALUE • NO BANK GUARANTEE
Neither the fund nor Fidelity Distributors Corporation is a bank.
Annual Report
(photo_of_Edward_C_Johnson_3d)
Dear Shareholder:
Equities have staged a rally in the second half of 2010, shaking off concerns about the European debt crisis and the possibility of a double-dip recession in the U.S. Although the short-term surge pushed major equity indexes back into positive territory for the year, several questions remain about the longer-term outlook, including lackluster economic growth and persistently high unemployment. Financial markets are always unpredictable, of course, but there also are several time-tested investment principles that can help put the odds in your favor.
One of the basic tenets is to invest for the long term. Over time, riding out the markets' inevitable ups and downs has proven much more effective than selling into panic or chasing the hottest trend. Even missing only a few of the markets' best days can significantly diminish investor returns. Patience also affords the benefits of compounding - of earning interest on additional income or reinvested dividends and capital gains. There can be tax advantages and cost benefits to consider as well. While staying the course doesn't eliminate risk, it can considerably lessen the effect of short-term declines.
You can further manage your investing risk through diversification. And today, more than ever, geographic diversification should be taken into account. Studies indicate that asset allocation is the single most important determinant of a portfolio's long-term success. The right mix of stocks, bonds and cash - aligned to your particular risk tolerance and investment objective - is very important. Age-appropriate rebalancing is also an essential aspect of asset allocation. For younger investors, an emphasis on equities - which historically have been the best-performing asset class over time - is encouraged. As investors near their specific goal, such as retirement or sending a child to college, consideration may be given to replacing volatile assets (e.g. common stocks) with more-stable fixed investments (bonds or savings plans).
A third principle - investing regularly - can help lower the average cost of your purchases. Investing a certain amount of money each month or quarter helps ensure you won't pay for all your shares at market highs. This strategy - known as dollar cost averaging - also reduces "emotion" from investing, helping shareholders avoid selling weak performers just prior to an upswing, or chasing a hot performer just before a correction.
We invite you to contact us via the Internet, through our Investor Centers or by phone. It is our privilege to provide you the information you need to make the investments that are right for you.
Sincerely,
(The chairman's signature appears here.)
Edward C. Johnson 3d
Annual Report
Average annual total return reflects the change in the value of an investment, assuming reinvestment of the class' distributions from dividend income and capital gains (the profits earned upon the sale of securities that have grown in value, if any) and assuming a constant rate of performance each year. The $10,000 table and the fund's returns do not reflect the deduction of taxes that a shareholder would pay on fund distributions or the redemption of fund shares. During periods of reimbursement by Fidelity, a fund's total return will be greater than it would be had the reimbursement not occurred. How a fund did yesterday is no guarantee of how it will do tomorrow.
Average Annual Total Returns
Periods ended October 31, 2010 | Past 1
year | Past 5
years | Life of
fund A |
Institutional Class | 24.33% | 1.89% | 2.57% |
A From August 2, 2005.
$10,000 Over Life of Class
Let's say hypothetically that $10,000 was invested in Fidelity AdvisorSM International Small Cap Opportunities Fund - Institutional Class on August 2, 2005, when the fund started. The chart shows how the value of your investment would have changed, and also shows how the MSCI® EAFE® Small Cap Index performed over the same period.
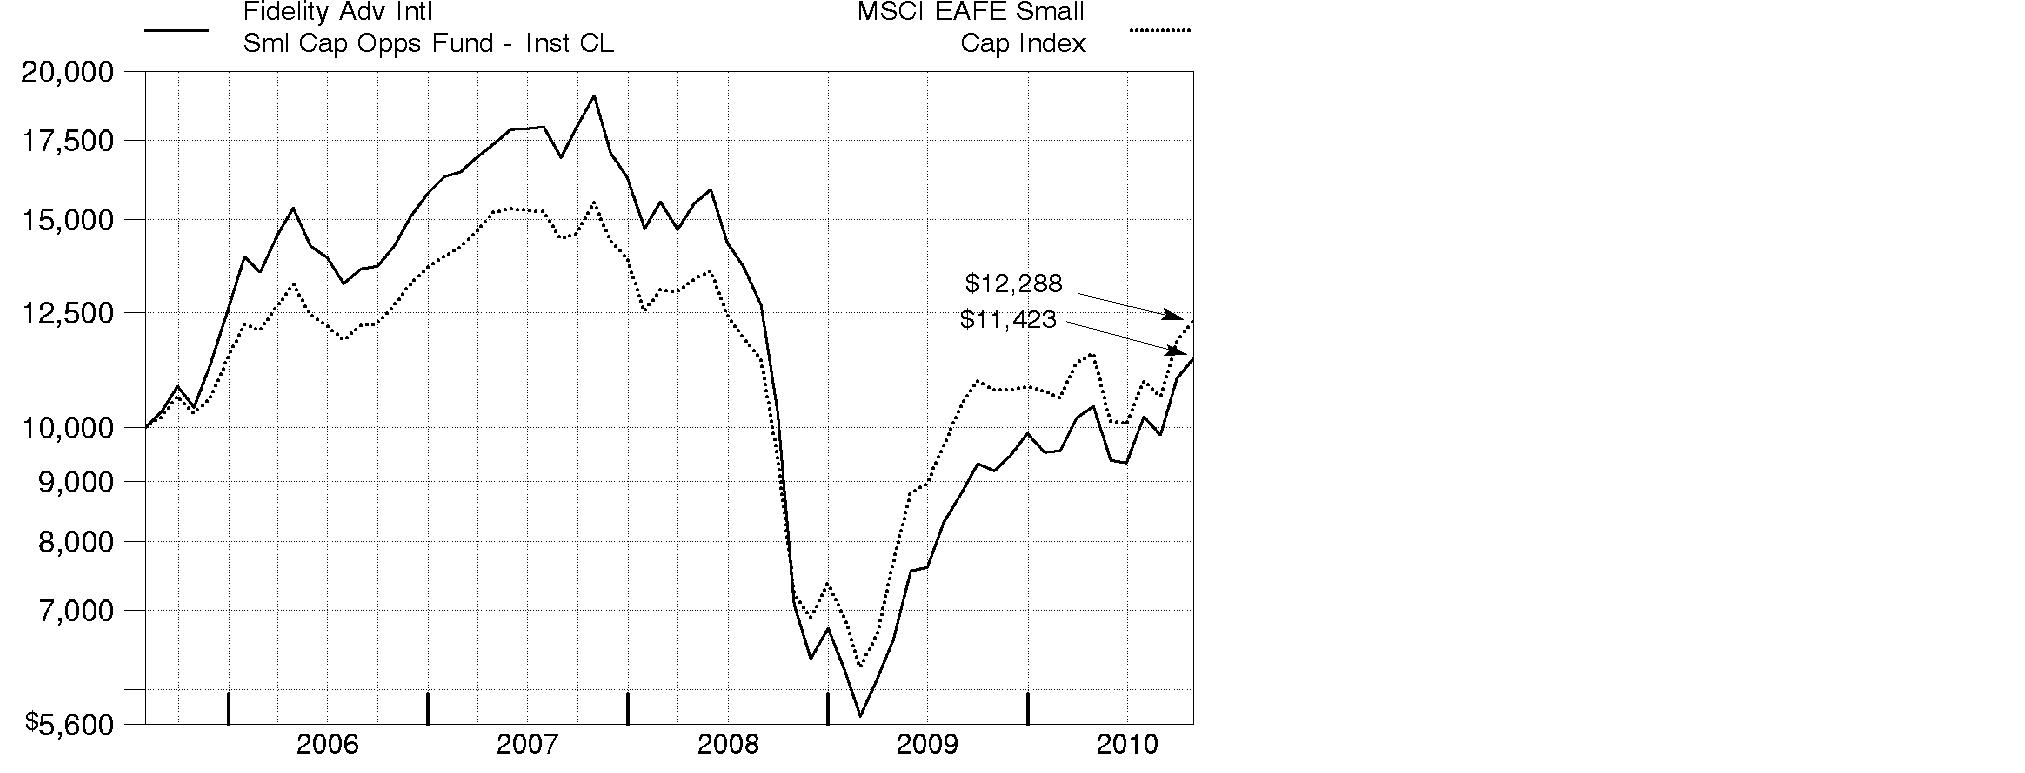
Annual Report
Market Recap: International stocks rode a wave of volatility similar to that of their U.S. counterparts during the 12 months ending October 31, 2010. Stocks gained modestly in the first half of the period, despite growing concerns about the European debt crisis. Sentiment turned decidedly negative in May and June, however, and the market suffered a precipitous decline. These losses were more than offset during the last four months of the period, when signs of economic growth and subsiding debt fears helped propel international stocks about 21%. For the full year, the MSCI® ACWI® (All Country World Index) ex USA Index gained 12.76%, boosted in part by a generally depreciating U.S. dollar. Within the index, Canada and emerging markets were standouts, returning 23% and 24%, respectively. Results in the latter group were led by strong-performing India, Mexico and South Africa, while China fell short of the MSCI benchmark due to cooling economic growth. The developed Asia ex Japan segment rose 16% for the period, lifted by solid results from Singapore and Hong Kong. Meanwhile, Europe rose just 9%, held back mainly by debt-riddled Spain and Italy, as well as lagging major constituent France. Japan returned only 5%, a result of that nation's continued weak economy.
Comments from Jed Weiss, Portfolio Manager of Fidelity AdvisorSM International Small Cap Opportunities Fund: For the year, the fund's Institutional Class shares returned 24.33%, significantly outpacing the 14.31% return of the MSCI EAFE® (Europe, Australasia, Far East) Small Cap Index. Stock picking was most favorable in consumer discretionary, industrials and consumer staples, while the fund's utilities holdings and a small cash position detracted modestly. In country terms, successful positioning in Japan and the U.S. contributed, as did security selection in various emerging markets, especially Brazil, Turkey and South Africa. In Europe, good security selection in Finland and the U.K. outweighed weakness in Switzerland. The fund's top individual contributor was SSL International, a U.K.-based health care products company I sold after it agreed to be acquired. Other contributors included out-of-index positions in U.S.-listed and Sweden-based auto-safety equipment maker Autoliv; PriceSmart, a California-based warehouse club retailer operating in Central America; Banco ABC Brasil, a Brazilian bank; and South African discount retailer Mr Price Group. The fund's three biggest detractors were all, to varying degrees, hurt by the European debt crisis last spring - Greek wind utility Terna Energy, Italian asset manager Azimut Holding and U.K.-based student-housing lender Unite Group.
The views expressed above reflect those of the portfolio manager(s) only through the end of the period as stated on the cover of this report and do not necessarily represent the views of Fidelity or any other person in the Fidelity organization. Any such views are subject to change at any time based upon market or other conditions and Fidelity disclaims any responsibility to update such views. These views may not be relied on as investment advice and, because investment decisions for a Fidelity fund are based on numerous factors, may not be relied on as an indication of trading intent on behalf of any Fidelity fund.
Annual Report
Shareholder Expense Example
As a shareholder of the Fund, you incur two types of costs: (1) transaction costs, including sales charges (loads) on purchase payments or redemption proceeds, redemption fees, and (2) ongoing costs, including management fees, distribution and/or service (12b-1) fees and other Fund expenses. This Example is intended to help you understand your ongoing costs (in dollars) of investing in the Fund and to compare these costs with the ongoing costs of investing in other mutual funds.
The Example is based on an investment of $1,000 invested at the beginning of the period and held for the entire period (May 1, 2010 to October 31, 2010).
Actual Expenses
The first line of the accompanying table for each class of the Fund provides information about actual account values and actual expenses. You may use the information in this line, together with the amount you invested, to estimate the expenses that you paid over the period. Simply divide your account value by $1,000.00 (for example, an $8,600 account value divided by $1,000.00 = 8.6), then multiply the result by the number in the first line for a class of the Fund under the heading entitled "Expenses Paid During Period" to estimate the expenses you paid on your account during this period. A small balance maintenance fee of $12.00 that is charged once a year may apply for certain accounts with a value of less than $2,000. This fee is not included in the table below. If it was, the estimate of expenses you paid during the period would be higher, and your ending account value lower, by this amount. In addition, the Fund, as a shareholder in the underlying Fidelity Central Funds, will indirectly bear its pro-rata share of the fees and expenses incurred by the underlying Fidelity Central Funds. These fees and expenses are not included in the Fund's annualized expense ratio used to calculate the expense estimate in the table below.
Hypothetical Example for Comparison Purposes
The second line of the accompanying table for each class of the Fund provides information about hypothetical account values and hypothetical expenses based on a Class' actual expense ratio and an assumed rate of return of 5% per year before expenses, which is not the Class' actual return. The hypothetical account values and expenses may not be used to estimate the actual ending account balance or expenses you paid for the period. You may use this information to compare the ongoing costs of investing in the Fund and other funds. To do so, compare this 5% hypothetical example with the 5% hypothetical examples that appear in the shareholder reports of the other funds. A small balance maintenance fee of $12.00 that is charged once a year may apply for certain accounts with a value of less than $2,000. This fee is not included in the table below. If it was, the estimate of expenses you paid during the period would be higher, and your ending account value lower, by this amount. In addition, the Fund, as a shareholder in the underlying Fidelity Central Funds, will indirectly bear its pro-rata share of the fees and expenses incurred by the underlying Fidelity Central Funds. These fees and expenses are not included in the Fund's annualized expense ratio used to calculate the expense estimate in the table below.
Annual Report
Please note that the expenses shown in the table are meant to highlight your ongoing costs only and do not reflect any transaction costs. Therefore, the second line of the table is useful in comparing ongoing costs only, and will not help you determine the relative total costs of owning different funds. In addition, if these transactional costs were included, your costs would have been higher.
| Annualized
Expense Ratio | Beginning
Account Value
May 1, 2010 | Ending
Account Value
October 31, 2010 | Expenses Paid
During Period*
May 1, 2010
to October 31, 2010 |
Class A | 1.23% | | | |
Actual | | $ 1,000.00 | $ 1,096.00 | $ 6.50 |
HypotheticalA | | $ 1,000.00 | $ 1,019.00 | $ 6.26 |
Class T | 1.49% | | | |
Actual | | $ 1,000.00 | $ 1,094.60 | $ 7.87 |
HypotheticalA | | $ 1,000.00 | $ 1,017.69 | $ 7.58 |
Class B | 1.98% | | | |
Actual | | $ 1,000.00 | $ 1,091.50 | $ 10.44 |
HypotheticalA | | $ 1,000.00 | $ 1,015.22 | $ 10.06 |
Class C | 1.98% | | | |
Actual | | $ 1,000.00 | $ 1,091.60 | $ 10.44 |
HypotheticalA | | $ 1,000.00 | $ 1,015.22 | $ 10.06 |
International Small Cap Opportunities | .97% | | | |
Actual | | $ 1,000.00 | $ 1,097.30 | $ 5.13 |
HypotheticalA | | $ 1,000.00 | $ 1,020.32 | $ 4.94 |
Institutional Class | .96% | | | |
Actual | | $ 1,000.00 | $ 1,097.20 | $ 5.07 |
HypotheticalA | | $ 1,000.00 | $ 1,020.37 | $ 4.89 |
A 5% return per year before expenses
* Expenses are equal to each Class' annualized expense ratio, multiplied by the average account value over the period, multiplied by 184/365 (to reflect the one-half year period).
Annual Report
Investment Changes (Unaudited)
Geographic Diversification (% of fund's net assets) |
As of October 31, 2010 |
| Japan 20.9% | |
| United Kingdom 16.1% | |
| United States of America 12.8% | |
| Canada 5.0% | |
| Brazil 4.1% | |
| Germany 3.7% | |
| France 3.5% | |
| South Africa 3.2% | |
| Finland 2.8% | |
| Other 27.9% | |

Percentages are adjusted for the effect of futures contracts, if applicable. |
As of April 30, 2010 |
| Japan 21.9% | |
| United Kingdom 17.7% | |
| United States of America 10.6% | |
| Canada 5.2% | |
| Brazil 3.9% | |
| Netherlands 3.8% | |
| France 3.2% | |
| South Africa 2.9% | |
| Singapore 2.8% | |
| Other 28.0% | |

Percentages are adjusted for the effect of futures contracts, if applicable. |
Asset Allocation |
| % of fund's
net assets | % of fund's net assets
6 months ago |
Stocks and Investment Companies | 97.7 | 98.7 |
Short-Term Investments and Net Other Assets | 2.3 | 1.3 |
Top Ten Stocks as of October 31, 2010 |
| % of fund's
net assets | % of fund's net assets
6 months ago |
USS Co. Ltd. (Japan, Specialty Retail) | 1.6 | 1.6 |
Osaka Securities Exchange Co. Ltd. (Japan, Diversified Financial Services) | 1.6 | 1.7 |
Braskem SA Class A sponsored ADR (Brazil, Chemicals) | 1.5 | 1.0 |
PriceSmart, Inc. (United States of America, Food & Staples Retailing) | 1.5 | 1.6 |
Kobayashi Pharmaceutical Co. Ltd. (Japan, Personal Products) | 1.5 | 1.3 |
Azimut Holdings SpA (Italy, Capital Markets) | 1.4 | 1.6 |
Prosegur Compania de Seguridad SA (Reg.) (Spain, Commercial Services & Supplies) | 1.3 | 1.2 |
Outotec OYJ (Finland, Construction & Engineering) | 1.3 | 1.2 |
Nippon Thompson Co. Ltd. (Japan, Machinery) | 1.3 | 1.4 |
Serco Group PLC (United Kingdom, Commercial Services & Supplies) | 1.3 | 1.2 |
| 14.3 | |
Market Sectors as of October 31, 2010 |
| % of fund's
net assets | % of fund's net assets
6 months ago |
Industrials | 20.8 | 20.2 |
Financials | 19.9 | 21.0 |
Consumer Discretionary | 17.1 | 17.6 |
Materials | 10.8 | 10.6 |
Consumer Staples | 8.5 | 8.0 |
Information Technology | 8.4 | 7.5 |
Health Care | 6.4 | 7.5 |
Energy | 5.4 | 5.6 |
Utilities | 0.4 | 0.5 |
Telecommunication Services | 0.0 | 0.2 |
Annual Report
Investments October 31, 2010
Showing Percentage of Net Assets
Common Stocks - 97.7% |
| Shares | | Value |
Australia - 1.0% |
MAp Group unit | 840,958 | | $ 2,512,726 |
OZ Minerals Ltd. | 1,167,654 | | 1,790,191 |
TOTAL AUSTRALIA | | 4,302,917 |
Austria - 0.8% |
Andritz AG | 44,600 | | 3,415,709 |
Bailiwick of Guernsey - 0.8% |
Resolution Ltd. | 860,273 | | 3,609,732 |
Bailiwick of Jersey - 1.3% |
Informa PLC | 530,236 | | 3,703,897 |
Randgold Resources Ltd. sponsored ADR | 23,600 | | 2,216,512 |
TOTAL BAILIWICK OF JERSEY | | 5,920,409 |
Belgium - 1.4% |
Gimv NV | 39,800 | | 2,200,236 |
Umicore SA | 89,474 | | 4,210,543 |
TOTAL BELGIUM | | 6,410,779 |
Bermuda - 2.0% |
Aquarius Platinum Ltd. (Australia) | 301,589 | | 1,734,301 |
Great Eagle Holdings Ltd. | 857,000 | | 2,565,057 |
Lazard Ltd. Class A | 25,000 | | 922,500 |
Seadrill Ltd. | 34,398 | | 1,041,456 |
Trinity Ltd. | 2,680,000 | | 2,679,568 |
TOTAL BERMUDA | | 8,942,882 |
Brazil - 4.1% |
Banco ABC Brasil SA | 535,300 | | 5,273,706 |
BR Malls Participacoes SA | 181,600 | | 1,734,658 |
Braskem SA Class A sponsored ADR (d) | 324,400 | | 6,763,740 |
Iguatemi Empresa de Shopping Centers SA | 39,800 | | 928,791 |
Multiplan Empreendimentos Imobiliarios SA | 47,800 | | 1,095,815 |
Odontoprev SA | 151,500 | | 2,226,370 |
TOTAL BRAZIL | | 18,023,080 |
Canada - 5.0% |
Agnico-Eagle Mines Ltd. (Canada) | 25,100 | | 1,946,671 |
Eldorado Gold Corp. | 104,600 | | 1,771,195 |
Fairfax Financial Holdings Ltd. (sub. vtg.) | 7,190 | | 2,941,069 |
Niko Resources Ltd. | 54,400 | | 5,189,842 |
Open Text Corp. (a) | 40,500 | | 1,791,705 |
Pan American Silver Corp. | 53,400 | | 1,704,528 |
Common Stocks - continued |
| Shares | | Value |
Canada - continued |
Petrobank Energy & Resources Ltd. (a) | 140,800 | | $ 5,603,561 |
Quadra FNX Mining Ltd. (a) | 76,400 | | 1,078,694 |
TOTAL CANADA | | 22,027,265 |
Cayman Islands - 1.2% |
China Lilang Ltd. | 1,443,000 | | 2,256,302 |
Vantage Drilling Co. (a) | 725,331 | | 1,247,569 |
Wynn Macau Ltd. | 762,000 | | 1,684,977 |
TOTAL CAYMAN ISLANDS | | 5,188,848 |
China - 0.1% |
China Hongxing Sports Ltd. | 4,264,000 | | 576,528 |
Cyprus - 0.1% |
AFI Development PLC GDR (Reg. S) | 470,800 | | 555,544 |
Denmark - 0.5% |
William Demant Holding AS (a) | 28,533 | | 2,138,737 |
Finland - 2.8% |
Metso Corp. | 57,500 | | 2,725,885 |
Nokian Tyres PLC (d) | 111,400 | | 3,859,688 |
Outotec OYJ (d) | 127,800 | | 5,964,328 |
TOTAL FINLAND | | 12,549,901 |
France - 3.5% |
Audika SA | 120,384 | | 2,939,771 |
Laurent-Perrier Group | 25,963 | | 2,925,862 |
Remy Cointreau SA | 47,298 | | 3,320,914 |
Saft Groupe SA | 85,419 | | 3,262,605 |
Vetoquinol SA | 21,539 | | 912,900 |
Virbac SA | 13,000 | | 2,091,976 |
TOTAL FRANCE | | 15,454,028 |
Germany - 3.7% |
alstria office REIT-AG | 75,100 | | 1,046,024 |
Bilfinger Berger Se | 44,776 | | 3,260,346 |
Colonia Real Estate AG (a) | 386,909 | | 2,538,927 |
CTS Eventim AG | 57,996 | | 3,273,133 |
Fielmann AG | 27,537 | | 2,779,852 |
Software AG (Bearer) | 24,227 | | 3,394,663 |
TOTAL GERMANY | | 16,292,945 |
Greece - 0.4% |
Terna Energy SA | 443,751 | | 1,907,943 |
Common Stocks - continued |
| Shares | | Value |
India - 0.7% |
Apollo Tyres Ltd. | 514,796 | | $ 830,991 |
Jyothy Laboratories Ltd. | 351,322 | | 2,187,589 |
TOTAL INDIA | | 3,018,580 |
Ireland - 0.6% |
James Hardie Industries NV sponsored ADR (a) | 106,775 | | 2,838,080 |
Israel - 0.6% |
Azrieli Group | 68,005 | | 1,752,976 |
Ituran Location & Control Ltd. | 70,645 | | 1,098,530 |
TOTAL ISRAEL | | 2,851,506 |
Italy - 2.3% |
Azimut Holdings SpA | 626,773 | | 6,392,664 |
Interpump Group SpA (a) | 590,858 | | 3,853,825 |
TOTAL ITALY | | 10,246,489 |
Japan - 20.9% |
Aozora Bank Ltd. | 1,335,000 | | 2,239,654 |
Asahi Co. Ltd. (d) | 72,000 | | 1,064,745 |
Autobacs Seven Co. Ltd. | 102,200 | | 3,829,166 |
Daikoku Denki Co. Ltd. | 150,800 | | 1,705,331 |
Daikokutenbussan Co. Ltd. | 105,500 | | 3,697,154 |
FCC Co. Ltd. | 147,900 | | 3,174,143 |
Fukuoka (REIT) Investment Fund | 189 | | 1,268,299 |
GCA Savvian Group Corp. (a) | 1,694 | | 1,606,216 |
Glory Ltd. | 58,400 | | 1,288,182 |
Goldcrest Co. Ltd. | 54,690 | | 1,180,521 |
Japan Steel Works Ltd. | 229,000 | | 2,184,908 |
Kamigumi Co. Ltd. | 298,000 | | 2,329,340 |
Kobayashi Pharmaceutical Co. Ltd. | 142,700 | | 6,649,994 |
Kyoto Kimono Yuzen Co. Ltd. | 109,900 | | 1,195,011 |
Meiko Network Japan Co. Ltd. | 120,500 | | 1,004,791 |
Miraial Co. Ltd. | 44,000 | | 1,078,812 |
MS&AD Insurance Group Holdings, Inc. | 38,660 | | 926,174 |
Nabtesco Corp. | 205,000 | | 3,630,235 |
Nachi-Fujikoshi Corp. | 858,000 | | 2,569,628 |
Nagaileben Co. Ltd. | 39,900 | | 946,057 |
Nihon M&A Center, Inc. | 381 | | 1,377,793 |
Nihon Parkerizing Co. Ltd. | 162,000 | | 2,127,923 |
Nippon Seiki Co. Ltd. | 186,000 | | 1,883,808 |
Nippon Thompson Co. Ltd. | 832,000 | | 5,769,305 |
Nitto Kohki Co. Ltd. | 38,900 | | 917,029 |
Common Stocks - continued |
| Shares | | Value |
Japan - continued |
Obic Co. Ltd. | 13,240 | | $ 2,444,966 |
Osaka Securities Exchange Co. Ltd. | 1,381 | | 6,950,478 |
OSG Corp. | 171,600 | | 1,793,409 |
SAZABY, Inc. | 49,300 | | 918,976 |
SHO-BOND Holdings Co. Ltd. | 112,200 | | 2,400,999 |
Shoei Co. Ltd. | 68,800 | | 623,278 |
The Nippon Synthetic Chemical Industry Co. Ltd. | 180,000 | | 1,055,797 |
THK Co. Ltd. | 107,700 | | 2,071,823 |
Toho Holdings Co. Ltd. | 138,600 | | 1,941,123 |
Tsumura & Co. | 75,000 | | 2,307,692 |
Tsutsumi Jewelry Co. Ltd. | 41,400 | | 974,935 |
USS Co. Ltd. | 89,540 | | 6,965,577 |
Yamatake Corp. | 81,000 | | 1,971,903 |
Yamato Kogyo Co. Ltd. | 188,700 | | 4,840,025 |
TOTAL JAPAN | | 92,905,200 |
Korea (South) - 0.8% |
NCsoft Corp. | 4,673 | | 1,028,517 |
NHN Corp. (a) | 13,235 | | 2,348,050 |
TOTAL KOREA (SOUTH) | | 3,376,567 |
Luxembourg - 0.3% |
GlobeOp Financial Services SA | 243,800 | | 1,192,319 |
Netherlands - 2.8% |
Aalberts Industries NV | 192,200 | | 3,510,107 |
ASM International NV unit (a)(d) | 167,800 | | 4,287,290 |
Heijmans NV unit (a) | 81,690 | | 1,540,195 |
QIAGEN NV (a)(d) | 166,200 | | 3,126,222 |
TOTAL NETHERLANDS | | 12,463,814 |
Norway - 0.4% |
Sevan Marine ASA (a) | 1,190,500 | | 1,604,116 |
Papua New Guinea - 0.2% |
Oil Search Ltd. | 164,418 | | 1,027,640 |
Philippines - 0.3% |
Jollibee Food Corp. | 545,210 | | 1,124,734 |
Portugal - 0.6% |
Jeronimo Martins SGPS SA | 179,600 | | 2,693,970 |
Singapore - 2.3% |
Allgreen Properties Ltd. | 2,765,000 | | 2,542,185 |
Keppel Land Ltd. | 321,000 | | 1,098,687 |
Common Stocks - continued |
| Shares | | Value |
Singapore - continued |
Singapore Exchange Ltd. | 622,000 | | $ 4,229,004 |
Wing Tai Holdings Ltd. | 1,817,000 | | 2,456,733 |
TOTAL SINGAPORE | | 10,326,609 |
South Africa - 3.2% |
African Rainbow Minerals Ltd. | 155,700 | | 3,972,155 |
Clicks Group Ltd. | 595,513 | | 3,885,046 |
JSE Ltd. | 219,281 | | 2,472,959 |
Mr Price Group Ltd. | 445,900 | | 4,052,219 |
TOTAL SOUTH AFRICA | | 14,382,379 |
Spain - 1.5% |
Grifols SA (d) | 50,332 | | 814,851 |
Prosegur Compania de Seguridad SA (Reg.) | 100,209 | | 6,004,106 |
TOTAL SPAIN | | 6,818,957 |
Sweden - 1.1% |
Intrum Justitia AB | 166,800 | | 2,296,695 |
Swedish Match Co. | 84,600 | | 2,363,928 |
TOTAL SWEDEN | | 4,660,623 |
Switzerland - 1.8% |
Bank Sarasin & Co. Ltd. Series B (Reg.) | 141,200 | | 5,164,017 |
Sonova Holding AG Class B | 23,726 | | 2,747,767 |
TOTAL SWITZERLAND | | 7,911,784 |
Turkey - 2.0% |
Albaraka Turk Katilim Bankasi AS | 1,230,000 | | 2,469,776 |
Anadolu Efes Biracilik ve Malt Sanayii AS | 113,000 | | 1,804,155 |
Asya Katilim Bankasi AS | 896,000 | | 2,311,371 |
Coca-Cola Icecek AS | 190,000 | | 2,437,426 |
TOTAL TURKEY | | 9,022,728 |
United Kingdom - 16.1% |
AMEC PLC | 135,700 | | 2,361,092 |
Babcock International Group PLC | 314,700 | | 2,924,340 |
Bellway PLC | 223,172 | | 1,909,344 |
Britvic PLC | 391,200 | | 3,023,495 |
Cobham PLC | 499,200 | | 1,852,321 |
Dechra Pharmaceuticals PLC | 173,400 | | 1,472,408 |
Derwent London PLC | 70,900 | | 1,726,605 |
Great Portland Estates PLC | 522,489 | | 2,892,200 |
H&T Group PLC (d) | 371,803 | | 2,078,938 |
Common Stocks - continued |
| Shares | | Value |
United Kingdom - continued |
InterContinental Hotel Group PLC ADR (d) | 195,500 | | $ 3,782,925 |
Johnson Matthey PLC | 132,689 | | 4,068,928 |
Meggitt PLC | 785,545 | | 4,154,510 |
Micro Focus International PLC | 321,800 | | 1,968,453 |
Mothercare PLC | 323,401 | | 2,722,810 |
Persimmon PLC | 256,563 | | 1,401,689 |
Rotork PLC | 65,300 | | 1,752,392 |
Serco Group PLC | 570,476 | | 5,611,887 |
Shaftesbury PLC | 456,732 | | 3,263,619 |
Spectris PLC | 207,487 | | 3,753,082 |
Spirax-Sarco Engineering PLC | 184,230 | | 5,339,519 |
Ted Baker PLC | 249,000 | | 2,453,452 |
Ultra Electronics Holdings PLC | 100,669 | | 3,001,548 |
Unite Group PLC (a) | 1,339,170 | | 4,462,747 |
Victrex PLC | 178,582 | | 3,693,747 |
TOTAL UNITED KINGDOM | | 71,672,051 |
United States of America - 10.5% |
Advanced Energy Industries, Inc. (a) | 210,419 | | 3,021,617 |
Autoliv, Inc. | 66,600 | | 4,748,580 |
Cymer, Inc. (a) | 92,100 | | 3,403,095 |
Dril-Quip, Inc. (a) | 29,100 | | 2,010,810 |
Evercore Partners, Inc. Class A | 42,700 | | 1,296,372 |
ION Geophysical Corp. (a)(d) | 455,889 | | 2,229,297 |
Juniper Networks, Inc. (a) | 108,200 | | 3,504,598 |
Kansas City Southern (a) | 84,300 | | 3,694,026 |
Lam Research Corp. (a) | 23,203 | | 1,062,465 |
Martin Marietta Materials, Inc. (d) | 23,900 | | 1,923,472 |
Mohawk Industries, Inc. (a) | 81,000 | | 4,644,540 |
Oceaneering International, Inc. (a) | 19,400 | | 1,200,278 |
PriceSmart, Inc. | 228,296 | | 6,695,922 |
ResMed, Inc. (a) | 148,200 | | 4,723,134 |
Solera Holdings, Inc. | 22,500 | | 1,081,125 |
Solutia, Inc. (a) | 66,156 | | 1,198,085 |
TOTAL UNITED STATES OF AMERICA | | 46,437,416 |
TOTAL COMMON STOCKS (Cost $328,402,495) | 433,892,809 |
Money Market Funds - 6.3% |
| Shares | | Value |
Fidelity Cash Central Fund, 0.23% (b) | 10,922,935 | | $ 10,922,935 |
Fidelity Securities Lending Cash Central Fund, 0.24% (b)(c) | 17,012,021 | | 17,012,021 |
TOTAL MONEY MARKET FUNDS (Cost $27,934,956) | 27,934,956 |
TOTAL INVESTMENT PORTFOLIO - 104.0% (Cost $356,337,451) | | 461,827,765 |
NET OTHER ASSETS (LIABILITIES) - (4.0)% | | (17,810,509) |
NET ASSETS - 100% | $ 444,017,256 |
Legend |
(a) Non-income producing |
(b) Affiliated fund that is available only to investment companies and other accounts managed by Fidelity Investments. The rate quoted is the annualized seven-day yield of the fund at period end. A complete unaudited listing of the fund's holdings as of its most recent quarter end is available upon request. In addition, each Fidelity Central Fund's financial statements, which are not covered by the Fund's report of Independent Registered Public Accounting Firm, are available on the SEC's website or upon request. |
(c) Investment made with cash collateral received from securities on loan. |
(d) Security or a portion of the security is on loan at period end. |
Affiliated Central Funds |
Information regarding fiscal year to date income earned by the Fund from investments in Fidelity Central Funds is as follows: |
Fund | Income earned |
Fidelity Cash Central Fund | $ 12,535 |
Fidelity Securities Lending Cash Central Fund | 263,176 |
Total | $ 275,711 |
Other Information |
The following is a summary of the inputs used, as of October 31, 2010, involving the Fund's assets and liabilities carried at fair value. The inputs or methodology used for valuing securities may not be an indication of the risk associated with investing in those securities. For more information on valuation inputs, and their aggregation into the levels used in the table below, please refer to the Security Valuation section in the accompanying Notes to Financial Statements. |
Valuation Inputs at Reporting Date: |
Description | Total | Level 1 | Level 2 | Level 3 |
Investments in Securities: | | | | |
Equities: | | | | |
Japan | $ 92,905,200 | $ 89,794,118 | $ 3,111,082 | $ - |
United Kingdom | 71,672,051 | 71,672,051 | - | - |
United States of America | 46,437,416 | 46,437,416 | - | - |
Canada | 22,027,265 | 22,027,265 | - | - |
Brazil | 18,023,080 | 18,023,080 | - | - |
Germany | 16,292,945 | 16,292,945 | - | - |
France | 15,454,028 | 15,454,028 | - | - |
South Africa | 14,382,379 | 14,382,379 | - | - |
Finland | 12,549,901 | 12,549,901 | - | - |
Other | 124,148,544 | 123,317,553 | 830,991 | - |
Money Market Funds | 27,934,956 | 27,934,956 | - | - |
Total Investments in Securities: | $ 461,827,765 | $ 457,885,692 | $ 3,942,073 | $ - |
Income Tax Information |
At October 31, 2010, the Fund had a capital loss carryforward of approximately $420,935,635 of which $90,555,924 and $330,379,711 will expire on October 31, 2016 and 2017, respectively. Capital loss carryforwards are only available to offset future capital gains of the Fund to the extent provided by regulations and may be limited. |
See accompanying notes which are an integral part of the financial statements.
Annual Report
Statement of Assets and Liabilities
| October 31, 2010 |
| | |
Assets | | |
Investment in securities, at value (including securities loaned of $16,477,464) - See accompanying schedule: Unaffiliated issuers (cost $328,402,495) | $ 433,892,809 | |
Fidelity Central Funds (cost $27,934,956) | 27,934,956 | |
Total Investments (cost $356,337,451) | | $ 461,827,765 |
Foreign currency held at value (cost $144,438) | | 144,438 |
Receivable for investments sold | | 3,451,646 |
Receivable for fund shares sold | | 265,800 |
Dividends receivable | | 1,033,772 |
Distributions receivable from Fidelity Central Funds | | 13,747 |
Other receivables | | 16,199 |
Total assets | | 466,753,367 |
| | |
Liabilities | | |
Payable for investments purchased | $ 4,888,295 | |
Payable for fund shares redeemed | 393,945 | |
Accrued management fee | 223,687 | |
Distribution and service plan fees payable | 18,734 | |
Other affiliated payables | 122,810 | |
Other payables and accrued expenses | 76,619 | |
Collateral on securities loaned, at value | 17,012,021 | |
Total liabilities | | 22,736,111 |
| | |
Net Assets | | $ 444,017,256 |
Net Assets consist of: | | |
Paid in capital | | $ 757,537,538 |
Undistributed net investment income | | 3,575,839 |
Accumulated undistributed net realized gain (loss) on investments and foreign currency transactions | | (422,628,442) |
Net unrealized appreciation (depreciation) on investments and assets and liabilities in foreign currencies | | 105,532,321 |
Net Assets | | $ 444,017,256 |
See accompanying notes which are an integral part of the financial statements.
Annual Report
Statement of Assets and Liabilities - continued
| October 31, 2010 |
| | |
Calculation of Maximum Offering Price Class A:
Net Asset Value and redemption price per share ($20,227,814 ÷ 2,060,269 shares) | | $ 9.82 |
| | |
Maximum offering price per share (100/94.25 of $9.82) | | $ 10.42 |
Class T:
Net Asset Value and redemption price per share ($11,202,002 ÷ 1,152,196 shares) | | $ 9.72 |
| | |
Maximum offering price per share (100/96.50 of $9.72) | | $ 10.07 |
Class B:
Net Asset Value and offering price per share ($2,902,474 ÷ 304,234 shares)A | | $ 9.54 |
| | |
Class C:
Net Asset Value and offering price per share ($8,935,535 ÷ 937,891 shares)A | | $ 9.53 |
| | |
| | |
International Small Cap Opportunities:
Net Asset Value, offering price and redemption price per share ($398,331,167 ÷ 40,172,676 shares) | | $ 9.92 |
| | |
Institutional Class:
Net Asset Value, offering price and redemption price per share ($2,418,264 ÷ 243,597 shares) | | $ 9.93 |
A Redemption price per share is equal to net asset value less any applicable contingent deferred sales charge.
See accompanying notes which are an integral part of the financial statements.
Annual Report
Financial Statements - continued
Statement of Operations
| Year ended October 31, 2010 |
| | |
Investment Income | | |
Dividends | | $ 7,608,270 |
Interest | | 5 |
Income from Fidelity Central Funds | | 275,711 |
Income before foreign taxes withheld | | 7,883,986 |
Less foreign taxes withheld | | (520,283) |
Total income | | 7,363,703 |
| | |
Expenses | | |
Management fee
Basic fee | $ 3,343,372 | |
Performance adjustment | (1,495,592) | |
Transfer agent fees | 1,191,720 | |
Distribution and service plan fees | 216,769 | |
Accounting and security lending fees | 206,297 | |
Custodian fees and expenses | 124,178 | |
Independent trustees' compensation | 2,177 | |
Registration fees | 77,687 | |
Audit | 71,763 | |
Legal | 1,903 | |
Miscellaneous | 5,248 | |
Total expenses before reductions | 3,745,522 | |
Expense reductions | (55,920) | 3,689,602 |
Net investment income (loss) | | 3,674,101 |
Realized and Unrealized Gain (Loss) Net realized gain (loss) on: | | |
Investment securities: | | |
Unaffiliated issuers | 58,545,504 | |
Foreign currency transactions | (57,981) | |
Total net realized gain (loss) | | 58,487,523 |
Change in net unrealized appreciation (depreciation) on: Investment securities | 25,226,622 | |
Assets and liabilities in foreign currencies | 27,111 | |
Total change in net unrealized appreciation (depreciation) | | 25,253,733 |
Net gain (loss) | | 83,741,256 |
Net increase (decrease) in net assets resulting from operations | | $ 87,415,357 |
See accompanying notes which are an integral part of the financial statements.
Annual Report
Statement of Changes in Net Assets
| Year ended
October 31,
2010 | Year ended
October 31,
2009 |
Increase (Decrease) in Net Assets | | |
Operations | | |
Net investment income (loss) | $ 3,674,101 | $ 3,774,364 |
Net realized gain (loss) | 58,487,523 | (316,364,225) |
Change in net unrealized appreciation (depreciation) | 25,253,733 | 391,843,877 |
Net increase (decrease) in net assets resulting
from operations | 87,415,357 | 79,254,016 |
Distributions to shareholders from net investment income | (3,861,178) | (140,700) |
Distributions to shareholders from net realized gain | (4,067,493) | - |
Total distributions | (7,928,671) | (140,700) |
Share transactions - net increase (decrease) | (8,820,184) | (68,133,927) |
Redemption fees | 60,781 | 113,424 |
Total increase (decrease) in net assets | 70,727,283 | 11,092,813 |
| | |
Net Assets | | |
Beginning of period | 373,289,973 | 362,197,160 |
End of period (including undistributed net investment income of $3,575,839 and undistributed net investment income of $3,633,664, respectively) | $ 444,017,256 | $ 373,289,973 |
See accompanying notes which are an integral part of the financial statements.
Annual Report
Financial Highlights - Class A
Years ended October 31, | 2010 | 2009 | 2008 | 2007 | 2006 |
Selected Per-Share Data | | | | | |
Net asset value, beginning of period | $ 8.07 | $ 6.24 | $ 18.97 | $ 14.18 | $ 10.41 |
Income from Investment Operations | | | | | |
Net investment income (loss)C | .06 | .06 | .02 | .02 | -G |
Net realized and unrealized gain (loss) | 1.85 | 1.77 | (10.85) | 4.76 | 3.74 |
Total from investment operations | 1.91 | 1.83 | (10.83) | 4.78 | 3.74 |
Distributions from net investment income | (.07) | - | (.03) | - | - |
Distributions from net realized gain | (.09) | - | (1.88) | - | -G |
Total distributions | (.16) | - | (1.90)H | - | -G |
Redemption fees added to paid in capitalC | -G | -G | -G | .01 | .03 |
Net asset value, end of period | $ 9.82 | $ 8.07 | $ 6.24 | $ 18.97 | $ 14.18 |
Total ReturnA,B | 24.05% | 29.33% | (62.98)% | 33.78% | 36.25% |
Ratios to Average Net AssetsD,F | | | | | |
Expenses before reductions | 1.16% | .94% | 1.75% | 1.63% | 1.63% |
Expenses net of fee waivers, if any | 1.16% | .94% | 1.66% | 1.63% | 1.63% |
Expenses net of all reductions | 1.15% | .89% | 1.62% | 1.59% | 1.51% |
Net investment income (loss) | .74% | 1.00% | .13% | .10% | .02% |
Supplemental Data | | | | | |
Net assets, end of period (000 omitted) | $ 20,228 | $ 18,883 | $ 17,905 | $ 70,785 | $ 35,674 |
Portfolio turnover rateE | 49% | 174% | 61% | 107% | 164% |
A Total returns would have been lower had certain expenses not been reduced during the periods shown.
B Total returns do not include the effect of the sales charges.
C Calculated based on average shares outstanding during the period.
D Fees and expenses of the underlying Fidelity Central Funds are not included in the Fund's expense ratio. The Fund indirectly bears its proportionate share of the expenses of any underlying Fidelity Central Funds.
E Amount does not include the portfolio activity of any underlying Fidelity Central Funds.
F Expense ratios reflect operating expenses of the class. Expenses before reductions do not reflect amounts reimbursed by the investment adviser or reductions from brokerage service arrangements or reductions from other expense offset arrangements and do not represent the amount paid by the class during periods when reimbursements or reductions occur. Expenses net of fee waivers reflect expenses after reimbursement by the investment adviser but prior to reductions from brokerage service arrangements or other expense offset arrangements. Expenses net of all reductions represent the net expenses paid by the class.
G Amount represents less than $.01 per share.
H Total distributions of $1.90 per share is comprised of distributions from net investment income of $.025 and distributions from net realized gain of $1.878 per share.
See accompanying notes which are an integral part of the financial statements.
Annual Report
Financial Highlights - Class T
Years ended October 31, | 2010 | 2009 | 2008 | 2007 | 2006 |
Selected Per-Share Data | | | | | |
Net asset value, beginning of period | $ 8.00 | $ 6.20 | $ 18.85 | $ 14.12 | $ 10.38 |
Income from Investment Operations | | | | | |
Net investment income (loss)C | .04 | .05 | (.02) | (.02) | (.03) |
Net realized and unrealized gain (loss) | 1.83 | 1.75 | (10.78) | 4.74 | 3.74 |
Total from investment operations | 1.87 | 1.80 | (10.80) | 4.72 | 3.71 |
Distributions from net investment income | (.06) | - | - | - | - |
Distributions from net realized gain | (.09) | - | (1.85) | - | - |
Total distributions | (.15) | - | (1.85)H | - | - |
Redemption fees added to paid in capitalC | -G | -G | -G | .01 | .03 |
Net asset value, end of period | $ 9.72 | $ 8.00 | $ 6.20 | $ 18.85 | $ 14.12 |
Total ReturnA,B | 23.65% | 29.03% | (63.08)% | 33.50% | 36.03% |
Ratios to Average Net AssetsD,F | | | | | |
Expenses before reductions | 1.43% | 1.20% | 2.00% | 1.85% | 1.85% |
Expenses net of fee waivers, if any | 1.43% | 1.20% | 1.91% | 1.85% | 1.85% |
Expenses net of all reductions | 1.41% | 1.15% | 1.87% | 1.81% | 1.74% |
Net investment income (loss) | .48% | .74% | (.12)% | (.13)% | (.20)% |
Supplemental Data | | | | | |
Net assets, end of period (000 omitted) | $ 11,202 | $ 11,915 | $ 11,614 | $ 46,568 | $ 28,309 |
Portfolio turnover rateE | 49% | 174% | 61% | 107% | 164% |
A Total returns would have been lower had certain expenses not been reduced during the periods shown.
B Total returns do not include the effect of the sales charges.
C Calculated based on average shares outstanding during the period.
D Fees and expenses of the underlying Fidelity Central Funds are not included in the Fund's expense ratio. The Fund indirectly bears its proportionate share of the expenses of any underlying Fidelity Central Funds.
E Amount does not include the portfolio activity of any underlying Fidelity Central Funds.
F Expense ratios reflect operating expenses of the class. Expenses before reductions do not reflect amounts reimbursed by the investment adviser or reductions from brokerage service arrangements or reductions from other expense offset arrangements and do not represent the amount paid by the class during periods when reimbursements or reductions occur. Expenses net of fee waivers reflect expenses after reimbursement by the investment adviser but prior to reductions from brokerage service arrangements or other expense offset arrangements. Expenses net of all reductions represent the net expenses paid by the class.
G Amount represents less than $.01 per share.
H Total distributions of $1.85 per share is comprised of distributions from net realized gain of $1.852 per share.
See accompanying notes which are an integral part of the financial statements.
Annual Report
Financial Highlights - Class B
Years ended October 31, | 2010 | 2009 | 2008 | 2007 | 2006 |
Selected Per-Share Data | | | | | |
Net asset value, beginning of period | $ 7.87 | $ 6.12 | $ 18.64 | $ 14.04 | $ 10.37 |
Income from Investment Operations | | | | | |
Net investment income (loss)C | (-)G | .02 | (.08) | (.11) | (.10) |
Net realized and unrealized gain (loss) | 1.79 | 1.73 | (10.68) | 4.70 | 3.74 |
Total from investment operations | 1.79 | 1.75 | (10.76) | 4.59 | 3.64 |
Distributions from net investment income | (.03) | - | - | - | - |
Distributions from net realized gain | (.09) | - | (1.76) | - | - |
Total distributions | (.12) | - | (1.76)H | - | - |
Redemption fees added to paid in capitalC | -G | -G | -G | .01 | .03 |
Net asset value, end of period | $ 9.54 | $ 7.87 | $ 6.12 | $ 18.64 | $ 14.04 |
Total ReturnA,B | 23.03% | 28.59% | (63.32)% | 32.76% | 35.39% |
Ratios to Average Net AssetsD,F | | | | | |
Expenses before reductions | 1.91% | 1.69% | 2.51% | 2.40% | 2.45% |
Expenses net of fee waivers, if any | 1.91% | 1.69% | 2.41% | 2.40% | 2.41% |
Expenses net of all reductions | 1.90% | 1.64% | 2.38% | 2.36% | 2.30% |
Net investment income (loss) | (.01)% | .25% | (.62)% | (.67)% | (.76)% |
Supplemental Data | | | | | |
Net assets, end of period (000 omitted) | $ 2,902 | $ 2,799 | $ 2,687 | $ 10,975 | $ 7,709 |
Portfolio turnover rateE | 49% | 174% | 61% | 107% | 164% |
A Total returns would have been lower had certain expenses not been reduced during the periods shown.
B Total returns do not include the effect of the contingent deferred sales charge.
C Calculated based on average shares outstanding during the period.
D Fees and expenses of the underlying Fidelity Central Funds are not included in the Fund's expense ratio. The Fund indirectly bears its proportionate share of the expenses of any underlying Fidelity Central Funds.
E Amount does not include the portfolio activity of any underlying Fidelity Central Funds.
F Expense ratios reflect operating expenses of the class. Expenses before reductions do not reflect amounts reimbursed by the investment adviser or reductions from brokerage service arrangements or reductions from other expense offset arrangements and do not represent the amount paid by the class during periods when reimbursements or reductions occur. Expenses net of fee waivers reflect expenses after reimbursement by the investment adviser but prior to reductions from brokerage service arrangements or other expense offset arrangements. Expenses net of all reductions represent the net expenses paid by the class.
G Amount represents less than $.01 per share.
H Total distributions of $1.76 per share is comprised of distributions from net realized gain of $1.760 per share.
See accompanying notes which are an integral part of the financial statements.
Annual Report
Financial Highlights - Class C
Years ended October 31, | 2010 | 2009 | 2008 | 2007 | 2006 |
Selected Per-Share Data | | | | | |
Net asset value, beginning of period | $ 7.86 | $ 6.11 | $ 18.63 | $ 14.03 | $ 10.37 |
Income from Investment Operations | | | | | |
Net investment income (loss)C | (-)G | .02 | (.08) | (.11) | (.10) |
Net realized and unrealized gain (loss) | 1.79 | 1.73 | (10.66) | 4.70 | 3.73 |
Total from investment operations | 1.79 | 1.75 | (10.74) | 4.59 | 3.63 |
Distributions from net investment income | (.03) | - | - | - | - |
Distributions from net realized gain | (.09) | - | (1.78) | - | - |
Total distributions | (.12) | - | (1.78)H | - | - |
Redemption fees added to paid in capitalC | -G | -G | -G | .01 | .03 |
Net asset value, end of period | $ 9.53 | $ 7.86 | $ 6.11 | $ 18.63 | $ 14.03 |
Total ReturnA,B | 23.06% | 28.64% | (63.32)% | 32.79% | 35.29% |
Ratios to Average Net AssetsD,F | | | | | |
Expenses before reductions | 1.91% | 1.68% | 2.51% | 2.38% | 2.38% |
Expenses net of fee waivers, if any | 1.91% | 1.68% | 2.41% | 2.38% | 2.38% |
Expenses net of all reductions | 1.90% | 1.63% | 2.38% | 2.34% | 2.27% |
Net investment income (loss) | (.01)% | .26% | (.62)% | (.66)% | (.73)% |
Supplemental Data | | | | | |
Net assets, end of period (000 omitted) | $ 8,936 | $ 8,543 | $ 9,497 | $ 40,894 | $ 26,320 |
Portfolio turnover rateE | 49% | 174% | 61% | 107% | 164% |
A Total returns would have been lower had certain expenses not been reduced during the periods shown.
B Total returns do not include the effect of the contingent deferred sales charge.
C Calculated based on average shares outstanding during the period.
D Fees and expenses of the underlying Fidelity Central Funds are not included in the Fund's expense ratio. The Fund indirectly bears its proportionate share of the expenses of any underlying Fidelity Central Funds.
E Amount does not include the portfolio activity of any underlying Fidelity Central Funds.
F Expense ratios reflect operating expenses of the class. Expenses before reductions do not reflect amounts reimbursed by the investment adviser or reductions from brokerage service arrangements or reductions from other expense offset arrangements and do not represent the amount paid by the class during periods when reimbursements or reductions occur. Expenses net of fee waivers reflect expenses after reimbursement by the investment adviser but prior to reductions from brokerage service arrangements or other expense offset arrangements. Expenses net of all reductions represent the net expenses paid by the class.
G Amount represents less than $.01 per share.
H Total distributions of $1.78 per share is comprised of distributions from net realized gain of $1.775 per share.
See accompanying notes which are an integral part of the financial statements.
Annual Report
Financial Highlights - International Small Cap Opportunities
Years ended October 31, | 2010 | 2009 | 2008 | 2007 | 2006 |
Selected Per-Share Data | | | | | |
Net asset value, beginning of period | $ 8.14 | $ 6.28 | $ 19.09 | $ 14.23 | $ 10.40 |
Income from Investment Operations | | | | | |
Net investment income (loss)B | .09 | .08 | .05 | .07 | .05 |
Net realized and unrealized gain (loss) | 1.87 | 1.78 | (10.92) | 4.78 | 3.75 |
Total from investment operations | 1.96 | 1.86 | (10.87) | 4.85 | 3.80 |
Distributions from net investment income | (.09) | -F | (.06) | - | - |
Distributions from net realized gain | (.09) | - | (1.88) | - | -F |
Total distributions | (.18) | -F | (1.94)G | - | -F |
Redemption fees added to paid in capitalB | -F | -F | -F | .01 | .03 |
Net asset value, end of period | $ 9.92 | $ 8.14 | $ 6.28 | $ 19.09 | $ 14.23 |
Total ReturnA | 24.43% | 29.68% | (62.91)% | 34.15% | 36.86% |
Ratios to Average Net AssetsC,E | | | | | |
Expenses before reductions | .91% | .68% | 1.44% | 1.30% | 1.28% |
Expenses net of fee waivers, if any | .91% | .68% | 1.44% | 1.30% | 1.28% |
Expenses net of all reductions | .89% | .64% | 1.40% | 1.25% | 1.16% |
Net investment income (loss) | 1.00% | 1.25% | .36% | .43% | .37% |
Supplemental Data | | | | | |
Net assets, end of period (000 omitted) | $ 398,331 | $ 329,128 | $ 312,376 | $ 1,433,844 | $ 981,210 |
Portfolio turnover rateD | 49% | 174% | 61% | 107% | 164% |
A Total returns would have been lower had certain expenses not been reduced during the periods shown.
B Calculated based on average shares outstanding during the period.
C Fees and expenses of the underlying Fidelity Central Funds are not included in the Fund's expense ratio. The Fund indirectly bears its proportionate share of the expenses of any underlying Fidelity Central Funds.
D Amount does not include the portfolio activity of any underlying Fidelity Central Funds.
E Expense ratios reflect operating expenses of the class. Expenses before reductions do not reflect amounts reimbursed by the investment adviser or reductions from brokerage service arrangements or reductions from other expense offset arrangements and do not represent the amount paid by the class during periods when reimbursements or reductions occur. Expenses net of fee waivers reflect expenses after reimbursement by the investment adviser but prior to reductions from brokerage service arrangements or other expense offset arrangements. Expenses net of all reductions represent the net expenses paid by the class.
F Amount represents less than $.01 per share.
G Total distributions of $1.94 per share is comprised of distributions from net investment income of $.064 and distributions from net realized gain of $1.878 per share.
See accompanying notes which are an integral part of the financial statements.
Annual Report
Financial Highlights - Institutional Class
Years ended October 31, | 2010 | 2009 | 2008 | 2007 | 2006 |
Selected Per-Share Data | | | | | |
Net asset value, beginning of period | $ 8.14 | $ 6.27 | $ 19.09 | $ 14.22 | $ 10.40 |
Income from Investment Operations | | | | | |
Net investment income (loss)B | .09 | .08 | .05 | .08 | .05 |
Net realized and unrealized gain (loss) | 1.86 | 1.79 | (10.92) | 4.78 | 3.74 |
Total from investment operations | 1.95 | 1.87 | (10.87) | 4.86 | 3.79 |
Distributions from net investment income | (.07) | -F | (.07) | - | - |
Distributions from net realized gain | (.09) | - | (1.88) | - | -F |
Total distributions | (.16) | -F | (1.95)G | - | -F |
Redemption fees added to paid in capitalB | -F | -F | -F | .01 | .03 |
Net asset value, end of period | $ 9.93 | $ 8.14 | $ 6.27 | $ 19.09 | $ 14.22 |
Total ReturnA | 24.33% | 29.87% | (62.95)% | 34.25% | 36.77% |
Ratios to Average Net AssetsC,E | | | | | |
Expenses before reductions | .90% | .68% | 1.40% | 1.29% | 1.25% |
Expenses net of fee waivers, if any | .90% | .68% | 1.40% | 1.29% | 1.25% |
Expenses net of all reductions | .88% | .64% | 1.37% | 1.25% | 1.14% |
Net investment income (loss) | 1.01% | 1.25% | .39% | .44% | .40% |
Supplemental Data | | | | | |
Net assets, end of period (000 omitted) | $ 2,418 | $ 2,022 | $ 8,117 | $ 27,609 | $ 13,954 |
Portfolio turnover rateD | 49% | 174% | 61% | 107% | 164% |
A Total returns would have been lower had certain expenses not been reduced during the periods shown.
B Calculated based on average shares outstanding during the period.
C Fees and expenses of the underlying Fidelity Central Funds are not included in the Fund's expense ratio. The Fund indirectly bears its proportionate share of the expenses of any underlying Fidelity Central Funds.
D Amount does not include the portfolio activity of any underlying Fidelity Central Funds.
E Expense ratios reflect operating expenses of the class. Expenses before reductions do not reflect amounts reimbursed by the investment adviser or reductions from brokerage service arrangements or reductions from other expense offset arrangements and do not represent the amount paid by the class during periods when reimbursements or reductions occur. Expenses net of fee waivers reflect expenses after reimbursement by the investment adviser but prior to reductions from brokerage service arrangements or other expense offset arrangements. Expenses net of all reductions represent the net expenses paid by the class.
F Amount represents less than $.01 per share.
G Total distributions of $1.95 per share is comprised of distributions from net investment income of $.074 and distributions from net realized gain of $1.878 per share.
See accompanying notes which are an integral part of the financial statements.
Annual Report
Notes to Financial Statements
For the period ended October 31, 2010
1. Organization.
Fidelity International Small Cap Opportunities Fund (the Fund) is a fund of Fidelity Investment Trust (the Trust) and is authorized to issue an unlimited number of shares. The Trust is registered under the Investment Company Act of 1940, as amended (the 1940 Act), as an open-end management investment company organized as a Massachusetts business trust. The Fund offers Class A, Class T, Class C, International Small Cap Opportunities and Institutional Class shares, each of which has equal rights as to assets and voting privileges. Effective after the close of business on September 1, 2010, Class B shares were closed to new accounts and additional purchases by existing shareholders. Each class has exclusive voting rights with respect to matters that affect that class. Class B shares will automatically convert to Class A shares after a holding period of seven years from the initial date of purchase. Investment income, realized and unrealized capital gains and losses, the common expenses of the Fund, and certain fund-level expense reductions, if any, are allocated on a pro-rata basis to each class based on the relative net assets of each class to the total net assets of the Fund. Each class differs with respect to transfer agent and distribution and service plan fees incurred. Certain expense reductions also differ by class. The Fund's investments in emerging markets can be subject to social, economic, regulatory, and political uncertainties and can be extremely volatile.
2. Investments in Fidelity Central Funds.
The Fund may invest in Fidelity Central Funds, which are open-end investment companies available only to other investment companies and accounts managed by Fidelity Management & Research Company (FMR) and its affiliates. The Fund's Schedule of Investments lists each of the Fidelity Central Funds held as of period end, if any, as an investment of the Fund, but does not include the underlying holdings of each Fidelity Central Fund. As an Investing Fund, the Fund indirectly bears its proportionate share of the expenses of the underlying Fidelity Central Funds.
The Money Market Central Funds seek preservation of capital and current income and are managed by Fidelity Investments Money Management, Inc. (FIMM), an affiliate of FMR.
A complete unaudited list of holdings for each Fidelity Central Fund is available upon request or at the Securities and Exchange Commission (the SEC) web site at www.sec.gov. In addition, the financial statements of the Fidelity Central Funds, which are not covered by the Fund's Report of Independent Registered Public Accounting Firm, are available on the SEC web site or upon request.
3. Significant Accounting Policies.
The financial statements have been prepared in conformity with accounting principles generally accepted in the United States of America (GAAP), which require management
Annual Report
3. Significant Accounting Policies - continued
to make certain estimates and assumptions at the date of the financial statements. Actual results could differ from those estimates. The following summarizes the significant accounting policies of the Fund:
Security Valuation. Investments are valued as of 4:00 p.m. Eastern time on the last calendar day of the period. The Fund uses independent pricing services approved by the Board of Trustees to value its investments. When current market prices or quotations are not readily available or reliable, valuations may be determined in good faith in accordance with procedures adopted by the Board of Trustees. Factors used in determining value may include market or security specific events. The frequency with which these procedures are used cannot be predicted and they may be utilized to a significant extent. The value used for net asset value (NAV) calculation under these procedures may differ from published prices for the same securities.
The Fund categorizes the inputs to valuation techniques used to value its investments into a disclosure hierarchy consisting of three levels as shown below.
Level 1 - quoted prices in active markets for identical investments
Level 2 - other significant observable inputs (including quoted prices for similar investments, interest rates, prepayment speeds, etc.)
Level 3 - unobservable inputs (including the fund's own assumptions based on the best information available)
Changes in valuation techniques may result in transfers in or out of an assigned level within the disclosure hierarchy. The aggregate value of investments by input level, as of October 31, 2010, is included at the end of the Fund's Schedule of Investments. Valuation techniques used to value the Fund's investments by major category are as follows.
Equity securities, including restricted securities, for which market quotations are readily available, are valued at the last reported sale price or official closing price as reported by an independent pricing service on the primary market or exchange on which they are traded and are categorized as Level 1 in the hierarchy. In the event there were no sales during the day or closing prices are not available, securities are valued at the last quoted bid price or may be valued using the last available price and are generally categorized as Level 2 in the hierarchy. For foreign equity securities, when significant market or security specific events arise, comparisons to the valuation of American Depositary Receipts (ADRs), futures contracts, Exchange-traded funds (ETFs) and certain indexes as well as quoted prices for similar securities are used and are categorized as Level 2 in the hierarchy in these circumstances. Utilizing these techniques may result in significant transfers between Level 1 and Level 2. For restricted equity securities and private placements
Annual Report
Notes to Financial Statements - continued
3. Significant Accounting Policies - continued
Security Valuation - continued
where observable inputs are limited, assumptions about market activity and risk are used and are categorized as Level 3 in the hierarchy.
Investments in open-end mutual funds, including the Fidelity Central Funds, are valued at their closing net asset value each business day and are categorized as Level 1 in the hierarchy. Short-term securities with remaining maturities of sixty days or less for which quotations are not readily available are valued at amortized cost, which approximates fair value and are categorized as Level 2 in the hierarchy.
Foreign Currency. The Fund uses foreign currency contracts to facilitate transactions in foreign-denominated securities. Gains and losses from these transactions may arise from changes in the value of the foreign currency or if the counterparties do not perform under the contracts' terms.
Foreign-denominated assets, including investment securities, and liabilities are translated into U.S. dollars at the exchange rate at period end. Purchases and sales of investment securities, income and dividends received and expenses denominated in foreign currencies are translated into U.S. dollars at the exchange rate in effect on the transaction date.
The effects of exchange rate fluctuations on investments are included with the net realized and unrealized gain (loss) on investment securities. Other foreign currency transactions resulting in realized and unrealized gain (loss) are disclosed separately.
Investment Transactions and Income. For financial reporting purposes, the Fund's investment holdings and NAV include trades executed through the end of the last business day of the period. The NAV per share for processing shareholder transactions is calculated as of the close of business of the New York Stock Exchange (NYSE), normally 4:00 p.m. Eastern time and includes trades executed through the end of the prior business day. Gains and losses on securities sold are determined on the basis of identified cost. Dividend income is recorded on the ex-dividend date, except for certain dividends from foreign securities where the ex-dividend date may have passed, which are recorded as soon as the Fund is informed of the ex-dividend date. Non-cash dividends included in dividend income, if any, are recorded at the fair market value of the securities received. Distributions received on securities that represent a return of capital or capital gain are recorded as a reduction of cost of investments and/or as a realized gain. The Fund estimates the components of distributions received that may be considered return of capital distributions or capital gain distributions. Interest income and distributions from the Fidelity Central Funds are accrued as earned. Interest income includes coupon interest and amortization of premium and accretion of discount on debt securities.
Annual Report
3. Significant Accounting Policies - continued
Investment Transactions and Income - continued
Investment income is recorded net of foreign taxes withheld where recovery of such taxes is uncertain.
Expenses. Most expenses of the Trust can be directly attributed to a fund. Expenses which cannot be directly attributed are apportioned amongst each fund in the Trust. Expense estimates are accrued in the period to which they relate and adjustments are made when actual amounts are known.
Income Tax Information and Distributions to Shareholders. Each year the Fund intends to qualify as a regulated investment company, including distributing substantially all of its taxable income and realized gains under Subchapter M of the Internal Revenue Code and filing its U.S. federal tax return. As a result, no provision for income taxes is required. As of October 31, 2010, the Fund did not have any unrecognized tax benefits in the accompanying financial statements. A fund's federal tax return is subject to examination by the Internal Revenue Service (IRS) for a period of three years. Foreign taxes are provided for based on the Fund's understanding of the tax rules and rates that exist in the foreign markets in which it invests.
Distributions are declared and recorded on the ex-dividend date. Income dividends and capital gain distributions are declared separately for each class. Income and capital gain distributions are determined in accordance with income tax regulations, which may differ from GAAP.
Capital accounts within the financial statements are adjusted for permanent book-tax differences. These adjustments have no impact on net assets or the results of operations. Temporary book-tax differences will reverse in a subsequent period.
Book-tax differences are primarily due to the short-term gain distributions from the Fidelity Central Funds, foreign currency transactions, passive foreign investment companies (PFIC), capital loss carryforwards and losses deferred due to wash sales.
The federal tax cost of investment securities and unrealized appreciation (depreciation) as of period end were as follows:
Gross unrealized appreciation | $ 110,936,787 |
Gross unrealized depreciation | (8,823,890) |
Net unrealized appreciation (depreciation) | $ 102,112,897 |
| |
Tax Cost | $ 359,714,868 |
Annual Report
Notes to Financial Statements - continued
3. Significant Accounting Policies - continued
Income Tax Information and Distributions to Shareholders - continued
The tax-based components of distributable earnings as of period end were as follows:
Undistributed ordinary income | $ 5,260,449 |
Capital loss carryforward | $ (420,935,635) |
Net unrealized appreciation (depreciation) | $ 102,154,904 |
The tax character of distributions paid was as follows:
| October 31, 2010 | October 31, 2009 |
Ordinary Income | $ 7,928,671 | $ 140,700 |
Short-Term Trading (Redemption) Fees. Shares held by investors in the Fund less than 90 days are subject to a redemption fee equal to 2.00% of the net asset value of shares redeemed. All redemption fees, which reduce the proceeds of the shareholder redemption, are retained by the Fund and accounted for as an addition to paid in capital.
4. Purchases and Sales of Investments.
Purchases and sales of securities, other than short-term securities, aggregated $186,444,286 and $203,425,442, respectively.
5. Fees and Other Transactions with Affiliates.
Management Fee. FMR and its affiliates provide the Fund with investment management related services for which the Fund pays a monthly management fee. The management fee is the sum of an individual fund fee rate that is based on an annual rate of .60% of the Fund's average net assets and a group fee rate that averaged .26% during the period. The group fee rate is based upon the average net assets of all the mutual funds advised by FMR. The group fee rate decreases as assets under management increase and increases as assets under management decrease. In addition, the management fee is subject to a performance adjustment (up to a maximum of ±.20% of the Fund's average net assets over a 36 month performance period). The upward or downward adjustment to the management fee is based on relative investment performance of International Small Cap Opportunities as compared to an appropriate benchmark index. For the period, the total annual management fee rate, including the performance adjustment, was .47% of the Fund's average net assets.
Distribution and Service Plan Fees. In accordance with Rule 12b-1 of the 1940 Act, the Fund has adopted separate Distribution and Service Plans for each class of shares. Certain classes pay Fidelity Distributors Corporation (FDC), an affiliate of FMR, separate
Annual Report
5. Fees and Other Transactions with Affiliates - continued
Distribution and Service Plan Fees - continued
Distribution and Service Fees, each of which is based on an annual percentage of each class' average net assets. In addition, FDC may pay financial intermediaries for selling shares of the Fund and providing shareholder support services. For the period, the Distribution and Service Fee rates, total fees and amounts retained by FDC were as follows:
| Distribution
Fee | Service
Fee | Total
Fees | Retained
by FDC |
Class A | -% | .25% | $ 47,792 | $ 274 |
Class T | .25% | .25% | 54,808 | - |
Class B | .75% | .25% | 28,142 | 21,120 |
Class C | .75% | .25% | 86,027 | 7,949 |
| | | $ 216,769 | $ 29,343 |
Sales Load. FDC receives a front-end sales charge of up to 5.75% for selling Class A shares and 3.50% for selling Class T shares, some of which is paid to financial intermediaries for selling shares of the Fund. FDC receives the proceeds of contingent deferred sales charges levied on Class A, Class T, Class B, and Class C redemptions. These charges depend on the holding period. The deferred sales charges range from 5% to 1% for Class B, 1% for Class C, 1.00% for certain purchases of Class A shares (1.00% to .50% prior to July 12, 2010) and .25% for certain purchases of Class T shares.
For the period, sales charge amounts retained by FDC were as follows:
| Retained
by FDC |
Class A | $ 7,450 |
Class T | 2,287 |
Class B* | 7,594 |
Class C* | 697 |
| $ 18,028 |
* When Class B and Class C shares are initially sold, FDC pays commissions from its own resources to financial intermediaries through which the sales are made.
Transfer Agent Fees. Fidelity Investments Institutional Operations Company, Inc. (FIIOC), an affiliate of FMR, is the transfer, dividend disbursing and shareholder servicing agent for each class of the Fund. FIIOC receives account fees and asset-based fees that vary according to the account size and type of account of the shareholders of the respective classes of the Fund. FIIOC pays for typesetting, printing and mailing of shareholder reports, except proxy statements. For the period, transfer agent fees for each class were as follows:
Annual Report
Notes to Financial Statements - continued
5. Fees and Other Transactions with Affiliates - continued
Transfer Agent Fees - continued
| Amount | % of
Average
Net Assets |
Class A | $ 59,699 | .31 |
Class T | 35,532 | .32 |
Class B | 8,814 | .31 |
Class C | 26,844 | .31 |
International Small Cap Opportunities | 1,055,328 | .30 |
Institutional Class | 5,503 | .30 |
| $ 1,191,720 | |
Accounting and Security Lending Fees. Fidelity Service Company, Inc. (FSC), an affiliate of FMR, maintains the Fund's accounting records. The accounting fee is based on the level of average net assets for the month. Under a separate contract, FSC administers the security lending program. The security lending fee is based on the number and duration of lending transactions.
Brokerage Commissions. The Fund placed a portion of its portfolio transactions with brokerage firms which are affiliates of the investment adviser. The commissions paid to these affiliated firms were $1,186 for the period.
6. Committed Line of Credit.
The Fund participates with other funds managed by FMR or an affiliate in a $3.75 billion credit facility (the "line of credit") to be utilized for temporary or emergency purposes to fund shareholder redemptions or for other short-term liquidity purposes. The Fund has agreed to pay commitment fees on its pro-rata portion of the line of credit, which amounted to $1,513 and is reflected in Miscellaneous expenses on the Statement of Operations. During the period, there were no borrowings on this line of credit.
7. Security Lending.
The Fund lends portfolio securities through a lending agent from time to time in order to earn additional income. The lending agent may loan securities to certain qualified borrowers, including Fidelity Capital Markets (FCM), a broker-dealer affiliated with the Fund. On the settlement date of the loan, the Fund receives collateral (in the form of U.S. Treasury obligations, letters of credit and/or cash) against the loaned securities and maintains collateral in an amount not less than 100% of the market value of the loaned securities during the period of the loan. The market value of the loaned securities is determined at the close of business of the Fund and any additional required collateral is
Annual Report
7. Security Lending - continued
delivered to the Fund on the next business day. If the borrower defaults on its obligation to return the securities loaned because of insolvency or other reasons, a fund could experience delays and costs in recovering the securities loaned or in gaining access to the collateral. Any cash collateral received is invested in the Fidelity Securities Lending Cash Central Fund. The value of loaned securities and cash collateral at period end are disclosed on the Fund's Statement of Assets and Liabilities. Security lending income represents the income earned on investing cash collateral, less rebates paid to borrowers and lending agent fees associated with the loan, plus any premium payments received for lending certain types of securities. Security lending income is presented in the Statement of Operations as a component of income from Fidelity Central Funds. Total security lending income during the period amounted to $263,176. During the period, there were no securities loaned to FCM.
8. Expense Reductions.
Many of the brokers with whom FMR places trades on behalf of the Fund provided services to the Fund in addition to trade execution. These services included payments of certain expenses on behalf of the Fund totaling $55,920 for the period.
9. Distributions to Shareholders.
Distributions to shareholders of each class were as follows:
Years ended October 31, | 2010 | 2009 |
From net investment income | | |
Class A | $ 167,529 | $ - |
Class T | 81,809 | - |
Class B | 11,651 | - |
Class C | 35,378 | - |
International Small Cap Opportunities | 3,548,259 | 138,653 |
Institutional Class | 16,552 | 2,047 |
Total | $ 3,861,178 | $ 140,700 |
From net realized gain | | |
Class A | $ 203,751 | $ - |
Class T | 126,944 | - |
Class B | 31,778 | - |
Class C | 96,486 | - |
International Small Cap Opportunities | 3,588,127 | - |
Institutional Class | 20,407 | - |
Total | $ 4,067,493 | $ - |
Annual Report
Notes to Financial Statements - continued
10. Share Transactions.
Transactions for each class of shares were as follows:
| Shares | Dollars |
Years ended October 31, | 2010 | 2009 | 2010 | 2009 |
Class A | | | | |
Shares sold | 502,676 | 560,746 | $ 4,331,157 | $ 3,588,317 |
Reinvestment of distributions | 39,668 | - | 334,402 | - |
Shares redeemed | (821,208) | (1,093,254) | (7,086,973) | (6,722,964) |
Net increase (decrease) | (278,864) | (532,508) | $ (2,421,414) | $ (3,134,647) |
Class T | | | | |
Shares sold | 202,721 | 318,902 | $ 1,752,774 | $ 2,064,516 |
Reinvestment of distributions | 24,207 | - | 202,613 | - |
Shares redeemed | (563,942) | (704,037) | (4,787,797) | (4,201,658) |
Net increase (decrease) | (337,014) | (385,135) | $ (2,832,410) | $ (2,137,142) |
Class B | | | | |
Shares sold | 33,509 | 50,745 | $ 282,738 | $ 317,874 |
Reinvestment of distributions | 4,957 | - | 40,893 | - |
Shares redeemed | (89,943) | (133,859) | (751,714) | (788,113) |
Net increase (decrease) | (51,477) | (83,114) | $ (428,083) | $ (470,239) |
Class C | | | | |
Shares sold | 138,774 | 196,866 | $ 1,172,961 | $ 1,233,043 |
Reinvestment of distributions | 13,874 | - | 114,325 | - |
Shares redeemed | (301,965) | (662,831) | (2,545,004) | (3,650,532) |
Net increase (decrease) | (149,317) | (465,965) | $ (1,257,718) | $ (2,417,489) |
International Small Cap Opportunities | | | | |
Shares sold | 11,750,215 | 7,245,986 | $ 101,991,968 | $ 48,782,866 |
Reinvestment of distributions | 792,800 | 21,738 | 6,738,804 | 128,470 |
Shares redeemed | (12,779,026) | (16,613,794) | (110,633,144) | (102,979,613) |
Net increase (decrease) | (236,011) | (9,346,070) | $ (1,902,372) | $ (54,068,277) |
Institutional Class | | | | |
Shares sold | 111,833 | 256,950 | $ 1,028,388 | $ 1,455,739 |
Reinvestment of distributions | 3,263 | 122 | 27,765 | 720 |
Shares redeemed | (119,898) | (1,302,675) | (1,034,340) | (7,362,592) |
Net increase (decrease) | (4,802) | (1,045,603) | $ 21,813 | $ (5,906,133) |
Annual Report
11. Other.
The Fund's organizational documents provide former and current trustees and officers with a limited indemnification against liabilities arising in connection with the performance of their duties to the Fund. In the normal course of business, the Fund may also enter into contracts that provide general indemnifications. The Fund's maximum exposure under these arrangements is unknown as this would be dependent on future claims that may be made against the Fund. The risk of material loss from such claims is considered remote.
Annual Report
To the Trustees of Fidelity Investment Trust and Shareholders of Fidelity International Small Cap Opportunities Fund:
We have audited the accompanying statement of assets and liabilities of Fidelity International Small Cap Opportunities Fund (the Fund), a fund of Fidelity Investment Trust, including the schedule of investments, as of October 31, 2010, and the related statement of operations for the year then ended, the statement of changes in net assets for each of the two years in the period then ended, and the financial highlights for each of the five years in the period then ended. These financial statements and financial highlights are the responsibility of the Fund's management. Our responsibility is to express an opinion on these financial statements and financial highlights based on our audits.
We conducted our audits in accordance with standards of the Public Company Accounting Oversight Board (United States). Those standards require that we plan and perform the audit to obtain reasonable assurance about whether the financial statements and financial highlights are free of material misstatement. The Fund is not required to have, nor were we engaged to perform, an audit of its internal control over financial reporting. Our audits included consideration of internal control over financial reporting as a basis for designing audit procedures that are appropriate in the circumstances, but not for the purpose of expressing an opinion on the effectiveness of the Fund's internal control over financial reporting. Accordingly, we express no such opinion. An audit also includes examining, on a test basis, evidence supporting the amounts and disclosures in the financial statements, assessing the accounting principles used and significant estimates made by management, as well as evaluating the overall financial statement presentation. Our procedures included confirmation of securities owned as of October 31, 2010, by correspondence with the custodians and brokers; where replies were not received from brokers, we performed other auditing procedures. We believe that our audits provide a reasonable basis for our opinion.
In our opinion, the financial statements and financial highlights referred to above present fairly, in all material respects, the financial position of Fidelity International Small Cap Opportunities Fund as of October 31, 2010, the results of its operations for the year then ended, the changes in its net assets for each of the two years in the period then ended, and the financial highlights for each of the five years in the period then ended, in conformity with accounting principles generally accepted in the United States of America.
/s/ Deloitte & Touche LLP
DELOITTE & TOUCHE LLP
Boston, Massachusetts
December 16, 2010
Annual Report
The Trustees, Member of the Advisory Board, and executive officers of the trust and fund, as applicable, are listed below. The Board of Trustees governs the fund and is responsible for protecting the interests of shareholders. The Trustees are experienced executives who meet periodically throughout the year to oversee the fund's activities, review contractual arrangements with companies that provide services to the fund, oversee management of the risks associated with such activities and contractual arrangements, and review the fund's performance. Except for James C. Curvey, each of the Trustees oversees 221 funds advised by FMR or an affiliate. Mr. Curvey oversees 410 funds advised by FMR or an affiliate.
The Trustees hold office without limit in time except that (a) any Trustee may resign; (b) any Trustee may be removed by written instrument, signed by at least two-thirds of the number of Trustees prior to such removal; (c) any Trustee who requests to be retired or who has become incapacitated by illness or injury may be retired by written instrument signed by a majority of the other Trustees; and (d) any Trustee may be removed at any special meeting of shareholders by a two-thirds vote of the outstanding voting securities of the trust. Each Trustee who is not an interested person (as defined in the 1940 Act) (Independent Trustee), shall retire not later than the last day of the calendar year in which his or her 72nd birthday occurs. The Independent Trustees may waive this mandatory retirement age policy with respect to individual Trustees. The executive officers and Advisory Board Member hold office without limit in time, except that any officer and Advisory Board Member may resign or may be removed by a vote of a majority of the Trustees at any regular meeting or any special meeting of the Trustees. Except as indicated, each individual has held the office shown or other offices in the same company for the past five years.
Experience, Skills, Attributes, and Qualifications of the Fund's Trustees. The Governance and Nominating Committee has adopted a statement of policy that describes the experience, qualifications, attributes, and skills that are necessary and desirable for potential Independent Trustee candidates (Statement of Policy). The Board believes that each Trustee satisfied at the time he or she was initially elected or appointed a Trustee, and continues to satisfy, the standards contemplated by the Statement of Policy. The Governance and Nominating Committee also engages professional search firms to help identify potential Independent Trustee candidates who have the experience, qualifications, attributes, and skills consistent with the Statement of Policy. From time to time, additional criteria based on the composition and skills of the current Independent Trustees, as well as experience or skills that may be appropriate in light of future changes to board composition, business conditions, and regulatory or other developments, have also been considered by the professional search firms and the Governance and Nominating Committee. In addition, the Board takes into account the Trustees' commitment and participation in Board and committee meetings, as well as their leadership of standing and ad hoc committees throughout their tenure.
In determining that a particular Trustee was and continues to be qualified to serve as a Trustee, the Board has considered a variety of criteria, none of which, in isolation, was controlling. The Board believes that, collectively, the Trustees have balanced and diverse experience, qualifications, attributes, and skills, which allow the Board to operate effectively in governing the fund and protecting the interests of shareholders. Information about the specific experience, skills, attributes, and qualifications of each Trustee, which in each case led to the Board's conclusion that the Trustee should serve (or continue to serve) as a trustee of the fund, is provided below.
Annual Report
Board Structure and Oversight Function. Edward C. Johnson 3d is an interested person (as defined in the 1940 Act) and currently serves as Chairman. The Trustees have determined that an interested Chairman is appropriate and benefits shareholders because an interested Chairman has a personal and professional stake in the quality and continuity of services provided to the fund. Independent Trustees exercise their informed business judgment to appoint an individual of their choosing to serve as Chairman, regardless of whether the Trustee happens to be independent or a member of management. The Independent Trustees have determined that they can act independently and effectively without having an Independent Trustee serve as Chairman and that a key structural component for assuring that they are in a position to do so is for the Independent Trustees to constitute a substantial majority for the Board. The Independent Trustees also regularly meet in executive session. Ned C. Lautenbach serves as Chairman of the Independent Trustees and as such (i) acts as a liaison between the Independent Trustees and management with respect to matters important to the Independent Trustees and (ii) with management prepares agendas for Board meetings.
Fidelity funds are overseen by different Boards of Trustees. The fund's Board oversees Fidelity's equity and high income funds and another Board oversees Fidelity's investment-grade bond, money market, and asset allocation funds. The asset allocation funds may invest in Fidelity funds overseen by the fund's Board. The use of separate Boards, each with its own committee structure, allows the Trustees of each group of Fidelity funds to focus on the unique issues of the funds they oversee, including common research, investment, and operational issues. On occasion, the separate Boards establish joint committees to address issues of overlapping consequences for the Fidelity funds overseen by each Board.
The Trustees operate using a system of committees to facilitate the timely and efficient consideration of all matters of importance to the Trustees, the fund, and fund shareholders and to facilitate compliance with legal and regulatory requirements and oversight of the fund's activities and associated risks. The Board, acting through its committees, has charged FMR and its affiliates with (i) identifying events or circumstances the occurrence of which could have demonstrably adverse effects on the fund's business and/or reputation; (ii) implementing processes and controls to lessen the possibility that such events or circumstances occur or to mitigate the effects of such events or circumstances if they do occur; and (iii) creating and maintaining a system designed to evaluate continuously business and market conditions in order to facilitate the identification and implementation processes described in (i) and (ii) above. Because the day-to-day operations and activities of the fund are carried out by or through FMR, its affiliates and other service providers, the fund's exposure to risks is mitigated but not eliminated by the processes overseen by the Trustees. While each of the Board's committees has responsibility for overseeing different aspects of the fund's activities, oversight is exercised primarily through the Operations, Audit, and Compliance Committees. Appropriate personnel, including but not limited to the fund's Chief Compliance Officer (CCO), FMR's internal auditor, the independent accountants, the fund's Treasurer and portfolio management personnel, make periodic reports to the Board's committees, as appropriate. The responsibilities of each committee, including their oversight responsibilities, are described further under "Standing Committees of the Fund's Trustees."
Annual Report
Trustees and Officers - continued
The fund's Statement of Additional Information (SAI) includes more information about the Trustees. To request a free copy, call Fidelity at 1-877-208-0098.
Interested Trustees*:
Correspondence intended for each Trustee who is an interested person may be sent to Fidelity Investments, 82 Devonshire Street, Boston, Massachusetts 02109.
Name, Age; Principal Occupations and Other Relevant Experience+ |
Edward C. Johnson 3d (80) |
| Year of Election or Appointment: 1984 Mr. Johnson is Trustee and Chairman of the Board of Trustees of certain Trusts. Mr. Johnson serves as Chief Executive Officer, Chairman, and a Director of FMR LLC; Chairman and a Director of FMR; Chairman and a Director of Fidelity Research & Analysis Company (FRAC); Chairman and a Director of Fidelity Investments Money Management, Inc.; and Chairman and a Director of FMR Co., Inc. In addition, Mr. Johnson serves as Chairman and Director of FIL Limited. Previously, Mr. Johnson served as President of FMR LLC (2006-2007). |
James C. Curvey (75) |
| Year of Election or Appointment: 2007 Mr. Curvey also serves as Trustee (2007-present) of other investment companies advised by FMR. Mr. Curvey is a Director of Fidelity Investments Money Management, Inc. (2009-present), Director of Fidelity Research & Analysis Co. (2009-present) and Director of FMR and FMR Co., Inc. (2007-present). Mr. Curvey is also Vice Chairman (2007-
present) and Director of FMR LLC. In addition, Mr. Curvey serves as an Overseer for the Boston Symphony Orchestra and a member of the Trustees of Villanova University. Previously, Mr. Curvey was the Vice Chairman (2006-2007) and Director (2000-2007) of FMR Corp. |
Annual Report
* Trustees have been determined to be "Interested Trustees" by virtue of, among other things, their affiliation with the trust or various entities under common control with FMR.
+ The information above includes each Trustee's principal occupation during the last five years and other information relating to the experience, attributes, and skills relevant to each Trustee's qualifications to serve as a Trustee, which led to the conclusion that each Trustee should serve as a Trustee for the fund.
Independent Trustees:
Correspondence intended for each Independent Trustee (that is, the Trustees other than the Interested Trustees) may be sent to Fidelity Investments, P.O. Box 55235, Boston, Massachusetts 02205-5235.
Name, Age; Principal Occupations and Other Relevant Experience+ |
Dennis J. Dirks (62) |
| Year of Election or Appointment: 2005 Prior to his retirement in May 2003, Mr. Dirks was Chief Operating Officer and a member of the Board of The Depository Trust & Clearing Corporation (DTCC). He also served as President, Chief Operating Officer, and Board member of The Depository Trust Company (DTC) and President and Board member of the National Securities Clearing Corporation (NSCC). In addition, Mr. Dirks served as Chief Executive Officer and Board member of the Government Securities Clearing Corporation, Chief Executive Officer and Board member of the Mortgage-Backed Securities Clearing Corporation, as a Trustee and a member of the Finance Committee of Manhattan College (2005-2008), and as a Trustee and a member of the Finance Committee of AHRC of Nassau County (2006-2008). Mr. Dirks is a member of the Independent Directors Council (IDC) Governing Council (2010-Present) and Board of Directors for The Brookville Center for Children's Services, Inc. (2009-present). |
Alan J. Lacy (57) |
| Year of Election or Appointment: 2008 Mr. Lacy serves as Senior Adviser (2007-present) of Oak Hill Capital Partners, L.P. (private equity). Mr. Lacy also served as Chief Executive Officer (2000-2005) and Vice Chairman (2005-2006) of Sears Holdings Corporation and Sears, Roebuck and Co. (retail). In addition, Mr. Lacy serves as a member of the Board of Directors of The Western Union Company (global money transfer, 2006-present) and Bristol-Myers Squibb Company (global pharmaceuticals, 2007-present). Mr. Lacy is Chairman (2008-present) and a member (2006-present) of the Board of Trustees of The National Parks Conservation Association. |
Ned C. Lautenbach (66) |
| Year of Election or Appointment: 2000 Mr. Lautenbach is Chairman of the Independent Trustees of the Equity and High Income Funds (2006-present). Mr. Lautenbach currently serves as the Lead Director of the Eaton Corporation Board of Directors (diversified industrial, 1997-present). Mr. Lautenbach is also a member of the Board of Directors of the Philharmonic Center for the Arts in Naples, Florida (1999-present); a member of the Board of Trustees of Fairfield University (2005-present); and a member of the Council on Foreign Relations (1994-present). Previously, Mr. Lautenbach was a Partner/Advisory Partner at Clayton, Dubilier & Rice, Inc. (private equity investment, 1998-2010), as well as a Director of Sony Corporation (2006-2007). |
Joseph Mauriello (66) |
| Year of Election or Appointment: 2008 Prior to his retirement in January 2006, Mr. Mauriello served in numerous senior management positions including Deputy Chairman and Chief Operating Officer (2004-2005), and Vice Chairman of Financial Services (2002-2004) of KPMG LLP US (professional services, 1965-2005). Mr. Mauriello currently serves as a member of the Board of Directors of XL Group plc. (global insurance and re-insurance, 2006-present) and of Arcadia Resources Inc. (health care services and products, 2007-present). Previously, Mr. Mauriello served as a Director of the Hamilton Funds of the Bank of New York (2006-2007). |
Cornelia M. Small (66) |
| Year of Election or Appointment: 2005 Ms. Small is a member of the Board of Directors of the Teagle Foundation (2009-present). Ms. Small is also a member of the Investment Committee, and Chair (2008-present) and a member of the Board of Trustees of Smith College. In addition, Ms. Small serves on the Investment Committee of the Berkshire Taconic Community Foundation (2008-present). Previously, Ms. Small served as Chairperson of the Investment Committee (2002-2008) of Smith College. In addition, Ms. Small served as Chief Investment Officer, Director of Global Equity Investments, and a member of the Board of Directors of Scudder, Stevens & Clark and Scudder Kemper Investments. |
William S. Stavropoulos (71) |
| Year of Election or Appointment: 2001 Mr. Stavropoulos is Vice Chairman of the Independent Trustees of the Equity and High Income Funds (2006-present). Mr. Stavropoulos serves as President and Founder of the Michigan Baseball Foundation, the Great Lakes Loons (2007-present). Mr. Stavropoulos is Chairman Emeritus of the Board of Directors of The Dow Chemical Company, where he previously served in numerous senior management positions, including President, CEO (1995-2000; 2002-2004), Chairman of the Executive Committee (2000-2006), and as a member of the Board of Directors (1990-2006). Currently, Mr. Stavropoulos is Chairman of Univar (global distributor of commodity and specialty chemicals, 2010-present), a Director of Teradata Corporation (data warehousing and technology solutions, 2008-present), Chemical Financial Corporation, Maersk Inc. (industrial conglomerate), Tyco International, Inc. (multinational manufacturing and services, 2007-present), and a member of the Advisory Board for Metalmark Capital (private equity investment, 2005-present). Mr. Stavropoulos is a special advisor to Clayton, Dubilier & Rice, Inc. (private equity investment). In addition, Mr. Stavropoulos is a member of the University of Notre Dame Advisory Council for the College of Science. |
David M. Thomas (61) |
| Year of Election or Appointment: 2008 Previously, Mr. Thomas served as Executive Chairman (2005-2006) and Chairman and Chief Executive Officer (2000-2005) of IMS Health, Inc. (pharmaceutical and healthcare information solutions). In addition, Mr. Thomas serves as a member of the Board of Directors of Fortune Brands, Inc. (consumer products), and Interpublic Group of Companies, Inc. (marketing communication, 2004-present). |
Michael E. Wiley (60) |
| Year of Election or Appointment: 2008 Mr. Wiley also serves as a Director of Asia Pacific Exploration Consolidated (international oil and gas exploration and production, 2008-
present). Mr. Wiley serves as a Director of Tesoro Corporation (independent oil refiner and marketer, 2005-present), and a Director of Bill Barrett Corporation (exploration and production, 2005-present). In addition, Mr. Wiley also serves as a Director of Post Oak Bank (privately-held bank, 2004-present). Previously, Mr. Wiley served as a member of the Board of Trustees of the University of Tulsa (2000-2006; 2007-2010), as a Senior Energy Advisor of Katzenbach Partners, LLC (consulting, 2006-2007), as an Advisory Director of Riverstone Holdings (private investment), Chairman, President, and CEO of Baker Hughes, Inc. (oilfield services, 2000- 2004), and as Director of Spinnaker Exploration Company (exploration and production, 2001-2005). |
Annual Report
Trustees and Officers - continued
+ The information above includes each Trustee's principal occupation during the last five years and other information relating to the experience, attributes, and skills relevant to each Trustee's qualifications to serve as a Trustee, which led to the conclusion that each Trustee should serve as a Trustee for the fund.
Advisory Board Member and Executive Officers:
Correspondence intended for each executive officer and Peter S. Lynch may be sent to Fidelity Investments, 82 Devonshire Street, Boston, Massachusetts 02109.
Name, Age; Principal Occupation |
Peter S. Lynch (66) |
| Year of Election or Appointment: 2003 Member of the Advisory Board of Fidelity's Equity and High Income Funds. Mr. Lynch is Vice Chairman and a Director of FMR and FMR Co., Inc. In addition, Mr. Lynch serves as a Trustee of Boston College and as the Chairman of the Inner-City Scholarship Fund. Previously, Mr. Lynch served on the Special Olympics International Board of Directors (1997-2006). |
Kenneth B. Robins (41) |
| Year of Election or Appointment: 2008 President and Treasurer of Fidelity's Equity and High Income Funds. Mr. Robins also serves as President and Treasurer (2010-present) and Assistant Treasurer (2009-present) of other Fidelity funds and is an employee of Fidelity Investments (2004-present). Previously, Mr. Robins served as Deputy Treasurer of the Fidelity funds (2005-2008) and Treasurer and Chief Financial Officer of The North Carolina Capital Management Trust: Cash and Term Portfolios (2006-2008). |
Thomas C. Hense (46) |
| Year of Election or Appointment: 2008 or 2010 Vice President of Fidelity's High Income (2008), Small Cap (2008), and Value (2010) Funds. Previously, Mr. Hense served as a portfolio manager for Fidelity's Institutional Money Management Group (Pyramis) (2003-2008). |
Brian B. Hogan (46) |
| Year of Election or Appointment: 2009 Vice President of certain Equity Funds and Vice President of Sector Funds. Mr. Hogan also serves as President of FMR's Equity Division (2009-present). Previously, Mr. Hogan served as Senior Vice President, Equity Research of FMR (2006-2009) and as a portfolio manager. |
Scott C. Goebel (42) |
| Year of Election or Appointment: 2008 Secretary and Chief Legal Officer (CLO) of the Fidelity funds. Mr. Goebel also serves as Secretary and CLO of The North Carolina Capital Management Trust: Cash and Term Portfolio (2008-present); General Counsel, Secretary, and Senior Vice President of FMR (2008-present) and FMR Co., Inc. (2008-present); Deputy General Counsel of FMR LLC; Chief Legal Officer of Fidelity Management & Research (Hong Kong) Limited (2008-present) and Assistant Secretary of Fidelity Management & Research (Japan) Inc. (2008-present), Fidelity Investments Money Management, Inc. (2008-present), Fidelity Management & Research (U.K.) Inc. (2008-present), and Fidelity Research and Analysis Company (2008- present). Previously, Mr. Goebel served as Assistant Secretary of the Funds (2007-2008) and as Vice President and Secretary of Fidelity Distributors Corporation (FDC) (2005-2007). |
William C. Coffey (41) |
| Year of Election or Appointment: 2009 Assistant Secretary of Fidelity's Equity and High Income Funds. Mr. Coffey also serves as Senior Vice President and Deputy General Counsel of FMR LLC (2010-present), and is an employee of Fidelity Investments. Previously, Mr. Coffey served as Vice President and Associate General Counsel of FMR LLC (2005-2009). |
Holly C. Laurent (56) |
| Year of Election or Appointment: 2008 Anti-Money Laundering (AML) Officer of the Fidelity funds. Ms. Laurent also serves as AML Officer of The North Carolina Capital Management Trust: Cash and Term Portfolio (2008-present) and is an employee of Fidelity Investments. Previously, Ms. Laurent was Senior Vice President and Head of Legal for Fidelity Business Services India Pvt. Ltd. (2006- 2008), and Senior Vice President, Deputy General Counsel and Group Head for FMR LLC (2005-2006). |
Christine Reynolds (52) |
| Year of Election or Appointment: 2008 Chief Financial Officer of the Fidelity funds. Ms. Reynolds became President of Fidelity Pricing and Cash Management Services (FPCMS) in August 2008. Ms. Reynolds served as Chief Operating Officer of FPCMS (2007-2008). Previously, Ms. Reynolds served as President, Treasurer, and Anti-Money Laundering officer of the Fidelity funds (2004-2007). |
Kenneth A. Rathgeber (63) |
| Year of Election or Appointment: 2004 Chief Compliance Officer of Fidelity's Equity and High Income Funds. Mr. Rathgeber is Chief Compliance Officer of Fidelity Management & Research (Hong Kong) Limited (2008-present), Fidelity Management & Research (Japan) Inc. (2008-present), FMR (2005-present), FMR Co., Inc. (2005-present), Fidelity Management & Research (U.K.) Inc. (2005-present), Fidelity Research & Analysis Company (2005-present), Fidelity Investments Money Management, Inc. (2005-present), Pyramis Global Advisors, LLC (2005-present), and Strategic Advisers, Inc. (2005-present). |
Jeffrey S. Christian (49) |
| Year of Election or Appointment: 2009 Deputy Treasurer of the Fidelity funds. Mr. Christian is an employee of Fidelity Investments. Previously, Mr. Christian served as Chief Financial Officer (2008-2009) of certain Fidelity funds and Senior Vice President of Fidelity Pricing and Cash Management Services (FPCMS) (2004-2009). |
Bryan A. Mehrmann (49) |
| Year of Election or Appointment: 2005 Deputy Treasurer of the Fidelity funds. Mr. Mehrmann is an employee of Fidelity Investments. |
Adrien E. Deberghes (43) |
| Year of Election or Appointment: 2008 Deputy Treasurer of Fidelity's Equity and High Income Funds. Mr. Deberghes also serves as Assistant Treasurer of other Fidelity funds (2010-present) and is an employee of Fidelity Investments (2008-
present). Previously, Mr. Deberghes served as Senior Vice President of Mutual Fund Administration at State Street Corporation (2007-2008), Senior Director of Mutual Fund Administration at Investors Bank & Trust (2005-2007), and Director of Finance for Dunkin' Brands (2000-2005). |
Stephanie J. Dorsey (41) |
| Year of Election or Appointment: 2010 Assistant Treasurer of Fidelity's Equity and High Income Funds. Ms. Dorsey also serves as Deputy Treasurer of other Fidelity funds (2008-present) and is an employee of Fidelity Investments (2008-present). Previously, Ms. Dorsey served as Treasurer (2004-2008) of the JPMorgan Mutual Funds and Vice President (2004-2008) of JPMorgan Chase Bank. |
John R. Hebble (52) |
| Year of Election or Appointment: 2009 Assistant Treasurer of Fidelity's Equity and High Income Funds. Mr. Hebble also serves as Treasurer and Chief Financial Officer of The North Carolina Capital Management Trust: Cash and Term Portfolio (2008-present), President and Treasurer of other Fidelity funds (2008-present) and is an employee of Fidelity Investments. |
Gary W. Ryan (52) |
| Year of Election or Appointment: 2005 Assistant Treasurer of the Fidelity funds. Mr. Ryan is an employee of Fidelity Investments. Previously, Mr. Ryan served as Vice President of Fund Reporting in Fidelity Pricing and Cash Management Services (FPCMS) (1999-2005). |
Jonathan Davis (42) |
| Year of Election or Appointment: 2010 Assistant Treasurer of the Fidelity funds. Mr. Davis is an employee of Fidelity Investments. Previously, Mr. Davis served as Vice President and Associate General Counsel of FMR LLC (2003-2010). |
Annual Report
The Board of Trustees of Advisor International Small Cap Opportunities Fund voted to pay to shareholders of record at the opening of business on record date, the following distributions per share derived from capital gains realized from sales of portfolio securities, and dividends derived from net investment income:
| Pay Date | Record Date | Dividends | Capital Gains |
Institutional Class | 12/06/10 | 12/03/10 | $0.089 | $0.04 |
Institutional Class designates 52% of the dividends distributed during the fiscal year as amounts which may be taken into account as a dividend for the purposes of the maximum rate under section 1(h)(11) of the Internal Revenue Code.
The amounts per share which represent income derived from sources within, and taxes paid to, foreign countries or possessions of the United States are as follows:
| Pay Date | Income | Taxes |
Institutional Class | 12/07/09 | $0.075 | $0.0064 |
The fund will notify shareholders in January 2011 of amounts for use in preparing 2010 income tax returns.
Annual Report
Board Approval of Investment Advisory Contracts and Management Fees
Fidelity International Small Cap Opportunities Fund
Each year, the Board of Trustees, including the Independent Trustees (together, the Board), votes on the renewal of the management contract and sub-advisory agreements (together, the Advisory Contracts) for the fund. The Board, assisted by the advice of fund counsel and Independent Trustees' counsel, requests and considers a broad range of information relevant to the renewal of the Advisory Contracts throughout the year.
The Board meets regularly and considers at each of its meetings factors that are relevant to its annual consideration of the renewal of the fund's Advisory Contracts, including the services and support provided to the fund and its shareholders. The Board has established various standing committees, each composed of Independent Trustees with varying backgrounds, to which the Board has assigned specific subject matter responsibilities in order to enhance effective decision-making by the Board. The Board, acting directly and through its Committees, requests and receives information concerning the annual consideration of the renewal of the fund's Advisory Contracts. The Board also meets as needed to consider matters specifically related to the Board's annual consideration of the renewal of Advisory Contracts. Members of the Board may also meet with trustees of other Fidelity funds through ad hoc joint committees to discuss certain matters relevant to the Fidelity funds.
At its July 2010 meeting, the Board of Trustees, including the Independent Trustees, unanimously determined to renew the fund's Advisory Contracts. In reaching its determination, the Board considered all factors it believed relevant, including (i) the nature, extent, and quality of the services to be provided to the fund and its shareholders (including the investment performance of the fund); (ii) the competitiveness of the fund's management fee and total expenses; (iii) the total costs of the services to be provided by and the profits to be realized by Fidelity from its relationship with the fund; (iv) the extent to which economies of scale would be realized as the fund grows; and (v) whether fee levels reflect these economies of scale, if any, for the benefit of fund shareholders.
In considering whether to renew the Advisory Contracts for the fund, the Board reached a determination, with the assistance of fund counsel and Independent Trustees' counsel and through the exercise of its business judgment, that the renewal of the Advisory Contracts is in the best interests of fund shareholders and that the compensation to be received by Fidelity under the management contract is fair and reasonable. The Board's decision to renew the Advisory Contracts was not based on any single factor noted above, but rather was based on a comprehensive consideration of all the information provided to the Board at its meetings throughout the year. The Board, in reaching its determination to renew the Advisory Contracts, is aware that shareholders in the fund have a broad range of investment choices available to them, including a wide choice among mutual funds offered by Fidelity's competitors, and that the fund's shareholders, with the opportunity to review and weigh the disclosure provided by the fund in its prospectus and other public disclosures, have chosen to invest in this fund, managed by Fidelity.
Annual Report
Nature, Extent, and Quality of Services Provided. The Board considered the staffing within the investment adviser, FMR, and the sub-advisers (together, the Investment Advisers), including the backgrounds of the fund's investment personnel and the fund's investment objective and discipline. The Independent Trustees also had discussions with senior management of Fidelity's investment operations and investment groups. The Board considered the structure of the portfolio manager compensation program and whether this structure provides appropriate incentives to act in the best interest of the fund.
Resources Dedicated to Investment Management and Support Services. The Board and the equity research subcommittee of the Board's Fund Oversight Committee reviewed the size, education, and experience of the Investment Advisers' investment staff, their use of technology, and the Investment Advisers' approach to recruiting, training, and retaining portfolio managers and other research, advisory, and management personnel. The Board noted that Fidelity's analysts have access to a variety of technological tools and market and securities data that enable them to perform both fundamental and quantitative analysis and to specialize in various disciplines. The Board considered Fidelity's extensive global research capabilities that enable the Investment Advisers to aggregate data from various sources in an effort to produce positive investment results. The Board also considered that Fidelity's portfolio managers and analysts have access to daily portfolio attribution that allows for monitoring of a fund's portfolio, as well as an electronic communication system that provides immediate real-time access to research concerning issuers and credit enhancers. The Board noted FMR's continued focus on strengthening the organization and discipline of equity portfolio management and research.
Shareholder and Administrative Services. The Board considered (i) the nature, extent, quality, and cost of advisory, administrative, and shareholder services performed by the Investment Advisers and their affiliates under the Advisory Contracts and under separate agreements covering transfer agency, pricing and bookkeeping, and securities lending services for the fund; (ii) the nature and extent of the investment adviser's supervision of third party service providers, principally custodians and subcustodians; and (iii) the resources devoted to, and the record of compliance with, the fund's compliance policies and procedures. The Board also reviewed the allocation of fund brokerage, including allocations to brokers affiliated with the Investment Advisers, the use of brokerage commissions to pay fund expenses, and the use of "soft" commission dollars to pay for research services.
The Board noted that the growth of fund assets over time across the complex allows Fidelity to reinvest in the development of services designed to enhance the value or convenience of the Fidelity funds as investment vehicles. These services include 24-hour access to account information and market information through phone representatives and over the Internet, and investor education materials and asset allocation tools.
Annual Report
Board Approval of Investment Advisory Contracts and
Management Fees - continued
Investment in a Large Fund Family. The Board considered the benefits to shareholders of investing in a Fidelity fund, including the benefits of investing in a fund that is part of a large family of funds offering a variety of investment disciplines and providing a large variety of mutual fund investor services. The Board noted that Fidelity had taken, or had made recommendations that resulted in the Fidelity funds taking, a number of actions over the previous year that benefited particular funds, including (i) dedicating additional resources to investment research and restructuring and broadening the focus of the investment research teams; (ii) bolstering the senior management team that oversees asset management; (iii) launching Class F of certain funds as a lower-fee class available to Freedom K and Freedom Index Funds; (iv) lowering the initial investment minimums and ongoing balance requirements for Real Estate High Income Fund; (v) eliminating subsequent purchase minimums for all funds and adding a waiver of the investment minimum requirement for new accounts opened with the proceeds of a systematic withdrawal plan; (vi) eliminating the withdrawal minimum and maximum limits for systematic withdrawals from Advisor funds; (vii) expanding sales load waivers on Class A shares for Destiny Planholders and expanding Institutional Class eligibility for Class O Destiny Planholders; and (viii) changing certain Class A and Class T sales charge structures to further align them with industry practices.
Investment Performance. The Board considered whether the fund has operated in accordance with its investment objective, as well as its record of compliance with its investment restrictions. It also reviewed the fund's absolute investment performance for each class, as well as the fund's relative investment performance for each class measured over multiple periods against (i) a broad-based securities market index, and (ii) a peer group of mutual funds deemed appropriate by Fidelity and reviewed by the Board. Because the fund had been in existence less than five calendar years, the following charts considered by the Board show, over the one- and three-year periods ended December 31, 2009, the cumulative total returns of Institutional Class (Class I) and Class B of the fund, the cumulative total returns of a broad-based securities market index ("benchmark"), and a range of cumulative total returns of a peer group of mutual funds identified by Lipper Inc. as having an investment objective similar to that of the fund. The returns of Institutional Class (Class I) and Class B show the performance of the highest and lowest performing classes, respectively (based on three-year performance). The box within each chart shows the 25th percentile return (bottom of box) and the 75th percentile return (top of box) of the peer group. Returns shown above the box are in the first quartile and returns shown below the box are in the fourth quartile. The percentage beaten numbers noted below each chart correspond to the percentile box and represent the percentage of funds in the peer group whose performance was equal to or lower than that of the class indicated.
Annual Report
Fidelity International Small Cap Opportunities Fund
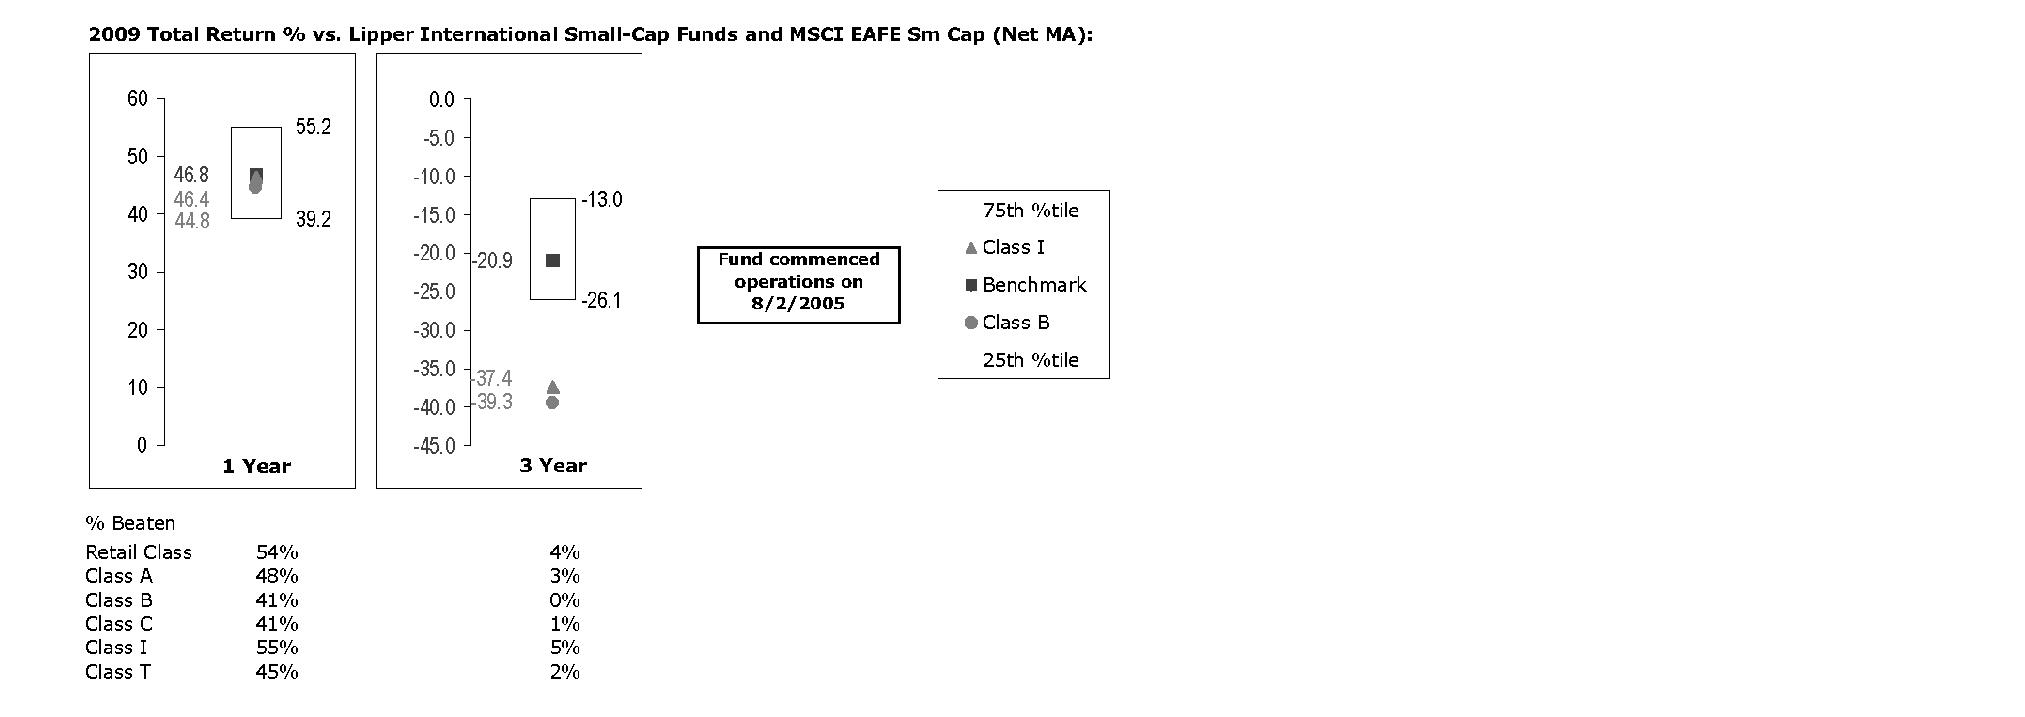
The Board reviewed the fund's relative investment performance against its peer group and noted that the performance of Institutional Class (Class I) of the fund was in the second quartile for the one-year period and the fourth quartile for the three-year period. The Board also noted that the investment performance of the fund was lower than its benchmark for all the periods shown. The Board considered that the variations in performance among the fund's classes reflect the variations in class expenses, which result in lower performance for higher expense classes. The Board also reviewed the fund's performance since inception as well as performance in the current year.
The Board also considered that the fund's management fee is subject to upward or downward adjustment depending upon whether, and to what extent, the fund's investment performance for the performance period exceeds, or is exceeded by, the record (over the same period) of a Board-approved performance adjustment index. The Board realizes that the performance adjustment provides FMR with a strong economic incentive to seek to achieve superior performance for the fund's shareholders and helps to more closely align the interests of FMR and the fund's shareholders.
Based on its review, and giving particular weight to the nature and quality of the resources dedicated by the Investment Advisers to maintain and improve relative performance and factoring in the unprecedented market events in recent years, the Board concluded that the nature, extent, and quality of investment management and support services and of shareholder and administrative services provided to the fund will benefit the fund's shareholders, particularly in light of the Board's view that the fund's shareholders benefit from investing in a fund that is part of a large family of funds offering a variety of investment disciplines and services.
Annual Report
Board Approval of Investment Advisory Contracts and
Management Fees - continued
Competitiveness of Management Fee and Total Fund Expenses. The Board considered the fund's management fee and total expenses compared to "mapped groups" of competitive funds and classes. Fidelity creates "mapped groups" by combining similar Lipper investment objective categories that have comparable management fee characteristics. Combining Lipper investment objective categories aids the Board's management fee and total expense comparisons by broadening the competitive group used for comparison and by reducing the number of universes to which various Fidelity funds are compared.
Management Fee. The Board considered two proprietary management fee comparisons for the 12-month (or shorter) periods shown in the chart below. The group of Lipper funds used by the Board for management fee comparisons is referred to below as the "Total Mapped Group." The Total Mapped Group is broader than the Lipper peer group used by the Board for performance comparisons because the Total Mapped Group combines several Lipper investment objective categories while the Lipper peer group does not. The Total Mapped Group comparison focuses on a fund's standing relative to the total universe of comparable funds available to investors, in terms of gross management fees before expense reimbursements or caps, and without giving effect to the fund's performance adjustment. "TMG %" represents the percentage of funds in the Total Mapped Group that had management fees that were lower than the fund's. For example, a TMG % of 19% means that 81% of the funds in the Total Mapped Group had higher management fees than the fund. The "Asset-Size Peer Group" (ASPG) comparison focuses on a fund's standing relative to non-Fidelity funds similar in size to the fund within the Total Mapped Group. The ASPG represents at least 15% of the funds in the Total Mapped Group with comparable asset size and management fee characteristics, subject to a minimum of 50 funds (or all funds in the Total Mapped Group if fewer than 50). Additional information, such as the ASPG quartile in which the fund's management fee ranked and the impact of the fund's performance adjustment, is also included in the chart and considered by the Board.
Annual Report
Fidelity International Small Cap Opportunities Fund

The Board noted that the fund's management fee ranked below the median of its Total Mapped Group and below the median of its ASPG for 2009. The Board also noted the effect of the fund's negative performance adjustment on the fund's management fee ranking. The Board noted that the performance adjustment for each year represents calculations for performance periods that differ from the periods shown in the performance charts above.
Based on its review, the Board concluded that the fund's management fee is fair and reasonable in light of the services that the fund receives and the other factors considered.
Total Expenses. In its review of each class's total expenses, the Board considered the fund's management fee as well as other fund or class expenses, as applicable, such as transfer agent fees, pricing and bookkeeping fees, fund-paid 12b-1 fees, and custodial, legal, and audit fees. The Board also noted the effects of any waivers and reimbursements on fees and expenses, as well as the impact of the fund's performance adjustment. As part of its review, the Board also considered current and historical total expenses of each class of the fund compared to competitive fund median expenses. Each class of the fund is compared to those funds and classes in the Total Mapped Group (used by the Board for management fee comparisons) that have a similar sales load structure.
The Board noted that the total expenses of each class ranked below its competitive median for 2009.
Annual Report
Board Approval of Investment Advisory Contracts and
Management Fees - continued
Fees Charged to Other Fidelity Clients. The Board also considered Fidelity fee structures and other information with respect to clients of FMR and its affiliates, such as other mutual funds advised or subadvised by FMR or its affiliates, pension plan clients, and other institutional clients. In March 2010, the Board created an ad hoc joint committee with the board of other Fidelity funds (the Committee) to review and compare Fidelity's institutional investment advisory business with its business of providing services to the Fidelity funds, including the differences in services provided, fees charged, and costs incurred, as well as competition in their respective marketplaces.
Based on its review of total expenses and fees charged to other Fidelity clients, the Board concluded that the total expenses of each class of the fund were reasonable in light of the services that the fund and its shareholders receive and the other factors considered, including the findings of the Committee.
Costs of the Services and Profitability. The Board considered the revenues earned and the expenses incurred by Fidelity in conducting the business of developing, marketing, distributing, managing, administering and servicing the fund and its shareholders. The Board also considered the level of Fidelity's profits in respect of all the Fidelity funds.
On an annual basis, FMR presents to the Board Fidelity's profitability for the fund. Fidelity calculates the profitability for each fund, as well as aggregate profitability for groups of Fidelity funds and all Fidelity funds, using a series of detailed revenue and cost allocation methodologies which originate with the audited books and records of Fidelity. The Audit Committee of the Board reviews any significant changes from the prior year's methodologies.
PricewaterhouseCoopers LLP (PwC), independent registered public accounting firm and auditor to Fidelity and certain Fidelity funds, has been engaged annually by the Board as part of the Board's assessment of Fidelity's profitability analysis. PwC's engagement includes the review and assessment of Fidelity's methodologies used in determining the revenues and expenses attributable to Fidelity's mutual fund business, and completion of agreed-upon procedures surrounding the mathematical accuracy of fund profitability and its conformity to allocation methodologies. After considering PwC's reports issued under the engagement and information provided by Fidelity, the Board believes that while other allocation methods may also be reasonable, Fidelity's profitability methodologies are reasonable in all material respects.
The Board has also reviewed Fidelity's non-fund businesses and fall-out benefits related to the mutual fund business as well as cases where Fidelity's affiliates may benefit from or be related to the fund's business.
Annual Report
The Board considered the costs of the services provided by and the profits realized by Fidelity in connection with the operation of the fund and were satisfied that the profitability was not excessive in the circumstances.
Economies of Scale. The Board considered whether there have been economies of scale in respect of the management of the Fidelity funds, whether the Fidelity funds (including the fund) have appropriately benefited from any such economies of scale, and whether there is potential for realization of any further economies of scale. The Board considered the extent to which the fund will benefit from economies of scale through increased services to the fund, through waivers or reimbursements, or through fee or expense reductions.
In February 2009, the Board and the board of other Fidelity funds created an ad hoc committee (the Economies of Scale Committee) to analyze whether FMR attains economies of scale in respect of the management and servicing of the Fidelity funds, whether the Fidelity funds have appropriately benefited from such economies of scale, and whether there is potential for realization of any further economies of scale.
The Board recognized that the fund's management contract incorporates a "group fee" structure, which provides for lower group fee rates as total fund assets under FMR's management increase, and for higher group fee rates as total fund assets under FMR's management decrease. FMR calculates the group fee rates based on a tiered asset "breakpoint" schedule that varies based on asset class. The Board considered that the group fee is designed to deliver the benefits of economies of scale to fund shareholders when total Fidelity fund assets increase, even if assets of any particular fund are unchanged or have declined, because some portion of Fidelity's costs are attributable to services provided to all Fidelity funds, and all funds benefit if those costs can be allocated among more assets. The Board concluded that, given the group fee structure, fund shareholders will benefit from lower management fees as assets under FMR's management increase at the fund complex level, regardless of whether Fidelity achieves any such economies of scale.
The Board concluded, considering the findings of the Economies of Scale Committee, that any potential economies of scale are being appropriately shared between fund shareholders and Fidelity.
Additional Information Requested by the Board. In order to develop fully the factual basis for consideration of the Fidelity funds' Advisory Contracts, the Board requested and received additional information on certain topics, including (i) fund performance trends, actions to be taken by FMR to improve certain funds' overall performance, and Fidelity's long-term strategies for certain funds; (ii) portfolio manager changes that have occurred during the past year and length of portfolio manager tenure for different categories of funds over time; (iii) Fidelity's compensation structure for portfolio managers, research analysts, and other key personnel, the rationale for the compensation structure, and how the compensation structure provides appropriate performance incentives; (iv) the amount of the investment that each portfolio manager has made in the Fidelity fund(s) that he or she manages; (v) management and other fees paid by FMR to affiliated sub-advisers on behalf of the Fidelity funds; (vi) Fidelity's fee structures and rationale for recommending different fees among different categories of funds; (vii) Fidelity's rationale for recommending which funds should have a performance adjustment component as part of their management fees; (viii) the rationale for any differences between fund fee structures and fee structures in place for other Fidelity clients; and (ix) explanations regarding the relative total expenses borne by certain funds and classes, total expense competitive trends, and actions that might be taken by FMR to reduce total expenses for certain funds and classes.
Annual Report
Board Approval of Investment Advisory Contracts and
Management Fees - continued
Based on its evaluation of all of the conclusions noted above, and after considering all factors it believed relevant, the Board ultimately concluded that the advisory fee structures are fair and reasonable, and that the fund's Advisory Contracts should be renewed.
Annual Report
Investment Adviser
Fidelity Management & Research Company
Boston, MA
Investment Sub-Advisers
FMR Co., Inc.
Fidelity Management & Research
(U.K.) Inc.
Fidelity Management & Research
(Hong Kong) Limited
Fidelity Management & Research
(Japan) Inc.
Fidelity Research & Analysis Company
FIL Investment Advisors
FIL Investments (Japan) Limited
FIL Investment Advisors (U.K.) Limited
General Distributor
Fidelity Distributors Corporation
Boston, MA
Transfer and Service Agents
Fidelity Investments Institutional
Operations Company, Inc.
Boston, MA
Fidelity Service Company, Inc.
Boston, MA
Custodian
The Northern Trust Company
Chicago, IL
AILSI-UANN-1210
1.815081.105
Fidelity®
International Value
Fund
Annual Report
October 31, 2010
(2_fidelity_logos) (Registered_Trademark)
Contents
Chairman's Message | <Click Here> | The Chairman's message to shareholders. |
Performance | <Click Here> | How the fund has done over time. |
Management's Discussion of Fund Performance | <Click Here> | The Portfolio Manager's review of fund performance and strategy. |
Shareholder Expense Example | <Click Here> | An example of shareholder expenses. |
Investment Changes | <Click Here> | A summary of major shifts in the fund's investments over the past six months. |
Investments | <Click Here> | A complete list of the fund's investments with their market values. |
Financial Statements | <Click Here> | Statements of assets and liabilities, operations, and changes in net assets, as well as financial highlights. |
Notes | <Click Here> | Notes to financial statements. |
Report of Independent Registered Public Accounting Firm | <Click Here> | |
Trustees and Officers | <Click Here> | |
Distributions | <Click Here> | |
Board Approval of Investment Advisory Contracts and Management Fees | <Click Here> | |
To view a fund's proxy voting guidelines and proxy voting record for the 12-month period ended June 30, visit http://www.fidelity.com/proxyvotingresults or visit the Securities and Exchange Commission's (SEC) web site at http://www.sec.gov. You may also call 1-800-544-8544 to request a free copy of the proxy voting guidelines.
Standard & Poor's, S&P and S&P 500 are registered service marks of The McGraw-Hill Companies, Inc. and have been licensed for use by Fidelity Distributors Corporation.
Other third party marks appearing herein are the property of their respective owners.
All other marks appearing herein are registered or unregistered trademarks or service marks of FMR LLC or an affiliated company.
Annual Report
This report and the financial statements contained herein are submitted for the general information of the shareholders of the fund. This report is not authorized for distribution to prospective investors in the fund unless preceded or accompanied by an effective prospectus.
A fund files its complete schedule of portfolio holdings with the SEC for the first and third quarters of each fiscal year on Form N-Q. Forms N-Q are available on the SEC's web site at http://www.sec.gov. A fund's Forms N-Q may be reviewed and copied at the SEC's Public Reference Room in Washington, DC. Information regarding the operation of the SEC's Public Reference Room may be obtained by calling 1-800-SEC-0330. For a complete list of a fund's portfolio holdings, view the most recent holdings listing, semiannual report, or annual report on Fidelity's web site at http://www.fidelity.com or http://www.advisor.fidelity.com, as applicable.
NOT FDIC INSURED • MAY LOSE VALUE • NO BANK GUARANTEE
Neither the fund nor Fidelity Distributors Corporation is a bank.
Annual Report
(photo_of_Edward_C_Johnson_3d)
Dear Shareholder:
Equities have staged a rally in the second half of 2010, shaking off concerns about the European debt crisis and the possibility of a double-dip recession in the U.S. Although the short-term surge pushed major equity indexes back into positive territory for the year, several questions remain about the longer-term outlook, including lackluster economic growth and persistently high unemployment. Financial markets are always unpredictable, of course, but there also are several time-tested investment principles that can help put the odds in your favor.
One of the basic tenets is to invest for the long term. Over time, riding out the markets' inevitable ups and downs has proven much more effective than selling into panic or chasing the hottest trend. Even missing only a few of the markets' best days can significantly diminish investor returns. Patience also affords the benefits of compounding - of earning interest on additional income or reinvested dividends and capital gains. There can be tax advantages and cost benefits to consider as well. While staying the course doesn't eliminate risk, it can considerably lessen the effect of short-term declines.
You can further manage your investing risk through diversification. And today, more than ever, geographic diversification should be taken into account. Studies indicate that asset allocation is the single most important determinant of a portfolio's long-term success. The right mix of stocks, bonds and cash - aligned to your particular risk tolerance and investment objective - is very important. Age-appropriate rebalancing is also an essential aspect of asset allocation. For younger investors, an emphasis on equities - which historically have been the best-performing asset class over time - is encouraged. As investors near their specific goal, such as retirement or sending a child to college, consideration may be given to replacing volatile assets (e.g. common stocks) with more-stable fixed investments (bonds or savings plans).
A third principle - investing regularly - can help lower the average cost of your purchases. Investing a certain amount of money each month or quarter helps ensure you won't pay for all your shares at market highs. This strategy - known as dollar cost averaging - also reduces "emotion" from investing, helping shareholders avoid selling weak performers just prior to an upswing, or chasing a hot performer just before a correction.
We invite you to contact us via the Internet, through our Investor Centers or by phone. It is our privilege to provide you the information you need to make the investments that are right for you.
Sincerely,
(The chairman's signature appears here.)
Edward C. Johnson 3d
Annual Report
Average annual total return reflects the change in the value of an investment, assuming reinvestment of the class' distributions from dividend income and capital gains (the profits earned upon the sale of securities that have grown in value, if any) and assuming a constant rate of performance each year. The $10,000 table and the fund's returns do not reflect the deduction of taxes that a shareholder would pay on fund distributions or the redemption of fund shares. During periods of reimbursement by Fidelity, a fund's total return will be greater than it would be had the reimbursement not occurred. How a fund did yesterday is no guarantee of how it will do tomorrow.
Average Annual Total Returns
Periods ended October 31, 2010 | | Past 1
year | Life of
classA |
Fidelity International Value Fund | | 7.95% | -1.89% |
A From May 18, 2006
$10,000 Over Life of Fund
Let's say hypothetically that $10,000 was invested in Fidelity International Value Fund, a class of the fund, on May 18, 2006, when the fund started. The chart shows how the value of your investment would have changed, and also shows how the MSCI® EAFE® (Europe, Australasia, Far East) Value Index performed over the same period.
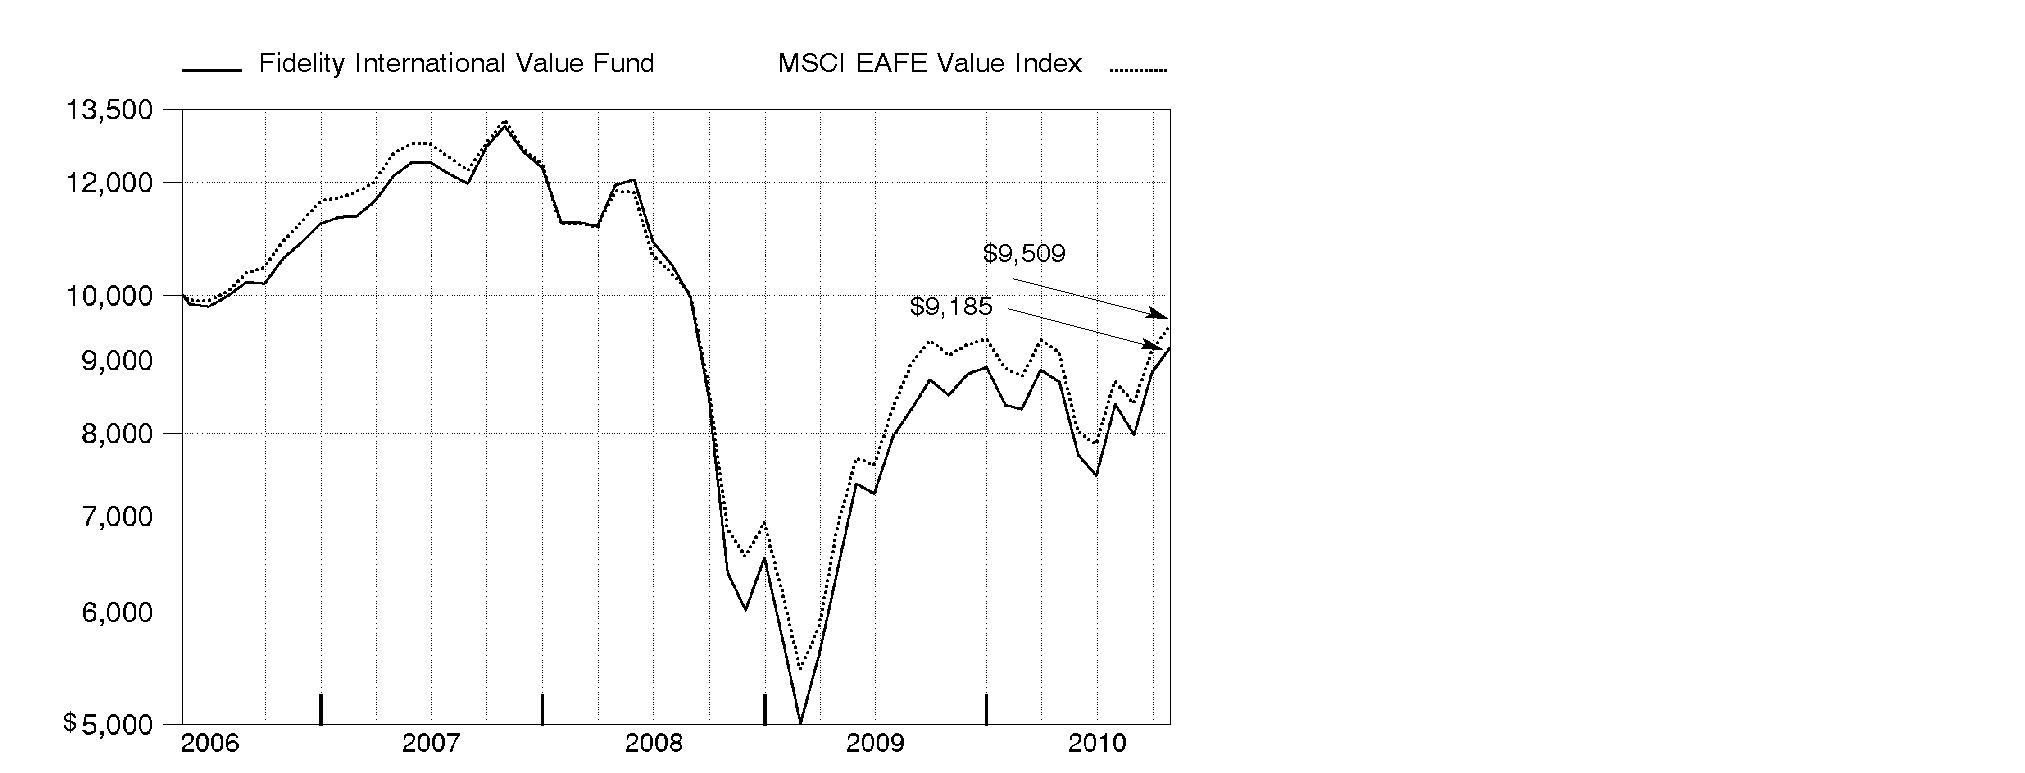
Annual Report
Market Recap: International stocks rode a wave of volatility similar to that of their U.S. counterparts during the 12 months ending October 31, 2010. Stocks gained modestly in the first half of the period, despite growing concerns about the European debt crisis. Sentiment turned decidedly negative in May and June, however, and the market suffered a precipitous decline. These losses were more than offset during the last four months of the period, when signs of economic growth and subsiding debt fears helped propel international stocks about 21%. For the full year, the MSCI® ACWI® (All Country World Index) ex USA Index gained 12.76%, boosted in part by a generally depreciating U.S. dollar. Within the index, Canada and emerging markets were standouts, returning 23% and 24%, respectively. Results in the latter group were led by strong-performing India, Mexico and South Africa, while China fell short of the MSCI benchmark due to cooling economic growth. The developed Asia ex Japan segment rose 16% for the period, lifted by solid results from Singapore and Hong Kong. Meanwhile, Europe rose just 9%, held back mainly by debt-riddled Spain and Italy, as well as lagging major constituent France. Japan returned only 5%, a result of that nation's continued weak economy.
Comments from George Stairs, Portfolio Manager of Fidelity® International Value Fund: For the year, the fund's Retail Class shares rose 7.95%, outpacing the 4.79% return of the MSCI EAFE® (Europe, Australasia, Far East) Value Index. The fund benefited from stock selection in financials, consumer discretionary and energy. Within financials, my picks in banks were particularly helpful, especially Canada's Toronto-Dominion Bank and underweighting Spain's Banco Santander. In contrast, the fund was hurt by positioning in the capital goods industry within the industrials sector, as well as in telecommunication services. In country terms, security selection in Japan and a number of emerging markets worked out very well. European results were mixed. Stock picking was very good in the U.K. and, to a lesser extent, Norway, but disappointing in Denmark, France, Switzerland and Germany. Underweighting Japan and overweighting Hong Kong aided results. In the U.K., a position in mining company Rio Tinto and an underweighting in energy producer BP helped, as did Norwegian and Bermudan oil driller Seadrill. The fund's biggest individual detractors included Vestas Wind Systems, a Danish wind turbine manufacturer; French insurance company AXA; and Spanish telecom company Telefonica. Several of the names mentioned were not in the index.
The views expressed above reflect those of the portfolio manager(s) only through the end of the period as stated on the cover of this report and do not necessarily represent the views of Fidelity or any other person in the Fidelity organization. Any such views are subject to change at any time based upon market or other conditions and Fidelity disclaims any responsibility to update such views. These views may not be relied on as investment advice and, because investment decisions for a Fidelity fund are based on numerous factors, may not be relied on as an indication of trading intent on behalf of any Fidelity fund.
Annual Report
Shareholder Expense Example
As a shareholder of the Fund, you incur two types of costs: (1) transaction costs, including sales charges (loads) on purchase payments or redemption proceeds, redemption fees, and (2) ongoing costs, including management fees, distribution and/or service (12b-1) fees and other Fund expenses. This Example is intended to help you understand your ongoing costs (in dollars) of investing in the Fund and to compare these costs with the ongoing costs of investing in other mutual funds.
The Example is based on an investment of $1,000 invested at the beginning of the period and held for the entire period (May 1, 2010 to October 31, 2010).
Actual Expenses
The first line of the accompanying table for each class of the Fund provides information about actual account values and actual expenses. You may use the information in this line, together with the amount you invested, to estimate the expenses that you paid over the period. Simply divide your account value by $1,000.00 (for example, an $8,600 account value divided by $1,000.00 = 8.6), then multiply the result by the number in the first line for a class of the Fund under the heading entitled "Expenses Paid During Period" to estimate the expenses you paid on your account during this period. A small balance maintenance fee of $12.00 that is charged once a year may apply for certain accounts with a value of less than $2,000. This fee is not included in the table below. If it was, the estimate of expenses you paid during the period would be higher, and your ending account value lower, by this amount. In addition, the Fund, as a shareholder in the underlying Fidelity Central Funds, will indirectly bear its pro-rata share of the fees and expenses incurred by the underlying Fidelity Central Funds. These fees and expenses are not included in the Fund's annualized expense ratio used to calculate the expense estimate in the table below.
Hypothetical Example for Comparison Purposes
The second line of the accompanying table for each class of the Fund provides information about hypothetical account values and hypothetical expenses based on a Class' actual expense ratio and an assumed rate of return of 5% per year before expenses, which is not the Class' actual return. The hypothetical account values and expenses may not be used to estimate the actual ending account balance or expenses you paid for the period. You may use this information to compare the ongoing costs of investing in the Fund and other funds. To do so, compare this 5% hypothetical example with the 5% hypothetical examples that appear in the shareholder reports of the other funds. A small balance maintenance fee of $12.00 that is charged once a year may apply for certain accounts with a value of less than $2,000. This fee is not included in the table below. If it was, the estimate of expenses you paid during the period would be higher, and your ending account value lower, by this amount. In addition, the Fund, as a shareholder in the underlying Fidelity Central Funds, will indirectly bear its pro-rata share of the fees and expenses incurred by the underlying Fidelity Central Funds. These fees and expenses are not included in the Fund's annualized expense ratio used to calculate the expense estimate in the table below.
Annual Report
Please note that the expenses shown in the table are meant to highlight your ongoing costs only and do not reflect any transaction costs. Therefore, the second line of the table is useful in comparing ongoing costs only, and will not help you determine the relative total costs of owning different funds. In addition, if these transactional costs were included, your costs would have been higher.
|
Annualized
Expense Ratio
|
Beginning
Account Value
May 1, 2010
|
Ending
Account Value
October 31, 2010
| Expenses Paid
During Period*
May 1, 2010 to
October 31, 2010 |
Class A | 1.39% | | | |
Actual | | $ 1,000.00 | $ 1,053.80 | $ 7.20 |
Hypothetical A | | $ 1,000.00 | $ 1,018.20 | $ 7.07 |
Class T | 1.66% | | | |
Actual | | $ 1,000.00 | $ 1,052.60 | $ 8.59 |
Hypothetical A | | $ 1,000.00 | $ 1,016.84 | $ 8.44 |
Class B | 2.15% | | | |
Actual | | $ 1,000.00 | $ 1,049.90 | $ 11.11 |
Hypothetical A | | $ 1,000.00 | $ 1,014.37 | $ 10.92 |
Class C | 2.14% | | | |
Actual | | $ 1,000.00 | $ 1,049.90 | $ 11.06 |
Hypothetical A | | $ 1,000.00 | $ 1,014.42 | $ 10.87 |
International Value | 1.09% | | | |
Actual | | $ 1,000.00 | $ 1,056.50 | $ 5.65 |
Hypothetical A | | $ 1,000.00 | $ 1,019.71 | $ 5.55 |
Institutional Class | .99% | | | |
Actual | | $ 1,000.00 | $ 1,055.10 | $ 5.13 |
Hypothetical A | | $ 1,000.00 | $ 1,020.21 | $ 5.04 |
A 5% return per year before expenses
* Expenses are equal to each Class' annualized expense ratio, multiplied by the average account value over the period, multiplied by 184/365 (to reflect the one-half year period).
Annual Report
Investment Changes (Unaudited)
Geographic Diversification (% of fund's net assets) |
As of October 31, 2010 |
| United Kingdom 18.9% | |
| Japan 18.3% | |
| France 10.7% | |
| Germany 6.9% | |
| Spain 6.6% | |
| Switzerland 4.6% | |
| Hong Kong 4.2% | |
| Netherlands 3.9% | |
| Italy 3.1% | |
| Other 22.8% | |

Percentages are adjusted for the effect of futures contracts, if applicable. |
As of April 30, 2010 |
| Japan 19.2% | |
| United Kingdom 18.1% | |
| France 11.5% | |
| Germany 6.8% | |
| Switzerland 4.8% | |
| Hong Kong 4.3% | |
| Spain 3.7% | |
| Italy 3.4% | |
| Australia 3.2% | |
| Other 25.0% | |

Percentages are adjusted for the effect of futures contracts, if applicable. |
Asset Allocation |
| % of fund's
net assets | % of fund's net assets
6 months ago |
Stocks | 99.0 | 98.6 |
Short-Term Investments and Net Other Assets | 1.0 | 1.4 |
Top Ten Stocks as of October 31, 2010 |
| % of fund's
net assets | % of fund's net assets
6 months ago |
Royal Dutch Shell PLC Class A sponsored ADR (United Kingdom, Oil, Gas & Consumable Fuels) | 3.8 | 3.8 |
HSBC Holdings PLC (United Kingdom, Commercial Banks) | 2.9 | 2.1 |
Mitsui & Co. Ltd. (Japan, Trading Companies & Distributors) | 2.1 | 2.1 |
Vodafone Group PLC sponsored ADR (United Kingdom, Wireless Telecommunication Services) | 2.0 | 1.9 |
BP PLC sponsored ADR (United Kingdom, Oil, Gas & Consumable Fuels) | 2.0 | 1.4 |
Roche Holding AG (participation certificate) (Switzerland, Pharmaceuticals) | 2.0 | 2.4 |
AXA SA sponsored ADR (France, Insurance) | 2.0 | 2.1 |
Banco Santander SA (Spain, Commercial Banks) | 2.0 | 1.9 |
Zurich Financial Services AG (Switzerland, Insurance) | 1.8 | 1.6 |
ING Groep NV (Netherlands, Diversified Financial Services) | 1.8 | 1.0 |
| 22.4 | |
Market Sectors as of October 31, 2010 |
| % of fund's
net assets | % of fund's net assets
6 months ago |
Financials | 38.4 | 36.6 |
Energy | 11.1 | 11.5 |
Consumer Discretionary | 10.8 | 10.9 |
Industrials | 8.2 | 8.4 |
Materials | 6.7 | 7.0 |
Utilities | 6.3 | 7.2 |
Telecommunication Services | 6.2 | 5.6 |
Information Technology | 4.7 | 4.6 |
Health Care | 4.4 | 4.6 |
Consumer Staples | 2.2 | 2.2 |
Annual Report
Investments October 31, 2010
Showing Percentage of Net Assets
Common Stocks - 98.0% |
| Shares | | Value |
Australia - 2.5% |
Commonwealth Bank of Australia | 9,042 | | $ 433,156 |
Macquarie Group Ltd. | 49,337 | | 1,749,654 |
Wesfarmers Ltd. | 19,149 | | 621,684 |
Westfield Group unit | 127,286 | | 1,543,733 |
TOTAL AUSTRALIA | | 4,348,227 |
Bailiwick of Jersey - 1.4% |
Informa PLC | 102,820 | | 718,236 |
United Business Media Ltd. | 101,800 | | 1,073,191 |
WPP PLC | 54,427 | | 632,412 |
TOTAL BAILIWICK OF JERSEY | | 2,423,839 |
Bermuda - 1.0% |
Seadrill Ltd. (d) | 43,600 | | 1,320,062 |
VimpelCom Ltd. ADR (a) | 30,100 | | 461,433 |
TOTAL BERMUDA | | 1,781,495 |
Brazil - 1.9% |
Banco do Brasil SA | 53,138 | | 1,033,898 |
Banco Santander (Brasil) SA ADR | 45,900 | | 660,960 |
Cyrela Brazil Realty SA | 35,700 | | 493,152 |
Itau Unibanco Banco Multiplo SA ADR | 12,933 | | 317,634 |
Vivo Participacoes SA sponsored ADR | 30,200 | | 864,928 |
TOTAL BRAZIL | | 3,370,572 |
Canada - 2.4% |
Open Text Corp. (a) | 8,000 | | 353,917 |
Petrobank Energy & Resources Ltd. (a) | 20,700 | | 823,819 |
Power Corp. of Canada (sub. vtg.) (d) | 20,500 | | 572,046 |
Suncor Energy, Inc. | 24,900 | | 797,855 |
Toronto-Dominion Bank | 22,800 | | 1,641,985 |
TOTAL CANADA | | 4,189,622 |
Cayman Islands - 0.6% |
China High Speed Transmission Equipment Group Co. Ltd. | 179,000 | | 365,794 |
Hengdeli Holdings Ltd. | 1,240,000 | | 687,889 |
TOTAL CAYMAN ISLANDS | | 1,053,683 |
China - 1.2% |
China Merchants Bank Co. Ltd. (H Shares) | 325,572 | | 924,055 |
Common Stocks - continued |
| Shares | | Value |
China - continued |
Industrial & Commercial Bank of China Ltd. (H Shares) | 983,000 | | $ 791,346 |
Nine Dragons Paper (Holdings) Ltd. | 251,000 | | 404,773 |
TOTAL CHINA | | 2,120,174 |
Denmark - 1.0% |
Novo Nordisk AS Series B | 6,704 | | 703,801 |
Vestas Wind Systems AS (a)(d) | 30,005 | | 957,410 |
TOTAL DENMARK | | 1,661,211 |
France - 10.7% |
Alstom SA | 8,417 | | 424,671 |
Atos Origin SA (a) | 9,086 | | 420,054 |
AXA SA sponsored ADR | 188,900 | | 3,443,647 |
BNP Paribas SA | 26,393 | | 1,929,875 |
Christian Dior SA | 4,700 | | 679,814 |
Compagnie de St. Gobain | 24,678 | | 1,152,390 |
Credit Agricole SA | 56,600 | | 927,353 |
PPR SA | 6,800 | | 1,114,607 |
Sanofi-Aventis sponsored ADR | 41,300 | | 1,450,043 |
Schneider Electric SA | 6,563 | | 931,473 |
Societe Generale Series A | 45,507 | | 2,724,374 |
Total SA | 2,900 | | 157,819 |
Total SA sponsored ADR | 31,800 | | 1,732,464 |
Unibail-Rodamco | 7,266 | | 1,513,508 |
TOTAL FRANCE | | 18,602,092 |
Germany - 6.8% |
Allianz AG sponsored ADR | 51,500 | | 645,295 |
BASF AG | 16,700 | | 1,214,842 |
Bayerische Motoren Werke AG (BMW) | 11,233 | | 805,109 |
Daimler AG (United States) (a) | 30,400 | | 2,006,400 |
Deutsche Boerse AG | 11,000 | | 773,869 |
E.ON AG | 81,327 | | 2,546,155 |
HeidelbergCement AG | 23,800 | | 1,244,684 |
Metro AG | 10,300 | | 721,756 |
Munich Re Group | 9,123 | | 1,426,193 |
Volkswagen AG (d) | 3,837 | | 503,787 |
TOTAL GERMANY | | 11,888,090 |
Common Stocks - continued |
| Shares | | Value |
Greece - 0.3% |
Hellenic Telecommunications Organization SA | 21,569 | | $ 172,247 |
Public Power Corp. of Greece | 22,520 | | 377,592 |
TOTAL GREECE | | 549,839 |
Hong Kong - 4.2% |
China Resources Power Holdings Co. Ltd. | 396,000 | | 762,241 |
CNOOC Ltd. | 423,000 | | 883,105 |
Hang Lung Group Ltd. | 52,000 | | 345,157 |
Hutchison Whampoa Ltd. | 35,000 | | 344,977 |
Swire Pacific Ltd. (A Shares) | 123,300 | | 1,749,782 |
Techtronic Industries Co. Ltd. | 727,500 | | 736,768 |
Wharf Holdings Ltd. | 367,000 | | 2,409,973 |
TOTAL HONG KONG | | 7,232,003 |
India - 0.5% |
Bank of Baroda | 37,000 | | 877,878 |
Punjab National Bank | 288 | | 9,381 |
TOTAL INDIA | | 887,259 |
Indonesia - 0.9% |
PT Bank Rakyat Indonesia Tbk | 803,000 | | 1,024,245 |
PT Semen Gresik (Persero) Tbk | 497,500 | | 545,510 |
TOTAL INDONESIA | | 1,569,755 |
Ireland - 0.3% |
CRH PLC sponsored ADR | 30,000 | | 530,100 |
Israel - 0.5% |
Teva Pharmaceutical Industries Ltd. sponsored ADR | 16,700 | | 866,730 |
Italy - 2.2% |
ENI SpA | 19,300 | | 434,475 |
Intesa Sanpaolo SpA | 647,919 | | 2,278,660 |
UniCredit SpA | 389,609 | | 1,015,393 |
TOTAL ITALY | | 3,728,528 |
Japan - 18.3% |
ABC-Mart, Inc. | 14,100 | | 479,579 |
Aisin Seiki Co. Ltd. | 30,900 | | 970,353 |
Credit Saison Co. Ltd. | 18,500 | | 262,398 |
Denso Corp. | 45,200 | | 1,405,634 |
East Japan Railway Co. | 18,500 | | 1,142,440 |
Honda Motor Co. Ltd. | 31,500 | | 1,135,537 |
Japan Retail Fund Investment Corp. | 714 | | 1,115,320 |
Common Stocks - continued |
| Shares | | Value |
Japan - continued |
Japan Tobacco, Inc. | 97 | | $ 301,348 |
JSR Corp. | 26,900 | | 465,660 |
Konica Minolta Holdings, Inc. | 50,500 | | 487,979 |
Miraca Holdings, Inc. | 12,100 | | 435,462 |
Mitsubishi UFJ Financial Group, Inc. | 562,300 | | 2,609,637 |
Mitsui & Co. Ltd. | 235,400 | | 3,702,232 |
Nippon Electric Glass Co. Ltd. | 105,000 | | 1,349,651 |
Nippon Telegraph & Telephone Corp. | 10,800 | | 487,084 |
Obic Co. Ltd. | 3,880 | | 716,501 |
ORIX Corp. | 16,480 | | 1,503,209 |
Promise Co. Ltd. (d) | 59,900 | | 250,855 |
Ricoh Co. Ltd. | 30,000 | | 419,659 |
Seven & i Holdings Co., Ltd. | 19,700 | | 457,297 |
SOFTBANK CORP. | 16,600 | | 533,109 |
Sumitomo Corp. | 148,700 | | 1,882,662 |
Sumitomo Metal Industries Ltd. | 180,000 | | 417,777 |
Sumitomo Mitsui Financial Group, Inc. | 50,300 | | 1,501,342 |
Tokio Marine Holdings, Inc. | 26,000 | | 731,012 |
Tokyo Electron Ltd. | 16,800 | | 947,912 |
Tokyo Gas Co. Ltd. | 429,000 | | 2,018,396 |
Toyota Motor Corp. | 70,000 | | 2,479,419 |
USS Co. Ltd. | 6,120 | | 476,093 |
West Japan Railway Co. | 132 | | 490,049 |
Xebio Co. Ltd. | 2,900 | | 56,940 |
Yamada Denki Co. Ltd. | 9,260 | | 601,837 |
TOTAL JAPAN | | 31,834,383 |
Korea (South) - 0.9% |
Samsung Electronics Co. Ltd. | 1,245 | | 824,833 |
Shinhan Financial Group Co. Ltd. | 15,815 | | 612,488 |
Shinhan Financial Group Co. Ltd. sponsored ADR | 2,600 | | 202,202 |
TOTAL KOREA (SOUTH) | | 1,639,523 |
Luxembourg - 1.0% |
ArcelorMittal SA: | | | |
(Netherlands) | 17,800 | | 575,834 |
Class A unit (d) | 33,600 | | 1,087,968 |
TOTAL LUXEMBOURG | | 1,663,802 |
Netherlands - 3.9% |
Gemalto NV | 21,398 | | 974,213 |
ING Groep NV: | | | |
(Certificaten Van Aandelen) unit (a) | 131,968 | | 1,411,530 |
Common Stocks - continued |
| Shares | | Value |
Netherlands - continued |
ING Groep NV: - continued | | | |
sponsored ADR (a)(d) | 164,100 | | $ 1,768,998 |
Koninklijke Ahold NV | 43,888 | | 606,405 |
Koninklijke KPN NV | 70,720 | | 1,180,840 |
Randstad Holdings NV (a) | 16,139 | | 768,016 |
TOTAL NETHERLANDS | | 6,710,002 |
Norway - 1.0% |
Aker Solutions ASA | 86,460 | | 1,316,238 |
DnB NOR ASA | 32,800 | | 450,074 |
TOTAL NORWAY | | 1,766,312 |
Portugal - 0.7% |
Energias de Portugal SA | 337,291 | | 1,290,170 |
Russia - 0.6% |
Mechel Steel Group OAO sponsored ADR | 20,500 | | 482,775 |
OAO Gazprom sponsored ADR | 26,900 | | 587,765 |
TOTAL RUSSIA | | 1,070,540 |
Singapore - 1.7% |
DBS Group Holdings Ltd. | 39,585 | | 425,119 |
United Overseas Bank Ltd. | 126,200 | | 1,817,483 |
Yanlord Land Group Ltd. | 564,000 | | 749,502 |
TOTAL SINGAPORE | | 2,992,104 |
South Africa - 0.2% |
Impala Platinum Holdings Ltd. | 12,300 | | 347,663 |
Spain - 6.6% |
Banco Bilbao Vizcaya Argentaria SA sponsored ADR (d) | 185,716 | | 2,442,165 |
Banco Santander SA | 77,889 | | 999,496 |
Banco Santander SA sponsored ADR | 185,200 | | 2,372,412 |
Gestevision Telecinco SA | 16,100 | | 205,340 |
Iberdrola SA | 268,746 | | 2,266,117 |
Red Electrica Corporacion SA | 8,800 | | 441,975 |
Telefonica SA sponsored ADR (d) | 32,800 | | 2,661,392 |
TOTAL SPAIN | | 11,388,897 |
Sweden - 0.3% |
Telefonaktiebolaget LM Ericsson (B Shares) | 48,352 | | 531,601 |
Switzerland - 4.6% |
Lonza Group AG | 2,189 | | 191,581 |
Roche Holding AG (participation certificate) | 23,649 | | 3,471,611 |
Common Stocks - continued |
| Shares | | Value |
Switzerland - continued |
Transocean Ltd. (a) | 18,439 | | $ 1,168,295 |
Zurich Financial Services AG | 13,038 | | 3,190,790 |
TOTAL SWITZERLAND | | 8,022,277 |
Taiwan - 0.5% |
AU Optronics Corp. (a) | 315,000 | | 314,442 |
Hon Hai Precision Industry Co. Ltd. (Foxconn) | 136,752 | | 518,322 |
TOTAL TAIWAN | | 832,764 |
Thailand - 0.4% |
Siam Commercial Bank PCL (For. Reg.) | 196,900 | | 674,090 |
United Kingdom - 18.9% |
Aberdeen Asset Management PLC | 202,260 | | 576,162 |
Aegis Group PLC | 342,500 | | 689,762 |
Anglo American PLC (United Kingdom) | 46,717 | | 2,176,569 |
AstraZeneca PLC sponsored ADR (d) | 13,200 | | 666,072 |
Aviva PLC | 110,728 | | 706,059 |
BAE Systems PLC | 158,200 | | 873,677 |
Barclays PLC | 393,292 | | 1,728,083 |
BP PLC sponsored ADR | 86,000 | | 3,511,380 |
British Airways PLC (a) | 88,300 | | 382,959 |
Centrica PLC | 99,225 | | 528,109 |
HSBC Holdings PLC: | | | |
(United Kingdom) | 166,235 | | 1,729,898 |
sponsored ADR | 62,270 | | 3,244,890 |
Imperial Tobacco Group PLC | 24,643 | | 789,241 |
International Power PLC | 69,857 | | 467,048 |
Man Group PLC | 62,924 | | 262,922 |
Misys PLC (a) | 78,900 | | 355,717 |
Prudential PLC | 113,283 | | 1,145,604 |
Rio Tinto PLC | 19,102 | | 1,240,525 |
Royal Dutch Shell PLC Class A sponsored ADR (d) | 101,400 | | 6,583,903 |
Vedanta Resources PLC | 27,600 | | 917,551 |
Vodafone Group PLC sponsored ADR | 129,112 | | 3,551,871 |
Wolseley PLC (a) | 27,062 | | 721,033 |
TOTAL UNITED KINGDOM | | 32,849,035 |
TOTAL COMMON STOCKS (Cost $181,546,961) | 170,416,382 |
Nonconvertible Preferred Stocks - 1.0% |
| Shares | | Value |
Germany - 0.1% |
Volkswagen AG | 1,600 | | $ 240,443 |
Italy - 0.9% |
Fiat SpA (Risparmio Shares) | 53,200 | | 625,142 |
Telecom Italia SpA (Risparmio Shares) | 727,800 | | 892,776 |
TOTAL ITALY | | 1,517,918 |
TOTAL NONCONVERTIBLE PREFERRED STOCKS (Cost $1,798,557) | 1,758,361 |
Money Market Funds - 9.6% |
| | | |
Fidelity Cash Central Fund, 0.23% (b) | 1,148,052 | | 1,148,052 |
Fidelity Securities Lending Cash Central Fund, 0.24% (b)(c) | 15,519,480 | | 15,519,480 |
TOTAL MONEY MARKET FUNDS (Cost $16,667,532) | 16,667,532 |
TOTAL INVESTMENT PORTFOLIO - 108.6% (Cost $200,013,050) | | 188,842,275 |
NET OTHER ASSETS (LIABILITIES) - (8.6)% | | (14,918,317) |
NET ASSETS - 100% | $ 173,923,958 |
Legend |
(a) Non-income producing |
(b) Affiliated fund that is available only to investment companies and other accounts managed by Fidelity Investments. The rate quoted is the annualized seven-day yield of the fund at period end. A complete unaudited listing of the fund's holdings as of its most recent quarter end is available upon request. In addition, each Fidelity Central Fund's financial statements, which are not covered by the Fund's report of Independent Registered Public Accounting Firm, are available on the SEC's website or upon request. |
(c) Investment made with cash collateral received from securities on loan. |
(d) Security or a portion of the security is on loan at period end. |
Affiliated Central Funds |
Information regarding fiscal year to date income earned by the Fund from investments in Fidelity Central Funds is as follows: |
Fund | Income earned |
Fidelity Cash Central Fund | $ 2,268 |
Fidelity Securities Lending Cash Central Fund | 157,549 |
Total | $ 159,817 |
Other Information |
The following is a summary of the inputs used, as of October 31, 2010, involving the Fund's assets and liabilities carried at fair value. The inputs or methodology used for valuing securities may not be an indication of the risk associated with investing in those securities. For more information on valuation inputs, and their aggregation into the levels used in the table below, please refer to the Security Valuation section in the accompanying Notes to Financial Statements. |
Valuation Inputs at Reporting Date: |
Description | Total | Level 1 | Level 2 | Level 3 |
Investments in Securities: | | | |
Equities: | | | | |
United Kingdom | $ 32,849,035 | $ 26,298,866 | $ 6,550,169 | $ - |
Japan | 31,834,383 | 7,071,809 | 24,762,574 | - |
France | 18,602,092 | 18,444,273 | 157,819 | - |
Germany | 12,128,533 | 12,128,533 | - | - |
Spain | 11,388,897 | 10,389,401 | 999,496 | - |
Switzerland | 8,022,277 | 8,022,277 | - | - |
Hong Kong | 7,232,003 | 6,348,898 | 883,105 | - |
Netherlands | 6,710,002 | 5,298,472 | 1,411,530 | - |
Italy | 5,246,446 | 3,919,195 | 1,327,251 | - |
Other | 38,161,075 | 34,343,479 | 3,817,596 | - |
Money Market Funds | 16,667,532 | 16,667,532 | - | - |
Total Investments in Securities: | $ 188,842,275 | $ 148,932,735 | $ 39,909,540 | $ - |
Income Tax Information |
At October 31, 2010, the Fund had a capital loss carryforward of approximately $86,037,358 of which $17,089,067, $65,376,972 and $3,571,319 will expire on October 31, 2016, 2017 and 2018, respectively. Capital loss carryforwards are only available to offset future capital gains of the Fund to the extent provided by regulations and may be limited. |
See accompanying notes which are an integral part of the financial statements.
Annual Report
Statement of Assets and Liabilities
| October 31, 2010 |
| | |
Assets | | |
Investment in securities, at value (including securities loaned of $15,206,694) - See accompanying schedule: Unaffiliated issuers (cost $183,345,518) | $ 172,174,743 | |
Fidelity Central Funds (cost $16,667,532) | 16,667,532 | |
Total Investments (cost $200,013,050) | | $ 188,842,275 |
Foreign currency held at value (cost $5,461) | | 5,490 |
Receivable for investments sold | | 446,531 |
Receivable for fund shares sold | | 78,493 |
Dividends receivable | | 605,309 |
Distributions receivable from Fidelity Central Funds | | 4,290 |
Other receivables | | 29,877 |
Total assets | | 190,012,265 |
| | |
Liabilities | | |
Payable for investments purchased | $ 163,146 | |
Payable for fund shares redeemed | 179,389 | |
Accrued management fee | 96,986 | |
Distribution and service plan fees payable | 4,718 | |
Other affiliated payables | 35,187 | |
Other payables and accrued expenses | 89,401 | |
Collateral on securities loaned, at value | 15,519,480 | |
Total liabilities | | 16,088,307 |
| | |
Net Assets | | $ 173,923,958 |
Net Assets consist of: | | |
Paid in capital | | $ 268,479,379 |
Undistributed net investment income | | 3,475,373 |
Accumulated undistributed net realized gain (loss) on investments and foreign currency transactions | | (86,855,582) |
Net unrealized appreciation (depreciation) on investments and assets and liabilities in foreign currencies | | (11,175,212) |
Net Assets | | $ 173,923,958 |
See accompanying notes which are an integral part of the financial statements.
Annual Report
Statement of Assets and Liabilities - continued
| October 31, 2010 |
| | |
Calculation of Maximum Offering Price Class A:
Net Asset Value and redemption price per share ($4,698,845 ÷ 571,797 shares) | | $ 8.22 |
| | |
Maximum offering price per share (100/94.25 of $8.22) | | $ 8.72 |
Class T:
Net Asset Value and redemption price per share ($2,276,315 ÷ 277,544 shares) | | $ 8.20 |
| | |
Maximum offering price per share (100/96.50 of $8.20) | | $ 8.50 |
Class B:
Net Asset Value and offering price per share ($1,216,282 ÷ 148,316 shares)A | | $ 8.20 |
| | |
Class C:
Net Asset Value and offering price per share ($2,123,283 ÷ 258,867 shares)A | | $ 8.20 |
| | |
International Value:
Net Asset Value, offering price and redemption price per share ($163,089,817 ÷ 19,827,024 shares) | | $ 8.23 |
| | |
Institutional Class:
Net Asset Value, offering price and redemption price per share ($519,416 ÷ 63,004 shares) | | $ 8.24 |
A Redemption price per share is equal to net asset value less any applicable contingent deferred sales charge.
See accompanying notes which are an integral part of the financial statements.
Annual Report
Financial Statements - continued
Statement of Operations
| Year ended October 31, 2010 |
| | |
Investment Income | | |
Dividends | | $ 6,155,601 |
Interest | | 12 |
Income from Fidelity Central Funds | | 159,817 |
Income before foreign taxes withheld | | 6,315,430 |
Less foreign taxes withheld | | (506,127) |
Total income | | 5,809,303 |
| | |
Expenses | | |
Management fee
Basic fee | $ 1,246,006 | |
Performance adjustment | (64,274) | |
Transfer agent fees | 456,496 | |
Distribution and service plan fees | 53,397 | |
Accounting and security lending fees | 86,012 | |
Custodian fees and expenses | 47,971 | |
Independent trustees' compensation | 1,006 | |
Registration fees | 80,881 | |
Audit | 66,813 | |
Legal | 923 | |
Miscellaneous | 2,258 | |
Total expenses before reductions | 1,977,489 | |
Expense reductions | (28,245) | 1,949,244 |
Net investment income (loss) | | 3,860,059 |
Realized and Unrealized Gain (Loss) Net realized gain (loss) on: | | |
Investment securities: | | |
Unaffiliated issuers | (3,197,843) | |
Foreign currency transactions | (24,115) | |
Total net realized gain (loss) | | (3,221,958) |
Change in net unrealized appreciation (depreciation) on: Investment securities (net of increase in deferred foreign taxes of $30,988) | 12,416,559 | |
Assets and liabilities in foreign currencies | 1,278 | |
Total change in net unrealized appreciation (depreciation) | | 12,417,837 |
Net gain (loss) | | 9,195,879 |
Net increase (decrease) in net assets resulting from operations | | $ 13,055,938 |
See accompanying notes which are an integral part of the financial statements.
Annual Report
Statement of Changes in Net Assets
| Year ended
October 31,
2010 | Year ended
October 31,
2009 |
Increase (Decrease) in Net Assets | | |
Operations | | |
Net investment income (loss) | $ 3,860,059 | $ 3,337,187 |
Net realized gain (loss) | (3,221,958) | (62,114,878) |
Change in net unrealized appreciation (depreciation) | 12,417,837 | 101,639,080 |
Net increase (decrease) in net assets resulting
from operations | 13,055,938 | 42,861,389 |
Distributions to shareholders from net investment income | (3,135,757) | (3,076,516) |
Distributions to shareholders from net realized gain | (123,529) | - |
Total distributions | (3,259,286) | (3,076,516) |
Share transactions - net increase (decrease) | (27,172,209) | (17,980,610) |
Redemption fees | 3,410 | 6,134 |
Total increase (decrease) in net assets | (17,372,147) | 21,810,397 |
| | |
Net Assets | | |
Beginning of period | 191,296,105 | 169,485,708 |
End of period (including undistributed net investment income of $3,475,373 and undistributed net investment income of $2,751,072, respectively) | $ 173,923,958 | $ 191,296,105 |
See accompanying notes which are an integral part of the financial statements.
Annual Report
Financial Highlights - Class A
Years ended October 31, | 2010 | 2009 | 2008 | 2007 | 2006 I |
Selected Per-Share Data | | | | | |
Net asset value, beginning of period | $ 7.75 | $ 5.93 | $ 13.02 | $ 10.60 | $ 10.00 |
Income from Investment Operations | | | | | |
Net investment income (loss) E | .15 | .12 | .21 | .18 | .06 H |
Net realized and unrealized gain (loss) | .44 | 1.78 | (6.53) | 2.29 | .54 |
Total from investment operations | .59 | 1.90 | (6.32) | 2.47 | .60 |
Distributions from net investment income | (.11) | (.08) | (.15) | (.03) | - |
Distributions from net realized gain | (.01) | - | (.62) | (.02) | - |
Total distributions | (.12) | (.08) | (.77) | (.05) | - |
Redemption fees added to paid in capital E, K | - | - | - | - | - |
Net asset value, end of period | $ 8.22 | $ 7.75 | $ 5.93 | $ 13.02 | $ 10.60 |
Total Return B, C, D | 7.60% | 32.71% | (51.50)% | 23.43% | 6.00% |
Ratios to Average Net Assets F, J | | | | | |
Expenses before reductions | 1.40% | 1.34% | 1.42% | 1.38% | 1.75%A |
Expenses net of fee waivers, if any | 1.40% | 1.34% | 1.42% | 1.38% | 1.50% A |
Expenses net of all reductions | 1.38% | 1.32% | 1.41% | 1.37% | 1.46% A |
Net investment income (loss) | 1.93% | 1.86% | 2.05% | 1.49% | 1.29% A, H |
Supplemental Data | | | | | |
Net assets, end of period (000 omitted) | $ 4,699 | $ 4,456 | $ 2,854 | $ 6,052 | $ 1,537 |
Portfolio turnover rate G | 43% | 46% | 68% | 59% | 29% A |
A Annualized
B Total returns for periods of less than one year are not annualized.
C Total returns would have been lower had certain expenses not been reduced during the periods shown.
D Total returns do not include the effect of the sales charges.
E Calculated based on average shares outstanding during the period.
F Fees and expenses of the underlying Fidelity Central Funds are not included in the Fund's expense ratio. The Fund indirectly bears its proportionate share of the expenses of any underlying Fidelity Central Funds.
G Amount does not include the portfolio activity of any underlying Fidelity Central Funds.
H Investment income per share reflects a special dividend which amounted to $.03 per share. Excluding the special dividend, the ratio of net investment income (loss) to average net assets would have been .63%.
I For the period May 18, 2006 (commencement of operations) to October 31, 2006.
J Expense ratios reflect operating expenses of the class. Expenses before reductions do not reflect amounts reimbursed by the investment adviser or reductions from brokerage service arrangements or reductions from other expense offset arrangements and do not represent the amount paid by the class during periods when reimbursements or reductions occur. Expense ratios before reductions for start-up periods may not be representative of longer-term operating periods. Expenses net of fee waivers reflect expenses after reimbursement by the investment adviser but prior to reductions from brokerage service arrangements or other expense offset arrangements. Expenses net of all reductions represent the net expenses paid by the class.
K Amount represents less than $.01 per share.
See accompanying notes which are an integral part of the financial statements.
Annual Report
Financial Highlights - Class T
Years ended October 31, | 2010 | 2009 | 2008 | 2007 | 2006 I |
Selected Per-Share Data | | | | | |
Net asset value, beginning of period | $ 7.73 | $ 5.91 | $ 12.99 | $ 10.59 | $ 10.00 |
Income from Investment Operations | | | | | |
Net investment income (loss) E | .13 | .10 | .18 | .15 | .05 H |
Net realized and unrealized gain (loss) | .44 | 1.77 | (6.50) | 2.29 | .54 |
Total from investment operations | .57 | 1.87 | (6.32) | 2.44 | .59 |
Distributions from net investment income | (.09) | (.05) | (.14) | (.02) | - |
Distributions from net realized gain | (.01) | - | (.62) | (.02) | - |
Total distributions | (.10) | (.05) | (.76) | (.04) | - |
Redemption fees added to paid in capital E, K | - | - | - | - | - |
Net asset value, end of period | $ 8.20 | $ 7.73 | $ 5.91 | $ 12.99 | $ 10.59 |
Total Return B, C, D | 7.32% | 32.14% | (51.60)% | 23.13% | 5.90% |
Ratios to Average Net Assets F, J | | | | | |
Expenses before reductions | 1.67% | 1.60% | 1.67% | 1.60% | 2.01% A |
Expenses net of fee waivers, if any | 1.67% | 1.60% | 1.67% | 1.60% | 1.75% A |
Expenses net of all reductions | 1.65% | 1.59% | 1.66% | 1.58% | 1.71% A |
Net investment income (loss) | 1.65% | 1.59% | 1.80% | 1.27% | 1.04% A, H |
Supplemental Data | | | | | |
Net assets, end of period (000 omitted) | $ 2,276 | $ 2,395 | $ 2,087 | $ 5,081 | $ 1,789 |
Portfolio turnover rate G | 43% | 46% | 68% | 59% | 29% A |
A Annualized
B Total returns for periods of less than one year are not annualized.
C Total returns would have been lower had certain expenses not been reduced during the periods shown.
D Total returns do not include the effect of the sales charges.
E Calculated based on average shares outstanding during the period.
F Fees and expenses of the underlying Fidelity Central Funds are not included in the Fund's expense ratio. The Fund indirectly bears its proportionate share of the expenses of any underlying Fidelity Central Funds.
G Amount does not include the portfolio activity of any underlying Fidelity Central Funds.
H Investment income per share reflects a special dividend which amounted to $.03 per share. Excluding the special dividend, the ratio of net investment income (loss) to average net assets would have been .38%.
I For the period May 18, 2006 (commencement of operations) to October 31, 2006.
J Expense ratios reflect operating expenses of the class. Expenses before reductions do not reflect amounts reimbursed by the investment adviser or reductions from brokerage service arrangements or reductions from other expense offset arrangements and do not represent the amount paid by the class during periods when reimbursements or reductions occur. Expense ratios before reductions for start-up periods may not be representative of longer-term operating periods. Expenses net of fee waivers reflect expenses after reimbursement by the investment adviser but prior to reductions from brokerage service arrangements or other expense offset arrangements. Expenses net of all reductions represent the net expenses paid by the class.
K Amount represents less than $.01 per share.
See accompanying notes which are an integral part of the financial statements.
Annual Report
Financial Highlights - Class B
Years ended October 31, | 2010 | 2009 | 2008 | 2007 | 2006 I |
Selected Per-Share Data | | | | | |
Net asset value, beginning of period | $ 7.74 | $ 5.88 | $ 12.93 | $ 10.56 | $ 10.00 |
Income from Investment Operations | | | | | |
Net investment income (loss) E | .09 | .07 | .13 | .09 | .02 H |
Net realized and unrealized gain (loss) | .44 | 1.79 | (6.48) | 2.29 | .54 |
Total from investment operations | .53 | 1.86 | (6.35) | 2.38 | .56 |
Distributions from net investment income | (.06) | - | (.08) | - | - |
Distributions from net realized gain | (.01) | - | (.62) | (.01) | - |
Total distributions | (.07) | - | (.70) | (.01) | - |
Redemption fees added to paid in capital E, K | - | - | - | - | - |
Net asset value, end of period | $ 8.20 | $ 7.74 | $ 5.88 | $ 12.93 | $ 10.56 |
Total Return B, C, D | 6.82% | 31.63% | (51.85)% | 22.59% | 5.60% |
Ratios to Average Net Assets F, J | | | | | |
Expenses before reductions | 2.15% | 2.08% | 2.18% | 2.10% | 2.50% A |
Expenses net of fee waivers, if any | 2.15% | 2.08% | 2.18% | 2.10% | 2.25% A |
Expenses net of all reductions | 2.13% | 2.07% | 2.17% | 2.08% | 2.21% A |
Net investment income (loss) | 1.18% | 1.11% | 1.29% | .77% | .54% A, H |
Supplemental Data | | | | | |
Net assets, end of period (000 omitted) | $ 1,216 | $ 1,076 | $ 931 | $ 2,651 | $ 1,304 |
Portfolio turnover rate G | 43% | 46% | 68% | 59% | 29% A |
A Annualized
B Total returns for periods of less than one year are not annualized.
C Total returns would have been lower had certain expenses not been reduced during the periods shown.
D Total returns do not include the effect of the contingent deferred sales charge.
E Calculated based on average shares outstanding during the period.
F Fees and expenses of the underlying Fidelity Central Funds are not included in the Fund's expense ratio. The Fund indirectly bears its proportionate share of the expenses of any underlying Fidelity Central Funds.
G Amount does not include the portfolio activity of any underlying Fidelity Central Funds.
H Investment income per share reflects a special dividend which amounted to $.03 per share. Excluding the special dividend, the ratio of net investment income (loss) to average net assets would have been (.12)%.
I For the period May 18, 2006 (commencement of operations) to October 31, 2006.
J Expense ratios reflect operating expenses of the class. Expenses before reductions do not reflect amounts reimbursed by the investment adviser or reductions from brokerage service arrangements or reductions from other expense offset arrangements and do not represent the amount paid by the class during periods when reimbursements or reductions occur. Expense ratios before reductions for start-up periods may not be representative of longer-term operating periods. Expenses net of fee waivers reflect expenses after reimbursement by the investment adviser but prior to reductions from brokerage service arrangements or other expense offset arrangements. Expenses net of all reductions represent the net expenses paid by the class.
K Amount represents less than $.01 per share.
See accompanying notes which are an integral part of the financial statements.
Annual Report
Financial Highlights - Class C
Years ended October 31, | 2010 | 2009 | 2008 | 2007 | 2006 I |
Selected Per-Share Data | | | | | |
Net asset value, beginning of period | $ 7.73 | $ 5.88 | $ 12.92 | $ 10.56 | $ 10.00 |
Income from Investment Operations | | | | | |
Net investment income (loss) E | .09 | .07 | .13 | .09 | .02 H |
Net realized and unrealized gain (loss) | .44 | 1.78 | (6.47) | 2.29 | .54 |
Total from investment operations | .53 | 1.85 | (6.34) | 2.38 | .56 |
Distributions from net investment income | (.05) | - | (.08) | - | - |
Distributions from net realized gain | (.01) | - | (.62) | (.02) | - |
Total distributions | (.06) | - | (.70) | (.02) | - |
Redemption fees added to paid in capital E, K | - | - | - | - | - |
Net asset value, end of period | $ 8.20 | $ 7.73 | $ 5.88 | $ 12.92 | $ 10.56 |
Total Return B, C, D | 6.84% | 31.46% | (51.80)% | 22.56% | 5.60% |
Ratios to Average Net Assets F, J | | | | | |
Expenses before reductions | 2.15% | 2.08% | 2.17% | 2.07% | 2.47% A |
Expenses net of fee waivers, if any | 2.15% | 2.08% | 2.17% | 2.07% | 2.25% A |
Expenses net of all reductions | 2.13% | 2.06% | 2.16% | 2.05% | 2.21% A |
Net investment income (loss) | 1.18% | 1.12% | 1.30% | .80% | .54% A, H |
Supplemental Data | | | | | |
Net assets, end of period (000 omitted) | $ 2,123 | $ 2,108 | $ 1,784 | $ 5,996 | $ 2,183 |
Portfolio turnover rate G | 43% | 46% | 68% | 59% | 29% A |
A Annualized
B Total returns for periods of less than one year are not annualized.
C Total returns would have been lower had certain expenses not been reduced during the periods shown.
D Total returns do not include the effect of the contingent deferred sales charge.
E Calculated based on average shares outstanding during the period.
F Fees and expenses of the underlying Fidelity Central Funds are not included in the Fund's expense ratio. The Fund indirectly bears its proportionate share of the expenses of any underlying Fidelity Central Funds.
G Amount does not include the portfolio activity of any underlying Fidelity Central Funds.
H Investment income per share reflects a special dividend which amounted to $.03 per share. Excluding the special dividend, the ratio of net investment income (loss) to average net assets would have been (.12)%.
I For the period May 18, 2006 (commencement of operations) to October 31, 2006.
J Expense ratios reflect operating expenses of the class. Expenses before reductions do not reflect amounts reimbursed by the investment adviser or reductions from brokerage service arrangements or reductions from other expense offset arrangements and do not represent the amount paid by the class during periods when reimbursements or reductions occur. Expense ratios before reductions for start-up periods may not be representative of longer-term operating periods. Expenses net of fee waivers reflect expenses after reimbursement by the investment adviser but prior to reductions from brokerage service arrangements or other expense offset arrangements. Expenses net of all reductions represent the net expenses paid by the class.
K Amount represents less than $.01 per share.
See accompanying notes which are an integral part of the financial statements.
Annual Report
Financial Highlights - International Value
Years ended October 31, | 2010 | 2009 | 2008 | 2007 | 2006 H |
Selected Per-Share Data | | | | | |
Net asset value, beginning of period | $ 7.75 | $ 5.95 | $ 13.06 | $ 10.61 | $ 10.00 |
Income from Investment Operations | | | | | |
Net investment income (loss) D | .17 | .13 | .24 | .22 | .07 G |
Net realized and unrealized gain (loss) | .44 | 1.78 | (6.54) | 2.29 | .54 |
Total from investment operations | .61 | 1.91 | (6.30) | 2.51 | .61 |
Distributions from net investment income | (.13) | (.11) | (.19) | (.04) | - |
Distributions from net realized gain | (.01) | - | (.62) | (.02) | - |
Total distributions | (.13) K | (.11) | (.81) | (.06) | - |
Redemption fees added to paid in capital D, J | - | - | - | - | - |
Net asset value, end of period | $ 8.23 | $ 7.75 | $ 5.95 | $ 13.06 | $ 10.61 |
Total Return B, C | 7.95% | 33.09% | (51.34)% | 23.81% | 6.10% |
Ratios to Average Net Assets E, I | | | | | |
Expenses before reductions | 1.09% | 1.07% | 1.10% | 1.03% | 1.50% A |
Expenses net of fee waivers, if any | 1.09% | 1.07% | 1.10% | 1.03% | 1.25% A |
Expenses net of all reductions | 1.08% | 1.06% | 1.09% | 1.02% | 1.21% A |
Net investment income (loss) | 2.23% | 2.12% | 2.37% | 1.84% | 1.54% A, G |
Supplemental Data | | | | | |
Net assets, end of period (000 omitted) | $ 163,090 | $ 180,447 | $ 160,777 | $ 381,148 | $ 221,130 |
Portfolio turnover rate F | 43% | 46% | 68% | 59% | 29% A |
A Annualized
B Total returns for periods of less than one year are not annualized.
C Total returns would have been lower had certain expenses not been reduced during the periods shown.
D Calculated based on average shares outstanding during the period.
E Fees and expenses of the underlying Fidelity Central Funds are not included in the Fund's expense ratio. The Fund indirectly bears its proportionate share of the expenses of any underlying Fidelity Central Funds.
F Amount does not include the portfolio activity of any underlying Fidelity Central Funds.
G Investment income per share reflects a special dividend which amounted to $.03 per share. Excluding the special dividend, the ratio of net investment income (loss) to average net assets would have been .88%.
H For the period May 18, 2006 (commencement of operations) to October 31, 2006.
I Expense ratios reflect operating expenses of the class. Expenses before reductions do not reflect amounts reimbursed by the investment adviser or reductions from brokerage service arrangements or reductions from other expense offset arrangements and do not represent the amount paid by the class during periods when reimbursements or reductions occur. Expense ratios before reductions for start-up periods may not be representative of longer-term operating periods. Expenses net of fee waivers reflect expenses after reimbursement by the investment adviser but prior to reductions from brokerage service arrangements or other expense offset arrangements. Expenses net of all reductions represent the net expenses paid by the class.
J Amount represents less than $.01 per share.
K Total distributions of $.13 per share is comprised of distributions from net investment income of $.129 and distributions from net realized gain of $.005 per share.
See accompanying notes which are an integral part of the financial statements.
Annual Report
Financial Highlights - Institutional Class
Years ended October 31, | 2010 | 2009 | 2008 | 2007 | 2006 H |
Selected Per-Share Data | | | | | |
Net asset value, beginning of period | $ 7.76 | $ 5.96 | $ 13.07 | $ 10.61 | $ 10.00 |
Income from Investment Operations | | | | | |
Net investment income (loss) D | .18 | .14 | .25 | .22 | .07 G |
Net realized and unrealized gain (loss) | .44 | 1.78 | (6.54) | 2.30 | .54 |
Total from investment operations | .62 | 1.92 | (6.29) | 2.52 | .61 |
Distributions from net investment income | (.14) | (.12) | (.20) | (.04) | - |
Distributions from net realized gain | (.01) | - | (.62) | (.02) | - |
Total distributions | (.14) K | (.12) | (.82) | (.06) | - |
Redemption fees added to paid in capital D, J | - | - | - | - | - |
Net asset value, end of period | $ 8.24 | $ 7.76 | $ 5.96 | $ 13.07 | $ 10.61 |
Total Return B, C | 8.05% | 33.06% | (51.27)% | 23.91% | 6.10% |
Ratios to Average Net Assets E, I | | | | | |
Expenses before reductions | .98% | .93% | 1.02% | .98% | 1.38% A |
Expenses net of fee waivers, if any | .98% | .93% | 1.02% | .98% | 1.25% A |
Expenses net of all reductions | .97% | .92% | 1.01% | .96% | 1.21% A |
Net investment income (loss) | 2.34% | 2.26% | 2.45% | 1.89% | 1.54% A, G |
Supplemental Data | | | | | |
Net assets, end of period (000 omitted) | $ 519 | $ 814 | $ 1,052 | $ 3,965 | $ 3,064 |
Portfolio turnover rate F | 43% | 46% | 68% | 59% | 29% A |
A Annualized
B Total returns for periods of less than one year are not annualized.
C Total returns would have been lower had certain expenses not been reduced during the periods shown.
D Calculated based on average shares outstanding during the period.
E Fees and expenses of the underlying Fidelity Central Funds are not included in the Fund's expense ratio. The Fund indirectly bears its proportionate share of the expenses of any underlying Fidelity Central Funds.
F Amount does not include the portfolio activity of any underlying Fidelity Central Funds.
G Investment income per share reflects a special dividend which amounted to $.03 per share. Excluding the special dividend, the ratio of net investment income (loss) to average net assets would have been .88%.
H For the period May 18, 2006 (commencement of operations) to October 31, 2006.
I Expense ratios reflect operating expenses of the class. Expenses before reductions do not reflect amounts reimbursed by the investment adviser or reductions from brokerage service arrangements or reductions from other expense offset arrangements and do not represent the amount paid by the class during periods when reimbursements or reductions occur. Expense ratios before reductions for start-up periods may not be representative of longer-term operating periods. Expenses net of fee waivers reflect expenses after reimbursement by the investment adviser but prior to reductions from brokerage service arrangements or other expense offset arrangements. Expenses net of all reductions represent the net expenses paid by the class.
J Amount represents less than $.01 per share.
K Total distributions of $.14 per share is comprised of distributions from net investment income of $.137 and distributions from net realized gain of $.005 per share.
See accompanying notes which are an integral part of the financial statements.
Annual Report
Notes to Financial Statements
For the period ended October 31, 2010
1. Organization.
Fidelity International Value Fund (the Fund) is a fund of Fidelity Investment Trust (the Trust) and is authorized to issue an unlimited number of shares. The Trust is registered under the Investment Company Act of 1940, as amended (the 1940 Act), as an open-end management investment company organized as a Massachusetts business trust. The Fund offers Class A, Class T, Class C, International Value and Institutional Class shares, each of which has equal rights as to assets and voting privileges. Effective after the close of business on September 1, 2010, Class B shares were closed to new accounts and additional purchases by existing shareholders. Each class has exclusive voting rights with respect to matters that affect that class. Class B shares will automatically convert to Class A shares after a holding period of seven years from the initial date of purchase. Investment income, realized and unrealized capital gains and losses, the common expenses of the Fund, and certain fund-level expense reductions, if any, are allocated on a pro-rata basis to each class based on the relative net assets of each class to the total net assets of the Fund. Each class differs with respect to transfer agent and distribution and service plan fees incurred. Certain expense reductions also differ by class. The Fund's investments in emerging markets can be subject to social, economic, regulatory, and political uncertainties and can be extremely volatile.
2. Investments in Fidelity Central Funds.
The Fund may invest in Fidelity Central Funds, which are open-end investment companies available only to other investment companies and accounts managed by Fidelity Management & Research Company (FMR) and its affiliates. The Fund's Schedule of Investments lists each of the Fidelity Central Funds held as of period end, if any, as an investment of the Fund, but does not include the underlying holdings of each Fidelity Central Fund. As an Investing Fund, the Fund indirectly bears its proportionate share of the expenses of the underlying Fidelity Central Funds.
The Money Market Central Funds seek preservation of capital and current income and are managed by Fidelity Investments Money Management, Inc. (FIMM), an affiliate of FMR.
A complete unaudited list of holdings for each Fidelity Central Fund is available upon request or at the Securities and Exchange Commission (the SEC) web site at www.sec.gov. In addition, the financial statements of the Fidelity Central Funds, which are not covered by the Fund's Report of Independent Registered Public Accounting Firm, are available on the SEC web site or upon request.
3. Significant Accounting Policies.
The financial statements have been prepared in conformity with accounting principles generally accepted in the United States of America (GAAP), which require management to make certain estimates and assumptions at the date of the financial statements.
Annual Report
Notes to Financial Statements - continued
3. Significant Accounting Policies - continued
Actual results could differ from those estimates. The following summarizes the significant accounting policies of the Fund:
Security Valuation. Investments are valued as of 4:00 p.m. Eastern time on the last calendar day of the period. The Fund uses independent pricing services approved by the Board of Trustees to value its investments. When current market prices or quotations are not readily available or reliable, valuations may be determined in good faith in accordance with procedures adopted by the Board of Trustees. Factors used in determining value may include market or security specific events. The frequency with which these procedures are used cannot be predicted and they may be utilized to a significant extent. The value used for net asset value (NAV) calculation under these procedures may differ from published prices for the same securities.
The Fund categorizes the inputs to valuation techniques used to value its investments into a disclosure hierarchy consisting of three levels as shown below.
Level 1 - quoted prices in active markets for identical investments
Level 2 - other significant observable inputs (including quoted prices for similar investments, interest rates, prepayment speeds, etc.)
Level 3 - unobservable inputs (including the fund's own assumptions based on the best information available)
Changes in valuation techniques may result in transfers in or out of an assigned level within the disclosure hierarchy. The aggregate value of investments by input level as of October 31, 2010 is included at the end of the Fund's Schedule of Investments. Valuation techniques used to value the Fund's investments by major category are as follows.
Equity securities, including restricted securities, for which market quotations are readily available, are valued at the last reported sale price or official closing price as reported by an independent pricing service on the primary market or exchange on which they are traded and are categorized as Level 1 in the hierarchy. In the event there were no sales during the day or closing prices are not available, securities are valued at the last quoted bid price or may be valued using the last available price and are generally categorized as Level 2 in the hierarchy. For foreign equity securities, when significant market or security specific events arise, comparisons to the valuation of American Depositary Receipts (ADRs), futures contracts, Exchange-traded funds (ETFs) and certain indexes as well as quoted prices for similar securities are used and are categorized as Level 2 in the hierarchy in these circumstances. Utilizing these techniques may result in significant transfers between Level 1 and Level 2. For restricted equity securities and private placements where observable inputs are limited, assumptions about market activity and risk are used and are categorized as Level 3 in the hierarchy.
Annual Report
3. Significant Accounting Policies - continued
Security Valuation - continued
Investments in open-end mutual funds ,including the Fidelity Central Funds, are valued at their closing net asset value each business day and are categorized as Level 1 in the hierarchy. Short-term securities with remaining maturities of sixty days or less for which quotations are not readily available are valued at amortized cost, which approximates fair value and are categorized as Level 2 in the hierarchy.
Foreign Currency. The Fund uses foreign currency contracts to facilitate transactions in foreign-denominated securities. Gains and losses from these transactions may arise from changes in the value of the foreign currency or if the counterparties do not perform under the contracts' terms.
Foreign-denominated assets, including investment securities, and liabilities are translated into U.S. dollars at the exchange rate at period end. Purchases and sales of investment securities, income and dividends received and expenses denominated in foreign currencies are translated into U.S. dollars at the exchange rate in effect on the transaction date.
The effects of exchange rate fluctuations on investments are included with the net realized and unrealized gain (loss) on investment securities. Other foreign currency transactions resulting in realized and unrealized gain (loss) are disclosed separately.
Investment Transactions and Income. For financial reporting purposes, the Fund's investment holdings and NAV include trades executed through the end of the last business day of the period. The NAV per share for processing shareholder transactions is calculated as of the close of business of the New York Stock Exchange (NYSE), normally 4:00 p.m. Eastern time and includes trades executed through the end of the prior business day. Gains and losses on securities sold are determined on the basis of identified cost. Dividend income is recorded on the ex-dividend date, except for certain dividends from foreign securities where the ex-dividend date may have passed, which are recorded as soon as the Fund is informed of the ex-dividend date. Non-cash dividends included in dividend income, if any, are recorded at the fair market value of the securities received. Interest income and distributions from the Fidelity Central Funds are accrued as earned. Interest income includes coupon interest and amortization of premium and accretion of discount on debt securities. Investment income is recorded net of foreign taxes withheld where recovery of such taxes is uncertain.
Expenses. Most expenses of the Trust can be directly attributed to a fund. Expenses which cannot be directly attributed are apportioned amongst each fund in the Trust. Expense estimates are accrued in the period to which they relate and adjustments are made when actual amounts are known.
Annual Report
Notes to Financial Statements - continued
3. Significant Accounting Policies - continued
Income Tax Information and Distributions to Shareholders. Each year the Fund intends to qualify as a regulated investment company, including distributing substantially all of its taxable income and realized gains under Subchapter M of the Internal Revenue Code and filing its U.S. federal tax return. As a result, no provision for income taxes is required. As of October 31, 2010, the Fund did not have any unrecognized tax benefits in the accompanying financial statements. A fund's federal tax return is subject to examination by the Internal Revenue Service (IRS) for a period of three years. Foreign taxes are provided for based on the Fund's understanding of the tax rules and rates that exist in the foreign markets in which it invests. The Fund is subject to a tax imposed on short term capital gains on securities of certain issuers domiciled in India. The Fund records an estimated deferred tax liability included in Other payables and accrued expenses in the accompanying Statement of Assets & Liabilities for net unrealized gains on these securities in an amount that would be payable if the securities were disposed of at period end.
Distributions are declared and recorded on the ex-dividend date. Income dividends and capital gain distributions are declared separately for each class. Income and capital gain distributions are determined in accordance with income tax regulations, which may differ from GAAP.
Capital accounts within the financial statements are adjusted for permanent book-tax differences. These adjustments have no impact on net assets or the results of operations. Temporary book-tax differences will reverse in a subsequent period.
Book-tax differences are primarily due to the short-term gain distributions from the Fidelity Central Funds, foreign currency transactions, passive foreign investment companies (PFIC), capital loss carryforwards and losses deferred due to wash sales.
The federal tax cost of investment securities and unrealized appreciation (depreciation) as of period end were as follows:
Gross unrealized appreciation | $ 16,722,692 |
Gross unrealized depreciation | (29,377,939) |
Net unrealized appreciation (depreciation) | $ (12,655,247) |
| |
Tax Cost | $ 201,497,522 |
The tax-based components of distributable earnings as of period end were as follows:
Undistributed ordinary income | $ 4,141,622 |
Capital loss carryforward | $ (86,037,358) |
Net unrealized appreciation (depreciation) | $ (12,628,725) |
Annual Report
3. Significant Accounting Policies - continued
Income Tax Information and Distributions to Shareholders - continued
The tax character of distributions paid was as follows:
| October 31, 2010 | October 31, 2009 |
Ordinary Income | $ 3,259,286 | $ 3,076,516 |
Short-Term Trading (Redemption) Fees. Shares held by investors in the Fund less than 30 days are subject to a redemption fee equal to 1.00% of the net asset value of shares redeemed. All redemption fees, which reduce the proceeds of the shareholder redemption, are retained by the Fund and accounted for as an addition to paid in capital.
4. Purchases and Sales of Investments.
Purchases and sales of securities, other than short-term securities, aggregated $74,051,222 and $100,611,718, respectively.
5. Fees and Other Transactions with Affiliates.
Management Fee. FMR and its affiliates provide the Fund with investment management related services for which the Fund pays a monthly management fee. The management fee is the sum of an individual fund fee rate that is based on an annual rate of .45% of the Fund's average net assets and a group fee rate that averaged .26% during the period. The group fee rate is based upon the average net assets of all the mutual funds advised by FMR. The group fee rate decreases as assets under management increase and increases as assets under management decrease. In addition, the management fee is subject to a performance adjustment (up to a maximum of ±.20% of the Fund's average net assets over a 36 month performance period). The upward or downward adjustment to the management fee is based on the relative investment performance of International Value as compared to an appropriate benchmark index. For the period, the total annual management fee rate, including the performance adjustment, was .67% of the Fund's average net assets.
Distribution and Service Plan Fees. In accordance with Rule 12b-1 of the 1940 Act, the Fund has adopted separate Distribution and Service Plans for each class of shares. Certain classes pay Fidelity Distributors Corporation (FDC), an affiliate of FMR, separate Distribution and Service Fees, each of which is based on an annual percentage of each class' average net assets. In addition, FDC may pay financial intermediaries for selling shares of the Fund and providing shareholder support services. For the period,
Annual Report
Notes to Financial Statements - continued
5. Fees and Other Transactions with Affiliates - continued
Distribution and Service Plan Fees - continued
the Distribution and Service Fee rates, total fees and amounts retained by FDC were as follows:
Sales Load. FDC receives a front-end sales charge of up to 5.75% for selling Class A shares, and 3.50% for selling Class T shares, some of which is paid to financial intermediaries for selling shares of the Fund. FDC receives the proceeds of contingent deferred sales charges levied on Class A, Class T, Class B, and Class C redemptions. These charges depend on the holding period. The deferred sales charges range from 5% to 1% for Class B, 1% for Class C, 1.00% for certain purchases of Class A shares (1.00% to .50% prior to July 12, 2010) and .25% for certain purchases of Class T shares.
For the period, sales charge amounts retained by FDC were as follows:
| Retained
by FDC |
Class A | $ 2,989 |
Class T | 944 |
Class B* | 1,152 |
Class C* | 496 |
| $ 5,581 |
* When Class B and Class C shares are initially sold, FDC pays commissions from its own resources to financial intermediaries through which the sales are made.
Transfer Agent Fees. Fidelity Investments Institutional Operations Company, Inc. (FIIOC), an affiliate of FMR, is the transfer, dividend disbursing and shareholder servicing agent for each class of the Fund. FIIOC receives account fees and asset-based fees that vary according to the account size and type of account of the shareholders of the respective classes of the Fund. FIIOC pays for typesetting, printing and mailing of
Annual Report
5. Fees and Other Transactions with Affiliates - continued
Transfer Agent Fees - continued
shareholder reports, except proxy statements. For the period, transfer agent fees for each class were as follows:
Accounting and Security Lending Fees. Fidelity Service Company, Inc. (FSC), an affiliate of FMR, maintains the Fund's accounting records. The accounting fee is based on the level of average net assets for the month. Under a separate contract, FSC administers the security lending program. The security lending fee is based on the number and duration of lending transactions.
Brokerage Commissions. The Fund placed a portion of its portfolio transactions with brokerage firms which are affiliates of the investment adviser. The commissions paid to these affiliated firms were $338 for the period.
6. Committed Line of Credit.
The Fund participates with other funds managed by FMR or an affiliate in a $3.75 billion credit facility (the "line of credit") to be utilized for temporary or emergency purposes to fund shareholder redemptions or for other short-term liquidity purposes. The Fund has agreed to pay commitment fees on its pro-rata portion of the line of credit, which amounted to $702 and is reflected in Miscellaneous expenses on the Statement of Operations. During the period, there were no borrowings on this line of credit.
7. Security Lending.
The Fund lends portfolio securities through a lending agent from time to time in order to earn additional income. The lending agent may loan securities to certain qualified borrowers, including Fidelity Capital Markets (FCM), a broker-dealer affiliated with the Fund. On the settlement date of the loan, the Fund receives collateral (in the form of U.S. Treasury obligations, letters of credit and/or cash) against the loaned securities and maintains collateral in an amount not less than 100% of the market value of the loaned securities during the period of the loan. The market value of the loaned securities is
Annual Report
Notes to Financial Statements - continued
7. Security Lending - continued
determined at the close of business of the Fund and any additional required collateral is delivered to the Fund on the next business day. If the borrower defaults on its obligation to return the securities loaned because of insolvency or other reasons, a fund could experience delays and costs in recovering the securities loaned or in gaining access to the collateral. Any cash collateral received is invested in the Fidelity Securities Lending Cash Central Fund. The value of loaned securities and cash collateral at period end are disclosed on the Fund's Statement of Assets and Liabilities. Security lending income represents the income earned on investing cash collateral, less rebates paid to borrowers and lending agent fees associated with the loan, plus any premium payments received for lending certain types of securities. Security lending income is presented in the Statement of Operations as a component of income from Fidelity Central Funds. Total security lending income during the period amounted to $157,549. During the period, there were no securities loaned to FCM.
8. Expense Reductions.
Many of the brokers with whom FMR places trades on behalf of the Fund provided services to the Fund in addition to trade execution. These services included payments of certain expenses on behalf of the Fund totaling $28,245 for the period.
9. Distributions to Shareholders.
Distributions to shareholders of each class were as follows:
Years ended October 31, | 2010 | 2009 |
From net investment income | | |
Class A | $ 64,929 | $ 38,784 |
Class T | 27,801 | 19,023 |
Class B | 8,869 | - |
Class C | 14,357 | - |
International Value | 3,006,248 | 3,001,128 |
Institutional Class | 13,553 | 17,581 |
Total | $ 3,135,757 | $ 3,076,516 |
From net realized gain | | |
Class A | $ 2,899 | $ - |
Class T | 1,544 | - |
Class B | 715 | - |
Class C | 1,354 | - |
International Value | 116,522 | - |
Institutional Class | 495 | - |
Total | $ 123,529 | $ - |
Annual Report
10. Share Transactions.
Transactions for each class of shares were as follows:
| Shares | Dollars |
Years ended October 31, | 2010 | 2009 | 2010 | 2009 |
Class A | | | | |
Shares sold | 216,581 | 302,325 | $ 1,676,019 | $ 1,876,749 |
Reinvestment of distributions | 7,621 | 6,730 | 61,732 | 35,265 |
Shares redeemed | (227,521) | (215,042) | (1,766,121) | (1,172,427) |
Net increase (decrease) | (3,319) | 94,013 | $ (28,370) | $ 739,587 |
Class T | | | | |
Shares sold | 82,344 | 72,122 | $ 635,080 | $ 432,831 |
Reinvestment of distributions | 3,507 | 2,980 | 28,408 | 15,614 |
Shares redeemed | (118,025) | (118,669) | (899,018) | (709,124) |
Net increase (decrease) | (32,174) | (43,567) | $ (235,530) | $ (260,679) |
Class B | | | | |
Shares sold | 44,963 | 51,221 | $ 346,949 | $ 307,508 |
Reinvestment of distributions | 980 | - | 7,981 | - |
Shares redeemed | (36,625) | (70,451) | (286,374) | (387,465) |
Net increase (decrease) | 9,318 | (19,230) | $ 68,556 | $ (79,957) |
Class C | | | | |
Shares sold | 56,757 | 108,573 | $ 434,910 | $ 666,628 |
Reinvestment of distributions | 1,540 | - | 12,532 | - |
Shares redeemed | (72,014) | (139,651) | (560,469) | (850,584) |
Net increase (decrease) | (13,717) | (31,078) | $ (113,027) | $ (183,956) |
International Value | | | | |
Shares sold | 3,662,730 | 4,879,190 | $ 28,403,948 | $ 32,198,500 |
Reinvestment of distributions | 369,795 | 550,070 | 2,987,943 | 2,876,866 |
Shares redeemed | (7,496,748) | (9,139,736) | (57,917,334) | (52,863,403) |
Net increase (decrease) | (3,464,223) | (3,710,476) | $ (26,525,443) | $ (17,788,037) |
Institutional Class | | | | |
Shares sold | 16,581 | 6,874 | $ 128,469 | $ 36,272 |
Reinvestment of distributions | 185 | 572 | 1,498 | 2,992 |
Shares redeemed | (58,573) | (79,196) | (468,362) | (446,832) |
Net increase (decrease) | (41,807) | (71,750) | $ (338,395) | $ (407,568) |
Annual Report
Notes to Financial Statements - continued
11. Other.
The Fund's organizational documents provide former and current trustees and officers with a limited indemnification against liabilities arising in connection with the performance of their duties to the Fund. In the normal course of business, the Fund may also enter into contracts that provide general indemnifications. The Fund's maximum exposure under these arrangements is unknown as this would be dependent on future claims that may be made against the Fund. The risk of material loss from such claims is considered remote.
Annual Report
To the Trustees of Fidelity Investment Trust and Shareholders of Fidelity International Value Fund:
We have audited the accompanying statement of assets and liabilities of Fidelity International Value Fund (the Fund), a fund of Fidelity Investment Trust, including the schedule of investments, as of October 31, 2010, and the related statement of operations for the year then ended, the statement of changes in net assets for each of the two years in the period then ended, and the financial highlights for each of the periods presented. These financial statements and financial highlights are the responsibility of the Fund's management. Our responsibility is to express an opinion on these financial statements and financial highlights based on our audits.
We conducted our audits in accordance with standards of the Public Company Accounting Oversight Board (United States). Those standards require that we plan and perform the audit to obtain reasonable assurance about whether the financial statements and financial highlights are free of material misstatement. The Fund is not required to have, nor were we engaged to perform, an audit of its internal control over financial reporting. Our audits included consideration of internal control over financial reporting as a basis for designing audit procedures that are appropriate in the circumstances, but not for the purpose of expressing an opinion on the effectiveness of the Fund's internal control over financial reporting. Accordingly, we express no such opinion. An audit also includes examining, on a test basis, evidence supporting the amounts and disclosures in the financial statements, assessing the accounting principles used and significant estimates made by management, as well as evaluating the overall financial statement presentation. Our procedures included confirmation of securities owned as of October 31, 2010, by correspondence with the custodians and brokers; where replies were not received from brokers, we performed other auditing procedures. We believe that our audits provide a reasonable basis for our opinion.
In our opinion, the financial statements and financial highlights referred to above present fairly, in all material respects, the financial position of Fidelity International Value Fund as of October 31, 2010, the results of its operations for the year then ended, the changes in its net assets for each of the two years in the period then ended, and the financial highlights for each of the periods presented, in conformity with accounting principles generally accepted in the United States of America.
/s/ Deloitte & Touche LLP
DELOITTE & TOUCHE LLP
Boston, Massachusetts
December 16, 2010
Annual Report
The Trustees, Member of the Advisory Board, and executive officers of the trust and fund, as applicable, are listed below. The Board of Trustees governs the fund and is responsible for protecting the interests of shareholders. The Trustees are experienced executives who meet periodically throughout the year to oversee the fund's activities, review contractual arrangements with companies that provide services to the fund, oversee management of the risks associated with such activities and contractual arrangements, and review the fund's performance. Except for James C. Curvey, each of the Trustees oversees 221 funds advised by FMR or an affiliate. Mr. Curvey oversees 410 funds advised by FMR or an affiliate.
The Trustees hold office without limit in time except that (a) any Trustee may resign; (b) any Trustee may be removed by written instrument, signed by at least two-thirds of the number of Trustees prior to such removal; (c) any Trustee who requests to be retired or who has become incapacitated by illness or injury may be retired by written instrument signed by a majority of the other Trustees; and (d) any Trustee may be removed at any special meeting of shareholders by a two-thirds vote of the outstanding voting securities of the trust. Each Trustee who is not an interested person (as defined in the 1940 Act) (Independent Trustee), shall retire not later than the last day of the calendar year in which his or her 72nd birthday occurs. The Independent Trustees may waive this mandatory retirement age policy with respect to individual Trustees. The executive officers and Advisory Board Member hold office without limit in time, except that any officer and Advisory Board Member may resign or may be removed by a vote of a majority of the Trustees at any regular meeting or any special meeting of the Trustees. Except as indicated, each individual has held the office shown or other offices in the same company for the past five years.
Experience, Skills, Attributes, and Qualifications of the Fund's Trustees. The Governance and Nominating Committee has adopted a statement of policy that describes the experience, qualifications, attributes, and skills that are necessary and desirable for potential Independent Trustee candidates (Statement of Policy). The Board believes that each Trustee satisfied at the time he or she was initially elected or appointed a Trustee, and continues to satisfy, the standards contemplated by the Statement of Policy. The Governance and Nominating Committee also engages professional search firms to help identify potential Independent Trustee candidates who have the experience, qualifications, attributes, and skills consistent with the Statement of Policy. From time to time, additional criteria based on the composition and skills of the current Independent Trustees, as well as experience or skills that may be appropriate in light of future changes to board composition, business conditions, and regulatory or other developments, have also been considered by the professional search firms and the Governance and Nominating Committee. In addition, the Board takes into account the Trustees' commitment and participation in Board and committee meetings, as well as their leadership of standing and ad hoc committees throughout their tenure.
In determining that a particular Trustee was and continues to be qualified to serve as a Trustee, the Board has considered a variety of criteria, none of which, in isolation, was controlling. The Board believes that, collectively, the Trustees have balanced and diverse experience, qualifications, attributes, and skills, which allow the Board to operate effectively in governing the fund and protecting the interests of shareholders. Information about the specific experience, skills, attributes, and qualifications of each Trustee, which in each case led to the Board's conclusion that the Trustee should serve (or continue to serve) as a trustee of the fund, is provided below.
Annual Report
Board Structure and Oversight Function. Edward C. Johnson 3d is an interested person (as defined in the 1940 Act) and currently serves as Chairman. The Trustees have determined that an interested Chairman is appropriate and benefits shareholders because an interested Chairman has a personal and professional stake in the quality and continuity of services provided to the fund. Independent Trustees exercise their informed business judgment to appoint an individual of their choosing to serve as Chairman, regardless of whether the Trustee happens to be independent or a member of management. The Independent Trustees have determined that they can act independently and effectively without having an Independent Trustee serve as Chairman and that a key structural component for assuring that they are in a position to do so is for the Independent Trustees to constitute a substantial majority for the Board. The Independent Trustees also regularly meet in executive session. Ned C. Lautenbach serves as Chairman of the Independent Trustees and as such (i) acts as a liaison between the Independent Trustees and management with respect to matters important to the Independent Trustees and (ii) with management prepares agendas for Board meetings.
Fidelity funds are overseen by different Boards of Trustees. The fund's Board oversees Fidelity's equity and high income funds and another Board oversees Fidelity's investment-grade bond, money market, and asset allocation funds. The asset allocation funds may invest in Fidelity funds overseen by the fund's Board. The use of separate Boards, each with its own committee structure, allows the Trustees of each group of Fidelity funds to focus on the unique issues of the funds they oversee, including common research, investment, and operational issues. On occasion, the separate Boards establish joint committees to address issues of overlapping consequences for the Fidelity funds overseen by each Board.
The Trustees operate using a system of committees to facilitate the timely and efficient consideration of all matters of importance to the Trustees, the fund, and fund shareholders and to facilitate compliance with legal and regulatory requirements and oversight of the fund's activities and associated risks. The Board, acting through its committees, has charged FMR and its affiliates with (i) identifying events or circumstances the occurrence of which could have demonstrably adverse effects on the fund's business and/or reputation; (ii) implementing processes and controls to lessen the possibility that such events or circumstances occur or to mitigate the effects of such events or circumstances if they do occur; and (iii) creating and maintaining a system designed to evaluate continuously business and market conditions in order to facilitate the identification and implementation processes described in (i) and (ii) above. Because the day-to-day operations and activities of the fund are carried out by or through FMR, its affiliates and other service providers, the fund's exposure to risks is mitigated but not eliminated by the processes overseen by the Trustees. While each of the Board's committees has responsibility for overseeing different aspects of the fund's activities, oversight is exercised primarily through the Operations, Audit, and Compliance Committees. Appropriate personnel, including but not limited to the fund's Chief Compliance Officer (CCO), FMR's internal auditor, the independent accountants, the fund's Treasurer and portfolio management personnel, make periodic reports to the Board's committees, as appropriate. The responsibilities of each committee, including their oversight responsibilities, are described further under "Standing Committees of the Fund's Trustees."
Annual Report
Trustees and Officers - continued
The fund's Statement of Additional Information (SAI) includes more information about the Trustees. To request a free copy, call Fidelity at 1-800-544-8544.
Interested Trustees*:
Correspondence intended for each Trustee who is an interested person may be sent to Fidelity Investments, 82 Devonshire Street, Boston, Massachusetts 02109.
Name, Age; Principal Occupations and Other Relevant Experience+ |
Edward C. Johnson 3d (80) |
| Year of Election or Appointment: 1984 Mr. Johnson is Trustee and Chairman of the Board of Trustees of certain Trusts. Mr. Johnson serves as Chief Executive Officer, Chairman, and a Director of FMR LLC; Chairman and a Director of FMR; Chairman and a Director of Fidelity Research & Analysis Company (FRAC); Chairman and a Director of Fidelity Investments Money Management, Inc.; and Chairman and a Director of FMR Co., Inc. In addition, Mr. Johnson serves as Chairman and Director of FIL Limited. Previously, Mr. Johnson served as President of FMR LLC (2006-2007). |
James C. Curvey (75) |
| Year of Election or Appointment: 2007 Mr. Curvey also serves as Trustee (2007-present) of other investment companies advised by FMR. Mr. Curvey is a Director of Fidelity Investments Money Management, Inc. (2009-present), Director of Fidelity Research & Analysis Co. (2009-present) and Director of FMR and FMR Co., Inc. (2007-present). Mr. Curvey is also Vice Chairman (2007-present) and Director of FMR LLC. In addition, Mr. Curvey serves as an Overseer for the Boston Symphony Orchestra and a member of the Trustees of Villanova University. Previously, Mr. Curvey was the Vice Chairman (2006-2007) and Director (2000-2007) of FMR Corp. |
* Trustees have been determined to be "Interested Trustees" by virtue of, among other things, their affiliation with the trust or various entities under common control with FMR.
+ The information above includes each Trustee's principal occupation during the last five years and other information relating to the experience, attributes, and skills relevant to each Trustee's qualifications to serve as a Trustee, which led to the conclusion that each Trustee should serve as a Trustee for the fund.
Independent Trustees:
Correspondence intended for each Independent Trustee (that is, the Trustees other than the Interested Trustees) may be sent to Fidelity Investments, P.O. Box 55235, Boston, Massachusetts 02205-5235.
Name, Age; Principal Occupations and Other Relevant Experience+ |
Dennis J. Dirks (62) |
| Year of Election or Appointment: 2005 Prior to his retirement in May 2003, Mr. Dirks was Chief Operating Officer and a member of the Board of The Depository Trust & Clearing Corporation (DTCC). He also served as President, Chief Operating Officer, and Board member of The Depository Trust Company (DTC) and President and Board member of the National Securities Clearing Corporation (NSCC). In addition, Mr. Dirks served as Chief Executive Officer and Board member of the Government Securities Clearing Corporation, Chief Executive Officer and Board member of the Mortgage-Backed Securities Clearing Corporation, as a Trustee and a member of the Finance Committee of Manhattan College (2005-2008), and as a Trustee and a member of the Finance Committee of AHRC of Nassau County (2006-2008). Mr. Dirks is a member of the Independent Directors Council (IDC) Governing Council (2010-Present) and Board of Directors for The Brookville Center for Children's Services, Inc. (2009-present). |
Alan J. Lacy (57) |
| Year of Election or Appointment: 2008 Mr. Lacy serves as Senior Adviser (2007-present) of Oak Hill Capital Partners, L.P. (private equity). Mr. Lacy also served as Chief Executive Officer (2000-2005) and Vice Chairman (2005-2006) of Sears Holdings Corporation and Sears, Roebuck and Co. (retail). In addition, Mr. Lacy serves as a member of the Board of Directors of The Western Union Company (global money transfer, 2006-present) and Bristol-Myers Squibb Company (global pharmaceuticals, 2007-present). Mr. Lacy is Chairman (2008-present) and a member (2006-present) of the Board of Trustees of The National Parks Conservation Association. |
Ned C. Lautenbach (66) |
| Year of Election or Appointment: 2000 Mr. Lautenbach is Chairman of the Independent Trustees of the Equity and High Income Funds (2006-present). Mr. Lautenbach currently serves as the Lead Director of the Eaton Corporation Board of Directors (diversified industrial, 1997-present). Mr. Lautenbach is also a member of the Board of Directors of the Philharmonic Center for the Arts in Naples, Florida (1999-present); a member of the Board of Trustees of Fairfield University (2005-present); and a member of the Council on Foreign Relations (1994-present). Previously, Mr. Lautenbach was a Partner/Advisory Partner at Clayton, Dubilier & Rice, Inc. (private equity investment, 1998-2010), as well as a Director of Sony Corporation (2006-2007). |
Joseph Mauriello (66) |
| Year of Election or Appointment: 2008 Prior to his retirement in January 2006, Mr. Mauriello served in numerous senior management positions including Deputy Chairman and Chief Operating Officer (2004-2005), and Vice Chairman of Financial Services (2002-2004) of KPMG LLP US (professional services, 1965-2005). Mr. Mauriello currently serves as a member of the Board of Directors of XL Group plc. (global insurance and re-insurance, 2006-present) and of Arcadia Resources Inc. (health care services and products, 2007-present). Previously, Mr. Mauriello served as a Director of the Hamilton Funds of the Bank of New York (2006-2007). |
Cornelia M. Small (66) |
| Year of Election or Appointment: 2005 Ms. Small is a member of the Board of Directors of the Teagle Foundation (2009-present). Ms. Small is also a member of the Investment Committee, and Chair (2008-present) and a member of the Board of Trustees of Smith College. In addition, Ms. Small serves on the Investment Committee of the Berkshire Taconic Community Foundation (2008-present). Previously, Ms. Small served as Chairperson of the Investment Committee (2002-2008) of Smith College. In addition, Ms. Small served as Chief Investment Officer, Director of Global Equity Investments, and a member of the Board of Directors of Scudder, Stevens & Clark and Scudder Kemper Investments. |
William S. Stavropoulos (71) |
| Year of Election or Appointment: 2001 Mr. Stavropoulos is Vice Chairman of the Independent Trustees of the Equity and High Income Funds (2006-present). Mr. Stavropoulos serves as President and Founder of the Michigan Baseball Foundation, the Great Lakes Loons (2007-present). Mr. Stavropoulos is Chairman Emeritus of the Board of Directors of The Dow Chemical Company, where he previously served in numerous senior management positions, including President, CEO (1995-2000; 2002-2004), Chairman of the Executive Committee (2000-2006), and as a member of the Board of Directors (1990-2006). Currently, Mr. Stavropoulos is Chairman of Univar (global distributor of commodity and specialty chemicals, 2010-present), a Director of Teradata Corporation (data warehousing and technology solutions, 2008-present), Chemical Financial Corporation, Maersk Inc. (industrial conglomerate), Tyco International, Inc. (multinational manufacturing and services, 2007-present), and a member of the Advisory Board for Metalmark Capital (private equity investment, 2005-present). Mr. Stavropoulos is a special advisor to Clayton, Dubilier & Rice, Inc. (private equity investment). In addition, Mr. Stavropoulos is a member of the University of Notre Dame Advisory Council for the College of Science. |
David M. Thomas (61) |
| Year of Election or Appointment: 2008 Previously, Mr. Thomas served as Executive Chairman (2005-2006) and Chairman and Chief Executive Officer (2000-2005) of IMS Health, Inc. (pharmaceutical and healthcare information solutions). In addition, Mr. Thomas serves as a member of the Board of Directors of Fortune Brands, Inc. (consumer products), and Interpublic Group of Companies, Inc. (marketing communication, 2004-present). |
Michael E. Wiley (60) |
| Year of Election or Appointment: 2008 Mr. Wiley also serves as a Director of Asia Pacific Exploration Consolidated (international oil and gas exploration and production, 2008-present). Mr. Wiley serves as a Director of Tesoro Corporation (independent oil refiner and marketer, 2005-present), and a Director of Bill Barrett Corporation (exploration and production, 2005-present). In addition, Mr. Wiley also serves as a Director of Post Oak Bank (privately-held bank, 2004-present). Previously, Mr. Wiley served as a member of the Board of Trustees of the University of Tulsa (2000-2006; 2007-2010), as a Senior Energy Advisor of Katzenbach Partners, LLC (consulting, 2006-2007), as an Advisory Director of Riverstone Holdings (private investment), Chairman, President, and CEO of Baker Hughes, Inc. (oilfield services, 2000-2004), and as Director of Spinnaker Exploration Company (exploration and production, 2001-2005). |
+ The information above includes each Trustee's principal occupation during the last five years and other information relating to the experience, attributes, and skills relevant to each Trustee's qualifications to serve as a Trustee, which led to the conclusion that each Trustee should serve as a Trustee for the fund.
Advisory Board Member and Executive Officers:
Correspondence intended for each executive officer and Peter S. Lynch may be sent to Fidelity Investments, 82 Devonshire Street, Boston, Massachusetts 02109.
Name, Age; Principal Occupation |
Peter S. Lynch (66) |
| Year of Election or Appointment: 2003 Member of the Advisory Board of Fidelity's Equity and High Income Funds. Mr. Lynch is Vice Chairman and a Director of FMR and FMR Co., Inc. In addition, Mr. Lynch serves as a Trustee of Boston College and as the Chairman of the Inner-City Scholarship Fund. Previously, Mr. Lynch served on the Special Olympics International Board of Directors (1997-2006). |
Kenneth B. Robins (41) |
| Year of Election or Appointment: 2008 President and Treasurer of Fidelity's Equity and High Income Funds. Mr. Robins also serves as President and Treasurer (2010-present) and Assistant Treasurer (2009-present) of other Fidelity funds and is an employee of Fidelity Investments (2004-present). Previously, Mr. Robins served as Deputy Treasurer of the Fidelity funds (2005-2008) and Treasurer and Chief Financial Officer of The North Carolina Capital Management Trust: Cash and Term Portfolios (2006-2008). |
Bruce T. Herring (45) |
| Year of Election or Appointment: 2006 Vice President of certain Equity Funds. Mr. Herring also serves as Chief Investment Officer and Director of Fidelity Management & Research (U.K.) Inc. (2010-present) and Group Chief Investments Officer of FMR. Previously, Mr. Herring served as Vice President (2005-2006) and Senior Vice President (2006-2007) of Fidelity Management & Research Company, Vice President of FMR Co., Inc. (2001-2007) and as a portfolio manager for Fidelity U.S. Equity Funds. |
Brian B. Hogan (46) |
| Year of Election or Appointment: 2009 Vice President of certain Equity Funds and Vice President of Sector Funds. Mr. Hogan also serves as President of FMR's Equity Division (2009-present). Previously, Mr. Hogan served as Senior Vice President, Equity Research of FMR (2006-2009) and as a portfolio manager. |
Scott C. Goebel (42) |
| Year of Election or Appointment: 2008 Secretary and Chief Legal Officer (CLO) of the Fidelity funds. Mr. Goebel also serves as Secretary and CLO of The North Carolina Capital Management Trust: Cash and Term Portfolio (2008-present); General Counsel, Secretary, and Senior Vice President of FMR (2008-present) and FMR Co., Inc. (2008-present); Deputy General Counsel of FMR LLC; Chief Legal Officer of Fidelity Management & Research (Hong Kong) Limited (2008-present) and Assistant Secretary of Fidelity Management & Research (Japan) Inc. (2008-present), Fidelity Investments Money Management, Inc. (2008-present), Fidelity Management & Research (U.K.) Inc. (2008-present), and Fidelity Research and Analysis Company (2008-present). Previously, Mr. Goebel served as Assistant Secretary of the Funds (2007-2008) and as Vice President and Secretary of Fidelity Distributors Corporation (FDC) (2005-2007). |
William C. Coffey (41) |
| Year of Election or Appointment: 2009 Assistant Secretary of Fidelity's Equity and High Income Funds. Mr. Coffey also serves as Senior Vice President and Deputy General Counsel of FMR LLC (2010-present), and is an employee of Fidelity Investments. Previously, Mr. Coffey served as Vice President and Associate General Counsel of FMR LLC (2005-2009). |
Holly C. Laurent (56) |
| Year of Election or Appointment: 2008 Anti-Money Laundering (AML) Officer of the Fidelity funds. Ms. Laurent also serves as AML Officer of The North Carolina Capital Management Trust: Cash and Term Portfolio (2008-present) and is an employee of Fidelity Investments. Previously, Ms. Laurent was Senior Vice President and Head of Legal for Fidelity Business Services India Pvt. Ltd. (2006-2008), and Senior Vice President, Deputy General Counsel and Group Head for FMR LLC (2005-2006). |
Christine Reynolds (52) |
| Year of Election or Appointment: 2008 Chief Financial Officer of the Fidelity funds. Ms. Reynolds became President of Fidelity Pricing and Cash Management Services (FPCMS) in August 2008. Ms. Reynolds served as Chief Operating Officer of FPCMS (2007-2008). Previously, Ms. Reynolds served as President, Treasurer, and Anti-Money Laundering officer of the Fidelity funds (2004-2007). |
Kenneth A. Rathgeber (63) |
| Year of Election or Appointment: 2004 Chief Compliance Officer of Fidelity's Equity and High Income Funds. Mr. Rathgeber is Chief Compliance Officer of Fidelity Management & Research (Hong Kong) Limited (2008-present), Fidelity Management & Research (Japan) Inc. (2008-present), FMR (2005-present), FMR Co., Inc. (2005-present), Fidelity Management & Research (U.K.) Inc. (2005-present), Fidelity Research & Analysis Company (2005-present), Fidelity Investments Money Management, Inc. (2005-present), Pyramis Global Advisors, LLC (2005-present), and Strategic Advisers, Inc. (2005-present). |
Jeffrey S. Christian (49) |
| Year of Election or Appointment: 2009 Deputy Treasurer of the Fidelity funds. Mr. Christian is an employee of Fidelity Investments. Previously, Mr. Christian served as Chief Financial Officer (2008-2009) of certain Fidelity funds and Senior Vice President of Fidelity Pricing and Cash Management Services (FPCMS) (2004-2009). |
Bryan A. Mehrmann (49) |
| Year of Election or Appointment: 2005 Deputy Treasurer of the Fidelity funds. Mr. Mehrmann is an employee of Fidelity Investments. |
Adrien E. Deberghes (43) |
| Year of Election or Appointment: 2008 Deputy Treasurer of Fidelity's Equity and High Income Funds. Mr. Deberghes also serves as Assistant Treasurer of other Fidelity funds (2010-present) and is an employee of Fidelity Investments (2008-present). Previously, Mr. Deberghes served as Senior Vice President of Mutual Fund Administration at State Street Corporation (2007-2008), Senior Director of Mutual Fund Administration at Investors Bank & Trust (2005-2007), and Director of Finance for Dunkin' Brands (2000-2005). |
Stephanie J. Dorsey (41) |
| Year of Election or Appointment: 2010 Assistant Treasurer of Fidelity's Equity and High Income Funds. Ms. Dorsey also serves as Deputy Treasurer of other Fidelity funds (2008-present) and is an employee of Fidelity Investments (2008-present). Previously, Ms. Dorsey served as Treasurer (2004-2008) of the JPMorgan Mutual Funds and Vice President (2004-2008) of JPMorgan Chase Bank. |
John R. Hebble (52) |
| Year of Election or Appointment: 2009 Assistant Treasurer of Fidelity's Equity and High Income Funds. Mr. Hebble also serves as Treasurer and Chief Financial Officer of The North Carolina Capital Management Trust: Cash and Term Portfolio (2008-present), President and Treasurer of other Fidelity funds (2008-present) and is an employee of Fidelity Investments. |
Gary W. Ryan (52) |
| Year of Election or Appointment: 2005 Assistant Treasurer of the Fidelity funds. Mr. Ryan is an employee of Fidelity Investments. Previously, Mr. Ryan served as Vice President of Fund Reporting in Fidelity Pricing and Cash Management Services (FPCMS) (1999-2005). |
Jonathan Davis (42) |
| Year of Election or Appointment: 2010 Assistant Treasurer of the Fidelity funds. Mr. Davis is an employee of Fidelity Investments. Previously, Mr. Davis served as Vice President and Associate General Counsel of FMR LLC (2003-2010). |
Annual Report
The Board of Trustees of Fidelity International Value Fund voted to pay on December 6, 2010, to shareholders of record at the opening of business on December 3, 2010, a distribution of $0.034 per share derived from capital gains realized from sales of portfolio securities and a dividend of $0.188 per share from net investment income.
The fund designates 77% of the dividends distributed in December during the fiscal year as amounts which may be taken into account as a dividend for the purposes of the maximum rate under section 1(h)(11) of the Internal Revenue Code.
The amounts per share which represent income derived from sources within, and taxes paid to, foreign countries or possessions of the United States are as follows:
| Pay Date | Income | Taxes |
International Value Fund | 12/07/09 | $0.138 | $0.012 |
The fund will notify shareholders in January 2011 of amounts for use in preparing 2010 income tax returns.
Annual Report
Board Approval of Investment Advisory Contracts and Management Fees
Fidelity International Value Fund
Each year, the Board of Trustees, including the Independent Trustees (together, the Board), votes on the renewal of the management contract and sub-advisory agreements (together, the Advisory Contracts) for the fund. The Board, assisted by the advice of fund counsel and Independent Trustees' counsel, requests and considers a broad range of information relevant to the renewal of the Advisory Contracts throughout the year.
The Board meets regularly and considers at each of its meetings factors that are relevant to its annual consideration of the renewal of the fund's Advisory Contracts, including the services and support provided to the fund and its shareholders. The Board has established various standing committees, each composed of Independent Trustees with varying backgrounds, to which the Board has assigned specific subject matter responsibilities in order to enhance effective decision-making by the Board. The Board, acting directly and through its Committees, requests and receives information concerning the annual consideration of the renewal of the fund's Advisory Contracts. The Board also meets as needed to consider matters specifically related to the Board's annual consideration of the renewal of Advisory Contracts. Members of the Board may also meet with trustees of other Fidelity funds through ad hoc joint committees to discuss certain matters relevant to the Fidelity funds.
At its July 2010 meeting, the Board of Trustees, including the Independent Trustees, unanimously determined to renew the fund's Advisory Contracts. In reaching its determination, the Board considered all factors it believed relevant, including (i) the nature, extent, and quality of the services to be provided to the fund and its shareholders (including the investment performance of the fund); (ii) the competitiveness of the fund's management fee and total expenses; (iii) the total costs of the services to be provided by and the profits to be realized by Fidelity from its relationship with the fund; (iv) the extent to which economies of scale would be realized as the fund grows; and (v) whether fee levels reflect these economies of scale, if any, for the benefit of fund shareholders.
In considering whether to renew the Advisory Contracts for the fund, the Board reached a determination, with the assistance of fund counsel and Independent Trustees' counsel and through the exercise of its business judgment, that the renewal of the Advisory Contracts is in the best interests of fund shareholders and that the compensation to be received by Fidelity under the management contract is fair and reasonable. The Board's decision to renew the Advisory Contracts was not based on any single factor noted above, but rather was based on a comprehensive consideration of all the information provided to the Board at its meetings throughout the year. The Board, in reaching its determination to renew the Advisory Contracts, is aware that shareholders in the fund have a broad range of investment choices available to them, including a wide choice among mutual funds offered by Fidelity's competitors, and that the fund's shareholders, with the opportunity to review and weigh the disclosure provided by the fund in its prospectus and other public disclosures, have chosen to invest in this fund, managed by Fidelity.
Annual Report
Nature, Extent, and Quality of Services Provided. The Board considered the staffing within the investment adviser, FMR, and the sub-advisers (together, the Investment Advisers), including the backgrounds of the fund's investment personnel and the fund's investment objective and discipline. The Independent Trustees also had discussions with senior management of Fidelity's investment operations and investment groups. The Board considered the structure of the portfolio manager compensation program and whether this structure provides appropriate incentives to act in the best interest of the fund.
Resources Dedicated to Investment Management and Support Services. The Board and the equity research subcommittee of the Board's Fund Oversight Committee reviewed the size, education, and experience of the Investment Advisers' investment staff, their use of technology, and the Investment Advisers' approach to recruiting, training, and retaining portfolio managers and other research, advisory, and management personnel. The Board noted that Fidelity's analysts have access to a variety of technological tools and market and securities data that enable them to perform both fundamental and quantitative analysis and to specialize in various disciplines. The Board considered Fidelity's extensive global research capabilities that enable the Investment Advisers to aggregate data from various sources in an effort to produce positive investment results. The Board also considered that Fidelity's portfolio managers and analysts have access to daily portfolio attribution that allows for monitoring of a fund's portfolio, as well as an electronic communication system that provides immediate real-time access to research concerning issuers and credit enhancers. The Board noted FMR's continued focus on strengthening the organization and discipline of equity portfolio management and research.
Shareholder and Administrative Services. The Board considered (i) the nature, extent, quality, and cost of advisory, administrative, and shareholder services performed by the Investment Advisers and their affiliates under the Advisory Contracts and under separate agreements covering transfer agency, pricing and bookkeeping, and securities lending services for the fund; (ii) the nature and extent of the investment adviser's supervision of third party service providers, principally custodians and subcustodians; and (iii) the resources devoted to, and the record of compliance with, the fund's compliance policies and procedures. The Board also reviewed the allocation of fund brokerage, including allocations to brokers affiliated with the Investment Advisers, the use of brokerage commissions to pay fund expenses, and the use of "soft" commission dollars to pay for research services.
The Board noted that the growth of fund assets over time across the complex allows Fidelity to reinvest in the development of services designed to enhance the value or convenience of the Fidelity funds as investment vehicles. These services include 24-hour access to account information and market information through phone representatives and over the Internet, and investor education materials and asset allocation tools.
Annual Report
Board Approval of Investment Advisory Contracts and
Management Fees - continued
Investment in a Large Fund Family. The Board considered the benefits to shareholders of investing in a Fidelity fund, including the benefits of investing in a fund that is part of a large family of funds offering a variety of investment disciplines and providing a large variety of mutual fund investor services. The Board noted that Fidelity had taken, or had made recommendations that resulted in the Fidelity funds taking, a number of actions over the previous year that benefited particular funds, including (i) dedicating additional resources to investment research and restructuring and broadening the focus of the investment research teams; (ii) bolstering the senior management team that oversees asset management; (iii) launching Class F of certain funds as a lower-fee class available to Freedom K and Freedom Index Funds; (iv) lowering the initial investment minimums and ongoing balance requirements for Real Estate High Income Fund; (v) eliminating subsequent purchase minimums for all funds and adding a waiver of the investment minimum requirement for new accounts opened with the proceeds of a systematic withdrawal plan; (vi) eliminating the withdrawal minimum and maximum limits for systematic withdrawals from Advisor funds; (vii) expanding sales load waivers on Class A shares for Destiny Planholders and expanding Institutional Class eligibility for Class O Destiny Planholders; and (viii) changing certain Class A and Class T sales charge structures to further align them with industry practices.
Investment Performance. The Board considered whether the fund has operated in accordance with its investment objective, as well as its record of compliance with its investment restrictions. It also reviewed the fund's absolute investment performance for each class, as well as the fund's relative investment performance for each class measured over multiple periods against (i) a broad-based securities market index, and (ii) a custom peer group of mutual funds deemed appropriate by Fidelity and reviewed by the Board. Because the fund had been in existence less than five calendar years, the following charts considered by the Board show, over the one- and three-year periods ended December 31, 2009, the cumulative total returns of Institutional Class (Class I) and Class B of the fund, the cumulative total returns of a broad-based securities market index ("benchmark"), and a range of cumulative total returns of a custom peer group of mutual funds defined by FMR based on categories assigned by Morningstar, Inc. The returns of Institutional Class (Class I) and Class B show the performance of the highest and lowest performing classes, respectively (based on three-year performance). The box within each chart shows the 25th percentile return (bottom of box) and the 75th percentile return (top of box) of the peer group. Returns shown above the box are in the first quartile and returns shown below the box are in the fourth quartile. The percentage beaten numbers noted below each chart correspond to the percentile box and represent the percentage of funds in the peer group whose performance was equal to or lower than that of the class indicated. The fund's custom peer group, defined by FMR, is a peer group that FMR believes provides a more meaningful performance comparison than the peer group assigned by Morningstar, Inc., which assigns mutual funds to categories based on their investment styles as measured by their underlying portfolio holdings.
Annual Report
Fidelity International Value Fund

The Board reviewed the fund's relative investment performance against its peer group and noted that the performance of Institutional Class (Class I) of the fund was in the second quartile for the one-year period and the third quartile for the three-year period. The Board also noted that the investment performance of Institutional Class (Class I) of the fund compared favorably to its benchmark for the one-year period, although the fund's three-year cumulative total return was lower than its benchmark. The Board considered that the variations in performance among the fund's classes reflect the variations in class expenses, which result in lower performance for higher expense classes. The Board also reviewed the fund's performance since inception as well as performance in the current year.
The Board also considered that the fund's management fee is subject to upward or downward adjustment depending upon whether, and to what extent, the fund's investment performance for the performance period exceeds, or is exceeded by, the record (over the same period) of a Board-approved performance adjustment index. The Board realizes that the performance adjustment provides FMR with a strong economic incentive to seek to achieve superior performance for the fund's shareholders and helps to more closely align the interests of FMR and the fund's shareholders.
Annual Report
Board Approval of Investment Advisory Contracts and
Management Fees - continued
Based on its review, and giving particular weight to the nature and quality of the resources dedicated by the Investment Advisers to maintain and improve relative performance and factoring in the unprecedented market events in recent years, the Board concluded that the nature, extent, and quality of investment management and support services and of shareholder and administrative services provided to the fund will benefit the fund's shareholders, particularly in light of the Board's view that the fund's shareholders benefit from investing in a fund that is part of a large family of funds offering a variety of investment disciplines and services.
Competitiveness of Management Fee and Total Fund Expenses. The Board considered the fund's management fee and total expenses compared to "mapped groups" of competitive funds and classes. Fidelity creates "mapped groups" by combining similar Lipper investment objective categories that have comparable management fee characteristics. Combining Lipper investment objective categories aids the Board's management fee and total expense comparisons by broadening the competitive group used for comparison and by reducing the number of universes to which various Fidelity funds are compared.
Management Fee. The Board considered two proprietary management fee comparisons for the 12-month (or shorter) periods shown in the chart below. The group of Lipper funds used by the Board for management fee comparisons is referred to below as the "Total Mapped Group." The Total Mapped Group comparison focuses on a fund's standing relative to the total universe of comparable funds available to investors, in terms of gross management fees before expense reimbursements or caps, and without giving effect to the fund's performance adjustment. "TMG %" represents the percentage of funds in the Total Mapped Group that had management fees that were lower than the fund's. For example, a TMG % of 15% means that 85% of the funds in the Total Mapped Group had higher management fees than the fund. The "Asset-Size Peer Group" (ASPG) comparison focuses on a fund's standing relative to non-Fidelity funds similar in size to the fund within the Total Mapped Group. The ASPG represents at least 15% of the funds in the Total Mapped Group with comparable asset size and management fee characteristics, subject to a minimum of 50 funds (or all funds in the Total Mapped Group if fewer than 50). Additional information, such as the ASPG quartile in which the fund's management fee ranked and the impact of the fund's performance adjustment, is also included in the chart and considered by the Board.
Annual Report
Fidelity International Value Fund
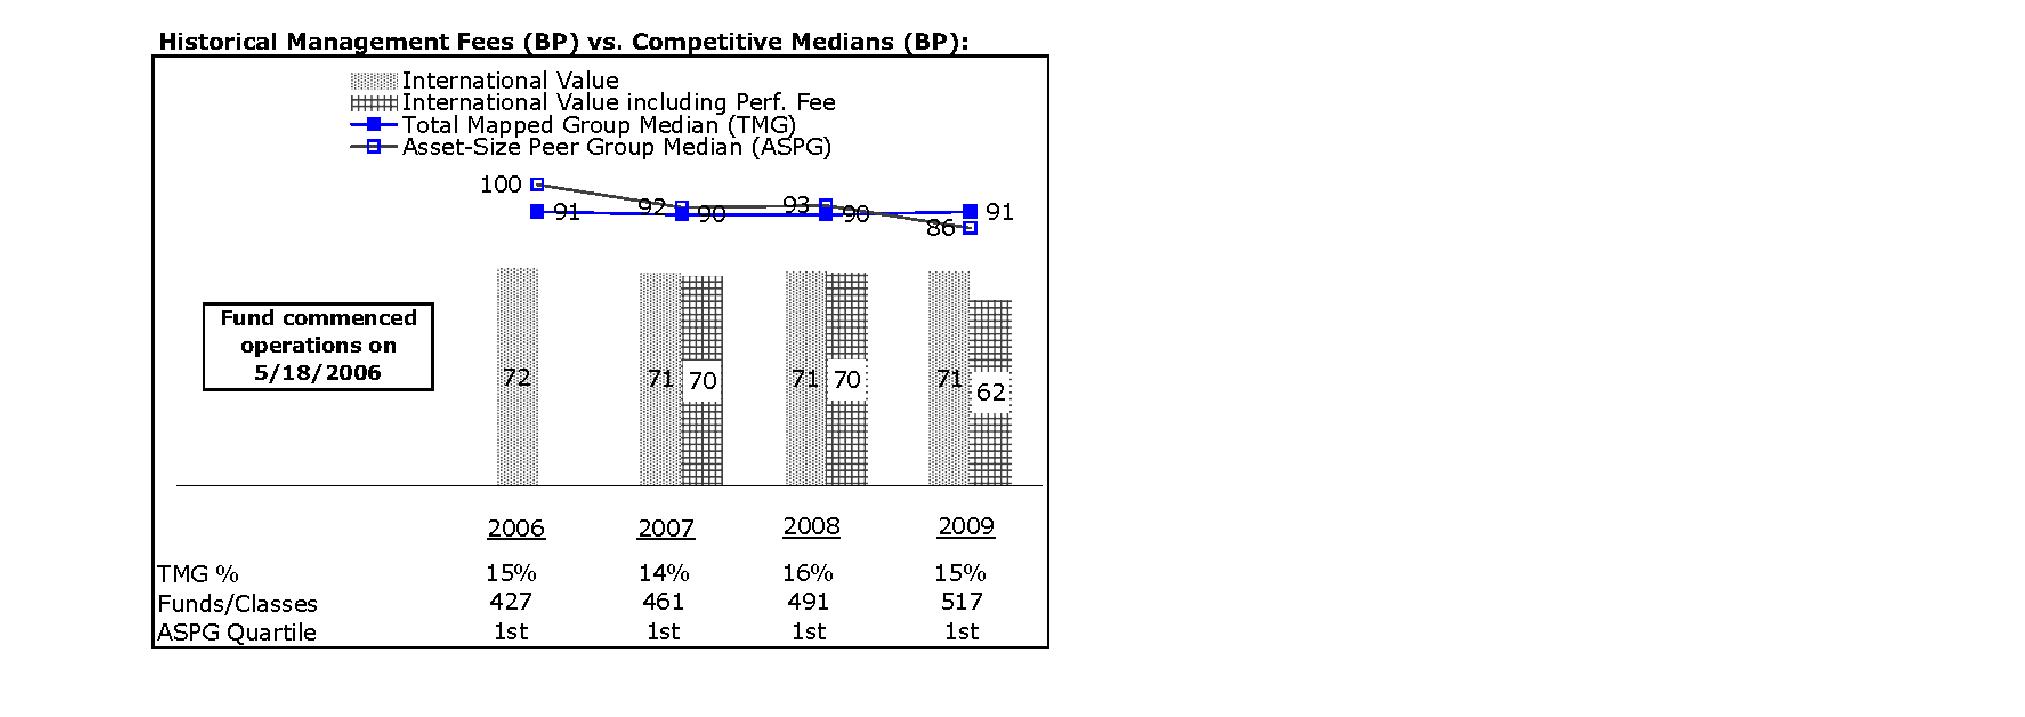
The Board noted that the fund's management fee ranked below the median of its Total Mapped Group and below the median of its ASPG for 2009. The Board also noted the effect of the fund's negative performance adjustment on the fund's management fee ranking. The Board noted that the performance adjustment for each year represents calculations for performance periods that differ from the periods shown in the performance charts above.
Based on its review, the Board concluded that the fund's management fee is fair and reasonable in light of the services that the fund receives and the other factors considered.
Total Expenses. In its review of each class's total expenses, the Board considered the fund's management fee as well as other fund or class expenses, as applicable, such as transfer agent fees, pricing and bookkeeping fees, fund-paid 12b-1 fees, and custodial, legal, and audit fees. The Board also noted the effects of any waivers and reimbursements on fees and expenses, as well as the impact of the fund's performance adjustment. As part of its review, the Board also considered current and historical total expenses of each class of the fund compared to competitive fund median expenses. Each class of the fund is compared to those funds and classes in the Total Mapped Group (used by the Board for management fee comparisons) that have a similar sales load structure.
The Board noted that the total expenses of each of Class A, Class B, Class C, Institutional Class, and the retail class ranked below its competitive median for 2009 and the total expenses of Class T ranked above its competitive median for 2009. The Board considered that the total expenses for Class T were above the median primarily because its 12b-1 fee is higher than the typical front-end load class. The Board noted that the fund offers multiple classes, each of which has a different sales load and 12b-1 fee structure, and that the multiple structures are intended to offer a range of pricing options for the intermediary market. The Board also noted that the total expenses of the classes vary primarily by the level of their 12b-1 fees, although differences in transfer agent fees may also cause expenses to vary from class to class.
Annual Report
Board Approval of Investment Advisory Contracts and
Management Fees - continued
Fees Charged to Other Fidelity Clients. The Board also considered Fidelity fee structures and other information with respect to clients of FMR and its affiliates, such as other mutual funds advised or subadvised by FMR or its affiliates, pension plan clients, and other institutional clients. In March 2010, the Board created an ad hoc joint committee with the board of other Fidelity funds (the Committee) to review and compare Fidelity's institutional investment advisory business with its business of providing services to the Fidelity funds, including the differences in services provided, fees charged, and costs incurred, as well as competition in their respective marketplaces.
Based on its review of total expenses and fees charged to other Fidelity clients, the Board concluded that the total expenses of each class of the fund were reasonable, although in one case above the median of the universe presented for comparison, in light of the services that the fund and its shareholders receive and the other factors considered, including the findings of the Committee.
Costs of the Services and Profitability. The Board considered the revenues earned and the expenses incurred by Fidelity in conducting the business of developing, marketing, distributing, managing, administering and servicing the fund and its shareholders. The Board also considered the level of Fidelity's profits in respect of all the Fidelity funds.
On an annual basis, FMR presents to the Board Fidelity's profitability for the fund. Fidelity calculates the profitability for each fund, as well as aggregate profitability for groups of Fidelity funds and all Fidelity funds, using a series of detailed revenue and cost allocation methodologies which originate with the audited books and records of Fidelity. The Audit Committee of the Board reviews any significant changes from the prior year's methodologies.
PricewaterhouseCoopers LLP (PwC), independent registered public accounting firm and auditor to Fidelity and certain Fidelity funds, has been engaged annually by the Board as part of the Board's assessment of Fidelity's profitability analysis. PwC's engagement includes the review and assessment of Fidelity's methodologies used in determining the revenues and expenses attributable to Fidelity's mutual fund business, and completion of agreed-upon procedures surrounding the mathematical accuracy of fund profitability and its conformity to allocation methodologies. After considering PwC's reports issued under the engagement and information provided by Fidelity, the Board believes that while other allocation methods may also be reasonable, Fidelity's profitability methodologies are reasonable in all material respects.
Annual Report
The Board has also reviewed Fidelity's non-fund businesses and fall-out benefits related to the mutual fund business as well as cases where Fidelity's affiliates may benefit from or be related to the fund's business.
The Board considered the costs of the services provided by and the profits realized by Fidelity in connection with the operation of the fund and were satisfied that the profitability was not excessive in the circumstances.
Economies of Scale. The Board considered whether there have been economies of scale in respect of the management of the Fidelity funds, whether the Fidelity funds (including the fund) have appropriately benefited from any such economies of scale, and whether there is potential for realization of any further economies of scale. The Board considered the extent to which the fund will benefit from economies of scale through increased services to the fund, through waivers or reimbursements, or through fee or expense reductions.
In February 2009, the Board and the board of other Fidelity funds created an ad hoc committee (the Economies of Scale Committee) to analyze whether FMR attains economies of scale in respect of the management and servicing of the Fidelity funds, whether the Fidelity funds have appropriately benefited from such economies of scale, and whether there is potential for realization of any further economies of scale.
The Board recognized that the fund's management contract incorporates a "group fee" structure, which provides for lower group fee rates as total fund assets under FMR's management increase, and for higher group fee rates as total fund assets under FMR's management decrease. FMR calculates the group fee rates based on a tiered asset "breakpoint" schedule that varies based on asset class. The Board considered that the group fee is designed to deliver the benefits of economies of scale to fund shareholders when total Fidelity fund assets increase, even if assets of any particular fund are unchanged or have declined, because some portion of Fidelity's costs are attributable to services provided to all Fidelity funds, and all funds benefit if those costs can be allocated among more assets. The Board concluded that, given the group fee structure, fund shareholders will benefit from lower management fees as assets under FMR's management increase at the fund complex level, regardless of whether Fidelity achieves any such economies of scale.
The Board concluded, considering the findings of the Economies of Scale Committee, that any potential economies of scale are being appropriately shared between fund shareholders and Fidelity.
Additional Information Requested by the Board. In order to develop fully the factual basis for consideration of the Fidelity funds' Advisory Contracts, the Board requested and received additional information on certain topics, including (i) fund performance trends, actions to be taken by FMR to improve certain funds' overall performance, and Fidelity's long-term strategies for certain funds; (ii) portfolio manager changes that have occurred during the past year and length of portfolio manager tenure for different categories of funds over time; (iii) Fidelity's compensation structure for portfolio managers, research analysts, and other key personnel, the rationale for the compensation structure, and how the compensation structure provides appropriate performance incentives; (iv) the amount of the investment that each portfolio manager has made in the Fidelity fund(s) that he or she manages; (v) management and other fees paid by FMR to affiliated sub-advisers on behalf of the Fidelity funds; (vi) Fidelity's fee structures and rationale for recommending different fees among different categories of funds; (vii) Fidelity's rationale for recommending which funds should have a performance adjustment component as part of their management fees; (viii) the rationale for any differences between fund fee structures and fee structures in place for other Fidelity clients; and (ix) explanations regarding the relative total expenses borne by certain funds and classes, total expense competitive trends, and actions that might be taken by FMR to reduce total expenses for certain funds and classes.
Annual Report
Board Approval of Investment Advisory Contracts and
Management Fees - continued
Based on its evaluation of all of the conclusions noted above, and after considering all factors it believed relevant, the Board ultimately concluded that the advisory fee structures are fair and reasonable, and that the fund's Advisory Contracts should be renewed.
Annual Report
Managing Your Investments
Fidelity offers several ways to conveniently manage your personal investments via your telephone or PC. You can access your account information, conduct trades and research your investments 24 hours a day.
By Phone
Fidelity Automated Service Telephone provides a single toll-free number to access account balances, positions, quotes and trading. It's easy to navigate the service, and on your first call, the system will help you create a personal identification number (PIN) for security.
(phone_graphic)
Fidelity Automated
Service Telephone (FAST®)
1-800-544-5555
Press
For mutual fund and brokerage trading.
For quotes.*
For account balances and holdings.
To review orders and mutual
fund activity.
To change your PIN.
To speak to a Fidelity representative.
By PC
Fidelity's web site on the Internet provides a wide range of information, including daily financial news, fund performance, interactive planning tools and news about Fidelity products and services.
(computer_graphic)
Fidelity's Web Site
www.fidelity.com
* When you call the quotes line, please remember that a fund's yield and return will vary and, except for money market funds, share price will also vary. This means that you may have a gain or loss when you sell your shares. There is no assurance that money market funds will be able to maintain a stable $1 share price; an investment in a money market fund is not insured or guaranteed by the U.S. government. Total returns are historical and include changes in share price, reinvestment of dividends and capital gains, and the effects of any sales charges.
Annual Report
To Visit Fidelity
For directions and hours,
please call 1-800-544-9797.
Arizona
7001 West Ray Road
Chandler, AZ
15445 N. Scottsdale Road
Scottsdale, AZ
17550 North 75th Avenue
Glendale, AZ
5330 E. Broadway Blvd
Tucson, AZ
California
815 East Birch Street
Brea, CA
1411 Chapin Avenue
Burlingame, CA
851 East Hamilton Avenue
Campbell, CA
601 Larkspur Landing Circle
Larkspur, CA
2000 Avenue of the Stars
Los Angeles, CA
27101 Puerta Real
Mission Viejo, CA
73575 El Paseo
Palm Desert, CA
251 University Avenue
Palo Alto, CA
123 South Lake Avenue
Pasadena, CA
16656 Bernardo Ctr. Drive
Rancho Bernardo, CA
1220 Roseville Parkway
Roseville, CA
1740 Arden Way
Sacramento, CA
7676 Hazard Center Drive
San Diego, CA
11943 El Camino Real
San Diego, CA
8 Montgomery Street
San Francisco, CA
3793 State Street
Santa Barbara, CA
1200 Wilshire Boulevard
Santa Monica, CA
398 West El Camino Real
Sunnyvale, CA
111 South Westlake Blvd
Thousand Oaks, CA
21701 Hawthorne Boulevard
Torrance, CA
2001 North Main Street
Walnut Creek, CA
6326 Canoga Avenue
Woodland Hills, CA
2211 Michelson Drive
Irvine, CA
Colorado
281 East Flatiron Circle
Broomfield, CO
1625 Broadway
Denver, CO
9185 Westview Road
Lone Tree, CO
Connecticut
48 West Putnam Avenue
Greenwich, CT
265 Church Street
New Haven, CT
300 Atlantic Street
Stamford, CT
29 South Main Street
West Hartford, CT
1261 Post Road
Fairfield, CT
Delaware
400 Delaware Avenue
Wilmington, DE
Florida
175 East Altamonte Drive
Altamonte Springs, FL
1400 Glades Road
Boca Raton, FL
121 Alhambra Plaza
Coral Gables, FL
2948 N. Federal Highway
Ft. Lauderdale, FL
4671 Town Center Parkway
Jacksonville, FL
8880 Tamiami Trail, North
Naples, FL
230 Royal Palm Way
Palm Beach, FL
3501 PGA Boulevard
Palm Beach Gardens, FL
3550 Tamiami Trail, South
Sarasota, FL
1502 N. Westshore Blvd.
Tampa, FL
2465 State Road 7
Wellington, FL
Georgia
3242 Peachtree Road
Atlanta, GA
1000 Abernathy Road
Atlanta, GA
Illinois
One North LaSalle Street
Chicago, IL
401 North Michigan Avenue
Chicago, IL
One Skokie Valley Road
Highland Park, IL
1415 West 22nd Street
Oak Brook, IL
15105 S LaGrange Road
Orland Park, IL
1572 East Golf Road
Schaumburg, IL
1823 Freedom Drive
Naperville, IL
Indiana
8480 Keystone Crossing
Indianapolis, IN
Kansas
5400 College Boulevard
Overland Park, KS
Maine
Three Canal Plaza
Portland, ME
Maryland
7315 Wisconsin Avenue
Bethesda, MD
610 York Road
Towson, MD
Massachusetts
801 Boylston Street
Boston, MA
155 Congress Street
Boston, MA
300 Granite Street
Braintree, MA
44 Mall Road
Burlington, MA
238 Main Street
Cambridge, MA
200 Endicott Street
Danvers, MA
Fidelity Brokerage Services, Inc., 100 Summer St., Boston, MA 02110 Member NYSE/SIPC
Annual Report
405 Cochituate Road
Framingham, MA
551 Boston Turnpike
Shrewsbury, MA
Michigan
500 E. Eisenhower Pkwy.
Ann Arbor, MI
280 N. Old Woodward Ave.
Birmingham, MI
30200 Northwestern Hwy.
Farmington Hills, MI
43420 Grand River Avenue
Novi, MI
3480 28th Street
Grand Rapids, MI
2425 S. Linden Road STE E
Flint, MI
Minnesota
7740 France Avenue South
Edina, MN
8342 3rd Street North
Oakdale, MN
Missouri
1524 South Lindbergh Blvd.
St. Louis, MO
Nevada
2225 Village Walk Drive
Henderson, NV
New Jersey
501 Route 73 South
Marlton, NJ
150 Essex Street
Millburn, NJ
35 Morris Street
Morristown, NJ
396 Route 17, North
Paramus, NJ
3518 Route 1 North
Princeton, NJ
530 Broad Street
Shrewsbury, NJ
New Mexico
2261 Q Street NE
Albuquerque, NM
New York
1130 Franklin Avenue
Garden City, NY
37 West Jericho Turnpike
Huntington Station, NY
1271 Avenue of the Americas
New York, NY
980 Madison Avenue
New York, NY
61 Broadway
New York, NY
350 Park Avenue
New York, NY
200 Fifth Avenue
New York, NY
733 Third Avenue
New York, NY
2070 Broadway
New York, NY
1075 Northern Blvd.
Roslyn, NY
799 Central Park Avenue
Scarsdale, NY
3349 Monroe Avenue
Rochester, NY
North Carolina
4611 Sharon Road
Charlotte, NC
7011 Fayetteville Road
Durham, NC
Ohio
3805 Edwards Road
Cincinnati, OH
1324 Polaris Parkway
Columbus, OH
1800 Crocker Road
Westlake, OH
28699 Chagrin Boulevard
Woodmere Village, OH
Oregon
7493 SW Bridgeport Road
Tigard, OR
Pennsylvania
600 West DeKalb Pike
King of Prussia, PA
1735 Market Street
Philadelphia, PA
12001 Perry Highway
Wexford, PA
Rhode Island
10 Memorial Boulevard
Providence, RI
Tennessee
3018 Peoples Street
Johnson City, TN
7628 West Farmington Blvd.
Germantown, TN
2035 Mallory Lane
Franklin, TN
Texas
10000 Research Boulevard
Austin, TX
4001 Northwest Parkway
Dallas, TX
12532 Memorial Drive
Houston, TX
2701 Drexel Drive
Houston, TX
6560 Fannin Street
Houston, TX
1701 Lake Robbins Drive
The Woodlands, TX
6500 N. MacArthur Blvd.
Irving, TX
6005 West Park Boulevard
Plano, TX
1576 East Southlake Blvd.
Southlake, TX
15600 Southwest Freeway
Sugar Land, TX
139 N. Loop 1604 East
San Antonio, TX
Utah
279 West South Temple
Salt Lake City, UT
Virginia
1861 International Drive
McLean, VA
11957 Democracy Drive
Reston, VA
Washington
10500 NE 8th Street
Bellevue, WA
1518 6th Avenue
Seattle, WA
304 Strander Blvd
Tukwila, WA
Washington, DC
1900 K Street, N.W.
Washington, DC
Wisconsin
16020 West Bluemound Road
Brookfield, WI
Annual Report
To Write Fidelity
We'll give your correspondence immediate attention and send you written confirmation upon completion of your request.
(letter_graphic)
Making Changes
To Your Account
(such as changing name, address, bank, etc.)
Fidelity Investments
P.O. Box 770001
Cincinnati, OH 45277-0002
(letter_graphic)
For Non-Retirement
Accounts
Buying shares
Fidelity Investments
P.O. Box 770001
Cincinnati, OH 45277-0003
Overnight Express
Fidelity Investments
Attn: Distribution Services
100 Crosby Parkway - KC1H
Covington, KY 41015
Selling shares
Fidelity Investments
P.O. Box 770001
Cincinnati, OH 45277-0035
Overnight Express
Fidelity Investments
Attn: Distribution Services
100 Crosby Parkway - KC1H
Covington, KY 41015
General Correspondence
Fidelity Investments
P.O. Box 500
Merrimack, NH 03054-0500
(letter_graphic)
For Retirement
Accounts
Buying shares
Fidelity Investments
P.O. Box 770001
Cincinnati, OH 45277-0003
Selling shares
Fidelity Investments
P.O. Box 770001
Cincinnati, OH 45277-0035
Overnight Express
Fidelity Investments
Attn: Distribution Services
100 Crosby Parkway - KC1H
Covington, KY 41015
General Correspondence
Fidelity Investments
P.O. Box 500
Merrimack, NH 03054-0500
Annual Report
Investment Adviser
Fidelity Management & Research Company
Boston, MA
Investment Sub-Advisers
FMR Co., Inc.
Fidelity Management & Research
(U.K.) Inc.
Fidelity Management & Research
(Hong Kong) Limited
Fidelity Management & Research
(Japan) Inc.
Fidelity Research & Analysis Company
FIL Investment Advisors
FIL Investments (Japan) Limited
FIL Investment Advisors (U.K.) Ltd.
General Distributor
Fidelity Distributors Corporation
Boston, MA
Transfer and Service Agents
Fidelity Investments Institutional
Operations Company, Inc.
Boston, MA
Fidelity Service Company, Inc.
Boston, MA
Custodian
The Northern Trust Company
Chicago, Illinois
The Fidelity Telephone Connection
Mutual Fund 24-Hour Service
Exchanges/Redemptions
and Account Assistance 1-800-544-6666
Product Information 1-800-544-8888
Retirement Accounts 1-800-544-4774
(8 a.m. - 9 p.m.)
TDD Service 1-800-544-0118
for the deaf and hearing impaired
(9 a.m. - 9 p.m. Eastern time)
Fidelity Automated Service
Telephone (FAST®)
1-800-544-5555
Automated line for quickest service
FIV-UANN-1210
1.827481.104
(Fidelity Investment logo)(registered trademark)
Fidelity AdvisorSM
International Value
Fund - Class A, Class T, Class B
and Class C
Annual Report
October 31, 2010
Class A, Class T, Class B, and Class C are classes of Fidelity® International Value Fund
(2_fidelity_logos) (Registered_Trademark)
Contents
Chairman's Message | <Click Here> | The Chairman's message to shareholders. |
Performance | <Click Here> | How the fund has done over time. |
Management's Discussion of Fund Performance | <Click Here> | The Portfolio Manager's review of fund performance and strategy. |
Shareholder Expense Example | <Click Here> | An example of shareholder expenses. |
Investment Changes | <Click Here> | A summary of major shifts in the fund's investments over the past six months. |
Investments | <Click Here> | A complete list of the fund's investments with their market values. |
Financial Statements | <Click Here> | Statements of assets and liabilities, operations, and changes in net assets, as well as financial highlights. |
Notes | <Click Here> | Notes to financial statements. |
Report of Independent Registered Public Accounting Firm | <Click Here> | |
Trustees and Officers | <Click Here> | |
Distributions | <Click Here> | |
Board Approval of Investment Advisory Contracts and Management Fees | <Click Here> | |
To view a fund's proxy voting guidelines and proxy voting record for the 12-month period ended June 30, visit http://www.fidelity.com/proxyvotingresults or visit the Securities and Exchange Commission's (SEC) web site at http://www.sec.gov. You may also call 1-877-208-0098 to request a free copy of the proxy voting guidelines.
Standard & Poor's, S&P and S&P 500 are registered service marks of The McGraw-Hill Companies, Inc. and have been licensed for use by Fidelity Distributors Corporation.
Other third party marks appearing herein are the property of their respective owners.
All other marks appearing herein are registered or unregistered trademarks or service marks of FMR LLC or an affiliated company.
Annual Report
This report and the financial statements contained herein are submitted for the general information of the shareholders of the fund. This report is not authorized for distribution to prospective investors in the fund unless preceded or accompanied by an effective prospectus.
A fund files its complete schedule of portfolio holdings with the SEC for the first and third quarters of each fiscal year on Form N-Q. Forms N-Q are available on the SEC's web site at http://www.sec.gov. A fund's Forms N-Q may be reviewed and copied at the SEC's Public Reference Room in Washington, DC. Information regarding the operation of the SEC's Public Reference Room may be obtained by calling 1-800-SEC-0330. For a complete list of a fund's portfolio holdings, view the most recent holdings listing, semiannual report, or annual report on Fidelity's web site at http://www.fidelity.com or http://www.advisor.fidelity.com, as applicable.
NOT FDIC INSURED • MAY LOSE VALUE • NO BANK GUARANTEE
Neither the fund nor Fidelity Distributors Corporation is a bank.
Annual Report
(photo_of_Edward_C_Johnson_3d)
Dear Shareholder:
Equities have staged a rally in the second half of 2010, shaking off concerns about the European debt crisis and the possibility of a double-dip recession in the U.S. Although the short-term surge pushed major equity indexes back into positive territory for the year, several questions remain about the longer-term outlook, including lackluster economic growth and persistently high unemployment. Financial markets are always unpredictable, of course, but there also are several time-tested investment principles that can help put the odds in your favor.
One of the basic tenets is to invest for the long term. Over time, riding out the markets' inevitable ups and downs has proven much more effective than selling into panic or chasing the hottest trend. Even missing only a few of the markets' best days can significantly diminish investor returns. Patience also affords the benefits of compounding - of earning interest on additional income or reinvested dividends and capital gains. There can be tax advantages and cost benefits to consider as well. While staying the course doesn't eliminate risk, it can considerably lessen the effect of short-term declines.
You can further manage your investing risk through diversification. And today, more than ever, geographic diversification should be taken into account. Studies indicate that asset allocation is the single most important determinant of a portfolio's long-term success. The right mix of stocks, bonds and cash - aligned to your particular risk tolerance and investment objective - is very important. Age-appropriate rebalancing is also an essential aspect of asset allocation. For younger investors, an emphasis on equities - which historically have been the best-performing asset class over time - is encouraged. As investors near their specific goal, such as retirement or sending a child to college, consideration may be given to replacing volatile assets (e.g. common stocks) with more-stable fixed investments (bonds or savings plans).
A third principle - investing regularly - can help lower the average cost of your purchases. Investing a certain amount of money each month or quarter helps ensure you won't pay for all your shares at market highs. This strategy - known as dollar cost averaging - also reduces "emotion" from investing, helping shareholders avoid selling weak performers just prior to an upswing, or chasing a hot performer just before a correction.
We invite you to contact us via the Internet, through our Investor Centers or by phone. It is our privilege to provide you the information you need to make the investments that are right for you.
Sincerely,
(The chairman's signature appears here.)
Edward C. Johnson 3d
Annual Report
Average annual total return reflects the change in the value of an investment, assuming reinvestment of the class' distributions from dividend income and capital gains (the profits earned upon the sale of securities that have grown in value, if any) and assuming a constant rate of performance each year. The $10,000 table and the fund's returns do not reflect the deduction of taxes that a shareholder would pay on fund distributions or the redemption of fund shares. During periods of reimbursement by Fidelity, a fund's total return will be greater than it would be had the reimbursement not occurred. How a fund did yesterday is no guarantee of how it will do tomorrow.
Average Annual Total Returns
Periods ended October 31, 2010 | Past 1
year | Life of
class A |
Class A (incl. 5.75% sales charge) | 1.41% | -3.48% |
Class T (incl. 3.50% sales charge) | 3.57% | -3.23% |
Class B (incl. contingent deferred sales charge)B | 1.82% | -3.33% |
Class C (incl. contingent deferred sales charge)C | 5.84% | -2.92% |
A From May 18, 2006.
B Class B shares' contingent deferred sales charges included in the past one year and life of class total return figures are 5% and 3%, respectively.
C Class C shares' contingent deferred sales charges included in the past one year and life of class total return figures are 1% and 0%, respectively.
Annual Report
$10,000 Over Life of Fund
Let's say hypothetically that $10,000 was invested in Fidelity Advisor International Value Fund - Class A on May 18, 2006, when the fund started, and the current 5.75% sales charge was paid. The chart shows how the value of your investment would have changed, and also shows how the MSCI® EAFE® (Europe, Australasia, Far East) Value Index performed over the same period.
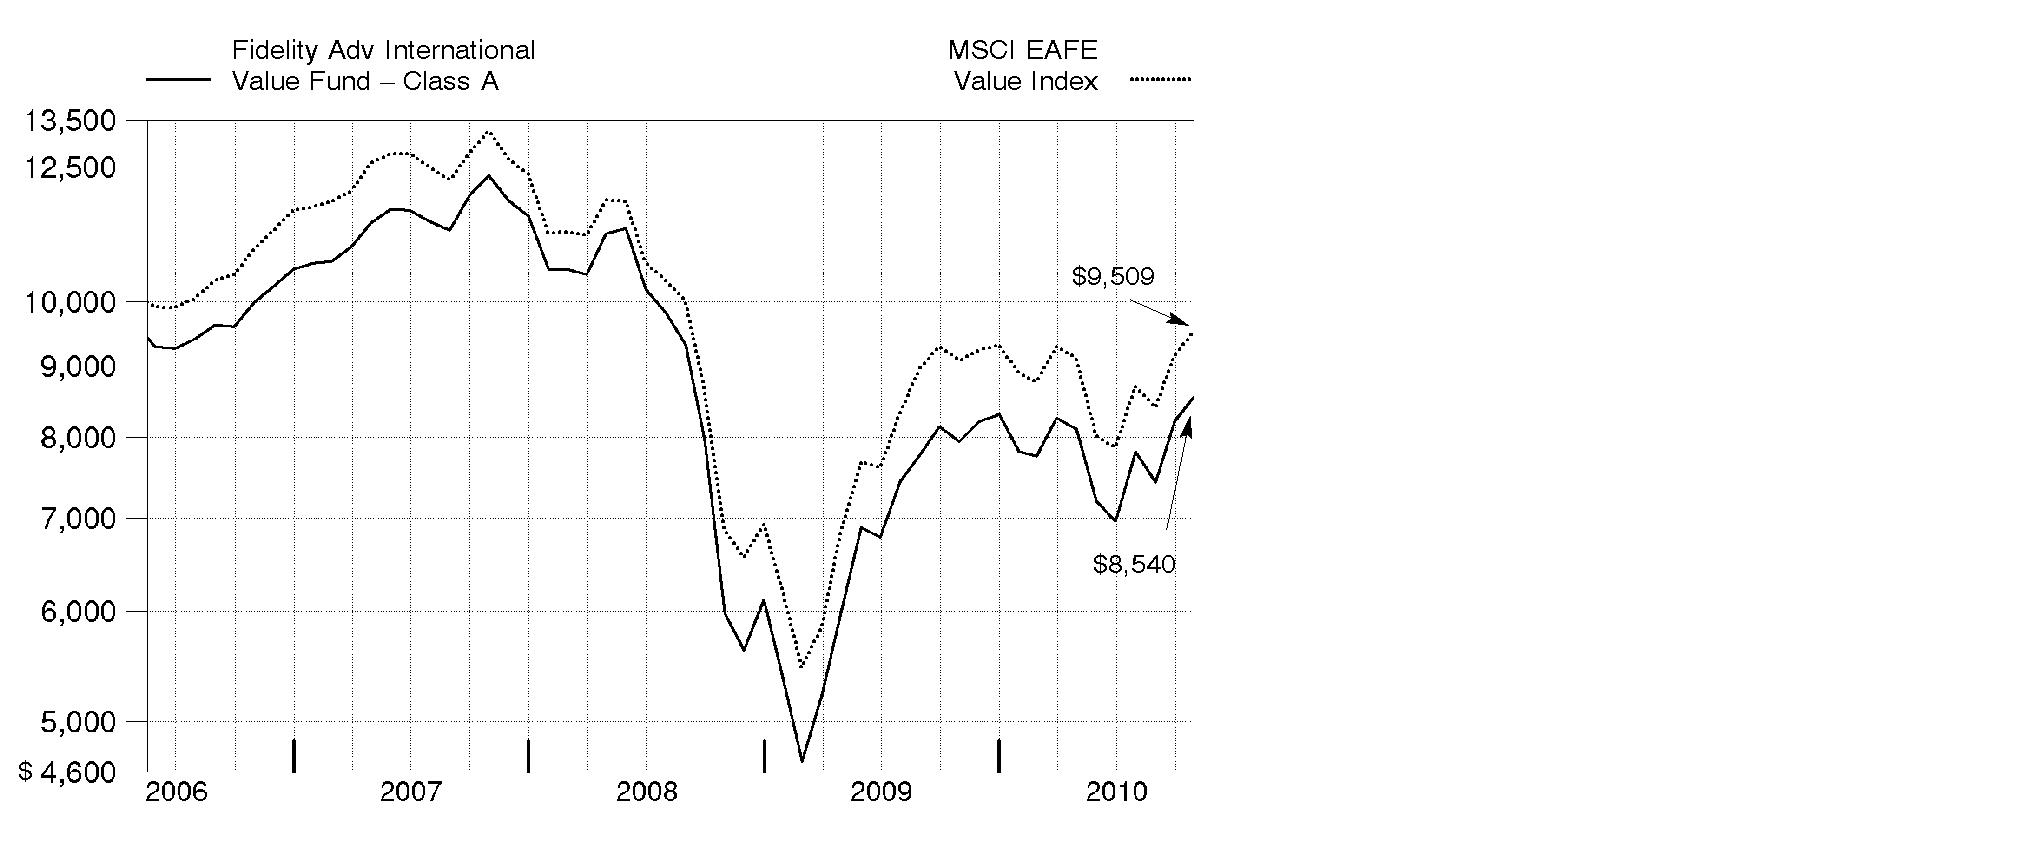
Annual Report
Market Recap: International stocks rode a wave of volatility similar to that of their U.S. counterparts during the 12 months ending October 31, 2010. Stocks gained modestly in the first half of the period, despite growing concerns about the European debt crisis. Sentiment turned decidedly negative in May and June, however, and the market suffered a precipitous decline. These losses were more than offset during the last four months of the period, when signs of economic growth and subsiding debt fears helped propel international stocks about 21%. For the full year, the MSCI® ACWI® (All Country World Index) ex USA Index gained 12.76%, boosted in part by a generally depreciating U.S. dollar. Within the index, Canada and emerging markets were standouts, returning 23% and 24%, respectively. Results in the latter group were led by strong-performing India, Mexico and South Africa, while China fell short of the MSCI benchmark due to cooling economic growth. The developed Asia ex Japan segment rose 16% for the period, lifted by solid results from Singapore and Hong Kong. Meanwhile, Europe rose just 9%, held back mainly by debt-riddled Spain and Italy, as well as lagging major constituent France. Japan returned only 5%, a result of that nation's continued weak economy.
Comments from George Stairs, Portfolio Manager of Fidelity AdvisorSM International Value Fund: For the year, the fund's Class A, Class T, Class B and Class C shares rose 7.60%, 7.32%, 6.82% and 6.84% (excluding sales charges), outpacing the 4.79% return of the MSCI EAFE® (Europe, Australasia, Far East) Value Index. The fund benefited from stock selection in financials, consumer discretionary and energy. Within financials, my picks in banks were particularly helpful, especially Canada's Toronto-Dominion Bank and underweighting Spain's Banco Santander. In contrast, the fund was hurt by positioning in the capital goods industry within the industrials sector, as well as in telecommunication services. In country terms, security selection in Japan and a number of emerging markets worked out very well. European results were mixed. Stock picking was very good in the U.K. and, to a lesser extent, Norway, but disappointing in Denmark, France, Switzerland and Germany. Underweighting Japan and overweighting Hong Kong aided results. In the U.K., a position in mining company Rio Tinto and an underweighting in energy producer BP helped, as did Norwegian and Bermudan oil driller Seadrill. The fund's biggest individual detractors included Vestas Wind Systems, a Danish wind turbine manufacturer; French insurance company AXA; and Spanish telecom company Telefonica. Several of the names mentioned were not in the index.
The views expressed above reflect those of the portfolio manager(s) only through the end of the period as stated on the cover of this report and do not necessarily represent the views of Fidelity or any other person in the Fidelity organization. Any such views are subject to change at any time based upon market or other conditions and Fidelity disclaims any responsibility to update such views. These views may not be relied on as investment advice and, because investment decisions for a Fidelity fund are based on numerous factors, may not be relied on as an indication of trading intent on behalf of any Fidelity fund.
Annual Report
Shareholder Expense Example
As a shareholder of the Fund, you incur two types of costs: (1) transaction costs, including sales charges (loads) on purchase payments or redemption proceeds, redemption fees, and (2) ongoing costs, including management fees, distribution and/or service (12b-1) fees and other Fund expenses. This Example is intended to help you understand your ongoing costs (in dollars) of investing in the Fund and to compare these costs with the ongoing costs of investing in other mutual funds.
The Example is based on an investment of $1,000 invested at the beginning of the period and held for the entire period (May 1, 2010 to October 31, 2010).
Actual Expenses
The first line of the accompanying table for each class of the Fund provides information about actual account values and actual expenses. You may use the information in this line, together with the amount you invested, to estimate the expenses that you paid over the period. Simply divide your account value by $1,000.00 (for example, an $8,600 account value divided by $1,000.00 = 8.6), then multiply the result by the number in the first line for a class of the Fund under the heading entitled "Expenses Paid During Period" to estimate the expenses you paid on your account during this period. A small balance maintenance fee of $12.00 that is charged once a year may apply for certain accounts with a value of less than $2,000. This fee is not included in the table below. If it was, the estimate of expenses you paid during the period would be higher, and your ending account value lower, by this amount. In addition, the Fund, as a shareholder in the underlying Fidelity Central Funds, will indirectly bear its pro-rata share of the fees and expenses incurred by the underlying Fidelity Central Funds. These fees and expenses are not included in the Fund's annualized expense ratio used to calculate the expense estimate in the table below.
Hypothetical Example for Comparison Purposes
The second line of the accompanying table for each class of the Fund provides information about hypothetical account values and hypothetical expenses based on a Class' actual expense ratio and an assumed rate of return of 5% per year before expenses, which is not the Class' actual return. The hypothetical account values and expenses may not be used to estimate the actual ending account balance or expenses you paid for the period. You may use this information to compare the ongoing costs of investing in the Fund and other funds. To do so, compare this 5% hypothetical example with the 5% hypothetical examples that appear in the shareholder reports of the other funds. A small balance maintenance fee of $12.00 that is charged once a year may apply for certain accounts with a value of less than $2,000. This fee is not included in the table below. If it was, the estimate of expenses you paid during the period would be higher, and your ending account value lower, by this amount. In addition, the Fund, as a shareholder in the underlying Fidelity Central Funds, will indirectly bear its pro-rata share of the fees and expenses incurred by the underlying Fidelity Central Funds. These fees and expenses are not included in the Fund's annualized expense ratio used to calculate the expense estimate in the table below.
Annual Report
Please note that the expenses shown in the table are meant to highlight your ongoing costs only and do not reflect any transaction costs. Therefore, the second line of the table is useful in comparing ongoing costs only, and will not help you determine the relative total costs of owning different funds. In addition, if these transactional costs were included, your costs would have been higher.
|
Annualized
Expense Ratio
|
Beginning
Account Value
May 1, 2010
|
Ending
Account Value
October 31, 2010
| Expenses Paid
During Period*
May 1, 2010 to
October 31, 2010 |
Class A | 1.39% | | | |
Actual | | $ 1,000.00 | $ 1,053.80 | $ 7.20 |
Hypothetical A | | $ 1,000.00 | $ 1,018.20 | $ 7.07 |
Class T | 1.66% | | | |
Actual | | $ 1,000.00 | $ 1,052.60 | $ 8.59 |
Hypothetical A | | $ 1,000.00 | $ 1,016.84 | $ 8.44 |
Class B | 2.15% | | | |
Actual | | $ 1,000.00 | $ 1,049.90 | $ 11.11 |
Hypothetical A | | $ 1,000.00 | $ 1,014.37 | $ 10.92 |
Class C | 2.14% | | | |
Actual | | $ 1,000.00 | $ 1,049.90 | $ 11.06 |
Hypothetical A | | $ 1,000.00 | $ 1,014.42 | $ 10.87 |
International Value | 1.09% | | | |
Actual | | $ 1,000.00 | $ 1,056.50 | $ 5.65 |
Hypothetical A | | $ 1,000.00 | $ 1,019.71 | $ 5.55 |
Institutional Class | .99% | | | |
Actual | | $ 1,000.00 | $ 1,055.10 | $ 5.13 |
Hypothetical A | | $ 1,000.00 | $ 1,020.21 | $ 5.04 |
A 5% return per year before expenses
* Expenses are equal to each Class' annualized expense ratio, multiplied by the average account value over the period, multiplied by 184/365 (to reflect the one-half year period).
Annual Report
Investment Changes (Unaudited)
Geographic Diversification (% of fund's net assets) |
As of October 31, 2010 |
| United Kingdom 18.9% | |
| Japan 18.3% | |
| France 10.7% | |
| Germany 6.9% | |
| Spain 6.6% | |
| Switzerland 4.6% | |
| Hong Kong 4.2% | |
| Netherlands 3.9% | |
| Italy 3.1% | |
| Other 22.8% | |

Percentages are adjusted for the effect of futures contracts, if applicable. |
As of April 30, 2010 |
| Japan 19.2% | |
| United Kingdom 18.1% | |
| France 11.5% | |
| Germany 6.8% | |
| Switzerland 4.8% | |
| Hong Kong 4.3% | |
| Spain 3.7% | |
| Italy 3.4% | |
| Australia 3.2% | |
| Other 25.0% | |

Percentages are adjusted for the effect of futures contracts, if applicable. |
Asset Allocation |
| % of fund's
net assets | % of fund's net assets
6 months ago |
Stocks | 99.0 | 98.6 |
Short-Term Investments and Net Other Assets | 1.0 | 1.4 |
Top Ten Stocks as of October 31, 2010 |
| % of fund's
net assets | % of fund's net assets
6 months ago |
Royal Dutch Shell PLC Class A sponsored ADR (United Kingdom, Oil, Gas & Consumable Fuels) | 3.8 | 3.8 |
HSBC Holdings PLC (United Kingdom, Commercial Banks) | 2.9 | 2.1 |
Mitsui & Co. Ltd. (Japan, Trading Companies & Distributors) | 2.1 | 2.1 |
Vodafone Group PLC sponsored ADR (United Kingdom, Wireless Telecommunication Services) | 2.0 | 1.9 |
BP PLC sponsored ADR (United Kingdom, Oil, Gas & Consumable Fuels) | 2.0 | 1.4 |
Roche Holding AG (participation certificate) (Switzerland, Pharmaceuticals) | 2.0 | 2.4 |
AXA SA sponsored ADR (France, Insurance) | 2.0 | 2.1 |
Banco Santander SA (Spain, Commercial Banks) | 2.0 | 1.9 |
Zurich Financial Services AG (Switzerland, Insurance) | 1.8 | 1.6 |
ING Groep NV (Netherlands, Diversified Financial Services) | 1.8 | 1.0 |
| 22.4 | |
Market Sectors as of October 31, 2010 |
| % of fund's
net assets | % of fund's net assets
6 months ago |
Financials | 38.4 | 36.6 |
Energy | 11.1 | 11.5 |
Consumer Discretionary | 10.8 | 10.9 |
Industrials | 8.2 | 8.4 |
Materials | 6.7 | 7.0 |
Utilities | 6.3 | 7.2 |
Telecommunication Services | 6.2 | 5.6 |
Information Technology | 4.7 | 4.6 |
Health Care | 4.4 | 4.6 |
Consumer Staples | 2.2 | 2.2 |
Annual Report
Investments October 31, 2010
Showing Percentage of Net Assets
Common Stocks - 98.0% |
| Shares | | Value |
Australia - 2.5% |
Commonwealth Bank of Australia | 9,042 | | $ 433,156 |
Macquarie Group Ltd. | 49,337 | | 1,749,654 |
Wesfarmers Ltd. | 19,149 | | 621,684 |
Westfield Group unit | 127,286 | | 1,543,733 |
TOTAL AUSTRALIA | | 4,348,227 |
Bailiwick of Jersey - 1.4% |
Informa PLC | 102,820 | | 718,236 |
United Business Media Ltd. | 101,800 | | 1,073,191 |
WPP PLC | 54,427 | | 632,412 |
TOTAL BAILIWICK OF JERSEY | | 2,423,839 |
Bermuda - 1.0% |
Seadrill Ltd. (d) | 43,600 | | 1,320,062 |
VimpelCom Ltd. ADR (a) | 30,100 | | 461,433 |
TOTAL BERMUDA | | 1,781,495 |
Brazil - 1.9% |
Banco do Brasil SA | 53,138 | | 1,033,898 |
Banco Santander (Brasil) SA ADR | 45,900 | | 660,960 |
Cyrela Brazil Realty SA | 35,700 | | 493,152 |
Itau Unibanco Banco Multiplo SA ADR | 12,933 | | 317,634 |
Vivo Participacoes SA sponsored ADR | 30,200 | | 864,928 |
TOTAL BRAZIL | | 3,370,572 |
Canada - 2.4% |
Open Text Corp. (a) | 8,000 | | 353,917 |
Petrobank Energy & Resources Ltd. (a) | 20,700 | | 823,819 |
Power Corp. of Canada (sub. vtg.) (d) | 20,500 | | 572,046 |
Suncor Energy, Inc. | 24,900 | | 797,855 |
Toronto-Dominion Bank | 22,800 | | 1,641,985 |
TOTAL CANADA | | 4,189,622 |
Cayman Islands - 0.6% |
China High Speed Transmission Equipment Group Co. Ltd. | 179,000 | | 365,794 |
Hengdeli Holdings Ltd. | 1,240,000 | | 687,889 |
TOTAL CAYMAN ISLANDS | | 1,053,683 |
China - 1.2% |
China Merchants Bank Co. Ltd. (H Shares) | 325,572 | | 924,055 |
Common Stocks - continued |
| Shares | | Value |
China - continued |
Industrial & Commercial Bank of China Ltd. (H Shares) | 983,000 | | $ 791,346 |
Nine Dragons Paper (Holdings) Ltd. | 251,000 | | 404,773 |
TOTAL CHINA | | 2,120,174 |
Denmark - 1.0% |
Novo Nordisk AS Series B | 6,704 | | 703,801 |
Vestas Wind Systems AS (a)(d) | 30,005 | | 957,410 |
TOTAL DENMARK | | 1,661,211 |
France - 10.7% |
Alstom SA | 8,417 | | 424,671 |
Atos Origin SA (a) | 9,086 | | 420,054 |
AXA SA sponsored ADR | 188,900 | | 3,443,647 |
BNP Paribas SA | 26,393 | | 1,929,875 |
Christian Dior SA | 4,700 | | 679,814 |
Compagnie de St. Gobain | 24,678 | | 1,152,390 |
Credit Agricole SA | 56,600 | | 927,353 |
PPR SA | 6,800 | | 1,114,607 |
Sanofi-Aventis sponsored ADR | 41,300 | | 1,450,043 |
Schneider Electric SA | 6,563 | | 931,473 |
Societe Generale Series A | 45,507 | | 2,724,374 |
Total SA | 2,900 | | 157,819 |
Total SA sponsored ADR | 31,800 | | 1,732,464 |
Unibail-Rodamco | 7,266 | | 1,513,508 |
TOTAL FRANCE | | 18,602,092 |
Germany - 6.8% |
Allianz AG sponsored ADR | 51,500 | | 645,295 |
BASF AG | 16,700 | | 1,214,842 |
Bayerische Motoren Werke AG (BMW) | 11,233 | | 805,109 |
Daimler AG (United States) (a) | 30,400 | | 2,006,400 |
Deutsche Boerse AG | 11,000 | | 773,869 |
E.ON AG | 81,327 | | 2,546,155 |
HeidelbergCement AG | 23,800 | | 1,244,684 |
Metro AG | 10,300 | | 721,756 |
Munich Re Group | 9,123 | | 1,426,193 |
Volkswagen AG (d) | 3,837 | | 503,787 |
TOTAL GERMANY | | 11,888,090 |
Common Stocks - continued |
| Shares | | Value |
Greece - 0.3% |
Hellenic Telecommunications Organization SA | 21,569 | | $ 172,247 |
Public Power Corp. of Greece | 22,520 | | 377,592 |
TOTAL GREECE | | 549,839 |
Hong Kong - 4.2% |
China Resources Power Holdings Co. Ltd. | 396,000 | | 762,241 |
CNOOC Ltd. | 423,000 | | 883,105 |
Hang Lung Group Ltd. | 52,000 | | 345,157 |
Hutchison Whampoa Ltd. | 35,000 | | 344,977 |
Swire Pacific Ltd. (A Shares) | 123,300 | | 1,749,782 |
Techtronic Industries Co. Ltd. | 727,500 | | 736,768 |
Wharf Holdings Ltd. | 367,000 | | 2,409,973 |
TOTAL HONG KONG | | 7,232,003 |
India - 0.5% |
Bank of Baroda | 37,000 | | 877,878 |
Punjab National Bank | 288 | | 9,381 |
TOTAL INDIA | | 887,259 |
Indonesia - 0.9% |
PT Bank Rakyat Indonesia Tbk | 803,000 | | 1,024,245 |
PT Semen Gresik (Persero) Tbk | 497,500 | | 545,510 |
TOTAL INDONESIA | | 1,569,755 |
Ireland - 0.3% |
CRH PLC sponsored ADR | 30,000 | | 530,100 |
Israel - 0.5% |
Teva Pharmaceutical Industries Ltd. sponsored ADR | 16,700 | | 866,730 |
Italy - 2.2% |
ENI SpA | 19,300 | | 434,475 |
Intesa Sanpaolo SpA | 647,919 | | 2,278,660 |
UniCredit SpA | 389,609 | | 1,015,393 |
TOTAL ITALY | | 3,728,528 |
Japan - 18.3% |
ABC-Mart, Inc. | 14,100 | | 479,579 |
Aisin Seiki Co. Ltd. | 30,900 | | 970,353 |
Credit Saison Co. Ltd. | 18,500 | | 262,398 |
Denso Corp. | 45,200 | | 1,405,634 |
East Japan Railway Co. | 18,500 | | 1,142,440 |
Honda Motor Co. Ltd. | 31,500 | | 1,135,537 |
Japan Retail Fund Investment Corp. | 714 | | 1,115,320 |
Common Stocks - continued |
| Shares | | Value |
Japan - continued |
Japan Tobacco, Inc. | 97 | | $ 301,348 |
JSR Corp. | 26,900 | | 465,660 |
Konica Minolta Holdings, Inc. | 50,500 | | 487,979 |
Miraca Holdings, Inc. | 12,100 | | 435,462 |
Mitsubishi UFJ Financial Group, Inc. | 562,300 | | 2,609,637 |
Mitsui & Co. Ltd. | 235,400 | | 3,702,232 |
Nippon Electric Glass Co. Ltd. | 105,000 | | 1,349,651 |
Nippon Telegraph & Telephone Corp. | 10,800 | | 487,084 |
Obic Co. Ltd. | 3,880 | | 716,501 |
ORIX Corp. | 16,480 | | 1,503,209 |
Promise Co. Ltd. (d) | 59,900 | | 250,855 |
Ricoh Co. Ltd. | 30,000 | | 419,659 |
Seven & i Holdings Co., Ltd. | 19,700 | | 457,297 |
SOFTBANK CORP. | 16,600 | | 533,109 |
Sumitomo Corp. | 148,700 | | 1,882,662 |
Sumitomo Metal Industries Ltd. | 180,000 | | 417,777 |
Sumitomo Mitsui Financial Group, Inc. | 50,300 | | 1,501,342 |
Tokio Marine Holdings, Inc. | 26,000 | | 731,012 |
Tokyo Electron Ltd. | 16,800 | | 947,912 |
Tokyo Gas Co. Ltd. | 429,000 | | 2,018,396 |
Toyota Motor Corp. | 70,000 | | 2,479,419 |
USS Co. Ltd. | 6,120 | | 476,093 |
West Japan Railway Co. | 132 | | 490,049 |
Xebio Co. Ltd. | 2,900 | | 56,940 |
Yamada Denki Co. Ltd. | 9,260 | | 601,837 |
TOTAL JAPAN | | 31,834,383 |
Korea (South) - 0.9% |
Samsung Electronics Co. Ltd. | 1,245 | | 824,833 |
Shinhan Financial Group Co. Ltd. | 15,815 | | 612,488 |
Shinhan Financial Group Co. Ltd. sponsored ADR | 2,600 | | 202,202 |
TOTAL KOREA (SOUTH) | | 1,639,523 |
Luxembourg - 1.0% |
ArcelorMittal SA: | | | |
(Netherlands) | 17,800 | | 575,834 |
Class A unit (d) | 33,600 | | 1,087,968 |
TOTAL LUXEMBOURG | | 1,663,802 |
Netherlands - 3.9% |
Gemalto NV | 21,398 | | 974,213 |
ING Groep NV: | | | |
(Certificaten Van Aandelen) unit (a) | 131,968 | | 1,411,530 |
Common Stocks - continued |
| Shares | | Value |
Netherlands - continued |
ING Groep NV: - continued | | | |
sponsored ADR (a)(d) | 164,100 | | $ 1,768,998 |
Koninklijke Ahold NV | 43,888 | | 606,405 |
Koninklijke KPN NV | 70,720 | | 1,180,840 |
Randstad Holdings NV (a) | 16,139 | | 768,016 |
TOTAL NETHERLANDS | | 6,710,002 |
Norway - 1.0% |
Aker Solutions ASA | 86,460 | | 1,316,238 |
DnB NOR ASA | 32,800 | | 450,074 |
TOTAL NORWAY | | 1,766,312 |
Portugal - 0.7% |
Energias de Portugal SA | 337,291 | | 1,290,170 |
Russia - 0.6% |
Mechel Steel Group OAO sponsored ADR | 20,500 | | 482,775 |
OAO Gazprom sponsored ADR | 26,900 | | 587,765 |
TOTAL RUSSIA | | 1,070,540 |
Singapore - 1.7% |
DBS Group Holdings Ltd. | 39,585 | | 425,119 |
United Overseas Bank Ltd. | 126,200 | | 1,817,483 |
Yanlord Land Group Ltd. | 564,000 | | 749,502 |
TOTAL SINGAPORE | | 2,992,104 |
South Africa - 0.2% |
Impala Platinum Holdings Ltd. | 12,300 | | 347,663 |
Spain - 6.6% |
Banco Bilbao Vizcaya Argentaria SA sponsored ADR (d) | 185,716 | | 2,442,165 |
Banco Santander SA | 77,889 | | 999,496 |
Banco Santander SA sponsored ADR | 185,200 | | 2,372,412 |
Gestevision Telecinco SA | 16,100 | | 205,340 |
Iberdrola SA | 268,746 | | 2,266,117 |
Red Electrica Corporacion SA | 8,800 | | 441,975 |
Telefonica SA sponsored ADR (d) | 32,800 | | 2,661,392 |
TOTAL SPAIN | | 11,388,897 |
Sweden - 0.3% |
Telefonaktiebolaget LM Ericsson (B Shares) | 48,352 | | 531,601 |
Switzerland - 4.6% |
Lonza Group AG | 2,189 | | 191,581 |
Roche Holding AG (participation certificate) | 23,649 | | 3,471,611 |
Common Stocks - continued |
| Shares | | Value |
Switzerland - continued |
Transocean Ltd. (a) | 18,439 | | $ 1,168,295 |
Zurich Financial Services AG | 13,038 | | 3,190,790 |
TOTAL SWITZERLAND | | 8,022,277 |
Taiwan - 0.5% |
AU Optronics Corp. (a) | 315,000 | | 314,442 |
Hon Hai Precision Industry Co. Ltd. (Foxconn) | 136,752 | | 518,322 |
TOTAL TAIWAN | | 832,764 |
Thailand - 0.4% |
Siam Commercial Bank PCL (For. Reg.) | 196,900 | | 674,090 |
United Kingdom - 18.9% |
Aberdeen Asset Management PLC | 202,260 | | 576,162 |
Aegis Group PLC | 342,500 | | 689,762 |
Anglo American PLC (United Kingdom) | 46,717 | | 2,176,569 |
AstraZeneca PLC sponsored ADR (d) | 13,200 | | 666,072 |
Aviva PLC | 110,728 | | 706,059 |
BAE Systems PLC | 158,200 | | 873,677 |
Barclays PLC | 393,292 | | 1,728,083 |
BP PLC sponsored ADR | 86,000 | | 3,511,380 |
British Airways PLC (a) | 88,300 | | 382,959 |
Centrica PLC | 99,225 | | 528,109 |
HSBC Holdings PLC: | | | |
(United Kingdom) | 166,235 | | 1,729,898 |
sponsored ADR | 62,270 | | 3,244,890 |
Imperial Tobacco Group PLC | 24,643 | | 789,241 |
International Power PLC | 69,857 | | 467,048 |
Man Group PLC | 62,924 | | 262,922 |
Misys PLC (a) | 78,900 | | 355,717 |
Prudential PLC | 113,283 | | 1,145,604 |
Rio Tinto PLC | 19,102 | | 1,240,525 |
Royal Dutch Shell PLC Class A sponsored ADR (d) | 101,400 | | 6,583,903 |
Vedanta Resources PLC | 27,600 | | 917,551 |
Vodafone Group PLC sponsored ADR | 129,112 | | 3,551,871 |
Wolseley PLC (a) | 27,062 | | 721,033 |
TOTAL UNITED KINGDOM | | 32,849,035 |
TOTAL COMMON STOCKS (Cost $181,546,961) | 170,416,382 |
Nonconvertible Preferred Stocks - 1.0% |
| Shares | | Value |
Germany - 0.1% |
Volkswagen AG | 1,600 | | $ 240,443 |
Italy - 0.9% |
Fiat SpA (Risparmio Shares) | 53,200 | | 625,142 |
Telecom Italia SpA (Risparmio Shares) | 727,800 | | 892,776 |
TOTAL ITALY | | 1,517,918 |
TOTAL NONCONVERTIBLE PREFERRED STOCKS (Cost $1,798,557) | 1,758,361 |
Money Market Funds - 9.6% |
| | | |
Fidelity Cash Central Fund, 0.23% (b) | 1,148,052 | | 1,148,052 |
Fidelity Securities Lending Cash Central Fund, 0.24% (b)(c) | 15,519,480 | | 15,519,480 |
TOTAL MONEY MARKET FUNDS (Cost $16,667,532) | 16,667,532 |
TOTAL INVESTMENT PORTFOLIO - 108.6% (Cost $200,013,050) | | 188,842,275 |
NET OTHER ASSETS (LIABILITIES) - (8.6)% | | (14,918,317) |
NET ASSETS - 100% | $ 173,923,958 |
Legend |
(a) Non-income producing |
(b) Affiliated fund that is available only to investment companies and other accounts managed by Fidelity Investments. The rate quoted is the annualized seven-day yield of the fund at period end. A complete unaudited listing of the fund's holdings as of its most recent quarter end is available upon request. In addition, each Fidelity Central Fund's financial statements, which are not covered by the Fund's report of Independent Registered Public Accounting Firm, are available on the SEC's website or upon request. |
(c) Investment made with cash collateral received from securities on loan. |
(d) Security or a portion of the security is on loan at period end. |
Affiliated Central Funds |
Information regarding fiscal year to date income earned by the Fund from investments in Fidelity Central Funds is as follows: |
Fund | Income earned |
Fidelity Cash Central Fund | $ 2,268 |
Fidelity Securities Lending Cash Central Fund | 157,549 |
Total | $ 159,817 |
Other Information |
The following is a summary of the inputs used, as of October 31, 2010, involving the Fund's assets and liabilities carried at fair value. The inputs or methodology used for valuing securities may not be an indication of the risk associated with investing in those securities. For more information on valuation inputs, and their aggregation into the levels used in the table below, please refer to the Security Valuation section in the accompanying Notes to Financial Statements. |
Valuation Inputs at Reporting Date: |
Description | Total | Level 1 | Level 2 | Level 3 |
Investments in Securities: | | | |
Equities: | | | | |
United Kingdom | $ 32,849,035 | $ 26,298,866 | $ 6,550,169 | $ - |
Japan | 31,834,383 | 7,071,809 | 24,762,574 | - |
France | 18,602,092 | 18,444,273 | 157,819 | - |
Germany | 12,128,533 | 12,128,533 | - | - |
Spain | 11,388,897 | 10,389,401 | 999,496 | - |
Switzerland | 8,022,277 | 8,022,277 | - | - |
Hong Kong | 7,232,003 | 6,348,898 | 883,105 | - |
Netherlands | 6,710,002 | 5,298,472 | 1,411,530 | - |
Italy | 5,246,446 | 3,919,195 | 1,327,251 | - |
Other | 38,161,075 | 34,343,479 | 3,817,596 | - |
Money Market Funds | 16,667,532 | 16,667,532 | - | - |
Total Investments in Securities: | $ 188,842,275 | $ 148,932,735 | $ 39,909,540 | $ - |
Income Tax Information |
At October 31, 2010, the Fund had a capital loss carryforward of approximately $86,037,358 of which $17,089,067, $65,376,972 and $3,571,319 will expire on October 31, 2016, 2017 and 2018, respectively. Capital loss carryforwards are only available to offset future capital gains of the Fund to the extent provided by regulations and may be limited. |
See accompanying notes which are an integral part of the financial statements.
Annual Report
Statement of Assets and Liabilities
| October 31, 2010 |
| | |
Assets | | |
Investment in securities, at value (including securities loaned of $15,206,694) - See accompanying schedule: Unaffiliated issuers (cost $183,345,518) | $ 172,174,743 | |
Fidelity Central Funds (cost $16,667,532) | 16,667,532 | |
Total Investments (cost $200,013,050) | | $ 188,842,275 |
Foreign currency held at value (cost $5,461) | | 5,490 |
Receivable for investments sold | | 446,531 |
Receivable for fund shares sold | | 78,493 |
Dividends receivable | | 605,309 |
Distributions receivable from Fidelity Central Funds | | 4,290 |
Other receivables | | 29,877 |
Total assets | | 190,012,265 |
| | |
Liabilities | | |
Payable for investments purchased | $ 163,146 | |
Payable for fund shares redeemed | 179,389 | |
Accrued management fee | 96,986 | |
Distribution and service plan fees payable | 4,718 | |
Other affiliated payables | 35,187 | |
Other payables and accrued expenses | 89,401 | |
Collateral on securities loaned, at value | 15,519,480 | |
Total liabilities | | 16,088,307 |
| | |
Net Assets | | $ 173,923,958 |
Net Assets consist of: | | |
Paid in capital | | $ 268,479,379 |
Undistributed net investment income | | 3,475,373 |
Accumulated undistributed net realized gain (loss) on investments and foreign currency transactions | | (86,855,582) |
Net unrealized appreciation (depreciation) on investments and assets and liabilities in foreign currencies | | (11,175,212) |
Net Assets | | $ 173,923,958 |
See accompanying notes which are an integral part of the financial statements.
Annual Report
Statement of Assets and Liabilities - continued
| October 31, 2010 |
| | |
Calculation of Maximum Offering Price Class A:
Net Asset Value and redemption price per share ($4,698,845 ÷ 571,797 shares) | | $ 8.22 |
| | |
Maximum offering price per share (100/94.25 of $8.22) | | $ 8.72 |
Class T:
Net Asset Value and redemption price per share ($2,276,315 ÷ 277,544 shares) | | $ 8.20 |
| | |
Maximum offering price per share (100/96.50 of $8.20) | | $ 8.50 |
Class B:
Net Asset Value and offering price per share ($1,216,282 ÷ 148,316 shares)A | | $ 8.20 |
| | |
Class C:
Net Asset Value and offering price per share ($2,123,283 ÷ 258,867 shares)A | | $ 8.20 |
| | |
International Value:
Net Asset Value, offering price and redemption price per share ($163,089,817 ÷ 19,827,024 shares) | | $ 8.23 |
| | |
Institutional Class:
Net Asset Value, offering price and redemption price per share ($519,416 ÷ 63,004 shares) | | $ 8.24 |
A Redemption price per share is equal to net asset value less any applicable contingent deferred sales charge.
See accompanying notes which are an integral part of the financial statements.
Annual Report
Financial Statements - continued
Statement of Operations
| Year ended October 31, 2010 |
| | |
Investment Income | | |
Dividends | | $ 6,155,601 |
Interest | | 12 |
Income from Fidelity Central Funds | | 159,817 |
Income before foreign taxes withheld | | 6,315,430 |
Less foreign taxes withheld | | (506,127) |
Total income | | 5,809,303 |
| | |
Expenses | | |
Management fee
Basic fee | $ 1,246,006 | |
Performance adjustment | (64,274) | |
Transfer agent fees | 456,496 | |
Distribution and service plan fees | 53,397 | |
Accounting and security lending fees | 86,012 | |
Custodian fees and expenses | 47,971 | |
Independent trustees' compensation | 1,006 | |
Registration fees | 80,881 | |
Audit | 66,813 | |
Legal | 923 | |
Miscellaneous | 2,258 | |
Total expenses before reductions | 1,977,489 | |
Expense reductions | (28,245) | 1,949,244 |
Net investment income (loss) | | 3,860,059 |
Realized and Unrealized Gain (Loss) Net realized gain (loss) on: | | |
Investment securities: | | |
Unaffiliated issuers | (3,197,843) | |
Foreign currency transactions | (24,115) | |
Total net realized gain (loss) | | (3,221,958) |
Change in net unrealized appreciation (depreciation) on: Investment securities (net of increase in deferred foreign taxes of $30,988) | 12,416,559 | |
Assets and liabilities in foreign currencies | 1,278 | |
Total change in net unrealized appreciation (depreciation) | | 12,417,837 |
Net gain (loss) | | 9,195,879 |
Net increase (decrease) in net assets resulting from operations | | $ 13,055,938 |
See accompanying notes which are an integral part of the financial statements.
Annual Report
Statement of Changes in Net Assets
| Year ended
October 31,
2010 | Year ended
October 31,
2009 |
Increase (Decrease) in Net Assets | | |
Operations | | |
Net investment income (loss) | $ 3,860,059 | $ 3,337,187 |
Net realized gain (loss) | (3,221,958) | (62,114,878) |
Change in net unrealized appreciation (depreciation) | 12,417,837 | 101,639,080 |
Net increase (decrease) in net assets resulting
from operations | 13,055,938 | 42,861,389 |
Distributions to shareholders from net investment income | (3,135,757) | (3,076,516) |
Distributions to shareholders from net realized gain | (123,529) | - |
Total distributions | (3,259,286) | (3,076,516) |
Share transactions - net increase (decrease) | (27,172,209) | (17,980,610) |
Redemption fees | 3,410 | 6,134 |
Total increase (decrease) in net assets | (17,372,147) | 21,810,397 |
| | |
Net Assets | | |
Beginning of period | 191,296,105 | 169,485,708 |
End of period (including undistributed net investment income of $3,475,373 and undistributed net investment income of $2,751,072, respectively) | $ 173,923,958 | $ 191,296,105 |
See accompanying notes which are an integral part of the financial statements.
Annual Report
Financial Highlights - Class A
Years ended October 31, | 2010 | 2009 | 2008 | 2007 | 2006 I |
Selected Per-Share Data | | | | | |
Net asset value, beginning of period | $ 7.75 | $ 5.93 | $ 13.02 | $ 10.60 | $ 10.00 |
Income from Investment Operations | | | | | |
Net investment income (loss) E | .15 | .12 | .21 | .18 | .06 H |
Net realized and unrealized gain (loss) | .44 | 1.78 | (6.53) | 2.29 | .54 |
Total from investment operations | .59 | 1.90 | (6.32) | 2.47 | .60 |
Distributions from net investment income | (.11) | (.08) | (.15) | (.03) | - |
Distributions from net realized gain | (.01) | - | (.62) | (.02) | - |
Total distributions | (.12) | (.08) | (.77) | (.05) | - |
Redemption fees added to paid in capital E, K | - | - | - | - | - |
Net asset value, end of period | $ 8.22 | $ 7.75 | $ 5.93 | $ 13.02 | $ 10.60 |
Total Return B, C, D | 7.60% | 32.71% | (51.50)% | 23.43% | 6.00% |
Ratios to Average Net Assets F, J | | | | | |
Expenses before reductions | 1.40% | 1.34% | 1.42% | 1.38% | 1.75%A |
Expenses net of fee waivers, if any | 1.40% | 1.34% | 1.42% | 1.38% | 1.50% A |
Expenses net of all reductions | 1.38% | 1.32% | 1.41% | 1.37% | 1.46% A |
Net investment income (loss) | 1.93% | 1.86% | 2.05% | 1.49% | 1.29% A, H |
Supplemental Data | | | | | |
Net assets, end of period (000 omitted) | $ 4,699 | $ 4,456 | $ 2,854 | $ 6,052 | $ 1,537 |
Portfolio turnover rate G | 43% | 46% | 68% | 59% | 29% A |
A Annualized
B Total returns for periods of less than one year are not annualized.
C Total returns would have been lower had certain expenses not been reduced during the periods shown.
D Total returns do not include the effect of the sales charges.
E Calculated based on average shares outstanding during the period.
F Fees and expenses of the underlying Fidelity Central Funds are not included in the Fund's expense ratio. The Fund indirectly bears its proportionate share of the expenses of any underlying Fidelity Central Funds.
G Amount does not include the portfolio activity of any underlying Fidelity Central Funds.
H Investment income per share reflects a special dividend which amounted to $.03 per share. Excluding the special dividend, the ratio of net investment income (loss) to average net assets would have been .63%.
I For the period May 18, 2006 (commencement of operations) to October 31, 2006.
J Expense ratios reflect operating expenses of the class. Expenses before reductions do not reflect amounts reimbursed by the investment adviser or reductions from brokerage service arrangements or reductions from other expense offset arrangements and do not represent the amount paid by the class during periods when reimbursements or reductions occur. Expense ratios before reductions for start-up periods may not be representative of longer-term operating periods. Expenses net of fee waivers reflect expenses after reimbursement by the investment adviser but prior to reductions from brokerage service arrangements or other expense offset arrangements. Expenses net of all reductions represent the net expenses paid by the class.
K Amount represents less than $.01 per share.
See accompanying notes which are an integral part of the financial statements.
Annual Report
Financial Highlights - Class T
Years ended October 31, | 2010 | 2009 | 2008 | 2007 | 2006 I |
Selected Per-Share Data | | | | | |
Net asset value, beginning of period | $ 7.73 | $ 5.91 | $ 12.99 | $ 10.59 | $ 10.00 |
Income from Investment Operations | | | | | |
Net investment income (loss) E | .13 | .10 | .18 | .15 | .05 H |
Net realized and unrealized gain (loss) | .44 | 1.77 | (6.50) | 2.29 | .54 |
Total from investment operations | .57 | 1.87 | (6.32) | 2.44 | .59 |
Distributions from net investment income | (.09) | (.05) | (.14) | (.02) | - |
Distributions from net realized gain | (.01) | - | (.62) | (.02) | - |
Total distributions | (.10) | (.05) | (.76) | (.04) | - |
Redemption fees added to paid in capital E, K | - | - | - | - | - |
Net asset value, end of period | $ 8.20 | $ 7.73 | $ 5.91 | $ 12.99 | $ 10.59 |
Total Return B, C, D | 7.32% | 32.14% | (51.60)% | 23.13% | 5.90% |
Ratios to Average Net Assets F, J | | | | | |
Expenses before reductions | 1.67% | 1.60% | 1.67% | 1.60% | 2.01% A |
Expenses net of fee waivers, if any | 1.67% | 1.60% | 1.67% | 1.60% | 1.75% A |
Expenses net of all reductions | 1.65% | 1.59% | 1.66% | 1.58% | 1.71% A |
Net investment income (loss) | 1.65% | 1.59% | 1.80% | 1.27% | 1.04% A, H |
Supplemental Data | | | | | |
Net assets, end of period (000 omitted) | $ 2,276 | $ 2,395 | $ 2,087 | $ 5,081 | $ 1,789 |
Portfolio turnover rate G | 43% | 46% | 68% | 59% | 29% A |
A Annualized
B Total returns for periods of less than one year are not annualized.
C Total returns would have been lower had certain expenses not been reduced during the periods shown.
D Total returns do not include the effect of the sales charges.
E Calculated based on average shares outstanding during the period.
F Fees and expenses of the underlying Fidelity Central Funds are not included in the Fund's expense ratio. The Fund indirectly bears its proportionate share of the expenses of any underlying Fidelity Central Funds.
G Amount does not include the portfolio activity of any underlying Fidelity Central Funds.
H Investment income per share reflects a special dividend which amounted to $.03 per share. Excluding the special dividend, the ratio of net investment income (loss) to average net assets would have been .38%.
I For the period May 18, 2006 (commencement of operations) to October 31, 2006.
J Expense ratios reflect operating expenses of the class. Expenses before reductions do not reflect amounts reimbursed by the investment adviser or reductions from brokerage service arrangements or reductions from other expense offset arrangements and do not represent the amount paid by the class during periods when reimbursements or reductions occur. Expense ratios before reductions for start-up periods may not be representative of longer-term operating periods. Expenses net of fee waivers reflect expenses after reimbursement by the investment adviser but prior to reductions from brokerage service arrangements or other expense offset arrangements. Expenses net of all reductions represent the net expenses paid by the class.
K Amount represents less than $.01 per share.
See accompanying notes which are an integral part of the financial statements.
Annual Report
Financial Highlights - Class B
Years ended October 31, | 2010 | 2009 | 2008 | 2007 | 2006 I |
Selected Per-Share Data | | | | | |
Net asset value, beginning of period | $ 7.74 | $ 5.88 | $ 12.93 | $ 10.56 | $ 10.00 |
Income from Investment Operations | | | | | |
Net investment income (loss) E | .09 | .07 | .13 | .09 | .02 H |
Net realized and unrealized gain (loss) | .44 | 1.79 | (6.48) | 2.29 | .54 |
Total from investment operations | .53 | 1.86 | (6.35) | 2.38 | .56 |
Distributions from net investment income | (.06) | - | (.08) | - | - |
Distributions from net realized gain | (.01) | - | (.62) | (.01) | - |
Total distributions | (.07) | - | (.70) | (.01) | - |
Redemption fees added to paid in capital E, K | - | - | - | - | - |
Net asset value, end of period | $ 8.20 | $ 7.74 | $ 5.88 | $ 12.93 | $ 10.56 |
Total Return B, C, D | 6.82% | 31.63% | (51.85)% | 22.59% | 5.60% |
Ratios to Average Net Assets F, J | | | | | |
Expenses before reductions | 2.15% | 2.08% | 2.18% | 2.10% | 2.50% A |
Expenses net of fee waivers, if any | 2.15% | 2.08% | 2.18% | 2.10% | 2.25% A |
Expenses net of all reductions | 2.13% | 2.07% | 2.17% | 2.08% | 2.21% A |
Net investment income (loss) | 1.18% | 1.11% | 1.29% | .77% | .54% A, H |
Supplemental Data | | | | | |
Net assets, end of period (000 omitted) | $ 1,216 | $ 1,076 | $ 931 | $ 2,651 | $ 1,304 |
Portfolio turnover rate G | 43% | 46% | 68% | 59% | 29% A |
A Annualized
B Total returns for periods of less than one year are not annualized.
C Total returns would have been lower had certain expenses not been reduced during the periods shown.
D Total returns do not include the effect of the contingent deferred sales charge.
E Calculated based on average shares outstanding during the period.
F Fees and expenses of the underlying Fidelity Central Funds are not included in the Fund's expense ratio. The Fund indirectly bears its proportionate share of the expenses of any underlying Fidelity Central Funds.
G Amount does not include the portfolio activity of any underlying Fidelity Central Funds.
H Investment income per share reflects a special dividend which amounted to $.03 per share. Excluding the special dividend, the ratio of net investment income (loss) to average net assets would have been (.12)%.
I For the period May 18, 2006 (commencement of operations) to October 31, 2006.
J Expense ratios reflect operating expenses of the class. Expenses before reductions do not reflect amounts reimbursed by the investment adviser or reductions from brokerage service arrangements or reductions from other expense offset arrangements and do not represent the amount paid by the class during periods when reimbursements or reductions occur. Expense ratios before reductions for start-up periods may not be representative of longer-term operating periods. Expenses net of fee waivers reflect expenses after reimbursement by the investment adviser but prior to reductions from brokerage service arrangements or other expense offset arrangements. Expenses net of all reductions represent the net expenses paid by the class.
K Amount represents less than $.01 per share.
See accompanying notes which are an integral part of the financial statements.
Annual Report
Financial Highlights - Class C
Years ended October 31, | 2010 | 2009 | 2008 | 2007 | 2006 I |
Selected Per-Share Data | | | | | |
Net asset value, beginning of period | $ 7.73 | $ 5.88 | $ 12.92 | $ 10.56 | $ 10.00 |
Income from Investment Operations | | | | | |
Net investment income (loss) E | .09 | .07 | .13 | .09 | .02 H |
Net realized and unrealized gain (loss) | .44 | 1.78 | (6.47) | 2.29 | .54 |
Total from investment operations | .53 | 1.85 | (6.34) | 2.38 | .56 |
Distributions from net investment income | (.05) | - | (.08) | - | - |
Distributions from net realized gain | (.01) | - | (.62) | (.02) | - |
Total distributions | (.06) | - | (.70) | (.02) | - |
Redemption fees added to paid in capital E, K | - | - | - | - | - |
Net asset value, end of period | $ 8.20 | $ 7.73 | $ 5.88 | $ 12.92 | $ 10.56 |
Total Return B, C, D | 6.84% | 31.46% | (51.80)% | 22.56% | 5.60% |
Ratios to Average Net Assets F, J | | | | | |
Expenses before reductions | 2.15% | 2.08% | 2.17% | 2.07% | 2.47% A |
Expenses net of fee waivers, if any | 2.15% | 2.08% | 2.17% | 2.07% | 2.25% A |
Expenses net of all reductions | 2.13% | 2.06% | 2.16% | 2.05% | 2.21% A |
Net investment income (loss) | 1.18% | 1.12% | 1.30% | .80% | .54% A, H |
Supplemental Data | | | | | |
Net assets, end of period (000 omitted) | $ 2,123 | $ 2,108 | $ 1,784 | $ 5,996 | $ 2,183 |
Portfolio turnover rate G | 43% | 46% | 68% | 59% | 29% A |
A Annualized
B Total returns for periods of less than one year are not annualized.
C Total returns would have been lower had certain expenses not been reduced during the periods shown.
D Total returns do not include the effect of the contingent deferred sales charge.
E Calculated based on average shares outstanding during the period.
F Fees and expenses of the underlying Fidelity Central Funds are not included in the Fund's expense ratio. The Fund indirectly bears its proportionate share of the expenses of any underlying Fidelity Central Funds.
G Amount does not include the portfolio activity of any underlying Fidelity Central Funds.
H Investment income per share reflects a special dividend which amounted to $.03 per share. Excluding the special dividend, the ratio of net investment income (loss) to average net assets would have been (.12)%.
I For the period May 18, 2006 (commencement of operations) to October 31, 2006.
J Expense ratios reflect operating expenses of the class. Expenses before reductions do not reflect amounts reimbursed by the investment adviser or reductions from brokerage service arrangements or reductions from other expense offset arrangements and do not represent the amount paid by the class during periods when reimbursements or reductions occur. Expense ratios before reductions for start-up periods may not be representative of longer-term operating periods. Expenses net of fee waivers reflect expenses after reimbursement by the investment adviser but prior to reductions from brokerage service arrangements or other expense offset arrangements. Expenses net of all reductions represent the net expenses paid by the class.
K Amount represents less than $.01 per share.
See accompanying notes which are an integral part of the financial statements.
Annual Report
Financial Highlights - International Value
Years ended October 31, | 2010 | 2009 | 2008 | 2007 | 2006 H |
Selected Per-Share Data | | | | | |
Net asset value, beginning of period | $ 7.75 | $ 5.95 | $ 13.06 | $ 10.61 | $ 10.00 |
Income from Investment Operations | | | | | |
Net investment income (loss) D | .17 | .13 | .24 | .22 | .07 G |
Net realized and unrealized gain (loss) | .44 | 1.78 | (6.54) | 2.29 | .54 |
Total from investment operations | .61 | 1.91 | (6.30) | 2.51 | .61 |
Distributions from net investment income | (.13) | (.11) | (.19) | (.04) | - |
Distributions from net realized gain | (.01) | - | (.62) | (.02) | - |
Total distributions | (.13) K | (.11) | (.81) | (.06) | - |
Redemption fees added to paid in capital D, J | - | - | - | - | - |
Net asset value, end of period | $ 8.23 | $ 7.75 | $ 5.95 | $ 13.06 | $ 10.61 |
Total Return B, C | 7.95% | 33.09% | (51.34)% | 23.81% | 6.10% |
Ratios to Average Net Assets E, I | | | | | |
Expenses before reductions | 1.09% | 1.07% | 1.10% | 1.03% | 1.50% A |
Expenses net of fee waivers, if any | 1.09% | 1.07% | 1.10% | 1.03% | 1.25% A |
Expenses net of all reductions | 1.08% | 1.06% | 1.09% | 1.02% | 1.21% A |
Net investment income (loss) | 2.23% | 2.12% | 2.37% | 1.84% | 1.54% A, G |
Supplemental Data | | | | | |
Net assets, end of period (000 omitted) | $ 163,090 | $ 180,447 | $ 160,777 | $ 381,148 | $ 221,130 |
Portfolio turnover rate F | 43% | 46% | 68% | 59% | 29% A |
A Annualized
B Total returns for periods of less than one year are not annualized.
C Total returns would have been lower had certain expenses not been reduced during the periods shown.
D Calculated based on average shares outstanding during the period.
E Fees and expenses of the underlying Fidelity Central Funds are not included in the Fund's expense ratio. The Fund indirectly bears its proportionate share of the expenses of any underlying Fidelity Central Funds.
F Amount does not include the portfolio activity of any underlying Fidelity Central Funds.
G Investment income per share reflects a special dividend which amounted to $.03 per share. Excluding the special dividend, the ratio of net investment income (loss) to average net assets would have been .88%.
H For the period May 18, 2006 (commencement of operations) to October 31, 2006.
I Expense ratios reflect operating expenses of the class. Expenses before reductions do not reflect amounts reimbursed by the investment adviser or reductions from brokerage service arrangements or reductions from other expense offset arrangements and do not represent the amount paid by the class during periods when reimbursements or reductions occur. Expense ratios before reductions for start-up periods may not be representative of longer-term operating periods. Expenses net of fee waivers reflect expenses after reimbursement by the investment adviser but prior to reductions from brokerage service arrangements or other expense offset arrangements. Expenses net of all reductions represent the net expenses paid by the class.
J Amount represents less than $.01 per share.
K Total distributions of $.13 per share is comprised of distributions from net investment income of $.129 and distributions from net realized gain of $.005 per share.
See accompanying notes which are an integral part of the financial statements.
Annual Report
Financial Highlights - Institutional Class
Years ended October 31, | 2010 | 2009 | 2008 | 2007 | 2006 H |
Selected Per-Share Data | | | | | |
Net asset value, beginning of period | $ 7.76 | $ 5.96 | $ 13.07 | $ 10.61 | $ 10.00 |
Income from Investment Operations | | | | | |
Net investment income (loss) D | .18 | .14 | .25 | .22 | .07 G |
Net realized and unrealized gain (loss) | .44 | 1.78 | (6.54) | 2.30 | .54 |
Total from investment operations | .62 | 1.92 | (6.29) | 2.52 | .61 |
Distributions from net investment income | (.14) | (.12) | (.20) | (.04) | - |
Distributions from net realized gain | (.01) | - | (.62) | (.02) | - |
Total distributions | (.14) K | (.12) | (.82) | (.06) | - |
Redemption fees added to paid in capital D, J | - | - | - | - | - |
Net asset value, end of period | $ 8.24 | $ 7.76 | $ 5.96 | $ 13.07 | $ 10.61 |
Total Return B, C | 8.05% | 33.06% | (51.27)% | 23.91% | 6.10% |
Ratios to Average Net Assets E, I | | | | | |
Expenses before reductions | .98% | .93% | 1.02% | .98% | 1.38% A |
Expenses net of fee waivers, if any | .98% | .93% | 1.02% | .98% | 1.25% A |
Expenses net of all reductions | .97% | .92% | 1.01% | .96% | 1.21% A |
Net investment income (loss) | 2.34% | 2.26% | 2.45% | 1.89% | 1.54% A, G |
Supplemental Data | | | | | |
Net assets, end of period (000 omitted) | $ 519 | $ 814 | $ 1,052 | $ 3,965 | $ 3,064 |
Portfolio turnover rate F | 43% | 46% | 68% | 59% | 29% A |
A Annualized
B Total returns for periods of less than one year are not annualized.
C Total returns would have been lower had certain expenses not been reduced during the periods shown.
D Calculated based on average shares outstanding during the period.
E Fees and expenses of the underlying Fidelity Central Funds are not included in the Fund's expense ratio. The Fund indirectly bears its proportionate share of the expenses of any underlying Fidelity Central Funds.
F Amount does not include the portfolio activity of any underlying Fidelity Central Funds.
G Investment income per share reflects a special dividend which amounted to $.03 per share. Excluding the special dividend, the ratio of net investment income (loss) to average net assets would have been .88%.
H For the period May 18, 2006 (commencement of operations) to October 31, 2006.
I Expense ratios reflect operating expenses of the class. Expenses before reductions do not reflect amounts reimbursed by the investment adviser or reductions from brokerage service arrangements or reductions from other expense offset arrangements and do not represent the amount paid by the class during periods when reimbursements or reductions occur. Expense ratios before reductions for start-up periods may not be representative of longer-term operating periods. Expenses net of fee waivers reflect expenses after reimbursement by the investment adviser but prior to reductions from brokerage service arrangements or other expense offset arrangements. Expenses net of all reductions represent the net expenses paid by the class.
J Amount represents less than $.01 per share.
K Total distributions of $.14 per share is comprised of distributions from net investment income of $.137 and distributions from net realized gain of $.005 per share.
See accompanying notes which are an integral part of the financial statements.
Annual Report
Notes to Financial Statements
For the period ended October 31, 2010
1. Organization.
Fidelity International Value Fund (the Fund) is a fund of Fidelity Investment Trust (the Trust) and is authorized to issue an unlimited number of shares. The Trust is registered under the Investment Company Act of 1940, as amended (the 1940 Act), as an open-end management investment company organized as a Massachusetts business trust. The Fund offers Class A, Class T, Class C, International Value and Institutional Class shares, each of which has equal rights as to assets and voting privileges. Effective after the close of business on September 1, 2010, Class B shares were closed to new accounts and additional purchases by existing shareholders. Each class has exclusive voting rights with respect to matters that affect that class. Class B shares will automatically convert to Class A shares after a holding period of seven years from the initial date of purchase. Investment income, realized and unrealized capital gains and losses, the common expenses of the Fund, and certain fund-level expense reductions, if any, are allocated on a pro-rata basis to each class based on the relative net assets of each class to the total net assets of the Fund. Each class differs with respect to transfer agent and distribution and service plan fees incurred. Certain expense reductions also differ by class. The Fund's investments in emerging markets can be subject to social, economic, regulatory, and political uncertainties and can be extremely volatile.
2. Investments in Fidelity Central Funds.
The Fund may invest in Fidelity Central Funds, which are open-end investment companies available only to other investment companies and accounts managed by Fidelity Management & Research Company (FMR) and its affiliates. The Fund's Schedule of Investments lists each of the Fidelity Central Funds held as of period end, if any, as an investment of the Fund, but does not include the underlying holdings of each Fidelity Central Fund. As an Investing Fund, the Fund indirectly bears its proportionate share of the expenses of the underlying Fidelity Central Funds.
The Money Market Central Funds seek preservation of capital and current income and are managed by Fidelity Investments Money Management, Inc. (FIMM), an affiliate of FMR.
A complete unaudited list of holdings for each Fidelity Central Fund is available upon request or at the Securities and Exchange Commission (the SEC) web site at www.sec.gov. In addition, the financial statements of the Fidelity Central Funds, which are not covered by the Fund's Report of Independent Registered Public Accounting Firm, are available on the SEC web site or upon request.
3. Significant Accounting Policies.
The financial statements have been prepared in conformity with accounting principles generally accepted in the United States of America (GAAP), which require management to make certain estimates and assumptions at the date of the financial statements.
Annual Report
Notes to Financial Statements - continued
3. Significant Accounting Policies - continued
Actual results could differ from those estimates. The following summarizes the significant accounting policies of the Fund:
Security Valuation. Investments are valued as of 4:00 p.m. Eastern time on the last calendar day of the period. The Fund uses independent pricing services approved by the Board of Trustees to value its investments. When current market prices or quotations are not readily available or reliable, valuations may be determined in good faith in accordance with procedures adopted by the Board of Trustees. Factors used in determining value may include market or security specific events. The frequency with which these procedures are used cannot be predicted and they may be utilized to a significant extent. The value used for net asset value (NAV) calculation under these procedures may differ from published prices for the same securities.
The Fund categorizes the inputs to valuation techniques used to value its investments into a disclosure hierarchy consisting of three levels as shown below.
Level 1 - quoted prices in active markets for identical investments
Level 2 - other significant observable inputs (including quoted prices for similar investments, interest rates, prepayment speeds, etc.)
Level 3 - unobservable inputs (including the fund's own assumptions based on the best information available)
Changes in valuation techniques may result in transfers in or out of an assigned level within the disclosure hierarchy. The aggregate value of investments by input level as of October 31, 2010 is included at the end of the Fund's Schedule of Investments. Valuation techniques used to value the Fund's investments by major category are as follows.
Equity securities, including restricted securities, for which market quotations are readily available, are valued at the last reported sale price or official closing price as reported by an independent pricing service on the primary market or exchange on which they are traded and are categorized as Level 1 in the hierarchy. In the event there were no sales during the day or closing prices are not available, securities are valued at the last quoted bid price or may be valued using the last available price and are generally categorized as Level 2 in the hierarchy. For foreign equity securities, when significant market or security specific events arise, comparisons to the valuation of American Depositary Receipts (ADRs), futures contracts, Exchange-traded funds (ETFs) and certain indexes as well as quoted prices for similar securities are used and are categorized as Level 2 in the hierarchy in these circumstances. Utilizing these techniques may result in significant transfers between Level 1 and Level 2. For restricted equity securities and private placements where observable inputs are limited, assumptions about market activity and risk are used and are categorized as Level 3 in the hierarchy.
Annual Report
3. Significant Accounting Policies - continued
Security Valuation - continued
Investments in open-end mutual funds ,including the Fidelity Central Funds, are valued at their closing net asset value each business day and are categorized as Level 1 in the hierarchy. Short-term securities with remaining maturities of sixty days or less for which quotations are not readily available are valued at amortized cost, which approximates fair value and are categorized as Level 2 in the hierarchy.
Foreign Currency. The Fund uses foreign currency contracts to facilitate transactions in foreign-denominated securities. Gains and losses from these transactions may arise from changes in the value of the foreign currency or if the counterparties do not perform under the contracts' terms.
Foreign-denominated assets, including investment securities, and liabilities are translated into U.S. dollars at the exchange rate at period end. Purchases and sales of investment securities, income and dividends received and expenses denominated in foreign currencies are translated into U.S. dollars at the exchange rate in effect on the transaction date.
The effects of exchange rate fluctuations on investments are included with the net realized and unrealized gain (loss) on investment securities. Other foreign currency transactions resulting in realized and unrealized gain (loss) are disclosed separately.
Investment Transactions and Income. For financial reporting purposes, the Fund's investment holdings and NAV include trades executed through the end of the last business day of the period. The NAV per share for processing shareholder transactions is calculated as of the close of business of the New York Stock Exchange (NYSE), normally 4:00 p.m. Eastern time and includes trades executed through the end of the prior business day. Gains and losses on securities sold are determined on the basis of identified cost. Dividend income is recorded on the ex-dividend date, except for certain dividends from foreign securities where the ex-dividend date may have passed, which are recorded as soon as the Fund is informed of the ex-dividend date. Non-cash dividends included in dividend income, if any, are recorded at the fair market value of the securities received. Interest income and distributions from the Fidelity Central Funds are accrued as earned. Interest income includes coupon interest and amortization of premium and accretion of discount on debt securities. Investment income is recorded net of foreign taxes withheld where recovery of such taxes is uncertain.
Expenses. Most expenses of the Trust can be directly attributed to a fund. Expenses which cannot be directly attributed are apportioned amongst each fund in the Trust. Expense estimates are accrued in the period to which they relate and adjustments are made when actual amounts are known.
Annual Report
Notes to Financial Statements - continued
3. Significant Accounting Policies - continued
Income Tax Information and Distributions to Shareholders. Each year the Fund intends to qualify as a regulated investment company, including distributing substantially all of its taxable income and realized gains under Subchapter M of the Internal Revenue Code and filing its U.S. federal tax return. As a result, no provision for income taxes is required. As of October 31, 2010, the Fund did not have any unrecognized tax benefits in the accompanying financial statements. A fund's federal tax return is subject to examination by the Internal Revenue Service (IRS) for a period of three years. Foreign taxes are provided for based on the Fund's understanding of the tax rules and rates that exist in the foreign markets in which it invests. The Fund is subject to a tax imposed on short term capital gains on securities of certain issuers domiciled in India. The Fund records an estimated deferred tax liability included in Other payables and accrued expenses in the accompanying Statement of Assets & Liabilities for net unrealized gains on these securities in an amount that would be payable if the securities were disposed of at period end.
Distributions are declared and recorded on the ex-dividend date. Income dividends and capital gain distributions are declared separately for each class. Income and capital gain distributions are determined in accordance with income tax regulations, which may differ from GAAP.
Capital accounts within the financial statements are adjusted for permanent book-tax differences. These adjustments have no impact on net assets or the results of operations. Temporary book-tax differences will reverse in a subsequent period.
Book-tax differences are primarily due to the short-term gain distributions from the Fidelity Central Funds, foreign currency transactions, passive foreign investment companies (PFIC), capital loss carryforwards and losses deferred due to wash sales.
The federal tax cost of investment securities and unrealized appreciation (depreciation) as of period end were as follows:
Gross unrealized appreciation | $ 16,722,692 |
Gross unrealized depreciation | (29,377,939) |
Net unrealized appreciation (depreciation) | $ (12,655,247) |
| |
Tax Cost | $ 201,497,522 |
The tax-based components of distributable earnings as of period end were as follows:
Undistributed ordinary income | $ 4,141,622 |
Capital loss carryforward | $ (86,037,358) |
Net unrealized appreciation (depreciation) | $ (12,628,725) |
Annual Report
3. Significant Accounting Policies - continued
Income Tax Information and Distributions to Shareholders - continued
The tax character of distributions paid was as follows:
| October 31, 2010 | October 31, 2009 |
Ordinary Income | $ 3,259,286 | $ 3,076,516 |
Short-Term Trading (Redemption) Fees. Shares held by investors in the Fund less than 30 days are subject to a redemption fee equal to 1.00% of the net asset value of shares redeemed. All redemption fees, which reduce the proceeds of the shareholder redemption, are retained by the Fund and accounted for as an addition to paid in capital.
4. Purchases and Sales of Investments.
Purchases and sales of securities, other than short-term securities, aggregated $74,051,222 and $100,611,718, respectively.
5. Fees and Other Transactions with Affiliates.
Management Fee. FMR and its affiliates provide the Fund with investment management related services for which the Fund pays a monthly management fee. The management fee is the sum of an individual fund fee rate that is based on an annual rate of .45% of the Fund's average net assets and a group fee rate that averaged .26% during the period. The group fee rate is based upon the average net assets of all the mutual funds advised by FMR. The group fee rate decreases as assets under management increase and increases as assets under management decrease. In addition, the management fee is subject to a performance adjustment (up to a maximum of ±.20% of the Fund's average net assets over a 36 month performance period). The upward or downward adjustment to the management fee is based on the relative investment performance of International Value as compared to an appropriate benchmark index. For the period, the total annual management fee rate, including the performance adjustment, was .67% of the Fund's average net assets.
Distribution and Service Plan Fees. In accordance with Rule 12b-1 of the 1940 Act, the Fund has adopted separate Distribution and Service Plans for each class of shares. Certain classes pay Fidelity Distributors Corporation (FDC), an affiliate of FMR, separate Distribution and Service Fees, each of which is based on an annual percentage of each class' average net assets. In addition, FDC may pay financial intermediaries for selling shares of the Fund and providing shareholder support services. For the period,
Annual Report
Notes to Financial Statements - continued
5. Fees and Other Transactions with Affiliates - continued
Distribution and Service Plan Fees - continued
the Distribution and Service Fee rates, total fees and amounts retained by FDC were as follows:
Sales Load. FDC receives a front-end sales charge of up to 5.75% for selling Class A shares, and 3.50% for selling Class T shares, some of which is paid to financial intermediaries for selling shares of the Fund. FDC receives the proceeds of contingent deferred sales charges levied on Class A, Class T, Class B, and Class C redemptions. These charges depend on the holding period. The deferred sales charges range from 5% to 1% for Class B, 1% for Class C, 1.00% for certain purchases of Class A shares (1.00% to .50% prior to July 12, 2010) and .25% for certain purchases of Class T shares.
For the period, sales charge amounts retained by FDC were as follows:
| Retained
by FDC |
Class A | $ 2,989 |
Class T | 944 |
Class B* | 1,152 |
Class C* | 496 |
| $ 5,581 |
* When Class B and Class C shares are initially sold, FDC pays commissions from its own resources to financial intermediaries through which the sales are made.
Transfer Agent Fees. Fidelity Investments Institutional Operations Company, Inc. (FIIOC), an affiliate of FMR, is the transfer, dividend disbursing and shareholder servicing agent for each class of the Fund. FIIOC receives account fees and asset-based fees that vary according to the account size and type of account of the shareholders of the respective classes of the Fund. FIIOC pays for typesetting, printing and mailing of
Annual Report
5. Fees and Other Transactions with Affiliates - continued
Transfer Agent Fees - continued
shareholder reports, except proxy statements. For the period, transfer agent fees for each class were as follows:
Accounting and Security Lending Fees. Fidelity Service Company, Inc. (FSC), an affiliate of FMR, maintains the Fund's accounting records. The accounting fee is based on the level of average net assets for the month. Under a separate contract, FSC administers the security lending program. The security lending fee is based on the number and duration of lending transactions.
Brokerage Commissions. The Fund placed a portion of its portfolio transactions with brokerage firms which are affiliates of the investment adviser. The commissions paid to these affiliated firms were $338 for the period.
6. Committed Line of Credit.
The Fund participates with other funds managed by FMR or an affiliate in a $3.75 billion credit facility (the "line of credit") to be utilized for temporary or emergency purposes to fund shareholder redemptions or for other short-term liquidity purposes. The Fund has agreed to pay commitment fees on its pro-rata portion of the line of credit, which amounted to $702 and is reflected in Miscellaneous expenses on the Statement of Operations. During the period, there were no borrowings on this line of credit.
7. Security Lending.
The Fund lends portfolio securities through a lending agent from time to time in order to earn additional income. The lending agent may loan securities to certain qualified borrowers, including Fidelity Capital Markets (FCM), a broker-dealer affiliated with the Fund. On the settlement date of the loan, the Fund receives collateral (in the form of U.S. Treasury obligations, letters of credit and/or cash) against the loaned securities and maintains collateral in an amount not less than 100% of the market value of the loaned securities during the period of the loan. The market value of the loaned securities is
Annual Report
Notes to Financial Statements - continued
7. Security Lending - continued
determined at the close of business of the Fund and any additional required collateral is delivered to the Fund on the next business day. If the borrower defaults on its obligation to return the securities loaned because of insolvency or other reasons, a fund could experience delays and costs in recovering the securities loaned or in gaining access to the collateral. Any cash collateral received is invested in the Fidelity Securities Lending Cash Central Fund. The value of loaned securities and cash collateral at period end are disclosed on the Fund's Statement of Assets and Liabilities. Security lending income represents the income earned on investing cash collateral, less rebates paid to borrowers and lending agent fees associated with the loan, plus any premium payments received for lending certain types of securities. Security lending income is presented in the Statement of Operations as a component of income from Fidelity Central Funds. Total security lending income during the period amounted to $157,549. During the period, there were no securities loaned to FCM.
8. Expense Reductions.
Many of the brokers with whom FMR places trades on behalf of the Fund provided services to the Fund in addition to trade execution. These services included payments of certain expenses on behalf of the Fund totaling $28,245 for the period.
9. Distributions to Shareholders.
Distributions to shareholders of each class were as follows:
Years ended October 31, | 2010 | 2009 |
From net investment income | | |
Class A | $ 64,929 | $ 38,784 |
Class T | 27,801 | 19,023 |
Class B | 8,869 | - |
Class C | 14,357 | - |
International Value | 3,006,248 | 3,001,128 |
Institutional Class | 13,553 | 17,581 |
Total | $ 3,135,757 | $ 3,076,516 |
From net realized gain | | |
Class A | $ 2,899 | $ - |
Class T | 1,544 | - |
Class B | 715 | - |
Class C | 1,354 | - |
International Value | 116,522 | - |
Institutional Class | 495 | - |
Total | $ 123,529 | $ - |
Annual Report
10. Share Transactions.
Transactions for each class of shares were as follows:
| Shares | Dollars |
Years ended October 31, | 2010 | 2009 | 2010 | 2009 |
Class A | | | | |
Shares sold | 216,581 | 302,325 | $ 1,676,019 | $ 1,876,749 |
Reinvestment of distributions | 7,621 | 6,730 | 61,732 | 35,265 |
Shares redeemed | (227,521) | (215,042) | (1,766,121) | (1,172,427) |
Net increase (decrease) | (3,319) | 94,013 | $ (28,370) | $ 739,587 |
Class T | | | | |
Shares sold | 82,344 | 72,122 | $ 635,080 | $ 432,831 |
Reinvestment of distributions | 3,507 | 2,980 | 28,408 | 15,614 |
Shares redeemed | (118,025) | (118,669) | (899,018) | (709,124) |
Net increase (decrease) | (32,174) | (43,567) | $ (235,530) | $ (260,679) |
Class B | | | | |
Shares sold | 44,963 | 51,221 | $ 346,949 | $ 307,508 |
Reinvestment of distributions | 980 | - | 7,981 | - |
Shares redeemed | (36,625) | (70,451) | (286,374) | (387,465) |
Net increase (decrease) | 9,318 | (19,230) | $ 68,556 | $ (79,957) |
Class C | | | | |
Shares sold | 56,757 | 108,573 | $ 434,910 | $ 666,628 |
Reinvestment of distributions | 1,540 | - | 12,532 | - |
Shares redeemed | (72,014) | (139,651) | (560,469) | (850,584) |
Net increase (decrease) | (13,717) | (31,078) | $ (113,027) | $ (183,956) |
International Value | | | | |
Shares sold | 3,662,730 | 4,879,190 | $ 28,403,948 | $ 32,198,500 |
Reinvestment of distributions | 369,795 | 550,070 | 2,987,943 | 2,876,866 |
Shares redeemed | (7,496,748) | (9,139,736) | (57,917,334) | (52,863,403) |
Net increase (decrease) | (3,464,223) | (3,710,476) | $ (26,525,443) | $ (17,788,037) |
Institutional Class | | | | |
Shares sold | 16,581 | 6,874 | $ 128,469 | $ 36,272 |
Reinvestment of distributions | 185 | 572 | 1,498 | 2,992 |
Shares redeemed | (58,573) | (79,196) | (468,362) | (446,832) |
Net increase (decrease) | (41,807) | (71,750) | $ (338,395) | $ (407,568) |
Annual Report
Notes to Financial Statements - continued
11. Other.
The Fund's organizational documents provide former and current trustees and officers with a limited indemnification against liabilities arising in connection with the performance of their duties to the Fund. In the normal course of business, the Fund may also enter into contracts that provide general indemnifications. The Fund's maximum exposure under these arrangements is unknown as this would be dependent on future claims that may be made against the Fund. The risk of material loss from such claims is considered remote.
Annual Report
To the Trustees of Fidelity Investment Trust and Shareholders of Fidelity International Value Fund:
We have audited the accompanying statement of assets and liabilities of Fidelity International Value Fund (the Fund), a fund of Fidelity Investment Trust, including the schedule of investments, as of October 31, 2010, and the related statement of operations for the year then ended, the statement of changes in net assets for each of the two years in the period then ended, and the financial highlights for each of the periods presented. These financial statements and financial highlights are the responsibility of the Fund's management. Our responsibility is to express an opinion on these financial statements and financial highlights based on our audits.
We conducted our audits in accordance with standards of the Public Company Accounting Oversight Board (United States). Those standards require that we plan and perform the audit to obtain reasonable assurance about whether the financial statements and financial highlights are free of material misstatement. The Fund is not required to have, nor were we engaged to perform, an audit of its internal control over financial reporting. Our audits included consideration of internal control over financial reporting as a basis for designing audit procedures that are appropriate in the circumstances, but not for the purpose of expressing an opinion on the effectiveness of the Fund's internal control over financial reporting. Accordingly, we express no such opinion. An audit also includes examining, on a test basis, evidence supporting the amounts and disclosures in the financial statements, assessing the accounting principles used and significant estimates made by management, as well as evaluating the overall financial statement presentation. Our procedures included confirmation of securities owned as of October 31, 2010, by correspondence with the custodians and brokers; where replies were not received from brokers, we performed other auditing procedures. We believe that our audits provide a reasonable basis for our opinion.
In our opinion, the financial statements and financial highlights referred to above present fairly, in all material respects, the financial position of Fidelity International Value Fund as of October 31, 2010, the results of its operations for the year then ended, the changes in its net assets for each of the two years in the period then ended, and the financial highlights for each of the periods presented, in conformity with accounting principles generally accepted in the United States of America.
/s/ Deloitte & Touche LLP
DELOITTE & TOUCHE LLP
Boston, Massachusetts
December 16, 2010
Annual Report
The Trustees, Member of the Advisory Board, and executive officers of the trust and fund, as applicable, are listed below. The Board of Trustees governs the fund and is responsible for protecting the interests of shareholders. The Trustees are experienced executives who meet periodically throughout the year to oversee the fund's activities, review contractual arrangements with companies that provide services to the fund, oversee management of the risks associated with such activities and contractual arrangements, and review the fund's performance. Except for James C. Curvey, each of the Trustees oversees 221 funds advised by FMR or an affiliate. Mr. Curvey oversees 410 funds advised by FMR or an affiliate.
The Trustees hold office without limit in time except that (a) any Trustee may resign; (b) any Trustee may be removed by written instrument, signed by at least two-thirds of the number of Trustees prior to such removal; (c) any Trustee who requests to be retired or who has become incapacitated by illness or injury may be retired by written instrument signed by a majority of the other Trustees; and (d) any Trustee may be removed at any special meeting of shareholders by a two-thirds vote of the outstanding voting securities of the trust. Each Trustee who is not an interested person (as defined in the 1940 Act) (Independent Trustee), shall retire not later than the last day of the calendar year in which his or her 72nd birthday occurs. The Independent Trustees may waive this mandatory retirement age policy with respect to individual Trustees. The executive officers and Advisory Board Member hold office without limit in time, except that any officer and Advisory Board Member may resign or may be removed by a vote of a majority of the Trustees at any regular meeting or any special meeting of the Trustees. Except as indicated, each individual has held the office shown or other offices in the same company for the past five years.
Experience, Skills, Attributes, and Qualifications of the Fund's Trustees. The Governance and Nominating Committee has adopted a statement of policy that describes the experience, qualifications, attributes, and skills that are necessary and desirable for potential Independent Trustee candidates (Statement of Policy). The Board believes that each Trustee satisfied at the time he or she was initially elected or appointed a Trustee, and continues to satisfy, the standards contemplated by the Statement of Policy. The Governance and Nominating Committee also engages professional search firms to help identify potential Independent Trustee candidates who have the experience, qualifications, attributes, and skills consistent with the Statement of Policy. From time to time, additional criteria based on the composition and skills of the current Independent Trustees, as well as experience or skills that may be appropriate in light of future changes to board composition, business conditions, and regulatory or other developments, have also been considered by the professional search firms and the Governance and Nominating Committee. In addition, the Board takes into account the Trustees' commitment and participation in Board and committee meetings, as well as their leadership of standing and ad hoc committees throughout their tenure.
In determining that a particular Trustee was and continues to be qualified to serve as a Trustee, the Board has considered a variety of criteria, none of which, in isolation, was controlling. The Board believes that, collectively, the Trustees have balanced and diverse experience, qualifications, attributes, and skills, which allow the Board to operate effectively in governing the fund and protecting the interests of shareholders. Information about the specific experience, skills, attributes, and qualifications of each Trustee, which in each case led to the Board's conclusion that the Trustee should serve (or continue to serve) as a trustee of the fund, is provided below.
Annual Report
Board Structure and Oversight Function. Edward C. Johnson 3d is an interested person (as defined in the 1940 Act) and currently serves as Chairman. The Trustees have determined that an interested Chairman is appropriate and benefits shareholders because an interested Chairman has a personal and professional stake in the quality and continuity of services provided to the fund. Independent Trustees exercise their informed business judgment to appoint an individual of their choosing to serve as Chairman, regardless of whether the Trustee happens to be independent or a member of management. The Independent Trustees have determined that they can act independently and effectively without having an Independent Trustee serve as Chairman and that a key structural component for assuring that they are in a position to do so is for the Independent Trustees to constitute a substantial majority for the Board. The Independent Trustees also regularly meet in executive session. Ned C. Lautenbach serves as Chairman of the Independent Trustees and as such (i) acts as a liaison between the Independent Trustees and management with respect to matters important to the Independent Trustees and (ii) with management prepares agendas for Board meetings.
Fidelity funds are overseen by different Boards of Trustees. The fund's Board oversees Fidelity's equity and high income funds and another Board oversees Fidelity's investment-grade bond, money market, and asset allocation funds. The asset allocation funds may invest in Fidelity funds overseen by the fund's Board. The use of separate Boards, each with its own committee structure, allows the Trustees of each group of Fidelity funds to focus on the unique issues of the funds they oversee, including common research, investment, and operational issues. On occasion, the separate Boards establish joint committees to address issues of overlapping consequences for the Fidelity funds overseen by each Board.
The Trustees operate using a system of committees to facilitate the timely and efficient consideration of all matters of importance to the Trustees, the fund, and fund shareholders and to facilitate compliance with legal and regulatory requirements and oversight of the fund's activities and associated risks. The Board, acting through its committees, has charged FMR and its affiliates with (i) identifying events or circumstances the occurrence of which could have demonstrably adverse effects on the fund's business and/or reputation; (ii) implementing processes and controls to lessen the possibility that such events or circumstances occur or to mitigate the effects of such events or circumstances if they do occur; and (iii) creating and maintaining a system designed to evaluate continuously business and market conditions in order to facilitate the identification and implementation processes described in (i) and (ii) above. Because the day-to-day operations and activities of the fund are carried out by or through FMR, its affiliates and other service providers, the fund's exposure to risks is mitigated but not eliminated by the processes overseen by the Trustees. While each of the Board's committees has responsibility for overseeing different aspects of the fund's activities, oversight is exercised primarily through the Operations, Audit, and Compliance Committees. Appropriate personnel, including but not limited to the fund's Chief Compliance Officer (CCO), FMR's internal auditor, the independent accountants, the fund's Treasurer and portfolio management personnel, make periodic reports to the Board's committees, as appropriate. The responsibilities of each committee, including their oversight responsibilities, are described further under "Standing Committees of the Fund's Trustees."
Annual Report
Trustees and Officers - continued
The fund's Statement of Additional Information (SAI) includes more information about the Trustees. To request a free copy, call Fidelity at 1-877-208-0098.
Interested Trustees*:
Correspondence intended for each Trustee who is an interested person may be sent to Fidelity Investments, 82 Devonshire Street, Boston, Massachusetts 02109.
Name, Age; Principal Occupations and Other Relevant Experience+ |
Edward C. Johnson 3d (80) |
| Year of Election or Appointment: 1984 Mr. Johnson is Trustee and Chairman of the Board of Trustees of certain Trusts. Mr. Johnson serves as Chief Executive Officer, Chairman, and a Director of FMR LLC; Chairman and a Director of FMR; Chairman and a Director of Fidelity Research & Analysis Company (FRAC); Chairman and a Director of Fidelity Investments Money Management, Inc.; and Chairman and a Director of FMR Co., Inc. In addition, Mr. Johnson serves as Chairman and Director of FIL Limited. Previously, Mr. Johnson served as President of FMR LLC (2006-2007). |
James C. Curvey (75) |
| Year of Election or Appointment: 2007 Mr. Curvey also serves as Trustee (2007-present) of other investment companies advised by FMR. Mr. Curvey is a Director of Fidelity Investments Money Management, Inc. (2009-present), Director of Fidelity Research & Analysis Co. (2009-present) and Director of FMR and FMR Co., Inc. (2007-present). Mr. Curvey is also Vice Chairman (2007-present) and Director of FMR LLC. In addition, Mr. Curvey serves as an Overseer for the Boston Symphony Orchestra and a member of the Trustees of Villanova University. Previously, Mr. Curvey was the Vice Chairman (2006-2007) and Director (2000-2007) of FMR Corp. |
* Trustees have been determined to be "Interested Trustees" by virtue of, among other things, their affiliation with the trust or various entities under common control with FMR.
+ The information above includes each Trustee's principal occupation during the last five years and other information relating to the experience, attributes, and skills relevant to each Trustee's qualifications to serve as a Trustee, which led to the conclusion that each Trustee should serve as a Trustee for the fund.
Independent Trustees:
Correspondence intended for each Independent Trustee (that is, the Trustees other than the Interested Trustees) may be sent to Fidelity Investments, P.O. Box 55235, Boston, Massachusetts 02205-5235.
Name, Age; Principal Occupations and Other Relevant Experience+ |
Dennis J. Dirks (62) |
| Year of Election or Appointment: 2005 Prior to his retirement in May 2003, Mr. Dirks was Chief Operating Officer and a member of the Board of The Depository Trust & Clearing Corporation (DTCC). He also served as President, Chief Operating Officer, and Board member of The Depository Trust Company (DTC) and President and Board member of the National Securities Clearing Corporation (NSCC). In addition, Mr. Dirks served as Chief Executive Officer and Board member of the Government Securities Clearing Corporation, Chief Executive Officer and Board member of the Mortgage-Backed Securities Clearing Corporation, as a Trustee and a member of the Finance Committee of Manhattan College (2005-2008), and as a Trustee and a member of the Finance Committee of AHRC of Nassau County (2006-2008). Mr. Dirks is a member of the Independent Directors Council (IDC) Governing Council (2010-Present) and Board of Directors for The Brookville Center for Children's Services, Inc. (2009-present). |
Alan J. Lacy (57) |
| Year of Election or Appointment: 2008 Mr. Lacy serves as Senior Adviser (2007-present) of Oak Hill Capital Partners, L.P. (private equity). Mr. Lacy also served as Chief Executive Officer (2000-2005) and Vice Chairman (2005-2006) of Sears Holdings Corporation and Sears, Roebuck and Co. (retail). In addition, Mr. Lacy serves as a member of the Board of Directors of The Western Union Company (global money transfer, 2006-present) and Bristol-Myers Squibb Company (global pharmaceuticals, 2007-present). Mr. Lacy is Chairman (2008-present) and a member (2006-present) of the Board of Trustees of The National Parks Conservation Association. |
Ned C. Lautenbach (66) |
| Year of Election or Appointment: 2000 Mr. Lautenbach is Chairman of the Independent Trustees of the Equity and High Income Funds (2006-present). Mr. Lautenbach currently serves as the Lead Director of the Eaton Corporation Board of Directors (diversified industrial, 1997-present). Mr. Lautenbach is also a member of the Board of Directors of the Philharmonic Center for the Arts in Naples, Florida (1999-present); a member of the Board of Trustees of Fairfield University (2005-present); and a member of the Council on Foreign Relations (1994-present). Previously, Mr. Lautenbach was a Partner/Advisory Partner at Clayton, Dubilier & Rice, Inc. (private equity investment, 1998-2010), as well as a Director of Sony Corporation (2006-2007). |
Joseph Mauriello (66) |
| Year of Election or Appointment: 2008 Prior to his retirement in January 2006, Mr. Mauriello served in numerous senior management positions including Deputy Chairman and Chief Operating Officer (2004-2005), and Vice Chairman of Financial Services (2002-2004) of KPMG LLP US (professional services, 1965-2005). Mr. Mauriello currently serves as a member of the Board of Directors of XL Group plc. (global insurance and re-insurance, 2006-present) and of Arcadia Resources Inc. (health care services and products, 2007-present). Previously, Mr. Mauriello served as a Director of the Hamilton Funds of the Bank of New York (2006-2007). |
Cornelia M. Small (66) |
| Year of Election or Appointment: 2005 Ms. Small is a member of the Board of Directors of the Teagle Foundation (2009-present). Ms. Small is also a member of the Investment Committee, and Chair (2008-present) and a member of the Board of Trustees of Smith College. In addition, Ms. Small serves on the Investment Committee of the Berkshire Taconic Community Foundation (2008-present). Previously, Ms. Small served as Chairperson of the Investment Committee (2002-2008) of Smith College. In addition, Ms. Small served as Chief Investment Officer, Director of Global Equity Investments, and a member of the Board of Directors of Scudder, Stevens & Clark and Scudder Kemper Investments. |
William S. Stavropoulos (71) |
| Year of Election or Appointment: 2001 Mr. Stavropoulos is Vice Chairman of the Independent Trustees of the Equity and High Income Funds (2006-present). Mr. Stavropoulos serves as President and Founder of the Michigan Baseball Foundation, the Great Lakes Loons (2007-present). Mr. Stavropoulos is Chairman Emeritus of the Board of Directors of The Dow Chemical Company, where he previously served in numerous senior management positions, including President, CEO (1995-2000; 2002-2004), Chairman of the Executive Committee (2000-2006), and as a member of the Board of Directors (1990-2006). Currently, Mr. Stavropoulos is Chairman of Univar (global distributor of commodity and specialty chemicals, 2010-present), a Director of Teradata Corporation (data warehousing and technology solutions, 2008-present), Chemical Financial Corporation, Maersk Inc. (industrial conglomerate), Tyco International, Inc. (multinational manufacturing and services, 2007-present), and a member of the Advisory Board for Metalmark Capital (private equity investment, 2005-present). Mr. Stavropoulos is a special advisor to Clayton, Dubilier & Rice, Inc. (private equity investment). In addition, Mr. Stavropoulos is a member of the University of Notre Dame Advisory Council for the College of Science. |
David M. Thomas (61) |
| Year of Election or Appointment: 2008 Previously, Mr. Thomas served as Executive Chairman (2005-2006) and Chairman and Chief Executive Officer (2000-2005) of IMS Health, Inc. (pharmaceutical and healthcare information solutions). In addition, Mr. Thomas serves as a member of the Board of Directors of Fortune Brands, Inc. (consumer products), and Interpublic Group of Companies, Inc. (marketing communication, 2004-present). |
Michael E. Wiley (60) |
| Year of Election or Appointment: 2008 Mr. Wiley also serves as a Director of Asia Pacific Exploration Consolidated (international oil and gas exploration and production, 2008-present). Mr. Wiley serves as a Director of Tesoro Corporation (independent oil refiner and marketer, 2005-present), and a Director of Bill Barrett Corporation (exploration and production, 2005-present). In addition, Mr. Wiley also serves as a Director of Post Oak Bank (privately-held bank, 2004-present). Previously, Mr. Wiley served as a member of the Board of Trustees of the University of Tulsa (2000-2006; 2007-2010), as a Senior Energy Advisor of Katzenbach Partners, LLC (consulting, 2006-2007), as an Advisory Director of Riverstone Holdings (private investment), Chairman, President, and CEO of Baker Hughes, Inc. (oilfield services, 2000-2004), and as Director of Spinnaker Exploration Company (exploration and production, 2001-2005). |
+ The information above includes each Trustee's principal occupation during the last five years and other information relating to the experience, attributes, and skills relevant to each Trustee's qualifications to serve as a Trustee, which led to the conclusion that each Trustee should serve as a Trustee for the fund.
Advisory Board Member and Executive Officers:
Correspondence intended for each executive officer and Peter S. Lynch may be sent to Fidelity Investments, 82 Devonshire Street, Boston, Massachusetts 02109.
Name, Age; Principal Occupation |
Peter S. Lynch (66) |
| Year of Election or Appointment: 2003 Member of the Advisory Board of Fidelity's Equity and High Income Funds. Mr. Lynch is Vice Chairman and a Director of FMR and FMR Co., Inc. In addition, Mr. Lynch serves as a Trustee of Boston College and as the Chairman of the Inner-City Scholarship Fund. Previously, Mr. Lynch served on the Special Olympics International Board of Directors (1997-2006). |
Kenneth B. Robins (41) |
| Year of Election or Appointment: 2008 President and Treasurer of Fidelity's Equity and High Income Funds. Mr. Robins also serves as President and Treasurer (2010-present) and Assistant Treasurer (2009-present) of other Fidelity funds and is an employee of Fidelity Investments (2004-present). Previously, Mr. Robins served as Deputy Treasurer of the Fidelity funds (2005-2008) and Treasurer and Chief Financial Officer of The North Carolina Capital Management Trust: Cash and Term Portfolios (2006-2008). |
Bruce T. Herring (45) |
| Year of Election or Appointment: 2006 Vice President of certain Equity Funds. Mr. Herring also serves as Chief Investment Officer and Director of Fidelity Management & Research (U.K.) Inc. (2010-present) and Group Chief Investments Officer of FMR. Previously, Mr. Herring served as Vice President (2005-2006) and Senior Vice President (2006-2007) of Fidelity Management & Research Company, Vice President of FMR Co., Inc. (2001-2007) and as a portfolio manager for Fidelity U.S. Equity Funds. |
Brian B. Hogan (46) |
| Year of Election or Appointment: 2009 Vice President of certain Equity Funds and Vice President of Sector Funds. Mr. Hogan also serves as President of FMR's Equity Division (2009-present). Previously, Mr. Hogan served as Senior Vice President, Equity Research of FMR (2006-2009) and as a portfolio manager. |
Scott C. Goebel (42) |
| Year of Election or Appointment: 2008 Secretary and Chief Legal Officer (CLO) of the Fidelity funds. Mr. Goebel also serves as Secretary and CLO of The North Carolina Capital Management Trust: Cash and Term Portfolio (2008-present); General Counsel, Secretary, and Senior Vice President of FMR (2008-present) and FMR Co., Inc. (2008-present); Deputy General Counsel of FMR LLC; Chief Legal Officer of Fidelity Management & Research (Hong Kong) Limited (2008-present) and Assistant Secretary of Fidelity Management & Research (Japan) Inc. (2008-present), Fidelity Investments Money Management, Inc. (2008-present), Fidelity Management & Research (U.K.) Inc. (2008-present), and Fidelity Research and Analysis Company (2008-present). Previously, Mr. Goebel served as Assistant Secretary of the Funds (2007-2008) and as Vice President and Secretary of Fidelity Distributors Corporation (FDC) (2005-2007). |
William C. Coffey (41) |
| Year of Election or Appointment: 2009 Assistant Secretary of Fidelity's Equity and High Income Funds. Mr. Coffey also serves as Senior Vice President and Deputy General Counsel of FMR LLC (2010-present), and is an employee of Fidelity Investments. Previously, Mr. Coffey served as Vice President and Associate General Counsel of FMR LLC (2005-2009). |
Holly C. Laurent (56) |
| Year of Election or Appointment: 2008 Anti-Money Laundering (AML) Officer of the Fidelity funds. Ms. Laurent also serves as AML Officer of The North Carolina Capital Management Trust: Cash and Term Portfolio (2008-present) and is an employee of Fidelity Investments. Previously, Ms. Laurent was Senior Vice President and Head of Legal for Fidelity Business Services India Pvt. Ltd. (2006-2008), and Senior Vice President, Deputy General Counsel and Group Head for FMR LLC (2005-2006). |
Christine Reynolds (52) |
| Year of Election or Appointment: 2008 Chief Financial Officer of the Fidelity funds. Ms. Reynolds became President of Fidelity Pricing and Cash Management Services (FPCMS) in August 2008. Ms. Reynolds served as Chief Operating Officer of FPCMS (2007-2008). Previously, Ms. Reynolds served as President, Treasurer, and Anti-Money Laundering officer of the Fidelity funds (2004-2007). |
Kenneth A. Rathgeber (63) |
| Year of Election or Appointment: 2004 Chief Compliance Officer of Fidelity's Equity and High Income Funds. Mr. Rathgeber is Chief Compliance Officer of Fidelity Management & Research (Hong Kong) Limited (2008-present), Fidelity Management & Research (Japan) Inc. (2008-present), FMR (2005-present), FMR Co., Inc. (2005-present), Fidelity Management & Research (U.K.) Inc. (2005-present), Fidelity Research & Analysis Company (2005-present), Fidelity Investments Money Management, Inc. (2005-present), Pyramis Global Advisors, LLC (2005-present), and Strategic Advisers, Inc. (2005-present). |
Jeffrey S. Christian (49) |
| Year of Election or Appointment: 2009 Deputy Treasurer of the Fidelity funds. Mr. Christian is an employee of Fidelity Investments. Previously, Mr. Christian served as Chief Financial Officer (2008-2009) of certain Fidelity funds and Senior Vice President of Fidelity Pricing and Cash Management Services (FPCMS) (2004-2009). |
Bryan A. Mehrmann (49) |
| Year of Election or Appointment: 2005 Deputy Treasurer of the Fidelity funds. Mr. Mehrmann is an employee of Fidelity Investments. |
Adrien E. Deberghes (43) |
| Year of Election or Appointment: 2008 Deputy Treasurer of Fidelity's Equity and High Income Funds. Mr. Deberghes also serves as Assistant Treasurer of other Fidelity funds (2010-present) and is an employee of Fidelity Investments (2008-present). Previously, Mr. Deberghes served as Senior Vice President of Mutual Fund Administration at State Street Corporation (2007-2008), Senior Director of Mutual Fund Administration at Investors Bank & Trust (2005-2007), and Director of Finance for Dunkin' Brands (2000-2005). |
Stephanie J. Dorsey (41) |
| Year of Election or Appointment: 2010 Assistant Treasurer of Fidelity's Equity and High Income Funds. Ms. Dorsey also serves as Deputy Treasurer of other Fidelity funds (2008-present) and is an employee of Fidelity Investments (2008-present). Previously, Ms. Dorsey served as Treasurer (2004-2008) of the JPMorgan Mutual Funds and Vice President (2004-2008) of JPMorgan Chase Bank. |
John R. Hebble (52) |
| Year of Election or Appointment: 2009 Assistant Treasurer of Fidelity's Equity and High Income Funds. Mr. Hebble also serves as Treasurer and Chief Financial Officer of The North Carolina Capital Management Trust: Cash and Term Portfolio (2008-present), President and Treasurer of other Fidelity funds (2008-present) and is an employee of Fidelity Investments. |
Gary W. Ryan (52) |
| Year of Election or Appointment: 2005 Assistant Treasurer of the Fidelity funds. Mr. Ryan is an employee of Fidelity Investments. Previously, Mr. Ryan served as Vice President of Fund Reporting in Fidelity Pricing and Cash Management Services (FPCMS) (1999-2005). |
Jonathan Davis (42) |
| Year of Election or Appointment: 2010 Assistant Treasurer of the Fidelity funds. Mr. Davis is an employee of Fidelity Investments. Previously, Mr. Davis served as Vice President and Associate General Counsel of FMR LLC (2003-2010). |
Annual Report
The Board of Trustees of Advisor International Value Fund voted to pay to shareholders of record at the opening of business on record date, the following distributions per share derived from capital gains realized from sales of portfolio securities, and dividends derived from net investment income:
| Pay Date | Record Date | Dividends | Capital Gains |
Class A | 12/06/10 | 12/03/10 | $0.164 | $0.034 |
Class T | 12/06/10 | 12/03/10 | $0.146 | $0.034 |
Class B | 12/06/10 | 12/03/10 | $0.104 | $0.034 |
Class C | 12/06/10 | 12/03/10 | $0.108 | $0.034 |
Class A designates 87%, Class B designates 100%, Class C designates 100%, and Class T designates 100% of the dividend distributed during the fiscal year as amounts which may be taken into account as a dividend for purposes of the maximum rate under section 1(h)(11) of the Internal Revenue Code.
The amounts per share which represent income derived from sources within, and taxes paid to, foreign countries or possessions of the United States are as follows:
| Pay Date | Income | Taxes |
Class A | 12/07/09 | $0.122 | $0.012 |
Class T | 12/07/09 | $0.101 | $0.012 |
Class B | 12/07/09 | $0.075 | $0.012 |
Class C | 12/07/09 | $0.066 | $0.012 |
The fund will notify shareholders in January 2011 of amounts for use in preparing 2010 income tax returns.
Annual Report
Board Approval of Investment Advisory Contracts and Management Fees
Fidelity International Value Fund
Each year, the Board of Trustees, including the Independent Trustees (together, the Board), votes on the renewal of the management contract and sub-advisory agreements (together, the Advisory Contracts) for the fund. The Board, assisted by the advice of fund counsel and Independent Trustees' counsel, requests and considers a broad range of information relevant to the renewal of the Advisory Contracts throughout the year.
The Board meets regularly and considers at each of its meetings factors that are relevant to its annual consideration of the renewal of the fund's Advisory Contracts, including the services and support provided to the fund and its shareholders. The Board has established various standing committees, each composed of Independent Trustees with varying backgrounds, to which the Board has assigned specific subject matter responsibilities in order to enhance effective decision-making by the Board. The Board, acting directly and through its Committees, requests and receives information concerning the annual consideration of the renewal of the fund's Advisory Contracts. The Board also meets as needed to consider matters specifically related to the Board's annual consideration of the renewal of Advisory Contracts. Members of the Board may also meet with trustees of other Fidelity funds through ad hoc joint committees to discuss certain matters relevant to the Fidelity funds.
At its July 2010 meeting, the Board of Trustees, including the Independent Trustees, unanimously determined to renew the fund's Advisory Contracts. In reaching its determination, the Board considered all factors it believed relevant, including (i) the nature, extent, and quality of the services to be provided to the fund and its shareholders (including the investment performance of the fund); (ii) the competitiveness of the fund's management fee and total expenses; (iii) the total costs of the services to be provided by and the profits to be realized by Fidelity from its relationship with the fund; (iv) the extent to which economies of scale would be realized as the fund grows; and (v) whether fee levels reflect these economies of scale, if any, for the benefit of fund shareholders.
In considering whether to renew the Advisory Contracts for the fund, the Board reached a determination, with the assistance of fund counsel and Independent Trustees' counsel and through the exercise of its business judgment, that the renewal of the Advisory Contracts is in the best interests of fund shareholders and that the compensation to be received by Fidelity under the management contract is fair and reasonable. The Board's decision to renew the Advisory Contracts was not based on any single factor noted above, but rather was based on a comprehensive consideration of all the information provided to the Board at its meetings throughout the year. The Board, in reaching its determination to renew the Advisory Contracts, is aware that shareholders in the fund have a broad range of investment choices available to them, including a wide choice among mutual funds offered by Fidelity's competitors, and that the fund's shareholders, with the opportunity to review and weigh the disclosure provided by the fund in its prospectus and other public disclosures, have chosen to invest in this fund, managed by Fidelity.
Annual Report
Nature, Extent, and Quality of Services Provided. The Board considered the staffing within the investment adviser, FMR, and the sub-advisers (together, the Investment Advisers), including the backgrounds of the fund's investment personnel and the fund's investment objective and discipline. The Independent Trustees also had discussions with senior management of Fidelity's investment operations and investment groups. The Board considered the structure of the portfolio manager compensation program and whether this structure provides appropriate incentives to act in the best interest of the fund.
Resources Dedicated to Investment Management and Support Services. The Board and the equity research subcommittee of the Board's Fund Oversight Committee reviewed the size, education, and experience of the Investment Advisers' investment staff, their use of technology, and the Investment Advisers' approach to recruiting, training, and retaining portfolio managers and other research, advisory, and management personnel. The Board noted that Fidelity's analysts have access to a variety of technological tools and market and securities data that enable them to perform both fundamental and quantitative analysis and to specialize in various disciplines. The Board considered Fidelity's extensive global research capabilities that enable the Investment Advisers to aggregate data from various sources in an effort to produce positive investment results. The Board also considered that Fidelity's portfolio managers and analysts have access to daily portfolio attribution that allows for monitoring of a fund's portfolio, as well as an electronic communication system that provides immediate real-time access to research concerning issuers and credit enhancers. The Board noted FMR's continued focus on strengthening the organization and discipline of equity portfolio management and research.
Shareholder and Administrative Services. The Board considered (i) the nature, extent, quality, and cost of advisory, administrative, and shareholder services performed by the Investment Advisers and their affiliates under the Advisory Contracts and under separate agreements covering transfer agency, pricing and bookkeeping, and securities lending services for the fund; (ii) the nature and extent of the investment adviser's supervision of third party service providers, principally custodians and subcustodians; and (iii) the resources devoted to, and the record of compliance with, the fund's compliance policies and procedures. The Board also reviewed the allocation of fund brokerage, including allocations to brokers affiliated with the Investment Advisers, the use of brokerage commissions to pay fund expenses, and the use of "soft" commission dollars to pay for research services.
The Board noted that the growth of fund assets over time across the complex allows Fidelity to reinvest in the development of services designed to enhance the value or convenience of the Fidelity funds as investment vehicles. These services include 24-hour access to account information and market information through phone representatives and over the Internet, and investor education materials and asset allocation tools.
Annual Report
Board Approval of Investment Advisory Contracts and
Management Fees - continued
Investment in a Large Fund Family. The Board considered the benefits to shareholders of investing in a Fidelity fund, including the benefits of investing in a fund that is part of a large family of funds offering a variety of investment disciplines and providing a large variety of mutual fund investor services. The Board noted that Fidelity had taken, or had made recommendations that resulted in the Fidelity funds taking, a number of actions over the previous year that benefited particular funds, including (i) dedicating additional resources to investment research and restructuring and broadening the focus of the investment research teams; (ii) bolstering the senior management team that oversees asset management; (iii) launching Class F of certain funds as a lower-fee class available to Freedom K and Freedom Index Funds; (iv) lowering the initial investment minimums and ongoing balance requirements for Real Estate High Income Fund; (v) eliminating subsequent purchase minimums for all funds and adding a waiver of the investment minimum requirement for new accounts opened with the proceeds of a systematic withdrawal plan; (vi) eliminating the withdrawal minimum and maximum limits for systematic withdrawals from Advisor funds; (vii) expanding sales load waivers on Class A shares for Destiny Planholders and expanding Institutional Class eligibility for Class O Destiny Planholders; and (viii) changing certain Class A and Class T sales charge structures to further align them with industry practices.
Investment Performance. The Board considered whether the fund has operated in accordance with its investment objective, as well as its record of compliance with its investment restrictions. It also reviewed the fund's absolute investment performance for each class, as well as the fund's relative investment performance for each class measured over multiple periods against (i) a broad-based securities market index, and (ii) a custom peer group of mutual funds deemed appropriate by Fidelity and reviewed by the Board. Because the fund had been in existence less than five calendar years, the following charts considered by the Board show, over the one- and three-year periods ended December 31, 2009, the cumulative total returns of Institutional Class (Class I) and Class B of the fund, the cumulative total returns of a broad-based securities market index ("benchmark"), and a range of cumulative total returns of a custom peer group of mutual funds defined by FMR based on categories assigned by Morningstar, Inc. The returns of Institutional Class (Class I) and Class B show the performance of the highest and lowest performing classes, respectively (based on three-year performance). The box within each chart shows the 25th percentile return (bottom of box) and the 75th percentile return (top of box) of the peer group. Returns shown above the box are in the first quartile and returns shown below the box are in the fourth quartile. The percentage beaten numbers noted below each chart correspond to the percentile box and represent the percentage of funds in the peer group whose performance was equal to or lower than that of the class indicated. The fund's custom peer group, defined by FMR, is a peer group that FMR believes provides a more meaningful performance comparison than the peer group assigned by Morningstar, Inc., which assigns mutual funds to categories based on their investment styles as measured by their underlying portfolio holdings.
Annual Report
Fidelity International Value Fund

The Board reviewed the fund's relative investment performance against its peer group and noted that the performance of Institutional Class (Class I) of the fund was in the second quartile for the one-year period and the third quartile for the three-year period. The Board also noted that the investment performance of Institutional Class (Class I) of the fund compared favorably to its benchmark for the one-year period, although the fund's three-year cumulative total return was lower than its benchmark. The Board considered that the variations in performance among the fund's classes reflect the variations in class expenses, which result in lower performance for higher expense classes. The Board also reviewed the fund's performance since inception as well as performance in the current year.
The Board also considered that the fund's management fee is subject to upward or downward adjustment depending upon whether, and to what extent, the fund's investment performance for the performance period exceeds, or is exceeded by, the record (over the same period) of a Board-approved performance adjustment index. The Board realizes that the performance adjustment provides FMR with a strong economic incentive to seek to achieve superior performance for the fund's shareholders and helps to more closely align the interests of FMR and the fund's shareholders.
Annual Report
Board Approval of Investment Advisory Contracts and
Management Fees - continued
Based on its review, and giving particular weight to the nature and quality of the resources dedicated by the Investment Advisers to maintain and improve relative performance and factoring in the unprecedented market events in recent years, the Board concluded that the nature, extent, and quality of investment management and support services and of shareholder and administrative services provided to the fund will benefit the fund's shareholders, particularly in light of the Board's view that the fund's shareholders benefit from investing in a fund that is part of a large family of funds offering a variety of investment disciplines and services.
Competitiveness of Management Fee and Total Fund Expenses. The Board considered the fund's management fee and total expenses compared to "mapped groups" of competitive funds and classes. Fidelity creates "mapped groups" by combining similar Lipper investment objective categories that have comparable management fee characteristics. Combining Lipper investment objective categories aids the Board's management fee and total expense comparisons by broadening the competitive group used for comparison and by reducing the number of universes to which various Fidelity funds are compared.
Management Fee. The Board considered two proprietary management fee comparisons for the 12-month (or shorter) periods shown in the chart below. The group of Lipper funds used by the Board for management fee comparisons is referred to below as the "Total Mapped Group." The Total Mapped Group comparison focuses on a fund's standing relative to the total universe of comparable funds available to investors, in terms of gross management fees before expense reimbursements or caps, and without giving effect to the fund's performance adjustment. "TMG %" represents the percentage of funds in the Total Mapped Group that had management fees that were lower than the fund's. For example, a TMG % of 15% means that 85% of the funds in the Total Mapped Group had higher management fees than the fund. The "Asset-Size Peer Group" (ASPG) comparison focuses on a fund's standing relative to non-Fidelity funds similar in size to the fund within the Total Mapped Group. The ASPG represents at least 15% of the funds in the Total Mapped Group with comparable asset size and management fee characteristics, subject to a minimum of 50 funds (or all funds in the Total Mapped Group if fewer than 50). Additional information, such as the ASPG quartile in which the fund's management fee ranked and the impact of the fund's performance adjustment, is also included in the chart and considered by the Board.
Annual Report
Fidelity International Value Fund

The Board noted that the fund's management fee ranked below the median of its Total Mapped Group and below the median of its ASPG for 2009. The Board also noted the effect of the fund's negative performance adjustment on the fund's management fee ranking. The Board noted that the performance adjustment for each year represents calculations for performance periods that differ from the periods shown in the performance charts above.
Based on its review, the Board concluded that the fund's management fee is fair and reasonable in light of the services that the fund receives and the other factors considered.
Total Expenses. In its review of each class's total expenses, the Board considered the fund's management fee as well as other fund or class expenses, as applicable, such as transfer agent fees, pricing and bookkeeping fees, fund-paid 12b-1 fees, and custodial, legal, and audit fees. The Board also noted the effects of any waivers and reimbursements on fees and expenses, as well as the impact of the fund's performance adjustment. As part of its review, the Board also considered current and historical total expenses of each class of the fund compared to competitive fund median expenses. Each class of the fund is compared to those funds and classes in the Total Mapped Group (used by the Board for management fee comparisons) that have a similar sales load structure.
The Board noted that the total expenses of each of Class A, Class B, Class C, Institutional Class, and the retail class ranked below its competitive median for 2009 and the total expenses of Class T ranked above its competitive median for 2009. The Board considered that the total expenses for Class T were above the median primarily because its 12b-1 fee is higher than the typical front-end load class. The Board noted that the fund offers multiple classes, each of which has a different sales load and 12b-1 fee structure, and that the multiple structures are intended to offer a range of pricing options for the intermediary market. The Board also noted that the total expenses of the classes vary primarily by the level of their 12b-1 fees, although differences in transfer agent fees may also cause expenses to vary from class to class.
Annual Report
Board Approval of Investment Advisory Contracts and
Management Fees - continued
Fees Charged to Other Fidelity Clients. The Board also considered Fidelity fee structures and other information with respect to clients of FMR and its affiliates, such as other mutual funds advised or subadvised by FMR or its affiliates, pension plan clients, and other institutional clients. In March 2010, the Board created an ad hoc joint committee with the board of other Fidelity funds (the Committee) to review and compare Fidelity's institutional investment advisory business with its business of providing services to the Fidelity funds, including the differences in services provided, fees charged, and costs incurred, as well as competition in their respective marketplaces.
Based on its review of total expenses and fees charged to other Fidelity clients, the Board concluded that the total expenses of each class of the fund were reasonable, although in one case above the median of the universe presented for comparison, in light of the services that the fund and its shareholders receive and the other factors considered, including the findings of the Committee.
Costs of the Services and Profitability. The Board considered the revenues earned and the expenses incurred by Fidelity in conducting the business of developing, marketing, distributing, managing, administering and servicing the fund and its shareholders. The Board also considered the level of Fidelity's profits in respect of all the Fidelity funds.
On an annual basis, FMR presents to the Board Fidelity's profitability for the fund. Fidelity calculates the profitability for each fund, as well as aggregate profitability for groups of Fidelity funds and all Fidelity funds, using a series of detailed revenue and cost allocation methodologies which originate with the audited books and records of Fidelity. The Audit Committee of the Board reviews any significant changes from the prior year's methodologies.
PricewaterhouseCoopers LLP (PwC), independent registered public accounting firm and auditor to Fidelity and certain Fidelity funds, has been engaged annually by the Board as part of the Board's assessment of Fidelity's profitability analysis. PwC's engagement includes the review and assessment of Fidelity's methodologies used in determining the revenues and expenses attributable to Fidelity's mutual fund business, and completion of agreed-upon procedures surrounding the mathematical accuracy of fund profitability and its conformity to allocation methodologies. After considering PwC's reports issued under the engagement and information provided by Fidelity, the Board believes that while other allocation methods may also be reasonable, Fidelity's profitability methodologies are reasonable in all material respects.
Annual Report
The Board has also reviewed Fidelity's non-fund businesses and fall-out benefits related to the mutual fund business as well as cases where Fidelity's affiliates may benefit from or be related to the fund's business.
The Board considered the costs of the services provided by and the profits realized by Fidelity in connection with the operation of the fund and were satisfied that the profitability was not excessive in the circumstances.
Economies of Scale. The Board considered whether there have been economies of scale in respect of the management of the Fidelity funds, whether the Fidelity funds (including the fund) have appropriately benefited from any such economies of scale, and whether there is potential for realization of any further economies of scale. The Board considered the extent to which the fund will benefit from economies of scale through increased services to the fund, through waivers or reimbursements, or through fee or expense reductions.
In February 2009, the Board and the board of other Fidelity funds created an ad hoc committee (the Economies of Scale Committee) to analyze whether FMR attains economies of scale in respect of the management and servicing of the Fidelity funds, whether the Fidelity funds have appropriately benefited from such economies of scale, and whether there is potential for realization of any further economies of scale.
The Board recognized that the fund's management contract incorporates a "group fee" structure, which provides for lower group fee rates as total fund assets under FMR's management increase, and for higher group fee rates as total fund assets under FMR's management decrease. FMR calculates the group fee rates based on a tiered asset "breakpoint" schedule that varies based on asset class. The Board considered that the group fee is designed to deliver the benefits of economies of scale to fund shareholders when total Fidelity fund assets increase, even if assets of any particular fund are unchanged or have declined, because some portion of Fidelity's costs are attributable to services provided to all Fidelity funds, and all funds benefit if those costs can be allocated among more assets. The Board concluded that, given the group fee structure, fund shareholders will benefit from lower management fees as assets under FMR's management increase at the fund complex level, regardless of whether Fidelity achieves any such economies of scale.
The Board concluded, considering the findings of the Economies of Scale Committee, that any potential economies of scale are being appropriately shared between fund shareholders and Fidelity.
Additional Information Requested by the Board. In order to develop fully the factual basis for consideration of the Fidelity funds' Advisory Contracts, the Board requested and received additional information on certain topics, including (i) fund performance trends, actions to be taken by FMR to improve certain funds' overall performance, and Fidelity's long-term strategies for certain funds; (ii) portfolio manager changes that have occurred during the past year and length of portfolio manager tenure for different categories of funds over time; (iii) Fidelity's compensation structure for portfolio managers, research analysts, and other key personnel, the rationale for the compensation structure, and how the compensation structure provides appropriate performance incentives; (iv) the amount of the investment that each portfolio manager has made in the Fidelity fund(s) that he or she manages; (v) management and other fees paid by FMR to affiliated sub-advisers on behalf of the Fidelity funds; (vi) Fidelity's fee structures and rationale for recommending different fees among different categories of funds; (vii) Fidelity's rationale for recommending which funds should have a performance adjustment component as part of their management fees; (viii) the rationale for any differences between fund fee structures and fee structures in place for other Fidelity clients; and (ix) explanations regarding the relative total expenses borne by certain funds and classes, total expense competitive trends, and actions that might be taken by FMR to reduce total expenses for certain funds and classes.
Annual Report
Board Approval of Investment Advisory Contracts and
Management Fees - continued
Based on its evaluation of all of the conclusions noted above, and after considering all factors it believed relevant, the Board ultimately concluded that the advisory fee structures are fair and reasonable, and that the fund's Advisory Contracts should be renewed.
Annual Report
Investment Adviser
Fidelity Management & Research Company
Boston, MA
Investment Sub-Advisers
FMR Co., Inc.
Fidelity Management & Research
(U.K.) Inc.
Fidelity Management & Research
(Hong Kong) Limited
Fidelity Management & Research
(Japan) Inc.
Fidelity Research & Analysis Company
FIL Investment Advisors
FIL Investments (Japan) Limited
FIL Investment Advisors (U.K.) Ltd.
General Distributor
Fidelity Distributors Corporation
Boston, MA
Transfer and Service Agents
Fidelity Investments Institutional Operations Company, Inc.
Boston, MA
Fidelity Service Company, Inc.
Boston, MA
Custodian
The Northern Trust Company
Chicago, IL
AFIV-UANN-1210
1.827496.104
(Fidelity Investment logo)(registered trademark)
Fidelity AdvisorSM
International Value
Fund - Institutional Class
Annual Report
October 31, 2010
Institutional Class is
a class of Fidelity®
International Value Fund
(2_fidelity_logos) (Registered_Trademark)
Contents
Chairman's Message | <Click Here> | The Chairman's message to shareholders. |
Performance | <Click Here> | How the fund has done over time. |
Management's Discussion of Fund Performance | <Click Here> | The Portfolio Manager's review of fund performance and strategy. |
Shareholder Expense Example | <Click Here> | An example of shareholder expenses. |
Investment Changes | <Click Here> | A summary of major shifts in the fund's investments over the past six months. |
Investments | <Click Here> | A complete list of the fund's investments with their market values. |
Financial Statements | <Click Here> | Statements of assets and liabilities, operations, and changes in net assets, as well as financial highlights. |
Notes | <Click Here> | Notes to financial statements. |
Report of Independent Registered Public Accounting Firm | <Click Here> | |
Trustees and Officers | <Click Here> | |
Distributions | <Click Here> | |
Board Approval of Investment Advisory Contracts and Management Fees | <Click Here> | |
To view a fund's proxy voting guidelines and proxy voting record for the 12-month period ended June 30, visit http://www.fidelity.com/proxyvotingresults or visit the Securities and Exchange Commission's (SEC) web site at http://www.sec.gov. You may also call 1-877-208-0098 to request a free copy of the proxy voting guidelines.
Standard & Poor's, S&P and S&P 500 are registered service marks of The McGraw-Hill Companies, Inc. and have been licensed for use by Fidelity Distributors Corporation.
Other third party marks appearing herein are the property of their respective owners.
All other marks appearing herein are registered or unregistered trademarks or service marks of FMR LLC or an affiliated company.
Annual Report
This report and the financial statements contained herein are submitted for the general information of the shareholders of the fund. This report is not authorized for distribution to prospective investors in the fund unless preceded or accompanied by an effective prospectus.
A fund files its complete schedule of portfolio holdings with the SEC for the first and third quarters of each fiscal year on Form N-Q. Forms N-Q are available on the SEC's web site at http://www.sec.gov. A fund's Forms N-Q may be reviewed and copied at the SEC's Public Reference Room in Washington, DC. Information regarding the operation of the SEC's Public Reference Room may be obtained by calling 1-800-SEC-0330. For a complete list of a fund's portfolio holdings, view the most recent holdings listing, semiannual report, or annual report on Fidelity's web site at http://www.fidelity.com or http://www.advisor.fidelity.com, as applicable.
NOT FDIC INSURED • MAY LOSE VALUE • NO BANK GUARANTEE
Neither the fund nor Fidelity Distributors Corporation is a bank.
Annual Report
(photo_of_Edward_C_Johnson_3d)
Dear Shareholder:
Equities have staged a rally in the second half of 2010, shaking off concerns about the European debt crisis and the possibility of a double-dip recession in the U.S. Although the short-term surge pushed major equity indexes back into positive territory for the year, several questions remain about the longer-term outlook, including lackluster economic growth and persistently high unemployment. Financial markets are always unpredictable, of course, but there also are several time-tested investment principles that can help put the odds in your favor.
One of the basic tenets is to invest for the long term. Over time, riding out the markets' inevitable ups and downs has proven much more effective than selling into panic or chasing the hottest trend. Even missing only a few of the markets' best days can significantly diminish investor returns. Patience also affords the benefits of compounding - of earning interest on additional income or reinvested dividends and capital gains. There can be tax advantages and cost benefits to consider as well. While staying the course doesn't eliminate risk, it can considerably lessen the effect of short-term declines.
You can further manage your investing risk through diversification. And today, more than ever, geographic diversification should be taken into account. Studies indicate that asset allocation is the single most important determinant of a portfolio's long-term success. The right mix of stocks, bonds and cash - aligned to your particular risk tolerance and investment objective - is very important. Age-appropriate rebalancing is also an essential aspect of asset allocation. For younger investors, an emphasis on equities - which historically have been the best-performing asset class over time - is encouraged. As investors near their specific goal, such as retirement or sending a child to college, consideration may be given to replacing volatile assets (e.g. common stocks) with more-stable fixed investments (bonds or savings plans).
A third principle - investing regularly - can help lower the average cost of your purchases. Investing a certain amount of money each month or quarter helps ensure you won't pay for all your shares at market highs. This strategy - known as dollar cost averaging - also reduces "emotion" from investing, helping shareholders avoid selling weak performers just prior to an upswing, or chasing a hot performer just before a correction.
We invite you to contact us via the Internet, through our Investor Centers or by phone. It is our privilege to provide you the information you need to make the investments that are right for you.
Sincerely,
(The chairman's signature appears here.)
Edward C. Johnson 3d
Annual Report
Average annual total return reflects the change in the value of an investment, assuming reinvestment of the class' distributions from dividend income and capital gains (the profits earned upon the sale of securities that have grown in value, if any) and assuming a constant rate of performance each year. The $10,000 table and the fund's returns do not reflect the deduction of taxes that a shareholder would pay on fund distributions or the redemption of fund shares. During periods of reimbursement by Fidelity, a fund's total return will be greater than it would be had the reimbursement not occurred. How a fund did yesterday is no guarantee of how it will do tomorrow.
Average Annual Total Returns
Periods ended October 31, 2010 | Past 1
year | Life of
classA |
Institutional Class | 8.05% | -1.83% |
A From May 18, 2006.
$10,000 Over Life of Fund
Let's say hypothetically that $10,000 was invested in Fidelity Advisor International Value Fund - Institutional Class on May 18, 2006, when the fund started. The chart shows how the value of your investment would have changed, and also shows how the MSCI® EAFE® (Europe, Australasia, Far East) Value Index performed over the same period.
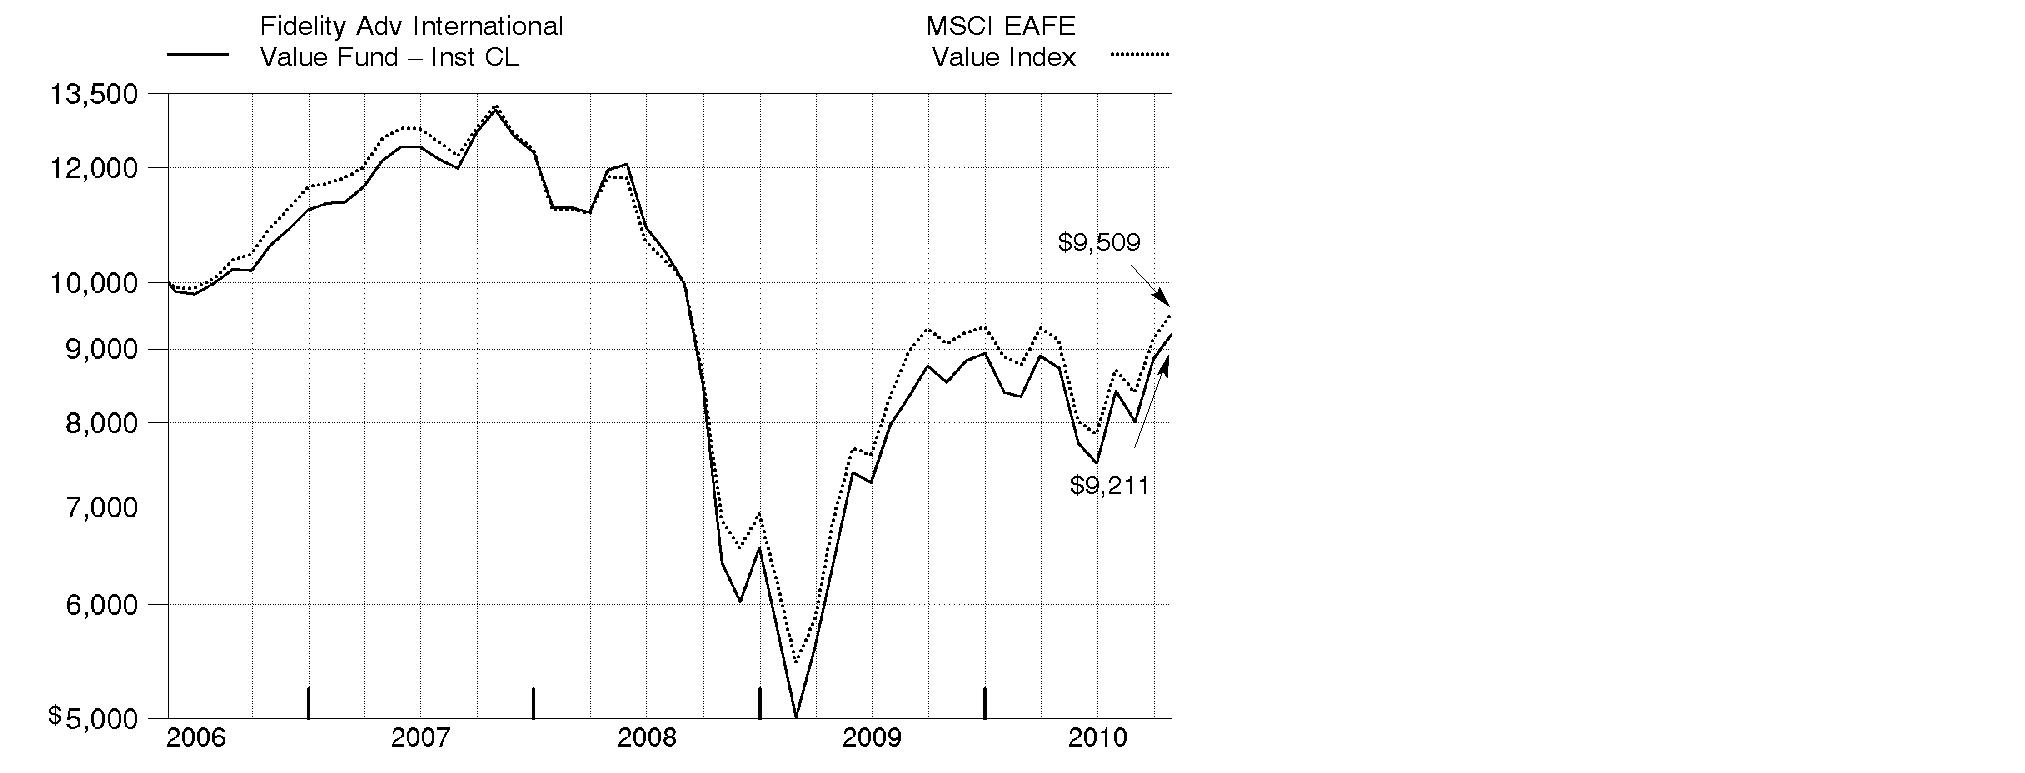
Annual Report
Market Recap: International stocks rode a wave of volatility similar to that of their U.S. counterparts during the 12 months ending October 31, 2010. Stocks gained modestly in the first half of the period, despite growing concerns about the European debt crisis. Sentiment turned decidedly negative in May and June, however, and the market suffered a precipitous decline. These losses were more than offset during the last four months of the period, when signs of economic growth and subsiding debt fears helped propel international stocks about 21%. For the full year, the MSCI® ACWI® (All Country World Index) ex USA Index gained 12.76%, boosted in part by a generally depreciating U.S. dollar. Within the index, Canada and emerging markets were standouts, returning 23% and 24%, respectively. Results in the latter group were led by strong-performing India, Mexico and South Africa, while China fell short of the MSCI benchmark due to cooling economic growth. The developed Asia ex Japan segment rose 16% for the period, lifted by solid results from Singapore and Hong Kong. Meanwhile, Europe rose just 9%, held back mainly by debt-riddled Spain and Italy, as well as lagging major constituent France. Japan returned only 5%, a result of that nation's continued weak economy.
Comments from George Stairs, Portfolio Manager of Fidelity AdvisorSM International Value Fund: For the year, the fund's Institutional Class shares rose 8.05%, outpacing the 4.79% return of the MSCI EAFE® (Europe, Australasia, Far East) Value Index. The fund benefited from stock selection in financials, consumer discretionary and energy. Within financials, my picks in banks were particularly helpful, especially Canada's Toronto-Dominion Bank and underweighting Spain's Banco Santander. In contrast, the fund was hurt by positioning in the capital goods industry within the industrials sector, as well as in telecommunication services. In country terms, security selection in Japan and a number of emerging markets worked out very well. European results were mixed. Stock picking was very good in the U.K. and, to a lesser extent, Norway, but disappointing in Denmark, France, Switzerland and Germany. Underweighting Japan and overweighting Hong Kong aided results. In the U.K., a position in mining company Rio Tinto and an underweighting in energy producer BP helped, as did Norwegian and Bermudan oil driller Seadrill. The fund's biggest individual detractors included Vestas Wind Systems, a Danish wind turbine manufacturer; French insurance company AXA; and Spanish telecom company Telefonica. Several of the names mentioned were not in the index.
The views expressed above reflect those of the portfolio manager(s) only through the end of the period as stated on the cover of this report and do not necessarily represent the views of Fidelity or any other person in the Fidelity organization. Any such views are subject to change at any time based upon market or other conditions and Fidelity disclaims any responsibility to update such views. These views may not be relied on as investment advice and, because investment decisions for a Fidelity fund are based on numerous factors, may not be relied on as an indication of trading intent on behalf of any Fidelity fund.
Annual Report
Shareholder Expense Example
As a shareholder of the Fund, you incur two types of costs: (1) transaction costs, including sales charges (loads) on purchase payments or redemption proceeds, redemption fees, and (2) ongoing costs, including management fees, distribution and/or service (12b-1) fees and other Fund expenses. This Example is intended to help you understand your ongoing costs (in dollars) of investing in the Fund and to compare these costs with the ongoing costs of investing in other mutual funds.
The Example is based on an investment of $1,000 invested at the beginning of the period and held for the entire period (May 1, 2010 to October 31, 2010).
Actual Expenses
The first line of the accompanying table for each class of the Fund provides information about actual account values and actual expenses. You may use the information in this line, together with the amount you invested, to estimate the expenses that you paid over the period. Simply divide your account value by $1,000.00 (for example, an $8,600 account value divided by $1,000.00 = 8.6), then multiply the result by the number in the first line for a class of the Fund under the heading entitled "Expenses Paid During Period" to estimate the expenses you paid on your account during this period. A small balance maintenance fee of $12.00 that is charged once a year may apply for certain accounts with a value of less than $2,000. This fee is not included in the table below. If it was, the estimate of expenses you paid during the period would be higher, and your ending account value lower, by this amount. In addition, the Fund, as a shareholder in the underlying Fidelity Central Funds, will indirectly bear its pro-rata share of the fees and expenses incurred by the underlying Fidelity Central Funds. These fees and expenses are not included in the Fund's annualized expense ratio used to calculate the expense estimate in the table below.
Hypothetical Example for Comparison Purposes
The second line of the accompanying table for each class of the Fund provides information about hypothetical account values and hypothetical expenses based on a Class' actual expense ratio and an assumed rate of return of 5% per year before expenses, which is not the Class' actual return. The hypothetical account values and expenses may not be used to estimate the actual ending account balance or expenses you paid for the period. You may use this information to compare the ongoing costs of investing in the Fund and other funds. To do so, compare this 5% hypothetical example with the 5% hypothetical examples that appear in the shareholder reports of the other funds. A small balance maintenance fee of $12.00 that is charged once a year may apply for certain accounts with a value of less than $2,000. This fee is not included in the table below. If it was, the estimate of expenses you paid during the period would be higher, and your ending account value lower, by this amount. In addition, the Fund, as a shareholder in the underlying Fidelity Central Funds, will indirectly bear its pro-rata share of the fees and expenses incurred by the underlying Fidelity Central Funds. These fees and expenses are not included in the Fund's annualized expense ratio used to calculate the expense estimate in the table below.
Annual Report
Shareholder Expense Example - continued
Please note that the expenses shown in the table are meant to highlight your ongoing costs only and do not reflect any transaction costs. Therefore, the second line of the table is useful in comparing ongoing costs only, and will not help you determine the relative total costs of owning different funds. In addition, if these transactional costs were included, your costs would have been higher.
|
Annualized
Expense Ratio
|
Beginning
Account Value
May 1, 2010
|
Ending
Account Value
October 31, 2010
| Expenses Paid
During Period*
May 1, 2010 to
October 31, 2010 |
Class A | 1.39% | | | |
Actual | | $ 1,000.00 | $ 1,053.80 | $ 7.20 |
Hypothetical A | | $ 1,000.00 | $ 1,018.20 | $ 7.07 |
Class T | 1.66% | | | |
Actual | | $ 1,000.00 | $ 1,052.60 | $ 8.59 |
Hypothetical A | | $ 1,000.00 | $ 1,016.84 | $ 8.44 |
Class B | 2.15% | | | |
Actual | | $ 1,000.00 | $ 1,049.90 | $ 11.11 |
Hypothetical A | | $ 1,000.00 | $ 1,014.37 | $ 10.92 |
Class C | 2.14% | | | |
Actual | | $ 1,000.00 | $ 1,049.90 | $ 11.06 |
Hypothetical A | | $ 1,000.00 | $ 1,014.42 | $ 10.87 |
International Value | 1.09% | | | |
Actual | | $ 1,000.00 | $ 1,056.50 | $ 5.65 |
Hypothetical A | | $ 1,000.00 | $ 1,019.71 | $ 5.55 |
Institutional Class | .99% | | | |
Actual | | $ 1,000.00 | $ 1,055.10 | $ 5.13 |
Hypothetical A | | $ 1,000.00 | $ 1,020.21 | $ 5.04 |
A 5% return per year before expenses
* Expenses are equal to each Class' annualized expense ratio, multiplied by the average account value over the period, multiplied by 184/365 (to reflect the one-half year period).
Annual Report
Investment Changes (Unaudited)
Geographic Diversification (% of fund's net assets) |
As of October 31, 2010 |
| United Kingdom 18.9% | |
| Japan 18.3% | |
| France 10.7% | |
| Germany 6.9% | |
| Spain 6.6% | |
| Switzerland 4.6% | |
| Hong Kong 4.2% | |
| Netherlands 3.9% | |
| Italy 3.1% | |
| Other 22.8% | |

Percentages are adjusted for the effect of futures contracts, if applicable. |
As of April 30, 2010 |
| Japan 19.2% | |
| United Kingdom 18.1% | |
| France 11.5% | |
| Germany 6.8% | |
| Switzerland 4.8% | |
| Hong Kong 4.3% | |
| Spain 3.7% | |
| Italy 3.4% | |
| Australia 3.2% | |
| Other 25.0% | |

Percentages are adjusted for the effect of futures contracts, if applicable. |
Asset Allocation |
| % of fund's
net assets | % of fund's net assets
6 months ago |
Stocks | 99.0 | 98.6 |
Short-Term Investments and Net Other Assets | 1.0 | 1.4 |
Top Ten Stocks as of October 31, 2010 |
| % of fund's
net assets | % of fund's net assets
6 months ago |
Royal Dutch Shell PLC Class A sponsored ADR (United Kingdom, Oil, Gas & Consumable Fuels) | 3.8 | 3.8 |
HSBC Holdings PLC (United Kingdom, Commercial Banks) | 2.9 | 2.1 |
Mitsui & Co. Ltd. (Japan, Trading Companies & Distributors) | 2.1 | 2.1 |
Vodafone Group PLC sponsored ADR (United Kingdom, Wireless Telecommunication Services) | 2.0 | 1.9 |
BP PLC sponsored ADR (United Kingdom, Oil, Gas & Consumable Fuels) | 2.0 | 1.4 |
Roche Holding AG (participation certificate) (Switzerland, Pharmaceuticals) | 2.0 | 2.4 |
AXA SA sponsored ADR (France, Insurance) | 2.0 | 2.1 |
Banco Santander SA (Spain, Commercial Banks) | 2.0 | 1.9 |
Zurich Financial Services AG (Switzerland, Insurance) | 1.8 | 1.6 |
ING Groep NV (Netherlands, Diversified Financial Services) | 1.8 | 1.0 |
| 22.4 | |
Market Sectors as of October 31, 2010 |
| % of fund's
net assets | % of fund's net assets
6 months ago |
Financials | 38.4 | 36.6 |
Energy | 11.1 | 11.5 |
Consumer Discretionary | 10.8 | 10.9 |
Industrials | 8.2 | 8.4 |
Materials | 6.7 | 7.0 |
Utilities | 6.3 | 7.2 |
Telecommunication Services | 6.2 | 5.6 |
Information Technology | 4.7 | 4.6 |
Health Care | 4.4 | 4.6 |
Consumer Staples | 2.2 | 2.2 |
Annual Report
Investments October 31, 2010
Showing Percentage of Net Assets
Common Stocks - 98.0% |
| Shares | | Value |
Australia - 2.5% |
Commonwealth Bank of Australia | 9,042 | | $ 433,156 |
Macquarie Group Ltd. | 49,337 | | 1,749,654 |
Wesfarmers Ltd. | 19,149 | | 621,684 |
Westfield Group unit | 127,286 | | 1,543,733 |
TOTAL AUSTRALIA | | 4,348,227 |
Bailiwick of Jersey - 1.4% |
Informa PLC | 102,820 | | 718,236 |
United Business Media Ltd. | 101,800 | | 1,073,191 |
WPP PLC | 54,427 | | 632,412 |
TOTAL BAILIWICK OF JERSEY | | 2,423,839 |
Bermuda - 1.0% |
Seadrill Ltd. (d) | 43,600 | | 1,320,062 |
VimpelCom Ltd. ADR (a) | 30,100 | | 461,433 |
TOTAL BERMUDA | | 1,781,495 |
Brazil - 1.9% |
Banco do Brasil SA | 53,138 | | 1,033,898 |
Banco Santander (Brasil) SA ADR | 45,900 | | 660,960 |
Cyrela Brazil Realty SA | 35,700 | | 493,152 |
Itau Unibanco Banco Multiplo SA ADR | 12,933 | | 317,634 |
Vivo Participacoes SA sponsored ADR | 30,200 | | 864,928 |
TOTAL BRAZIL | | 3,370,572 |
Canada - 2.4% |
Open Text Corp. (a) | 8,000 | | 353,917 |
Petrobank Energy & Resources Ltd. (a) | 20,700 | | 823,819 |
Power Corp. of Canada (sub. vtg.) (d) | 20,500 | | 572,046 |
Suncor Energy, Inc. | 24,900 | | 797,855 |
Toronto-Dominion Bank | 22,800 | | 1,641,985 |
TOTAL CANADA | | 4,189,622 |
Cayman Islands - 0.6% |
China High Speed Transmission Equipment Group Co. Ltd. | 179,000 | | 365,794 |
Hengdeli Holdings Ltd. | 1,240,000 | | 687,889 |
TOTAL CAYMAN ISLANDS | | 1,053,683 |
China - 1.2% |
China Merchants Bank Co. Ltd. (H Shares) | 325,572 | | 924,055 |
Common Stocks - continued |
| Shares | | Value |
China - continued |
Industrial & Commercial Bank of China Ltd. (H Shares) | 983,000 | | $ 791,346 |
Nine Dragons Paper (Holdings) Ltd. | 251,000 | | 404,773 |
TOTAL CHINA | | 2,120,174 |
Denmark - 1.0% |
Novo Nordisk AS Series B | 6,704 | | 703,801 |
Vestas Wind Systems AS (a)(d) | 30,005 | | 957,410 |
TOTAL DENMARK | | 1,661,211 |
France - 10.7% |
Alstom SA | 8,417 | | 424,671 |
Atos Origin SA (a) | 9,086 | | 420,054 |
AXA SA sponsored ADR | 188,900 | | 3,443,647 |
BNP Paribas SA | 26,393 | | 1,929,875 |
Christian Dior SA | 4,700 | | 679,814 |
Compagnie de St. Gobain | 24,678 | | 1,152,390 |
Credit Agricole SA | 56,600 | | 927,353 |
PPR SA | 6,800 | | 1,114,607 |
Sanofi-Aventis sponsored ADR | 41,300 | | 1,450,043 |
Schneider Electric SA | 6,563 | | 931,473 |
Societe Generale Series A | 45,507 | | 2,724,374 |
Total SA | 2,900 | | 157,819 |
Total SA sponsored ADR | 31,800 | | 1,732,464 |
Unibail-Rodamco | 7,266 | | 1,513,508 |
TOTAL FRANCE | | 18,602,092 |
Germany - 6.8% |
Allianz AG sponsored ADR | 51,500 | | 645,295 |
BASF AG | 16,700 | | 1,214,842 |
Bayerische Motoren Werke AG (BMW) | 11,233 | | 805,109 |
Daimler AG (United States) (a) | 30,400 | | 2,006,400 |
Deutsche Boerse AG | 11,000 | | 773,869 |
E.ON AG | 81,327 | | 2,546,155 |
HeidelbergCement AG | 23,800 | | 1,244,684 |
Metro AG | 10,300 | | 721,756 |
Munich Re Group | 9,123 | | 1,426,193 |
Volkswagen AG (d) | 3,837 | | 503,787 |
TOTAL GERMANY | | 11,888,090 |
Common Stocks - continued |
| Shares | | Value |
Greece - 0.3% |
Hellenic Telecommunications Organization SA | 21,569 | | $ 172,247 |
Public Power Corp. of Greece | 22,520 | | 377,592 |
TOTAL GREECE | | 549,839 |
Hong Kong - 4.2% |
China Resources Power Holdings Co. Ltd. | 396,000 | | 762,241 |
CNOOC Ltd. | 423,000 | | 883,105 |
Hang Lung Group Ltd. | 52,000 | | 345,157 |
Hutchison Whampoa Ltd. | 35,000 | | 344,977 |
Swire Pacific Ltd. (A Shares) | 123,300 | | 1,749,782 |
Techtronic Industries Co. Ltd. | 727,500 | | 736,768 |
Wharf Holdings Ltd. | 367,000 | | 2,409,973 |
TOTAL HONG KONG | | 7,232,003 |
India - 0.5% |
Bank of Baroda | 37,000 | | 877,878 |
Punjab National Bank | 288 | | 9,381 |
TOTAL INDIA | | 887,259 |
Indonesia - 0.9% |
PT Bank Rakyat Indonesia Tbk | 803,000 | | 1,024,245 |
PT Semen Gresik (Persero) Tbk | 497,500 | | 545,510 |
TOTAL INDONESIA | | 1,569,755 |
Ireland - 0.3% |
CRH PLC sponsored ADR | 30,000 | | 530,100 |
Israel - 0.5% |
Teva Pharmaceutical Industries Ltd. sponsored ADR | 16,700 | | 866,730 |
Italy - 2.2% |
ENI SpA | 19,300 | | 434,475 |
Intesa Sanpaolo SpA | 647,919 | | 2,278,660 |
UniCredit SpA | 389,609 | | 1,015,393 |
TOTAL ITALY | | 3,728,528 |
Japan - 18.3% |
ABC-Mart, Inc. | 14,100 | | 479,579 |
Aisin Seiki Co. Ltd. | 30,900 | | 970,353 |
Credit Saison Co. Ltd. | 18,500 | | 262,398 |
Denso Corp. | 45,200 | | 1,405,634 |
East Japan Railway Co. | 18,500 | | 1,142,440 |
Honda Motor Co. Ltd. | 31,500 | | 1,135,537 |
Japan Retail Fund Investment Corp. | 714 | | 1,115,320 |
Common Stocks - continued |
| Shares | | Value |
Japan - continued |
Japan Tobacco, Inc. | 97 | | $ 301,348 |
JSR Corp. | 26,900 | | 465,660 |
Konica Minolta Holdings, Inc. | 50,500 | | 487,979 |
Miraca Holdings, Inc. | 12,100 | | 435,462 |
Mitsubishi UFJ Financial Group, Inc. | 562,300 | | 2,609,637 |
Mitsui & Co. Ltd. | 235,400 | | 3,702,232 |
Nippon Electric Glass Co. Ltd. | 105,000 | | 1,349,651 |
Nippon Telegraph & Telephone Corp. | 10,800 | | 487,084 |
Obic Co. Ltd. | 3,880 | | 716,501 |
ORIX Corp. | 16,480 | | 1,503,209 |
Promise Co. Ltd. (d) | 59,900 | | 250,855 |
Ricoh Co. Ltd. | 30,000 | | 419,659 |
Seven & i Holdings Co., Ltd. | 19,700 | | 457,297 |
SOFTBANK CORP. | 16,600 | | 533,109 |
Sumitomo Corp. | 148,700 | | 1,882,662 |
Sumitomo Metal Industries Ltd. | 180,000 | | 417,777 |
Sumitomo Mitsui Financial Group, Inc. | 50,300 | | 1,501,342 |
Tokio Marine Holdings, Inc. | 26,000 | | 731,012 |
Tokyo Electron Ltd. | 16,800 | | 947,912 |
Tokyo Gas Co. Ltd. | 429,000 | | 2,018,396 |
Toyota Motor Corp. | 70,000 | | 2,479,419 |
USS Co. Ltd. | 6,120 | | 476,093 |
West Japan Railway Co. | 132 | | 490,049 |
Xebio Co. Ltd. | 2,900 | | 56,940 |
Yamada Denki Co. Ltd. | 9,260 | | 601,837 |
TOTAL JAPAN | | 31,834,383 |
Korea (South) - 0.9% |
Samsung Electronics Co. Ltd. | 1,245 | | 824,833 |
Shinhan Financial Group Co. Ltd. | 15,815 | | 612,488 |
Shinhan Financial Group Co. Ltd. sponsored ADR | 2,600 | | 202,202 |
TOTAL KOREA (SOUTH) | | 1,639,523 |
Luxembourg - 1.0% |
ArcelorMittal SA: | | | |
(Netherlands) | 17,800 | | 575,834 |
Class A unit (d) | 33,600 | | 1,087,968 |
TOTAL LUXEMBOURG | | 1,663,802 |
Netherlands - 3.9% |
Gemalto NV | 21,398 | | 974,213 |
ING Groep NV: | | | |
(Certificaten Van Aandelen) unit (a) | 131,968 | | 1,411,530 |
Common Stocks - continued |
| Shares | | Value |
Netherlands - continued |
ING Groep NV: - continued | | | |
sponsored ADR (a)(d) | 164,100 | | $ 1,768,998 |
Koninklijke Ahold NV | 43,888 | | 606,405 |
Koninklijke KPN NV | 70,720 | | 1,180,840 |
Randstad Holdings NV (a) | 16,139 | | 768,016 |
TOTAL NETHERLANDS | | 6,710,002 |
Norway - 1.0% |
Aker Solutions ASA | 86,460 | | 1,316,238 |
DnB NOR ASA | 32,800 | | 450,074 |
TOTAL NORWAY | | 1,766,312 |
Portugal - 0.7% |
Energias de Portugal SA | 337,291 | | 1,290,170 |
Russia - 0.6% |
Mechel Steel Group OAO sponsored ADR | 20,500 | | 482,775 |
OAO Gazprom sponsored ADR | 26,900 | | 587,765 |
TOTAL RUSSIA | | 1,070,540 |
Singapore - 1.7% |
DBS Group Holdings Ltd. | 39,585 | | 425,119 |
United Overseas Bank Ltd. | 126,200 | | 1,817,483 |
Yanlord Land Group Ltd. | 564,000 | | 749,502 |
TOTAL SINGAPORE | | 2,992,104 |
South Africa - 0.2% |
Impala Platinum Holdings Ltd. | 12,300 | | 347,663 |
Spain - 6.6% |
Banco Bilbao Vizcaya Argentaria SA sponsored ADR (d) | 185,716 | | 2,442,165 |
Banco Santander SA | 77,889 | | 999,496 |
Banco Santander SA sponsored ADR | 185,200 | | 2,372,412 |
Gestevision Telecinco SA | 16,100 | | 205,340 |
Iberdrola SA | 268,746 | | 2,266,117 |
Red Electrica Corporacion SA | 8,800 | | 441,975 |
Telefonica SA sponsored ADR (d) | 32,800 | | 2,661,392 |
TOTAL SPAIN | | 11,388,897 |
Sweden - 0.3% |
Telefonaktiebolaget LM Ericsson (B Shares) | 48,352 | | 531,601 |
Switzerland - 4.6% |
Lonza Group AG | 2,189 | | 191,581 |
Roche Holding AG (participation certificate) | 23,649 | | 3,471,611 |
Common Stocks - continued |
| Shares | | Value |
Switzerland - continued |
Transocean Ltd. (a) | 18,439 | | $ 1,168,295 |
Zurich Financial Services AG | 13,038 | | 3,190,790 |
TOTAL SWITZERLAND | | 8,022,277 |
Taiwan - 0.5% |
AU Optronics Corp. (a) | 315,000 | | 314,442 |
Hon Hai Precision Industry Co. Ltd. (Foxconn) | 136,752 | | 518,322 |
TOTAL TAIWAN | | 832,764 |
Thailand - 0.4% |
Siam Commercial Bank PCL (For. Reg.) | 196,900 | | 674,090 |
United Kingdom - 18.9% |
Aberdeen Asset Management PLC | 202,260 | | 576,162 |
Aegis Group PLC | 342,500 | | 689,762 |
Anglo American PLC (United Kingdom) | 46,717 | | 2,176,569 |
AstraZeneca PLC sponsored ADR (d) | 13,200 | | 666,072 |
Aviva PLC | 110,728 | | 706,059 |
BAE Systems PLC | 158,200 | | 873,677 |
Barclays PLC | 393,292 | | 1,728,083 |
BP PLC sponsored ADR | 86,000 | | 3,511,380 |
British Airways PLC (a) | 88,300 | | 382,959 |
Centrica PLC | 99,225 | | 528,109 |
HSBC Holdings PLC: | | | |
(United Kingdom) | 166,235 | | 1,729,898 |
sponsored ADR | 62,270 | | 3,244,890 |
Imperial Tobacco Group PLC | 24,643 | | 789,241 |
International Power PLC | 69,857 | | 467,048 |
Man Group PLC | 62,924 | | 262,922 |
Misys PLC (a) | 78,900 | | 355,717 |
Prudential PLC | 113,283 | | 1,145,604 |
Rio Tinto PLC | 19,102 | | 1,240,525 |
Royal Dutch Shell PLC Class A sponsored ADR (d) | 101,400 | | 6,583,903 |
Vedanta Resources PLC | 27,600 | | 917,551 |
Vodafone Group PLC sponsored ADR | 129,112 | | 3,551,871 |
Wolseley PLC (a) | 27,062 | | 721,033 |
TOTAL UNITED KINGDOM | | 32,849,035 |
TOTAL COMMON STOCKS (Cost $181,546,961) | 170,416,382 |
Nonconvertible Preferred Stocks - 1.0% |
| Shares | | Value |
Germany - 0.1% |
Volkswagen AG | 1,600 | | $ 240,443 |
Italy - 0.9% |
Fiat SpA (Risparmio Shares) | 53,200 | | 625,142 |
Telecom Italia SpA (Risparmio Shares) | 727,800 | | 892,776 |
TOTAL ITALY | | 1,517,918 |
TOTAL NONCONVERTIBLE PREFERRED STOCKS (Cost $1,798,557) | 1,758,361 |
Money Market Funds - 9.6% |
| | | |
Fidelity Cash Central Fund, 0.23% (b) | 1,148,052 | | 1,148,052 |
Fidelity Securities Lending Cash Central Fund, 0.24% (b)(c) | 15,519,480 | | 15,519,480 |
TOTAL MONEY MARKET FUNDS (Cost $16,667,532) | 16,667,532 |
TOTAL INVESTMENT PORTFOLIO - 108.6% (Cost $200,013,050) | | 188,842,275 |
NET OTHER ASSETS (LIABILITIES) - (8.6)% | | (14,918,317) |
NET ASSETS - 100% | $ 173,923,958 |
Legend |
(a) Non-income producing |
(b) Affiliated fund that is available only to investment companies and other accounts managed by Fidelity Investments. The rate quoted is the annualized seven-day yield of the fund at period end. A complete unaudited listing of the fund's holdings as of its most recent quarter end is available upon request. In addition, each Fidelity Central Fund's financial statements, which are not covered by the Fund's report of Independent Registered Public Accounting Firm, are available on the SEC's website or upon request. |
(c) Investment made with cash collateral received from securities on loan. |
(d) Security or a portion of the security is on loan at period end. |
Affiliated Central Funds |
Information regarding fiscal year to date income earned by the Fund from investments in Fidelity Central Funds is as follows: |
Fund | Income earned |
Fidelity Cash Central Fund | $ 2,268 |
Fidelity Securities Lending Cash Central Fund | 157,549 |
Total | $ 159,817 |
Other Information |
The following is a summary of the inputs used, as of October 31, 2010, involving the Fund's assets and liabilities carried at fair value. The inputs or methodology used for valuing securities may not be an indication of the risk associated with investing in those securities. For more information on valuation inputs, and their aggregation into the levels used in the table below, please refer to the Security Valuation section in the accompanying Notes to Financial Statements. |
Valuation Inputs at Reporting Date: |
Description | Total | Level 1 | Level 2 | Level 3 |
Investments in Securities: | | | |
Equities: | | | | |
United Kingdom | $ 32,849,035 | $ 26,298,866 | $ 6,550,169 | $ - |
Japan | 31,834,383 | 7,071,809 | 24,762,574 | - |
France | 18,602,092 | 18,444,273 | 157,819 | - |
Germany | 12,128,533 | 12,128,533 | - | - |
Spain | 11,388,897 | 10,389,401 | 999,496 | - |
Switzerland | 8,022,277 | 8,022,277 | - | - |
Hong Kong | 7,232,003 | 6,348,898 | 883,105 | - |
Netherlands | 6,710,002 | 5,298,472 | 1,411,530 | - |
Italy | 5,246,446 | 3,919,195 | 1,327,251 | - |
Other | 38,161,075 | 34,343,479 | 3,817,596 | - |
Money Market Funds | 16,667,532 | 16,667,532 | - | - |
Total Investments in Securities: | $ 188,842,275 | $ 148,932,735 | $ 39,909,540 | $ - |
Income Tax Information |
At October 31, 2010, the Fund had a capital loss carryforward of approximately $86,037,358 of which $17,089,067, $65,376,972 and $3,571,319 will expire on October 31, 2016, 2017 and 2018, respectively. Capital loss carryforwards are only available to offset future capital gains of the Fund to the extent provided by regulations and may be limited. |
See accompanying notes which are an integral part of the financial statements.
Annual Report
Statement of Assets and Liabilities
| October 31, 2010 |
| | |
Assets | | |
Investment in securities, at value (including securities loaned of $15,206,694) - See accompanying schedule: Unaffiliated issuers (cost $183,345,518) | $ 172,174,743 | |
Fidelity Central Funds (cost $16,667,532) | 16,667,532 | |
Total Investments (cost $200,013,050) | | $ 188,842,275 |
Foreign currency held at value (cost $5,461) | | 5,490 |
Receivable for investments sold | | 446,531 |
Receivable for fund shares sold | | 78,493 |
Dividends receivable | | 605,309 |
Distributions receivable from Fidelity Central Funds | | 4,290 |
Other receivables | | 29,877 |
Total assets | | 190,012,265 |
| | |
Liabilities | | |
Payable for investments purchased | $ 163,146 | |
Payable for fund shares redeemed | 179,389 | |
Accrued management fee | 96,986 | |
Distribution and service plan fees payable | 4,718 | |
Other affiliated payables | 35,187 | |
Other payables and accrued expenses | 89,401 | |
Collateral on securities loaned, at value | 15,519,480 | |
Total liabilities | | 16,088,307 |
| | |
Net Assets | | $ 173,923,958 |
Net Assets consist of: | | |
Paid in capital | | $ 268,479,379 |
Undistributed net investment income | | 3,475,373 |
Accumulated undistributed net realized gain (loss) on investments and foreign currency transactions | | (86,855,582) |
Net unrealized appreciation (depreciation) on investments and assets and liabilities in foreign currencies | | (11,175,212) |
Net Assets | | $ 173,923,958 |
See accompanying notes which are an integral part of the financial statements.
Annual Report
Financial Statements - continued
Statement of Assets and Liabilities - continued
| October 31, 2010 |
| | |
Calculation of Maximum Offering Price Class A:
Net Asset Value and redemption price per share ($4,698,845 ÷ 571,797 shares) | | $ 8.22 |
| | |
Maximum offering price per share (100/94.25 of $8.22) | | $ 8.72 |
Class T:
Net Asset Value and redemption price per share ($2,276,315 ÷ 277,544 shares) | | $ 8.20 |
| | |
Maximum offering price per share (100/96.50 of $8.20) | | $ 8.50 |
Class B:
Net Asset Value and offering price per share ($1,216,282 ÷ 148,316 shares)A | | $ 8.20 |
| | |
Class C:
Net Asset Value and offering price per share ($2,123,283 ÷ 258,867 shares)A | | $ 8.20 |
| | |
International Value:
Net Asset Value, offering price and redemption price per share ($163,089,817 ÷ 19,827,024 shares) | | $ 8.23 |
| | |
Institutional Class:
Net Asset Value, offering price and redemption price per share ($519,416 ÷ 63,004 shares) | | $ 8.24 |
A Redemption price per share is equal to net asset value less any applicable contingent deferred sales charge.
See accompanying notes which are an integral part of the financial statements.
Annual Report
Statement of Operations
| Year ended October 31, 2010 |
| | |
Investment Income | | |
Dividends | | $ 6,155,601 |
Interest | | 12 |
Income from Fidelity Central Funds | | 159,817 |
Income before foreign taxes withheld | | 6,315,430 |
Less foreign taxes withheld | | (506,127) |
Total income | | 5,809,303 |
| | |
Expenses | | |
Management fee
Basic fee | $ 1,246,006 | |
Performance adjustment | (64,274) | |
Transfer agent fees | 456,496 | |
Distribution and service plan fees | 53,397 | |
Accounting and security lending fees | 86,012 | |
Custodian fees and expenses | 47,971 | |
Independent trustees' compensation | 1,006 | |
Registration fees | 80,881 | |
Audit | 66,813 | |
Legal | 923 | |
Miscellaneous | 2,258 | |
Total expenses before reductions | 1,977,489 | |
Expense reductions | (28,245) | 1,949,244 |
Net investment income (loss) | | 3,860,059 |
Realized and Unrealized Gain (Loss) Net realized gain (loss) on: | | |
Investment securities: | | |
Unaffiliated issuers | (3,197,843) | |
Foreign currency transactions | (24,115) | |
Total net realized gain (loss) | | (3,221,958) |
Change in net unrealized appreciation (depreciation) on: Investment securities (net of increase in deferred foreign taxes of $30,988) | 12,416,559 | |
Assets and liabilities in foreign currencies | 1,278 | |
Total change in net unrealized appreciation (depreciation) | | 12,417,837 |
Net gain (loss) | | 9,195,879 |
Net increase (decrease) in net assets resulting from operations | | $ 13,055,938 |
See accompanying notes which are an integral part of the financial statements.
Annual Report
Financial Statements - continued
Statement of Changes in Net Assets
| Year ended
October 31,
2010 | Year ended
October 31,
2009 |
Increase (Decrease) in Net Assets | | |
Operations | | |
Net investment income (loss) | $ 3,860,059 | $ 3,337,187 |
Net realized gain (loss) | (3,221,958) | (62,114,878) |
Change in net unrealized appreciation (depreciation) | 12,417,837 | 101,639,080 |
Net increase (decrease) in net assets resulting
from operations | 13,055,938 | 42,861,389 |
Distributions to shareholders from net investment income | (3,135,757) | (3,076,516) |
Distributions to shareholders from net realized gain | (123,529) | - |
Total distributions | (3,259,286) | (3,076,516) |
Share transactions - net increase (decrease) | (27,172,209) | (17,980,610) |
Redemption fees | 3,410 | 6,134 |
Total increase (decrease) in net assets | (17,372,147) | 21,810,397 |
| | |
Net Assets | | |
Beginning of period | 191,296,105 | 169,485,708 |
End of period (including undistributed net investment income of $3,475,373 and undistributed net investment income of $2,751,072, respectively) | $ 173,923,958 | $ 191,296,105 |
See accompanying notes which are an integral part of the financial statements.
Annual Report
Financial Highlights - Class A
Years ended October 31, | 2010 | 2009 | 2008 | 2007 | 2006 I |
Selected Per-Share Data | | | | | |
Net asset value, beginning of period | $ 7.75 | $ 5.93 | $ 13.02 | $ 10.60 | $ 10.00 |
Income from Investment Operations | | | | | |
Net investment income (loss) E | .15 | .12 | .21 | .18 | .06 H |
Net realized and unrealized gain (loss) | .44 | 1.78 | (6.53) | 2.29 | .54 |
Total from investment operations | .59 | 1.90 | (6.32) | 2.47 | .60 |
Distributions from net investment income | (.11) | (.08) | (.15) | (.03) | - |
Distributions from net realized gain | (.01) | - | (.62) | (.02) | - |
Total distributions | (.12) | (.08) | (.77) | (.05) | - |
Redemption fees added to paid in capital E, K | - | - | - | - | - |
Net asset value, end of period | $ 8.22 | $ 7.75 | $ 5.93 | $ 13.02 | $ 10.60 |
Total Return B, C, D | 7.60% | 32.71% | (51.50)% | 23.43% | 6.00% |
Ratios to Average Net Assets F, J | | | | | |
Expenses before reductions | 1.40% | 1.34% | 1.42% | 1.38% | 1.75%A |
Expenses net of fee waivers, if any | 1.40% | 1.34% | 1.42% | 1.38% | 1.50% A |
Expenses net of all reductions | 1.38% | 1.32% | 1.41% | 1.37% | 1.46% A |
Net investment income (loss) | 1.93% | 1.86% | 2.05% | 1.49% | 1.29% A, H |
Supplemental Data | | | | | |
Net assets, end of period (000 omitted) | $ 4,699 | $ 4,456 | $ 2,854 | $ 6,052 | $ 1,537 |
Portfolio turnover rate G | 43% | 46% | 68% | 59% | 29% A |
A Annualized
B Total returns for periods of less than one year are not annualized.
C Total returns would have been lower had certain expenses not been reduced during the periods shown.
D Total returns do not include the effect of the sales charges.
E Calculated based on average shares outstanding during the period.
F Fees and expenses of the underlying Fidelity Central Funds are not included in the Fund's expense ratio. The Fund indirectly bears its proportionate share of the expenses of any underlying Fidelity Central Funds.
G Amount does not include the portfolio activity of any underlying Fidelity Central Funds.
H Investment income per share reflects a special dividend which amounted to $.03 per share. Excluding the special dividend, the ratio of net investment income (loss) to average net assets would have been .63%.
I For the period May 18, 2006 (commencement of operations) to October 31, 2006.
J Expense ratios reflect operating expenses of the class. Expenses before reductions do not reflect amounts reimbursed by the investment adviser or reductions from brokerage service arrangements or reductions from other expense offset arrangements and do not represent the amount paid by the class during periods when reimbursements or reductions occur. Expense ratios before reductions for start-up periods may not be representative of longer-term operating periods. Expenses net of fee waivers reflect expenses after reimbursement by the investment adviser but prior to reductions from brokerage service arrangements or other expense offset arrangements. Expenses net of all reductions represent the net expenses paid by the class.
K Amount represents less than $.01 per share.
See accompanying notes which are an integral part of the financial statements.
Annual Report
Financial Highlights - Class T
Years ended October 31, | 2010 | 2009 | 2008 | 2007 | 2006 I |
Selected Per-Share Data | | | | | |
Net asset value, beginning of period | $ 7.73 | $ 5.91 | $ 12.99 | $ 10.59 | $ 10.00 |
Income from Investment Operations | | | | | |
Net investment income (loss) E | .13 | .10 | .18 | .15 | .05 H |
Net realized and unrealized gain (loss) | .44 | 1.77 | (6.50) | 2.29 | .54 |
Total from investment operations | .57 | 1.87 | (6.32) | 2.44 | .59 |
Distributions from net investment income | (.09) | (.05) | (.14) | (.02) | - |
Distributions from net realized gain | (.01) | - | (.62) | (.02) | - |
Total distributions | (.10) | (.05) | (.76) | (.04) | - |
Redemption fees added to paid in capital E, K | - | - | - | - | - |
Net asset value, end of period | $ 8.20 | $ 7.73 | $ 5.91 | $ 12.99 | $ 10.59 |
Total Return B, C, D | 7.32% | 32.14% | (51.60)% | 23.13% | 5.90% |
Ratios to Average Net Assets F, J | | | | | |
Expenses before reductions | 1.67% | 1.60% | 1.67% | 1.60% | 2.01% A |
Expenses net of fee waivers, if any | 1.67% | 1.60% | 1.67% | 1.60% | 1.75% A |
Expenses net of all reductions | 1.65% | 1.59% | 1.66% | 1.58% | 1.71% A |
Net investment income (loss) | 1.65% | 1.59% | 1.80% | 1.27% | 1.04% A, H |
Supplemental Data | | | | | |
Net assets, end of period (000 omitted) | $ 2,276 | $ 2,395 | $ 2,087 | $ 5,081 | $ 1,789 |
Portfolio turnover rate G | 43% | 46% | 68% | 59% | 29% A |
A Annualized
B Total returns for periods of less than one year are not annualized.
C Total returns would have been lower had certain expenses not been reduced during the periods shown.
D Total returns do not include the effect of the sales charges.
E Calculated based on average shares outstanding during the period.
F Fees and expenses of the underlying Fidelity Central Funds are not included in the Fund's expense ratio. The Fund indirectly bears its proportionate share of the expenses of any underlying Fidelity Central Funds.
G Amount does not include the portfolio activity of any underlying Fidelity Central Funds.
H Investment income per share reflects a special dividend which amounted to $.03 per share. Excluding the special dividend, the ratio of net investment income (loss) to average net assets would have been .38%.
I For the period May 18, 2006 (commencement of operations) to October 31, 2006.
J Expense ratios reflect operating expenses of the class. Expenses before reductions do not reflect amounts reimbursed by the investment adviser or reductions from brokerage service arrangements or reductions from other expense offset arrangements and do not represent the amount paid by the class during periods when reimbursements or reductions occur. Expense ratios before reductions for start-up periods may not be representative of longer-term operating periods. Expenses net of fee waivers reflect expenses after reimbursement by the investment adviser but prior to reductions from brokerage service arrangements or other expense offset arrangements. Expenses net of all reductions represent the net expenses paid by the class.
K Amount represents less than $.01 per share.
See accompanying notes which are an integral part of the financial statements.
Annual Report
Financial Highlights - Class B
Years ended October 31, | 2010 | 2009 | 2008 | 2007 | 2006 I |
Selected Per-Share Data | | | | | |
Net asset value, beginning of period | $ 7.74 | $ 5.88 | $ 12.93 | $ 10.56 | $ 10.00 |
Income from Investment Operations | | | | | |
Net investment income (loss) E | .09 | .07 | .13 | .09 | .02 H |
Net realized and unrealized gain (loss) | .44 | 1.79 | (6.48) | 2.29 | .54 |
Total from investment operations | .53 | 1.86 | (6.35) | 2.38 | .56 |
Distributions from net investment income | (.06) | - | (.08) | - | - |
Distributions from net realized gain | (.01) | - | (.62) | (.01) | - |
Total distributions | (.07) | - | (.70) | (.01) | - |
Redemption fees added to paid in capital E, K | - | - | - | - | - |
Net asset value, end of period | $ 8.20 | $ 7.74 | $ 5.88 | $ 12.93 | $ 10.56 |
Total Return B, C, D | 6.82% | 31.63% | (51.85)% | 22.59% | 5.60% |
Ratios to Average Net Assets F, J | | | | | |
Expenses before reductions | 2.15% | 2.08% | 2.18% | 2.10% | 2.50% A |
Expenses net of fee waivers, if any | 2.15% | 2.08% | 2.18% | 2.10% | 2.25% A |
Expenses net of all reductions | 2.13% | 2.07% | 2.17% | 2.08% | 2.21% A |
Net investment income (loss) | 1.18% | 1.11% | 1.29% | .77% | .54% A, H |
Supplemental Data | | | | | |
Net assets, end of period (000 omitted) | $ 1,216 | $ 1,076 | $ 931 | $ 2,651 | $ 1,304 |
Portfolio turnover rate G | 43% | 46% | 68% | 59% | 29% A |
A Annualized
B Total returns for periods of less than one year are not annualized.
C Total returns would have been lower had certain expenses not been reduced during the periods shown.
D Total returns do not include the effect of the contingent deferred sales charge.
E Calculated based on average shares outstanding during the period.
F Fees and expenses of the underlying Fidelity Central Funds are not included in the Fund's expense ratio. The Fund indirectly bears its proportionate share of the expenses of any underlying Fidelity Central Funds.
G Amount does not include the portfolio activity of any underlying Fidelity Central Funds.
H Investment income per share reflects a special dividend which amounted to $.03 per share. Excluding the special dividend, the ratio of net investment income (loss) to average net assets would have been (.12)%.
I For the period May 18, 2006 (commencement of operations) to October 31, 2006.
J Expense ratios reflect operating expenses of the class. Expenses before reductions do not reflect amounts reimbursed by the investment adviser or reductions from brokerage service arrangements or reductions from other expense offset arrangements and do not represent the amount paid by the class during periods when reimbursements or reductions occur. Expense ratios before reductions for start-up periods may not be representative of longer-term operating periods. Expenses net of fee waivers reflect expenses after reimbursement by the investment adviser but prior to reductions from brokerage service arrangements or other expense offset arrangements. Expenses net of all reductions represent the net expenses paid by the class.
K Amount represents less than $.01 per share.
See accompanying notes which are an integral part of the financial statements.
Annual Report
Financial Highlights - Class C
Years ended October 31, | 2010 | 2009 | 2008 | 2007 | 2006 I |
Selected Per-Share Data | | | | | |
Net asset value, beginning of period | $ 7.73 | $ 5.88 | $ 12.92 | $ 10.56 | $ 10.00 |
Income from Investment Operations | | | | | |
Net investment income (loss) E | .09 | .07 | .13 | .09 | .02 H |
Net realized and unrealized gain (loss) | .44 | 1.78 | (6.47) | 2.29 | .54 |
Total from investment operations | .53 | 1.85 | (6.34) | 2.38 | .56 |
Distributions from net investment income | (.05) | - | (.08) | - | - |
Distributions from net realized gain | (.01) | - | (.62) | (.02) | - |
Total distributions | (.06) | - | (.70) | (.02) | - |
Redemption fees added to paid in capital E, K | - | - | - | - | - |
Net asset value, end of period | $ 8.20 | $ 7.73 | $ 5.88 | $ 12.92 | $ 10.56 |
Total Return B, C, D | 6.84% | 31.46% | (51.80)% | 22.56% | 5.60% |
Ratios to Average Net Assets F, J | | | | | |
Expenses before reductions | 2.15% | 2.08% | 2.17% | 2.07% | 2.47% A |
Expenses net of fee waivers, if any | 2.15% | 2.08% | 2.17% | 2.07% | 2.25% A |
Expenses net of all reductions | 2.13% | 2.06% | 2.16% | 2.05% | 2.21% A |
Net investment income (loss) | 1.18% | 1.12% | 1.30% | .80% | .54% A, H |
Supplemental Data | | | | | |
Net assets, end of period (000 omitted) | $ 2,123 | $ 2,108 | $ 1,784 | $ 5,996 | $ 2,183 |
Portfolio turnover rate G | 43% | 46% | 68% | 59% | 29% A |
A Annualized
B Total returns for periods of less than one year are not annualized.
C Total returns would have been lower had certain expenses not been reduced during the periods shown.
D Total returns do not include the effect of the contingent deferred sales charge.
E Calculated based on average shares outstanding during the period.
F Fees and expenses of the underlying Fidelity Central Funds are not included in the Fund's expense ratio. The Fund indirectly bears its proportionate share of the expenses of any underlying Fidelity Central Funds.
G Amount does not include the portfolio activity of any underlying Fidelity Central Funds.
H Investment income per share reflects a special dividend which amounted to $.03 per share. Excluding the special dividend, the ratio of net investment income (loss) to average net assets would have been (.12)%.
I For the period May 18, 2006 (commencement of operations) to October 31, 2006.
J Expense ratios reflect operating expenses of the class. Expenses before reductions do not reflect amounts reimbursed by the investment adviser or reductions from brokerage service arrangements or reductions from other expense offset arrangements and do not represent the amount paid by the class during periods when reimbursements or reductions occur. Expense ratios before reductions for start-up periods may not be representative of longer-term operating periods. Expenses net of fee waivers reflect expenses after reimbursement by the investment adviser but prior to reductions from brokerage service arrangements or other expense offset arrangements. Expenses net of all reductions represent the net expenses paid by the class.
K Amount represents less than $.01 per share.
See accompanying notes which are an integral part of the financial statements.
Annual Report
Financial Highlights - International Value
Years ended October 31, | 2010 | 2009 | 2008 | 2007 | 2006 H |
Selected Per-Share Data | | | | | |
Net asset value, beginning of period | $ 7.75 | $ 5.95 | $ 13.06 | $ 10.61 | $ 10.00 |
Income from Investment Operations | | | | | |
Net investment income (loss) D | .17 | .13 | .24 | .22 | .07 G |
Net realized and unrealized gain (loss) | .44 | 1.78 | (6.54) | 2.29 | .54 |
Total from investment operations | .61 | 1.91 | (6.30) | 2.51 | .61 |
Distributions from net investment income | (.13) | (.11) | (.19) | (.04) | - |
Distributions from net realized gain | (.01) | - | (.62) | (.02) | - |
Total distributions | (.13) K | (.11) | (.81) | (.06) | - |
Redemption fees added to paid in capital D, J | - | - | - | - | - |
Net asset value, end of period | $ 8.23 | $ 7.75 | $ 5.95 | $ 13.06 | $ 10.61 |
Total Return B, C | 7.95% | 33.09% | (51.34)% | 23.81% | 6.10% |
Ratios to Average Net Assets E, I | | | | | |
Expenses before reductions | 1.09% | 1.07% | 1.10% | 1.03% | 1.50% A |
Expenses net of fee waivers, if any | 1.09% | 1.07% | 1.10% | 1.03% | 1.25% A |
Expenses net of all reductions | 1.08% | 1.06% | 1.09% | 1.02% | 1.21% A |
Net investment income (loss) | 2.23% | 2.12% | 2.37% | 1.84% | 1.54% A, G |
Supplemental Data | | | | | |
Net assets, end of period (000 omitted) | $ 163,090 | $ 180,447 | $ 160,777 | $ 381,148 | $ 221,130 |
Portfolio turnover rate F | 43% | 46% | 68% | 59% | 29% A |
A Annualized
B Total returns for periods of less than one year are not annualized.
C Total returns would have been lower had certain expenses not been reduced during the periods shown.
D Calculated based on average shares outstanding during the period.
E Fees and expenses of the underlying Fidelity Central Funds are not included in the Fund's expense ratio. The Fund indirectly bears its proportionate share of the expenses of any underlying Fidelity Central Funds.
F Amount does not include the portfolio activity of any underlying Fidelity Central Funds.
G Investment income per share reflects a special dividend which amounted to $.03 per share. Excluding the special dividend, the ratio of net investment income (loss) to average net assets would have been .88%.
H For the period May 18, 2006 (commencement of operations) to October 31, 2006.
I Expense ratios reflect operating expenses of the class. Expenses before reductions do not reflect amounts reimbursed by the investment adviser or reductions from brokerage service arrangements or reductions from other expense offset arrangements and do not represent the amount paid by the class during periods when reimbursements or reductions occur. Expense ratios before reductions for start-up periods may not be representative of longer-term operating periods. Expenses net of fee waivers reflect expenses after reimbursement by the investment adviser but prior to reductions from brokerage service arrangements or other expense offset arrangements. Expenses net of all reductions represent the net expenses paid by the class.
J Amount represents less than $.01 per share.
K Total distributions of $.13 per share is comprised of distributions from net investment income of $.129 and distributions from net realized gain of $.005 per share.
See accompanying notes which are an integral part of the financial statements.
Annual Report
Financial Highlights - Institutional Class
Years ended October 31, | 2010 | 2009 | 2008 | 2007 | 2006 H |
Selected Per-Share Data | | | | | |
Net asset value, beginning of period | $ 7.76 | $ 5.96 | $ 13.07 | $ 10.61 | $ 10.00 |
Income from Investment Operations | | | | | |
Net investment income (loss) D | .18 | .14 | .25 | .22 | .07 G |
Net realized and unrealized gain (loss) | .44 | 1.78 | (6.54) | 2.30 | .54 |
Total from investment operations | .62 | 1.92 | (6.29) | 2.52 | .61 |
Distributions from net investment income | (.14) | (.12) | (.20) | (.04) | - |
Distributions from net realized gain | (.01) | - | (.62) | (.02) | - |
Total distributions | (.14) K | (.12) | (.82) | (.06) | - |
Redemption fees added to paid in capital D, J | - | - | - | - | - |
Net asset value, end of period | $ 8.24 | $ 7.76 | $ 5.96 | $ 13.07 | $ 10.61 |
Total Return B, C | 8.05% | 33.06% | (51.27)% | 23.91% | 6.10% |
Ratios to Average Net Assets E, I | | | | | |
Expenses before reductions | .98% | .93% | 1.02% | .98% | 1.38% A |
Expenses net of fee waivers, if any | .98% | .93% | 1.02% | .98% | 1.25% A |
Expenses net of all reductions | .97% | .92% | 1.01% | .96% | 1.21% A |
Net investment income (loss) | 2.34% | 2.26% | 2.45% | 1.89% | 1.54% A, G |
Supplemental Data | | | | | |
Net assets, end of period (000 omitted) | $ 519 | $ 814 | $ 1,052 | $ 3,965 | $ 3,064 |
Portfolio turnover rate F | 43% | 46% | 68% | 59% | 29% A |
A Annualized
B Total returns for periods of less than one year are not annualized.
C Total returns would have been lower had certain expenses not been reduced during the periods shown.
D Calculated based on average shares outstanding during the period.
E Fees and expenses of the underlying Fidelity Central Funds are not included in the Fund's expense ratio. The Fund indirectly bears its proportionate share of the expenses of any underlying Fidelity Central Funds.
F Amount does not include the portfolio activity of any underlying Fidelity Central Funds.
G Investment income per share reflects a special dividend which amounted to $.03 per share. Excluding the special dividend, the ratio of net investment income (loss) to average net assets would have been .88%.
H For the period May 18, 2006 (commencement of operations) to October 31, 2006.
I Expense ratios reflect operating expenses of the class. Expenses before reductions do not reflect amounts reimbursed by the investment adviser or reductions from brokerage service arrangements or reductions from other expense offset arrangements and do not represent the amount paid by the class during periods when reimbursements or reductions occur. Expense ratios before reductions for start-up periods may not be representative of longer-term operating periods. Expenses net of fee waivers reflect expenses after reimbursement by the investment adviser but prior to reductions from brokerage service arrangements or other expense offset arrangements. Expenses net of all reductions represent the net expenses paid by the class.
J Amount represents less than $.01 per share.
K Total distributions of $.14 per share is comprised of distributions from net investment income of $.137 and distributions from net realized gain of $.005 per share.
See accompanying notes which are an integral part of the financial statements.
Annual Report
Notes to Financial Statements
For the period ended October 31, 2010
1. Organization.
Fidelity International Value Fund (the Fund) is a fund of Fidelity Investment Trust (the Trust) and is authorized to issue an unlimited number of shares. The Trust is registered under the Investment Company Act of 1940, as amended (the 1940 Act), as an open-end management investment company organized as a Massachusetts business trust. The Fund offers Class A, Class T, Class C, International Value and Institutional Class shares, each of which has equal rights as to assets and voting privileges. Effective after the close of business on September 1, 2010, Class B shares were closed to new accounts and additional purchases by existing shareholders. Each class has exclusive voting rights with respect to matters that affect that class. Class B shares will automatically convert to Class A shares after a holding period of seven years from the initial date of purchase. Investment income, realized and unrealized capital gains and losses, the common expenses of the Fund, and certain fund-level expense reductions, if any, are allocated on a pro-rata basis to each class based on the relative net assets of each class to the total net assets of the Fund. Each class differs with respect to transfer agent and distribution and service plan fees incurred. Certain expense reductions also differ by class. The Fund's investments in emerging markets can be subject to social, economic, regulatory, and political uncertainties and can be extremely volatile.
2. Investments in Fidelity Central Funds.
The Fund may invest in Fidelity Central Funds, which are open-end investment companies available only to other investment companies and accounts managed by Fidelity Management & Research Company (FMR) and its affiliates. The Fund's Schedule of Investments lists each of the Fidelity Central Funds held as of period end, if any, as an investment of the Fund, but does not include the underlying holdings of each Fidelity Central Fund. As an Investing Fund, the Fund indirectly bears its proportionate share of the expenses of the underlying Fidelity Central Funds.
The Money Market Central Funds seek preservation of capital and current income and are managed by Fidelity Investments Money Management, Inc. (FIMM), an affiliate of FMR.
A complete unaudited list of holdings for each Fidelity Central Fund is available upon request or at the Securities and Exchange Commission (the SEC) web site at www.sec.gov. In addition, the financial statements of the Fidelity Central Funds, which are not covered by the Fund's Report of Independent Registered Public Accounting Firm, are available on the SEC web site or upon request.
3. Significant Accounting Policies.
The financial statements have been prepared in conformity with accounting principles generally accepted in the United States of America (GAAP), which require management to make certain estimates and assumptions at the date of the financial statements.
Annual Report
Notes to Financial Statements - continued
3. Significant Accounting Policies - continued
Actual results could differ from those estimates. The following summarizes the significant accounting policies of the Fund:
Security Valuation. Investments are valued as of 4:00 p.m. Eastern time on the last calendar day of the period. The Fund uses independent pricing services approved by the Board of Trustees to value its investments. When current market prices or quotations are not readily available or reliable, valuations may be determined in good faith in accordance with procedures adopted by the Board of Trustees. Factors used in determining value may include market or security specific events. The frequency with which these procedures are used cannot be predicted and they may be utilized to a significant extent. The value used for net asset value (NAV) calculation under these procedures may differ from published prices for the same securities.
The Fund categorizes the inputs to valuation techniques used to value its investments into a disclosure hierarchy consisting of three levels as shown below.
Level 1 - quoted prices in active markets for identical investments
Level 2 - other significant observable inputs (including quoted prices for similar investments, interest rates, prepayment speeds, etc.)
Level 3 - unobservable inputs (including the fund's own assumptions based on the best information available)
Changes in valuation techniques may result in transfers in or out of an assigned level within the disclosure hierarchy. The aggregate value of investments by input level as of October 31, 2010 is included at the end of the Fund's Schedule of Investments. Valuation techniques used to value the Fund's investments by major category are as follows.
Equity securities, including restricted securities, for which market quotations are readily available, are valued at the last reported sale price or official closing price as reported by an independent pricing service on the primary market or exchange on which they are traded and are categorized as Level 1 in the hierarchy. In the event there were no sales during the day or closing prices are not available, securities are valued at the last quoted bid price or may be valued using the last available price and are generally categorized as Level 2 in the hierarchy. For foreign equity securities, when significant market or security specific events arise, comparisons to the valuation of American Depositary Receipts (ADRs), futures contracts, Exchange-traded funds (ETFs) and certain indexes as well as quoted prices for similar securities are used and are categorized as Level 2 in the hierarchy in these circumstances. Utilizing these techniques may result in significant transfers between Level 1 and Level 2. For restricted equity securities and private placements where observable inputs are limited, assumptions about market activity and risk are used and are categorized as Level 3 in the hierarchy.
Annual Report
3. Significant Accounting Policies - continued
Security Valuation - continued
Investments in open-end mutual funds ,including the Fidelity Central Funds, are valued at their closing net asset value each business day and are categorized as Level 1 in the hierarchy. Short-term securities with remaining maturities of sixty days or less for which quotations are not readily available are valued at amortized cost, which approximates fair value and are categorized as Level 2 in the hierarchy.
Foreign Currency. The Fund uses foreign currency contracts to facilitate transactions in foreign-denominated securities. Gains and losses from these transactions may arise from changes in the value of the foreign currency or if the counterparties do not perform under the contracts' terms.
Foreign-denominated assets, including investment securities, and liabilities are translated into U.S. dollars at the exchange rate at period end. Purchases and sales of investment securities, income and dividends received and expenses denominated in foreign currencies are translated into U.S. dollars at the exchange rate in effect on the transaction date.
The effects of exchange rate fluctuations on investments are included with the net realized and unrealized gain (loss) on investment securities. Other foreign currency transactions resulting in realized and unrealized gain (loss) are disclosed separately.
Investment Transactions and Income. For financial reporting purposes, the Fund's investment holdings and NAV include trades executed through the end of the last business day of the period. The NAV per share for processing shareholder transactions is calculated as of the close of business of the New York Stock Exchange (NYSE), normally 4:00 p.m. Eastern time and includes trades executed through the end of the prior business day. Gains and losses on securities sold are determined on the basis of identified cost. Dividend income is recorded on the ex-dividend date, except for certain dividends from foreign securities where the ex-dividend date may have passed, which are recorded as soon as the Fund is informed of the ex-dividend date. Non-cash dividends included in dividend income, if any, are recorded at the fair market value of the securities received. Interest income and distributions from the Fidelity Central Funds are accrued as earned. Interest income includes coupon interest and amortization of premium and accretion of discount on debt securities. Investment income is recorded net of foreign taxes withheld where recovery of such taxes is uncertain.
Expenses. Most expenses of the Trust can be directly attributed to a fund. Expenses which cannot be directly attributed are apportioned amongst each fund in the Trust. Expense estimates are accrued in the period to which they relate and adjustments are made when actual amounts are known.
Annual Report
Notes to Financial Statements - continued
3. Significant Accounting Policies - continued
Income Tax Information and Distributions to Shareholders. Each year the Fund intends to qualify as a regulated investment company, including distributing substantially all of its taxable income and realized gains under Subchapter M of the Internal Revenue Code and filing its U.S. federal tax return. As a result, no provision for income taxes is required. As of October 31, 2010, the Fund did not have any unrecognized tax benefits in the accompanying financial statements. A fund's federal tax return is subject to examination by the Internal Revenue Service (IRS) for a period of three years. Foreign taxes are provided for based on the Fund's understanding of the tax rules and rates that exist in the foreign markets in which it invests. The Fund is subject to a tax imposed on short term capital gains on securities of certain issuers domiciled in India. The Fund records an estimated deferred tax liability included in Other payables and accrued expenses in the accompanying Statement of Assets & Liabilities for net unrealized gains on these securities in an amount that would be payable if the securities were disposed of at period end.
Distributions are declared and recorded on the ex-dividend date. Income dividends and capital gain distributions are declared separately for each class. Income and capital gain distributions are determined in accordance with income tax regulations, which may differ from GAAP.
Capital accounts within the financial statements are adjusted for permanent book-tax differences. These adjustments have no impact on net assets or the results of operations. Temporary book-tax differences will reverse in a subsequent period.
Book-tax differences are primarily due to the short-term gain distributions from the Fidelity Central Funds, foreign currency transactions, passive foreign investment companies (PFIC), capital loss carryforwards and losses deferred due to wash sales.
The federal tax cost of investment securities and unrealized appreciation (depreciation) as of period end were as follows:
Gross unrealized appreciation | $ 16,722,692 |
Gross unrealized depreciation | (29,377,939) |
Net unrealized appreciation (depreciation) | $ (12,655,247) |
| |
Tax Cost | $ 201,497,522 |
The tax-based components of distributable earnings as of period end were as follows:
Undistributed ordinary income | $ 4,141,622 |
Capital loss carryforward | $ (86,037,358) |
Net unrealized appreciation (depreciation) | $ (12,628,725) |
Annual Report
3. Significant Accounting Policies - continued
Income Tax Information and Distributions to Shareholders - continued
The tax character of distributions paid was as follows:
| October 31, 2010 | October 31, 2009 |
Ordinary Income | $ 3,259,286 | $ 3,076,516 |
Short-Term Trading (Redemption) Fees. Shares held by investors in the Fund less than 30 days are subject to a redemption fee equal to 1.00% of the net asset value of shares redeemed. All redemption fees, which reduce the proceeds of the shareholder redemption, are retained by the Fund and accounted for as an addition to paid in capital.
4. Purchases and Sales of Investments.
Purchases and sales of securities, other than short-term securities, aggregated $74,051,222 and $100,611,718, respectively.
5. Fees and Other Transactions with Affiliates.
Management Fee. FMR and its affiliates provide the Fund with investment management related services for which the Fund pays a monthly management fee. The management fee is the sum of an individual fund fee rate that is based on an annual rate of .45% of the Fund's average net assets and a group fee rate that averaged .26% during the period. The group fee rate is based upon the average net assets of all the mutual funds advised by FMR. The group fee rate decreases as assets under management increase and increases as assets under management decrease. In addition, the management fee is subject to a performance adjustment (up to a maximum of ±.20% of the Fund's average net assets over a 36 month performance period). The upward or downward adjustment to the management fee is based on the relative investment performance of International Value as compared to an appropriate benchmark index. For the period, the total annual management fee rate, including the performance adjustment, was .67% of the Fund's average net assets.
Distribution and Service Plan Fees. In accordance with Rule 12b-1 of the 1940 Act, the Fund has adopted separate Distribution and Service Plans for each class of shares. Certain classes pay Fidelity Distributors Corporation (FDC), an affiliate of FMR, separate Distribution and Service Fees, each of which is based on an annual percentage of each class' average net assets. In addition, FDC may pay financial intermediaries for selling shares of the Fund and providing shareholder support services. For the period,
Annual Report
Notes to Financial Statements - continued
5. Fees and Other Transactions with Affiliates - continued
Distribution and Service Plan Fees - continued
the Distribution and Service Fee rates, total fees and amounts retained by FDC were as follows:
Sales Load. FDC receives a front-end sales charge of up to 5.75% for selling Class A shares, and 3.50% for selling Class T shares, some of which is paid to financial intermediaries for selling shares of the Fund. FDC receives the proceeds of contingent deferred sales charges levied on Class A, Class T, Class B, and Class C redemptions. These charges depend on the holding period. The deferred sales charges range from 5% to 1% for Class B, 1% for Class C, 1.00% for certain purchases of Class A shares (1.00% to .50% prior to July 12, 2010) and .25% for certain purchases of Class T shares.
For the period, sales charge amounts retained by FDC were as follows:
| Retained
by FDC |
Class A | $ 2,989 |
Class T | 944 |
Class B* | 1,152 |
Class C* | 496 |
| $ 5,581 |
* When Class B and Class C shares are initially sold, FDC pays commissions from its own resources to financial intermediaries through which the sales are made.
Transfer Agent Fees. Fidelity Investments Institutional Operations Company, Inc. (FIIOC), an affiliate of FMR, is the transfer, dividend disbursing and shareholder servicing agent for each class of the Fund. FIIOC receives account fees and asset-based fees that vary according to the account size and type of account of the shareholders of the respective classes of the Fund. FIIOC pays for typesetting, printing and mailing of
Annual Report
5. Fees and Other Transactions with Affiliates - continued
Transfer Agent Fees - continued
shareholder reports, except proxy statements. For the period, transfer agent fees for each class were as follows:
Accounting and Security Lending Fees. Fidelity Service Company, Inc. (FSC), an affiliate of FMR, maintains the Fund's accounting records. The accounting fee is based on the level of average net assets for the month. Under a separate contract, FSC administers the security lending program. The security lending fee is based on the number and duration of lending transactions.
Brokerage Commissions. The Fund placed a portion of its portfolio transactions with brokerage firms which are affiliates of the investment adviser. The commissions paid to these affiliated firms were $338 for the period.
6. Committed Line of Credit.
The Fund participates with other funds managed by FMR or an affiliate in a $3.75 billion credit facility (the "line of credit") to be utilized for temporary or emergency purposes to fund shareholder redemptions or for other short-term liquidity purposes. The Fund has agreed to pay commitment fees on its pro-rata portion of the line of credit, which amounted to $702 and is reflected in Miscellaneous expenses on the Statement of Operations. During the period, there were no borrowings on this line of credit.
7. Security Lending.
The Fund lends portfolio securities through a lending agent from time to time in order to earn additional income. The lending agent may loan securities to certain qualified borrowers, including Fidelity Capital Markets (FCM), a broker-dealer affiliated with the Fund. On the settlement date of the loan, the Fund receives collateral (in the form of U.S. Treasury obligations, letters of credit and/or cash) against the loaned securities and maintains collateral in an amount not less than 100% of the market value of the loaned securities during the period of the loan. The market value of the loaned securities is
Annual Report
Notes to Financial Statements - continued
7. Security Lending - continued
determined at the close of business of the Fund and any additional required collateral is delivered to the Fund on the next business day. If the borrower defaults on its obligation to return the securities loaned because of insolvency or other reasons, a fund could experience delays and costs in recovering the securities loaned or in gaining access to the collateral. Any cash collateral received is invested in the Fidelity Securities Lending Cash Central Fund. The value of loaned securities and cash collateral at period end are disclosed on the Fund's Statement of Assets and Liabilities. Security lending income represents the income earned on investing cash collateral, less rebates paid to borrowers and lending agent fees associated with the loan, plus any premium payments received for lending certain types of securities. Security lending income is presented in the Statement of Operations as a component of income from Fidelity Central Funds. Total security lending income during the period amounted to $157,549. During the period, there were no securities loaned to FCM.
8. Expense Reductions.
Many of the brokers with whom FMR places trades on behalf of the Fund provided services to the Fund in addition to trade execution. These services included payments of certain expenses on behalf of the Fund totaling $28,245 for the period.
9. Distributions to Shareholders.
Distributions to shareholders of each class were as follows:
Years ended October 31, | 2010 | 2009 |
From net investment income | | |
Class A | $ 64,929 | $ 38,784 |
Class T | 27,801 | 19,023 |
Class B | 8,869 | - |
Class C | 14,357 | - |
International Value | 3,006,248 | 3,001,128 |
Institutional Class | 13,553 | 17,581 |
Total | $ 3,135,757 | $ 3,076,516 |
From net realized gain | | |
Class A | $ 2,899 | $ - |
Class T | 1,544 | - |
Class B | 715 | - |
Class C | 1,354 | - |
International Value | 116,522 | - |
Institutional Class | 495 | - |
Total | $ 123,529 | $ - |
Annual Report
10. Share Transactions.
Transactions for each class of shares were as follows:
| Shares | Dollars |
Years ended October 31, | 2010 | 2009 | 2010 | 2009 |
Class A | | | | |
Shares sold | 216,581 | 302,325 | $ 1,676,019 | $ 1,876,749 |
Reinvestment of distributions | 7,621 | 6,730 | 61,732 | 35,265 |
Shares redeemed | (227,521) | (215,042) | (1,766,121) | (1,172,427) |
Net increase (decrease) | (3,319) | 94,013 | $ (28,370) | $ 739,587 |
Class T | | | | |
Shares sold | 82,344 | 72,122 | $ 635,080 | $ 432,831 |
Reinvestment of distributions | 3,507 | 2,980 | 28,408 | 15,614 |
Shares redeemed | (118,025) | (118,669) | (899,018) | (709,124) |
Net increase (decrease) | (32,174) | (43,567) | $ (235,530) | $ (260,679) |
Class B | | | | |
Shares sold | 44,963 | 51,221 | $ 346,949 | $ 307,508 |
Reinvestment of distributions | 980 | - | 7,981 | - |
Shares redeemed | (36,625) | (70,451) | (286,374) | (387,465) |
Net increase (decrease) | 9,318 | (19,230) | $ 68,556 | $ (79,957) |
Class C | | | | |
Shares sold | 56,757 | 108,573 | $ 434,910 | $ 666,628 |
Reinvestment of distributions | 1,540 | - | 12,532 | - |
Shares redeemed | (72,014) | (139,651) | (560,469) | (850,584) |
Net increase (decrease) | (13,717) | (31,078) | $ (113,027) | $ (183,956) |
International Value | | | | |
Shares sold | 3,662,730 | 4,879,190 | $ 28,403,948 | $ 32,198,500 |
Reinvestment of distributions | 369,795 | 550,070 | 2,987,943 | 2,876,866 |
Shares redeemed | (7,496,748) | (9,139,736) | (57,917,334) | (52,863,403) |
Net increase (decrease) | (3,464,223) | (3,710,476) | $ (26,525,443) | $ (17,788,037) |
Institutional Class | | | | |
Shares sold | 16,581 | 6,874 | $ 128,469 | $ 36,272 |
Reinvestment of distributions | 185 | 572 | 1,498 | 2,992 |
Shares redeemed | (58,573) | (79,196) | (468,362) | (446,832) |
Net increase (decrease) | (41,807) | (71,750) | $ (338,395) | $ (407,568) |
Annual Report
Notes to Financial Statements - continued
11. Other.
The Fund's organizational documents provide former and current trustees and officers with a limited indemnification against liabilities arising in connection with the performance of their duties to the Fund. In the normal course of business, the Fund may also enter into contracts that provide general indemnifications. The Fund's maximum exposure under these arrangements is unknown as this would be dependent on future claims that may be made against the Fund. The risk of material loss from such claims is considered remote.
Annual Report
To the Trustees of Fidelity Investment Trust and Shareholders of Fidelity International Value Fund:
We have audited the accompanying statement of assets and liabilities of Fidelity International Value Fund (the Fund), a fund of Fidelity Investment Trust, including the schedule of investments, as of October 31, 2010, and the related statement of operations for the year then ended, the statement of changes in net assets for each of the two years in the period then ended, and the financial highlights for each of the periods presented. These financial statements and financial highlights are the responsibility of the Fund's management. Our responsibility is to express an opinion on these financial statements and financial highlights based on our audits.
We conducted our audits in accordance with standards of the Public Company Accounting Oversight Board (United States). Those standards require that we plan and perform the audit to obtain reasonable assurance about whether the financial statements and financial highlights are free of material misstatement. The Fund is not required to have, nor were we engaged to perform, an audit of its internal control over financial reporting. Our audits included consideration of internal control over financial reporting as a basis for designing audit procedures that are appropriate in the circumstances, but not for the purpose of expressing an opinion on the effectiveness of the Fund's internal control over financial reporting. Accordingly, we express no such opinion. An audit also includes examining, on a test basis, evidence supporting the amounts and disclosures in the financial statements, assessing the accounting principles used and significant estimates made by management, as well as evaluating the overall financial statement presentation. Our procedures included confirmation of securities owned as of October 31, 2010, by correspondence with the custodians and brokers; where replies were not received from brokers, we performed other auditing procedures. We believe that our audits provide a reasonable basis for our opinion.
In our opinion, the financial statements and financial highlights referred to above present fairly, in all material respects, the financial position of Fidelity International Value Fund as of October 31, 2010, the results of its operations for the year then ended, the changes in its net assets for each of the two years in the period then ended, and the financial highlights for each of the periods presented, in conformity with accounting principles generally accepted in the United States of America.
/s/ Deloitte & Touche LLP
DELOITTE & TOUCHE LLP
Boston, Massachusetts
December 16, 2010
Annual Report
The Trustees, Member of the Advisory Board, and executive officers of the trust and fund, as applicable, are listed below. The Board of Trustees governs the fund and is responsible for protecting the interests of shareholders. The Trustees are experienced executives who meet periodically throughout the year to oversee the fund's activities, review contractual arrangements with companies that provide services to the fund, oversee management of the risks associated with such activities and contractual arrangements, and review the fund's performance. Except for James C. Curvey, each of the Trustees oversees 221 funds advised by FMR or an affiliate. Mr. Curvey oversees 410 funds advised by FMR or an affiliate.
The Trustees hold office without limit in time except that (a) any Trustee may resign; (b) any Trustee may be removed by written instrument, signed by at least two-thirds of the number of Trustees prior to such removal; (c) any Trustee who requests to be retired or who has become incapacitated by illness or injury may be retired by written instrument signed by a majority of the other Trustees; and (d) any Trustee may be removed at any special meeting of shareholders by a two-thirds vote of the outstanding voting securities of the trust. Each Trustee who is not an interested person (as defined in the 1940 Act) (Independent Trustee), shall retire not later than the last day of the calendar year in which his or her 72nd birthday occurs. The Independent Trustees may waive this mandatory retirement age policy with respect to individual Trustees. The executive officers and Advisory Board Member hold office without limit in time, except that any officer and Advisory Board Member may resign or may be removed by a vote of a majority of the Trustees at any regular meeting or any special meeting of the Trustees. Except as indicated, each individual has held the office shown or other offices in the same company for the past five years.
Experience, Skills, Attributes, and Qualifications of the Fund's Trustees. The Governance and Nominating Committee has adopted a statement of policy that describes the experience, qualifications, attributes, and skills that are necessary and desirable for potential Independent Trustee candidates (Statement of Policy). The Board believes that each Trustee satisfied at the time he or she was initially elected or appointed a Trustee, and continues to satisfy, the standards contemplated by the Statement of Policy. The Governance and Nominating Committee also engages professional search firms to help identify potential Independent Trustee candidates who have the experience, qualifications, attributes, and skills consistent with the Statement of Policy. From time to time, additional criteria based on the composition and skills of the current Independent Trustees, as well as experience or skills that may be appropriate in light of future changes to board composition, business conditions, and regulatory or other developments, have also been considered by the professional search firms and the Governance and Nominating Committee. In addition, the Board takes into account the Trustees' commitment and participation in Board and committee meetings, as well as their leadership of standing and ad hoc committees throughout their tenure.
In determining that a particular Trustee was and continues to be qualified to serve as a Trustee, the Board has considered a variety of criteria, none of which, in isolation, was controlling. The Board believes that, collectively, the Trustees have balanced and diverse experience, qualifications, attributes, and skills, which allow the Board to operate effectively in governing the fund and protecting the interests of shareholders. Information about the specific experience, skills, attributes, and qualifications of each Trustee, which in each case led to the Board's conclusion that the Trustee should serve (or continue to serve) as a trustee of the fund, is provided below.
Annual Report
Board Structure and Oversight Function. Edward C. Johnson 3d is an interested person (as defined in the 1940 Act) and currently serves as Chairman. The Trustees have determined that an interested Chairman is appropriate and benefits shareholders because an interested Chairman has a personal and professional stake in the quality and continuity of services provided to the fund. Independent Trustees exercise their informed business judgment to appoint an individual of their choosing to serve as Chairman, regardless of whether the Trustee happens to be independent or a member of management. The Independent Trustees have determined that they can act independently and effectively without having an Independent Trustee serve as Chairman and that a key structural component for assuring that they are in a position to do so is for the Independent Trustees to constitute a substantial majority for the Board. The Independent Trustees also regularly meet in executive session. Ned C. Lautenbach serves as Chairman of the Independent Trustees and as such (i) acts as a liaison between the Independent Trustees and management with respect to matters important to the Independent Trustees and (ii) with management prepares agendas for Board meetings.
Fidelity funds are overseen by different Boards of Trustees. The fund's Board oversees Fidelity's equity and high income funds and another Board oversees Fidelity's investment-grade bond, money market, and asset allocation funds. The asset allocation funds may invest in Fidelity funds overseen by the fund's Board. The use of separate Boards, each with its own committee structure, allows the Trustees of each group of Fidelity funds to focus on the unique issues of the funds they oversee, including common research, investment, and operational issues. On occasion, the separate Boards establish joint committees to address issues of overlapping consequences for the Fidelity funds overseen by each Board.
The Trustees operate using a system of committees to facilitate the timely and efficient consideration of all matters of importance to the Trustees, the fund, and fund shareholders and to facilitate compliance with legal and regulatory requirements and oversight of the fund's activities and associated risks. The Board, acting through its committees, has charged FMR and its affiliates with (i) identifying events or circumstances the occurrence of which could have demonstrably adverse effects on the fund's business and/or reputation; (ii) implementing processes and controls to lessen the possibility that such events or circumstances occur or to mitigate the effects of such events or circumstances if they do occur; and (iii) creating and maintaining a system designed to evaluate continuously business and market conditions in order to facilitate the identification and implementation processes described in (i) and (ii) above. Because the day-to-day operations and activities of the fund are carried out by or through FMR, its affiliates and other service providers, the fund's exposure to risks is mitigated but not eliminated by the processes overseen by the Trustees. While each of the Board's committees has responsibility for overseeing different aspects of the fund's activities, oversight is exercised primarily through the Operations, Audit, and Compliance Committees. Appropriate personnel, including but not limited to the fund's Chief Compliance Officer (CCO), FMR's internal auditor, the independent accountants, the fund's Treasurer and portfolio management personnel, make periodic reports to the Board's committees, as appropriate. The responsibilities of each committee, including their oversight responsibilities, are described further under "Standing Committees of the Fund's Trustees."
Annual Report
Trustees and Officers - continued
The fund's Statement of Additional Information (SAI) includes more information about the Trustees. To request a free copy, call Fidelity at 1-877-208-0098.
Interested Trustees*:
Correspondence intended for each Trustee who is an interested person may be sent to Fidelity Investments, 82 Devonshire Street, Boston, Massachusetts 02109.
Name, Age; Principal Occupations and Other Relevant Experience+ |
Edward C. Johnson 3d (80) |
| Year of Election or Appointment: 1984 Mr. Johnson is Trustee and Chairman of the Board of Trustees of certain Trusts. Mr. Johnson serves as Chief Executive Officer, Chairman, and a Director of FMR LLC; Chairman and a Director of FMR; Chairman and a Director of Fidelity Research & Analysis Company (FRAC); Chairman and a Director of Fidelity Investments Money Management, Inc.; and Chairman and a Director of FMR Co., Inc. In addition, Mr. Johnson serves as Chairman and Director of FIL Limited. Previously, Mr. Johnson served as President of FMR LLC (2006-2007). |
James C. Curvey (75) |
| Year of Election or Appointment: 2007 Mr. Curvey also serves as Trustee (2007-present) of other investment companies advised by FMR. Mr. Curvey is a Director of Fidelity Investments Money Management, Inc. (2009-present), Director of Fidelity Research & Analysis Co. (2009-present) and Director of FMR and FMR Co., Inc. (2007-present). Mr. Curvey is also Vice Chairman (2007-present) and Director of FMR LLC. In addition, Mr. Curvey serves as an Overseer for the Boston Symphony Orchestra and a member of the Trustees of Villanova University. Previously, Mr. Curvey was the Vice Chairman (2006-2007) and Director (2000-2007) of FMR Corp. |
* Trustees have been determined to be "Interested Trustees" by virtue of, among other things, their affiliation with the trust or various entities under common control with FMR.
+ The information above includes each Trustee's principal occupation during the last five years and other information relating to the experience, attributes, and skills relevant to each Trustee's qualifications to serve as a Trustee, which led to the conclusion that each Trustee should serve as a Trustee for the fund.
Independent Trustees:
Correspondence intended for each Independent Trustee (that is, the Trustees other than the Interested Trustees) may be sent to Fidelity Investments, P.O. Box 55235, Boston, Massachusetts 02205-5235.
Name, Age; Principal Occupations and Other Relevant Experience+ |
Dennis J. Dirks (62) |
| Year of Election or Appointment: 2005 Prior to his retirement in May 2003, Mr. Dirks was Chief Operating Officer and a member of the Board of The Depository Trust & Clearing Corporation (DTCC). He also served as President, Chief Operating Officer, and Board member of The Depository Trust Company (DTC) and President and Board member of the National Securities Clearing Corporation (NSCC). In addition, Mr. Dirks served as Chief Executive Officer and Board member of the Government Securities Clearing Corporation, Chief Executive Officer and Board member of the Mortgage-Backed Securities Clearing Corporation, as a Trustee and a member of the Finance Committee of Manhattan College (2005-2008), and as a Trustee and a member of the Finance Committee of AHRC of Nassau County (2006-2008). Mr. Dirks is a member of the Independent Directors Council (IDC) Governing Council (2010-Present) and Board of Directors for The Brookville Center for Children's Services, Inc. (2009-present). |
Alan J. Lacy (57) |
| Year of Election or Appointment: 2008 Mr. Lacy serves as Senior Adviser (2007-present) of Oak Hill Capital Partners, L.P. (private equity). Mr. Lacy also served as Chief Executive Officer (2000-2005) and Vice Chairman (2005-2006) of Sears Holdings Corporation and Sears, Roebuck and Co. (retail). In addition, Mr. Lacy serves as a member of the Board of Directors of The Western Union Company (global money transfer, 2006-present) and Bristol-Myers Squibb Company (global pharmaceuticals, 2007-present). Mr. Lacy is Chairman (2008-present) and a member (2006-present) of the Board of Trustees of The National Parks Conservation Association. |
Ned C. Lautenbach (66) |
| Year of Election or Appointment: 2000 Mr. Lautenbach is Chairman of the Independent Trustees of the Equity and High Income Funds (2006-present). Mr. Lautenbach currently serves as the Lead Director of the Eaton Corporation Board of Directors (diversified industrial, 1997-present). Mr. Lautenbach is also a member of the Board of Directors of the Philharmonic Center for the Arts in Naples, Florida (1999-present); a member of the Board of Trustees of Fairfield University (2005-present); and a member of the Council on Foreign Relations (1994-present). Previously, Mr. Lautenbach was a Partner/Advisory Partner at Clayton, Dubilier & Rice, Inc. (private equity investment, 1998-2010), as well as a Director of Sony Corporation (2006-2007). |
Joseph Mauriello (66) |
| Year of Election or Appointment: 2008 Prior to his retirement in January 2006, Mr. Mauriello served in numerous senior management positions including Deputy Chairman and Chief Operating Officer (2004-2005), and Vice Chairman of Financial Services (2002-2004) of KPMG LLP US (professional services, 1965-2005). Mr. Mauriello currently serves as a member of the Board of Directors of XL Group plc. (global insurance and re-insurance, 2006-present) and of Arcadia Resources Inc. (health care services and products, 2007-present). Previously, Mr. Mauriello served as a Director of the Hamilton Funds of the Bank of New York (2006-2007). |
Cornelia M. Small (66) |
| Year of Election or Appointment: 2005 Ms. Small is a member of the Board of Directors of the Teagle Foundation (2009-present). Ms. Small is also a member of the Investment Committee, and Chair (2008-present) and a member of the Board of Trustees of Smith College. In addition, Ms. Small serves on the Investment Committee of the Berkshire Taconic Community Foundation (2008-present). Previously, Ms. Small served as Chairperson of the Investment Committee (2002-2008) of Smith College. In addition, Ms. Small served as Chief Investment Officer, Director of Global Equity Investments, and a member of the Board of Directors of Scudder, Stevens & Clark and Scudder Kemper Investments. |
William S. Stavropoulos (71) |
| Year of Election or Appointment: 2001 Mr. Stavropoulos is Vice Chairman of the Independent Trustees of the Equity and High Income Funds (2006-present). Mr. Stavropoulos serves as President and Founder of the Michigan Baseball Foundation, the Great Lakes Loons (2007-present). Mr. Stavropoulos is Chairman Emeritus of the Board of Directors of The Dow Chemical Company, where he previously served in numerous senior management positions, including President, CEO (1995-2000; 2002-2004), Chairman of the Executive Committee (2000-2006), and as a member of the Board of Directors (1990-2006). Currently, Mr. Stavropoulos is Chairman of Univar (global distributor of commodity and specialty chemicals, 2010-present), a Director of Teradata Corporation (data warehousing and technology solutions, 2008-present), Chemical Financial Corporation, Maersk Inc. (industrial conglomerate), Tyco International, Inc. (multinational manufacturing and services, 2007-present), and a member of the Advisory Board for Metalmark Capital (private equity investment, 2005-present). Mr. Stavropoulos is a special advisor to Clayton, Dubilier & Rice, Inc. (private equity investment). In addition, Mr. Stavropoulos is a member of the University of Notre Dame Advisory Council for the College of Science. |
David M. Thomas (61) |
| Year of Election or Appointment: 2008 Previously, Mr. Thomas served as Executive Chairman (2005-2006) and Chairman and Chief Executive Officer (2000-2005) of IMS Health, Inc. (pharmaceutical and healthcare information solutions). In addition, Mr. Thomas serves as a member of the Board of Directors of Fortune Brands, Inc. (consumer products), and Interpublic Group of Companies, Inc. (marketing communication, 2004-present). |
Michael E. Wiley (60) |
| Year of Election or Appointment: 2008 Mr. Wiley also serves as a Director of Asia Pacific Exploration Consolidated (international oil and gas exploration and production, 2008-present). Mr. Wiley serves as a Director of Tesoro Corporation (independent oil refiner and marketer, 2005-present), and a Director of Bill Barrett Corporation (exploration and production, 2005-present). In addition, Mr. Wiley also serves as a Director of Post Oak Bank (privately-held bank, 2004-present). Previously, Mr. Wiley served as a member of the Board of Trustees of the University of Tulsa (2000-2006; 2007-2010), as a Senior Energy Advisor of Katzenbach Partners, LLC (consulting, 2006-2007), as an Advisory Director of Riverstone Holdings (private investment), Chairman, President, and CEO of Baker Hughes, Inc. (oilfield services, 2000-2004), and as Director of Spinnaker Exploration Company (exploration and production, 2001-2005). |
+ The information above includes each Trustee's principal occupation during the last five years and other information relating to the experience, attributes, and skills relevant to each Trustee's qualifications to serve as a Trustee, which led to the conclusion that each Trustee should serve as a Trustee for the fund.
Advisory Board Member and Executive Officers:
Correspondence intended for each executive officer and Peter S. Lynch may be sent to Fidelity Investments, 82 Devonshire Street, Boston, Massachusetts 02109.
Name, Age; Principal Occupation |
Peter S. Lynch (66) |
| Year of Election or Appointment: 2003 Member of the Advisory Board of Fidelity's Equity and High Income Funds. Mr. Lynch is Vice Chairman and a Director of FMR and FMR Co., Inc. In addition, Mr. Lynch serves as a Trustee of Boston College and as the Chairman of the Inner-City Scholarship Fund. Previously, Mr. Lynch served on the Special Olympics International Board of Directors (1997-2006). |
Kenneth B. Robins (41) |
| Year of Election or Appointment: 2008 President and Treasurer of Fidelity's Equity and High Income Funds. Mr. Robins also serves as President and Treasurer (2010-present) and Assistant Treasurer (2009-present) of other Fidelity funds and is an employee of Fidelity Investments (2004-present). Previously, Mr. Robins served as Deputy Treasurer of the Fidelity funds (2005-2008) and Treasurer and Chief Financial Officer of The North Carolina Capital Management Trust: Cash and Term Portfolios (2006-2008). |
Bruce T. Herring (45) |
| Year of Election or Appointment: 2006 Vice President of certain Equity Funds. Mr. Herring also serves as Chief Investment Officer and Director of Fidelity Management & Research (U.K.) Inc. (2010-present) and Group Chief Investments Officer of FMR. Previously, Mr. Herring served as Vice President (2005-2006) and Senior Vice President (2006-2007) of Fidelity Management & Research Company, Vice President of FMR Co., Inc. (2001-2007) and as a portfolio manager for Fidelity U.S. Equity Funds. |
Brian B. Hogan (46) |
| Year of Election or Appointment: 2009 Vice President of certain Equity Funds and Vice President of Sector Funds. Mr. Hogan also serves as President of FMR's Equity Division (2009-present). Previously, Mr. Hogan served as Senior Vice President, Equity Research of FMR (2006-2009) and as a portfolio manager. |
Scott C. Goebel (42) |
| Year of Election or Appointment: 2008 Secretary and Chief Legal Officer (CLO) of the Fidelity funds. Mr. Goebel also serves as Secretary and CLO of The North Carolina Capital Management Trust: Cash and Term Portfolio (2008-present); General Counsel, Secretary, and Senior Vice President of FMR (2008-present) and FMR Co., Inc. (2008-present); Deputy General Counsel of FMR LLC; Chief Legal Officer of Fidelity Management & Research (Hong Kong) Limited (2008-present) and Assistant Secretary of Fidelity Management & Research (Japan) Inc. (2008-present), Fidelity Investments Money Management, Inc. (2008-present), Fidelity Management & Research (U.K.) Inc. (2008-present), and Fidelity Research and Analysis Company (2008-present). Previously, Mr. Goebel served as Assistant Secretary of the Funds (2007-2008) and as Vice President and Secretary of Fidelity Distributors Corporation (FDC) (2005-2007). |
William C. Coffey (41) |
| Year of Election or Appointment: 2009 Assistant Secretary of Fidelity's Equity and High Income Funds. Mr. Coffey also serves as Senior Vice President and Deputy General Counsel of FMR LLC (2010-present), and is an employee of Fidelity Investments. Previously, Mr. Coffey served as Vice President and Associate General Counsel of FMR LLC (2005-2009). |
Holly C. Laurent (56) |
| Year of Election or Appointment: 2008 Anti-Money Laundering (AML) Officer of the Fidelity funds. Ms. Laurent also serves as AML Officer of The North Carolina Capital Management Trust: Cash and Term Portfolio (2008-present) and is an employee of Fidelity Investments. Previously, Ms. Laurent was Senior Vice President and Head of Legal for Fidelity Business Services India Pvt. Ltd. (2006-2008), and Senior Vice President, Deputy General Counsel and Group Head for FMR LLC (2005-2006). |
Christine Reynolds (52) |
| Year of Election or Appointment: 2008 Chief Financial Officer of the Fidelity funds. Ms. Reynolds became President of Fidelity Pricing and Cash Management Services (FPCMS) in August 2008. Ms. Reynolds served as Chief Operating Officer of FPCMS (2007-2008). Previously, Ms. Reynolds served as President, Treasurer, and Anti-Money Laundering officer of the Fidelity funds (2004-2007). |
Kenneth A. Rathgeber (63) |
| Year of Election or Appointment: 2004 Chief Compliance Officer of Fidelity's Equity and High Income Funds. Mr. Rathgeber is Chief Compliance Officer of Fidelity Management & Research (Hong Kong) Limited (2008-present), Fidelity Management & Research (Japan) Inc. (2008-present), FMR (2005-present), FMR Co., Inc. (2005-present), Fidelity Management & Research (U.K.) Inc. (2005-present), Fidelity Research & Analysis Company (2005-present), Fidelity Investments Money Management, Inc. (2005-present), Pyramis Global Advisors, LLC (2005-present), and Strategic Advisers, Inc. (2005-present). |
Jeffrey S. Christian (49) |
| Year of Election or Appointment: 2009 Deputy Treasurer of the Fidelity funds. Mr. Christian is an employee of Fidelity Investments. Previously, Mr. Christian served as Chief Financial Officer (2008-2009) of certain Fidelity funds and Senior Vice President of Fidelity Pricing and Cash Management Services (FPCMS) (2004-2009). |
Bryan A. Mehrmann (49) |
| Year of Election or Appointment: 2005 Deputy Treasurer of the Fidelity funds. Mr. Mehrmann is an employee of Fidelity Investments. |
Adrien E. Deberghes (43) |
| Year of Election or Appointment: 2008 Deputy Treasurer of Fidelity's Equity and High Income Funds. Mr. Deberghes also serves as Assistant Treasurer of other Fidelity funds (2010-present) and is an employee of Fidelity Investments (2008-present). Previously, Mr. Deberghes served as Senior Vice President of Mutual Fund Administration at State Street Corporation (2007-2008), Senior Director of Mutual Fund Administration at Investors Bank & Trust (2005-2007), and Director of Finance for Dunkin' Brands (2000-2005). |
Stephanie J. Dorsey (41) |
| Year of Election or Appointment: 2010 Assistant Treasurer of Fidelity's Equity and High Income Funds. Ms. Dorsey also serves as Deputy Treasurer of other Fidelity funds (2008-present) and is an employee of Fidelity Investments (2008-present). Previously, Ms. Dorsey served as Treasurer (2004-2008) of the JPMorgan Mutual Funds and Vice President (2004-2008) of JPMorgan Chase Bank. |
John R. Hebble (52) |
| Year of Election or Appointment: 2009 Assistant Treasurer of Fidelity's Equity and High Income Funds. Mr. Hebble also serves as Treasurer and Chief Financial Officer of The North Carolina Capital Management Trust: Cash and Term Portfolio (2008-present), President and Treasurer of other Fidelity funds (2008-present) and is an employee of Fidelity Investments. |
Gary W. Ryan (52) |
| Year of Election or Appointment: 2005 Assistant Treasurer of the Fidelity funds. Mr. Ryan is an employee of Fidelity Investments. Previously, Mr. Ryan served as Vice President of Fund Reporting in Fidelity Pricing and Cash Management Services (FPCMS) (1999-2005). |
Jonathan Davis (42) |
| Year of Election or Appointment: 2010 Assistant Treasurer of the Fidelity funds. Mr. Davis is an employee of Fidelity Investments. Previously, Mr. Davis served as Vice President and Associate General Counsel of FMR LLC (2003-2010). |
Annual Report
The Board of Trustees of Advisor International Value Fund voted to pay to shareholders of record at the opening of business on record date, the following distributions per share derived from capital gains realized from sales of portfolio securities, and dividends derived from net investment income:
| Pay Date | Record Date | Dividends | Capital Gains |
Institutional Class | 12/06/10 | 12/03/10 | $0.194 | $0.034 |
Institutional Class designates 73% of the dividends distributed in December during the fiscal year as amounts which may be taken into account as a dividend for purposes of the maximum rate under section 1(h)(11) of the Internal Revenue Code.
The amounts per share which represent income derived from sources within, and taxes paid to, foreign countries or possessions of the United States are as follows:
| Pay Date | Income | Taxes |
Institutional Class | 12/07/09 | $0.145 | $0.012 |
The fund will notify shareholders in January 2011 of amounts for use in preparing 2010 income tax returns.
Annual Report
Board Approval of Investment Advisory Contracts and Management Fees
Fidelity International Value Fund
Each year, the Board of Trustees, including the Independent Trustees (together, the Board), votes on the renewal of the management contract and sub-advisory agreements (together, the Advisory Contracts) for the fund. The Board, assisted by the advice of fund counsel and Independent Trustees' counsel, requests and considers a broad range of information relevant to the renewal of the Advisory Contracts throughout the year.
The Board meets regularly and considers at each of its meetings factors that are relevant to its annual consideration of the renewal of the fund's Advisory Contracts, including the services and support provided to the fund and its shareholders. The Board has established various standing committees, each composed of Independent Trustees with varying backgrounds, to which the Board has assigned specific subject matter responsibilities in order to enhance effective decision-making by the Board. The Board, acting directly and through its Committees, requests and receives information concerning the annual consideration of the renewal of the fund's Advisory Contracts. The Board also meets as needed to consider matters specifically related to the Board's annual consideration of the renewal of Advisory Contracts. Members of the Board may also meet with trustees of other Fidelity funds through ad hoc joint committees to discuss certain matters relevant to the Fidelity funds.
At its July 2010 meeting, the Board of Trustees, including the Independent Trustees, unanimously determined to renew the fund's Advisory Contracts. In reaching its determination, the Board considered all factors it believed relevant, including (i) the nature, extent, and quality of the services to be provided to the fund and its shareholders (including the investment performance of the fund); (ii) the competitiveness of the fund's management fee and total expenses; (iii) the total costs of the services to be provided by and the profits to be realized by Fidelity from its relationship with the fund; (iv) the extent to which economies of scale would be realized as the fund grows; and (v) whether fee levels reflect these economies of scale, if any, for the benefit of fund shareholders.
In considering whether to renew the Advisory Contracts for the fund, the Board reached a determination, with the assistance of fund counsel and Independent Trustees' counsel and through the exercise of its business judgment, that the renewal of the Advisory Contracts is in the best interests of fund shareholders and that the compensation to be received by Fidelity under the management contract is fair and reasonable. The Board's decision to renew the Advisory Contracts was not based on any single factor noted above, but rather was based on a comprehensive consideration of all the information provided to the Board at its meetings throughout the year. The Board, in reaching its determination to renew the Advisory Contracts, is aware that shareholders in the fund have a broad range of investment choices available to them, including a wide choice among mutual funds offered by Fidelity's competitors, and that the fund's shareholders, with the opportunity to review and weigh the disclosure provided by the fund in its prospectus and other public disclosures, have chosen to invest in this fund, managed by Fidelity.
Annual Report
Nature, Extent, and Quality of Services Provided. The Board considered the staffing within the investment adviser, FMR, and the sub-advisers (together, the Investment Advisers), including the backgrounds of the fund's investment personnel and the fund's investment objective and discipline. The Independent Trustees also had discussions with senior management of Fidelity's investment operations and investment groups. The Board considered the structure of the portfolio manager compensation program and whether this structure provides appropriate incentives to act in the best interest of the fund.
Resources Dedicated to Investment Management and Support Services. The Board and the equity research subcommittee of the Board's Fund Oversight Committee reviewed the size, education, and experience of the Investment Advisers' investment staff, their use of technology, and the Investment Advisers' approach to recruiting, training, and retaining portfolio managers and other research, advisory, and management personnel. The Board noted that Fidelity's analysts have access to a variety of technological tools and market and securities data that enable them to perform both fundamental and quantitative analysis and to specialize in various disciplines. The Board considered Fidelity's extensive global research capabilities that enable the Investment Advisers to aggregate data from various sources in an effort to produce positive investment results. The Board also considered that Fidelity's portfolio managers and analysts have access to daily portfolio attribution that allows for monitoring of a fund's portfolio, as well as an electronic communication system that provides immediate real-time access to research concerning issuers and credit enhancers. The Board noted FMR's continued focus on strengthening the organization and discipline of equity portfolio management and research.
Shareholder and Administrative Services. The Board considered (i) the nature, extent, quality, and cost of advisory, administrative, and shareholder services performed by the Investment Advisers and their affiliates under the Advisory Contracts and under separate agreements covering transfer agency, pricing and bookkeeping, and securities lending services for the fund; (ii) the nature and extent of the investment adviser's supervision of third party service providers, principally custodians and subcustodians; and (iii) the resources devoted to, and the record of compliance with, the fund's compliance policies and procedures. The Board also reviewed the allocation of fund brokerage, including allocations to brokers affiliated with the Investment Advisers, the use of brokerage commissions to pay fund expenses, and the use of "soft" commission dollars to pay for research services.
The Board noted that the growth of fund assets over time across the complex allows Fidelity to reinvest in the development of services designed to enhance the value or convenience of the Fidelity funds as investment vehicles. These services include 24-hour access to account information and market information through phone representatives and over the Internet, and investor education materials and asset allocation tools.
Annual Report
Board Approval of Investment Advisory Contracts and
Management Fees - continued
Investment in a Large Fund Family. The Board considered the benefits to shareholders of investing in a Fidelity fund, including the benefits of investing in a fund that is part of a large family of funds offering a variety of investment disciplines and providing a large variety of mutual fund investor services. The Board noted that Fidelity had taken, or had made recommendations that resulted in the Fidelity funds taking, a number of actions over the previous year that benefited particular funds, including (i) dedicating additional resources to investment research and restructuring and broadening the focus of the investment research teams; (ii) bolstering the senior management team that oversees asset management; (iii) launching Class F of certain funds as a lower-fee class available to Freedom K and Freedom Index Funds; (iv) lowering the initial investment minimums and ongoing balance requirements for Real Estate High Income Fund; (v) eliminating subsequent purchase minimums for all funds and adding a waiver of the investment minimum requirement for new accounts opened with the proceeds of a systematic withdrawal plan; (vi) eliminating the withdrawal minimum and maximum limits for systematic withdrawals from Advisor funds; (vii) expanding sales load waivers on Class A shares for Destiny Planholders and expanding Institutional Class eligibility for Class O Destiny Planholders; and (viii) changing certain Class A and Class T sales charge structures to further align them with industry practices.
Investment Performance. The Board considered whether the fund has operated in accordance with its investment objective, as well as its record of compliance with its investment restrictions. It also reviewed the fund's absolute investment performance for each class, as well as the fund's relative investment performance for each class measured over multiple periods against (i) a broad-based securities market index, and (ii) a custom peer group of mutual funds deemed appropriate by Fidelity and reviewed by the Board. Because the fund had been in existence less than five calendar years, the following charts considered by the Board show, over the one- and three-year periods ended December 31, 2009, the cumulative total returns of Institutional Class (Class I) and Class B of the fund, the cumulative total returns of a broad-based securities market index ("benchmark"), and a range of cumulative total returns of a custom peer group of mutual funds defined by FMR based on categories assigned by Morningstar, Inc. The returns of Institutional Class (Class I) and Class B show the performance of the highest and lowest performing classes, respectively (based on three-year performance). The box within each chart shows the 25th percentile return (bottom of box) and the 75th percentile return (top of box) of the peer group. Returns shown above the box are in the first quartile and returns shown below the box are in the fourth quartile. The percentage beaten numbers noted below each chart correspond to the percentile box and represent the percentage of funds in the peer group whose performance was equal to or lower than that of the class indicated. The fund's custom peer group, defined by FMR, is a peer group that FMR believes provides a more meaningful performance comparison than the peer group assigned by Morningstar, Inc., which assigns mutual funds to categories based on their investment styles as measured by their underlying portfolio holdings.
Annual Report
Fidelity International Value Fund
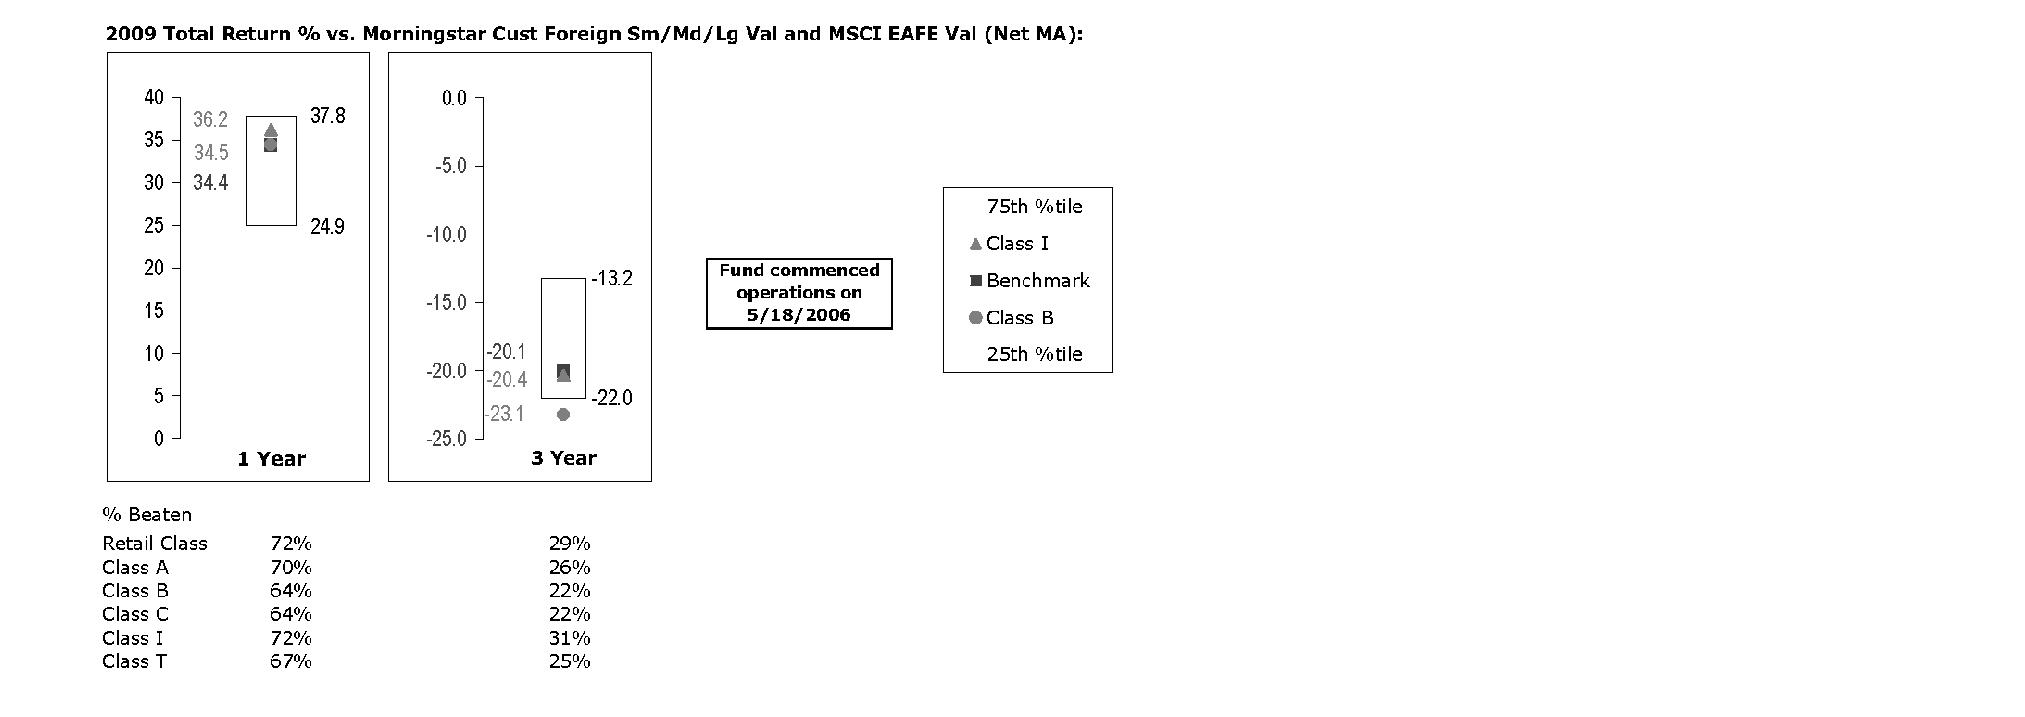
The Board reviewed the fund's relative investment performance against its peer group and noted that the performance of Institutional Class (Class I) of the fund was in the second quartile for the one-year period and the third quartile for the three-year period. The Board also noted that the investment performance of Institutional Class (Class I) of the fund compared favorably to its benchmark for the one-year period, although the fund's three-year cumulative total return was lower than its benchmark. The Board considered that the variations in performance among the fund's classes reflect the variations in class expenses, which result in lower performance for higher expense classes. The Board also reviewed the fund's performance since inception as well as performance in the current year.
The Board also considered that the fund's management fee is subject to upward or downward adjustment depending upon whether, and to what extent, the fund's investment performance for the performance period exceeds, or is exceeded by, the record (over the same period) of a Board-approved performance adjustment index. The Board realizes that the performance adjustment provides FMR with a strong economic incentive to seek to achieve superior performance for the fund's shareholders and helps to more closely align the interests of FMR and the fund's shareholders.
Annual Report
Board Approval of Investment Advisory Contracts and
Management Fees - continued
Based on its review, and giving particular weight to the nature and quality of the resources dedicated by the Investment Advisers to maintain and improve relative performance and factoring in the unprecedented market events in recent years, the Board concluded that the nature, extent, and quality of investment management and support services and of shareholder and administrative services provided to the fund will benefit the fund's shareholders, particularly in light of the Board's view that the fund's shareholders benefit from investing in a fund that is part of a large family of funds offering a variety of investment disciplines and services.
Competitiveness of Management Fee and Total Fund Expenses. The Board considered the fund's management fee and total expenses compared to "mapped groups" of competitive funds and classes. Fidelity creates "mapped groups" by combining similar Lipper investment objective categories that have comparable management fee characteristics. Combining Lipper investment objective categories aids the Board's management fee and total expense comparisons by broadening the competitive group used for comparison and by reducing the number of universes to which various Fidelity funds are compared.
Management Fee. The Board considered two proprietary management fee comparisons for the 12-month (or shorter) periods shown in the chart below. The group of Lipper funds used by the Board for management fee comparisons is referred to below as the "Total Mapped Group." The Total Mapped Group comparison focuses on a fund's standing relative to the total universe of comparable funds available to investors, in terms of gross management fees before expense reimbursements or caps, and without giving effect to the fund's performance adjustment. "TMG %" represents the percentage of funds in the Total Mapped Group that had management fees that were lower than the fund's. For example, a TMG % of 15% means that 85% of the funds in the Total Mapped Group had higher management fees than the fund. The "Asset-Size Peer Group" (ASPG) comparison focuses on a fund's standing relative to non-Fidelity funds similar in size to the fund within the Total Mapped Group. The ASPG represents at least 15% of the funds in the Total Mapped Group with comparable asset size and management fee characteristics, subject to a minimum of 50 funds (or all funds in the Total Mapped Group if fewer than 50). Additional information, such as the ASPG quartile in which the fund's management fee ranked and the impact of the fund's performance adjustment, is also included in the chart and considered by the Board.
Annual Report
Fidelity International Value Fund

The Board noted that the fund's management fee ranked below the median of its Total Mapped Group and below the median of its ASPG for 2009. The Board also noted the effect of the fund's negative performance adjustment on the fund's management fee ranking. The Board noted that the performance adjustment for each year represents calculations for performance periods that differ from the periods shown in the performance charts above.
Based on its review, the Board concluded that the fund's management fee is fair and reasonable in light of the services that the fund receives and the other factors considered.
Total Expenses. In its review of each class's total expenses, the Board considered the fund's management fee as well as other fund or class expenses, as applicable, such as transfer agent fees, pricing and bookkeeping fees, fund-paid 12b-1 fees, and custodial, legal, and audit fees. The Board also noted the effects of any waivers and reimbursements on fees and expenses, as well as the impact of the fund's performance adjustment. As part of its review, the Board also considered current and historical total expenses of each class of the fund compared to competitive fund median expenses. Each class of the fund is compared to those funds and classes in the Total Mapped Group (used by the Board for management fee comparisons) that have a similar sales load structure.
The Board noted that the total expenses of each of Class A, Class B, Class C, Institutional Class, and the retail class ranked below its competitive median for 2009 and the total expenses of Class T ranked above its competitive median for 2009. The Board considered that the total expenses for Class T were above the median primarily because its 12b-1 fee is higher than the typical front-end load class. The Board noted that the fund offers multiple classes, each of which has a different sales load and 12b-1 fee structure, and that the multiple structures are intended to offer a range of pricing options for the intermediary market. The Board also noted that the total expenses of the classes vary primarily by the level of their 12b-1 fees, although differences in transfer agent fees may also cause expenses to vary from class to class.
Annual Report
Board Approval of Investment Advisory Contracts and
Management Fees - continued
Fees Charged to Other Fidelity Clients. The Board also considered Fidelity fee structures and other information with respect to clients of FMR and its affiliates, such as other mutual funds advised or subadvised by FMR or its affiliates, pension plan clients, and other institutional clients. In March 2010, the Board created an ad hoc joint committee with the board of other Fidelity funds (the Committee) to review and compare Fidelity's institutional investment advisory business with its business of providing services to the Fidelity funds, including the differences in services provided, fees charged, and costs incurred, as well as competition in their respective marketplaces.
Based on its review of total expenses and fees charged to other Fidelity clients, the Board concluded that the total expenses of each class of the fund were reasonable, although in one case above the median of the universe presented for comparison, in light of the services that the fund and its shareholders receive and the other factors considered, including the findings of the Committee.
Costs of the Services and Profitability. The Board considered the revenues earned and the expenses incurred by Fidelity in conducting the business of developing, marketing, distributing, managing, administering and servicing the fund and its shareholders. The Board also considered the level of Fidelity's profits in respect of all the Fidelity funds.
On an annual basis, FMR presents to the Board Fidelity's profitability for the fund. Fidelity calculates the profitability for each fund, as well as aggregate profitability for groups of Fidelity funds and all Fidelity funds, using a series of detailed revenue and cost allocation methodologies which originate with the audited books and records of Fidelity. The Audit Committee of the Board reviews any significant changes from the prior year's methodologies.
PricewaterhouseCoopers LLP (PwC), independent registered public accounting firm and auditor to Fidelity and certain Fidelity funds, has been engaged annually by the Board as part of the Board's assessment of Fidelity's profitability analysis. PwC's engagement includes the review and assessment of Fidelity's methodologies used in determining the revenues and expenses attributable to Fidelity's mutual fund business, and completion of agreed-upon procedures surrounding the mathematical accuracy of fund profitability and its conformity to allocation methodologies. After considering PwC's reports issued under the engagement and information provided by Fidelity, the Board believes that while other allocation methods may also be reasonable, Fidelity's profitability methodologies are reasonable in all material respects.
Annual Report
The Board has also reviewed Fidelity's non-fund businesses and fall-out benefits related to the mutual fund business as well as cases where Fidelity's affiliates may benefit from or be related to the fund's business.
The Board considered the costs of the services provided by and the profits realized by Fidelity in connection with the operation of the fund and were satisfied that the profitability was not excessive in the circumstances.
Economies of Scale. The Board considered whether there have been economies of scale in respect of the management of the Fidelity funds, whether the Fidelity funds (including the fund) have appropriately benefited from any such economies of scale, and whether there is potential for realization of any further economies of scale. The Board considered the extent to which the fund will benefit from economies of scale through increased services to the fund, through waivers or reimbursements, or through fee or expense reductions.
In February 2009, the Board and the board of other Fidelity funds created an ad hoc committee (the Economies of Scale Committee) to analyze whether FMR attains economies of scale in respect of the management and servicing of the Fidelity funds, whether the Fidelity funds have appropriately benefited from such economies of scale, and whether there is potential for realization of any further economies of scale.
The Board recognized that the fund's management contract incorporates a "group fee" structure, which provides for lower group fee rates as total fund assets under FMR's management increase, and for higher group fee rates as total fund assets under FMR's management decrease. FMR calculates the group fee rates based on a tiered asset "breakpoint" schedule that varies based on asset class. The Board considered that the group fee is designed to deliver the benefits of economies of scale to fund shareholders when total Fidelity fund assets increase, even if assets of any particular fund are unchanged or have declined, because some portion of Fidelity's costs are attributable to services provided to all Fidelity funds, and all funds benefit if those costs can be allocated among more assets. The Board concluded that, given the group fee structure, fund shareholders will benefit from lower management fees as assets under FMR's management increase at the fund complex level, regardless of whether Fidelity achieves any such economies of scale.
The Board concluded, considering the findings of the Economies of Scale Committee, that any potential economies of scale are being appropriately shared between fund shareholders and Fidelity.
Additional Information Requested by the Board. In order to develop fully the factual basis for consideration of the Fidelity funds' Advisory Contracts, the Board requested and received additional information on certain topics, including (i) fund performance trends, actions to be taken by FMR to improve certain funds' overall performance, and Fidelity's long-term strategies for certain funds; (ii) portfolio manager changes that have occurred during the past year and length of portfolio manager tenure for different categories of funds over time; (iii) Fidelity's compensation structure for portfolio managers, research analysts, and other key personnel, the rationale for the compensation structure, and how the compensation structure provides appropriate performance incentives; (iv) the amount of the investment that each portfolio manager has made in the Fidelity fund(s) that he or she manages; (v) management and other fees paid by FMR to affiliated sub-advisers on behalf of the Fidelity funds; (vi) Fidelity's fee structures and rationale for recommending different fees among different categories of funds; (vii) Fidelity's rationale for recommending which funds should have a performance adjustment component as part of their management fees; (viii) the rationale for any differences between fund fee structures and fee structures in place for other Fidelity clients; and (ix) explanations regarding the relative total expenses borne by certain funds and classes, total expense competitive trends, and actions that might be taken by FMR to reduce total expenses for certain funds and classes.
Annual Report
Board Approval of Investment Advisory Contracts and
Management Fees - continued
Based on its evaluation of all of the conclusions noted above, and after considering all factors it believed relevant, the Board ultimately concluded that the advisory fee structures are fair and reasonable, and that the fund's Advisory Contracts should be renewed.
Annual Report
Investment Adviser
Fidelity Management & Research Company
Boston, MA
Investment Sub-Advisers
FMR Co., Inc.
Fidelity Management & Research
(U.K.) Inc.
Fidelity Management & Research
(Hong Kong) Limited
Fidelity Management & Research
(Japan) Inc.
Fidelity Research & Analysis Company
FIL Investment Advisors
FIL Investments (Japan) Limited
FIL Investment Advisors (U.K.) Ltd.
General Distributor
Fidelity Distributors Corporation
Boston, MA
Transfer and Service Agents
Fidelity Investments Institutional Operations Company, Inc.
Boston, MA
Fidelity Service Company, Inc.
Boston, MA
Custodian
The Northern Trust Company
Chicago, IL
AFIVI-UANN-1210
1.827488.104
Fidelity®
Series Emerging Markets
Fund
Fidelity Series Emerging Markets Fund
Class F
Annual Report
October 31, 2010
(2_fidelity_logos) (Registered_Trademark)
Contents
Performance | <Click Here> | How the fund has done over time. |
Management's Discussion of Fund Performance | <Click Here> | The Portfolio Manager's review of fund performance and strategy. |
Shareholder Expense Example | <Click Here> | An example of shareholder expenses. |
Investment Changes | <Click Here> | A summary of major shifts in the fund's investments over the past six months. |
Investments | <Click Here> | A complete list of the fund's investments with their market values. |
Financial Statements | <Click Here> | Statements of assets and liabilities, operations, and changes in net assets, as well as financial highlights. |
Notes | <Click Here> | Notes to the Financial Statements. |
Report of Independent Registered Public Accounting Firm | <Click Here> | |
Trustees and Officers | <Click Here> | |
Distributions | <Click Here> | |
Board Approval of Investment Advisory Contracts and Management Fees | <Click Here> | |
To view a fund's proxy voting guidelines and proxy voting record for the 12-month period ended June 30, visit http://www.fidelity.com/proxyvotingresults or visit the Securities and Exchange Commission's (SEC) web site at http://www.sec.gov. You may also call 1-800-544-8544 for Fidelity Series Emerging Markets Fund or 1-800-835-5092 for Class F to request a free copy of the proxy voting guidelines.
Standard & Poor's, S&P and S&P 500 are registered service marks of The McGraw-Hill Companies, Inc. and have been licensed for use by Fidelity Distributors Corporation.
Other third party marks appearing herein are the property of their respective owners.
All other marks appearing herein are registered or unregistered trademarks or service marks of FMR LLC or an affiliated company.
Annual Report
This report and the financial statements contained herein are submitted for the general information of the shareholders of the fund. This report is not authorized for distribution to prospective investors in the fund unless preceded or accompanied by an effective prospectus.
A fund files its complete schedule of portfolio holdings with the SEC for the first and third quarters of each fiscal year on Form N-Q. Forms N-Q are available on the SEC's web site at http://www.sec.gov. A fund's Forms N-Q may be reviewed and copied at the SEC's Public Reference Room in Washington, DC. Information regarding the operation of the SEC's Public Reference Room may be obtained by calling 1-800-SEC-0330. For a complete list of a fund's portfolio holdings, view the most recent holdings listing, semiannual report, or annual report on Fidelity's web site at http://www.fidelity.com or http://www.advisor.fidelity.com, as applicable.
NOT FDIC INSURED • MAY LOSE VALUE • NO BANK GUARANTEE
Neither the fund nor Fidelity Distributors Corporation is a bank.
Annual Report
Average annual total return reflects the change in the value of an investment, assuming reinvestment of the class' distributions from dividend income and capital gains (the profits earned upon the sale of securities that have grown in value, if any) and assuming a constant rate of performance each year. The $10,000 table and the fund's returns do not reflect the deduction of taxes that a shareholder would pay on fund distributions or the redemption of fund shares. During periods of reimbursement by Fidelity, a fund's total return will be greater than it would be had the reimbursement not occurred. How a fund did yesterday is no guarantee of how it will do tomorrow.
Average Annual Total Returns
Periods ended October 31, 2010 | Past 1
year | Life of
fund A |
Fidelity® Series Emerging Markets Fund | 27.32% | 47.70% |
Class F B | 27.59% | 47.97% |
A From December 9, 2008.
B The initial offering of Class F shares took place on June 26, 2009. Returns prior to June 26, 2009 are those of Fidelity Series Emerging Markets Fund, the original class of the fund.
$10,000 Over Life of Fund
Let's say hypothetically that $10,000 was invested in Fidelity® Series Emerging Markets Fund, a class of the fund, on December 9, 2008, when the fund started. The chart shows how the value of your investment would have changed, and also shows how the MSCI® Emerging Markets (EM) Index performed over the same period.
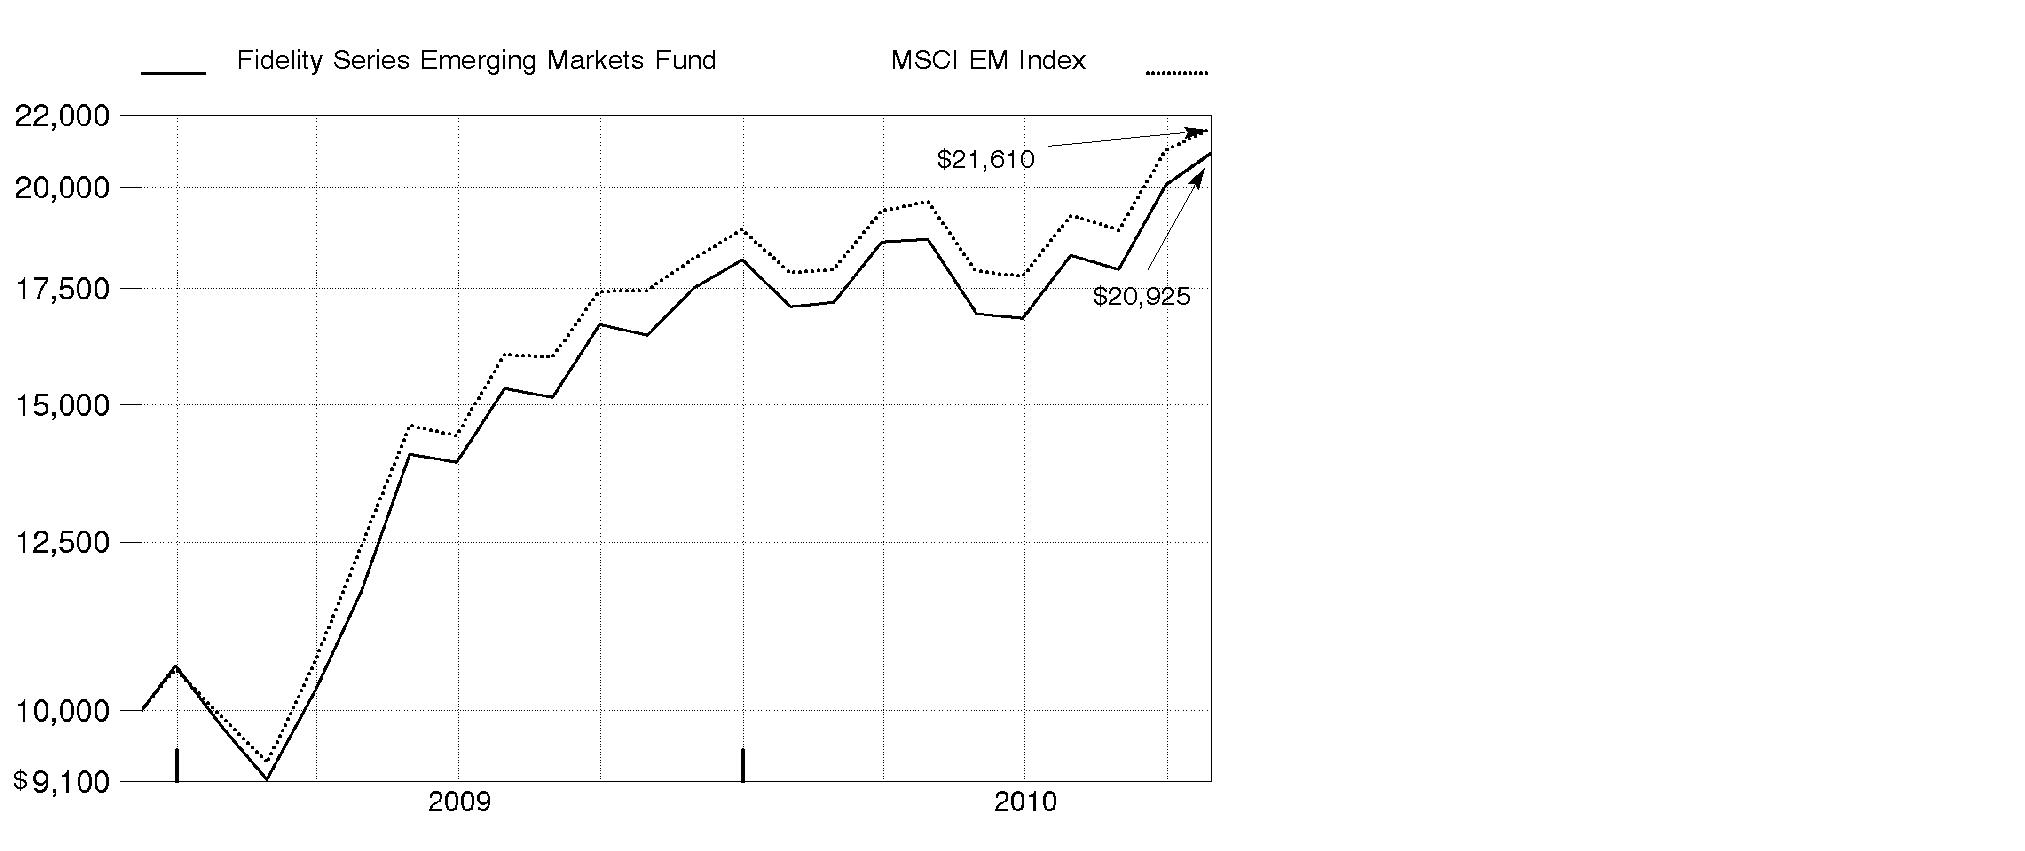
Annual Report
Market Recap: The return-to-risk theme was evident within emerging markets during the 12 months ending October 31, 2010. The combination of strong economic growth and superior fiscal conditions bolstered the performance of emerging-markets stocks, as they finished the period well ahead of most foreign developed-country stock indexes. Several smaller country constituents provided a big boost to the index, while most of its biggest components, though strong, still lagged. The falling value of the U.S. dollar relative to most emerging-markets currencies also provided a meaningful contribution. Rising commodity prices supported returns in commodity-producing regions, such as Latin America, which also benefited from the announced integration of the Chile, Colombia and Peru stock exchanges, scheduled for November. For the 12 months ending October 31, 2010, the MSCI® Emerging Markets Index climbed 23.89%. Among emerging-markets countries, major index components South Korea, Taiwan, Brazil and China gained roughly 25%, 21%, 15% and 9%, respectively. India, also a large constituent, solidly beat the index, returning about 35%. Other strong-performing countries included Thailand (62%), Turkey (55%), Indonesia (52%), Malaysia (36%), Mexico (34%) and South Africa (33%).
Comments from Timothy Gannon, James Hayes, Jessamyn Larrabee, Carolina Pierry and Sam Polyak, Co-Portfolio Managers of Fidelity® Series Emerging Markets Fund: For the year, the fund's Series Emerging Markets and Class F shares gained 27.32% and 27.59%, respectively, solidly outperforming the MSCI index. Performance was driven by strong overall security selection, most notably in information technology, materials, energy and financials. Market selection also was beneficial, but to a much lesser extent. On a country basis, the biggest contributions came from our holdings in China, Russia, Brazil, India and Hong Kong. Notable detractors included security selection in Mexico and, from a sector standpoint, utilities and health care. In terms of individual holdings, the largest contributors were three out-of-index holdings: Bank of Baroda, a public sector lender in India; Baidu, China's leading Internet search engine; and Canadian mining and exploration firm Uranium One. The fund also benefited from not owning poor-performing China Life Insurance, a Beijing-based provider of a variety of insurance products and a sizable index component. The largest individual detractor was an overweighted stake in KB Financial Group, South Korea's largest financial holding company. Not owning automobile manufacturer and benchmark constituent Hyundai Motor also hurt, as did underweighting the U.S.-listed shares of Israeli drug firm Teva Pharmaceutical Industries. Teva was not held at period end.
The views expressed above reflect those of the portfolio manager(s) only through the end of the period as stated on the cover of this report and do not necessarily represent the views of Fidelity or any other person in the Fidelity organization. Any such views are subject to change at any time based upon market or other conditions and Fidelity disclaims any responsibility to update such views. These views may not be relied on as investment advice and, because investment decisions for a Fidelity fund are based on numerous factors, may not be relied on as an indication of trading intent on behalf of any Fidelity fund.
Annual Report
Shareholder Expense Example
As a shareholder of the Fund, you incur two types of costs: (1) transaction costs, and (2) ongoing costs, including management fees and other Fund expenses. This Example is intended to help you understand your ongoing costs (in dollars) of investing in the Fund and to compare these costs with the ongoing costs of investing in other mutual funds.
The Example is based on an investment of $1,000 invested at the beginning of the period and held for the entire period (May 1, 2010 to October 31, 2010).
Actual Expenses
The first line of the accompanying table for each class of the Fund provides information about actual account values and actual expenses. You may use the information in this line, together with the amount you invested, to estimate the expenses that you paid over the period. Simply divide your account value by $1,000.00 (for example, an $8,600 account value divided by $1,000.00 = 8.6), then multiply the result by the number in the first line for a class of the Fund under the heading entitled "Expenses Paid During Period" to estimate the expenses you paid on your account during this period. In addition, the Fund, as a shareholder in the underlying Fidelity Central Funds, will indirectly bear its pro-rata share of the fees and expenses incurred by the underlying Fidelity Central Funds. These fees and expenses are not included in the Fund's annualized expense ratio used to calculate the expense estimate in the table below.
Hypothetical Example for Comparison Purposes
The second line of the accompanying table for each class of the Fund provides information about hypothetical account values and hypothetical expenses based on a Class' actual expense ratio and an assumed rate of return of 5% per year before expenses, which is not the Class' actual return. The hypothetical account values and expenses may not be used to estimate the actual ending account balance or expenses you paid for the period. You may use this information to compare the ongoing costs of investing in the Fund and other funds. To do so, compare this 5% hypothetical example with the 5% hypothetical examples that appear in the shareholder reports of the other funds. In addition, the Fund, as a shareholder in the underlying Fidelity Central Funds, will indirectly bear its pro-rata share of the fees and expenses incurred by the underlying Fidelity Central Funds. These fees and expenses are not included in the Fund's annualized expense ratio used to calculate the expense estimate in the table below.
Please note that the expenses shown in the table are meant to highlight your ongoing costs only and do not reflect any transaction costs. Therefore, the second line of the table is useful in comparing ongoing costs only, and will not help you determine the relative total costs of owning different funds.
Annual Report
| Annualized
Expense Ratio | Beginning
Account Value
May 1, 2010 | Ending
Account Value
October 31, 2010 | Expenses Paid
During Period*
May 1, 2010 to
October 31, 2010 |
Series Emerging Markets | 1.16% | | | |
Actual | | $ 1,000.00 | $ 1,121.40 | $ 6.20 |
HypotheticalA | | $ 1,000.00 | $ 1,019.36 | $ 5.90 |
Class F | .93% | | | |
Actual | | $ 1,000.00 | $ 1,122.30 | $ 4.97 |
HypotheticalA | | $ 1,000.00 | $ 1,020.52 | $ 4.74 |
A 5% return per year before expenses
* Expenses are equal to each Class' annualized expense ratio, multiplied by the average account value over the period, multiplied by 184/365 (to reflect the one-half year period).
Annual Report
Investment Changes (Unaudited)
Geographic Diversification (% of fund's net assets) |
As of October 31, 2010 |
| Brazil 16.2% | |
| Korea (South) 10.6% | |
| India 9.5% | |
| Russia 8.4% | |
| China 7.9% | |
| Taiwan 7.2% | |
| South Africa 6.1% | |
| Hong Kong 4.6% | |
| Mexico 3.9% | |
| Other 25.6% | |

Percentages are adjusted for the effect of futures contracts, if applicable. |
As of April 30, 2010 |
| Brazil 16.3% | |
| Korea (South) 13.6% | |
| China 9.0% | |
| India 8.8% | |
| Russia 8.4% | |
| Taiwan 6.1% | |
| South Africa 5.7% | |
| Hong Kong 4.9% | |
| Mexico 4.4% | |
| Other 22.8% | |

Percentages are adjusted for the effect of futures contracts, if applicable. |
Asset Allocation |
| % of fund's
net assets | % of fund's net assets
6 months ago |
Stocks | 98.9 | 98.7 |
Short-Term Investments and Net Other Assets | 1.1 | 1.3 |
Top Ten Stocks as of October 31, 2010 |
| % of fund's
net assets | % of fund's net assets
6 months ago |
China Construction Bank Corp. (H Shares) (China, Commercial Banks) | 2.2 | 1.8 |
America Movil SAB de CV Series L sponsored ADR (Mexico, Wireless Telecommunication Services) | 2.0 | 1.9 |
Samsung Electronics Co. Ltd. (Korea (South), Semiconductors & Semiconductor Equipment) | 2.0 | 2.7 |
Industrial & Commercial Bank of China Ltd. (H Shares) (China, Commercial Banks) | 1.9 | 1.8 |
Petroleo Brasileiro SA - Petrobras (ON) sponsored ADR (Brazil, Oil, Gas & Consumable Fuels) | 1.8 | 2.0 |
Uranium One, Inc. (Canada, Oil, Gas & Consumable Fuels) | 1.7 | 0.0 |
Sberbank (Savings Bank of the Russian Federation) GDR (Russia, Commercial Banks) | 1.7 | 1.0 |
CNOOC Ltd. sponsored ADR (Hong Kong, Oil, Gas & Consumable Fuels) | 1.7 | 1.3 |
Taiwan Semiconductor Manufacturing Co. Ltd. (Taiwan, Semiconductors & Semiconductor Equipment) | 1.6 | 1.2 |
China Mobile (Hong Kong) Ltd. sponsored ADR (Hong Kong, Wireless Telecommunication Services) | 1.4 | 1.4 |
| 18.0 | |
Market Sectors as of October 31, 2010 |
| % of fund's
net assets | % of fund's net assets
6 months ago |
Financials | 25.0 | 23.3 |
Energy | 15.2 | 14.0 |
Materials | 13.2 | 15.3 |
Information Technology | 12.1 | 13.8 |
Industrials | 8.4 | 7.3 |
Telecommunication Services | 7.4 | 7.9 |
Consumer Discretionary | 7.0 | 5.7 |
Consumer Staples | 6.3 | 5.4 |
Utilities | 3.6 | 3.6 |
Health Care | 0.7 | 2.4 |
Annual Report
Investments October 31, 2010
Showing Percentage of Net Assets
Common Stocks - 98.9% |
| Shares | | Value |
Argentina - 0.6% |
Banco Macro SA sponsored ADR | 266,000 | | $ 13,260,100 |
BBVA Banco Frances SA sponsored ADR (d) | 446,974 | | 5,386,037 |
TOTAL ARGENTINA | | 18,646,137 |
Bahamas (Nassau) - 0.2% |
Petrominerales Ltd. | 259,300 | | 6,643,307 |
Bailiwick of Guernsey - 0.2% |
Chariot Oil & Gas Ltd. (a) | 2,132,900 | | 6,808,822 |
Bailiwick of Jersey - 0.2% |
Heritage Oil PLC | 786,900 | | 4,343,221 |
Bermuda - 0.6% |
GP Investments, Ltd. unit (a) | 1,489,353 | | 6,303,399 |
Trinity Ltd. | 11,310,000 | | 11,308,176 |
TOTAL BERMUDA | | 17,611,575 |
Brazil - 16.2% |
AES Tiete SA (PN) (non-vtg.) | 528,300 | | 7,282,292 |
Anhanguera Educacional Participacoes SA unit | 404,530 | | 8,013,556 |
Banco do Brasil SA | 2,045,857 | | 39,805,941 |
Banco do Estado do Rio Grande do Sul SA | 2,368,400 | | 26,020,101 |
BM&F Bovespa SA | 1,411,300 | | 11,821,670 |
BR Properties SA | 717,400 | | 6,915,918 |
Brasil Insurance Participacoes e Administracao SA (a) | 5,000 | | 3,967,787 |
Centrais Eletricas Brasileiras SA (Electrobras) (PN-B) | 621,200 | | 10,038,084 |
Cia Hering SA | 173,700 | | 8,551,243 |
Companhia Brasileira de Distribuicao Grupo Pao de Acucar sponsored ADR (d) | 183,600 | | 7,272,396 |
Companhia Paranaense de Energia-Copel (PN-B) sponsored ADR (d) | 327,600 | | 7,610,148 |
Companhia Siderurgica Nacional SA (CSN) sponsored ADR (d) | 563,800 | | 9,516,944 |
Cosan SA Industria e Comercio | 879,700 | | 13,884,285 |
Ecorodovias Infraestrutura e Logistica SA (a) | 1,396,000 | | 10,585,704 |
Gafisa SA sponsored ADR | 702,900 | | 11,801,691 |
Iguatemi Empresa de Shopping Centers SA | 688,900 | | 16,076,493 |
Itau Unibanco Banco Multiplo SA: | | | |
ADR | 1,245,760 | | 30,595,866 |
ADR (a)(e) | 267,800 | | 6,577,168 |
Localiza Rent A Car SA | 679,000 | | 11,235,510 |
Lojas Renner SA | 317,000 | | 12,521,984 |
Mills Estruturas e Servicos de Engenharia SA (a) | 969,000 | | 11,693,846 |
Multiplus SA | 536,000 | | 9,105,573 |
Common Stocks - continued |
| Shares | | Value |
Brazil - continued |
Natura Cosmeticos SA | 552,000 | | $ 15,802,022 |
OGX Petroleo e Gas Participacoes SA (a) | 1,877,700 | | 24,635,707 |
PDG Realty SA Empreendimentos e Participacoes | 1,201,900 | | 15,027,283 |
Petroleo Brasileiro SA - Petrobras: | | | |
(ON) sponsored ADR | 1,550,200 | | 52,892,824 |
(PN) sponsored ADR (non-vtg.) | 560,000 | | 17,466,400 |
Tele Norte Leste Participacoes SA sponsored ADR (non-vtg.) (d) | 565,900 | | 8,680,906 |
TIM Participacoes SA | 2,808,100 | | 9,194,167 |
TIM Participacoes SA sponsored ADR (non-vtg.) | 146,600 | | 4,729,316 |
Vale SA (PN-A) sponsored ADR | 1,311,900 | | 37,690,887 |
TOTAL BRAZIL | | 467,013,712 |
Canada - 3.3% |
Africa Oil Corp. (a) | 1,770,100 | | 3,523,191 |
First Quantum Minerals Ltd. | 180,000 | | 15,762,134 |
IAMGOLD Corp. | 502,000 | | 9,159,937 |
Pacific Rubiales Energy Corp. (a) | 243,900 | | 7,774,477 |
Uranium One, Inc. (a) | 12,157,700 | | 49,708,412 |
Yamana Gold, Inc. | 790,000 | | 8,690,852 |
TOTAL CANADA | | 94,619,003 |
Cayman Islands - 3.4% |
Alibaba.com Ltd. (a)(d) | 4,243,500 | | 8,288,546 |
China Shanshui Cement Group Ltd. | 33,552,000 | | 23,893,829 |
CNinsure, Inc. ADR (d) | 280,350 | | 7,204,995 |
Enn Energy Holdings Ltd. | 3,622,000 | | 10,887,612 |
Eurasia Drilling Co. Ltd. GDR (Reg. S) | 502,600 | | 12,816,300 |
Hengdeli Holdings Ltd. | 13,064,000 | | 7,247,244 |
Mongolian Mining Corp. | 4,216,000 | | 4,563,424 |
Shenguan Holdings Group Ltd. | 9,926,000 | | 12,933,733 |
Trina Solar Ltd. ADR (a)(d) | 273,400 | | 7,316,184 |
Trony Solar Holdings Co. Ltd. | 6,578,000 | | 4,115,891 |
TOTAL CAYMAN ISLANDS | | 99,267,758 |
Chile - 0.5% |
Enersis SA | 29,209,724 | | 13,345,768 |
China - 7.9% |
Baidu.com, Inc. sponsored ADR (a) | 105,200 | | 11,573,052 |
China Construction Bank Corp. (H Shares) | 66,196,000 | | 63,110,912 |
Digital China Holdings Ltd. (H Shares) | 3,368,000 | | 6,083,148 |
Golden Eagle Retail Group Ltd. (H Shares) | 4,341,000 | | 11,536,797 |
Common Stocks - continued |
| Shares | | Value |
China - continued |
Harbin Power Equipment Co. Ltd. (H Shares) | 7,184,000 | | $ 9,675,983 |
Industrial & Commercial Bank of China Ltd. (H Shares) | 67,872,000 | | 54,639,094 |
Maanshan Iron & Steel Co. Ltd. (H Shares) | 8,812,000 | | 5,047,609 |
Minth Group Ltd. | 4,928,000 | | 9,218,642 |
Ping An Insurance Group Co. China Ltd. (H Shares) | 2,945,000 | | 31,705,886 |
Tencent Holdings Ltd. | 375,000 | | 8,587,325 |
Weichai Power Co. Ltd. (H Shares) | 1,286,000 | | 16,889,508 |
TOTAL CHINA | | 228,067,956 |
Colombia - 0.4% |
Ecopetrol SA ADR (d) | 268,400 | | 12,813,416 |
Egypt - 0.6% |
Commercial International Bank Ltd. | 2,191,900 | | 16,511,130 |
Hong Kong - 4.6% |
Cathay Pacific Airways Ltd. | 3,297,000 | | 8,868,563 |
China Agri-Industries Holding Ltd. | 10,650,000 | | 15,498,403 |
China Mobile (Hong Kong) Ltd. | 49,500 | | 505,510 |
China Mobile (Hong Kong) Ltd. sponsored ADR (d) | 793,800 | | 40,777,506 |
CNOOC Ltd. sponsored ADR (d) | 231,200 | | 48,302,304 |
Lenovo Group Ltd. | 12,000,000 | | 7,771,650 |
Shanghai Industrial Holdings Ltd. | 2,146,000 | | 9,883,851 |
TOTAL HONG KONG | | 131,607,787 |
Hungary - 0.4% |
MOL Hungarian Oil and Gas PLC Series A (For. Reg.) (a) | 115,300 | | 12,255,276 |
India - 9.5% |
Adani Power Ltd. (a) | 3,742,234 | | 10,886,883 |
Bank of Baroda | 699,306 | | 16,592,028 |
Bank of India | 847,054 | | 9,298,006 |
Dabur India Ltd. | 4,230,641 | | 9,520,732 |
Future Mall Management Ltd. | 32,095 | | 0 |
Grasim Industries Ltd. | 414,821 | | 21,810,212 |
Housing Development and Infrastructure Ltd. (a) | 1,103,396 | | 6,161,095 |
Idea Cellular Ltd. (a) | 3,805,512 | | 5,790,903 |
Indiabulls Real Estate Ltd. (a) | 2,684,165 | | 11,590,506 |
Infosys Technologies Ltd. sponsored ADR | 469,400 | | 31,656,336 |
Jain Irrigation Systems Ltd. | 1,955,845 | | 10,237,023 |
JK Cement Ltd. | 1,063,196 | | 4,166,433 |
Larsen & Toubro Ltd. | 376,406 | | 17,219,991 |
Pantaloon Retail India Ltd. | 697,802 | | 7,695,951 |
Power Finance Corp. Ltd. | 705,191 | | 5,727,440 |
Reliance Industries Ltd. | 1,286,666 | | 31,821,943 |
Common Stocks - continued |
| Shares | | Value |
India - continued |
State Bank of India | 147,895 | | $ 10,512,307 |
Tata Consultancy Services Ltd. | 759,551 | | 18,042,442 |
Ultratech Cement Ltd. | 715,367 | | 17,751,431 |
Union Bank of India | 1,054,947 | | 9,056,780 |
Unitech Ltd. | 8,442,806 | | 16,533,233 |
TOTAL INDIA | | 272,071,675 |
Indonesia - 3.3% |
PT Bakrieland Development Tbk | 499,483,000 | | 8,830,012 |
PT Bank Central Asia Tbk | 6,564,000 | | 5,141,030 |
PT Bank Rakyat Indonesia Tbk | 16,759,500 | | 21,377,131 |
PT Bank Tabungan Negara Tbk | 34,049,500 | | 7,581,364 |
PT Gudang Garam Tbk | 2,222,500 | | 11,861,611 |
PT Indofood Sukses Makmur Tbk | 23,111,500 | | 13,446,677 |
PT Indosat Tbk | 13,580,500 | | 9,116,970 |
PT Perusahaan Gas Negara Tbk Series B | 23,378,500 | | 10,593,883 |
PT Tower Bersama Infrastructure Tbk | 29,435,000 | | 8,398,229 |
TOTAL INDONESIA | | 96,346,907 |
Kazakhstan - 0.3% |
JSC Halyk Bank of Kazakhstan unit (a) | 779,580 | | 7,250,094 |
Korea (South) - 10.6% |
Doosan Heavy Industries & Construction Co. Ltd. | 158,188 | | 12,463,721 |
Hana Financial Group, Inc. | 197,830 | | 5,620,869 |
Hyundai Mipo Dockyard Co. Ltd. | 85,125 | | 14,231,657 |
Hyundai Mobis | 106,662 | | 26,558,787 |
KB Financial Group, Inc. | 649,270 | | 28,928,092 |
Kia Motors Corp. | 493,650 | | 19,710,878 |
Korea Electric Power Corp. (a) | 417,740 | | 11,002,423 |
LG Display Co. Ltd. | 375,680 | | 12,890,832 |
LG Innotek Co. Ltd. | 69,122 | | 8,021,716 |
NCsoft Corp. | 41,141 | | 9,055,043 |
Orion Corp. | 37,306 | | 12,507,212 |
POSCO | 20,055 | | 8,282,780 |
S-Oil Corp. | 141,881 | | 8,756,372 |
Samsung C&T Corp. | 297,280 | | 17,448,179 |
Samsung Electronics Co. Ltd. | 85,103 | | 56,382,148 |
Samsung Engineering Co. Ltd. | 103,867 | | 16,579,923 |
Shinhan Financial Group Co. Ltd. sponsored ADR (d) | 383,100 | | 29,793,687 |
Tong Yang Life Insurance Co. Ltd. | 784,310 | | 8,299,945 |
TOTAL KOREA (SOUTH) | | 306,534,264 |
Common Stocks - continued |
| Shares | | Value |
Luxembourg - 0.3% |
Millicom International Cellular SA | 105,500 | | $ 9,980,300 |
Malaysia - 0.6% |
Axiata Group Bhd (a) | 12,148,700 | | 17,533,804 |
Mexico - 3.9% |
America Movil SAB de CV Series L sponsored ADR | 998,400 | | 57,168,384 |
Corporacion Geo SAB de CV Series B (a) | 2,668,600 | | 8,467,870 |
Empresas ICA Sociedad Controladora SAB de CV sponsored ADR (a)(d) | 813,500 | | 8,574,290 |
Gruma SAB de CV Series B (a) | 4,243,400 | | 8,335,281 |
Grupo Modelo SAB de CV Series C | 2,362,700 | | 13,230,584 |
Grupo Televisa SA de CV (CPO) sponsored ADR | 751,100 | | 16,862,195 |
TOTAL MEXICO | | 112,638,604 |
Nigeria - 0.6% |
Guaranty Trust Bank PLC GDR (Reg. S) | 2,307,523 | | 16,752,617 |
Philippines - 0.6% |
Metropolitan Bank & Trust Co. | 4,379,000 | | 7,997,544 |
Philippine Long Distance Telephone Co. sponsored ADR | 137,100 | | 8,518,023 |
TOTAL PHILIPPINES | | 16,515,567 |
Poland - 0.6% |
Eurocash SA | 983,409 | | 9,038,717 |
Polska Grupa Energetyczna SA | 1,045,900 | | 8,035,365 |
TOTAL POLAND | | 17,074,082 |
Russia - 8.4% |
Bank St. Petersburg OJSC (a) | 754,614 | | 3,601,872 |
Interregional Distribution Grid Companies Holding JSC (a) | 42,091,800 | | 7,293,027 |
LSR Group OJSC unit (a)(e) | 34,400 | | 292,400 |
Lukoil Oil Co. sponsored: | | | |
ADR | 449,500 | | 25,104,575 |
ADR (United Kingdom) | 41,600 | | 2,321,280 |
Magnit OJSC GDR (Reg. S) | 657,600 | | 17,584,224 |
Magnitogorsk Iron & Steel Works OJSC unit (a) | 2,266,100 | | 28,326,250 |
OAO Gazprom sponsored ADR | 1,208,100 | | 26,396,985 |
OAO NOVATEK GDR | 284,100 | | 27,174,165 |
OJSC MMC Norilsk Nickel ADR | 1,586,512 | | 29,588,449 |
Sberbank (Savings Bank of the Russian Federation) | 1,330,000 | | 4,370,767 |
Sberbank (Savings Bank of the Russian Federation) GDR | 130,000 | | 48,839,895 |
Uralkali JSC GDR (Reg. S) | 886,600 | | 21,943,350 |
TOTAL RUSSIA | | 242,837,239 |
Common Stocks - continued |
| Shares | | Value |
Singapore - 0.4% |
Yangzijiang Shipbuilding Holdings Ltd. | 7,120,000 | | $ 10,286,950 |
South Africa - 6.1% |
African Bank Investments Ltd. | 1,652,200 | | 8,476,752 |
AngloGold Ashanti Ltd. | 532,800 | | 24,988,359 |
Aspen Pharmacare Holdings Ltd. | 956,100 | | 12,761,558 |
Aveng Ltd. | 2,074,200 | | 13,028,430 |
Barloworld Ltd. | 692,600 | | 5,190,755 |
Blue Label Telecoms Ltd. | 12,280,200 | | 12,621,957 |
Clicks Group Ltd. | 1,345,239 | | 8,776,158 |
Gold Fields Ltd. sponsored ADR | 1,057,700 | | 16,679,929 |
Impala Platinum Holdings Ltd. | 527,900 | | 14,921,264 |
Mr. Price Group Ltd. | 1,006,900 | | 9,150,435 |
MTN Group Ltd. | 700,000 | | 12,590,917 |
Shoprite Holdings Ltd. | 1,247,400 | | 17,632,643 |
Standard Bank Group Ltd. | 1,256,131 | | 18,523,541 |
TOTAL SOUTH AFRICA | | 175,342,698 |
Sweden - 0.3% |
Lundin Petroleum AB (a) | 813,400 | | 7,693,798 |
Taiwan - 7.2% |
Acer, Inc. | 3,853,755 | | 11,194,211 |
Asia Cement Corp. | 12,258,000 | | 12,636,494 |
Chroma ATE, Inc. | 2,668,089 | | 6,869,643 |
Delta Electronics, Inc. | 3,377,000 | | 13,958,193 |
Hon Hai Precision Industry Co. Ltd. (Foxconn) | 3,989,584 | | 15,121,443 |
HTC Corp. | 906,000 | | 20,455,677 |
Pegatron Corp. (a) | 5,918,000 | | 8,015,066 |
Synnex Technology International Corp. | 4,189,739 | | 10,253,601 |
Taiwan Fertilizer Co. Ltd. | 7,273,000 | | 24,833,475 |
Taiwan Mobile Co. Ltd. | 5,238,000 | | 11,655,213 |
Taiwan Semiconductor Manufacturing Co. Ltd. | 3,618,284 | | 7,447,954 |
Taiwan Semiconductor Manufacturing Co. Ltd. sponsored ADR | 3,567,351 | | 38,919,799 |
Unimicron Technology Corp. | 4,501,000 | | 7,662,215 |
Wintek Corp. (a) | 7,023,000 | | 11,840,771 |
WPG Holding Co. Ltd. | 3,697,000 | | 6,873,364 |
TOTAL TAIWAN | | 207,737,119 |
Thailand - 1.5% |
Advanced Info Service PCL (For. Reg.) | 4,001,200 | | 12,027,655 |
Banpu PCL unit | 496,300 | | 12,830,201 |
Common Stocks - continued |
| Shares | | Value |
Thailand - continued |
BEC World PCL (For. Reg.) | 6,822,900 | | $ 7,577,202 |
Siam Commercial Bank PCL (For. Reg.) | 2,737,500 | | 9,371,869 |
TOTAL THAILAND | | 41,806,927 |
Turkey - 2.3% |
Koc Holding AS | 1,836,000 | | 8,768,458 |
TAV Havalimanlari Holding AS (a) | 886,000 | | 4,632,922 |
Turkiye Garanti Bankasi AS | 2,695,000 | | 16,534,895 |
Turkiye Is Bankasi AS Series C | 3,682,000 | | 16,557,833 |
Turkiye Vakiflar Bankasi TAO | 6,250,000 | | 20,218,922 |
TOTAL TURKEY | | 66,713,030 |
United Kingdom - 2.1% |
Afren PLC (a) | 3,766,100 | | 7,813,845 |
Aurelian Oil & Gas PLC (a) | 4,665,100 | | 4,559,256 |
Faroe Petroleum PLC (a) | 923,600 | | 2,885,504 |
Hikma Pharmaceuticals PLC | 811,909 | | 10,224,288 |
International Personal Finance PLC | 809,469 | | 4,033,330 |
Kazakhmys PLC | 950,100 | | 20,032,188 |
Premier Oil PLC (a) | 430,127 | | 11,584,241 |
TOTAL UNITED KINGDOM | | 61,132,652 |
United States of America - 1.2% |
Central European Distribution Corp. (a) | 311,300 | | 7,773,161 |
Freeport-McMoRan Copper & Gold, Inc. | 171,600 | | 16,247,088 |
Gran Tierra Energy, Inc. (a) | 1,249,800 | | 9,313,148 |
TOTAL UNITED STATES OF AMERICA | | 33,333,397 |
TOTAL COMMON STOCKS (Cost $2,257,075,717) | 2,849,136,592 |
Money Market Funds - 2.4% |
| Shares | | Value |
Fidelity Cash Central Fund, 0.23% (b) | 3,933,962 | | $ 3,933,962 |
Fidelity Securities Lending Cash Central Fund, 0.24% (b)(c) | 64,167,480 | | 64,167,480 |
TOTAL MONEY MARKET FUNDS (Cost $68,101,442) | 68,101,442 |
TOTAL INVESTMENT PORTFOLIO - 101.3% (Cost $2,325,177,159) | | 2,917,238,034 |
NET OTHER ASSETS (LIABILITIES) - (1.3)% | | (37,828,871) |
NET ASSETS - 100% | $ 2,879,409,163 |
Legend |
(a) Non-income producing |
(b) Affiliated fund that is available only to investment companies and other accounts managed by Fidelity Investments. The rate quoted is the annualized seven-day yield of the fund at period end. A complete unaudited listing of the fund's holdings as of its most recent quarter end is available upon request. In addition, each Fidelity Central Fund's financial statements, which are not covered by the Fund's report of Independent Registered Public Accounting Firm, are available on the SEC's website or upon request. |
(c) Investment made with cash collateral received from securities on loan. |
(d) Security or a portion of the security is on loan at period end. |
(e) Security exempt from registration under Rule 144A of the Securities Act of 1933. These securities may be resold in transactions exempt from registration, normally to qualified institutional buyers. At the end of the period, the value of these securities amounted to $6,869,568 or 0.2% of net assets. |
Affiliated Central Funds |
Information regarding fiscal year to date income earned by the Fund from investments in Fidelity Central Funds is as follows: |
Fund | Income earned |
Fidelity Cash Central Fund | $ 60,467 |
Fidelity Securities Lending Cash Central Fund | 234,446 |
Total | $ 294,913 |
Other Information |
The following is a summary of the inputs used, as of October 31, 2010, involving the Fund's assets and liabilities carried at fair value. The inputs or methodology used for valuing securities may not be an indication of the risk associated with investing in those securities. For more information on valuation inputs, and their aggregation into the levels used in the table below, please refer to the Security Valuation section in the accompanying Notes to Financial Statements. |
Valuation Inputs at Reporting Date: |
Description | Total | Level 1 | Level 2 | Level 3 |
Investments in Securities: | | | | |
Equities: | | | | |
Brazil | $ 467,013,712 | $ 463,045,925 | $ 3,967,787 | $ - |
Korea (South) | 306,534,264 | 245,430,137 | 61,104,127 | - |
India | 272,071,675 | 216,916,704 | 55,154,971 | - |
Russia | 242,837,239 | 242,837,239 | - | - |
China | 228,067,956 | 228,067,956 | - | - |
Taiwan | 207,737,119 | 200,289,165 | 7,447,954 | - |
South Africa | 175,342,698 | 150,354,339 | 24,988,359 | - |
Hong Kong | 131,607,787 | 131,102,277 | 505,510 | - |
Mexico | 112,638,604 | 112,638,604 | - | - |
Other | 705,285,538 | 705,285,538 | - | - |
Money Market Funds | 68,101,442 | 68,101,442 | - | - |
Total Investments in Securities: | $ 2,917,238,034 | $ 2,764,069,326 | $ 153,168,708 | $ - |
See accompanying notes which are an integral part of the financial statements.
Annual Report
Statement of Assets and Liabilities
| October 31, 2010 |
| | |
Assets | | |
Investment in securities, at value (including securities loaned of $62,871,564) - See accompanying schedule: Unaffiliated issuers (cost $2,257,075,717) | $ 2,849,136,592 | |
Fidelity Central Funds (cost $68,101,442) | 68,101,442 | |
Total Investments (cost $2,325,177,159) | | $ 2,917,238,034 |
Cash | | 1,081,897 |
Foreign currency held at value (cost $19,170,916) | | 19,185,296 |
Receivable for investments sold | | 22,330,350 |
Receivable for fund shares sold | | 4,677,455 |
Dividends receivable | | 2,093,489 |
Distributions receivable from Fidelity Central Funds | | 34,346 |
Other receivables | | 1,382,961 |
Total assets | | 2,968,023,828 |
| | |
Liabilities | | |
Payable for investments purchased | $ 17,787,682 | |
Accrued management fee | 1,895,835 | |
Other affiliated payables | 516,962 | |
Other payables and accrued expenses | 4,246,706 | |
Collateral on securities loaned, at value | 64,167,480 | |
Total liabilities | | 88,614,665 |
| | |
Net Assets | | $ 2,879,409,163 |
Net Assets consist of: | | |
Paid in capital | | $ 2,189,255,903 |
Undistributed net investment income | | 16,171,630 |
Accumulated undistributed net realized gain (loss) on investments and foreign currency transactions | | 85,834,863 |
Net unrealized appreciation (depreciation) on investments and assets and liabilities in foreign currencies | | 588,146,767 |
Net Assets | | $ 2,879,409,163 |
See accompanying notes which are an integral part of the financial statements.
Annual Report
Financial Statements - continued
Statement of Assets and Liabilities - continued
| October 31, 2010 |
| | |
Series Emerging Markets:
Net Asset Value, offering price and redemption price per share ($2,425,249,455 ÷ 128,661,622 shares) | | $ 18.85 |
| | |
Class F:
Net Asset Value, offering price and redemption price per share ($454,159,708 ÷ 24,027,329 shares) | | $ 18.90 |
See accompanying notes which are an integral part of the financial statements.
Annual Report
Statement of Operations
| Year ended October 31, 2010 |
| | |
Investment Income | | |
Dividends | | $ 38,267,474 |
Interest | | 3,027 |
Income from Fidelity Central Funds | | 294,913 |
Income before foreign taxes withheld | | 38,565,414 |
Less foreign taxes withheld | | (3,655,892) |
Total income | | 34,909,522 |
| | |
Expenses | | |
Management fee | $ 14,202,930 | |
Transfer agent fees | 3,680,834 | |
Accounting and security lending fees | 789,972 | |
Custodian fees and expenses | 1,144,760 | |
Independent trustees' compensation | 9,026 | |
Registration fees | 22,500 | |
Audit | 73,116 | |
Legal | 5,740 | |
Interest | 276 | |
Miscellaneous | 16,676 | |
Total expenses before reductions | 19,945,830 | |
Expense reductions | (1,207,938) | 18,737,892 |
Net investment income (loss) | | 16,171,630 |
Realized and Unrealized Gain (Loss) Net realized gain (loss) on: | | |
Investment securities: | | |
Unaffiliated issuers (net of foreign taxes of $3,058,628) | 100,386,308 | |
Foreign currency transactions | (6,920,133) | |
Capital gain distribution from Fidelity Central Funds | 1,204 | |
Total net realized gain (loss) | | 93,467,379 |
Change in net unrealized appreciation (depreciation) on: Investment securities (net of increase in deferred foreign taxes of $1,676,014) | 386,211,893 | |
Assets and liabilities in foreign currencies | (972) | |
Total change in net unrealized appreciation (depreciation) | | 386,210,921 |
Net gain (loss) | | 479,678,300 |
Net increase (decrease) in net assets resulting from operations | | $ 495,849,930 |
See accompanying notes which are an integral part of the financial statements.
Annual Report
Financial Statements - continued
Statement of Changes in Net Assets
| Year ended
October 31,
2010 | For the period
December 9, 2008 (commencement of operations) to
October 31,
2009 |
Increase (Decrease) in Net Assets | | |
Operations | | |
Net investment income (loss) | $ 16,171,630 | $ 5,227,666 |
Net realized gain (loss) | 93,467,379 | 85,493,953 |
Change in net unrealized appreciation (depreciation) | 386,210,921 | 201,935,846 |
Net increase (decrease) in net assets resulting
from operations | 495,849,930 | 292,657,465 |
Distributions to shareholders from net investment income | (4,970,807) | (87,500) |
Distributions to shareholders from net realized gain | (92,304,978) | - |
Total distributions | (97,275,785) | (87,500) |
Share transactions - net increase (decrease) | 1,562,703,553 | 625,561,500 |
Total increase (decrease) in net assets | 1,961,277,698 | 918,131,465 |
| | |
Net Assets | | |
Beginning of period | 918,131,465 | - |
End of period (including undistributed net investment income of $16,171,630 and undistributed net investment income of $5,088,289, respectively) | $ 2,879,409,163 | $ 918,131,465 |
See accompanying notes which are an integral part of the financial statements.
Annual Report
Financial Highlights - Series Emerging Markets
Years ended October 31, | 2010 | 2009 G |
Selected Per-Share Data | |
Net asset value, beginning of period | $ 16.38 | $ 10.00 |
Income from Investment Operations | | |
Net investment income (loss) D | .15 | .15 |
Net realized and unrealized gain (loss) | 4.03 | 6.27 |
Total from investment operations | 4.18 | 6.42 |
Distributions from net investment income | (.09) | (.04) |
Distributions from net realized gain | (1.62) | - |
Total distributions | (1.71) | (.04) |
Net asset value, end of period | $ 18.85 | $ 16.38 |
Total Return B, C | 27.32% | 64.35% |
Ratios to Average Net Assets E, H | |
Expenses before reductions | 1.15% | 1.21% A |
Expenses net of fee waivers, if any | 1.15% | 1.21% A |
Expenses net of all reductions | 1.08% | 1.09% A |
Net investment income (loss) | .89% | 1.15% A |
Supplemental Data | |
Net assets, end of period (000 omitted) | $ 2,425,249 | $ 910,106 |
Portfolio turnover rate F | 92% | 109% A |
A Annualized
B Total returns for periods of less than one year are not annualized.
C Total returns would have been lower had certain expenses not been reduced during the periods shown.
D Calculated based on average shares outstanding during the period.
E Fees and expenses of the underlying Fidelity Central Funds are not included in the Fund's expense ratio. The Fund indirectly bears its proportionate share of the expenses of any underlying Fidelity Central Funds.
F Amount does not include the portfolio activity of any underlying Fidelity Central Funds.
G For the period December 9, 2008 (commencement of operations) to October 31, 2009.
H Expense ratios reflect operating expenses of the class. Expenses before reductions do not reflect amounts reimbursed by the investment adviser or reductions from brokerage service arrangements or reductions from other expense offset arrangements and do not represent the amount paid by the class during periods when reimbursements or reductions occur. Expense ratios before reductions for start-up periods may not be representative of longer-term operating periods. Expenses net of fee waivers reflect expenses after reimbursement by the investment adviser but prior to reductions from brokerage service arrangements or other expense offset arrangements. Expenses net of all reductions represent the net expenses paid by the class.
See accompanying notes which are an integral part of the financial statements.
Annual Report
Financial Highlights - Class F
Years ended October 31, | 2010 | 2009 G |
Selected Per-Share Data | |
Net asset value, beginning of period | $ 16.40 | $ 13.91 |
Income from Investment Operations | | |
Net investment income (loss) D | .19 | .02 |
Net realized and unrealized gain (loss) | 4.03 | 2.47 |
Total from investment operations | 4.22 | 2.49 |
Distributions from net investment income | (.10) | - |
Distributions from net realized gain | (1.62) | - |
Total distributions | (1.72) | - |
Net asset value, end of period | $ 18.90 | $ 16.40 |
Total Return B, C | 27.59% | 17.90% |
Ratios to Average Net Assets E, H | |
Expenses before reductions | .92% | .93% A |
Expenses net of fee waivers, if any | .92% | .93% A |
Expenses net of all reductions | .85% | .82% A |
Net investment income (loss) | 1.13% | .28% A |
Supplemental Data | |
Net assets, end of period (000 omitted) | $ 454,160 | $ 8,025 |
Portfolio turnover rate F | 92% | 109% A |
A Annualized
B Total returns for periods of less than one year are not annualized.
C Total returns would have been lower had certain expenses not been reduced during the periods shown.
D Calculated based on average shares outstanding during the period.
E Fees and expenses of the underlying Fidelity Central Funds are not included in the Fund's expense ratio. The Fund indirectly bears its proportionate share of the expenses of any underlying Fidelity Central Funds.
F Amount does not include the portfolio activity of any underlying Fidelity Central Funds.
G For the period June 26, 2009 (commencement of sale of shares) to October 31, 2009.
H Expense ratios reflect operating expenses of the class. Expenses before reductions do not reflect amounts reimbursed by the investment adviser or reductions from brokerage service arrangements or reductions from other expense offset arrangements and do not represent the amount paid by the class during periods when reimbursements or reductions occur. Expense ratios before reductions for start-up periods may not be representative of longer-term operating periods. Expenses net of fee waivers reflect expenses after reimbursement by the investment adviser but prior to reductions from brokerage service arrangements or other expense offset arrangements. Expenses net of all reductions represent the net expenses paid by the class.
See accompanying notes which are an integral part of the financial statements.
Annual Report
Notes to Financial Statements
For the period ended October 31, 2010
1. Organization.
Fidelity Series Emerging Markets Fund (the Fund) is a fund of the Fidelity Investment Trust (the trust) and is authorized to issue an unlimited number of shares. Shares of the Fund are only available for purchase by mutual funds for which Fidelity Management & Research Company (FMR) or an affiliate serves as an investment manager. The Trust is registered under the Investment Company Act of 1940, as amended (the 1940 Act), as an open-end management investment company organized as a Massachusetts business trust. The fund offers Series Emerging Markets and Class F shares, each of which has equal rights as to assets and voting privileges. Each class has exclusive voting rights with respect to matters that affect that class. Investment income, realized and unrealized capital gains and losses, the common expenses of the Fund, and certain fund-level expense reductions, if any, are allocated on a pro-rata basis to each class based on the relative net assets of each class to the total net assets of the Fund. Each class differs with respect to transfer agent fees incurred. Certain expense reductions also differ by class. The Fund's investments in emerging markets can be subject to social, economic, regulatory, and political uncertainties and can be extremely volatile.
2. Investments in Fidelity Central Funds.
The Fund may invest in Fidelity Central Funds, which are open-end investment companies available only to other investment companies and accounts managed by Fidelity Management & Research Company (FMR) and its affiliates. The Fund's Schedule of Investments lists each of the Fidelity Central Funds held as of period end, if any, as an investment of the Fund, but does not include the underlying holdings of each Fidelity Central Fund. As an Investing Fund, the Fund indirectly bears its proportionate share of the expenses of the underlying Fidelity Central Funds.
The Money Market Central Funds seek preservation of capital and current income and are managed by Fidelity Investments Money Management, Inc. (FIMM), an affiliate of FMR.
A complete unaudited list of holdings for each Fidelity Central Fund is available upon request or at the Securities and Exchange Commission (the SEC) web site at www.sec.gov. In addition, the financial statements of the Fidelity Central Funds, which are not covered by the Fund's Report of Independent Registered Public Accounting Firm, are available on the SEC web site or upon request.
3. Significant Accounting Policies.
The financial statements have been prepared in conformity with accounting principles generally accepted in the United States of America (GAAP), which require management to make certain estimates and assumptions at the date of the financial statements.
Annual Report
Notes to Financial Statements - continued
3. Significant Accounting Policies - continued
Actual results could differ from those estimates. The following summarizes the significant accounting policies of the Fund:
Security Valuation. Investments are valued as of 4:00 p.m. Eastern time on the last calendar day of the period. The Fund uses independent pricing services approved by the Board of Trustees to value its investments. When current market prices or quotations are not readily available or reliable, valuations may be determined in good faith in accordance with procedures adopted by the Board of Trustees. Factors used in determining value may include market or security specific events. The frequency with which these procedures are used cannot be predicted and they may be utilized to a significant extent. The value used for net asset value (NAV) calculation under these procedures may differ from published prices for the same securities.
The Fund categorizes the inputs to valuation techniques used to value its investments into a disclosure hierarchy consisting of three levels as shown below.
Level 1 - quoted prices in active markets for identical investments
Level 2 - other significant observable inputs (including quoted prices for similar investments, interest rates, prepayment speeds, etc.)
Level 3 - unobservable inputs (including the fund's own assumptions based on the best information available)
Changes in valuation techniques may result in transfers in or out of an assigned level within the disclosure hierarchy. The aggregate value of investments by input level as of October 31, 2010 is included at the end of the Fund's Schedule of Investments. Valuation techniques used to value the Fund's investments by major category are as follows.
Equity securities, including restricted securities, for which market quotations are readily available, are valued at the last reported sale price or official closing price as reported by an independent pricing service on the primary market or exchange on which they are traded and are categorized as Level 1 in the hierarchy. In the event there were no sales during the day or closing prices are not available, securities are valued at the last quoted bid price or may be valued using the last available price and are generally categorized as Level 2 in the hierarchy. For foreign equity securities, when significant market or security specific events arise, comparisons to the valuation of American Depositary Receipts (ADRs), futures contracts, Exchange-traded funds (ETFs) and certain indexes as well as quoted prices for similar securities are used and are categorized as Level 2 in the hierarchy in these circumstances. Utilizing these techniques may result in transfers between Level 1 and Level 2. For restricted equity securities and private placements where observable inputs are limited, assumptions about market activity and risk are used and are categorized as Level 3 in the hierarchy.
Annual Report
3. Significant Accounting Policies - continued
Security Valuation - continued
Investments in open-end mutual funds, including Fidelity Central Funds, are valued at their closing net asset value each business day and are categorized as Level 1 in the hierarchy. Short-term securities with remaining maturities of sixty days or less for which quotations are not readily available are valued at amortized cost, which approximates fair value and are categorized as Level 2 in the hierarchy.
Foreign Currency. The Fund uses foreign currency contracts to facilitate transactions in foreign-denominated securities. Gains and losses from these transactions may arise from changes in the value of the foreign currency or if the counterparties do not perform under the contracts' terms.
Foreign-denominated assets, including investment securities, and liabilities are translated into U.S. dollars at the exchange rate at period end. Purchases and sales of investment securities, income and dividends received and expenses denominated in foreign currencies are translated into U.S. dollars at the exchange rate in effect on the transaction date.
The effects of exchange rate fluctuations on investments are included with the net realized and unrealized gain (loss) on investment securities. Other foreign currency transactions resulting in realized and unrealized gain (loss) are disclosed separately.
Investment Transactions and Income. For financial reporting purposes, the Fund's investment holdings and NAV include trades executed through the end of the last business day of the period. The NAV per share for processing shareholder transactions is calculated as of the close of business of the New York Stock Exchange (NYSE), normally 4:00 p.m. Eastern time and includes trades executed through the end of the prior business day. Gains and losses on securities sold are determined on the basis of identified cost. Dividend income is recorded on the ex-dividend date, except for certain dividends from foreign securities where the ex-dividend date may have passed, which are recorded as soon as the Fund is informed of the ex-dividend date. Non-cash dividends included in dividend income, if any, are recorded at the fair market value of the securities received. Interest income and distributions from the Fidelity Central Funds are accrued as earned. Distributions received on securities that represent a return of capital or capital gain are recorded as a reduction of cost of investment and/or as a realized gain. The Fund estimates the components of distributions received that may be considered return of capital distribution or capital gain distributions. Interest income includes coupon interest and amortization of premium and accretion of discount on debt securities. Investment income is recorded net of foreign taxes withheld where recovery of such taxes is uncertain.
Annual Report
Notes to Financial Statements - continued
3. Significant Accounting Policies - continued
Expenses. Most expenses of the Trust can be directly attributed to a fund. Expenses which cannot be directly attributed are apportioned amongst each fund in the Trust. Expense estimates are accrued in the period to which they relate and adjustments are made when actual amounts are known.
Income Tax Information and Distributions to Shareholders. Each year the Fund intends to qualify as a regulated investment company, including distributing substantially all of its taxable income and realized gains under Subchapter M of the Internal Revenue Code and filing its U.S. federal tax return. As a result, no provision for income taxes is required. As of October 31, 2010, the Fund did not have any unrecognized tax benefits in the accompanying financial statements. A fund's federal tax return is subject to examination by the Internal Revenue Service (IRS) for a period of three years. Foreign taxes are provided for based on the Fund's understanding of the tax rules and rates that exist in the foreign markets in which it invests. The Fund is subject to a tax imposed on short term capital gains on securities of certain issuers domiciled in India. The Fund records an estimated deferred tax liability included in Other payables and accrued expenses in the accompanying Statement of Assets & Liabilities for net unrealized gains on these securities in an amount that would be payable if the securities were disposed of at period end.
Distributions are declared and recorded on the ex-dividend date. Income dividends and capital gain distributions are declared separately for each class. Income and capital gain distributions are determined in accordance with income tax regulations, which may differ from GAAP.
Capital accounts within the financial statements are adjusted for permanent book-tax differences. These adjustments have no impact on net assets or the results of operations. Temporary book-tax differences will reverse in a subsequent period.
Book-tax differences are primarily due to the short-term gain distributions from the Fidelity Central Funds, foreign currency transactions, certain foreign taxes, passive foreign investment companies (PFIC)and losses deferred due to wash sales.
The federal tax cost of investment securities and unrealized appreciation (depreciation) as of period end were as follows:
Gross unrealized appreciation | $ 594,508,959 |
Gross unrealized depreciation | (26,210,806) |
Net unrealized appreciation (depreciation) | $ 568,298,153 |
| |
Tax Cost | $ 2,348,939,881 |
Annual Report
3. Significant Accounting Policies - continued
Income Tax Information and Distributions to Shareholders - continued
The tax-based components of distributable earnings as of period end were as follows:
Undistributed ordinary income | $ 64,616,871 |
Undistributed long-term capital gain | $ 61,152,344 |
Net unrealized appreciation (depreciation) | $ 568,303,680 |
The tax character of distributions paid was as follows:
| October 31, 2010 | October 31, 2009 |
Ordinary Income | $ 97,275,785 | $ 87,500 |
4. Operating Policies.
Restricted Securities. The Fund may invest in securities that are subject to legal or contractual restrictions on resale. These securities generally may be resold in transactions exempt from registration or to the public if the securities are registered. Disposal of these securities may involve time-consuming negotiations and expense, and prompt sale at an acceptable price may be difficult. Information regarding restricted securities is included at the end of the Fund's Schedule of Investments.
5. Purchases and Sales of Investments.
Purchases and sales of securities , other than short-term securities, aggregated $3,038,675,469 and $1,590,534,958, respectively.
6. Fees and Other Transactions with Affiliates.
Management Fee. FMR and its affiliates provide the Fund with investment management related services for which the Fund pays a monthly management fee. The management fee is the sum of an individual fund fee rate that is based on an annual rate of .55% of the Fund's average net assets and a group fee rate that averaged .26% during the period. The group fee rate is based upon the average net assets of all the mutual funds advised by FMR. The group fee rate decreases as assets under management increase and increases as assets under management decrease. For the period, the total annual management fee rate was .80% of the Fund's average net assets.
Transfer Agent Fees. Fidelity Investments Institutional Operations Company, Inc. (FIIOC), an affiliate of FMR, is the transfer, dividend disbursing and shareholder servicing agent for each class of the Fund. FIIOC receives account fees and asset-based fees
Annual Report
Notes to Financial Statements - continued
6. Fees and Other Transactions with Affiliates - continued
Transfer Agent Fees - continued
that vary according to the account size and type of account of the shareholders of each class, except for Class F. FIIOC receives no fees for providing transfer agency services to Class F. FIIOC pays for typesetting, printing and mailing of shareholder reports, except proxy statements. For the period, transfer agent fees for each class were as follows:
| Amount | % of
Average
Net Assets |
Series Emerging Markets | $ 3,680,834 | .23 |
Accounting and Security Lending Fees. Fidelity Service Company, Inc. (FSC), an affiliate of FMR, maintains the Fund's accounting records. The accounting fee is based on the level of average net assets for the month. Under a separate contract, FSC administers the security lending program. The security lending fee is based on the number and duration of lending transactions.
Brokerage Commissions. The Fund placed a portion of its portfolio transactions with brokerage firms which are affiliates of the investment adviser. The commissions paid to these affiliated firms were $1,620 for the period.
Interfund Lending Program. Pursuant to an Exemptive Order issued by the SEC, the Fund, along with other registered investment companies having management contracts with FMR, may participate in an interfund lending program. This program provides an alternative credit facility allowing the funds to borrow from, or lend money to, other participating affiliated funds. At period end, there were no interfund loans outstanding. The Fund's activity in this program during the period for which loans were outstanding was as follows:
Borrower or Lender | Average Daily
Loan Balance | Weighted Average
Interest Rate | Interest
Expense |
Borrower | $ 8,515,000 | .39% | $ 276 |
7. Committed Line of Credit.
The Fund participates with other funds managed by FMR or an affiliate in a $3.75 billion credit facility (the "line of credit") to be utilized for temporary or emergency purposes to fund shareholder redemptions or for other short-term liquidity purposes. The Fund has agreed to pay commitment fees on its pro-rata portion of the line of credit, which amounted to $6,224 and is reflected in Miscellaneous expenses on the Statement of Operations. During the period, there were no borrowings on this line of credit.
Annual Report
8. Security Lending.
The Fund lends portfolio securities through a lending agent from time to time in order to earn additional income. The lending agent may loan securities to certain qualified borrowers, including Fidelity Capital Markets (FCM), a broker-dealer affiliated with the fund. On the settlement date of the loan, the Fund receives collateral (in the form of U.S. Treasury obligations, letters of credit and/or cash) against the loaned securities and maintains collateral in an amount not less than 100% of the market value of the loaned securities during the period of the loan. The market value of the loaned securities is determined at the close of business of the Fund and any additional required collateral is delivered to the Fund on the next business day. If the borrower defaults on its obligation to return the securities loaned because of insolvency or other reasons, a fund could experience delays and costs in recovering the securities loaned or in gaining access to the collateral. Any cash collateral received is invested in the Fidelity Securities Lending Cash Central Fund. The value of loaned securities and cash collateral at period end are disclosed on the Fund's Statement of Assets and Liabilities. Security lending income represents the income earned on investing cash collateral, less rebates paid to borrowers and lending agent fees associated with the loan, plus any premium payments received for lending certain types of securities. Security lending income is presented in the Statement of Operations as a component of income from Fidelity Central Funds. Total security lending income during the period amounted to $234,446. During the period, there were no securities loaned to FCM.
9. Expense Reductions.
Many of the brokers with whom FMR places trades on behalf of the Fund provided services to the Fund in addition to trade execution. These services included payments of certain expenses on behalf of the Fund totaling $1,207,938 for the period.
10. Distributions to Shareholders.
Distributions to shareholders of each class were as follows:
Years ended October 31, | 2010 | 2009 A |
From net investment income | | |
Series Emerging Markets | $ 4,872,057 | $ 87,500 |
Class F | 98,750 | - |
Total | $ 4,970,807 | $ 87,500 |
From net realized gain | | |
Series Emerging Markets | $ 90,721,075 | $ - |
Class F | 1,583,903 | - |
Total | $ 92,304,978 | $ - |
A Distributions for Series Emerging Markets are for the period December 9, 2008 (commencement of operations) to October 31, 2009.
Annual Report
Notes to Financial Statements - continued
11. Share Transactions.
Transactions for each class of shares were as follows:
| Shares | Dollars |
Years ended October 31, | 2010 | 2009 A, B | 2010 | 2009 A, B |
Series Emerging Markets | | | | |
Shares sold | 79,991,131 | 56,936,886 | $ 1,291,962,481 | $ 638,934,301 |
Reinvestment of distributions | 5,955,958 | 8,373 | 95,593,132 | 87,500 |
Shares redeemed | (12,830,835) | (1,399,891) | (212,836,681) | (21,868,415) |
Net increase (decrease) | 73,116,254 | 55,545,368 | $ 1,174,718,932 | $ 617,153,386 |
Class F | | | | |
Shares sold | 23,518,400 | 493,687 | $ 387,691,188 | $ 8,485,905 |
Reinvestment of distributions | 104,773 | - | 1,682,653 | - |
Shares redeemed | (85,069) | (4,462) | (1,389,220) | (77,791) |
Net increase (decrease) | 23,538,104 | 489,225 | $ 387,984,621 | $ 8,408,114 |
A Share transactions for Series Emerging Markets are for the period December 9, 2008 (commencement of operations) to October 31, 2009.
B Share transactions for Class F are for the period June 26, 2009 (commencement of sale of shares) to October 31, 2009.
12. Other.
The Fund's organizational documents provide former and current trustees and officers with a limited indemnification against liabilities arising in connection with the performance of their duties to the Fund. In the normal course of business, the Fund may also enter into contracts that provide general indemnifications. The Fund's maximum exposure under these arrangements is unknown as this would be dependent on future claims that may be made against the Fund. The risk of material loss from such claims is considered remote.
At the end of the period, mutual funds managed by FMR or an FMR affiliate were the owners of record of all the outstanding shares of the Fund.
Annual Report
To the Trustees of Fidelity Investment Trust and Shareholders of Fidelity Series Emerging Markets Fund:
We have audited the accompanying statement of assets and liabilities of Fidelity Series Emerging Markets Fund (the Fund), a fund of Fidelity Investment Trust, including the schedule of investments, as of October 31, 2010, and the related statement of operations for the year then ended, the statement of changes in net assets and the financial highlights for each of the periods presented. These financial statements and financial highlights are the responsibility of the Fund's management. Our responsibility is to express an opinion on these financial statements and financial highlights based on our audits.
We conducted our audits in accordance with standards of the Public Company Accounting Oversight Board (United States). Those standards require that we plan and perform the audit to obtain reasonable assurance about whether the financial statements and financial highlights are free of material misstatement. The Fund is not required to have, nor were we engaged to perform, an audit of its internal control over financial reporting. Our audits included consideration of internal control over financial reporting as a basis for designing audit procedures that are appropriate in the circumstances, but not for the purpose of expressing an opinion on the effectiveness of the Fund's internal control over financial reporting. Accordingly, we express no such opinion. An audit also includes examining, on a test basis, evidence supporting the amounts and disclosures in the financial statements, assessing the accounting principles used and significant estimates made by management, as well as evaluating the overall financial statement presentation. Our procedures included confirmation of securities owned as of October 31, 2010, by correspondence with the custodians and brokers; where replies were not received from brokers, we performed other auditing procedures. We believe that our audits provide a reasonable basis for our opinion.
In our opinion, the financial statements and financial highlights referred to above present fairly, in all material respects, the financial position of Fidelity Series Emerging Markets Fund as of October 31, 2010, the results of its operations for the year then ended, the changes in its net assets and the financial highlights for each of the periods presented, in conformity with accounting principles generally accepted in the United States of America.
/s/ Deloitte & Touche LLP
DELOITTE & TOUCHE LLP
Boston, Massachusetts
December 16, 2010
Annual Report
The Trustees, Member of the Advisory Board, and executive officers of the trust and fund, as applicable, are listed below. The Board of Trustees governs the fund and is responsible for protecting the interests of shareholders. The Trustees are experienced executives who meet periodically throughout the year to oversee the fund's activities, review contractual arrangements with companies that provide services to the fund, oversee management of the risks associated with such activities and contractual arrangements, and review the fund's performance. Except for James C. Curvey, the of the Trustees oversees 221 funds advised by FMR or an affiliate. Mr. Curvey oversees 410 funds advised by FMR or an affiliate.
The Trustees hold office without limit in time except that (a) any Trustee may resign; (b) any Trustee may be removed by written instrument, signed by at least two-thirds of the number of Trustees prior to such removal; (c) any Trustee who requests to be retired or who has become incapacitated by illness or injury may be retired by written instrument signed by a majority of the other Trustees; and (d) any Trustee may be removed at any special meeting of shareholders by a two-thirds vote of the outstanding voting securities of the trust. Each Trustee who is not an interested person (as defined in the 1940 Act) (Independent Trustee), shall retire not later than the last day of the calendar year in which his or her 72nd birthday occurs. The Independent Trustees may waive this mandatory retirement age policy with respect to individual Trustees. The executive officers and Advisory Board Member hold office without limit in time, except that any officer and Advisory Board Member may resign or may be removed by a vote of a majority of the Trustees at any regular meeting or any special meeting of the Trustees. Except as indicated, each individual has held the office shown or other offices in the same company for the past five years.
Experience, Skills, Attributes, and Qualifications of the Fund's Trustees. The Governance and Nominating Committee has adopted a statement of policy that describes the experience, qualifications, attributes, and skills that are necessary and desirable for potential Independent Trustee candidates (Statement of Policy). The Board believes that each Trustee satisfied at the time he or she was initially elected or appointed a Trustee, and continues to satisfy, the standards contemplated by the Statement of Policy. The Governance and Nominating Committee also engages professional search firms to help identify potential Independent Trustee candidates who have the experience, qualifications, attributes, and skills consistent with the Statement of Policy. From time to time, additional criteria based on the composition and skills of the current Independent Trustees, as well as experience or skills that may be appropriate in light of future changes to board composition, business conditions, and regulatory or other developments, have also been considered by the professional search firms and the Governance and Nominating Committee. In addition, the Board takes into account the Trustees' commitment and participation in Board and committee meetings, as well as their leadership of standing and ad hoc committees throughout their tenure.
In determining that a particular Trustee was and continues to be qualified to serve as a Trustee, the Board has considered a variety of criteria, none of which, in isolation, was controlling. The Board believes that, collectively, the Trustees have balanced and diverse experience, qualifications, attributes, and skills, which allow the Board to operate effectively in governing the fund and protecting the interests of shareholders. Information about the specific experience, skills, attributes, and qualifications of each Trustee, which in each case led to the Board's conclusion that the Trustee should serve (or continue to serve) as a trustee of the fund, is provided below.
Annual Report
Board Structure and Oversight Function. Edward C. Johnson 3d is an interested person (as defined in the 1940 Act) and currently serves as Chairman. The Trustees have determined that an interested Chairman is appropriate and benefits shareholders because an interested Chairman has a personal and professional stake in the quality and continuity of services provided to the fund. Independent Trustees exercise their informed business judgment to appoint an individual of their choosing to serve as Chairman, regardless of whether the Trustee happens to be independent or a member of management. The Independent Trustees have determined that they can act independently and effectively without having an Independent Trustee serve as Chairman and that a key structural component for assuring that they are in a position to do so is for the Independent Trustees to constitute a substantial majority for the Board. The Independent Trustees also regularly meet in executive session. Ned C. Lautenbach serves as Chairman of the Independent Trustees and as such (i) acts as a liaison between the Independent Trustees and management with respect to matters important to the Independent Trustees and (ii) with management prepares agendas for Board meetings.
Fidelity funds are overseen by different Boards of Trustees. The fund's Board oversees Fidelity's equity and high income funds and another Board oversees Fidelity's investment-grade bond, money market, and asset allocation funds. The asset allocation funds may invest in Fidelity funds overseen by the fund's Board. The use of separate Boards, each with its own committee structure, allows the Trustees of each group of Fidelity funds to focus on the unique issues of the funds they oversee, including common research, investment, and operational issues. On occasion, the separate Boards establish joint committees to address issues of overlapping consequences for the Fidelity funds overseen by each Board.
The Trustees operate using a system of committees to facilitate the timely and efficient consideration of all matters of importance to the Trustees, the fund, and fund shareholders and to facilitate compliance with legal and regulatory requirements and oversight of the fund's activities and associated risks. The Board, acting through its committees, has charged FMR and its affiliates with (i) identifying events or circumstances the occurrence of which could have demonstrably adverse effects on the fund's business and/or reputation; (ii) implementing processes and controls to lessen the possibility that such events or circumstances occur or to mitigate the effects of such events or circumstances if they do occur; and (iii) creating and maintaining a system designed to evaluate continuously business and market conditions in order to facilitate the identification and implementation processes described in (i) and (ii) above. Because the day-to-day operations and activities of the fund are carried out by or through FMR, its affiliates and other service providers, the fund's exposure to risks is mitigated but not eliminated by the processes overseen by the Trustees. While each of the Board's committees has responsibility for overseeing different aspects of the fund's activities, oversight is exercised primarily through the Operations, Audit, and Compliance Committees. Appropriate personnel, including but not limited to the fund's Chief Compliance Officer (CCO), FMR's internal auditor, the independent accountants, the fund's Treasurer and portfolio management personnel, make periodic reports to the Board's committees, as appropriate. The responsibilities of each committee, including their oversight responsibilities, are described further under "Standing Committees of the Fund's Trustees."
Annual Report
Trustees and Officers - continued
The fund's Statement of Additional Information (SAI) includes more information about the Trustees. To request a free copy, call Fidelity at 1-800-544-8544 for Fidelity Series Emerging Markets Fund or 1-800-835-5092 for Class F.
Interested Trustees*:
Correspondence intended for each Trustee who is an interested person may be sent to Fidelity Investments, 82 Devonshire Street, Boston, Massachusetts 02109.
Name, Age; Principal Occupations and Other Relevant Experience+ |
Edward C. Johnson 3d (80) |
| Year of Election or Appointment: 1984 Mr. Johnson is Trustee and Chairman of the Board of Trustees of certain Trusts. Mr. Johnson serves as Chief Executive Officer, Chairman, and a Director of FMR LLC; Chairman and a Director of FMR; Chairman and a Director of Fidelity Research & Analysis Company (FRAC); Chairman and a Director of Fidelity Investments Money Management, Inc.; and Chairman and a Director of FMR Co., Inc. In addition, Mr. Johnson serves as Chairman and Director of FIL Limited. Previously, Mr. Johnson served as President of FMR LLC (2006-2007). |
James C. Curvey (75) |
| Year of Election or Appointment: 2007 Mr. Curvey also serves as Trustee (2007-present) of other investment companies advised by FMR. Mr. Curvey is a Director of Fidelity Investments Money Management, Inc. (2009-present), Director of Fidelity Research & Analysis Co. (2009-present) and Director of FMR and FMR Co., Inc. (2007-present). Mr. Curvey is also Vice Chairman (2007-present) and Director of FMR LLC. In addition, Mr. Curvey serves as an Overseer for the Boston Symphony Orchestra and a member of the Trustees of Villanova University. Previously, Mr. Curvey was the Vice Chairman (2006-2007) and Director (2000-2007) of FMR Corp. |
* Trustees have been determined to be "Interested Trustees" by virtue of, among other things, their affiliation with the trust or various entities under common control with FMR.
Annual Report
+ The information above includes each Trustee's principal occupation during the last five years and other information relating to the experience, attributes, and skills relevant to each Trustee's qualifications to serve as a Trustee, which led to the conclusion that each Trustee should serve as a Trustee for the fund.
Independent Trustees:
Correspondence intended for each Independent Trustee (that is, the Trustees other than the Interested Trustees) may be sent to Fidelity Investments, P.O. Box 55235, Boston, Massachusetts 02205-5235.
Name, Age; Principal Occupations and Other Relevant Experience+ |
Dennis J. Dirks (62) |
| Year of Election or Appointment: 2005 Prior to his retirement in May 2003, Mr. Dirks was Chief Operating Officer and a member of the Board of The Depository Trust & Clearing Corporation (DTCC). He also served as President, Chief Operating Officer, and Board member of The Depository Trust Company (DTC) and President and Board member of the National Securities Clearing Corporation (NSCC). In addition, Mr. Dirks served as Chief Executive Officer and Board member of the Government Securities Clearing Corporation, Chief Executive Officer and Board member of the Mortgage-Backed Securities Clearing Corporation, as a Trustee and a member of the Finance Committee of Manhattan College (2005-2008), and as a Trustee and a member of the Finance Committee of AHRC of Nassau County (2006-2008). Mr. Dirks is a member of the Independent Directors Council (IDC) Governing Council (2010-Present) and Board of Directors for The Brookville Center for Children's Services, Inc. (2009-present). |
Alan J. Lacy (57) |
| Year of Election or Appointment: 2008 Mr. Lacy serves as Senior Adviser (2007-present) of Oak Hill Capital Partners, L.P. (private equity). Mr. Lacy also served as Chief Executive Officer (2000-2005) and Vice Chairman (2005-2006) of Sears Holdings Corporation and Sears, Roebuck and Co. (retail). In addition, Mr. Lacy serves as a member of the Board of Directors of The Western Union Company (global money transfer, 2006-present) and Bristol-Myers Squibb Company (global pharmaceuticals, 2007-present). Mr. Lacy is Chairman (2008-present) and a member (2006-present) of the Board of Trustees of The National Parks Conservation Association. |
Ned C. Lautenbach (66) |
| Year of Election or Appointment: 2000 Mr. Lautenbach is Chairman of the Independent Trustees of the Equity and High Income Funds (2006-present). Mr. Lautenbach currently serves as the Lead Director of the Eaton Corporation Board of Directors (diversified industrial, 1997-present). Mr. Lautenbach is also a member of the Board of Directors of the Philharmonic Center for the Arts in Naples, Florida (1999-present); a member of the Board of Trustees of Fairfield University (2005-present); and a member of the Council on Foreign Relations (1994-present). Previously, Mr. Lautenbach was a Partner/Advisory Partner at Clayton, Dubilier & Rice, Inc. (private equity investment, 1998-2010), as well as a Director of Sony Corporation (2006-2007). |
Joseph Mauriello (66) |
| Year of Election or Appointment: 2008 Prior to his retirement in January 2006, Mr. Mauriello served in numerous senior management positions including Deputy Chairman and Chief Operating Officer (2004-2005), and Vice Chairman of Financial Services (2002-2004) of KPMG LLP US (professional services, 1965-2005). Mr. Mauriello currently serves as a member of the Board of Directors of XL Group plc. (global insurance and re-insurance, 2006-present) and of Arcadia Resources Inc. (health care services and products, 2007-present). Previously, Mr. Mauriello served as a Director of the Hamilton Funds of the Bank of New York (2006-2007). |
Cornelia M. Small (66) |
| Year of Election or Appointment: 2005 Ms. Small is a member of the Board of Directors of the Teagle Foundation (2009-present). Ms. Small is also a member of the Investment Committee, and Chair (2008-present) and a member of the Board of Trustees of Smith College. In addition, Ms. Small serves on the Investment Committee of the Berkshire Taconic Community Foundation (2008-present). Previously, Ms. Small served as Chairperson of the Investment Committee (2002-2008) of Smith College. In addition, Ms. Small served as Chief Investment Officer, Director of Global Equity Investments, and a member of the Board of Directors of Scudder, Stevens & Clark and Scudder Kemper Investments. |
William S. Stavropoulos (71) |
| Year of Election or Appointment: 2001 Mr. Stavropoulos is Vice Chairman of the Independent Trustees of the Equity and High Income Funds (2006-present). Mr. Stavropoulos serves as President and Founder of the Michigan Baseball Foundation, the Great Lakes Loons (2007-present). Mr. Stavropoulos is Chairman Emeritus of the Board of Directors of The Dow Chemical Company, where he previously served in numerous senior management positions, including President, CEO (1995-2000; 2002-2004), Chairman of the Executive Committee (2000-2006), and as a member of the Board of Directors (1990-2006). Currently, Mr. Stavropoulos is Chairman of Univar (global distributor of commodity and specialty chemicals, 2010-present), a Director of Teradata Corporation (data warehousing and technology solutions, 2008-present), Chemical Financial Corporation, Maersk Inc. (industrial conglomerate), Tyco International, Inc. (multinational manufacturing and services, 2007-present), and a member of the Advisory Board for Metalmark Capital (private equity investment, 2005-
present). Mr. Stavropoulos is a special advisor to Clayton, Dubilier & Rice, Inc. (private equity investment). In addition, Mr. Stavropoulos is a member of the University of Notre Dame Advisory Council for the College of Science. |
David M. Thomas (61) |
| Year of Election or Appointment: 2008 Previously, Mr. Thomas served as Executive Chairman (2005-2006) and Chairman and Chief Executive Officer (2000-2005) of IMS Health, Inc. (pharmaceutical and healthcare information solutions). In addition, Mr. Thomas serves as a member of the Board of Directors of Fortune Brands, Inc. (consumer products), and Interpublic Group of Companies, Inc. (marketing communication, 2004-present). |
Michael E. Wiley (60) |
| Year of Election or Appointment: 2008 Mr. Wiley also serves as a Director of Asia Pacific Exploration Consolidated (international oil and gas exploration and production, 2008-present). Mr. Wiley serves as a Director of Tesoro Corporation (independent oil refiner and marketer, 2005-present), and a Director of Bill Barrett Corporation (exploration and production, 2005-present). In addition, Mr. Wiley also serves as a Director of Post Oak Bank (privately-held bank, 2004-present). Previously, Mr. Wiley served as a member of the Board of Trustees of the University of Tulsa (2000-2006; 2007-2010), as a Senior Energy Advisor of Katzenbach Partners, LLC (consulting, 2006-2007), as an Advisory Director of Riverstone Holdings (private investment), Chairman, President, and CEO of Baker Hughes, Inc. (oilfield services, 2000-2004), and as Director of Spinnaker Exploration Company (exploration and production, 2001-2005). |
Annual Report
Trustees and Officers - continued
+ The information above includes each Trustee's principal occupation during the last five years and other information relating to the experience, attributes, and skills relevant to each Trustee's qualifications to serve as a Trustee, which led to the conclusion that each Trustee should serve as a Trustee for the fund.
Advisory Board Member and Executive Officers:
Correspondence intended for each executive officer and Peter S. Lynch may be sent to Fidelity Investments, 82 Devonshire Street, Boston, Massachusetts 02109.
Name, Age; Principal Occupation |
Peter S. Lynch (66) |
| Year of Election or Appointment: 2003 Member of the Advisory Board of Fidelity's Equity and High Income Funds. Mr. Lynch is Vice Chairman and a Director of FMR and FMR Co., Inc. In addition, Mr. Lynch serves as a Trustee of Boston College and as the Chairman of the Inner-City Scholarship Fund. Previously, Mr. Lynch served on the Special Olympics International Board of Directors (1997-2006). |
Kenneth B. Robins (41) |
| Year of Election or Appointment: 2008 President and Treasurer of Fidelity's Equity and High Income Funds. Mr. Robins also serves as President and Treasurer (2010-present) and Assistant Treasurer (2009-present) of other Fidelity funds and is an employee of Fidelity Investments (2004-present). Previously, Mr. Robins served as Deputy Treasurer of the Fidelity funds (2005-2008) and Treasurer and Chief Financial Officer of The North Carolina Capital Management Trust: Cash and Term Portfolios (2006-2008). |
Bruce T. Herring (45) |
| Year of Election or Appointment: 2006 Vice President of certain Equity Funds. Mr. Herring also serves as Chief Investment Officer and Director of Fidelity Management & Research (U.K.) Inc. (2010-present) and Group Chief Investments Officer of FMR. Previously, Mr. Herring served as Vice President (2005-2006) and Senior Vice President (2006-2007) of Fidelity Management & Research Company, Vice President of FMR Co., Inc. (2001-2007) and as a portfolio manager for Fidelity U.S. Equity Funds. |
Brian B. Hogan (46) |
| Year of Election or Appointment: 2009 Vice President of certain Equity Funds and Vice President of Sector Funds. Mr. Hogan also serves as President of FMR's Equity Division (2009-present). Previously, Mr. Hogan served as Senior Vice President, Equity Research of FMR (2006-2009) and as a portfolio manager. |
Thomas C. Hense (46) |
| Year of Election or Appointment: 2008 or 2010 Vice President of Fidelity's High Income (2008), Small Cap (2008), and Value (2010) Funds. Previously, Mr. Hense served as a portfolio manager for Fidelity's Institutional Money Management Group (Pyramis) (2003-2008). |
Scott C. Goebel (42) |
| Year of Election or Appointment: 2008 Secretary and Chief Legal Officer (CLO) of the Fidelity funds. Mr. Goebel also serves as Secretary and CLO of The North Carolina Capital Management Trust: Cash and Term Portfolio (2008-present); General Counsel, Secretary, and Senior Vice President of FMR (2008-present) and FMR Co., Inc. (2008-present); Deputy General Counsel of FMR LLC; Chief Legal Officer of Fidelity Management & Research (Hong Kong) Limited (2008-present) and Assistant Secretary of Fidelity Management & Research (Japan) Inc. (2008-present), Fidelity Investments Money Management, Inc. (2008-present), Fidelity Management & Research (U.K.) Inc. (2008-present), and Fidelity Research and Analysis Company (2008-present). Previously, Mr. Goebel served as Assistant Secretary of the Funds (2007-2008) and as Vice President and Secretary of Fidelity Distributors Corporation (FDC) (2005-2007). |
William C. Coffey (41) |
| Year of Election or Appointment: 2009 Assistant Secretary of Fidelity's Equity and High Income Funds. Mr. Coffey also serves as Senior Vice President and Deputy General Counsel of FMR LLC (2010-present), and is an employee of Fidelity Investments. Previously, Mr. Coffey served as Vice President and Associate General Counsel of FMR LLC (2005-2009). |
Holly C. Laurent (56) |
| Year of Election or Appointment: 2008 Anti-Money Laundering (AML) Officer of the Fidelity funds. Ms. Laurent also serves as AML Officer of The North Carolina Capital Management Trust: Cash and Term Portfolio (2008-present) and is an employee of Fidelity Investments. Previously, Ms. Laurent was Senior Vice President and Head of Legal for Fidelity Business Services India Pvt. Ltd. (2006-2008), and Senior Vice President, Deputy General Counsel and Group Head for FMR LLC (2005-2006). |
Christine Reynolds (52) |
| Year of Election or Appointment: 2008 Chief Financial Officer of the Fidelity funds. Ms. Reynolds became President of Fidelity Pricing and Cash Management Services (FPCMS) in August 2008. Ms. Reynolds served as Chief Operating Officer of FPCMS (2007-2008). Previously, Ms. Reynolds served as President, Treasurer, and Anti-Money Laundering officer of the Fidelity funds (2004-2007). |
Kenneth A. Rathgeber (63) |
| Year of Election or Appointment: 2004 Chief Compliance Officer of Fidelity's Equity and High Income Funds. Mr. Rathgeber is Chief Compliance Officer of Fidelity Management & Research (Hong Kong) Limited (2008-present), Fidelity Management & Research (Japan) Inc. (2008-present), FMR (2005-present), FMR Co., Inc. (2005-present), Fidelity Management & Research (U.K.) Inc. (2005-present), Fidelity Research & Analysis Company (2005-present), Fidelity Investments Money Management, Inc. (2005-present), Pyramis Global Advisors, LLC (2005-present), and Strategic Advisers, Inc. (2005-present). |
Jeffrey S. Christian (49) |
| Year of Election or Appointment: 2009 Deputy Treasurer of the Fidelity funds. Mr. Christian is an employee of Fidelity Investments. Previously, Mr. Christian served as Chief Financial Officer (2008-2009) of certain Fidelity funds and Senior Vice President of Fidelity Pricing and Cash Management Services (FPCMS) (2004-2009). |
Bryan A. Mehrmann (49) |
| Year of Election or Appointment: 2005 Deputy Treasurer of the Fidelity funds. Mr. Mehrmann is an employee of Fidelity Investments. |
Adrien E. Deberghes (43) |
| Year of Election or Appointment: 2008 Deputy Treasurer of Fidelity's Equity and High Income Funds. Mr. Deberghes also serves as Assistant Treasurer of other Fidelity funds (2010-present) and is an employee of Fidelity Investments (2008-present). Previously, Mr. Deberghes served as Senior Vice President of Mutual Fund Administration at State Street Corporation (2007-2008), Senior Director of Mutual Fund Administration at Investors Bank & Trust (2005-2007), and Director of Finance for Dunkin' Brands (2000-2005). |
Stephanie J. Dorsey (41) |
| Year of Election or Appointment: 2010 Assistant Treasurer of Fidelity's Equity and High Income Funds. Ms. Dorsey also serves as Deputy Treasurer of other Fidelity funds (2008-present) and is an employee of Fidelity Investments (2008-present). Previously, Ms. Dorsey served as Treasurer (2004-2008) of the JPMorgan Mutual Funds and Vice President (2004-2008) of JPMorgan Chase Bank. |
John R. Hebble (52) |
| Year of Election or Appointment: 2009 Assistant Treasurer of Fidelity's Equity and High Income Funds. Mr. Hebble also serves as Treasurer and Chief Financial Officer of The North Carolina Capital Management Trust: Cash and Term Portfolio (2008-present), President and Treasurer of other Fidelity funds (2008-present) and is an employee of Fidelity Investments. |
Gary W. Ryan (52) |
| Year of Election or Appointment: 2005 Assistant Treasurer of the Fidelity funds. Mr. Ryan is an employee of Fidelity Investments. Previously, Mr. Ryan served as Vice President of Fund Reporting in Fidelity Pricing and Cash Management Services (FPCMS) (1999-2005). |
Jonathan Davis (42) |
| Year of Election or Appointment: 2010 Assistant Treasurer of the Fidelity funds. Mr. Davis is an employee of Fidelity Investments. Previously, Mr. Davis served as Vice President and Associate General Counsel of FMR LLC (2003-2010). |
Annual Report
The Board of Trustees of Fidelity Series Emerging Markets Fund voted to pay shareholders of record at the opening of business on record date, the following distributions per share derived from capital gains realized from sales of portfolio securities, and dividends derived from net investment income:
| Pay Date | Record Date | Dividends | Capital Gains |
Series Emerging Markets Fund | 12/13/10 | 12/10/10 | $.098 | $.678 |
Class F | 12/13/10 | 12/10/10 | $.13 | $.678 |
The fund hereby designates as a capital gain dividend with respect to the taxable year ended October 31, 2010, $61,152,344, or, if subsequently determined to be different, the net capital gain of such year.
The fund designates 8% of the dividends distributed during the fiscal year as amounts which may be taken into account as a dividend for the purpose of the maximum rate under section 1(h)(11) of the Internal Revenue Code.
The fund will notify shareholders in January 2011 of amounts for use in preparing 2010 income tax returns.
Annual Report
Board Approval of Investment Advisory Contracts and Management Fees
Fidelity Series Emerging Markets Fund
Each year, the Board of Trustees, including the Independent Trustees (together, the Board), votes on the renewal of the management contract and sub-advisory agreements (together, the Advisory Contracts) for the fund. The Board, assisted by the advice of fund counsel and Independent Trustees' counsel, requests and considers a broad range of information relevant to the renewal of the Advisory Contracts throughout the year.
The Board meets regularly and considers at each of its meetings factors that are relevant to its annual consideration of the renewal of the fund's Advisory Contracts, including the services and support provided to the fund and its shareholders. The Board has established various standing committees, each composed of Independent Trustees with varying backgrounds, to which the Board has assigned specific subject matter responsibilities in order to enhance effective decision-making by the Board. The Board, acting directly and through its Committees, requests and receives information concerning the annual consideration of the renewal of the fund's Advisory Contracts. The Board also meets as needed to consider matters specifically related to the Board's annual consideration of the renewal of Advisory Contracts. Members of the Board may also meet with trustees of other Fidelity funds through ad hoc joint committees to discuss certain matters relevant to the Fidelity funds.
At its July 2010 meeting, the Board of Trustees, including the Independent Trustees, unanimously determined to renew the fund's Advisory Contracts. In reaching its determination, the Board considered all factors it believed relevant, including (i) the nature, extent, and quality of the services to be provided to the fund and its shareholders (including the investment performance of the fund); (ii) the competitiveness of the fund's management fee and total expenses; (iii) the total costs of the services to be provided by and the profits to be realized by Fidelity from its relationship with the fund; (iv) the extent to which economies of scale would be realized as the fund grows; and (v) whether fee levels reflect these economies of scale, if any, for the benefit of fund shareholders.
In considering whether to renew the Advisory Contracts for the fund, the Board reached a determination, with the assistance of fund counsel and Independent Trustees' counsel and through the exercise of its business judgment, that the renewal of the Advisory Contracts is in the best interests of fund shareholders and that the compensation to be received by Fidelity under the management contract is fair and reasonable. The Board's decision to renew the Advisory Contracts was not based on any single factor noted above, but rather was based on a comprehensive consideration of all the information provided to the Board at its meetings throughout the year. The Board, in reaching its determination to renew the Advisory Contracts, is aware that shareholders in the fund have a broad range of investment choices available to them, including a wide choice among mutual funds offered by Fidelity's competitors, and that the fund's shareholders, with the opportunity to review and weigh the disclosure provided by the fund in its prospectus and other public disclosures, have chosen to invest in this fund, managed by Fidelity.
Annual Report
Nature, Extent, and Quality of Services Provided. The Board considered the staffing within the investment adviser, FMR, and the sub-advisers (together, the Investment Advisers), including the backgrounds of the fund's investment personnel and the fund's investment objective and discipline. The Independent Trustees also had discussions with senior management of Fidelity's investment operations and investment groups. The Board considered the structure of the portfolio manager compensation program and whether this structure provides appropriate incentives to act in the best interest of the fund.
Resources Dedicated to Investment Management and Support Services. The Board and the equity research subcommittee of the Board's Fund Oversight Committee reviewed the size, education, and experience of the Investment Advisers' investment staff, their use of technology, and the Investment Advisers' approach to recruiting, training, and retaining portfolio managers and other research, advisory, and management personnel. The Board noted that Fidelity's analysts have access to a variety of technological tools and market and securities data that enable them to perform both fundamental and quantitative analysis and to specialize in various disciplines. The Board considered Fidelity's extensive global research capabilities that enable the Investment Advisers to aggregate data from various sources in an effort to produce positive investment results. The Board also considered that Fidelity's portfolio managers and analysts have access to daily portfolio attribution that allows for monitoring of a fund's portfolio, as well as an electronic communication system that provides immediate real-time access to research concerning issuers and credit enhancers. The Board noted FMR's continued focus on strengthening the organization and discipline of equity portfolio management and research.
Shareholder and Administrative Services. The Board considered (i) the nature, extent, quality, and cost of advisory, administrative, and shareholder services performed by the Investment Advisers and their affiliates under the Advisory Contracts and under separate agreements covering transfer agency, pricing and bookkeeping, and securities lending services for the fund; (ii) the nature and extent of the investment adviser's supervision of third party service providers, principally custodians and subcustodians; and (iii) the resources devoted to, and the record of compliance with, the fund's compliance policies and procedures. The Board also reviewed the allocation of fund brokerage, including allocations to brokers affiliated with the Investment Advisers, the use of brokerage commissions to pay fund expenses, and the use of "soft" commission dollars to pay for research services.
The Board noted that the growth of fund assets over time across the complex allows Fidelity to reinvest in the development of services designed to enhance the value or convenience of the Fidelity funds as investment vehicles. These services include 24-hour access to account information and market information through phone representatives and over the Internet, and investor education materials and asset allocation tools.
Annual Report
Board Approval of Investment Advisory Contracts and
Management Fees - continued
Investment in a Large Fund Family. The Board considered the benefits to shareholders of investing in a Fidelity fund, including the benefits of investing in a fund that is part of a large family of funds offering a variety of investment disciplines and providing a large variety of mutual fund investor services. The Board noted that Fidelity had taken, or had made recommendations that resulted in the Fidelity funds taking, a number of actions over the previous year that benefited particular funds, including (i) dedicating additional resources to investment research and restructuring and broadening the focus of the investment research teams; (ii) bolstering the senior management team that oversees asset management; (iii) launching Class F of certain funds as a lower-fee class available to Freedom K and Freedom Index Funds; (iv) lowering the initial investment minimums and ongoing balance requirements for Real Estate High Income Fund; (v) eliminating subsequent purchase minimums for all funds and adding a waiver of the investment minimum requirement for new accounts opened with the proceeds of a systematic withdrawal plan; (vi) eliminating the withdrawal minimum and maximum limits for systematic withdrawals from Advisor funds; (vii) expanding sales load waivers on Class A shares for Destiny Planholders and expanding Institutional Class eligibility for Class O Destiny Planholders; and (viii) changing certain Class A and Class T sales charge structures to further align them with industry practices.
Investment Performance. The Board considered whether the fund has operated in accordance with its investment objective, as well as its record of compliance with its investment restrictions. It also reviewed the fund's absolute investment performance for the retail class, as well as the fund's relative investment performance for the retail class measured against a broad-based securities market index. The Board noted that FMR does not believe that a meaningful peer group exists against which to compare the fund's performance. Because the fund had been in existence less than three calendar years, the following chart considered by the Board shows, for the one-year period ended December 31, 2009, the total return of the retail class of the fund and the total return of a broad-based securities market index ("benchmark"). (Class F of the fund had less than one year of performance as of December 31, 2009.)
Annual Report
Fidelity Series Emerging Markets Fund
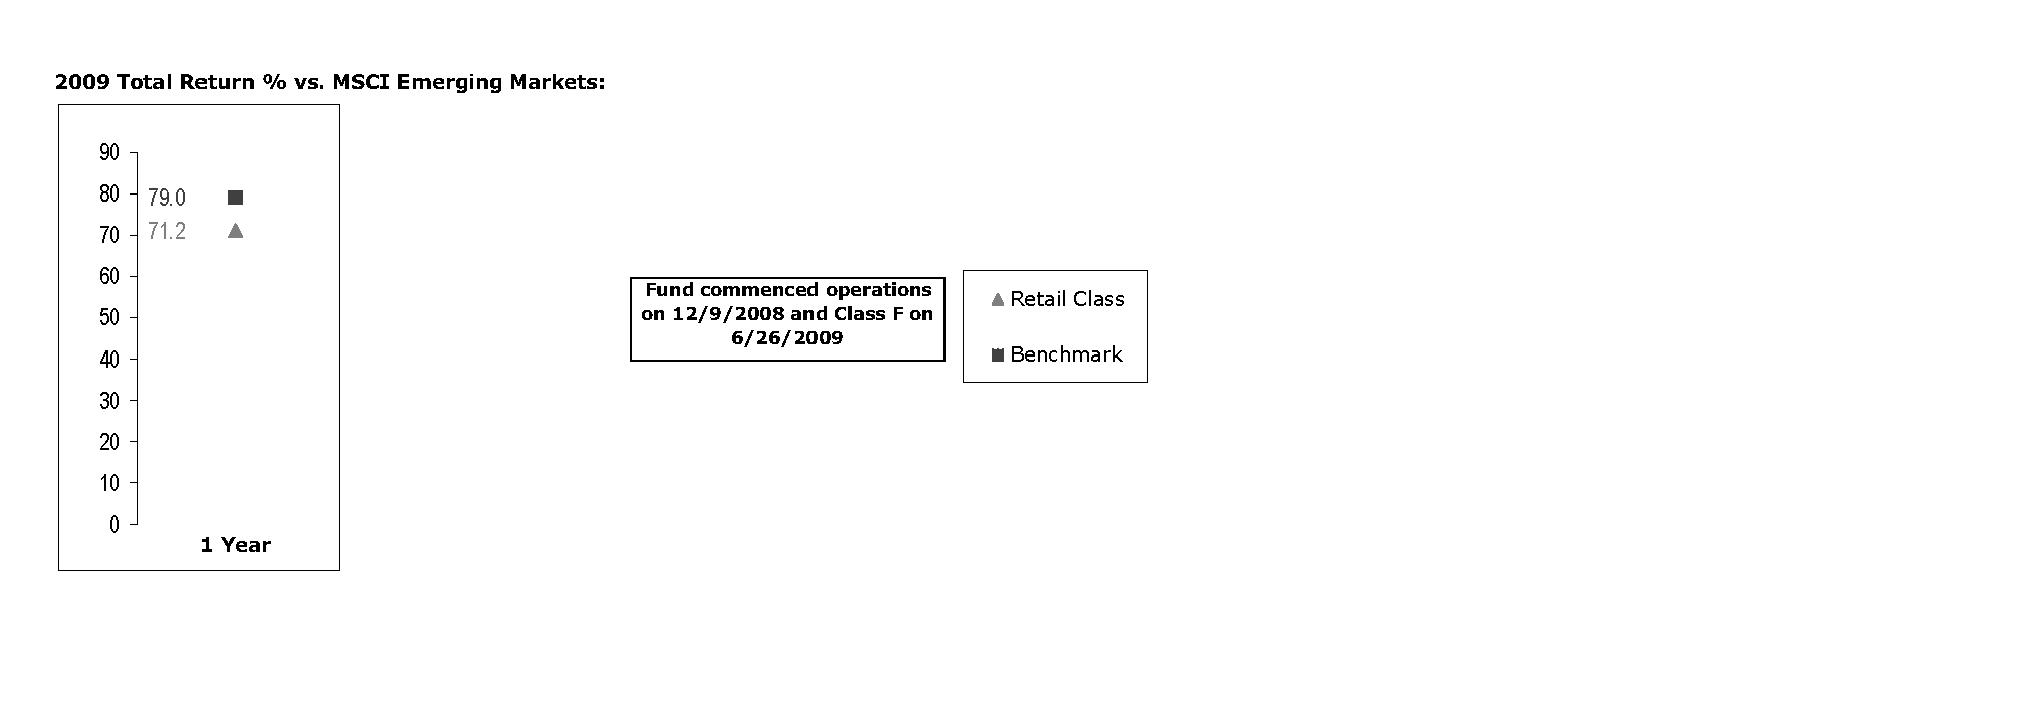
The Board noted that the investment performance of the fund was lower than its benchmark for the period shown. The Board also reviewed the fund's performance since inception as well as performance in the current year. The Board noted that it is difficult to evaluate in any comprehensive fashion the performance of the fund, in light of its relatively recent commencement of operations.
Based on its review, and giving particular weight to the nature and quality of the resources dedicated by the Investment Advisers to maintain and improve relative performance and factoring in the unprecedented market events in recent years, the Board concluded that the nature, extent, and quality of investment management and support services and of shareholder and administrative services provided to the fund will benefit the fund's shareholders, particularly in light of the Board's view that the fund's shareholders benefit from investing in a fund that is part of a large family of funds offering a variety of investment disciplines and services.
Competitiveness of Management Fee and Total Fund Expenses. The Board considered the fund's management fee and total expenses compared to "mapped groups" of competitive funds and classes. Fidelity creates "mapped groups" by combining similar Lipper investment objective categories that have comparable management fee characteristics. Combining Lipper investment objective categories aids the Board's management fee and total expense comparisons by broadening the competitive group used for comparison and by reducing the number of universes to which various Fidelity funds are compared.
Annual Report
Board Approval of Investment Advisory Contracts and
Management Fees - continued
Management Fee. The Board considered two proprietary management fee comparisons for the 12-month (or shorter) periods shown in the chart below. The group of Lipper funds used by the Board for management fee comparisons is referred to below as the "Total Mapped Group." The Total Mapped Group comparison focuses on a fund's standing relative to the total universe of comparable funds available to investors, in terms of gross management fees before expense reimbursements or caps. "TMG %" represents the percentage of funds in the Total Mapped Group that had management fees that were lower than the fund's. For example, a TMG % of 13% means that 87% of the funds in the Total Mapped Group had higher management fees than the fund. The "Asset-Size Peer Group" (ASPG) comparison focuses on a fund's standing relative to non-Fidelity funds similar in size to the fund within the Total Mapped Group. The ASPG represents at least 15% of the funds in the Total Mapped Group with comparable asset size and management fee characteristics, subject to a minimum of 50 funds (or all funds in the Total Mapped Group if fewer than 50). Additional information, such as the ASPG quartile in which the fund's management fee ranked, is also included in the chart and considered by the Board.
Fidelity Series Emerging Markets Fund
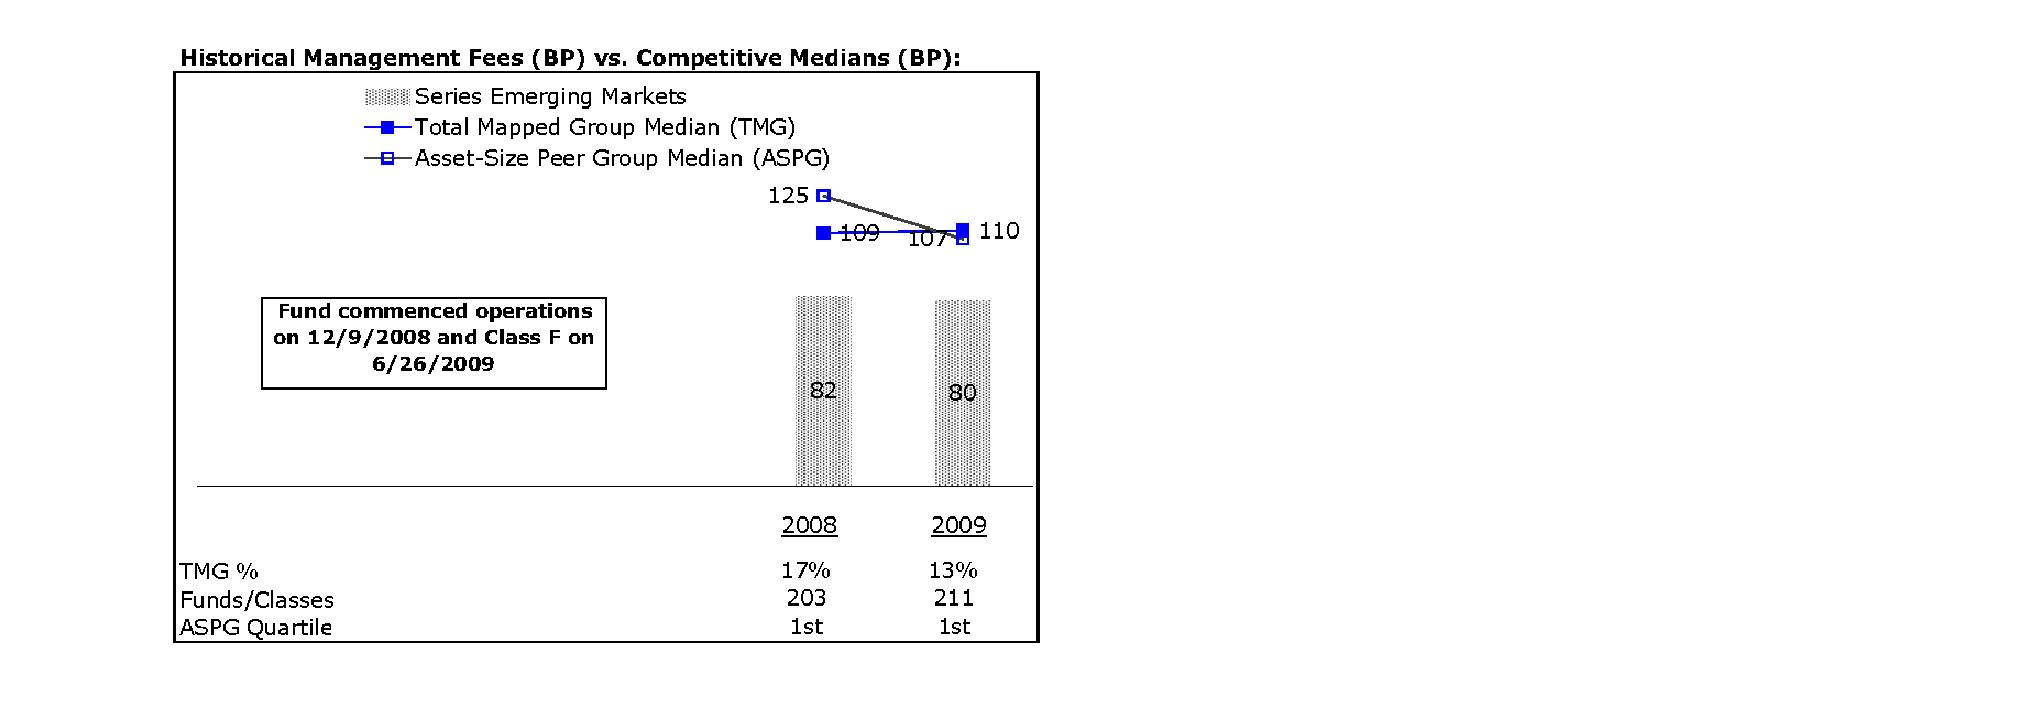
The Board noted that the fund's management fee ranked below the median of its Total Mapped Group and below the median of its ASPG for 2009.
Based on its review, the Board concluded that the fund's management fee is fair and reasonable in light of the services that the fund receives and the other factors considered.
Annual Report
Total Expenses. In its review of each class's total expenses, the Board considered the fund's management fee as well as other fund or class expenses, as applicable, such as transfer agent fees, pricing and bookkeeping fees, and custodial, legal, and audit fees. The Board also noted the effects of any waivers and reimbursements on fees and expenses. As part of its review, the Board also considered current and historical total expenses of each class of the fund compared to competitive fund median expenses. Each class of the fund is compared to those funds and classes in the Total Mapped Group (used by the Board for management fee comparisons) that have a similar sales load structure.
The Board noted that the total expenses of each class ranked below its competitive median for the period.
Fees Charged to Other Fidelity Clients. The Board also considered Fidelity fee structures and other information with respect to clients of FMR and its affiliates, such as other mutual funds advised or subadvised by FMR or its affiliates, pension plan clients, and other institutional clients. In March 2010, the Board created an ad hoc joint committee with the board of other Fidelity funds (the Committee) to review and compare Fidelity's institutional investment advisory business with its business of providing services to the Fidelity funds, including the differences in services provided, fees charged, and costs incurred, as well as competition in their respective marketplaces.
Based on its review of total expenses and fees charged to other Fidelity clients, the Board concluded that the total expenses of each class of the fund were reasonable in light of the services that the fund and its shareholders receive and the other factors considered, including the findings of the Committee.
Costs of the Services and Profitability. The Board considered the revenues earned and the expenses incurred by Fidelity in conducting the business of developing, marketing, distributing, managing, administering and servicing the fund and its shareholders. The Board also considered the level of Fidelity's profits in respect of all the Fidelity funds.
On an annual basis, FMR presents to the Board Fidelity's profitability for the fund. Fidelity calculates the profitability for each fund, as well as aggregate profitability for groups of Fidelity funds and all Fidelity funds, using a series of detailed revenue and cost allocation methodologies which originate with the audited books and records of Fidelity. The Audit Committee of the Board reviews any significant changes from the prior year's methodologies.
PricewaterhouseCoopers LLP (PwC), independent registered public accounting firm and auditor to Fidelity and certain Fidelity funds, has been engaged annually by the Board as part of the Board's assessment of Fidelity's profitability analysis. PwC's engagement includes the review and assessment of Fidelity's methodologies used in determining the revenues and expenses attributable to Fidelity's mutual fund business, and completion of agreed-upon procedures surrounding the mathematical accuracy of fund profitability and its conformity to allocation methodologies. After considering PwC's reports issued under the engagement and information provided by Fidelity, the Board believes that while other allocation methods may also be reasonable, Fidelity's profitability methodologies are reasonable in all material respects.
Annual Report
Board Approval of Investment Advisory Contracts and
Management Fees - continued
The Board has also reviewed Fidelity's non-fund businesses and fall-out benefits related to the mutual fund business as well as cases where Fidelity's affiliates may benefit from or be related to the fund's business.
The Board considered the costs of the services provided by and the profits realized by Fidelity in connection with the operation of the fund and were satisfied that the profitability was not excessive in the circumstances.
Economies of Scale. The Board considered whether there have been economies of scale in respect of the management of the Fidelity funds, whether the Fidelity funds (including the fund) have appropriately benefited from any such economies of scale, and whether there is potential for realization of any further economies of scale. The Board considered the extent to which the fund will benefit from economies of scale through increased services to the fund, through waivers or reimbursements, or through fee or expense reductions.
In February 2009, the Board and the board of other Fidelity funds created an ad hoc committee (the Economies of Scale Committee) to analyze whether FMR attains economies of scale in respect of the management and servicing of the Fidelity funds, whether the Fidelity funds have appropriately benefited from such economies of scale, and whether there is potential for realization of any further economies of scale.
The Board recognized that the fund's management contract incorporates a "group fee" structure, which provides for lower group fee rates as total fund assets under FMR's management increase, and for higher group fee rates as total fund assets under FMR's management decrease. FMR calculates the group fee rates based on a tiered asset "breakpoint" schedule that varies based on asset class. The Board considered that the group fee is designed to deliver the benefits of economies of scale to fund shareholders when total Fidelity fund assets increase, even if assets of any particular fund are unchanged or have declined, because some portion of Fidelity's costs are attributable to services provided to all Fidelity funds, and all funds benefit if those costs can be allocated among more assets. The Board also considered that although the fund is offered only to other funds advised by FMR or an affiliate, it continues to incur management expenses. The Board further noted that the fund may continue to realize benefits from the group fee structure, even though assets may not be expected to grow significantly at the fund level. The Board concluded that, given the group fee structure, fund shareholders will benefit from lower management fees as assets under FMR's management increase at the fund complex level, regardless of whether Fidelity achieves any such economies of scale.
Annual Report
The Board concluded, considering the findings of the Economies of Scale Committee, that any potential economies of scale are being appropriately shared between fund shareholders and Fidelity.
Additional Information Requested by the Board. In order to develop fully the factual basis for consideration of the Fidelity funds' Advisory Contracts, the Board requested and received additional information on certain topics, including (i) fund performance trends, actions to be taken by FMR to improve certain funds' overall performance, and Fidelity's long-term strategies for certain funds; (ii) portfolio manager changes that have occurred during the past year and length of portfolio manager tenure for different categories of funds over time; (iii) Fidelity's compensation structure for portfolio managers, research analysts, and other key personnel, the rationale for the compensation structure, and how the compensation structure provides appropriate performance incentives; (iv) the amount of the investment that each portfolio manager has made in the Fidelity fund(s) that he or she manages; (v) management and other fees paid by FMR to affiliated sub-advisers on behalf of the Fidelity funds; (vi) Fidelity's fee structures and rationale for recommending different fees among different categories of funds; (vii) Fidelity's rationale for recommending which funds should have a performance adjustment component as part of their management fees; (viii) the rationale for any differences between fund fee structures and fee structures in place for other Fidelity clients; and (ix) explanations regarding the relative total expenses borne by certain funds and classes, total expense competitive trends, and actions that might be taken by FMR to reduce total expenses for certain funds and classes.
Based on its evaluation of all of the conclusions noted above, and after considering all factors it believed relevant, the Board ultimately concluded that the advisory fee structures are fair and reasonable, and that the fund's Advisory Contracts should be renewed.
Annual Report
Investment Adviser
Fidelity Management & Research Company
Boston, MA
Investment Sub-Advisers
FMR Co., Inc.
Fidelity Management & Research (U.K.) Inc.
Fidelity Research & Analysis Company
Fidelity Management & Research (Hong Kong) Limited
Fidelity Management & Research (Japan) Inc.
FIL Investment Advisors
FIL Investment Advisors (U.K.) Ltd.
FIL Investments (Japan) Limited
General Distributor
Fidelity Distributors Corporation
Boston, MA
Transfer and Service Agents
Fidelity Investments Institutional Operations Company, Inc.
Boston, MA
Fidelity Service Company, Inc.
Boston, MA
Custodian
The Northern Trust Company
Chicago, IL
ILF-ANN-1210
1.873103.101
Fidelity®
Series International Growth
Series International Value
Series International Small Cap
Funds -
Fidelity Series International Growth Fund
Fidelity Series International Value Fund
Fidelity Series International Small Cap Fund
Class F
Annual Report
October 31, 2010
(2_fidelity_logos) (Registered_Trademark)
Contents
Shareholder Expense Example | <Click Here> | An example of shareholder expenses. |
Fidelity Series International Growth Fund |
Performance | <Click Here> | How the fund has done over time. |
Management's Discussion of Fund Performance | <Click Here> | The Portfolio Manager's review of fund performance and strategy. |
Investment Changes | <Click Here> | A summary of major shifts in the Fund's investments over the past six months. |
Investments | <Click Here> | A complete list of the fund's investments with their market values. |
Financial Statements | <Click Here> | Statements of assets and liabilities, operations, and changes in net assets, as well as financial highlights. |
Fidelity Series International Value Fund |
Performance | <Click Here> | How the fund has done over time. |
Management's Discussion of Fund Performance | <Click Here> | The Portfolio Manager's review of fund performance and strategy. |
Investment Changes | <Click Here> | A summary of major shifts in the Fund's investments over the past six months. |
Investments | <Click Here> | A complete list of the fund's investments with their market values. |
Financial Statements | <Click Here> | Statements of assets and liabilities, operations, and changes in net assets, as well as financial highlights. |
Fidelity Series International Small Cap Fund |
Performance | <Click Here> | How the fund has done over time. |
Management's Discussion of Fund Performance | <Click Here> | The Portfolio Manager's review of fund performance and strategy. |
Investment Changes | <Click Here> | A summary of major shifts in the Fund's investments over the past six months. |
Investments | <Click Here> | A complete list of the fund's investments with their market values. |
Financial Statements | <Click Here> | Statements of assets and liabilities, operations, and changes in net assets, as well as financial highlights. |
Notes | <Click Here> | Notes to the Financial Statements. |
Report of Independent Registered Public Accounting Firms | <Click Here> | |
Trustees and Officers | <Click Here> | |
Distributions | <Click Here> | |
Annual Report
To view a fund's proxy voting guidelines and proxy voting record for the 12-month period ended June 30, visit http://www.fidelity.com/proxyvotingresults or visit the Securities and Exchange Commission's (SEC) web site at http://www.sec.gov. You may also call 1-800-544-8544 for Fidelity Series International Growth Fund, Fidelity Series International Small Cap Fund, and Fidelity Series International Value Fund or 1-800-835-5092 for Class F of each fund to request a free copy of the proxy voting guidelines.
Standard & Poor's, S&P and S&P 500 are registered service marks of The McGraw-Hill Companies, Inc. and have been licensed for use by Fidelity Distributors Corporation.
Other third party marks appearing herein are the property of their respective owners.
All other marks appearing herein are registered or unregistered trademarks or service marks of FMR LLC or an affiliated company.
This report and the financial statements contained herein are submitted for the general information of the shareholders of the funds. This report is not authorized for distribution to prospective investors in the funds unless preceded or accompanied by an effective prospectus.
A fund files its complete schedule of portfolio holdings with the SEC for the first and third quarters of each fiscal year on Form N-Q. Forms N-Q are available on the SEC's web site at http://www.sec.gov. A fund's Forms N-Q may be reviewed and copied at the SEC's Public Reference Room in Washington, DC. Information regarding the operation of the SEC's Public Reference Room may be obtained by calling 1-800-SEC-0330. For a complete list of a fund's portfolio holdings, view the most recent holdings listing, semiannual report, or annual report on Fidelity's web site at http://www.fidelity.com or http://www.advisor.fidelity.com, as applicable.
NOT FDIC INSURED • MAY LOSE VALUE • NO BANK GUARANTEE
Neither the funds nor Fidelity Distributors Corporation is a bank.
Annual Report
Shareholder Expense Example
As a shareholder of a Fund, you incur two types of costs: (1) transaction costs, and (2) ongoing costs, including management fees and other Fund expenses. This Example is intended to help you understand your ongoing costs (in dollars) of investing in the Funds and to compare these costs with the ongoing costs of investing in other mutual funds.
The Example is based on an investment of $1,000 invested at the beginning of the period and held for the entire period (May 1, 2010 to October 31, 2010).
Actual Expenses
The first line of the accompanying table for each class of each fund provides information about actual account values and actual expenses. You may use the information in this line, together with the amount you invested, to estimate the expenses that you paid over the period. Simply divide your account value by $1,000.00 (for example, an $8,600 account value divided by $1,000.00 = 8.6), then multiply the result by the number in the first line for a class of the fund under the heading entitled "Expenses Paid During Period" to estimate the expenses you paid on your account during this period. In addition, each Fund, as a shareholder in the underlying Fidelity Central Funds, will indirectly bear its pro-rata share of the fees and expenses incurred by the underlying Fidelity Central Funds. These fees and expenses are not included in the Fund's annualized expense ratio used to calculate the expense estimate in the table below.
Hypothetical Example for Comparison Purposes
The second line of the accompanying table for each class of each fund provides information about hypothetical account values and hypothetical expenses based on a Class' actual expense ratio and an assumed rate of return of 5% per year before expenses, which is not the Class' actual return. The hypothetical account values and expenses may not be used to estimate the actual ending account balance or expenses you paid for the period. You may use this information to compare the ongoing costs of investing in the Fund and other funds. To do so, compare this 5% hypothetical example with the 5% hypothetical examples that appear in the shareholder reports of the other funds. In addition, each Fund, as a shareholder in the underlying Fidelity Central Funds, will indirectly bear its pro-rata share of the fees and expenses incurred by the underlying Fidelity Central Funds. These fees and expenses are not included in the Fund's annualized expense ratio used to calculate the expense estimate in the table below.
Please note that the expenses shown in the table are meant to highlight your ongoing costs only and do not reflect any transaction costs. Therefore, the second line of the table is useful in comparing ongoing costs only, and will not help you determine the relative total costs of owning different funds.
Annual Report
Shareholder Expense Example - continued
| Annualized Expense Ratio | Beginning
Account Value
May 1, 2010 | Ending
Account Value
October 31, 2010 | Expenses Paid
During Period*
May 1, 2010 to October 31, 2010 |
Fidelity Series International Growth Fund | | | | |
Series International Growth | 1.01% | | | |
Actual | | $ 1,000.00 | $ 1,112.40 | $ 5.38 |
HypotheticalA | | $ 1,000.00 | $ 1,020.11 | $ 5.14 |
Class F | .78% | | | |
Actual | | $ 1,000.00 | $ 1,113.30 | $ 4.15 |
HypotheticalA | | $ 1,000.00 | $ 1,021.27 | $ 3.97 |
Fidelity Series International Value Fund | | | | |
Series International Value | 1.01% | | | |
Actual | | $ 1,000.00 | $ 1,046.50 | $ 5.21 |
HypotheticalA | | $ 1,000.00 | $ 1,020.11 | $ 5.14 |
Class F | .78% | | | |
Actual | | $ 1,000.00 | $ 1,047.50 | $ 4.03 |
HypotheticalA | | $ 1,000.00 | $ 1,021.27 | $ 3.97 |
Fidelity Series International Small Cap Fund | | | | |
Series International Small Cap | 1.20% | | | |
Actual | | $ 1,000.00 | $ 1,092.00 | $ 6.33 |
HypotheticalA | | $ 1,000.00 | $ 1,019.16 | $ 6.11 |
Class F | .98% | | | |
Actual | | $ 1,000.00 | $ 1,094.80 | $ 5.17 |
Hypothetical A | | $ 1,000.00 | $ 1,020.27 | $ 4.99 |
A 5% return per year before expenses
* Expenses are equal to each Class' annualized expense ratio, multiplied by the average account value over the period, multiplied by 184/365 (to reflect the one-half year period).
Annual Report
Fidelity Series International Growth Fund
Average annual total return reflects the change in the value of an investment, assuming reinvestment of the class' distributions from dividend income and capital gains (the profits earned upon the sale of securities that have grown in value, if any) and assuming a constant rate of performance each year. The $10,000 table and the fund's returns do not reflect the deduction of taxes that a shareholder would pay on fund distributions or the redemption of fund shares. During periods of reimbursement by Fidelity, a fund's total return will be greater than it would be had the reimbursement not occurred. How a fund did yesterday is no guarantee of how it will do tomorrow.
Average annual total returns take Fidelity ® Series International Growth Fund's cumulative total return and show you what would have happened if Fidelity Series International Growth Fund shares had performed at a constant rate each year. These numbers will be reported once the fund is a year old.
$10,000 Over Life of Fund
Let's say hypothetically that $10,000 was invested in Fidelity Series International Growth Fund, a class of the fund, on December 3, 2009, when the fund started. The chart shows how the value of your investment would have changed, and also shows how the MSCI ® EAFE ® (Europe, Australasia, Far East) Growth Index performed over the same period.
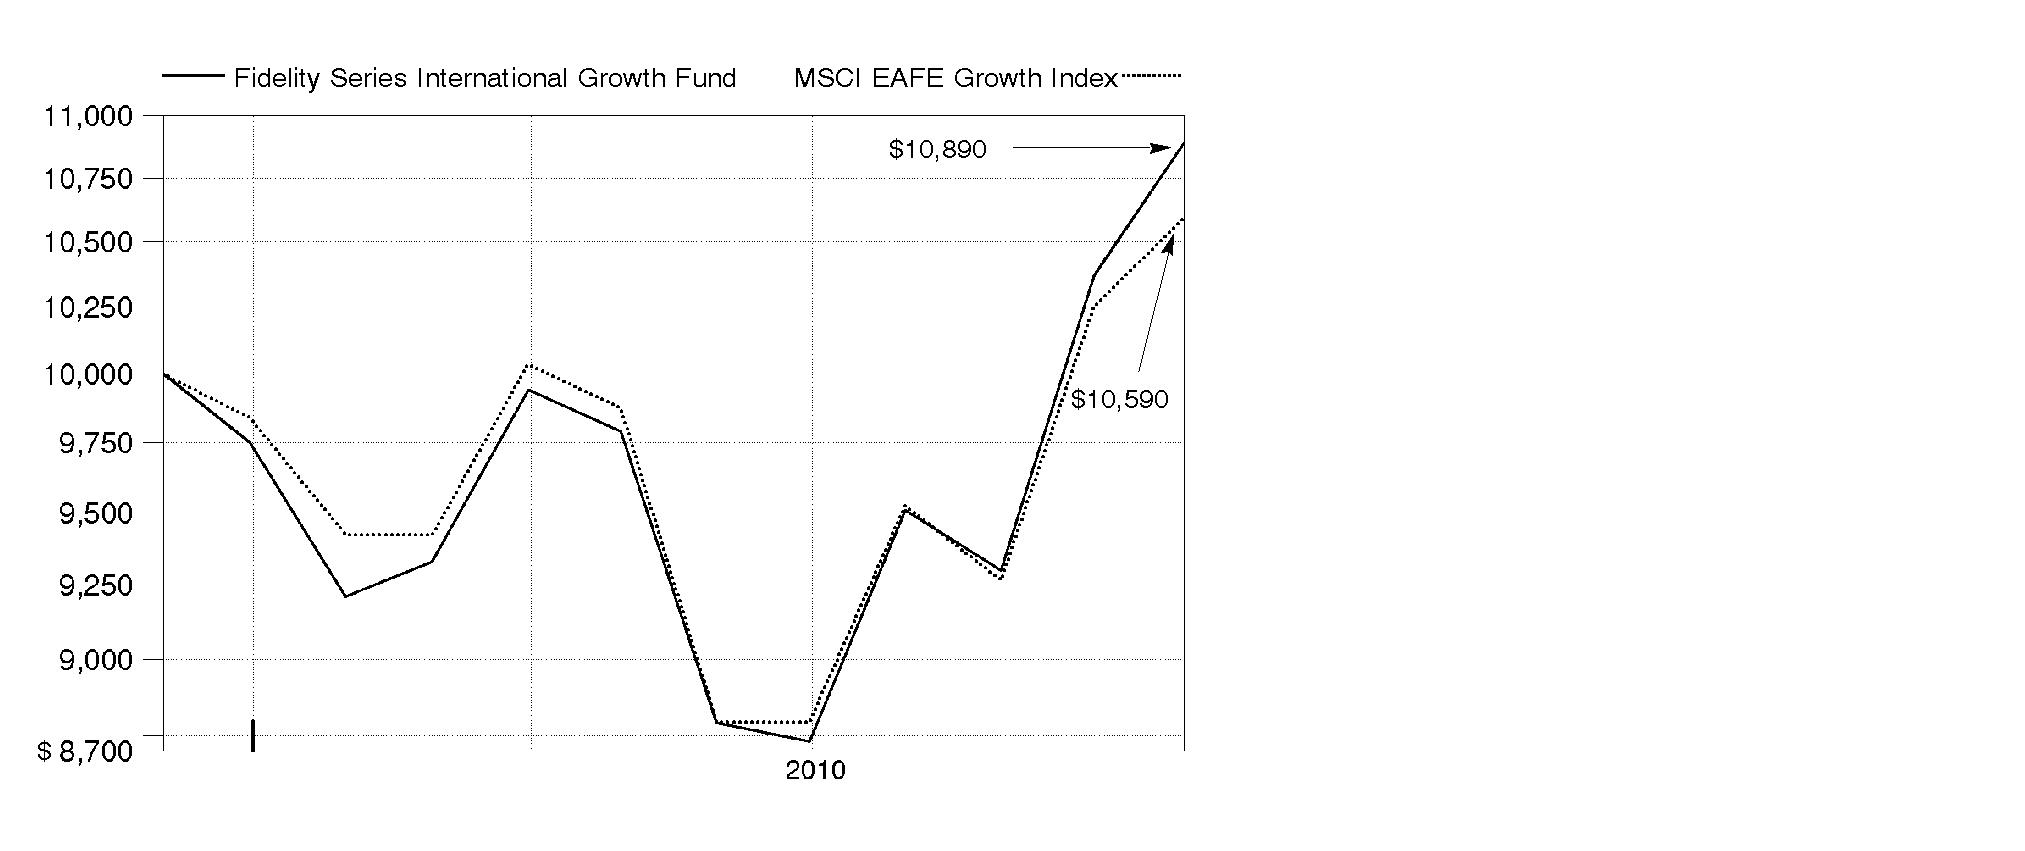
Annual Report
Market Recap: International stocks rode a wave of volatility similar to that of their U.S. counterparts during the 12 months ending October 31, 2010. Stocks gained modestly in the first half of the period, despite growing concerns about the European debt crisis. Sentiment turned decidedly negative in May and June, however, and the market suffered a precipitous decline. These losses were more than offset during the last four months of the period, when signs of economic growth and subsiding debt fears helped propel international stocks about 21%. For the full year, the MSCI® ACWI® (All Country World Index) ex USA Index gained 12.76%, boosted in part by a generally depreciating U.S. dollar. Within the index, Canada and emerging markets were standouts, returning 23% and 24%, respectively. Results in the latter group were led by strong-performing India, Mexico and South Africa, while China fell short of the MSCI benchmark due to cooling economic growth. The developed Asia ex Japan segment rose 16% for the period, lifted by solid results from Singapore and Hong Kong. Meanwhile, Europe rose just 9%, held back mainly by debt-riddled Spain and Italy, as well as lagging major constituent France. Japan returned only 5%, a result of that nation's continued weak economy.
Comments from Jed Weiss, Portfolio Manager of Fidelity ® Series International Growth Fund: Between the fund's inception date of December 3, 2009, and October 31, 2010, the fund's Series International Growth and Class F shares rose 8.90% and 9.10%, respectively, outpacing the 5.90% return of the MSCI EAFE® (Europe, Australasia, Far East) Growth Index. Stock picking was quite favorable in financials and consumer discretionary, with positive results also coming from consumer staples, health care, materials and industrials. Conversely, stock picking in telecommunication services, energy, utilities and technology modestly detracted. In country terms, the fund's positioning in emerging markets was positive, especially stock picking in South Africa, Turkey and Brazil. An out-of-index stake in the United States also aided results. In Europe, country positioning, along with the associated currency impact, was helpful, but virtually offset by unsuccessful stock picking in the region, particularly in the U.K. and Switzerland. Top individual contributors included Turkish bank Turkiye Garanti Bankasi; Autoliv, a Swedish auto-safety equipment maker with shares listed in the United States; South African retailers Mr Price Group and Clicks Group; and Novo Nordisk, a Danish health care company. In contrast, the biggest detractors were positions in credit card processor Visa, and Irish home-siding firm James Hardie Industries, and not owning lagging index component British American Tobacco . Several of the stocks mentioned were not in the index.
The views expressed above reflect those of the portfolio manager(s) only through the end of the period as stated on the cover of this report and do not necessarily represent the views of Fidelity or any other person in the Fidelity organization. Any such views are subject to change at any time based upon market or other conditions and Fidelity disclaims any responsibility to update such views. These views may not be relied on as investment advice and, because investment decisions for a Fidelity fund are based on numerous factors, may not be relied on as an indication of trading intent on behalf of any Fidelity fund.
Annual Report
Fidelity Series International Growth Fund
Investment Changes (Unaudited)
Geographic Diversification (% of fund's net assets) |
As of October 31, 2010 |
| United Kingdom 20.3% | |
| Switzerland 12.0% | |
| United States of America 11.2% | |
| Japan 8.0% | |
| Australia 5.3% | |
| Germany 4.1% | |
| Belgium 3.5% | |
| Brazil 3.3% | |
| France 2.9% | |
| Other 29.4% | |

Percentages are adjusted for the effect of futures contracts, if applicable. |
As of April 30, 2010 |
| United Kingdom 19.3% | |
| Switzerland 13.1% | |
| United States of America 9.9% | |
| Japan 9.3% | |
| Australia 4.3% | |
| Brazil 3.9% | |
| Spain 3.8% | |
| Belgium 3.3% | |
| Germany 3.0% | |
| Other 30.1% | |

Percentages are adjusted for the effect of futures contracts, if applicable. |
Asset Allocation |
| % of fund's
net assets | % of fund's net assets
6 months ago |
Stocks | 99.0 | 98.7 |
Short-Term Investments and Net Other Assets | 1.0 | 1.3 |
Top Ten Stocks as of October 31, 2010 |
| % of fund's
net assets | % of fund's net assets
6 months ago |
Nestle SA (Switzerland, Food Products) | 4.5 | 4.0 |
BHP Billiton PLC (United Kingdom, Metals & Mining) | 4.4 | 3.4 |
Anheuser-Busch InBev SA NV (Belgium, Beverages) | 2.9 | 2.7 |
Rio Tinto PLC (United Kingdom, Metals & Mining) | 2.1 | 2.3 |
Roche Holding AG (participation certificate) (Switzerland, Pharmaceuticals) | 2.1 | 3.0 |
Visa, Inc. Class A (United States of America, IT Services) | 2.0 | 2.0 |
BG Group PLC (United Kingdom, Oil, Gas & Consumable Fuels) | 2.0 | 1.8 |
Novo Nordisk AS Series B
(Denmark, Pharmaceuticals) | 2.0 | 1.6 |
Siemens AG (Germany, Industrial Conglomerates) | 1.9 | 0.4 |
Standard Chartered PLC (United Kingdom, Commercial Banks) | 1.9 | 1.7 |
| 25.8 | |
Market Sectors as of October 31, 2010 |
| % of fund's
net assets | % of fund's net assets
6 months ago |
Consumer Staples | 18.1 | 17.1 |
Materials | 17.0 | 17.0 |
Financials | 13.8 | 16.5 |
Consumer Discretionary | 12.4 | 11.6 |
Industrials | 12.4 | 11.3 |
Health Care | 11.3 | 10.9 |
Information Technology | 8.4 | 6.6 |
Energy | 5.0 | 4.6 |
Telecommunication Services | 0.6 | 2.8 |
Utilities | 0.0 | 0.3 |
Annual Report
Fidelity Series International Growth Fund
Investments October 31, 2010
Showing Percentage of Net Assets
Common Stocks - 99.0% |
| Shares | | Value |
Australia - 5.3% |
CSL Ltd. | 1,653,564 | | $ 53,181,776 |
Leighton Holdings Ltd. (d) | 1,242,009 | | 44,654,142 |
MAp Group unit | 3,449,456 | | 10,306,742 |
Newcrest Mining Ltd. | 285,477 | | 11,175,515 |
Newcrest Mining Ltd. sponsored ADR | 802,586 | | 31,621,888 |
OZ Minerals Ltd. | 18,144,966 | | 27,818,996 |
Woolworths Ltd. | 1,691,782 | | 46,985,993 |
Worleyparsons Ltd. | 1,061,933 | | 23,875,405 |
TOTAL AUSTRALIA | | 249,620,457 |
Austria - 0.5% |
Andritz AG | 279,400 | | 21,397,963 |
Bailiwick of Guernsey - 0.5% |
Resolution Ltd. | 5,973,373 | | 25,064,458 |
Bailiwick of Jersey - 0.9% |
Informa PLC | 2,376,987 | | 16,604,143 |
Randgold Resources Ltd. sponsored ADR | 252,065 | | 23,673,945 |
TOTAL BAILIWICK OF JERSEY | | 40,278,088 |
Belgium - 3.5% |
Anheuser-Busch InBev SA NV | 2,154,863 | | 135,032,230 |
Umicore SA | 649,848 | | 30,581,093 |
TOTAL BELGIUM | | 165,613,323 |
Bermuda - 1.3% |
Huabao International Holdings Ltd. | 650,000 | | 979,455 |
Lazard Ltd. Class A | 524,700 | | 19,361,430 |
Seadrill Ltd. (d) | 934,400 | | 28,290,506 |
Trinity Ltd. | 10,970,000 | | 10,968,231 |
TOTAL BERMUDA | | 59,599,622 |
Brazil - 3.3% |
Banco ABC Brasil SA | 2,152,000 | | 21,201,223 |
BM&F Bovespa SA | 3,482,700 | | 29,172,628 |
BR Malls Participacoes SA | 1,556,600 | | 14,868,769 |
Braskem SA Class A sponsored ADR (d) | 1,670,500 | | 34,829,925 |
Fibria Celulose SA sponsored ADR (a)(d) | 677,900 | | 12,175,084 |
Iguatemi Empresa de Shopping Centers SA | 390,200 | | 9,105,890 |
Itau Unibanco Banco Multiplo SA ADR | 952,800 | | 23,400,768 |
Multiplan Empreendimentos Imobiliarios SA | 467,200 | | 10,710,557 |
TOTAL BRAZIL | | 155,464,844 |
Common Stocks - continued |
| Shares | | Value |
Canada - 2.8% |
Agnico-Eagle Mines Ltd. (Canada) | 311,500 | | $ 24,158,888 |
Fairfax Financial Holdings Ltd. (sub. vtg.) | 27,800 | | 11,371,587 |
Goldcorp, Inc. | 212,400 | | 9,483,965 |
Niko Resources Ltd. | 368,100 | | 35,117,296 |
Open Text Corp. (a) | 363,900 | | 16,098,802 |
Pan American Silver Corp. | 566,300 | | 18,076,297 |
Petrobank Energy & Resources Ltd. (a) | 453,000 | | 18,028,503 |
TOTAL CANADA | | 132,335,338 |
Cayman Islands - 0.9% |
Alibaba.com Ltd. (a) | 5,238,000 | | 10,231,036 |
China Lilang Ltd. | 6,803,000 | | 10,637,299 |
Wynn Macau Ltd. | 9,808,200 | | 21,688,444 |
TOTAL CAYMAN ISLANDS | | 42,556,779 |
Chile - 0.5% |
Banco Santander Chile sponsored ADR | 254,800 | | 23,604,672 |
China - 0.6% |
Baidu.com, Inc. sponsored ADR (a) | 237,820 | | 26,162,578 |
Denmark - 2.4% |
Novo Nordisk AS: | | | |
Series B | 54,966 | | 5,770,456 |
Series B sponsored ADR | 822,700 | | 86,218,960 |
William Demant Holding AS (a) | 267,300 | | 20,035,903 |
TOTAL DENMARK | | 112,025,319 |
Finland - 1.9% |
Metso Corp. | 587,300 | | 27,841,956 |
Nokian Tyres PLC | 991,000 | | 34,335,281 |
Outotec OYJ | 538,000 | | 25,108,047 |
TOTAL FINLAND | | 87,285,284 |
France - 2.9% |
Alstom SA | 508,916 | | 25,676,836 |
Danone | 786,005 | | 49,735,401 |
Remy Cointreau SA | 301,703 | | 21,183,342 |
Safran SA | 1,302,486 | | 41,285,200 |
TOTAL FRANCE | | 137,880,779 |
Germany - 4.1% |
Bayerische Motoren Werke AG (BMW) | 212,206 | | 15,209,566 |
Colonia Real Estate AG (a) | 167,240 | | 1,097,442 |
Common Stocks - continued |
| Shares | | Value |
Germany - continued |
Linde AG | 442,129 | | $ 63,642,481 |
MAN SE | 230,337 | | 25,319,691 |
Siemens AG | 66,124 | | 7,552,036 |
Siemens AG sponsored ADR | 712,400 | | 81,434,444 |
TOTAL GERMANY | | 194,255,660 |
Hong Kong - 1.2% |
Hong Kong Exchanges and Clearing Ltd. | 2,590,800 | | 57,021,833 |
Ireland - 1.0% |
CRH PLC sponsored ADR (d) | 1,529,000 | | 27,017,430 |
James Hardie Industries NV unit (a) | 3,376,546 | | 17,829,222 |
TOTAL IRELAND | | 44,846,652 |
Italy - 1.9% |
Azimut Holdings SpA | 2,295,566 | | 23,413,232 |
Fiat SpA | 2,562,400 | | 43,355,890 |
Saipem SpA | 485,158 | | 21,555,084 |
TOTAL ITALY | | 88,324,206 |
Japan - 8.0% |
Autobacs Seven Co. Ltd. | 506,200 | | 18,965,987 |
Denso Corp. | 1,231,700 | | 38,303,526 |
Fanuc Ltd. | 420,600 | | 60,890,122 |
Fast Retailing Co. Ltd. | 169,900 | | 22,255,410 |
Japan Steel Works Ltd. | 2,265,000 | | 21,610,551 |
Keyence Corp. | 158,600 | | 39,319,869 |
Kobayashi Pharmaceutical Co. Ltd. | 523,800 | | 24,409,717 |
MS&AD Insurance Group Holdings, Inc. | 707,900 | | 16,959,088 |
Nippon Thompson Co. Ltd. | 2,260,000 | | 15,671,430 |
Osaka Securities Exchange Co. Ltd. | 3,822 | | 19,235,864 |
Shiseido Co. Ltd. | 1,288,300 | | 26,896,608 |
SHO-BOND Holdings Co. Ltd. | 492,000 | | 10,528,445 |
USS Co. Ltd. | 461,610 | | 35,910,010 |
Yamato Kogyo Co. Ltd. | 1,023,100 | | 26,241,808 |
TOTAL JAPAN | | 377,198,435 |
Korea (South) - 0.7% |
NHN Corp. (a) | 195,511 | | 34,686,028 |
Mexico - 1.1% |
Wal-Mart de Mexico SA de CV Series V | 18,489,300 | | 50,570,305 |
Netherlands - 2.2% |
ASM International NV unit (a) | 821,165 | | 20,980,766 |
Common Stocks - continued |
| Shares | | Value |
Netherlands - continued |
ASML Holding NV | 1,040,000 | | $ 34,517,600 |
ASML Holding NV (Netherlands) | 78,600 | | 2,604,924 |
Koninklijke KPN NV | 1,541,150 | | 25,733,198 |
QIAGEN NV (a)(d) | 1,019,300 | | 19,173,033 |
TOTAL NETHERLANDS | | 103,009,521 |
Peru - 0.2% |
Compania de Minas Buenaventura SA sponsored ADR | 194,400 | | 10,310,976 |
Portugal - 0.5% |
Jeronimo Martins SGPS SA | 1,681,200 | | 25,217,716 |
Singapore - 1.2% |
City Developments Ltd. | 1,416,000 | | 13,916,032 |
Singapore Exchange Ltd. | 5,121,000 | | 34,817,894 |
Wing Tai Holdings Ltd. | 6,345,000 | | 8,578,962 |
TOTAL SINGAPORE | | 57,312,888 |
South Africa - 2.3% |
African Rainbow Minerals Ltd. | 1,350,500 | | 34,453,409 |
Clicks Group Ltd. | 4,172,308 | | 27,219,574 |
JSE Ltd. | 1,620,000 | | 18,269,677 |
Mr Price Group Ltd. | 2,820,500 | | 25,631,941 |
TOTAL SOUTH AFRICA | | 105,574,601 |
Spain - 1.3% |
Inditex SA (d) | 503,146 | | 42,013,151 |
Prosegur Compania de Seguridad SA (Reg.) | 353,900 | | 21,204,215 |
TOTAL SPAIN | | 63,217,366 |
Sweden - 1.5% |
H&M Hennes & Mauritz AB (B Shares) | 1,518,357 | | 53,493,361 |
Swedish Match Co. | 580,400 | | 16,217,774 |
TOTAL SWEDEN | | 69,711,135 |
Switzerland - 12.0% |
Credit Suisse Group sponsored ADR | 583,320 | | 24,207,780 |
Nestle SA | 3,888,834 | | 212,940,678 |
Novartis AG | 166,191 | | 9,626,626 |
Novartis AG sponsored ADR (d) | 1,359,500 | | 78,783,025 |
Roche Holding AG (participation certificate) | 681,526 | | 100,046,230 |
Sonova Holding AG Class B | 464,137 | | 53,752,850 |
The Swatch Group AG: | | | |
(Bearer) | 123,170 | | 47,060,738 |
Common Stocks - continued |
| Shares | | Value |
Switzerland - continued |
The Swatch Group AG: - continued | | | |
(Reg.) | 32,278 | | $ 2,242,917 |
UBS AG (a) | 569,570 | | 9,672,646 |
UBS AG (NY Shares) (a) | 1,302,200 | | 22,163,444 |
TOTAL SWITZERLAND | | 560,496,934 |
Turkey - 2.0% |
Anadolu Efes Biracilik ve Malt Sanayii AS | 1,104,000 | | 17,626,438 |
Asya Katilim Bankasi AS | 4,817,000 | | 12,426,201 |
Coca-Cola Icecek AS | 1,368,125 | | 17,551,070 |
Turkiye Garanti Bankasi AS | 7,291,000 | | 44,733,180 |
TOTAL TURKEY | | 92,336,889 |
United Kingdom - 20.3% |
Anglo American PLC (United Kingdom) | 918,700 | | 42,802,713 |
Babcock International Group PLC | 2,449,200 | | 22,759,118 |
BAE Systems PLC | 3,333,900 | | 18,411,833 |
BG Group PLC | 4,724,946 | | 92,014,228 |
BHP Billiton PLC | 94,981 | | 3,364,281 |
BHP Billiton PLC ADR | 2,897,100 | | 205,114,680 |
Cobham PLC | 3,836,600 | | 14,236,009 |
GlaxoSmithKline PLC | 314,500 | | 6,140,641 |
GlaxoSmithKline PLC sponsored ADR | 1,432,200 | | 55,913,088 |
Imperial Tobacco Group PLC | 611,307 | | 19,578,316 |
InterContinental Hotel Group PLC ADR (d) | 2,003,915 | | 38,775,755 |
Johnson Matthey PLC | 937,800 | | 28,757,779 |
Morgan Crucible Co. PLC | 108,101 | | 396,614 |
Mothercare PLC | 1,260,000 | | 10,608,316 |
Reckitt Benckiser Group PLC | 961,800 | | 53,794,490 |
Rio Tinto PLC | 373,000 | | 24,223,424 |
Rio Tinto PLC sponsored ADR (d) | 1,175,000 | | 76,516,000 |
Serco Group PLC | 4,480,745 | | 44,077,989 |
Shaftesbury PLC | 2,666,200 | | 19,051,569 |
Standard Chartered PLC: | | | |
rights 11/5/10 (a) | 356,296 | | 2,999,762 |
(United Kingdom) | 2,966,636 | | 85,815,341 |
Tesco PLC | 9,648,529 | | 65,984,141 |
Unite Group PLC (a) | 2,661,500 | | 8,869,374 |
Victrex PLC | 509,707 | | 10,542,656 |
TOTAL UNITED KINGDOM | | 950,748,117 |
United States of America - 10.2% |
Allergan, Inc. | 253,700 | | 18,370,417 |
Common Stocks - continued |
| Shares | | Value |
United States of America - continued |
Autoliv, Inc. (d) | 580,400 | | $ 41,382,520 |
Berkshire Hathaway, Inc. Class B (a) | 267,300 | | 21,266,388 |
Cymer, Inc. (a) | 283,100 | | 10,460,545 |
eBay, Inc. (a) | 403,700 | | 12,034,297 |
Google, Inc. Class A (a) | 30,600 | | 18,757,494 |
ION Geophysical Corp. (a) | 2,095,300 | | 10,246,017 |
JPMorgan Chase & Co. | 512,219 | | 19,274,801 |
Juniper Networks, Inc. (a) | 2,520,000 | | 81,622,800 |
Martin Marietta Materials, Inc. | 127,400 | | 10,253,152 |
Mead Johnson Nutrition Co. Class A | 608,800 | | 35,809,616 |
Mohawk Industries, Inc. (a) | 368,100 | | 21,106,854 |
Philip Morris International, Inc. | 424,700 | | 24,844,950 |
ResMed, Inc. (a) | 750,300 | | 23,912,061 |
Union Pacific Corp. | 410,600 | | 36,001,408 |
Visa, Inc. Class A | 1,178,006 | | 92,084,729 |
TOTAL UNITED STATES OF AMERICA | | 477,428,049 |
TOTAL COMMON STOCKS (Cost $4,078,517,512) | 4,641,156,815 |
Money Market Funds - 5.6% |
| | | |
Fidelity Cash Central Fund, 0.23% (b) | 38,488,971 | | 38,488,971 |
Fidelity Securities Lending Cash Central Fund, 0.24% (b)(c) | 226,717,574 | | 226,717,574 |
TOTAL MONEY MARKET FUNDS (Cost $265,206,545) | 265,206,545 |
TOTAL INVESTMENT PORTFOLIO - 104.6% (Cost $4,343,724,057) | | 4,906,363,360 |
NET OTHER ASSETS (LIABILITIES) - (4.6)% | | (217,915,316) |
NET ASSETS - 100% | $ 4,688,448,044 |
Legend |
(a) Non-income producing |
(b) Affiliated fund that is available only to investment companies and other accounts managed by Fidelity Investments. The rate quoted is the annualized seven-day yield of the fund at period end. A complete unaudited listing of the fund's holdings as of its most recent quarter end is available upon request. In addition, each Fidelity Central Fund's financial statements, which are not covered by the Fund's report of Independent Registered Public Accounting Firm, are available on the SEC's website or upon request. |
(c) Investment made with cash collateral received from securities on loan. |
(d) Security or a portion of the security is on loan at period end. |
Affiliated Central Funds |
Information regarding fiscal year to date income earned by the Fund from investments in Fidelity Central Funds is as follows: |
Fund | Income earned |
Fidelity Cash Central Fund | $ 91,510 |
Fidelity Securities Lending Cash Central Fund | 607,006 |
Total | $ 698,516 |
Other Information |
The following is a summary of the inputs used, as of October 31, 2010, involving the Fund's assets and liabilities carried at fair value. The inputs or methodology used for valuing securities may not be an indication of the risk associated with investing in those securities. For more information on valuation inputs, and their aggregation into the levels used in the table below, please refer to the Security Valuation section in the accompanying Notes to Financial Statements. |
Valuation Inputs at Reporting Date: |
Description | Total | Level 1 | Level 2 | Level 3 |
Investments in Securities: | | | | |
Equities: | | | | |
United Kingdom | $ 950,748,117 | $ 917,019,771 | $ 33,728,346 | $ - |
Switzerland | 560,496,934 | 541,197,662 | 19,299,272 | - |
United States of America | 477,428,049 | 477,428,049 | - | - |
Japan | 377,198,435 | 190,283,130 | 186,915,305 | - |
Australia | 249,620,457 | 249,620,457 | - | - |
Germany | 194,255,660 | 186,703,624 | 7,552,036 | - |
Belgium | 165,613,323 | 165,613,323 | - | - |
Brazil | 155,464,844 | 155,464,844 | - | - |
France | 137,880,779 | 137,880,779 | - | - |
Other | 1,372,450,217 | 1,364,074,837 | 8,375,380 | - |
Money Market Funds | 265,206,545 | 265,206,545 | - | - |
Total Investments in Securities: | $ 4,906,363,360 | $ 4,650,493,021 | $ 255,870,339 | $ - |
Income Tax Information |
At October 31, 2010, the Fund had a capital loss carryforward of approximately $27,059,158 all of which will expire on October 31, 2018. Capital loss carryforwards are only available to offset future capital gains of the Fund to the extent provided by regulations and may be limited. |
See accompanying notes which are an integral part of the financial statements.
Annual Report
Statement of Assets and Liabilities
| October 31, 2010 |
| | |
Assets | | |
Investment in securities, at value (including securities loaned of $219,638,149) - See accompanying schedule: Unaffiliated issuers (cost $4,078,517,512) | $ 4,641,156,815 | |
Fidelity Central Funds (cost $265,206,545) | 265,206,545 | |
Total Investments (cost $4,343,724,057) | | $ 4,906,363,360 |
Foreign currency held at value (cost $155,840) | | 156,092 |
Receivable for investments sold | | 17,174,504 |
Receivable for fund shares sold | | 8,534,601 |
Dividends receivable | | 6,158,986 |
Distributions receivable from Fidelity Central Funds | | 112,566 |
Other receivables | | 215,411 |
Total assets | | 4,938,715,520 |
| | |
Liabilities | | |
Payable to custodian bank | $ 892,544 | |
Payable for investments purchased | 19,259,034 | |
Accrued management fee | 2,472,060 | |
Other affiliated payables | 716,533 | |
Other payables and accrued expenses | 209,731 | |
Collateral on securities loaned, at value | 226,717,574 | |
Total liabilities | | 250,267,476 |
| | |
Net Assets | | $ 4,688,448,044 |
Net Assets consist of: | | |
Paid in capital | | $ 4,139,316,338 |
Undistributed net investment income | | 18,331,035 |
Accumulated undistributed net realized gain (loss) on investments and foreign currency transactions | | (32,051,803) |
Net unrealized appreciation (depreciation) on investments and assets and liabilities in foreign currencies | | 562,852,474 |
Net Assets | | $ 4,688,448,044 |
See accompanying notes which are an integral part of the financial statements.
Annual Report
Statement of Assets and Liabilities - continued
| October 31, 2010 |
| | |
Series International Growth:
Net Asset Value, offering price and redemption price per share ($3,944,122,663 ÷ 362,226,099 shares) | | $ 10.89 |
| | |
Class F:
Net Asset Value, offering price and redemption price per share ($744,325,381 ÷ 68,210,406 shares) | | $ 10.91 |
See accompanying notes which are an integral part of the financial statements.
Annual Report
Financial Statements - continued
Statement of Operations
| For the period December 3, 2009
(commencement of operations) to
October 31, 2010 |
| | |
Investment Income | | |
Dividends | | $ 35,956,235 |
Interest | | 1,808 |
Income from Fidelity Central Funds | | 698,516 |
Income before foreign taxes withheld | | 36,656,559 |
Less foreign taxes withheld | | (2,113,303) |
Total income | | 34,543,256 |
| | |
Expenses | | |
Management fee | $ 11,888,233 | |
Transfer agent fees | 3,464,974 | |
Accounting and security lending fees | 726,439 | |
Custodian fees and expenses | 438,401 | |
Independent trustees' compensation | 7,444 | |
Registration fees | 48,459 | |
Audit | 43,533 | |
Legal | 3,285 | |
Miscellaneous | 5,395 | |
Total expenses before reductions | 16,626,163 | |
Expense reductions | (413,942) | 16,212,221 |
Net investment income (loss) | | 18,331,035 |
Realized and Unrealized Gain (Loss) Net realized gain (loss) on: | | |
Investment securities: | | |
Unaffiliated issuers | (30,723,805) | |
Foreign currency transactions | (1,327,998) | |
Total net realized gain (loss) | | (32,051,803) |
Change in net unrealized appreciation (depreciation) on: Investment securities | 562,639,303 | |
Assets and liabilities in foreign currencies | 213,171 | |
Total change in net unrealized appreciation (depreciation) | | 562,852,474 |
Net gain (loss) | | 530,800,671 |
Net increase (decrease) in net assets resulting from operations | | $ 549,131,706 |
See accompanying notes which are an integral part of the financial statements.
Annual Report
Statement of Changes in Net Assets
| For the period ended December 3, 2009
(commencement of operations) to October 31, 2010 |
Increase (Decrease) in Net Assets | |
Operations | |
Net investment income (loss) | $ 18,331,035 |
Net realized gain (loss) | (32,051,803) |
Change in net unrealized appreciation (depreciation) | 562,852,474 |
Net increase (decrease) in net assets resulting
from operations | 549,131,706 |
Share transactions - net increase (decrease) | 4,139,316,338 |
Total increase (decrease) in net assets | 4,688,448,044 |
| |
Net Assets | |
Beginning of period | - |
End of period (including undistributed net investment income of $18,331,035) | $ 4,688,448,044 |
See accompanying notes which are an integral part of the financial statements.
Annual Report
Financial Highlights - Series International Growth
Period ended October 31, | 2010 G |
Selected Per-Share Data | |
Net asset value, beginning of period | $ 10.00 |
Income from Investment Operations | |
Net investment income (loss) D | .09 |
Net realized and unrealized gain (loss) | .80 |
Total from investment operations | .89 |
Net asset value, end of period | $ 10.89 |
Total Return B, C | 8.90% |
Ratios to Average Net Assets E, H | |
Expenses before reductions | 1.01% A |
Expenses net of fee waivers, if any | 1.01% A |
Expenses net of all reductions | .99% A |
Net investment income (loss) | 1.06% A |
Supplemental Data | |
Net assets, end of period (000 omitted) | $ 3,944,123 |
Portfolio turnover rate F | 63% A |
A Annualized
B Total returns for periods of less than one year are not annualized.
C Total returns would have been lower had certain expenses not been reduced during the periods shown.
D Calculated based on average shares outstanding during the period.
E Fees and expenses of the underlying Fidelity Central Funds are not included in the Fund's expense ratio. The Fund indirectly bears its proportionate share of the expenses of any underlying Fidelity Central Funds.
F Amount does not include the portfolio activity of any underlying Fidelity Central Funds.
G For the period December 3, 2009 (commencement of operations) to October 31, 2010.
H Expense ratios reflect operating expenses of the class. Expenses before reductions do not reflect amounts reimbursed by the investment adviser or reductions from brokerage service arrangements or reductions from other expense offset arrangements and do not represent the amount paid by the class during periods when reimbursements or reductions occur. Expense ratios before reductions for start-up periods may not be representative of longer-term operating periods. Expenses net of fee waivers reflect expenses after reimbursement by the investment adviser but prior to reductions from brokerage service arrangements or other expense offset arrangements. Expenses net of all reductions represent the net expenses paid by the class.
See accompanying notes which are an integral part of the financial statements.
Annual Report
Financial Highlights - Class F
Period ended October 31, | 2010 G |
Selected Per-Share Data | |
Net asset value, beginning of period | $ 10.00 |
Income from Investment Operations | |
Net investment income (loss) D | .11 |
Net realized and unrealized gain (loss) | .80 |
Total from investment operations | .91 |
Net asset value, end of period | $ 10.91 |
Total Return B, C | 9.10% |
Ratios to Average Net Assets E, H | |
Expenses before reductions | .78% A |
Expenses net of fee waivers, if any | .78% A |
Expenses net of all reductions | .75% A |
Net investment income (loss) | 1.29% A |
Supplemental Data | |
Net assets, end of period (000 omitted) | $ 744,325 |
Portfolio turnover rate F | 63% A |
A Annualized
B Total returns for periods of less than one year are not annualized.
C Total returns would have been lower had certain expenses not been reduced during the periods shown.
D Calculated based on average shares outstanding during the period.
E Fees and expenses of the underlying Fidelity Central Funds are not included in the Fund's expense ratio. The Fund indirectly bears its proportionate share of the expenses of any underlying Fidelity Central Funds.
F Amount does not include the portfolio activity of any underlying Fidelity Central Funds.
G For the period December 3, 2009 (commencement of operations) to October 31, 2010.
H Expense ratios reflect operating expenses of the class. Expenses before reductions do not reflect amounts reimbursed by the investment adviser or reductions from brokerage service arrangements or reductions from other expense offset arrangements and do not represent the amount paid by the class during periods when reimbursements or reductions occur. Expense ratios before reductions for start-up periods may not be representative of longer-term operating periods. Expenses net of fee waivers reflect expenses after reimbursement by the investment adviser but prior to reductions from brokerage service arrangements or other expense offset arrangements. Expenses net of all reductions represent the net expenses paid by the class.
See accompanying notes which are an integral part of the financial statements.
Annual Report
Fidelity Series International Value Fund
Average annual total return reflects the change in the value of an investment, assuming reinvestment of the class' distributions from dividend income and capital gains (the profits earned upon the sale of securities that have grown in value, if any) and assuming a constant rate of performance each year. The $10,000 table and the fund's returns do not reflect the deduction of taxes that a shareholder would pay on fund distributions or the redemption of fund shares. During periods of reimbursement by Fidelity, a fund's total return will be greater than it would be had the reimbursement not occurred. How a fund did yesterday is no guarantee of how it will do tomorrow.
Average annual total returns take Fidelity Series International Value Fund's cumulative total return and show you what would have happened if Fidelity Series International Value Fund shares had performed at a constant rate each year. These numbers will be reported once the fund is a year old.
$10,000 Over Life of Fund
Let's say hypothetically that $10,000 was invested in Fidelity Series International Value Fund, a class of the fund, on December 3, 2009, when the fund started. The chart shows how the value of your investment would have changed, and also shows how the MSCI EAFE (Europe, Australasia, Far East) Value Index performed over the same period.
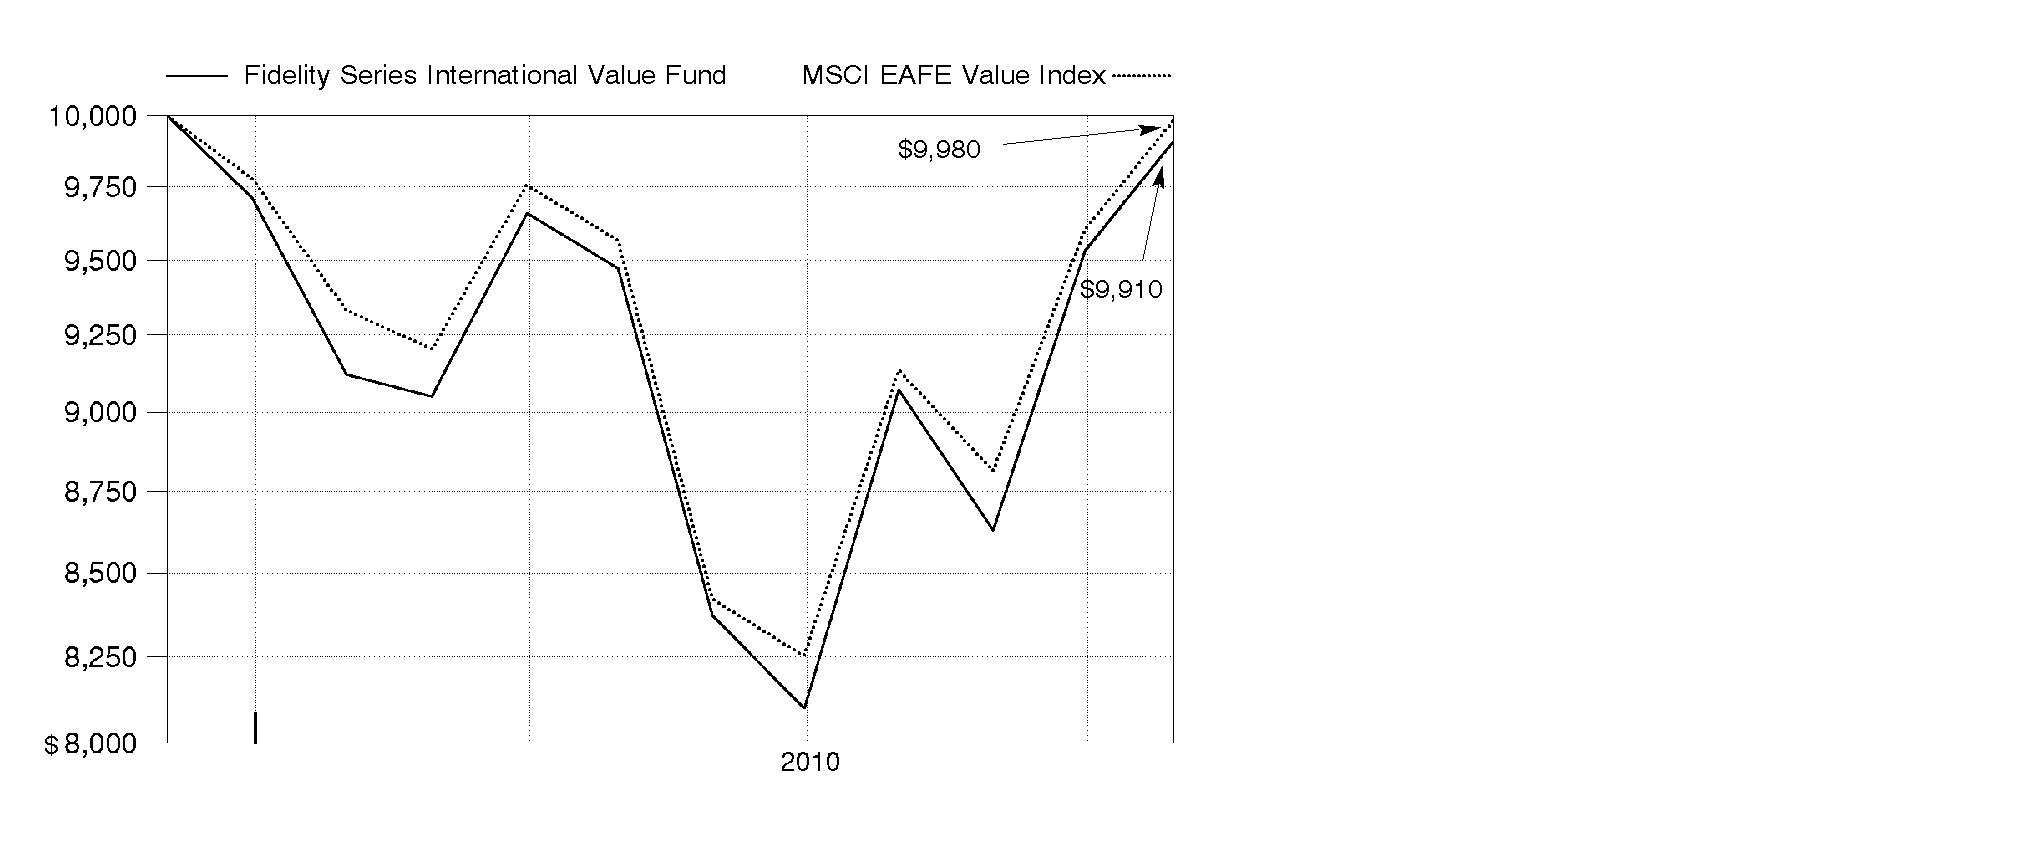
Annual Report
Market Recap: International stocks rode a wave of volatility similar to that of their U.S. counterparts during the 12 months ending October 31, 2010. Stocks gained modestly in the first half of the period, despite growing concerns about the European debt crisis. Sentiment turned decidedly negative in May and June, however, and the market suffered a precipitous decline. These losses were more than offset during the last four months of the period, when signs of economic growth and subsiding debt fears helped propel international stocks about 21%. For the full year, the MSCI® ACWI® (All Country World Index) ex USA Index gained 12.76%, boosted in part by a generally depreciating U.S. dollar. Within the index, Canada and emerging markets were standouts, returning 23% and 24%, respectively. Results in the latter group were led by strong-performing India, Mexico and South Africa, while China fell short of the MSCI benchmark due to cooling economic growth. The developed Asia ex Japan segment rose 16% for the period, lifted by solid results from Singapore and Hong Kong. Meanwhile, Europe rose just 9%, held back mainly by debt-riddled Spain and Italy, as well as lagging major constituent France. Japan returned only 5%, a result of that nation's continued weak economy.
Comments from George Stairs, Portfolio Manager of Fidelity® Series International Value Fund: From inception on December 3, 2009, through October 31, 2010, the fund's Series International Value and Class F shares declined 0.90% and 0.70%, respectively, trailing the 0.20% drop in the MSCI EAFE® (Europe, Australasia, Far East) Value Index. Positioning in industrials and telecommunication services hurt relative performance the most, followed by a modest cash position and weak stock selection within health care. Conversely, the fund benefited from stock selection in financials and energy. Positioning in consumer discretionary also was positive. Within financials, underweighting Spain's Banco Santander and Banco Bilbao was especially helpful, given worries about the country's sovereign debt problems. Geographically, the fund's results in Europe were poor overall, with disappointing stock selection in Denmark and France. In contrast, security selection in emerging markets helped, as did picks in Japan and an out-of-benchmark stake in Canada. The fund's biggest individual detractors were Vestas Wind Systems, an out-of-benchmark Danish wind turbine manufacturer; Spanish telecommunications company Telefonica; and French insurance company AXA. The fund's top individual contributor relative to the index was an underweighting in U.K. oil services giant BP, while out-of-benchmark Danish health care company Novo Nordisk also contributed.
The views expressed above reflect those of the portfolio manager(s) only through the end of the period as stated on the cover of this report and do not necessarily represent the views of Fidelity or any other person in the Fidelity organization. Any such views are subject to change at any time based upon market or other conditions and Fidelity disclaims any responsibility to update such views. These views may not be relied on as investment advice and, because investment decisions for a Fidelity fund are based on numerous factors, may not be relied on as an indication of trading intent on behalf of any Fidelity fund.
Annual Report
Fidelity Series International Value Fund
Investment Changes (Unaudited)
Geographic Diversification (% of fund's net assets) |
As of October 31, 2010 |
| United Kingdom 18.9% | |
| Japan 18.4% | |
| France 10.7% | |
| Germany 6.9% | |
| Spain 6.6% | |
| Switzerland 4.6% | |
| Hong Kong 4.1% | |
| Netherlands 3.9% | |
| Italy 3.1% | |
| Other 22.8% | |

Percentages are adjusted for the effect of futures contracts, if applicable. |
As of April 30, 2010 |
| Japan 19.2% | |
| United Kingdom 18.1% | |
| France 11.5% | |
| Germany 6.9% | |
| Switzerland 4.9% | |
| Hong Kong 4.3% | |
| Spain 3.7% | |
| Italy 3.3% | |
| Australia 3.2% | |
| Other 24.9% | |

Percentages are adjusted for the effect of futures contracts, if applicable. |
Asset Allocation |
| % of fund's
net assets | % of fund's net assets
6 months ago |
Stocks | 99.1 | 98.6 |
Short-Term Investments and Net Other Assets | 0.9 | 1.4 |
Top Ten Stocks as of October 31, 2010 |
| % of fund's
net assets | % of fund's net assets
6 months ago |
Royal Dutch Shell PLC Class A sponsored ADR (United Kingdom, Oil, Gas & Consumable Fuels) | 3.8 | 3.9 |
HSBC Holdings PLC (United Kingdom, Commercial Banks) | 2.9 | 2.2 |
Mitsui & Co. Ltd. (Japan, Trading Companies & Distributors) | 2.1 | 2.1 |
Vodafone Group PLC sponsored ADR (United Kingdom, Wireless Telecommunication Services) | 2.0 | 1.8 |
BP PLC sponsored ADR (United Kingdom, Oil, Gas & Consumable Fuels) | 2.0 | 1.4 |
Roche Holding AG (participation certificate) (Switzerland, Pharmaceuticals) | 2.0 | 2.5 |
AXA SA sponsored ADR (France, Insurance) | 2.0 | 2.1 |
Banco Santander SA (Spain, Commercial Banks) | 1.9 | 1.8 |
Zurich Financial Services AG (Switzerland, Insurance) | 1.8 | 1.6 |
ING Groep NV (Netherlands, Diversified Financial Services) | 1.8 | 1.0 |
| 22.3 | |
Market Sectors as of October 31, 2010 |
| % of fund's
net assets | % of fund's net assets
6 months ago |
Financials | 38.4 | 36.1 |
Energy | 11.2 | 11.6 |
Consumer Discretionary | 11.0 | 11.0 |
Industrials | 8.2 | 8.4 |
Materials | 6.7 | 7.0 |
Telecommunication Services | 6.2 | 5.6 |
Utilities | 6.1 | 7.3 |
Information Technology | 4.7 | 4.6 |
Health Care | 4.5 | 4.8 |
Consumer Staples | 2.1 | 2.2 |
Annual Report
Fidelity Series International Value Fund
Investments October 31, 2010
Showing Percentage of Net Assets
Common Stocks - 98.1% |
| Shares | | Value |
Australia - 2.5% |
Commonwealth Bank of Australia | 239,470 | | $ 11,471,783 |
Macquarie Group Ltd. | 1,306,649 | | 46,338,125 |
Wesfarmers Ltd. | 507,145 | | 16,464,767 |
Westfield Group unit | 3,371,063 | | 40,884,478 |
TOTAL AUSTRALIA | | 115,159,153 |
Bailiwick of Jersey - 1.4% |
Informa PLC | 2,652,146 | | 18,526,232 |
United Business Media Ltd. | 2,696,100 | | 28,422,683 |
WPP PLC | 1,441,454 | | 16,748,898 |
TOTAL BAILIWICK OF JERSEY | | 63,697,813 |
Bermuda - 1.1% |
Huabao International Holdings Ltd. | 651,000 | | 980,962 |
Seadrill Ltd. (d) | 1,159,600 | | 35,108,808 |
VimpelCom Ltd. ADR (a) | 797,200 | | 12,221,076 |
TOTAL BERMUDA | | 48,310,846 |
Brazil - 1.9% |
Banco do Brasil SA | 1,407,312 | | 27,381,864 |
Banco Santander (Brasil) SA ADR | 1,215,600 | | 17,504,640 |
Cyrela Brazil Realty SA | 945,500 | | 13,060,928 |
Itau Unibanco Banco Multiplo SA ADR | 342,500 | | 8,411,800 |
Vivo Participacoes SA sponsored ADR | 799,800 | | 22,906,272 |
TOTAL BRAZIL | | 89,265,504 |
Canada - 2.4% |
Open Text Corp. (a) | 211,900 | | 9,374,378 |
Petrobank Energy & Resources Ltd. (a) | 525,900 | | 20,929,778 |
Power Corp. of Canada (sub. vtg.) (d) | 542,900 | | 15,149,460 |
Suncor Energy, Inc. | 659,500 | | 21,131,935 |
Toronto-Dominion Bank | 603,800 | | 43,483,783 |
TOTAL CANADA | | 110,069,334 |
Cayman Islands - 0.6% |
China High Speed Transmission Equipment Group Co. Ltd. | 4,325,000 | | 8,838,316 |
Hengdeli Holdings Ltd. | 32,840,000 | | 18,217,965 |
TOTAL CAYMAN ISLANDS | | 27,056,281 |
China - 1.2% |
China Merchants Bank Co. Ltd. (H Shares) | 8,622,445 | | 24,472,671 |
Common Stocks - continued |
| Shares | | Value |
China - continued |
Industrial & Commercial Bank of China Ltd. (H Shares) | 26,034,000 | | $ 20,958,189 |
Nine Dragons Paper (Holdings) Ltd. | 6,648,000 | | 10,720,852 |
TOTAL CHINA | | 56,151,712 |
Denmark - 1.0% |
Novo Nordisk AS Series B | 177,550 | | 18,639,604 |
Vestas Wind Systems AS (a)(d) | 794,691 | | 25,357,273 |
TOTAL DENMARK | | 43,996,877 |
France - 10.7% |
Alstom SA | 222,917 | | 11,247,049 |
Atos Origin SA (a) | 240,635 | | 11,124,779 |
AXA SA sponsored ADR | 5,002,900 | | 91,202,867 |
BNP Paribas SA | 698,975 | | 51,109,540 |
Christian Dior SA | 124,500 | | 18,007,833 |
Compagnie de St. Gobain | 653,576 | | 30,520,079 |
Credit Agricole SA | 1,499,000 | | 24,560,101 |
PPR SA | 183,900 | | 30,143,566 |
Sanofi-Aventis sponsored ADR | 1,093,800 | | 38,403,318 |
Schneider Electric SA | 173,816 | | 24,669,340 |
Societe Generale Series A | 1,205,192 | | 72,151,394 |
Total SA | 76,831 | | 4,181,160 |
Total SA sponsored ADR | 842,200 | | 45,883,056 |
Unibail-Rodamco | 192,434 | | 40,084,015 |
TOTAL FRANCE | | 493,288,097 |
Germany - 6.8% |
Allianz AG sponsored ADR | 1,363,900 | | 17,089,667 |
BASF AG | 442,286 | | 32,174,098 |
Bayerische Motoren Werke AG (BMW) | 297,497 | | 21,322,678 |
Daimler AG (United States) (a) | 805,100 | | 53,136,600 |
Deutsche Boerse AG | 291,300 | | 20,493,454 |
E.ON AG | 2,134,947 | | 66,840,120 |
HeidelbergCement AG | 630,300 | | 32,963,208 |
Metro AG | 268,200 | | 18,793,692 |
Munich Re Group | 241,615 | | 37,771,530 |
Volkswagen AG (d) | 101,620 | | 13,342,424 |
TOTAL GERMANY | | 313,927,471 |
Common Stocks - continued |
| Shares | | Value |
Greece - 0.3% |
Hellenic Telecommunications Organization SA | 678,870 | | $ 5,421,355 |
Public Power Corp. of Greece | 544,078 | | 9,122,541 |
TOTAL GREECE | | 14,543,896 |
Hong Kong - 4.1% |
China Resources Power Holdings Co. Ltd. | 10,488,000 | | 20,187,836 |
CNOOC Ltd. | 11,203,000 | | 23,388,707 |
Hang Lung Group Ltd. | 1,377,000 | | 9,140,029 |
Hutchison Whampoa Ltd. | 1,004,000 | | 9,895,901 |
Swire Pacific Ltd. (A Shares) | 3,265,500 | | 46,341,558 |
Techtronic Industries Co. Ltd. | 16,047,500 | | 16,251,943 |
Wharf Holdings Ltd. | 9,720,000 | | 63,828,157 |
TOTAL HONG KONG | | 189,034,131 |
India - 0.5% |
Bank of Baroda | 976,597 | | 23,171,151 |
Punjab National Bank | 7,562 | | 246,310 |
TOTAL INDIA | | 23,417,461 |
Indonesia - 0.9% |
PT Bank Rakyat Indonesia Tbk | 21,267,000 | | 27,126,552 |
PT Semen Gresik (Persero) Tbk | 13,176,000 | | 14,447,516 |
TOTAL INDONESIA | | 41,574,068 |
Ireland - 0.3% |
CRH PLC sponsored ADR (d) | 794,496 | | 14,038,744 |
Israel - 0.5% |
Teva Pharmaceutical Industries Ltd. sponsored ADR | 442,300 | | 22,955,370 |
Italy - 2.2% |
ENI SpA | 511,100 | | 11,505,716 |
Intesa Sanpaolo SpA | 17,159,593 | | 60,348,399 |
UniCredit SpA | 10,318,500 | | 26,891,929 |
TOTAL ITALY | | 98,746,044 |
Japan - 18.4% |
ABC-Mart, Inc. | 373,400 | | 12,700,333 |
Aisin Seiki Co. Ltd. | 818,400 | | 25,700,220 |
Credit Saison Co. Ltd. | 446,900 | | 6,338,695 |
Denso Corp. | 1,197,100 | | 37,227,532 |
East Japan Railway Co. | 490,000 | | 30,259,232 |
Honda Motor Co. Ltd. | 766,600 | | 27,634,999 |
Honda Motor Co. Ltd. sponsored ADR | 66,900 | | 2,410,407 |
Common Stocks - continued |
| Shares | | Value |
Japan - continued |
Japan Retail Fund Investment Corp. | 18,910 | | $ 29,538,796 |
Japan Tobacco, Inc. | 2,569 | | 7,981,072 |
JSR Corp. | 712,400 | | 12,332,213 |
Konica Minolta Holdings, Inc. | 1,337,500 | | 12,924,188 |
Miraca Holdings, Inc. | 320,500 | | 11,534,335 |
Mitsubishi UFJ Financial Group, Inc. | 13,745,700 | | 63,793,848 |
Mitsubishi UFJ Financial Group, Inc. sponsored ADR | 1,145,400 | | 5,337,564 |
Mitsui & Co. Ltd. | 6,234,400 | | 98,050,962 |
Nippon Electric Glass Co. Ltd. | 2,781,000 | | 35,746,463 |
Nippon Telegraph & Telephone Corp. | 286,000 | | 12,898,717 |
Obic Co. Ltd. | 102,760 | | 18,976,184 |
ORIX Corp. | 436,460 | | 39,811,312 |
Promise Co. Ltd. (d) | 1,586,400 | | 6,643,678 |
Ricoh Co. Ltd. | 795,000 | | 11,120,951 |
Seven & i Holdings Co., Ltd. | 521,700 | | 12,110,244 |
SOFTBANK CORP. | 439,600 | | 14,117,766 |
Sumitomo Corp. | 3,938,200 | | 49,860,795 |
Sumitomo Metal Industries Ltd. | 4,767,000 | | 11,064,126 |
Sumitomo Mitsui Financial Group, Inc. | 1,370,300 | | 40,900,365 |
Tokio Marine Holdings, Inc. | 688,600 | | 19,360,573 |
Tokyo Electron Ltd. | 444,900 | | 25,102,752 |
Tokyo Gas Co. Ltd. | 11,362,000 | | 53,456,922 |
Toyota Motor Corp. | 1,828,800 | | 64,776,582 |
Toyota Motor Corp. sponsored ADR | 12,600 | | 892,332 |
USS Co. Ltd. | 162,080 | | 12,608,684 |
West Japan Railway Co. | 3,496 | | 12,978,864 |
Xebio Co. Ltd. | 75,500 | | 1,482,416 |
Yamada Denki Co. Ltd. | 245,240 | | 15,938,923 |
TOTAL JAPAN | | 843,613,045 |
Korea (South) - 0.9% |
Samsung Electronics Co. Ltd. | 32,973 | | 21,845,159 |
Shinhan Financial Group Co. Ltd. | 418,850 | | 16,221,356 |
Shinhan Financial Group Co. Ltd. sponsored ADR | 68,900 | | 5,358,353 |
TOTAL KOREA (SOUTH) | | 43,424,868 |
Luxembourg - 1.0% |
ArcelorMittal SA: | | | |
(Netherlands) | 471,456 | | 15,251,717 |
Class A unit (d) | 889,900 | | 28,814,962 |
TOTAL LUXEMBOURG | | 44,066,679 |
Common Stocks - continued |
| Shares | | Value |
Netherlands - 3.9% |
Gemalto NV | 566,708 | | $ 25,801,220 |
ING Groep NV: | | | |
(Certificaten Van Aandelen) unit (a) | 3,435,552 | | 36,746,679 |
sponsored ADR (a)(d) | 4,346,100 | | 46,850,958 |
Koninklijke Ahold NV | 1,162,337 | | 16,060,125 |
Koninklijke KPN NV | 1,872,960 | | 31,273,562 |
Randstad Holdings NV (a) | 445,121 | | 21,182,236 |
TOTAL NETHERLANDS | | 177,914,780 |
Norway - 1.0% |
Aker Solutions ASA | 2,289,787 | | 34,858,942 |
DnB NOR ASA | 868,600 | | 11,918,734 |
TOTAL NORWAY | | 46,777,676 |
Portugal - 0.7% |
Energias de Portugal SA | 8,932,870 | | 34,169,086 |
Russia - 0.6% |
Mechel Steel Group OAO sponsored ADR | 582,600 | | 13,720,230 |
OAO Gazprom sponsored ADR | 712,400 | | 15,565,940 |
TOTAL RUSSIA | | 29,286,170 |
Singapore - 1.7% |
DBS Group Holdings Ltd. | 1,048,197 | | 11,257,002 |
United Overseas Bank Ltd. | 3,342,677 | | 48,139,921 |
Yanlord Land Group Ltd. | 14,937,000 | | 19,849,834 |
TOTAL SINGAPORE | | 79,246,757 |
South Africa - 0.2% |
Impala Platinum Holdings Ltd. | 325,800 | | 9,208,842 |
Spain - 6.6% |
Banco Bilbao Vizcaya Argentaria SA sponsored ADR (d) | 4,918,500 | | 64,678,275 |
Banco Santander SA | 2,062,825 | | 26,470,807 |
Banco Santander SA sponsored ADR (d) | 4,904,900 | | 62,831,769 |
Gestevision Telecinco SA | 368,400 | | 4,698,585 |
Iberdrola SA | 7,117,500 | | 60,016,091 |
Red Electrica Corporacion SA | 233,100 | | 11,707,305 |
Telefonica SA sponsored ADR (d) | 868,700 | | 70,486,318 |
TOTAL SPAIN | | 300,889,150 |
Sweden - 0.3% |
Telefonaktiebolaget LM Ericsson (B Shares) | 1,280,562 | | 14,078,996 |
Common Stocks - continued |
| Shares | | Value |
Switzerland - 4.6% |
Lonza Group AG | 48,087 | | $ 4,208,559 |
Roche Holding AG (participation certificate) | 626,324 | | 91,942,722 |
Transocean Ltd. (a) | 488,300 | | 30,938,688 |
Zurich Financial Services AG | 345,301 | | 84,505,522 |
TOTAL SWITZERLAND | | 211,595,491 |
Taiwan - 0.5% |
AU Optronics Corp. (a) | 8,343,000 | | 8,328,228 |
Hon Hai Precision Industry Co. Ltd. (Foxconn) | 3,622,200 | | 13,728,973 |
TOTAL TAIWAN | | 22,057,201 |
Thailand - 0.4% |
Siam Commercial Bank PCL (For. Reg.) | 5,214,700 | | 17,852,597 |
United Kingdom - 18.9% |
Aberdeen Asset Management PLC | 5,356,687 | | 15,259,180 |
Aegis Group PLC | 8,808,830 | | 17,740,125 |
Anglo American PLC (United Kingdom) | 1,237,300 | | 57,646,453 |
AstraZeneca PLC sponsored ADR (d) | 349,600 | | 17,640,816 |
Aviva PLC | 2,932,500 | | 18,699,141 |
BAE Systems PLC | 4,189,800 | | 23,138,636 |
Barclays PLC | 10,416,010 | | 45,766,822 |
BP PLC sponsored ADR | 2,277,600 | | 92,994,408 |
British Airways PLC (a)(d) | 2,338,600 | | 10,142,555 |
Centrica PLC | 2,499,300 | | 13,302,130 |
HSBC Holdings PLC: | | | |
(United Kingdom) | 4,402,545 | | 45,814,391 |
sponsored ADR | 1,649,184 | | 85,938,978 |
Imperial Tobacco Group PLC | 652,649 | | 20,902,376 |
International Power PLC | 1,786,187 | | 11,942,039 |
Man Group PLC | 1,635,597 | | 6,834,190 |
Misys PLC (a) | 2,190,900 | | 9,877,563 |
Morgan Crucible Co. PLC | 108,012 | | 396,288 |
Prudential PLC | 3,000,206 | | 30,340,377 |
Rio Tinto PLC | 505,900 | | 32,854,237 |
Royal Dutch Shell PLC Class A sponsored ADR (d) | 2,685,500 | | 174,369,512 |
Vedanta Resources PLC | 731,000 | | 24,301,812 |
Vodafone Group PLC sponsored ADR | 3,419,400 | | 94,067,694 |
Wolseley PLC (a) | 699,100 | | 18,626,649 |
TOTAL UNITED KINGDOM | | 868,596,372 |
TOTAL COMMON STOCKS (Cost $4,183,046,228) | 4,508,010,512 |
Nonconvertible Preferred Stocks - 1.0% |
| Shares | | Value |
Germany - 0.1% |
Volkswagen AG | 42,400 | | $ 6,371,728 |
Italy - 0.9% |
Fiat SpA (Risparmio Shares) | 1,409,000 | | 16,556,871 |
Telecom Italia SpA (Risparmio Shares) | 19,275,200 | | 23,644,453 |
TOTAL ITALY | | 40,201,324 |
TOTAL NONCONVERTIBLE PREFERRED STOCKS (Cost $38,002,810) | 46,573,052 |
Money Market Funds - 4.2% |
| | | |
Fidelity Cash Central Fund, 0.23% (b) | 15,184,603 | | 15,184,603 |
Fidelity Securities Lending Cash Central Fund, 0.24% (b)(c) | 175,625,067 | | 175,625,067 |
TOTAL MONEY MARKET FUNDS (Cost $190,809,670) | 190,809,670 |
TOTAL INVESTMENT PORTFOLIO - 103.3% (Cost $4,411,858,708) | | 4,745,393,234 |
NET OTHER ASSETS (LIABILITIES) - (3.3)% | | (149,811,428) |
NET ASSETS - 100% | $ 4,595,581,806 |
Legend |
(a) Non-income producing |
(b) Affiliated fund that is available only to investment companies and other accounts managed by Fidelity Investments. The rate quoted is the annualized seven-day yield of the fund at period end. A complete unaudited listing of the fund's holdings as of its most recent quarter end is available upon request. In addition, each Fidelity Central Fund's financial statements, which are not covered by the Fund's report of Independent Registered Public Accounting Firm, are available on the SEC's website or upon request. |
(c) Investment made with cash collateral received from securities on loan. |
(d) Security or a portion of the security is on loan at period end. |
Affiliated Central Funds |
Information regarding fiscal year to date income earned by the Fund from investments in Fidelity Central Funds is as follows: |
Fund | Income earned |
Fidelity Cash Central Fund | $ 75,493 |
Fidelity Securities Lending Cash Central Fund | 1,274,850 |
Total | $ 1,350,343 |
Other Information |
The following is a summary of the inputs used, as of October 31, 2010, involving the Fund's assets and liabilities carried at fair value. The inputs or methodology used for valuing securities may not be an indication of the risk associated with investing in those securities. For more information on valuation inputs, and their aggregation into the levels used in the table below, please refer to the Security Valuation section in the accompanying Notes to Financial Statements. |
Valuation Inputs at Reporting Date: |
Description | Total | Level 1 | Level 2 | Level 3 |
Investments in Securities: | | | | |
Equities: | | | | |
United Kingdom | $ 868,596,372 | $ 695,121,404 | $ 173,474,968 | $ - |
Japan | 843,613,045 | 195,907,397 | 647,705,648 | - |
France | 493,288,097 | 489,106,937 | 4,181,160 | - |
Germany | 320,299,199 | 320,299,199 | - | - |
Spain | 300,889,150 | 274,418,343 | 26,470,807 | - |
Switzerland | 211,595,491 | 211,595,491 | - | - |
Hong Kong | 189,034,131 | 165,645,424 | 23,388,707 | - |
Netherlands | 177,914,780 | 141,168,101 | 36,746,679 | - |
Italy | 138,947,368 | 103,797,199 | 35,150,169 | - |
Other | 1,010,405,931 | 908,519,672 | 101,886,259 | - |
Money Market Funds | 190,809,670 | 190,809,670 | - | - |
Total Investments in Securities: | $ 4,745,393,234 | $ 3,696,388,837 | $ 1,049,004,397 | $ - |
Income Tax Information |
At October 31, 2010, the Fund had a capital loss carryforward of approximately $6,804,041 all of which will expire on October 31, 2018. Capital loss carryforwards are only available to offset future capital gains of the Fund to the extent provided by regulations and may be limited. |
See accompanying notes which are an integral part of the financial statements.
Annual Report
Statement of Assets and Liabilities
| October 31, 2010 |
| | |
Assets | | |
Investment in securities, at value (including securities loaned of $170,330,694) - See accompanying schedule: Unaffiliated issuers (cost $4,221,049,038) | $ 4,554,583,564 | |
Fidelity Central Funds (cost $190,809,670) | 190,809,670 | |
Total Investments (cost $4,411,858,708) | | $ 4,745,393,234 |
Receivable for investments sold | | 21,255,000 |
Receivable for fund shares sold | | 8,589,622 |
Dividends receivable | | 10,476,888 |
Distributions receivable from Fidelity Central Funds | | 96,054 |
Other receivables | | 270,792 |
Total assets | | 4,786,081,590 |
| | |
Liabilities | | |
Payable to custodian bank | $ 3,295,400 | |
Payable for investments purchased | 7,248,828 | |
Accrued management fee | 2,435,782 | |
Other affiliated payables | 707,052 | |
Other payables and accrued expenses | 1,187,655 | |
Collateral on securities loaned, at value | 175,625,067 | |
Total liabilities | | 190,499,784 |
| | |
Net Assets | | $ 4,595,581,806 |
Net Assets consist of: | | |
Paid in capital | | $ 4,239,646,122 |
Undistributed net investment income | | 38,040,995 |
Accumulated undistributed net realized gain (loss) on investments and foreign currency transactions | | (15,045,002) |
Net unrealized appreciation (depreciation) on investments and assets and liabilities in foreign currencies | | 332,939,691 |
Net Assets | | $ 4,595,581,806 |
See accompanying notes which are an integral part of the financial statements.
Annual Report
Financial Statements - continued
Statement of Assets and Liabilities - continued
| October 31, 2010 |
| | |
Series International Value:
Net Asset Value, offering price and redemption price per share ($3,865,058,143 ÷ 389,922,383 shares) | | $ 9.91 |
| | |
Class F:
Net Asset Value, offering price and redemption price per share ($730,523,663 ÷ 73,537,902 shares) | | $ 9.93 |
See accompanying notes which are an integral part of the financial statements.
Annual Report
Statement of Operations
| For the period ended December 3, 2009 (commencement of operations) to
October 31, 2010 |
| | |
Investment Income | | |
Dividends | | $ 57,373,100 |
Interest | | 1,157 |
Income from Fidelity Central Funds | | 1,350,343 |
Income before foreign taxes withheld | | 58,724,600 |
Less foreign taxes withheld | | (4,609,542) |
Total income | | 54,115,058 |
| | |
Expenses | | |
Management fee | $ 11,776,308 | |
Transfer agent fees | 3,427,540 | |
Accounting and security lending fees | 728,434 | |
Custodian fees and expenses | 431,348 | |
Independent trustees' compensation | 7,383 | |
Registration fees | 49,636 | |
Audit | 54,106 | |
Legal | 3,253 | |
Miscellaneous | 5,360 | |
Total expenses before reductions | 16,483,368 | |
Expense reductions | (409,305) | 16,074,063 |
Net investment income (loss) | | 38,040,995 |
Realized and Unrealized Gain (Loss) Net realized gain (loss) on: | | |
Investment securities: | | |
Unaffiliated issuers | (15,988,330) | |
Foreign currency transactions | 943,328 | |
Total net realized gain (loss) | | (15,045,002) |
Change in net unrealized appreciation (depreciation) on: Investment securities (net of increase in deferred foreign taxes of $972,928) | 332,561,598 | |
Assets and liabilities in foreign currencies | 378,093 | |
Total change in net unrealized appreciation (depreciation) | | 332,939,691 |
Net gain (loss) | | 317,894,689 |
Net increase (decrease) in net assets resulting from operations | | $ 355,935,684 |
See accompanying notes which are an integral part of the financial statements.
Annual Report
Financial Statements - continued
Statement of Changes in Net Assets
| For the period
December 3, 2009 (commencement of operations) to
October 31, 2010 |
Increase (Decrease) in Net Assets | |
Operations | |
Net investment income (loss) | $ 38,040,995 |
Net realized gain (loss) | (15,045,002) |
Change in net unrealized appreciation (depreciation) | 332,939,691 |
Net increase (decrease) in net assets resulting
from operations | 355,935,684 |
Share transactions - net increase (decrease) | 4,239,646,122 |
Total increase (decrease) in net assets | 4,595,581,806 |
| |
Net Assets | |
Beginning of period | - |
End of period (including undistributed net investment income of $38,040,995) | $ 4,595,581,806 |
See accompanying notes which are an integral part of the financial statements.
Annual Report
Financial Highlights - Series International Value
Period ended October 31, | 2010 H |
Selected Per-Share Data | |
Net asset value, beginning of period | $ 10.00 |
Income from Investment Operations | |
Net investment income (loss) D | .18 |
Net realized and unrealized gain (loss) | (.27) G |
Total from investment operations | (.09) |
Net asset value, end of period | $ 9.91 |
Total Return B, C | (.90)% |
Ratios to Average Net Assets E, I | |
Expenses before reductions | 1.01% A |
Expenses net of fee waivers, if any | 1.01% A |
Expenses net of all reductions | .99% A |
Net investment income (loss) | 2.24% A |
Supplemental Data | |
Net assets, end of period (000 omitted) | $ 3,865,058 |
Portfolio turnover rate F | 72% A |
A Annualized
B Total returns for periods of less than one year are not annualized.
C Total returns would have been lower had certain expenses not been reduced during the periods shown.
D Calculated based on average shares outstanding during the period.
E Fees and expenses of the underlying Fidelity Central Funds are not included in the Fund's expense ratio. The Fund indirectly bears its proportionate share of the expenses of any underlying Fidelity Central Funds.
F Amount does not include the portfolio activity of any underlying Fidelity Central Funds.
G The amount shown for a share outstanding does not correspond with the aggregate net gain (loss) on investments for the period due to the timing of sales and repurchases of shares in relation to fluctuating market values of the investments of the Fund.
H For the period December 3, 2009 (commencement of operations) to October 31, 2010.
I Expense ratios reflect operating expenses of the class. Expenses before reductions do not reflect amounts reimbursed by the investment adviser or reductions from brokerage service arrangements or reductions from other expense offset arrangements and do not represent the amount paid by the class during periods when reimbursements or reductions occur. Expense ratios before reductions for start-up periods may not be representative of longer-term operating periods. Expenses net of fee waivers reflect expenses after reimbursement by the investment adviser but prior to reductions from brokerage service arrangements or other expense offset arrangements. Expenses net of all reductions represent the net expenses paid by the class.
See accompanying notes which are an integral part of the financial statements.
Annual Report
Financial Highlights - Class F
Period ended October 31, | 2010 H |
Selected Per-Share Data | |
Net asset value, beginning of period | $ 10.00 |
Income from Investment Operations | |
Net investment income (loss) D | .20 |
Net realized and unrealized gain (loss) | (.27) G |
Total from investment operations | (.07) |
Net asset value, end of period | $ 9.93 |
Total Return B, C | (.70)% |
Ratios to Average Net Assets E, I | |
Expenses before reductions | .78% A |
Expenses net of fee waivers, if any | .78% A |
Expenses net of all reductions | .75% A |
Net investment income (loss) | 2.47% A |
Supplemental Data | |
Net assets, end of period (000 omitted) | $ 730,524 |
Portfolio turnover rate F | 72% A |
A Annualized
B Total returns for periods of less than one year are not annualized.
C Total returns would have been lower had certain expenses not been reduced during the periods shown.
D Calculated based on average shares outstanding during the period.
E Fees and expenses of the underlying Fidelity Central Funds are not included in the Fund's expense ratio. The Fund indirectly bears its proportionate share of the expenses of any underlying Fidelity Central Funds.
F Amount does not include the portfolio activity of any underlying Fidelity Central Funds.
G The amount shown for a share outstanding does not correspond with the aggregate net gain (loss) on investments for the period due to the timing of sales and repurchases of shares in relation to fluctuating market values of the investments of the Fund.
H For the period December 3, 2009 (commencement of operations) to October 31, 2010.
I Expense ratios reflect operating expenses of the class. Expenses before reductions do not reflect amounts reimbursed by the investment adviser or reductions from brokerage service arrangements or reductions from other expense offset arrangements and do not represent the amount paid by the class during periods when reimbursements or reductions occur. Expense ratios before reductions for start-up periods may not be representative of longer-term operating periods. Expenses net of fee waivers reflect expenses after reimbursement by the investment adviser but prior to reductions from brokerage service arrangements or other expense offset arrangements. Expenses net of all reductions represent the net expenses paid by the class.
See accompanying notes which are an integral part of the financial statements.
Annual Report
Fidelity Series International Small Cap Fund
Average annual total return reflects the change in the value of an investment, assuming reinvestment of the class' distributions from dividend income and capital gains (the profits earned upon the sale of securities that have grown in value, if any) and assuming a constant rate of performance each year. The $10,000 table and the fund's returns do not reflect the deduction of taxes that a shareholder would pay on fund distributions or the redemption of fund shares. During periods of reimbursement by Fidelity, a fund's total return will be greater than it would be had the reimbursement not occurred. How a fund did yesterday is no guarantee of how it will do tomorrow.
Average annual total returns take Fidelity Series International Small Cap Fund's cumulative total return and show you what would have happened if Fidelity Series International Small Cap Fund shares had performed at a constant rate each year. These numbers will be reported once the fund is a year old.
$10,000 Over Life of Fund
Let's say hypothetically that $10,000 was invested in Fidelity Series International Small Cap Fund, a class of the fund, on December 3, 2009, when the fund started. The chart shows how the value of your investment would have changed, and also shows how the MSCI EAFE (Europe, Australasia, Far East) Small Cap Index performed over the same period.
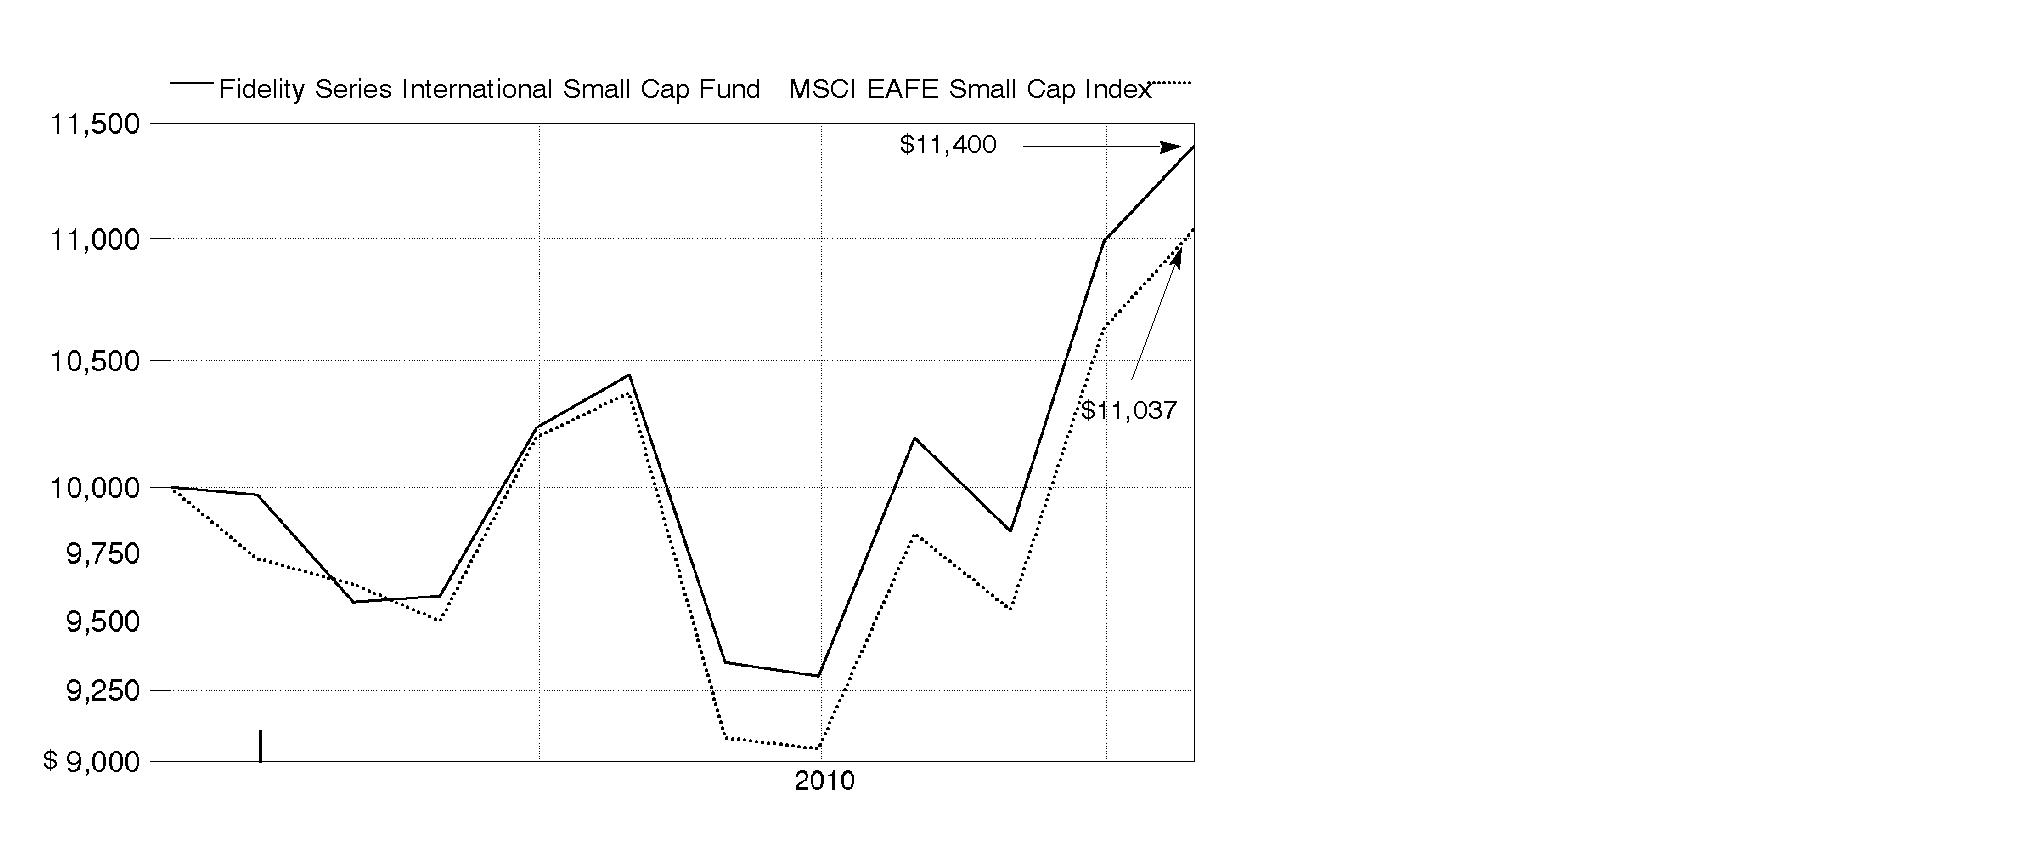
Annual Report
Market Recap: International stocks rode a wave of volatility similar to that of their U.S. counterparts during the 12 months ending October 31, 2010. Stocks gained modestly in the first half of the period, despite growing concerns about the European debt crisis. Sentiment turned decidedly negative in May and June, however, and the market suffered a precipitous decline. These losses were more than offset during the last four months of the period, when signs of economic growth and subsiding debt fears helped propel international stocks about 21%. For the full year, the MSCI® ACWI® (All Country World Index) ex USA Index gained 12.76%, boosted in part by a generally depreciating U.S. dollar. Within the index, Canada and emerging markets were standouts, returning 23% and 24%, respectively. Results in the latter group were led by strong-performing India, Mexico and South Africa, while China fell short of the MSCI benchmark due to cooling economic growth. The developed Asia ex Japan segment rose 16% for the period, lifted by solid results from Singapore and Hong Kong. Meanwhile, Europe rose just 9%, held back mainly by debt-riddled Spain and Italy, as well as lagging major constituent France. Japan returned only 5%, a result of that nation's continued weak economy.
Comments from Jed Weiss, Portfolio Manager of Fidelity ® Series International Small Cap Fund: Between the fund's inception date of December 3, 2009, and October 31, 2010, the Fund's Series International Small Cap and Class F shares rose 14.00% and 14.30%, respectively, solidly outpacing the 10.37% return of the MSCI EAFE® (Europe, Australasia, Far East) Small Cap Index. Stock selection was very strong in consumer discretionary, consumer staples and industrials, while picks in materials, utilities and energy detracted. In country terms, stock selection in emerging markets, particularly South Africa and Brazil, contributed. Good positioning in Japan and an out-of-benchmark stake in the U.S. also were helpful. In Europe, security selection was negative in Switzerland, France and the Netherlands, outweighing better results in Finland and Spain. The top individual contributor was SSL International, a U.K.-based health care products company that was no longer in the fund at period end. Other winners included Swedish auto-safety equipment maker Autoliv, whose shares are listed in the U.S.; PriceSmart, a California-based warehouse club retailer operating in Central America; South African discount retailer Mr Price Group; and Spirax-Sarco Engineering, a U.K.-based maker of industrial steam systems. Of these contributors, only two - SSL and Spirax-Sarco - were in the index. On the negative side, Greece-based wind utility Terna Energy lost significant value. Italian asset manager Azimut Holdings and French industrial battery maker Saft Groupe also underperformed.
The views expressed above reflect those of the portfolio manager(s) only through the end of the period as stated on the cover of this report and do not necessarily represent the views of Fidelity or any other person in the Fidelity organization. Any such views are subject to change at any time based upon market or other conditions and Fidelity disclaims any responsibility to update such views. These views may not be relied on as investment advice and, because investment decisions for a Fidelity fund are based on numerous factors, may not be relied on as an indication of trading intent on behalf of any Fidelity fund.
Annual Report
Fidelity Series International Small Cap Fund
Investment Changes (Unaudited)
Geographic Diversification (% of fund's net assets) |
As of October 31, 2010 |
| Japan 21.3% | |
| United Kingdom 16.1% | |
| United States of America 13.2% | |
| Canada 5.0% | |
| Brazil 3.8% | |
| Germany 3.8% | |
| South Africa 3.0% | |
| France 3.0% | |
| Finland 2.8% | |
| Other 28.0% | |

Percentages are adjusted for the effect of futures contracts, if applicable. |
As of April 30, 2010 |
| Japan 21.2% | |
| United Kingdom 17.7% | |
| United States of America 10.6% | |
| Canada 5.3% | |
| Brazil 4.0% | |
| Netherlands 3.7% | |
| France 3.2% | |
| Bermuda 2.9% | |
| South Africa 2.9% | |
| Other 28.5% | |

Percentages are adjusted for the effect of futures contracts, if applicable. |
Asset Allocation |
| % of fund's
net assets | % of fund's net assets
6 months ago |
Stocks | 96.9 | 98.0 |
Short-Term Investments and Net Other Assets | 3.1 | 2.0 |
Top Ten Stocks as of October 31, 2010 |
| % of fund's
net assets | % of fund's net assets
6 months ago |
USS Co. Ltd. (Japan, Specialty Retail) | 1.7 | 1.5 |
Kobayashi Pharmaceutical Co. Ltd. (Japan, Personal Products) | 1.7 | 1.3 |
Osaka Securities Exchange Co. Ltd. (Japan, Diversified Financial Services) | 1.6 | 1.6 |
Azimut Holdings SpA (Italy, Capital Markets) | 1.5 | 1.6 |
PriceSmart, Inc. (United States of America, Food & Staples Retailing) | 1.5 | 1.6 |
Petrobank Energy & Resources Ltd. (Canada, Oil, Gas & Consumable Fuels) | 1.4 | 1.5 |
Prosegur Compania de Seguridad SA (Reg.) (Spain, Commercial Services & Supplies) | 1.4 | 1.1 |
Braskem SA Class A sponsored ADR (Brazil, Chemicals) | 1.4 | 1.1 |
Serco Group PLC (United Kingdom, Commercial Services & Supplies) | 1.4 | 1.3 |
Outotec OYJ (Finland, Construction & Engineering) | 1.3 | 1.2 |
| 14.9 | |
Market Sectors as of October 31, 2010 |
| % of fund's
net assets | % of fund's net assets
6 months ago |
Industrials | 21.1 | 20.1 |
Financials | 19.6 | 20.5 |
Consumer Discretionary | 16.8 | 16.8 |
Materials | 10.6 | 10.9 |
Consumer Staples | 8.7 | 8.1 |
Information Technology | 8.3 | 7.4 |
Health Care | 6.2 | 7.9 |
Energy | 5.2 | 5.5 |
Utilities | 0.4 | 0.5 |
Telecommunication Services | 0.0 | 0.3 |
Annual Report
Fidelity Series International Small Cap Fund
Investments October 31, 2010
Showing Percentage of Net Assets
Common Stocks - 96.9% |
| Shares | | Value |
Australia - 0.8% |
MAp Group unit | 1,121,089 | | $ 3,349,738 |
OZ Minerals Ltd. | 2,022,648 | | 3,101,027 |
TOTAL AUSTRALIA | | 6,450,765 |
Austria - 0.8% |
Andritz AG | 88,900 | | 6,808,443 |
Bailiwick of Guernsey - 0.8% |
Resolution Ltd. | 1,579,121 | | 6,626,040 |
Bailiwick of Jersey - 1.4% |
Informa PLC | 1,136,898 | | 7,941,658 |
Randgold Resources Ltd. sponsored ADR | 39,600 | | 3,719,232 |
TOTAL BAILIWICK OF JERSEY | | 11,660,890 |
Belgium - 1.4% |
Gimv NV | 79,200 | | 4,378,359 |
Umicore SA | 163,277 | | 7,683,626 |
TOTAL BELGIUM | | 12,061,985 |
Bermuda - 2.3% |
Aquarius Platinum Ltd. (Australia) | 626,514 | | 3,602,797 |
Great Eagle Holdings Ltd. | 1,645,000 | | 4,923,593 |
Lazard Ltd. Class A | 96,900 | | 3,575,610 |
Seadrill Ltd. | 60,202 | | 1,822,715 |
Trinity Ltd. | 5,426,000 | | 5,425,125 |
TOTAL BERMUDA | | 19,349,840 |
Brazil - 3.8% |
Banco ABC Brasil SA | 882,000 | | 8,689,349 |
BR Malls Participacoes SA | 389,900 | | 3,724,356 |
Braskem SA Class A sponsored ADR (d) | 543,600 | | 11,334,060 |
Iguatemi Empresa de Shopping Centers SA | 83,600 | | 1,950,929 |
Multiplan Empreendimentos Imobiliarios SA | 87,700 | | 2,010,522 |
Odontoprev SA | 285,300 | | 4,192,629 |
TOTAL BRAZIL | | 31,901,845 |
Canada - 5.0% |
Agnico-Eagle Mines Ltd. (Canada) | 45,300 | | 3,513,315 |
Eldorado Gold Corp. | 189,800 | | 3,213,890 |
Fairfax Financial Holdings Ltd. (sub. vtg.) | 13,700 | | 5,603,984 |
Niko Resources Ltd. | 91,100 | | 8,691,078 |
Open Text Corp. (a) | 78,800 | | 3,486,083 |
Pan American Silver Corp. | 103,200 | | 3,294,144 |
Common Stocks - continued |
| Shares | | Value |
Canada - continued |
Petrobank Energy & Resources Ltd. (a) | 291,600 | | $ 11,605,102 |
Quadra FNX Mining Ltd. (a) | 140,800 | | 1,987,960 |
TOTAL CANADA | | 41,395,556 |
Cayman Islands - 1.1% |
China Lilang Ltd. (d) | 3,002,000 | | 4,693,984 |
Vantage Drilling Co. (a) | 1,132,469 | | 1,947,847 |
Wynn Macau Ltd. | 1,322,800 | | 2,925,050 |
TOTAL CAYMAN ISLANDS | | 9,566,881 |
China - 0.1% |
China Hongxing Sports Ltd. | 6,394,000 | | 864,521 |
Cyprus - 0.1% |
AFI Development PLC GDR (Reg. S) | 827,100 | | 975,978 |
Denmark - 0.4% |
William Demant Holding AS (a) | 48,900 | | 3,665,378 |
Finland - 2.8% |
Metso Corp. | 91,200 | | 4,323,491 |
Nokian Tyres PLC | 221,300 | | 7,667,404 |
Outotec OYJ (d) | 235,400 | | 10,985,937 |
TOTAL FINLAND | | 22,976,832 |
France - 3.0% |
Audika SA | 90,341 | | 2,206,122 |
Laurent-Perrier Group | 42,626 | | 4,803,675 |
Remy Cointreau SA | 83,373 | | 5,853,832 |
Saft Groupe SA | 175,949 | | 6,720,425 |
Vetoquinol SA | 38,703 | | 1,640,371 |
Virbac SA | 22,600 | | 3,636,819 |
TOTAL FRANCE | | 24,861,244 |
Germany - 3.8% |
alstria office REIT-AG | 131,900 | | 1,837,158 |
Bilfinger Berger Se | 92,045 | | 6,702,218 |
Colonia Real Estate AG (a) | 712,329 | | 4,674,359 |
CTS Eventim AG | 101,648 | | 5,736,730 |
Fielmann AG | 55,895 | | 5,642,583 |
Software AG (Bearer) | 49,600 | | 6,949,903 |
TOTAL GERMANY | | 31,542,951 |
Greece - 0.4% |
Terna Energy SA | 744,900 | | 3,202,758 |
Common Stocks - continued |
| Shares | | Value |
India - 0.5% |
Jyothy Laboratories Ltd. | 614,664 | | $ 3,827,350 |
Ireland - 0.7% |
James Hardie Industries NV unit (a) | 1,072,773 | | 5,664,578 |
Israel - 0.6% |
Azrieli Group | 130,213 | | 3,356,522 |
Ituran Location & Control Ltd. | 122,399 | | 1,903,304 |
TOTAL ISRAEL | | 5,259,826 |
Italy - 2.4% |
Azimut Holdings SpA | 1,260,764 | | 12,858,946 |
Interpump Group SpA (a) | 1,088,617 | | 7,100,419 |
TOTAL ITALY | | 19,959,365 |
Japan - 21.3% |
Aozora Bank Ltd. | 2,470,000 | | 4,143,780 |
Asahi Co. Ltd. (d) | 148,800 | | 2,200,472 |
Autobacs Seven Co. Ltd. | 179,700 | | 6,732,888 |
Daikoku Denki Co. Ltd. | 231,400 | | 2,616,801 |
Daikokutenbussan Co. Ltd. | 188,000 | | 6,588,293 |
FCC Co. Ltd. | 297,300 | | 6,380,478 |
Fukuoka (REIT) Investment Fund (d) | 514 | | 3,449,236 |
GCA Savvian Group Corp. (a) | 3,055 | | 2,896,688 |
Glory Ltd. | 118,000 | | 2,602,833 |
Goldcrest Co. Ltd. | 97,280 | | 2,099,855 |
Japan Steel Works Ltd. | 463,000 | | 4,417,521 |
Kamigumi Co. Ltd. | 624,000 | | 4,877,544 |
Kobayashi Pharmaceutical Co. Ltd. | 299,400 | | 13,952,404 |
Kyoto Kimono Yuzen Co. Ltd. | 166,200 | | 1,807,195 |
Meiko Network Japan Co. Ltd. | 19,400 | | 161,767 |
Miraial Co. Ltd. | 83,200 | | 2,039,935 |
MS&AD Insurance Group Holdings, Inc. | 72,630 | | 1,739,989 |
Nabtesco Corp. | 389,200 | | 6,892,133 |
Nachi-Fujikoshi Corp. | 1,800,000 | | 5,390,829 |
Nagaileben Co. Ltd. | 82,000 | | 1,944,277 |
Nihon M&A Center, Inc. | 619 | | 2,238,461 |
Nihon Parkerizing Co. Ltd. | 339,000 | | 4,452,877 |
Nippon Seiki Co. Ltd. | 221,000 | | 2,238,288 |
Nippon Thompson Co. Ltd. | 1,471,000 | | 10,200,298 |
Nitto Kohki Co. Ltd. | 80,100 | | 1,888,278 |
Obic Co. Ltd. | 27,070 | | 4,998,884 |
Osaka Securities Exchange Co. Ltd. | 2,690 | | 13,538,585 |
OSG Corp. | 367,600 | | 3,841,824 |
Common Stocks - continued |
| Shares | | Value |
Japan - continued |
SAZABY, Inc. | 50,000 | | $ 932,024 |
SHO-BOND Holdings Co. Ltd. | 219,400 | | 4,695,002 |
Shoei Co. Ltd. | 141,500 | | 1,281,888 |
The Nippon Synthetic Chemical Industry Co. Ltd. | 327,000 | | 1,918,032 |
THK Co. Ltd. | 190,300 | | 3,660,798 |
Toho Holdings Co. Ltd. | 278,100 | | 3,894,851 |
Tsumura & Co. | 149,500 | | 4,600,000 |
Tsutsumi Jewelry Co. Ltd. | 75,600 | | 1,780,316 |
USS Co. Ltd. | 181,800 | | 14,142,767 |
Yamatake Corp. | 173,800 | | 4,231,070 |
Yamato Kogyo Co. Ltd. | 375,000 | | 9,618,491 |
TOTAL JAPAN | | 177,087,652 |
Korea (South) - 0.8% |
NCsoft Corp. | 9,575 | | 2,107,436 |
NHN Corp. (a) | 23,621 | | 4,190,653 |
TOTAL KOREA (SOUTH) | | 6,298,089 |
Luxembourg - 0.2% |
GlobeOp Financial Services SA | 388,900 | | 1,901,940 |
Netherlands - 2.7% |
Aalberts Industries NV | 404,800 | | 7,392,774 |
ASM International NV unit (a) | 298,100 | | 7,616,455 |
Heijmans NV unit (a) | 49,600 | | 935,166 |
QIAGEN NV (a)(d) | 328,300 | | 6,175,323 |
TOTAL NETHERLANDS | | 22,119,718 |
Norway - 0.3% |
Sevan Marine ASA (a) | 1,557,600 | | 2,098,758 |
Papua New Guinea - 0.2% |
Oil Search Ltd. | 283,589 | | 1,772,479 |
Philippines - 0.3% |
Jollibee Food Corp. | 1,086,300 | | 2,240,969 |
Portugal - 0.6% |
Jeronimo Martins SGPS SA | 313,200 | | 4,697,947 |
Singapore - 2.6% |
Allgreen Properties Ltd. | 5,834,000 | | 5,363,872 |
Keppel Land Ltd. | 618,000 | | 2,115,228 |
Singapore Exchange Ltd. | 1,340,000 | | 9,110,716 |
Wing Tai Holdings Ltd. | 3,700,000 | | 5,002,704 |
TOTAL SINGAPORE | | 21,592,520 |
Common Stocks - continued |
| Shares | | Value |
South Africa - 3.0% |
African Rainbow Minerals Ltd. | 264,427 | | $ 6,745,955 |
Clicks Group Ltd. | 1,081,267 | | 7,054,040 |
JSE Ltd. | 326,100 | | 3,677,618 |
Mr Price Group Ltd. | 841,200 | | 7,644,598 |
TOTAL SOUTH AFRICA | | 25,122,211 |
Spain - 1.6% |
Grifols SA (d) | 120,800 | | 1,955,694 |
Prosegur Compania de Seguridad SA (Reg.) | 190,400 | | 11,407,975 |
TOTAL SPAIN | | 13,363,669 |
Sweden - 1.0% |
Intrum Justitia AB | 332,200 | | 4,574,114 |
Swedish Match Co. | 146,200 | | 4,085,180 |
TOTAL SWEDEN | | 8,659,294 |
Switzerland - 1.8% |
Bank Sarasin & Co. Ltd. Series B (Reg.) | 266,264 | | 9,737,902 |
Sonova Holding AG Class B | 48,682 | | 5,637,982 |
TOTAL SWITZERLAND | | 15,375,884 |
Turkey - 2.1% |
Albaraka Turk Katilim Bankasi AS | 2,253,000 | | 4,523,907 |
Anadolu Efes Biracilik ve Malt Sanayii AS | 208,000 | | 3,320,923 |
Asya Katilim Bankasi AS | 1,996,000 | | 5,148,993 |
Coca-Cola Icecek AS | 365,000 | | 4,682,423 |
TOTAL TURKEY | | 17,676,246 |
United Kingdom - 16.1% |
AMEC PLC | 238,354 | | 4,147,204 |
Babcock International Group PLC | 653,800 | | 6,075,417 |
Bellway PLC | 384,500 | | 3,289,582 |
Britvic PLC | 807,200 | | 6,238,664 |
Cobham PLC | 1,021,800 | | 3,791,470 |
Dechra Pharmaceuticals PLC | 293,903 | | 2,495,646 |
Derwent London PLC | 139,800 | | 3,404,505 |
Great Portland Estates PLC | 1,027,800 | | 5,689,313 |
H&T Group PLC | 352,727 | | 1,972,274 |
InterContinental Hotel Group PLC ADR (d) | 368,800 | | 7,136,280 |
Johnson Matthey PLC | 227,800 | | 6,985,521 |
Meggitt PLC | 1,424,746 | | 7,535,050 |
Micro Focus International PLC | 509,900 | | 3,119,063 |
Mothercare PLC | 638,700 | | 5,377,406 |
Common Stocks - continued |
| Shares | | Value |
United Kingdom - continued |
Persimmon PLC | 494,500 | | $ 2,701,617 |
Rotork PLC | 131,300 | | 3,523,568 |
Serco Group PLC | 1,147,138 | | 11,284,627 |
Shaftesbury PLC | 801,300 | | 5,725,761 |
Spectris PLC | 357,283 | | 6,462,633 |
Spirax-Sarco Engineering PLC | 369,600 | | 10,712,078 |
Ted Baker PLC | 354,600 | | 3,493,953 |
Ultra Electronics Holdings PLC | 206,500 | | 6,157,006 |
Unite Group PLC (a) | 2,820,900 | | 9,400,570 |
Victrex PLC | 344,500 | | 7,125,554 |
TOTAL UNITED KINGDOM | | 133,844,762 |
United States of America - 10.1% |
Advanced Energy Industries, Inc. (a) | 380,300 | | 5,461,108 |
Autoliv, Inc. (d) | 121,400 | | 8,655,820 |
Cymer, Inc. (a) | 182,200 | | 6,732,290 |
Dril-Quip, Inc. (a) | 56,000 | | 3,869,600 |
ION Geophysical Corp. (a)(d) | 835,900 | | 4,087,551 |
Juniper Networks, Inc. (a) | 183,600 | | 5,946,804 |
Kansas City Southern (a) | 144,500 | | 6,331,990 |
Lam Research Corp. (a) | 33,300 | | 1,524,807 |
Martin Marietta Materials, Inc. (d) | 47,000 | | 3,782,560 |
Mohawk Industries, Inc. (a) | 167,200 | | 9,587,248 |
Oceaneering International, Inc. (a) | 39,100 | | 2,419,117 |
PriceSmart, Inc. | 426,600 | | 12,512,178 |
ResMed, Inc. (a) | 293,900 | | 9,366,593 |
Solera Holdings, Inc. | 48,500 | | 2,330,425 |
Solutia, Inc. (a) | 94,900 | | 1,718,639 |
TOTAL UNITED STATES OF AMERICA | | 84,326,730 |
TOTAL COMMON STOCKS (Cost $710,172,321) | 806,801,894 |
Money Market Funds - 6.0% |
| Shares | | Value |
Fidelity Cash Central Fund, 0.23% (b) | 21,294,510 | | $ 21,294,510 |
Fidelity Securities Lending Cash Central Fund, 0.24% (b)(c) | 28,200,571 | | 28,200,571 |
TOTAL MONEY MARKET FUNDS (Cost $49,495,081) | 49,495,081 |
TOTAL INVESTMENT PORTFOLIO - 102.9% (Cost $759,667,402) | | 856,296,975 |
NET OTHER ASSETS (LIABILITIES) - (2.9)% | | (23,970,230) |
NET ASSETS - 100% | $ 832,326,745 |
Legend |
(a) Non-income producing |
(b) Affiliated fund that is available only to investment companies and other accounts managed by Fidelity Investments. The rate quoted is the annualized seven-day yield of the fund at period end. A complete unaudited listing of the fund's holdings as of its most recent quarter end is available upon request. In addition, each Fidelity Central Fund's financial statements, which are not covered by the Fund's report of Independent Registered Public Accounting Firm, are available on the SEC's website or upon request. |
(c) Investment made with cash collateral received from securities on loan. |
(d) Security or a portion of the security is on loan at period end. |
Affiliated Central Funds |
Information regarding fiscal year to date income earned by the Fund from investments in Fidelity Central Funds is as follows: |
Fund | Income earned |
Fidelity Cash Central Fund | $ 25,324 |
Fidelity Securities Lending Cash Central Fund | 143,723 |
Total | $ 169,047 |
Other Information |
The following is a summary of the inputs used, as of October 31, 2010, involving the Fund's assets and liabilities carried at fair value. The inputs or methodology used for valuing securities may not be an indication of the risk associated with investing in those securities. For more information on valuation inputs, and their aggregation into the levels used in the table below, please refer to the Security Valuation section in the accompanying Notes to Financial Statements. |
Valuation Inputs at Reporting Date: |
Description | Total | Level 1 | Level 2 | Level 3 |
Investments in Securities: | | | | |
Equities: | | | | |
Japan | $ 177,087,652 | $ 170,930,142 | $ 6,157,510 | $ - |
United Kingdom | 133,844,762 | 133,844,762 | - | - |
United States of America | 84,326,730 | 84,326,730 | - | - |
Canada | 41,395,556 | 41,395,556 | - | - |
Brazil | 31,901,845 | 31,901,845 | - | - |
Germany | 31,542,951 | 31,542,951 | - | - |
South Africa | 25,122,211 | 25,122,211 | - | - |
France | 24,861,244 | 24,861,244 | - | - |
Finland | 22,976,832 | 22,976,832 | - | - |
Other | 233,742,111 | 233,742,111 | - | - |
Money Market Funds | 49,495,081 | 49,495,081 | - | - |
Total Investments in Securities: | $ 856,296,975 | $ 850,139,465 | $ 6,157,510 | $ - |
See accompanying notes which are an integral part of the financial statements.
Annual Report
Statement of Assets and Liabilities
| October 31, 2010 |
| | |
Assets | | |
Investment in securities, at value (including securities loaned of $27,405,590) - See accompanying schedule: Unaffiliated issuers (cost $710,172,321) | $ 806,801,894 | |
Fidelity Central Funds (cost $49,495,081) | 49,495,081 | |
Total Investments (cost $759,667,402) | | $ 856,296,975 |
Cash | | 795,207 |
Foreign currency held at value (cost $61,643) | | 61,697 |
Receivable for investments sold | | 4,706,598 |
Receivable for fund shares sold | | 1,745,145 |
Dividends receivable | | 1,546,545 |
Distributions receivable from Fidelity Central Funds | | 30,909 |
Other receivables | | 50,184 |
Total assets | | 865,233,260 |
| | |
Liabilities | | |
Payable for investments purchased | $ 3,823,837 | |
Accrued management fee | 567,449 | |
Other affiliated payables | 144,795 | |
Other payables and accrued expenses | 169,863 | |
Collateral on securities loaned, at value | 28,200,571 | |
Total liabilities | | 32,906,515 |
| | |
Net Assets | | $ 832,326,745 |
Net Assets consist of: | | |
Paid in capital | | $ 729,956,180 |
Undistributed net investment income | | 2,308,288 |
Accumulated undistributed net realized gain (loss) on investments and foreign currency transactions | | 3,459,115 |
Net unrealized appreciation (depreciation) on investments and assets and liabilities in foreign currencies | | 96,603,162 |
Net Assets | | $ 832,326,745 |
See accompanying notes which are an integral part of the financial statements.
Annual Report
Financial Statements - continued
Statement of Assets and Liabilities - continued
| October 31, 2010 |
| | |
Series International Small Cap:
Net Asset Value, offering price and redemption price per share ($701,813,892 ÷ 61,553,753 shares) | | $ 11.40 |
| | |
Class F:
Net Asset Value, offering price and redemption price per share ($130,512,853 ÷ 11,422,946 shares) | | $ 11.43 |
See accompanying notes which are an integral part of the financial statements.
Annual Report
Statement of Operations
| For the period December 3, 2009 (commencement of operations) to
October 31, 2010 |
| | |
Investment Income | | |
Dividends | | $ 6,316,663 |
Interest | | 838 |
Income from Fidelity Central Funds | | 169,047 |
Income before foreign taxes withheld | | 6,486,548 |
Less foreign taxes withheld | | (450,804) |
Total income | | 6,035,744 |
| | |
Expenses | | |
Management fee | $ 2,763,290 | |
Transfer agent fees | 668,235 | |
Accounting and security lending fees | 163,605 | |
Custodian fees and expenses | 184,506 | |
Independent trustees' compensation | 1,433 | |
Registration fees | 8,542 | |
Audit | 47,705 | |
Legal | 633 | |
Miscellaneous | 968 | |
Total expenses before reductions | 3,838,917 | |
Expense reductions | (111,461) | 3,727,456 |
Net investment income (loss) | | 2,308,288 |
Realized and Unrealized Gain (Loss) Net realized gain (loss) on: | | |
Investment securities: | | |
Unaffiliated issuers | 3,343,966 | |
Foreign currency transactions | 115,149 | |
Total net realized gain (loss) | | 3,459,115 |
Change in net unrealized appreciation (depreciation) on: Investment securities (net of increase in deferred foreign taxes of $84,401) | 96,545,172 | |
Assets and liabilities in foreign currencies | 57,990 | |
Total change in net unrealized appreciation (depreciation) | | 96,603,162 |
Net gain (loss) | | 100,062,277 |
Net increase (decrease) in net assets resulting from operations | | $ 102,370,565 |
See accompanying notes which are an integral part of the financial statements.
Annual Report
Financial Statements - continued
Statement of Changes in Net Assets
| For the period December 3, 2009 (commencement of operations) to
October 31, 2010 |
Increase (Decrease) in Net Assets | |
Operations | |
Net investment income (loss) | $ 2,308,288 |
Net realized gain (loss) | 3,459,115 |
Change in net unrealized appreciation (depreciation) | 96,603,162 |
Net increase (decrease) in net assets resulting
from operations | 102,370,565 |
Share transactions - net increase (decrease) | 729,956,180 |
Total increase (decrease) in net assets | 832,326,745 |
| |
Net Assets | |
Beginning of period | - |
End of period (including undistributed net investment income of $2,308,288) | $ 832,326,745 |
See accompanying notes which are an integral part of the financial statements.
Annual Report
Financial Highlights - Series International Small Cap
Period ended October 31, | 2010 G |
Selected Per-Share Data | |
Net asset value, beginning of period | $ 10.00 |
Income from Investment Operations | |
Net investment income (loss) D | .06 |
Net realized and unrealized gain (loss) | 1.34 |
Total from investment operations | 1.40 |
Net asset value, end of period | $ 11.40 |
Total Return B, C | 14.00% |
Ratios to Average Net Assets E, H | |
Expenses before reductions | 1.21% A |
Expenses net of fee waivers, if any | 1.21% A |
Expenses net of all reductions | 1.18% A |
Net investment income (loss) | .68% A |
Supplemental Data | |
Net assets, end of period (000 omitted) | $ 701,814 |
Portfolio turnover rate F | 21% A |
A Annualized
B Total returns for periods of less than one year are not annualized.
C Total returns would have been lower had certain expenses not been reduced during the periods shown.
D Calculated based on average shares outstanding during the period.
E Fees and expenses of the underlying Fidelity Central Funds are not included in the Fund's expense ratio. The Fund indirectly bears its proportionate share of the expenses of any underlying Fidelity Central Funds.
F Amount does not include the portfolio activity of any underlying Fidelity Central Funds.
G For the period December 3, 2009 (commencement of operations) to October 31, 2010.
H Expense ratios reflect operating expenses of the class. Expenses before reductions do not reflect amounts reimbursed by the investment adviser or reductions from brokerage service arrangements or reductions from other expense offset arrangements and do not represent the amount paid by the class during periods when reimbursements or reductions occur. Expense ratios before reductions for start-up periods may not be representative of longer-term operating periods. Expenses net of fee waivers reflect expenses after reimbursement by the investment adviser but prior to reductions from brokerage service arrangements or other expense offset arrangements. Expenses net of all reductions represent the net expenses paid by the class.
See accompanying notes which are an integral part of the financial statements.
Annual Report
Financial Highlights - Class F
Period ended October 31, | 2010 G |
Selected Per-Share Data | |
Net asset value, beginning of period | $ 10.00 |
Income from Investment Operations | |
Net investment income (loss) D | .09 |
Net realized and unrealized gain (loss) | 1.34 |
Total from investment operations | 1.43 |
Net asset value, end of period | $ 11.43 |
Total Return B, C | 14.30% |
Ratios to Average Net Assets E, H | |
Expenses before reductions | .98% A |
Expenses net of fee waivers, if any | .98% A |
Expenses net of all reductions | .94% A |
Net investment income (loss) | .92% A |
Supplemental Data | |
Net assets, end of period (000 omitted) | $ 130,513 |
Portfolio turnover rate F | 21% A |
A Annualized
B Total returns for periods of less than one year are not annualized.
C Total returns would have been lower had certain expenses not been reduced during the periods shown.
D Calculated based on average shares outstanding during the period.
E Fees and expenses of the underlying Fidelity Central Funds are not included in the Fund's expense ratio. The Fund indirectly bears its proportionate share of the expenses of any underlying Fidelity Central Funds.
F Amount does not include the portfolio activity of any underlying Fidelity Central Funds.
G For the period December 3, 2009 (commencement of operations) to October 31, 2010.
H Expense ratios reflect operating expenses of the class. Expenses before reductions do not reflect amounts reimbursed by the investment adviser or reductions from brokerage service arrangements or reductions from other expense offset arrangements and do not represent the amount paid by the class during periods when reimbursements or reductions occur. Expense ratios before reductions for start-up periods may not be representative of longer-term operating periods. Expenses net of fee waivers reflect expenses after reimbursement by the investment adviser but prior to reductions from brokerage service arrangements or other expense offset arrangements. Expenses net of all reductions represent the net expenses paid by the class.
See accompanying notes which are an integral part of the financial statements.
Annual Report
Notes to Financial Statements
For the period ended October 31, 2010
1. Organization.
Fidelity Series International Growth Fund, Fidelity Series International Value Fund and Fidelity Series International Small Cap Fund (the Funds) are funds of Fidelity Investment Trust (the Trust). The Trust is registered under the Investment Company Act of 1940, as amended (the 1940 Act), as an open-end management investment company organized as a Massachusetts business trust. Each Fund is authorized to issue an unlimited number of shares. Shares of the Funds are only available for purchase by mutual funds for which Fidelity Management & Research Company (FMR) or an affiliate serves as an investment manager. Fidelity Series International Growth Fund offers Series International Growth shares and Class F shares, each of which has equal rights as to assets and voting privileges. Fidelity Series International Value Fund offers Series International Value shares and Class F shares, each of which has equal rights as to assets and voting privileges. Fidelity Series International Small Cap Fund offers Series International Small Cap shares and Class F shares, each of which has equal rights as to assets and voting privileges. Each class has exclusive voting rights with respect to matters that affect that class. Investment income, realized and unrealized capital gains and losses, the common expenses of each Fund, and certain fund-level expense reductions, if any, are allocated on a pro-rata basis to each class based on the relative net assets of each class to the total net assets of each Fund. Each class differs with respect to transfer agent fees incurred and certain class-level expense reductions. Certain Funds' investments in emerging markets can be subject to social, economic, regulatory, and political uncertainties and can be extremely volatile.
2. Investments in Fidelity Central Funds.
The Funds may invest in Fidelity Central Funds, which are open-end investment companies available only to other investment companies and accounts managed by Fidelity Management & Research Company (FMR) and its affiliates. The Funds' Schedules of Investments list each of the Fidelity Central Funds held as of period end, if any, as an investment of each Fund, but does not include the underlying holdings of each Fidelity Central Fund. As an Investing Fund, the Funds indirectly bear their proportionate share of the expenses of the underlying Fidelity Central Funds.
The Money Market Central Funds seek preservation of capital and current income and are managed by Fidelity Investments Money Management, Inc. (FIMM), an affiliate of FMR.
A complete unaudited list of holdings for each Fidelity Central Fund is available upon request or at the Securities and Exchange Commission (the SEC) web site at www.sec.gov. In addition, the financial statements of the Fidelity Central Funds which are not covered by the Funds' Report of Independent Registered Public Accounting Firm, are available on the SEC web site or upon request.
Annual Report
Notes to Financial Statements - continued
3. Significant Accounting Policies.
The financial statements have been prepared in conformity with accounting principles generally accepted in the United States of America (GAAP), which require management to make certain estimates and assumptions at the date of the financial statements. Actual results could differ from those estimates. The following summarizes the significant accounting policies of the Funds:
Security Valuation. Investments are valued as of 4:00 p.m. Eastern time on the last calendar day of the period. Each Fund uses independent pricing services approved by the Board of Trustees to value their investments. When current market prices or quotations are not readily available or reliable, valuations may be determined in good faith in accordance with procedures adopted by the Board of Trustees. Factors used in determining value may include market or security specific events. The frequency with which these procedures are used cannot be predicted and they may be utilized to a significant extent. The value used for net asset value (NAV) calculation under these procedures may differ from published prices for the same securities.
Each Fund categorizes the inputs to valuation techniques used to value their investments into a disclosure hierarchy consisting of three levels as shown below.
Level 1 - quoted prices in active markets for identical investments
Level 2 - other significant observable inputs (including quoted prices for similar investments, interest rates, prepayment speeds, etc.)
Level 3 - unobservable inputs (including the fund's own assumptions based on the best information available)
Changes in valuation techniques may result in transfers in or out of an assigned level within the disclosure hierarchy. The aggregate value of investments by input level, as of October 31, 2010 is included at the end of each Fund's Schedule of Investments. Valuation techniques used to value each Fund's investments by major category are as follows.
Equity securities, including restricted securities, for which market quotations are readily available, are valued at the last reported sale price or official closing price as reported by an independent pricing service on the primary market or exchange on which they are traded and are categorized as Level 1 in the hierarchy. In the event there were no sales during the day or closing prices are not available, securities are valued at the last quoted bid price or may be valued using the last available price and are generally categorized as Level 2 in the hierarchy. For foreign equity securities, when significant market or security specific events arise, comparisons to the valuation of American Depositary Receipts (ADRs), futures contracts, Exchange-traded funds (ETFs) and certain indexes as well as quoted prices for similar securities are used and are categorized as Level 2 in the hierarchy in these circumstances. Utilizing these techniques may result in transfers between
Annual Report
3. Significant Accounting Policies - continued
Security Valuation - continued
Level 1 and Level 2. For restricted equity securities and private placements where observable inputs are limited, assumptions about market activity and risk are used and are categorized as Level 3 in the hierarchy.
Investments in open-end mutual funds, including the Fidelity Central Funds, are valued at their closing net asset value each business day and are categorized as Level 1 in the hierarchy. Short-term securities with remaining maturities of sixty days or less for which quotations are not readily available are valued at amortized cost, which approximates fair value and are categorized as Level 2 in the hierarchy.
Foreign Currency. Certain Funds may use foreign currency contracts to facilitate transactions in foreign-denominated securities. Gains and losses from these transactions may arise from changes in the value of the foreign currency or if the counterparties do not perform under the contracts' terms.
Foreign-denominated assets, including investment securities, and liabilities are translated into U.S. dollars at the exchange rate at period end. Purchases and sales of investment securities, income and dividends received and expenses denominated in foreign currencies are translated into U.S. dollars at the exchange rate in effect on the transaction date.
The effects of exchange rate fluctuations on investments are included with the net realized and unrealized gain (loss) on investment securities. Other foreign currency transactions resulting in realized and unrealized gain (loss) are disclosed separately.
Investment Transactions and Income. For financial reporting purposes, the Funds' investment holdings and NAV include trades executed through the end of the last business day of the period. The NAV per share for processing shareholder transactions is calculated as of the close of business of the New York Stock Exchange (NYSE), normally 4:00 p.m. Eastern time and includes trades executed through the end of the prior business day. Gains and losses on securities sold are determined on the basis of identified cost. Dividend income is recorded on the ex-dividend date, except for certain dividends from foreign securities where the ex-dividend date may have passed, which are recorded as soon as the Funds are informed of the ex-dividend date. Non-cash dividends included in dividend income, if any, are recorded at the fair market value of the securities received. Distributions received on securities that represent a return of capital or capital gain are recorded as a reduction of cost of investments and/or as a realized gain. The Funds estimate the components of distributions received that may be considered return of capital distributions or capital gain distributions. Interest income and distributions from the Fidelity Central Funds are accrued as earned. Interest income includes coupon interest and amortization of premium and accretion of discount on debt securities.
Annual Report
Notes to Financial Statements - continued
3. Significant Accounting Policies - continued
Investment Transactions and Income - continued
Investment income is recorded net of foreign taxes withheld where recovery of such taxes is uncertain.
Expenses. Most expenses of the Trust can be directly attributed to a fund. Expenses which cannot be directly attributed are apportioned amongst each fund in the Trust. Expense estimates are accrued in the period to which they relate and adjustments are made when actual amounts are known.
Income Tax Information and Distributions to Shareholders. Each year each Fund intends to qualify as a regulated investment company, including distributing substantially all of its taxable income and realized gains under Subchapter M of the Internal Revenue Code and filing its U.S. federal tax return. As a result, no provision for income taxes is required. As of October 31, 2010, each Fund did not have any unrecognized tax benefits in the accompanying financial statements. A fund's federal tax return is subject to examination by the Internal Revenue Service (IRS) for a period of three years. Foreign taxes are provided for based on each Fund's understanding of the tax rules and rates that exist in the foreign markets in which it invests. The Fidelity Series International Value Fund and the Fidelity Series International Small Cap Fund are subject to a tax imposed on short term capital gains on securities of certain issuers domiciled in India. The Fidelity Series International Value Fund and the Fidelity Series International Small Cap Fund record an estimated deferred tax liability included in Other payables and accrued expenses in the accompanying Statement of Assets & Liabilities for net unrealized gains on these securities in an amount that would be payable if the securities were disposed of at period end.
Distributions are declared and recorded on the ex-dividend date. Income dividends and capital gain distributions are declared separately for each class. Income and capital gain distributions are determined in accordance with income tax regulations, which may differ from GAAP.
Capital accounts within the financial statements are adjusted for permanent book-tax differences. These adjustments have no impact on net assets or the results of operations. Temporary book-tax differences will reverse in a subsequent period.
Book-tax differences are primarily due to foreign currency transactions, passive foreign investment companies (PFIC), partnerships and capital loss carryforwards and losses deferred due to wash sales.
Annual Report
3. Significant Accounting Policies - continued
Income Tax Information and Distributions to Shareholders - continued
The federal tax cost of investment securities and unrealized appreciation (depreciation) as of period end were as follows for each Fund:
| Tax cost | Gross
unrealized
appreciation | Gross
unrealized
depreciation | Net unrealized appreciation
(depreciation) |
Fidelity Series International Growth Fund | $ 4,351,696,842 | $ 610,380,406 | $ (55,713,888) | $ 554,666,518 |
Fidelity Series International Value Fund | 4,438,142,428 | 422,919,187 | (115,668,381) | 307,250,806 |
Fidelity Series International Small Cap Fund | 762,129,201 | 110,342,655 | (16,174,881) | 94,167,774 |
The tax-based components of distributable earnings as of period end were as follows for each Fund:
| Undistributed ordinary
income | Capital loss
carryforward | Net unrealized
appreciation
(depreciation) |
Fidelity Series International Growth Fund | $ 21,311,176 | $ (27,059,158) | $ 554,879,689 |
Fidelity Series International Value Fund | 56,083,754 | (6,804,041) | 307,628,899 |
Fidelity Series International Small Cap Fund | 8,229,201 | - | 94,225,765 |
4. Purchases and Sales of Investments.
Purchases and sales of securities, other than short-term securities, are noted in the table below.
| Purchases ($) | Sales ($) |
Fidelity Series International Growth Fund | 5,254,194,027 | 1,145,079,652 |
Fidelity Series International Value Fund | 5,541,548,899 | 1,304,554,716 |
Fidelity Series International Small Cap Fund | 779,008,198 | 72,090,852 |
Annual Report
Notes to Financial Statements - continued
5. Fees and Other Transactions with Affiliates.
Management Fee. FMR and its affiliates provide the Funds with investment management related services for which the Funds pay a monthly management fee. The management fee is the sum of an individual fund fee rate and a group fee rate. The individual fund fee rate is applied to each Fund's average net assets. The group fee rate is based upon the average net assets of all the mutual funds advised by FMR. The group fee rate decreases as assets under management increase and increases as assets under management decrease. In addition, the management fee for Fidelity Series International Growth Fund, Fidelity Series International Value Fund and Fidelity Series International Small Cap Fund is subject to a performance adjustment (up to a maximum of ± .20% of each applicable Fund's average net assets over a 36 month performance period). The upward or downward adjustment to the management fee is based on the relative investment performance of the retail class of each Fund as compared to an appropriate benchmark index. Each fund's performance adjustment will not take effect until December 2010. Subsequent months will be added until the performance period includes 36 months. For the period, each Fund's annualized management fee rate expressed as a percentage of each Fund's average net assets was as follows:
| Individual Rate | Group
Rate | Total |
Fidelity Series International Growth Fund | .45% | .26% | .70% |
Fidelity Series International Value Fund | .45% | .26% | .70% |
Fidelity Series International Small Cap Fund | .60% | .26% | .85% |
Transfer Agent Fees. Fidelity Investments Institutional Operations Company, Inc. (FIIOC), an affiliate of FMR, is the transfer, dividend disbursing and shareholder servicing agent for each class of the Funds. FIIOC receives account fees and asset-based fees that vary according to the account size and type of account of the shareholders of the respective classes of each Fund except for Class F. FIIOC receives no fees for providing transfer agency services to Class F. FIIOC pays for typesetting, printing and mailing of shareholder reports, except proxy statements. For the period, transfer agent fees for each class were as follows:
Fidelity Series International Growth Fund | Amount | % of
Average
Net Assets* |
Series International Growth | $ 3,464,974 | .23 |
Fidelity Series International Value Fund | | |
Series International Value | $ 3,427,540 | .23 |
Fidelity Series International Small Cap Fund | | |
Series International Small Cap | $ 668,235 | .23 |
* Annualized
Annual Report
5. Fees and Other Transactions with Affiliates - continued
Accounting and Security Lending Fees. Fidelity Service Company, Inc. (FSC), an affiliate of FMR, maintains each Fund's accounting records. The accounting fee is based on the level of average net assets for the month. Under a separate contract, FSC administers the security lending program. The security lending fee is based on the number and duration of lending transactions.
Brokerage Commissions. Certain Funds placed a portion of their portfolio transactions with brokerage firms which are affiliates of the investment adviser. The commissions paid to these affiliated firms were as follows:
| Amount |
Fidelity Series International Growth Fund | $ 3,490 |
Fidelity Series International Value Fund | 762 |
Fidelity Series International Small Cap Fund | 979 |
Exchange In-Kind. During the period, certain investment companies managed by FMR or its affiliates (Investing Funds) completed exchanges in-kind with Fidelity Series International Growth Fund and Fidelity Series International Value Fund. The Investing Funds delivered securities in exchange for shares of each Fund, as presented in the accompanying table. The value of securities delivered from the Investing Funds is included in Shares sold transactions in Note 9. Each Fund recognized no gain or loss for federal income tax purposes.
Exchange-in-kind date | Fund | Value of securities delivered from
Investing Funds | Unrealized
appreciation
(depreciation) | Exchanged
number of
Fund shares |
12/04/09 | Fidelity Series International Growth Fund | $ 250,000,000 | $ 26,568,361 | 25,227,043 |
12/04/09 | Fidelity Series International Value Fund | 250,000,000 | 25,137,531 | 25,176,234 |
04/23/10 | Fidelity Series International Growth Fund | 150,000,000 | 5,933,323 | 14,864,876 |
04/23/10 | Fidelity Series International Value Fund | 150,000,000 | 8,660,014 | 15,289,115 |
7/16/10 | Fidelity Series International Growth Fund | 250,000,000 | (9,681,236) | 27,166,803 |
7/16/10 | Fidelity Series International Value Fund | 250,000,000 | (3,584,609) | 28,994,223 |
Annual Report
Notes to Financial Statements - continued
5. Fees and Other Transactions with Affiliates - continued
Exchange In-Kind - continued
Exchange-in-kind date | Fund | Value of securities delivered from
Investing Funds | Unrealized
appreciation
(depreciation) | Exchanged
number of
Fund shares |
10/22/10 | Fidelity Series International Growth Fund | $ 381,723,801 | $ 86,057,020 | 35,170,579 |
10/22/10 | Fidelity Series International Value Fund | 381,723,801 | 78,394,806 | 38,350,721 |
6. Committed Line of Credit.
Certain Funds participate with other funds managed by FMR or an affiliate in a $3.75 billion credit facility (the "line of credit") to be utilized for temporary or emergency purposes to fund shareholder redemptions or for other short-term liquidity purposes. The participating funds have agreed to pay commitment fees on their pro-rata portion of the line of credit, which are reflected in Miscellaneous expenses on the Statement of Operations, and are as follows:
Fidelity Series International Growth Fund | $ 4,540 |
Fidelity Series International Value Fund | 4,505 |
Fidelity Series International Small Cap Fund | 868 |
During the period, there were no borrowings on this line of credit.
7. Security Lending.
Certain Funds lend portfolio securities through a lending agent from time to time in order to earn additional income. The lending agent may loan securities to certain qualified borrowers, including Fidelity Capital Markets (FCM), a broker-dealer affiliated with the Funds. On the settlement date of the loan, each applicable Fund receives collateral (in the form of U.S. Treasury obligations, letters of credit and/or cash) against the loaned securities and maintains collateral in an amount not less than 100% of the market value of the loaned securities during the period of the loan. The market value of the loaned securities is determined at the close of business of the Funds and any additional required collateral is delivered to the Funds on the next business day. If the borrower defaults on its obligation to return the securities loaned because of insolvency or other reasons, a fund could experience delays and costs in recovering the securities loaned or in gaining access to the collateral. Any cash collateral received is invested in the Fidelity Securities Lending Cash Central Fund. The value of loaned securities and
Annual Report
7. Security Lending - continued
cash collateral at period end are disclosed on each applicable Fund's Statement of Assets and Liabilities. Security lending income represents the income earned on investing cash collateral, less rebates paid to borrowers and lending agent fees associated with the loan, plus any premium payments received for lending certain types of securities. Security lending income is presented on each applicable Fund's Statement of Operations as a component of income from Fidelity Central Funds. During the period, there were no securities loaned to FCM. Security lending activity as of and during the period was as follows:
| Total Security Lending Income |
Fidelity Series International Growth Fund | $ 607,006 |
Fidelity Series International Value Fund | 1,274,850 |
Fidelity Series International Small Cap Fund | 143,723 |
8. Expense Reductions.
Many of the brokers with whom FMR places trades on behalf of certain Funds provided services to these Funds in addition to trade execution. These services included payments of expenses on behalf of each applicable Fund. In addition, through arrangements with each applicable Fund's custodian, credits realized as a result of uninvested cash balances were used to reduce the Fund's expenses. All of the applicable expense reductions are noted in the table below.
| Brokerage
Service
reduction | Custody
expense
reduction |
| | |
Fidelity Series International Growth Fund | $ 413,887 | $ 55 |
Fidelity Series International Value Fund | 409,168 | 137 |
Fidelity Series International Small Cap Fund | 111,431 | 30 |
9. Share Transactions.
Transactions for each class of shares were as follows:
| Shares | Dollars |
Period ended October 31, | 2010 A | 2010 A |
Series International Growth | | |
Shares sold | 383,695,719 | $ 3,683,684,745 |
Shares redeemed | (21,469,620) | (207,462,670) |
Net increase (decrease) | 362,226,099 | $ 3,476,222,075 |
Annual Report
Notes to Financial Statements - continued
9. Share Transactions - continued
| Shares | Dollars |
Period ended October 31, | 2010 A | 2010 A |
Class F | | |
Shares sold | 68,259,971 | $ 663,568,900 |
Shares redeemed | (49,565) | (474,637) |
Net increase (decrease) | 68,210,406 | $ 663,094,263 |
Series International Value | | |
Shares sold | 412,641,187 | $ 3,772,955,102 |
Shares redeemed | (22,718,804) | (206,545,585) |
Net increase (decrease) | 389,922,383 | $ 3,566,409,517 |
Class F | | |
Shares sold | 73,576,238 | $ 673,595,109 |
Shares redeemed | (38,336) | (358,504) |
Net increase (decrease) | 73,537,902 | $ 673,236,605 |
Series International Small Cap | | |
Shares sold | 65,438,695 | $ 653,652,045 |
Shares redeemed | (3,884,942) | (39,646,565) |
Net increase (decrease) | 61,553,753 | $ 614,005,480 |
Class F | | |
Shares sold | 11,440,459 | $ 116,123,150 |
Shares redeemed | (17,513) | (172,450) |
Net increase (decrease) | 11,422,946 | $ 115,950,700 |
A Share transactions are for the period December 3, 2009 (commencement of operations) to October 31, 2010.
10. Other.
The Funds' organizational documents provide former and current trustees and officers with a limited indemnification against liabilities arising in connection with the performance of their duties to the Funds. In the normal course of business, the Funds may also enter into contracts that provide general indemnifications. The Funds' maximum exposure under these arrangements is unknown as this would be dependent on future claims that may be made against the Funds. The risk of material loss from such claims is considered remote.
At the end of the period, mutual funds managed by FMR or an FMR affiliate were the owners of record of all of the outstanding shares of the Funds.
Annual Report
To the Trustees of Fidelity Investment Trust and the Shareholders of Fidelity Series International Growth Fund:
In our opinion, the accompanying statements of assets and liabilities, including the schedules of investments, and the related statements of operations and of changes in net assets and the financial highlights present fairly, in all material respects, the financial position of Series International Growth Fund (a fund of Fidelity Investment Trust ) at October 31, 2010, the results of its operations for the period indicated, the changes in its net assets for the period indicated and the financial highlights for the period indicated, in conformity with accounting principles generally accepted in the United States of America. These financial statements and financial highlights (hereafter referred to as "financial statements") are the responsibility of the Fidelity Series International Growth Fund's management. Our responsibility is to express an opinion on these financial statements based on our audits. We conducted our audits of these financial statements in accordance with the standards of the Public Company Accounting Oversight Board (United States). Those standards require that we plan and perform the audit to obtain reasonable assurance about whether the financial statements are free of material misstatement. An audit includes examining, on a test basis, evidence supporting the amounts and disclosures in the financial statements, assessing the accounting principles used and significant estimates made by management, and evaluating the overall financial statement presentation. We believe that our audit, which included confirmation of securities at October 31, 2010 by correspondence with the custodian and brokers, provides a reasonable basis for our opinion.
/s/ PricewaterhouseCoopers LLP
PricewaterhouseCoopers LLP
Boston, Massachusetts
December 16, 2010
Annual Report
Report of Independent Registered Public Accounting Firm
To the Trustees of Fidelity Investment Trust and Shareholders of Fidelity Series International Value Fund and Fidelity Series International Small Cap Fund:
We have audited the accompanying statements of assets and liabilities including the schedules of investments of Fidelity Series International Value Fund and Fidelity Series International Small Cap Fund (the Funds), each a fund of Fidelity Investment Trust, as of October 31, 2010, and the related statements of operations, the statements of changes in net assets, and the financial highlights for the period from December 3, 2009 (commencement of operations) to October 31, 2010. These financial statements and financial highlights are the responsibility of the Funds' management. Our responsibility is to express an opinion on these financial statements and financial highlights based on our audits.
We conducted our audits in accordance with standards of the Public Company Accounting Oversight Board (United States). Those standards require that we plan and perform the audit to obtain reasonable assurance about whether the financial statements and financial highlights are free of material misstatement. The Funds are not required to have, nor were we engaged to perform, an audit of their internal control over financial reporting. Our audits included consideration of internal control over financial reporting as a basis for designing audit procedures that are appropriate in the circumstances, but not for the purpose of expressing an opinion on the effectiveness of the Fund's internal control over financial reporting. Accordingly, we express no such opinion. An audit also includes examining, on a test basis, evidence supporting the amounts and disclosures in the financial statements, assessing the accounting principles used and significant estimates made by management, as well as evaluating the overall financial statement presentation. Our procedures included confirmation of securities owned as of October 31, 2010, by correspondence with the custodians and brokers; where replies were not received from brokers, we performed other auditing procedures. We believe that our audits provide a reasonable basis for our opinion.
In our opinion, the financial statements and financial highlights referred to above present fairly, in all material respects, the financial positions of Fidelity Series International Value Fund and Fidelity Series International Small Cap Fund as of October 31, 2010, the results of their operations , the changes in their net assets, and the financial highlights for the period from December 3, 2009 (commencement of operations) to October 31, 2010 in conformity with accounting principles generally accepted in the United States of America.
/s/ Deloitte & Touche LLP
DELOITTE & TOUCHE LLP
Boston, Massachusetts
December 16, 2010
Annual Report
The Trustees, Member of the Advisory Board, and executive officers of the trust and funds, as applicable, are listed below. The Board of Trustees governs each fund and is responsible for protecting the interests of shareholders. The Trustees are experienced executives who meet periodically throughout the year to oversee each fund's activities, review contractual arrangements with companies that provide services to each fund, oversee management of the risks associated with such activities and contractual arrangements, and review each fund's performance. Except for James C. Curvey, each of the Trustees oversees 221 funds advised by FMR or an affiliate. Mr. Curvey oversees 410 funds advised by FMR or an affiliate.
The Trustees hold office without limit in time except that (a) any Trustee may resign; (b) any Trustee may be removed by written instrument, signed by at least two-thirds of the number of Trustees prior to such removal; (c) any Trustee who requests to be retired or who has become incapacitated by illness or injury may be retired by written instrument signed by a majority of the other Trustees; and (d) any Trustee may be removed at any special meeting of shareholders by a two-thirds vote of the outstanding voting securities of the trust. Each Trustee who is not an interested person (as defined in the 1940 Act) (Independent Trustee), shall retire not later than the last day of the calendar year in which his or her 72nd birthday occurs. The Independent Trustees may waive this mandatory retirement age policy with respect to individual Trustees. The executive officers and Advisory Board Member hold office without limit in time, except that any officer and Advisory Board Member may resign or may be removed by a vote of a majority of the Trustees at any regular meeting or any special meeting of the Trustees. Except as indicated, each individual has held the office shown or other offices in the same company for the past five years.
Experience, Skills, Attributes, and Qualifications of the Funds' Trustees. The Governance and Nominating Committee has adopted a statement of policy that describes the experience, qualifications, attributes, and skills that are necessary and desirable for potential Independent Trustee candidates (Statement of Policy). The Board believes that each Trustee satisfied at the time he or she was initially elected or appointed a Trustee, and continues to satisfy, the standards contemplated by the Statement of Policy. The Governance and Nominating Committee also engages professional search firms to help identify potential Independent Trustee candidates who have the experience, qualifications, attributes, and skills consistent with the Statement of Policy. From time to time, additional criteria based on the composition and skills of the current Independent Trustees, as well as experience or skills that may be appropriate in light of future changes to board composition, business conditions, and regulatory or other developments, have also been considered by the professional search firms and the Governance and Nominating Committee. In addition, the Board takes into account the Trustees' commitment and participation in Board and committee meetings, as well as their leadership of standing and ad hoc committees throughout their tenure.
In determining that a particular Trustee was and continues to be qualified to serve as a Trustee, the Board has considered a variety of criteria, none of which, in isolation, was controlling. The Board believes that, collectively, the Trustees have balanced and diverse experience, qualifications, attributes, and skills, which allow the Board to operate effectively in governing each fund and protecting the interests of shareholders. Information about the specific experience, skills, attributes, and qualifications of each Trustee, which in each case led to the Board's conclusion that the Trustee should serve (or continue to serve) as a trustee of the funds, is provided below.
Annual Report
Trustees and Officers - continued
Board Structure and Oversight Function. Edward C. Johnson 3d is an interested person (as defined in the 1940 Act) and currently serves as Chairman. The Trustees have determined that an interested Chairman is appropriate and benefits shareholders because an interested Chairman has a personal and professional stake in the quality and continuity of services provided to the funds. Independent Trustees exercise their informed business judgment to appoint an individual of their choosing to serve as Chairman, regardless of whether the Trustee happens to be independent or a member of management. The Independent Trustees have determined that they can act independently and effectively without having an Independent Trustee serve as Chairman and that a key structural component for assuring that they are in a position to do so is for the Independent Trustees to constitute a substantial majority for the Board. The Independent Trustees also regularly meet in executive session. Ned C. Lautenbach serves as Chairman of the Independent Trustees and as such (i) acts as a liaison between the Independent Trustees and management with respect to matters important to the Independent Trustees and (ii) with management prepares agendas for Board meetings.
Fidelity funds are overseen by different Boards of Trustees. The funds' Board oversees Fidelity's equity and high income funds and another Board oversees Fidelity's investment-grade bond, money market, and asset allocation funds. The asset allocation funds may invest in Fidelity funds overseen by the funds' Board. The use of separate Boards, each with its own committee structure, allows the Trustees of each group of Fidelity funds to focus on the unique issues of the funds they oversee, including common research, investment, and operational issues. On occasion, the separate Boards establish joint committees to address issues of overlapping consequences for the Fidelity funds overseen by each Board.
The Trustees operate using a system of committees to facilitate the timely and efficient consideration of all matters of importance to the Trustees, each fund, and fund shareholders and to facilitate compliance with legal and regulatory requirements and oversight of the funds' activities and associated risks. The Board, acting through its committees, has charged FMR and its affiliates with (i) identifying events or circumstances the occurrence of which could have demonstrably adverse effects on the funds' business and/or reputation; (ii) implementing processes and controls to lessen the possibility that such events or circumstances occur or to mitigate the effects of such events or circumstances if they do occur; and (iii) creating and maintaining a system designed to evaluate continuously business and market conditions in order to facilitate the identification and implementation processes described in (i) and (ii) above. Because the day-to-day operations and activities of the funds are carried out by or through FMR, its affiliates and other service providers, the funds' exposure to risks is mitigated but not eliminated by the processes overseen by the Trustees. While each of the Board's committees has responsibility for overseeing different aspects of the funds' activities, oversight is exercised primarily through the Operations, Audit, and Compliance Committees. Appropriate personnel, including but not limited to the funds' Chief Compliance Officer (CCO), FMR's internal auditor, the independent accountants, the funds' Treasurer and portfolio management personnel, make periodic reports to the Board's committees, as appropriate. The responsibilities of each committee, including their oversight responsibilities, are described further under "Standing Committees of the Funds' Trustees."
Annual Report
The fund's Statement of Additional Information (SAI) includes more information about the Trustees. To request a free copy, call Fidelity at 1-800-544-8544 for Fidelity Series International Growth Fund, Fidelity Series International Value Fund, and Fidelity Series International Small Cap Fund or 1-800-835-5092 for Class F.
Interested Trustees*:
Correspondence intended for each Trustee who is an interested person may be sent to Fidelity Investments, 82 Devonshire Street, Boston, Massachusetts 02109.
Name, Age; Principal Occupations and Other Relevant Experience+ |
Edward C. Johnson 3d (80) |
| Year of Election or Appointment: 1984 Mr. Johnson is Trustee and Chairman of the Board of Trustees of certain Trusts. Mr. Johnson serves as Chief Executive Officer, Chairman, and a Director of FMR LLC; Chairman and a Director of FMR; Chairman and a Director of Fidelity Research & Analysis Company (FRAC); Chairman and a Director of Fidelity Investments Money Management, Inc.; and Chairman and a Director of FMR Co., Inc. In addition, Mr. Johnson serves as Chairman and Director of FIL Limited. Previously, Mr. Johnson served as President of FMR LLC (2006-2007). |
James C. Curvey (75) |
| Year of Election or Appointment: 2007 Mr. Curvey also serves as Trustee (2007-present) of other investment companies advised by FMR. Mr. Curvey is a Director of Fidelity Investments Money Management, Inc. (2009-present), Director of Fidelity Research & Analysis Co. (2009-present) and Director of FMR and FMR Co., Inc. (2007-present). Mr. Curvey is also Vice Chairman (2007-
present) and Director of FMR LLC. In addition, Mr. Curvey serves as an Overseer for the Boston Symphony Orchestra and a member of the Trustees of Villanova University. Previously, Mr. Curvey was the Vice Chairman (2006-2007) and Director (2000-2007) of FMR Corp. |
Annual Report
Trustees and Officers - continued
* Trustees have been determined to be "Interested Trustees" by virtue of, among other things, their affiliation with the trust or various entities under common control with FMR.
+ The information above includes each Trustee's principal occupation during the last five years and other information relating to the experience, attributes, and skills relevant to each Trustee's qualifications to serve as a Trustee, which led to the conclusion that each Trustee should serve as a Trustee for each fund.
Independent Trustees:
Correspondence intended for each Independent Trustee (that is, the Trustees other than the Interested Trustees) may be sent to Fidelity Investments, P.O. Box 55235, Boston, Massachusetts 02205-5235.
Name, Age; Principal Occupations and Other Relevant Experience+ |
Dennis J. Dirks (62) |
| Year of Election or Appointment: 2005 Prior to his retirement in May 2003, Mr. Dirks was Chief Operating Officer and a member of the Board of The Depository Trust & Clearing Corporation (DTCC). He also served as President, Chief Operating Officer, and Board member of The Depository Trust Company (DTC) and President and Board member of the National Securities Clearing Corporation (NSCC). In addition, Mr. Dirks served as Chief Executive Officer and Board member of the Government Securities Clearing Corporation, Chief Executive Officer and Board member of the Mortgage-Backed Securities Clearing Corporation, as a Trustee and a member of the Finance Committee of Manhattan College (2005-2008), and as a Trustee and a member of the Finance Committee of AHRC of Nassau County (2006-2008). Mr. Dirks is a member of the Independent Directors Council (IDC) Governing Council (2010-Present) and Board of Directors for The Brookville Center for Children's Services, Inc. (2009-present). |
Alan J. Lacy (57) |
| Year of Election or Appointment: 2008 Mr. Lacy serves as Senior Adviser (2007-present) of Oak Hill Capital Partners, L.P. (private equity). Mr. Lacy also served as Chief Executive Officer (2000-2005) and Vice Chairman (2005-2006) of Sears Holdings Corporation and Sears, Roebuck and Co. (retail). In addition, Mr. Lacy serves as a member of the Board of Directors of The Western Union Company (global money transfer, 2006-present) and Bristol-Myers Squibb Company (global pharmaceuticals, 2007-present). Mr. Lacy is Chairman (2008-present) and a member (2006-present) of the Board of Trustees of The National Parks Conservation Association. |
Ned C. Lautenbach (66) |
| Year of Election or Appointment: 2000 Mr. Lautenbach is Chairman of the Independent Trustees of the Equity and High Income Funds (2006-present). Mr. Lautenbach currently serves as the Lead Director of the Eaton Corporation Board of Directors (diversified industrial, 1997-present). Mr. Lautenbach is also a member of the Board of Directors of the Philharmonic Center for the Arts in Naples, Florida (1999-present); a member of the Board of Trustees of Fairfield University (2005-present); and a member of the Council on Foreign Relations (1994-present). Previously, Mr. Lautenbach was a Partner/Advisory Partner at Clayton, Dubilier & Rice, Inc. (private equity investment, 1998-2010), as well as a Director of Sony Corporation (2006-2007). |
Joseph Mauriello (66) |
| Year of Election or Appointment: 2008 Prior to his retirement in January 2006, Mr. Mauriello served in numerous senior management positions including Deputy Chairman and Chief Operating Officer (2004-2005), and Vice Chairman of Financial Services (2002-2004) of KPMG LLP US (professional services, 1965-2005). Mr. Mauriello currently serves as a member of the Board of Directors of XL Group plc. (global insurance and re-insurance, 2006-present) and of Arcadia Resources Inc. (health care services and products, 2007-
present). Previously, Mr. Mauriello served as a Director of the Hamilton Funds of the Bank of New York (2006-2007). |
Cornelia M. Small (66) |
| Year of Election or Appointment: 2005 Ms. Small is a member of the Board of Directors of the Teagle Foundation (2009-present). Ms. Small is also a member of the Investment Committee, and Chair (2008-present) and a member of the Board of Trustees of Smith College. In addition, Ms. Small serves on the Investment Committee of the Berkshire Taconic Community Foundation (2008-
present). Previously, Ms. Small served as Chairperson of the Investment Committee (2002-2008) of Smith College. In addition, Ms. Small served as Chief Investment Officer, Director of Global Equity Investments, and a member of the Board of Directors of Scudder, Stevens & Clark and Scudder Kemper Investments. |
William S. Stavropoulos (71) |
| Year of Election or Appointment: 2001 Mr. Stavropoulos is Vice Chairman of the Independent Trustees of the Equity and High Income Funds (2006-present). Mr. Stavropoulos serves as President and Founder of the Michigan Baseball Foundation, the Great Lakes Loons (2007-present). Mr. Stavropoulos is Chairman Emeritus of the Board of Directors of The Dow Chemical Company, where he previously served in numerous senior management positions, including President, CEO (1995-2000; 2002-2004), Chairman of the Executive Committee (2000-2006), and as a member of the Board of Directors (1990-2006). Currently, Mr. Stavropoulos is Chairman of Univar (global distributor of commodity and specialty chemicals, 2010-present), a Director of Teradata Corporation (data warehousing and technology solutions, 2008-present), Chemical Financial Corporation, Maersk Inc. (industrial conglomerate), Tyco International, Inc. (multinational manufacturing and services, 2007-present), and a member of the Advisory Board for Metalmark Capital (private equity investment, 2005-
present). Mr. Stavropoulos is a special advisor to Clayton, Dubilier & Rice, Inc. (private equity investment). In addition, Mr. Stavropoulos is a member of the University of Notre Dame Advisory Council for the College of Science. |
David M. Thomas (61) |
| Year of Election or Appointment: 2008 Previously, Mr. Thomas served as Executive Chairman (2005-2006) and Chairman and Chief Executive Officer (2000-2005) of IMS Health, Inc. (pharmaceutical and healthcare information solutions). In addition, Mr. Thomas serves as a member of the Board of Directors of Fortune Brands, Inc. (consumer products), and Interpublic Group of Companies, Inc. (marketing communication, 2004-present). |
Michael E. Wiley (60) |
| Year of Election or Appointment: 2008 Mr. Wiley also serves as a Director of Asia Pacific Exploration Consolidated (international oil and gas exploration and production, 2008-present). Mr. Wiley serves as a Director of Tesoro Corporation (independent oil refiner and marketer, 2005-present), and a Director of Bill Barrett Corporation (exploration and production, 2005-present). In addition, Mr. Wiley also serves as a Director of Post Oak Bank (privately-held bank, 2004-present). Previously, Mr. Wiley served as a member of the Board of Trustees of the University of Tulsa (2000-2006; 2007-2010), as a Senior Energy Advisor of Katzenbach Partners, LLC (consulting, 2006-2007), as an Advisory Director of Riverstone Holdings (private investment), Chairman, President, and CEO of Baker Hughes, Inc. (oilfield services, 2000-2004), and as Director of Spinnaker Exploration Company (exploration and production, 2001-2005). |
Annual Report
+ The information above includes each Trustee's principal occupation during the last five years and other information relating to the experience, attributes, and skills relevant to each Trustee's qualifications to serve as a Trustee, which led to the conclusion that each Trustee should serve as a Trustee for each fund.
Advisory Board Member and Executive Officers:
Correspondence intended for each executive officer and Peter S. Lynch may be sent to Fidelity Investments, 82 Devonshire Street, Boston, Massachusetts 02109.
Name, Age; Principal Occupation |
Peter S. Lynch (66) |
| Year of Election or Appointment: 2003 Member of the Advisory Board of Fidelity's Equity and High Income Funds. Mr. Lynch is Vice Chairman and a Director of FMR and FMR Co., Inc. In addition, Mr. Lynch serves as a Trustee of Boston College and as the Chairman of the Inner-City Scholarship Fund. Previously, Mr. Lynch served on the Special Olympics International Board of Directors (1997-2006). |
Kenneth B. Robins (41) |
| Year of Election or Appointment: 2008 President and Treasurer of Fidelity's Equity and High Income Funds. Mr. Robins also serves as President and Treasurer (2010-present) and Assistant Treasurer (2009-present) of other Fidelity funds and is an employee of Fidelity Investments (2004-present). Previously, Mr. Robins served as Deputy Treasurer of the Fidelity funds (2005-2008) and Treasurer and Chief Financial Officer of The North Carolina Capital Management Trust: Cash and Term Portfolios (2006-2008). |
Bruce T. Herring (45) |
| Year of Election or Appointment: 2006 Vice President of certain Equity Funds. Mr. Herring also serves as Chief Investment Officer and Director of Fidelity Management & Research (U.K.) Inc. (2010-present) and Group Chief Investments Officer of FMR. Previously, Mr. Herring served as Vice President (2005-2006) and Senior Vice President (2006-2007) of Fidelity Management & Research Company, Vice President of FMR Co., Inc. (2001-2007) and as a portfolio manager for Fidelity U.S. Equity Funds. |
Brian B. Hogan (46) |
| Year of Election or Appointment: 2009 Vice President of certain Equity Funds and Vice President of Sector Funds. Mr. Hogan also serves as President of FMR's Equity Division (2009-present). Previously, Mr. Hogan served as Senior Vice President, Equity Research of FMR (2006-2009) and as a portfolio manager. |
Thomas C. Hense (46) |
| Year of Election or Appointment: 2008 or 2010 Vice President of Fidelity's High Income (2008), Small Cap (2008), and Value (2010) Funds. Previously, Mr. Hense served as a portfolio manager for Fidelity's Institutional Money Management Group (Pyramis) (2003-2008). |
Scott C. Goebel (42) |
| Year of Election or Appointment: 2008 Secretary and Chief Legal Officer (CLO) of the Fidelity funds. Mr. Goebel also serves as Secretary and CLO of The North Carolina Capital Management Trust: Cash and Term Portfolio (2008-present); General Counsel, Secretary, and Senior Vice President of FMR (2008-present) and FMR Co., Inc. (2008-present); Deputy General Counsel of FMR LLC; Chief Legal Officer of Fidelity Management & Research (Hong Kong) Limited (2008-present) and Assistant Secretary of Fidelity Management & Research (Japan) Inc. (2008-present), Fidelity Investments Money Management, Inc. (2008-present), Fidelity Management & Research (U.K.) Inc. (2008-present), and Fidelity Research and Analysis Company (2008-present). Previously, Mr. Goebel served as Assistant Secretary of the Funds (2007-2008) and as Vice President and Secretary of Fidelity Distributors Corporation (FDC) (2005-2007). |
William C. Coffey (41) |
| Year of Election or Appointment: 2009 Assistant Secretary of Fidelity's Equity and High Income Funds. Mr. Coffey also serves as Senior Vice President and Deputy General Counsel of FMR LLC (2010-present), and is an employee of Fidelity Investments. Previously, Mr. Coffey served as Vice President and Associate General Counsel of FMR LLC (2005-2009). |
Holly C. Laurent (56) |
| Year of Election or Appointment: 2008 Anti-Money Laundering (AML) Officer of the Fidelity funds. Ms. Laurent also serves as AML Officer of The North Carolina Capital Management Trust: Cash and Term Portfolio (2008-present) and is an employee of Fidelity Investments. Previously, Ms. Laurent was Senior Vice President and Head of Legal for Fidelity Business Services India Pvt. Ltd. (2006-
2008), and Senior Vice President, Deputy General Counsel and Group Head for FMR LLC (2005-2006). |
Christine Reynolds (52) |
| Year of Election or Appointment: 2008 Chief Financial Officer of the Fidelity funds. Ms. Reynolds became President of Fidelity Pricing and Cash Management Services (FPCMS) in August 2008. Ms. Reynolds served as Chief Operating Officer of FPCMS (2007-2008). Previously, Ms. Reynolds served as President, Treasurer, and Anti-Money Laundering officer of the Fidelity funds (2004-2007). |
Kenneth A. Rathgeber (63) |
| Year of Election or Appointment: 2004 Chief Compliance Officer of Fidelity's Equity and High Income Funds. Mr. Rathgeber is Chief Compliance Officer of Fidelity Management & Research (Hong Kong) Limited (2008-present), Fidelity Management & Research (Japan) Inc. (2008-present), FMR (2005-present), FMR Co., Inc. (2005-present), Fidelity Management & Research (U.K.) Inc. (2005-
present), Fidelity Research & Analysis Company (2005-present), Fidelity Investments Money Management, Inc. (2005-present), Pyramis Global Advisors, LLC (2005-present), and Strategic Advisers, Inc.
(2005-present). |
Jeffrey S. Christian (49) |
| Year of Election or Appointment: 2009 Deputy Treasurer of the Fidelity funds. Mr. Christian is an employee of Fidelity Investments. Previously, Mr. Christian served as Chief Financial Officer (2008-2009) of certain Fidelity funds and Senior Vice President of Fidelity Pricing and Cash Management Services (FPCMS) (2004-2009). |
Bryan A. Mehrmann (49) |
| Year of Election or Appointment: 2005 Deputy Treasurer of the Fidelity funds. Mr. Mehrmann is an employee of Fidelity Investments. |
Adrien E. Deberghes (43) |
| Year of Election or Appointment: 2008 Deputy Treasurer of Fidelity's Equity and High Income Funds. Mr. Deberghes also serves as Assistant Treasurer of other Fidelity funds (2010-present) and is an employee of Fidelity Investments (2008-
present). Previously, Mr. Deberghes served as Senior Vice President of Mutual Fund Administration at State Street Corporation (2007-2008), Senior Director of Mutual Fund Administration at Investors Bank & Trust (2005-2007), and Director of Finance for Dunkin' Brands (2000-2005). |
Name, Age; Principal Occupation |
Stephanie J. Dorsey (41) |
| Year of Election or Appointment: 2010 Assistant Treasurer of Fidelity's Equity and High Income Funds. Ms. Dorsey also serves as Deputy Treasurer of other Fidelity funds (2008-
present) and is an employee of Fidelity Investments (2008-present). Previously, Ms. Dorsey served as Treasurer (2004-2008) of the JPMorgan Mutual Funds and Vice President (2004-2008) of JPMorgan Chase Bank. |
John R. Hebble (52) |
| Year of Election or Appointment: 2009 Assistant Treasurer of Fidelity's Equity and High Income Funds. Mr. Hebble also serves as Treasurer and Chief Financial Officer of The North Carolina Capital Management Trust: Cash and Term Portfolio (2008-present), President and Treasurer of other Fidelity funds (2008-present) and is an employee of Fidelity Investments. |
Gary W. Ryan (52) |
| Year of Election or Appointment: 2005 Assistant Treasurer of the Fidelity funds. Mr. Ryan is an employee of Fidelity Investments. Previously, Mr. Ryan served as Vice President of Fund Reporting in Fidelity Pricing and Cash Management Services (FPCMS) (1999-2005). |
Jonathan Davis (42) |
| Year of Election or Appointment: 2010 Assistant Treasurer of the Fidelity funds. Mr. Davis is an employee of Fidelity Investments. Previously, Mr. Davis served as Vice President and Associate General Counsel of FMR LLC (2003-2010). |
Annual Report
The Board of Trustees of each voted to pay to shareholders of record at the opening of business on record date, the following distributions per share derived from capital gains realized from sales of portfolio securities, and dividends derived from net investment income:
| Pay Date | Record Date | Dividends | Capital Gains |
Series International Growth Fund | 12/13/10 | 12/10/10 | $0.037 | $0.010 |
Class F | 12/13/10 | 12/10/10 | $0.046 | $0.010 |
Series International Value Fund | 12/13/10 | 12/10/10 | $0.086 | $0.037 |
Class F | 12/13/10 | 12/10/10 | $0.097 | $0.037 |
Series International Small Cap Fund | 12/13/10 | 12/10/10 | $0.025 | $0.070 |
Class F | 12/13/10 | 12/10/10 | $0.038 | $0.070 |
The fund will notify shareholders in January 2011 of amounts for use in preparing 2010 income tax returns.
Annual Report
Investment Adviser
Fidelity Management & Research Company
Boston, MA
Investment Sub-Advisers
FMR Co., Inc.
Fidelity Management & Research (U.K.) Inc.
Fidelity Research & Analysis Company
FIL Investments (Japan) Limited
Fidelity Management & Research (Hong Kong) Limited
Fidelity Management & Research (Japan) Inc.
FIL Investment Advisors
FIL Investment Advisors (U.K.) Ltd.
General Distributor
Fidelity Distributors Corporation
Boston, MA
Transfer and Service Agents
Fidelity Investments Institutional Operations Company, Inc.
Boston, MA
Fidelity Service Company, Inc.
Boston, MA
Custodian
State Street Bank and Trust Company
Quincy, MA
GSV-S-ANN-1210
1.907943.100
Fidelity®
Total International Equity Fund
Annual Report
October 31, 2010
(2_fidelity_logos) (Registered_Trademark)
Contents
Chairman's Message | <Click Here> | The Chairman's message to shareholders. |
Performance | <Click Here> | How the fund has done over time. |
Management's Discussion of Fund Performance | <Click Here> | The Portfolio Managers' review of fund performance and strategy. |
Shareholder Expense Example | <Click Here> | An example of shareholder expenses. |
Investment Changes | <Click Here> | A summary of major shifts in the fund's investments over the past six months. |
Investments | <Click Here> | A complete list of the fund's investments with their market values. |
Financial Statements | <Click Here> | Statements of assets and liabilities, operations, and changes in net assets, as well as financial highlights. |
Notes | <Click Here> | Notes to financial statements. |
Report of Independent Registered Public Accounting Firm | <Click Here> | |
Trustees and Officers | <Click Here> | |
Distributions | <Click Here> | |
Board Approval of Investment Advisory Contracts and Management Fees | <Click Here> | |
To view a fund's proxy voting guidelines and proxy voting record for the 12-month period ended June 30, visit http://www.fidelity.com/proxyvotingresults or visit the Securities and Exchange Commission's (SEC) web site at http://www.sec.gov. You may also call 1-800-544-8544 to request a free copy of the proxy voting guidelines.
Standard & Poor's, S&P and S&P 500 are registered service marks of The McGraw-Hill Companies, Inc. and have been licensed for use by Fidelity Distributors Corporation.
Other third party marks appearing herein are the property of their respective owners.
All other marks appearing herein are registered or unregistered trademarks or service marks of FMR LLC or an affiliated company.
Annual Report
This report and the financial statements contained herein are submitted for the general information of the shareholders of the fund. This report is not authorized for distribution to prospective investors in the fund unless preceded or accompanied by an effective prospectus.
A fund files its complete schedule of portfolio holdings with the SEC for the first and third quarters of each fiscal year on Form N-Q. Forms N-Q are available on the SEC's web site at http://www.sec.gov. A fund's Forms N-Q may be reviewed and copied at the SEC's Public Reference Room in Washington, DC. Information regarding the operation of the SEC's Public Reference Room may be obtained by calling 1-800-SEC-0330. For a complete list of a fund's portfolio holdings, view the most recent holdings listing, semiannual report, or annual report on Fidelity's web site at http://www.fidelity.com or http://www.advisor.fidelity.com, as applicable.
NOT FDIC INSURED • MAY LOSE VALUE • NO BANK GUARANTEE
Neither the fund nor Fidelity Distributors Corporation is a bank.
Annual Report
(photo_of_Edward_C_Johnson_3d)
Dear Shareholder:
Equities have staged a rally in the second half of 2010, shaking off concerns about the European debt crisis and the possibility of a double-dip recession in the U.S. Although the short-term surge pushed major equity indexes back into positive territory for the year, several questions remain about the longer-term outlook, including lackluster economic growth and persistently high unemployment. Financial markets are always unpredictable, of course, but there also are several time-tested investment principles that can help put the odds in your favor.
One of the basic tenets is to invest for the long term. Over time, riding out the markets' inevitable ups and downs has proven much more effective than selling into panic or chasing the hottest trend. Even missing only a few of the markets' best days can significantly diminish investor returns. Patience also affords the benefits of compounding - of earning interest on additional income or reinvested dividends and capital gains. There can be tax advantages and cost benefits to consider as well. While staying the course doesn't eliminate risk, it can considerably lessen the effect of short-term declines.
You can further manage your investing risk through diversification. And today, more than ever, geographic diversification should be taken into account. Studies indicate that asset allocation is the single most important determinant of a portfolio's long-term success. The right mix of stocks, bonds and cash - aligned to your particular risk tolerance and investment objective - is very important. Age-appropriate rebalancing is also an essential aspect of asset allocation. For younger investors, an emphasis on equities - which historically have been the best-performing asset class over time - is encouraged. As investors near their specific goal, such as retirement or sending a child to college, consideration may be given to replacing volatile assets (e.g. common stocks) with more-stable fixed investments (bonds or savings plans).
A third principle - investing regularly - can help lower the average cost of your purchases. Investing a certain amount of money each month or quarter helps ensure you won't pay for all your shares at market highs. This strategy - known as dollar cost averaging - also reduces "emotion" from investing, helping shareholders avoid selling weak performers just prior to an upswing, or chasing a hot performer just before a correction.
We invite you to contact us via the Internet, through our Investor Centers or by phone. It is our privilege to provide you the information you need to make the investments that are right for you.
Sincerely,
(The chairman's signature appears here.)
Edward C. Johnson 3d
Annual Report
Average annual total return reflects the change in the value of an investment, assuming reinvestment of the class' distributions from dividend income and capital gains (the profits earned upon the sale of securities that have grown in value, if any) and assuming a constant rate of performance each year. The $10,000 table and the fund's returns do not reflect the deduction of taxes that a shareholder would pay on fund distributions or the redemption of fund shares. During periods of reimbursement by Fidelity, a fund's total return will be greater than it would be had the reimbursement not occurred. How a fund did yesterday is no guarantee of how it will do tomorrow.
Average Annual Total Returns
Periods ended October 31, 2010 | Past 1
year | Life of
fund A |
Fidelity Total International Equity Fund | 16.45% | -8.43% |
A From November 1, 2007.
$10,000 Over Life of Fund
Let's say hypothetically that $10,000 was invested in Fidelity Total International Equity Fund, a class of the fund, on November 1, 2007, when the fund started. The chart shows how the value of your investment would have changed, and also shows how the MSCI® ACWI® (All Country World Index) ex USA Index performed over the same period.
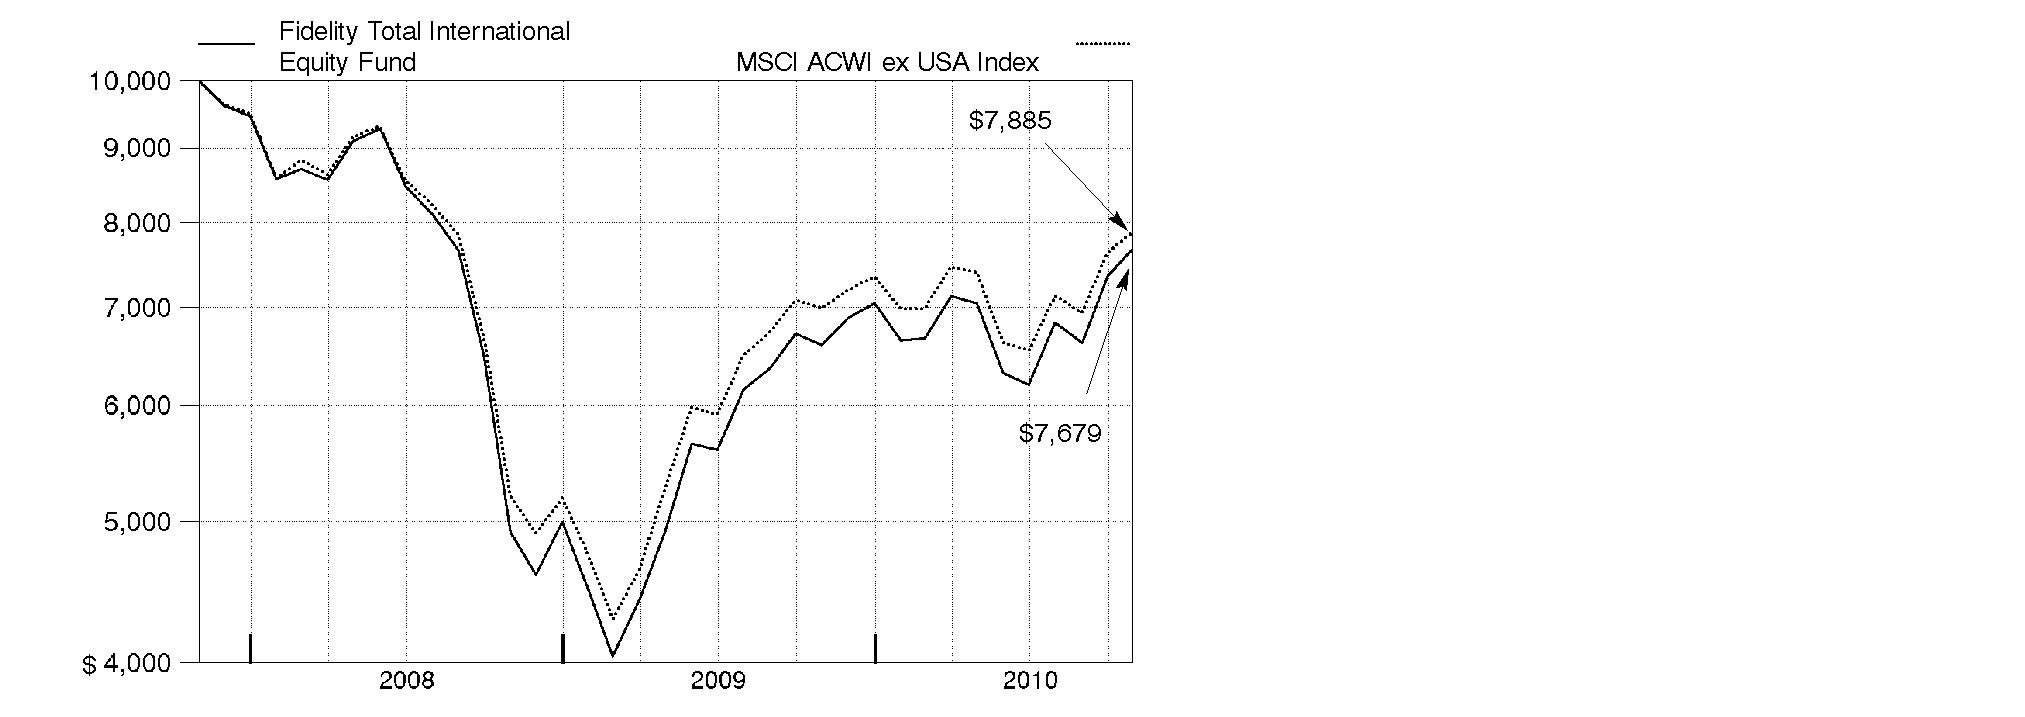
Annual Report
Market Recap: International stocks rode a wave of volatility similar to that of their U.S. counterparts during the 12 months ending October 31, 2010. Stocks gained modestly in the first half of the period, despite growing concerns about the European debt crisis. Sentiment turned decidedly negative in May and June, however, and the market suffered a precipitous decline. These losses were more than offset during the last four months of the period, when signs of economic growth and subsiding debt fears helped propel international stocks about 21%. For the full year, the MSCI® ACWI® (All Country World Index) ex USA Index gained 12.76%, boosted in part by a generally depreciating U.S. dollar. Within the index, Canada and emerging markets were standouts, returning 23% and 24%, respectively. Results in the latter group were led by strong-performing India, Mexico and South Africa, while China fell short of the MSCI benchmark due to cooling economic growth. The developed Asia ex Japan segment rose 16% for the period, lifted by solid results from Singapore and Hong Kong. Meanwhile, Europe rose just 9%, held back mainly by debt-riddled Spain and Italy, as well as lagging major constituent France. Japan returned only 5%, a result of that nation's continued weak economy.
Comments from Jed Weiss and George Stairs, Co-Portfolio Managers of Fidelity® Total International Equity Fund: For the year, the fund's Retail Class shares rose 16.45%, solidly outpacing the MSCI ACWI ex USA index. Stock picking was most favorable in financials - especially among banks - and in the consumer discretionary group, with positive results also coming from information technology, consumer staples and energy. The only material detractor was telecommunication services. Geographically, the fund's allocation in emerging markets was the biggest positive. Specifically, stock picking was strong in Brazil, China and South Africa, while overweightings in Turkey and Indonesia also were helpful. Additionally, successful positioning in Japan contributed. In Europe, good security selection in the U.K., Belgium and Finland outweighed weakness in France and Switzerland, while elsewhere, the fund's stake in global U.S. companies proved beneficial. Top individual contributors included Danish health care company Novo Nordisk, U.S.-listed and Sweden-based auto-safety equipment manufacturer Autoliv, Turkish bank Turkiye Garanti Bankasi, U.K.-based mining company Rio Tinto and South African retailer Mr Price Group. Autoliv and Mr Price Group were not in the index. In contrast, the biggest detractors were French insurance company AXA, Swiss drug maker Roche Holding and Spanish telecommunications provider Telefonica.
The views expressed above reflect those of the portfolio manager(s) only through the end of the period as stated on the cover of this report and do not necessarily represent the views of Fidelity or any other person in the Fidelity organization. Any such views are subject to change at any time based upon market or other conditions and Fidelity disclaims any responsibility to update such views. These views may not be relied on as investment advice and, because investment decisions for a Fidelity fund are based on numerous factors, may not be relied on as an indication of trading intent on behalf of any Fidelity fund.
Annual Report
Shareholder Expense Example
As a shareholder of the Fund, you incur two types of costs: (1) transaction costs, including sales charges (loads) on purchase payments or redemption proceeds, redemption fees, and (2) ongoing costs, including management fees, distribution and/or service (12b-1) fees and other Fund expenses. This Example is intended to help you understand your ongoing costs (in dollars) of investing in the Fund and to compare these costs with the ongoing costs of investing in other mutual funds.
The Example is based on an investment of $1,000 invested at the beginning of the period and held for the entire period (May 1, 2010 to October 31, 2010).
Actual Expenses
The first line of the accompanying table for each class of the Fund provides information about actual account values and actual expenses. You may use the information in this line, together with the amount you invested, to estimate the expenses that you paid over the period. Simply divide your account value by $1,000.00 (for example, an $8,600 account value divided by $1,000.00 = 8.6), then multiply the result by the number in the first line for a class of the Fund under the heading entitled "Expenses Paid During Period" to estimate the expenses you paid on your account during this period. A small balance maintenance fee of $12.00 that is charged once a year may apply for certain accounts with a value of less than $2,000. This fee is not included in the table below. If it was, the estimate of expenses you paid during the period would be higher, and your ending account value lower, by this amount. In addition, the Fund, as a shareholder in the underlying Fidelity Central Funds, will indirectly bear its pro-rata share of the fees and expenses incurred by the underlying Fidelity Central Funds. These fees and expenses are not included in the Fund's annualized expense ratio used to calculate the expense estimate in the table below.
Hypothetical Example for Comparison Purposes
The second line of the accompanying table for each class of the Fund provides information about hypothetical account values and hypothetical expenses based on a Class' actual expense ratio and an assumed rate of return of 5% per year before expenses, which is not the Class' actual return. The hypothetical account values and expenses may not be used to estimate the actual ending account balance or expenses you paid for the period. You may use this information to compare the ongoing costs of investing in the Fund and other funds. To do so, compare this 5% hypothetical example with the 5% hypothetical examples that appear in the shareholder reports of the other funds. A small balance maintenance fee of $12.00 that is charged once a year may apply for certain accounts with a value of less than $2,000. This fee is not included in the table below. If it was, the estimate of expenses you paid during the period would be higher, and your ending account value lower, by this amount. In addition, the Fund, as a shareholder in the underlying Fidelity Central Funds, will indirectly bear its pro-rata share of the fees and expenses incurred by the underlying Fidelity Central Funds. These fees and expenses are not included in the Fund's annualized expense ratio used to calculate the expense estimate in the table below.
Annual Report
Shareholder Expense Example - continued
Please note that the expenses shown in the table are meant to highlight your ongoing costs only and do not reflect any transaction costs. Therefore, the second line of the table is useful in comparing ongoing costs only, and will not help you determine the relative total costs of owning different funds. In addition, if these transactional costs were included, your costs would have been higher.
| Annualized
Expense Ratio | Beginning
Account Value
May 1, 2010 | Ending
Account Value
October 31, 2010 | Expenses Paid
During Period*
May 1, 2010 to
October 31, 2010 |
Class A | 1.50%** | | | |
Actual | | $ 1,000.00 | $ 1,088.80 | $ 7.90** |
HypotheticalA | | $ 1,000.00 | $ 1,017.64 | $ 7.63** |
Class T | 1.75%** | | | |
Actual | | $ 1,000.00 | $ 1,086.50 | $ 9.20** |
HypotheticalA | | $ 1,000.00 | $ 1,016.38 | $ 8.89** |
Class B | 2.25%** | | | |
Actual | | $ 1,000.00 | $ 1,085.40 | $ 11.83** |
HypotheticalA | | $ 1,000.00 | $ 1,013.86 | $ 11.42** |
Class C | 2.25%** | | | |
Actual | | $ 1,000.00 | $ 1,085.50 | $ 11.83** |
HypotheticalA | | $ 1,000.00 | $ 1,013.86 | $ 11.42** |
Total International Equity | 1.25%** | | | |
Actual | | $ 1,000.00 | $ 1,090.20 | $ 6.59** |
HypotheticalA | | $ 1,000.00 | $ 1,018.90 | $ 6.36** |
Institutional Class | 1.25%** | | | |
Actual | | $ 1,000.00 | $ 1,090.50 | $ 6.59** |
HypotheticalA | | $ 1,000.00 | $ 1,018.90 | $ 6.36** |
A 5% return per year before expenses
* Expenses are equal to each Class' annualized expense ratio, multiplied by the average account value over the period, multiplied by 184/365 (to reflect the one-half year period).
Annual Report
** If changes to voluntary expense limitations, effective November 1, 2010, had been in effect during the entire period, the annualized expense ratios and the expenses paid in the actual and hypothetical examples above would have been as follows:
| Annualized
Expense Ratio | Expenses
Paid |
Class A | 1.45% | |
Actual | | $ 7.63 |
HypotheticalA | | $ 7.38 |
Class T | 1.70% | |
Actual | | $ 8.94 |
HypotheticalA | | $ 8.64 |
Class B | 2.20% | |
Actual | | $ 11.57 |
HypotheticalA | | $ 11.17 |
Class C | 2.20% | |
Actual | | $ 11.57 |
HypotheticalA | | $ 11.17 |
Total International Equity | 1.20% | |
Actual | | $ 6.32 |
HypotheticalA | | $ 6.11 |
Institutional Class | 1.20% | |
Actual | | $ 6.32 |
HypotheticalA | | $ 6.11 |
A 5% return per year before expenses
Annual Report
Investment Changes (Unaudited)
Geographic Diversification (% of fund's net assets) |
As of October 31, 2010 |
| United Kingdom 15.7% | |
| Japan 11.0% | |
| United States of America 7.2% | |
| Switzerland 6.4% | |
| France 5.4% | |
| Brazil 4.5% | |
| Germany 4.4% | |
| Spain 3.2% | |
| Australia 3.1% | |
| Other 39.1% | |

Percentages are adjusted for the effect of futures contracts, if applicable. |
As of April 30, 2010 |
| United Kingdom 15.8% | |
| Japan 12.4% | |
| Switzerland 7.1% | |
| United States of America 6.2% | |
| France 5.4% | |
| Brazil 4.5% | |
| Germany 4.2% | |
| Australia 3.0% | |
| Canada 3.0% | |
| Other 38.4% | |

Percentages are adjusted for the effect of futures contracts, if applicable. |
Asset Allocation |
| % of fund's
net assets | % of fund's net assets
6 months ago |
Stocks and Investment Companies | 97.8 | 98.0 |
Short-Term Investments and Net Other Assets | 2.2 | 2.0 |
Top Ten Stocks as of October 31, 2010 |
| % of fund's
net assets | % of fund's net assets
6 months ago |
Nestle SA (Switzerland, Food Products) | 1.7 | 1.5 |
BHP Billiton PLC ADR (United Kingdom, Metals & Mining) | 1.7 | 1.3 |
Roche Holding AG (participation certificate) (Switzerland, Pharmaceuticals) | 1.6 | 2.1 |
Royal Dutch Shell PLC Class A sponsored ADR (United Kingdom, Oil, Gas & Consumable Fuels) | 1.5 | 1.5 |
Rio Tinto PLC (United Kingdom, Metals & Mining) | 1.1 | 1.3 |
Anheuser-Busch InBev SA NV (Belgium, Beverages) | 1.1 | 1.0 |
HSBC Holdings PLC (United Kingdom, Commercial Banks) | 1.1 | 1.0 |
Novo Nordisk AS Series B (Denmark, Pharmaceuticals) | 0.9 | 0.8 |
Anglo American PLC (United Kingdom) (United Kingdom, Metals & Mining) | 0.8 | 0.8 |
Mitsui & Co. Ltd. (Japan, Trading Companies & Distributors) | 0.8 | 0.8 |
| 12.3 | |
Market Sectors as of October 31, 2010 |
| % of fund's
net assets | % of fund's net assets
6 months ago |
Financials | 25.6 | 25.3 |
Materials | 12.3 | 12.4 |
Consumer Discretionary | 11.6 | 11.7 |
Industrials | 10.0 | 9.2 |
Consumer Staples | 8.9 | 9.0 |
Energy | 8.8 | 8.5 |
Information Technology | 7.0 | 7.1 |
Health Care | 6.3 | 7.0 |
Telecommunication Services | 4.1 | 4.5 |
Utilities | 2.7 | 3.1 |
Annual Report
Investments October 31, 2010
Showing Percentage of Net Assets
Common Stocks - 96.9% |
| Shares | | Value |
Argentina - 0.1% |
Banco Macro SA sponsored ADR | 1,200 | | $ 59,820 |
Australia - 3.1% |
Commonwealth Bank of Australia | 1,288 | | 61,701 |
CSL Ltd. | 9,386 | | 301,872 |
Leighton Holdings Ltd. | 7,429 | | 267,096 |
Macquarie Group Ltd. | 7,610 | | 269,876 |
MAp Group unit | 26,561 | | 79,362 |
Newcrest Mining Ltd. | 633 | | 24,780 |
Newcrest Mining Ltd. sponsored ADR | 5,384 | | 212,130 |
OZ Minerals Ltd. | 108,330 | | 166,086 |
Wesfarmers Ltd. | 2,954 | | 95,903 |
Westfield Group unit | 18,847 | | 228,578 |
Woolworths Ltd. | 9,477 | | 263,205 |
Worleyparsons Ltd. | 6,016 | | 135,258 |
TOTAL AUSTRALIA | | 2,105,847 |
Austria - 0.3% |
Andritz AG | 1,840 | | 140,917 |
Erste Bank AG | 700 | | 31,587 |
TOTAL AUSTRIA | | 172,504 |
Bahamas (Nassau) - 0.0% |
Petrominerales Ltd. | 700 | | 17,934 |
Bailiwick of Guernsey - 0.3% |
Resolution Ltd. | 40,466 | | 169,797 |
Bailiwick of Jersey - 1.0% |
Heritage Oil PLC | 3,830 | | 21,139 |
Informa PLC | 31,795 | | 222,100 |
Randgold Resources Ltd. sponsored ADR | 2,080 | | 195,354 |
United Business Media Ltd. | 15,200 | | 160,241 |
West China Cement Ltd. (a) | 36,000 | | 13,933 |
WPP PLC | 7,668 | | 89,098 |
TOTAL BAILIWICK OF JERSEY | | 701,865 |
Belgium - 1.4% |
Anheuser-Busch InBev SA NV | 12,136 | | 760,490 |
Gimv NV | 350 | | 19,349 |
Umicore SA | 4,521 | | 212,753 |
TOTAL BELGIUM | | 992,592 |
Common Stocks - continued |
| Shares | | Value |
Bermuda - 1.4% |
Aquarius Platinum Ltd.: | | | |
(Australia) | 10,047 | | $ 57,776 |
(United Kingdom) | 3,600 | | 20,781 |
China Yurun Food Group Ltd. | 13,000 | | 50,566 |
CNPC (Hong Kong) Ltd. | 38,000 | | 48,338 |
Credicorp Ltd. (NY Shares) | 200 | | 25,176 |
Great Eagle Holdings Ltd. | 7,000 | | 20,951 |
Jinhui Shipping & Transportation Ltd. (a) | 1,197 | | 4,760 |
Lazard Ltd. Class A | 2,800 | | 103,320 |
Orient Overseas International Ltd. | 7,000 | | 61,364 |
Seadrill Ltd. (d) | 12,000 | | 363,320 |
Sinofert Holdings Ltd. (a) | 38,000 | | 20,100 |
Texwinca Holdings Ltd. | 16,000 | | 17,463 |
Trinity Ltd. | 78,000 | | 77,987 |
VimpelCom Ltd. ADR (a) | 4,300 | | 65,919 |
TOTAL BERMUDA | | 937,821 |
Brazil - 4.5% |
AES Tiete SA (PN) (non-vtg.) | 1,700 | | 23,433 |
Banco ABC Brasil SA | 14,100 | | 138,911 |
Banco Bradesco SA (PN) sponsored ADR | 10,500 | | 218,400 |
Banco do Brasil SA | 12,611 | | 245,370 |
Banco do Estado do Rio Grande do Sul SA | 1,200 | | 13,184 |
Banco Santander (Brasil) SA ADR | 6,800 | | 97,920 |
BM&F Bovespa SA | 19,700 | | 165,016 |
BR Malls Participacoes SA | 8,800 | | 84,058 |
Brascan Residential Properties SA | 2,000 | | 10,886 |
Braskem SA Class A sponsored ADR | 11,730 | | 244,571 |
Companhia de Bebidas das Americas (AmBev) (PN) sponsored ADR | 600 | | 83,544 |
Companhia Siderurgica Nacional SA (CSN) sponsored ADR | 5,700 | | 96,216 |
Confab Industrial SA (PN) (non-vtg.) | 2,000 | | 7,230 |
Cyrela Brazil Realty SA | 5,300 | | 73,213 |
Drogasil SA | 800 | | 20,235 |
Eletropaulo Metropolitana SA (PN-B) | 900 | | 15,712 |
Estacio Participacoes SA | 900 | | 13,443 |
Even Construtora e Incorporadora SA | 1,500 | | 8,535 |
Fibria Celulose SA sponsored ADR (a) | 3,157 | | 56,700 |
Fleury SA | 900 | | 11,639 |
Gafisa SA sponsored ADR | 3,930 | | 65,985 |
Iguatemi Empresa de Shopping Centers SA | 2,800 | | 65,342 |
Itau Unibanco Banco Multiplo SA ADR | 6,927 | | 170,127 |
Common Stocks - continued |
| Shares | | Value |
Brazil - continued |
Light SA | 1,700 | | $ 21,405 |
Localiza Rent A Car SA | 2,800 | | 46,332 |
Lojas Renner SA | 1,600 | | 63,202 |
Multiplan Empreendimentos Imobiliarios SA | 3,400 | | 77,945 |
Natura Cosmeticos SA | 1,800 | | 51,528 |
Odontoprev SA | 1,200 | | 17,635 |
OGX Petroleo e Gas Participacoes SA (a) | 9,500 | | 124,641 |
PDG Realty SA Empreendimentos e Participacoes | 4,900 | | 61,264 |
Petroleo Brasileiro SA - Petrobras: | | | |
(ON) sponsored ADR | 4,500 | | 153,540 |
(PN) sponsored ADR (non-vtg.) | 4,700 | | 146,593 |
TIM Participacoes SA sponsored ADR (non-vtg.) | 1,400 | | 45,164 |
Vale SA (PN-A) sponsored ADR | 8,000 | | 229,840 |
Vivo Participacoes SA sponsored ADR | 4,700 | | 134,608 |
Weg SA | 1,100 | | 14,206 |
TOTAL BRAZIL | | 3,117,573 |
Canada - 2.5% |
Agnico-Eagle Mines Ltd. (Canada) | 2,090 | | 162,093 |
Eldorado Gold Corp. | 3,900 | | 66,039 |
Fairfax Financial Holdings Ltd. (sub. vtg.) | 165 | | 67,493 |
First Quantum Minerals Ltd. | 800 | | 70,054 |
Goldcorp, Inc. | 1,400 | | 62,512 |
Niko Resources Ltd. | 2,660 | | 253,768 |
Open Text Corp. (a) | 3,900 | | 172,535 |
Pacific Rubiales Energy Corp. (a) | 400 | | 12,750 |
Pan American Silver Corp. | 3,500 | | 111,720 |
Petrobank Energy & Resources Ltd. (a) | 6,400 | | 254,707 |
Power Corp. of Canada (sub. vtg.) | 2,900 | | 80,924 |
Quadra FNX Mining Ltd. (a) | 600 | | 8,471 |
Sherritt International Corp. | 1,600 | | 12,440 |
Suncor Energy, Inc. | 3,500 | | 112,148 |
Toronto-Dominion Bank | 3,500 | | 252,059 |
Uranium One, Inc. (a) | 9,500 | | 38,842 |
TOTAL CANADA | | 1,738,555 |
Cayman Islands - 1.2% |
3SBio, Inc. sponsored ADR (a) | 1,200 | | 18,060 |
Alibaba.com Ltd. (a) | 32,500 | | 63,480 |
China High Speed Transmission Equipment Group Co. Ltd. | 26,000 | | 53,132 |
China Lilang Ltd. | 51,000 | | 79,745 |
China Shanshui Cement Group Ltd. | 49,000 | | 34,895 |
Common Stocks - continued |
| Shares | | Value |
Cayman Islands - continued |
Daphne International Holdings Ltd. | 36,000 | | $ 40,221 |
Eurasia Drilling Co. Ltd.: | | | |
GDR (e) | 400 | | 10,200 |
GDR (Reg. S) | 2,400 | | 61,200 |
Geely Automobile Holdings Ltd. | 65,000 | | 36,646 |
Hengdeli Holdings Ltd. | 206,000 | | 114,278 |
Hidili Industry International Development Ltd. | 33,000 | | 35,166 |
International Mining Machinery Holdings Ltd. | 26,000 | | 22,642 |
Kingboard Chemical Holdings Ltd. | 11,000 | | 53,501 |
Kingboard Chemical Holdings Ltd. warrants 10/31/12 (a) | 600 | | 344 |
Shenguan Holdings Group Ltd. | 10,000 | | 13,030 |
Trina Solar Ltd. ADR (a) | 800 | | 21,408 |
Vantage Drilling Co. (a) | 5,500 | | 9,460 |
Wynn Macau Ltd. | 64,000 | | 141,520 |
TOTAL CAYMAN ISLANDS | | 808,928 |
Chile - 0.2% |
Banco Santander Chile sponsored ADR | 1,400 | | 129,696 |
China - 2.1% |
Anhui Expressway Co. Ltd. (H Shares) | 16,000 | | 12,179 |
Baidu.com, Inc. sponsored ADR (a) | 1,800 | | 198,018 |
China Communications Services Corp. Ltd. (H Shares) | 36,000 | | 20,993 |
China Construction Bank Corp. (H Shares) | 155,000 | | 147,776 |
China Hongxing Sports Ltd. | 33,000 | | 4,462 |
China Merchants Bank Co. Ltd. (H Shares) | 84,383 | | 239,500 |
China Minsheng Banking Corp. Ltd. (H Shares) | 31,500 | | 29,300 |
China Suntien Green Energy Corp. Ltd. (H Shares) | 2,000 | | 673 |
Digital China Holdings Ltd. (H Shares) | 9,000 | | 16,255 |
Golden Eagle Retail Group Ltd. (H Shares) | 21,000 | | 55,810 |
Harbin Power Equipment Co. Ltd. (H Shares) | 28,000 | | 37,713 |
Industrial & Commercial Bank of China Ltd. (H Shares) | 411,000 | | 330,868 |
Minth Group Ltd. | 24,000 | | 44,896 |
Nine Dragons Paper (Holdings) Ltd. | 37,000 | | 59,668 |
Ping An Insurance Group Co. China Ltd. (H Shares) | 12,000 | | 129,192 |
Weichai Power Co. Ltd. (H Shares) | 2,000 | | 26,267 |
Yantai Changyu Pioneer Wine Co. (B Shares) | 4,890 | | 63,024 |
Zhaojin Mining Industry Co. Ltd. (H Shares) | 2,000 | | 6,218 |
TOTAL CHINA | | 1,422,812 |
Colombia - 0.1% |
Ecopetrol SA ADR | 1,400 | | 66,836 |
Common Stocks - continued |
| Shares | | Value |
Cyprus - 0.0% |
AFI Development PLC GDR (Reg. S) | 3,600 | | $ 4,248 |
Czech Republic - 0.1% |
Komercni Banka AS | 300 | | 68,070 |
Denmark - 1.3% |
Novo Nordisk AS: | | | |
Series B | 948 | | 99,523 |
Series B sponsored ADR | 4,800 | | 503,040 |
Vestas Wind Systems AS (a) | 4,295 | | 137,046 |
William Demant Holding AS (a) | 2,010 | | 150,663 |
TOTAL DENMARK | | 890,272 |
Egypt - 0.1% |
Commercial International Bank Ltd. sponsored GDR | 12,800 | | 97,920 |
Finland - 0.9% |
Metso Corp. | 3,600 | | 170,664 |
Nokian Tyres PLC | 6,502 | | 225,275 |
Outotec OYJ | 4,300 | | 200,678 |
TOTAL FINLAND | | 596,617 |
France - 5.4% |
Alstom SA | 3,947 | | 199,142 |
Atos Origin SA (a) | 1,272 | | 58,806 |
Audika SA | 1,000 | | 24,420 |
AXA SA sponsored ADR | 28,100 | | 512,263 |
BNP Paribas SA | 4,051 | | 296,212 |
Christian Dior SA | 700 | | 101,249 |
Compagnie de St. Gobain | 3,807 | | 177,776 |
Credit Agricole SA | 9,000 | | 147,459 |
Danone | 4,280 | | 270,822 |
Laurent-Perrier Group | 209 | | 23,553 |
PPR SA | 1,000 | | 163,913 |
Remy Cointreau SA | 1,952 | | 137,055 |
Safran SA | 7,114 | | 225,494 |
Saft Groupe SA | 629 | | 24,025 |
Sanofi-Aventis sponsored ADR | 6,400 | | 224,704 |
Schneider Electric SA | 957 | | 135,825 |
Societe Generale Series A | 6,910 | | 413,682 |
Total SA | 390 | | 21,224 |
Total SA sponsored ADR | 4,900 | | 266,952 |
Unibail-Rodamco | 1,121 | | 233,504 |
Common Stocks - continued |
| Shares | | Value |
France - continued |
Vetoquinol SA | 200 | | $ 8,477 |
Virbac SA | 100 | | 16,092 |
TOTAL FRANCE | | 3,682,649 |
Georgia - 0.0% |
Bank of Georgia unit (a) | 1,100 | | 18,139 |
Germany - 4.3% |
Allianz AG sponsored ADR | 7,300 | | 91,469 |
alstria office REIT-AG | 600 | | 8,357 |
BASF AG | 2,472 | | 179,826 |
Bayerische Motoren Werke AG (BMW) | 2,642 | | 189,362 |
Bilfinger Berger Se | 348 | | 25,339 |
Colonia Real Estate AG (a) | 2,981 | | 19,562 |
CTS Eventim AG | 431 | | 24,324 |
Daimler AG (United States) (a) | 4,700 | | 310,200 |
Deutsche Boerse AG | 1,650 | | 116,080 |
E.ON AG | 12,545 | | 392,754 |
Fielmann AG | 209 | | 21,098 |
HeidelbergCement AG | 3,700 | | 193,501 |
Linde AG | 2,496 | | 359,288 |
MAN SE | 1,266 | | 139,164 |
Metro AG | 1,600 | | 112,117 |
Munich Re Group | 1,402 | | 219,174 |
Siemens AG sponsored ADR | 4,200 | | 480,102 |
Software AG (Bearer) | 193 | | 27,043 |
Volkswagen AG | 566 | | 74,314 |
TOTAL GERMANY | | 2,983,074 |
Greece - 0.1% |
Hellenic Telecommunications Organization SA | 3,227 | | 25,770 |
Public Power Corp. of Greece | 3,202 | | 53,688 |
Terna Energy SA | 3,249 | | 13,969 |
TOTAL GREECE | | 93,427 |
Hong Kong - 2.8% |
China Mobile (Hong Kong) Ltd. | 18,000 | | 183,822 |
China Resources Power Holdings Co. Ltd. | 60,000 | | 115,491 |
Chow Sang Sang Holdings International Ltd. | 4,000 | | 10,527 |
CNOOC Ltd. | 142,000 | | 296,456 |
CNOOC Ltd. sponsored ADR | 260 | | 54,319 |
Hang Lung Group Ltd. | 8,000 | | 53,101 |
Hong Kong Exchanges and Clearing Ltd. | 14,500 | | 319,136 |
Common Stocks - continued |
| Shares | | Value |
Hong Kong - continued |
Hutchison Whampoa Ltd. | 5,000 | | $ 49,282 |
I.T Ltd. | 12,000 | | 10,125 |
Shanghai Industrial Holdings Ltd. | 14,000 | | 64,480 |
Swire Pacific Ltd. (A Shares) | 18,500 | | 262,538 |
Techtronic Industries Co. Ltd. | 112,500 | | 113,933 |
Wharf Holdings Ltd. | 56,000 | | 367,734 |
TOTAL HONG KONG | | 1,900,944 |
Hungary - 0.0% |
Egis Rt. | 125 | | 14,685 |
India - 1.8% |
Bank of Baroda | 8,655 | | 205,352 |
Bharat Heavy Electricals Ltd. | 1,225 | | 67,587 |
Housing Development Finance Corp. Ltd. | 6,972 | | 108,170 |
Idea Cellular Ltd. (a) | 13,905 | | 21,159 |
Indian Oil Corp. Ltd. | 1,798 | | 16,958 |
Indian Overseas Bank | 3,526 | | 12,712 |
Infosys Technologies Ltd. sponsored ADR | 1,900 | | 128,136 |
Infotech Enterprises Ltd. | 1,602 | | 5,913 |
Infrastructure Development Finance Co. Ltd. | 14,735 | | 66,503 |
Jain Irrigation Systems Ltd. | 9,935 | | 52,000 |
JSW Steel Ltd. | 2,520 | | 76,294 |
Jyothy Laboratories Ltd. | 2,850 | | 17,746 |
LIC Housing Finance Ltd. | 393 | | 11,886 |
Punjab National Bank | 150 | | 4,886 |
Radico Khaitan Ltd. | 1,989 | | 8,023 |
Reliance Industries Ltd. | 6,015 | | 148,764 |
Rural Electrification Corp. Ltd. | 7,306 | | 61,093 |
Shriram Transport Finance Co. Ltd. | 1,315 | | 26,149 |
Tata Consultancy Services Ltd. | 4,255 | | 101,074 |
Tata Steel Ltd. | 1,184 | | 15,744 |
Ultratech Cement Ltd. | 1,753 | | 43,500 |
Unitech Ltd. | 4,394 | | 8,605 |
TOTAL INDIA | | 1,208,254 |
Indonesia - 1.4% |
Indofood Sukses Makmur Tbk PT (a) | 17,500 | | 11,161 |
PT Astra International Tbk | 14,500 | | 92,475 |
PT Bank Mandiri (Persero) Tbk | 32,000 | | 25,063 |
PT Bank Negara Indonesia (Persero) Tbk | 132,000 | | 57,600 |
PT Bank Rakyat Indonesia Tbk | 187,000 | | 238,523 |
PT Bank Tabungan Negara Tbk | 79,000 | | 17,590 |
Common Stocks - continued |
| Shares | | Value |
Indonesia - continued |
PT Bumi Serpong Damai Tbk | 106,500 | | $ 10,010 |
PT Ciputra Development Tbk (a) | 245,500 | | 11,537 |
PT Delta Dunia Petroindo Tbk (a) | 154,000 | | 18,437 |
PT Gudang Garam Tbk | 12,000 | | 64,045 |
PT Indo Tambangraya Megah Tbk | 7,000 | | 35,401 |
PT Indocement Tunggal Prakarsa Tbk | 36,000 | | 73,712 |
PT Indofood Sukses Makmur Tbk | 123,500 | | 71,854 |
PT Kalbe Farma Tbk | 67,500 | | 20,203 |
PT Perusahaan Gas Negara Tbk Series B | 102,000 | | 46,221 |
PT Semen Gresik (Persero) Tbk | 67,500 | | 74,014 |
PT Tambang Batubbara Bukit Asam Tbk | 6,000 | | 13,192 |
PT Tower Bersama Infrastructure Tbk | 101,000 | | 28,817 |
PT XL Axiata Tbk (a) | 75,500 | | 48,573 |
TOTAL INDONESIA | | 958,428 |
Ireland - 0.5% |
CRH PLC sponsored ADR | 12,904 | | 228,014 |
James Hardie Industries NV sponsored ADR (a) | 4,465 | | 118,680 |
TOTAL IRELAND | | 346,694 |
Israel - 0.2% |
Azrieli Group | 582 | | 15,002 |
Ituran Location & Control Ltd. | 492 | | 7,651 |
Teva Pharmaceutical Industries Ltd. sponsored ADR | 2,500 | | 129,750 |
TOTAL ISRAEL | | 152,403 |
Italy - 1.7% |
Azimut Holdings SpA | 18,707 | | 190,799 |
ENI SpA | 3,000 | | 67,535 |
Fiat SpA | 14,000 | | 236,880 |
Interpump Group SpA (a) | 4,425 | | 28,862 |
Intesa Sanpaolo SpA | 99,944 | | 351,492 |
Saipem SpA | 2,714 | | 120,580 |
UniCredit SpA | 60,101 | | 156,634 |
TOTAL ITALY | | 1,152,782 |
Japan - 11.0% |
ABC-Mart, Inc. | 2,100 | | 71,427 |
Aisin Seiki Co. Ltd. | 4,400 | | 138,173 |
Aozora Bank Ltd. | 10,000 | | 16,776 |
Asahi Co. Ltd. | 500 | | 7,394 |
Autobacs Seven Co. Ltd. | 3,900 | | 146,123 |
Credit Saison Co. Ltd. | 2,700 | | 38,296 |
Common Stocks - continued |
| Shares | | Value |
Japan - continued |
Daikoku Denki Co. Ltd. | 1,200 | | $ 13,570 |
Daikokutenbussan Co. Ltd. | 800 | | 28,035 |
Denso Corp. | 13,800 | | 429,154 |
East Japan Railway Co. | 2,700 | | 166,735 |
Fanuc Ltd. | 2,300 | | 332,970 |
Fast Retailing Co. Ltd. | 900 | | 117,892 |
FCC Co. Ltd. | 1,000 | | 21,461 |
Fukuoka (REIT) Investment Fund | 2 | | 13,421 |
GCA Savvian Group Corp. (a) | 14 | | 13,275 |
Glory Ltd. | 400 | | 8,823 |
Goldcrest Co. Ltd. | 410 | | 8,850 |
Honda Motor Co. Ltd. | 4,500 | | 162,220 |
Japan Retail Fund Investment Corp. | 103 | | 160,893 |
Japan Steel Works Ltd. | 15,000 | | 143,116 |
Japan Tobacco, Inc. | 14 | | 43,494 |
JSR Corp. | 4,300 | | 74,436 |
Kamigumi Co. Ltd. | 2,000 | | 15,633 |
Keyence Corp. | 810 | | 200,814 |
Kobayashi Pharmaceutical Co. Ltd. | 4,200 | | 195,725 |
Konica Minolta Holdings, Inc. | 8,500 | | 82,135 |
Kyoto Kimono Yuzen Co. Ltd. | 900 | | 9,786 |
Meiko Network Japan Co. Ltd. | 900 | | 7,505 |
Miraca Holdings, Inc. | 1,900 | | 68,378 |
Miraial Co. Ltd. | 300 | | 7,356 |
Mitsubishi UFJ Financial Group, Inc. | 83,900 | | 389,380 |
Mitsui & Co. Ltd. | 35,100 | | 552,032 |
MS&AD Insurance Group Holdings, Inc. | 4,190 | | 100,379 |
Nabtesco Corp. | 1,600 | | 28,334 |
Nachi-Fujikoshi Corp. | 7,000 | | 20,964 |
Nagaileben Co. Ltd. | 300 | | 7,113 |
Nihon Parkerizing Co. Ltd. | 1,000 | | 13,135 |
Nippon Electric Glass Co. Ltd. | 16,000 | | 205,661 |
Nippon Seiki Co. Ltd. | 2,000 | | 20,256 |
Nippon Telegraph & Telephone Corp. | 1,400 | | 63,141 |
Nippon Thompson Co. Ltd. | 20,000 | | 138,685 |
Nitto Kohki Co. Ltd. | 300 | | 7,072 |
Obic Co. Ltd. | 700 | | 129,266 |
ORIX Corp. | 2,420 | | 220,738 |
Osaka Securities Exchange Co. Ltd. | 32 | | 161,054 |
OSG Corp. | 1,400 | | 14,632 |
Promise Co. Ltd. | 8,950 | | 37,482 |
Ricoh Co. Ltd. | 5,000 | | 69,943 |
Common Stocks - continued |
| Shares | | Value |
Japan - continued |
SAZABY, Inc. | 400 | | $ 7,456 |
Seven & i Holdings Co., Ltd. | 3,000 | | 69,639 |
Shiseido Co. Ltd. | 7,100 | | 148,231 |
SHO-BOND Holdings Co. Ltd. | 3,500 | | 74,897 |
Shoei Co. Ltd. | 600 | | 5,436 |
SOFTBANK CORP. | 2,400 | | 77,076 |
Sumitomo Corp. | 22,900 | | 289,933 |
Sumitomo Metal Industries Ltd. | 27,000 | | 62,667 |
Sumitomo Mitsui Financial Group, Inc. | 7,500 | | 223,858 |
The Nippon Synthetic Chemical Industry Co. Ltd. | 1,000 | | 5,866 |
THK Co. Ltd. | 700 | | 13,466 |
Toho Holdings Co. Ltd. | 1,200 | | 16,806 |
Tokio Marine Holdings, Inc. | 4,000 | | 112,463 |
Tokyo Electron Ltd. | 2,400 | | 135,416 |
Tokyo Gas Co. Ltd. | 66,000 | | 310,523 |
Toyota Motor Corp. | 10,800 | | 382,539 |
Tsumura & Co. | 600 | | 18,462 |
Tsutsumi Jewelry Co. Ltd. | 400 | | 9,420 |
USS Co. Ltd. | 4,100 | | 318,951 |
West Japan Railway Co. | 19 | | 70,537 |
Xebio Co. Ltd. | 400 | | 7,854 |
Yamada Denki Co. Ltd. | 1,400 | | 90,990 |
Yamatake Corp. | 600 | | 14,607 |
Yamato Kogyo Co. Ltd. | 6,900 | | 176,980 |
TOTAL JAPAN | | 7,567,206 |
Kazakhstan - 0.1% |
KazMunaiGas Exploration & Production JSC (Reg. S) GDR | 1,900 | | 32,680 |
Korea (South) - 2.7% |
Busan Bank | 1,850 | | 23,032 |
CJ Corp. | 645 | | 45,486 |
Daegu Bank Co. Ltd. | 1,700 | | 22,299 |
Daelim Industrial Co. | 450 | | 36,656 |
Doosan Co. Ltd. | 158 | | 21,287 |
GS Holdings Corp. | 640 | | 33,579 |
Hanjin Heavy Industries & Consolidated Co. Ltd. | 1,090 | | 41,584 |
Honam Petrochemical Corp. | 295 | | 65,060 |
Hyundai Department Store Co. Ltd. | 153 | | 16,940 |
Hyundai Heavy Industries Co. Ltd. | 267 | | 87,021 |
Hyundai Mobis | 495 | | 123,255 |
Hyundai Motor Co. | 1,177 | | 177,937 |
Industrial Bank of Korea | 5,500 | | 78,991 |
Common Stocks - continued |
| Shares | | Value |
Korea (South) - continued |
Kia Motors Corp. | 2,440 | | $ 97,426 |
KT Corp. | 1,220 | | 48,100 |
LG Chemical Ltd. | 150 | | 46,287 |
Lumens Co. Ltd. (a) | 1,889 | | 16,799 |
NCsoft Corp. | 296 | | 65,149 |
NHN Corp. (a) | 1,207 | | 214,136 |
Samsung Electronics Co. Ltd. | 519 | | 343,846 |
Shinhan Financial Group Co. Ltd. | 5,240 | | 202,936 |
Shinhan Financial Group Co. Ltd. sponsored ADR | 300 | | 23,331 |
Tong Yang Securities, Inc. | 2,260 | | 22,811 |
Young Poong Precision Corp. | 570 | | 6,666 |
TOTAL KOREA (SOUTH) | | 1,860,614 |
Lebanon - 0.0% |
BLOM Bank SAL GDR | 500 | | 4,600 |
Luxembourg - 0.5% |
ArcelorMittal SA: | | | |
(Netherlands) | 2,449 | | 79,226 |
Class A unit | 5,200 | | 168,376 |
Evraz Group SA GDR (a) | 1,900 | | 57,608 |
GlobeOp Financial Services SA | 2,300 | | 11,248 |
Millicom International Cellular SA | 500 | | 47,300 |
TOTAL LUXEMBOURG | | 363,758 |
Malaysia - 0.1% |
AirAsia Bhd (a) | 20,300 | | 16,117 |
Axiata Group Bhd (a) | 35,000 | | 50,514 |
RHB Capital BHD | 5,200 | | 13,422 |
Top Glove Corp. Bhd | 11,500 | | 20,331 |
TOTAL MALAYSIA | | 100,384 |
Mexico - 0.9% |
America Movil SAB de CV Series L sponsored ADR | 4,300 | | 246,218 |
Banco Compartamos SA de CV | 6,300 | | 44,629 |
Genomma Lab Internacional SA de CV (a) | 7,000 | | 15,207 |
Wal-Mart de Mexico SA de CV Series V | 106,200 | | 290,469 |
TOTAL MEXICO | | 596,523 |
Netherlands - 2.5% |
Aalberts Industries NV | 1,500 | | 27,394 |
ASM International NV unit (a) | 6,035 | | 154,194 |
ASML Holding NV | 6,500 | | 215,735 |
Common Stocks - continued |
| Shares | | Value |
Netherlands - continued |
Gemalto NV | 3,301 | | $ 150,289 |
Heijmans NV unit (a) | 710 | | 13,386 |
ING Groep NV: | | | |
(Certificaten Van Aandelen) unit (a) | 19,510 | | 208,679 |
sponsored ADR (a) | 25,300 | | 272,734 |
Koninklijke Ahold NV | 6,433 | | 88,885 |
Koninklijke KPN NV | 19,438 | | 324,564 |
QIAGEN NV (a) | 6,800 | | 127,908 |
Randstad Holdings NV (a) | 2,303 | | 109,594 |
TOTAL NETHERLANDS | | 1,693,362 |
Nigeria - 0.1% |
Guaranty Trust Bank PLC GDR (Reg. S) | 5,825 | | 42,290 |
Norway - 0.4% |
Aker Solutions ASA | 12,453 | | 189,580 |
Det Norske Oljeselskap ASA (DNO) (A Shares) (a) | 7,400 | | 11,619 |
DnB NOR ASA | 4,300 | | 59,004 |
Sevan Marine ASA (a) | 10,000 | | 13,474 |
TOTAL NORWAY | | 273,677 |
Papua New Guinea - 0.0% |
Oil Search Ltd. | 1,312 | | 8,200 |
Peru - 0.2% |
Compania de Minas Buenaventura SA sponsored ADR | 2,600 | | 137,904 |
Philippines - 0.0% |
Jollibee Food Corp. | 3,500 | | 7,220 |
Megaworld Corp. | 70,000 | | 4,177 |
TOTAL PHILIPPINES | | 11,397 |
Poland - 0.0% |
Bank Handlowy w Warszawie SA | 511 | | 16,134 |
Portugal - 0.5% |
Energias de Portugal SA | 52,028 | | 199,012 |
Jeronimo Martins SGPS SA | 10,525 | | 157,873 |
TOTAL PORTUGAL | | 356,885 |
Qatar - 0.0% |
Commercial Bank of Qatar GDR (Reg. S) | 6,707 | | 30,733 |
Russia - 1.6% |
Cherkizovo Group OJSC GDR (a) | 1,018 | | 20,740 |
LSR Group OJSC GDR (Reg. S) (a) | 1,800 | | 15,300 |
Magnit OJSC GDR (Reg. S) | 3,100 | | 82,894 |
Common Stocks - continued |
| Shares | | Value |
Russia - continued |
Mechel Steel Group OAO sponsored ADR | 5,300 | | $ 124,815 |
OAO Gazprom sponsored ADR | 3,800 | | 83,030 |
OAO NOVATEK GDR | 1,300 | | 124,345 |
OAO Raspadskaya (a) | 2,100 | | 12,228 |
OAO Tatneft sponsored ADR | 2,400 | | 75,720 |
OJSC MMC Norilsk Nickel sponsored ADR | 4,484 | | 83,627 |
OJSC Oil Company Rosneft GDR (Reg. S) | 16,800 | | 117,096 |
Polymetal JSC GDR (Reg. S) (a) | 3,900 | | 61,620 |
Protek (a) | 705 | | 1,280 |
RusHydro JSC sponsored ADR (a) | 10,400 | | 53,820 |
Sberbank (Savings Bank of the Russian Federation) | 34,200 | | 112,391 |
Sberbank (Savings Bank of the Russian Federation) GDR | 150 | | 56,354 |
Severstal JSC (a) | 1,200 | | 16,377 |
Sistema JSFC sponsored GDR | 2,200 | | 56,760 |
TGK-1 OAO (a) | 17,098,600 | | 11,866 |
TOTAL RUSSIA | | 1,110,263 |
Singapore - 1.3% |
Allgreen Properties Ltd. | 21,000 | | 19,308 |
City Developments Ltd. | 8,000 | | 78,622 |
DBS Group Holdings Ltd. | 5,226 | | 56,124 |
Keppel Corp. Ltd. | 5,000 | | 38,554 |
Keppel Land Ltd. | 3,000 | | 10,268 |
Singapore Exchange Ltd. | 29,700 | | 201,932 |
Straits Asia Resources Ltd. | 23,000 | | 40,694 |
United Overseas Bank Ltd. | 18,943 | | 272,810 |
Wing Tai Holdings Ltd. | 57,000 | | 77,069 |
Yanlord Land Group Ltd. | 91,000 | | 120,930 |
TOTAL SINGAPORE | | 916,311 |
South Africa - 2.3% |
African Bank Investments Ltd. | 13,600 | | 69,776 |
African Rainbow Minerals Ltd. | 11,850 | | 302,312 |
AngloGold Ashanti Ltd. | 1,600 | | 75,040 |
AngloGold Ashanti Ltd. sponsored ADR | 900 | | 42,399 |
Aspen Pharmacare Holdings Ltd. | 3,700 | | 49,386 |
Clicks Group Ltd. | 33,784 | | 220,402 |
Foschini Ltd. | 4,920 | | 59,721 |
Impala Platinum Holdings Ltd. | 1,700 | | 48,051 |
Imperial Holdings Ltd. | 120 | | 1,957 |
JSE Ltd. | 10,100 | | 113,904 |
Mr Price Group Ltd. | 27,800 | | 252,639 |
Common Stocks - continued |
| Shares | | Value |
South Africa - continued |
Mvelaphanda Resources Ltd. (a) | 8,322 | | $ 54,410 |
Shoprite Holdings Ltd. | 4,600 | | 65,023 |
Standard Bank Group Ltd. | 7,537 | | 111,144 |
Wilson Bayly Holmes-Ovcon Ltd. | 1,000 | | 19,326 |
Woolworths Holdings Ltd. | 16,241 | | 63,642 |
TOTAL SOUTH AFRICA | | 1,549,132 |
Spain - 3.2% |
Banco Bilbao Vizcaya Argentaria SA sponsored ADR | 30,294 | | 398,366 |
Banco Santander SA | 12,015 | | 154,180 |
Banco Santander SA sponsored ADR | 28,700 | | 367,647 |
Gestevision Telecinco SA | 2,300 | | 29,334 |
Grifols SA | 446 | | 7,221 |
Iberdrola SA | 41,442 | | 349,447 |
Inditex SA | 2,780 | | 232,133 |
Prosegur Compania de Seguridad SA (Reg.) | 2,951 | | 176,812 |
Red Electrica Corporacion SA | 1,300 | | 65,292 |
Telefonica SA sponsored ADR | 5,040 | | 408,946 |
TOTAL SPAIN | | 2,189,378 |
Sweden - 0.7% |
H&M Hennes & Mauritz AB (B Shares) | 8,382 | | 295,307 |
Intrum Justitia AB | 1,200 | | 16,523 |
Swedish Match Co. | 3,900 | | 108,975 |
Telefonaktiebolaget LM Ericsson (B Shares) | 6,834 | | 75,136 |
TOTAL SWEDEN | | 495,941 |
Switzerland - 6.4% |
Bank Sarasin & Co. Ltd. Series B (Reg.) | 1,098 | | 40,156 |
Credit Suisse Group sponsored ADR | 3,160 | | 131,140 |
Lonza Group AG | 313 | | 27,394 |
Nestle SA | 21,540 | | 1,179,467 |
Novartis AG sponsored ADR | 8,400 | | 486,780 |
Roche Holding AG (participation certificate) | 7,328 | | 1,075,731 |
Sonova Holding AG Class B | 2,658 | | 307,830 |
The Swatch Group AG: | | | |
(Bearer) | 680 | | 259,814 |
(Reg.) | 189 | | 13,133 |
Transocean Ltd. (a) | 2,920 | | 185,011 |
UBS AG (a) | 4,073 | | 69,169 |
Common Stocks - continued |
| Shares | | Value |
Switzerland - continued |
UBS AG (NY Shares) (a) | 6,900 | | $ 117,438 |
Zurich Financial Services AG | 1,946 | | 476,245 |
TOTAL SWITZERLAND | | 4,369,308 |
Taiwan - 1.4% |
Advanced Semiconductor Engineering, Inc. | 10,999 | | 9,576 |
Advanced Semiconductor Engineering, Inc. sponsored ADR | 9,899 | | 43,853 |
Alpha Networks, Inc. | 20,000 | | 17,775 |
Asia Cement Corp. | 49,440 | | 50,967 |
AU Optronics Corp. (a) | 45,000 | | 44,920 |
Chroma ATE, Inc. | 9,150 | | 23,559 |
Farglory Land Development Co. Ltd. | 8,000 | | 19,866 |
Formosa Plastics Corp. | 37,000 | | 106,146 |
Fubon Financial Holding Co. Ltd. | 59,846 | | 73,329 |
Hon Hai Precision Industry Co. Ltd. (Foxconn) | 18,858 | | 71,476 |
HTC Corp. | 6,300 | | 142,241 |
Huaku Development Co. Ltd. | 6,000 | | 16,644 |
Macronix International Co. Ltd. | 103,000 | | 63,439 |
Pegatron Corp. (a) | 21,000 | | 28,441 |
Ruentex Development Co. Ltd. | 6,000 | | 9,959 |
Taishin Financial Holdings Co. Ltd. | 153,180 | | 67,068 |
Taiwan Cement Corp. | 26,000 | | 27,695 |
Taiwan Semiconductor Manufacturing Co. Ltd. | 27,035 | | 55,649 |
Unimicron Technology Corp. | 7,000 | | 11,916 |
Wistron Corp. | 35,510 | | 72,981 |
TOTAL TAIWAN | | 957,500 |
Thailand - 0.5% |
Advanced Info Service PCL (For. Reg.) | 15,700 | | 47,194 |
Banpu PCL: | | | |
unit | 300 | | 7,756 |
(For. Reg.) | 2,000 | | 51,703 |
BEC World PCL (For. Reg.) | 20,800 | | 23,100 |
Siam Commercial Bank PCL (For. Reg.) | 53,300 | | 182,473 |
Total Access Communication PCL (For. Reg.) | 200 | | 281 |
TOTAL THAILAND | | 312,507 |
Turkey - 1.4% |
Albaraka Turk Katilim Bankasi AS | 10,000 | | 20,079 |
Anadolu Efes Biracilik ve Malt Sanayii AS | 8,000 | | 127,728 |
Asya Katilim Bankasi AS | 30,000 | | 77,390 |
Coca-Cola Icecek AS | 10,400 | | 133,417 |
Enka Insaat ve Sanayi AS | 5,666 | | 25,875 |
Common Stocks - continued |
| Shares | | Value |
Turkey - continued |
Sinpas Gayrimenkul Yatirim Ortakligi AS (a) | 11,000 | | $ 16,719 |
Tofas Turk Otomobil Fabrikasi AS | 8,511 | | 47,175 |
Turk Hava Yollari AO | 21,714 | | 90,078 |
Turkiye Garanti Bankasi AS | 61,700 | | 378,554 |
Turkiye Halk Bankasi AS | 7,000 | | 70,766 |
TOTAL TURKEY | | 987,781 |
United Arab Emirates - 0.1% |
DP World Ltd. | 62,496 | | 37,435 |
United Kingdom - 15.7% |
Aberdeen Asset Management PLC | 27,018 | | 76,964 |
Aegis Group PLC | 48,438 | | 97,549 |
AMEC PLC | 1,055 | | 18,356 |
Anglo American PLC (United Kingdom) | 12,031 | | 560,531 |
AstraZeneca PLC sponsored ADR | 1,900 | | 95,874 |
Aviva PLC | 17,072 | | 108,860 |
Babcock International Group PLC | 16,100 | | 149,609 |
BAE Systems PLC | 39,000 | | 215,382 |
Barclays PLC | 57,875 | | 254,296 |
Bellway PLC | 1,728 | | 14,784 |
BG Group PLC | 26,887 | | 523,601 |
BHP Billiton PLC ADR | 16,300 | | 1,154,040 |
BP PLC sponsored ADR | 13,100 | | 534,873 |
British Airways PLC (a) | 13,000 | | 56,381 |
Britvic PLC | 3,000 | | 23,186 |
Centrica PLC | 15,575 | | 82,895 |
Cobham PLC | 25,400 | | 94,249 |
Dechra Pharmaceuticals PLC | 1,300 | | 11,039 |
Derwent London PLC | 500 | | 12,176 |
GlaxoSmithKline PLC sponsored ADR | 8,500 | | 331,840 |
Great Portland Estates PLC | 3,972 | | 21,987 |
H&T Group PLC | 2,891 | | 16,165 |
Hikma Pharmaceuticals PLC | 3,478 | | 43,798 |
HSBC Holdings PLC: | | | |
(United Kingdom) | 25,682 | | 267,256 |
sponsored ADR | 9,251 | | 482,070 |
Imperial Tobacco Group PLC | 6,811 | | 218,136 |
InterContinental Hotel Group PLC ADR | 12,590 | | 243,617 |
International Power PLC | 9,989 | | 66,784 |
Johnson Matthey PLC | 6,192 | | 189,879 |
Man Group PLC | 9,279 | | 38,771 |
Meggitt PLC | 5,952 | | 31,478 |
Common Stocks - continued |
| Shares | | Value |
United Kingdom - continued |
Micro Focus International PLC | 2,500 | | $ 15,293 |
Misys PLC (a) | 11,200 | | 50,495 |
Mothercare PLC | 9,299 | | 78,291 |
Persimmon PLC | 1,737 | | 9,490 |
Prudential PLC | 16,571 | | 167,579 |
Reckitt Benckiser Group PLC | 4,738 | | 265,001 |
Rio Tinto PLC | 5,196 | | 337,440 |
Rio Tinto PLC sponsored ADR | 6,560 | | 427,187 |
Rotork PLC | 500 | | 13,418 |
Royal Dutch Shell PLC Class A sponsored ADR | 15,300 | | 993,429 |
Serco Group PLC | 27,871 | | 274,173 |
Shaftesbury PLC | 17,833 | | 127,427 |
Spectris PLC | 1,649 | | 29,828 |
Spirax-Sarco Engineering PLC | 1,404 | | 40,692 |
Standard Chartered PLC: | | | |
rights 11/5/10 (a) | 2,079 | | 17,504 |
(United Kingdom) | 16,639 | | 481,313 |
Ted Baker PLC | 2,175 | | 21,431 |
Tesco PLC | 54,583 | | 373,281 |
Ultra Electronics Holdings PLC | 800 | | 23,853 |
Unite Group PLC (a) | 25,402 | | 84,651 |
Vedanta Resources PLC | 4,000 | | 132,978 |
Victrex PLC | 4,318 | | 89,312 |
Vodafone Group PLC sponsored ADR | 19,400 | | 533,694 |
Wolseley PLC (a) | 3,963 | | 105,589 |
Xstrata PLC | 2,900 | | 56,196 |
TOTAL UNITED KINGDOM | | 10,785,971 |
United States of America - 4.5% |
Advanced Energy Industries, Inc. (a) | 1,581 | | 22,703 |
Allergan, Inc. | 1,400 | | 101,374 |
Autoliv, Inc. | 3,750 | | 267,375 |
Berkshire Hathaway, Inc. Class B (a) | 1,550 | | 123,318 |
CTC Media, Inc. | 1,600 | | 37,760 |
Cymer, Inc. (a) | 2,350 | | 86,833 |
Dril-Quip, Inc. (a) | 230 | | 15,893 |
eBay, Inc. (a) | 2,000 | | 59,620 |
Evercore Partners, Inc. Class A | 380 | | 11,537 |
Freeport-McMoRan Copper & Gold, Inc. | 600 | | 56,808 |
Google, Inc. Class A (a) | 200 | | 122,598 |
ION Geophysical Corp. (a) | 16,371 | | 80,054 |
JPMorgan Chase & Co. | 2,663 | | 100,209 |
Common Stocks - continued |
| Shares | | Value |
United States of America - continued |
Juniper Networks, Inc. (a) | 13,740 | | $ 445,039 |
Kansas City Southern (a) | 680 | | 29,798 |
Lam Research Corp. (a) | 197 | | 9,021 |
Martin Marietta Materials, Inc. | 880 | | 70,822 |
Mead Johnson Nutrition Co. Class A | 3,400 | | 199,988 |
Mohawk Industries, Inc. (a) | 2,670 | | 153,098 |
Oceaneering International, Inc. (a) | 140 | | 8,662 |
Philip Morris International, Inc. | 2,300 | | 134,550 |
PriceSmart, Inc. | 1,800 | | 52,794 |
ResMed, Inc. (a) | 5,360 | | 170,823 |
Solera Holdings, Inc. | 200 | | 9,610 |
Solutia, Inc. (a) | 484 | | 8,765 |
Union Pacific Corp. | 2,300 | | 201,664 |
Visa, Inc. Class A | 6,594 | | 515,453 |
TOTAL UNITED STATES OF AMERICA | | 3,096,169 |
TOTAL COMMON STOCKS (Cost $63,165,472) | 66,515,229 |
Nonconvertible Preferred Stocks - 0.4% |
| | | |
Germany - 0.1% |
Volkswagen AG | 200 | | 30,055 |
Italy - 0.3% |
Fiat SpA (Risparmio Shares) | 7,800 | | 91,656 |
Telecom Italia SpA (Risparmio Shares) | 104,200 | | 127,820 |
TOTAL ITALY | | 219,476 |
TOTAL NONCONVERTIBLE PREFERRED STOCKS (Cost $240,073) | 249,531 |
Investment Companies - 0.5% |
| | | |
United States of America - 0.5% |
iShares MSCI ACWI ex US Index ETF
(Cost $347,161) | 8,000 | | 342,000 |
Money Market Funds - 0.5% |
| | | |
Fidelity Securities Lending Cash Central Fund, 0.24% (b)(c)
(Cost $355,537) | 355,537 | | 355,537 |
Cash Equivalents - 1.6% |
| Maturity Amount | | Value |
Investments in repurchase agreements in a joint trading account at 0.22%, dated 10/29/10 due 11/1/10 (Collateralized by U.S. Treasury Obligations) #
(Cost $1,074,000) | $ 1,074,019 | | $ 1,074,000 |
TOTAL INVESTMENT PORTFOLIO - 99.9% (Cost $65,182,243) | | 68,536,297 |
NET OTHER ASSETS (LIABILITIES) - 0.1% | | 100,928 |
NET ASSETS - 100% | $ 68,637,225 |
Security Type Abbreviations |
ETF | - | Exchange-Traded Funds |
Legend |
(a) Non-income producing |
(b) Affiliated fund that is available only to investment companies and other accounts managed by Fidelity Investments. The rate quoted is the annualized seven-day yield of the fund at period end. A complete unaudited listing of the fund's holdings as of its most recent quarter end is available upon request. In addition, each Fidelity Central Fund's financial statements, which are not covered by the Fund's report of Independent Registered Public Accounting Firm, are available on the SEC's website or upon request. |
(c) Investment made with cash collateral received from securities on loan. |
(d) Security or a portion of the security is on loan at period end. |
(e) Security exempt from registration under Rule 144A of the Securities Act of 1933. These securities may be resold in transactions exempt from registration, normally to qualified institutional buyers. At the end of the period, the value of these securities amounted to $10,200 or 0.0% of net assets. |
# Additional information on each counterparty to the repurchase agreement is as follows: |
Repurchase Agreement / Counterparty | Value |
$1,074,000 due 11/01/10 at 0.22% |
BNP Paribas Securities Corp. | $ 178,969 |
Barclays Capital, Inc. | 268,288 |
Credit Agricole Securities (USA), Inc. | 46,262 |
Credit Suisse Securities (USA) LLC | 49,440 |
Deutsche Bank Securities, Inc. | 82,975 |
HSBC Securities (USA), Inc. | 82,975 |
J.P. Morgan Securities, Inc. | 221,267 |
Mizuho Securities USA, Inc. | 55,317 |
Societe Generale, New York Branch | 55,317 |
UBS Securities LLC | 27,658 |
Wells Fargo Securities LLC | 5,532 |
| $ 1,074,000 |
Affiliated Central Funds |
Information regarding fiscal year to date income earned by the Fund from investments in Fidelity Central Funds is as follows: |
Fund | Income earned |
Fidelity Securities Lending Cash Central Fund | $ 17,945 |
Other Information |
The following is a summary of the inputs used, as of October 31, 2010, involving the Fund's assets and liabilities carried at fair value. The inputs or methodology used for valuing securities may not be an indication of the risk associated with investing in those securities. For more information on valuation inputs, and their aggregation into the levels used in the tables below, please refer to the Security Valuation section in the accompanying Notes to Financial Statements. |
Valuation Inputs at Reporting Date: |
Description | Total | Level 1 | Level 2 | Level 3 |
Investments in Securities: | | | | |
Equities: | | | | |
United Kingdom | $ 10,785,971 | $ 9,650,540 | $ 1,135,431 | $ - |
Japan | 7,567,206 | 2,787,776 | 4,779,430 | - |
Switzerland | 4,369,308 | 4,300,139 | 69,169 | - |
France | 3,682,649 | 3,661,425 | 21,224 | - |
Brazil | 3,117,573 | 3,117,573 | - | - |
United States of America | 3,096,169 | 3,096,169 | - | - |
Germany | 3,013,129 | 3,013,129 | - | - |
Spain | 2,189,378 | 2,035,198 | 154,180 | - |
Australia | 2,105,847 | 2,105,847 | - | - |
Other | 26,837,530 | 25,140,942 | 1,696,588 | - |
Investment Companies | 342,000 | 342,000 | - | - |
Money Market Funds | 355,537 | 355,537 | - | - |
Cash Equivalents | 1,074,000 | - | 1,074,000 | - |
Total Investments in Securities: | $ 68,536,297 | $ 59,606,275 | $ 8,930,022 | $ - |
The following is a reconciliation of Investments in Securities for which Level 3 inputs were used in determining value: |
Investments in Securities: | |
Beginning Balance | $ 369 |
Total Realized Gain (Loss) | (25,822) |
Total Unrealized Gain (Loss) | 25,854 |
Cost of Purchases | - |
Proceeds of Sales | (401) |
Amortization/Accretion | - |
Transfers in to Level 3 | - |
Transfers out of Level 3 | - |
Ending Balance | $ - |
The change in unrealized gain (loss) for the period attributable to Level 3 securities held at October 31, 2010 | $ - |
The information used in the above reconciliation represents fiscal year to date activity for any Investments in Securities identified as using Level 3 inputs at either the beginning or the end of the current fiscal period. Transfers in or out of Level 3 represent the beginning value of any Security or Instrument where a change in the pricing level occurred from the beginning to the end of the period. The cost of purchases and the proceeds of sales may include securities received or delivered through corporate actions or exchanges. Realized and unrealized gains (losses) disclosed in the reconciliation are included in Net Gain (Loss) on the Fund's Statement of Operations. |
Income Tax Information |
At October 31, 2010, the Fund had a capital loss carryforward of approximately $24,325,764 of which $8,618,800 and $15,706,964 will expire on October 31, 2016 and 2017, respectively. Capital loss carryforwards are only available to offset future capital gains of the Fund to the extent provided by regulations and may be limited. |
See accompanying notes which are an integral part of the financial statements.
Annual Report
Statement of Assets and Liabilities
| October 31, 2010 |
| | |
Assets | | |
Investment in securities, at value (including securities loaned of $337,322 and repurchase agreements of $1,074,000) - See accompanying schedule: Unaffiliated issuers (cost $64,826,706) | $ 68,180,760 | |
Fidelity Central Funds (cost $355,537) | 355,537 | |
Total Investments (cost $65,182,243) | | $ 68,536,297 |
Cash | | 2,825 |
Foreign currency held at value (cost $238,396) | | 238,365 |
Receivable for investments sold | | 225,351 |
Receivable for fund shares sold | | 93,567 |
Dividends receivable | | 171,941 |
Distributions receivable from Fidelity Central Funds | | 52 |
Receivable from investment adviser for expense reductions | | 65,182 |
Other receivables | | 3,697 |
Total assets | | 69,337,277 |
| | |
Liabilities | | |
Payable for investments purchased | $ 107,723 | |
Payable for fund shares redeemed | 67,777 | |
Accrued management fee | 38,219 | |
Distribution and service plan fees payable | 2,988 | |
Other affiliated payables | 18,211 | |
Other payables and accrued expenses | 109,597 | |
Collateral on securities loaned, at value | 355,537 | |
Total liabilities | | 700,052 |
| | |
Net Assets | | $ 68,637,225 |
Net Assets consist of: | | |
Paid in capital | | $ 89,611,259 |
Undistributed net investment income | | 724,017 |
Accumulated undistributed net realized gain (loss) on investments and foreign currency transactions | | (25,059,753) |
Net unrealized appreciation (depreciation) on investments and assets and liabilities in foreign currencies | | 3,361,702 |
Net Assets | | $ 68,637,225 |
See accompanying notes which are an integral part of the financial statements.
Annual Report
Financial Statements - continued
Statement of Assets and Liabilities - continued
| October 31, 2010 |
| | |
Calculation of Maximum Offering Price
Class A:
Net Asset Value and redemption price per share ($5,029,222 ÷ 683,520 shares) | | $ 7.36 |
| | |
Maximum offering price per share (100/94.25 of $7.36) | | $ 7.81 |
Class T:
Net Asset Value and redemption price per share ($1,003,572 ÷ 135,346 shares) | | $ 7.41 |
| | |
Maximum offering price per share (100/96.50 of $7.41) | | $ 7.68 |
Class B:
Net Asset Value and offering price per share ($327,327 ÷ 44,417 shares)A | | $ 7.37 |
| | |
Class C:
Net Asset Value and offering price per share ($1,422,646 ÷ 193,344 shares)A | | $ 7.36 |
| | |
Total International Equity:
Net Asset Value, offering price and redemption price per share ($60,826,332 ÷ 8,257,843 shares) | | $ 7.37 |
| | |
Institutional Class:
Net Asset Value, offering price and redemption price per share ($28,126 ÷ 3,827 shares) | | $ 7.35 |
A Redemption price per share is equal to net asset value less any applicable contingent deferred sales charge.
See accompanying notes which are an integral part of the financial statements.
Annual Report
Statement of Operations
| Year ended October 31, 2010 |
| | |
Investment Income | | |
Dividends | | $ 1,628,770 |
Interest | | 1,411 |
Income from Fidelity Central Funds | | 17,945 |
Income before foreign taxes withheld | | 1,648,126 |
Less foreign taxes withheld | | (137,196) |
Total income | | 1,510,930 |
| | |
Expenses | | |
Management fee
Basic fee | $ 407,616 | |
Performance adjustment | (31,057) | |
Transfer agent fees | 168,397 | |
Distribution and service plan fees | 32,016 | |
Accounting and security lending fees | 29,939 | |
Custodian fees and expenses | 283,045 | |
Independent trustees' compensation | 315 | |
Registration fees | 81,296 | |
Audit | 89,169 | |
Legal | 347 | |
Miscellaneous | 625 | |
Total expenses before reductions | 1,061,708 | |
Expense reductions | (324,723) | 736,985 |
Net investment income (loss) | | 773,945 |
Realized and Unrealized Gain (Loss) Net realized gain (loss) on: | | |
Investment securities: | | |
Unaffiliated issuers | 1,923,248 | |
Foreign currency transactions | (17,111) | |
Total net realized gain (loss) | | 1,906,137 |
Change in net unrealized appreciation (depreciation) on: Investment securities | 5,446,085 | |
Assets and liabilities in foreign currencies | 1,641 | |
Total change in net unrealized appreciation (depreciation) | | 5,447,726 |
Net gain (loss) | | 7,353,863 |
Net increase (decrease) in net assets resulting from operations | | $ 8,127,808 |
See accompanying notes which are an integral part of the financial statements.
Annual Report
Financial Statements - continued
Statement of Changes in Net Assets
| Year ended
October 31,
2010 | Year ended
October 31,
2009 |
Increase (Decrease) in Net Assets | | |
Operations | | |
Net investment income (loss) | $ 773,945 | $ 445,721 |
Net realized gain (loss) | 1,906,137 | (15,995,813) |
Change in net unrealized appreciation (depreciation) | 5,447,726 | 25,959,338 |
Net increase (decrease) in net assets resulting
from operations | 8,127,808 | 10,409,246 |
Distributions to shareholders from net investment income | (411,223) | (859,670) |
Distributions to shareholders from net realized gain | (169,935) | - |
Total distributions | (581,158) | (859,670) |
Share transactions - net increase (decrease) | 18,410,630 | (6,640,043) |
Redemption fees | 6,300 | 1,869 |
Total increase (decrease) in net assets | 25,963,580 | 2,911,402 |
| | |
Net Assets | | |
Beginning of period | 42,673,645 | 39,762,243 |
End of period (including undistributed net investment income of $724,017 and undistributed net investment income of $385,749, respectively) | $ 68,637,225 | $ 42,673,645 |
See accompanying notes which are an integral part of the financial statements.
Annual Report
Financial Highlights - Class A
Years ended October 31, | 2010 | 2009 | 2008 F |
Selected Per-Share Data | | | |
Net asset value, beginning of period | $ 6.40 | $ 4.90 | $ 10.00 |
Income from Investment Operations | | | |
Net investment income (loss) C | .08 | .06 | .11 |
Net realized and unrealized gain (loss) | .95 | 1.55 | (5.21) |
Total from investment operations | 1.03 | 1.61 | (5.10) |
Distributions from net investment income | (.04) | (.11) | - |
Distributions from net realized gain | (.03) | - | - |
Total distributions | (.07) | (.11) | - |
Redemption fees added to paid in capital C, H | - | - | - |
Net asset value, end of period | $ 7.36 | $ 6.40 | $ 4.90 |
Total Return A, B | 16.17% | 33.87% | (51.00)% |
Ratios to Average Net Assets D, G | | | |
Expenses before reductions | 2.02% | 2.09% | 2.00% |
Expenses net of fee waivers, if any | 1.50% | 1.50% | 1.50% |
Expenses net of all reductions | 1.47% | 1.47% | 1.48% |
Net investment income (loss) | 1.15% | 1.13% | 1.35% |
Supplemental Data | | | |
Net assets, end of period (000 omitted) | $ 5,029 | $ 3,727 | $ 5,944 |
Portfolio turnover rate E | 67% | 98% | 91% |
A Total returns would have been lower had certain expenses not been reduced during the periods shown.
B Total returns do not include the effect of the sales charges.
C Calculated based on average shares outstanding during the period.
D Fees and expenses of the underlying Fidelity Central Funds are not included in the Fund's expense ratio. The Fund indirectly bears its proportionate share of the expenses of any underlying Fidelity Central Funds.
E Amount does not include the portfolio activity of any underlying Fidelity Central Funds.
F For the period November 1, 2007 (commencement of operations) to October 31, 2008.
G Expense ratios reflect operating expenses of the class. Expenses before reductions do not reflect amounts reimbursed by the investment adviser or reductions from brokerage service arrangements or reductions from other expense offset arrangements and do not represent the amount paid by the class during periods when reimbursements or reductions occur. Expense ratios before reductions for start-up periods may not be representative of longer-term operating periods. Expenses net of fee waivers reflect expenses after reimbursement by the investment adviser but prior to reductions from brokerage service arrangements or other expense offset arrangements. Expenses net of all reductions represent the net expenses paid by the class.
H Amount represents less than $.01 per share.
See accompanying notes which are an integral part of the financial statements.
Annual Report
Financial Highlights - Class T
Years ended October 31, | 2010 | 2009 | 2008 F |
Selected Per-Share Data | | | |
Net asset value, beginning of period | $ 6.40 | $ 4.88 | $ 10.00 |
Income from Investment Operations | | | |
Net investment income (loss) C | .06 | .04 | .09 |
Net realized and unrealized gain (loss) | .95 | 1.57 | (5.21) |
Total from investment operations | 1.01 | 1.61 | (5.12) |
Distributions from net investment income | - | (.09) | - |
Redemption fees added to paid in capital C, H | - | - | - |
Net asset value, end of period | $ 7.41 | $ 6.40 | $ 4.88 |
Total Return A, B | 15.78% | 33.74% | (51.20)% |
Ratios to Average Net Assets D, G | | | |
Expenses before reductions | 2.31% | 2.34% | 2.42% |
Expenses net of fee waivers, if any | 1.75% | 1.75% | 1.75% |
Expenses net of all reductions | 1.72% | 1.72% | 1.73% |
Net investment income (loss) | .90% | .88% | 1.10% |
Supplemental Data | | | |
Net assets, end of period (000 omitted) | $ 1,004 | $ 1,526 | $ 2,567 |
Portfolio turnover rate E | 67% | 98% | 91% |
A Total returns would have been lower had certain expenses not been reduced during the periods shown.
B Total returns do not include the effect of the sales charges.
C Calculated based on average shares outstanding during the period.
D Fees and expenses of the underlying Fidelity Central Funds are not included in the Fund's expense ratio. The Fund indirectly bears its proportionate share of the expenses of any underlying Fidelity Central Funds.
E Amount does not include the portfolio activity of any underlying Fidelity Central Funds.
F For the period November 1, 2007 (commencement of operations) to October 31, 2008.
G Expense ratios reflect operating expenses of the class. Expenses before reductions do not reflect amounts reimbursed by the investment adviser or reductions from brokerage service arrangements or reductions from other expense offset arrangements and do not represent the amount paid by the class during periods when reimbursements or reductions occur. Expense ratios before reductions for start-up periods may not be representative of longer-term operating periods. Expenses net of fee waivers reflect expenses after reimbursement by the investment adviser but prior to reductions from brokerage service arrangements or other expense offset arrangements. Expenses net of all reductions represent the net expenses paid by the class.
H Amount represents less than $.01 per share.
See accompanying notes which are an integral part of the financial statements.
Annual Report
Financial Highlights - Class B
Years ended October 31, | 2010 | 2009 | 2008 F |
Selected Per-Share Data | | | |
Net asset value, beginning of period | $ 6.39 | $ 4.86 | $ 10.00 |
Income from Investment Operations | | | |
Net investment income (loss) C | .03 | .02 | .05 |
Net realized and unrealized gain (loss) | .95 | 1.56 | (5.19) |
Total from investment operations | .98 | 1.58 | (5.14) |
Distributions from net investment income | - | (.05) | - |
Redemption fees added to paid in capital C, H | - | - | - |
Net asset value, end of period | $ 7.37 | $ 6.39 | $ 4.86 |
Total Return A, B | 15.34% | 32.95% | (51.40)% |
Ratios to Average Net Assets D, G | | | |
Expenses before reductions | 2.81% | 2.82% | 2.92% |
Expenses net of fee waivers, if any | 2.25% | 2.25% | 2.25% |
Expenses net of all reductions | 2.22% | 2.22% | 2.24% |
Net investment income (loss) | .40% | .38% | .60% |
Supplemental Data | | | |
Net assets, end of period (000 omitted) | $ 327 | $ 1,337 | $ 2,505 |
Portfolio turnover rate E | 67% | 98% | 91% |
A Total returns would have been lower had certain expenses not been reduced during the periods shown.
B Total returns do not include the effect of the contingent deferred sales charge.
C Calculated based on average shares outstanding during the period.
D Fees and expenses of the underlying Fidelity Central Funds are not included in the Fund's expense ratio. The Fund indirectly bears its proportionate share of the expenses of any underlying Fidelity Central Funds.
E Amount does not include the portfolio activity of any underlying Fidelity Central Funds.
F For the period November 1, 2007 (commencement of operations) to October 31, 2008.
G Expense ratios reflect operating expenses of the class. Expenses before reductions do not reflect amounts reimbursed by the investment adviser or reductions from brokerage service arrangements or reductions from other expense offset arrangements and do not represent the amount paid by the class during periods when reimbursements or reductions occur. Expense ratios before reductions for start-up periods may not be representative of longer-term operating periods. Expenses net of fee waivers reflect expenses after reimbursement by the investment adviser but prior to reductions from brokerage service arrangements or other expense offset arrangements. Expenses net of all reductions represent the net expenses paid by the class.
H Amount represents less than $.01 per share.
See accompanying notes which are an integral part of the financial statements.
Annual Report
Financial Highlights - Class C
Years ended October 31, | 2010 | 2009 | 2008 F |
Selected Per-Share Data | | | |
Net asset value, beginning of period | $ 6.39 | $ 4.86 | $ 10.00 |
Income from Investment Operations | | | |
Net investment income (loss) C | .03 | .02 | .05 |
Net realized and unrealized gain (loss) | .94 | 1.56 | (5.19) |
Total from investment operations | .97 | 1.58 | (5.14) |
Distributions from net investment income | - | (.05) | - |
Redemption fees added to paid in capital C, H | - | - | - |
Net asset value, end of period | $ 7.36 | $ 6.39 | $ 4.86 |
Total Return A, B | 15.18% | 33.10% | (51.40)% |
Ratios to Average Net Assets D, G | | | |
Expenses before reductions | 2.80% | 2.85% | 2.92% |
Expenses net of fee waivers, if any | 2.25% | 2.25% | 2.25% |
Expenses net of all reductions | 2.22% | 2.22% | 2.23% |
Net investment income (loss) | .40% | .38% | .60% |
Supplemental Data | | | |
Net assets, end of period (000 omitted) | $ 1,423 | $ 1,714 | $ 2,787 |
Portfolio turnover rate E | 67% | 98% | 91% |
A Total returns would have been lower had certain expenses not been reduced during the periods shown.
B Total returns do not include the effect of the contingent deferred sales charge.
C Calculated based on average shares outstanding during the period.
D Fees and expenses of the underlying Fidelity Central Funds are not included in the Fund's expense ratio. The Fund indirectly bears its proportionate share of the expenses of any underlying Fidelity Central Funds.
E Amount does not include the portfolio activity of any underlying Fidelity Central Funds.
F For the period November 1, 2007 (commencement of operations) to October 31, 2008.
G Expense ratios reflect operating expenses of the class. Expenses before reductions do not reflect amounts reimbursed by the investment adviser or reductions from brokerage service arrangements or reductions from other expense offset arrangements and do not represent the amount paid by the class during periods when reimbursements or reductions occur. Expense ratios before reductions for start-up periods may not be representative of longer-term operating periods. Expenses net of fee waivers reflect expenses after reimbursement by the investment adviser but prior to reductions from brokerage service arrangements or other expense offset arrangements. Expenses net of all reductions represent the net expenses paid by the class.
H Amount represents less than $.01 per share.
See accompanying notes which are an integral part of the financial statements.
Annual Report
Financial Highlights - Total International Equity
Years ended October 31, | 2010 | 2009 | 2008 E |
Selected Per-Share Data | | | |
Net asset value, beginning of period | $ 6.41 | $ 4.91 | $ 10.00 |
Income from Investment Operations | | | |
Net investment income (loss) B | .09 | .07 | .13 |
Net realized and unrealized gain (loss) | .96 | 1.55 | (5.21) |
Total from investment operations | 1.05 | 1.62 | (5.08) |
Distributions from net investment income | (.06) | (.12) | (.01) |
Distributions from net realized gain | (.03) | - | - |
Total distributions | (.09) | (.12) | (.01) |
Redemption fees added to paid in capital B, G | - | - | - |
Net asset value, end of period | $ 7.37 | $ 6.41 | $ 4.91 |
Total Return A | 16.45% | 34.23% | (50.87)% |
Ratios to Average Net Assets C, F | | | |
Expenses before reductions | 1.79% | 1.87% | 1.89% |
Expenses net of fee waivers, if any | 1.25% | 1.25% | 1.25% |
Expenses net of all reductions | 1.22% | 1.22% | 1.23% |
Net investment income (loss) | 1.40% | 1.38% | 1.60% |
Supplemental Data | | | |
Net assets, end of period (000 omitted) | $ 60,826 | $ 33,061 | $ 23,226 |
Portfolio turnover rate D | 67% | 98% | 91% |
A Total returns would have been lower had certain expenses not been reduced during the periods shown.
B Calculated based on average shares outstanding during the period.
C Fees and expenses of the underlying Fidelity Central Funds are not included in the Fund's expense ratio. The Fund indirectly bears its proportionate share of the expenses of any underlying Fidelity Central Funds.
D Amount does not include the portfolio activity of any underlying Fidelity Central Funds.
E For the period November 1, 2007 (commencement of operations) to October 31, 2008.
F Expense ratios reflect operating expenses of the class. Expenses before reductions do not reflect amounts reimbursed by the investment adviser or reductions from brokerage service arrangements or reductions from other expense offset arrangements and do not represent the amount paid by the class during periods when reimbursements or reductions occur. Expense ratios before reductions for start-up periods may not be representative of longer-term operating periods. Expenses net of fee waivers reflect expenses after reimbursement by the investment adviser but prior to reductions from brokerage service arrangements or other expense offset arrangements. Expenses net of all reductions represent the net expenses paid by the class.
G Amount represents less than $.01 per share.
See accompanying notes which are an integral part of the financial statements.
Annual Report
Financial Highlights - Institutional Class
Years ended October 31, | 2010 | 2009 | 2008 E |
Selected Per-Share Data | | | |
Net asset value, beginning of period | $ 6.41 | $ 4.91 | $ 10.00 |
Income from Investment Operations | | | |
Net investment income (loss) B | .10 | .07 | .13 |
Net realized and unrealized gain (loss) | .95 | 1.55 | (5.21) |
Total from investment operations | 1.05 | 1.62 | (5.08) |
Distributions from net investment income | (.08) | (.12) | (.01) |
Distributions from net realized gain | (.03) | - | - |
Total distributions | (.11) | (.12) | (.01) |
Redemption fees added to paid in capital B, G | - | - | - |
Net asset value, end of period | $ 7.35 | $ 6.41 | $ 4.91 |
Total Return A | 16.48% | 34.23% | (50.87)% |
Ratios to Average Net Assets C, F | | | |
Expenses before reductions | 1.82% | 1.80% | 1.91% |
Expenses net of fee waivers, if any | 1.25% | 1.25% | 1.25% |
Expenses net of all reductions | 1.23% | 1.22% | 1.23% |
Net investment income (loss) | 1.40% | 1.38% | 1.60% |
Supplemental Data | | | |
Net assets, end of period (000 omitted) | $ 28 | $ 1,308 | $ 2,733 |
Portfolio turnover rate D | 67% | 98% | 91% |
A Total returns would have been lower had certain expenses not been reduced during the periods shown.
B Calculated based on average shares outstanding during the period.
C Fees and expenses of the underlying Fidelity Central Funds are not included in the Fund's expense ratio. The Fund indirectly bears its proportionate share of the expenses of any underlying Fidelity Central Funds.
D Amount does not include the portfolio activity of any underlying Fidelity Central Funds.
E For the period November 1, 2007 (commencement of operations) to October 31, 2008.
F Expense ratios reflect operating expenses of the class. Expenses before reductions do not reflect amounts reimbursed by the investment adviser or reductions from brokerage service arrangements or reductions from other expense offset arrangements and do not represent the amount paid by the class during periods when reimbursements or reductions occur. Expense ratios before reductions for start-up periods may not be representative of longer-term operating periods. Expenses net of fee waivers reflect expenses after reimbursement by the investment adviser but prior to reductions from brokerage service arrangements or other expense offset arrangements. Expenses net of all reductions represent the net expenses paid by the class.
G Amount represents less than $.01 per share.
See accompanying notes which are an integral part of the financial statements.
Annual Report
Notes to Financial Statements
For the period ended October 31, 2010
1. Organization.
Fidelity Total International Equity Fund (the Fund) is a fund of Fidelity Investment Trust (the Trust) and is authorized to issue an unlimited number of shares. The Trust is registered under the Investment Company Act of 1940, as amended (the 1940 Act), as an open-end management investment company organized as a Massachusetts business trust. The Fund offers Class A, Class T, Class C, Total International Equity and Institutional Class shares, each of which has equal rights as to assets and voting privileges. Effective after the close of business on September 1, 2010, Class B shares were closed to new accounts and additional purchases by existing shareholders. Each class has exclusive voting rights with respect to matters that affect that class. Class B shares will automatically convert to Class A shares after a holding period of seven years from the initial date of purchase. Investment income, realized and unrealized capital gains and losses, the common expenses of the Fund, and certain fund-level expense reductions, if any, are allocated on a pro-rata basis to each class based on the relative net assets of each class to the total net assets of the Fund. Each class differs with respect to transfer agent and distribution and service plan fees incurred. Certain expense reductions also differ by class. The Fund's investments in emerging markets can be subject to social, economic, regulatory, and political uncertainties and can be extremely volatile.
2. Investments in Fidelity Central Funds.
The Fund may invest in Fidelity Central Funds, which are open-end investment companies available only to other investment companies and accounts managed by Fidelity Management & Research Company (FMR) and its affiliates. The Fund's Schedule of Investments lists each of the Fidelity Central Funds held as of period end, if any, as an investment of the Fund, but does not include the underlying holdings of each Fidelity Central Fund. As an Investing Fund, the Fund indirectly bears its proportionate share of the expenses of the underlying Fidelity Central Funds.
The Money Market Central Funds seek preservation of capital and current income and are managed by Fidelity Investments Money Management, Inc. (FIMM), an affiliate of FMR.
A complete unaudited list of holdings for each Fidelity Central Fund is available upon request or at the Securities and Exchange Commission (the SEC) web site at www.sec.gov. In addition, the financial statements of the Fidelity Central Funds, which are not covered by the Fund's Report of Independent Registered Public Accounting Firm, are available on the SEC web site or upon request.
Annual Report
3. Significant Accounting Policies.
The financial statements have been prepared in conformity with accounting principles generally accepted in the United States of America (GAAP), which require management to make certain estimates and assumptions at the date of the financial statements. Actual results could differ from those estimates. The following summarizes the significant accounting policies of the Fund:
Security Valuation. Investments are valued as of 4:00 p.m. Eastern time on the last calendar day of the period. The Fund uses independent pricing services approved by the Board of Trustees to value its investments. When current market prices or quotations are not readily available or reliable, valuations may be determined in good faith in accordance with procedures adopted by the Board of Trustees. Factors used in determining value may include market or security specific events. The frequency with which these procedures are used cannot be predicted and they may be utilized to a significant extent. The value used for net asset value (NAV) calculation under these procedures may differ from published prices for the same securities.
The Fund categorizes the inputs to valuation techniques used to value its investments into a disclosure hierarchy consisting of three levels as shown below.
Level 1 - quoted prices in active markets for identical investments
Level 2 - other significant observable inputs (including quoted prices for similar investments, interest rates, prepayment speeds, etc.)
Level 3 - unobservable inputs (including the fund's own assumptions based on the best information available)
Changes in valuation techniques may result in transfers in or out of an assigned level within the disclosure hierarchy. The aggregate value of investments by input level, as of October 31, 2010, as well as a roll forward of Level 3 securities, is included at the end of the Fund's Schedule of Investments. Valuation techniques used to value the Fund's investments by major category are as follows.
Equity securities, including restricted securities, for which market quotations are readily available, are valued at the last reported sale price or official closing price as reported by an independent pricing service on the primary market or exchange on which they are traded and are categorized as Level 1 in the hierarchy. In the event there were no sales during the day or closing prices are not available, securities are valued at the last quoted bid price or may be valued using the last available price and are generally categorized as Level 2 in the hierarchy. For foreign equity securities, when significant market or security specific events arise, comparisons to the valuation of American Depositary Receipts (ADRs), futures contracts, Exchange-traded funds (ETFs) and certain indexes as well as
Annual Report
Notes to Financial Statements - continued
3. Significant Accounting Policies - continued
Security Valuation - continued
quoted prices for similar securities are used and are categorized as Level 2 in the hierarchy in these circumstances. Utilizing these techniques may result in transfers between Level 1 and Level 2. For restricted equity securities and private placements where observable inputs are limited, assumptions about market activity and risk are used and are categorized as Level 3 in the hierarchy.
ETFs are valued at their last sale price or official closing price as reported by an independent pricing service on the primary market or exchange on which they are traded and are categorized as Level 1 in the hierarchy. In the event there were no sales during the day but the exchange reports a closing bid level, ETFs are valued at the closing bid and would be categorized as Level 1 in the hierarchy. In the event there was no closing bid, ETFs may be valued by another method that the Board of Trustees believes reflects fair value in accordance with the Board's fair value pricing policies and may be categorized as Level 2 in the hierarchy.
Investments in open-end mutual funds, including the Fidelity Central Funds, are valued at their closing net asset value each business day and are categorized as Level 1 in the hierarchy. Short-term securities with remaining maturities of sixty days or less for which quotations are not readily available are valued at amortized cost, which approximates fair value and are categorized as Level 2 in the hierarchy.
Foreign Currency. The Fund uses foreign currency contracts to facilitate transactions in foreign-denominated securities. Gains and losses from these transactions may arise from changes in the value of the foreign currency or if the counterparties do not perform under the contracts' terms.
Foreign-denominated assets, including investment securities, and liabilities are translated into U.S. dollars at the exchange rate at period end. Purchases and sales of investment securities, income and dividends received and expenses denominated in foreign currencies are translated into U.S. dollars at the exchange rate in effect on the transaction date.
The effects of exchange rate fluctuations on investments are included with the net realized and unrealized gain (loss) on investment securities. Other foreign currency transactions resulting in realized and unrealized gain (loss) are disclosed separately.
Annual Report
3. Significant Accounting Policies - continued
Investment Transactions and Income. For financial reporting purposes, the Fund's investment holdings and NAV include trades executed through the end of the last business day of the period. The NAV per share for processing shareholder transactions is calculated as of the close of business of the New York Stock Exchange (NYSE), normally 4:00 p.m. Eastern time and includes trades executed through the end of the prior business day. Gains and losses on securities sold are determined on the basis of identified cost. Dividend income is recorded on the ex-dividend date, except for certain dividends from foreign securities where the ex-dividend date may have passed, which are recorded as soon as the Fund is informed of the ex-dividend date. Non-cash dividends included in dividend income, if any, are recorded at the fair market value of the securities received. Distributions received on securities that represent a return of capital or capital gain are recorded as a reduction of cost of investments and/or as a realized gain. The Fund estimates the components of distributions received that may be considered return of capital distributions or capital gain distributions. Interest income and distributions from the Fidelity Central Funds are accrued as earned. Interest income includes coupon interest and amortization of premium and accretion of discount on debt securities. Investment income is recorded net of foreign taxes withheld where recovery of such taxes is uncertain.
Expenses. Most expenses of the Trust can be directly attributed to a fund. Expenses which cannot be directly attributed are apportioned amongst each fund in the Trust. Expense estimates are accrued in the period to which they relate and adjustments are made when actual amounts are known.
Income Tax Information and Distributions to Shareholders. Each year the Fund intends to qualify as a regulated investment company, including distributing substantially all of its taxable income and realized gains under Subchapter M of the Internal Revenue Code and filing its U.S. federal tax return. As a result, no provision for income taxes is required. As of October 31, 2010, the Fund did not have any unrecognized tax benefits in the accompanying financial statements. A fund's federal tax return is subject to examination by the Internal Revenue Service (IRS) for a period of three years. Foreign taxes are provided for based on the Fund's understanding of the tax rules and rates that exist in the foreign markets in which it invests.
Distributions are declared and recorded on the ex-dividend date. Income dividends and capital gain distributions are declared separately for each class. Income and capital gain distributions are determined in accordance with income tax regulations, which may differ from GAAP.
Capital accounts within the financial statements are adjusted for permanent book-tax differences. These adjustments have no impact on net assets or the results of operations. Temporary book-tax differences will reverse in a subsequent period.
Annual Report
Notes to Financial Statements - continued
3. Significant Accounting Policies - continued
Income Tax Information and Distributions to Shareholders - continued
Book-tax differences are primarily due to the short-term gain distributions from the Underlying Funds, foreign currency transactions, passive foreign investment companies (PFIC), partnerships, capital loss carryforwards and losses deferred due to wash sales.
The federal tax cost of investment securities and unrealized appreciation (depreciation) as of period end were as follows:
Gross unrealized appreciation | $ 8,591,290 |
Gross unrealized depreciation | (6,168,619) |
Net unrealized appreciation (depreciation) | $ 2,422,671 |
| |
Tax Cost | $ 66,113,626 |
The tax-based components of distributable earnings as of period end were as follows:
Undistributed ordinary income | $ 921,411 |
Capital loss carryforward | $ (24,325,764) |
Net unrealized appreciation (depreciation) | $ 2,430,319 |
The tax character of distributions paid was as follows:
| October 31, 2010 | October 31, 2009 |
Ordinary Income | $ 581,158 | $ 859,670 |
Short-Term Trading (Redemption) Fees. Shares held by investors in the Fund less than 30 days are subject to a redemption fee equal to 1.00% of the net asset value of shares redeemed. All redemption fees, which reduce the proceeds of the shareholder redemption, are retained by the Funds and accounted for as an addition to paid in capital.
4. Operating Policies.
Repurchase Agreements. FMR has received an Exemptive Order from the SEC which permits the Fund and other affiliated entities of FMR to transfer uninvested cash balances into joint trading accounts which are then invested in repurchase agreements. The Fund may also invest directly with institutions in repurchase agreements. Repurchase agreements are collateralized by government or non-government securities. Upon settlement date, collateral is held in segregated accounts with custodian banks and may be obtained in the event of a default of the counterparty. The Fund monitors, on a daily basis, the value of the collateral to ensure it is at least equal to the principal amount of the repurchase agreement (including accrued interest). In the event of a default by the
Annual Report
4. Operating Policies - continued
Repurchase Agreements - continued
counterparty, realization of the collateral proceeds could be delayed, during which time the value of the collateral may decline.
Restricted Securities. The Fund may invest in securities that are subject to legal or contractual restrictions on resale. These securities generally may be resold in transactions exempt from registration or to the public if the securities are registered. Disposal of these securities may involve time-consuming negotiations and expense, and prompt sale at an acceptable price may be difficult. Information regarding restricted securities is included at the end of the Fund's Schedule of Investments.
5. Purchases and Sales of Investments.
Purchases and sales of securities, other than short-term securities, aggregated $54,337,237 and $37,096,392, respectively.
6. Fees and Other Transactions with Affiliates.
Management Fee. FMR and its affiliates provide the Fund with investment management related services for which the Fund pays a monthly management fee. The management fee is the sum of an individual fund fee rate that is based on an annual rate of .45% of the Fund's average net assets and a group fee rate that averaged .26% during the period. The group fee rate is based upon the average net assets of all the mutual funds advised by FMR. The group fee rate decreases as assets under management increase and increases as assets under management decrease. In addition, the management fee is subject to a performance adjustment (up to a maximum of ± .20% of the Fund's average net assets over a 36 month performance period). The upward or downward adjustment to the management fee is based on the relative investment performance of Total International Equity as compared to an appropriate benchmark index. The Fund's performance adjustment took effect in November 2008. Subsequent months will be added until the performance period includes 36 months. For the period, the total annual management fee rate, including the performance adjustment, was .65% of the Fund's average net assets.
Distribution and Service Plan Fees. In accordance with Rule 12b-1 of the 1940 Act, the Fund has adopted separate Distribution and Service Plans for each class of shares. Certain classes pay Fidelity Distributors Corporation (FDC), an affiliate of FMR, separate Distribution and Service Fees, each of which is based on an annual percentage of each class' average net assets. In addition, FDC may pay financial intermediaries for
Annual Report
Notes to Financial Statements - continued
6. Fees and Other Transactions with Affiliates - continued
Distribution and Service Plan Fees - continued
selling shares of the Fund and providing shareholder support services. For the period, the Distribution and Service Fee rates, total fees and amounts retained by FDC were as follows:
| Distribution
Fee | Service
Fee | Total
Fees | Retained
by FDC |
Class A | -% | .25% | $ 10,450 | $ - |
Class T | .25% | .25% | 4,688 | 238 |
Class B | .75% | .25% | 3,367 | 2,686 |
Class C | .75% | .25% | 13,511 | 6,154 |
| | | $ 32,016 | $ 9,078 |
Sales Load. FDC receives a front-end sales charge of up to 5.75% for selling Class A shares, and 3.50% for selling Class T shares, some of which is paid to financial intermediaries for selling shares of the Fund. FDC receives the proceeds of contingent deferred sales charges levied on Class A, Class T, Class B, and Class C redemptions. These charges depend on the holding period. The deferred sales charges range from 5% to 1% for Class B, 1% for Class C, 1.00% for certain purchases of Class A shares (1.00% to .50% prior to July 12, 2010) and .25% for certain purchases of Class T shares.
For the period, sales charge amounts retained by FDC were as follows:
| Retained
by FDC |
Class A | $ 2,966 |
Class T | 2,078 |
Class B* | 920 |
Class C* | 13 |
| $ 5,977 |
* When Class B and Class C shares are initially sold, FDC pays commissions from its own resources to financial intermediaries through which the sales are made.
Transfer Agent Fees. Fidelity Investments Institutional Operations Company, Inc. (FIIOC), an affiliate of FMR, is the transfer, dividend disbursing and shareholder servicing agent for each class of the Fund. FIIOC receives account fees and asset-based fees that vary according to the account size and type of account of the shareholders of the respective classes of the Fund. FIIOC pays for typesetting, printing and mailing of
Annual Report
6. Fees and Other Transactions with Affiliates - continued
Transfer Agent Fees - continued
shareholder reports, except proxy statements. For the period, transfer agent fees for each class were as follows:
| Amount | % of
Average
Net Assets |
Class A | $ 11,393 | .27 |
Class T | 3,002 | .32 |
Class B | 954 | .28 |
Class C | 4,057 | .30 |
Total International Equity | 148,596 | .29 |
Institutional Class | 395 | .23 |
| $ 168,397 | |
Accounting and Security Lending Fees. Fidelity Service Company, Inc. (FSC), an affiliate of FMR, maintains the Fund's accounting records. The accounting fee is based on the level of average net assets for the month. Under a separate contract, FSC administers the security lending program. The security lending fee is based on the number and duration of lending transactions.
Brokerage Commissions. The Fund placed a portion of its portfolio transactions with brokerage firms which are affiliates of the investment adviser. The commissions paid to these affiliated firms were $437 for the period.
7. Committed Line of Credit.
The Fund participates with other funds managed by FMR or an affiliate in a $3.75 billion credit facility (the "line of credit") to be utilized for temporary or emergency purposes to fund shareholder redemptions or for other short-term liquidity purposes. The Fund has agreed to pay commitment fees on its pro-rata portion of the line of credit, which amounted to $219 and is reflected in Miscellaneous expenses on the Statement of Operations. During the period, there were no borrowings on this line of credit.
8. Security Lending.
The Fund lends portfolio securities through a lending agent from time to time in order to earn additional income. The lending agent may loan securities to certain qualified borrowers, including Fidelity Capital Markets (FCM), a broker-dealer affiliated with the Fund. On the settlement date of the loan, the Fund receives collateral (in the form of U.S. Treasury obligations, letters of credit and/or cash) against the loaned securities and maintains collateral in an amount not less than 100% of the market value of the loaned
Annual Report
Notes to Financial Statements - continued
8. Security Lending - continued
securities during the period of the loan. The market value of the loaned securities is determined at the close of business of the Fund and any additional required collateral is delivered to the Fund on the next business day. If the borrower defaults on its obligation to return the securities loaned because of insolvency or other reasons, a fund could experience delays and costs in recovering the securities loaned or in gaining access to the collateral. Any cash collateral received is invested in the Fidelity Securities Lending Cash Central Fund. The value of loaned securities and cash collateral at period end are disclosed on the Fund's Statement of Assets and Liabilities. Security lending income represents the income earned on investing cash collateral, less rebates paid to borrowers and lending agent fees associated with the loan, plus any premium payments received for lending certain types of securities. Security lending income is presented in the Statement of Operations as a component of income from Fidelity Central Funds. Total security lending income during the period amounted to $17,945. During the period, there were no securities loaned to FCM.
9. Expense Reductions.
FMR voluntarily agreed to reimburse each class to the extent annual operating expenses exceeded certain levels of average net assets as noted in the table below. Some expenses, for example interest expense, including commitment fees, are excluded from this reimbursement.
The following classes were in reimbursement during the period:
| Expense
Limitations | Reimbursement
from adviser |
| | |
Class A | 1.50% | $ 22,035 |
Class T | 1.75% | 5,266 |
Class B | 2.25% | 1,870 |
Class C | 2.25% | 7,481 |
Total International Equity | 1.25% | 272,664 |
Institutional Class | 1.25% | 962 |
| | $ 310,278 |
Effective November 1, 2010 the expense limitation will be changed to 1.45%, 1.70%, 2.20%, 2.20%, 1.20% and 1.20% for Class A, T, B, C, Total International Equity and Institutional, respectively.
Many of the brokers with whom FMR places trades on behalf of the Fund provided services to the Fund in addition to trade execution. These services included payments of certain expenses on behalf of the Fund totaling $14,445 for the period.
Annual Report
10. Distributions to Shareholders.
Distributions to shareholders of each class were as follows:
Years ended October 31, | 2010 | 2009 |
From net investment income | | |
Class A | $ 26,391 | $ 131,963 |
Class T | - | 45,379 |
Class B | - | 24,856 |
Class C | - | 30,949 |
Total International Equity | 382,451 | 560,888 |
Institutional Class | 2,381 | 65,635 |
Total | $ 411,223 | $ 859,670 |
From net realized gain | | |
Class A | $ 14,995 | $ - |
Total International Equity | 154,214 | - |
Institutional Class | 726 | - |
Total | $ 169,935 | $ - |
11. Share Transactions.
Transactions for each class of shares were as follows:
| Shares | Dollars |
Years ended October 31, | 2010 | 2009 | 2010 | 2009 |
Class A | | | | |
Shares sold | 443,125 | 372,557 | $ 2,924,922 | $ 1,887,197 |
Reinvestment of distributions | 5,568 | 30,531 | 37,804 | 130,977 |
Shares redeemed | (347,260) | (1,035,215) | (2,296,503) | (5,265,367) |
Net increase (decrease) | 101,433 | (632,127) | $ 666,223 | $ (3,247,193) |
Class T | | | | |
Shares sold | 121,719 | 59,609 | $ 807,663 | $ 314,219 |
Reinvestment of distributions | - | 10,553 | - | 45,379 |
Shares redeemed | (224,749) | (357,387) | (1,531,457) | (2,032,994) |
Net increase (decrease) | (103,030) | (287,225) | $ (723,794) | $ (1,673,396) |
Class B | | | | |
Shares sold | 30,066 | 19,155 | $ 198,826 | $ 103,145 |
Reinvestment of distributions | - | 5,760 | - | 24,827 |
Shares redeemed | (194,792) | (331,368) | (1,332,260) | (1,871,062) |
Net increase (decrease) | (164,726) | (306,453) | $ (1,133,434) | $ (1,743,090) |
Annual Report
Notes to Financial Statements - continued
11. Share Transactions - continued
| Shares | Dollars |
Years ended October 31, | 2010 | 2009 | 2010 | 2009 |
Class C | | | | |
Shares sold | 86,496 | 111,127 | $ 580,588 | $ 616,982 |
Reinvestment of distributions | - | 7,163 | - | 30,872 |
Shares redeemed | (161,545) | (423,400) | (1,102,805) | (2,395,281) |
Net increase (decrease) | (75,049) | (305,110) | $ (522,217) | $ (1,747,427) |
Total International Equity | | | | |
Shares sold | 6,833,012 | 2,869,211 | $ 45,955,028 | $ 16,097,831 |
Reinvestment of distributions | 74,043 | 124,381 | 502,009 | 533,594 |
Shares redeemed | (3,806,841) | (2,570,692) | (24,965,317) | (12,899,110) |
Net increase (decrease) | 3,100,214 | 422,900 | $ 21,491,720 | $ 3,732,315 |
Institutional Class | | | | |
Shares sold | 377 | 5,817 | $ 2,481 | $ 30,049 |
Reinvestment of distributions | 460 | 15,268 | 3,106 | 65,500 |
Shares redeemed | (201,123) | (373,992) | (1,373,455) | (2,056,801) |
Net increase (decrease) | (200,286) | (352,907) | $ (1,367,868) | $ (1,961,252) |
12. Other.
The Fund's organizational documents provide former and current trustees and officers with a limited indemnification against liabilities arising in connection with the performance of their duties to the Fund. In the normal course of business, the Fund may also enter into contracts that provide general indemnifications. The Fund's maximum exposure under these arrangements is unknown as this would be dependent on future claims that may be made against the Fund. The risk of material loss from such claims is considered remote.
Annual Report
To the Trustees of Fidelity Investment Trust and Shareholders of Fidelity Total International Equity Fund:
We have audited the accompanying statement of assets and liabilities of Fidelity Total International Equity Fund (the Fund), a fund of Fidelity Investment Trust, including the schedule of investments, as of October 31, 2010, and the related statement of operations for the year then ended, the statement of changes in net assets for each of the two years in the period then ended, and the financial highlights for each of the periods presented. These financial statements and financial highlights are the responsibility of the Fund's management. Our responsibility is to express an opinion on these financial statements and financial highlights based on our audits.
We conducted our audits in accordance with standards of the Public Company Accounting Oversight Board (United States). Those standards require that we plan and perform the audit to obtain reasonable assurance about whether the financial statements and financial highlights are free of material misstatement. The Fund is not required to have, nor were we engaged to perform, an audit of its internal control over financial reporting. Our audits included consideration of internal control over financial reporting as a basis for designing audit procedures that are appropriate in the circumstances, but not for the purpose of expressing an opinion on the effectiveness of the Fund's internal control over financial reporting. Accordingly, we express no such opinion. An audit also includes examining, on a test basis, evidence supporting the amounts and disclosures in the financial statements, assessing the accounting principles used and significant estimates made by management, as well as evaluating the overall financial statement presentation. Our procedures included confirmation of securities owned as of October 31, 2010, by correspondence with the custodians and brokers; where replies were not received from brokers, we performed other auditing procedures. We believe that our audits provide a reasonable basis for our opinion.
In our opinion, the financial statements and financial highlights referred to above present fairly, in all material respects, the financial position of Fidelity Total International Equity Fund as of October 31, 2010, the results of its operations for the year then ended, the changes in its net assets for each of the two years in the period then ended, and the financial highlights for each of the periods presented, in conformity with accounting principles generally accepted in the United States of America.
/s/ Deloitte & Touche LLP
DELOITTE & TOUCHE LLP
Boston, Massachusetts
December 14, 2010
Annual Report
The Trustees, Member of the Advisory Board, and executive officers of the trust and fund, as applicable, are listed below. The Board of Trustees governs the fund and is responsible for protecting the interests of shareholders. The Trustees are experienced executives who meet periodically throughout the year to oversee the fund's activities, review contractual arrangements with companies that provide services to the fund, oversee management of the risks associated with such activities and contractual arrangements, and review the fund's performance. Except for James C. Curvey, each of the Trustees oversees 221 funds advised by FMR or an affiliate. Mr. Curvey oversees 410 funds advised by FMR or an affiliate.
The Trustees hold office without limit in time except that (a) any Trustee may resign; (b) any Trustee may be removed by written instrument, signed by at least two-thirds of the number of Trustees prior to such removal; (c) any Trustee who requests to be retired or who has become incapacitated by illness or injury may be retired by written instrument signed by a majority of the other Trustees; and (d) any Trustee may be removed at any special meeting of shareholders by a two-thirds vote of the outstanding voting securities of the trust. Each Trustee who is not an interested person (as defined in the 1940 Act) (Independent Trustee), shall retire not later than the last day of the calendar year in which his or her 72nd birthday occurs. The Independent Trustees may waive this mandatory retirement age policy with respect to individual Trustees. The executive officers and Advisory Board Member hold office without limit in time, except that any officer and Advisory Board Member may resign or may be removed by a vote of a majority of the Trustees at any regular meeting or any special meeting of the Trustees. Except as indicated, each individual has held the office shown or other offices in the same company for the past five years.
Experience, Skills, Attributes, and Qualifications of the Fund's Trustees. The Governance and Nominating Committee has adopted a statement of policy that describes the experience, qualifications, attributes, and skills that are necessary and desirable for potential Independent Trustee candidates (Statement of Policy). The Board believes that each Trustee satisfied at the time he or she was initially elected or appointed a Trustee, and continues to satisfy, the standards contemplated by the Statement of Policy. The Governance and Nominating Committee also engages professional search firms to help identify potential Independent Trustee candidates who have the experience, qualifications, attributes, and skills consistent with the Statement of Policy. From time to time, additional criteria based on the composition and skills of the current Independent Trustees, as well as experience or skills that may be appropriate in light of future changes to board composition, business conditions, and regulatory or other developments, have also been considered by the professional search firms and the Governance and Nominating Committee. In addition, the Board takes into account the Trustees' commitment and participation in Board and committee meetings, as well as their leadership of standing and ad hoc committees throughout their tenure.
In determining that a particular Trustee was and continues to be qualified to serve as a Trustee, the Board has considered a variety of criteria, none of which, in isolation, was controlling. The Board believes that, collectively, the Trustees have balanced and diverse experience, qualifications, attributes, and skills, which allow the Board to operate effectively in governing the fund and protecting the interests of shareholders. Information about the specific experience, skills, attributes, and qualifications of each Trustee, which in each case led to the Board's conclusion that the Trustee should serve (or continue to serve) as a trustee of the fund, is provided below.
Annual Report
Trustees and Officers - continued
Board Structure and Oversight Function. Edward C. Johnson 3d is an interested person (as defined in the 1940 Act) and currently serves as Chairman. The Trustees have determined that an interested Chairman is appropriate and benefits shareholders because an interested Chairman has a personal and professional stake in the quality and continuity of services provided to the fund. Independent Trustees exercise their informed business judgment to appoint an individual of their choosing to serve as Chairman, regardless of whether the Trustee happens to be independent or a member of management. The Independent Trustees have determined that they can act independently and effectively without having an Independent Trustee serve as Chairman and that a key structural component for assuring that they are in a position to do so is for the Independent Trustees to constitute a substantial majority for the Board. The Independent Trustees also regularly meet in executive session. Ned C. Lautenbach serves as Chairman of the Independent Trustees and as such (i) acts as a liaison between the Independent Trustees and management with respect to matters important to the Independent Trustees and (ii) with management prepares agendas for Board meetings.
Fidelity funds are overseen by different Boards of Trustees. The fund's Board oversees Fidelity's equity and high income funds and another Board oversees Fidelity's investment-grade bond, money market, and asset allocation funds. The asset allocation funds may invest in Fidelity funds overseen by the fund's Board. The use of separate Boards, each with its own committee structure, allows the Trustees of each group of Fidelity funds to focus on the unique issues of the funds they oversee, including common research, investment, and operational issues. On occasion, the separate Boards establish joint committees to address issues of overlapping consequences for the Fidelity funds overseen by each Board.
The Trustees operate using a system of committees to facilitate the timely and efficient consideration of all matters of importance to the Trustees, the fund, and fund shareholders and to facilitate compliance with legal and regulatory requirements and oversight of the fund's activities and associated risks. The Board, acting through its committees, has charged FMR and its affiliates with (i) identifying events or circumstances the occurrence of which could have demonstrably adverse effects on the fund's business and/or reputation; (ii) implementing processes and controls to lessen the possibility that such events or circumstances occur or to mitigate the effects of such events or circumstances if they do occur; and (iii) creating and maintaining a system designed to evaluate continuously business and market conditions in order to facilitate the identification and implementation processes described in (i) and (ii) above. Because the day-to-day operations and activities of the fund are carried out by or through FMR, its affiliates and other service providers, the fund's exposure to risks is mitigated but not eliminated by the processes overseen by the Trustees. While each of the Board's committees has responsibility for overseeing different aspects of the fund's activities, oversight is exercised primarily through the Operations, Audit, and Compliance Committees. Appropriate personnel, including but not limited to the fund's Chief Compliance Officer (CCO), FMR's internal auditor, the independent accountants, the fund's Treasurer and portfolio management personnel, make periodic reports to the Board's committees, as appropriate. The responsibilities of each committee, including their oversight responsibilities, are described further under "Standing Committees of the Fund's Trustees."
Annual Report
The fund's Statement of Additional Information (SAI) includes more information about the Trustees. To request a free copy, call Fidelity at 1-800-544-8544.
Interested Trustees*:
Correspondence intended for each Trustee who is an interested person may be sent to Fidelity Investments, 82 Devonshire Street, Boston, Massachusetts 02109.
Name, Age; Principal Occupations and Other Relevant Experience+ |
Edward C. Johnson 3d (80) |
| Year of Election or Appointment: 1984 Mr. Johnson is Trustee and Chairman of the Board of Trustees of certain Trusts. Mr. Johnson serves as Chief Executive Officer, Chairman, and a Director of FMR LLC; Chairman and a Director of FMR; Chairman and a Director of Fidelity Research & Analysis Company (FRAC); Chairman and a Director of Fidelity Investments Money Management, Inc.; and Chairman and a Director of FMR Co., Inc. In addition, Mr. Johnson serves as Chairman and Director of FIL Limited. Previously, Mr. Johnson served as President of FMR LLC (2006-2007). |
James C. Curvey (75) |
| Year of Election or Appointment: 2007 Mr. Curvey also serves as Trustee (2007-present) of other investment companies advised by FMR. Mr. Curvey is a Director of Fidelity Investments Money Management, Inc. (2009-present), Director of Fidelity Research & Analysis Co. (2009-present) and Director of FMR and FMR Co., Inc. (2007-present). Mr. Curvey is also Vice Chairman (2007-present) and Director of FMR LLC. In addition, Mr. Curvey serves as an Overseer for the Boston Symphony Orchestra and a member of the Trustees of Villanova University. Previously, Mr. Curvey was the Vice Chairman (2006-2007) and Director (2000-2007) of FMR Corp. |
* Trustees have been determined to be "Interested Trustees" by virtue of, among other things, their affiliation with the trust or various entities under common control with FMR.
Annual Report
Trustees and Officers - continued
+ The information above includes each Trustee's principal occupation during the last five years and other information relating to the experience, attributes, and skills relevant to each Trustee's qualifications to serve as a Trustee, which led to the conclusion that each Trustee should serve as a Trustee for the fund.
Independent Trustees:
Correspondence intended for each Independent Trustee (that is, the Trustees other than the Interested Trustees) may be sent to Fidelity Investments, P.O. Box 55235, Boston, Massachusetts 02205-5235.
Name, Age; Principal Occupations and Other Relevant Experience+ |
Dennis J. Dirks (62) |
| Year of Election or Appointment: 2005 Prior to his retirement in May 2003, Mr. Dirks was Chief Operating Officer and a member of the Board of The Depository Trust & Clearing Corporation (DTCC). He also served as President, Chief Operating Officer, and Board member of The Depository Trust Company (DTC) and President and Board member of the National Securities Clearing Corporation (NSCC). In addition, Mr. Dirks served as Chief Executive Officer and Board member of the Government Securities Clearing Corporation, Chief Executive Officer and Board member of the Mortgage-Backed Securities Clearing Corporation, as a Trustee and a member of the Finance Committee of Manhattan College (2005-2008), and as a Trustee and a member of the Finance Committee of AHRC of Nassau County (2006-2008). Mr. Dirks is a member of the Independent Directors Council (IDC) Governing Council (2010-Present) and Board of Directors for The Brookville Center for Children's Services, Inc. (2009-present). |
Alan J. Lacy (57) |
| Year of Election or Appointment: 2008 Mr. Lacy serves as Senior Adviser (2007-present) of Oak Hill Capital Partners, L.P. (private equity). Mr. Lacy also served as Chief Executive Officer (2000-2005) and Vice Chairman (2005-2006) of Sears Holdings Corporation and Sears, Roebuck and Co. (retail). In addition, Mr. Lacy serves as a member of the Board of Directors of The Western Union Company (global money transfer, 2006-present) and Bristol-Myers Squibb Company (global pharmaceuticals, 2007-present). Mr. Lacy is Chairman (2008-present) and a member (2006-present) of the Board of Trustees of The National Parks Conservation Association. |
Ned C. Lautenbach (66) |
| Year of Election or Appointment: 2000 Mr. Lautenbach is Chairman of the Independent Trustees of the Equity and High Income Funds (2006-present). Mr. Lautenbach currently serves as the Lead Director of the Eaton Corporation Board of Directors (diversified industrial, 1997-present). Mr. Lautenbach is also a member of the Board of Directors of the Philharmonic Center for the Arts in Naples, Florida (1999-present); a member of the Board of Trustees of Fairfield University (2005-present); and a member of the Council on Foreign Relations (1994-present). Previously, Mr. Lautenbach was a Partner/Advisory Partner at Clayton, Dubilier & Rice, Inc. (private equity investment, 1998-2010), as well as a Director of Sony Corporation (2006-2007). |
Joseph Mauriello (66) |
| Year of Election or Appointment: 2008 Prior to his retirement in January 2006, Mr. Mauriello served in numerous senior management positions including Deputy Chairman and Chief Operating Officer (2004-2005), and Vice Chairman of Financial Services (2002-2004) of KPMG LLP US (professional services, 1965-2005). Mr. Mauriello currently serves as a member of the Board of Directors of XL Group plc. (global insurance and re-insurance, 2006-present) and of Arcadia Resources Inc. (health care services and products, 2007-present). Previously, Mr. Mauriello served as a Director of the Hamilton Funds of the Bank of New York (2006-2007). |
Cornelia M. Small (66) |
| Year of Election or Appointment: 2005 Ms. Small is a member of the Board of Directors of the Teagle Foundation (2009-present). Ms. Small is also a member of the Investment Committee, and Chair (2008-present) and a member of the Board of Trustees of Smith College. In addition, Ms. Small serves on the Investment Committee of the Berkshire Taconic Community Foundation (2008-present). Previously, Ms. Small served as Chairperson of the Investment Committee (2002-2008) of Smith College. In addition, Ms. Small served as Chief Investment Officer, Director of Global Equity Investments, and a member of the Board of Directors of Scudder, Stevens & Clark and Scudder Kemper Investments. |
William S. Stavropoulos (71) |
| Year of Election or Appointment: 2001 Mr. Stavropoulos is Vice Chairman of the Independent Trustees of the Equity and High Income Funds (2006-present). Mr. Stavropoulos serves as President and Founder of the Michigan Baseball Foundation, the Great Lakes Loons (2007-present). Mr. Stavropoulos is Chairman Emeritus of the Board of Directors of The Dow Chemical Company, where he previously served in numerous senior management positions, including President, CEO (1995-2000; 2002-2004), Chairman of the Executive Committee (2000-2006), and as a member of the Board of Directors (1990-2006). Currently, Mr. Stavropoulos is Chairman of Univar (global distributor of commodity and specialty chemicals, 2010-present), a Director of Teradata Corporation (data warehousing and technology solutions, 2008-present), Chemical Financial Corporation, Maersk Inc. (industrial conglomerate), Tyco International, Inc. (multinational manufacturing and services, 2007-present), and a member of the Advisory Board for Metalmark Capital (private equity investment, 2005-present). Mr. Stavropoulos is a special advisor to Clayton, Dubilier & Rice, Inc. (private equity investment). In addition, Mr. Stavropoulos is a member of the University of Notre Dame Advisory Council for the College of Science. |
David M. Thomas (61) |
| Year of Election or Appointment: 2008 Previously, Mr. Thomas served as Executive Chairman (2005-2006) and Chairman and Chief Executive Officer (2000-2005) of IMS Health, Inc. (pharmaceutical and healthcare information solutions). In addition, Mr. Thomas serves as a member of the Board of Directors of Fortune Brands, Inc. (consumer products), and Interpublic Group of Companies, Inc. (marketing communication, 2004-present). |
Michael E. Wiley (60) |
| Year of Election or Appointment: 2008 Mr. Wiley also serves as a Director of Asia Pacific Exploration Consolidated (international oil and gas exploration and production, 2008-present). Mr. Wiley serves as a Director of Tesoro Corporation (independent oil refiner and marketer, 2005-present), and a Director of Bill Barrett Corporation (exploration and production, 2005-present). In addition, Mr. Wiley also serves as a Director of Post Oak Bank (privately-held bank, 2004-present). Previously, Mr. Wiley served as a member of the Board of Trustees of the University of Tulsa (2000-2006; 2007-2010), as a Senior Energy Advisor of Katzenbach Partners, LLC (consulting, 2006-2007), as an Advisory Director of Riverstone Holdings (private investment), Chairman, President, and CEO of Baker Hughes, Inc. (oilfield services, 2000-2004), and as Director of Spinnaker Exploration Company (exploration and production, 2001-2005). |
Annual Report
+ The information above includes each Trustee's principal occupation during the last five years and other information relating to the experience, attributes, and skills relevant to each Trustee's qualifications to serve as a Trustee, which led to the conclusion that each Trustee should serve as a Trustee for the fund.
Advisory Board Member and Executive Officers:
Correspondence intended for each executive officer and Peter S. Lynch may be sent to Fidelity Investments, 82 Devonshire Street, Boston, Massachusetts 02109.
Name, Age; Principal Occupation |
Peter S. Lynch (66) |
| Year of Election or Appointment: 2003 Member of the Advisory Board of Fidelity's Equity and High Income Funds. Mr. Lynch is Vice Chairman and a Director of FMR and FMR Co., Inc. In addition, Mr. Lynch serves as a Trustee of Boston College and as the Chairman of the Inner-City Scholarship Fund. Previously, Mr. Lynch served on the Special Olympics International Board of Directors (1997-2006). |
Kenneth B. Robins (41) |
| Year of Election or Appointment: 2008 President and Treasurer of Fidelity's Equity and High Income Funds. Mr. Robins also serves as President and Treasurer (2010-present) and Assistant Treasurer (2009-present) of other Fidelity funds and is an employee of Fidelity Investments (2004-present). Previously, Mr. Robins served as Deputy Treasurer of the Fidelity funds (2005-2008) and Treasurer and Chief Financial Officer of The North Carolina Capital Management Trust: Cash and Term Portfolios (2006-2008). |
Bruce T. Herring (45) |
| Year of Election or Appointment: 2006 Vice President of certain Equity Funds. Mr. Herring also serves as Chief Investment Officer and Director of Fidelity Management & Research (U.K.) Inc. (2010-present) and Group Chief Investments Officer of FMR. Previously, Mr. Herring served as Vice President (2005-2006) and Senior Vice President (2006-2007) of Fidelity Management & Research Company, Vice President of FMR Co., Inc. (2001-2007) and as a portfolio manager for Fidelity U.S. Equity Funds. |
Brian B. Hogan (46) |
| Year of Election or Appointment: 2009 Vice President of certain Equity Funds and Vice President of Sector Funds. Mr. Hogan also serves as President of FMR's Equity Division (2009-present). Previously, Mr. Hogan served as Senior Vice President, Equity Research of FMR (2006-2009) and as a portfolio manager. |
Scott C. Goebel (42) |
| Year of Election or Appointment: 2008 Secretary and Chief Legal Officer (CLO) of the Fidelity funds. Mr. Goebel also serves as Secretary and CLO of The North Carolina Capital Management Trust: Cash and Term Portfolio (2008-present); General Counsel, Secretary, and Senior Vice President of FMR (2008-present) and FMR Co., Inc. (2008-present); Deputy General Counsel of FMR LLC; Chief Legal Officer of Fidelity Management & Research (Hong Kong) Limited (2008-present) and Assistant Secretary of Fidelity Management & Research (Japan) Inc. (2008-present), Fidelity Investments Money Management, Inc. (2008-present), Fidelity Management & Research (U.K.) Inc. (2008-present), and Fidelity Research and Analysis Company (2008-present). Previously, Mr. Goebel served as Assistant Secretary of the Funds (2007-2008) and as Vice President and Secretary of Fidelity Distributors Corporation (FDC) (2005-2007). |
William C. Coffey (41) |
| Year of Election or Appointment: 2009 Assistant Secretary of Fidelity's Equity and High Income Funds. Mr. Coffey also serves as Senior Vice President and Deputy General Counsel of FMR LLC (2010-present), and is an employee of Fidelity Investments. Previously, Mr. Coffey served as Vice President and Associate General Counsel of FMR LLC (2005-2009). |
Holly C. Laurent (56) |
| Year of Election or Appointment: 2008 Anti-Money Laundering (AML) Officer of the Fidelity funds. Ms. Laurent also serves as AML Officer of The North Carolina Capital Management Trust: Cash and Term Portfolio (2008-present) and is an employee of Fidelity Investments. Previously, Ms. Laurent was Senior Vice President and Head of Legal for Fidelity Business Services India Pvt. Ltd. (2006-2008), and Senior Vice President, Deputy General Counsel and Group Head for FMR LLC (2005-2006). |
Christine Reynolds (52) |
| Year of Election or Appointment: 2008 Chief Financial Officer of the Fidelity funds. Ms. Reynolds became President of Fidelity Pricing and Cash Management Services (FPCMS) in August 2008. Ms. Reynolds served as Chief Operating Officer of FPCMS (2007-2008). Previously, Ms. Reynolds served as President, Treasurer, and Anti-Money Laundering officer of the Fidelity funds (2004-2007). |
Kenneth A. Rathgeber (63) |
| Year of Election or Appointment: 2004 Chief Compliance Officer of Fidelity's Equity and High Income Funds. Mr. Rathgeber is Chief Compliance Officer of Fidelity Management & Research (Hong Kong) Limited (2008-present), Fidelity Management & Research (Japan) Inc. (2008-present), FMR (2005-present), FMR Co., Inc. (2005-present), Fidelity Management & Research (U.K.) Inc. (2005-present), Fidelity Research & Analysis Company (2005-present), Fidelity Investments Money Management, Inc. (2005-present), Pyramis Global Advisors, LLC (2005-present), and Strategic Advisers, Inc. (2005-present). |
Jeffrey S. Christian (49) |
| Year of Election or Appointment: 2009 Deputy Treasurer of the Fidelity funds. Mr. Christian is an employee of Fidelity Investments. Previously, Mr. Christian served as Chief Financial Officer (2008-2009) of certain Fidelity funds and Senior Vice President of Fidelity Pricing and Cash Management Services (FPCMS) (2004-2009). |
Bryan A. Mehrmann (49) |
| Year of Election or Appointment: 2005 Deputy Treasurer of the Fidelity funds. Mr. Mehrmann is an employee of Fidelity Investments. |
Adrien E. Deberghes (43) |
| Year of Election or Appointment: 2008 Deputy Treasurer of Fidelity's Equity and High Income Funds. Mr. Deberghes also serves as Assistant Treasurer of other Fidelity funds (2010-present) and is an employee of Fidelity Investments (2008-present). Previously, Mr. Deberghes served as Senior Vice President of Mutual Fund Administration at State Street Corporation (2007-2008), Senior Director of Mutual Fund Administration at Investors Bank & Trust (2005-2007), and Director of Finance for Dunkin' Brands (2000-2005). |
Stephanie J. Dorsey (41) |
| Year of Election or Appointment: 2010 Assistant Treasurer of Fidelity's Equity and High Income Funds. Ms. Dorsey also serves as Deputy Treasurer of other Fidelity funds (2008-present) and is an employee of Fidelity Investments (2008-present). Previously, Ms. Dorsey served as Treasurer (2004-2008) of the JPMorgan Mutual Funds and Vice President (2004-2008) of JPMorgan Chase Bank. |
John R. Hebble (52) |
| Year of Election or Appointment: 2009 Assistant Treasurer of Fidelity's Equity and High Income Funds. Mr. Hebble also serves as Treasurer and Chief Financial Officer of The North Carolina Capital Management Trust: Cash and Term Portfolio (2008-present), President and Treasurer of other Fidelity funds (2008-present) and is an employee of Fidelity Investments. |
Gary W. Ryan (52) |
| Year of Election or Appointment: 2005 Assistant Treasurer of the Fidelity funds. Mr. Ryan is an employee of Fidelity Investments. Previously, Mr. Ryan served as Vice President of Fund Reporting in Fidelity Pricing and Cash Management Services (FPCMS) (1999-2005). |
Jonathan Davis (42) |
| Year of Election or Appointment: 2010 Assistant Treasurer of the Fidelity funds. Mr. Davis is an employee of Fidelity Investments. Previously, Mr. Davis served as Vice President and Associate General Counsel of FMR LLC (2003-2010). |
Annual Report
The Board of Trustees of Fidelity Total International Equity Fund voted to pay on December 6, 2010, to shareholders of record at the opening of business on December 3, 2010, a distribution of $0.023 per share derived from capital gains realized from sales of portfolio securities and a dividend of $0.081 per share from net investment income.
The fund designates 100% of the dividends distributed in December 2009 during the fiscal year as amounts which may be taken into account as a dividend for the purposes of the maximum rate under section 1(h)(11) of the Internal Revenue Code.
The amounts per share which represent income derived from sources within, and taxes paid to, foreign countries or possessions of the United States are as follows:
| Pay Date | Income | Taxes |
Total International Equity Fund | 12/7/2009 | $0.074 | $0.0119 |
The fund will notify shareholders in January 2011 of amounts for use in preparing 2010 income tax returns.
Annual Report
Board Approval of Investment Advisory Contracts and Management Fees
Fidelity Total International Equity Fund
Each year, the Board of Trustees, including the Independent Trustees (together, the Board), votes on the renewal of the management contract and sub-advisory agreements (together, the Advisory Contracts) for the fund. The Board, assisted by the advice of fund counsel and Independent Trustees' counsel, requests and considers a broad range of information relevant to the renewal of the Advisory Contracts throughout the year.
The Board meets regularly and considers at each of its meetings factors that are relevant to its annual consideration of the renewal of the fund's Advisory Contracts, including the services and support provided to the fund and its shareholders. The Board has established various standing committees, each composed of Independent Trustees with varying backgrounds, to which the Board has assigned specific subject matter responsibilities in order to enhance effective decision-making by the Board. The Board, acting directly and through its Committees, requests and receives information concerning the annual consideration of the renewal of the fund's Advisory Contracts. The Board also meets as needed to consider matters specifically related to the Board's annual consideration of the renewal of Advisory Contracts. Members of the Board may also meet with trustees of other Fidelity funds through ad hoc joint committees to discuss certain matters relevant to the Fidelity funds.
At its July 2010 meeting, the Board of Trustees, including the Independent Trustees, unanimously determined to renew the fund's Advisory Contracts. In reaching its determination, the Board considered all factors it believed relevant, including (i) the nature, extent, and quality of the services to be provided to the fund and its shareholders (including the investment performance of the fund); (ii) the competitiveness of the fund's management fee and total expenses; (iii) the total costs of the services to be provided by and the profits to be realized by Fidelity from its relationship with the fund; (iv) the extent to which economies of scale would be realized as the fund grows; and (v) whether fee levels reflect these economies of scale, if any, for the benefit of fund shareholders.
In considering whether to renew the Advisory Contracts for the fund, the Board reached a determination, with the assistance of fund counsel and Independent Trustees' counsel and through the exercise of its business judgment, that the renewal of the Advisory Contracts is in the best interests of fund shareholders and that the compensation to be received by Fidelity under the management contract is fair and reasonable. The Board's decision to renew the Advisory Contracts was not based on any single factor noted above, but rather was based on a comprehensive consideration of all the information provided to the Board at its meetings throughout the year. The Board, in reaching its determination to renew the Advisory Contracts, is aware that shareholders in the fund have a broad range of investment choices available to them, including a wide choice among mutual funds offered by Fidelity's competitors, and that the fund's shareholders, with the opportunity to review and weigh the disclosure provided by the fund in its prospectus and other public disclosures, have chosen to invest in this fund, managed by Fidelity.
Annual Report
Nature, Extent, and Quality of Services Provided. The Board considered the staffing within the investment adviser, FMR, and the sub-advisers (together, the Investment Advisers), including the backgrounds of the fund's investment personnel and the fund's investment objective and discipline. The Independent Trustees also had discussions with senior management of Fidelity's investment operations and investment groups. The Board considered the structure of the portfolio manager compensation program and whether this structure provides appropriate incentives to act in the best interest of the fund.
Resources Dedicated to Investment Management and Support Services. The Board and the equity research subcommittee of the Board's Fund Oversight Committee reviewed the size, education, and experience of the Investment Advisers' investment staff, their use of technology, and the Investment Advisers' approach to recruiting, training, and retaining portfolio managers and other research, advisory, and management personnel. The Board noted that Fidelity's analysts have access to a variety of technological tools and market and securities data that enable them to perform both fundamental and quantitative analysis and to specialize in various disciplines. The Board considered Fidelity's extensive global research capabilities that enable the Investment Advisers to aggregate data from various sources in an effort to produce positive investment results. The Board also considered that Fidelity's portfolio managers and analysts have access to daily portfolio attribution that allows for monitoring of a fund's portfolio, as well as an electronic communication system that provides immediate real-time access to research concerning issuers and credit enhancers. The Board noted FMR's continued focus on strengthening the organization and discipline of equity portfolio management and research.
Shareholder and Administrative Services. The Board considered (i) the nature, extent, quality, and cost of advisory, administrative, and shareholder services performed by the Investment Advisers and their affiliates under the Advisory Contracts and under separate agreements covering transfer agency, pricing and bookkeeping, and securities lending services for the fund; (ii) the nature and extent of the investment adviser's supervision of third party service providers, principally custodians and subcustodians; and (iii) the resources devoted to, and the record of compliance with, the fund's compliance policies and procedures. The Board also reviewed the allocation of fund brokerage, including allocations to brokers affiliated with the Investment Advisers, the use of brokerage commissions to pay fund expenses, and the use of "soft" commission dollars to pay for research services.
The Board noted that the growth of fund assets over time across the complex allows Fidelity to reinvest in the development of services designed to enhance the value or convenience of the Fidelity funds as investment vehicles. These services include 24-hour access to account information and market information through phone representatives and over the Internet, and investor education materials and asset allocation tools.
Annual Report
Board Approval of Investment Advisory Contracts and
Management Fees - continued
Investment in a Large Fund Family. The Board considered the benefits to shareholders of investing in a Fidelity fund, including the benefits of investing in a fund that is part of a large family of funds offering a variety of investment disciplines and providing a large variety of mutual fund investor services. The Board noted that Fidelity had taken, or had made recommendations that resulted in the Fidelity funds taking, a number of actions over the previous year that benefited particular funds, including (i) dedicating additional resources to investment research and restructuring and broadening the focus of the investment research teams; (ii) bolstering the senior management team that oversees asset management; (iii) launching Class F of certain funds as a lower-fee class available to Freedom K and Freedom Index Funds; (iv) lowering the initial investment minimums and ongoing balance requirements for Real Estate High Income Fund; (v) eliminating subsequent purchase minimums for all funds and adding a waiver of the investment minimum requirement for new accounts opened with the proceeds of a systematic withdrawal plan; (vi) eliminating the withdrawal minimum and maximum limits for systematic withdrawals from Advisor funds; (vii) expanding sales load waivers on Class A shares for Destiny Planholders and expanding Institutional Class eligibility for Class O Destiny Planholders; and (viii) changing certain Class A and Class T sales charge structures to further align them with industry practices.
Investment Performance. The Board considered whether the fund has operated in accordance with its investment objective, as well as its record of compliance with its investment restrictions. It also reviewed the fund's absolute investment performance for each class, as well as the fund's relative investment performance for each class measured against (i) a broad-based securities market index, and (ii) a peer group of mutual funds deemed appropriate by Fidelity and reviewed by the Board. Because the fund had been in existence less than three calendar years, the following chart considered by the Board shows, for the one-year period ended December 31, 2009, the total returns of the retail class and Class B of the fund, the total return of a broad-based securities market index ("benchmark"), and a range of total returns of a peer group of mutual funds identified by Morningstar, Inc. as having an investment style similar to that of the fund based on underlying portfolio holdings. The returns of the retail class and Class B show the performance of the highest and lowest performing classes, respectively. The box within the chart shows the 25th percentile return (bottom of box) and the 75th percentile return (top of box) of the peer group. Returns shown above the box are in the first quartile and returns shown below the box are in the fourth quartile. The percentage beaten numbers noted below the chart correspond to the percentile box and represent the percentage of funds in the peer group whose performance was equal to or lower than that of the class indicated.
Annual Report
Fidelity Total International Equity Fund

The Board reviewed the fund's relative investment performance against its peer group and noted that the performance of the retail class of the fund was in the first quartile for the period shown. The Board also noted that the investment performance of the fund was lower than its benchmark for the period shown. The Board considered that the variations in performance among the fund's classes reflect the variations in class expenses, which result in lower performance for higher expense classes. The Board also reviewed the fund's performance since inception as well as performance in the current year. The Board noted that it is difficult to evaluate in any comprehensive fashion the performance of the fund, in light of its relatively recent commencement of operations.
The Board also considered that the fund's management fee is subject to upward or downward adjustment depending upon whether, and to what extent, the fund's investment performance for the performance period exceeds, or is exceeded by, the record (over the same period) of a Board-approved performance adjustment index. The Board realizes that the performance adjustment provides FMR with a strong economic incentive to seek to achieve superior performance for the fund's shareholders and helps to more closely align the interests of FMR and the fund's shareholders.
Based on its review, and giving particular weight to the nature and quality of the resources dedicated by the Investment Advisers to maintain and improve relative performance and factoring in the unprecedented market events in recent years, the Board concluded that the nature, extent, and quality of investment management and support services and of shareholder and administrative services provided to the fund will benefit the fund's shareholders, particularly in light of the Board's view that the fund's shareholders benefit from investing in a fund that is part of a large family of funds offering a variety of investment disciplines and services.
Annual Report
Board Approval of Investment Advisory Contracts and
Management Fees - continued
Competitiveness of Management Fee and Total Fund Expenses. The Board considered the fund's management fee and total expenses compared to "mapped groups" of competitive funds and classes. Fidelity creates "mapped groups" by combining similar Lipper investment objective categories that have comparable management fee characteristics. Combining Lipper investment objective categories aids the Board's management fee and total expense comparisons by broadening the competitive group used for comparison and by reducing the number of universes to which various Fidelity funds are compared.
Management Fee. The Board considered two proprietary management fee comparisons for the 12-month (or shorter) periods shown in the chart below. The group of Lipper funds used by the Board for management fee comparisons is referred to below as the "Total Mapped Group." The Total Mapped Group comparison focuses on a fund's standing relative to the total universe of comparable funds available to investors, in terms of gross management fees before expense reimbursements or caps, and without giving effect to the fund's performance adjustment. "TMG %" represents the percentage of funds in the Total Mapped Group that had management fees that were lower than the fund's. For example, a TMG % of 15% means that 85% of the funds in the Total Mapped Group had higher management fees than the fund. The "Asset-Size Peer Group" (ASPG) comparison focuses on a fund's standing relative to non-Fidelity funds similar in size to the fund within the Total Mapped Group. The ASPG represents at least 15% of the funds in the Total Mapped Group with comparable asset size and management fee characteristics, subject to a minimum of 50 funds (or all funds in the Total Mapped Group if fewer than 50). Additional information, such as the ASPG quartile in which the fund's management fee ranked and the impact of the fund's performance adjustment, is also included in the chart and considered by the Board.
Annual Report
Fidelity Total International Equity Fund

The Board noted that the fund's management fee ranked below the median of its Total Mapped Group and below the median of its ASPG for 2009. The Board also noted the effect of the fund's negative performance adjustment on the fund's management fee ranking. The Board noted that the performance adjustment for each year represents calculations for performance periods that differ from the period shown in the performance chart above.
Based on its review, the Board concluded that the fund's management fee is fair and reasonable in light of the services that the fund receives and the other factors considered.
Total Expenses. In its review of each class's total expenses, the Board considered the fund's management fee as well as other fund or class expenses, as applicable, such as transfer agent fees, pricing and bookkeeping fees, fund-paid 12b-1 fees, and custodial, legal, and audit fees. The Board also noted the effects of any waivers and reimbursements on fees and expenses, as well as the impact of the fund's performance adjustment. As part of its review, the Board also considered current and historical total expenses of each class of the fund compared to competitive fund median expenses. Each class of the fund is compared to those funds and classes in the Total Mapped Group (used by the Board for management fee comparisons) that have a similar sales load structure.
The Board noted that the total expenses of each of Class A and the retail class ranked below its competitive median for 2009, the total expenses of Class B ranked equal to its competitive median for 2009, and the total expenses of each of Class T, Class C, and Institutional Class ranked above its competitive median for 2009. The Board considered that the total expenses for Class T were above the median primarily because its 12b-1 fee is higher than the typical front-end load class. The Board noted that the fund offers multiple classes, each of which has a different sales load and 12b-1 fee structure, and that the multiple structures are intended to offer a range of pricing options for the intermediary market. The Board also noted that the total expenses of the classes vary primarily by the level of their 12b-1 fees, although differences in transfer agent fees may also cause expenses to vary from class to class.
Annual Report
Board Approval of Investment Advisory Contracts and
Management Fees - continued
Fees Charged to Other Fidelity Clients. The Board also considered Fidelity fee structures and other information with respect to clients of FMR and its affiliates, such as other mutual funds advised or subadvised by FMR or its affiliates, pension plan clients, and other institutional clients. In March 2010, the Board created an ad hoc joint committee with the board of other Fidelity funds (the Committee) to review and compare Fidelity's institutional investment advisory business with its business of providing services to the Fidelity funds, including the differences in services provided, fees charged, and costs incurred, as well as competition in their respective marketplaces.
Based on its review of total expenses and fees charged to other Fidelity clients, the Board concluded that the total expenses of each class of the fund were reasonable, although in some cases above the median of the universe presented for comparison, in light of the services that the fund and its shareholders receive and the other factors considered, including the findings of the Committee.
Costs of the Services and Profitability. The Board considered the revenues earned and the expenses incurred by Fidelity in conducting the business of developing, marketing, distributing, managing, administering and servicing the fund and its shareholders. The Board also considered the level of Fidelity's profits in respect of all the Fidelity funds.
On an annual basis, FMR presents to the Board Fidelity's profitability for the fund. Fidelity calculates the profitability for each fund, as well as aggregate profitability for groups of Fidelity funds and all Fidelity funds, using a series of detailed revenue and cost allocation methodologies which originate with the audited books and records of Fidelity. The Audit Committee of the Board reviews any significant changes from the prior year's methodologies.
PricewaterhouseCoopers LLP (PwC), independent registered public accounting firm and auditor to Fidelity and certain Fidelity funds, has been engaged annually by the Board as part of the Board's assessment of Fidelity's profitability analysis. PwC's engagement includes the review and assessment of Fidelity's methodologies used in determining the revenues and expenses attributable to Fidelity's mutual fund business, and completion of agreed-upon procedures surrounding the mathematical accuracy of fund profitability and its conformity to allocation methodologies. After considering PwC's reports issued under the engagement and information provided by Fidelity, the Board believes that while other allocation methods may also be reasonable, Fidelity's profitability methodologies are reasonable in all material respects.
Annual Report
The Board has also reviewed Fidelity's non-fund businesses and fall-out benefits related to the mutual fund business as well as cases where Fidelity's affiliates may benefit from or be related to the fund's business.
The Board considered the costs of the services provided by and the profits realized by Fidelity in connection with the operation of the fund and were satisfied that the profitability was not excessive in the circumstances.
Economies of Scale. The Board considered whether there have been economies of scale in respect of the management of the Fidelity funds, whether the Fidelity funds (including the fund) have appropriately benefited from any such economies of scale, and whether there is potential for realization of any further economies of scale. The Board considered the extent to which the fund will benefit from economies of scale through increased services to the fund, through waivers or reimbursements, or through fee or expense reductions.
In February 2009, the Board and the board of other Fidelity funds created an ad hoc committee (the Economies of Scale Committee) to analyze whether FMR attains economies of scale in respect of the management and servicing of the Fidelity funds, whether the Fidelity funds have appropriately benefited from such economies of scale, and whether there is potential for realization of any further economies of scale.
The Board recognized that the fund's management contract incorporates a "group fee" structure, which provides for lower group fee rates as total fund assets under FMR's management increase, and for higher group fee rates as total fund assets under FMR's management decrease. FMR calculates the group fee rates based on a tiered asset "breakpoint" schedule that varies based on asset class. The Board considered that the group fee is designed to deliver the benefits of economies of scale to fund shareholders when total Fidelity fund assets increase, even if assets of any particular fund are unchanged or have declined, because some portion of Fidelity's costs are attributable to services provided to all Fidelity funds, and all funds benefit if those costs can be allocated among more assets. The Board concluded that, given the group fee structure, fund shareholders will benefit from lower management fees as assets under FMR's management increase at the fund complex level, regardless of whether Fidelity achieves any such economies of scale.
The Board concluded, considering the findings of the Economies of Scale Committee, that any potential economies of scale are being appropriately shared between fund shareholders and Fidelity.
Additional Information Requested by the Board. In order to develop fully the factual basis for consideration of the Fidelity funds' Advisory Contracts, the Board requested and received additional information on certain topics, including (i) fund performance trends, actions to be taken by FMR to improve certain funds' overall performance, and Fidelity's long-term strategies for certain funds; (ii) portfolio manager changes that have occurred during the past year and length of portfolio manager tenure for different categories of funds over time; (iii) Fidelity's compensation structure for portfolio managers, research analysts, and other key personnel, the rationale for the compensation structure, and how the compensation structure provides appropriate performance incentives; (iv) the amount of the investment that each portfolio manager has made in the Fidelity fund(s) that he or she manages; (v) management and other fees paid by FMR to affiliated sub-advisers on behalf of the Fidelity funds; (vi) Fidelity's fee structures and rationale for recommending different fees among different categories of funds; (vii) Fidelity's rationale for recommending which funds should have a performance adjustment component as part of their management fees; (viii) the rationale for any differences between fund fee structures and fee structures in place for other Fidelity clients; and (ix) explanations regarding the relative total expenses borne by certain funds and classes, total expense competitive trends, and actions that might be taken by FMR to reduce total expenses for certain funds and classes.
Annual Report
Board Approval of Investment Advisory Contracts and
Management Fees - continued
Based on its evaluation of all of the conclusions noted above, and after considering all factors it believed relevant, the Board ultimately concluded that the advisory fee structures are fair and reasonable, and that the fund's Advisory Contracts should be renewed.
Annual Report
Managing Your Investments
Fidelity offers several ways to conveniently manage your personal investments via your telephone or PC. You can access your account information, conduct trades and research your investments 24 hours a day.
By Phone
Fidelity Automated Service Telephone provides a single toll-free number to access account balances, positions, quotes and trading. It's easy to navigate the service, and on your first call, the system will help you create a personal identification number (PIN) for security.
(phone_graphic)
Fidelity Automated
Service Telephone (FAST®)
1-800-544-5555
Press
For mutual fund and brokerage trading.
For quotes.*
For account balances and holdings.
To review orders and mutual
fund activity.
To change your PIN.
To speak to a Fidelity representative.
By PC
Fidelity's web site on the Internet provides a wide range of information, including daily financial news, fund performance, interactive planning tools and news about Fidelity products and services.
(computer_graphic)
Fidelity's Web Site
www.fidelity.com
* When you call the quotes line, please remember that a fund's yield and return will vary and, except for money market funds, share price will also vary. This means that you may have a gain or loss when you sell your shares. There is no assurance that money market funds will be able to maintain a stable $1 share price; an investment in a money market fund is not insured or guaranteed by the U.S. government. Total returns are historical and include changes in share price, reinvestment of dividends and capital gains, and the effects of any sales charges.
Annual Report
To Write Fidelity
We'll give your correspondence immediate attention and send you written confirmation upon completion of your request.
(letter_graphic)
Making Changes
To Your Account
(such as changing name, address, bank, etc.)
Fidelity Investments
P.O. Box 770001
Cincinnati, OH 45277-0002
(letter_graphic)
For Non-Retirement
Accounts
Buying shares
Fidelity Investments
P.O. Box 770001
Cincinnati, OH 45277-0003
Overnight Express
Fidelity Investments
Attn: Distribution Services
100 Crosby Parkway - KC1H
Covington, KY 41015
Selling shares
Fidelity Investments
P.O. Box 770001
Cincinnati, OH 45277-0035
Overnight Express
Fidelity Investments
Attn: Distribution Services
100 Crosby Parkway - KC1H
Covington, KY 41015
General Correspondence
Fidelity Investments
P.O. Box 500
Merrimack, NH 03054-0500
(letter_graphic)
For Retirement
Accounts
Buying shares
Fidelity Investments
P.O. Box 770001
Cincinnati, OH 45277-0003
Selling shares
Fidelity Investments
P.O. Box 770001
Cincinnati, OH 45277-0035
Overnight Express
Fidelity Investments
Attn: Distribution Services
100 Crosby Parkway - KC1H
Covington, KY 41015
General Correspondence
Fidelity Investments
P.O. Box 500
Merrimack, NH 03054-0500
Annual Report
To Visit Fidelity
For directions and hours,
please call 1-800-544-9797.
Arizona
7001 West Ray Road
Chandler, AZ
15445 N. Scottsdale Road
Scottsdale, AZ
17550 North 75th Avenue
Glendale, AZ
5330 E. Broadway Blvd
Tucson, AZ
California
815 East Birch Street
Brea, CA
1411 Chapin Avenue
Burlingame, CA
851 East Hamilton Avenue
Campbell, CA
601 Larkspur Landing Circle
Larkspur, CA
2000 Avenue of the Stars
Los Angeles, CA
27101 Puerta Real
Mission Viejo, CA
73575 El Paseo
Palm Desert, CA
251 University Avenue
Palo Alto, CA
123 South Lake Avenue
Pasadena, CA
16656 Bernardo Ctr. Drive
Rancho Bernardo, CA
1220 Roseville Parkway
Roseville, CA
1740 Arden Way
Sacramento, CA
7676 Hazard Center Drive
San Diego, CA
11943 El Camino Real
San Diego, CA
8 Montgomery Street
San Francisco, CA
3793 State Street
Santa Barbara, CA
1200 Wilshire Boulevard
Santa Monica, CA
398 West El Camino Real
Sunnyvale, CA
111 South Westlake Blvd
Thousand Oaks, CA
21701 Hawthorne Boulevard
Torrance, CA
2001 North Main Street
Walnut Creek, CA
6326 Canoga Avenue
Woodland Hills, CA
2211 Michelson Drive
Irvine, CA
Colorado
281 East Flatiron Circle
Broomfield, CO
1625 Broadway
Denver, CO
9185 Westview Road
Lone Tree, CO
Connecticut
48 West Putnam Avenue
Greenwich, CT
265 Church Street
New Haven, CT
300 Atlantic Street
Stamford, CT
29 South Main Street
West Hartford, CT
1261 Post Road
Fairfield, CT
Delaware
400 Delaware Avenue
Wilmington, DE
Florida
175 East Altamonte Drive
Altamonte Springs, FL
1400 Glades Road
Boca Raton, FL
121 Alhambra Plaza
Coral Gables, FL
2948 N. Federal Highway
Ft. Lauderdale, FL
4671 Town Center Parkway
Jacksonville, FL
8880 Tamiami Trail, North
Naples, FL
230 Royal Palm Way
Palm Beach, FL
3501 PGA Boulevard
Palm Beach Gardens, FL
3550 Tamiami Trail, South
Sarasota, FL
1502 N. Westshore Blvd.
Tampa, FL
2465 State Road 7
Wellington, FL
Georgia
3242 Peachtree Road
Atlanta, GA
1000 Abernathy Road
Atlanta, GA
Illinois
One North LaSalle Street
Chicago, IL
401 North Michigan Avenue
Chicago, IL
One Skokie Valley Road
Highland Park, IL
1415 West 22nd Street
Oak Brook, IL
15105 S LaGrange Road
Orland Park, IL
1572 East Golf Road
Schaumburg, IL
1823 Freedom Drive
Naperville, IL
Indiana
8480 Keystone Crossing
Indianapolis, IN
Kansas
5400 College Boulevard
Overland Park, KS
Maine
Three Canal Plaza
Portland, ME
Maryland
7315 Wisconsin Avenue
Bethesda, MD
610 York Road
Towson, MD
Massachusetts
801 Boylston Street
Boston, MA
155 Congress Street
Boston, MA
300 Granite Street
Braintree, MA
44 Mall Road
Burlington, MA
238 Main Street
Cambridge, MA
200 Endicott Street
Danvers, MA
Fidelity Brokerage Services, Inc., 100 Summer St., Boston, MA 02110 Member NYSE/SIPC
Annual Report
405 Cochituate Road
Framingham, MA
551 Boston Turnpike
Shrewsbury, MA
Michigan
500 E. Eisenhower Pkwy.
Ann Arbor, MI
280 N. Old Woodward Ave.
Birmingham, MI
30200 Northwestern Hwy.
Farmington Hills, MI
43420 Grand River Avenue
Novi, MI
3480 28th Street
Grand Rapids, MI
2425 S. Linden Road STE E
Flint, MI
Minnesota
7740 France Avenue South
Edina, MN
8342 3rd Street North
Oakdale, MN
Missouri
1524 South Lindbergh Blvd.
St. Louis, MO
Nevada
2225 Village Walk Drive
Henderson, NV
New Jersey
501 Route 73 South
Marlton, NJ
150 Essex Street
Millburn, NJ
35 Morris Street
Morristown, NJ
396 Route 17, North
Paramus, NJ
3518 Route 1 North
Princeton, NJ
530 Broad Street
Shrewsbury, NJ
New Mexico
2261 Q Street NE
Albuquerque, NM
New York
1130 Franklin Avenue
Garden City, NY
37 West Jericho Turnpike
Huntington Station, NY
1271 Avenue of the Americas
New York, NY
980 Madison Avenue
New York, NY
61 Broadway
New York, NY
350 Park Avenue
New York, NY
200 Fifth Avenue
New York, NY
733 Third Avenue
New York, NY
2070 Broadway
New York, NY
1075 Northern Blvd.
Roslyn, NY
799 Central Park Avenue
Scarsdale, NY
3349 Monroe Avenue
Rochester, NY
North Carolina
4611 Sharon Road
Charlotte, NC
7011 Fayetteville Road
Durham, NC
Ohio
3805 Edwards Road
Cincinnati, OH
1324 Polaris Parkway
Columbus, OH
1800 Crocker Road
Westlake, OH
28699 Chagrin Boulevard
Woodmere Village, OH
Oregon
7493 SW Bridgeport Road
Tigard, OR
Pennsylvania
600 West DeKalb Pike
King of Prussia, PA
1735 Market Street
Philadelphia, PA
12001 Perry Highway
Wexford, PA
Rhode Island
10 Memorial Boulevard
Providence, RI
Tennessee
3018 Peoples Street
Johnson City, TN
7628 West Farmington Blvd.
Germantown, TN
2035 Mallory Lane
Franklin, TN
Texas
10000 Research Boulevard
Austin, TX
4001 Northwest Parkway
Dallas, TX
12532 Memorial Drive
Houston, TX
2701 Drexel Drive
Houston, TX
6560 Fannin Street
Houston, TX
1701 Lake Robbins Drive
The Woodlands, TX
6500 N. MacArthur Blvd.
Irving, TX
6005 West Park Boulevard
Plano, TX
1576 East Southlake Blvd.
Southlake, TX
15600 Southwest Freeway
Sugar Land, TX
139 N. Loop 1604 East
San Antonio, TX
Utah
279 West South Temple
Salt Lake City, UT
Virginia
1861 International Drive
McLean, VA
11957 Democracy Drive
Reston, VA
Washington
10500 NE 8th Street
Bellevue, WA
1518 6th Avenue
Seattle, WA
304 Strander Blvd
Tukwila, WA
Washington, DC
1900 K Street, N.W.
Washington, DC
Wisconsin
16020 West Bluemound Road
Brookfield, WI
Annual Report
Investment Adviser
Fidelity Management & Research Company
Boston, MA
Investment Sub-Advisers
FMR Co., Inc.
Fidelity Management & Research
(U.K.) Inc.
Fidelity Management & Research
(Hong Kong) Limited
Fidelity Management & Research
(Japan) Inc.
Fidelity Research & Analysis Company
FIL Investment Advisors
FIL Investments (Japan) Limited
FIL Investment Advisors (U.K.) Ltd.
General Distributor
Fidelity Distributors Corporation
Boston, MA
Transfer and Service Agent
Fidelity Investments Institutional
Operations Company, Inc.
Boston, MA
Fidelity Service Company, Inc.
Boston, MA
Custodian
State Street Bank and Trust Company
Quincy, MA
The Fidelity Telephone Connection
Mutual Fund 24-Hour Service
Exchanges/Redemptions
and Account Assistance 1-800-544-6666
Product Information 1-800-544-8888
Retirement Accounts 1-800-544-4774
(8 a.m. - 9 p.m.)
TDD Service 1-800-544-0118
for the deaf and hearing impaired
(9 a.m. - 9 p.m. Eastern time)
Fidelity Automated Service
Telephone (FAST)
1-800-544-5555
Automated line for quickest service
TIE-UANN-1210
1.912357.100
(Fidelity Investment logo)(registered trademark)
Fidelity AdvisorSM
Total International Equity
Fund - Class A, Class T, Class B
and Class C
Annual Report
October 31, 2010
Class A, Class T,
Class B, and Class C are
classes of Fidelity® Total
International Equity Fund
(2_fidelity_logos) (Registered_Trademark)
Contents
Chairman's Message | <Click Here> | The Chairman's message to shareholders. |
Performance | <Click Here> | How the fund has done over time. |
Management's Discussion of Fund Performance | <Click Here> | The Portfolio Managers' review of fund performance and strategy. |
Shareholder Expense Example | <Click Here> | An example of shareholder expenses. |
Investment Changes | <Click Here> | A summary of major shifts in the fund's investments over the past six months. |
Investments | <Click Here> | A complete list of the fund's investments with their market values. |
Financial Statements | <Click Here> | Statements of assets and liabilities, operations, and changes in net assets, as well as financial highlights. |
Notes | <Click Here> | Notes to financial statements. |
Report of Independent Registered Public Accounting Firm | <Click Here> | |
Trustees and Officers | <Click Here> | |
Distributions | <Click Here> | |
Board Approval of Investment Advisory Contracts and Management Fees | <Click Here> | |
To view a fund's proxy voting guidelines and proxy voting record for the 12-month period ended June 30, visit http://www.fidelity.com/proxyvotingresults or visit the Securities and Exchange Commission's (SEC) web site at http://www.sec.gov. You may also call 1-877-208-0098 to request a free copy of the proxy voting guidelines.
Standard & Poor's, S&P and S&P 500 are registered service marks of The McGraw-Hill Companies, Inc. and have been licensed for use by Fidelity Distributors Corporation.
Other third party marks appearing herein are the property of their respective owners.
All other marks appearing herein are registered or unregistered trademarks or service marks of FMR LLC or an affiliated company.
Annual Report
This report and the financial statements contained herein are submitted for the general information of the shareholders of the fund. This report is not authorized for distribution to prospective investors in the fund unless preceded or accompanied by an effective prospectus.
A fund files its complete schedule of portfolio holdings with the SEC for the first and third quarters of each fiscal year on Form N-Q. Forms N-Q are available on the SEC's web site at http://www.sec.gov. A fund's Forms N-Q may be reviewed and copied at the SEC's Public Reference Room in Washington, DC. Information regarding the operation of the SEC's Public Reference Room may be obtained by calling 1-800-SEC-0330. For a complete list of a fund's portfolio holdings, view the most recent holdings listing, semiannual report, or annual report on Fidelity's web site at http://www.fidelity.com or http://www.advisor.fidelity.com, as applicable.
NOT FDIC INSURED • MAY LOSE VALUE • NO BANK GUARANTEE
Neither the fund nor Fidelity Distributors Corporation is a bank.
Annual Report
(photo_of_Edward_C_Johnson_3d)
Dear Shareholder:
Equities have staged a rally in the second half of 2010, shaking off concerns about the European debt crisis and the possibility of a double-dip recession in the U.S. Although the short-term surge pushed major equity indexes back into positive territory for the year, several questions remain about the longer-term outlook, including lackluster economic growth and persistently high unemployment. Financial markets are always unpredictable, of course, but there also are several time-tested investment principles that can help put the odds in your favor.
One of the basic tenets is to invest for the long term. Over time, riding out the markets' inevitable ups and downs has proven much more effective than selling into panic or chasing the hottest trend. Even missing only a few of the markets' best days can significantly diminish investor returns. Patience also affords the benefits of compounding - of earning interest on additional income or reinvested dividends and capital gains. There can be tax advantages and cost benefits to consider as well. While staying the course doesn't eliminate risk, it can considerably lessen the effect of short-term declines.
You can further manage your investing risk through diversification. And today, more than ever, geographic diversification should be taken into account. Studies indicate that asset allocation is the single most important determinant of a portfolio's long-term success. The right mix of stocks, bonds and cash - aligned to your particular risk tolerance and investment objective - is very important. Age-appropriate rebalancing is also an essential aspect of asset allocation. For younger investors, an emphasis on equities - which historically have been the best-performing asset class over time - is encouraged. As investors near their specific goal, such as retirement or sending a child to college, consideration may be given to replacing volatile assets (e.g. common stocks) with more-stable fixed investments (bonds or savings plans).
A third principle - investing regularly - can help lower the average cost of your purchases. Investing a certain amount of money each month or quarter helps ensure you won't pay for all your shares at market highs. This strategy - known as dollar cost averaging - also reduces "emotion" from investing, helping shareholders avoid selling weak performers just prior to an upswing, or chasing a hot performer just before a correction.
We invite you to contact us via the Internet, through our Investor Centers or by phone. It is our privilege to provide you the information you need to make the investments that are right for you.
Sincerely,
(The chairman's signature appears here.)
Edward C. Johnson 3d
Annual Report
Average annual total return reflects the change in the value of an investment, assuming reinvestment of the class' distributions from dividend income and capital gains (the profits earned upon the sale of securities that have grown in value, if any) and assuming a constant rate of performance each year. The $10,000 table and the fund's returns do not reflect the deduction of taxes that a shareholder would pay on fund distributions or the redemption of fund shares. During periods of reimbursement by Fidelity, a fund's total return will be greater than it would be had the reimbursement not occurred. How a fund did yesterday is no guarantee of how it will do tomorrow.
Average Annual Total Returns
Periods ended October 31, 2010 | Past 1
year | Life of
fund A |
Class A (incl. 5.75% sales charge) | 9.49% | -10.45% |
Class T (incl. 3.50% sales charge) | 11.73% | -9.99% |
Class B (incl. contingent deferred sales charge) B | 10.34% | -10.24% |
Class C (incl. contingent deferred sales charge) C | 14.18% | -9.34% |
A From November 1, 2007.
B Class B shares' contingent deferred sales charge included in the past one year and life of fund total return figures are 5% and 3%, respectively.
C Class C shares' contingent deferred sales charge included in the past one year and life of fund total return figures are 1% and 0%, respectively.
Annual Report
$10,000 Over Life of Fund
Let's say hypothetically that $10,000 was invested in Fidelity AdvisorSM Total International Equity Fund - Class A on November 1, 2007, when the fund started, and the current 5.75% sales charge was paid. The chart shows how the value of your investment would have changed, and also shows how the MSCI® ACWI® (All Country World Index) ex USA Index performed over the same period.
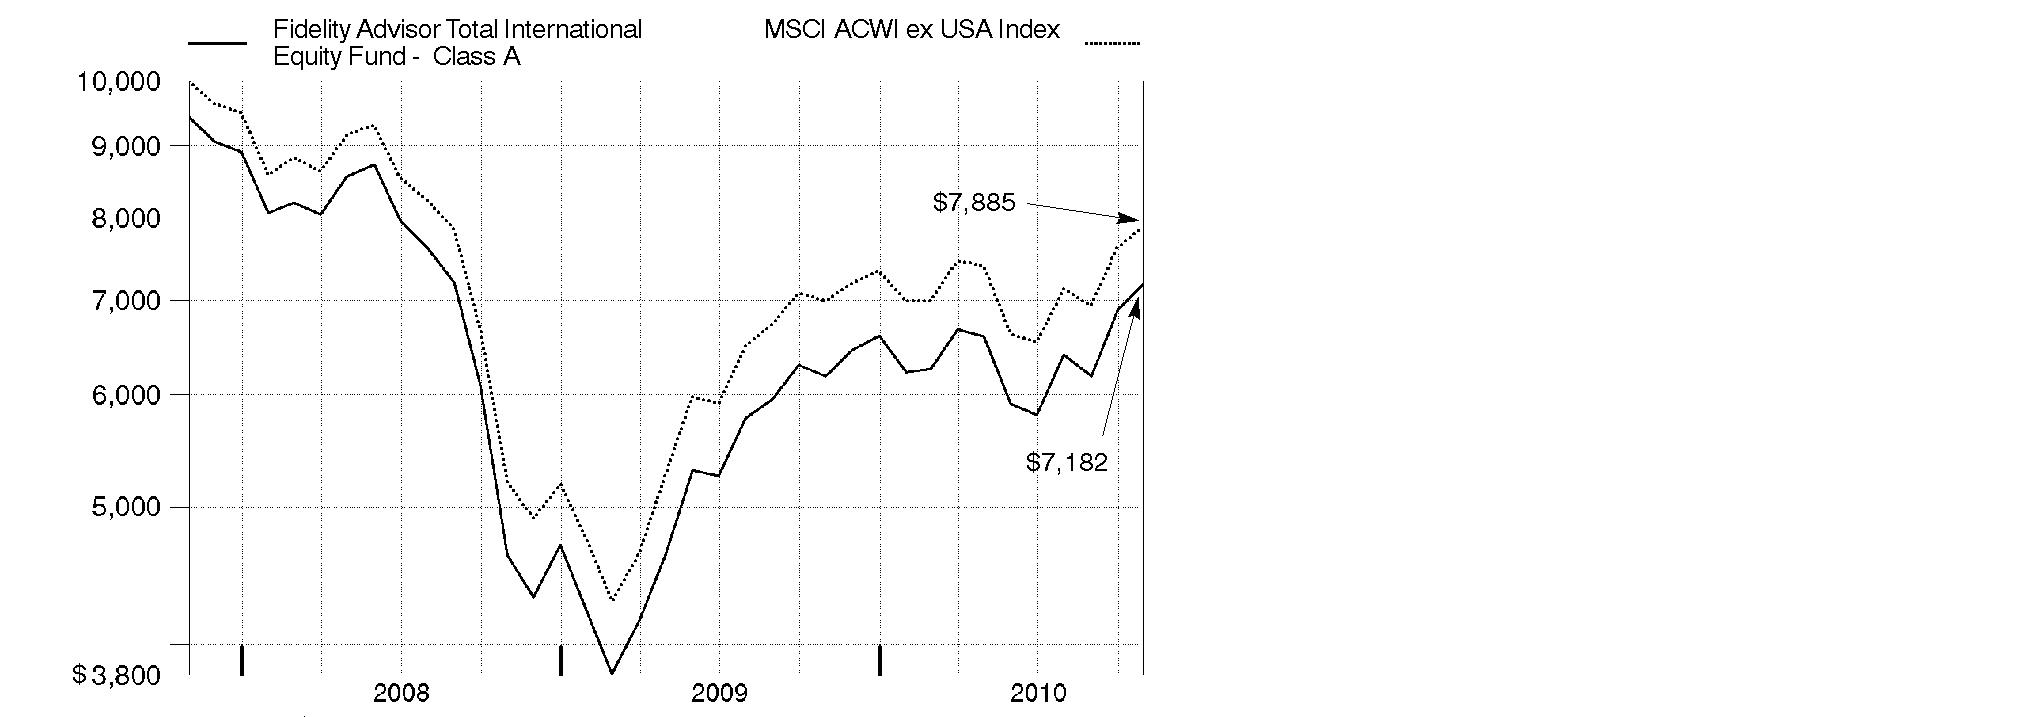
Annual Report
Market Recap: International stocks rode a wave of volatility similar to that of their U.S. counterparts during the 12 months ending October 31, 2010. Stocks gained modestly in the first half of the period, despite growing concerns about the European debt crisis. Sentiment turned decidedly negative in May and June, however, and the market suffered a precipitous decline. These losses were more than offset during the last four months of the period, when signs of economic growth and subsiding debt fears helped propel international stocks about 21%. For the full year, the MSCI® ACWI® (All Country World Index) ex USA Index gained 12.76%, boosted in part by a generally depreciating U.S. dollar. Within the index, Canada and emerging markets were standouts, returning 23% and 24%, respectively. Results in the latter group were led by strong-performing India, Mexico and South Africa, while China fell short of the MSCI benchmark due to cooling economic growth. The developed Asia ex Japan segment rose 16% for the period, lifted by solid results from Singapore and Hong Kong. Meanwhile, Europe rose just 9%, held back mainly by debt-riddled Spain and Italy, as well as lagging major constituent France. Japan returned only 5%, a result of that nation's continued weak economy.
Comments from Jed Weiss and George Stairs, Co-Portfolio Managers of Fidelity Advisor Total International Equity Fund: For the year, the fund's Class A, Class T, Class B and Class C shares rose 16.17%, 15.78%, 15.34% and 15.18%, respectively (excluding sales charges), outpacing the MSCI index. Stock picking was most favorable in financials - especially among banks - and in the consumer discretionary group, with positive results also coming from information technology, consumer staples and energy. The only material detractor was telecommunication services. Geographically, the fund's allocation in emerging markets was the biggest positive. Specifically, stock picking was strong in Brazil, China and South Africa, while overweightings in Turkey and Indonesia also were helpful. Additionally, successful positioning in Japan contributed. In Europe, good security selection in the U.K., Belgium and Finland outweighed weakness in France and Switzerland, while elsewhere, the fund's stake in global U.S. companies proved beneficial. Top individual contributors included Danish health care company Novo Nordisk, U.S.-listed and Sweden-based auto-safety equipment manufacturer Autoliv, Turkish bank Turkiye Garanti Bankasi, U.K.-based mining company Rio Tinto and South African retailer Mr Price Group. Autoliv and Mr Price Group were not in the index. In contrast, the biggest detractors were French insurance company AXA, Swiss drug maker Roche Holding and Spanish telecommunications provider Telefonica.
The views expressed above reflect those of the portfolio manager(s) only through the end of the period as stated on the cover of this report and do not necessarily represent the views of Fidelity or any other person in the Fidelity organization. Any such views are subject to change at any time based upon market or other conditions and Fidelity disclaims any responsibility to update such views. These views may not be relied on as investment advice and, because investment decisions for a Fidelity fund are based on numerous factors, may not be relied on as an indication of trading intent on behalf of any Fidelity fund.
Annual Report
Shareholder Expense Example
As a shareholder of the Fund, you incur two types of costs: (1) transaction costs, including sales charges (loads) on purchase payments or redemption proceeds, redemption fees, and (2) ongoing costs, including management fees, distribution and/or service (12b-1) fees and other Fund expenses. This Example is intended to help you understand your ongoing costs (in dollars) of investing in the Fund and to compare these costs with the ongoing costs of investing in other mutual funds.
The Example is based on an investment of $1,000 invested at the beginning of the period and held for the entire period (May 1, 2010 to October 31, 2010).
Actual Expenses
The first line of the accompanying table for each class of the Fund provides information about actual account values and actual expenses. You may use the information in this line, together with the amount you invested, to estimate the expenses that you paid over the period. Simply divide your account value by $1,000.00 (for example, an $8,600 account value divided by $1,000.00 = 8.6), then multiply the result by the number in the first line for a class of the Fund under the heading entitled "Expenses Paid During Period" to estimate the expenses you paid on your account during this period. A small balance maintenance fee of $12.00 that is charged once a year may apply for certain accounts with a value of less than $2,000. This fee is not included in the table below. If it was, the estimate of expenses you paid during the period would be higher, and your ending account value lower, by this amount. In addition, the Fund, as a shareholder in the underlying Fidelity Central Funds, will indirectly bear its pro-rata share of the fees and expenses incurred by the underlying Fidelity Central Funds. These fees and expenses are not included in the Fund's annualized expense ratio used to calculate the expense estimate in the table below.
Hypothetical Example for Comparison Purposes
The second line of the accompanying table for each class of the Fund provides information about hypothetical account values and hypothetical expenses based on a Class' actual expense ratio and an assumed rate of return of 5% per year before expenses, which is not the Class' actual return. The hypothetical account values and expenses may not be used to estimate the actual ending account balance or expenses you paid for the period. You may use this information to compare the ongoing costs of investing in the Fund and other funds. To do so, compare this 5% hypothetical example with the 5% hypothetical examples that appear in the shareholder reports of the other funds. A small balance maintenance fee of $12.00 that is charged once a year may apply for certain accounts with a value of less than $2,000. This fee is not included in the table below. If it was, the estimate of expenses you paid during the period would be higher, and your ending account value lower, by this amount. In addition, the Fund, as a shareholder in the underlying Fidelity Central Funds, will indirectly bear its pro-rata share of the fees and expenses incurred by the underlying Fidelity Central Funds. These fees and expenses are not included in the Fund's annualized expense ratio used to calculate the expense estimate in the table below.
Annual Report
Please note that the expenses shown in the table are meant to highlight your ongoing costs only and do not reflect any transaction costs. Therefore, the second line of the table is useful in comparing ongoing costs only, and will not help you determine the relative total costs of owning different funds. In addition, if these transactional costs were included, your costs would have been higher.
| Annualized
Expense Ratio | Beginning
Account Value
May 1, 2010 | Ending
Account Value
October 31, 2010 | Expenses Paid
During Period*
May 1, 2010 to
October 31, 2010 |
Class A | 1.50%** | | | |
Actual | | $ 1,000.00 | $ 1,088.80 | $ 7.90** |
HypotheticalA | | $ 1,000.00 | $ 1,017.64 | $ 7.63** |
Class T | 1.75%** | | | |
Actual | | $ 1,000.00 | $ 1,086.50 | $ 9.20** |
HypotheticalA | | $ 1,000.00 | $ 1,016.38 | $ 8.89** |
Class B | 2.25%** | | | |
Actual | | $ 1,000.00 | $ 1,085.40 | $ 11.83** |
HypotheticalA | | $ 1,000.00 | $ 1,013.86 | $ 11.42** |
Class C | 2.25%** | | | |
Actual | | $ 1,000.00 | $ 1,085.50 | $ 11.83** |
HypotheticalA | | $ 1,000.00 | $ 1,013.86 | $ 11.42** |
Total International Equity | 1.25%** | | | |
Actual | | $ 1,000.00 | $ 1,090.20 | $ 6.59** |
HypotheticalA | | $ 1,000.00 | $ 1,018.90 | $ 6.36** |
Institutional Class | 1.25%** | | | |
Actual | | $ 1,000.00 | $ 1,090.50 | $ 6.59** |
HypotheticalA | | $ 1,000.00 | $ 1,018.90 | $ 6.36** |
A 5% return per year before expenses
* Expenses are equal to each Class' annualized expense ratio, multiplied by the average account value over the period, multiplied by 184/365 (to reflect the one-half year period).
Annual Report
Shareholder Expense Example - continued
** If changes to voluntary expense limitations, effective November 1, 2010, had been in effect during the entire period, the annualized expense ratios and the expenses paid in the actual and hypothetical examples above would have been as follows:
| Annualized
Expense Ratio | Expenses
Paid |
Class A | 1.45% | |
Actual | | $ 7.63 |
HypotheticalA | | $ 7.38 |
Class T | 1.70% | |
Actual | | $ 8.94 |
HypotheticalA | | $ 8.64 |
Class B | 2.20% | |
Actual | | $ 11.57 |
HypotheticalA | | $ 11.17 |
Class C | 2.20% | |
Actual | | $ 11.57 |
HypotheticalA | | $ 11.17 |
Total International Equity | 1.20% | |
Actual | | $ 6.32 |
HypotheticalA | | $ 6.11 |
Institutional Class | 1.20% | |
Actual | | $ 6.32 |
HypotheticalA | | $ 6.11 |
A 5% return per year before expenses
Annual Report
Investment Changes (Unaudited)
Geographic Diversification (% of fund's net assets) |
As of October 31, 2010 |
| United Kingdom 15.7% | |
| Japan 11.0% | |
| United States of America 7.2% | |
| Switzerland 6.4% | |
| France 5.4% | |
| Brazil 4.5% | |
| Germany 4.4% | |
| Spain 3.2% | |
| Australia 3.1% | |
| Other 39.1% | |

Percentages are adjusted for the effect of futures contracts, if applicable. |
As of April 30, 2010 |
| United Kingdom 15.8% | |
| Japan 12.4% | |
| Switzerland 7.1% | |
| United States of America 6.2% | |
| France 5.4% | |
| Brazil 4.5% | |
| Germany 4.2% | |
| Australia 3.0% | |
| Canada 3.0% | |
| Other 38.4% | |

Percentages are adjusted for the effect of futures contracts, if applicable. |
Asset Allocation |
| % of fund's
net assets | % of fund's net assets
6 months ago |
Stocks and Investment Companies | 97.8 | 98.0 |
Short-Term Investments and Net Other Assets | 2.2 | 2.0 |
Top Ten Stocks as of October 31, 2010 |
| % of fund's
net assets | % of fund's net assets
6 months ago |
Nestle SA (Switzerland, Food Products) | 1.7 | 1.5 |
BHP Billiton PLC ADR (United Kingdom, Metals & Mining) | 1.7 | 1.3 |
Roche Holding AG (participation certificate) (Switzerland, Pharmaceuticals) | 1.6 | 2.1 |
Royal Dutch Shell PLC Class A sponsored ADR (United Kingdom, Oil, Gas & Consumable Fuels) | 1.5 | 1.5 |
Rio Tinto PLC (United Kingdom, Metals & Mining) | 1.1 | 1.3 |
Anheuser-Busch InBev SA NV (Belgium, Beverages) | 1.1 | 1.0 |
HSBC Holdings PLC (United Kingdom, Commercial Banks) | 1.1 | 1.0 |
Novo Nordisk AS Series B (Denmark, Pharmaceuticals) | 0.9 | 0.8 |
Anglo American PLC (United Kingdom) (United Kingdom, Metals & Mining) | 0.8 | 0.8 |
Mitsui & Co. Ltd. (Japan, Trading Companies & Distributors) | 0.8 | 0.8 |
| 12.3 | |
Market Sectors as of October 31, 2010 |
| % of fund's
net assets | % of fund's net assets
6 months ago |
Financials | 25.6 | 25.3 |
Materials | 12.3 | 12.4 |
Consumer Discretionary | 11.6 | 11.7 |
Industrials | 10.0 | 9.2 |
Consumer Staples | 8.9 | 9.0 |
Energy | 8.8 | 8.5 |
Information Technology | 7.0 | 7.1 |
Health Care | 6.3 | 7.0 |
Telecommunication Services | 4.1 | 4.5 |
Utilities | 2.7 | 3.1 |
Annual Report
Investments October 31, 2010
Showing Percentage of Net Assets
Common Stocks - 96.9% |
| Shares | | Value |
Argentina - 0.1% |
Banco Macro SA sponsored ADR | 1,200 | | $ 59,820 |
Australia - 3.1% |
Commonwealth Bank of Australia | 1,288 | | 61,701 |
CSL Ltd. | 9,386 | | 301,872 |
Leighton Holdings Ltd. | 7,429 | | 267,096 |
Macquarie Group Ltd. | 7,610 | | 269,876 |
MAp Group unit | 26,561 | | 79,362 |
Newcrest Mining Ltd. | 633 | | 24,780 |
Newcrest Mining Ltd. sponsored ADR | 5,384 | | 212,130 |
OZ Minerals Ltd. | 108,330 | | 166,086 |
Wesfarmers Ltd. | 2,954 | | 95,903 |
Westfield Group unit | 18,847 | | 228,578 |
Woolworths Ltd. | 9,477 | | 263,205 |
Worleyparsons Ltd. | 6,016 | | 135,258 |
TOTAL AUSTRALIA | | 2,105,847 |
Austria - 0.3% |
Andritz AG | 1,840 | | 140,917 |
Erste Bank AG | 700 | | 31,587 |
TOTAL AUSTRIA | | 172,504 |
Bahamas (Nassau) - 0.0% |
Petrominerales Ltd. | 700 | | 17,934 |
Bailiwick of Guernsey - 0.3% |
Resolution Ltd. | 40,466 | | 169,797 |
Bailiwick of Jersey - 1.0% |
Heritage Oil PLC | 3,830 | | 21,139 |
Informa PLC | 31,795 | | 222,100 |
Randgold Resources Ltd. sponsored ADR | 2,080 | | 195,354 |
United Business Media Ltd. | 15,200 | | 160,241 |
West China Cement Ltd. (a) | 36,000 | | 13,933 |
WPP PLC | 7,668 | | 89,098 |
TOTAL BAILIWICK OF JERSEY | | 701,865 |
Belgium - 1.4% |
Anheuser-Busch InBev SA NV | 12,136 | | 760,490 |
Gimv NV | 350 | | 19,349 |
Umicore SA | 4,521 | | 212,753 |
TOTAL BELGIUM | | 992,592 |
Common Stocks - continued |
| Shares | | Value |
Bermuda - 1.4% |
Aquarius Platinum Ltd.: | | | |
(Australia) | 10,047 | | $ 57,776 |
(United Kingdom) | 3,600 | | 20,781 |
China Yurun Food Group Ltd. | 13,000 | | 50,566 |
CNPC (Hong Kong) Ltd. | 38,000 | | 48,338 |
Credicorp Ltd. (NY Shares) | 200 | | 25,176 |
Great Eagle Holdings Ltd. | 7,000 | | 20,951 |
Jinhui Shipping & Transportation Ltd. (a) | 1,197 | | 4,760 |
Lazard Ltd. Class A | 2,800 | | 103,320 |
Orient Overseas International Ltd. | 7,000 | | 61,364 |
Seadrill Ltd. (d) | 12,000 | | 363,320 |
Sinofert Holdings Ltd. (a) | 38,000 | | 20,100 |
Texwinca Holdings Ltd. | 16,000 | | 17,463 |
Trinity Ltd. | 78,000 | | 77,987 |
VimpelCom Ltd. ADR (a) | 4,300 | | 65,919 |
TOTAL BERMUDA | | 937,821 |
Brazil - 4.5% |
AES Tiete SA (PN) (non-vtg.) | 1,700 | | 23,433 |
Banco ABC Brasil SA | 14,100 | | 138,911 |
Banco Bradesco SA (PN) sponsored ADR | 10,500 | | 218,400 |
Banco do Brasil SA | 12,611 | | 245,370 |
Banco do Estado do Rio Grande do Sul SA | 1,200 | | 13,184 |
Banco Santander (Brasil) SA ADR | 6,800 | | 97,920 |
BM&F Bovespa SA | 19,700 | | 165,016 |
BR Malls Participacoes SA | 8,800 | | 84,058 |
Brascan Residential Properties SA | 2,000 | | 10,886 |
Braskem SA Class A sponsored ADR | 11,730 | | 244,571 |
Companhia de Bebidas das Americas (AmBev) (PN) sponsored ADR | 600 | | 83,544 |
Companhia Siderurgica Nacional SA (CSN) sponsored ADR | 5,700 | | 96,216 |
Confab Industrial SA (PN) (non-vtg.) | 2,000 | | 7,230 |
Cyrela Brazil Realty SA | 5,300 | | 73,213 |
Drogasil SA | 800 | | 20,235 |
Eletropaulo Metropolitana SA (PN-B) | 900 | | 15,712 |
Estacio Participacoes SA | 900 | | 13,443 |
Even Construtora e Incorporadora SA | 1,500 | | 8,535 |
Fibria Celulose SA sponsored ADR (a) | 3,157 | | 56,700 |
Fleury SA | 900 | | 11,639 |
Gafisa SA sponsored ADR | 3,930 | | 65,985 |
Iguatemi Empresa de Shopping Centers SA | 2,800 | | 65,342 |
Itau Unibanco Banco Multiplo SA ADR | 6,927 | | 170,127 |
Common Stocks - continued |
| Shares | | Value |
Brazil - continued |
Light SA | 1,700 | | $ 21,405 |
Localiza Rent A Car SA | 2,800 | | 46,332 |
Lojas Renner SA | 1,600 | | 63,202 |
Multiplan Empreendimentos Imobiliarios SA | 3,400 | | 77,945 |
Natura Cosmeticos SA | 1,800 | | 51,528 |
Odontoprev SA | 1,200 | | 17,635 |
OGX Petroleo e Gas Participacoes SA (a) | 9,500 | | 124,641 |
PDG Realty SA Empreendimentos e Participacoes | 4,900 | | 61,264 |
Petroleo Brasileiro SA - Petrobras: | | | |
(ON) sponsored ADR | 4,500 | | 153,540 |
(PN) sponsored ADR (non-vtg.) | 4,700 | | 146,593 |
TIM Participacoes SA sponsored ADR (non-vtg.) | 1,400 | | 45,164 |
Vale SA (PN-A) sponsored ADR | 8,000 | | 229,840 |
Vivo Participacoes SA sponsored ADR | 4,700 | | 134,608 |
Weg SA | 1,100 | | 14,206 |
TOTAL BRAZIL | | 3,117,573 |
Canada - 2.5% |
Agnico-Eagle Mines Ltd. (Canada) | 2,090 | | 162,093 |
Eldorado Gold Corp. | 3,900 | | 66,039 |
Fairfax Financial Holdings Ltd. (sub. vtg.) | 165 | | 67,493 |
First Quantum Minerals Ltd. | 800 | | 70,054 |
Goldcorp, Inc. | 1,400 | | 62,512 |
Niko Resources Ltd. | 2,660 | | 253,768 |
Open Text Corp. (a) | 3,900 | | 172,535 |
Pacific Rubiales Energy Corp. (a) | 400 | | 12,750 |
Pan American Silver Corp. | 3,500 | | 111,720 |
Petrobank Energy & Resources Ltd. (a) | 6,400 | | 254,707 |
Power Corp. of Canada (sub. vtg.) | 2,900 | | 80,924 |
Quadra FNX Mining Ltd. (a) | 600 | | 8,471 |
Sherritt International Corp. | 1,600 | | 12,440 |
Suncor Energy, Inc. | 3,500 | | 112,148 |
Toronto-Dominion Bank | 3,500 | | 252,059 |
Uranium One, Inc. (a) | 9,500 | | 38,842 |
TOTAL CANADA | | 1,738,555 |
Cayman Islands - 1.2% |
3SBio, Inc. sponsored ADR (a) | 1,200 | | 18,060 |
Alibaba.com Ltd. (a) | 32,500 | | 63,480 |
China High Speed Transmission Equipment Group Co. Ltd. | 26,000 | | 53,132 |
China Lilang Ltd. | 51,000 | | 79,745 |
China Shanshui Cement Group Ltd. | 49,000 | | 34,895 |
Common Stocks - continued |
| Shares | | Value |
Cayman Islands - continued |
Daphne International Holdings Ltd. | 36,000 | | $ 40,221 |
Eurasia Drilling Co. Ltd.: | | | |
GDR (e) | 400 | | 10,200 |
GDR (Reg. S) | 2,400 | | 61,200 |
Geely Automobile Holdings Ltd. | 65,000 | | 36,646 |
Hengdeli Holdings Ltd. | 206,000 | | 114,278 |
Hidili Industry International Development Ltd. | 33,000 | | 35,166 |
International Mining Machinery Holdings Ltd. | 26,000 | | 22,642 |
Kingboard Chemical Holdings Ltd. | 11,000 | | 53,501 |
Kingboard Chemical Holdings Ltd. warrants 10/31/12 (a) | 600 | | 344 |
Shenguan Holdings Group Ltd. | 10,000 | | 13,030 |
Trina Solar Ltd. ADR (a) | 800 | | 21,408 |
Vantage Drilling Co. (a) | 5,500 | | 9,460 |
Wynn Macau Ltd. | 64,000 | | 141,520 |
TOTAL CAYMAN ISLANDS | | 808,928 |
Chile - 0.2% |
Banco Santander Chile sponsored ADR | 1,400 | | 129,696 |
China - 2.1% |
Anhui Expressway Co. Ltd. (H Shares) | 16,000 | | 12,179 |
Baidu.com, Inc. sponsored ADR (a) | 1,800 | | 198,018 |
China Communications Services Corp. Ltd. (H Shares) | 36,000 | | 20,993 |
China Construction Bank Corp. (H Shares) | 155,000 | | 147,776 |
China Hongxing Sports Ltd. | 33,000 | | 4,462 |
China Merchants Bank Co. Ltd. (H Shares) | 84,383 | | 239,500 |
China Minsheng Banking Corp. Ltd. (H Shares) | 31,500 | | 29,300 |
China Suntien Green Energy Corp. Ltd. (H Shares) | 2,000 | | 673 |
Digital China Holdings Ltd. (H Shares) | 9,000 | | 16,255 |
Golden Eagle Retail Group Ltd. (H Shares) | 21,000 | | 55,810 |
Harbin Power Equipment Co. Ltd. (H Shares) | 28,000 | | 37,713 |
Industrial & Commercial Bank of China Ltd. (H Shares) | 411,000 | | 330,868 |
Minth Group Ltd. | 24,000 | | 44,896 |
Nine Dragons Paper (Holdings) Ltd. | 37,000 | | 59,668 |
Ping An Insurance Group Co. China Ltd. (H Shares) | 12,000 | | 129,192 |
Weichai Power Co. Ltd. (H Shares) | 2,000 | | 26,267 |
Yantai Changyu Pioneer Wine Co. (B Shares) | 4,890 | | 63,024 |
Zhaojin Mining Industry Co. Ltd. (H Shares) | 2,000 | | 6,218 |
TOTAL CHINA | | 1,422,812 |
Colombia - 0.1% |
Ecopetrol SA ADR | 1,400 | | 66,836 |
Common Stocks - continued |
| Shares | | Value |
Cyprus - 0.0% |
AFI Development PLC GDR (Reg. S) | 3,600 | | $ 4,248 |
Czech Republic - 0.1% |
Komercni Banka AS | 300 | | 68,070 |
Denmark - 1.3% |
Novo Nordisk AS: | | | |
Series B | 948 | | 99,523 |
Series B sponsored ADR | 4,800 | | 503,040 |
Vestas Wind Systems AS (a) | 4,295 | | 137,046 |
William Demant Holding AS (a) | 2,010 | | 150,663 |
TOTAL DENMARK | | 890,272 |
Egypt - 0.1% |
Commercial International Bank Ltd. sponsored GDR | 12,800 | | 97,920 |
Finland - 0.9% |
Metso Corp. | 3,600 | | 170,664 |
Nokian Tyres PLC | 6,502 | | 225,275 |
Outotec OYJ | 4,300 | | 200,678 |
TOTAL FINLAND | | 596,617 |
France - 5.4% |
Alstom SA | 3,947 | | 199,142 |
Atos Origin SA (a) | 1,272 | | 58,806 |
Audika SA | 1,000 | | 24,420 |
AXA SA sponsored ADR | 28,100 | | 512,263 |
BNP Paribas SA | 4,051 | | 296,212 |
Christian Dior SA | 700 | | 101,249 |
Compagnie de St. Gobain | 3,807 | | 177,776 |
Credit Agricole SA | 9,000 | | 147,459 |
Danone | 4,280 | | 270,822 |
Laurent-Perrier Group | 209 | | 23,553 |
PPR SA | 1,000 | | 163,913 |
Remy Cointreau SA | 1,952 | | 137,055 |
Safran SA | 7,114 | | 225,494 |
Saft Groupe SA | 629 | | 24,025 |
Sanofi-Aventis sponsored ADR | 6,400 | | 224,704 |
Schneider Electric SA | 957 | | 135,825 |
Societe Generale Series A | 6,910 | | 413,682 |
Total SA | 390 | | 21,224 |
Total SA sponsored ADR | 4,900 | | 266,952 |
Unibail-Rodamco | 1,121 | | 233,504 |
Common Stocks - continued |
| Shares | | Value |
France - continued |
Vetoquinol SA | 200 | | $ 8,477 |
Virbac SA | 100 | | 16,092 |
TOTAL FRANCE | | 3,682,649 |
Georgia - 0.0% |
Bank of Georgia unit (a) | 1,100 | | 18,139 |
Germany - 4.3% |
Allianz AG sponsored ADR | 7,300 | | 91,469 |
alstria office REIT-AG | 600 | | 8,357 |
BASF AG | 2,472 | | 179,826 |
Bayerische Motoren Werke AG (BMW) | 2,642 | | 189,362 |
Bilfinger Berger Se | 348 | | 25,339 |
Colonia Real Estate AG (a) | 2,981 | | 19,562 |
CTS Eventim AG | 431 | | 24,324 |
Daimler AG (United States) (a) | 4,700 | | 310,200 |
Deutsche Boerse AG | 1,650 | | 116,080 |
E.ON AG | 12,545 | | 392,754 |
Fielmann AG | 209 | | 21,098 |
HeidelbergCement AG | 3,700 | | 193,501 |
Linde AG | 2,496 | | 359,288 |
MAN SE | 1,266 | | 139,164 |
Metro AG | 1,600 | | 112,117 |
Munich Re Group | 1,402 | | 219,174 |
Siemens AG sponsored ADR | 4,200 | | 480,102 |
Software AG (Bearer) | 193 | | 27,043 |
Volkswagen AG | 566 | | 74,314 |
TOTAL GERMANY | | 2,983,074 |
Greece - 0.1% |
Hellenic Telecommunications Organization SA | 3,227 | | 25,770 |
Public Power Corp. of Greece | 3,202 | | 53,688 |
Terna Energy SA | 3,249 | | 13,969 |
TOTAL GREECE | | 93,427 |
Hong Kong - 2.8% |
China Mobile (Hong Kong) Ltd. | 18,000 | | 183,822 |
China Resources Power Holdings Co. Ltd. | 60,000 | | 115,491 |
Chow Sang Sang Holdings International Ltd. | 4,000 | | 10,527 |
CNOOC Ltd. | 142,000 | | 296,456 |
CNOOC Ltd. sponsored ADR | 260 | | 54,319 |
Hang Lung Group Ltd. | 8,000 | | 53,101 |
Hong Kong Exchanges and Clearing Ltd. | 14,500 | | 319,136 |
Common Stocks - continued |
| Shares | | Value |
Hong Kong - continued |
Hutchison Whampoa Ltd. | 5,000 | | $ 49,282 |
I.T Ltd. | 12,000 | | 10,125 |
Shanghai Industrial Holdings Ltd. | 14,000 | | 64,480 |
Swire Pacific Ltd. (A Shares) | 18,500 | | 262,538 |
Techtronic Industries Co. Ltd. | 112,500 | | 113,933 |
Wharf Holdings Ltd. | 56,000 | | 367,734 |
TOTAL HONG KONG | | 1,900,944 |
Hungary - 0.0% |
Egis Rt. | 125 | | 14,685 |
India - 1.8% |
Bank of Baroda | 8,655 | | 205,352 |
Bharat Heavy Electricals Ltd. | 1,225 | | 67,587 |
Housing Development Finance Corp. Ltd. | 6,972 | | 108,170 |
Idea Cellular Ltd. (a) | 13,905 | | 21,159 |
Indian Oil Corp. Ltd. | 1,798 | | 16,958 |
Indian Overseas Bank | 3,526 | | 12,712 |
Infosys Technologies Ltd. sponsored ADR | 1,900 | | 128,136 |
Infotech Enterprises Ltd. | 1,602 | | 5,913 |
Infrastructure Development Finance Co. Ltd. | 14,735 | | 66,503 |
Jain Irrigation Systems Ltd. | 9,935 | | 52,000 |
JSW Steel Ltd. | 2,520 | | 76,294 |
Jyothy Laboratories Ltd. | 2,850 | | 17,746 |
LIC Housing Finance Ltd. | 393 | | 11,886 |
Punjab National Bank | 150 | | 4,886 |
Radico Khaitan Ltd. | 1,989 | | 8,023 |
Reliance Industries Ltd. | 6,015 | | 148,764 |
Rural Electrification Corp. Ltd. | 7,306 | | 61,093 |
Shriram Transport Finance Co. Ltd. | 1,315 | | 26,149 |
Tata Consultancy Services Ltd. | 4,255 | | 101,074 |
Tata Steel Ltd. | 1,184 | | 15,744 |
Ultratech Cement Ltd. | 1,753 | | 43,500 |
Unitech Ltd. | 4,394 | | 8,605 |
TOTAL INDIA | | 1,208,254 |
Indonesia - 1.4% |
Indofood Sukses Makmur Tbk PT (a) | 17,500 | | 11,161 |
PT Astra International Tbk | 14,500 | | 92,475 |
PT Bank Mandiri (Persero) Tbk | 32,000 | | 25,063 |
PT Bank Negara Indonesia (Persero) Tbk | 132,000 | | 57,600 |
PT Bank Rakyat Indonesia Tbk | 187,000 | | 238,523 |
PT Bank Tabungan Negara Tbk | 79,000 | | 17,590 |
Common Stocks - continued |
| Shares | | Value |
Indonesia - continued |
PT Bumi Serpong Damai Tbk | 106,500 | | $ 10,010 |
PT Ciputra Development Tbk (a) | 245,500 | | 11,537 |
PT Delta Dunia Petroindo Tbk (a) | 154,000 | | 18,437 |
PT Gudang Garam Tbk | 12,000 | | 64,045 |
PT Indo Tambangraya Megah Tbk | 7,000 | | 35,401 |
PT Indocement Tunggal Prakarsa Tbk | 36,000 | | 73,712 |
PT Indofood Sukses Makmur Tbk | 123,500 | | 71,854 |
PT Kalbe Farma Tbk | 67,500 | | 20,203 |
PT Perusahaan Gas Negara Tbk Series B | 102,000 | | 46,221 |
PT Semen Gresik (Persero) Tbk | 67,500 | | 74,014 |
PT Tambang Batubbara Bukit Asam Tbk | 6,000 | | 13,192 |
PT Tower Bersama Infrastructure Tbk | 101,000 | | 28,817 |
PT XL Axiata Tbk (a) | 75,500 | | 48,573 |
TOTAL INDONESIA | | 958,428 |
Ireland - 0.5% |
CRH PLC sponsored ADR | 12,904 | | 228,014 |
James Hardie Industries NV sponsored ADR (a) | 4,465 | | 118,680 |
TOTAL IRELAND | | 346,694 |
Israel - 0.2% |
Azrieli Group | 582 | | 15,002 |
Ituran Location & Control Ltd. | 492 | | 7,651 |
Teva Pharmaceutical Industries Ltd. sponsored ADR | 2,500 | | 129,750 |
TOTAL ISRAEL | | 152,403 |
Italy - 1.7% |
Azimut Holdings SpA | 18,707 | | 190,799 |
ENI SpA | 3,000 | | 67,535 |
Fiat SpA | 14,000 | | 236,880 |
Interpump Group SpA (a) | 4,425 | | 28,862 |
Intesa Sanpaolo SpA | 99,944 | | 351,492 |
Saipem SpA | 2,714 | | 120,580 |
UniCredit SpA | 60,101 | | 156,634 |
TOTAL ITALY | | 1,152,782 |
Japan - 11.0% |
ABC-Mart, Inc. | 2,100 | | 71,427 |
Aisin Seiki Co. Ltd. | 4,400 | | 138,173 |
Aozora Bank Ltd. | 10,000 | | 16,776 |
Asahi Co. Ltd. | 500 | | 7,394 |
Autobacs Seven Co. Ltd. | 3,900 | | 146,123 |
Credit Saison Co. Ltd. | 2,700 | | 38,296 |
Common Stocks - continued |
| Shares | | Value |
Japan - continued |
Daikoku Denki Co. Ltd. | 1,200 | | $ 13,570 |
Daikokutenbussan Co. Ltd. | 800 | | 28,035 |
Denso Corp. | 13,800 | | 429,154 |
East Japan Railway Co. | 2,700 | | 166,735 |
Fanuc Ltd. | 2,300 | | 332,970 |
Fast Retailing Co. Ltd. | 900 | | 117,892 |
FCC Co. Ltd. | 1,000 | | 21,461 |
Fukuoka (REIT) Investment Fund | 2 | | 13,421 |
GCA Savvian Group Corp. (a) | 14 | | 13,275 |
Glory Ltd. | 400 | | 8,823 |
Goldcrest Co. Ltd. | 410 | | 8,850 |
Honda Motor Co. Ltd. | 4,500 | | 162,220 |
Japan Retail Fund Investment Corp. | 103 | | 160,893 |
Japan Steel Works Ltd. | 15,000 | | 143,116 |
Japan Tobacco, Inc. | 14 | | 43,494 |
JSR Corp. | 4,300 | | 74,436 |
Kamigumi Co. Ltd. | 2,000 | | 15,633 |
Keyence Corp. | 810 | | 200,814 |
Kobayashi Pharmaceutical Co. Ltd. | 4,200 | | 195,725 |
Konica Minolta Holdings, Inc. | 8,500 | | 82,135 |
Kyoto Kimono Yuzen Co. Ltd. | 900 | | 9,786 |
Meiko Network Japan Co. Ltd. | 900 | | 7,505 |
Miraca Holdings, Inc. | 1,900 | | 68,378 |
Miraial Co. Ltd. | 300 | | 7,356 |
Mitsubishi UFJ Financial Group, Inc. | 83,900 | | 389,380 |
Mitsui & Co. Ltd. | 35,100 | | 552,032 |
MS&AD Insurance Group Holdings, Inc. | 4,190 | | 100,379 |
Nabtesco Corp. | 1,600 | | 28,334 |
Nachi-Fujikoshi Corp. | 7,000 | | 20,964 |
Nagaileben Co. Ltd. | 300 | | 7,113 |
Nihon Parkerizing Co. Ltd. | 1,000 | | 13,135 |
Nippon Electric Glass Co. Ltd. | 16,000 | | 205,661 |
Nippon Seiki Co. Ltd. | 2,000 | | 20,256 |
Nippon Telegraph & Telephone Corp. | 1,400 | | 63,141 |
Nippon Thompson Co. Ltd. | 20,000 | | 138,685 |
Nitto Kohki Co. Ltd. | 300 | | 7,072 |
Obic Co. Ltd. | 700 | | 129,266 |
ORIX Corp. | 2,420 | | 220,738 |
Osaka Securities Exchange Co. Ltd. | 32 | | 161,054 |
OSG Corp. | 1,400 | | 14,632 |
Promise Co. Ltd. | 8,950 | | 37,482 |
Ricoh Co. Ltd. | 5,000 | | 69,943 |
Common Stocks - continued |
| Shares | | Value |
Japan - continued |
SAZABY, Inc. | 400 | | $ 7,456 |
Seven & i Holdings Co., Ltd. | 3,000 | | 69,639 |
Shiseido Co. Ltd. | 7,100 | | 148,231 |
SHO-BOND Holdings Co. Ltd. | 3,500 | | 74,897 |
Shoei Co. Ltd. | 600 | | 5,436 |
SOFTBANK CORP. | 2,400 | | 77,076 |
Sumitomo Corp. | 22,900 | | 289,933 |
Sumitomo Metal Industries Ltd. | 27,000 | | 62,667 |
Sumitomo Mitsui Financial Group, Inc. | 7,500 | | 223,858 |
The Nippon Synthetic Chemical Industry Co. Ltd. | 1,000 | | 5,866 |
THK Co. Ltd. | 700 | | 13,466 |
Toho Holdings Co. Ltd. | 1,200 | | 16,806 |
Tokio Marine Holdings, Inc. | 4,000 | | 112,463 |
Tokyo Electron Ltd. | 2,400 | | 135,416 |
Tokyo Gas Co. Ltd. | 66,000 | | 310,523 |
Toyota Motor Corp. | 10,800 | | 382,539 |
Tsumura & Co. | 600 | | 18,462 |
Tsutsumi Jewelry Co. Ltd. | 400 | | 9,420 |
USS Co. Ltd. | 4,100 | | 318,951 |
West Japan Railway Co. | 19 | | 70,537 |
Xebio Co. Ltd. | 400 | | 7,854 |
Yamada Denki Co. Ltd. | 1,400 | | 90,990 |
Yamatake Corp. | 600 | | 14,607 |
Yamato Kogyo Co. Ltd. | 6,900 | | 176,980 |
TOTAL JAPAN | | 7,567,206 |
Kazakhstan - 0.1% |
KazMunaiGas Exploration & Production JSC (Reg. S) GDR | 1,900 | | 32,680 |
Korea (South) - 2.7% |
Busan Bank | 1,850 | | 23,032 |
CJ Corp. | 645 | | 45,486 |
Daegu Bank Co. Ltd. | 1,700 | | 22,299 |
Daelim Industrial Co. | 450 | | 36,656 |
Doosan Co. Ltd. | 158 | | 21,287 |
GS Holdings Corp. | 640 | | 33,579 |
Hanjin Heavy Industries & Consolidated Co. Ltd. | 1,090 | | 41,584 |
Honam Petrochemical Corp. | 295 | | 65,060 |
Hyundai Department Store Co. Ltd. | 153 | | 16,940 |
Hyundai Heavy Industries Co. Ltd. | 267 | | 87,021 |
Hyundai Mobis | 495 | | 123,255 |
Hyundai Motor Co. | 1,177 | | 177,937 |
Industrial Bank of Korea | 5,500 | | 78,991 |
Common Stocks - continued |
| Shares | | Value |
Korea (South) - continued |
Kia Motors Corp. | 2,440 | | $ 97,426 |
KT Corp. | 1,220 | | 48,100 |
LG Chemical Ltd. | 150 | | 46,287 |
Lumens Co. Ltd. (a) | 1,889 | | 16,799 |
NCsoft Corp. | 296 | | 65,149 |
NHN Corp. (a) | 1,207 | | 214,136 |
Samsung Electronics Co. Ltd. | 519 | | 343,846 |
Shinhan Financial Group Co. Ltd. | 5,240 | | 202,936 |
Shinhan Financial Group Co. Ltd. sponsored ADR | 300 | | 23,331 |
Tong Yang Securities, Inc. | 2,260 | | 22,811 |
Young Poong Precision Corp. | 570 | | 6,666 |
TOTAL KOREA (SOUTH) | | 1,860,614 |
Lebanon - 0.0% |
BLOM Bank SAL GDR | 500 | | 4,600 |
Luxembourg - 0.5% |
ArcelorMittal SA: | | | |
(Netherlands) | 2,449 | | 79,226 |
Class A unit | 5,200 | | 168,376 |
Evraz Group SA GDR (a) | 1,900 | | 57,608 |
GlobeOp Financial Services SA | 2,300 | | 11,248 |
Millicom International Cellular SA | 500 | | 47,300 |
TOTAL LUXEMBOURG | | 363,758 |
Malaysia - 0.1% |
AirAsia Bhd (a) | 20,300 | | 16,117 |
Axiata Group Bhd (a) | 35,000 | | 50,514 |
RHB Capital BHD | 5,200 | | 13,422 |
Top Glove Corp. Bhd | 11,500 | | 20,331 |
TOTAL MALAYSIA | | 100,384 |
Mexico - 0.9% |
America Movil SAB de CV Series L sponsored ADR | 4,300 | | 246,218 |
Banco Compartamos SA de CV | 6,300 | | 44,629 |
Genomma Lab Internacional SA de CV (a) | 7,000 | | 15,207 |
Wal-Mart de Mexico SA de CV Series V | 106,200 | | 290,469 |
TOTAL MEXICO | | 596,523 |
Netherlands - 2.5% |
Aalberts Industries NV | 1,500 | | 27,394 |
ASM International NV unit (a) | 6,035 | | 154,194 |
ASML Holding NV | 6,500 | | 215,735 |
Common Stocks - continued |
| Shares | | Value |
Netherlands - continued |
Gemalto NV | 3,301 | | $ 150,289 |
Heijmans NV unit (a) | 710 | | 13,386 |
ING Groep NV: | | | |
(Certificaten Van Aandelen) unit (a) | 19,510 | | 208,679 |
sponsored ADR (a) | 25,300 | | 272,734 |
Koninklijke Ahold NV | 6,433 | | 88,885 |
Koninklijke KPN NV | 19,438 | | 324,564 |
QIAGEN NV (a) | 6,800 | | 127,908 |
Randstad Holdings NV (a) | 2,303 | | 109,594 |
TOTAL NETHERLANDS | | 1,693,362 |
Nigeria - 0.1% |
Guaranty Trust Bank PLC GDR (Reg. S) | 5,825 | | 42,290 |
Norway - 0.4% |
Aker Solutions ASA | 12,453 | | 189,580 |
Det Norske Oljeselskap ASA (DNO) (A Shares) (a) | 7,400 | | 11,619 |
DnB NOR ASA | 4,300 | | 59,004 |
Sevan Marine ASA (a) | 10,000 | | 13,474 |
TOTAL NORWAY | | 273,677 |
Papua New Guinea - 0.0% |
Oil Search Ltd. | 1,312 | | 8,200 |
Peru - 0.2% |
Compania de Minas Buenaventura SA sponsored ADR | 2,600 | | 137,904 |
Philippines - 0.0% |
Jollibee Food Corp. | 3,500 | | 7,220 |
Megaworld Corp. | 70,000 | | 4,177 |
TOTAL PHILIPPINES | | 11,397 |
Poland - 0.0% |
Bank Handlowy w Warszawie SA | 511 | | 16,134 |
Portugal - 0.5% |
Energias de Portugal SA | 52,028 | | 199,012 |
Jeronimo Martins SGPS SA | 10,525 | | 157,873 |
TOTAL PORTUGAL | | 356,885 |
Qatar - 0.0% |
Commercial Bank of Qatar GDR (Reg. S) | 6,707 | | 30,733 |
Russia - 1.6% |
Cherkizovo Group OJSC GDR (a) | 1,018 | | 20,740 |
LSR Group OJSC GDR (Reg. S) (a) | 1,800 | | 15,300 |
Magnit OJSC GDR (Reg. S) | 3,100 | | 82,894 |
Common Stocks - continued |
| Shares | | Value |
Russia - continued |
Mechel Steel Group OAO sponsored ADR | 5,300 | | $ 124,815 |
OAO Gazprom sponsored ADR | 3,800 | | 83,030 |
OAO NOVATEK GDR | 1,300 | | 124,345 |
OAO Raspadskaya (a) | 2,100 | | 12,228 |
OAO Tatneft sponsored ADR | 2,400 | | 75,720 |
OJSC MMC Norilsk Nickel sponsored ADR | 4,484 | | 83,627 |
OJSC Oil Company Rosneft GDR (Reg. S) | 16,800 | | 117,096 |
Polymetal JSC GDR (Reg. S) (a) | 3,900 | | 61,620 |
Protek (a) | 705 | | 1,280 |
RusHydro JSC sponsored ADR (a) | 10,400 | | 53,820 |
Sberbank (Savings Bank of the Russian Federation) | 34,200 | | 112,391 |
Sberbank (Savings Bank of the Russian Federation) GDR | 150 | | 56,354 |
Severstal JSC (a) | 1,200 | | 16,377 |
Sistema JSFC sponsored GDR | 2,200 | | 56,760 |
TGK-1 OAO (a) | 17,098,600 | | 11,866 |
TOTAL RUSSIA | | 1,110,263 |
Singapore - 1.3% |
Allgreen Properties Ltd. | 21,000 | | 19,308 |
City Developments Ltd. | 8,000 | | 78,622 |
DBS Group Holdings Ltd. | 5,226 | | 56,124 |
Keppel Corp. Ltd. | 5,000 | | 38,554 |
Keppel Land Ltd. | 3,000 | | 10,268 |
Singapore Exchange Ltd. | 29,700 | | 201,932 |
Straits Asia Resources Ltd. | 23,000 | | 40,694 |
United Overseas Bank Ltd. | 18,943 | | 272,810 |
Wing Tai Holdings Ltd. | 57,000 | | 77,069 |
Yanlord Land Group Ltd. | 91,000 | | 120,930 |
TOTAL SINGAPORE | | 916,311 |
South Africa - 2.3% |
African Bank Investments Ltd. | 13,600 | | 69,776 |
African Rainbow Minerals Ltd. | 11,850 | | 302,312 |
AngloGold Ashanti Ltd. | 1,600 | | 75,040 |
AngloGold Ashanti Ltd. sponsored ADR | 900 | | 42,399 |
Aspen Pharmacare Holdings Ltd. | 3,700 | | 49,386 |
Clicks Group Ltd. | 33,784 | | 220,402 |
Foschini Ltd. | 4,920 | | 59,721 |
Impala Platinum Holdings Ltd. | 1,700 | | 48,051 |
Imperial Holdings Ltd. | 120 | | 1,957 |
JSE Ltd. | 10,100 | | 113,904 |
Mr Price Group Ltd. | 27,800 | | 252,639 |
Common Stocks - continued |
| Shares | | Value |
South Africa - continued |
Mvelaphanda Resources Ltd. (a) | 8,322 | | $ 54,410 |
Shoprite Holdings Ltd. | 4,600 | | 65,023 |
Standard Bank Group Ltd. | 7,537 | | 111,144 |
Wilson Bayly Holmes-Ovcon Ltd. | 1,000 | | 19,326 |
Woolworths Holdings Ltd. | 16,241 | | 63,642 |
TOTAL SOUTH AFRICA | | 1,549,132 |
Spain - 3.2% |
Banco Bilbao Vizcaya Argentaria SA sponsored ADR | 30,294 | | 398,366 |
Banco Santander SA | 12,015 | | 154,180 |
Banco Santander SA sponsored ADR | 28,700 | | 367,647 |
Gestevision Telecinco SA | 2,300 | | 29,334 |
Grifols SA | 446 | | 7,221 |
Iberdrola SA | 41,442 | | 349,447 |
Inditex SA | 2,780 | | 232,133 |
Prosegur Compania de Seguridad SA (Reg.) | 2,951 | | 176,812 |
Red Electrica Corporacion SA | 1,300 | | 65,292 |
Telefonica SA sponsored ADR | 5,040 | | 408,946 |
TOTAL SPAIN | | 2,189,378 |
Sweden - 0.7% |
H&M Hennes & Mauritz AB (B Shares) | 8,382 | | 295,307 |
Intrum Justitia AB | 1,200 | | 16,523 |
Swedish Match Co. | 3,900 | | 108,975 |
Telefonaktiebolaget LM Ericsson (B Shares) | 6,834 | | 75,136 |
TOTAL SWEDEN | | 495,941 |
Switzerland - 6.4% |
Bank Sarasin & Co. Ltd. Series B (Reg.) | 1,098 | | 40,156 |
Credit Suisse Group sponsored ADR | 3,160 | | 131,140 |
Lonza Group AG | 313 | | 27,394 |
Nestle SA | 21,540 | | 1,179,467 |
Novartis AG sponsored ADR | 8,400 | | 486,780 |
Roche Holding AG (participation certificate) | 7,328 | | 1,075,731 |
Sonova Holding AG Class B | 2,658 | | 307,830 |
The Swatch Group AG: | | | |
(Bearer) | 680 | | 259,814 |
(Reg.) | 189 | | 13,133 |
Transocean Ltd. (a) | 2,920 | | 185,011 |
UBS AG (a) | 4,073 | | 69,169 |
Common Stocks - continued |
| Shares | | Value |
Switzerland - continued |
UBS AG (NY Shares) (a) | 6,900 | | $ 117,438 |
Zurich Financial Services AG | 1,946 | | 476,245 |
TOTAL SWITZERLAND | | 4,369,308 |
Taiwan - 1.4% |
Advanced Semiconductor Engineering, Inc. | 10,999 | | 9,576 |
Advanced Semiconductor Engineering, Inc. sponsored ADR | 9,899 | | 43,853 |
Alpha Networks, Inc. | 20,000 | | 17,775 |
Asia Cement Corp. | 49,440 | | 50,967 |
AU Optronics Corp. (a) | 45,000 | | 44,920 |
Chroma ATE, Inc. | 9,150 | | 23,559 |
Farglory Land Development Co. Ltd. | 8,000 | | 19,866 |
Formosa Plastics Corp. | 37,000 | | 106,146 |
Fubon Financial Holding Co. Ltd. | 59,846 | | 73,329 |
Hon Hai Precision Industry Co. Ltd. (Foxconn) | 18,858 | | 71,476 |
HTC Corp. | 6,300 | | 142,241 |
Huaku Development Co. Ltd. | 6,000 | | 16,644 |
Macronix International Co. Ltd. | 103,000 | | 63,439 |
Pegatron Corp. (a) | 21,000 | | 28,441 |
Ruentex Development Co. Ltd. | 6,000 | | 9,959 |
Taishin Financial Holdings Co. Ltd. | 153,180 | | 67,068 |
Taiwan Cement Corp. | 26,000 | | 27,695 |
Taiwan Semiconductor Manufacturing Co. Ltd. | 27,035 | | 55,649 |
Unimicron Technology Corp. | 7,000 | | 11,916 |
Wistron Corp. | 35,510 | | 72,981 |
TOTAL TAIWAN | | 957,500 |
Thailand - 0.5% |
Advanced Info Service PCL (For. Reg.) | 15,700 | | 47,194 |
Banpu PCL: | | | |
unit | 300 | | 7,756 |
(For. Reg.) | 2,000 | | 51,703 |
BEC World PCL (For. Reg.) | 20,800 | | 23,100 |
Siam Commercial Bank PCL (For. Reg.) | 53,300 | | 182,473 |
Total Access Communication PCL (For. Reg.) | 200 | | 281 |
TOTAL THAILAND | | 312,507 |
Turkey - 1.4% |
Albaraka Turk Katilim Bankasi AS | 10,000 | | 20,079 |
Anadolu Efes Biracilik ve Malt Sanayii AS | 8,000 | | 127,728 |
Asya Katilim Bankasi AS | 30,000 | | 77,390 |
Coca-Cola Icecek AS | 10,400 | | 133,417 |
Enka Insaat ve Sanayi AS | 5,666 | | 25,875 |
Common Stocks - continued |
| Shares | | Value |
Turkey - continued |
Sinpas Gayrimenkul Yatirim Ortakligi AS (a) | 11,000 | | $ 16,719 |
Tofas Turk Otomobil Fabrikasi AS | 8,511 | | 47,175 |
Turk Hava Yollari AO | 21,714 | | 90,078 |
Turkiye Garanti Bankasi AS | 61,700 | | 378,554 |
Turkiye Halk Bankasi AS | 7,000 | | 70,766 |
TOTAL TURKEY | | 987,781 |
United Arab Emirates - 0.1% |
DP World Ltd. | 62,496 | | 37,435 |
United Kingdom - 15.7% |
Aberdeen Asset Management PLC | 27,018 | | 76,964 |
Aegis Group PLC | 48,438 | | 97,549 |
AMEC PLC | 1,055 | | 18,356 |
Anglo American PLC (United Kingdom) | 12,031 | | 560,531 |
AstraZeneca PLC sponsored ADR | 1,900 | | 95,874 |
Aviva PLC | 17,072 | | 108,860 |
Babcock International Group PLC | 16,100 | | 149,609 |
BAE Systems PLC | 39,000 | | 215,382 |
Barclays PLC | 57,875 | | 254,296 |
Bellway PLC | 1,728 | | 14,784 |
BG Group PLC | 26,887 | | 523,601 |
BHP Billiton PLC ADR | 16,300 | | 1,154,040 |
BP PLC sponsored ADR | 13,100 | | 534,873 |
British Airways PLC (a) | 13,000 | | 56,381 |
Britvic PLC | 3,000 | | 23,186 |
Centrica PLC | 15,575 | | 82,895 |
Cobham PLC | 25,400 | | 94,249 |
Dechra Pharmaceuticals PLC | 1,300 | | 11,039 |
Derwent London PLC | 500 | | 12,176 |
GlaxoSmithKline PLC sponsored ADR | 8,500 | | 331,840 |
Great Portland Estates PLC | 3,972 | | 21,987 |
H&T Group PLC | 2,891 | | 16,165 |
Hikma Pharmaceuticals PLC | 3,478 | | 43,798 |
HSBC Holdings PLC: | | | |
(United Kingdom) | 25,682 | | 267,256 |
sponsored ADR | 9,251 | | 482,070 |
Imperial Tobacco Group PLC | 6,811 | | 218,136 |
InterContinental Hotel Group PLC ADR | 12,590 | | 243,617 |
International Power PLC | 9,989 | | 66,784 |
Johnson Matthey PLC | 6,192 | | 189,879 |
Man Group PLC | 9,279 | | 38,771 |
Meggitt PLC | 5,952 | | 31,478 |
Common Stocks - continued |
| Shares | | Value |
United Kingdom - continued |
Micro Focus International PLC | 2,500 | | $ 15,293 |
Misys PLC (a) | 11,200 | | 50,495 |
Mothercare PLC | 9,299 | | 78,291 |
Persimmon PLC | 1,737 | | 9,490 |
Prudential PLC | 16,571 | | 167,579 |
Reckitt Benckiser Group PLC | 4,738 | | 265,001 |
Rio Tinto PLC | 5,196 | | 337,440 |
Rio Tinto PLC sponsored ADR | 6,560 | | 427,187 |
Rotork PLC | 500 | | 13,418 |
Royal Dutch Shell PLC Class A sponsored ADR | 15,300 | | 993,429 |
Serco Group PLC | 27,871 | | 274,173 |
Shaftesbury PLC | 17,833 | | 127,427 |
Spectris PLC | 1,649 | | 29,828 |
Spirax-Sarco Engineering PLC | 1,404 | | 40,692 |
Standard Chartered PLC: | | | |
rights 11/5/10 (a) | 2,079 | | 17,504 |
(United Kingdom) | 16,639 | | 481,313 |
Ted Baker PLC | 2,175 | | 21,431 |
Tesco PLC | 54,583 | | 373,281 |
Ultra Electronics Holdings PLC | 800 | | 23,853 |
Unite Group PLC (a) | 25,402 | | 84,651 |
Vedanta Resources PLC | 4,000 | | 132,978 |
Victrex PLC | 4,318 | | 89,312 |
Vodafone Group PLC sponsored ADR | 19,400 | | 533,694 |
Wolseley PLC (a) | 3,963 | | 105,589 |
Xstrata PLC | 2,900 | | 56,196 |
TOTAL UNITED KINGDOM | | 10,785,971 |
United States of America - 4.5% |
Advanced Energy Industries, Inc. (a) | 1,581 | | 22,703 |
Allergan, Inc. | 1,400 | | 101,374 |
Autoliv, Inc. | 3,750 | | 267,375 |
Berkshire Hathaway, Inc. Class B (a) | 1,550 | | 123,318 |
CTC Media, Inc. | 1,600 | | 37,760 |
Cymer, Inc. (a) | 2,350 | | 86,833 |
Dril-Quip, Inc. (a) | 230 | | 15,893 |
eBay, Inc. (a) | 2,000 | | 59,620 |
Evercore Partners, Inc. Class A | 380 | | 11,537 |
Freeport-McMoRan Copper & Gold, Inc. | 600 | | 56,808 |
Google, Inc. Class A (a) | 200 | | 122,598 |
ION Geophysical Corp. (a) | 16,371 | | 80,054 |
JPMorgan Chase & Co. | 2,663 | | 100,209 |
Common Stocks - continued |
| Shares | | Value |
United States of America - continued |
Juniper Networks, Inc. (a) | 13,740 | | $ 445,039 |
Kansas City Southern (a) | 680 | | 29,798 |
Lam Research Corp. (a) | 197 | | 9,021 |
Martin Marietta Materials, Inc. | 880 | | 70,822 |
Mead Johnson Nutrition Co. Class A | 3,400 | | 199,988 |
Mohawk Industries, Inc. (a) | 2,670 | | 153,098 |
Oceaneering International, Inc. (a) | 140 | | 8,662 |
Philip Morris International, Inc. | 2,300 | | 134,550 |
PriceSmart, Inc. | 1,800 | | 52,794 |
ResMed, Inc. (a) | 5,360 | | 170,823 |
Solera Holdings, Inc. | 200 | | 9,610 |
Solutia, Inc. (a) | 484 | | 8,765 |
Union Pacific Corp. | 2,300 | | 201,664 |
Visa, Inc. Class A | 6,594 | | 515,453 |
TOTAL UNITED STATES OF AMERICA | | 3,096,169 |
TOTAL COMMON STOCKS (Cost $63,165,472) | 66,515,229 |
Nonconvertible Preferred Stocks - 0.4% |
| | | |
Germany - 0.1% |
Volkswagen AG | 200 | | 30,055 |
Italy - 0.3% |
Fiat SpA (Risparmio Shares) | 7,800 | | 91,656 |
Telecom Italia SpA (Risparmio Shares) | 104,200 | | 127,820 |
TOTAL ITALY | | 219,476 |
TOTAL NONCONVERTIBLE PREFERRED STOCKS (Cost $240,073) | 249,531 |
Investment Companies - 0.5% |
| | | |
United States of America - 0.5% |
iShares MSCI ACWI ex US Index ETF
(Cost $347,161) | 8,000 | | 342,000 |
Money Market Funds - 0.5% |
| | | |
Fidelity Securities Lending Cash Central Fund, 0.24% (b)(c)
(Cost $355,537) | 355,537 | | 355,537 |
Cash Equivalents - 1.6% |
| Maturity Amount | | Value |
Investments in repurchase agreements in a joint trading account at 0.22%, dated 10/29/10 due 11/1/10 (Collateralized by U.S. Treasury Obligations) #
(Cost $1,074,000) | $ 1,074,019 | | $ 1,074,000 |
TOTAL INVESTMENT PORTFOLIO - 99.9% (Cost $65,182,243) | | 68,536,297 |
NET OTHER ASSETS (LIABILITIES) - 0.1% | | 100,928 |
NET ASSETS - 100% | $ 68,637,225 |
Security Type Abbreviations |
ETF | - | Exchange-Traded Funds |
Legend |
(a) Non-income producing |
(b) Affiliated fund that is available only to investment companies and other accounts managed by Fidelity Investments. The rate quoted is the annualized seven-day yield of the fund at period end. A complete unaudited listing of the fund's holdings as of its most recent quarter end is available upon request. In addition, each Fidelity Central Fund's financial statements, which are not covered by the Fund's report of Independent Registered Public Accounting Firm, are available on the SEC's website or upon request. |
(c) Investment made with cash collateral received from securities on loan. |
(d) Security or a portion of the security is on loan at period end. |
(e) Security exempt from registration under Rule 144A of the Securities Act of 1933. These securities may be resold in transactions exempt from registration, normally to qualified institutional buyers. At the end of the period, the value of these securities amounted to $10,200 or 0.0% of net assets. |
# Additional information on each counterparty to the repurchase agreement is as follows: |
Repurchase Agreement / Counterparty | Value |
$1,074,000 due 11/01/10 at 0.22% |
BNP Paribas Securities Corp. | $ 178,969 |
Barclays Capital, Inc. | 268,288 |
Credit Agricole Securities (USA), Inc. | 46,262 |
Credit Suisse Securities (USA) LLC | 49,440 |
Deutsche Bank Securities, Inc. | 82,975 |
HSBC Securities (USA), Inc. | 82,975 |
J.P. Morgan Securities, Inc. | 221,267 |
Mizuho Securities USA, Inc. | 55,317 |
Societe Generale, New York Branch | 55,317 |
UBS Securities LLC | 27,658 |
Wells Fargo Securities LLC | 5,532 |
| $ 1,074,000 |
Affiliated Central Funds |
Information regarding fiscal year to date income earned by the Fund from investments in Fidelity Central Funds is as follows: |
Fund | Income earned |
Fidelity Securities Lending Cash Central Fund | $ 17,945 |
Other Information |
The following is a summary of the inputs used, as of October 31, 2010, involving the Fund's assets and liabilities carried at fair value. The inputs or methodology used for valuing securities may not be an indication of the risk associated with investing in those securities. For more information on valuation inputs, and their aggregation into the levels used in the tables below, please refer to the Security Valuation section in the accompanying Notes to Financial Statements. |
Valuation Inputs at Reporting Date: |
Description | Total | Level 1 | Level 2 | Level 3 |
Investments in Securities: | | | | |
Equities: | | | | |
United Kingdom | $ 10,785,971 | $ 9,650,540 | $ 1,135,431 | $ - |
Japan | 7,567,206 | 2,787,776 | 4,779,430 | - |
Switzerland | 4,369,308 | 4,300,139 | 69,169 | - |
France | 3,682,649 | 3,661,425 | 21,224 | - |
Brazil | 3,117,573 | 3,117,573 | - | - |
United States of America | 3,096,169 | 3,096,169 | - | - |
Germany | 3,013,129 | 3,013,129 | - | - |
Spain | 2,189,378 | 2,035,198 | 154,180 | - |
Australia | 2,105,847 | 2,105,847 | - | - |
Other | 26,837,530 | 25,140,942 | 1,696,588 | - |
Investment Companies | 342,000 | 342,000 | - | - |
Money Market Funds | 355,537 | 355,537 | - | - |
Cash Equivalents | 1,074,000 | - | 1,074,000 | - |
Total Investments in Securities: | $ 68,536,297 | $ 59,606,275 | $ 8,930,022 | $ - |
The following is a reconciliation of Investments in Securities for which Level 3 inputs were used in determining value: |
Investments in Securities: | |
Beginning Balance | $ 369 |
Total Realized Gain (Loss) | (25,822) |
Total Unrealized Gain (Loss) | 25,854 |
Cost of Purchases | - |
Proceeds of Sales | (401) |
Amortization/Accretion | - |
Transfers in to Level 3 | - |
Transfers out of Level 3 | - |
Ending Balance | $ - |
The change in unrealized gain (loss) for the period attributable to Level 3 securities held at October 31, 2010 | $ - |
The information used in the above reconciliation represents fiscal year to date activity for any Investments in Securities identified as using Level 3 inputs at either the beginning or the end of the current fiscal period. Transfers in or out of Level 3 represent the beginning value of any Security or Instrument where a change in the pricing level occurred from the beginning to the end of the period. The cost of purchases and the proceeds of sales may include securities received or delivered through corporate actions or exchanges. Realized and unrealized gains (losses) disclosed in the reconciliation are included in Net Gain (Loss) on the Fund's Statement of Operations. |
Income Tax Information |
At October 31, 2010, the Fund had a capital loss carryforward of approximately $24,325,764 of which $8,618,800 and $15,706,964 will expire on October 31, 2016 and 2017, respectively. Capital loss carryforwards are only available to offset future capital gains of the Fund to the extent provided by regulations and may be limited. |
See accompanying notes which are an integral part of the financial statements.
Annual Report
Statement of Assets and Liabilities
| October 31, 2010 |
| | |
Assets | | |
Investment in securities, at value (including securities loaned of $337,322 and repurchase agreements of $1,074,000) - See accompanying schedule: Unaffiliated issuers (cost $64,826,706) | $ 68,180,760 | |
Fidelity Central Funds (cost $355,537) | 355,537 | |
Total Investments (cost $65,182,243) | | $ 68,536,297 |
Cash | | 2,825 |
Foreign currency held at value (cost $238,396) | | 238,365 |
Receivable for investments sold | | 225,351 |
Receivable for fund shares sold | | 93,567 |
Dividends receivable | | 171,941 |
Distributions receivable from Fidelity Central Funds | | 52 |
Receivable from investment adviser for expense reductions | | 65,182 |
Other receivables | | 3,697 |
Total assets | | 69,337,277 |
| | |
Liabilities | | |
Payable for investments purchased | $ 107,723 | |
Payable for fund shares redeemed | 67,777 | |
Accrued management fee | 38,219 | |
Distribution and service plan fees payable | 2,988 | |
Other affiliated payables | 18,211 | |
Other payables and accrued expenses | 109,597 | |
Collateral on securities loaned, at value | 355,537 | |
Total liabilities | | 700,052 |
| | |
Net Assets | | $ 68,637,225 |
Net Assets consist of: | | |
Paid in capital | | $ 89,611,259 |
Undistributed net investment income | | 724,017 |
Accumulated undistributed net realized gain (loss) on investments and foreign currency transactions | | (25,059,753) |
Net unrealized appreciation (depreciation) on investments and assets and liabilities in foreign currencies | | 3,361,702 |
Net Assets | | $ 68,637,225 |
See accompanying notes which are an integral part of the financial statements.
Annual Report
Statement of Assets and Liabilities - continued
| October 31, 2010 |
| | |
Calculation of Maximum Offering Price
Class A:
Net Asset Value and redemption price per share ($5,029,222 ÷ 683,520 shares) | | $ 7.36 |
| | |
Maximum offering price per share (100/94.25 of $7.36) | | $ 7.81 |
Class T:
Net Asset Value and redemption price per share ($1,003,572 ÷ 135,346 shares) | | $ 7.41 |
| | |
Maximum offering price per share (100/96.50 of $7.41) | | $ 7.68 |
Class B:
Net Asset Value and offering price per share ($327,327 ÷ 44,417 shares)A | | $ 7.37 |
| | |
Class C:
Net Asset Value and offering price per share ($1,422,646 ÷ 193,344 shares)A | | $ 7.36 |
| | |
Total International Equity:
Net Asset Value, offering price and redemption price per share ($60,826,332 ÷ 8,257,843 shares) | | $ 7.37 |
| | |
Institutional Class:
Net Asset Value, offering price and redemption price per share ($28,126 ÷ 3,827 shares) | | $ 7.35 |
A Redemption price per share is equal to net asset value less any applicable contingent deferred sales charge.
See accompanying notes which are an integral part of the financial statements.
Annual Report
Financial Statements - continued
Statement of Operations
| Year ended October 31, 2010 |
| | |
Investment Income | | |
Dividends | | $ 1,628,770 |
Interest | | 1,411 |
Income from Fidelity Central Funds | | 17,945 |
Income before foreign taxes withheld | | 1,648,126 |
Less foreign taxes withheld | | (137,196) |
Total income | | 1,510,930 |
| | |
Expenses | | |
Management fee
Basic fee | $ 407,616 | |
Performance adjustment | (31,057) | |
Transfer agent fees | 168,397 | |
Distribution and service plan fees | 32,016 | |
Accounting and security lending fees | 29,939 | |
Custodian fees and expenses | 283,045 | |
Independent trustees' compensation | 315 | |
Registration fees | 81,296 | |
Audit | 89,169 | |
Legal | 347 | |
Miscellaneous | 625 | |
Total expenses before reductions | 1,061,708 | |
Expense reductions | (324,723) | 736,985 |
Net investment income (loss) | | 773,945 |
Realized and Unrealized Gain (Loss) Net realized gain (loss) on: | | |
Investment securities: | | |
Unaffiliated issuers | 1,923,248 | |
Foreign currency transactions | (17,111) | |
Total net realized gain (loss) | | 1,906,137 |
Change in net unrealized appreciation (depreciation) on: Investment securities | 5,446,085 | |
Assets and liabilities in foreign currencies | 1,641 | |
Total change in net unrealized appreciation (depreciation) | | 5,447,726 |
Net gain (loss) | | 7,353,863 |
Net increase (decrease) in net assets resulting from operations | | $ 8,127,808 |
See accompanying notes which are an integral part of the financial statements.
Annual Report
Statement of Changes in Net Assets
| Year ended
October 31,
2010 | Year ended
October 31,
2009 |
Increase (Decrease) in Net Assets | | |
Operations | | |
Net investment income (loss) | $ 773,945 | $ 445,721 |
Net realized gain (loss) | 1,906,137 | (15,995,813) |
Change in net unrealized appreciation (depreciation) | 5,447,726 | 25,959,338 |
Net increase (decrease) in net assets resulting
from operations | 8,127,808 | 10,409,246 |
Distributions to shareholders from net investment income | (411,223) | (859,670) |
Distributions to shareholders from net realized gain | (169,935) | - |
Total distributions | (581,158) | (859,670) |
Share transactions - net increase (decrease) | 18,410,630 | (6,640,043) |
Redemption fees | 6,300 | 1,869 |
Total increase (decrease) in net assets | 25,963,580 | 2,911,402 |
| | |
Net Assets | | |
Beginning of period | 42,673,645 | 39,762,243 |
End of period (including undistributed net investment income of $724,017 and undistributed net investment income of $385,749, respectively) | $ 68,637,225 | $ 42,673,645 |
See accompanying notes which are an integral part of the financial statements.
Annual Report
Financial Highlights - Class A
Years ended October 31, | 2010 | 2009 | 2008 F |
Selected Per-Share Data | | | |
Net asset value, beginning of period | $ 6.40 | $ 4.90 | $ 10.00 |
Income from Investment Operations | | | |
Net investment income (loss) C | .08 | .06 | .11 |
Net realized and unrealized gain (loss) | .95 | 1.55 | (5.21) |
Total from investment operations | 1.03 | 1.61 | (5.10) |
Distributions from net investment income | (.04) | (.11) | - |
Distributions from net realized gain | (.03) | - | - |
Total distributions | (.07) | (.11) | - |
Redemption fees added to paid in capital C, H | - | - | - |
Net asset value, end of period | $ 7.36 | $ 6.40 | $ 4.90 |
Total Return A, B | 16.17% | 33.87% | (51.00)% |
Ratios to Average Net Assets D, G | | | |
Expenses before reductions | 2.02% | 2.09% | 2.00% |
Expenses net of fee waivers, if any | 1.50% | 1.50% | 1.50% |
Expenses net of all reductions | 1.47% | 1.47% | 1.48% |
Net investment income (loss) | 1.15% | 1.13% | 1.35% |
Supplemental Data | | | |
Net assets, end of period (000 omitted) | $ 5,029 | $ 3,727 | $ 5,944 |
Portfolio turnover rate E | 67% | 98% | 91% |
A Total returns would have been lower had certain expenses not been reduced during the periods shown.
B Total returns do not include the effect of the sales charges.
C Calculated based on average shares outstanding during the period.
D Fees and expenses of the underlying Fidelity Central Funds are not included in the Fund's expense ratio. The Fund indirectly bears its proportionate share of the expenses of any underlying Fidelity Central Funds.
E Amount does not include the portfolio activity of any underlying Fidelity Central Funds.
F For the period November 1, 2007 (commencement of operations) to October 31, 2008.
G Expense ratios reflect operating expenses of the class. Expenses before reductions do not reflect amounts reimbursed by the investment adviser or reductions from brokerage service arrangements or reductions from other expense offset arrangements and do not represent the amount paid by the class during periods when reimbursements or reductions occur. Expense ratios before reductions for start-up periods may not be representative of longer-term operating periods. Expenses net of fee waivers reflect expenses after reimbursement by the investment adviser but prior to reductions from brokerage service arrangements or other expense offset arrangements. Expenses net of all reductions represent the net expenses paid by the class.
H Amount represents less than $.01 per share.
See accompanying notes which are an integral part of the financial statements.
Annual Report
Financial Highlights - Class T
Years ended October 31, | 2010 | 2009 | 2008 F |
Selected Per-Share Data | | | |
Net asset value, beginning of period | $ 6.40 | $ 4.88 | $ 10.00 |
Income from Investment Operations | | | |
Net investment income (loss) C | .06 | .04 | .09 |
Net realized and unrealized gain (loss) | .95 | 1.57 | (5.21) |
Total from investment operations | 1.01 | 1.61 | (5.12) |
Distributions from net investment income | - | (.09) | - |
Redemption fees added to paid in capital C, H | - | - | - |
Net asset value, end of period | $ 7.41 | $ 6.40 | $ 4.88 |
Total Return A, B | 15.78% | 33.74% | (51.20)% |
Ratios to Average Net Assets D, G | | | |
Expenses before reductions | 2.31% | 2.34% | 2.42% |
Expenses net of fee waivers, if any | 1.75% | 1.75% | 1.75% |
Expenses net of all reductions | 1.72% | 1.72% | 1.73% |
Net investment income (loss) | .90% | .88% | 1.10% |
Supplemental Data | | | |
Net assets, end of period (000 omitted) | $ 1,004 | $ 1,526 | $ 2,567 |
Portfolio turnover rate E | 67% | 98% | 91% |
A Total returns would have been lower had certain expenses not been reduced during the periods shown.
B Total returns do not include the effect of the sales charges.
C Calculated based on average shares outstanding during the period.
D Fees and expenses of the underlying Fidelity Central Funds are not included in the Fund's expense ratio. The Fund indirectly bears its proportionate share of the expenses of any underlying Fidelity Central Funds.
E Amount does not include the portfolio activity of any underlying Fidelity Central Funds.
F For the period November 1, 2007 (commencement of operations) to October 31, 2008.
G Expense ratios reflect operating expenses of the class. Expenses before reductions do not reflect amounts reimbursed by the investment adviser or reductions from brokerage service arrangements or reductions from other expense offset arrangements and do not represent the amount paid by the class during periods when reimbursements or reductions occur. Expense ratios before reductions for start-up periods may not be representative of longer-term operating periods. Expenses net of fee waivers reflect expenses after reimbursement by the investment adviser but prior to reductions from brokerage service arrangements or other expense offset arrangements. Expenses net of all reductions represent the net expenses paid by the class.
H Amount represents less than $.01 per share.
See accompanying notes which are an integral part of the financial statements.
Annual Report
Financial Highlights - Class B
Years ended October 31, | 2010 | 2009 | 2008 F |
Selected Per-Share Data | | | |
Net asset value, beginning of period | $ 6.39 | $ 4.86 | $ 10.00 |
Income from Investment Operations | | | |
Net investment income (loss) C | .03 | .02 | .05 |
Net realized and unrealized gain (loss) | .95 | 1.56 | (5.19) |
Total from investment operations | .98 | 1.58 | (5.14) |
Distributions from net investment income | - | (.05) | - |
Redemption fees added to paid in capital C, H | - | - | - |
Net asset value, end of period | $ 7.37 | $ 6.39 | $ 4.86 |
Total Return A, B | 15.34% | 32.95% | (51.40)% |
Ratios to Average Net Assets D, G | | | |
Expenses before reductions | 2.81% | 2.82% | 2.92% |
Expenses net of fee waivers, if any | 2.25% | 2.25% | 2.25% |
Expenses net of all reductions | 2.22% | 2.22% | 2.24% |
Net investment income (loss) | .40% | .38% | .60% |
Supplemental Data | | | |
Net assets, end of period (000 omitted) | $ 327 | $ 1,337 | $ 2,505 |
Portfolio turnover rate E | 67% | 98% | 91% |
A Total returns would have been lower had certain expenses not been reduced during the periods shown.
B Total returns do not include the effect of the contingent deferred sales charge.
C Calculated based on average shares outstanding during the period.
D Fees and expenses of the underlying Fidelity Central Funds are not included in the Fund's expense ratio. The Fund indirectly bears its proportionate share of the expenses of any underlying Fidelity Central Funds.
E Amount does not include the portfolio activity of any underlying Fidelity Central Funds.
F For the period November 1, 2007 (commencement of operations) to October 31, 2008.
G Expense ratios reflect operating expenses of the class. Expenses before reductions do not reflect amounts reimbursed by the investment adviser or reductions from brokerage service arrangements or reductions from other expense offset arrangements and do not represent the amount paid by the class during periods when reimbursements or reductions occur. Expense ratios before reductions for start-up periods may not be representative of longer-term operating periods. Expenses net of fee waivers reflect expenses after reimbursement by the investment adviser but prior to reductions from brokerage service arrangements or other expense offset arrangements. Expenses net of all reductions represent the net expenses paid by the class.
H Amount represents less than $.01 per share.
See accompanying notes which are an integral part of the financial statements.
Annual Report
Financial Highlights - Class C
Years ended October 31, | 2010 | 2009 | 2008 F |
Selected Per-Share Data | | | |
Net asset value, beginning of period | $ 6.39 | $ 4.86 | $ 10.00 |
Income from Investment Operations | | | |
Net investment income (loss) C | .03 | .02 | .05 |
Net realized and unrealized gain (loss) | .94 | 1.56 | (5.19) |
Total from investment operations | .97 | 1.58 | (5.14) |
Distributions from net investment income | - | (.05) | - |
Redemption fees added to paid in capital C, H | - | - | - |
Net asset value, end of period | $ 7.36 | $ 6.39 | $ 4.86 |
Total Return A, B | 15.18% | 33.10% | (51.40)% |
Ratios to Average Net Assets D, G | | | |
Expenses before reductions | 2.80% | 2.85% | 2.92% |
Expenses net of fee waivers, if any | 2.25% | 2.25% | 2.25% |
Expenses net of all reductions | 2.22% | 2.22% | 2.23% |
Net investment income (loss) | .40% | .38% | .60% |
Supplemental Data | | | |
Net assets, end of period (000 omitted) | $ 1,423 | $ 1,714 | $ 2,787 |
Portfolio turnover rate E | 67% | 98% | 91% |
A Total returns would have been lower had certain expenses not been reduced during the periods shown.
B Total returns do not include the effect of the contingent deferred sales charge.
C Calculated based on average shares outstanding during the period.
D Fees and expenses of the underlying Fidelity Central Funds are not included in the Fund's expense ratio. The Fund indirectly bears its proportionate share of the expenses of any underlying Fidelity Central Funds.
E Amount does not include the portfolio activity of any underlying Fidelity Central Funds.
F For the period November 1, 2007 (commencement of operations) to October 31, 2008.
G Expense ratios reflect operating expenses of the class. Expenses before reductions do not reflect amounts reimbursed by the investment adviser or reductions from brokerage service arrangements or reductions from other expense offset arrangements and do not represent the amount paid by the class during periods when reimbursements or reductions occur. Expense ratios before reductions for start-up periods may not be representative of longer-term operating periods. Expenses net of fee waivers reflect expenses after reimbursement by the investment adviser but prior to reductions from brokerage service arrangements or other expense offset arrangements. Expenses net of all reductions represent the net expenses paid by the class.
H Amount represents less than $.01 per share.
See accompanying notes which are an integral part of the financial statements.
Annual Report
Financial Highlights - Total International Equity
Years ended October 31, | 2010 | 2009 | 2008 E |
Selected Per-Share Data | | | |
Net asset value, beginning of period | $ 6.41 | $ 4.91 | $ 10.00 |
Income from Investment Operations | | | |
Net investment income (loss) B | .09 | .07 | .13 |
Net realized and unrealized gain (loss) | .96 | 1.55 | (5.21) |
Total from investment operations | 1.05 | 1.62 | (5.08) |
Distributions from net investment income | (.06) | (.12) | (.01) |
Distributions from net realized gain | (.03) | - | - |
Total distributions | (.09) | (.12) | (.01) |
Redemption fees added to paid in capital B, G | - | - | - |
Net asset value, end of period | $ 7.37 | $ 6.41 | $ 4.91 |
Total Return A | 16.45% | 34.23% | (50.87)% |
Ratios to Average Net Assets C, F | | | |
Expenses before reductions | 1.79% | 1.87% | 1.89% |
Expenses net of fee waivers, if any | 1.25% | 1.25% | 1.25% |
Expenses net of all reductions | 1.22% | 1.22% | 1.23% |
Net investment income (loss) | 1.40% | 1.38% | 1.60% |
Supplemental Data | | | |
Net assets, end of period (000 omitted) | $ 60,826 | $ 33,061 | $ 23,226 |
Portfolio turnover rate D | 67% | 98% | 91% |
A Total returns would have been lower had certain expenses not been reduced during the periods shown.
B Calculated based on average shares outstanding during the period.
C Fees and expenses of the underlying Fidelity Central Funds are not included in the Fund's expense ratio. The Fund indirectly bears its proportionate share of the expenses of any underlying Fidelity Central Funds.
D Amount does not include the portfolio activity of any underlying Fidelity Central Funds.
E For the period November 1, 2007 (commencement of operations) to October 31, 2008.
F Expense ratios reflect operating expenses of the class. Expenses before reductions do not reflect amounts reimbursed by the investment adviser or reductions from brokerage service arrangements or reductions from other expense offset arrangements and do not represent the amount paid by the class during periods when reimbursements or reductions occur. Expense ratios before reductions for start-up periods may not be representative of longer-term operating periods. Expenses net of fee waivers reflect expenses after reimbursement by the investment adviser but prior to reductions from brokerage service arrangements or other expense offset arrangements. Expenses net of all reductions represent the net expenses paid by the class.
G Amount represents less than $.01 per share.
See accompanying notes which are an integral part of the financial statements.
Annual Report
Financial Highlights - Institutional Class
Years ended October 31, | 2010 | 2009 | 2008 E |
Selected Per-Share Data | | | |
Net asset value, beginning of period | $ 6.41 | $ 4.91 | $ 10.00 |
Income from Investment Operations | | | |
Net investment income (loss) B | .10 | .07 | .13 |
Net realized and unrealized gain (loss) | .95 | 1.55 | (5.21) |
Total from investment operations | 1.05 | 1.62 | (5.08) |
Distributions from net investment income | (.08) | (.12) | (.01) |
Distributions from net realized gain | (.03) | - | - |
Total distributions | (.11) | (.12) | (.01) |
Redemption fees added to paid in capital B, G | - | - | - |
Net asset value, end of period | $ 7.35 | $ 6.41 | $ 4.91 |
Total Return A | 16.48% | 34.23% | (50.87)% |
Ratios to Average Net Assets C, F | | | |
Expenses before reductions | 1.82% | 1.80% | 1.91% |
Expenses net of fee waivers, if any | 1.25% | 1.25% | 1.25% |
Expenses net of all reductions | 1.23% | 1.22% | 1.23% |
Net investment income (loss) | 1.40% | 1.38% | 1.60% |
Supplemental Data | | | |
Net assets, end of period (000 omitted) | $ 28 | $ 1,308 | $ 2,733 |
Portfolio turnover rate D | 67% | 98% | 91% |
A Total returns would have been lower had certain expenses not been reduced during the periods shown.
B Calculated based on average shares outstanding during the period.
C Fees and expenses of the underlying Fidelity Central Funds are not included in the Fund's expense ratio. The Fund indirectly bears its proportionate share of the expenses of any underlying Fidelity Central Funds.
D Amount does not include the portfolio activity of any underlying Fidelity Central Funds.
E For the period November 1, 2007 (commencement of operations) to October 31, 2008.
F Expense ratios reflect operating expenses of the class. Expenses before reductions do not reflect amounts reimbursed by the investment adviser or reductions from brokerage service arrangements or reductions from other expense offset arrangements and do not represent the amount paid by the class during periods when reimbursements or reductions occur. Expense ratios before reductions for start-up periods may not be representative of longer-term operating periods. Expenses net of fee waivers reflect expenses after reimbursement by the investment adviser but prior to reductions from brokerage service arrangements or other expense offset arrangements. Expenses net of all reductions represent the net expenses paid by the class.
G Amount represents less than $.01 per share.
See accompanying notes which are an integral part of the financial statements.
Annual Report
Notes to Financial Statements
For the period ended October 31, 2010
1. Organization.
Fidelity Total International Equity Fund (the Fund) is a fund of Fidelity Investment Trust (the Trust) and is authorized to issue an unlimited number of shares. The Trust is registered under the Investment Company Act of 1940, as amended (the 1940 Act), as an open-end management investment company organized as a Massachusetts business trust. The Fund offers Class A, Class T, Class C, Total International Equity and Institutional Class shares, each of which has equal rights as to assets and voting privileges. Effective after the close of business on September 1, 2010, Class B shares were closed to new accounts and additional purchases by existing shareholders. Each class has exclusive voting rights with respect to matters that affect that class. Class B shares will automatically convert to Class A shares after a holding period of seven years from the initial date of purchase. Investment income, realized and unrealized capital gains and losses, the common expenses of the Fund, and certain fund-level expense reductions, if any, are allocated on a pro-rata basis to each class based on the relative net assets of each class to the total net assets of the Fund. Each class differs with respect to transfer agent and distribution and service plan fees incurred. Certain expense reductions also differ by class. The Fund's investments in emerging markets can be subject to social, economic, regulatory, and political uncertainties and can be extremely volatile.
2. Investments in Fidelity Central Funds.
The Fund may invest in Fidelity Central Funds, which are open-end investment companies available only to other investment companies and accounts managed by Fidelity Management & Research Company (FMR) and its affiliates. The Fund's Schedule of Investments lists each of the Fidelity Central Funds held as of period end, if any, as an investment of the Fund, but does not include the underlying holdings of each Fidelity Central Fund. As an Investing Fund, the Fund indirectly bears its proportionate share of the expenses of the underlying Fidelity Central Funds.
The Money Market Central Funds seek preservation of capital and current income and are managed by Fidelity Investments Money Management, Inc. (FIMM), an affiliate of FMR.
A complete unaudited list of holdings for each Fidelity Central Fund is available upon request or at the Securities and Exchange Commission (the SEC) web site at www.sec.gov. In addition, the financial statements of the Fidelity Central Funds, which are not covered by the Fund's Report of Independent Registered Public Accounting Firm, are available on the SEC web site or upon request.
Annual Report
3. Significant Accounting Policies.
The financial statements have been prepared in conformity with accounting principles generally accepted in the United States of America (GAAP), which require management to make certain estimates and assumptions at the date of the financial statements. Actual results could differ from those estimates. The following summarizes the significant accounting policies of the Fund:
Security Valuation. Investments are valued as of 4:00 p.m. Eastern time on the last calendar day of the period. The Fund uses independent pricing services approved by the Board of Trustees to value its investments. When current market prices or quotations are not readily available or reliable, valuations may be determined in good faith in accordance with procedures adopted by the Board of Trustees. Factors used in determining value may include market or security specific events. The frequency with which these procedures are used cannot be predicted and they may be utilized to a significant extent. The value used for net asset value (NAV) calculation under these procedures may differ from published prices for the same securities.
The Fund categorizes the inputs to valuation techniques used to value its investments into a disclosure hierarchy consisting of three levels as shown below.
Level 1 - quoted prices in active markets for identical investments
Level 2 - other significant observable inputs (including quoted prices for similar investments, interest rates, prepayment speeds, etc.)
Level 3 - unobservable inputs (including the fund's own assumptions based on the best information available)
Changes in valuation techniques may result in transfers in or out of an assigned level within the disclosure hierarchy. The aggregate value of investments by input level, as of October 31, 2010, as well as a roll forward of Level 3 securities, is included at the end of the Fund's Schedule of Investments. Valuation techniques used to value the Fund's investments by major category are as follows.
Equity securities, including restricted securities, for which market quotations are readily available, are valued at the last reported sale price or official closing price as reported by an independent pricing service on the primary market or exchange on which they are traded and are categorized as Level 1 in the hierarchy. In the event there were no sales during the day or closing prices are not available, securities are valued at the last quoted bid price or may be valued using the last available price and are generally categorized as Level 2 in the hierarchy. For foreign equity securities, when significant market or security specific events arise, comparisons to the valuation of American Depositary Receipts (ADRs), futures contracts, Exchange-traded funds (ETFs) and certain indexes as well as
Annual Report
Notes to Financial Statements - continued
3. Significant Accounting Policies - continued
Security Valuation - continued
quoted prices for similar securities are used and are categorized as Level 2 in the hierarchy in these circumstances. Utilizing these techniques may result in transfers between Level 1 and Level 2. For restricted equity securities and private placements where observable inputs are limited, assumptions about market activity and risk are used and are categorized as Level 3 in the hierarchy.
ETFs are valued at their last sale price or official closing price as reported by an independent pricing service on the primary market or exchange on which they are traded and are categorized as Level 1 in the hierarchy. In the event there were no sales during the day but the exchange reports a closing bid level, ETFs are valued at the closing bid and would be categorized as Level 1 in the hierarchy. In the event there was no closing bid, ETFs may be valued by another method that the Board of Trustees believes reflects fair value in accordance with the Board's fair value pricing policies and may be categorized as Level 2 in the hierarchy.
Investments in open-end mutual funds, including the Fidelity Central Funds, are valued at their closing net asset value each business day and are categorized as Level 1 in the hierarchy. Short-term securities with remaining maturities of sixty days or less for which quotations are not readily available are valued at amortized cost, which approximates fair value and are categorized as Level 2 in the hierarchy.
Foreign Currency. The Fund uses foreign currency contracts to facilitate transactions in foreign-denominated securities. Gains and losses from these transactions may arise from changes in the value of the foreign currency or if the counterparties do not perform under the contracts' terms.
Foreign-denominated assets, including investment securities, and liabilities are translated into U.S. dollars at the exchange rate at period end. Purchases and sales of investment securities, income and dividends received and expenses denominated in foreign currencies are translated into U.S. dollars at the exchange rate in effect on the transaction date.
The effects of exchange rate fluctuations on investments are included with the net realized and unrealized gain (loss) on investment securities. Other foreign currency transactions resulting in realized and unrealized gain (loss) are disclosed separately.
Annual Report
3. Significant Accounting Policies - continued
Investment Transactions and Income. For financial reporting purposes, the Fund's investment holdings and NAV include trades executed through the end of the last business day of the period. The NAV per share for processing shareholder transactions is calculated as of the close of business of the New York Stock Exchange (NYSE), normally 4:00 p.m. Eastern time and includes trades executed through the end of the prior business day. Gains and losses on securities sold are determined on the basis of identified cost. Dividend income is recorded on the ex-dividend date, except for certain dividends from foreign securities where the ex-dividend date may have passed, which are recorded as soon as the Fund is informed of the ex-dividend date. Non-cash dividends included in dividend income, if any, are recorded at the fair market value of the securities received. Distributions received on securities that represent a return of capital or capital gain are recorded as a reduction of cost of investments and/or as a realized gain. The Fund estimates the components of distributions received that may be considered return of capital distributions or capital gain distributions. Interest income and distributions from the Fidelity Central Funds are accrued as earned. Interest income includes coupon interest and amortization of premium and accretion of discount on debt securities. Investment income is recorded net of foreign taxes withheld where recovery of such taxes is uncertain.
Expenses. Most expenses of the Trust can be directly attributed to a fund. Expenses which cannot be directly attributed are apportioned amongst each fund in the Trust. Expense estimates are accrued in the period to which they relate and adjustments are made when actual amounts are known.
Income Tax Information and Distributions to Shareholders. Each year the Fund intends to qualify as a regulated investment company, including distributing substantially all of its taxable income and realized gains under Subchapter M of the Internal Revenue Code and filing its U.S. federal tax return. As a result, no provision for income taxes is required. As of October 31, 2010, the Fund did not have any unrecognized tax benefits in the accompanying financial statements. A fund's federal tax return is subject to examination by the Internal Revenue Service (IRS) for a period of three years. Foreign taxes are provided for based on the Fund's understanding of the tax rules and rates that exist in the foreign markets in which it invests.
Distributions are declared and recorded on the ex-dividend date. Income dividends and capital gain distributions are declared separately for each class. Income and capital gain distributions are determined in accordance with income tax regulations, which may differ from GAAP.
Capital accounts within the financial statements are adjusted for permanent book-tax differences. These adjustments have no impact on net assets or the results of operations. Temporary book-tax differences will reverse in a subsequent period.
Annual Report
Notes to Financial Statements - continued
3. Significant Accounting Policies - continued
Income Tax Information and Distributions to Shareholders - continued
Book-tax differences are primarily due to the short-term gain distributions from the Underlying Funds, foreign currency transactions, passive foreign investment companies (PFIC), partnerships, capital loss carryforwards and losses deferred due to wash sales.
The federal tax cost of investment securities and unrealized appreciation (depreciation) as of period end were as follows:
Gross unrealized appreciation | $ 8,591,290 |
Gross unrealized depreciation | (6,168,619) |
Net unrealized appreciation (depreciation) | $ 2,422,671 |
| |
Tax Cost | $ 66,113,626 |
The tax-based components of distributable earnings as of period end were as follows:
Undistributed ordinary income | $ 921,411 |
Capital loss carryforward | $ (24,325,764) |
Net unrealized appreciation (depreciation) | $ 2,430,319 |
The tax character of distributions paid was as follows:
| October 31, 2010 | October 31, 2009 |
Ordinary Income | $ 581,158 | $ 859,670 |
Short-Term Trading (Redemption) Fees. Shares held by investors in the Fund less than 30 days are subject to a redemption fee equal to 1.00% of the net asset value of shares redeemed. All redemption fees, which reduce the proceeds of the shareholder redemption, are retained by the Funds and accounted for as an addition to paid in capital.
4. Operating Policies.
Repurchase Agreements. FMR has received an Exemptive Order from the SEC which permits the Fund and other affiliated entities of FMR to transfer uninvested cash balances into joint trading accounts which are then invested in repurchase agreements. The Fund may also invest directly with institutions in repurchase agreements. Repurchase agreements are collateralized by government or non-government securities. Upon settlement date, collateral is held in segregated accounts with custodian banks and may be obtained in the event of a default of the counterparty. The Fund monitors, on a daily basis, the value of the collateral to ensure it is at least equal to the principal amount of the repurchase agreement (including accrued interest). In the event of a default by the
Annual Report
4. Operating Policies - continued
Repurchase Agreements - continued
counterparty, realization of the collateral proceeds could be delayed, during which time the value of the collateral may decline.
Restricted Securities. The Fund may invest in securities that are subject to legal or contractual restrictions on resale. These securities generally may be resold in transactions exempt from registration or to the public if the securities are registered. Disposal of these securities may involve time-consuming negotiations and expense, and prompt sale at an acceptable price may be difficult. Information regarding restricted securities is included at the end of the Fund's Schedule of Investments.
5. Purchases and Sales of Investments.
Purchases and sales of securities, other than short-term securities, aggregated $54,337,237 and $37,096,392, respectively.
6. Fees and Other Transactions with Affiliates.
Management Fee. FMR and its affiliates provide the Fund with investment management related services for which the Fund pays a monthly management fee. The management fee is the sum of an individual fund fee rate that is based on an annual rate of .45% of the Fund's average net assets and a group fee rate that averaged .26% during the period. The group fee rate is based upon the average net assets of all the mutual funds advised by FMR. The group fee rate decreases as assets under management increase and increases as assets under management decrease. In addition, the management fee is subject to a performance adjustment (up to a maximum of ± .20% of the Fund's average net assets over a 36 month performance period). The upward or downward adjustment to the management fee is based on the relative investment performance of Total International Equity as compared to an appropriate benchmark index. The Fund's performance adjustment took effect in November 2008. Subsequent months will be added until the performance period includes 36 months. For the period, the total annual management fee rate, including the performance adjustment, was .65% of the Fund's average net assets.
Distribution and Service Plan Fees. In accordance with Rule 12b-1 of the 1940 Act, the Fund has adopted separate Distribution and Service Plans for each class of shares. Certain classes pay Fidelity Distributors Corporation (FDC), an affiliate of FMR, separate Distribution and Service Fees, each of which is based on an annual percentage of each class' average net assets. In addition, FDC may pay financial intermediaries for
Annual Report
Notes to Financial Statements - continued
6. Fees and Other Transactions with Affiliates - continued
Distribution and Service Plan Fees - continued
selling shares of the Fund and providing shareholder support services. For the period, the Distribution and Service Fee rates, total fees and amounts retained by FDC were as follows:
| Distribution
Fee | Service
Fee | Total
Fees | Retained
by FDC |
Class A | -% | .25% | $ 10,450 | $ - |
Class T | .25% | .25% | 4,688 | 238 |
Class B | .75% | .25% | 3,367 | 2,686 |
Class C | .75% | .25% | 13,511 | 6,154 |
| | | $ 32,016 | $ 9,078 |
Sales Load. FDC receives a front-end sales charge of up to 5.75% for selling Class A shares, and 3.50% for selling Class T shares, some of which is paid to financial intermediaries for selling shares of the Fund. FDC receives the proceeds of contingent deferred sales charges levied on Class A, Class T, Class B, and Class C redemptions. These charges depend on the holding period. The deferred sales charges range from 5% to 1% for Class B, 1% for Class C, 1.00% for certain purchases of Class A shares (1.00% to .50% prior to July 12, 2010) and .25% for certain purchases of Class T shares.
For the period, sales charge amounts retained by FDC were as follows:
| Retained
by FDC |
Class A | $ 2,966 |
Class T | 2,078 |
Class B* | 920 |
Class C* | 13 |
| $ 5,977 |
* When Class B and Class C shares are initially sold, FDC pays commissions from its own resources to financial intermediaries through which the sales are made.
Transfer Agent Fees. Fidelity Investments Institutional Operations Company, Inc. (FIIOC), an affiliate of FMR, is the transfer, dividend disbursing and shareholder servicing agent for each class of the Fund. FIIOC receives account fees and asset-based fees that vary according to the account size and type of account of the shareholders of the respective classes of the Fund. FIIOC pays for typesetting, printing and mailing of
Annual Report
6. Fees and Other Transactions with Affiliates - continued
Transfer Agent Fees - continued
shareholder reports, except proxy statements. For the period, transfer agent fees for each class were as follows:
| Amount | % of
Average
Net Assets |
Class A | $ 11,393 | .27 |
Class T | 3,002 | .32 |
Class B | 954 | .28 |
Class C | 4,057 | .30 |
Total International Equity | 148,596 | .29 |
Institutional Class | 395 | .23 |
| $ 168,397 | |
Accounting and Security Lending Fees. Fidelity Service Company, Inc. (FSC), an affiliate of FMR, maintains the Fund's accounting records. The accounting fee is based on the level of average net assets for the month. Under a separate contract, FSC administers the security lending program. The security lending fee is based on the number and duration of lending transactions.
Brokerage Commissions. The Fund placed a portion of its portfolio transactions with brokerage firms which are affiliates of the investment adviser. The commissions paid to these affiliated firms were $437 for the period.
7. Committed Line of Credit.
The Fund participates with other funds managed by FMR or an affiliate in a $3.75 billion credit facility (the "line of credit") to be utilized for temporary or emergency purposes to fund shareholder redemptions or for other short-term liquidity purposes. The Fund has agreed to pay commitment fees on its pro-rata portion of the line of credit, which amounted to $219 and is reflected in Miscellaneous expenses on the Statement of Operations. During the period, there were no borrowings on this line of credit.
8. Security Lending.
The Fund lends portfolio securities through a lending agent from time to time in order to earn additional income. The lending agent may loan securities to certain qualified borrowers, including Fidelity Capital Markets (FCM), a broker-dealer affiliated with the Fund. On the settlement date of the loan, the Fund receives collateral (in the form of U.S. Treasury obligations, letters of credit and/or cash) against the loaned securities and maintains collateral in an amount not less than 100% of the market value of the loaned
Annual Report
Notes to Financial Statements - continued
8. Security Lending - continued
securities during the period of the loan. The market value of the loaned securities is determined at the close of business of the Fund and any additional required collateral is delivered to the Fund on the next business day. If the borrower defaults on its obligation to return the securities loaned because of insolvency or other reasons, a fund could experience delays and costs in recovering the securities loaned or in gaining access to the collateral. Any cash collateral received is invested in the Fidelity Securities Lending Cash Central Fund. The value of loaned securities and cash collateral at period end are disclosed on the Fund's Statement of Assets and Liabilities. Security lending income represents the income earned on investing cash collateral, less rebates paid to borrowers and lending agent fees associated with the loan, plus any premium payments received for lending certain types of securities. Security lending income is presented in the Statement of Operations as a component of income from Fidelity Central Funds. Total security lending income during the period amounted to $17,945. During the period, there were no securities loaned to FCM.
9. Expense Reductions.
FMR voluntarily agreed to reimburse each class to the extent annual operating expenses exceeded certain levels of average net assets as noted in the table below. Some expenses, for example interest expense, including commitment fees, are excluded from this reimbursement.
The following classes were in reimbursement during the period:
| Expense
Limitations | Reimbursement
from adviser |
| | |
Class A | 1.50% | $ 22,035 |
Class T | 1.75% | 5,266 |
Class B | 2.25% | 1,870 |
Class C | 2.25% | 7,481 |
Total International Equity | 1.25% | 272,664 |
Institutional Class | 1.25% | 962 |
| | $ 310,278 |
Effective November 1, 2010 the expense limitation will be changed to 1.45%, 1.70%, 2.20%, 2.20%, 1.20% and 1.20% for Class A, T, B, C, Total International Equity and Institutional, respectively.
Many of the brokers with whom FMR places trades on behalf of the Fund provided services to the Fund in addition to trade execution. These services included payments of certain expenses on behalf of the Fund totaling $14,445 for the period.
Annual Report
10. Distributions to Shareholders.
Distributions to shareholders of each class were as follows:
Years ended October 31, | 2010 | 2009 |
From net investment income | | |
Class A | $ 26,391 | $ 131,963 |
Class T | - | 45,379 |
Class B | - | 24,856 |
Class C | - | 30,949 |
Total International Equity | 382,451 | 560,888 |
Institutional Class | 2,381 | 65,635 |
Total | $ 411,223 | $ 859,670 |
From net realized gain | | |
Class A | $ 14,995 | $ - |
Total International Equity | 154,214 | - |
Institutional Class | 726 | - |
Total | $ 169,935 | $ - |
11. Share Transactions.
Transactions for each class of shares were as follows:
| Shares | Dollars |
Years ended October 31, | 2010 | 2009 | 2010 | 2009 |
Class A | | | | |
Shares sold | 443,125 | 372,557 | $ 2,924,922 | $ 1,887,197 |
Reinvestment of distributions | 5,568 | 30,531 | 37,804 | 130,977 |
Shares redeemed | (347,260) | (1,035,215) | (2,296,503) | (5,265,367) |
Net increase (decrease) | 101,433 | (632,127) | $ 666,223 | $ (3,247,193) |
Class T | | | | |
Shares sold | 121,719 | 59,609 | $ 807,663 | $ 314,219 |
Reinvestment of distributions | - | 10,553 | - | 45,379 |
Shares redeemed | (224,749) | (357,387) | (1,531,457) | (2,032,994) |
Net increase (decrease) | (103,030) | (287,225) | $ (723,794) | $ (1,673,396) |
Class B | | | | |
Shares sold | 30,066 | 19,155 | $ 198,826 | $ 103,145 |
Reinvestment of distributions | - | 5,760 | - | 24,827 |
Shares redeemed | (194,792) | (331,368) | (1,332,260) | (1,871,062) |
Net increase (decrease) | (164,726) | (306,453) | $ (1,133,434) | $ (1,743,090) |
Annual Report
Notes to Financial Statements - continued
11. Share Transactions - continued
| Shares | Dollars |
Years ended October 31, | 2010 | 2009 | 2010 | 2009 |
Class C | | | | |
Shares sold | 86,496 | 111,127 | $ 580,588 | $ 616,982 |
Reinvestment of distributions | - | 7,163 | - | 30,872 |
Shares redeemed | (161,545) | (423,400) | (1,102,805) | (2,395,281) |
Net increase (decrease) | (75,049) | (305,110) | $ (522,217) | $ (1,747,427) |
Total International Equity | | | | |
Shares sold | 6,833,012 | 2,869,211 | $ 45,955,028 | $ 16,097,831 |
Reinvestment of distributions | 74,043 | 124,381 | 502,009 | 533,594 |
Shares redeemed | (3,806,841) | (2,570,692) | (24,965,317) | (12,899,110) |
Net increase (decrease) | 3,100,214 | 422,900 | $ 21,491,720 | $ 3,732,315 |
Institutional Class | | | | |
Shares sold | 377 | 5,817 | $ 2,481 | $ 30,049 |
Reinvestment of distributions | 460 | 15,268 | 3,106 | 65,500 |
Shares redeemed | (201,123) | (373,992) | (1,373,455) | (2,056,801) |
Net increase (decrease) | (200,286) | (352,907) | $ (1,367,868) | $ (1,961,252) |
12. Other.
The Fund's organizational documents provide former and current trustees and officers with a limited indemnification against liabilities arising in connection with the performance of their duties to the Fund. In the normal course of business, the Fund may also enter into contracts that provide general indemnifications. The Fund's maximum exposure under these arrangements is unknown as this would be dependent on future claims that may be made against the Fund. The risk of material loss from such claims is considered remote.
Annual Report
To the Trustees of Fidelity Investment Trust and Shareholders of Fidelity Total International Equity Fund:
We have audited the accompanying statement of assets and liabilities of Fidelity Total International Equity Fund (the Fund), a fund of Fidelity Investment Trust, including the schedule of investments, as of October 31, 2010, and the related statement of operations for the year then ended, the statement of changes in net assets for each of the two years in the period then ended, and the financial highlights for each of the periods presented. These financial statements and financial highlights are the responsibility of the Fund's management. Our responsibility is to express an opinion on these financial statements and financial highlights based on our audits.
We conducted our audits in accordance with standards of the Public Company Accounting Oversight Board (United States). Those standards require that we plan and perform the audit to obtain reasonable assurance about whether the financial statements and financial highlights are free of material misstatement. The Fund is not required to have, nor were we engaged to perform, an audit of its internal control over financial reporting. Our audits included consideration of internal control over financial reporting as a basis for designing audit procedures that are appropriate in the circumstances, but not for the purpose of expressing an opinion on the effectiveness of the Fund's internal control over financial reporting. Accordingly, we express no such opinion. An audit also includes examining, on a test basis, evidence supporting the amounts and disclosures in the financial statements, assessing the accounting principles used and significant estimates made by management, as well as evaluating the overall financial statement presentation. Our procedures included confirmation of securities owned as of October 31, 2010, by correspondence with the custodians and brokers; where replies were not received from brokers, we performed other auditing procedures. We believe that our audits provide a reasonable basis for our opinion.
In our opinion, the financial statements and financial highlights referred to above present fairly, in all material respects, the financial position of Fidelity Total International Equity Fund as of October 31, 2010, the results of its operations for the year then ended, the changes in its net assets for each of the two years in the period then ended, and the financial highlights for each of the periods presented, in conformity with accounting principles generally accepted in the United States of America.
/s/ Deloitte & Touche LLP
DELOITTE & TOUCHE LLP
Boston, Massachusetts
December 14, 2010
Annual Report
The Trustees, Member of the Advisory Board, and executive officers of the trust and fund, as applicable, are listed below. The Board of Trustees governs the fund and is responsible for protecting the interests of shareholders. The Trustees are experienced executives who meet periodically throughout the year to oversee the fund's activities, review contractual arrangements with companies that provide services to the fund, oversee management of the risks associated with such activities and contractual arrangements, and review the fund's performance. Except for James C. Curvey, each of the Trustees oversees 221 funds advised by FMR or an affiliate. Mr. Curvey oversees 410 funds advised by FMR or an affiliate.
The Trustees hold office without limit in time except that (a) any Trustee may resign; (b) any Trustee may be removed by written instrument, signed by at least two-thirds of the number of Trustees prior to such removal; (c) any Trustee who requests to be retired or who has become incapacitated by illness or injury may be retired by written instrument signed by a majority of the other Trustees; and (d) any Trustee may be removed at any special meeting of shareholders by a two-thirds vote of the outstanding voting securities of the trust. Each Trustee who is not an interested person (as defined in the 1940 Act) (Independent Trustee), shall retire not later than the last day of the calendar year in which his or her 72nd birthday occurs. The Independent Trustees may waive this mandatory retirement age policy with respect to individual Trustees. The executive officers and Advisory Board Member hold office without limit in time, except that any officer and Advisory Board Member may resign or may be removed by a vote of a majority of the Trustees at any regular meeting or any special meeting of the Trustees. Except as indicated, each individual has held the office shown or other offices in the same company for the past five years.
Experience, Skills, Attributes, and Qualifications of the Fund's Trustees. The Governance and Nominating Committee has adopted a statement of policy that describes the experience, qualifications, attributes, and skills that are necessary and desirable for potential Independent Trustee candidates (Statement of Policy). The Board believes that each Trustee satisfied at the time he or she was initially elected or appointed a Trustee, and continues to satisfy, the standards contemplated by the Statement of Policy. The Governance and Nominating Committee also engages professional search firms to help identify potential Independent Trustee candidates who have the experience, qualifications, attributes, and skills consistent with the Statement of Policy. From time to time, additional criteria based on the composition and skills of the current Independent Trustees, as well as experience or skills that may be appropriate in light of future changes to board composition, business conditions, and regulatory or other developments, have also been considered by the professional search firms and the Governance and Nominating Committee. In addition, the Board takes into account the Trustees' commitment and participation in Board and committee meetings, as well as their leadership of standing and ad hoc committees throughout their tenure.
In determining that a particular Trustee was and continues to be qualified to serve as a Trustee, the Board has considered a variety of criteria, none of which, in isolation, was controlling. The Board believes that, collectively, the Trustees have balanced and diverse experience, qualifications, attributes, and skills, which allow the Board to operate effectively in governing the fund and protecting the interests of shareholders. Information about the specific experience, skills, attributes, and qualifications of each Trustee, which in each case led to the Board's conclusion that the Trustee should serve (or continue to serve) as a trustee of the fund, is provided below.
Annual Report
Trustees and Officers - continued
Board Structure and Oversight Function. Edward C. Johnson 3d is an interested person (as defined in the 1940 Act) and currently serves as Chairman. The Trustees have determined that an interested Chairman is appropriate and benefits shareholders because an interested Chairman has a personal and professional stake in the quality and continuity of services provided to the fund. Independent Trustees exercise their informed business judgment to appoint an individual of their choosing to serve as Chairman, regardless of whether the Trustee happens to be independent or a member of management. The Independent Trustees have determined that they can act independently and effectively without having an Independent Trustee serve as Chairman and that a key structural component for assuring that they are in a position to do so is for the Independent Trustees to constitute a substantial majority for the Board. The Independent Trustees also regularly meet in executive session. Ned C. Lautenbach serves as Chairman of the Independent Trustees and as such (i) acts as a liaison between the Independent Trustees and management with respect to matters important to the Independent Trustees and (ii) with management prepares agendas for Board meetings.
Fidelity funds are overseen by different Boards of Trustees. The fund's Board oversees Fidelity's equity and high income funds and another Board oversees Fidelity's investment-grade bond, money market, and asset allocation funds. The asset allocation funds may invest in Fidelity funds overseen by the fund's Board. The use of separate Boards, each with its own committee structure, allows the Trustees of each group of Fidelity funds to focus on the unique issues of the funds they oversee, including common research, investment, and operational issues. On occasion, the separate Boards establish joint committees to address issues of overlapping consequences for the Fidelity funds overseen by each Board.
The Trustees operate using a system of committees to facilitate the timely and efficient consideration of all matters of importance to the Trustees, the fund, and fund shareholders and to facilitate compliance with legal and regulatory requirements and oversight of the fund's activities and associated risks. The Board, acting through its committees, has charged FMR and its affiliates with (i) identifying events or circumstances the occurrence of which could have demonstrably adverse effects on the fund's business and/or reputation; (ii) implementing processes and controls to lessen the possibility that such events or circumstances occur or to mitigate the effects of such events or circumstances if they do occur; and (iii) creating and maintaining a system designed to evaluate continuously business and market conditions in order to facilitate the identification and implementation processes described in (i) and (ii) above. Because the day-to-day operations and activities of the fund are carried out by or through FMR, its affiliates and other service providers, the fund's exposure to risks is mitigated but not eliminated by the processes overseen by the Trustees. While each of the Board's committees has responsibility for overseeing different aspects of the fund's activities, oversight is exercised primarily through the Operations, Audit, and Compliance Committees. Appropriate personnel, including but not limited to the fund's Chief Compliance Officer (CCO), FMR's internal auditor, the independent accountants, the fund's Treasurer and portfolio management personnel, make periodic reports to the Board's committees, as appropriate. The responsibilities of each committee, including their oversight responsibilities, are described further under "Standing Committees of the Fund's Trustees."
Annual Report
The fund's Statement of Additional Information (SAI) includes more information about the Trustees. To request a free copy, call Fidelity at 1-877-208-0098.
Interested Trustees*:
Correspondence intended for each Trustee who is an interested person may be sent to Fidelity Investments, 82 Devonshire Street, Boston, Massachusetts 02109.
Name, Age; Principal Occupations and Other Relevant Experience+ |
Edward C. Johnson 3d (80) |
| Year of Election or Appointment: 1984 Mr. Johnson is Trustee and Chairman of the Board of Trustees of certain Trusts. Mr. Johnson serves as Chief Executive Officer, Chairman, and a Director of FMR LLC; Chairman and a Director of FMR; Chairman and a Director of Fidelity Research & Analysis Company (FRAC); Chairman and a Director of Fidelity Investments Money Management, Inc.; and Chairman and a Director of FMR Co., Inc. In addition, Mr. Johnson serves as Chairman and Director of FIL Limited. Previously, Mr. Johnson served as President of FMR LLC (2006-2007). |
James C. Curvey (75) |
| Year of Election or Appointment: 2007 Mr. Curvey also serves as Trustee (2007-present) of other investment companies advised by FMR. Mr. Curvey is a Director of Fidelity Investments Money Management, Inc. (2009-present), Director of Fidelity Research & Analysis Co. (2009-present) and Director of FMR and FMR Co., Inc. (2007-present). Mr. Curvey is also Vice Chairman (2007-present) and Director of FMR LLC. In addition, Mr. Curvey serves as an Overseer for the Boston Symphony Orchestra and a member of the Trustees of Villanova University. Previously, Mr. Curvey was the Vice Chairman (2006-2007) and Director (2000-2007) of FMR Corp. |
* Trustees have been determined to be "Interested Trustees" by virtue of, among other things, their affiliation with the trust or various entities under common control with FMR.
Annual Report
Trustees and Officers - continued
+ The information above includes each Trustee's principal occupation during the last five years and other information relating to the experience, attributes, and skills relevant to each Trustee's qualifications to serve as a Trustee, which led to the conclusion that each Trustee should serve as a Trustee for the fund.
Independent Trustees:
Correspondence intended for each Independent Trustee (that is, the Trustees other than the Interested Trustees) may be sent to Fidelity Investments, P.O. Box 55235, Boston, Massachusetts 02205-5235.
Name, Age; Principal Occupations and Other Relevant Experience+ |
Dennis J. Dirks (62) |
| Year of Election or Appointment: 2005 Prior to his retirement in May 2003, Mr. Dirks was Chief Operating Officer and a member of the Board of The Depository Trust & Clearing Corporation (DTCC). He also served as President, Chief Operating Officer, and Board member of The Depository Trust Company (DTC) and President and Board member of the National Securities Clearing Corporation (NSCC). In addition, Mr. Dirks served as Chief Executive Officer and Board member of the Government Securities Clearing Corporation, Chief Executive Officer and Board member of the Mortgage-Backed Securities Clearing Corporation, as a Trustee and a member of the Finance Committee of Manhattan College (2005-2008), and as a Trustee and a member of the Finance Committee of AHRC of Nassau County (2006-2008). Mr. Dirks is a member of the Independent Directors Council (IDC) Governing Council (2010-Present) and Board of Directors for The Brookville Center for Children's Services, Inc. (2009-present). |
Alan J. Lacy (57) |
| Year of Election or Appointment: 2008 Mr. Lacy serves as Senior Adviser (2007-present) of Oak Hill Capital Partners, L.P. (private equity). Mr. Lacy also served as Chief Executive Officer (2000-2005) and Vice Chairman (2005-2006) of Sears Holdings Corporation and Sears, Roebuck and Co. (retail). In addition, Mr. Lacy serves as a member of the Board of Directors of The Western Union Company (global money transfer, 2006-present) and Bristol-Myers Squibb Company (global pharmaceuticals, 2007-present). Mr. Lacy is Chairman (2008-present) and a member (2006-present) of the Board of Trustees of The National Parks Conservation Association. |
Ned C. Lautenbach (66) |
| Year of Election or Appointment: 2000 Mr. Lautenbach is Chairman of the Independent Trustees of the Equity and High Income Funds (2006-present). Mr. Lautenbach currently serves as the Lead Director of the Eaton Corporation Board of Directors (diversified industrial, 1997-present). Mr. Lautenbach is also a member of the Board of Directors of the Philharmonic Center for the Arts in Naples, Florida (1999-present); a member of the Board of Trustees of Fairfield University (2005-present); and a member of the Council on Foreign Relations (1994-present). Previously, Mr. Lautenbach was a Partner/Advisory Partner at Clayton, Dubilier & Rice, Inc. (private equity investment, 1998-2010), as well as a Director of Sony Corporation (2006-2007). |
Joseph Mauriello (66) |
| Year of Election or Appointment: 2008 Prior to his retirement in January 2006, Mr. Mauriello served in numerous senior management positions including Deputy Chairman and Chief Operating Officer (2004-2005), and Vice Chairman of Financial Services (2002-2004) of KPMG LLP US (professional services, 1965-2005). Mr. Mauriello currently serves as a member of the Board of Directors of XL Group plc. (global insurance and re-insurance, 2006-present) and of Arcadia Resources Inc. (health care services and products, 2007-present). Previously, Mr. Mauriello served as a Director of the Hamilton Funds of the Bank of New York (2006-2007). |
Cornelia M. Small (66) |
| Year of Election or Appointment: 2005 Ms. Small is a member of the Board of Directors of the Teagle Foundation (2009-present). Ms. Small is also a member of the Investment Committee, and Chair (2008-present) and a member of the Board of Trustees of Smith College. In addition, Ms. Small serves on the Investment Committee of the Berkshire Taconic Community Foundation (2008-present). Previously, Ms. Small served as Chairperson of the Investment Committee (2002-2008) of Smith College. In addition, Ms. Small served as Chief Investment Officer, Director of Global Equity Investments, and a member of the Board of Directors of Scudder, Stevens & Clark and Scudder Kemper Investments. |
William S. Stavropoulos (71) |
| Year of Election or Appointment: 2001 Mr. Stavropoulos is Vice Chairman of the Independent Trustees of the Equity and High Income Funds (2006-present). Mr. Stavropoulos serves as President and Founder of the Michigan Baseball Foundation, the Great Lakes Loons (2007-present). Mr. Stavropoulos is Chairman Emeritus of the Board of Directors of The Dow Chemical Company, where he previously served in numerous senior management positions, including President, CEO (1995-2000; 2002-2004), Chairman of the Executive Committee (2000-2006), and as a member of the Board of Directors (1990-2006). Currently, Mr. Stavropoulos is Chairman of Univar (global distributor of commodity and specialty chemicals, 2010-present), a Director of Teradata Corporation (data warehousing and technology solutions, 2008-present), Chemical Financial Corporation, Maersk Inc. (industrial conglomerate), Tyco International, Inc. (multinational manufacturing and services, 2007-present), and a member of the Advisory Board for Metalmark Capital (private equity investment, 2005-
present). Mr. Stavropoulos is a special advisor to Clayton, Dubilier & Rice, Inc. (private equity investment). In addition, Mr. Stavropoulos is a member of the University of Notre Dame Advisory Council for the College of Science. |
David M. Thomas (61) |
| Year of Election or Appointment: 2008 Previously, Mr. Thomas served as Executive Chairman (2005-2006) and Chairman and Chief Executive Officer (2000-2005) of IMS Health, Inc. (pharmaceutical and healthcare information solutions). In addition, Mr. Thomas serves as a member of the Board of Directors of Fortune Brands, Inc. (consumer products), and Interpublic Group of Companies, Inc. (marketing communication, 2004-present). |
Michael E. Wiley (60) |
| Year of Election or Appointment: 2008 Mr. Wiley also serves as a Director of Asia Pacific Exploration Consolidated (international oil and gas exploration and production, 2008-present). Mr. Wiley serves as a Director of Tesoro Corporation (independent oil refiner and marketer, 2005-present), and a Director of Bill Barrett Corporation (exploration and production, 2005-present). In addition, Mr. Wiley also serves as a Director of Post Oak Bank (privately-held bank, 2004-present). Previously, Mr. Wiley served as a member of the Board of Trustees of the University of Tulsa (2000-2006; 2007-2010), as a Senior Energy Advisor of Katzenbach Partners, LLC (consulting, 2006-2007), as an Advisory Director of Riverstone Holdings (private investment), Chairman, President, and CEO of Baker Hughes, Inc. (oilfield services, 2000-2004), and as Director of Spinnaker Exploration Company (exploration and production, 2001-2005). |
Annual Report
+ The information above includes each Trustee's principal occupation during the last five years and other information relating to the experience, attributes, and skills relevant to each Trustee's qualifications to serve as a Trustee, which led to the conclusion that each Trustee should serve as a Trustee for the fund.
Advisory Board Member and Executive Officers:
Correspondence intended for each executive officer and Peter S. Lynch may be sent to Fidelity Investments, 82 Devonshire Street, Boston, Massachusetts 02109.
Name, Age; Principal Occupation |
Peter S. Lynch (66) |
| Year of Election or Appointment: 2003 Member of the Advisory Board of Fidelity's Equity and High Income Funds. Mr. Lynch is Vice Chairman and a Director of FMR and FMR Co., Inc. In addition, Mr. Lynch serves as a Trustee of Boston College and as the Chairman of the Inner-City Scholarship Fund. Previously, Mr. Lynch served on the Special Olympics International Board of Directors (1997-2006). |
Kenneth B. Robins (41) |
| Year of Election or Appointment: 2008 President and Treasurer of Fidelity's Equity and High Income Funds. Mr. Robins also serves as President and Treasurer (2010-present) and Assistant Treasurer (2009-present) of other Fidelity funds and is an employee of Fidelity Investments (2004-present). Previously, Mr. Robins served as Deputy Treasurer of the Fidelity funds (2005-2008) and Treasurer and Chief Financial Officer of The North Carolina Capital Management Trust: Cash and Term Portfolios (2006-2008). |
Bruce T. Herring (45) |
| Year of Election or Appointment: 2006 Vice President of certain Equity Funds. Mr. Herring also serves as Chief Investment Officer and Director of Fidelity Management & Research (U.K.) Inc. (2010-present) and Group Chief Investments Officer of FMR. Previously, Mr. Herring served as Vice President (2005-2006) and Senior Vice President (2006-2007) of Fidelity Management & Research Company, Vice President of FMR Co., Inc. (2001-2007) and as a portfolio manager for Fidelity U.S. Equity Funds. |
Brian B. Hogan (46) |
| Year of Election or Appointment: 2009 Vice President of certain Equity Funds and Vice President of Sector Funds. Mr. Hogan also serves as President of FMR's Equity Division (2009-present). Previously, Mr. Hogan served as Senior Vice President, Equity Research of FMR (2006-2009) and as a portfolio manager. |
Scott C. Goebel (42) |
| Year of Election or Appointment: 2008 Secretary and Chief Legal Officer (CLO) of the Fidelity funds. Mr. Goebel also serves as Secretary and CLO of The North Carolina Capital Management Trust: Cash and Term Portfolio (2008-present); General Counsel, Secretary, and Senior Vice President of FMR (2008-present) and FMR Co., Inc. (2008-present); Deputy General Counsel of FMR LLC; Chief Legal Officer of Fidelity Management & Research (Hong Kong) Limited (2008-present) and Assistant Secretary of Fidelity Management & Research (Japan) Inc. (2008-present), Fidelity Investments Money Management, Inc. (2008-present), Fidelity Management & Research (U.K.) Inc. (2008-present), and Fidelity Research and Analysis Company (2008-present). Previously, Mr. Goebel served as Assistant Secretary of the Funds (2007-2008) and as Vice President and Secretary of Fidelity Distributors Corporation (FDC) (2005-2007). |
William C. Coffey (41) |
| Year of Election or Appointment: 2009 Assistant Secretary of Fidelity's Equity and High Income Funds. Mr. Coffey also serves as Senior Vice President and Deputy General Counsel of FMR LLC (2010-present), and is an employee of Fidelity Investments. Previously, Mr. Coffey served as Vice President and Associate General Counsel of FMR LLC (2005-2009). |
Holly C. Laurent (56) |
| Year of Election or Appointment: 2008 Anti-Money Laundering (AML) Officer of the Fidelity funds. Ms. Laurent also serves as AML Officer of The North Carolina Capital Management Trust: Cash and Term Portfolio (2008-present) and is an employee of Fidelity Investments. Previously, Ms. Laurent was Senior Vice President and Head of Legal for Fidelity Business Services India Pvt. Ltd. (2006-2008), and Senior Vice President, Deputy General Counsel and Group Head for FMR LLC (2005-2006). |
Christine Reynolds (52) |
| Year of Election or Appointment: 2008 Chief Financial Officer of the Fidelity funds. Ms. Reynolds became President of Fidelity Pricing and Cash Management Services (FPCMS) in August 2008. Ms. Reynolds served as Chief Operating Officer of FPCMS (2007-2008). Previously, Ms. Reynolds served as President, Treasurer, and Anti-Money Laundering officer of the Fidelity funds (2004-2007). |
Kenneth A. Rathgeber (63) |
| Year of Election or Appointment: 2004 Chief Compliance Officer of Fidelity's Equity and High Income Funds. Mr. Rathgeber is Chief Compliance Officer of Fidelity Management & Research (Hong Kong) Limited (2008-present), Fidelity Management & Research (Japan) Inc. (2008-present), FMR (2005-present), FMR Co., Inc. (2005-present), Fidelity Management & Research (U.K.) Inc. (2005-present), Fidelity Research & Analysis Company (2005-present), Fidelity Investments Money Management, Inc. (2005-present), Pyramis Global Advisors, LLC (2005-present), and Strategic Advisers, Inc. (2005-present). |
Jeffrey S. Christian (49) |
| Year of Election or Appointment: 2009 Deputy Treasurer of the Fidelity funds. Mr. Christian is an employee of Fidelity Investments. Previously, Mr. Christian served as Chief Financial Officer (2008-2009) of certain Fidelity funds and Senior Vice President of Fidelity Pricing and Cash Management Services (FPCMS) (2004-2009). |
Bryan A. Mehrmann (49) |
| Year of Election or Appointment: 2005 Deputy Treasurer of the Fidelity funds. Mr. Mehrmann is an employee of Fidelity Investments. |
Adrien E. Deberghes (43) |
| Year of Election or Appointment: 2008 Deputy Treasurer of Fidelity's Equity and High Income Funds. Mr. Deberghes also serves as Assistant Treasurer of other Fidelity funds (2010-present) and is an employee of Fidelity Investments (2008-present). Previously, Mr. Deberghes served as Senior Vice President of Mutual Fund Administration at State Street Corporation (2007-2008), Senior Director of Mutual Fund Administration at Investors Bank & Trust (2005-2007), and Director of Finance for Dunkin' Brands (2000-2005). |
Stephanie J. Dorsey (41) |
| Year of Election or Appointment: 2010 Assistant Treasurer of Fidelity's Equity and High Income Funds. Ms. Dorsey also serves as Deputy Treasurer of other Fidelity funds (2008-present) and is an employee of Fidelity Investments (2008-present). Previously, Ms. Dorsey served as Treasurer (2004-2008) of the JPMorgan Mutual Funds and Vice President (2004-2008) of JPMorgan Chase Bank. |
John R. Hebble (52) |
| Year of Election or Appointment: 2009 Assistant Treasurer of Fidelity's Equity and High Income Funds. Mr. Hebble also serves as Treasurer and Chief Financial Officer of The North Carolina Capital Management Trust: Cash and Term Portfolio (2008-present), President and Treasurer of other Fidelity funds (2008-present) and is an employee of Fidelity Investments. |
Gary W. Ryan (52) |
| Year of Election or Appointment: 2005 Assistant Treasurer of the Fidelity funds. Mr. Ryan is an employee of Fidelity Investments. Previously, Mr. Ryan served as Vice President of Fund Reporting in Fidelity Pricing and Cash Management Services (FPCMS) (1999-2005). |
Jonathan Davis (42) |
| Year of Election or Appointment: 2010 Assistant Treasurer of the Fidelity funds. Mr. Davis is an employee of Fidelity Investments. Previously, Mr. Davis served as Vice President and Associate General Counsel of FMR LLC (2003-2010). |
Annual Report
The Board of Trustees of Fidelity Total International Equity Fund voted to pay to shareholders of record at the opening of business on record date, the following distributions per share derived from capital gains realized from sales of portfolio securities, and dividends derived from net investment income:
| Pay Date | Record Date | Dividends | Capital Gains |
Class A | 12/06/10 | 12/03/10 | $0.066 | $0.023 |
Class T | 12/06/10 | 12/03/10 | $0.047 | $0.023 |
Class B | 12/06/10 | 12/03/10 | $0.015 | $0.023 |
Class C | 12/06/10 | 12/03/10 | $0.011 | $0.023 |
Class A designates 100%, Class T designates 0%, Class B designates 0%, and Class C designates 0% of the dividends distributed in December 2009, respectively during the fiscal year as amounts which may be taken into account as a dividend for purposes of the maximum rate under section 1(h)(11) of the Internal Revenue Code.
The amounts per share which represent income derived from sources within, and taxes paid to, foreign countries or possessions of the United States are as follows:
| Pay Date | Income | Taxes |
Class A | 12/07/2009 | $0.061 | $0.0119 |
Class T | 12/07/2009 | $0.00 | $0.00 |
Class B | 12/07/2009 | $0.00 | $0.00 |
Class C | 12/07/2009 | $0.00 | $0.00 |
The fund will notify shareholders in January 2011 of amounts for use in preparing 2010 income tax returns.
Annual Report
Board Approval of Investment Advisory Contracts and Management Fees
Fidelity Total International Equity Fund
Each year, the Board of Trustees, including the Independent Trustees (together, the Board), votes on the renewal of the management contract and sub-advisory agreements (together, the Advisory Contracts) for the fund. The Board, assisted by the advice of fund counsel and Independent Trustees' counsel, requests and considers a broad range of information relevant to the renewal of the Advisory Contracts throughout the year.
The Board meets regularly and considers at each of its meetings factors that are relevant to its annual consideration of the renewal of the fund's Advisory Contracts, including the services and support provided to the fund and its shareholders. The Board has established various standing committees, each composed of Independent Trustees with varying backgrounds, to which the Board has assigned specific subject matter responsibilities in order to enhance effective decision-making by the Board. The Board, acting directly and through its Committees, requests and receives information concerning the annual consideration of the renewal of the fund's Advisory Contracts. The Board also meets as needed to consider matters specifically related to the Board's annual consideration of the renewal of Advisory Contracts. Members of the Board may also meet with trustees of other Fidelity funds through ad hoc joint committees to discuss certain matters relevant to the Fidelity funds.
At its July 2010 meeting, the Board of Trustees, including the Independent Trustees, unanimously determined to renew the fund's Advisory Contracts. In reaching its determination, the Board considered all factors it believed relevant, including (i) the nature, extent, and quality of the services to be provided to the fund and its shareholders (including the investment performance of the fund); (ii) the competitiveness of the fund's management fee and total expenses; (iii) the total costs of the services to be provided by and the profits to be realized by Fidelity from its relationship with the fund; (iv) the extent to which economies of scale would be realized as the fund grows; and (v) whether fee levels reflect these economies of scale, if any, for the benefit of fund shareholders.
In considering whether to renew the Advisory Contracts for the fund, the Board reached a determination, with the assistance of fund counsel and Independent Trustees' counsel and through the exercise of its business judgment, that the renewal of the Advisory Contracts is in the best interests of fund shareholders and that the compensation to be received by Fidelity under the management contract is fair and reasonable. The Board's decision to renew the Advisory Contracts was not based on any single factor noted above, but rather was based on a comprehensive consideration of all the information provided to the Board at its meetings throughout the year. The Board, in reaching its determination to renew the Advisory Contracts, is aware that shareholders in the fund have a broad range of investment choices available to them, including a wide choice among mutual funds offered by Fidelity's competitors, and that the fund's shareholders, with the opportunity to review and weigh the disclosure provided by the fund in its prospectus and other public disclosures, have chosen to invest in this fund, managed by Fidelity.
Annual Report
Nature, Extent, and Quality of Services Provided. The Board considered the staffing within the investment adviser, FMR, and the sub-advisers (together, the Investment Advisers), including the backgrounds of the fund's investment personnel and the fund's investment objective and discipline. The Independent Trustees also had discussions with senior management of Fidelity's investment operations and investment groups. The Board considered the structure of the portfolio manager compensation program and whether this structure provides appropriate incentives to act in the best interest of the fund.
Resources Dedicated to Investment Management and Support Services. The Board and the equity research subcommittee of the Board's Fund Oversight Committee reviewed the size, education, and experience of the Investment Advisers' investment staff, their use of technology, and the Investment Advisers' approach to recruiting, training, and retaining portfolio managers and other research, advisory, and management personnel. The Board noted that Fidelity's analysts have access to a variety of technological tools and market and securities data that enable them to perform both fundamental and quantitative analysis and to specialize in various disciplines. The Board considered Fidelity's extensive global research capabilities that enable the Investment Advisers to aggregate data from various sources in an effort to produce positive investment results. The Board also considered that Fidelity's portfolio managers and analysts have access to daily portfolio attribution that allows for monitoring of a fund's portfolio, as well as an electronic communication system that provides immediate real-time access to research concerning issuers and credit enhancers. The Board noted FMR's continued focus on strengthening the organization and discipline of equity portfolio management and research.
Shareholder and Administrative Services. The Board considered (i) the nature, extent, quality, and cost of advisory, administrative, and shareholder services performed by the Investment Advisers and their affiliates under the Advisory Contracts and under separate agreements covering transfer agency, pricing and bookkeeping, and securities lending services for the fund; (ii) the nature and extent of the investment adviser's supervision of third party service providers, principally custodians and subcustodians; and (iii) the resources devoted to, and the record of compliance with, the fund's compliance policies and procedures. The Board also reviewed the allocation of fund brokerage, including allocations to brokers affiliated with the Investment Advisers, the use of brokerage commissions to pay fund expenses, and the use of "soft" commission dollars to pay for research services.
The Board noted that the growth of fund assets over time across the complex allows Fidelity to reinvest in the development of services designed to enhance the value or convenience of the Fidelity funds as investment vehicles. These services include 24-hour access to account information and market information through phone representatives and over the Internet, and investor education materials and asset allocation tools.
Annual Report
Board Approval of Investment Advisory Contracts and
Management Fees - continued
Investment in a Large Fund Family. The Board considered the benefits to shareholders of investing in a Fidelity fund, including the benefits of investing in a fund that is part of a large family of funds offering a variety of investment disciplines and providing a large variety of mutual fund investor services. The Board noted that Fidelity had taken, or had made recommendations that resulted in the Fidelity funds taking, a number of actions over the previous year that benefited particular funds, including (i) dedicating additional resources to investment research and restructuring and broadening the focus of the investment research teams; (ii) bolstering the senior management team that oversees asset management; (iii) launching Class F of certain funds as a lower-fee class available to Freedom K and Freedom Index Funds; (iv) lowering the initial investment minimums and ongoing balance requirements for Real Estate High Income Fund; (v) eliminating subsequent purchase minimums for all funds and adding a waiver of the investment minimum requirement for new accounts opened with the proceeds of a systematic withdrawal plan; (vi) eliminating the withdrawal minimum and maximum limits for systematic withdrawals from Advisor funds; (vii) expanding sales load waivers on Class A shares for Destiny Planholders and expanding Institutional Class eligibility for Class O Destiny Planholders; and (viii) changing certain Class A and Class T sales charge structures to further align them with industry practices.
Investment Performance. The Board considered whether the fund has operated in accordance with its investment objective, as well as its record of compliance with its investment restrictions. It also reviewed the fund's absolute investment performance for each class, as well as the fund's relative investment performance for each class measured against (i) a broad-based securities market index, and (ii) a peer group of mutual funds deemed appropriate by Fidelity and reviewed by the Board. Because the fund had been in existence less than three calendar years, the following chart considered by the Board shows, for the one-year period ended December 31, 2009, the total returns of the retail class and Class B of the fund, the total return of a broad-based securities market index ("benchmark"), and a range of total returns of a peer group of mutual funds identified by Morningstar, Inc. as having an investment style similar to that of the fund based on underlying portfolio holdings. The returns of the retail class and Class B show the performance of the highest and lowest performing classes, respectively. The box within the chart shows the 25th percentile return (bottom of box) and the 75th percentile return (top of box) of the peer group. Returns shown above the box are in the first quartile and returns shown below the box are in the fourth quartile. The percentage beaten numbers noted below the chart correspond to the percentile box and represent the percentage of funds in the peer group whose performance was equal to or lower than that of the class indicated.
Annual Report
Fidelity Total International Equity Fund

The Board reviewed the fund's relative investment performance against its peer group and noted that the performance of the retail class of the fund was in the first quartile for the period shown. The Board also noted that the investment performance of the fund was lower than its benchmark for the period shown. The Board considered that the variations in performance among the fund's classes reflect the variations in class expenses, which result in lower performance for higher expense classes. The Board also reviewed the fund's performance since inception as well as performance in the current year. The Board noted that it is difficult to evaluate in any comprehensive fashion the performance of the fund, in light of its relatively recent commencement of operations.
The Board also considered that the fund's management fee is subject to upward or downward adjustment depending upon whether, and to what extent, the fund's investment performance for the performance period exceeds, or is exceeded by, the record (over the same period) of a Board-approved performance adjustment index. The Board realizes that the performance adjustment provides FMR with a strong economic incentive to seek to achieve superior performance for the fund's shareholders and helps to more closely align the interests of FMR and the fund's shareholders.
Based on its review, and giving particular weight to the nature and quality of the resources dedicated by the Investment Advisers to maintain and improve relative performance and factoring in the unprecedented market events in recent years, the Board concluded that the nature, extent, and quality of investment management and support services and of shareholder and administrative services provided to the fund will benefit the fund's shareholders, particularly in light of the Board's view that the fund's shareholders benefit from investing in a fund that is part of a large family of funds offering a variety of investment disciplines and services.
Annual Report
Board Approval of Investment Advisory Contracts and
Management Fees - continued
Competitiveness of Management Fee and Total Fund Expenses. The Board considered the fund's management fee and total expenses compared to "mapped groups" of competitive funds and classes. Fidelity creates "mapped groups" by combining similar Lipper investment objective categories that have comparable management fee characteristics. Combining Lipper investment objective categories aids the Board's management fee and total expense comparisons by broadening the competitive group used for comparison and by reducing the number of universes to which various Fidelity funds are compared.
Management Fee. The Board considered two proprietary management fee comparisons for the 12-month (or shorter) periods shown in the chart below. The group of Lipper funds used by the Board for management fee comparisons is referred to below as the "Total Mapped Group." The Total Mapped Group comparison focuses on a fund's standing relative to the total universe of comparable funds available to investors, in terms of gross management fees before expense reimbursements or caps, and without giving effect to the fund's performance adjustment. "TMG %" represents the percentage of funds in the Total Mapped Group that had management fees that were lower than the fund's. For example, a TMG % of 15% means that 85% of the funds in the Total Mapped Group had higher management fees than the fund. The "Asset-Size Peer Group" (ASPG) comparison focuses on a fund's standing relative to non-Fidelity funds similar in size to the fund within the Total Mapped Group. The ASPG represents at least 15% of the funds in the Total Mapped Group with comparable asset size and management fee characteristics, subject to a minimum of 50 funds (or all funds in the Total Mapped Group if fewer than 50). Additional information, such as the ASPG quartile in which the fund's management fee ranked and the impact of the fund's performance adjustment, is also included in the chart and considered by the Board.
Annual Report
Fidelity Total International Equity Fund

The Board noted that the fund's management fee ranked below the median of its Total Mapped Group and below the median of its ASPG for 2009. The Board also noted the effect of the fund's negative performance adjustment on the fund's management fee ranking. The Board noted that the performance adjustment for each year represents calculations for performance periods that differ from the period shown in the performance chart above.
Based on its review, the Board concluded that the fund's management fee is fair and reasonable in light of the services that the fund receives and the other factors considered.
Total Expenses. In its review of each class's total expenses, the Board considered the fund's management fee as well as other fund or class expenses, as applicable, such as transfer agent fees, pricing and bookkeeping fees, fund-paid 12b-1 fees, and custodial, legal, and audit fees. The Board also noted the effects of any waivers and reimbursements on fees and expenses, as well as the impact of the fund's performance adjustment. As part of its review, the Board also considered current and historical total expenses of each class of the fund compared to competitive fund median expenses. Each class of the fund is compared to those funds and classes in the Total Mapped Group (used by the Board for management fee comparisons) that have a similar sales load structure.
The Board noted that the total expenses of each of Class A and the retail class ranked below its competitive median for 2009, the total expenses of Class B ranked equal to its competitive median for 2009, and the total expenses of each of Class T, Class C, and Institutional Class ranked above its competitive median for 2009. The Board considered that the total expenses for Class T were above the median primarily because its 12b-1 fee is higher than the typical front-end load class. The Board noted that the fund offers multiple classes, each of which has a different sales load and 12b-1 fee structure, and that the multiple structures are intended to offer a range of pricing options for the intermediary market. The Board also noted that the total expenses of the classes vary primarily by the level of their 12b-1 fees, although differences in transfer agent fees may also cause expenses to vary from class to class.
Annual Report
Board Approval of Investment Advisory Contracts and
Management Fees - continued
Fees Charged to Other Fidelity Clients. The Board also considered Fidelity fee structures and other information with respect to clients of FMR and its affiliates, such as other mutual funds advised or subadvised by FMR or its affiliates, pension plan clients, and other institutional clients. In March 2010, the Board created an ad hoc joint committee with the board of other Fidelity funds (the Committee) to review and compare Fidelity's institutional investment advisory business with its business of providing services to the Fidelity funds, including the differences in services provided, fees charged, and costs incurred, as well as competition in their respective marketplaces.
Based on its review of total expenses and fees charged to other Fidelity clients, the Board concluded that the total expenses of each class of the fund were reasonable, although in some cases above the median of the universe presented for comparison, in light of the services that the fund and its shareholders receive and the other factors considered, including the findings of the Committee.
Costs of the Services and Profitability. The Board considered the revenues earned and the expenses incurred by Fidelity in conducting the business of developing, marketing, distributing, managing, administering and servicing the fund and its shareholders. The Board also considered the level of Fidelity's profits in respect of all the Fidelity funds.
On an annual basis, FMR presents to the Board Fidelity's profitability for the fund. Fidelity calculates the profitability for each fund, as well as aggregate profitability for groups of Fidelity funds and all Fidelity funds, using a series of detailed revenue and cost allocation methodologies which originate with the audited books and records of Fidelity. The Audit Committee of the Board reviews any significant changes from the prior year's methodologies.
PricewaterhouseCoopers LLP (PwC), independent registered public accounting firm and auditor to Fidelity and certain Fidelity funds, has been engaged annually by the Board as part of the Board's assessment of Fidelity's profitability analysis. PwC's engagement includes the review and assessment of Fidelity's methodologies used in determining the revenues and expenses attributable to Fidelity's mutual fund business, and completion of agreed-upon procedures surrounding the mathematical accuracy of fund profitability and its conformity to allocation methodologies. After considering PwC's reports issued under the engagement and information provided by Fidelity, the Board believes that while other allocation methods may also be reasonable, Fidelity's profitability methodologies are reasonable in all material respects.
Annual Report
The Board has also reviewed Fidelity's non-fund businesses and fall-out benefits related to the mutual fund business as well as cases where Fidelity's affiliates may benefit from or be related to the fund's business.
The Board considered the costs of the services provided by and the profits realized by Fidelity in connection with the operation of the fund and were satisfied that the profitability was not excessive in the circumstances.
Economies of Scale. The Board considered whether there have been economies of scale in respect of the management of the Fidelity funds, whether the Fidelity funds (including the fund) have appropriately benefited from any such economies of scale, and whether there is potential for realization of any further economies of scale. The Board considered the extent to which the fund will benefit from economies of scale through increased services to the fund, through waivers or reimbursements, or through fee or expense reductions.
In February 2009, the Board and the board of other Fidelity funds created an ad hoc committee (the Economies of Scale Committee) to analyze whether FMR attains economies of scale in respect of the management and servicing of the Fidelity funds, whether the Fidelity funds have appropriately benefited from such economies of scale, and whether there is potential for realization of any further economies of scale.
The Board recognized that the fund's management contract incorporates a "group fee" structure, which provides for lower group fee rates as total fund assets under FMR's management increase, and for higher group fee rates as total fund assets under FMR's management decrease. FMR calculates the group fee rates based on a tiered asset "breakpoint" schedule that varies based on asset class. The Board considered that the group fee is designed to deliver the benefits of economies of scale to fund shareholders when total Fidelity fund assets increase, even if assets of any particular fund are unchanged or have declined, because some portion of Fidelity's costs are attributable to services provided to all Fidelity funds, and all funds benefit if those costs can be allocated among more assets. The Board concluded that, given the group fee structure, fund shareholders will benefit from lower management fees as assets under FMR's management increase at the fund complex level, regardless of whether Fidelity achieves any such economies of scale.
The Board concluded, considering the findings of the Economies of Scale Committee, that any potential economies of scale are being appropriately shared between fund shareholders and Fidelity.
Additional Information Requested by the Board. In order to develop fully the factual basis for consideration of the Fidelity funds' Advisory Contracts, the Board requested and received additional information on certain topics, including (i) fund performance trends, actions to be taken by FMR to improve certain funds' overall performance, and Fidelity's long-term strategies for certain funds; (ii) portfolio manager changes that have occurred during the past year and length of portfolio manager tenure for different categories of funds over time; (iii) Fidelity's compensation structure for portfolio managers, research analysts, and other key personnel, the rationale for the compensation structure, and how the compensation structure provides appropriate performance incentives; (iv) the amount of the investment that each portfolio manager has made in the Fidelity fund(s) that he or she manages; (v) management and other fees paid by FMR to affiliated sub-advisers on behalf of the Fidelity funds; (vi) Fidelity's fee structures and rationale for recommending different fees among different categories of funds; (vii) Fidelity's rationale for recommending which funds should have a performance adjustment component as part of their management fees; (viii) the rationale for any differences between fund fee structures and fee structures in place for other Fidelity clients; and (ix) explanations regarding the relative total expenses borne by certain funds and classes, total expense competitive trends, and actions that might be taken by FMR to reduce total expenses for certain funds and classes.
Annual Report
Board Approval of Investment Advisory Contracts and
Management Fees - continued
Based on its evaluation of all of the conclusions noted above, and after considering all factors it believed relevant, the Board ultimately concluded that the advisory fee structures are fair and reasonable, and that the fund's Advisory Contracts should be renewed.
Annual Report
Investment Adviser
Fidelity Management & Research Company
Boston, MA
Investment Sub-Advisers
FMR Co., Inc.
Fidelity Management & Research
(U.K.) Inc.
Fidelity Research & Analysis Company
FIL Investment Advisors
FIL Investments (Japan) Limited
FIL Investment Advisors
(U.K.) Limited
Fidelity Management & Research
(Hong Kong) Limited
Fidelity Management & Research
(Japan) Inc.
General Distributor
Fidelity Distributors Corporation
Boston, MA
Transfer and Service Agents
Fidelity Investments Institutional Operations Company, Inc.
Boston, MA
Fidelity Service Company, Inc.
Boston, MA
Custodian
State Street Bank & Trust Company
Quincy, MA
ATIE-UANN-1210
1.853363.102
(Fidelity Investment logo)(registered trademark)
Fidelity AdvisorSM
Total International Equity
Fund - Institutional Class
Annual Report
October 31, 2010
Institutional Class is
a class of Fidelity®
Total International Equity Fund
(2_fidelity_logos) (Registered_Trademark)
Contents
Chairman's Message | <Click Here> | The Chairman's message to shareholders. |
Performance | <Click Here> | How the fund has done over time. |
Management's Discussion of Fund Performance | <Click Here> | The Portfolio Managers' review of fund performance and strategy. |
Shareholder Expense Example | <Click Here> | An example of shareholder expenses. |
Investment Changes | <Click Here> | A summary of major shifts in the fund's investments over the past six months. |
Investments | <Click Here> | A complete list of the fund's investments with their market values. |
Financial Statements | <Click Here> | Statements of assets and liabilities, operations, and changes in net assets, as well as financial highlights. |
Notes | <Click Here> | Notes to financial statements. |
Report of Independent Registered Public Accounting Firm | <Click Here> | |
Trustees and Officers | <Click Here> | |
Distributions | <Click Here> | |
Board Approval of Investment Advisory Contracts and Management Fees | <Click Here> | |
To view a fund's proxy voting guidelines and proxy voting record for the 12-month period ended June 30, visit http://www.fidelity.com/proxyvotingresults or visit the Securities and Exchange Commission's (SEC) web site at http://www.sec.gov. You may also call 1-877-208-0098 to request a free copy of the proxy voting guidelines.
Standard & Poor's, S&P and S&P 500 are registered service marks of The McGraw-Hill Companies, Inc. and have been licensed for use by Fidelity Distributors Corporation.
Other third party marks appearing herein are the property of their respective owners.
All other marks appearing herein are registered or unregistered trademarks or service marks of FMR LLC or an affiliated company.
Annual Report
This report and the financial statements contained herein are submitted for the general information of the shareholders of the fund. This report is not authorized for distribution to prospective investors in the fund unless preceded or accompanied by an effective prospectus.
A fund files its complete schedule of portfolio holdings with the SEC for the first and third quarters of each fiscal year on Form N-Q. Forms N-Q are available on the SEC's web site at http://www.sec.gov. A fund's Forms N-Q may be reviewed and copied at the SEC's Public Reference Room in Washington, DC. Information regarding the operation of the SEC's Public Reference Room may be obtained by calling 1-800-SEC-0330. For a complete list of a fund's portfolio holdings, view the most recent holdings listing, semiannual report, or annual report on Fidelity's web site at http://www.fidelity.com or http://www.advisor.fidelity.com, as applicable.
NOT FDIC INSURED • MAY LOSE VALUE • NO BANK GUARANTEE
Neither the fund nor Fidelity Distributors Corporation is a bank.
Annual Report
(photo_of_Edward_C_Johnson_3d)
Dear Shareholder:
Equities have staged a rally in the second half of 2010, shaking off concerns about the European debt crisis and the possibility of a double-dip recession in the U.S. Although the short-term surge pushed major equity indexes back into positive territory for the year, several questions remain about the longer-term outlook, including lackluster economic growth and persistently high unemployment. Financial markets are always unpredictable, of course, but there also are several time-tested investment principles that can help put the odds in your favor.
One of the basic tenets is to invest for the long term. Over time, riding out the markets' inevitable ups and downs has proven much more effective than selling into panic or chasing the hottest trend. Even missing only a few of the markets' best days can significantly diminish investor returns. Patience also affords the benefits of compounding - of earning interest on additional income or reinvested dividends and capital gains. There can be tax advantages and cost benefits to consider as well. While staying the course doesn't eliminate risk, it can considerably lessen the effect of short-term declines.
You can further manage your investing risk through diversification. And today, more than ever, geographic diversification should be taken into account. Studies indicate that asset allocation is the single most important determinant of a portfolio's long-term success. The right mix of stocks, bonds and cash - aligned to your particular risk tolerance and investment objective - is very important. Age-appropriate rebalancing is also an essential aspect of asset allocation. For younger investors, an emphasis on equities - which historically have been the best-performing asset class over time - is encouraged. As investors near their specific goal, such as retirement or sending a child to college, consideration may be given to replacing volatile assets (e.g. common stocks) with more-stable fixed investments (bonds or savings plans).
A third principle - investing regularly - can help lower the average cost of your purchases. Investing a certain amount of money each month or quarter helps ensure you won't pay for all your shares at market highs. This strategy - known as dollar cost averaging - also reduces "emotion" from investing, helping shareholders avoid selling weak performers just prior to an upswing, or chasing a hot performer just before a correction.
We invite you to contact us via the Internet, through our Investor Centers or by phone. It is our privilege to provide you the information you need to make the investments that are right for you.
Sincerely,
(The chairman's signature appears here.)
Edward C. Johnson 3d
Annual Report
Average annual total return reflects the change in the value of an investment, assuming reinvestment of the class' distributions from dividend income and capital gains (the profits earned upon the sale of securities that have grown in value, if any) and assuming a constant rate of performance each year. The $10,000 table and the fund's returns do not reflect the deduction of taxes that a shareholder would pay on fund distributions or the redemption of fund shares. During periods of reimbursement by Fidelity, a fund's total return will be greater than it would be had the reimbursement not occurred. How a fund did yesterday is no guarantee of how it will do tomorrow.
Average Annual Total Returns
Periods ended October 31, 2010 | Past 1
year | Life of
fund A |
Institutional Class | 16.48% | -8.42% |
A From November 1, 2007.
$10,000 Over Life of Fund
Let's say hypothetically that $10,000 was invested in Fidelity AdvisorSM Total International Equity Fund - Institutional Class on November 1, 2007, when the fund started. The chart shows how the value of your investment would have changed, and also shows how the MSCI® ACWI® (All Country World Index) ex USA Index performed over the same period.
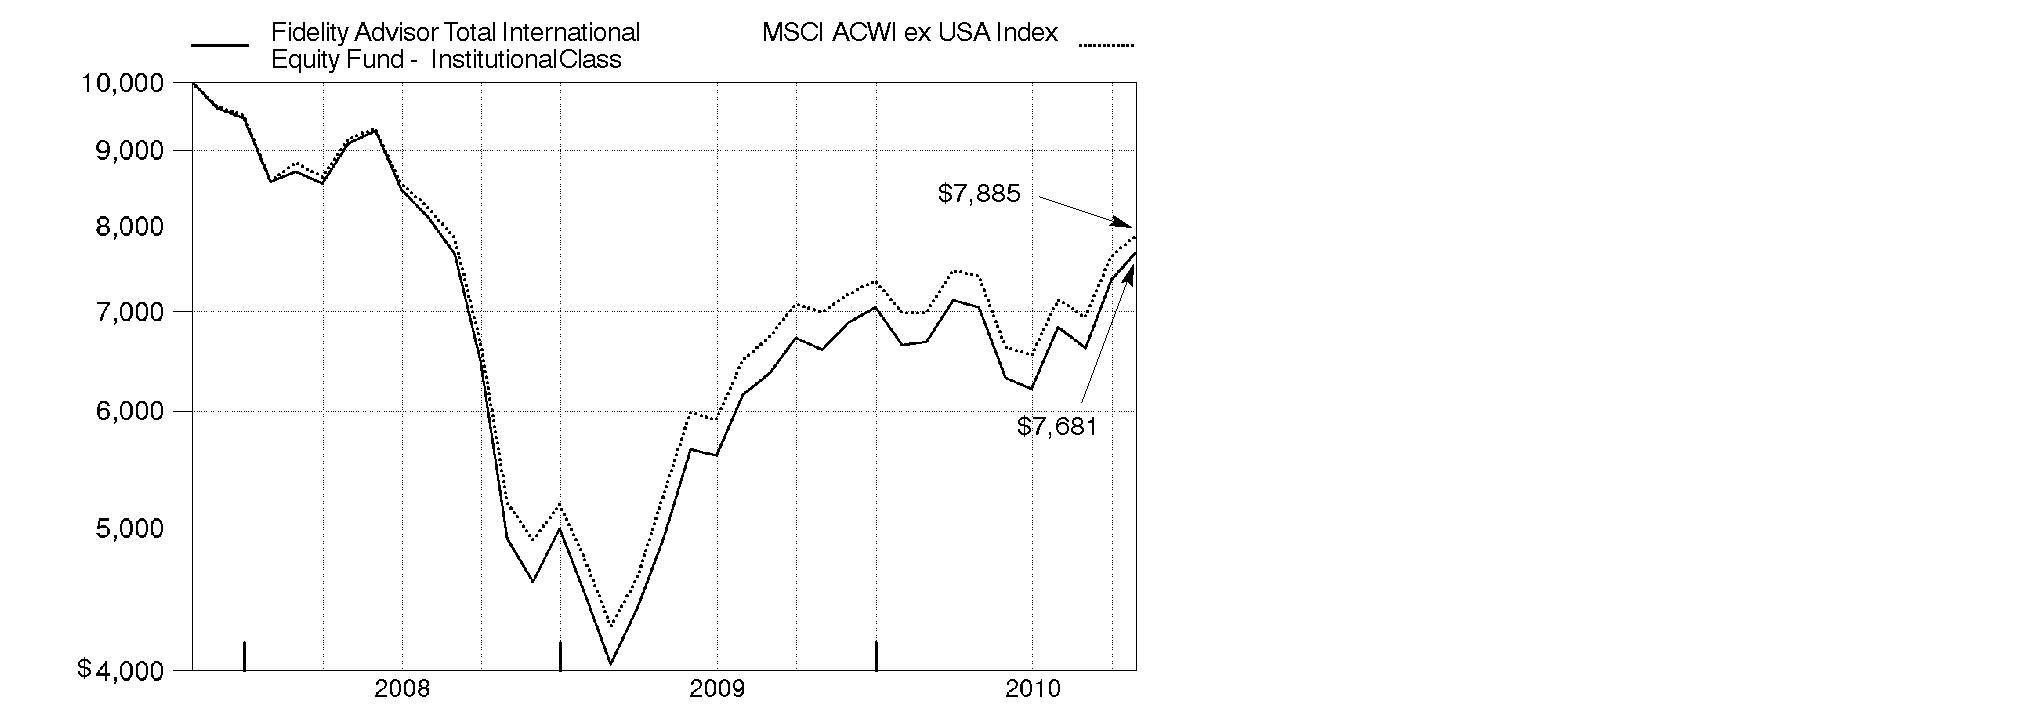
Annual Report
Market Recap: International stocks rode a wave of volatility similar to that of their U.S. counterparts during the 12 months ending October 31, 2010. Stocks gained modestly in the first half of the period, despite growing concerns about the European debt crisis. Sentiment turned decidedly negative in May and June, however, and the market suffered a precipitous decline. These losses were more than offset during the last four months of the period, when signs of economic growth and subsiding debt fears helped propel international stocks about 21%. For the full year, the MSCI® ACWI® (All Country World Index) ex USA Index gained 12.76%, boosted in part by a generally depreciating U.S. dollar. Within the index, Canada and emerging markets were standouts, returning 23% and 24%, respectively. Results in the latter group were led by strong-performing India, Mexico and South Africa, while China fell short of the MSCI benchmark due to cooling economic growth. The developed Asia ex Japan segment rose 16% for the period, lifted by solid results from Singapore and Hong Kong. Meanwhile, Europe rose just 9%, held back mainly by debt-riddled Spain and Italy, as well as lagging major constituent France. Japan returned only 5%, a result of that nation's continued weak economy.
Comments from Jed Weiss and George Stairs, Co-Portfolio Managers of Fidelity Advisor Total International Equity Fund: For the year, the fund's Institutional Class shares rose 16.48%, outpacing the MSCI ACWI ex USA index. Stock picking was most favorable in financials - especially among banks - and in the consumer discretionary group, with positive results also coming from information technology, consumer staples and energy. The only material detractor was telecommunication services. Geographically, the fund's allocation in emerging markets was the biggest positive. Specifically, stock picking was strong in Brazil, China and South Africa, while overweightings in Turkey and Indonesia also were helpful. Additionally, successful positioning in Japan contributed. In Europe, good security selection in the U.K., Belgium and Finland outweighed weakness in France and Switzerland, while elsewhere, the fund's stake in global U.S. companies proved beneficial. Top individual contributors included Danish health care company Novo Nordisk, U.S.-listed and Sweden-based auto-safety equipment manufacturer Autoliv, Turkish bank Turkiye Garanti Bankasi, U.K.-based mining company Rio Tinto and South African retailer Mr Price Group. Autoliv and Mr Price Group were not in the index. In contrast, the biggest detractors were French insurance company AXA, Swiss drug maker Roche Holding and Spanish telecommunications provider Telefonica.
The views expressed above reflect those of the portfolio manager(s) only through the end of the period as stated on the cover of this report and do not necessarily represent the views of Fidelity or any other person in the Fidelity organization. Any such views are subject to change at any time based upon market or other conditions and Fidelity disclaims any responsibility to update such views. These views may not be relied on as investment advice and, because investment decisions for a Fidelity fund are based on numerous factors, may not be relied on as an indication of trading intent on behalf of any Fidelity fund.
Annual Report
Shareholder Expense Example
As a shareholder of the Fund, you incur two types of costs: (1) transaction costs, including sales charges (loads) on purchase payments or redemption proceeds, redemption fees, and (2) ongoing costs, including management fees, distribution and/or service (12b-1) fees and other Fund expenses. This Example is intended to help you understand your ongoing costs (in dollars) of investing in the Fund and to compare these costs with the ongoing costs of investing in other mutual funds.
The Example is based on an investment of $1,000 invested at the beginning of the period and held for the entire period (May 1, 2010 to October 31, 2010).
Actual Expenses
The first line of the accompanying table for each class of the Fund provides information about actual account values and actual expenses. You may use the information in this line, together with the amount you invested, to estimate the expenses that you paid over the period. Simply divide your account value by $1,000.00 (for example, an $8,600 account value divided by $1,000.00 = 8.6), then multiply the result by the number in the first line for a class of the Fund under the heading entitled "Expenses Paid During Period" to estimate the expenses you paid on your account during this period. A small balance maintenance fee of $12.00 that is charged once a year may apply for certain accounts with a value of less than $2,000. This fee is not included in the table below. If it was, the estimate of expenses you paid during the period would be higher, and your ending account value lower, by this amount. In addition, the Fund, as a shareholder in the underlying Fidelity Central Funds, will indirectly bear its pro-rata share of the fees and expenses incurred by the underlying Fidelity Central Funds. These fees and expenses are not included in the Fund's annualized expense ratio used to calculate the expense estimate in the table below.
Hypothetical Example for Comparison Purposes
The second line of the accompanying table for each class of the Fund provides information about hypothetical account values and hypothetical expenses based on a Class' actual expense ratio and an assumed rate of return of 5% per year before expenses, which is not the Class' actual return. The hypothetical account values and expenses may not be used to estimate the actual ending account balance or expenses you paid for the period. You may use this information to compare the ongoing costs of investing in the Fund and other funds. To do so, compare this 5% hypothetical example with the 5% hypothetical examples that appear in the shareholder reports of the other funds. A small balance maintenance fee of $12.00 that is charged once a year may apply for certain accounts with a value of less than $2,000. This fee is not included in the table below. If it was, the estimate of expenses you paid during the period would be higher, and your ending account value lower, by this amount. In addition, the Fund, as a shareholder in the underlying Fidelity Central Funds, will indirectly bear its pro-rata share of the fees and expenses incurred by the underlying Fidelity Central Funds. These fees and expenses are not included in the Fund's annualized expense ratio used to calculate the expense estimate in the table below.
Annual Report
Shareholder Expense Example - continued
Please note that the expenses shown in the table are meant to highlight your ongoing costs only and do not reflect any transaction costs. Therefore, the second line of the table is useful in comparing ongoing costs only, and will not help you determine the relative total costs of owning different funds. In addition, if these transactional costs were included, your costs would have been higher.
| Annualized
Expense Ratio | Beginning
Account Value
May 1, 2010 | Ending
Account Value
October 31, 2010 | Expenses Paid
During Period*
May 1, 2010 to
October 31, 2010 |
Class A | 1.50%** | | | |
Actual | | $ 1,000.00 | $ 1,088.80 | $ 7.90** |
HypotheticalA | | $ 1,000.00 | $ 1,017.64 | $ 7.63** |
Class T | 1.75%** | | | |
Actual | | $ 1,000.00 | $ 1,086.50 | $ 9.20** |
HypotheticalA | | $ 1,000.00 | $ 1,016.38 | $ 8.89** |
Class B | 2.25%** | | | |
Actual | | $ 1,000.00 | $ 1,085.40 | $ 11.83** |
HypotheticalA | | $ 1,000.00 | $ 1,013.86 | $ 11.42** |
Class C | 2.25%** | | | |
Actual | | $ 1,000.00 | $ 1,085.50 | $ 11.83** |
HypotheticalA | | $ 1,000.00 | $ 1,013.86 | $ 11.42** |
Total International Equity | 1.25%** | | | |
Actual | | $ 1,000.00 | $ 1,090.20 | $ 6.59** |
HypotheticalA | | $ 1,000.00 | $ 1,018.90 | $ 6.36** |
Institutional Class | 1.25%** | | | |
Actual | | $ 1,000.00 | $ 1,090.50 | $ 6.59** |
HypotheticalA | | $ 1,000.00 | $ 1,018.90 | $ 6.36** |
A 5% return per year before expenses
* Expenses are equal to each Class' annualized expense ratio, multiplied by the average account value over the period, multiplied by 184/365 (to reflect the one-half year period).
Annual Report
** If changes to voluntary expense limitations, effective November 1, 2010, had been in effect during the entire period, the annualized expense ratios and the expenses paid in the actual and hypothetical examples above would have been as follows:
| Annualized
Expense Ratio | Expenses
Paid |
Class A | 1.45% | |
Actual | | $ 7.63 |
HypotheticalA | | $ 7.38 |
Class T | 1.70% | |
Actual | | $ 8.94 |
HypotheticalA | | $ 8.64 |
Class B | 2.20% | |
Actual | | $ 11.57 |
HypotheticalA | | $ 11.17 |
Class C | 2.20% | |
Actual | | $ 11.57 |
HypotheticalA | | $ 11.17 |
Total International Equity | 1.20% | |
Actual | | $ 6.32 |
HypotheticalA | | $ 6.11 |
Institutional Class | 1.20% | |
Actual | | $ 6.32 |
HypotheticalA | | $ 6.11 |
A 5% return per year before expenses
Annual Report
Investment Changes (Unaudited)
Geographic Diversification (% of fund's net assets) |
As of October 31, 2010 |
| United Kingdom 15.7% | |
| Japan 11.0% | |
| United States of America 7.2% | |
| Switzerland 6.4% | |
| France 5.4% | |
| Brazil 4.5% | |
| Germany 4.4% | |
| Spain 3.2% | |
| Australia 3.1% | |
| Other 39.1% | |

Percentages are adjusted for the effect of futures contracts, if applicable. |
As of April 30, 2010 |
| United Kingdom 15.8% | |
| Japan 12.4% | |
| Switzerland 7.1% | |
| United States of America 6.2% | |
| France 5.4% | |
| Brazil 4.5% | |
| Germany 4.2% | |
| Australia 3.0% | |
| Canada 3.0% | |
| Other 38.4% | |

Percentages are adjusted for the effect of futures contracts, if applicable. |
Asset Allocation |
| % of fund's
net assets | % of fund's net assets
6 months ago |
Stocks and Investment Companies | 97.8 | 98.0 |
Short-Term Investments and Net Other Assets | 2.2 | 2.0 |
Top Ten Stocks as of October 31, 2010 |
| % of fund's
net assets | % of fund's net assets
6 months ago |
Nestle SA (Switzerland, Food Products) | 1.7 | 1.5 |
BHP Billiton PLC ADR (United Kingdom, Metals & Mining) | 1.7 | 1.3 |
Roche Holding AG (participation certificate) (Switzerland, Pharmaceuticals) | 1.6 | 2.1 |
Royal Dutch Shell PLC Class A sponsored ADR (United Kingdom, Oil, Gas & Consumable Fuels) | 1.5 | 1.5 |
Rio Tinto PLC (United Kingdom, Metals & Mining) | 1.1 | 1.3 |
Anheuser-Busch InBev SA NV (Belgium, Beverages) | 1.1 | 1.0 |
HSBC Holdings PLC (United Kingdom, Commercial Banks) | 1.1 | 1.0 |
Novo Nordisk AS Series B (Denmark, Pharmaceuticals) | 0.9 | 0.8 |
Anglo American PLC (United Kingdom) (United Kingdom, Metals & Mining) | 0.8 | 0.8 |
Mitsui & Co. Ltd. (Japan, Trading Companies & Distributors) | 0.8 | 0.8 |
| 12.3 | |
Market Sectors as of October 31, 2010 |
| % of fund's
net assets | % of fund's net assets
6 months ago |
Financials | 25.6 | 25.3 |
Materials | 12.3 | 12.4 |
Consumer Discretionary | 11.6 | 11.7 |
Industrials | 10.0 | 9.2 |
Consumer Staples | 8.9 | 9.0 |
Energy | 8.8 | 8.5 |
Information Technology | 7.0 | 7.1 |
Health Care | 6.3 | 7.0 |
Telecommunication Services | 4.1 | 4.5 |
Utilities | 2.7 | 3.1 |
Annual Report
Investments October 31, 2010
Showing Percentage of Net Assets
Common Stocks - 96.9% |
| Shares | | Value |
Argentina - 0.1% |
Banco Macro SA sponsored ADR | 1,200 | | $ 59,820 |
Australia - 3.1% |
Commonwealth Bank of Australia | 1,288 | | 61,701 |
CSL Ltd. | 9,386 | | 301,872 |
Leighton Holdings Ltd. | 7,429 | | 267,096 |
Macquarie Group Ltd. | 7,610 | | 269,876 |
MAp Group unit | 26,561 | | 79,362 |
Newcrest Mining Ltd. | 633 | | 24,780 |
Newcrest Mining Ltd. sponsored ADR | 5,384 | | 212,130 |
OZ Minerals Ltd. | 108,330 | | 166,086 |
Wesfarmers Ltd. | 2,954 | | 95,903 |
Westfield Group unit | 18,847 | | 228,578 |
Woolworths Ltd. | 9,477 | | 263,205 |
Worleyparsons Ltd. | 6,016 | | 135,258 |
TOTAL AUSTRALIA | | 2,105,847 |
Austria - 0.3% |
Andritz AG | 1,840 | | 140,917 |
Erste Bank AG | 700 | | 31,587 |
TOTAL AUSTRIA | | 172,504 |
Bahamas (Nassau) - 0.0% |
Petrominerales Ltd. | 700 | | 17,934 |
Bailiwick of Guernsey - 0.3% |
Resolution Ltd. | 40,466 | | 169,797 |
Bailiwick of Jersey - 1.0% |
Heritage Oil PLC | 3,830 | | 21,139 |
Informa PLC | 31,795 | | 222,100 |
Randgold Resources Ltd. sponsored ADR | 2,080 | | 195,354 |
United Business Media Ltd. | 15,200 | | 160,241 |
West China Cement Ltd. (a) | 36,000 | | 13,933 |
WPP PLC | 7,668 | | 89,098 |
TOTAL BAILIWICK OF JERSEY | | 701,865 |
Belgium - 1.4% |
Anheuser-Busch InBev SA NV | 12,136 | | 760,490 |
Gimv NV | 350 | | 19,349 |
Umicore SA | 4,521 | | 212,753 |
TOTAL BELGIUM | | 992,592 |
Common Stocks - continued |
| Shares | | Value |
Bermuda - 1.4% |
Aquarius Platinum Ltd.: | | | |
(Australia) | 10,047 | | $ 57,776 |
(United Kingdom) | 3,600 | | 20,781 |
China Yurun Food Group Ltd. | 13,000 | | 50,566 |
CNPC (Hong Kong) Ltd. | 38,000 | | 48,338 |
Credicorp Ltd. (NY Shares) | 200 | | 25,176 |
Great Eagle Holdings Ltd. | 7,000 | | 20,951 |
Jinhui Shipping & Transportation Ltd. (a) | 1,197 | | 4,760 |
Lazard Ltd. Class A | 2,800 | | 103,320 |
Orient Overseas International Ltd. | 7,000 | | 61,364 |
Seadrill Ltd. (d) | 12,000 | | 363,320 |
Sinofert Holdings Ltd. (a) | 38,000 | | 20,100 |
Texwinca Holdings Ltd. | 16,000 | | 17,463 |
Trinity Ltd. | 78,000 | | 77,987 |
VimpelCom Ltd. ADR (a) | 4,300 | | 65,919 |
TOTAL BERMUDA | | 937,821 |
Brazil - 4.5% |
AES Tiete SA (PN) (non-vtg.) | 1,700 | | 23,433 |
Banco ABC Brasil SA | 14,100 | | 138,911 |
Banco Bradesco SA (PN) sponsored ADR | 10,500 | | 218,400 |
Banco do Brasil SA | 12,611 | | 245,370 |
Banco do Estado do Rio Grande do Sul SA | 1,200 | | 13,184 |
Banco Santander (Brasil) SA ADR | 6,800 | | 97,920 |
BM&F Bovespa SA | 19,700 | | 165,016 |
BR Malls Participacoes SA | 8,800 | | 84,058 |
Brascan Residential Properties SA | 2,000 | | 10,886 |
Braskem SA Class A sponsored ADR | 11,730 | | 244,571 |
Companhia de Bebidas das Americas (AmBev) (PN) sponsored ADR | 600 | | 83,544 |
Companhia Siderurgica Nacional SA (CSN) sponsored ADR | 5,700 | | 96,216 |
Confab Industrial SA (PN) (non-vtg.) | 2,000 | | 7,230 |
Cyrela Brazil Realty SA | 5,300 | | 73,213 |
Drogasil SA | 800 | | 20,235 |
Eletropaulo Metropolitana SA (PN-B) | 900 | | 15,712 |
Estacio Participacoes SA | 900 | | 13,443 |
Even Construtora e Incorporadora SA | 1,500 | | 8,535 |
Fibria Celulose SA sponsored ADR (a) | 3,157 | | 56,700 |
Fleury SA | 900 | | 11,639 |
Gafisa SA sponsored ADR | 3,930 | | 65,985 |
Iguatemi Empresa de Shopping Centers SA | 2,800 | | 65,342 |
Itau Unibanco Banco Multiplo SA ADR | 6,927 | | 170,127 |
Common Stocks - continued |
| Shares | | Value |
Brazil - continued |
Light SA | 1,700 | | $ 21,405 |
Localiza Rent A Car SA | 2,800 | | 46,332 |
Lojas Renner SA | 1,600 | | 63,202 |
Multiplan Empreendimentos Imobiliarios SA | 3,400 | | 77,945 |
Natura Cosmeticos SA | 1,800 | | 51,528 |
Odontoprev SA | 1,200 | | 17,635 |
OGX Petroleo e Gas Participacoes SA (a) | 9,500 | | 124,641 |
PDG Realty SA Empreendimentos e Participacoes | 4,900 | | 61,264 |
Petroleo Brasileiro SA - Petrobras: | | | |
(ON) sponsored ADR | 4,500 | | 153,540 |
(PN) sponsored ADR (non-vtg.) | 4,700 | | 146,593 |
TIM Participacoes SA sponsored ADR (non-vtg.) | 1,400 | | 45,164 |
Vale SA (PN-A) sponsored ADR | 8,000 | | 229,840 |
Vivo Participacoes SA sponsored ADR | 4,700 | | 134,608 |
Weg SA | 1,100 | | 14,206 |
TOTAL BRAZIL | | 3,117,573 |
Canada - 2.5% |
Agnico-Eagle Mines Ltd. (Canada) | 2,090 | | 162,093 |
Eldorado Gold Corp. | 3,900 | | 66,039 |
Fairfax Financial Holdings Ltd. (sub. vtg.) | 165 | | 67,493 |
First Quantum Minerals Ltd. | 800 | | 70,054 |
Goldcorp, Inc. | 1,400 | | 62,512 |
Niko Resources Ltd. | 2,660 | | 253,768 |
Open Text Corp. (a) | 3,900 | | 172,535 |
Pacific Rubiales Energy Corp. (a) | 400 | | 12,750 |
Pan American Silver Corp. | 3,500 | | 111,720 |
Petrobank Energy & Resources Ltd. (a) | 6,400 | | 254,707 |
Power Corp. of Canada (sub. vtg.) | 2,900 | | 80,924 |
Quadra FNX Mining Ltd. (a) | 600 | | 8,471 |
Sherritt International Corp. | 1,600 | | 12,440 |
Suncor Energy, Inc. | 3,500 | | 112,148 |
Toronto-Dominion Bank | 3,500 | | 252,059 |
Uranium One, Inc. (a) | 9,500 | | 38,842 |
TOTAL CANADA | | 1,738,555 |
Cayman Islands - 1.2% |
3SBio, Inc. sponsored ADR (a) | 1,200 | | 18,060 |
Alibaba.com Ltd. (a) | 32,500 | | 63,480 |
China High Speed Transmission Equipment Group Co. Ltd. | 26,000 | | 53,132 |
China Lilang Ltd. | 51,000 | | 79,745 |
China Shanshui Cement Group Ltd. | 49,000 | | 34,895 |
Common Stocks - continued |
| Shares | | Value |
Cayman Islands - continued |
Daphne International Holdings Ltd. | 36,000 | | $ 40,221 |
Eurasia Drilling Co. Ltd.: | | | |
GDR (e) | 400 | | 10,200 |
GDR (Reg. S) | 2,400 | | 61,200 |
Geely Automobile Holdings Ltd. | 65,000 | | 36,646 |
Hengdeli Holdings Ltd. | 206,000 | | 114,278 |
Hidili Industry International Development Ltd. | 33,000 | | 35,166 |
International Mining Machinery Holdings Ltd. | 26,000 | | 22,642 |
Kingboard Chemical Holdings Ltd. | 11,000 | | 53,501 |
Kingboard Chemical Holdings Ltd. warrants 10/31/12 (a) | 600 | | 344 |
Shenguan Holdings Group Ltd. | 10,000 | | 13,030 |
Trina Solar Ltd. ADR (a) | 800 | | 21,408 |
Vantage Drilling Co. (a) | 5,500 | | 9,460 |
Wynn Macau Ltd. | 64,000 | | 141,520 |
TOTAL CAYMAN ISLANDS | | 808,928 |
Chile - 0.2% |
Banco Santander Chile sponsored ADR | 1,400 | | 129,696 |
China - 2.1% |
Anhui Expressway Co. Ltd. (H Shares) | 16,000 | | 12,179 |
Baidu.com, Inc. sponsored ADR (a) | 1,800 | | 198,018 |
China Communications Services Corp. Ltd. (H Shares) | 36,000 | | 20,993 |
China Construction Bank Corp. (H Shares) | 155,000 | | 147,776 |
China Hongxing Sports Ltd. | 33,000 | | 4,462 |
China Merchants Bank Co. Ltd. (H Shares) | 84,383 | | 239,500 |
China Minsheng Banking Corp. Ltd. (H Shares) | 31,500 | | 29,300 |
China Suntien Green Energy Corp. Ltd. (H Shares) | 2,000 | | 673 |
Digital China Holdings Ltd. (H Shares) | 9,000 | | 16,255 |
Golden Eagle Retail Group Ltd. (H Shares) | 21,000 | | 55,810 |
Harbin Power Equipment Co. Ltd. (H Shares) | 28,000 | | 37,713 |
Industrial & Commercial Bank of China Ltd. (H Shares) | 411,000 | | 330,868 |
Minth Group Ltd. | 24,000 | | 44,896 |
Nine Dragons Paper (Holdings) Ltd. | 37,000 | | 59,668 |
Ping An Insurance Group Co. China Ltd. (H Shares) | 12,000 | | 129,192 |
Weichai Power Co. Ltd. (H Shares) | 2,000 | | 26,267 |
Yantai Changyu Pioneer Wine Co. (B Shares) | 4,890 | | 63,024 |
Zhaojin Mining Industry Co. Ltd. (H Shares) | 2,000 | | 6,218 |
TOTAL CHINA | | 1,422,812 |
Colombia - 0.1% |
Ecopetrol SA ADR | 1,400 | | 66,836 |
Common Stocks - continued |
| Shares | | Value |
Cyprus - 0.0% |
AFI Development PLC GDR (Reg. S) | 3,600 | | $ 4,248 |
Czech Republic - 0.1% |
Komercni Banka AS | 300 | | 68,070 |
Denmark - 1.3% |
Novo Nordisk AS: | | | |
Series B | 948 | | 99,523 |
Series B sponsored ADR | 4,800 | | 503,040 |
Vestas Wind Systems AS (a) | 4,295 | | 137,046 |
William Demant Holding AS (a) | 2,010 | | 150,663 |
TOTAL DENMARK | | 890,272 |
Egypt - 0.1% |
Commercial International Bank Ltd. sponsored GDR | 12,800 | | 97,920 |
Finland - 0.9% |
Metso Corp. | 3,600 | | 170,664 |
Nokian Tyres PLC | 6,502 | | 225,275 |
Outotec OYJ | 4,300 | | 200,678 |
TOTAL FINLAND | | 596,617 |
France - 5.4% |
Alstom SA | 3,947 | | 199,142 |
Atos Origin SA (a) | 1,272 | | 58,806 |
Audika SA | 1,000 | | 24,420 |
AXA SA sponsored ADR | 28,100 | | 512,263 |
BNP Paribas SA | 4,051 | | 296,212 |
Christian Dior SA | 700 | | 101,249 |
Compagnie de St. Gobain | 3,807 | | 177,776 |
Credit Agricole SA | 9,000 | | 147,459 |
Danone | 4,280 | | 270,822 |
Laurent-Perrier Group | 209 | | 23,553 |
PPR SA | 1,000 | | 163,913 |
Remy Cointreau SA | 1,952 | | 137,055 |
Safran SA | 7,114 | | 225,494 |
Saft Groupe SA | 629 | | 24,025 |
Sanofi-Aventis sponsored ADR | 6,400 | | 224,704 |
Schneider Electric SA | 957 | | 135,825 |
Societe Generale Series A | 6,910 | | 413,682 |
Total SA | 390 | | 21,224 |
Total SA sponsored ADR | 4,900 | | 266,952 |
Unibail-Rodamco | 1,121 | | 233,504 |
Common Stocks - continued |
| Shares | | Value |
France - continued |
Vetoquinol SA | 200 | | $ 8,477 |
Virbac SA | 100 | | 16,092 |
TOTAL FRANCE | | 3,682,649 |
Georgia - 0.0% |
Bank of Georgia unit (a) | 1,100 | | 18,139 |
Germany - 4.3% |
Allianz AG sponsored ADR | 7,300 | | 91,469 |
alstria office REIT-AG | 600 | | 8,357 |
BASF AG | 2,472 | | 179,826 |
Bayerische Motoren Werke AG (BMW) | 2,642 | | 189,362 |
Bilfinger Berger Se | 348 | | 25,339 |
Colonia Real Estate AG (a) | 2,981 | | 19,562 |
CTS Eventim AG | 431 | | 24,324 |
Daimler AG (United States) (a) | 4,700 | | 310,200 |
Deutsche Boerse AG | 1,650 | | 116,080 |
E.ON AG | 12,545 | | 392,754 |
Fielmann AG | 209 | | 21,098 |
HeidelbergCement AG | 3,700 | | 193,501 |
Linde AG | 2,496 | | 359,288 |
MAN SE | 1,266 | | 139,164 |
Metro AG | 1,600 | | 112,117 |
Munich Re Group | 1,402 | | 219,174 |
Siemens AG sponsored ADR | 4,200 | | 480,102 |
Software AG (Bearer) | 193 | | 27,043 |
Volkswagen AG | 566 | | 74,314 |
TOTAL GERMANY | | 2,983,074 |
Greece - 0.1% |
Hellenic Telecommunications Organization SA | 3,227 | | 25,770 |
Public Power Corp. of Greece | 3,202 | | 53,688 |
Terna Energy SA | 3,249 | | 13,969 |
TOTAL GREECE | | 93,427 |
Hong Kong - 2.8% |
China Mobile (Hong Kong) Ltd. | 18,000 | | 183,822 |
China Resources Power Holdings Co. Ltd. | 60,000 | | 115,491 |
Chow Sang Sang Holdings International Ltd. | 4,000 | | 10,527 |
CNOOC Ltd. | 142,000 | | 296,456 |
CNOOC Ltd. sponsored ADR | 260 | | 54,319 |
Hang Lung Group Ltd. | 8,000 | | 53,101 |
Hong Kong Exchanges and Clearing Ltd. | 14,500 | | 319,136 |
Common Stocks - continued |
| Shares | | Value |
Hong Kong - continued |
Hutchison Whampoa Ltd. | 5,000 | | $ 49,282 |
I.T Ltd. | 12,000 | | 10,125 |
Shanghai Industrial Holdings Ltd. | 14,000 | | 64,480 |
Swire Pacific Ltd. (A Shares) | 18,500 | | 262,538 |
Techtronic Industries Co. Ltd. | 112,500 | | 113,933 |
Wharf Holdings Ltd. | 56,000 | | 367,734 |
TOTAL HONG KONG | | 1,900,944 |
Hungary - 0.0% |
Egis Rt. | 125 | | 14,685 |
India - 1.8% |
Bank of Baroda | 8,655 | | 205,352 |
Bharat Heavy Electricals Ltd. | 1,225 | | 67,587 |
Housing Development Finance Corp. Ltd. | 6,972 | | 108,170 |
Idea Cellular Ltd. (a) | 13,905 | | 21,159 |
Indian Oil Corp. Ltd. | 1,798 | | 16,958 |
Indian Overseas Bank | 3,526 | | 12,712 |
Infosys Technologies Ltd. sponsored ADR | 1,900 | | 128,136 |
Infotech Enterprises Ltd. | 1,602 | | 5,913 |
Infrastructure Development Finance Co. Ltd. | 14,735 | | 66,503 |
Jain Irrigation Systems Ltd. | 9,935 | | 52,000 |
JSW Steel Ltd. | 2,520 | | 76,294 |
Jyothy Laboratories Ltd. | 2,850 | | 17,746 |
LIC Housing Finance Ltd. | 393 | | 11,886 |
Punjab National Bank | 150 | | 4,886 |
Radico Khaitan Ltd. | 1,989 | | 8,023 |
Reliance Industries Ltd. | 6,015 | | 148,764 |
Rural Electrification Corp. Ltd. | 7,306 | | 61,093 |
Shriram Transport Finance Co. Ltd. | 1,315 | | 26,149 |
Tata Consultancy Services Ltd. | 4,255 | | 101,074 |
Tata Steel Ltd. | 1,184 | | 15,744 |
Ultratech Cement Ltd. | 1,753 | | 43,500 |
Unitech Ltd. | 4,394 | | 8,605 |
TOTAL INDIA | | 1,208,254 |
Indonesia - 1.4% |
Indofood Sukses Makmur Tbk PT (a) | 17,500 | | 11,161 |
PT Astra International Tbk | 14,500 | | 92,475 |
PT Bank Mandiri (Persero) Tbk | 32,000 | | 25,063 |
PT Bank Negara Indonesia (Persero) Tbk | 132,000 | | 57,600 |
PT Bank Rakyat Indonesia Tbk | 187,000 | | 238,523 |
PT Bank Tabungan Negara Tbk | 79,000 | | 17,590 |
Common Stocks - continued |
| Shares | | Value |
Indonesia - continued |
PT Bumi Serpong Damai Tbk | 106,500 | | $ 10,010 |
PT Ciputra Development Tbk (a) | 245,500 | | 11,537 |
PT Delta Dunia Petroindo Tbk (a) | 154,000 | | 18,437 |
PT Gudang Garam Tbk | 12,000 | | 64,045 |
PT Indo Tambangraya Megah Tbk | 7,000 | | 35,401 |
PT Indocement Tunggal Prakarsa Tbk | 36,000 | | 73,712 |
PT Indofood Sukses Makmur Tbk | 123,500 | | 71,854 |
PT Kalbe Farma Tbk | 67,500 | | 20,203 |
PT Perusahaan Gas Negara Tbk Series B | 102,000 | | 46,221 |
PT Semen Gresik (Persero) Tbk | 67,500 | | 74,014 |
PT Tambang Batubbara Bukit Asam Tbk | 6,000 | | 13,192 |
PT Tower Bersama Infrastructure Tbk | 101,000 | | 28,817 |
PT XL Axiata Tbk (a) | 75,500 | | 48,573 |
TOTAL INDONESIA | | 958,428 |
Ireland - 0.5% |
CRH PLC sponsored ADR | 12,904 | | 228,014 |
James Hardie Industries NV sponsored ADR (a) | 4,465 | | 118,680 |
TOTAL IRELAND | | 346,694 |
Israel - 0.2% |
Azrieli Group | 582 | | 15,002 |
Ituran Location & Control Ltd. | 492 | | 7,651 |
Teva Pharmaceutical Industries Ltd. sponsored ADR | 2,500 | | 129,750 |
TOTAL ISRAEL | | 152,403 |
Italy - 1.7% |
Azimut Holdings SpA | 18,707 | | 190,799 |
ENI SpA | 3,000 | | 67,535 |
Fiat SpA | 14,000 | | 236,880 |
Interpump Group SpA (a) | 4,425 | | 28,862 |
Intesa Sanpaolo SpA | 99,944 | | 351,492 |
Saipem SpA | 2,714 | | 120,580 |
UniCredit SpA | 60,101 | | 156,634 |
TOTAL ITALY | | 1,152,782 |
Japan - 11.0% |
ABC-Mart, Inc. | 2,100 | | 71,427 |
Aisin Seiki Co. Ltd. | 4,400 | | 138,173 |
Aozora Bank Ltd. | 10,000 | | 16,776 |
Asahi Co. Ltd. | 500 | | 7,394 |
Autobacs Seven Co. Ltd. | 3,900 | | 146,123 |
Credit Saison Co. Ltd. | 2,700 | | 38,296 |
Common Stocks - continued |
| Shares | | Value |
Japan - continued |
Daikoku Denki Co. Ltd. | 1,200 | | $ 13,570 |
Daikokutenbussan Co. Ltd. | 800 | | 28,035 |
Denso Corp. | 13,800 | | 429,154 |
East Japan Railway Co. | 2,700 | | 166,735 |
Fanuc Ltd. | 2,300 | | 332,970 |
Fast Retailing Co. Ltd. | 900 | | 117,892 |
FCC Co. Ltd. | 1,000 | | 21,461 |
Fukuoka (REIT) Investment Fund | 2 | | 13,421 |
GCA Savvian Group Corp. (a) | 14 | | 13,275 |
Glory Ltd. | 400 | | 8,823 |
Goldcrest Co. Ltd. | 410 | | 8,850 |
Honda Motor Co. Ltd. | 4,500 | | 162,220 |
Japan Retail Fund Investment Corp. | 103 | | 160,893 |
Japan Steel Works Ltd. | 15,000 | | 143,116 |
Japan Tobacco, Inc. | 14 | | 43,494 |
JSR Corp. | 4,300 | | 74,436 |
Kamigumi Co. Ltd. | 2,000 | | 15,633 |
Keyence Corp. | 810 | | 200,814 |
Kobayashi Pharmaceutical Co. Ltd. | 4,200 | | 195,725 |
Konica Minolta Holdings, Inc. | 8,500 | | 82,135 |
Kyoto Kimono Yuzen Co. Ltd. | 900 | | 9,786 |
Meiko Network Japan Co. Ltd. | 900 | | 7,505 |
Miraca Holdings, Inc. | 1,900 | | 68,378 |
Miraial Co. Ltd. | 300 | | 7,356 |
Mitsubishi UFJ Financial Group, Inc. | 83,900 | | 389,380 |
Mitsui & Co. Ltd. | 35,100 | | 552,032 |
MS&AD Insurance Group Holdings, Inc. | 4,190 | | 100,379 |
Nabtesco Corp. | 1,600 | | 28,334 |
Nachi-Fujikoshi Corp. | 7,000 | | 20,964 |
Nagaileben Co. Ltd. | 300 | | 7,113 |
Nihon Parkerizing Co. Ltd. | 1,000 | | 13,135 |
Nippon Electric Glass Co. Ltd. | 16,000 | | 205,661 |
Nippon Seiki Co. Ltd. | 2,000 | | 20,256 |
Nippon Telegraph & Telephone Corp. | 1,400 | | 63,141 |
Nippon Thompson Co. Ltd. | 20,000 | | 138,685 |
Nitto Kohki Co. Ltd. | 300 | | 7,072 |
Obic Co. Ltd. | 700 | | 129,266 |
ORIX Corp. | 2,420 | | 220,738 |
Osaka Securities Exchange Co. Ltd. | 32 | | 161,054 |
OSG Corp. | 1,400 | | 14,632 |
Promise Co. Ltd. | 8,950 | | 37,482 |
Ricoh Co. Ltd. | 5,000 | | 69,943 |
Common Stocks - continued |
| Shares | | Value |
Japan - continued |
SAZABY, Inc. | 400 | | $ 7,456 |
Seven & i Holdings Co., Ltd. | 3,000 | | 69,639 |
Shiseido Co. Ltd. | 7,100 | | 148,231 |
SHO-BOND Holdings Co. Ltd. | 3,500 | | 74,897 |
Shoei Co. Ltd. | 600 | | 5,436 |
SOFTBANK CORP. | 2,400 | | 77,076 |
Sumitomo Corp. | 22,900 | | 289,933 |
Sumitomo Metal Industries Ltd. | 27,000 | | 62,667 |
Sumitomo Mitsui Financial Group, Inc. | 7,500 | | 223,858 |
The Nippon Synthetic Chemical Industry Co. Ltd. | 1,000 | | 5,866 |
THK Co. Ltd. | 700 | | 13,466 |
Toho Holdings Co. Ltd. | 1,200 | | 16,806 |
Tokio Marine Holdings, Inc. | 4,000 | | 112,463 |
Tokyo Electron Ltd. | 2,400 | | 135,416 |
Tokyo Gas Co. Ltd. | 66,000 | | 310,523 |
Toyota Motor Corp. | 10,800 | | 382,539 |
Tsumura & Co. | 600 | | 18,462 |
Tsutsumi Jewelry Co. Ltd. | 400 | | 9,420 |
USS Co. Ltd. | 4,100 | | 318,951 |
West Japan Railway Co. | 19 | | 70,537 |
Xebio Co. Ltd. | 400 | | 7,854 |
Yamada Denki Co. Ltd. | 1,400 | | 90,990 |
Yamatake Corp. | 600 | | 14,607 |
Yamato Kogyo Co. Ltd. | 6,900 | | 176,980 |
TOTAL JAPAN | | 7,567,206 |
Kazakhstan - 0.1% |
KazMunaiGas Exploration & Production JSC (Reg. S) GDR | 1,900 | | 32,680 |
Korea (South) - 2.7% |
Busan Bank | 1,850 | | 23,032 |
CJ Corp. | 645 | | 45,486 |
Daegu Bank Co. Ltd. | 1,700 | | 22,299 |
Daelim Industrial Co. | 450 | | 36,656 |
Doosan Co. Ltd. | 158 | | 21,287 |
GS Holdings Corp. | 640 | | 33,579 |
Hanjin Heavy Industries & Consolidated Co. Ltd. | 1,090 | | 41,584 |
Honam Petrochemical Corp. | 295 | | 65,060 |
Hyundai Department Store Co. Ltd. | 153 | | 16,940 |
Hyundai Heavy Industries Co. Ltd. | 267 | | 87,021 |
Hyundai Mobis | 495 | | 123,255 |
Hyundai Motor Co. | 1,177 | | 177,937 |
Industrial Bank of Korea | 5,500 | | 78,991 |
Common Stocks - continued |
| Shares | | Value |
Korea (South) - continued |
Kia Motors Corp. | 2,440 | | $ 97,426 |
KT Corp. | 1,220 | | 48,100 |
LG Chemical Ltd. | 150 | | 46,287 |
Lumens Co. Ltd. (a) | 1,889 | | 16,799 |
NCsoft Corp. | 296 | | 65,149 |
NHN Corp. (a) | 1,207 | | 214,136 |
Samsung Electronics Co. Ltd. | 519 | | 343,846 |
Shinhan Financial Group Co. Ltd. | 5,240 | | 202,936 |
Shinhan Financial Group Co. Ltd. sponsored ADR | 300 | | 23,331 |
Tong Yang Securities, Inc. | 2,260 | | 22,811 |
Young Poong Precision Corp. | 570 | | 6,666 |
TOTAL KOREA (SOUTH) | | 1,860,614 |
Lebanon - 0.0% |
BLOM Bank SAL GDR | 500 | | 4,600 |
Luxembourg - 0.5% |
ArcelorMittal SA: | | | |
(Netherlands) | 2,449 | | 79,226 |
Class A unit | 5,200 | | 168,376 |
Evraz Group SA GDR (a) | 1,900 | | 57,608 |
GlobeOp Financial Services SA | 2,300 | | 11,248 |
Millicom International Cellular SA | 500 | | 47,300 |
TOTAL LUXEMBOURG | | 363,758 |
Malaysia - 0.1% |
AirAsia Bhd (a) | 20,300 | | 16,117 |
Axiata Group Bhd (a) | 35,000 | | 50,514 |
RHB Capital BHD | 5,200 | | 13,422 |
Top Glove Corp. Bhd | 11,500 | | 20,331 |
TOTAL MALAYSIA | | 100,384 |
Mexico - 0.9% |
America Movil SAB de CV Series L sponsored ADR | 4,300 | | 246,218 |
Banco Compartamos SA de CV | 6,300 | | 44,629 |
Genomma Lab Internacional SA de CV (a) | 7,000 | | 15,207 |
Wal-Mart de Mexico SA de CV Series V | 106,200 | | 290,469 |
TOTAL MEXICO | | 596,523 |
Netherlands - 2.5% |
Aalberts Industries NV | 1,500 | | 27,394 |
ASM International NV unit (a) | 6,035 | | 154,194 |
ASML Holding NV | 6,500 | | 215,735 |
Common Stocks - continued |
| Shares | | Value |
Netherlands - continued |
Gemalto NV | 3,301 | | $ 150,289 |
Heijmans NV unit (a) | 710 | | 13,386 |
ING Groep NV: | | | |
(Certificaten Van Aandelen) unit (a) | 19,510 | | 208,679 |
sponsored ADR (a) | 25,300 | | 272,734 |
Koninklijke Ahold NV | 6,433 | | 88,885 |
Koninklijke KPN NV | 19,438 | | 324,564 |
QIAGEN NV (a) | 6,800 | | 127,908 |
Randstad Holdings NV (a) | 2,303 | | 109,594 |
TOTAL NETHERLANDS | | 1,693,362 |
Nigeria - 0.1% |
Guaranty Trust Bank PLC GDR (Reg. S) | 5,825 | | 42,290 |
Norway - 0.4% |
Aker Solutions ASA | 12,453 | | 189,580 |
Det Norske Oljeselskap ASA (DNO) (A Shares) (a) | 7,400 | | 11,619 |
DnB NOR ASA | 4,300 | | 59,004 |
Sevan Marine ASA (a) | 10,000 | | 13,474 |
TOTAL NORWAY | | 273,677 |
Papua New Guinea - 0.0% |
Oil Search Ltd. | 1,312 | | 8,200 |
Peru - 0.2% |
Compania de Minas Buenaventura SA sponsored ADR | 2,600 | | 137,904 |
Philippines - 0.0% |
Jollibee Food Corp. | 3,500 | | 7,220 |
Megaworld Corp. | 70,000 | | 4,177 |
TOTAL PHILIPPINES | | 11,397 |
Poland - 0.0% |
Bank Handlowy w Warszawie SA | 511 | | 16,134 |
Portugal - 0.5% |
Energias de Portugal SA | 52,028 | | 199,012 |
Jeronimo Martins SGPS SA | 10,525 | | 157,873 |
TOTAL PORTUGAL | | 356,885 |
Qatar - 0.0% |
Commercial Bank of Qatar GDR (Reg. S) | 6,707 | | 30,733 |
Russia - 1.6% |
Cherkizovo Group OJSC GDR (a) | 1,018 | | 20,740 |
LSR Group OJSC GDR (Reg. S) (a) | 1,800 | | 15,300 |
Magnit OJSC GDR (Reg. S) | 3,100 | | 82,894 |
Common Stocks - continued |
| Shares | | Value |
Russia - continued |
Mechel Steel Group OAO sponsored ADR | 5,300 | | $ 124,815 |
OAO Gazprom sponsored ADR | 3,800 | | 83,030 |
OAO NOVATEK GDR | 1,300 | | 124,345 |
OAO Raspadskaya (a) | 2,100 | | 12,228 |
OAO Tatneft sponsored ADR | 2,400 | | 75,720 |
OJSC MMC Norilsk Nickel sponsored ADR | 4,484 | | 83,627 |
OJSC Oil Company Rosneft GDR (Reg. S) | 16,800 | | 117,096 |
Polymetal JSC GDR (Reg. S) (a) | 3,900 | | 61,620 |
Protek (a) | 705 | | 1,280 |
RusHydro JSC sponsored ADR (a) | 10,400 | | 53,820 |
Sberbank (Savings Bank of the Russian Federation) | 34,200 | | 112,391 |
Sberbank (Savings Bank of the Russian Federation) GDR | 150 | | 56,354 |
Severstal JSC (a) | 1,200 | | 16,377 |
Sistema JSFC sponsored GDR | 2,200 | | 56,760 |
TGK-1 OAO (a) | 17,098,600 | | 11,866 |
TOTAL RUSSIA | | 1,110,263 |
Singapore - 1.3% |
Allgreen Properties Ltd. | 21,000 | | 19,308 |
City Developments Ltd. | 8,000 | | 78,622 |
DBS Group Holdings Ltd. | 5,226 | | 56,124 |
Keppel Corp. Ltd. | 5,000 | | 38,554 |
Keppel Land Ltd. | 3,000 | | 10,268 |
Singapore Exchange Ltd. | 29,700 | | 201,932 |
Straits Asia Resources Ltd. | 23,000 | | 40,694 |
United Overseas Bank Ltd. | 18,943 | | 272,810 |
Wing Tai Holdings Ltd. | 57,000 | | 77,069 |
Yanlord Land Group Ltd. | 91,000 | | 120,930 |
TOTAL SINGAPORE | | 916,311 |
South Africa - 2.3% |
African Bank Investments Ltd. | 13,600 | | 69,776 |
African Rainbow Minerals Ltd. | 11,850 | | 302,312 |
AngloGold Ashanti Ltd. | 1,600 | | 75,040 |
AngloGold Ashanti Ltd. sponsored ADR | 900 | | 42,399 |
Aspen Pharmacare Holdings Ltd. | 3,700 | | 49,386 |
Clicks Group Ltd. | 33,784 | | 220,402 |
Foschini Ltd. | 4,920 | | 59,721 |
Impala Platinum Holdings Ltd. | 1,700 | | 48,051 |
Imperial Holdings Ltd. | 120 | | 1,957 |
JSE Ltd. | 10,100 | | 113,904 |
Mr Price Group Ltd. | 27,800 | | 252,639 |
Common Stocks - continued |
| Shares | | Value |
South Africa - continued |
Mvelaphanda Resources Ltd. (a) | 8,322 | | $ 54,410 |
Shoprite Holdings Ltd. | 4,600 | | 65,023 |
Standard Bank Group Ltd. | 7,537 | | 111,144 |
Wilson Bayly Holmes-Ovcon Ltd. | 1,000 | | 19,326 |
Woolworths Holdings Ltd. | 16,241 | | 63,642 |
TOTAL SOUTH AFRICA | | 1,549,132 |
Spain - 3.2% |
Banco Bilbao Vizcaya Argentaria SA sponsored ADR | 30,294 | | 398,366 |
Banco Santander SA | 12,015 | | 154,180 |
Banco Santander SA sponsored ADR | 28,700 | | 367,647 |
Gestevision Telecinco SA | 2,300 | | 29,334 |
Grifols SA | 446 | | 7,221 |
Iberdrola SA | 41,442 | | 349,447 |
Inditex SA | 2,780 | | 232,133 |
Prosegur Compania de Seguridad SA (Reg.) | 2,951 | | 176,812 |
Red Electrica Corporacion SA | 1,300 | | 65,292 |
Telefonica SA sponsored ADR | 5,040 | | 408,946 |
TOTAL SPAIN | | 2,189,378 |
Sweden - 0.7% |
H&M Hennes & Mauritz AB (B Shares) | 8,382 | | 295,307 |
Intrum Justitia AB | 1,200 | | 16,523 |
Swedish Match Co. | 3,900 | | 108,975 |
Telefonaktiebolaget LM Ericsson (B Shares) | 6,834 | | 75,136 |
TOTAL SWEDEN | | 495,941 |
Switzerland - 6.4% |
Bank Sarasin & Co. Ltd. Series B (Reg.) | 1,098 | | 40,156 |
Credit Suisse Group sponsored ADR | 3,160 | | 131,140 |
Lonza Group AG | 313 | | 27,394 |
Nestle SA | 21,540 | | 1,179,467 |
Novartis AG sponsored ADR | 8,400 | | 486,780 |
Roche Holding AG (participation certificate) | 7,328 | | 1,075,731 |
Sonova Holding AG Class B | 2,658 | | 307,830 |
The Swatch Group AG: | | | |
(Bearer) | 680 | | 259,814 |
(Reg.) | 189 | | 13,133 |
Transocean Ltd. (a) | 2,920 | | 185,011 |
UBS AG (a) | 4,073 | | 69,169 |
Common Stocks - continued |
| Shares | | Value |
Switzerland - continued |
UBS AG (NY Shares) (a) | 6,900 | | $ 117,438 |
Zurich Financial Services AG | 1,946 | | 476,245 |
TOTAL SWITZERLAND | | 4,369,308 |
Taiwan - 1.4% |
Advanced Semiconductor Engineering, Inc. | 10,999 | | 9,576 |
Advanced Semiconductor Engineering, Inc. sponsored ADR | 9,899 | | 43,853 |
Alpha Networks, Inc. | 20,000 | | 17,775 |
Asia Cement Corp. | 49,440 | | 50,967 |
AU Optronics Corp. (a) | 45,000 | | 44,920 |
Chroma ATE, Inc. | 9,150 | | 23,559 |
Farglory Land Development Co. Ltd. | 8,000 | | 19,866 |
Formosa Plastics Corp. | 37,000 | | 106,146 |
Fubon Financial Holding Co. Ltd. | 59,846 | | 73,329 |
Hon Hai Precision Industry Co. Ltd. (Foxconn) | 18,858 | | 71,476 |
HTC Corp. | 6,300 | | 142,241 |
Huaku Development Co. Ltd. | 6,000 | | 16,644 |
Macronix International Co. Ltd. | 103,000 | | 63,439 |
Pegatron Corp. (a) | 21,000 | | 28,441 |
Ruentex Development Co. Ltd. | 6,000 | | 9,959 |
Taishin Financial Holdings Co. Ltd. | 153,180 | | 67,068 |
Taiwan Cement Corp. | 26,000 | | 27,695 |
Taiwan Semiconductor Manufacturing Co. Ltd. | 27,035 | | 55,649 |
Unimicron Technology Corp. | 7,000 | | 11,916 |
Wistron Corp. | 35,510 | | 72,981 |
TOTAL TAIWAN | | 957,500 |
Thailand - 0.5% |
Advanced Info Service PCL (For. Reg.) | 15,700 | | 47,194 |
Banpu PCL: | | | |
unit | 300 | | 7,756 |
(For. Reg.) | 2,000 | | 51,703 |
BEC World PCL (For. Reg.) | 20,800 | | 23,100 |
Siam Commercial Bank PCL (For. Reg.) | 53,300 | | 182,473 |
Total Access Communication PCL (For. Reg.) | 200 | | 281 |
TOTAL THAILAND | | 312,507 |
Turkey - 1.4% |
Albaraka Turk Katilim Bankasi AS | 10,000 | | 20,079 |
Anadolu Efes Biracilik ve Malt Sanayii AS | 8,000 | | 127,728 |
Asya Katilim Bankasi AS | 30,000 | | 77,390 |
Coca-Cola Icecek AS | 10,400 | | 133,417 |
Enka Insaat ve Sanayi AS | 5,666 | | 25,875 |
Common Stocks - continued |
| Shares | | Value |
Turkey - continued |
Sinpas Gayrimenkul Yatirim Ortakligi AS (a) | 11,000 | | $ 16,719 |
Tofas Turk Otomobil Fabrikasi AS | 8,511 | | 47,175 |
Turk Hava Yollari AO | 21,714 | | 90,078 |
Turkiye Garanti Bankasi AS | 61,700 | | 378,554 |
Turkiye Halk Bankasi AS | 7,000 | | 70,766 |
TOTAL TURKEY | | 987,781 |
United Arab Emirates - 0.1% |
DP World Ltd. | 62,496 | | 37,435 |
United Kingdom - 15.7% |
Aberdeen Asset Management PLC | 27,018 | | 76,964 |
Aegis Group PLC | 48,438 | | 97,549 |
AMEC PLC | 1,055 | | 18,356 |
Anglo American PLC (United Kingdom) | 12,031 | | 560,531 |
AstraZeneca PLC sponsored ADR | 1,900 | | 95,874 |
Aviva PLC | 17,072 | | 108,860 |
Babcock International Group PLC | 16,100 | | 149,609 |
BAE Systems PLC | 39,000 | | 215,382 |
Barclays PLC | 57,875 | | 254,296 |
Bellway PLC | 1,728 | | 14,784 |
BG Group PLC | 26,887 | | 523,601 |
BHP Billiton PLC ADR | 16,300 | | 1,154,040 |
BP PLC sponsored ADR | 13,100 | | 534,873 |
British Airways PLC (a) | 13,000 | | 56,381 |
Britvic PLC | 3,000 | | 23,186 |
Centrica PLC | 15,575 | | 82,895 |
Cobham PLC | 25,400 | | 94,249 |
Dechra Pharmaceuticals PLC | 1,300 | | 11,039 |
Derwent London PLC | 500 | | 12,176 |
GlaxoSmithKline PLC sponsored ADR | 8,500 | | 331,840 |
Great Portland Estates PLC | 3,972 | | 21,987 |
H&T Group PLC | 2,891 | | 16,165 |
Hikma Pharmaceuticals PLC | 3,478 | | 43,798 |
HSBC Holdings PLC: | | | |
(United Kingdom) | 25,682 | | 267,256 |
sponsored ADR | 9,251 | | 482,070 |
Imperial Tobacco Group PLC | 6,811 | | 218,136 |
InterContinental Hotel Group PLC ADR | 12,590 | | 243,617 |
International Power PLC | 9,989 | | 66,784 |
Johnson Matthey PLC | 6,192 | | 189,879 |
Man Group PLC | 9,279 | | 38,771 |
Meggitt PLC | 5,952 | | 31,478 |
Common Stocks - continued |
| Shares | | Value |
United Kingdom - continued |
Micro Focus International PLC | 2,500 | | $ 15,293 |
Misys PLC (a) | 11,200 | | 50,495 |
Mothercare PLC | 9,299 | | 78,291 |
Persimmon PLC | 1,737 | | 9,490 |
Prudential PLC | 16,571 | | 167,579 |
Reckitt Benckiser Group PLC | 4,738 | | 265,001 |
Rio Tinto PLC | 5,196 | | 337,440 |
Rio Tinto PLC sponsored ADR | 6,560 | | 427,187 |
Rotork PLC | 500 | | 13,418 |
Royal Dutch Shell PLC Class A sponsored ADR | 15,300 | | 993,429 |
Serco Group PLC | 27,871 | | 274,173 |
Shaftesbury PLC | 17,833 | | 127,427 |
Spectris PLC | 1,649 | | 29,828 |
Spirax-Sarco Engineering PLC | 1,404 | | 40,692 |
Standard Chartered PLC: | | | |
rights 11/5/10 (a) | 2,079 | | 17,504 |
(United Kingdom) | 16,639 | | 481,313 |
Ted Baker PLC | 2,175 | | 21,431 |
Tesco PLC | 54,583 | | 373,281 |
Ultra Electronics Holdings PLC | 800 | | 23,853 |
Unite Group PLC (a) | 25,402 | | 84,651 |
Vedanta Resources PLC | 4,000 | | 132,978 |
Victrex PLC | 4,318 | | 89,312 |
Vodafone Group PLC sponsored ADR | 19,400 | | 533,694 |
Wolseley PLC (a) | 3,963 | | 105,589 |
Xstrata PLC | 2,900 | | 56,196 |
TOTAL UNITED KINGDOM | | 10,785,971 |
United States of America - 4.5% |
Advanced Energy Industries, Inc. (a) | 1,581 | | 22,703 |
Allergan, Inc. | 1,400 | | 101,374 |
Autoliv, Inc. | 3,750 | | 267,375 |
Berkshire Hathaway, Inc. Class B (a) | 1,550 | | 123,318 |
CTC Media, Inc. | 1,600 | | 37,760 |
Cymer, Inc. (a) | 2,350 | | 86,833 |
Dril-Quip, Inc. (a) | 230 | | 15,893 |
eBay, Inc. (a) | 2,000 | | 59,620 |
Evercore Partners, Inc. Class A | 380 | | 11,537 |
Freeport-McMoRan Copper & Gold, Inc. | 600 | | 56,808 |
Google, Inc. Class A (a) | 200 | | 122,598 |
ION Geophysical Corp. (a) | 16,371 | | 80,054 |
JPMorgan Chase & Co. | 2,663 | | 100,209 |
Common Stocks - continued |
| Shares | | Value |
United States of America - continued |
Juniper Networks, Inc. (a) | 13,740 | | $ 445,039 |
Kansas City Southern (a) | 680 | | 29,798 |
Lam Research Corp. (a) | 197 | | 9,021 |
Martin Marietta Materials, Inc. | 880 | | 70,822 |
Mead Johnson Nutrition Co. Class A | 3,400 | | 199,988 |
Mohawk Industries, Inc. (a) | 2,670 | | 153,098 |
Oceaneering International, Inc. (a) | 140 | | 8,662 |
Philip Morris International, Inc. | 2,300 | | 134,550 |
PriceSmart, Inc. | 1,800 | | 52,794 |
ResMed, Inc. (a) | 5,360 | | 170,823 |
Solera Holdings, Inc. | 200 | | 9,610 |
Solutia, Inc. (a) | 484 | | 8,765 |
Union Pacific Corp. | 2,300 | | 201,664 |
Visa, Inc. Class A | 6,594 | | 515,453 |
TOTAL UNITED STATES OF AMERICA | | 3,096,169 |
TOTAL COMMON STOCKS (Cost $63,165,472) | 66,515,229 |
Nonconvertible Preferred Stocks - 0.4% |
| | | |
Germany - 0.1% |
Volkswagen AG | 200 | | 30,055 |
Italy - 0.3% |
Fiat SpA (Risparmio Shares) | 7,800 | | 91,656 |
Telecom Italia SpA (Risparmio Shares) | 104,200 | | 127,820 |
TOTAL ITALY | | 219,476 |
TOTAL NONCONVERTIBLE PREFERRED STOCKS (Cost $240,073) | 249,531 |
Investment Companies - 0.5% |
| | | |
United States of America - 0.5% |
iShares MSCI ACWI ex US Index ETF
(Cost $347,161) | 8,000 | | 342,000 |
Money Market Funds - 0.5% |
| | | |
Fidelity Securities Lending Cash Central Fund, 0.24% (b)(c)
(Cost $355,537) | 355,537 | | 355,537 |
Cash Equivalents - 1.6% |
| Maturity Amount | | Value |
Investments in repurchase agreements in a joint trading account at 0.22%, dated 10/29/10 due 11/1/10 (Collateralized by U.S. Treasury Obligations) #
(Cost $1,074,000) | $ 1,074,019 | | $ 1,074,000 |
TOTAL INVESTMENT PORTFOLIO - 99.9% (Cost $65,182,243) | | 68,536,297 |
NET OTHER ASSETS (LIABILITIES) - 0.1% | | 100,928 |
NET ASSETS - 100% | $ 68,637,225 |
Security Type Abbreviations |
ETF | - | Exchange-Traded Funds |
Legend |
(a) Non-income producing |
(b) Affiliated fund that is available only to investment companies and other accounts managed by Fidelity Investments. The rate quoted is the annualized seven-day yield of the fund at period end. A complete unaudited listing of the fund's holdings as of its most recent quarter end is available upon request. In addition, each Fidelity Central Fund's financial statements, which are not covered by the Fund's report of Independent Registered Public Accounting Firm, are available on the SEC's website or upon request. |
(c) Investment made with cash collateral received from securities on loan. |
(d) Security or a portion of the security is on loan at period end. |
(e) Security exempt from registration under Rule 144A of the Securities Act of 1933. These securities may be resold in transactions exempt from registration, normally to qualified institutional buyers. At the end of the period, the value of these securities amounted to $10,200 or 0.0% of net assets. |
# Additional information on each counterparty to the repurchase agreement is as follows: |
Repurchase Agreement / Counterparty | Value |
$1,074,000 due 11/01/10 at 0.22% |
BNP Paribas Securities Corp. | $ 178,969 |
Barclays Capital, Inc. | 268,288 |
Credit Agricole Securities (USA), Inc. | 46,262 |
Credit Suisse Securities (USA) LLC | 49,440 |
Deutsche Bank Securities, Inc. | 82,975 |
HSBC Securities (USA), Inc. | 82,975 |
J.P. Morgan Securities, Inc. | 221,267 |
Mizuho Securities USA, Inc. | 55,317 |
Societe Generale, New York Branch | 55,317 |
UBS Securities LLC | 27,658 |
Wells Fargo Securities LLC | 5,532 |
| $ 1,074,000 |
Affiliated Central Funds |
Information regarding fiscal year to date income earned by the Fund from investments in Fidelity Central Funds is as follows: |
Fund | Income earned |
Fidelity Securities Lending Cash Central Fund | $ 17,945 |
Other Information |
The following is a summary of the inputs used, as of October 31, 2010, involving the Fund's assets and liabilities carried at fair value. The inputs or methodology used for valuing securities may not be an indication of the risk associated with investing in those securities. For more information on valuation inputs, and their aggregation into the levels used in the tables below, please refer to the Security Valuation section in the accompanying Notes to Financial Statements. |
Valuation Inputs at Reporting Date: |
Description | Total | Level 1 | Level 2 | Level 3 |
Investments in Securities: | | | | |
Equities: | | | | |
United Kingdom | $ 10,785,971 | $ 9,650,540 | $ 1,135,431 | $ - |
Japan | 7,567,206 | 2,787,776 | 4,779,430 | - |
Switzerland | 4,369,308 | 4,300,139 | 69,169 | - |
France | 3,682,649 | 3,661,425 | 21,224 | - |
Brazil | 3,117,573 | 3,117,573 | - | - |
United States of America | 3,096,169 | 3,096,169 | - | - |
Germany | 3,013,129 | 3,013,129 | - | - |
Spain | 2,189,378 | 2,035,198 | 154,180 | - |
Australia | 2,105,847 | 2,105,847 | - | - |
Other | 26,837,530 | 25,140,942 | 1,696,588 | - |
Investment Companies | 342,000 | 342,000 | - | - |
Money Market Funds | 355,537 | 355,537 | - | - |
Cash Equivalents | 1,074,000 | - | 1,074,000 | - |
Total Investments in Securities: | $ 68,536,297 | $ 59,606,275 | $ 8,930,022 | $ - |
The following is a reconciliation of Investments in Securities for which Level 3 inputs were used in determining value: |
Investments in Securities: | |
Beginning Balance | $ 369 |
Total Realized Gain (Loss) | (25,822) |
Total Unrealized Gain (Loss) | 25,854 |
Cost of Purchases | - |
Proceeds of Sales | (401) |
Amortization/Accretion | - |
Transfers in to Level 3 | - |
Transfers out of Level 3 | - |
Ending Balance | $ - |
The change in unrealized gain (loss) for the period attributable to Level 3 securities held at October 31, 2010 | $ - |
The information used in the above reconciliation represents fiscal year to date activity for any Investments in Securities identified as using Level 3 inputs at either the beginning or the end of the current fiscal period. Transfers in or out of Level 3 represent the beginning value of any Security or Instrument where a change in the pricing level occurred from the beginning to the end of the period. The cost of purchases and the proceeds of sales may include securities received or delivered through corporate actions or exchanges. Realized and unrealized gains (losses) disclosed in the reconciliation are included in Net Gain (Loss) on the Fund's Statement of Operations. |
Income Tax Information |
At October 31, 2010, the Fund had a capital loss carryforward of approximately $24,325,764 of which $8,618,800 and $15,706,964 will expire on October 31, 2016 and 2017, respectively. Capital loss carryforwards are only available to offset future capital gains of the Fund to the extent provided by regulations and may be limited. |
See accompanying notes which are an integral part of the financial statements.
Annual Report
Statement of Assets and Liabilities
| October 31, 2010 |
| | |
Assets | | |
Investment in securities, at value (including securities loaned of $337,322 and repurchase agreements of $1,074,000) - See accompanying schedule: Unaffiliated issuers (cost $64,826,706) | $ 68,180,760 | |
Fidelity Central Funds (cost $355,537) | 355,537 | |
Total Investments (cost $65,182,243) | | $ 68,536,297 |
Cash | | 2,825 |
Foreign currency held at value (cost $238,396) | | 238,365 |
Receivable for investments sold | | 225,351 |
Receivable for fund shares sold | | 93,567 |
Dividends receivable | | 171,941 |
Distributions receivable from Fidelity Central Funds | | 52 |
Receivable from investment adviser for expense reductions | | 65,182 |
Other receivables | | 3,697 |
Total assets | | 69,337,277 |
| | |
Liabilities | | |
Payable for investments purchased | $ 107,723 | |
Payable for fund shares redeemed | 67,777 | |
Accrued management fee | 38,219 | |
Distribution and service plan fees payable | 2,988 | |
Other affiliated payables | 18,211 | |
Other payables and accrued expenses | 109,597 | |
Collateral on securities loaned, at value | 355,537 | |
Total liabilities | | 700,052 |
| | |
Net Assets | | $ 68,637,225 |
Net Assets consist of: | | |
Paid in capital | | $ 89,611,259 |
Undistributed net investment income | | 724,017 |
Accumulated undistributed net realized gain (loss) on investments and foreign currency transactions | | (25,059,753) |
Net unrealized appreciation (depreciation) on investments and assets and liabilities in foreign currencies | | 3,361,702 |
Net Assets | | $ 68,637,225 |
See accompanying notes which are an integral part of the financial statements.
Annual Report
Financial Statements - continued
Statement of Assets and Liabilities - continued
| October 31, 2010 |
| | |
Calculation of Maximum Offering Price
Class A:
Net Asset Value and redemption price per share ($5,029,222 ÷ 683,520 shares) | | $ 7.36 |
| | |
Maximum offering price per share (100/94.25 of $7.36) | | $ 7.81 |
Class T:
Net Asset Value and redemption price per share ($1,003,572 ÷ 135,346 shares) | | $ 7.41 |
| | |
Maximum offering price per share (100/96.50 of $7.41) | | $ 7.68 |
Class B:
Net Asset Value and offering price per share ($327,327 ÷ 44,417 shares)A | | $ 7.37 |
| | |
Class C:
Net Asset Value and offering price per share ($1,422,646 ÷ 193,344 shares)A | | $ 7.36 |
| | |
Total International Equity:
Net Asset Value, offering price and redemption price per share ($60,826,332 ÷ 8,257,843 shares) | | $ 7.37 |
| | |
Institutional Class:
Net Asset Value, offering price and redemption price per share ($28,126 ÷ 3,827 shares) | | $ 7.35 |
A Redemption price per share is equal to net asset value less any applicable contingent deferred sales charge.
See accompanying notes which are an integral part of the financial statements.
Annual Report
Statement of Operations
| Year ended October 31, 2010 |
| | |
Investment Income | | |
Dividends | | $ 1,628,770 |
Interest | | 1,411 |
Income from Fidelity Central Funds | | 17,945 |
Income before foreign taxes withheld | | 1,648,126 |
Less foreign taxes withheld | | (137,196) |
Total income | | 1,510,930 |
| | |
Expenses | | |
Management fee
Basic fee | $ 407,616 | |
Performance adjustment | (31,057) | |
Transfer agent fees | 168,397 | |
Distribution and service plan fees | 32,016 | |
Accounting and security lending fees | 29,939 | |
Custodian fees and expenses | 283,045 | |
Independent trustees' compensation | 315 | |
Registration fees | 81,296 | |
Audit | 89,169 | |
Legal | 347 | |
Miscellaneous | 625 | |
Total expenses before reductions | 1,061,708 | |
Expense reductions | (324,723) | 736,985 |
Net investment income (loss) | | 773,945 |
Realized and Unrealized Gain (Loss) Net realized gain (loss) on: | | |
Investment securities: | | |
Unaffiliated issuers | 1,923,248 | |
Foreign currency transactions | (17,111) | |
Total net realized gain (loss) | | 1,906,137 |
Change in net unrealized appreciation (depreciation) on: Investment securities | 5,446,085 | |
Assets and liabilities in foreign currencies | 1,641 | |
Total change in net unrealized appreciation (depreciation) | | 5,447,726 |
Net gain (loss) | | 7,353,863 |
Net increase (decrease) in net assets resulting from operations | | $ 8,127,808 |
See accompanying notes which are an integral part of the financial statements.
Annual Report
Financial Statements - continued
Statement of Changes in Net Assets
| Year ended
October 31,
2010 | Year ended
October 31,
2009 |
Increase (Decrease) in Net Assets | | |
Operations | | |
Net investment income (loss) | $ 773,945 | $ 445,721 |
Net realized gain (loss) | 1,906,137 | (15,995,813) |
Change in net unrealized appreciation (depreciation) | 5,447,726 | 25,959,338 |
Net increase (decrease) in net assets resulting
from operations | 8,127,808 | 10,409,246 |
Distributions to shareholders from net investment income | (411,223) | (859,670) |
Distributions to shareholders from net realized gain | (169,935) | - |
Total distributions | (581,158) | (859,670) |
Share transactions - net increase (decrease) | 18,410,630 | (6,640,043) |
Redemption fees | 6,300 | 1,869 |
Total increase (decrease) in net assets | 25,963,580 | 2,911,402 |
| | |
Net Assets | | |
Beginning of period | 42,673,645 | 39,762,243 |
End of period (including undistributed net investment income of $724,017 and undistributed net investment income of $385,749, respectively) | $ 68,637,225 | $ 42,673,645 |
See accompanying notes which are an integral part of the financial statements.
Annual Report
Financial Highlights - Class A
Years ended October 31, | 2010 | 2009 | 2008 F |
Selected Per-Share Data | | | |
Net asset value, beginning of period | $ 6.40 | $ 4.90 | $ 10.00 |
Income from Investment Operations | | | |
Net investment income (loss) C | .08 | .06 | .11 |
Net realized and unrealized gain (loss) | .95 | 1.55 | (5.21) |
Total from investment operations | 1.03 | 1.61 | (5.10) |
Distributions from net investment income | (.04) | (.11) | - |
Distributions from net realized gain | (.03) | - | - |
Total distributions | (.07) | (.11) | - |
Redemption fees added to paid in capital C, H | - | - | - |
Net asset value, end of period | $ 7.36 | $ 6.40 | $ 4.90 |
Total Return A, B | 16.17% | 33.87% | (51.00)% |
Ratios to Average Net Assets D, G | | | |
Expenses before reductions | 2.02% | 2.09% | 2.00% |
Expenses net of fee waivers, if any | 1.50% | 1.50% | 1.50% |
Expenses net of all reductions | 1.47% | 1.47% | 1.48% |
Net investment income (loss) | 1.15% | 1.13% | 1.35% |
Supplemental Data | | | |
Net assets, end of period (000 omitted) | $ 5,029 | $ 3,727 | $ 5,944 |
Portfolio turnover rate E | 67% | 98% | 91% |
A Total returns would have been lower had certain expenses not been reduced during the periods shown.
B Total returns do not include the effect of the sales charges.
C Calculated based on average shares outstanding during the period.
D Fees and expenses of the underlying Fidelity Central Funds are not included in the Fund's expense ratio. The Fund indirectly bears its proportionate share of the expenses of any underlying Fidelity Central Funds.
E Amount does not include the portfolio activity of any underlying Fidelity Central Funds.
F For the period November 1, 2007 (commencement of operations) to October 31, 2008.
G Expense ratios reflect operating expenses of the class. Expenses before reductions do not reflect amounts reimbursed by the investment adviser or reductions from brokerage service arrangements or reductions from other expense offset arrangements and do not represent the amount paid by the class during periods when reimbursements or reductions occur. Expense ratios before reductions for start-up periods may not be representative of longer-term operating periods. Expenses net of fee waivers reflect expenses after reimbursement by the investment adviser but prior to reductions from brokerage service arrangements or other expense offset arrangements. Expenses net of all reductions represent the net expenses paid by the class.
H Amount represents less than $.01 per share.
See accompanying notes which are an integral part of the financial statements.
Annual Report
Financial Highlights - Class T
Years ended October 31, | 2010 | 2009 | 2008 F |
Selected Per-Share Data | | | |
Net asset value, beginning of period | $ 6.40 | $ 4.88 | $ 10.00 |
Income from Investment Operations | | | |
Net investment income (loss) C | .06 | .04 | .09 |
Net realized and unrealized gain (loss) | .95 | 1.57 | (5.21) |
Total from investment operations | 1.01 | 1.61 | (5.12) |
Distributions from net investment income | - | (.09) | - |
Redemption fees added to paid in capital C, H | - | - | - |
Net asset value, end of period | $ 7.41 | $ 6.40 | $ 4.88 |
Total Return A, B | 15.78% | 33.74% | (51.20)% |
Ratios to Average Net Assets D, G | | | |
Expenses before reductions | 2.31% | 2.34% | 2.42% |
Expenses net of fee waivers, if any | 1.75% | 1.75% | 1.75% |
Expenses net of all reductions | 1.72% | 1.72% | 1.73% |
Net investment income (loss) | .90% | .88% | 1.10% |
Supplemental Data | | | |
Net assets, end of period (000 omitted) | $ 1,004 | $ 1,526 | $ 2,567 |
Portfolio turnover rate E | 67% | 98% | 91% |
A Total returns would have been lower had certain expenses not been reduced during the periods shown.
B Total returns do not include the effect of the sales charges.
C Calculated based on average shares outstanding during the period.
D Fees and expenses of the underlying Fidelity Central Funds are not included in the Fund's expense ratio. The Fund indirectly bears its proportionate share of the expenses of any underlying Fidelity Central Funds.
E Amount does not include the portfolio activity of any underlying Fidelity Central Funds.
F For the period November 1, 2007 (commencement of operations) to October 31, 2008.
G Expense ratios reflect operating expenses of the class. Expenses before reductions do not reflect amounts reimbursed by the investment adviser or reductions from brokerage service arrangements or reductions from other expense offset arrangements and do not represent the amount paid by the class during periods when reimbursements or reductions occur. Expense ratios before reductions for start-up periods may not be representative of longer-term operating periods. Expenses net of fee waivers reflect expenses after reimbursement by the investment adviser but prior to reductions from brokerage service arrangements or other expense offset arrangements. Expenses net of all reductions represent the net expenses paid by the class.
H Amount represents less than $.01 per share.
See accompanying notes which are an integral part of the financial statements.
Annual Report
Financial Highlights - Class B
Years ended October 31, | 2010 | 2009 | 2008 F |
Selected Per-Share Data | | | |
Net asset value, beginning of period | $ 6.39 | $ 4.86 | $ 10.00 |
Income from Investment Operations | | | |
Net investment income (loss) C | .03 | .02 | .05 |
Net realized and unrealized gain (loss) | .95 | 1.56 | (5.19) |
Total from investment operations | .98 | 1.58 | (5.14) |
Distributions from net investment income | - | (.05) | - |
Redemption fees added to paid in capital C, H | - | - | - |
Net asset value, end of period | $ 7.37 | $ 6.39 | $ 4.86 |
Total Return A, B | 15.34% | 32.95% | (51.40)% |
Ratios to Average Net Assets D, G | | | |
Expenses before reductions | 2.81% | 2.82% | 2.92% |
Expenses net of fee waivers, if any | 2.25% | 2.25% | 2.25% |
Expenses net of all reductions | 2.22% | 2.22% | 2.24% |
Net investment income (loss) | .40% | .38% | .60% |
Supplemental Data | | | |
Net assets, end of period (000 omitted) | $ 327 | $ 1,337 | $ 2,505 |
Portfolio turnover rate E | 67% | 98% | 91% |
A Total returns would have been lower had certain expenses not been reduced during the periods shown.
B Total returns do not include the effect of the contingent deferred sales charge.
C Calculated based on average shares outstanding during the period.
D Fees and expenses of the underlying Fidelity Central Funds are not included in the Fund's expense ratio. The Fund indirectly bears its proportionate share of the expenses of any underlying Fidelity Central Funds.
E Amount does not include the portfolio activity of any underlying Fidelity Central Funds.
F For the period November 1, 2007 (commencement of operations) to October 31, 2008.
G Expense ratios reflect operating expenses of the class. Expenses before reductions do not reflect amounts reimbursed by the investment adviser or reductions from brokerage service arrangements or reductions from other expense offset arrangements and do not represent the amount paid by the class during periods when reimbursements or reductions occur. Expense ratios before reductions for start-up periods may not be representative of longer-term operating periods. Expenses net of fee waivers reflect expenses after reimbursement by the investment adviser but prior to reductions from brokerage service arrangements or other expense offset arrangements. Expenses net of all reductions represent the net expenses paid by the class.
H Amount represents less than $.01 per share.
See accompanying notes which are an integral part of the financial statements.
Annual Report
Financial Highlights - Class C
Years ended October 31, | 2010 | 2009 | 2008 F |
Selected Per-Share Data | | | |
Net asset value, beginning of period | $ 6.39 | $ 4.86 | $ 10.00 |
Income from Investment Operations | | | |
Net investment income (loss) C | .03 | .02 | .05 |
Net realized and unrealized gain (loss) | .94 | 1.56 | (5.19) |
Total from investment operations | .97 | 1.58 | (5.14) |
Distributions from net investment income | - | (.05) | - |
Redemption fees added to paid in capital C, H | - | - | - |
Net asset value, end of period | $ 7.36 | $ 6.39 | $ 4.86 |
Total Return A, B | 15.18% | 33.10% | (51.40)% |
Ratios to Average Net Assets D, G | | | |
Expenses before reductions | 2.80% | 2.85% | 2.92% |
Expenses net of fee waivers, if any | 2.25% | 2.25% | 2.25% |
Expenses net of all reductions | 2.22% | 2.22% | 2.23% |
Net investment income (loss) | .40% | .38% | .60% |
Supplemental Data | | | |
Net assets, end of period (000 omitted) | $ 1,423 | $ 1,714 | $ 2,787 |
Portfolio turnover rate E | 67% | 98% | 91% |
A Total returns would have been lower had certain expenses not been reduced during the periods shown.
B Total returns do not include the effect of the contingent deferred sales charge.
C Calculated based on average shares outstanding during the period.
D Fees and expenses of the underlying Fidelity Central Funds are not included in the Fund's expense ratio. The Fund indirectly bears its proportionate share of the expenses of any underlying Fidelity Central Funds.
E Amount does not include the portfolio activity of any underlying Fidelity Central Funds.
F For the period November 1, 2007 (commencement of operations) to October 31, 2008.
G Expense ratios reflect operating expenses of the class. Expenses before reductions do not reflect amounts reimbursed by the investment adviser or reductions from brokerage service arrangements or reductions from other expense offset arrangements and do not represent the amount paid by the class during periods when reimbursements or reductions occur. Expense ratios before reductions for start-up periods may not be representative of longer-term operating periods. Expenses net of fee waivers reflect expenses after reimbursement by the investment adviser but prior to reductions from brokerage service arrangements or other expense offset arrangements. Expenses net of all reductions represent the net expenses paid by the class.
H Amount represents less than $.01 per share.
See accompanying notes which are an integral part of the financial statements.
Annual Report
Financial Highlights - Total International Equity
Years ended October 31, | 2010 | 2009 | 2008 E |
Selected Per-Share Data | | | |
Net asset value, beginning of period | $ 6.41 | $ 4.91 | $ 10.00 |
Income from Investment Operations | | | |
Net investment income (loss) B | .09 | .07 | .13 |
Net realized and unrealized gain (loss) | .96 | 1.55 | (5.21) |
Total from investment operations | 1.05 | 1.62 | (5.08) |
Distributions from net investment income | (.06) | (.12) | (.01) |
Distributions from net realized gain | (.03) | - | - |
Total distributions | (.09) | (.12) | (.01) |
Redemption fees added to paid in capital B, G | - | - | - |
Net asset value, end of period | $ 7.37 | $ 6.41 | $ 4.91 |
Total Return A | 16.45% | 34.23% | (50.87)% |
Ratios to Average Net Assets C, F | | | |
Expenses before reductions | 1.79% | 1.87% | 1.89% |
Expenses net of fee waivers, if any | 1.25% | 1.25% | 1.25% |
Expenses net of all reductions | 1.22% | 1.22% | 1.23% |
Net investment income (loss) | 1.40% | 1.38% | 1.60% |
Supplemental Data | | | |
Net assets, end of period (000 omitted) | $ 60,826 | $ 33,061 | $ 23,226 |
Portfolio turnover rate D | 67% | 98% | 91% |
A Total returns would have been lower had certain expenses not been reduced during the periods shown.
B Calculated based on average shares outstanding during the period.
C Fees and expenses of the underlying Fidelity Central Funds are not included in the Fund's expense ratio. The Fund indirectly bears its proportionate share of the expenses of any underlying Fidelity Central Funds.
D Amount does not include the portfolio activity of any underlying Fidelity Central Funds.
E For the period November 1, 2007 (commencement of operations) to October 31, 2008.
F Expense ratios reflect operating expenses of the class. Expenses before reductions do not reflect amounts reimbursed by the investment adviser or reductions from brokerage service arrangements or reductions from other expense offset arrangements and do not represent the amount paid by the class during periods when reimbursements or reductions occur. Expense ratios before reductions for start-up periods may not be representative of longer-term operating periods. Expenses net of fee waivers reflect expenses after reimbursement by the investment adviser but prior to reductions from brokerage service arrangements or other expense offset arrangements. Expenses net of all reductions represent the net expenses paid by the class.
G Amount represents less than $.01 per share.
See accompanying notes which are an integral part of the financial statements.
Annual Report
Financial Highlights - Institutional Class
Years ended October 31, | 2010 | 2009 | 2008 E |
Selected Per-Share Data | | | |
Net asset value, beginning of period | $ 6.41 | $ 4.91 | $ 10.00 |
Income from Investment Operations | | | |
Net investment income (loss) B | .10 | .07 | .13 |
Net realized and unrealized gain (loss) | .95 | 1.55 | (5.21) |
Total from investment operations | 1.05 | 1.62 | (5.08) |
Distributions from net investment income | (.08) | (.12) | (.01) |
Distributions from net realized gain | (.03) | - | - |
Total distributions | (.11) | (.12) | (.01) |
Redemption fees added to paid in capital B, G | - | - | - |
Net asset value, end of period | $ 7.35 | $ 6.41 | $ 4.91 |
Total Return A | 16.48% | 34.23% | (50.87)% |
Ratios to Average Net Assets C, F | | | |
Expenses before reductions | 1.82% | 1.80% | 1.91% |
Expenses net of fee waivers, if any | 1.25% | 1.25% | 1.25% |
Expenses net of all reductions | 1.23% | 1.22% | 1.23% |
Net investment income (loss) | 1.40% | 1.38% | 1.60% |
Supplemental Data | | | |
Net assets, end of period (000 omitted) | $ 28 | $ 1,308 | $ 2,733 |
Portfolio turnover rate D | 67% | 98% | 91% |
A Total returns would have been lower had certain expenses not been reduced during the periods shown.
B Calculated based on average shares outstanding during the period.
C Fees and expenses of the underlying Fidelity Central Funds are not included in the Fund's expense ratio. The Fund indirectly bears its proportionate share of the expenses of any underlying Fidelity Central Funds.
D Amount does not include the portfolio activity of any underlying Fidelity Central Funds.
E For the period November 1, 2007 (commencement of operations) to October 31, 2008.
F Expense ratios reflect operating expenses of the class. Expenses before reductions do not reflect amounts reimbursed by the investment adviser or reductions from brokerage service arrangements or reductions from other expense offset arrangements and do not represent the amount paid by the class during periods when reimbursements or reductions occur. Expense ratios before reductions for start-up periods may not be representative of longer-term operating periods. Expenses net of fee waivers reflect expenses after reimbursement by the investment adviser but prior to reductions from brokerage service arrangements or other expense offset arrangements. Expenses net of all reductions represent the net expenses paid by the class.
G Amount represents less than $.01 per share.
See accompanying notes which are an integral part of the financial statements.
Annual Report
Notes to Financial Statements
For the period ended October 31, 2010
1. Organization.
Fidelity Total International Equity Fund (the Fund) is a fund of Fidelity Investment Trust (the Trust) and is authorized to issue an unlimited number of shares. The Trust is registered under the Investment Company Act of 1940, as amended (the 1940 Act), as an open-end management investment company organized as a Massachusetts business trust. The Fund offers Class A, Class T, Class C, Total International Equity and Institutional Class shares, each of which has equal rights as to assets and voting privileges. Effective after the close of business on September 1, 2010, Class B shares were closed to new accounts and additional purchases by existing shareholders. Each class has exclusive voting rights with respect to matters that affect that class. Class B shares will automatically convert to Class A shares after a holding period of seven years from the initial date of purchase. Investment income, realized and unrealized capital gains and losses, the common expenses of the Fund, and certain fund-level expense reductions, if any, are allocated on a pro-rata basis to each class based on the relative net assets of each class to the total net assets of the Fund. Each class differs with respect to transfer agent and distribution and service plan fees incurred. Certain expense reductions also differ by class. The Fund's investments in emerging markets can be subject to social, economic, regulatory, and political uncertainties and can be extremely volatile.
2. Investments in Fidelity Central Funds.
The Fund may invest in Fidelity Central Funds, which are open-end investment companies available only to other investment companies and accounts managed by Fidelity Management & Research Company (FMR) and its affiliates. The Fund's Schedule of Investments lists each of the Fidelity Central Funds held as of period end, if any, as an investment of the Fund, but does not include the underlying holdings of each Fidelity Central Fund. As an Investing Fund, the Fund indirectly bears its proportionate share of the expenses of the underlying Fidelity Central Funds.
The Money Market Central Funds seek preservation of capital and current income and are managed by Fidelity Investments Money Management, Inc. (FIMM), an affiliate of FMR.
A complete unaudited list of holdings for each Fidelity Central Fund is available upon request or at the Securities and Exchange Commission (the SEC) web site at www.sec.gov. In addition, the financial statements of the Fidelity Central Funds, which are not covered by the Fund's Report of Independent Registered Public Accounting Firm, are available on the SEC web site or upon request.
Annual Report
3. Significant Accounting Policies.
The financial statements have been prepared in conformity with accounting principles generally accepted in the United States of America (GAAP), which require management to make certain estimates and assumptions at the date of the financial statements. Actual results could differ from those estimates. The following summarizes the significant accounting policies of the Fund:
Security Valuation. Investments are valued as of 4:00 p.m. Eastern time on the last calendar day of the period. The Fund uses independent pricing services approved by the Board of Trustees to value its investments. When current market prices or quotations are not readily available or reliable, valuations may be determined in good faith in accordance with procedures adopted by the Board of Trustees. Factors used in determining value may include market or security specific events. The frequency with which these procedures are used cannot be predicted and they may be utilized to a significant extent. The value used for net asset value (NAV) calculation under these procedures may differ from published prices for the same securities.
The Fund categorizes the inputs to valuation techniques used to value its investments into a disclosure hierarchy consisting of three levels as shown below.
Level 1 - quoted prices in active markets for identical investments
Level 2 - other significant observable inputs (including quoted prices for similar investments, interest rates, prepayment speeds, etc.)
Level 3 - unobservable inputs (including the fund's own assumptions based on the best information available)
Changes in valuation techniques may result in transfers in or out of an assigned level within the disclosure hierarchy. The aggregate value of investments by input level, as of October 31, 2010, as well as a roll forward of Level 3 securities, is included at the end of the Fund's Schedule of Investments. Valuation techniques used to value the Fund's investments by major category are as follows.
Equity securities, including restricted securities, for which market quotations are readily available, are valued at the last reported sale price or official closing price as reported by an independent pricing service on the primary market or exchange on which they are traded and are categorized as Level 1 in the hierarchy. In the event there were no sales during the day or closing prices are not available, securities are valued at the last quoted bid price or may be valued using the last available price and are generally categorized as Level 2 in the hierarchy. For foreign equity securities, when significant market or security specific events arise, comparisons to the valuation of American Depositary Receipts (ADRs), futures contracts, Exchange-traded funds (ETFs) and certain indexes as well as
Annual Report
Notes to Financial Statements - continued
3. Significant Accounting Policies - continued
Security Valuation - continued
quoted prices for similar securities are used and are categorized as Level 2 in the hierarchy in these circumstances. Utilizing these techniques may result in transfers between Level 1 and Level 2. For restricted equity securities and private placements where observable inputs are limited, assumptions about market activity and risk are used and are categorized as Level 3 in the hierarchy.
ETFs are valued at their last sale price or official closing price as reported by an independent pricing service on the primary market or exchange on which they are traded and are categorized as Level 1 in the hierarchy. In the event there were no sales during the day but the exchange reports a closing bid level, ETFs are valued at the closing bid and would be categorized as Level 1 in the hierarchy. In the event there was no closing bid, ETFs may be valued by another method that the Board of Trustees believes reflects fair value in accordance with the Board's fair value pricing policies and may be categorized as Level 2 in the hierarchy.
Investments in open-end mutual funds, including the Fidelity Central Funds, are valued at their closing net asset value each business day and are categorized as Level 1 in the hierarchy. Short-term securities with remaining maturities of sixty days or less for which quotations are not readily available are valued at amortized cost, which approximates fair value and are categorized as Level 2 in the hierarchy.
Foreign Currency. The Fund uses foreign currency contracts to facilitate transactions in foreign-denominated securities. Gains and losses from these transactions may arise from changes in the value of the foreign currency or if the counterparties do not perform under the contracts' terms.
Foreign-denominated assets, including investment securities, and liabilities are translated into U.S. dollars at the exchange rate at period end. Purchases and sales of investment securities, income and dividends received and expenses denominated in foreign currencies are translated into U.S. dollars at the exchange rate in effect on the transaction date.
The effects of exchange rate fluctuations on investments are included with the net realized and unrealized gain (loss) on investment securities. Other foreign currency transactions resulting in realized and unrealized gain (loss) are disclosed separately.
Annual Report
3. Significant Accounting Policies - continued
Investment Transactions and Income. For financial reporting purposes, the Fund's investment holdings and NAV include trades executed through the end of the last business day of the period. The NAV per share for processing shareholder transactions is calculated as of the close of business of the New York Stock Exchange (NYSE), normally 4:00 p.m. Eastern time and includes trades executed through the end of the prior business day. Gains and losses on securities sold are determined on the basis of identified cost. Dividend income is recorded on the ex-dividend date, except for certain dividends from foreign securities where the ex-dividend date may have passed, which are recorded as soon as the Fund is informed of the ex-dividend date. Non-cash dividends included in dividend income, if any, are recorded at the fair market value of the securities received. Distributions received on securities that represent a return of capital or capital gain are recorded as a reduction of cost of investments and/or as a realized gain. The Fund estimates the components of distributions received that may be considered return of capital distributions or capital gain distributions. Interest income and distributions from the Fidelity Central Funds are accrued as earned. Interest income includes coupon interest and amortization of premium and accretion of discount on debt securities. Investment income is recorded net of foreign taxes withheld where recovery of such taxes is uncertain.
Expenses. Most expenses of the Trust can be directly attributed to a fund. Expenses which cannot be directly attributed are apportioned amongst each fund in the Trust. Expense estimates are accrued in the period to which they relate and adjustments are made when actual amounts are known.
Income Tax Information and Distributions to Shareholders. Each year the Fund intends to qualify as a regulated investment company, including distributing substantially all of its taxable income and realized gains under Subchapter M of the Internal Revenue Code and filing its U.S. federal tax return. As a result, no provision for income taxes is required. As of October 31, 2010, the Fund did not have any unrecognized tax benefits in the accompanying financial statements. A fund's federal tax return is subject to examination by the Internal Revenue Service (IRS) for a period of three years. Foreign taxes are provided for based on the Fund's understanding of the tax rules and rates that exist in the foreign markets in which it invests.
Distributions are declared and recorded on the ex-dividend date. Income dividends and capital gain distributions are declared separately for each class. Income and capital gain distributions are determined in accordance with income tax regulations, which may differ from GAAP.
Capital accounts within the financial statements are adjusted for permanent book-tax differences. These adjustments have no impact on net assets or the results of operations. Temporary book-tax differences will reverse in a subsequent period.
Annual Report
Notes to Financial Statements - continued
3. Significant Accounting Policies - continued
Income Tax Information and Distributions to Shareholders - continued
Book-tax differences are primarily due to the short-term gain distributions from the Underlying Funds, foreign currency transactions, passive foreign investment companies (PFIC), partnerships, capital loss carryforwards and losses deferred due to wash sales.
The federal tax cost of investment securities and unrealized appreciation (depreciation) as of period end were as follows:
Gross unrealized appreciation | $ 8,591,290 |
Gross unrealized depreciation | (6,168,619) |
Net unrealized appreciation (depreciation) | $ 2,422,671 |
| |
Tax Cost | $ 66,113,626 |
The tax-based components of distributable earnings as of period end were as follows:
Undistributed ordinary income | $ 921,411 |
Capital loss carryforward | $ (24,325,764) |
Net unrealized appreciation (depreciation) | $ 2,430,319 |
The tax character of distributions paid was as follows:
| October 31, 2010 | October 31, 2009 |
Ordinary Income | $ 581,158 | $ 859,670 |
Short-Term Trading (Redemption) Fees. Shares held by investors in the Fund less than 30 days are subject to a redemption fee equal to 1.00% of the net asset value of shares redeemed. All redemption fees, which reduce the proceeds of the shareholder redemption, are retained by the Funds and accounted for as an addition to paid in capital.
4. Operating Policies.
Repurchase Agreements. FMR has received an Exemptive Order from the SEC which permits the Fund and other affiliated entities of FMR to transfer uninvested cash balances into joint trading accounts which are then invested in repurchase agreements. The Fund may also invest directly with institutions in repurchase agreements. Repurchase agreements are collateralized by government or non-government securities. Upon settlement date, collateral is held in segregated accounts with custodian banks and may be obtained in the event of a default of the counterparty. The Fund monitors, on a daily basis, the value of the collateral to ensure it is at least equal to the principal amount of the repurchase agreement (including accrued interest). In the event of a default by the
Annual Report
4. Operating Policies - continued
Repurchase Agreements - continued
counterparty, realization of the collateral proceeds could be delayed, during which time the value of the collateral may decline.
Restricted Securities. The Fund may invest in securities that are subject to legal or contractual restrictions on resale. These securities generally may be resold in transactions exempt from registration or to the public if the securities are registered. Disposal of these securities may involve time-consuming negotiations and expense, and prompt sale at an acceptable price may be difficult. Information regarding restricted securities is included at the end of the Fund's Schedule of Investments.
5. Purchases and Sales of Investments.
Purchases and sales of securities, other than short-term securities, aggregated $54,337,237 and $37,096,392, respectively.
6. Fees and Other Transactions with Affiliates.
Management Fee. FMR and its affiliates provide the Fund with investment management related services for which the Fund pays a monthly management fee. The management fee is the sum of an individual fund fee rate that is based on an annual rate of .45% of the Fund's average net assets and a group fee rate that averaged .26% during the period. The group fee rate is based upon the average net assets of all the mutual funds advised by FMR. The group fee rate decreases as assets under management increase and increases as assets under management decrease. In addition, the management fee is subject to a performance adjustment (up to a maximum of ± .20% of the Fund's average net assets over a 36 month performance period). The upward or downward adjustment to the management fee is based on the relative investment performance of Total International Equity as compared to an appropriate benchmark index. The Fund's performance adjustment took effect in November 2008. Subsequent months will be added until the performance period includes 36 months. For the period, the total annual management fee rate, including the performance adjustment, was .65% of the Fund's average net assets.
Distribution and Service Plan Fees. In accordance with Rule 12b-1 of the 1940 Act, the Fund has adopted separate Distribution and Service Plans for each class of shares. Certain classes pay Fidelity Distributors Corporation (FDC), an affiliate of FMR, separate Distribution and Service Fees, each of which is based on an annual percentage of each class' average net assets. In addition, FDC may pay financial intermediaries for
Annual Report
Notes to Financial Statements - continued
6. Fees and Other Transactions with Affiliates - continued
Distribution and Service Plan Fees - continued
selling shares of the Fund and providing shareholder support services. For the period, the Distribution and Service Fee rates, total fees and amounts retained by FDC were as follows:
| Distribution
Fee | Service
Fee | Total
Fees | Retained
by FDC |
Class A | -% | .25% | $ 10,450 | $ - |
Class T | .25% | .25% | 4,688 | 238 |
Class B | .75% | .25% | 3,367 | 2,686 |
Class C | .75% | .25% | 13,511 | 6,154 |
| | | $ 32,016 | $ 9,078 |
Sales Load. FDC receives a front-end sales charge of up to 5.75% for selling Class A shares, and 3.50% for selling Class T shares, some of which is paid to financial intermediaries for selling shares of the Fund. FDC receives the proceeds of contingent deferred sales charges levied on Class A, Class T, Class B, and Class C redemptions. These charges depend on the holding period. The deferred sales charges range from 5% to 1% for Class B, 1% for Class C, 1.00% for certain purchases of Class A shares (1.00% to .50% prior to July 12, 2010) and .25% for certain purchases of Class T shares.
For the period, sales charge amounts retained by FDC were as follows:
| Retained
by FDC |
Class A | $ 2,966 |
Class T | 2,078 |
Class B* | 920 |
Class C* | 13 |
| $ 5,977 |
* When Class B and Class C shares are initially sold, FDC pays commissions from its own resources to financial intermediaries through which the sales are made.
Transfer Agent Fees. Fidelity Investments Institutional Operations Company, Inc. (FIIOC), an affiliate of FMR, is the transfer, dividend disbursing and shareholder servicing agent for each class of the Fund. FIIOC receives account fees and asset-based fees that vary according to the account size and type of account of the shareholders of the respective classes of the Fund. FIIOC pays for typesetting, printing and mailing of
Annual Report
6. Fees and Other Transactions with Affiliates - continued
Transfer Agent Fees - continued
shareholder reports, except proxy statements. For the period, transfer agent fees for each class were as follows:
| Amount | % of
Average
Net Assets |
Class A | $ 11,393 | .27 |
Class T | 3,002 | .32 |
Class B | 954 | .28 |
Class C | 4,057 | .30 |
Total International Equity | 148,596 | .29 |
Institutional Class | 395 | .23 |
| $ 168,397 | |
Accounting and Security Lending Fees. Fidelity Service Company, Inc. (FSC), an affiliate of FMR, maintains the Fund's accounting records. The accounting fee is based on the level of average net assets for the month. Under a separate contract, FSC administers the security lending program. The security lending fee is based on the number and duration of lending transactions.
Brokerage Commissions. The Fund placed a portion of its portfolio transactions with brokerage firms which are affiliates of the investment adviser. The commissions paid to these affiliated firms were $437 for the period.
7. Committed Line of Credit.
The Fund participates with other funds managed by FMR or an affiliate in a $3.75 billion credit facility (the "line of credit") to be utilized for temporary or emergency purposes to fund shareholder redemptions or for other short-term liquidity purposes. The Fund has agreed to pay commitment fees on its pro-rata portion of the line of credit, which amounted to $219 and is reflected in Miscellaneous expenses on the Statement of Operations. During the period, there were no borrowings on this line of credit.
8. Security Lending.
The Fund lends portfolio securities through a lending agent from time to time in order to earn additional income. The lending agent may loan securities to certain qualified borrowers, including Fidelity Capital Markets (FCM), a broker-dealer affiliated with the Fund. On the settlement date of the loan, the Fund receives collateral (in the form of U.S. Treasury obligations, letters of credit and/or cash) against the loaned securities and maintains collateral in an amount not less than 100% of the market value of the loaned
Annual Report
Notes to Financial Statements - continued
8. Security Lending - continued
securities during the period of the loan. The market value of the loaned securities is determined at the close of business of the Fund and any additional required collateral is delivered to the Fund on the next business day. If the borrower defaults on its obligation to return the securities loaned because of insolvency or other reasons, a fund could experience delays and costs in recovering the securities loaned or in gaining access to the collateral. Any cash collateral received is invested in the Fidelity Securities Lending Cash Central Fund. The value of loaned securities and cash collateral at period end are disclosed on the Fund's Statement of Assets and Liabilities. Security lending income represents the income earned on investing cash collateral, less rebates paid to borrowers and lending agent fees associated with the loan, plus any premium payments received for lending certain types of securities. Security lending income is presented in the Statement of Operations as a component of income from Fidelity Central Funds. Total security lending income during the period amounted to $17,945. During the period, there were no securities loaned to FCM.
9. Expense Reductions.
FMR voluntarily agreed to reimburse each class to the extent annual operating expenses exceeded certain levels of average net assets as noted in the table below. Some expenses, for example interest expense, including commitment fees, are excluded from this reimbursement.
The following classes were in reimbursement during the period:
| Expense
Limitations | Reimbursement
from adviser |
| | |
Class A | 1.50% | $ 22,035 |
Class T | 1.75% | 5,266 |
Class B | 2.25% | 1,870 |
Class C | 2.25% | 7,481 |
Total International Equity | 1.25% | 272,664 |
Institutional Class | 1.25% | 962 |
| | $ 310,278 |
Effective November 1, 2010 the expense limitation will be changed to 1.45%, 1.70%, 2.20%, 2.20%, 1.20% and 1.20% for Class A, T, B, C, Total International Equity and Institutional, respectively.
Many of the brokers with whom FMR places trades on behalf of the Fund provided services to the Fund in addition to trade execution. These services included payments of certain expenses on behalf of the Fund totaling $14,445 for the period.
Annual Report
10. Distributions to Shareholders.
Distributions to shareholders of each class were as follows:
Years ended October 31, | 2010 | 2009 |
From net investment income | | |
Class A | $ 26,391 | $ 131,963 |
Class T | - | 45,379 |
Class B | - | 24,856 |
Class C | - | 30,949 |
Total International Equity | 382,451 | 560,888 |
Institutional Class | 2,381 | 65,635 |
Total | $ 411,223 | $ 859,670 |
From net realized gain | | |
Class A | $ 14,995 | $ - |
Total International Equity | 154,214 | - |
Institutional Class | 726 | - |
Total | $ 169,935 | $ - |
11. Share Transactions.
Transactions for each class of shares were as follows:
| Shares | Dollars |
Years ended October 31, | 2010 | 2009 | 2010 | 2009 |
Class A | | | | |
Shares sold | 443,125 | 372,557 | $ 2,924,922 | $ 1,887,197 |
Reinvestment of distributions | 5,568 | 30,531 | 37,804 | 130,977 |
Shares redeemed | (347,260) | (1,035,215) | (2,296,503) | (5,265,367) |
Net increase (decrease) | 101,433 | (632,127) | $ 666,223 | $ (3,247,193) |
Class T | | | | |
Shares sold | 121,719 | 59,609 | $ 807,663 | $ 314,219 |
Reinvestment of distributions | - | 10,553 | - | 45,379 |
Shares redeemed | (224,749) | (357,387) | (1,531,457) | (2,032,994) |
Net increase (decrease) | (103,030) | (287,225) | $ (723,794) | $ (1,673,396) |
Class B | | | | |
Shares sold | 30,066 | 19,155 | $ 198,826 | $ 103,145 |
Reinvestment of distributions | - | 5,760 | - | 24,827 |
Shares redeemed | (194,792) | (331,368) | (1,332,260) | (1,871,062) |
Net increase (decrease) | (164,726) | (306,453) | $ (1,133,434) | $ (1,743,090) |
Annual Report
Notes to Financial Statements - continued
11. Share Transactions - continued
| Shares | Dollars |
Years ended October 31, | 2010 | 2009 | 2010 | 2009 |
Class C | | | | |
Shares sold | 86,496 | 111,127 | $ 580,588 | $ 616,982 |
Reinvestment of distributions | - | 7,163 | - | 30,872 |
Shares redeemed | (161,545) | (423,400) | (1,102,805) | (2,395,281) |
Net increase (decrease) | (75,049) | (305,110) | $ (522,217) | $ (1,747,427) |
Total International Equity | | | | |
Shares sold | 6,833,012 | 2,869,211 | $ 45,955,028 | $ 16,097,831 |
Reinvestment of distributions | 74,043 | 124,381 | 502,009 | 533,594 |
Shares redeemed | (3,806,841) | (2,570,692) | (24,965,317) | (12,899,110) |
Net increase (decrease) | 3,100,214 | 422,900 | $ 21,491,720 | $ 3,732,315 |
Institutional Class | | | | |
Shares sold | 377 | 5,817 | $ 2,481 | $ 30,049 |
Reinvestment of distributions | 460 | 15,268 | 3,106 | 65,500 |
Shares redeemed | (201,123) | (373,992) | (1,373,455) | (2,056,801) |
Net increase (decrease) | (200,286) | (352,907) | $ (1,367,868) | $ (1,961,252) |
12. Other.
The Fund's organizational documents provide former and current trustees and officers with a limited indemnification against liabilities arising in connection with the performance of their duties to the Fund. In the normal course of business, the Fund may also enter into contracts that provide general indemnifications. The Fund's maximum exposure under these arrangements is unknown as this would be dependent on future claims that may be made against the Fund. The risk of material loss from such claims is considered remote.
Annual Report
To the Trustees of Fidelity Investment Trust and Shareholders of Fidelity Total International Equity Fund:
We have audited the accompanying statement of assets and liabilities of Fidelity Total International Equity Fund (the Fund), a fund of Fidelity Investment Trust, including the schedule of investments, as of October 31, 2010, and the related statement of operations for the year then ended, the statement of changes in net assets for each of the two years in the period then ended, and the financial highlights for each of the periods presented. These financial statements and financial highlights are the responsibility of the Fund's management. Our responsibility is to express an opinion on these financial statements and financial highlights based on our audits.
We conducted our audits in accordance with standards of the Public Company Accounting Oversight Board (United States). Those standards require that we plan and perform the audit to obtain reasonable assurance about whether the financial statements and financial highlights are free of material misstatement. The Fund is not required to have, nor were we engaged to perform, an audit of its internal control over financial reporting. Our audits included consideration of internal control over financial reporting as a basis for designing audit procedures that are appropriate in the circumstances, but not for the purpose of expressing an opinion on the effectiveness of the Fund's internal control over financial reporting. Accordingly, we express no such opinion. An audit also includes examining, on a test basis, evidence supporting the amounts and disclosures in the financial statements, assessing the accounting principles used and significant estimates made by management, as well as evaluating the overall financial statement presentation. Our procedures included confirmation of securities owned as of October 31, 2010, by correspondence with the custodians and brokers; where replies were not received from brokers, we performed other auditing procedures. We believe that our audits provide a reasonable basis for our opinion.
In our opinion, the financial statements and financial highlights referred to above present fairly, in all material respects, the financial position of Fidelity Total International Equity Fund as of October 31, 2010, the results of its operations for the year then ended, the changes in its net assets for each of the two years in the period then ended, and the financial highlights for each of the periods presented, in conformity with accounting principles generally accepted in the United States of America.
/s/ Deloitte & Touche LLP
DELOITTE & TOUCHE LLP
Boston, Massachusetts
December 14, 2010
Annual Report
The Trustees, Member of the Advisory Board, and executive officers of the trust and fund, as applicable, are listed below. The Board of Trustees governs the fund and is responsible for protecting the interests of shareholders. The Trustees are experienced executives who meet periodically throughout the year to oversee the fund's activities, review contractual arrangements with companies that provide services to the fund, oversee management of the risks associated with such activities and contractual arrangements, and review the fund's performance. Except for James C. Curvey, each of the Trustees oversees 221 funds advised by FMR or an affiliate. Mr. Curvey oversees 410 funds advised by FMR or an affiliate.
The Trustees hold office without limit in time except that (a) any Trustee may resign; (b) any Trustee may be removed by written instrument, signed by at least two-thirds of the number of Trustees prior to such removal; (c) any Trustee who requests to be retired or who has become incapacitated by illness or injury may be retired by written instrument signed by a majority of the other Trustees; and (d) any Trustee may be removed at any special meeting of shareholders by a two-thirds vote of the outstanding voting securities of the trust. Each Trustee who is not an interested person (as defined in the 1940 Act) (Independent Trustee), shall retire not later than the last day of the calendar year in which his or her 72nd birthday occurs. The Independent Trustees may waive this mandatory retirement age policy with respect to individual Trustees. The executive officers and Advisory Board Member hold office without limit in time, except that any officer and Advisory Board Member may resign or may be removed by a vote of a majority of the Trustees at any regular meeting or any special meeting of the Trustees. Except as indicated, each individual has held the office shown or other offices in the same company for the past five years.
Experience, Skills, Attributes, and Qualifications of the Fund's Trustees. The Governance and Nominating Committee has adopted a statement of policy that describes the experience, qualifications, attributes, and skills that are necessary and desirable for potential Independent Trustee candidates (Statement of Policy). The Board believes that each Trustee satisfied at the time he or she was initially elected or appointed a Trustee, and continues to satisfy, the standards contemplated by the Statement of Policy. The Governance and Nominating Committee also engages professional search firms to help identify potential Independent Trustee candidates who have the experience, qualifications, attributes, and skills consistent with the Statement of Policy. From time to time, additional criteria based on the composition and skills of the current Independent Trustees, as well as experience or skills that may be appropriate in light of future changes to board composition, business conditions, and regulatory or other developments, have also been considered by the professional search firms and the Governance and Nominating Committee. In addition, the Board takes into account the Trustees' commitment and participation in Board and committee meetings, as well as their leadership of standing and ad hoc committees throughout their tenure.
In determining that a particular Trustee was and continues to be qualified to serve as a Trustee, the Board has considered a variety of criteria, none of which, in isolation, was controlling. The Board believes that, collectively, the Trustees have balanced and diverse experience, qualifications, attributes, and skills, which allow the Board to operate effectively in governing the fund and protecting the interests of shareholders. Information about the specific experience, skills, attributes, and qualifications of each Trustee, which in each case led to the Board's conclusion that the Trustee should serve (or continue to serve) as a trustee of the fund, is provided below.
Annual Report
Trustees and Officers - continued
Board Structure and Oversight Function. Edward C. Johnson 3d is an interested person (as defined in the 1940 Act) and currently serves as Chairman. The Trustees have determined that an interested Chairman is appropriate and benefits shareholders because an interested Chairman has a personal and professional stake in the quality and continuity of services provided to the fund. Independent Trustees exercise their informed business judgment to appoint an individual of their choosing to serve as Chairman, regardless of whether the Trustee happens to be independent or a member of management. The Independent Trustees have determined that they can act independently and effectively without having an Independent Trustee serve as Chairman and that a key structural component for assuring that they are in a position to do so is for the Independent Trustees to constitute a substantial majority for the Board. The Independent Trustees also regularly meet in executive session. Ned C. Lautenbach serves as Chairman of the Independent Trustees and as such (i) acts as a liaison between the Independent Trustees and management with respect to matters important to the Independent Trustees and (ii) with management prepares agendas for Board meetings.
Fidelity funds are overseen by different Boards of Trustees. The fund's Board oversees Fidelity's equity and high income funds and another Board oversees Fidelity's investment-grade bond, money market, and asset allocation funds. The asset allocation funds may invest in Fidelity funds overseen by the fund's Board. The use of separate Boards, each with its own committee structure, allows the Trustees of each group of Fidelity funds to focus on the unique issues of the funds they oversee, including common research, investment, and operational issues. On occasion, the separate Boards establish joint committees to address issues of overlapping consequences for the Fidelity funds overseen by each Board.
The Trustees operate using a system of committees to facilitate the timely and efficient consideration of all matters of importance to the Trustees, the fund, and fund shareholders and to facilitate compliance with legal and regulatory requirements and oversight of the fund's activities and associated risks. The Board, acting through its committees, has charged FMR and its affiliates with (i) identifying events or circumstances the occurrence of which could have demonstrably adverse effects on the fund's business and/or reputation; (ii) implementing processes and controls to lessen the possibility that such events or circumstances occur or to mitigate the effects of such events or circumstances if they do occur; and (iii) creating and maintaining a system designed to evaluate continuously business and market conditions in order to facilitate the identification and implementation processes described in (i) and (ii) above. Because the day-to-day operations and activities of the fund are carried out by or through FMR, its affiliates and other service providers, the fund's exposure to risks is mitigated but not eliminated by the processes overseen by the Trustees. While each of the Board's committees has responsibility for overseeing different aspects of the fund's activities, oversight is exercised primarily through the Operations, Audit, and Compliance Committees. Appropriate personnel, including but not limited to the fund's Chief Compliance Officer (CCO), FMR's internal auditor, the independent accountants, the fund's Treasurer and portfolio management personnel, make periodic reports to the Board's committees, as appropriate. The responsibilities of each committee, including their oversight responsibilities, are described further under "Standing Committees of the Fund's Trustees."
Annual Report
The fund's Statement of Additional Information (SAI) includes more information about the Trustees. To request a free copy, call Fidelity at 1-877-208-0098.
Interested Trustees*:
Correspondence intended for each Trustee who is an interested person may be sent to Fidelity Investments, 82 Devonshire Street, Boston, Massachusetts 02109.
Name, Age; Principal Occupations and Other Relevant Experience+ |
Edward C. Johnson 3d (80) |
| Year of Election or Appointment: 1984 Mr. Johnson is Trustee and Chairman of the Board of Trustees of certain Trusts. Mr. Johnson serves as Chief Executive Officer, Chairman, and a Director of FMR LLC; Chairman and a Director of FMR; Chairman and a Director of Fidelity Research & Analysis Company (FRAC); Chairman and a Director of Fidelity Investments Money Management, Inc.; and Chairman and a Director of FMR Co., Inc. In addition, Mr. Johnson serves as Chairman and Director of FIL Limited. Previously, Mr. Johnson served as President of FMR LLC (2006-2007). |
James C. Curvey (75) |
| Year of Election or Appointment: 2007 Mr. Curvey also serves as Trustee (2007-present) of other investment companies advised by FMR. Mr. Curvey is a Director of Fidelity Investments Money Management, Inc. (2009-present), Director of Fidelity Research & Analysis Co. (2009-present) and Director of FMR and FMR Co., Inc. (2007-present). Mr. Curvey is also Vice Chairman (2007-present) and Director of FMR LLC. In addition, Mr. Curvey serves as an Overseer for the Boston Symphony Orchestra and a member of the Trustees of Villanova University. Previously, Mr. Curvey was the Vice Chairman (2006-2007) and Director (2000-2007) of FMR Corp. |
* Trustees have been determined to be "Interested Trustees" by virtue of, among other things, their affiliation with the trust or various entities under common control with FMR.
Annual Report
Trustees and Officers - continued
+ The information above includes each Trustee's principal occupation during the last five years and other information relating to the experience, attributes, and skills relevant to each Trustee's qualifications to serve as a Trustee, which led to the conclusion that each Trustee should serve as a Trustee for the fund.
Independent Trustees:
Correspondence intended for each Independent Trustee (that is, the Trustees other than the Interested Trustees) may be sent to Fidelity Investments, P.O. Box 55235, Boston, Massachusetts 02205-5235.
Name, Age; Principal Occupations and Other Relevant Experience+ |
Dennis J. Dirks (62) |
| Year of Election or Appointment: 2005 Prior to his retirement in May 2003, Mr. Dirks was Chief Operating Officer and a member of the Board of The Depository Trust & Clearing Corporation (DTCC). He also served as President, Chief Operating Officer, and Board member of The Depository Trust Company (DTC) and President and Board member of the National Securities Clearing Corporation (NSCC). In addition, Mr. Dirks served as Chief Executive Officer and Board member of the Government Securities Clearing Corporation, Chief Executive Officer and Board member of the Mortgage-Backed Securities Clearing Corporation, as a Trustee and a member of the Finance Committee of Manhattan College (2005-2008), and as a Trustee and a member of the Finance Committee of AHRC of Nassau County (2006-2008). Mr. Dirks is a member of the Independent Directors Council (IDC) Governing Council (2010-Present) and Board of Directors for The Brookville Center for Children's Services, Inc. (2009-present). |
Alan J. Lacy (57) |
| Year of Election or Appointment: 2008 Mr. Lacy serves as Senior Adviser (2007-present) of Oak Hill Capital Partners, L.P. (private equity). Mr. Lacy also served as Chief Executive Officer (2000-2005) and Vice Chairman (2005-2006) of Sears Holdings Corporation and Sears, Roebuck and Co. (retail). In addition, Mr. Lacy serves as a member of the Board of Directors of The Western Union Company (global money transfer, 2006-present) and Bristol-Myers Squibb Company (global pharmaceuticals, 2007-present). Mr. Lacy is Chairman (2008-present) and a member (2006-present) of the Board of Trustees of The National Parks Conservation Association. |
Ned C. Lautenbach (66) |
| Year of Election or Appointment: 2000 Mr. Lautenbach is Chairman of the Independent Trustees of the Equity and High Income Funds (2006-present). Mr. Lautenbach currently serves as the Lead Director of the Eaton Corporation Board of Directors (diversified industrial, 1997-present). Mr. Lautenbach is also a member of the Board of Directors of the Philharmonic Center for the Arts in Naples, Florida (1999-present); a member of the Board of Trustees of Fairfield University (2005-present); and a member of the Council on Foreign Relations (1994-present). Previously, Mr. Lautenbach was a Partner/Advisory Partner at Clayton, Dubilier & Rice, Inc. (private equity investment, 1998-2010), as well as a Director of Sony Corporation (2006-2007). |
Joseph Mauriello (66) |
| Year of Election or Appointment: 2008 Prior to his retirement in January 2006, Mr. Mauriello served in numerous senior management positions including Deputy Chairman and Chief Operating Officer (2004-2005), and Vice Chairman of Financial Services (2002-2004) of KPMG LLP US (professional services, 1965-2005). Mr. Mauriello currently serves as a member of the Board of Directors of XL Group plc. (global insurance and re-insurance, 2006-present) and of Arcadia Resources Inc. (health care services and products, 2007-present). Previously, Mr. Mauriello served as a Director of the Hamilton Funds of the Bank of New York (2006-2007). |
Cornelia M. Small (66) |
| Year of Election or Appointment: 2005 Ms. Small is a member of the Board of Directors of the Teagle Foundation (2009-present). Ms. Small is also a member of the Investment Committee, and Chair (2008-present) and a member of the Board of Trustees of Smith College. In addition, Ms. Small serves on the Investment Committee of the Berkshire Taconic Community Foundation (2008-present). Previously, Ms. Small served as Chairperson of the Investment Committee (2002-2008) of Smith College. In addition, Ms. Small served as Chief Investment Officer, Director of Global Equity Investments, and a member of the Board of Directors of Scudder, Stevens & Clark and Scudder Kemper Investments. |
William S. Stavropoulos (71) |
| Year of Election or Appointment: 2001 Mr. Stavropoulos is Vice Chairman of the Independent Trustees of the Equity and High Income Funds (2006-present). Mr. Stavropoulos serves as President and Founder of the Michigan Baseball Foundation, the Great Lakes Loons (2007-present). Mr. Stavropoulos is Chairman Emeritus of the Board of Directors of The Dow Chemical Company, where he previously served in numerous senior management positions, including President, CEO (1995-2000; 2002-2004), Chairman of the Executive Committee (2000-2006), and as a member of the Board of Directors (1990-2006). Currently, Mr. Stavropoulos is Chairman of Univar (global distributor of commodity and specialty chemicals, 2010-present), a Director of Teradata Corporation (data warehousing and technology solutions, 2008-present), Chemical Financial Corporation, Maersk Inc. (industrial conglomerate), Tyco International, Inc. (multinational manufacturing and services, 2007-present), and a member of the Advisory Board for Metalmark Capital (private equity investment, 2005-
present). Mr. Stavropoulos is a special advisor to Clayton, Dubilier & Rice, Inc. (private equity investment). In addition, Mr. Stavropoulos is a member of the University of Notre Dame Advisory Council for the College of Science. |
David M. Thomas (61) |
| Year of Election or Appointment: 2008 Previously, Mr. Thomas served as Executive Chairman (2005-2006) and Chairman and Chief Executive Officer (2000-2005) of IMS Health, Inc. (pharmaceutical and healthcare information solutions). In addition, Mr. Thomas serves as a member of the Board of Directors of Fortune Brands, Inc. (consumer products), and Interpublic Group of Companies, Inc. (marketing communication, 2004-present). |
Michael E. Wiley (60) |
| Year of Election or Appointment: 2008 Mr. Wiley also serves as a Director of Asia Pacific Exploration Consolidated (international oil and gas exploration and production, 2008-present). Mr. Wiley serves as a Director of Tesoro Corporation (independent oil refiner and marketer, 2005-present), and a Director of Bill Barrett Corporation (exploration and production, 2005-present). In addition, Mr. Wiley also serves as a Director of Post Oak Bank (privately-held bank, 2004-present). Previously, Mr. Wiley served as a member of the Board of Trustees of the University of Tulsa (2000-2006; 2007-2010), as a Senior Energy Advisor of Katzenbach Partners, LLC (consulting, 2006-2007), as an Advisory Director of Riverstone Holdings (private investment), Chairman, President, and CEO of Baker Hughes, Inc. (oilfield services, 2000-2004), and as Director of Spinnaker Exploration Company (exploration and production, 2001-2005). |
Annual Report
+ The information above includes each Trustee's principal occupation during the last five years and other information relating to the experience, attributes, and skills relevant to each Trustee's qualifications to serve as a Trustee, which led to the conclusion that each Trustee should serve as a Trustee for the fund.
Advisory Board Member and Executive Officers:
Correspondence intended for each executive officer and Peter S. Lynch may be sent to Fidelity Investments, 82 Devonshire Street, Boston, Massachusetts 02109.
Name, Age; Principal Occupation |
Peter S. Lynch (66) |
| Year of Election or Appointment: 2003 Member of the Advisory Board of Fidelity's Equity and High Income Funds. Mr. Lynch is Vice Chairman and a Director of FMR and FMR Co., Inc. In addition, Mr. Lynch serves as a Trustee of Boston College and as the Chairman of the Inner-City Scholarship Fund. Previously, Mr. Lynch served on the Special Olympics International Board of Directors (1997-2006). |
Kenneth B. Robins (41) |
| Year of Election or Appointment: 2008 President and Treasurer of Fidelity's Equity and High Income Funds. Mr. Robins also serves as President and Treasurer (2010-present) and Assistant Treasurer (2009-present) of other Fidelity funds and is an employee of Fidelity Investments (2004-present). Previously, Mr. Robins served as Deputy Treasurer of the Fidelity funds (2005-2008) and Treasurer and Chief Financial Officer of The North Carolina Capital Management Trust: Cash and Term Portfolios (2006-2008). |
Bruce T. Herring (45) |
| Year of Election or Appointment: 2006 Vice President of certain Equity Funds. Mr. Herring also serves as Chief Investment Officer and Director of Fidelity Management & Research (U.K.) Inc. (2010-present) and Group Chief Investments Officer of FMR. Previously, Mr. Herring served as Vice President (2005-2006) and Senior Vice President (2006-2007) of Fidelity Management & Research Company, Vice President of FMR Co., Inc. (2001-2007) and as a portfolio manager for Fidelity U.S. Equity Funds. |
Brian B. Hogan (46) |
| Year of Election or Appointment: 2009 Vice President of certain Equity Funds and Vice President of Sector Funds. Mr. Hogan also serves as President of FMR's Equity Division (2009-present). Previously, Mr. Hogan served as Senior Vice President, Equity Research of FMR (2006-2009) and as a portfolio manager. |
Scott C. Goebel (42) |
| Year of Election or Appointment: 2008 Secretary and Chief Legal Officer (CLO) of the Fidelity funds. Mr. Goebel also serves as Secretary and CLO of The North Carolina Capital Management Trust: Cash and Term Portfolio (2008-present); General Counsel, Secretary, and Senior Vice President of FMR (2008-present) and FMR Co., Inc. (2008-present); Deputy General Counsel of FMR LLC; Chief Legal Officer of Fidelity Management & Research (Hong Kong) Limited (2008-present) and Assistant Secretary of Fidelity Management & Research (Japan) Inc. (2008-present), Fidelity Investments Money Management, Inc. (2008-present), Fidelity Management & Research (U.K.) Inc. (2008-present), and Fidelity Research and Analysis Company (2008-present). Previously, Mr. Goebel served as Assistant Secretary of the Funds (2007-2008) and as Vice President and Secretary of Fidelity Distributors Corporation (FDC) (2005-2007). |
William C. Coffey (41) |
| Year of Election or Appointment: 2009 Assistant Secretary of Fidelity's Equity and High Income Funds. Mr. Coffey also serves as Senior Vice President and Deputy General Counsel of FMR LLC (2010-present), and is an employee of Fidelity Investments. Previously, Mr. Coffey served as Vice President and Associate General Counsel of FMR LLC (2005-2009). |
Holly C. Laurent (56) |
| Year of Election or Appointment: 2008 Anti-Money Laundering (AML) Officer of the Fidelity funds. Ms. Laurent also serves as AML Officer of The North Carolina Capital Management Trust: Cash and Term Portfolio (2008-present) and is an employee of Fidelity Investments. Previously, Ms. Laurent was Senior Vice President and Head of Legal for Fidelity Business Services India Pvt. Ltd. (2006-2008), and Senior Vice President, Deputy General Counsel and Group Head for FMR LLC (2005-2006). |
Christine Reynolds (52) |
| Year of Election or Appointment: 2008 Chief Financial Officer of the Fidelity funds. Ms. Reynolds became President of Fidelity Pricing and Cash Management Services (FPCMS) in August 2008. Ms. Reynolds served as Chief Operating Officer of FPCMS (2007-2008). Previously, Ms. Reynolds served as President, Treasurer, and Anti-Money Laundering officer of the Fidelity funds (2004-2007). |
Kenneth A. Rathgeber (63) |
| Year of Election or Appointment: 2004 Chief Compliance Officer of Fidelity's Equity and High Income Funds. Mr. Rathgeber is Chief Compliance Officer of Fidelity Management & Research (Hong Kong) Limited (2008-present), Fidelity Management & Research (Japan) Inc. (2008-present), FMR (2005-present), FMR Co., Inc. (2005-present), Fidelity Management & Research (U.K.) Inc. (2005-present), Fidelity Research & Analysis Company (2005-present), Fidelity Investments Money Management, Inc. (2005-present), Pyramis Global Advisors, LLC (2005-present), and Strategic Advisers, Inc. (2005-present). |
Jeffrey S. Christian (49) |
| Year of Election or Appointment: 2009 Deputy Treasurer of the Fidelity funds. Mr. Christian is an employee of Fidelity Investments. Previously, Mr. Christian served as Chief Financial Officer (2008-2009) of certain Fidelity funds and Senior Vice President of Fidelity Pricing and Cash Management Services (FPCMS) (2004-2009). |
Bryan A. Mehrmann (49) |
| Year of Election or Appointment: 2005 Deputy Treasurer of the Fidelity funds. Mr. Mehrmann is an employee of Fidelity Investments. |
Adrien E. Deberghes (43) |
| Year of Election or Appointment: 2008 Deputy Treasurer of Fidelity's Equity and High Income Funds. Mr. Deberghes also serves as Assistant Treasurer of other Fidelity funds (2010-present) and is an employee of Fidelity Investments (2008-present). Previously, Mr. Deberghes served as Senior Vice President of Mutual Fund Administration at State Street Corporation (2007-2008), Senior Director of Mutual Fund Administration at Investors Bank & Trust (2005-2007), and Director of Finance for Dunkin' Brands (2000-2005). |
Stephanie J. Dorsey (41) |
| Year of Election or Appointment: 2010 Assistant Treasurer of Fidelity's Equity and High Income Funds. Ms. Dorsey also serves as Deputy Treasurer of other Fidelity funds (2008-present) and is an employee of Fidelity Investments (2008-present). Previously, Ms. Dorsey served as Treasurer (2004-2008) of the JPMorgan Mutual Funds and Vice President (2004-2008) of JPMorgan Chase Bank. |
John R. Hebble (52) |
| Year of Election or Appointment: 2009 Assistant Treasurer of Fidelity's Equity and High Income Funds. Mr. Hebble also serves as Treasurer and Chief Financial Officer of The North Carolina Capital Management Trust: Cash and Term Portfolio (2008-present), President and Treasurer of other Fidelity funds (2008-present) and is an employee of Fidelity Investments. |
Gary W. Ryan (52) |
| Year of Election or Appointment: 2005 Assistant Treasurer of the Fidelity funds. Mr. Ryan is an employee of Fidelity Investments. Previously, Mr. Ryan served as Vice President of Fund Reporting in Fidelity Pricing and Cash Management Services (FPCMS) (1999-2005). |
Jonathan Davis (42) |
| Year of Election or Appointment: 2010 Assistant Treasurer of the Fidelity funds. Mr. Davis is an employee of Fidelity Investments. Previously, Mr. Davis served as Vice President and Associate General Counsel of FMR LLC (2003-2010). |
Annual Report
The Board of Trustees of Fidelity Total International Equity Fund voted to pay to shareholders of record at the opening of business on record date, the following distributions per share derived from capital gains realized from sales of portfolio securities, and dividends derived from net investment income:
| Pay Date | Record Date | Dividends | Capital Gains |
Institutional Class | 12/06/10 | 12/03/10 | $0.081 | $0.023 |
Institutional Class designates 100% of dividends distributed during the fiscal year as amounts which may be taken into account as a dividend for purposes of the maximum rate under section 1(h)(11) of the Internal Revenue Code.
The amounts per share which represent income derived from sources within, and taxes paid to, foreign countries or possessions of the United States are as follows:
| Pay Date | Income | Taxes |
Institutional Class | 12/07/2009 | $0.089 | $0.0119 |
The fund will notify shareholders in January 2011 of amounts for use in preparing 2010 income tax returns.
Annual Report
Board Approval of Investment Advisory Contracts and Management Fees
Fidelity Total International Equity Fund
Each year, the Board of Trustees, including the Independent Trustees (together, the Board), votes on the renewal of the management contract and sub-advisory agreements (together, the Advisory Contracts) for the fund. The Board, assisted by the advice of fund counsel and Independent Trustees' counsel, requests and considers a broad range of information relevant to the renewal of the Advisory Contracts throughout the year.
The Board meets regularly and considers at each of its meetings factors that are relevant to its annual consideration of the renewal of the fund's Advisory Contracts, including the services and support provided to the fund and its shareholders. The Board has established various standing committees, each composed of Independent Trustees with varying backgrounds, to which the Board has assigned specific subject matter responsibilities in order to enhance effective decision-making by the Board. The Board, acting directly and through its Committees, requests and receives information concerning the annual consideration of the renewal of the fund's Advisory Contracts. The Board also meets as needed to consider matters specifically related to the Board's annual consideration of the renewal of Advisory Contracts. Members of the Board may also meet with trustees of other Fidelity funds through ad hoc joint committees to discuss certain matters relevant to the Fidelity funds.
At its July 2010 meeting, the Board of Trustees, including the Independent Trustees, unanimously determined to renew the fund's Advisory Contracts. In reaching its determination, the Board considered all factors it believed relevant, including (i) the nature, extent, and quality of the services to be provided to the fund and its shareholders (including the investment performance of the fund); (ii) the competitiveness of the fund's management fee and total expenses; (iii) the total costs of the services to be provided by and the profits to be realized by Fidelity from its relationship with the fund; (iv) the extent to which economies of scale would be realized as the fund grows; and (v) whether fee levels reflect these economies of scale, if any, for the benefit of fund shareholders.
In considering whether to renew the Advisory Contracts for the fund, the Board reached a determination, with the assistance of fund counsel and Independent Trustees' counsel and through the exercise of its business judgment, that the renewal of the Advisory Contracts is in the best interests of fund shareholders and that the compensation to be received by Fidelity under the management contract is fair and reasonable. The Board's decision to renew the Advisory Contracts was not based on any single factor noted above, but rather was based on a comprehensive consideration of all the information provided to the Board at its meetings throughout the year. The Board, in reaching its determination to renew the Advisory Contracts, is aware that shareholders in the fund have a broad range of investment choices available to them, including a wide choice among mutual funds offered by Fidelity's competitors, and that the fund's shareholders, with the opportunity to review and weigh the disclosure provided by the fund in its prospectus and other public disclosures, have chosen to invest in this fund, managed by Fidelity.
Annual Report
Nature, Extent, and Quality of Services Provided. The Board considered the staffing within the investment adviser, FMR, and the sub-advisers (together, the Investment Advisers), including the backgrounds of the fund's investment personnel and the fund's investment objective and discipline. The Independent Trustees also had discussions with senior management of Fidelity's investment operations and investment groups. The Board considered the structure of the portfolio manager compensation program and whether this structure provides appropriate incentives to act in the best interest of the fund.
Resources Dedicated to Investment Management and Support Services. The Board and the equity research subcommittee of the Board's Fund Oversight Committee reviewed the size, education, and experience of the Investment Advisers' investment staff, their use of technology, and the Investment Advisers' approach to recruiting, training, and retaining portfolio managers and other research, advisory, and management personnel. The Board noted that Fidelity's analysts have access to a variety of technological tools and market and securities data that enable them to perform both fundamental and quantitative analysis and to specialize in various disciplines. The Board considered Fidelity's extensive global research capabilities that enable the Investment Advisers to aggregate data from various sources in an effort to produce positive investment results. The Board also considered that Fidelity's portfolio managers and analysts have access to daily portfolio attribution that allows for monitoring of a fund's portfolio, as well as an electronic communication system that provides immediate real-time access to research concerning issuers and credit enhancers. The Board noted FMR's continued focus on strengthening the organization and discipline of equity portfolio management and research.
Shareholder and Administrative Services. The Board considered (i) the nature, extent, quality, and cost of advisory, administrative, and shareholder services performed by the Investment Advisers and their affiliates under the Advisory Contracts and under separate agreements covering transfer agency, pricing and bookkeeping, and securities lending services for the fund; (ii) the nature and extent of the investment adviser's supervision of third party service providers, principally custodians and subcustodians; and (iii)��the resources devoted to, and the record of compliance with, the fund's compliance policies and procedures. The Board also reviewed the allocation of fund brokerage, including allocations to brokers affiliated with the Investment Advisers, the use of brokerage commissions to pay fund expenses, and the use of "soft" commission dollars to pay for research services.
The Board noted that the growth of fund assets over time across the complex allows Fidelity to reinvest in the development of services designed to enhance the value or convenience of the Fidelity funds as investment vehicles. These services include 24-hour access to account information and market information through phone representatives and over the Internet, and investor education materials and asset allocation tools.
Annual Report
Board Approval of Investment Advisory Contracts and
Management Fees - continued
Investment in a Large Fund Family. The Board considered the benefits to shareholders of investing in a Fidelity fund, including the benefits of investing in a fund that is part of a large family of funds offering a variety of investment disciplines and providing a large variety of mutual fund investor services. The Board noted that Fidelity had taken, or had made recommendations that resulted in the Fidelity funds taking, a number of actions over the previous year that benefited particular funds, including (i) dedicating additional resources to investment research and restructuring and broadening the focus of the investment research teams; (ii) bolstering the senior management team that oversees asset management; (iii) launching Class F of certain funds as a lower-fee class available to Freedom K and Freedom Index Funds; (iv) lowering the initial investment minimums and ongoing balance requirements for Real Estate High Income Fund; (v) eliminating subsequent purchase minimums for all funds and adding a waiver of the investment minimum requirement for new accounts opened with the proceeds of a systematic withdrawal plan; (vi) eliminating the withdrawal minimum and maximum limits for systematic withdrawals from Advisor funds; (vii) expanding sales load waivers on Class A shares for Destiny Planholders and expanding Institutional Class eligibility for Class O Destiny Planholders; and (viii) changing certain Class A and Class T sales charge structures to further align them with industry practices.
Investment Performance. The Board considered whether the fund has operated in accordance with its investment objective, as well as its record of compliance with its investment restrictions. It also reviewed the fund's absolute investment performance for each class, as well as the fund's relative investment performance for each class measured against (i) a broad-based securities market index, and (ii) a peer group of mutual funds deemed appropriate by Fidelity and reviewed by the Board. Because the fund had been in existence less than three calendar years, the following chart considered by the Board shows, for the one-year period ended December 31, 2009, the total returns of the retail class and Class B of the fund, the total return of a broad-based securities market index ("benchmark"), and a range of total returns of a peer group of mutual funds identified by Morningstar, Inc. as having an investment style similar to that of the fund based on underlying portfolio holdings. The returns of the retail class and Class B show the performance of the highest and lowest performing classes, respectively. The box within the chart shows the 25th percentile return (bottom of box) and the 75th percentile return (top of box) of the peer group. Returns shown above the box are in the first quartile and returns shown below the box are in the fourth quartile. The percentage beaten numbers noted below the chart correspond to the percentile box and represent the percentage of funds in the peer group whose performance was equal to or lower than that of the class indicated.
Annual Report
Fidelity Total International Equity Fund
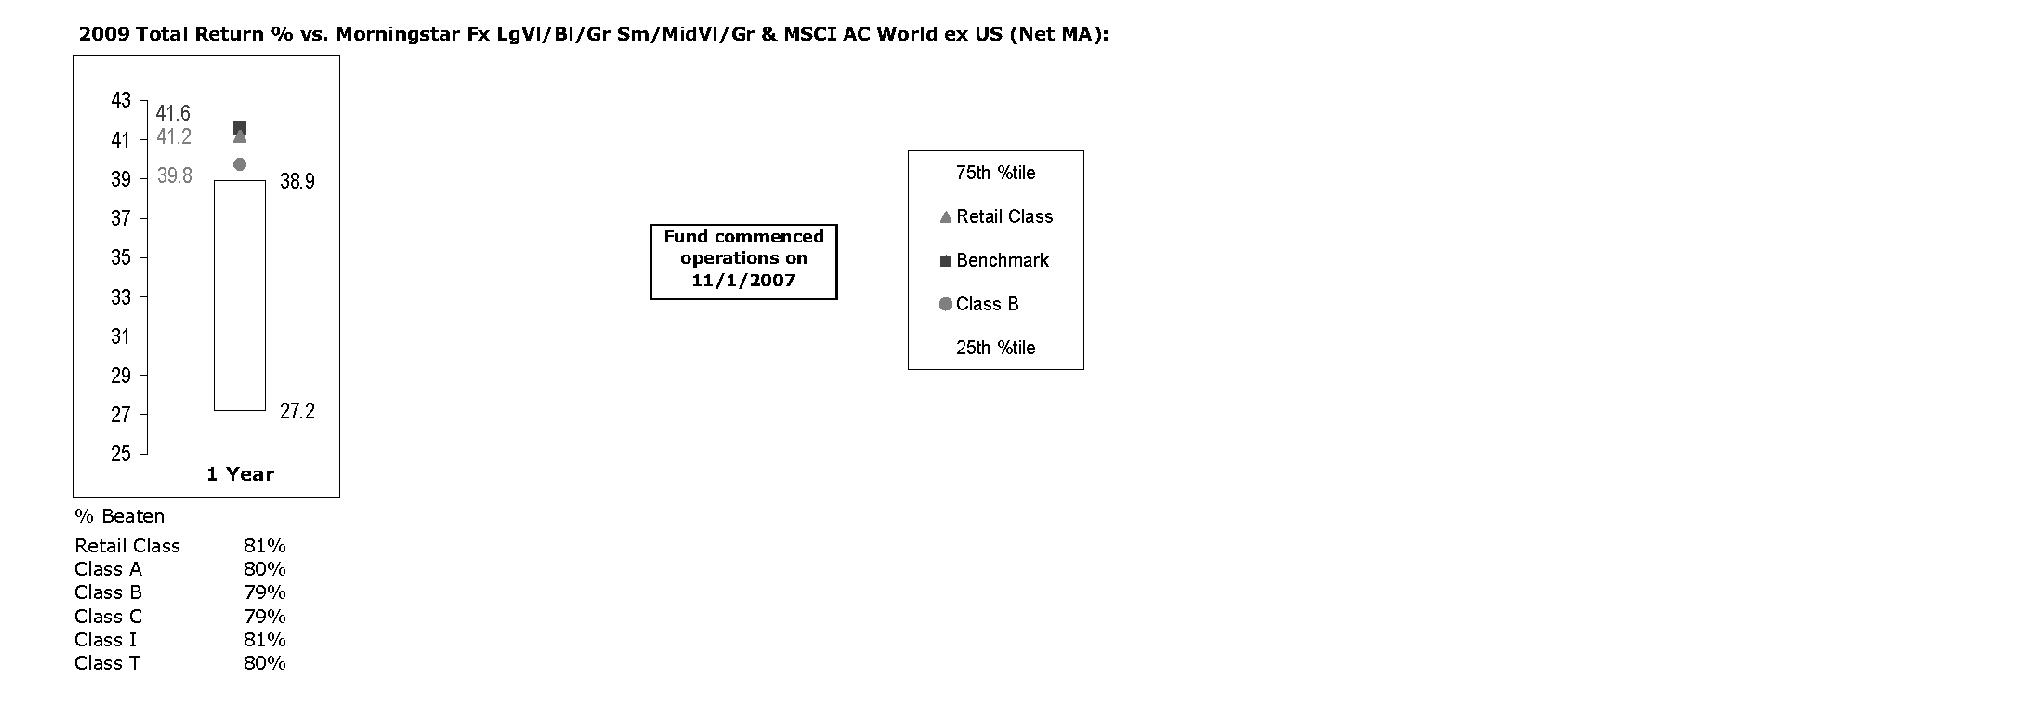
The Board reviewed the fund's relative investment performance against its peer group and noted that the performance of the retail class of the fund was in the first quartile for the period shown. The Board also noted that the investment performance of the fund was lower than its benchmark for the period shown. The Board considered that the variations in performance among the fund's classes reflect the variations in class expenses, which result in lower performance for higher expense classes. The Board also reviewed the fund's performance since inception as well as performance in the current year. The Board noted that it is difficult to evaluate in any comprehensive fashion the performance of the fund, in light of its relatively recent commencement of operations.
The Board also considered that the fund's management fee is subject to upward or downward adjustment depending upon whether, and to what extent, the fund's investment performance for the performance period exceeds, or is exceeded by, the record (over the same period) of a Board-approved performance adjustment index. The Board realizes that the performance adjustment provides FMR with a strong economic incentive to seek to achieve superior performance for the fund's shareholders and helps to more closely align the interests of FMR and the fund's shareholders.
Based on its review, and giving particular weight to the nature and quality of the resources dedicated by the Investment Advisers to maintain and improve relative performance and factoring in the unprecedented market events in recent years, the Board concluded that the nature, extent, and quality of investment management and support services and of shareholder and administrative services provided to the fund will benefit the fund's shareholders, particularly in light of the Board's view that the fund's shareholders benefit from investing in a fund that is part of a large family of funds offering a variety of investment disciplines and services.
Annual Report
Board Approval of Investment Advisory Contracts and
Management Fees - continued
Competitiveness of Management Fee and Total Fund Expenses. The Board considered the fund's management fee and total expenses compared to "mapped groups" of competitive funds and classes. Fidelity creates "mapped groups" by combining similar Lipper investment objective categories that have comparable management fee characteristics. Combining Lipper investment objective categories aids the Board's management fee and total expense comparisons by broadening the competitive group used for comparison and by reducing the number of universes to which various Fidelity funds are compared.
Management Fee. The Board considered two proprietary management fee comparisons for the 12-month (or shorter) periods shown in the chart below. The group of Lipper funds used by the Board for management fee comparisons is referred to below as the "Total Mapped Group." The Total Mapped Group comparison focuses on a fund's standing relative to the total universe of comparable funds available to investors, in terms of gross management fees before expense reimbursements or caps, and without giving effect to the fund's performance adjustment. "TMG %" represents the percentage of funds in the Total Mapped Group that had management fees that were lower than the fund's. For example, a TMG % of 15% means that 85% of the funds in the Total Mapped Group had higher management fees than the fund. The "Asset-Size Peer Group" (ASPG) comparison focuses on a fund's standing relative to non-Fidelity funds similar in size to the fund within the Total Mapped Group. The ASPG represents at least 15% of the funds in the Total Mapped Group with comparable asset size and management fee characteristics, subject to a minimum of 50 funds (or all funds in the Total Mapped Group if fewer than 50). Additional information, such as the ASPG quartile in which the fund's management fee ranked and the impact of the fund's performance adjustment, is also included in the chart and considered by the Board.
Annual Report
Fidelity Total International Equity Fund

The Board noted that the fund's management fee ranked below the median of its Total Mapped Group and below the median of its ASPG for 2009. The Board also noted the effect of the fund's negative performance adjustment on the fund's management fee ranking. The Board noted that the performance adjustment for each year represents calculations for performance periods that differ from the period shown in the performance chart above.
Based on its review, the Board concluded that the fund's management fee is fair and reasonable in light of the services that the fund receives and the other factors considered.
Total Expenses. In its review of each class's total expenses, the Board considered the fund's management fee as well as other fund or class expenses, as applicable, such as transfer agent fees, pricing and bookkeeping fees, fund-paid 12b-1 fees, and custodial, legal, and audit fees. The Board also noted the effects of any waivers and reimbursements on fees and expenses, as well as the impact of the fund's performance adjustment. As part of its review, the Board also considered current and historical total expenses of each class of the fund compared to competitive fund median expenses. Each class of the fund is compared to those funds and classes in the Total Mapped Group (used by the Board for management fee comparisons) that have a similar sales load structure.
The Board noted that the total expenses of each of Class A and the retail class ranked below its competitive median for 2009, the total expenses of Class B ranked equal to its competitive median for 2009, and the total expenses of each of Class T, Class C, and Institutional Class ranked above its competitive median for 2009. The Board considered that the total expenses for Class T were above the median primarily because its 12b-1 fee is higher than the typical front-end load class. The Board noted that the fund offers multiple classes, each of which has a different sales load and 12b-1 fee structure, and that the multiple structures are intended to offer a range of pricing options for the intermediary market. The Board also noted that the total expenses of the classes vary primarily by the level of their 12b-1 fees, although differences in transfer agent fees may also cause expenses to vary from class to class.
Annual Report
Board Approval of Investment Advisory Contracts and
Management Fees - continued
Fees Charged to Other Fidelity Clients. The Board also considered Fidelity fee structures and other information with respect to clients of FMR and its affiliates, such as other mutual funds advised or subadvised by FMR or its affiliates, pension plan clients, and other institutional clients. In March 2010, the Board created an ad hoc joint committee with the board of other Fidelity funds (the Committee) to review and compare Fidelity's institutional investment advisory business with its business of providing services to the Fidelity funds, including the differences in services provided, fees charged, and costs incurred, as well as competition in their respective marketplaces.
Based on its review of total expenses and fees charged to other Fidelity clients, the Board concluded that the total expenses of each class of the fund were reasonable, although in some cases above the median of the universe presented for comparison, in light of the services that the fund and its shareholders receive and the other factors considered, including the findings of the Committee.
Costs of the Services and Profitability. The Board considered the revenues earned and the expenses incurred by Fidelity in conducting the business of developing, marketing, distributing, managing, administering and servicing the fund and its shareholders. The Board also considered the level of Fidelity's profits in respect of all the Fidelity funds.
On an annual basis, FMR presents to the Board Fidelity's profitability for the fund. Fidelity calculates the profitability for each fund, as well as aggregate profitability for groups of Fidelity funds and all Fidelity funds, using a series of detailed revenue and cost allocation methodologies which originate with the audited books and records of Fidelity. The Audit Committee of the Board reviews any significant changes from the prior year's methodologies.
PricewaterhouseCoopers LLP (PwC), independent registered public accounting firm and auditor to Fidelity and certain Fidelity funds, has been engaged annually by the Board as part of the Board's assessment of Fidelity's profitability analysis. PwC's engagement includes the review and assessment of Fidelity's methodologies used in determining the revenues and expenses attributable to Fidelity's mutual fund business, and completion of agreed-upon procedures surrounding the mathematical accuracy of fund profitability and its conformity to allocation methodologies. After considering PwC's reports issued under the engagement and information provided by Fidelity, the Board believes that while other allocation methods may also be reasonable, Fidelity's profitability methodologies are reasonable in all material respects.
Annual Report
The Board has also reviewed Fidelity's non-fund businesses and fall-out benefits related to the mutual fund business as well as cases where Fidelity's affiliates may benefit from or be related to the fund's business.
The Board considered the costs of the services provided by and the profits realized by Fidelity in connection with the operation of the fund and were satisfied that the profitability was not excessive in the circumstances.
Economies of Scale. The Board considered whether there have been economies of scale in respect of the management of the Fidelity funds, whether the Fidelity funds (including the fund) have appropriately benefited from any such economies of scale, and whether there is potential for realization of any further economies of scale. The Board considered the extent to which the fund will benefit from economies of scale through increased services to the fund, through waivers or reimbursements, or through fee or expense reductions.
In February 2009, the Board and the board of other Fidelity funds created an ad hoc committee (the Economies of Scale Committee) to analyze whether FMR attains economies of scale in respect of the management and servicing of the Fidelity funds, whether the Fidelity funds have appropriately benefited from such economies of scale, and whether there is potential for realization of any further economies of scale.
The Board recognized that the fund's management contract incorporates a "group fee" structure, which provides for lower group fee rates as total fund assets under FMR's management increase, and for higher group fee rates as total fund assets under FMR's management decrease. FMR calculates the group fee rates based on a tiered asset "breakpoint" schedule that varies based on asset class. The Board considered that the group fee is designed to deliver the benefits of economies of scale to fund shareholders when total Fidelity fund assets increase, even if assets of any particular fund are unchanged or have declined, because some portion of Fidelity's costs are attributable to services provided to all Fidelity funds, and all funds benefit if those costs can be allocated among more assets. The Board concluded that, given the group fee structure, fund shareholders will benefit from lower management fees as assets under FMR's management increase at the fund complex level, regardless of whether Fidelity achieves any such economies of scale.
The Board concluded, considering the findings of the Economies of Scale Committee, that any potential economies of scale are being appropriately shared between fund shareholders and Fidelity.
Additional Information Requested by the Board. In order to develop fully the factual basis for consideration of the Fidelity funds' Advisory Contracts, the Board requested and received additional information on certain topics, including (i) fund performance trends, actions to be taken by FMR to improve certain funds' overall performance, and Fidelity's long-term strategies for certain funds; (ii) portfolio manager changes that have occurred during the past year and length of portfolio manager tenure for different categories of funds over time; (iii) Fidelity's compensation structure for portfolio managers, research analysts, and other key personnel, the rationale for the compensation structure, and how the compensation structure provides appropriate performance incentives; (iv) the amount of the investment that each portfolio manager has made in the Fidelity fund(s) that he or she manages; (v) management and other fees paid by FMR to affiliated sub-advisers on behalf of the Fidelity funds; (vi) Fidelity's fee structures and rationale for recommending different fees among different categories of funds; (vii) Fidelity's rationale for recommending which funds should have a performance adjustment component as part of their management fees; (viii) the rationale for any differences between fund fee structures and fee structures in place for other Fidelity clients; and (ix) explanations regarding the relative total expenses borne by certain funds and classes, total expense competitive trends, and actions that might be taken by FMR to reduce total expenses for certain funds and classes.
Annual Report
Board Approval of Investment Advisory Contracts and
Management Fees - continued
Based on its evaluation of all of the conclusions noted above, and after considering all factors it believed relevant, the Board ultimately concluded that the advisory fee structures are fair and reasonable, and that the fund's Advisory Contracts should be renewed.
Annual Report
Investment Adviser
Fidelity Management & Research Company
Boston, MA
Investment Sub-Advisers
FMR Co., Inc.
Fidelity Management & Research
(U.K.) Inc.
Fidelity Research & Analysis Company
FIL Investment Advisors
FIL Investments (Japan) Limited
FIL Investment Advisors
(U.K.) Limited
Fidelity Management & Research
(Hong Kong) Limited
Fidelity Management & Research
(Japan) Inc.
General Distributor
Fidelity Distributors Corporation
Boston, MA
Transfer and Service Agents
Fidelity Investments Institutional Operations Company, Inc.
Boston, MA
Fidelity Service Company, Inc.
Boston, MA
Custodian
State Street Bank & Trust Company
Quincy, MA
ATIEI-UANN-1210
1.853356.102
Item 2. Code of Ethics
As of the end of the period, October 31, 2010, Fidelity Investment Trust (the trust) has adopted a code of ethics, as defined in Item 2 of Form N-CSR, that applies to its President and Treasurer and its Chief Financial Officer. A copy of the code of ethics is filed as an exhibit to this Form N-CSR.
Item 3. Audit Committee Financial Expert
The Board of Trustees of the trust has determined that Joseph Mauriello is an audit committee financial expert, as defined in Item 3 of Form N-CSR. Mr. Mauriello is independent for purposes of Item 3 of Form N-CSR.
Item 4. Principal Accountant Fees and Services
Fees and Services
The following table presents fees billed by Deloitte & Touche LLP, the member firms of Deloitte Touche Tohmatsu, and their respective affiliates (collectively, "Deloitte Entities") in each of the last two fiscal years for services rendered to Fidelity Diversified International Fund, Fidelity Emerging Europe, Middle East, Africa (EMEA) Fund, Fidelity Europe Capital Appreciation Fund, Fidelity International Capital Appreciation Fund, Fidelity International Small Cap Fund, Fidelity International Small Cap Opportunities Fund, Fidelity International Value Fund, Fidelity Series Emerging Markets Fund, Fidelity Series International Small Cap Fund, Fidelity Series International Value Fund, Fidelity Total International Equity Fund, and Fidelity Worldwide Fund (the "Funds"):
Services Billed by Deloitte Entities
October 31, 2010 FeesA, B
| Audit Fees | Audit-Related Fees | Tax Fees | All Other Fees |
Fidelity Diversified International Fund | $89,000 | $- | $6,600 | $- |
Fidelity Emerging Europe, Middle East, Africa (EMEA) Fund | $49,000 | $- | $5,800 | $- |
Fidelity Europe Capital Appreciation Fund | $42,000 | $- | $5,600 | $- |
Fidelity International Capital Appreciation Fund | $48,000 | $- | $6,600 | $- |
Fidelity International Small Cap Fund | $118,000 | $- | $6,600 | $- |
Fidelity International Small Cap Opportunities Fund | $48,000 | $- | $5,600 | $- |
Fidelity International Value Fund | $46,000 | $- | $5,600 | $- |
Fidelity Series Emerging Markets Fund | $31,000 | $- | $6,600 | $- |
Fidelity Series International Small Cap Fund | $33,000 | $- | $5,600 | $- |
Fidelity Series International Value Fund | $33,000 | $- | $5,600 | $- |
Fidelity Total International Equity Fund | $58,000 | $- | $6,400 | $- |
Fidelity Worldwide Fund | $49,000 | $- | $5,700 | $- |
October 31, 2009 FeesA, B, C
| Audit Fees | Audit-Related Fees | Tax Fees | All Other Fees |
Fidelity Diversified International Fund | $90,000 | $- | $9,600 | $- |
Fidelity Emerging Europe, Middle East, Africa (EMEA) Fund | $46,000 | $- | $5,800 | $- |
Fidelity Europe Capital Appreciation Fund | $43,000 | $- | $5,600 | $- |
Fidelity International Capital Appreciation Fund | $49,000 | $- | $6,600 | $- |
Fidelity International Small Cap Fund | $120,000 | $- | $6,600 | $- |
Fidelity International Small Cap Opportunities Fund | $49,000 | $- | $5,600 | $- |
Fidelity International Value Fund | $49,000 | $- | $5,600 | $- |
Fidelity Series Emerging Markets Fund | $31,000 | $- | $5,600 | $- |
Fidelity Series International Small Cap Fund | $- | $- | $- | $- |
Fidelity Series International Value Fund | $- | $- | $- | $- |
Fidelity Total International Equity Fund | $59,000 | $- | $6,400 | $- |
Fidelity Worldwide Fund | $50,000 | $- | $5,600 | $- |
A Amounts may reflect rounding.
B Fidelity Series International Small Cap Fund and Fidelity Series International Value Fund commenced operations on December 3, 2009.
C Fidelity Series Emerging Markets Fund commenced operations on December 9, 2008.
The following table presents fees billed by PricewaterhouseCoopers LLP ("PwC") in each of the last two fiscal years for services rendered to Fidelity Canada Fund, Fidelity China Region Fund, Fidelity Emerging Asia Fund, Fidelity Emerging Markets Fund, Fidelity Europe Fund, Fidelity Global Commodity Stock Fund, Fidelity International Discovery Fund, Fidelity International Growth Fund, Fidelity Japan Fund, Fidelity Japan Smaller Companies Fund, Fidelity Latin America Fund, Fidelity Nordic Fund, Fidelity Overseas Fund, Fidelity Pacific Basin Fund and Fidelity Series International Growth Fund (the "Funds"):
Services Billed by PwC
October 31, 2010 FeesA, B
| Audit Fees | Audit-Related Fees | Tax Fees | All Other Fees |
Fidelity Canada Fund | $62,000 | $- | $4,900 | $3,500 |
Fidelity China Region Fund | $57,000 | $- | $4,900 | $2,600 |
Fidelity Emerging Asia Fund | $59,000 | $- | $4,900 | $2,400 |
Fidelity Emerging Markets Fund | $78,000 | $- | $5,100 | $3,700 |
Fidelity Europe Fund | $61,000 | $- | $12,500 | $2,600 |
Fidelity Global Commodity Stock Fund | $35,000 | $- | $2,600 | $1,800 |
Fidelity International Discovery Fund | $80,000 | $- | $9,700 | $6,300 |
Fidelity International Growth Fund | $51,000 | $- | $4,900 | $1,700 |
Fidelity Japan Fund | $58,000 | $- | $4,900 | $2,100 |
Fidelity Japan Smaller Companies Fund | $47,000 | $- | $4,900 | $1,800 |
Fidelity Latin America Fund | $63,000 | $- | $4,900 | $3,600 |
Fidelity Nordic Fund | $47,000 | $- | $4,900 | $1,800 |
Fidelity Overseas Fund | $71,000 | $- | $27,700 | $4,900 |
Fidelity Pacific Basin Fund | $59,000 | $- | $5,100 | $2,000 |
Fidelity Series International Growth Fund | $36,000 | $- | $4,900 | $2,300 |
October 31, 2009 FeesA, B, C
| Audit Fees | Audit-Related Fees | Tax Fees | All Other Fees |
Fidelity Canada Fund | $64,000 | $- | $5,000 | $3,600 |
Fidelity China Region Fund | $59,000 | $- | $5,000 | $2,400 |
Fidelity Emerging Asia Fund | $64,000 | $- | $7,800 | $2,700 |
Fidelity Emerging Markets Fund | $78,000 | $- | $27,800 | $3,400 |
Fidelity Europe Fund | $65,000 | $- | $5,000 | $3,400 |
Fidelity Global Commodity Stock Fund | $32,000 | $- | $2,600 | $1,100 |
Fidelity International Discovery Fund | $83,000 | $- | $8,000 | $7,500 |
Fidelity International Growth Fund | $51,000 | $- | $5,000 | $1,400 |
Fidelity Japan Fund | $62,000 | $- | $5,000 | $2,200 |
Fidelity Japan Smaller Companies Fund | $48,000 | $- | $5,000 | $1,700 |
Fidelity Latin America Fund | $63,000 | $- | $5,000 | $3,600 |
Fidelity Nordic Fund | $47,000 | $- | $5,000 | $1,600 |
Fidelity Overseas Fund | $73,000 | $- | $5,200 | $6,000 |
Fidelity Pacific Basin Fund | $59,000 | $- | $8,400 | $1,800 |
Fidelity Series International Growth Fund | $- | $- | $- | $- |
A Amounts may reflect rounding.
B Fidelity Series International Growth Fund commenced operations on December 3, 2009.
C Fidelity Global Commodity Stock Fund commenced operations on March 25, 2009.
The following table presents fees billed by PwC and Deloitte Entities that were required to be approved by the Audit Committee for services that relate directly to the operations and financial reporting of the Funds and that are rendered on behalf of Fidelity Management & Research Company ("FMR") and entities controlling, controlled by, or under common control with FMR (not including any sub-adviser whose role is primarily portfolio management and is subcontracted with or overseen by another investment adviser) that provide ongoing services to the Funds ("Fund Service Providers"):
Services Billed by Deloitte Entities
| October 31, 2010A | October 31, 2009A |
Audit-Related Fees | $720,000 | $685,000 |
Tax Fees | $- | $2,000 |
All Other Fees | $790,000 | $215,000 |
A Amounts may reflect rounding.
Services Billed by PwC
| October 31, 2010A | October 31, 2009A |
Audit-Related Fees | $2,150,000 | $2,825,000 |
Tax Fees | $- | $2,000 |
All Other Fees | $510,000 | $- |
A Amounts may reflect rounding.
"Audit-Related Fees" represent fees billed for assurance and related services that are reasonably related to the performance of the fund audit or the review of the fund's financial statements and that are not reported under Audit Fees.
"Tax Fees" represent fees billed for tax compliance, tax advice or tax planning that relate directly to the operations and financial reporting of the fund.
"All Other Fees" represent fees billed for assurance services provided to the fund or Fund Service Provider that relate directly to the operations and financial reporting of the fund, excluding those services that are reported under Audit Fees, Audit-Related Fees or Tax Fees.
Assurance services must be performed by an independent public accountant.
* * *
The aggregate non-audit fees billed by PwC and Deloitte Entities for services rendered to the Funds, FMR (not including any sub-adviser whose role is primarily portfolio management and is subcontracted with or overseen by another investment adviser), and any Fund Service Provider for each of the last two fiscal years of the Funds are as follows:
Billed By | October 31, 2010 A | October 31, 2009 A |
PwC | $5,350,000 | $3,595,000 |
Deloitte Entities | $1,670,000 | $1,010,000 |
A Amounts may reflect rounding.
The trust's Audit Committee has considered non-audit services that were not pre-approved that were provided by PwC and Deloitte Entities to Fund Service Providers to be compatible with maintaining the independence of PwC and Deloitte Entities in their audits of the Funds, taking into account representations from PwC and Deloitte Entities, in accordance with Public Company Accounting Oversight Board rules, regarding their independence from the Funds and their related entities and FMR's review of the appropriateness and permissibility under applicable law of such non-audit services prior to their provision to the Fund Service Providers.
Audit Committee Pre-Approval Policies and Procedures
The trust's Audit Committee must pre-approve all audit and non-audit services provided by a fund's independent registered public accounting firm relating to the operations or financial reporting of the fund. Prior to the commencement of any audit or non-audit services to a fund, the Audit Committee reviews the services to determine whether they are appropriate and permissible under applicable law.
The Audit Committee has adopted policies and procedures to, among other purposes, provide a framework for the Committee's consideration of non-audit services by the audit firms that audit the Fidelity funds. The policies and procedures require that any non-audit service provided by a fund audit firm to a Fidelity fund and any non-audit service provided by a fund auditor to a Fund Service Provider that relates directly to the operations and financial reporting of a Fidelity fund ("Covered Service") are subject to approval by the Audit Committee before such service is provided.
All Covered Services must be approved in advance of provision of the service either: (i) by formal resolution of the Audit Committee, or (ii) by oral or written approval of the service by the Chair of the Audit Committee (or if the Chair is unavailable, such other member of the Audit Committee as may be designated by the Chair to act in the Chair's absence). The approval contemplated by (ii) above is permitted where the Treasurer determines that action on such an engagement is necessary before the next meeting of the Audit Committee.
Non-audit services provided by a fund audit firm to a Fund Service Provider that do not relate directly to the operations and financial reporting of a Fidelity fund are reported to the Audit Committee on a periodic basis.
Non-Audit Services Approved Pursuant to Rule 2-01(c)(7)(i)(C) and (ii) of Regulation S-X ("De Minimis Exception")
There were no non-audit services approved or required to be approved by the Audit Committee pursuant to the De Minimis Exception during the Funds' last two fiscal years relating to services provided to (i) the Funds or (ii) any Fund Service Provider that relate directly to the operations and financial reporting of the Funds.
Item 5. Audit Committee of Listed Registrants
Not applicable.
Item 6. Investments
(a) Not applicable.
(b) Not applicable
Item 7. Disclosure of Proxy Voting Policies and Procedures for Closed-End Management Investment Companies
Not applicable.
Item 8. Portfolio Managers of Closed-End Management Investment Companies
Not applicable.
Item 9. Purchase of Equity Securities by Closed-End Management Investment Company and Affiliated Purchasers
Not applicable.
Item 10. Submission of Matters to a Vote of Security Holders
There were no material changes to the procedures by which shareholders may recommend nominees to the trust's Board of Trustees.
Item 11. Controls and Procedures
(a)(i) The President and Treasurer and the Chief Financial Officer have concluded that the trust's disclosure controls and procedures (as defined in Rule 30a-3(c) under the Investment Company Act) provide reasonable assurances that material information relating to the trust is made known to them by the appropriate persons, based on their evaluation of these controls and procedures as of a date within 90 days of the filing date of this report.
(a)(ii) There was no change in the trust's internal control over financial reporting (as defined in Rule 30a-3(d) under the Investment Company Act) that occurred during the second fiscal quarter of the period covered by this report that has materially affected, or is reasonably likely to materially affect, the trust's internal control over financial reporting.
Item 12. Exhibits
(a) | (1) | Code of Ethics pursuant to Item 2 of Form N-CSR is filed and attached hereto as EX-99.CODE ETH. |
(a) | (2) | Certification pursuant to Rule 30a-2(a) under the Investment Company Act of 1940 (17 CFR 270.30a-2(a)) is filed and attached hereto as Exhibit 99.CERT. |
(a) | (3) | Not applicable. |
(b) | | Certification pursuant to Rule 30a-2(b) under the Investment Company Act of 1940 (17 CFR 270.30a-2(b)) is furnished and attached hereto as Exhibit 99.906CERT. |
SIGNATURES
Pursuant to the requirements of the Securities Exchange Act of 1934 and the Investment Company Act of 1940, the registrant has duly caused this report to be signed on its behalf by the undersigned, thereunto duly authorized.
Fidelity Investment Trust
By: | /s/Kenneth B. Robins |
| Kenneth B. Robins |
| President and Treasurer |
| |
Date: | December 28, 2010 |
Pursuant to the requirements of the Securities Exchange Act of 1934 and the Investment Company Act of 1940, this report has been signed below by the following persons on behalf of the registrant and in the capacities and on the dates indicated.
By: | /s/Kenneth B. Robins |
| Kenneth B. Robins |
| President and Treasurer |
| |
Date: | December 28, 2010 |
By: | /s/Christine Reynolds |
| Christine Reynolds |
| Chief Financial Officer |
| |
Date: | December 28, 2010 |