UNITED STATES
SECURITIES AND EXCHANGE COMMISSION
Washington, D.C. 20549
FORM N-CSR
CERTIFIED SHAREHOLDER REPORT OF REGISTERED
MANAGEMENT INVESTMENT COMPANIES
Investment Company Act file number 811-4008
Fidelity Investment Trust
(Exact name of registrant as specified in charter)
82 Devonshire St., Boston, Massachusetts 02109
(Address of principal executive offices) (Zip code)
Eric D. Roiter, Secretary
82 Devonshire St.
Boston, Massachusetts 02109
(Name and address of agent for service)
Registrant's telephone number, including area code: 617-563-7000
Date of fiscal year end: | October 31 |
| |
Date of reporting period: | October 31, 2007 |
Item 1. Reports to Stockholders
Fidelity's
Broadly Diversified International Equity
Funds
Fidelity® Diversified International Fund
Fidelity Aggressive International Fund
Fidelity Overseas Fund
Fidelity Worldwide Fund
Annual Report
October 31, 2007
(2_fidelity_logos) (Registered_Trademark)
Contents
To view a fund's proxy voting guidelines and proxy voting record for the 12-month period ended June 30, visit http://www.fidelity.com (search for "proxy voting guidelines") or visit the Securities and Exchange Commission's (SEC) web site at http://www.sec.gov. You may also call 1-800-544-8544 to request a free copy of the proxy voting guidelines.
Standard & Poor's, S&P and S&P 500 are registered service marks of The McGraw-Hill Companies, Inc. and have been licensed for use by Fidelity Distributors Corporation.
Other third party marks appearing herein are the property of their respective owners.
All other marks appearing herein are registered or unregistered trademarks or service marks of FMR LLC or an affiliated company.
Annual Report
This report and the financial statements contained herein are submitted for the general information of the shareholders of the funds. This report is not authorized for distribution to prospective investors in the funds unless preceded or accompanied by an effective prospectus.
A fund files its complete schedule of portfolio holdings with the SEC for the first and third quarters of each fiscal year on Form N-Q. Forms N-Q are available on the SEC's web site at http://www.sec.gov. A fund's Forms N-Q may be reviewed and copied at the SEC's Public Reference Room in Washington, DC. Information regarding the operation of the SEC's Public Reference Room may be obtained by calling 1-800-SEC-0330. For a complete list of a fund's portfolio holdings, view the most recent holdings listing, semiannual report, or annual report on Fidelity's web site at http://www.fidelity.com or http://www.advisor.fidelity.com, as applicable.
NOT FDIC INSURED · MAY LOSE VALUE · NO BANK GUARANTEE
Neither the funds nor Fidelity Distributors Corporation is a bank.
Annual Report
Chairman's Message
(Photograph of Edward C. Johnson 3d.)
Dear Shareholder:
Many stock and bond markets around the world have been unsettled of late; however, volatility can often lead to opportunity for patient investors. Financial markets are always unpredictable, but there are a number of time-tested principles that can put the historical odds in your favor.
One of the basic tenets is to invest for the long term. Over time, riding out the markets' inevitable ups and downs has proven much more effective than selling into panic or chasing the hottest trend. Even missing only a few of the markets' best days can significantly diminish investor returns. Patience also affords the benefits of compounding - of earning interest on additional income or reinvested dividends and capital gains. There are tax advantages and cost benefits to consider as well. The more you sell, the more taxes you pay, and the more you trade, the higher the costs. While staying the course doesn't eliminate risk, it can considerably lessen the effect of short-term declines.
You can further manage your investing risk through diversification. And today, more than ever, geographic diversification should be taken into account. Studies
indicate that asset allocation is the single most important determinant of a portfolio's long-term success. The right mix of stocks, bonds and cash - - aligned to your particular risk tolerance and investment objective - is very important. Age-appropriate rebalancing is also an essential aspect of asset allocation. For younger investors, an emphasis on equities - which historically have been the best-performing asset class over time - is encouraged. As investors near their specific goal, such as retirement or sending a child to college, consideration may be given to replacing volatile assets (e.g. common stocks) with more-stable fixed investments (bonds or savings plans).
A third investment principle - investing regularly - can help lower the average cost of your purchases. Investing a certain amount of money each month or quarter helps ensure you won't pay for all your shares at market highs. This strategy - known as dollar cost averaging - also reduces unconstructive "emotion" from investing, helping shareholders avoid selling weak performers just prior to an upswing, or chasing a hot performer just before a correction.
We invite you to contact us via the Internet, through our Investor Centers or over the phone. It is our privilege to provide you the information you need to make the investments that are right for you.
Sincerely,
/s/Edward C. Johnson 3d
Edward C. Johnson 3d
Annual Report
Shareholder Expense Example
As a shareholder of a Fund, you incur two types of costs: (1) transaction costs, including redemption fees, and (2) ongoing costs, including management fees and other Fund expenses. This Example is intended to help you understand your ongoing costs (in dollars) of investing in the Funds and to compare these costs with the ongoing costs of investing in other mutual funds.
The Example is based on an investment of $1,000 invested at the beginning of the period and held for the entire period (May 1, 2007 to October 31, 2007).
Actual Expenses
The first line of the accompanying table for each fund provides information about actual account values and actual expenses. You may use the information in this line, together with the amount you invested, to estimate the expenses that you paid over the period. Simply divide your account value by $1,000.00 (for example, an $8,600 account value divided by $1,000.00 = 8.6), then multiply the result by the number in the first line for a fund under the heading entitled "Expenses Paid During Period" to estimate the expenses you paid on your account during this period. A small balance maintenance fee of $12.00 that is charged once a year may apply for certain accounts with a value of less than $2,000. This fee is not included in the table below. If it was, the estimate of expenses you paid during the period would be higher, and your ending account value lower, by this amount. In addition, each Fund, as a shareholder in the underlying Fidelity Central Funds, will indirectly bear its pro rata share of the fees and expenses incurred by the underlying Fidelity Central Funds. These fees and expenses are not included in the Fund's annualized expense ratio used to calculate the expense estimate in the table below.
Hypothetical Example for Comparison Purposes
The second line of the accompanying table for each fund provides information about hypothetical account values and hypothetical expenses based on a fund's actual expense ratio and an assumed rate of return of 5% per year before expenses, which is not the Fund's actual return. The hypothetical account values and expenses may not be used to estimate the actual ending account balance or expenses you paid for the period. You may use this information to compare the ongoing costs of investing in the Fund and other funds. To do so, compare this 5% hypothetical example with the 5% hypothetical examples that appear in the shareholder reports of the other funds. A small balance maintenance fee of $12.00 that is charged once a year may apply for certain accounts with a value of less than $2,000. This fee is not included in the table below. If it was, the estimate of expenses you paid during the period would be higher, and your ending account value lower, by this amount. In addition, each Fund, as a shareholder in the underlying Fidelity Central Funds, will indirectly bear its pro rata share of the fees and expenses incurred by the underlying Fidelity Central Funds. These fees and expenses are not included in the Fund's annualized expense ratio used to calculate the expense estimate in the table below.
Please note that the expenses shown in the table are meant to highlight your ongoing costs only and do not reflect any transaction costs. Therefore, the second line of the table is useful in comparing ongoing costs only, and will not help you determine the relative total costs of owning different funds. In addition, if these transactional costs were included, your costs would have been higher.
| Beginning
Account Value
May 1, 2007 | Ending
Account Value
October 31, 2007 | Expenses Paid
During Period*
May 1, 2007
to October 31, 2007 |
Diversified International | | | |
Actual | $ 1,000.00 | $ 1,133.30 | $ 5.16 |
Hypothetical A | $ 1,000.00 | $ 1,020.37 | $ 4.89 |
Aggressive International | | | |
Actual | $ 1,000.00 | $ 1,068.10 | $ 4.59 |
Hypothetical A | $ 1,000.00 | $ 1,020.77 | $ 4.48 |
Overseas | | | |
Actual | $ 1,000.00 | $ 1,193.60 | $ 5.69 |
Hypothetical A | $ 1,000.00 | $ 1,020.01 | $ 5.24 |
Worldwide | | | |
Actual | $ 1,000.00 | $ 1,160.40 | $ 6.04 |
Hypothetical A | $ 1,000.00 | $ 1,019.61 | $ 5.65 |
A 5% return per year before expenses
* Expenses are equal to each Fund's annualized expense ratio (shown in the table below); multiplied by the average account value over the period, multiplied by 184/365 (to reflect the one-half year period).
| Annualized
Expense Ratio |
Diversified International | .96% |
Aggressive International | .88% |
Overseas | 1.03% |
Worldwide | 1.11% |
Annual Report
Diversified International
Performance: The Bottom Line
Average annual total return reflects the change in the value of an investment, assuming reinvestment of the fund's dividend income and capital gains (the profits earned upon the sale of securities that have grown in value) and assuming a constant rate of performance each year. The $10,000 table and the fund's returns do not reflect the deduction of taxes that a shareholder would pay on fund distributions or the redemption of fund shares. During periods of reimbursement by Fidelity, a fund's total return will be greater than it would be had the reimbursement not occurred. How a fund did yesterday is no guarantee of how it will do tomorrow.
Average Annual Total Returns
Periods ended October 31, 2007 | Past 1
year | Past 5
years | Past 10
years |
Fidelity Diversified International Fund | 30.37% | 25.20% | 14.15% |
$10,000 Over 10 Years
Let's say hypothetically that $10,000 was invested in Fidelity Diversified International Fund on October 31, 1997. The chart shows how the value of your investment would have changed, and also shows how the Morgan Stanley Capital InternationalSM Europe, Australasia, and Far East Index performed over the same period.
Annual Report
Diversified International
Management's Discussion of Fund Performance
Comments from William Bower, Portfolio Manager of Fidelity® Diversified International Fund
Foreign stocks, with a large assist from a weak U.S. dollar, generally had higher returns for U.S. investors than domestic equities during the 12-month period ending October 31, 2007. The backdrop for global stocks was solid, with robust economic growth and relatively high corporate profitability worldwide. Developed international equity markets, as measured by the Morgan Stanley Capital InternationalSM Europe, Australasia, and Far East (MSCI® EAFE®) Index - a performance monitor of established markets outside the United States and Canada - rose 25.09%. In comparison, the Standard & Poor's 500SM Index, a gauge of U.S. stocks, was up 14.56%, while Canada did appreciably better, as measured by the 43.24% advance of the S&P/TSX Composite Index. Among countries making up at least 1% of the EAFE benchmark, Finland had the best showing, soaring nearly 69%, while Hong Kong gained roughly 66%. The United Kingdom and Japan, the two largest components of the index, both underperformed. Fallout from the credit crunch and concerns about export growth tempered U.K. stocks, while Japan struggled with a slowdown in consumer spending and sluggish domestic growth. Emerging markets were the period's big winners, advancing 68.33% as measured by the MSCI Emerging Markets index.
For the 12 months ending October 31, 2007, Fidelity Diversified International Fund returned 30.37%, outperforming the MSCI EAFE index. Favorable security selection in energy, industrials and health care contributed, as did overweighting energy and health care and underweighting financials. Currency fluctuations also helped the fund's performance. Detractors included less-favorable security selection in financials and materials, as well as an underweighting in the latter group. Geographically, stock selection in Europe, South Korea and India bolstered performance, along with underweighting Japan. Underweighting Australia, Hong Kong and Singapore hurt. Contributors included Japanese video game manufacturer Nintendo, Italian automotive firm Fiat, Australian pharmaceutical and biotechnology company CSL, and out-of-benchmark positions in China Mobile and energy firms Canadian Natural Resources and India's Reliance Industries. Japanese diversified financial services provider ORIX, French-American telecommunications equipment manufacturer Alcatel-Lucent and Swiss pharmaceutical firm Roche Holding detracted, as did underweighting German auto company Volkswagen - not held at period end - and Australian metals and minerals firm BHP Billiton.
The views expressed above reflect those of the portfolio manager(s) only through the end of the period as stated on the cover of this report and do not necessarily represent the views of Fidelity or any other person in the Fidelity organization. Any such views are subject to change at any time based upon market or other conditions and Fidelity disclaims any responsibility to update such views. These views may not be relied on as investment advice and, because investment decisions for a Fidelity fund are based on numerous factors, may not be relied on as an indication of trading intent on behalf of any Fidelity fund.
Annual Report
Diversified International
Investment Changes
Geographic Diversification (% of fund's net assets) |
As of October 31, 2007 |
 | Japan | 12.9% | |
 | United Kingdom | 12.8% | |
 | Germany | 10.0% | |
 | France | 9.0% | |
 | Switzerland | 8.5% | |
 | United States of America | 7.1% | |
 | Canada | 6.4% | |
 | Spain | 3.9% | |
 | Australia | 3.8% | |
 | Other | 25.6% | |

Percentages are adjusted for the effect of futures contracts, if applicable. |
|
As of April 30, 2007 |
| Japan | 14.3% | |
| United Kingdom | 14.0% | |
| Switzerland | 10.6% | |
| France | 9.8% | |
| United States of America | 8.7% | |
| Germany | 7.9% | |
| Canada | 5.1% | |
| Italy | 4.0% | |
| Netherlands | 3.8% | |
| Other | 21.8% | |

Percentages are adjusted for the effect of futures contracts, if applicable. |
Asset Allocation |
| % of fund's
net assets | % of fund's net assets
6 months ago |
Stocks | 96.5 | 94.5 |
Short-Term Investments and Net Other Assets | 3.5 | 5.5 |
Top Ten Stocks as of October 31, 2007 |
| % of fund's
net assets | % of fund's net assets
6 months ago |
Vodafone Group PLC sponsored ADR (United Kingdom, Wireless Telecommunication Services) | 2.0 | 1.4 |
Bayer AG (Germany, Chemicals) | 1.7 | 1.5 |
E.ON AG (Germany, Electric Utilities) | 1.6 | 1.0 |
Canadian Natural Resources Ltd. (Canada, Oil, Gas & Consumable Fuels) | 1.5 | 1.1 |
Telefonica SA (Spain, Diversified Telecommunication Services) | 1.5 | 0.6 |
Roche Holding AG (participation certificate) (Switzerland, Pharmaceuticals) | 1.4 | 1.9 |
Nintendo Co. Ltd. (Japan, Software) | 1.4 | 1.1 |
Fiat SpA (Italy, Automobiles) | 1.3 | 1.6 |
Tesco PLC (United Kingdom, Food & Staples Retailing) | 1.3 | 1.6 |
Toyota Motor Corp. sponsored ADR (Japan, Automobiles) | 1.3 | 1.3 |
| 15.0 | |
Market Sectors as of October 31, 2007 |
| % of fund's
net assets | % of fund's net assets
6 months ago |
Financials | 16.4 | 21.1 |
Industrials | 14.3 | 12.9 |
Consumer Discretionary | 10.7 | 11.6 |
Materials | 10.2 | 7.5 |
Information Technology | 9.8 | 8.4 |
Consumer Staples | 8.4 | 9.3 |
Energy | 8.2 | 6.7 |
Telecommunication Services | 6.9 | 4.8 |
Health Care | 6.6 | 8.4 |
Utilities | 5.0 | 3.8 |
Annual Report
Diversified International
Investments October 31, 2007
Showing Percentage of Net Assets
Common Stocks - 96.0% |
| Shares | | Value |
Argentina - 0.1% |
Mercadolibre, Inc. | 807,800 | | $ 36,092,504 |
Australia - 3.8% |
Aristocrat Leisure Ltd. | 3,750,000 | | 36,680,479 |
Babcock & Brown Ltd. | 1,000,000 | | 28,955,463 |
BHP Billiton Ltd. sponsored ADR (d) | 4,876,492 | | 425,522,692 |
Brambles Ltd. | 13,500,000 | | 179,698,905 |
Brambles Ltd. unit | 7,500,000 | | 96,363,968 |
Cochlear Ltd. | 1,300,000 | | 83,592,708 |
Commonwealth Bank of Australia | 1,500,000 | | 86,391,272 |
Computershare Ltd. | 21,000,000 | | 169,324,000 |
CSL Ltd. | 15,900,000 | | 540,537,988 |
Macquarie Bank Ltd. | 750,000 | | 59,899,403 |
National Australia Bank Ltd. | 7,000,000 | | 283,204,872 |
QBE Insurance Group Ltd. | 9,500,000 | | 290,724,389 |
Woodside Petroleum Ltd. | 500,000 | | 24,469,023 |
TOTAL AUSTRALIA | | 2,305,365,162 |
Austria - 0.1% |
Raiffeisen International Bank Holding AG | 541,666 | | 89,541,767 |
Belgium - 0.6% |
Fortis | 1,500,000 | | 47,940,792 |
InBev SA | 2,934,400 | | 277,018,536 |
Nyrstar SA/NV (a) | 2,000,000 | | 57,807,120 |
TOTAL BELGIUM | | 382,766,448 |
Bermuda - 0.2% |
Clear Media Ltd. (a) | 22,443,000 | | 23,816,489 |
Genesis Lease Ltd. ADR | 269,800 | | 5,919,412 |
Ports Design Ltd. | 2,000,000 | | 7,550,425 |
Willis Group Holdings Ltd. | 1,700,000 | | 71,961,000 |
TOTAL BERMUDA | | 109,247,326 |
Brazil - 1.4% |
Banco Nossa Caixa SA | 1,650,000 | | 29,326,340 |
Bovespa Holding SA (a) | 1,320,000 | | 25,139,587 |
Companhia Siderurgica Nacional SA (CSN) sponsored ADR (d) | 139,000 | | 11,106,100 |
Cosan SA Industria E Comercio | 2,000,000 | | 31,269,869 |
Cyrela Brazil Realty SA | 2,600,000 | | 44,588,174 |
Cyrela Commercial Properties SA Empreendimentos e Participações (a) | 520,000 | | 4,042,541 |
Petroleo Brasileiro SA-Petrobras: | | | |
(PN) sponsored ADR (non-vtg.) | 200,000 | | 16,638,000 |
sponsored ADR | 1,300,000 | | 124,319,000 |
Redecard SA | 3,000,000 | | 63,464,540 |
Uniao de Bancos Brasileiros SA (Unibanco) GDR | 2,700,000 | | 426,708,000 |
Vivo Participacoes SA (PN) sponsored ADR (a) | 7,500,000 | | 44,175,000 |
TOTAL BRAZIL | | 820,777,151 |
|
| Shares | | Value |
Canada - 6.4% |
BCE, Inc. | 1,500,000 | | $ 65,531,667 |
Bombardier, Inc. Class B (sub. vtg.) (a) | 2,500,000 | | 14,827,367 |
Brookfield Asset Management, Inc.
Class A | 5,000,000 | | 204,352,891 |
Canadian National Railway Co. | 1,925,000 | | 108,034,050 |
Canadian Natural Resources Ltd. | 10,500,000 | | 873,628,469 |
Canadian Pacific Railway Ltd. | 1,700,000 | | 119,694,980 |
EnCana Corp. | 6,500,000 | | 455,041,305 |
Finning International, Inc. | 500,000 | | 17,210,337 |
Flint Energy Services Ltd. (a)(e) | 2,500,000 | | 64,419,614 |
Lundin Mining Corp. (a) | 865,000 | | 11,726,329 |
Niko Resources Ltd. (e) | 3,900,000 | | 437,004,872 |
OZ Optics Ltd. unit (a)(g) | 102,000 | | 1,504,500 |
Potash Corp. of Saskatchewan, Inc. | 2,200,000 | | 270,204,014 |
Power Corp. of Canada (sub. vtg.) | 3,800,000 | | 163,075,620 |
Research In Motion Ltd. (a) | 700,000 | | 87,157,006 |
Rogers Communications, Inc. Class B (non-vtg.) | 3,000,000 | | 152,954,882 |
Shoppers Drug Mart Corp. | 1,400,000 | | 82,113,959 |
SNC-Lavalin Group, Inc. | 4,300,000 | | 222,787,545 |
Suncor Energy, Inc. | 2,850,000 | | 312,256,408 |
Suramina Resources, Inc. (a) | 500,000 | | 1,006,143 |
Trican Well Service Ltd. | 4,000,000 | | 84,727,812 |
Ultra Petroleum Corp. (a) | 800,000 | | 56,688,000 |
Westernzagros Resources Ltd. | 7,000,000 | | 26,689,261 |
Westernzagros Resources Ltd. warrants 1/18/08 (a) | 700,000 | | 815,505 |
Yamana Gold, Inc. | 1,478,900 | | 22,304,105 |
TOTAL CANADA | | 3,855,756,641 |
Cayman Islands - 0.4% |
Foxconn International Holdings Ltd. (a) | 12,000,000 | | 33,460,871 |
GlobalSantaFe Corp. | 1,200,000 | | 97,236,000 |
Lee & Man Paper Manufacturing Ltd. | 9,000,000 | | 36,003,092 |
Suntech Power Holdings Co. Ltd. sponsored ADR (a) | 1,178,500 | | 69,401,865 |
TOTAL CAYMAN ISLANDS | | 236,101,828 |
China - 0.2% |
China Techfaith Wireless Communication Technology Ltd. sponsored ADR (a)(d) | 1,920,300 | | 13,730,145 |
China Telecom Corp. Ltd. sponsored ADR (d) | 1,000,000 | | 87,880,000 |
Global Bio-Chem Technology Group Co. Ltd. | 47,349,600 | | 17,556,801 |
Shandong Weigao Group Medical Polymer Co. Ltd. (H Shares) | 1,000,000 | | 2,227,467 |
TOTAL CHINA | | 121,394,413 |
Czech Republic - 0.3% |
Ceske Energeticke Zavody AS | 2,700,000 | | 195,164,978 |
Denmark - 0.4% |
DSV de Sammensluttede Vognmaend AS | 2,134,800 | | 56,433,927 |
Common Stocks - continued |
| Shares | | Value |
Denmark - continued |
Novo Nordisk AS Series B | 16,100 | | $ 1,996,598 |
Novozymes AS Series B | 1,800,000 | | 195,931,696 |
William Demant Holding AS (a) | 80,297 | | 7,359,108 |
TOTAL DENMARK | | 261,721,329 |
Egypt - 0.0% |
Orascom Construction Industries SAE GDR | 75,000 | | 13,762,500 |
Finland - 1.3% |
Neste Oil Oyj | 350,000 | | 12,580,655 |
Nokia Corp. sponsored ADR | 18,850,000 | | 748,722,000 |
TOTAL FINLAND | | 761,302,655 |
France - 9.0% |
Accor SA | 1,500,000 | | 143,148,685 |
Alcatel-Lucent SA sponsored ADR | 16,500,000 | | 159,885,000 |
Alstom SA | 1,770,300 | | 417,807,656 |
AXA SA sponsored ADR | 7,000,000 | | 313,110,000 |
bioMerieux SA | 300,000 | | 33,506,398 |
BNP Paribas SA | 1,700,000 | | 187,406,628 |
Bouygues SA | 2,950,000 | | 283,192,591 |
Cap Gemini SA | 2,700,000 | | 172,117,441 |
CNP Assurances | 800,000 | | 101,983,930 |
Compagnie Generale de Geophysique SA (a) | 25,000 | | 8,191,153 |
Dassault Aviation SA (d) | 36,265 | | 40,456,364 |
Electricite de France | 3,849,500 | | 461,732,715 |
Essilor International SA | 2,400,000 | | 152,958,510 |
Financiere Marc de Lacharriere SA (Fimalac) (d) | 1,485,000 | | 117,685,300 |
Groupe Danone | 1,500,000 | | 129,375,000 |
Ipsen SA | 500,000 | | 28,490,652 |
L'Oreal SA | 1,200,000 | | 157,200,000 |
LVMH Moet Hennessy - Louis Vuitton | 1,200,000 | | 154,523,214 |
Michelin SA (Compagnie Generale des Etablissements) Series B | 150,000 | | 20,086,888 |
Neopost SA | 1,275,000 | | 148,091,628 |
Nexans SA | 600,406 | | 102,026,843 |
Pernod Ricard SA | 1,100,000 | | 254,191,962 |
Pinault Printemps-Redoute SA | 600,000 | | 118,934,890 |
Renault SA | 1,422,700 | | 238,893,981 |
Sanofi-Aventis sponsored ADR | 1,400,000 | | 61,614,000 |
Societe Generale Series A | 1,600,000 | | 269,600,000 |
Sodexho Alliance SA | 1,099,696 | | 79,295,534 |
Suez SA (France) | 1,769,900 | | 115,043,500 |
Total SA: | | | |
Series B | 63,800 | | 5,142,918 |
sponsored ADR | 500,000 | | 40,305,000 |
Vallourec SA | 200,000 | | 57,969,386 |
|
| Shares | | Value |
Veolia Environnement | 3,857,041 | | $ 344,505,196 |
Vinci SA | 5,500,000 | | 451,170,811 |
TOTAL FRANCE | | 5,369,643,774 |
Germany - 9.8% |
Adidas-Salomon AG | 1,649,600 | | 110,056,760 |
Allianz AG: | | | |
(Reg.) | 16,060 | | 3,629,560 |
sponsored ADR | 22,000,000 | | 497,200,000 |
BASF AG | 217,500 | | 30,254,250 |
Bayer AG | 12,576,710 | | 1,036,320,903 |
Bayerische Motoren Werke AG (BMW) | 2,650,000 | | 177,491,765 |
Celesio AG | 125,516 | | 7,119,333 |
Continental AG | 1,054,923 | | 159,546,800 |
DaimlerChrysler AG | 3,928,300 | | 432,702,245 |
Deutsche Boerse AG | 750,000 | | 118,330,741 |
Deutsche Postbank AG | 500,000 | | 36,553,224 |
E.ON AG | 38,480 | | 7,515,144 |
E.ON AG sponsored ADR | 15,000,000 | | 976,500,000 |
Fresenius AG | 2,300,000 | | 179,074,579 |
GEA Group AG (a) | 3,500,000 | | 131,333,721 |
Gerresheimer AG | 1,000,000 | | 55,054,400 |
GFK AG | 1,600,000 | | 64,581,709 |
Henkel KGaA | 1,000,000 | | 46,361,600 |
Hochtief AG | 276,900 | | 38,235,772 |
K&S AG | 870,400 | | 181,980,037 |
Linde AG | 3,039,086 | | 384,560,450 |
MAN AG | 900,000 | | 160,642,945 |
MTU Aero Engines Holding AG | 500,000 | | 30,526,216 |
Muenchener Rueckversicherungs-Gesellschaft AG (Reg.) | 1,300,000 | | 249,405,126 |
Praktiker Bau- und Heimwerkermaerkte Holding AG | 19,600 | | 708,776 |
Q-Cells AG (a) | 900,000 | | 114,614,569 |
Siemens AG: | | | |
(Reg.) | 23,400 | | 3,191,058 |
sponsored ADR | 4,600,000 | | 627,302,000 |
Thyssenkrupp AG | 28,700 | | 1,912,706 |
Wacker Chemie AG | 100,000 | | 24,557,160 |
TOTAL GERMANY | | 5,887,263,549 |
Greece - 0.1% |
Coca-Cola Hellenic Bottling Co. SA: | | | |
(Bearer) | 250,000 | | 15,516,648 |
sponsored ADR | 584,000 | | 36,406,560 |
National Bank of Greece SA | 500,000 | | 34,756,712 |
TOTAL GREECE | | 86,679,920 |
Common Stocks - continued |
| Shares | | Value |
Hong Kong - 1.4% |
China Mobile (Hong Kong) Ltd. sponsored ADR | 4,550,000 | | $ 471,744,000 |
Cosco Pacific Ltd. | 9,000,000 | | 28,045,935 |
Esprit Holdings Ltd. | 11,810,000 | | 197,239,995 |
Hutchison Whampoa Ltd. | 5,000,000 | | 63,000,000 |
Sun Hung Kai Properties Ltd. | 2,500,000 | | 47,776,762 |
Techtronic Industries Co. Ltd. | 10,983,000 | | 11,869,088 |
TOTAL HONG KONG | | 819,675,780 |
India - 3.1% |
Bajaj Auto Ltd. | 800,000 | | 50,898,462 |
Bharti Airtel Ltd. (a) | 5,000,000 | | 129,176,391 |
HDFC Bank Ltd. | 100,000 | | 4,352,562 |
Infosys Technologies Ltd. | 6,600,000 | | 313,194,260 |
Infosys Technologies Ltd. sponsored ADR | 1,610,000 | | 82,013,400 |
Reliance Energy Ltd. | 2,000,000 | | 96,017,510 |
Reliance Industries Ltd. | 8,550,000 | | 610,300,081 |
Satyam Computer Services Ltd. | 18,000,000 | | 221,239,390 |
State Bank of India | 4,000,000 | | 250,978,963 |
Tata Consultancy Services Ltd. | 3,400,000 | | 90,656,437 |
TOTAL INDIA | | 1,848,827,456 |
Ireland - 1.0% |
CRH PLC | 4,250,000 | | 162,185,917 |
IAWS Group PLC (Ireland) | 4,000,000 | | 94,172,001 |
Ryanair Holdings PLC sponsored ADR (a) | 5,900,000 | | 290,221,000 |
Smurfit Kappa Group plc | 3,199,558 | | 64,387,368 |
TOTAL IRELAND | | 610,966,286 |
Italy - 3.1% |
AEM SpA | 12,000,000 | | 50,487,783 |
ASM SpA | 2,000,000 | | 14,015,691 |
Enel SpA ADR (d) | 71,000 | | 4,267,100 |
Fiat SpA (d) | 23,406,012 | | 755,189,739 |
Impregilo SpA (a) | 2,000,000 | | 16,023,728 |
Intesa Sanpaolo SpA | 48,478,464 | | 383,275,664 |
Prysmian SpA | 1,682,100 | | 48,328,672 |
Saipem SpA | 35,300 | | 1,560,873 |
Unicredito Italiano SpA | 68,916,600 | | 589,093,587 |
TOTAL ITALY | | 1,862,242,837 |
Japan - 12.9% |
ABC-Mart, Inc. | 200,000 | | 4,119,121 |
Aeon Co. Ltd. | 4,000,000 | | 62,979,226 |
Asahi Glass Co. Ltd. | 2,000,000 | | 27,549,451 |
Canon, Inc. sponsored ADR | 8,890,000 | | 449,567,300 |
Chugai Pharmaceutical Co. Ltd. | 5,000,000 | | 86,629,718 |
Daiwa Securities Group, Inc. | 4,000,000 | | 38,556,551 |
Fanuc Ltd. | 2,100,000 | | 230,250,943 |
Hirose Electric Co. Ltd. | 650,000 | | 77,964,219 |
|
| Shares | | Value |
Hitachi Ltd. | 4,000,000 | | $ 26,544,000 |
Honda Motor Co. Ltd. sponsored ADR | 6,050,000 | | 226,451,500 |
Hoya Corp. | 2,299,500 | | 83,751,873 |
Ibiden Co. Ltd. | 900,000 | | 76,305,092 |
Japan Tobacco, Inc. | 85,000 | | 495,542,337 |
JSR Corp. | 4,500,000 | | 116,871,537 |
Kawasaki Kisen Kaisha Ltd. | 7,000,000 | | 97,182,826 |
Keyence Corp. | 920,000 | | 212,060,885 |
Komatsu Ltd. | 4,300,000 | | 144,195,882 |
Konica Minolta Holdings, Inc. | 5,000,000 | | 87,546,870 |
Kubota Corp. | 22,000,000 | | 184,738,215 |
Leopalace21 Corp. | 250,000 | | 7,982,457 |
Mitsubishi Corp. | 1,000,000 | | 31,142,133 |
Mitsubishi Estate Co. Ltd. | 7,000,000 | | 209,893,442 |
Mitsui & Co. Ltd. | 18,000,000 | | 466,986,325 |
Mitsui Fudosan Co. Ltd. | 4,700,000 | | 130,048,884 |
Mitsui O.S.K. Lines Ltd. | 5,000,000 | | 82,655,567 |
Mizuho Financial Group, Inc. | 5,000 | | 28,108,318 |
Mori Seiki Co. Ltd. | 900,000 | | 22,865,516 |
Murata Manufacturing Co. Ltd. | 2,600,000 | | 158,262,556 |
NGK Insulators Ltd. | 1,200,000 | | 42,550,505 |
Nidec Corp. | 400,000 | | 30,061,481 |
Nikon Corp. | 1,500,000 | | 48,148,068 |
Nintendo Co. Ltd. | 1,350,000 | | 847,799,993 |
Nippon Electric Glass Co. Ltd. | 3,750,000 | | 63,751,133 |
Nomura Holdings, Inc. | 5,000,000 | | 89,149,999 |
ORIX Corp. | 2,150,000 | | 441,117,146 |
Ricoh Co. Ltd. | 1,000,000 | | 19,769,836 |
Shin-Etsu Chemical Co. Ltd. | 4,300,000 | | 275,887,837 |
Sony Corp. | 2,500,000 | | 123,649,999 |
Sony Financial Holdings, Inc. | 28,879 | | 103,908,314 |
Stanley Electric Co. Ltd. | 1,500,000 | | 33,365,913 |
Sumco Corp. | 2,700,000 | | 98,563,790 |
Sumitomo Metal Industries Ltd. | 10,000,000 | | 49,506,834 |
Sumitomo Mitsui Financial Group, Inc. | 21,550 | | 176,561,305 |
Sumitomo Trust & Banking Co. Ltd. | 9,000,000 | | 67,118,565 |
T&D Holdings, Inc. | 1,700,000 | | 102,338,670 |
Takeda Pharmaceutical Co. Ltd. | 3,500,000 | | 218,673,073 |
Teijin Ltd. | 2,500,000 | | 12,065,334 |
Tokai Carbon Co. Ltd. | 2,500,000 | | 31,358,426 |
Tokuyama Corp. | 5,000,000 | | 69,853,581 |
Tokyo Tatemono Co. Ltd. | 2,000,000 | | 25,735,889 |
Toshiba Corp. (d) | 15,000,000 | | 127,051,709 |
Toyota Motor Corp. sponsored ADR | 6,550,000 | | 749,582,000 |
TOTAL JAPAN | | 7,714,322,144 |
Korea (South) - 2.1% |
Amorepacific Corp. | 165,751 | | 158,375,001 |
Kookmin Bank sponsored ADR | 1,300,000 | | 106,197,000 |
Korean Reinsurance Co. | 1,100,460 | | 19,631,798 |
LG Household & Health Care Ltd. | 519,530 | | 115,832,023 |
NHN Corp. (a) | 1,000,000 | | 321,578,165 |
Common Stocks - continued |
| Shares | | Value |
Korea (South) - continued |
Samsung Fire & Marine Insurance Co. Ltd. | 400,000 | | $ 111,292,118 |
Shinhan Financial Group Co. Ltd. | 3,000,000 | | 196,455,024 |
SK Energy Co. Ltd. | 639,000 | | 146,872,103 |
SK Holdings Co. Ltd. | 261,000 | | 78,406,900 |
TOTAL KOREA (SOUTH) | | 1,254,640,132 |
Luxembourg - 1.0% |
ArcelorMittal SA | 58,900 | | 4,727,521 |
ArcelorMittal SA (NY Shares) Class A | 5,000,000 | | 399,750,000 |
SES SA FDR (France) unit | 6,916,322 | | 170,747,060 |
TOTAL LUXEMBOURG | | 575,224,581 |
Malaysia - 0.1% |
DiGi.com Bhd | 5,000,000 | | 37,660,371 |
KNM Group Bhd | 2,500,000 | | 4,425,145 |
Public Bank BHD | 1,000,000 | | 3,345,307 |
TOTAL MALAYSIA | | 45,430,823 |
Mexico - 1.0% |
America Movil SAB de CV Series L sponsored ADR | 7,450,000 | | 487,155,500 |
Fomento Economico Mexicano SA de CV sponsored ADR | 1,200,000 | | 42,732,000 |
Grupo Televisa SA de CV (CPO) sponsored ADR | 2,000,000 | | 49,700,000 |
TOTAL MEXICO | | 579,587,500 |
Netherlands - 2.4% |
Chicago Bridge & Iron Co. NV (NY Shares) | 2,000,000 | | 100,000,000 |
CNH Global NV | 700,000 | | 45,906,000 |
Fugro NV (Certificaten Van Aandelen) unit | 100,000 | | 8,765,240 |
Heineken NV (Bearer) | 2,000,000 | | 139,600,000 |
ING Groep NV sponsored ADR | 5,800,000 | | 260,942,000 |
Koninklijke Numico NV | 5,000,000 | | 398,420,002 |
Koninklijke Philips Electronics NV (NY Shares) | 5,800,000 | | 239,772,000 |
Nutreco Holding NV | 32,300 | | 2,206,443 |
OPG Groep NV (A Shares)(Certificaten Van Aandelen) unit | 2,094,400 | | 72,491,021 |
Reed Elsevier NV sponsored ADR | 3,950,000 | | 153,813,000 |
TOTAL NETHERLANDS | | 1,421,915,706 |
Netherlands Antilles - 0.7% |
Schlumberger Ltd. (NY Shares) | 4,100,000 | | 395,937,000 |
Norway - 0.6% |
Marine Harvest ASA (a) | 50,000,000 | | 50,684,804 |
Orkla ASA (A Shares) | 2,500,000 | | 46,445,542 |
Petroleum Geo-Services ASA | 300,000 | | 8,832,572 |
Pronova BioPharma ASA | 12,999,500 | | 59,831,855 |
|
| Shares | | Value |
Renewable Energy Corp. AS (a) | 2,300,000 | | $ 117,217,926 |
StatoilHydro ASA sponsored ADR | 69,000 | | 2,351,520 |
Telenor ASA | 3,000,000 | | 70,400,000 |
TOTAL NORWAY | | 355,764,219 |
Panama - 0.1% |
McDermott International, Inc. (a) | 1,200,000 | | 73,272,000 |
Papua New Guinea - 0.2% |
Lihir Gold Ltd. (a) | 31,000,000 | | 123,073,698 |
Russia - 0.5% |
JSC MMC 'Norilsk Nickel' sponsored ADR | 500,800 | | 157,752,000 |
Magma OJSC sponsored GDR ADR (f) | 1,900,000 | | 32,300,000 |
OAO Gazprom sponsored ADR | 2,000,000 | | 100,500,000 |
Rostelecom sponsored ADR (d) | 91,000 | | 5,432,700 |
Sberbank (Savings Bank of the Russian Federation) GDR | 60,000 | | 30,381,336 |
TOTAL RUSSIA | | 326,366,036 |
Singapore - 0.1% |
DBS Group Holdings Ltd. | 5,000,000 | | 78,258,916 |
South Africa - 0.8% |
Bidvest Group Ltd. | 200,000 | | 4,197,569 |
Gold Fields Ltd. sponsored ADR | 11,000,000 | | 198,770,000 |
Highveld Steel & Vanadium Corp. Ltd. ADR | 378,000 | | 6,365,520 |
Impala Platinum Holdings Ltd. | 5,600,000 | | 210,247,730 |
Kumba Iron Ore Ltd. | 53,000 | | 2,071,396 |
Mondi Ltd. unit | 590,000 | | 5,802,005 |
MTN Group Ltd. | 1,000,000 | | 19,426,066 |
Sasol Ltd. sponsored ADR | 54,000 | | 2,746,440 |
TOTAL SOUTH AFRICA | | 449,626,726 |
Spain - 3.9% |
Actividades de Construccion y Servicios SA (ACS) | 2,700,000 | | 167,071,271 |
Banco Bilbao Vizcaya Argentaria SA sponsored ADR | 13,000,000 | | 328,120,000 |
Banco Santander SA sponsored ADR | 9,000,000 | | 195,390,000 |
Enagas SA | 4,319,649 | | 122,662,827 |
Grupo Acciona SA | 87,600 | | 27,032,870 |
Inditex SA | 7,150,000 | | 531,930,545 |
Red Electrica de Espana SA | 1,700,000 | | 95,439,701 |
Telefonica SA | 11,096,100 | | 367,835,715 |
Telefonica SA sponsored ADR | 5,150,000 | | 512,167,500 |
TOTAL SPAIN | | 2,347,650,429 |
Sweden - 1.5% |
AB Volvo sponsored ADR | 265,000 | | 5,207,250 |
Assa Abloy AB (B Shares) | 9,308,800 | | 194,856,644 |
Modern Times Group MTG AB (B Shares) | 1,000,800 | | 70,329,679 |
Scania AB (B Shares) | 6,462,000 | | 176,455,952 |
Common Stocks - continued |
| Shares | | Value |
Sweden - continued |
Skandinaviska Enskilda Banken AB (A Shares) | 2,000,000 | | $ 61,223,687 |
SSAB Svenskt Stal AB (B Shares) | 456,100 | | 13,423,679 |
Svenska Cellulosa AB (SCA) (B Shares) | 12,500,000 | | 220,342,318 |
Telefonaktiebolaget LM Ericsson (B Shares) sponsored ADR (d) | 6,000,000 | | 180,300,000 |
TOTAL SWEDEN | | 922,139,209 |
Switzerland - 8.5% |
ABB Ltd. (Reg.) | 22,144,547 | | 666,076,161 |
Actelion Ltd. (Reg.) (a) | 4,600,000 | | 228,550,462 |
Alcon, Inc. | 1,250,000 | | 190,262,500 |
Barry Callebaut AG | 13,000 | | 10,432,099 |
Compagnie Financiere Richemont unit | 2,840,374 | | 202,673,669 |
Credit Suisse Group (Reg.) | 400,000 | | 27,080,000 |
Julius Baer Holding AG (Bearer) | 4,500,000 | | 389,277,389 |
Kuehne & Nagel International AG | 1,200,000 | | 128,671,329 |
Lonza Group AG | 26,560 | | 3,093,278 |
Nestle SA (Reg.) | 1,541,976 | | 712,392,912 |
Nobel Biocare Holding AG (Switzerland) | 50,000 | | 14,547,181 |
Novartis AG sponsored ADR | 3,100,000 | | 164,827,000 |
Roche Holding AG (participation certificate) | 5,027,164 | | 859,142,328 |
Schindler Holding AG (Reg.) | 1,400,000 | | 96,572,563 |
SGS Societe Generale de Surveillance Holding SA (Reg.) | 212,647 | | 278,682,678 |
Sika AG (Bearer) | 723 | | 1,429,397 |
Sonova Holding AG | 935,825 | | 105,030,864 |
Sulzer AG (Reg.) | 80,000 | | 128,325,995 |
Swiss Life Holding | 393,358 | | 108,671,812 |
Swiss Reinsurance Co. (Reg.) | 1,100,352 | | 103,261,903 |
Syngenta AG sponsored ADR | 1,000,000 | | 48,470,000 |
Tecan Group AG (e) | 1,100,000 | | 73,599,240 |
The Swatch Group AG (Reg.) | 2,000,000 | | 125,615,126 |
UBS AG (NY Shares) | 4,625,000 | | 248,316,250 |
Zurich Financial Services AG (Reg.) | 506,457 | | 152,488,025 |
TOTAL SWITZERLAND | | 5,067,490,161 |
Taiwan - 0.4% |
Foxconn Technology Co. Ltd. | 4,500,000 | | 54,175,027 |
Hon Hai Precision Industry Co. Ltd. (Foxconn) | 10,000,000 | | 75,937,644 |
Siliconware Precision Industries Co. Ltd. | 20,837,136 | | 43,931,976 |
Siliconware Precision Industries Co. Ltd. sponsored ADR | 2,957,213 | | 34,244,527 |
Taiwan Mobile Co. Ltd. | 7,543,000 | | 10,105,454 |
TOTAL TAIWAN | | 218,394,628 |
Turkey - 0.1% |
Acibadem Saglik Hizmetleri AS | 4,574,044 | | 33,931,204 |
United Kingdom - 12.8% |
Anglo American PLC (United Kingdom) | 6,209,000 | | 427,798,346 |
Autonomy Corp. PLC (a) | 2,500,000 | | 51,066,666 |
|
| Shares | | Value |
BAE Systems PLC | 16,000,000 | | $ 165,658,705 |
Barclays PLC | 2,000,000 | | 25,425,000 |
BG Group PLC | 5,218,200 | | 96,275,840 |
BG Group PLC sponsored ADR | 27,000 | | 2,490,750 |
BHP Billiton PLC | 4,000,000 | | 152,269,623 |
British Airways PLC (a) | 3,000,000 | | 27,770,911 |
British American Tobacco PLC | 112,900 | | 4,328,586 |
British American Tobacco PLC sponsored ADR | 4,830,000 | | 370,364,400 |
Bunzl PLC ADR | 67,000 | | 5,028,350 |
Burberry Group PLC | 7,000,000 | | 89,503,103 |
Cadbury Schweppes PLC sponsored ADR | 41,000 | | 2,182,840 |
Capita Group PLC | 19,806,451 | | 308,427,731 |
Diageo PLC sponsored ADR | 23,000 | | 2,110,250 |
easyJet PLC (a) | 9,000,351 | | 124,061,753 |
European Capital Ltd. (e) | 5,819,600 | | 69,643,666 |
Experian Group Ltd. | 10,000,000 | | 104,888,073 |
HSBC Holdings PLC sponsored ADR | 3,200,000 | | 318,464,000 |
Imperial Tobacco Group PLC sponsored ADR | 131,500 | | 13,365,660 |
Informa PLC | 16,000,000 | | 177,966,681 |
International Power PLC | 21,415,800 | | 217,724,899 |
International Power PLC sponsored ADR | 90,000 | | 8,905,500 |
Invensys PLC (a) | 2,000,000 | | 13,596,987 |
Investec PLC | 2,000,000 | | 24,158,561 |
Johnson Matthey PLC | 1,000,000 | | 37,111,043 |
KKR Private Equity Investors, LP | 1,000,557 | | 19,811,029 |
Man Group plc | 16,000,000 | | 195,597,025 |
Mondi PLC | 75,000 | | 695,052 |
National Grid PLC | 14,310,800 | | 238,469,245 |
Next PLC | 2,500,000 | | 114,763,561 |
Pearson PLC | 8,100,000 | | 134,301,433 |
Pearson PLC sponsored ADR | 300,000 | | 5,049,000 |
Reckitt Benckiser Group PLC | 10,437,400 | | 605,209,559 |
Reed Elsevier PLC sponsored ADR | 39,000 | | 2,054,130 |
Rexam PLC sponsored ADR | 34,000 | | 1,913,860 |
Rolls-Royce Group PLC | 20,572,790 | | 230,112,603 |
Royal Bank of Scotland Group PLC | 39,500,000 | | 424,162,586 |
Royal Dutch Shell PLC Class A sponsored ADR | 347,800 | | 30,435,978 |
Serco Group PLC | 2,000,000 | | 18,742,636 |
Shire PLC sponsored ADR | 2,650,000 | | 199,147,500 |
Smith & Nephew PLC | 7,300,000 | | 98,944,200 |
Standard Chartered PLC (United Kingdom) | 3,000,300 | | 116,396,858 |
Tesco PLC | 73,421,400 | | 752,569,911 |
United Utilities PLC sponsored ADR | 170,000 | | 5,100,000 |
Vodafone Group PLC sponsored ADR | 30,700,000 | | 1,205,588,994 |
Wolseley PLC ADR | 170,000 | | 2,973,300 |
Common Stocks - continued |
| Shares | | Value |
United Kingdom - continued |
WPP Group plc | 3,500,000 | | $ 48,160,000 |
Xstrata PLC | 5,350,000 | | 383,406,969 |
TOTAL UNITED KINGDOM | | 7,674,193,353 |
United States of America - 3.6% |
Autoliv, Inc. | 900,000 | | 56,862,000 |
Becton, Dickinson & Co. | 700,000 | | 58,422,000 |
C.R. Bard, Inc. | 1,000,000 | | 83,610,000 |
Cabela's, Inc. Class A (a)(d) | 500,000 | | 9,760,000 |
Cerner Corp. (a) | 200,000 | | 11,912,000 |
Flowserve Corp. | 2,050,000 | | 161,868,000 |
Google, Inc. Class A (sub. vtg.) (a) | 482,645 | | 341,230,015 |
Henry Schein, Inc. (a) | 1,050,000 | | 62,895,000 |
Ingersoll-Rand Co. Ltd. Class A | 750,000 | | 37,762,500 |
Marathon Oil Corp. | 3,535,316 | | 209,043,235 |
NII Holdings, Inc. (a) | 993,500 | | 57,623,000 |
Peabody Energy Corp. | 1,409,700 | | 78,590,775 |
RTI International Metals, Inc. (a) | 800,000 | | 62,544,000 |
Synthes, Inc. | 2,050,000 | | 255,918,156 |
Titanium Metals Corp. (a) | 4,181,500 | | 147,188,800 |
Transocean, Inc. (a) | 1,550,000 | | 185,023,500 |
United Technologies Corp. | 100,000 | | 7,659,000 |
Valero Energy Corp. | 5,000,000 | | 352,150,000 |
TOTAL UNITED STATES OF AMERICA | | 2,180,061,981 |
TOTAL COMMON STOCKS (Cost $37,179,006,965) | 57,511,574,750 |
Preferred Stocks - 0.5% |
| | | |
Convertible Preferred Stocks - 0.0% |
Canada - 0.0% |
MetroPhotonics, Inc. Series 2 (a)(g) | 198,000 | | 2 |
Nonconvertible Preferred Stocks - 0.5% |
Germany - 0.2% |
Porsche AG | 46,046 | | 122,683,682 |
Italy - 0.3% |
Intesa Sanpaolo SpA | 20,359,700 | | 154,535,483 |
|
| Shares | | Value |
United Kingdom - 0.0% |
Rolls-Royce Group PLC B Shares (a) | 831,140,716 | | $ 1,727,983 |
Rolls-Royce Group PLC B Shares | 3,793 | | 9 |
TOTAL UNITED KINGDOM | | 1,727,992 |
TOTAL NONCONVERTIBLE PREFERRED STOCKS | | 278,947,157 |
TOTAL PREFERRED STOCKS (Cost $165,264,107) | 278,947,159 |
Money Market Funds - 3.9% |
| | | |
Fidelity Cash Central Fund, 4.97% (b) | 1,911,976,678 | | 1,911,976,678 |
Fidelity Securities Lending Cash Central Fund, 5.02% (b)(c) | 454,526,602 | | 454,526,602 |
TOTAL MONEY MARKET FUNDS (Cost $2,366,503,280) | 2,366,503,280 |
TOTAL INVESTMENT PORTFOLIO - 100.4% (Cost $39,710,774,352) | | 60,157,025,189 |
NET OTHER ASSETS - (0.4)% | | (227,082,961) |
NET ASSETS - 100% | $ 59,929,942,228 |
Forward Foreign Currency Contracts |
| Settlement Dates | | Value | | Unrealized Appreciation/
(Depreciation) |
Contracts to Buy |
146,093,639 EUR | Nov. 2007 | | $ 211,767,403 | | $ 11,767,403 |
99,443,119 GBP | Nov. 2007 | | 206,549,770 | | 6,549,770 |
45,428,200,000 JPY | Nov. 2007 | | 395,267,134 | | (4,732,866) |
| | $ 813,584,307 | | $ 13,584,307 |
|
(Payable Amount $800,000,000) |
|
The value of contracts to buy as a percentage of net assets - 1.4% |
Currency Abbreviations |
EUR | - | European Monetary Unit |
GBP | - | British pound |
JPY | - | Japanese yen |
Legend |
(a) Non-income producing |
(b) Affiliated fund that is available only to investment companies and other accounts managed by Fidelity Investments. The rate quoted is the annualized seven-day yield of the fund at period end. A complete unaudited listing of the fund's holdings as of its most recent quarter end is available upon request. |
(c) Investment made with cash collateral received from securities on loan. |
(d) Security or a portion of the security is on loan at period end. |
(e) Affiliated company |
(f) Security exempt from registration under Rule 144A of the Securities Act of 1933. These securities may be resold in transactions exempt from registration, normally to qualified institutional buyers. At the end of the period, the value of these securities amounted to $32,300,000 or 0.1% of net assets. |
(g) Restricted securities - Investment in securities not registered under the Securities Act of 1933 (excluding 144A issues). At the end of the period, the value of restricted securities (excluding 144A issues) amounted to $1,504,502 or 0.0% of net assets. |
Additional information on each holding is as follows: |
Security | Acquisition Date | Acquisition Cost |
MetroPhotonics, Inc. Series 2 | 9/29/00 | $ 1,980,000 |
OZ Optics Ltd. unit | 8/18/00 | $ 1,505,520 |
Affiliated Central Funds |
Information regarding fiscal year to date income earned by the Fund from investments in Fidelity Central Funds is as follows: |
Fund | Income earned |
Fidelity Cash Central Fund | $ 118,954,712 |
Fidelity Securities Lending Cash Central Fund | 35,690,016 |
Total | $ 154,644,728 |
Other Affiliated Issuers |
An affiliated company is a company in which the fund has ownership of at least 5% of the voting securities. Fiscal year to date transactions with companies which are or were affiliates are as follows: |
Affiliates | Value, beginning of period | Purchases | Sales
Proceeds | Dividend
Income | Value, end of period |
Acibadem Saglik Hizmetleri AS | $ 26,724,309 | $ 4,072,561 | $ 4,091,431 | $ 66,139 | $ - |
Clear Media Ltd. | 37,841,382 | - | 4,919,112 | - | - |
European Capital Ltd. | - | 12,301,478 | - | 1,853,580 | 69,643,666 |
Flint Energy Services Ltd. | 51,218,100 | 19,052,360 | 4,273,244 | - | 64,419,614 |
Ipsos SA | 84,893,943 | - | 79,324,351 | 648,298 | - |
Neopost SA | 201,760,549 | - | 52,710,138 | 5,798,567 | - |
Niko Resources Ltd. | 121,141,941 | 151,128,439 | - | 298,064 | 437,004,872 |
RTI International Metals, Inc. | 73,584,000 | 59,030,307 | 97,908,672 | - | - |
Tecan Group AG | 42,888,719 | 21,186,706 | - | 741,241 | 73,599,240 |
Techem AG | 127,767,640 | - | 144,513,953 | - | - |
Total | $ 767,820,583 | $ 266,771,851 | $ 387,740,901 | $ 9,405,889 | $ 644,667,392 |
See accompanying notes which are an integral part of the financial statements.
Annual Report
Diversified International
Financial Statements
Statement of Assets and Liabilities
| October 31, 2007 |
| | |
Assets | | |
Investment in securities, at value (including securities loaned of $456,582,447) - See accompanying schedule: Unaffiliated issuers (cost $36,891,602,305) | $ 57,145,854,517 | |
Fidelity Central Funds (cost $2,366,503,280) | 2,366,503,280 | |
Other affiliated issuers (cost $452,668,767) | 644,667,392 | |
Total Investments (cost $39,710,774,352) | | $ 60,157,025,189 |
Cash | | 145,166,431 |
Receivable for investments sold | | 289,969,003 |
Unrealized appreciation on foreign currency contracts | | 18,317,173 |
Receivable for fund shares sold | | 93,352,674 |
Dividends receivable | | 55,445,340 |
Distributions receivable from Fidelity Central Funds | | 7,647,850 |
Prepaid expenses | | 17,879 |
Other receivables | | 2,295,209 |
Total assets | | 60,769,236,748 |
| | |
Liabilities | | |
Payable for investments purchased | $ 216,387,999 | |
Unrealized depreciation on foreign currency contracts | 4,732,866 | |
Payable for fund shares redeemed | 100,906,111 | |
Accrued management fee | 37,487,243 | |
Other affiliated payables | 9,351,458 | |
Other payables and accrued expenses | 15,902,241 | |
Collateral on securities loaned, at value | 454,526,602 | |
Total liabilities | | 839,294,520 |
| | |
Net Assets | | $ 59,929,942,228 |
Net Assets consist of: | | |
Paid in capital | | $ 35,300,807,882 |
Undistributed net investment income | | 604,543,864 |
Accumulated undistributed net realized gain (loss) on investments and foreign currency transactions | | 3,576,929,259 |
Net unrealized appreciation (depreciation) on investments and assets and liabilities in foreign currencies | | 20,447,661,223 |
Net Assets, for 1,319,718,440 shares outstanding | | $ 59,929,942,228 |
Net Asset Value, offering price and redemption price per share ($59,929,942,228 ÷ 1,319,718,440 shares) | | $ 45.41 |
Statement of Operations
| Year ended October 31, 2007 |
| | |
Investment Income | | |
Dividends (including $9,405,889 earned from other affiliated issuers) | | $ 1,003,072,583 |
Interest | | 9,196,302 |
Income from Fidelity Central Funds | | 154,644,728 |
| | 1,166,913,613 |
Less foreign taxes withheld | | (93,306,069) |
Total income | | 1,073,607,544 |
| | |
Expenses | | |
Management fee
Basic fee | $ 360,918,979 | |
Performance adjustment | (5,990,141) | |
Transfer agent fees | 104,277,885 | |
Accounting and security lending fees | 3,079,782 | |
Custodian fees and expenses | 9,618,144 | |
Independent trustees' compensation | 169,047 | |
Appreciation in deferred trustee compensation account | 216 | |
Registration fees | 541,983 | |
Audit | 372,958 | |
Legal | 448,182 | |
Miscellaneous | 1,283,345 | |
Total expenses before reductions | 474,720,380 | |
Expense reductions | (11,952,880) | 462,767,500 |
| | |
Net investment income (loss) | | 610,840,044 |
Realized and Unrealized Gain (Loss) Net realized gain (loss) on: | | |
Investment securities: | | |
Unaffiliated issuers | 3,742,271,053 | |
Other affiliated issuers | 128,261,190 | |
Investment not meeting investment restrictions | (875) | |
Foreign currency transactions | 27,104,280 | |
Payment from investment advisor for loss on investment not meeting investment restrictions | 875 | |
Total net realized gain (loss) | | 3,897,636,523 |
Change in net unrealized appreciation (depreciation) on: Investment securities (net of decrease in deferred foreign taxes of $12,448,709) | 9,161,359,976 | |
Assets and liabilities in foreign currencies | 12,679,892 | |
Total change in net unrealized appreciation (depreciation) | | 9,174,039,868 |
Net gain (loss) | | 13,071,676,391 |
Net increase (decrease) in net assets resulting from operations | | $ 13,682,516,435 |
See accompanying notes which are an integral part of the financial statements.
Annual Report
Statement of Changes in Net Assets
| Year ended
October 31,
2007 | Year ended
October 31,
2006 |
Increase (Decrease) in Net Assets | | |
Operations | | |
Net investment income (loss) | $ 610,840,044 | $ 502,990,237 |
Net realized gain (loss) | 3,897,636,523 | 3,136,092,270 |
Change in net unrealized appreciation (depreciation) | 9,174,039,868 | 4,490,328,944 |
Net increase (decrease) in net assets resulting from operations | 13,682,516,435 | 8,129,411,451 |
Distributions to shareholders from net investment income | (425,826,410) | (273,726,595) |
Distributions to shareholders from net realized gain | (2,968,965,380) | (713,589,701) |
Total distributions | (3,394,791,790) | (987,316,296) |
Share transactions
Proceeds from sales of shares | 12,905,719,605 | 13,118,280,110 |
Reinvestment of distributions | 3,274,080,069 | 945,934,875 |
Cost of shares redeemed | (10,504,509,010) | (6,879,921,320) |
Net increase (decrease) in net assets resulting from share transactions | 5,675,290,664 | 7,184,293,665 |
Redemption fees | 1,737,801 | 1,607,319 |
Total increase (decrease) in net assets | 15,964,753,110 | 14,327,996,139 |
| | |
Net Assets | | |
Beginning of period | 43,965,189,118 | 29,637,192,979 |
End of period (including undistributed net investment income of $604,543,864 and undistributed net investment
income of $447,691,136, respectively) | $ 59,929,942,228 | $ 43,965,189,118 |
Other Information Shares | | |
Sold | 326,379,078 | 376,717,133 |
Issued in reinvestment of distributions | 90,046,217 | 29,746,334 |
Redeemed | (266,671,784) | (198,599,068) |
Net increase (decrease) | 149,753,511 | 207,864,399 |
Financial Highlights
Years ended October 31, | 2007 | 2006 | 2005 | 2004 | 2003 |
Selected Per-Share Data | | | | | |
Net asset value, beginning of period | $ 37.58 | $ 30.80 | $ 26.08 | $ 22.35 | $ 16.90 |
Income from Investment Operations | | | | | |
Net investment income (loss) B | .47 | .46 | .30 | .16 | .18 |
Net realized and unrealized gain (loss) | 10.23 | 7.33 | 4.63 | 3.87 | 5.40 |
Total from investment operations | 10.70 | 7.79 | 4.93 | 4.03 | 5.58 |
Distributions from net investment income | (.36) | (.28) | (.15) | (.30) | (.13) |
Distributions from net realized gain | (2.51) | (.73) | (.06) | - | - |
Total distributions | (2.87) | (1.01) | (.21) | (.30) | (.13) |
Redemption fees added to paid in capital B | - F | - F | - F | - F | - F |
Net asset value, end of period | $ 45.41 | $ 37.58 | $ 30.80 | $ 26.08 | $ 22.35 |
Total Return A | 30.37% | 25.89% | 19.01% | 18.20% | 33.26% |
Ratios to Average Net Assets C, E | | | | | |
Expenses before reductions | .93% | 1.01% | 1.10% | 1.15% | 1.24% |
Expenses net of fee waivers, if any | .93% | 1.01% | 1.10% | 1.15% | 1.24% |
Expenses net of all reductions | .91% | .97% | 1.07% | 1.12% | 1.22% |
Net investment income (loss) | 1.20% | 1.32% | 1.02% | .66% | .96% |
Supplemental Data | | | | | |
Net assets, end of period (000 omitted) | $ 59,929,942 | $ 43,965,189 | $ 29,637,193 | $ 19,902,063 | $ 11,542,386 |
Portfolio turnover rate D | 51% | 59% | 41% | 55% | 51% |
A Total returns would have been lower had certain expenses not been reduced during the periods shown. B Calculated based on average shares outstanding during the period. C Fees and expenses of the underlying Fidelity Central Funds are not included in the Fund's expense ratio. The Fund indirectly bears its proportionate share of the expenses of any underlying Fidelity Central Funds. D Amount does not include the portfolio activity of any underlying Fidelity Central Funds. E Expense ratios reflect operating expenses of the Fund. Expenses before reductions do not reflect amounts reimbursed by the investment adviser or reductions from brokerage service arrangements or other expense offset arrangements and do not represent the amount paid by the Fund during periods when reimbursements or reductions occur. Expenses net of fee waivers reflect expenses after reimbursement by the investment adviser but prior to reductions from brokerage service arrangements or other expense offset arrangements. Expenses net of all reductions represent the net expenses paid by the Fund. F Amount represents less than $.01 per share. |
See accompanying notes which are an integral part of the financial statements.
Annual Report
Aggressive International
Performance: The Bottom Line
Average annual total return reflects the change in the value of an investment, assuming reinvestment of the fund's dividend income and capital gains (the profits earned upon the sale of securities that have grown in value) and assuming a constant rate of performance each year. The $10,000 table and the fund's returns do not reflect the deduction of taxes that a shareholder would pay on fund distributions or the redemption of fund shares. During periods of reimbursement by Fidelity, a fund's total return will be greater than it would be had the reimbursement not occurred. How a fund did yesterday is no guarantee of how it will do tomorrow.
Average Annual Total Returns
Periods ended October 31, 2007 | Past 1
year | Past 5
years | Past 10 years |
Fidelity Aggressive International Fund | 24.81% | 18.93% | 9.02% |
$10,000 Over 10 Years
Let's say hypothetically that $10,000 was invested in Fidelity Aggressive International Fund on October 31, 1997. The chart shows how the value of your investment would have changed, and also shows how the Morgan Stanley Capital International All Country World ex USA Index performed over the same period.
Annual Report
Aggressive International
Management's Discussion of Fund Performance
Comments from Darren Maupin, Portfolio Manager of Fidelity® Aggressive International Fund
Foreign stocks, with a large assist from a weak U.S. dollar, generally had higher returns for U.S. investors than domestic equities during the 12-month period ending October 31, 2007. The backdrop for global stocks was solid, with robust economic growth and relatively high corporate profitability worldwide. Developed international equity markets, as measured by the Morgan Stanley Capital InternationalSM Europe, Australasia, and Far East (MSCI® EAFE®) Index - a performance monitor of established markets outside the United States and Canada - rose 25.09%. In comparison, the Standard & Poor's 500SM Index, a gauge of U.S. stocks, was up 14.56%, while Canada did appreciably better, as measured by the 43.24% advance of the S&P/TSX Composite Index. Among countries making up at least 1% of the EAFE benchmark, Finland had the best showing, soaring nearly 69%, while Hong Kong gained roughly 66%. The United Kingdom and Japan, the two largest components of the index, both underperformed. Fallout from the credit crunch and concerns about export growth tempered U.K. stocks, while Japan struggled with a slowdown in consumer spending and sluggish domestic growth. Emerging markets were the period's big winners, advancing 68.33% as measured by the MSCI Emerging Markets index.
The fund produced a solid absolute return of 24.81% for the year but fell short of the 32.60% advance of the MSCI All Country World ex USA index, mainly due to unrewarding stock picks in the materials and financials sectors. I held big stakes in two pulp and paper companies - Canada's Catalyst Paper and U.S.- and Canada-listed AbitibiBowater - believing they would benefit from consolidation in this over-capacity industry. Both stocks disappointed, however, and were a significant drag on relative performance. Unproductive stock selection in the financials sector - in particular, our positions in Japan's Shinsei Bank and U.K. reinsurance broker Benfield Group - also hurt, as did a position in Japanese agricultural equipment manufacturer Kubota and out-of-index stakes in cash and sovereign bonds. Upside performance came from several good performers with leverage to global agriculture, which benefited from favorable supply/demand dynamics. Among the top contributors were Saskatchewan Wheat Pool, which enjoys a dominant position in the Western Canada grain business; two large makers of farm equipment - U.S.-based Deere & Co. and Netherlands-based CNH Global; and Fiat, the Italian automaker that also owns a majority interest in CNH Global. Fiat and CNH Global were no longer held at period end.
Note to shareholders: Sammy Simnegar will become Portfolio Manager of the fund on January 1, 2008, replacing Darren Maupin.
The views expressed above reflect those of the portfolio manager(s) only through the end of the period as stated on the cover of this report and do not necessarily represent the views of Fidelity or any other person in the Fidelity organization. Any such views are subject to change at any time based upon market or other conditions and Fidelity disclaims any responsibility to update such views. These views may not be relied on as investment advice and, because investment decisions for a Fidelity fund are based on numerous factors, may not be relied on as an indication of trading intent on behalf of any Fidelity fund.
Annual Report
Aggressive International
Investment Changes
Geographic Diversification (% of fund's net assets) |
As of October 31, 2007 |
| Japan | 28.8% | |
| Canada | 20.3% | |
| United States of America | 13.7% | |
| Hong Kong | 5.8% | |
| Germany | 4.9% | |
| South Africa | 4.0% | |
| Switzerland | 3.4% | |
| France | 2.9% | |
| Netherlands | 2.8% | |
| Other | 13.4% | |

Percentages are adjusted for the effect of futures contracts, if applicable. |
|
As of April 30, 2007 |
| United States of America | 23.0% | |
| Canada | 18.2% | |
| Japan | 17.0% | |
| Netherlands | 8.3% | |
| South Africa | 4.9% | |
| Germany | 4.7% | |
| United Kingdom | 3.9% | |
| Italy | 3.6% | |
| Argentina | 3.4% | |
| Other | 13.0% | |

Percentages are adjusted for the effect of futures contracts, if applicable. |
Asset Allocation |
| % of fund's
net assets | % of fund's net assets
6 months ago |
Stocks | 89.8 | 86.6 |
Bonds | 1.0 | 1.0 |
Short-Term Investments and Net Other Assets | 9.2 | 12.4 |
Top Ten Stocks as of October 31, 2007 |
| % of fund's
net assets | % of fund's net assets
6 months ago |
Hutchison Whampoa Ltd. (Hong Kong, Industrial Conglomerates) | 5.8 | 0.0 |
Kubota Corp. (Japan, Machinery) | 4.7 | 1.9 |
Takeda Pharmaceutical Co. Ltd. (Japan, Pharmaceuticals) | 4.0 | 0.3 |
Gold Fields Ltd. sponsored ADR (South Africa, Metals & Mining) | 4.0 | 4.3 |
AbitibiBowater, Inc. (United States of America, Paper & Forest Products) | 3.6 | 0.0 |
Shinsei Bank Ltd. (Japan, Commercial Banks) | 3.3 | 0.0 |
Synthes, Inc. (United States of America, Health Care Equipment & Supplies) | 3.3 | 3.2 |
E.ON AG (Germany, Electric Utilities) | 3.0 | 2.4 |
Sanofi-Aventis sponsored ADR (France, Pharmaceuticals) | 2.9 | 0.0 |
Aquiline Resources, Inc. (Canada, Metals & Mining) | 2.9 | 1.0 |
| 37.5 | |
Market Sectors as of October 31, 2007 |
| % of fund's
net assets | % of fund's net assets
6 months ago |
Materials | 21.9 | 20.3 |
Health Care | 12.9 | 7.5 |
Financials | 12.2 | 9.3 |
Industrials | 10.9 | 9.4 |
Consumer Staples | 8.6 | 12.1 |
Energy | 8.6 | 9.0 |
Consumer Discretionary | 6.8 | 13.5 |
Telecommunication Services | 3.7 | 0.2 |
Utilities | 3.0 | 2.4 |
Information Technology | 1.2 | 2.9 |
Annual Report
Aggressive International
Investments October 31, 2007
Showing Percentage of Net Assets
Common Stocks - 88.0% |
| Shares | | Value |
Argentina - 2.3% |
Cresud S.A.C.I.F. y A. sponsored ADR (d) | 312,200 | | $ 7,705,096 |
Inversiones y Representaciones SA sponsored GDR (a) | 164,900 | | 2,945,114 |
Pampa Holding SA (a) | 6,881,842 | | 6,156,141 |
Pampa Holding SA GDR (a)(e) | 11,400 | | 254,946 |
TOTAL ARGENTINA | | 17,061,297 |
Australia - 0.5% |
ABB Grain Ltd. | 421,842 | | 2,969,555 |
Newcrest Mining Ltd. | 17,335 | | 528,430 |
TOTAL AUSTRALIA | | 3,497,985 |
Canada - 20.3% |
Absolut Resources Corp. (a) | 936,000 | | 981,402 |
Aquiline Resources, Inc. (a) | 1,418,700 | | 15,941,969 |
Aquiline Resources, Inc. (a)(e) | 494,600 | | 5,557,833 |
Canadian Natural Resources Ltd. | 160,500 | | 13,354,035 |
Canfor Corp. (a) | 1,302,400 | | 12,069,477 |
Catalyst Paper Corp. (a) | 8,029,400 | | 12,075,565 |
European Goldfields Ltd. (a) | 2,201,000 | | 14,965,495 |
Guyana Goldfields, Inc. (a) | 405,900 | | 4,191,405 |
IAMGOLD Corp. | 1,848,100 | | 16,206,596 |
NuVista Energy Ltd. (a) | 264,400 | | 4,121,974 |
ProEx Energy Ltd. (a) | 503,300 | | 7,777,110 |
Saskatchewan Wheat Pool, Inc. (a) | 408,300 | | 5,522,126 |
Saskatchewan Wheat Pool, Inc. (a)(e) | 1,036,400 | | 14,016,975 |
Suncor Energy, Inc. | 81,100 | | 8,885,612 |
Trican Well Service Ltd. | 755,900 | | 16,011,438 |
TOTAL CANADA | | 151,679,012 |
Cayman Islands - 2.2% |
Apex Silver Mines Ltd. (a) | 338,400 | | 6,937,200 |
Hutchison Telecommunications International Ltd. (a) | 6,550,000 | | 9,348,845 |
TOTAL CAYMAN ISLANDS | | 16,286,045 |
Czech Republic - 2.3% |
Philip Morris CR AS | 32,600 | | 17,007,019 |
France - 2.9% |
Sanofi-Aventis sponsored ADR (d) | 498,200 | | 21,925,782 |
Germany - 4.9% |
E.ON AG (d) | 115,500 | | 22,557,150 |
Lanxess AG | 280,000 | | 13,983,238 |
TOTAL GERMANY | | 36,540,388 |
Hong Kong - 5.8% |
Hutchison Whampoa Ltd. | 3,446,000 | | 43,419,601 |
Japan - 24.9% |
Aioi Insurance Co. Ltd. | 1,847,000 | | 10,737,273 |
Canon, Inc. | 142,000 | | 7,180,940 |
Kose Corp. | 669,900 | | 17,196,481 |
|
| Shares | | Value |
Kubota Corp. | 3,609,400 | | $ 30,308,823 |
Kubota Corp. sponsored ADR | 104,000 | | 4,378,400 |
Millea Holdings, Inc. | 273,909 | | 10,753,667 |
Mitsui Marine & Fire Insurance Co. Ltd. | 874,000 | | 10,025,961 |
Nec Electronics Corp. (a) | 53,500 | | 1,466,077 |
Nissin Healthcare Food Service Co. | 244,800 | | 2,996,719 |
Parco Co. Ltd. | 592,800 | | 8,301,022 |
Seino Holdings Co. Ltd. | 362,800 | | 3,115,909 |
SFCG Co. Ltd. | 78,440 | | 13,013,255 |
Shinsei Bank Ltd. | 7,575,000 | | 24,557,970 |
Takeda Pharmaceutical Co. Ltd. | 479,800 | | 29,976,954 |
Tokyo Steel Manufacturing Co. Ltd. | 211,100 | | 2,927,860 |
Torii Pharmaceutical Co. Ltd. | 137,100 | | 2,416,610 |
Tsutsumi Jewelry Co. Ltd. | 160,000 | | 3,500,550 |
USS Co. Ltd. | 54,400 | | 3,564,005 |
TOTAL JAPAN | | 186,418,476 |
Korea (South) - 0.0% |
Samwhan Corp. | 20 | | 670 |
Netherlands - 2.8% |
Koninklijke Philips Electronics NV | 505,600 | | 20,901,504 |
Philippines - 1.9% |
DMCI Holdings, Inc. | 20,908,000 | | 5,777,686 |
Semirara Mining Corp. | 7,954,600 | | 8,243,109 |
TOTAL PHILIPPINES | | 14,020,795 |
South Africa - 4.0% |
Gold Fields Ltd. | 246,000 | | 4,445,220 |
Gold Fields Ltd. sponsored ADR | 1,406,600 | | 25,417,262 |
TOTAL SOUTH AFRICA | | 29,862,482 |
Switzerland - 2.4% |
Actelion Ltd. (Reg.) (a) | 363,529 | | 18,061,896 |
Taiwan - 2.4% |
Taiwan Mobile Co. Ltd. | 13,592,000 | | 18,209,378 |
United States of America - 8.4% |
AbitibiBowater, Inc. (d) | 792,243 | | 27,142,245 |
Deere & Co. | 1,400 | | 216,860 |
Synthes, Inc. | 196,351 | | 24,512,091 |
Virgin Media, Inc. | 489,600 | | 10,825,056 |
TOTAL UNITED STATES OF AMERICA | | 62,696,252 |
TOTAL COMMON STOCKS (Cost $610,669,447) | 657,588,582 |
Nonconvertible Preferred Stocks - 1.8% |
| | | |
Italy - 1.8% |
Istituto Finanziario Industriale SpA (IFI) (a)
(Cost $12,347,760) | 315,800 | | 13,149,442 |
Government Obligations - 4.9% |
| Principal Amount | | Value |
Japan - 3.9% |
Japan Government 0.5953% to 0.6605% 11/5/07 to 1/21/08 | JPY | 3,400,000,000 | | 29,457,936 |
Switzerland - 1.0% |
Switzerland Confederation 4.25% 1/8/08 | CHF | 8,400,000 | | 7,274,488 |
TOTAL GOVERNMENT OBLIGATIONS (Cost $35,646,149) | 36,732,424 |
Money Market Funds - 9.9% |
| Shares | | |
Fidelity Cash Central Fund, 4.97% (b) | 32,145,260 | | 32,145,260 |
Fidelity Securities Lending Cash Central Fund, 5.02% (b)(c) | 41,643,750 | | 41,643,750 |
TOTAL MONEY MARKET FUNDS (Cost $73,789,010) | 73,789,010 |
TOTAL INVESTMENT PORTFOLIO - 104.6% (Cost $732,452,366) | | 781,259,458 |
NET OTHER ASSETS - (4.6)% | | (34,164,608) |
NET ASSETS - 100% | $ 747,094,850 |
Forward Foreign Currency Contracts |
| Settlement Dates | | Value | | Unrealized Appreciation/(Depreciation) |
Contracts to Buy |
2,546,219 AUD | Nov. 2007 | | $ 2,369,657 | | $ 69,657 |
2,706,663 CHF | Nov. 2007 | | 2,339,246 | | 39,246 |
8,849,620 EUR | Nov. 2007 | | 12,824,523 | | 224,523 |
4,024,658 GBP | Nov. 2007 | | 8,363,529 | | 163,529 |
843,544,800 JPY | Nov. 2007 | | 7,326,448 | | 126,448 |
| | $ 33,223,403 | | $ 623,403 |
|
(Payable Amount $32,600,000) |
|
The value of contracts to buy as a percentage of net assets - 4.4% |
Currency Abbreviations |
AUD | - | Australian dollar |
CHF | - | Swiss franc |
EUR | - | European Monetary Unit |
GBP | - | British pound |
JPY | - | Japanese yen |
Legend |
(a) Non-income producing |
(b) Affiliated fund that is available only to investment companies and other accounts managed by Fidelity Investments. The rate quoted is the annualized seven-day yield of the fund at period end. A complete unaudited listing of the fund's holdings as of its most recent quarter end is available upon request. |
(c) Investment made with cash collateral received from securities on loan. |
(d) Security or a portion of the security is on loan at period end. |
(e) Security exempt from registration under Rule 144A of the Securities Act of 1933. These securities may be resold in transactions exempt from registration, normally to qualified institutional buyers. At the end of the period, the value of these securities amounted to $19,829,754 or 2.7% of net assets. |
Affiliated Central Funds |
Information regarding fiscal year to date income earned by the Fund from investments in Fidelity Central Funds is as follows: |
Fund | Income earned |
Fidelity Cash Central Fund | $ 2,779,145 |
Fidelity Securities Lending Cash Central Fund | 541,973 |
Total | $ 3,321,118 |
See accompanying notes which are an integral part of the financial statements.
Annual Report
Aggressive International
Financial Statements
Statement of Assets and Liabilities
| October 31, 2007 |
| | |
Assets | | |
Investment in securities, at value (including securities loaned of $39,574,911) - See accompanying schedule: Unaffiliated issuers (cost $658,663,356) | $ 707,470,448 | |
Fidelity Central Funds (cost $73,789,010) | 73,789,010 | |
Total Investments (cost $732,452,366) | | $ 781,259,458 |
Foreign currency held at value (cost $79,063) | | 79,995 |
Receivable for investments sold | | 14,451,472 |
Unrealized appreciation on foreign currency contracts | | 623,403 |
Receivable for fund shares sold | | 727,395 |
Dividends receivable | | 917,367 |
Interest receivable | | 249,993 |
Distributions receivable from Fidelity Central Funds | | 197,580 |
Prepaid expenses | | 214 |
Other receivables | | 111,508 |
Total assets | | 798,618,385 |
| | |
Liabilities | | |
Payable for investments purchased | $ 7,846,092 | |
Payable for fund shares redeemed | 1,265,862 | |
Accrued management fee | 328,120 | |
Other affiliated payables | 172,576 | |
Other payables and accrued expenses | 267,135 | |
Collateral on securities loaned, at value | 41,643,750 | |
Total liabilities | | 51,523,535 |
| | |
Net Assets | | $ 747,094,850 |
Net Assets consist of: | | |
Paid in capital | | $ 603,712,466 |
Undistributed net investment income | | 6,211,246 |
Accumulated undistributed net realized gain (loss) on investments and foreign currency transactions | | 87,882,618 |
Net unrealized appreciation (depreciation) on investments and assets and liabilities in foreign currencies | | 49,288,520 |
Net Assets, for 38,713,092 shares outstanding | | $ 747,094,850 |
Net Asset Value, offering price and redemption price per share ($747,094,850 ÷ 38,713,092 shares) | | $ 19.30 |
Statement of Operations
| Year ended October 31, 2007 |
| | |
Investment Income | | |
Dividends | | $ 8,406,706 |
Interest | | 162,202 |
Income from Fidelity Central Funds | | 3,321,118 |
| | 11,890,026 |
Less foreign taxes withheld | | (774,941) |
Total income | | 11,115,085 |
| | |
Expenses | | |
Management fee
Basic fee | $ 4,133,276 | |
Performance adjustment | (1,242,165) | |
Transfer agent fees | 1,463,272 | |
Accounting and security lending fees | 296,812 | |
Custodian fees and expenses | 148,280 | |
Independent trustees' compensation | 1,926 | |
Registration fees | 58,964 | |
Audit | 85,289 | |
Legal | 13,233 | |
Miscellaneous | 27,106 | |
Total expenses before reductions | 4,985,993 | |
Expense reductions | (389,840) | 4,596,153 |
| | |
Net investment income (loss) | | 6,518,932 |
Realized and Unrealized Gain (Loss) Net realized gain (loss) on: | | |
Investment securities: | | |
Unaffiliated issuers (net of foreign taxes of $261,867) | 87,021,490 | |
Foreign currency transactions | 1,844,646 | |
Total net realized gain (loss) | | 88,866,136 |
Change in net unrealized appreciation (depreciation) on: Investment securities (net of increase in deferred foreign taxes of $170,023) | 20,849,391 | |
Assets and liabilities in foreign currencies | 647,081 | |
Total change in net unrealized appreciation (depreciation) | | 21,496,472 |
Net gain (loss) | | 110,362,608 |
Net increase (decrease) in net assets resulting from operations | | $ 116,881,540 |
See accompanying notes which are an integral part of the financial statements.
Annual Report
Statement of Changes in Net Assets
| Year ended
October 31,
2007 | Year ended
October 31,
2006 |
Increase (Decrease) in Net Assets | | |
Operations | | |
Net investment income (loss) | $ 6,518,932 | $ 7,666,044 |
Net realized gain (loss) | 88,866,136 | 96,103,715 |
Change in net unrealized appreciation (depreciation) | 21,496,472 | (5,719,610) |
Net increase (decrease) in net assets resulting from operations | 116,881,540 | 98,050,149 |
Distributions to shareholders from net investment income | (5,378,123) | (7,891,662) |
Distributions to shareholders from net realized gain | (70,991,187) | (60,750,944) |
Total distributions | (76,369,310) | (68,642,606) |
Share transactions
Proceeds from sales of shares | 446,155,386 | 173,391,281 |
Reinvestment of distributions | 73,093,150 | 62,343,713 |
Cost of shares redeemed | (288,846,638) | (484,972,865) |
Net increase (decrease) in net assets resulting from share transactions | 230,401,898 | (249,237,871) |
Redemption fees | 33,598 | 263,134 |
Total increase (decrease) in net assets | 270,947,726 | (219,567,194) |
| | |
Net Assets | | |
Beginning of period | 476,147,124 | 695,714,318 |
End of period (including undistributed net investment income of $6,211,246 and undistributed net investment
income of $6,915,455, respectively) | $ 747,094,850 | $ 476,147,124 |
Other Information Shares | | |
Sold | 24,579,741 | 9,840,640 |
Issued in reinvestment of distributions | 4,454,183 | 3,762,445 |
Redeemed | (16,564,041) | (27,820,456) |
Net increase (decrease) | 12,469,883 | (14,217,371) |
Financial Highlights
Years ended October 31, | 2007 | 2006 | 2005 | 2004 | 2003 |
Selected Per-Share Data | | | | | |
Net asset value, beginning of period | $ 18.14 | $ 17.19 | $ 15.21 | $ 14.36 | $ 10.78 |
Income from Investment Operations | | | | | |
Net investment income (loss) B | .20 | .24 | .20 | .04 | .06 |
Net realized and unrealized gain (loss) | 3.80 | 2.70 | 1.83 | .91 | 3.53 |
Total from investment operations | 4.00 | 2.94 | 2.03 | .95 | 3.59 |
Distributions from net investment income | (.20) | (.23) | (.05) | (.10) | (.01) |
Distributions from net realized gain | (2.64) | (1.77) | - | - | - |
Total distributions | (2.84) | (2.00) | (.05) | (.10) | (.01) |
Redemption fees added to paid in capital B | - F | .01 | - F | - F | - F |
Net asset value, end of period | $ 19.30 | $ 18.14 | $ 17.19 | $ 15.21 | $ 14.36 |
Total Return A | 24.81% | 18.26% | 13.37% | 6.65% | 33.33% |
Ratios to Average Net Assets C, E | | | | | |
Expenses before reductions | .85% | .87% | .97% | 1.24% | 1.23% |
Expenses net of fee waivers, if any | .85% | .87% | .97% | 1.24% | 1.23% |
Expenses net of all reductions | .79% | .75% | .84% | 1.16% | 1.16% |
Net investment income (loss) | 1.11% | 1.36% | 1.20% | .27% | .50% |
Supplemental Data | | | | | |
Net assets, end of period (000 omitted) | $ 747,095 | $ 476,147 | $ 695,714 | $ 721,144 | $ 554,853 |
Portfolio turnover rate D | 138% | 176% | 185% | 161% | 212% |
A Total returns would have been lower had certain expenses not been reduced during the periods shown. B Calculated based on average shares outstanding during the period. C Fees and expenses of the underlying Fidelity Central Funds are not included in the Fund's expense ratio. The Fund indirectly bears its proportionate share of the expenses of any underlying Fidelity Central Funds. D Amount does not include the portfolio activity of any underlying Fidelity Central Funds. E Expense ratios reflect operating expenses of the Fund. Expenses before reductions do not reflect amounts reimbursed by the investment adviser or reductions from brokerage service arrangements or other expense offset arrangements and do not represent the amount paid by the Fund during periods when reimbursements or reductions occur. Expenses net of fee waivers reflect expenses after reimbursement by the investment adviser but prior to reductions from brokerage service arrangements or other expense offset arrangements. Expenses net of all reductions represent the net expenses paid by the Fund. F Amount represents less than $.01 per share. |
See accompanying notes which are an integral part of the financial statements.
Annual Report
Overseas
Performance: The Bottom Line
Average annual total return reflects the change in the value of an investment, assuming reinvestment of the fund's dividend income and capital gains (the profits earned upon the sale of securities that have grown in value) and assuming a constant rate of performance each year. The $10,000 table and the fund's returns do not reflect the deduction of taxes that a shareholder would pay on fund distributions or the redemption of fund shares. During periods of reimbursement by Fidelity, a fund's total return will be greater than it would be had the reimbursement not occurred. How a fund did yesterday is no guarantee of how it will do tomorrow.
Average Annual Total Returns
Periods ended October 31, 2007 | Past 1
year | Past 5
years | Past 10
years |
Fidelity Overseas Fund | 38.79% | 24.86% | 10.04% |
$10,000 Over 10 Years
Let's say hypothetically that $10,000 was invested in Fidelity Overseas Fund on October 31, 1997. The chart shows how the value of your investment would have changed, and also shows how the Morgan Stanley Capital International EAFE Index performed over the same period.
Annual Report
Overseas
Management's Discussion of Fund Performance
Comments from Ian Hart, Portfolio Manager of Fidelity® Overseas Fund
Foreign stocks, with a large assist from a weak U.S. dollar, generally had higher returns for U.S. investors than domestic equities during the 12-month period ending October 31, 2007. The backdrop for global stocks was solid, with robust economic growth and relatively high corporate profitability worldwide. Developed international equity markets, as measured by the Morgan Stanley Capital InternationalSM Europe, Australasia, and Far East (MSCI® EAFE®) Index - a performance monitor of established markets outside the United States and Canada - rose 25.09%. In comparison, the Standard & Poor's 500SM Index, a gauge of U.S. stocks, was up 14.56%, while Canada did appreciably better, as measured by the 43.24% advance of the S&P/TSX Composite Index. Among countries making up at least 1% of the EAFE benchmark, Finland had the best showing, soaring nearly 69%, while Hong Kong gained roughly 66%. The United Kingdom and Japan, the two largest components of the index, both underperformed. Fallout from the credit crunch and concerns about export growth tempered U.K. stocks, while Japan struggled with a slowdown in consumer spending and sluggish domestic growth. Emerging markets were the period's big winners, advancing 68.33% as measured by the MSCI Emerging Markets index.
The fund performed well in both absolute and relative terms, its 38.79% gain far exceeding that of the MSCI EAFE index during the past year. This solid outperformance came almost entirely from favorable stock selection, with good picks across all sectors of the index. An overweighting in the strong-performing industrials sector and an underweighting in the weak financials group also helped. Favorable stock selection was diluted a bit by not owning some of the biggest names in materials, the index's top-performing sector, and by holding an average cash position of nearly 4%. At the regional level, underweighting the anemic Japanese market was a big positive. The top contributions came from large stakes in China Unicom, the No. 2 mobile telephone operator in this rapidly growing market; Aker Kvaerner, a Norwegian engineering and construction services provider to the energy industry; and Nintendo, the Japanese video game maker. Results were tempered by not holding a position in strong-performing British-Australian mining giant BHP Billiton and by not maintaining a stake in Finland's Nokia, the world's No. 1 wireless handset maker.
The views expressed above reflect those of the portfolio manager(s) only through the end of the period as stated on the cover of this report and do not necessarily represent the views of Fidelity or any other person in the Fidelity organization. Any such views are subject to change at any time based upon market or other conditions and Fidelity disclaims any responsibility to update such views. These views may not be relied on as investment advice and, because investment decisions for a Fidelity fund are based on numerous factors, may not be relied on as an indication of trading intent on behalf of any Fidelity fund.
Annual Report
Overseas
Investment Changes
Geographic Diversification (% of fund's net assets) |
As of October 31, 2007 |
| France | 18.1% | |
| Germany | 11.1% | |
| United Kingdom | 9.7% | |
| Japan | 7.6% | |
| Hong Kong | 6.8% | |
| United States of America | 6.6% | |
| Norway | 5.3% | |
| Australia | 4.8% | |
| Switzerland | 4.7% | |
| Other | 25.3% | |

Percentages are adjusted for the effect of futures contracts, if applicable. |
|
As of April 30, 2007 |
| France | 14.6% | |
| Japan | 14.1% | |
| United Kingdom | 11.1% | |
| Switzerland | 9.8% | |
| Germany | 7.6% | |
| United States of America | 7.3% | |
| Australia | 4.4% | |
| Italy | 4.3% | |
| Spain | 3.4% | |
| Other | 23.4% | |

Percentages are adjusted for the effect of futures contracts, if applicable. |
Asset Allocation |
| % of fund's
net assets | % of fund's net assets
6 months ago |
Stocks | 98.5 | 97.3 |
Short-Term Investments and Net Other Assets | 1.5 | 2.7 |
Top Ten Stocks as of October 31, 2007 |
| % of fund's
net assets | % of fund's net assets
6 months ago |
China Unicom Ltd. sponsored ADR (Hong Kong, Wireless Telecommunication Services) | 6.1 | 2.2 |
Pernod Ricard SA (France, Beverages) | 5.4 | 5.0 |
Aker Kvaerner ASA (Norway, Energy Equipment & Services) | 5.3 | 2.6 |
Veolia Environnement (France, Multi-Utilities) | 4.0 | 1.8 |
Hochtief AG (Germany, Construction & Engineering) | 3.5 | 0.4 |
Alstom SA (France, Electrical Equipment) | 2.8 | 0.0 |
AES Corp. (United States of America, Independent Power Producers & Energy Traders) | 2.6 | 0.7 |
Rolls-Royce Group PLC (United Kingdom, Aerospace & Defense) | 2.4 | 0.7 |
DaimlerChrysler AG (Germany, Automobiles) | 2.1 | 0.8 |
Suntech Power Holdings Co. Ltd. sponsored ADR (Cayman Islands, Electrical Equipment) | 1.9 | 0.7 |
| 36.1 | |
Market Sectors as of October 31, 2007 |
| % of fund's
net assets | % of fund's net assets
6 months ago |
Industrials | 18.6 | 11.9 |
Financials | 17.7 | 28.6 |
Telecommunication Services | 12.1 | 5.6 |
Energy | 8.8 | 7.1 |
Materials | 8.8 | 6.1 |
Utilities | 8.7 | 4.7 |
Consumer Discretionary | 8.2 | 11.0 |
Information Technology | 6.4 | 10.2 |
Consumer Staples | 5.9 | 8.0 |
Health Care | 3.3 | 4.1 |
Annual Report
Overseas
Investments October 31, 2007
Showing Percentage of Net Assets
Common Stocks - 97.9% |
| Shares | | Value |
Australia - 4.8% |
Babcock & Brown Ltd. | 1,703,593 | | $ 49,328,324 |
Computershare Ltd. | 10,269,163 | | 82,800,750 |
CSL Ltd. | 3,693,900 | | 125,578,193 |
Macquarie Bank Ltd. | 1,526,200 | | 121,891,291 |
National Australia Bank Ltd. | 1,823,180 | | 73,761,923 |
TOTAL AUSTRALIA | | 453,360,481 |
Austria - 0.9% |
Raiffeisen International Bank Holding AG | 543,507 | | 89,846,099 |
Brazil - 2.7% |
Bovespa Holding SA (a) | 546,000 | | 10,398,647 |
Petroleo Brasileiro SA Petrobras sponsored ADR | 910,500 | | 87,071,115 |
Vivo Participacoes SA (PN) sponsored ADR (a)(d) | 27,861,100 | | 164,101,879 |
TOTAL BRAZIL | | 261,571,641 |
Canada - 1.3% |
Aber Diamond Corp. | 2,810,900 | | 123,665,310 |
Cayman Islands - 1.9% |
Suntech Power Holdings Co. Ltd. sponsored ADR (a)(d) | 3,017,800 | | 177,718,242 |
China - 0.5% |
Global Bio-Chem Technology Group Co. Ltd. | 114,978,000 | | 42,632,796 |
Denmark - 1.3% |
DSV de Sammensluttede Vognmaend AS | 2,778,200 | | 73,442,353 |
Vestas Wind Systems AS (a) | 602,900 | | 53,790,073 |
TOTAL DENMARK | | 127,232,426 |
Finland - 0.7% |
Neste Oil Oyj | 1,926,322 | | 69,241,121 |
France - 18.1% |
Alcatel-Lucent SA sponsored ADR | 4,290,000 | | 41,570,100 |
Alstom SA | 1,134,100 | | 267,658,398 |
AXA SA | 1,309,060 | | 58,554,254 |
Cap Gemini SA | 1,075,700 | | 68,572,863 |
Electricite de France | 849,500 | | 101,894,257 |
Pernod Ricard SA | 2,238,742 | | 517,336,564 |
Pinault Printemps-Redoute SA | 584,600 | | 115,882,228 |
Sodexho Alliance SA ADR | 1,633,800 | | 117,796,980 |
Veolia Environnement | 4,220,137 | | 376,936,393 |
Vinci SA | 797,500 | | 65,419,768 |
TOTAL FRANCE | | 1,731,621,805 |
Germany - 10.5% |
Bayer AG | 1,039,800 | | 85,679,520 |
DaimlerChrysler AG | 1,838,900 | | 202,554,835 |
E.ON AG | 483,891 | | 94,503,912 |
Hochtief AG | 2,420,300 | | 334,207,437 |
K&S AG | 268,700 | | 56,178,810 |
|
| Shares | | Value |
Linde AG | 1,186,500 | | $ 150,137,566 |
MLP AG | 177,784 | | 2,356,797 |
Muenchener Rueckversicherungs-Gesellschaft AG (Reg.) | 383,376 | | 73,550,723 |
TOTAL GERMANY | | 999,169,600 |
Hong Kong - 6.8% |
China Unicom Ltd. sponsored ADR (d) | 23,821,100 | | 584,093,373 |
Shanghai Industrial Holdings Ltd. (H Shares) | 10,446,000 | | 61,624,720 |
TOTAL HONG KONG | | 645,718,093 |
India - 3.0% |
Allahabad Bank | 10,885,323 | | 29,075,226 |
Bank of Baroda | 5,270,852 | | 52,226,019 |
Gammon India Ltd. | 2,169,930 | | 31,424,174 |
Satyam Computer Services Ltd. | 8,459,009 | | 103,970,333 |
State Bank of India | 1,153,012 | | 72,345,439 |
TOTAL INDIA | | 289,041,191 |
Indonesia - 0.8% |
PT Indosat Tbk sponsored ADR (d) | 1,501,900 | | 72,466,675 |
Italy - 2.5% |
Impregilo SpA (a) | 16,879,000 | | 135,232,253 |
Unicredito Italiano SpA | 12,352,000 | | 105,583,908 |
TOTAL ITALY | | 240,816,161 |
Japan - 7.6% |
Citizen Holdings Co. Ltd. | 14,450,900 | | 155,707,716 |
Konica Minolta Holdings, Inc. | 2,434,500 | | 42,626,571 |
Kubota Corp. | 10,318,000 | | 86,642,223 |
Kurita Water Industries Ltd. | 1,590,500 | | 53,143,683 |
Mitsubishi Estate Co. Ltd. | 2,734,000 | | 81,978,381 |
Mitsui Fudosan Co. Ltd. | 2,192,000 | | 60,652,586 |
Murata Manufacturing Co. Ltd. | 272,400 | | 16,581,046 |
Nintendo Co. Ltd. | 120,200 | | 75,485,599 |
Nomura Holdings, Inc. | 4,262,300 | | 75,996,808 |
Omron Corp. | 1,363,800 | | 33,549,640 |
Tokuyama Corp. | 3,158,000 | | 44,119,522 |
TOTAL JAPAN | | 726,483,775 |
Korea (South) - 1.0% |
SK Telecom Co. Ltd. sponsored ADR (d) | 2,944,800 | | 90,729,288 |
Luxembourg - 2.3% |
Acergy SA sponsored ADR | 2,948,500 | | 85,329,590 |
ArcelorMittal SA (NY Shares) Class A | 1,621,500 | | 129,638,925 |
TOTAL LUXEMBOURG | | 214,968,515 |
Netherlands Antilles - 1.0% |
Schlumberger Ltd. (NY Shares) | 956,000 | | 92,320,920 |
Norway - 5.3% |
Aker Kvaerner ASA (e) | 14,622,900 | | 509,546,689 |
Common Stocks - continued |
| Shares | | Value |
South Africa - 0.8% |
Impala Platinum Holdings Ltd. | 2,130,790 | | $ 79,998,886 |
Spain - 3.1% |
Banco Bilbao Vizcaya Argentaria SA | 2,778,600 | | 70,131,864 |
Banco Santander Central Hispano SA | 4,404,400 | | 95,716,421 |
Telefonica SA sponsored ADR | 1,331,300 | | 132,397,785 |
TOTAL SPAIN | | 298,246,070 |
Switzerland - 4.7% |
Actelion Ltd. (Reg.) (a) | 2,132,655 | | 105,960,714 |
Compagnie Financiere Richemont unit | 1,755,710 | | 125,277,935 |
Credit Suisse Group (Reg.) (d) | 1,697,345 | | 114,910,257 |
EFG International | 474,075 | | 22,162,791 |
Roche Holding AG (participation certificate) | 468,746 | | 80,108,691 |
TOTAL SWITZERLAND | | 448,420,388 |
Turkey - 1.5% |
Turkiye Garanti Bankasi AS | 6,060,000 | | 55,608,250 |
Yapi ve Kredi Bankasi AS | 21,368,532 | | 83,198,092 |
TOTAL TURKEY | | 138,806,342 |
United Kingdom - 9.7% |
3i Group plc | 4,461,030 | | 100,630,544 |
HSBC Holdings PLC sponsored ADR (d) | 798,800 | | 79,496,576 |
Land Securities Group PLC | 2,133,900 | | 72,935,811 |
Marks & Spencer Group PLC | 6,158,400 | | 83,479,613 |
Rolls-Royce Group PLC | 20,251,785 | | 226,522,070 |
Standard Chartered PLC (United Kingdom) | 1,215,000 | | 47,136,014 |
The Weir Group PLC | 6,262,546 | | 115,488,698 |
Vodafone Group PLC sponsored ADR | 2,682,900 | | 105,357,483 |
Xstrata PLC | 1,332,500 | | 95,493,418 |
TOTAL UNITED KINGDOM | | 926,540,227 |
United States of America - 5.1% |
AES Corp. (a) | 11,738,800 | | 251,327,708 |
Fluor Corp. | 564,217 | | 89,146,286 |
Starwood Hotels & Resorts Worldwide, Inc. | 1,192,500 | | 67,805,550 |
Titanium Metals Corp. (a) | 1,856,400 | | 65,345,280 |
Zale Corp. (a)(d) | 748,352 | | 15,775,260 |
TOTAL UNITED STATES OF AMERICA | | 489,400,084 |
TOTAL COMMON STOCKS (Cost $6,830,386,421) | 9,339,562,825 |
Nonconvertible Preferred Stocks - 0.6% |
| Shares | | Value |
Germany - 0.6% |
Porsche AG | 23,100 | | $ 61,546,998 |
United Kingdom - 0.0% |
Rolls-Royce Group PLC: | | | |
B Shares | 4,436 | | 10 |
B Shares (a) | 818,172,114 | | 1,701,021 |
TOTAL UNITED KINGDOM | | 1,701,031 |
TOTAL NONCONVERTIBLE PREFERRED STOCKS (Cost $31,831,207) | 63,248,029 |
Money Market Funds - 7.6% |
| | | |
Fidelity Cash Central Fund, 4.97% (b) | 552,193,770 | | 552,193,770 |
Fidelity Securities Lending Cash Central Fund, 5.02% (b)(c) | 175,253,475 | | 175,253,475 |
TOTAL MONEY MARKET FUNDS (Cost $727,447,245) | 727,447,245 |
TOTAL INVESTMENT PORTFOLIO - 106.1% (Cost $7,589,664,873) | 10,130,258,099 |
NET OTHER ASSETS - (6.1)% | | (586,904,651) |
NET ASSETS - 100% | $ 9,543,353,448 |
Legend |
(a) Non-income producing |
(b) Affiliated fund that is available only to investment companies and other accounts managed by Fidelity Investments. The rate quoted is the annualized seven-day yield of the fund at period end. A complete unaudited listing of the fund's holdings as of its most recent quarter end is available upon request. |
(c) Investment made with cash collateral received from securities on loan. |
(d) Security or a portion of the security is on loan at period end. |
(e) Affiliated company |
Affiliated Central Funds |
Information regarding fiscal year to date income earned by the Fund from investments in Fidelity Central Funds is as follows: |
Fund | Income earned |
Fidelity Cash Central Fund | $ 16,611,363 |
Fidelity Securities Lending Cash Central Fund | 7,088,492 |
Total | $ 23,699,855 |
Other Affiliated Issuers |
An affiliated company is a company in which the fund has ownership of at least 5% of the voting securities. Fiscal year to date transactions with companies which are or were affiliates are as follows: |
Affiliate | Value, beginning
of period | Purchases | Sales
Proceeds | Dividend
Income | Value, end
of period |
Aker Kvaerner ASA | $ 75,698,192 | $ 265,907,779 | $ - | $ 10,357,829 | $ 509,546,689 |
See accompanying notes which are an integral part of the financial statements.
Annual Report
Overseas
Financial Statements
Statement of Assets and Liabilities
| October 31, 2007 |
| | |
Assets | | |
Investment in securities, at value (including securities loaned of $172,775,145) - See accompanying schedule: Unaffiliated issuers (cost $6,523,146,131) | $ 8,893,264,165 | |
Fidelity Central Funds (cost $727,447,245) | 727,447,245 | |
Other affiliated issuers (cost $339,071,497) | 509,546,689 | |
Total Investments (cost $7,589,664,873) | | $ 10,130,258,099 |
Receivable for investments sold | | 268,672,869 |
Receivable for fund shares sold | | 22,616,529 |
Dividends receivable | | 6,851,203 |
Distributions receivable from Fidelity Central Funds | | 1,871,774 |
Prepaid expenses | | 2,909 |
Other receivables | | 830,929 |
Total assets | | 10,431,104,312 |
| | |
Liabilities | | |
Payable to custodian bank | $ 904,232 | |
Payable for investments purchased | 5,517,566 | |
Payable for fund shares redeemed | 696,431,382 | |
Accrued management fee | 6,803,621 | |
Other affiliated payables | 1,794,752 | |
Other payables and accrued expenses | 1,045,836 | |
Collateral on securities loaned, at value | 175,253,475 | |
Total liabilities | | 887,750,864 |
| | |
Net Assets | | $ 9,543,353,448 |
Net Assets consist of: | | |
Paid in capital | | $ 5,796,499,220 |
Undistributed net investment income | | 106,479,330 |
Accumulated undistributed net realized gain (loss) on investments and foreign currency transactions | | 1,100,244,979 |
Net unrealized appreciation (depreciation) on investments and assets and liabilities in foreign currencies | | 2,540,129,919 |
Net Assets, for 163,441,870 shares outstanding | | $ 9,543,353,448 |
Net Asset Value, offering price and redemption price per share ($9,543,353,448 ÷ 163,441,870 shares) | | $ 58.39 |
Statement of Operations
| Year ended October 31, 2007 |
| | |
Investment Income | | |
Dividends (including $10,357,829 earned from other affiliated issuers) | | $ 187,740,013 |
Interest | | 220,090 |
Income from Fidelity Central Funds | | 23,699,855 |
| | 211,659,958 |
Less foreign taxes withheld | | (16,365,720) |
Total income | | 195,294,238 |
| | |
Expenses | | |
Management fee
Basic fee | $ 59,166,775 | |
Performance adjustment | (2,604,316) | |
Transfer agent fees | 18,822,388 | |
Accounting and security lending fees | 1,761,024 | |
Custodian fees and expenses | 1,934,912 | |
Independent trustees' compensation | 27,643 | |
Appreciation in deferred trustee compensation account | 1,992 | |
Registration fees | 121,109 | |
Audit | 134,218 | |
Legal | 80,130 | |
Miscellaneous | 210,423 | |
Total expenses before reductions | 79,656,298 | |
Expense reductions | (3,578,508) | 76,077,790 |
| | |
Net investment income (loss) | | 119,216,448 |
Realized and Unrealized Gain (Loss) Net realized gain (loss) on: | | |
Investment securities: | | |
Unaffiliated issuers | 1,123,222,685 | |
Foreign currency transactions | (2,553,929) | |
Total net realized gain (loss) | | 1,120,668,756 |
Change in net unrealized appreciation (depreciation) on: Investment securities (net of decrease in deferred foreign taxes of $2,038,588) | 1,583,635,658 | |
Assets and liabilities in foreign currencies | (231,552) | |
Total change in net unrealized appreciation (depreciation) | | 1,583,404,106 |
Net gain (loss) | | 2,704,072,862 |
Net increase (decrease) in net assets resulting from operations | | $ 2,823,289,310 |
See accompanying notes which are an integral part of the financial statements.
Annual Report
Statement of Changes in Net Assets
| Year ended
October 31,
2007 | Year ended
October 31,
2006 |
Increase (Decrease) in Net Assets | | |
Operations | | |
Net investment income (loss) | $ 119,216,448 | $ 88,135,211 |
Net realized gain (loss) | 1,120,668,756 | 865,971,702 |
Change in net unrealized appreciation (depreciation) | 1,583,404,106 | 392,508,226 |
Net increase (decrease) in net assets resulting from operations | 2,823,289,310 | 1,346,615,139 |
Distributions to shareholders from net investment income | (85,344,347) | (51,835,782) |
Distributions to shareholders from net realized gain | (719,995,618) | (20,228,519) |
Total distributions | (805,339,965) | (72,064,301) |
Share transactions
Proceeds from sales of shares | 2,023,578,024 | 2,352,534,453 |
Reinvestment of distributions | 797,167,795 | 71,154,819 |
Cost of shares redeemed | (2,512,867,122) | (1,215,037,539) |
Net increase (decrease) in net assets resulting from share transactions | 307,878,697 | 1,208,651,733 |
Redemption fees | 238,697 | 287,325 |
Total increase (decrease) in net assets | 2,326,066,739 | 2,483,489,896 |
| | |
Net Assets | | |
Beginning of period | 7,217,286,709 | 4,733,796,813 |
End of period (including undistributed net investment income of $106,479,330 and undistributed net investment
income of $82,749,519, respectively) | $ 9,543,353,448 | $ 7,217,286,709 |
Other Information Shares | | |
Sold | 41,499,511 | 53,641,186 |
Issued in reinvestment of distributions | 18,292,055 | 1,782,435 |
Redeemed | (49,648,078) | (27,857,412) |
Net increase (decrease) | 10,143,488 | 27,566,209 |
Financial Highlights
Years ended October 31, | 2007 | 2006 | 2005 | 2004 | 2003 |
Selected Per-Share Data | | | | | |
Net asset value, beginning of period | $ 47.08 | $ 37.65 | $ 32.21 | $ 29.19 | $ 22.34 |
Income from Investment Operations | | | | | |
Net investment income (loss) B | .70 | .63 | .39 | .17 E | .18 |
Net realized and unrealized gain (loss) | 15.80 | 9.37 | 5.35 | 3.15 | 6.76 |
Total from investment operations | 16.50 | 10.00 | 5.74 | 3.32 | 6.94 |
Distributions from net investment income | (.55) | (.41) | (.19) | (.30) | (.09) |
Distributions from net realized gain | (4.64) | (.16) | (.11) | - | - |
Total distributions | (5.19) | (.57) | (.30) | (.30) | (.09) |
Redemption fees added to paid in capital B | - G | - G | - G | - G | - G |
Net asset value, end of period | $ 58.39 | $ 47.08 | $ 37.65 | $ 32.21 | $ 29.19 |
Total Return A | 38.79% | 26.83% | 17.90% | 11.45% | 31.18% |
Ratios to Average Net Assets C, F | | | | | |
Expenses before reductions | .95% | 1.00% | .93% | 1.05% | 1.04% |
Expenses net of fee waivers, if any | .95% | 1.00% | .93% | 1.05% | 1.04% |
Expenses net of all reductions | .91% | .90% | .86% | 1.01% | 1.00% |
Net investment income (loss) | 1.43% | 1.43% | 1.11% | .55% E | .75% |
Supplemental Data | | | | | |
Net assets, end of period (000 omitted) | $ 9,543,353 | $ 7,217,287 | $ 4,733,797 | $ 4,182,103 | $ 3,500,394 |
Portfolio turnover rate D | 87% | 132% | 87% | 79% | 104% |
A Total returns would have been lower had certain expenses not been reduced during the periods shown. B Calculated based on average shares outstanding during the period. C Fees and expenses of the underlying Fidelity Central Funds are not included in the Fund's expense ratio. The Fund indirectly bears its proportionate share of the expenses of any underlying Fidelity Central Funds. D Amount does not include the portfolio activity of any underlying Fidelity Central Funds. E Net investment income per share includes approximately $.01 per share received as a result of a reorganization of an issuer that was in bankruptcy. Excluding this non-recurring amount, the ratio of net investment income (loss) to average net assets would have been ..52%. F Expense ratios reflect operating expenses of the Fund. Expenses before reductions do not reflect amounts reimbursed by the investment adviser or reductions from brokerage service arrangements or other expense offset arrangements and do not represent the amount paid by the Fund during periods when reimbursements or reductions occur. Expenses net of fee waivers reflect expenses after reimbursement by the investment adviser but prior to reductions from brokerage service arrangements or other expense offset arrangements. Expenses net of all reductions represent the net expenses paid by the Fund. G Amount represents less than $.01 per share. |
See accompanying notes which are an integral part of the financial statements.
Annual Report
Worldwide
Performance: The Bottom Line
Average annual total return reflects the change in the value of an investment, assuming reinvestment of the fund's dividend income and capital gains (the profits earned upon the sale of securities that have grown in value) and assuming a constant rate of performance each year. The $10,000 table and the fund's returns do not reflect the deduction of taxes that a shareholder would pay on fund distributions or the redemption of fund shares. During periods of reimbursement by Fidelity, a fund's total return will be greater than it would be had the reimbursement not occurred. How a fund did yesterday is no guarantee of how it will do tomorrow.
Average Annual Total Returns
Periods ended October 31, 2007 | Past 1
year | Past 5
years | Past 10
years |
Fidelity Worldwide Fund | 31.87% | 20.98% | 9.79% |
$10,000 Over 10 Years
Let's say hypothetically that $10,000 was invested in Fidelity Worldwide Fund on October 31, 1997. The chart shows how the value of your investment would have changed, and also shows how the Morgan Stanley Capital International World Index performed over the same period.
Annual Report
Worldwide
Management's Discussion of Fund Performance
Comments from William Kennedy, Lead Portfolio Manager of Fidelity® Worldwide Fund and manager of its non-U.S. equity investments, and from Stephen DuFour, Co-Portfolio Manager responsible for the fund's U.S. equity subportfolio. Kennedy became Lead Portfolio Manager and DuFour became Co-Portfolio Manager on October 1, 2007.
Foreign stocks, with a large assist from a weak U.S. dollar, generally had higher returns for U.S. investors than domestic equities during the 12-month period ending October 31, 2007. The backdrop for global stocks was solid, with robust economic growth and relatively high corporate profitability worldwide. Developed international equity markets, as measured by the Morgan Stanley Capital InternationalSM Europe, Australasia, and Far East (MSCI® EAFE®) Index - a performance monitor of established markets outside the United States and Canada - rose 25.09%. In comparison, the Standard & Poor's 500SM Index, a gauge of U.S. stocks, was up 14.56%, while Canada did appreciably better, as measured by the 43.24% advance of the S&P/TSX Composite Index. Among countries making up at least 1% of the EAFE benchmark, Finland had the best showing, soaring nearly 69%, while Hong Kong gained roughly 66%. The United Kingdom and Japan, the two largest components of the index, both underperformed. Fallout from the credit crunch and concerns about export growth tempered U.K. stocks, while Japan struggled with a slowdown in consumer spending and sluggish domestic growth. Emerging markets were the period's big winners, advancing 68.33% as measured by the MSCI Emerging Markets index.
The fund gained 31.87% for the year ending October 31, 2007, nicely outpacing the 20.79% return of the MSCI World index. Stock picking was exceptionally strong in both the U.S. and non-U.S. subportfolios. Gains in Europe and non-index component South Korea, as well as in capital goods, pharmaceuticals/ biotechnology/life science, and software and services helped the non-U.S. subportfolio. Top individual contributors included Nintendo, the Japanese electronic game company, and CSL, an Australian biotech company benefiting from improved pricing for blood plasma products and royalty income from a new vaccine. Overweightings in health care and consumer discretionary and a modest stake in cash nicked returns. Individual disappointments included not owning Volkswagen, a German car maker in the index that climbed on takeover news. In the U.S. subportfolio, stock selection in industrials, financials, technology, materials and health care stood out. Winners included ABB, a Swiss-based global manufacturer of power transmission and distribution equipment, and Apple. ABB benefited from growing demand worldwide, while Apple's string of product successes drove it higher. Stock picking in consumer discretionary was a detractor, as several retail holdings - including JCPenney - disappointed investors amid slowing economic growth. JCPenney was gone from the portfolio by period end.
The views expressed above reflect those of the portfolio manager(s) only through the end of the period as stated on the cover of this report and do not necessarily represent the views of Fidelity or any other person in the Fidelity organization. Any such views are subject to change at any time based upon market or other conditions and Fidelity disclaims any responsibility to update such views. These views may not be relied on as investment advice and, because investment decisions for a Fidelity fund are based on numerous factors, may not be relied on as an indication of trading intent on behalf of any Fidelity fund.
Annual Report
Worldwide
Investment Changes
Geographic Diversification (% of fund's net assets) |
As of October 31, 2007 |
| United States of America | 40.5% | |
| Japan | 7.9% | |
| United Kingdom | 7.8% | |
| Germany | 7.2% | |
| Switzerland | 5.8% | |
| France | 5.8% | |
| Australia | 5.4% | |
| Canada | 1.8% | |
| Spain | 1.7% | |
| Other | 16.1% | |

Percentages are adjusted for the effect of futures contracts, if applicable. |
|
As of April 30, 2007 |
| United States of America | 42.1% | |
| Japan | 8.7% | |
| United Kingdom | 8.4% | |
| Switzerland | 7.8% | |
| Germany | 5.7% | |
| France | 5.6% | |
| Australia | 3.8% | |
| Netherlands | 1.9% | |
| Canada | 1.8% | |
| Other | 14.2% | |

Percentages are adjusted for the effect of futures contracts, if applicable. |
Asset Allocation |
| % of fund's
net assets | % of fund's net assets
6 months ago |
Stocks | 97.2 | 99.5 |
Short-Term Investments and Net Other Assets | 2.8 | 0.5 |
Top Ten Stocks as of October 31, 2007 |
| % of fund's
net assets | % of fund's net assets
6 months ago |
Exxon Mobil Corp. (United States of America, Oil, Gas & Consumable Fuels) | 2.7 | 1.5 |
AT&T, Inc. (United States of America, Diversified Telecommunication Services) | 2.0 | 1.5 |
ABB Ltd. (Switzerland, Electrical Equipment) | 1.7 | 2.2 |
Merck & Co., Inc. (United States of America, Pharmaceuticals) | 1.6 | 1.2 |
State Street Corp. (United States of America, Capital Markets) | 1.4 | 0.6 |
CSL Ltd. (Australia, Biotechnology) | 1.4 | 0.9 |
Union Pacific Corp. (United States of America, Road & Rail) | 1.4 | 0.0 |
Hewlett-Packard Co. (United States of America, Computers & Peripherals) | 1.4 | 0.0 |
Fannie Mae (United States of America, Thrifts & Mortgage Finance) | 1.2 | 0.0 |
Google, Inc. Class A (sub. vtg.) (United States of America, Internet Software & Services) | 1.2 | 1.1 |
| 16.0 | |
Market Sectors as of October 31, 2007 |
| % of fund's
net assets | % of fund's net assets
6 months ago |
Industrials | 16.8 | 12.8 |
Information Technology | 16.3 | 12.7 |
Financials | 14.9 | 20.5 |
Health Care | 9.4 | 9.8 |
Materials | 9.0 | 5.5 |
Energy | 8.8 | 7.6 |
Consumer Discretionary | 7.5 | 13.5 |
Telecommunication Services | 5.4 | 3.9 |
Consumer Staples | 5.1 | 8.8 |
Utilities | 4.0 | 4.4 |
Annual Report
Worldwide
Investments October 31, 2007
Showing Percentage of Net Assets
Common Stocks - 96.6% |
| Shares | | Value |
Australia - 5.4% |
AMP Ltd. | 129,360 | | $ 1,238,607 |
Aristocrat Leisure Ltd. (d) | 100,765 | | 985,629 |
AXA Asia Pacific Holdings Ltd. | 239,300 | | 1,830,717 |
Babcock & Brown Japan Property Trust | 926,600 | | 1,450,456 |
Babcock & Brown Ltd. | 164,271 | | 4,756,543 |
Babcock & Brown Wind Partners | 918,400 | | 1,580,344 |
BHP Billiton Ltd. sponsored ADR | 97,200 | | 8,481,672 |
Brambles Ltd. | 234,168 | | 3,117,017 |
Cochlear Ltd. | 46,300 | | 2,977,186 |
Commonwealth Bank of Australia | 83,600 | | 4,814,874 |
Computershare Ltd. | 414,665 | | 3,343,464 |
CSL Ltd. | 743,247 | | 25,267,499 |
Downer EDI Ltd. | 235,094 | | 1,466,008 |
Goodman Group unit | 285,587 | | 1,851,222 |
Macquarie Bank Ltd. | 37,034 | | 2,957,753 |
Mortgage Choice Ltd. | 186,300 | | 429,073 |
National Australia Bank Ltd. | 145,335 | | 5,879,940 |
Newcrest Mining Ltd. | 207,816 | | 6,334,940 |
Oxiana Ltd. | 178,299 | | 710,587 |
QBE Insurance Group Ltd. | 125,680 | | 3,846,131 |
Seek Ltd. | 120,324 | | 1,053,046 |
United Group Ltd. | 33,427 | | 669,035 |
Woolworths Ltd. | 171,349 | | 5,370,363 |
WorleyParsons Ltd. | 110,562 | | 4,997,743 |
TOTAL AUSTRALIA | | 95,409,849 |
Austria - 0.2% |
Raiffeisen International Bank Holding AG | 19,808 | | 3,274,422 |
Strabag SE (a) | 14,200 | | 1,114,849 |
TOTAL AUSTRIA | | 4,389,271 |
Belgium - 0.1% |
InBev SA | 22,000 | | 2,076,884 |
Bermuda - 0.6% |
Aquarius Platinum Ltd. (United Kingdom) | 93,800 | | 3,594,124 |
MF Global Ltd. | 135,000 | | 3,990,600 |
Ports Design Ltd. | 286,500 | | 1,081,598 |
Sinofert Holdings Ltd. | 2,433,100 | | 2,295,070 |
TOTAL BERMUDA | | 10,961,392 |
Brazil - 0.8% |
B2W Companhia Global Do Varejo | 71,300 | | 3,849,153 |
Bovespa Holding SA (a) | 219,000 | | 4,170,886 |
Brasil Telecom SA sponsored ADR | 125,000 | | 3,698,750 |
Uniao de Bancos Brasileiros SA (Unibanco) GDR | 21,200 | | 3,350,448 |
TOTAL BRAZIL | | 15,069,237 |
Canada - 1.8% |
Niko Resources Ltd. | 32,300 | | 3,619,297 |
Open Text Corp. (a) | 84,300 | | 2,634,710 |
|
| Shares | | Value |
Potash Corp. of Saskatchewan, Inc. | 97,600 | | $ 11,987,233 |
Research In Motion Ltd. (a) | 115,000 | | 14,318,651 |
TOTAL CANADA | | 32,559,891 |
Cayman Islands - 0.5% |
Alibaba.com Ltd. (a) | 144,000 | | 464,495 |
Chaoda Modern Agriculture (Holdings) Ltd. | 758,000 | | 691,775 |
CNinsure, Inc. ADR (a) | 7,400 | | 187,146 |
Lee & Man Paper Manufacturing Ltd. | 585,100 | | 2,340,601 |
Subsea 7, Inc. (a) | 51,100 | | 1,499,720 |
Suntech Power Holdings Co. Ltd. sponsored ADR (a) | 52,900 | | 3,115,281 |
TOTAL CAYMAN ISLANDS | | 8,299,018 |
China - 0.2% |
Jiangsu Expressway Co. Ltd. (H Shares) | 849,700 | | 982,992 |
Nine Dragons Paper (Holdings) Ltd. | 654,000 | | 1,771,537 |
TOTAL CHINA | | 2,754,529 |
Cyprus - 0.2% |
Aisi Realty Public Ltd. | 583,060 | | 509,129 |
Marfin Popular Bank Public Co. | 163,149 | | 2,652,074 |
TOTAL CYPRUS | | 3,161,203 |
Czech Republic - 0.1% |
Ceske Energeticke Zavody AS | 35,200 | | 2,544,373 |
Denmark - 0.4% |
Vestas Wind Systems AS (a) | 74,000 | | 6,602,198 |
Finland - 1.2% |
Citycon Oyj | 50,514 | | 329,331 |
Nokia Corp. sponsored ADR | 459,600 | | 18,255,312 |
Wartsila Corp. (B Shares) | 27,200 | | 2,222,575 |
TOTAL FINLAND | | 20,807,218 |
France - 5.8% |
Accor SA | 20,000 | | 1,908,649 |
Alcatel-Lucent SA | 69,600 | | 674,424 |
Alstom SA | 73,900 | | 17,441,104 |
AXA SA | 101,700 | | 4,549,041 |
BNP Paribas SA | 26,382 | | 2,908,330 |
Cap Gemini SA | 39,000 | | 2,486,141 |
CNP Assurances | 13,200 | | 1,682,735 |
Electricite de France | 55,700 | | 6,681,001 |
Gameloft (a) | 341,200 | | 3,514,690 |
Gaz de France | 50,600 | | 2,873,724 |
Geodis SA | 4,900 | | 1,057,769 |
Groupe Danone | 30,400 | | 2,622,000 |
Icade SA | 36,500 | | 2,693,768 |
L'Oreal SA | 14,900 | | 1,951,900 |
LVMH Moet Hennessy - Louis Vuitton | 22,400 | | 2,884,433 |
Neopost SA | 16,600 | | 1,928,095 |
Neuf Cegetel | 41,400 | | 2,093,313 |
Orpea (a) | 34,000 | | 2,149,179 |
Common Stocks - continued |
| Shares | | Value |
France - continued |
Pinault Printemps-Redoute SA | 9,800 | | $ 1,942,603 |
Remy Cointreau SA | 18,300 | | 1,406,517 |
Renault SA | 29,000 | | 4,869,562 |
Sechilienne-Sidec | 10,900 | | 978,783 |
Societe Generale Series A | 10,985 | | 1,850,973 |
Suez SA (France) | 74,400 | | 4,836,000 |
Total SA Series B | 118,996 | | 9,592,268 |
Veolia Environnement | 57,562 | | 5,141,353 |
Vinci SA | 84,000 | | 6,890,609 |
Vivendi | 69,016 | | 3,107,701 |
TOTAL FRANCE | | 102,716,665 |
Germany - 6.7% |
Adidas-Salomon AG | 30,700 | | 2,048,219 |
Allianz AG (Reg.) | 38,100 | | 8,610,600 |
Bayer AG | 105,100 | | 8,660,240 |
Bayer AG sponsored ADR | 139,300 | | 11,478,320 |
CompuGROUP Holding AG (a) | 33,200 | | 690,237 |
Continental AG | 14,400 | | 2,177,859 |
DaimlerChrysler AG | 85,000 | | 9,362,750 |
DaimlerChrysler AG (Reg.) | 43,700 | | 4,813,555 |
Deutsche Boerse AG | 45,700 | | 7,210,286 |
E.ON AG | 77,800 | | 15,194,340 |
Gerresheimer AG | 19,600 | | 1,079,066 |
Hochtief AG | 32,600 | | 4,501,575 |
K&S AG | 14,700 | | 3,073,422 |
Linde AG | 32,214 | | 4,076,301 |
MAN AG | 22,800 | | 4,069,621 |
MTU Aero Engines Holding AG | 3,700 | | 225,894 |
Muenchener Rueckversicherungs-Gesellschaft AG (Reg.) | 24,000 | | 4,604,402 |
Q-Cells AG (a) | 47,200 | | 6,010,897 |
SGL Carbon AG (a) | 40,100 | | 2,339,561 |
Siemens AG: | | | |
(Reg.) | 56,600 | | 7,718,542 |
sponsored ADR | 35,900 | | 4,895,683 |
SolarWorld AG | 69,100 | | 4,687,248 |
Wincor Nixdorf AG | 14,900 | | 1,480,013 |
TOTAL GERMANY | | 119,008,631 |
Greece - 0.3% |
EFG Eurobank Ergasias SA | 52,473 | | 2,041,975 |
Marfin Financial Group Holdings SA | 84,400 | | 802,148 |
National Bank of Greece SA | 34,500 | | 2,398,213 |
TOTAL GREECE | | 5,242,336 |
Hong Kong - 0.7% |
China Mobile (Hong Kong) Ltd. | 96,500 | | 2,001,024 |
Esprit Holdings Ltd. | 430,600 | | 7,191,494 |
Li & Fung Ltd. | 716,100 | | 3,398,103 |
TOTAL HONG KONG | | 12,590,621 |
|
| Shares | | Value |
India - 1.0% |
Bharti Airtel Ltd. (a) | 239,722 | | $ 6,193,285 |
Infosys Technologies Ltd. | 62,311 | | 2,956,886 |
Reliance Industries Ltd. | 74,079 | | 5,287,768 |
Satyam Computer Services Ltd. | 197,732 | | 2,430,339 |
TOTAL INDIA | | 16,868,278 |
Indonesia - 0.1% |
PT Perusahaan Gas Negara Tbk Series B | 953,000 | | 1,493,516 |
Ireland - 0.2% |
Paddy Power PLC (Ireland) | 37,500 | | 1,551,122 |
Ryanair Holdings PLC sponsored ADR (a) | 29,300 | | 1,441,267 |
TOTAL IRELAND | | 2,992,389 |
Israel - 0.3% |
Israel Chemicals Ltd. | 256,100 | | 2,818,201 |
Nice Systems Ltd. sponsored ADR (a) | 64,700 | | 2,551,121 |
TOTAL ISRAEL | | 5,369,322 |
Italy - 1.1% |
AEM SpA | 454,300 | | 1,911,383 |
Edison SpA | 596,100 | | 2,026,939 |
ENI SpA | 67,751 | | 2,475,622 |
Fiat SpA | 162,200 | | 5,233,347 |
Impregilo SpA (a) | 77,000 | | 616,914 |
Prysmian SpA | 63,500 | | 1,824,428 |
Unicredito Italiano SpA | 587,600 | | 5,022,758 |
TOTAL ITALY | | 19,111,391 |
Japan - 7.9% |
Aeon Mall Co. Ltd. | 47,700 | | 1,240,784 |
Asahi Glass Co. Ltd. | 121,000 | | 1,666,742 |
Asics Corp. | 193,000 | | 3,078,284 |
Canon, Inc. | 155,850 | | 7,881,334 |
Chiba Bank Ltd. | 132,000 | | 1,059,696 |
East Japan Railway Co. | 221 | | 1,820,854 |
Fujifilm Holdings Corp. | 95,400 | | 4,573,476 |
Honda Motor Co. Ltd. | 97,300 | | 3,641,939 |
Ibiden Co. Ltd. | 28,300 | | 2,399,371 |
Japan Tobacco, Inc. | 782 | | 4,558,989 |
Kawasaki Kisen Kaisha Ltd. | 148,000 | | 2,054,723 |
Keyence Corp. | 5,000 | | 1,152,505 |
Konica Minolta Holdings, Inc. | 182,500 | | 3,195,461 |
Kubota Corp. | 369,000 | | 3,098,564 |
Leopalace21 Corp. | 19,800 | | 632,211 |
Matsui Securities Co. Ltd. | 145,100 | | 1,153,131 |
Mitsubishi Corp. | 84,600 | | 2,634,624 |
Mitsubishi Estate Co. Ltd. | 127,600 | | 3,826,058 |
Mitsui & Co. Ltd. | 201,000 | | 5,214,681 |
Mitsui Fudosan Co. Ltd. | 147,000 | | 4,067,486 |
Murata Manufacturing Co. Ltd. | 41,000 | | 2,495,679 |
Namco Bandai Holdings, Inc. | 106,100 | | 1,636,168 |
NGK Insulators Ltd. | 140,000 | | 4,964,226 |
Nintendo Co. Ltd. | 33,100 | | 20,786,800 |
Common Stocks - continued |
| Shares | | Value |
Japan - continued |
Nippon Building Fund, Inc. | 157 | | $ 2,277,932 |
Nippon Electric Glass Co. Ltd. | 55,000 | | 935,017 |
Nippon Steel Corp. | 299,000 | | 1,987,740 |
Nomura Holdings, Inc. | 183,100 | | 3,264,673 |
NSK Ltd. | 227,000 | | 2,013,071 |
ORIX Corp. | 16,630 | | 3,411,990 |
Sony Corp. sponsored ADR | 50,800 | | 2,512,568 |
Sony Financial Holdings, Inc. | 130 | | 467,748 |
Sumco Corp. | 67,500 | | 2,464,095 |
Sumitomo Corp. | 118,700 | | 2,068,666 |
Sumitomo Electric Industries Ltd. | 107,500 | | 1,740,832 |
Sumitomo Metal Industries Ltd. | 106,100 | | 525,268 |
Sumitomo Mitsui Financial Group, Inc. | 697 | | 5,710,591 |
Sumitomo Trust & Banking Co. Ltd. | 149,200 | | 1,112,677 |
Takeda Pharmaceutical Co. Ltd. | 124,900 | | 7,803,505 |
Tokuyama Corp. | 202,300 | | 2,826,276 |
Toyota Motor Corp. | 168,700 | | 9,653,014 |
TOTAL JAPAN | | 139,609,449 |
Korea (South) - 1.1% |
Korean Reinsurance Co. | 56,950 | | 1,015,967 |
LG Household & Health Care Ltd. | 35,200 | | 7,848,030 |
NHN Corp. (a) | 17,982 | | 5,782,619 |
Samsung Fire & Marine Insurance Co. Ltd. | 13,640 | | 3,795,061 |
Shinhan Financial Group Co. Ltd. | 23,166 | | 1,517,026 |
TOTAL KOREA (SOUTH) | | 19,958,703 |
Luxembourg - 1.0% |
Acergy SA | 71,500 | | 2,069,210 |
ArcelorMittal SA | 45,900 | | 3,684,096 |
ArcelorMittal SA (NY Shares) Class A | 126,100 | | 10,081,695 |
SES SA (A Shares) FDR unit | 98,454 | | 2,367,827 |
TOTAL LUXEMBOURG | | 18,202,828 |
Malaysia - 0.6% |
DiGi.com Bhd | 229,400 | | 1,727,858 |
Gamuda Bhd | 3,356,600 | | 4,628,030 |
IJM Corp. Bhd | 533,300 | | 1,400,925 |
KNM Group Bhd | 1,210,800 | | 2,143,186 |
TOTAL MALAYSIA | | 9,899,999 |
Mexico - 0.8% |
America Movil SAB de CV Series L sponsored ADR | 201,600 | | 13,182,624 |
Urbi, Desarrollos Urbanos, SA de CV (a) | 257,800 | | 996,152 |
TOTAL MEXICO | | 14,178,776 |
Netherlands - 1.1% |
CNH Global NV | 45,900 | | 3,010,122 |
Heineken NV (Bearer) | 58,000 | | 4,048,400 |
ING Groep NV (Certificaten Van Aandelen) | 20,100 | | 904,299 |
|
| Shares | | Value |
Koninklijke KPN NV | 120,100 | | $ 2,265,491 |
Koninklijke Numico NV | 22,700 | | 1,808,827 |
Koninklijke Philips Electronics NV | 81,200 | | 3,356,808 |
Nutreco Holding NV | 41,100 | | 2,807,579 |
SBM Offshore NV | 44,372 | | 1,707,440 |
TOTAL NETHERLANDS | | 19,908,966 |
Netherlands Antilles - 0.2% |
Schlumberger Ltd. (NY Shares) | 45,500 | | 4,393,935 |
Norway - 1.5% |
Aker Kvaerner ASA | 204,450 | | 7,124,224 |
Hafslund ASA (B Shares) | 42,200 | | 1,250,312 |
Marine Harvest ASA (a) | 2,535,800 | | 2,570,531 |
Petroleum Geo-Services ASA | 119,800 | | 3,527,141 |
Pronova BioPharma ASA | 407,100 | | 1,873,730 |
Renewable Energy Corp. AS (a) | 117,500 | | 5,988,307 |
StatoilHydro ASA | 131,200 | | 4,439,750 |
TOTAL NORWAY | | 26,773,995 |
Papua New Guinea - 0.1% |
Lihir Gold Ltd. (a) | 592,521 | | 2,352,379 |
Singapore - 0.3% |
Keppel Corp. Ltd. | 140,000 | | 1,439,079 |
Singapore Exchange Ltd. | 342,000 | | 3,747,500 |
TOTAL SINGAPORE | | 5,186,579 |
South Africa - 0.0% |
JSE Ltd. | 19,900 | | 264,864 |
Spain - 1.7% |
Banco Santander Central Hispano SA | 348,200 | | 7,567,082 |
Compania de Distribucion Integral Logista SA | 10,100 | | 787,981 |
Inditex SA | 96,400 | | 7,171,763 |
Sol Melia SA | 16,900 | | 324,423 |
Telefonica SA | 436,900 | | 14,483,235 |
TOTAL SPAIN | | 30,334,484 |
Sweden - 0.8% |
H&M Hennes & Mauritz AB (B Shares) | 73,050 | | 4,863,293 |
Modern Times Group MTG AB (B Shares) | 68,500 | | 4,813,732 |
Scania AB (B Shares) | 150,200 | | 4,101,468 |
TOTAL SWEDEN | | 13,778,493 |
Switzerland - 5.8% |
ABB Ltd.: | | | |
(Reg.) | 14,171 | | 426,243 |
sponsored ADR | 1,020,900 | | 30,851,598 |
Actelion Ltd. (Reg.) (a) | 102,960 | | 5,115,556 |
BB Biotech AG | 20,557 | | 1,804,927 |
Compagnie Financiere Richemont unit | 33,269 | | 2,373,895 |
Credit Suisse Group (Reg.) | 58,762 | | 3,978,187 |
EFG International | 31,770 | | 1,485,233 |
Julius Baer Holding AG (Bearer) | 61,054 | | 5,281,543 |
Common Stocks - continued |
| Shares | | Value |
Switzerland - continued |
Lindt & Spruengli AG (participation certificate) | 1,255 | | $ 4,333,938 |
Nestle SA (Reg.) | 23,728 | | 10,962,336 |
Novartis AG sponsored ADR | 46,200 | | 2,456,454 |
Roche Holding AG (participation certificate) | 65,794 | | 11,244,195 |
SGS Societe Generale de Surveillance Holding SA (Reg.) | 1,632 | | 2,138,803 |
Sonova Holding AG | 43,235 | | 4,852,413 |
Swiss Life Holding | 5,699 | | 1,574,445 |
Syngenta AG (Switzerland) | 11,261 | | 2,729,103 |
Tecan Group AG | 18,800 | | 1,257,878 |
The Swatch Group AG (Reg.) | 80,215 | | 5,038,109 |
UBS AG (NY Shares) | 64,090 | | 3,440,992 |
Zurich Financial Services AG (Reg.) | 7,145 | | 2,151,272 |
TOTAL SWITZERLAND | | 103,497,120 |
Taiwan - 0.5% |
Gemtek Technology Corp. | 26,088 | | 58,707 |
Hon Hai Precision Industry Co. Ltd. (Foxconn) | 546,536 | | 4,150,266 |
PixArt Imaging, Inc. | 10,900 | | 95,390 |
Shin Kong Financial Holding Co. Ltd. | 657,948 | | 609,305 |
Siliconware Precision Industries Co. Ltd. | 747,348 | | 1,575,671 |
Wistron Corp. | 886,550 | | 1,765,164 |
TOTAL TAIWAN | | 8,254,503 |
United Kingdom - 7.8% |
Anglo American PLC (United Kingdom) | 59,485 | | 4,098,500 |
Autonomy Corp. PLC (a) | 169,700 | | 3,466,405 |
BAE Systems PLC | 271,000 | | 2,805,844 |
Barclays PLC | 86,100 | | 1,094,546 |
BG Group PLC | 87,500 | | 1,614,376 |
BG Group PLC sponsored ADR | 12,700 | | 1,171,575 |
BHP Billiton PLC | 288,200 | | 10,971,026 |
Blinkx PLC | 169,700 | | 112,019 |
BP PLC | 314,375 | | 4,086,351 |
BP PLC sponsored ADR | 6,500 | | 506,935 |
British American Tobacco PLC | 168,700 | | 6,467,958 |
Burberry Group PLC | 45,000 | | 575,377 |
Capita Group PLC | 94,819 | | 1,476,529 |
Clipper Windpower PLC (a) | 128,900 | | 1,782,130 |
GlaxoSmithKline PLC sponsored ADR | 60,100 | | 3,080,125 |
Gyrus Group PLC (a) | 217,700 | | 1,934,904 |
HSBC Holdings PLC (Hong Kong) (Reg.) | 86,838 | | 1,728,424 |
Informa PLC | 83,000 | | 923,202 |
International Power PLC | 572,500 | | 5,820,352 |
Investec PLC | 190,000 | | 2,295,063 |
John Wood Group PLC | 191,600 | | 1,663,094 |
Marks & Spencer Group PLC | 116,500 | | 1,579,205 |
Misys PLC | 141,300 | | 710,188 |
N Brown Group PLC | 251,500 | | 1,512,434 |
National Grid PLC | 211,900 | | 3,531,014 |
|
| Shares | | Value |
Next PLC | 57,000 | | $ 2,616,609 |
Pearson PLC | 156,500 | | 2,594,836 |
Punch Taverns Ltd. | 52,400 | | 1,094,869 |
Reckitt Benckiser Group PLC | 123,800 | | 7,178,506 |
Renovo Group PLC (a) | 764,000 | | 3,208,556 |
Rio Tinto PLC sponsored ADR | 10,200 | | 3,825,000 |
Rolls-Royce Group PLC | 255,832 | | 2,861,555 |
Royal Bank of Scotland Group PLC | 420,274 | | 4,513,025 |
Royal Dutch Shell PLC Class B | 229,200 | | 9,998,850 |
RPS Group PLC | 261,900 | | 2,120,840 |
Shire PLC | 134,600 | | 3,371,730 |
SSL International PLC | 439,200 | | 4,702,562 |
Tesco PLC | 639,743 | | 6,557,371 |
Vodafone Group PLC | 3,074,800 | | 12,074,740 |
Vodafone Group PLC sponsored ADR | 71,412 | | 2,804,349 |
Xstrata PLC | 42,500 | | 3,045,756 |
TOTAL UNITED KINGDOM | | 137,576,730 |
United States of America - 37.7% |
Adobe Systems, Inc. (a) | 165,200 | | 7,913,080 |
AES Corp. (a) | 286,100 | | 6,125,401 |
AFLAC, Inc. | 50,000 | | 3,139,000 |
Akamai Technologies, Inc. (a) | 125,000 | | 4,898,750 |
Albemarle Corp. | 160,000 | | 7,641,600 |
Allergan, Inc. | 80,500 | | 5,440,190 |
American Superconductor Corp. (a)(d) | 338,800 | | 9,198,420 |
Amphenol Corp. Class A | 154,600 | | 6,844,142 |
Amylin Pharmaceuticals, Inc. (a) | 159,086 | | 7,162,052 |
Apple, Inc. (a) | 97,900 | | 18,596,105 |
AT&T, Inc. | 851,200 | | 35,571,648 |
athenahealth, Inc. | 18,000 | | 688,140 |
Celgene Corp. (a) | 98,100 | | 6,474,600 |
Cisco Systems, Inc. (a) | 501,700 | | 16,586,202 |
Cognizant Technology Solutions Corp. Class A (a) | 199,600 | | 8,275,416 |
CSX Corp. | 120,000 | | 5,372,400 |
CyberSource Corp. (a)(d) | 405,200 | | 6,625,020 |
DealerTrack Holdings, Inc. (a) | 110,500 | | 5,424,445 |
Eaton Corp. | 145,000 | | 13,424,100 |
EMC Corp. (a) | 250,000 | | 6,347,500 |
Exelixis, Inc. (a) | 196,200 | | 2,158,200 |
Exxon Mobil Corp. | 513,800 | | 47,264,461 |
Fannie Mae | 380,000 | | 21,675,200 |
Fluor Corp. | 18,000 | | 2,844,000 |
FMC Corp. | 60,000 | | 3,450,000 |
Freeport-McMoRan Copper & Gold, Inc. Class B | 90,000 | | 10,591,200 |
Fuel Tech, Inc. (a)(d) | 489,423 | | 14,472,238 |
General Growth Properties, Inc. | 171,600 | | 9,328,176 |
Gilead Sciences, Inc. (a) | 173,700 | | 8,023,203 |
Google, Inc. Class A (sub. vtg.) (a) | 30,500 | | 21,563,500 |
Hewlett-Packard Co. | 480,000 | | 24,806,400 |
Infinera Corp. | 65,400 | | 1,443,378 |
Intel Corp. | 305,000 | | 8,204,500 |
Common Stocks - continued |
| Shares | | Value |
United States of America - continued |
Inverness Medical Innovations, Inc. (a) | 158,901 | | $ 9,548,361 |
J.B. Hunt Transport Services, Inc. | 250,000 | | 6,930,000 |
Lehman Brothers Holdings, Inc. | 308,400 | | 19,534,056 |
Macquarie Infrastructure Co. LLC | 8,300 | | 346,608 |
Mastercard, Inc. Class A | 18,800 | | 3,563,540 |
Merck & Co., Inc. | 494,900 | | 28,832,874 |
Microsoft Corp. | 260,000 | | 9,570,600 |
Molson Coors Brewing Co. Class B | 70,600 | | 4,040,438 |
Monsanto Co. | 137,300 | | 13,404,599 |
NRG Energy, Inc. (a) | 55,800 | | 2,547,828 |
Oracle Corp. (a) | 200,000 | | 4,434,000 |
PACCAR, Inc. | 200,000 | | 11,112,000 |
PDL BioPharma, Inc. (a) | 143,700 | | 3,046,440 |
Petrohawk Energy Corp. (a) | 188,400 | | 3,485,400 |
Phorm, Inc. (a) | 40,000 | | 1,706,900 |
PPL Corp. | 113,900 | | 5,888,630 |
Precision Castparts Corp. | 51,000 | | 7,640,310 |
Principal Financial Group, Inc. | 25,000 | | 1,691,750 |
Quanta Services, Inc. (a) | 184,100 | | 6,075,300 |
Quicksilver Resources, Inc. (a) | 86,600 | | 4,936,200 |
Raytheon Co. | 100,000 | | 6,361,000 |
Schering-Plough Corp. | 230,000 | | 7,019,600 |
Service Corp. International | 546,300 | | 7,904,961 |
State Street Corp. | 319,100 | | 25,454,607 |
Sunpower Corp. Class A (a) | 25,300 | | 3,199,438 |
T. Rowe Price Group, Inc. | 210,000 | | 13,490,400 |
The Coca-Cola Co. | 210,000 | | 12,969,600 |
Titanium Metals Corp. (a) | 360,440 | | 12,687,488 |
Union Pacific Corp. | 195,000 | | 24,967,800 |
Visual Sciences, Inc. (a) | 407,800 | | 7,421,960 |
VMware, Inc. Class A | 59,800 | | 7,464,834 |
Washington Group International, Inc. (a) | 81,500 | | 7,934,025 |
Weatherford International Ltd. (a) | 150,000 | | 9,736,500 |
Williams Companies, Inc. | 455,000 | | 16,602,950 |
TOTAL UNITED STATES OF AMERICA | | 669,123,664 |
TOTAL COMMON STOCKS (Cost $1,300,581,017) | 1,713,323,679 |
Nonconvertible Preferred Stocks - 0.6% |
| | | |
Germany - 0.5% |
Fresenius AG (non-vtg.) | 36,000 | | 2,854,542 |
Porsche AG | 1,371 | | 3,652,854 |
ProSiebenSat.1 Media AG | 87,700 | | 2,562,795 |
TOTAL GERMANY | | 9,070,191 |
|
| Shares | | Value |
Italy - 0.1% |
Intesa Sanpaolo SpA | 99,200 | | $ 752,954 |
United Kingdom - 0.0% |
Rolls-Royce Group PLC B Shares (a) | 10,335,612 | | 21,488 |
Rolls-Royce Group PLC B Shares | 1,259 | | 3 |
TOTAL UNITED KINGDOM | | 21,491 |
TOTAL NONCONVERTIBLE PREFERRED STOCKS (Cost $6,816,032) | 9,844,636 |
Money Market Funds - 3.7% |
| | | |
Fidelity Cash Central Fund, 4.97% (b) | 55,269,323 | | 55,269,323 |
Fidelity Securities Lending Cash Central Fund, 5.02% (b)(c) | 10,574,223 | | 10,574,223 |
TOTAL MONEY MARKET FUNDS (Cost $65,843,546) | 65,843,546 |
TOTAL INVESTMENT PORTFOLIO - 100.9% (Cost $1,373,240,595) | | 1,789,011,861 |
NET OTHER ASSETS - (0.9)% | | (15,409,297) |
NET ASSETS - 100% | $ 1,773,602,564 |
Legend |
(a) Non-income producing |
(b) Affiliated fund that is available only to investment companies and other accounts managed by Fidelity Investments. The rate quoted is the annualized seven-day yield of the fund at period end. A complete unaudited listing of the fund's holdings as of its most recent quarter end is available upon request. |
(c) Investment made with cash collateral received from securities on loan. |
(d) Security or a portion of the security is on loan at period end. |
Affiliated Central Funds |
Information regarding fiscal year to date income earned by the Fund from investments in Fidelity Central Funds is as follows: |
Fund | Income earned |
Fidelity Cash Central Fund | $ 943,593 |
Fidelity Securities Lending Cash Central Fund | 341,711 |
Total | $ 1,285,304 |
See accompanying notes which are an integral part of the financial statements.
Annual Report
Worldwide
Financial Statements
Statement of Assets and Liabilities
| October 31, 2007 |
| | |
Assets | | |
Investment in securities, at value (including securities loaned of $10,487,285) - See accompanying schedule: Unaffiliated issuers (cost $1,307,397,049) | $ 1,723,168,315 | |
Fidelity Central Funds (cost $65,843,546) | 65,843,546 | |
Total Investments (cost $1,373,240,595) | | $ 1,789,011,861 |
Receivable for investments sold | | 33,855,779 |
Receivable for fund shares sold | | 2,810,116 |
Dividends receivable | | 1,742,948 |
Distributions receivable from Fidelity Central Funds | | 306,933 |
Prepaid expenses | | 575 |
Other receivables | | 158,150 |
Total assets | | 1,827,886,362 |
| | |
Liabilities | | |
Payable to custodian bank | $ 1,684,678 | |
Payable for investments purchased | 39,168,671 | |
Payable for fund shares redeemed | 865,732 | |
Accrued management fee | 1,213,787 | |
Other affiliated payables | 339,499 | |
Other payables and accrued expenses | 437,208 | |
Collateral on securities loaned, at value | 10,574,223 | |
Total liabilities | | 54,283,798 |
| | |
Net Assets | | $ 1,773,602,564 |
Net Assets consist of: | | |
Paid in capital | | $ 1,168,264,684 |
Undistributed net investment income | | 9,207,582 |
Accumulated undistributed net realized gain (loss) on investments and foreign currency transactions | | 180,617,786 |
Net unrealized appreciation (depreciation) on investments and assets and liabilities in foreign currencies | | 415,512,512 |
Net Assets, for 70,446,578 shares outstanding | | $ 1,773,602,564 |
Net Asset Value, offering price and redemption price per share ($1,773,602,564 ÷ 70,446,578 shares) | | $ 25.18 |
Statement of Operations
| Year ended October 31, 2007 |
| | |
Investment Income | | |
Dividends | | $ 24,782,828 |
Interest | | 2,295 |
Income from Fidelity Central Funds | | 1,285,304 |
| | 26,070,427 |
Less foreign taxes withheld | | (1,589,917) |
Total income | | 24,480,510 |
| | |
Expenses | | |
Management fee
Basic fee | $ 10,364,517 | |
Performance adjustment | 473,885 | |
Transfer agent fees | 3,218,206 | |
Accounting and security lending fees | 656,870 | |
Custodian fees and expenses | 333,900 | |
Independent trustees' compensation | 5,167 | |
Registration fees | 45,988 | |
Audit | 100,372 | |
Legal | 22,252 | |
Interest | 2,619 | |
Miscellaneous | 47,401 | |
Total expenses before reductions | 15,271,177 | |
Expense reductions | (403,346) | 14,867,831 |
| | |
Net investment income (loss) | | 9,612,679 |
Realized and Unrealized Gain (Loss) Net realized gain (loss) on: | | |
Investment securities: | | |
Unaffiliated issuers (net of foreign taxes of $183,484) | 184,204,077 | |
Foreign currency transactions | 41,342 | |
Futures contracts | (187,513) | |
Total net realized gain (loss) | | 184,057,906 |
Change in net unrealized appreciation (depreciation) on: Investment securities (net of increase in deferred foreign taxes of $260,649) | 221,591,259 | |
Assets and liabilities in foreign currencies | 65,027 | |
Total change in net unrealized appreciation (depreciation) | | 221,656,286 |
Net gain (loss) | | 405,714,192 |
Net increase (decrease) in net assets resulting from operations | | $ 415,326,871 |
See accompanying notes which are an integral part of the financial statements.
Annual Report
Worldwide
Financial Statements - continued
Statement of Changes in Net Assets
| Year ended
October 31,
2007 | Year ended
October 31,
2006 |
Increase (Decrease) in Net Assets | | |
Operations | | |
Net investment income (loss) | $ 9,612,679 | $ 11,004,832 |
Net realized gain (loss) | 184,057,906 | 190,489,131 |
Change in net unrealized appreciation (depreciation) | 221,656,286 | 41,357,609 |
Net increase (decrease) in net assets resulting from operations | 415,326,871 | 242,851,572 |
Distributions to shareholders from net investment income | (10,242,312) | (6,174,286) |
Distributions to shareholders from net realized gain | (160,260,858) | (64,208,386) |
Total distributions | (170,503,170) | (70,382,672) |
Share transactions
Proceeds from sales of shares | 384,029,331 | 204,091,203 |
Reinvestment of distributions | 166,220,804 | 68,541,602 |
Cost of shares redeemed | (349,745,488) | (297,960,894) |
Net increase (decrease) in net assets resulting from share transactions | 200,504,647 | (25,328,089) |
Redemption fees | 55,036 | 34,454 |
Total increase (decrease) in net assets | 445,383,384 | 147,175,265 |
| | |
Net Assets | | |
Beginning of period | 1,328,219,180 | 1,181,043,915 |
End of period (including undistributed net investment income of $9,207,582 and undistributed net investment
income of $10,732,638, respectively) | $ 1,773,602,564 | $ 1,328,219,180 |
Other Information Shares | | |
Sold | 17,316,232 | 9,990,392 |
Issued in reinvestment of distributions | 8,382,290 | 3,551,377 |
Redeemed | (16,127,334) | (14,660,695) |
Net increase (decrease) | 9,571,188 | (1,118,926) |
Financial Highlights
Years ended October 31, | 2007 | 2006 | 2005 | 2004 | 2003 |
Selected Per-Share Data | | | | | |
Net asset value, beginning of period | $ 21.82 | $ 19.05 | $ 16.72 | $ 15.30 | $ 11.91 |
Income from Investment Operations | | | | | |
Net investment income (loss) B | .14 | .17 | .15 E | .05 F | .04 |
Net realized and unrealized gain (loss) | 6.05 | 3.74 | 2.30 | 1.44 | 3.37 |
Total from investment operations | 6.19 | 3.91 | 2.45 | 1.49 | 3.41 |
Distributions from net investment income | (.17) | (.10) | (.10) | (.07) | (.02) |
Distributions from net realized gain | (2.66) | (1.04) | (.02) | - | - |
Total distributions | (2.83) | (1.14) | (.12) | (.07) | (.02) |
Redemption fees added to paid in capital B | - H | - H | - H | - H | - H |
Net asset value, end of period | $ 25.18 | $ 21.82 | $ 19.05 | $ 16.72 | $ 15.30 |
Total Return A | 31.87% | 21.31% | 14.71% | 9.77% | 28.68% |
Ratios to Average Net Assets C, G | | | | | |
Expenses before reductions | 1.04% | 1.08% | 1.07% | 1.23% | 1.31% |
Expenses net of fee waivers, if any | 1.04% | 1.08% | 1.07% | 1.23% | 1.31% |
Expenses net of all reductions | 1.02% | 1.02% | 1.01% | 1.19% | 1.28% |
Net investment income (loss) | .66% | .85% | .82% E | .29% F | .28% |
Supplemental Data | | | | | |
Net assets, end of period (000 omitted) | $ 1,773,603 | $ 1,328,219 | $ 1,181,044 | $ 1,064,162 | $ 849,087 |
Portfolio turnover rate D | 128% | 205% | 93% | 95% | 106% |
A Total returns would have been lower had certain expenses not been reduced during the periods shown. B Calculated based on average shares outstanding during the period. C Fees and expenses of the underlying Fidelity Central Funds are not included in the Fund's expense ratio. The Fund indirectly bears its proportionate share of the expenses of any underlying Fidelity Central Funds. D Amount does not include the portfolio activity of any underlying Fidelity Central Funds. E Investment income per share reflects a special dividend which amounted to $.04 per share. Excluding the special dividend, the ratio of net investment income (loss) to average net assets would have been .60%. F Net investment income per share includes approximately $.01 per share received as a result of a reorganization of an issuer that was in bankruptcy. Excluding this non-recurring amount, the ratio of net investment income (loss) to average net assets would have been .25%. G Expense ratios reflect operating expenses of the Fund. Expenses before reductions do not reflect amounts reimbursed by the investment adviser or reductions from brokerage service arrangements or other expense offset arrangements and do not represent the amount paid by the Fund during periods when reimbursements or reductions occur. Expenses net of fee waivers reflect expenses after reimbursement by the investment adviser but prior to reductions from brokerage service arrangements or other expense offset arrangements. Expenses net of all reductions represent the net expenses paid by the Fund. H Amount represents less than $.01 per share. |
See accompanying notes which are an integral part of the financial statements.
Annual Report
Notes to Financial Statements
For the period ended October 31, 2007
1. Organization.
Fidelity Diversified International Fund, Fidelity Aggressive International Fund, Fidelity Overseas Fund and Fidelity Worldwide Fund (the Funds) are funds of Fidelity Investment Trust (the trust). The trust is registered under the Investment Company Act of 1940, as amended (the 1940 Act), as an open-end management investment company organized as a Massachusetts business trust. Each Fund is authorized to issue an unlimited number of shares. Fidelity Diversified International Fund is currently closed to most new accounts. Certain Funds' investments in emerging markets can be subject to social, economic, regulatory, and political uncertainties and can be extremely volatile.
2. Investments in Fidelity Central Funds.
The Funds may invest in Fidelity Central Funds, which are open-end investment companies available only to other investment companies and accounts managed by Fidelity Management & Research Company (FMR) and its affiliates. The Funds' Schedules of Investments list each of the Fidelity Central Funds as an investment of each Fund, but does not include the underlying holdings of each Fidelity Central Fund. As an Investing Fund, the Funds indirectly bear their proportionate share of the expenses of the underlying Fidelity Central Funds.
The Money Market Central Funds seek preservation of capital and current income and are managed by Fidelity Investments Money Management, Inc. (FIMM), an affiliate of FMR.
A complete list of holdings for each Fidelity Central Fund is available upon request or at the SEC's web site at www.sec.gov. In addition, the financial statements of the Fidelity Central Funds, which are not covered by the Funds' Report of Independent Registered Public Accounting Firm, are available on the SEC's web site or upon request.
3. Significant Accounting Policies.
The financial statements have been prepared in conformity with accounting principles generally accepted in the United States of America, which require management to make certain estimates and assumptions at the date of the financial statements. The following summarizes the significant accounting policies of the Funds:
Security Valuation. Investments are valued and net asset value (NAV) per share is calculated (NAV calculation) as of the close of business of the New York Stock Exchange (NYSE), normally 4:00 p.m. Eastern time. Wherever possible, each Fund uses independent pricing services approved by the Board of Trustees to value their investments.
Equity securities, including restricted securities, for which market quotations are readily available, are valued at the last reported sale price or official closing price as reported by an independent pricing service on the primary market or exchange on which they are traded. In the event there were no sales during the day or closing prices are not available, securities are valued at the last quoted bid price. Debt securities, including restricted securities, for which quotations are readily available, are valued by independent pricing services or by dealers who make markets in such securities. Pricing services consider yield or price of bonds of comparable quality, coupon, maturity and type as well as dealer supplied prices. Investments in open-end mutual funds, including the Fidelity Central Funds, are valued at their closing net asset value each business day. Short-term securities with remaining maturities of sixty days or less for which quotations are not readily available are valued at amortized cost, which approximates value.
When current market prices or quotations are not readily available or do not accurately reflect fair value, valuations may be determined in accordance with procedures adopted by the Board of Trustees. For example, when developments occur between the close of a market and the close of the NYSE that may materially affect the value of some or all of the securities, or when trading in a security is halted, those securities may be fair valued. Factors used in the determination of fair value may include monitoring news to identify significant market or security specific events such as changes in the value of U.S. securities markets, reviewing developments in foreign markets and evaluating the performance of ADRs, futures contracts and exchange-traded funds. Because each Fund's utilization of fair value pricing depends on market activity, the frequency with which fair value pricing is used cannot be predicted and may be utilized to a significant extent. The value of securities used for NAV calculation under fair value pricing may differ from published prices for the same securities.
Foreign Currency. Certain Funds may use foreign currency contracts to facilitate transactions in foreign-denominated securities. Losses from these transactions may arise from changes in the value of the foreign currency or if the counterparties do not perform under the contracts' terms.
Foreign-denominated assets, including investment securities, and liabilities are translated into U.S. dollars at the exchange rate at period end. Purchases and sales of investment securities, income and dividends received and expenses denominated in foreign currencies are translated into U.S. dollars at the exchange rate in effect on the transaction date.
The effects of exchange rate fluctuations on investments are included with the net realized and unrealized gain (loss) on investment securities. Other foreign currency transactions resulting in realized and unrealized gain (loss) are disclosed separately.
Annual Report
Notes to Financial Statements - continued
3. Significant Accounting Policies - continued
Investment Transactions and Income. For financial reporting purposes, the Funds' investment holdings and NAV include trades executed through the end of the last business day of the period. The NAV for processing shareholder transactions includes trades executed through the end of the prior business day. Gains and losses on securities sold are determined on the basis of identified cost and may include proceeds received from litigation. Dividend income is recorded on the ex-dividend date, except for certain dividends from foreign securities where the ex-dividend date may have passed, which are recorded as soon as the Funds are informed of the ex-dividend date. Non-cash dividends included in dividend income, if any, are recorded at the fair market value of the securities received. Distributions received on securities that represent a return of capital or capital gain are recorded as a reduction of cost of investments and/or as a realized gain. The Funds estimate the components of distributions received that may be considered return of capital distributions or capital gain distributions. Interest income and distributions from the Fidelity Central Funds are accrued as earned. Interest income includes coupon interest and amortization of premium and accretion of discount on debt securities. Investment income is recorded net of foreign taxes withheld where recovery of such taxes is uncertain.
Expenses. Most expenses of the trust can be directly attributed to a fund. Expenses which cannot be directly attributed are apportioned among each Fund in the trust. Expense estimates are accrued in the period to which they relate and adjustments are made when actual amounts are known.
Deferred Trustee Compensation. Under a Deferred Compensation Plan (the Plan) for Overseas and Diversified International, Independent Trustees must defer receipt of a portion of, and may elect to defer receipt of an additional portion of, their annual compensation. Deferred amounts are invested in a cross-section of Fidelity funds, are marked-to-market and remain in the Fund until distributed in accordance with the Plan. The investment of deferred amounts and the offsetting payable to the Trustees are included in the accompanying Statements of Assets and Liabilities.
Income Tax Information and Distributions to Shareholders. Each year, each Fund intends to qualify as a regulated investment company by distributing all of its taxable income and realized gains under Subchapter M of the Internal Revenue Code. As a result, no provision for income taxes is required in the accompanying financial statements. Foreign taxes are provided for based on each Fund's understanding of the tax rules and rates that exist in the foreign markets in which it invests.
Distributions are recorded on the ex-dividend date. Income and capital gain distributions are determined in accordance with income tax regulations, which may differ from generally accepted accounting principles. In addition, certain Funds will claim a portion of the payment made to redeeming shareholders as a distribution for income tax purposes.
Capital accounts within the financial statements are adjusted for permanent book-tax differences. Certain adjustments have been made to the accounts relating to prior periods. Collectively, these adjustments have no impact on net assets or the results of operations. Temporary book-tax differences will reverse in a subsequent period.
Book-tax differences are primarily due to short-term capital gains, futures and option transactions, foreign currency transactions, certain foreign taxes, passive foreign investment companies (PFIC), market discount, partnerships, deferred trustees compensation and losses deferred due to wash sales.
The tax-basis components of distributable earnings and the federal tax cost as of period end were as follows for each Fund:
| Cost for Federal
Income Tax
Purposes | Unrealized
Appreciation | Unrealized
Depreciation | Net Unrealized
Appreciation/
(Depreciation) |
Diversified International | $ 39,902,318,787 | $ 20,782,314,475 | $ (527,608,073) | $ 20,254,706,402 |
Aggressive International | 750,850,767 | 73,944,632 | (43,535,941) | 30,408,691 |
Overseas | 7,595,532,819 | 2,640,203,481 | (105,478,201) | 2,534,725,280 |
Worldwide | 1,377,560,595 | 428,264,399 | (16,813,133) | 411,451,266 |
| Undistributed
Ordinary
Income | Undistributed
Long-term
Capital Gain |
Diversified International | $ 546,113,911 | $ 3,405,000,465 |
Aggressive International | 73,735,591 | 23,228,078 |
Overseas | 201,459,531 | 836,356,812 |
Worldwide | 53,272,040 | 123,890,744 |
Annual Report
3. Significant Accounting Policies - continued
Income Tax Information and Distributions to Shareholders - continued
The tax character of distributions paid was as follows:
October 31, 2007 | | | |
| Ordinary
Income | Long-term
Capital Gains | Total |
Diversified International | $ 449,483,504 | $ 2,945,308,286 | $ 3,394,791,790 |
Aggressive International | 10,756,243 | 65,613,067 | 76,369,310 |
Overseas | 313,446,407 | 491,893,558 | 805,339,965 |
Worldwide | 44,085,022 | 126,418,148 | 170,503,170 |
October 31, 2006 | | | |
| Ordinary
Income | Long-term
Capital Gains | Total |
Diversified International | $ 342,153,004 | $ 645,163,292 | $ 987,316,296 |
Aggressive International | 7,891,662 | 60,750,944 | 68,642,606 |
Overseas | 72,064,301 | - | 72,064,301 |
Worldwide | 10,496,004 | 59,886,668 | 70,382,672 |
Short-Term Trading (Redemption) Fees. Shares held in the Funds less than 30 days are subject to a redemption fee equal to 1% of the proceeds of the redeemed shares. All redemption fees, including any estimated redemption fees paid by FMR, are retained by the Funds and accounted for as an addition to paid in capital.
New Accounting Pronouncements. In July 2006, Financial Accounting Standards Board Interpretation No. 48, Accounting for Uncertainty in Income Taxes - an interpretation of FASB Statement 109 (FIN 48), was issued and is effective on the last business day of the semiannual reporting period for fiscal years beginning after December 15, 2006. FIN 48 sets forth a threshold for financial statement recognition, measurement and disclosure of a tax position taken or expected to be taken on a tax return. Management has concluded that the adoption of FIN 48 will not result in a material impact on the Funds' net assets, results of operations and financial statement disclosures.
In addition, in September 2006, Statement of Financial Accounting Standards No. 157, Fair Value Measurements (SFAS 157), was issued and is effective for fiscal years beginning after November 15, 2007. SFAS 157 defines fair value, establishes a framework for measuring fair value and expands disclosures about fair value measurements. Management is currently evaluating the impact the adoption of SFAS 157 will have on the Funds' financial statement disclosures.
4. Operating Policies.
Forward Foreign Currency Contracts. Diversified International Fund and Aggressive International Fund generally use foreign currency contracts to facilitate transactions in foreign-denominated securities and to manage the Funds' currency exposure. Contracts to sell generally are used to hedge the Funds' investments against currency fluctuations, while contracts to buy generally are used to offset a previous contract to sell. Also, a contract to buy can be used to acquire exposure to foreign currencies and a contract to sell can be used to offset a previous contract to buy. These contracts involve market risk in excess of the unrealized gain or loss reflected in the Funds' Statement of Assets and Liabilities. The U.S. dollar value of the currencies the Fund has committed to buy or sell is shown in the Schedule of Investments under the caption "Forward Foreign Currency Contracts." This amount represents the aggregate exposure to each currency the Fund has acquired or hedged through currency contracts at period end. Losses may arise from changes in the value of foreign currency or if the counterparties do not perform under the contracts' terms.
The U.S. dollar value of forward foreign currency contracts is determined using forward currency exchange rates supplied by a quotation service. Purchases and sales of forward foreign currency contracts having the same settlement date and broker are offset and any realized gain (loss) recognized on the date of offset; otherwise, gain (loss) is recognized on settlement date. Contracts that have been offset with different counterparties are reflected as both a contract to buy and a contract to sell in the Schedule of Investments under the caption "Forward Foreign Currency Contracts."
Repurchase Agreements. FMR has received an Exemptive Order from the Securities and Exchange Commission (the SEC) which permits certain Funds and other affiliated entities of FMR to transfer uninvested cash balances into joint trading accounts which are then invested in repurchase agreements. Certain Funds may also invest directly with institutions in repurchase agreements. Repurchase agreements are collateralized by government or non-government securities. Upon settlement date, collateral is held in segregated accounts with custodian banks and may be obtained in the event of a default of the counterparty. Each applicable Fund monitors, on a daily basis, the value of the collateral to ensure it is at least equal to the principal amount of the repurchase agreement (including accrued interest). In the event of a default by the counterparty, realization of the collateral proceeds could be delayed, during which time the value of the collateral may decline.
Annual Report
Notes to Financial Statements - continued
4. Operating Policies - continued
Futures Contracts. Certain Funds may use futures contracts to manage their exposure to the stock markets. Buying futures tends to increase a fund's exposure to the underlying instrument, while selling futures tends to decrease a fund's exposure to the underlying instrument or hedge other fund investments. Upon entering into a futures contract, a fund is required to deposit with a clearing broker, no later than the following business day, an amount ("initial margin") equal to a certain percentage of the face value of the contract. The initial margin may be in the form of cash or securities and is transferred to a segregated account on settlement date. Subsequent payments ("variation margin") are made or received by a fund depending on the daily fluctuations in the value of the futures contract and are accounted for as unrealized gains or losses. Realized gains (losses) are recorded upon the expiration or closing of the futures contract. Securities deposited to meet margin requirements are identified in each applicable Fund's Schedule of Investments. Losses may arise from changes in the value of the underlying instruments or if the counterparties do not perform under the contract's terms. Futures contracts are valued at the settlement price established each day by the board of trade or exchange on which they are traded.
Restricted Securities. Certain Funds may invest in securities that are subject to legal or contractual restrictions on resale. These securities generally may be resold in transactions exempt from registration or to the public if the securities are registered. Disposal of these securities may involve time-consuming negotiations and expense, and prompt sale at an acceptable price may be difficult. Information regarding restricted securities is included at the end of each applicable Fund's Schedule of Investments.
5. Purchases and Sales of Investments.
Purchases and sales of securities, other than short-term securities and U.S. Government securities, are noted in the table below.
| Purchases ($) | Sales ($) |
Diversified International | 28,792,560,081 | 24,868,995,667 |
Aggressive International | 837,904,632 | 717,441,191 |
Overseas | 7,013,512,480 | 6,978,226,228 |
Worldwide | 1,874,445,471 | 1,855,303,329 |
Diversified International realized a loss on the sale of an investment not meeting the investment restrictions of the Fund. The loss was fully reimbursed by the Fund's investment advisor.
6. Fees and Other Transactions with Affiliates.
Management Fee. FMR and its affiliates provide the Funds with investment management related services for which the Funds pay a monthly management fee. The management fee is the sum of an individual fund fee rate and a group fee rate. The individual fund fee rate is applied to each Fund's average net assets. The group fee rate is based upon the average net assets of all the mutual funds advised by FMR. The group fee rate decreases as assets under management increase and increases as assets under management decrease. In addition, the management fee for Diversified International, Aggressive International, Overseas and Worldwide is subject to a performance adjustment (up to a maximum ±.20% of each applicable Fund's average net assets over a 36 month performance period). The upward or downward adjustment to the management fee is based on each Fund's relative investment performance as compared to an appropriate benchmark index. For the period, each Fund's annual management fee rate expressed as a percentage of each Fund's average net assets, including the performance adjustment, if applicable , was as follows:
| Individual Rate | Group Rate | Total |
Diversified International | .45% | .26% | .70% |
Aggressive International | .45% | .26% | .49% |
Overseas | .45% | .26% | .68% |
Worldwide | .45% | .26% | .74% |
Transfer Agent Fees. Fidelity Service Company, Inc. (FSC), an affiliate of FMR, is the Funds' transfer, dividend disbursing and shareholder servicing agent. FSC receives account fees and asset-based fees that vary according to account size and type of account. FSC pays for typesetting, printing and mailing of shareholder reports, except proxy statements. For the period, the transfer agent fees were equivalent to the following annual rates expressed as a percentage of average net assets:
Diversified International | .20% |
Aggressive International | .25% |
Overseas | .23% |
Worldwide | .22% |
Accounting and Security Lending Fees. FSC maintains each Fund's accounting records. The accounting fee is based on the level of average net assets for the month. Under a separate contract, FSC administers the security lending program. The security lending fee is based on the number and duration of lending transactions.
Annual Report
6. Fees and Other Transactions with Affiliates - continued
Brokerage Commissions. Certain Funds placed a portion of their portfolio transactions with brokerage firms which are affiliates of the investment adviser. The commissions paid to these affiliated firms were as follows:
| Amount |
Diversified International | $ 10,276 |
Aggressive International | 709 |
Overseas | 3,692 |
Worldwide | 11,315 |
Interfund Lending Program. Pursuant to an Exemptive Order issued by the SEC, the Funds, along with other registered investment companies having management contracts with FMR, may participate in an interfund lending program. This program provides an alternative credit facility allowing the funds to borrow from, or lend money to, other participating affiliated funds. At period end, there were no interfund loans outstanding. Each applicable fund's activity in this program during the period for which loans were outstanding was as follows:
| Borrower or
Lender | Average
Daily Loan
Balance | Weighted
Average
Interest Rate | Interest
Expense |
Worldwide | Borrower | $ 4,368,750 | 5.40% | $ 2,619 |
7. Committed Line of Credit.
Certain Funds participate with other funds managed by FMR in a $4.2 billion credit facility (the "line of credit") to be utilized for temporary or emergency purposes to fund shareholder redemptions or for other short-term liquidity purposes. The participating funds have agreed to pay commitment fees on their pro rata portion of the line of credit, which is reflected in Miscellaneous Expense on the Statement of Operations, and is as follows:
Diversified International | $103,513 |
Aggressive International | 1,154 |
Overseas | 16,910 |
Worldwide | 2,991 |
During the period, there were no borrowings on this line of credit.
8. Security Lending.
Certain Funds lend portfolio securities from time to time in order to earn additional income. On the settlement date of the loan, each applicable Fund receives collateral (in the form of U.S. Treasury obligations, letters of credit and/or cash) against the loaned securities and maintains collateral in an amount not less than 100% of the market value of the loaned securities during the period of the loan. The market value of the loaned securities is determined at the close of business of the Funds and any additional required collateral is delivered to the Funds on the next business day. If the borrower defaults on its obligation to return the securities loaned because of insolvency or other reasons, a fund could experience delays and costs in recovering the securities loaned or in gaining access to the collateral. Any cash collateral received is invested in the Fidelity Securities Lending Cash Central Fund. The value of loaned securities and cash collateral at period end are disclosed on each applicable Fund's Statement of Assets and Liabilities. Security lending income represents the income earned on investing cash collateral, less fees and expenses associated with the loan, plus any premium payments that may be received on the loan of certain types of securities. Security lending income is presented on each applicable Fund's Statement of Operations as a component of income from Fidelity Central Funds.
Diversified International | $ 35,690,016 |
Aggressive International | 541,973 |
Overseas | 7,088,492 |
Worldwide | 341,711 |
Annual Report
Notes to Financial Statements - continued
9. Expense Reductions.
Many of the brokers with whom FMR places trades on behalf of certain Funds provided services to these Funds in addition to trade execution. These services included payments of expenses on behalf of each applicable Fund. In addition, through arrangements with each applicable Fund's custodian and transfer agent, credits realized as a result of uninvested cash balances were used to reduce each applicable Fund's expenses. All of the applicable expense reductions are noted in the table below.
| Brokerage
Service
Arrangements | Custody
expense
reduction | Transfer
Agent expense
reduction |
| | | |
Diversified International | $ 7,692,706 | $ 82,700 | $ 3,582,801 |
Aggressive International | 359,854 | 3,273 | 17,858 |
Overseas | 2,755,633 | 8,453 | 718,091 |
Worldwide | 299,114 | 10,047 | 74,058 |
10. Other.
The Funds' organizational documents provide former and current trustees and officers with a limited indemnification against liabilities arising in connection with the performance of their duties to the Funds. In the normal course of business, the Funds may also enter into contracts that provide general indemnifications. The Funds' maximum exposure under these arrangements is unknown as this would be dependent on future claims that may be made against the Funds. The risk of material loss from such claims is considered remote.
At the end of the period, Fidelity Freedom Funds were the owners of the record, in the aggregate of approximately 27% of the total outstanding shares of Overseas.
The United States Securities and Exchange Commission ("SEC") is conducting an investigation of FMR (covering the years 2002 to 2004) arising from gifts, gratuities and business entertainment provided by certain brokers to certain individuals who were employed on FMR's domestic equity trading desk during that period. FMR is in discussions with the SEC staff regarding the possible resolution of the matter, but as of period-end no final resolution has been reached.
In December 2006, the Independent Trustees completed their own investigation of the matter with the assistance of independent counsel. The Independent Trustees and FMR agree that, despite the absence of proof that the Fidelity mutual funds experienced diminished execution quality as a result of the improper receipt of gifts and business entertainment, the conduct at issue was serious and is worthy of redress. Accordingly, the Independent Trustees have requested and FMR has agreed to pay $42 million to Fidelity mutual funds, plus interest to be determined at the time that payment is made. A method of allocating this payment among the funds has not yet been determined. The total payment to each of the Funds is not anticipated to have a material impact on such Fund's net assets. In addition, FMR reimbursed related legal expenses which are recorded in the accompanying Statements of Operations as an expense reduction.
Annual Report
Report of Independent Registered Public Accounting Firm
To the Trustees of Fidelity Investment Trust and the Shareholders of Fidelity Overseas Fund:
In our opinion, the accompanying statement of assets and liabilities, including the schedule of investments, and the related statements of operations and of changes in net assets and the financial highlights present fairly, in all material respects, the financial position of Fidelity Overseas Fund (a Fund of Fidelity Investment Trust) at October 31, 2007 and the results of its operations for the year then ended, the changes in its net assets for each of the two years in the period then ended and the financial highlights for its five years in the period then ended, in conformity with accounting principles generally accepted in the United States of America. These financial statements and financial highlights (hereafter referred to as "financial statements") are the responsibility of the Fidelity Investment Trust's management.Our responsibility is to express an opinion on these financial statements based on our audits. We conducted our audits of these financial statements in accordance with the standards of the Public Company Accounting Oversight Board (United States). Those standards require that we plan and perform the audit to obtain reasonable assurance about whether the financial statements are free of material misstatement. An audit includes examining, on a test basis, evidence supporting the amounts and disclosures in the financial statements, assessing the accounting principles used and significant estimates made by management, and evaluating the overall financial statement presentation. We believe that our audits, which included confirmation of securities at October 31, 2007 by correspondence with the custodian and brokers, provide a reasonable basis for our opinion.
/s/ PricewaterhouseCoopers LLP
PricewaterhouseCoopers LLP
Boston, Massachusetts
December 20, 2007
Annual Report
Report of Independent Registered Public Accounting Firm
To the Trustees of Fidelity Investment Trust and Shareholders of Fidelity Diversified International Fund, Fidelity Aggressive International Fund and Fidelity Worldwide Fund:
We have audited the accompanying statements of assets and liabilities of Fidelity Diversified International Fund, Fidelity Aggressive International Fund and Fidelity Worldwide Fund (the Funds), each fund of Fidelity Investment Trust (the Trust) including the schedules of investments, as of October 31, 2007, and the related statements of operations for the year then ended, the statements of changes in net assets for each of the two years in the period then ended, and the financial highlights for each of the five years in the period then ended. These financial statements and financial highlights are the responsibility of the Funds' management. Our responsibility is to express an opinion on these financial statements and financial highlights based on our audits.
We conducted our audits in accordance with standards of the Public Company Accounting Oversight Board (United States). Those standards require that we plan and perform the audit to obtain reasonable assurance about whether the financial statements and financial highlights are free of material misstatement. The Funds are not required to have, nor were we engaged to perform, an audit of their internal control over financial reporting. Our audits included consideration of internal control over financial reporting as a basis for designing audit procedures that are appropriate in the circumstances, but not for the purpose of expressing an opinion on the effectiveness of the Fund's internal control over financial reporting. Accordingly, we express no such opinion. An audit also includes examining, on a test basis, evidence supporting the amounts and disclosures in the financial statements, assessing the accounting principles used and significant estimates made by management, as well as evaluating the overall financial statement presentation. Our procedures included confirmation of securities owned as of October 31, 2007, by correspondence with the custodians and brokers; where replies were not received from brokers, we performed other auditing procedures. We believe that our audits provide a reasonable basis for our opinion.
In our opinion, the financial statements and financial highlights referred to above present fairly, in all material respects, the financial positions of Fidelity Diversified International Fund, Fidelity Aggressive International Fund and Fidelity Worldwide Fund as of October 31, 2007, the results of their operations for the year then ended, the changes in their net assets for each of the two years in the period then ended, and their financial highlights for each of the five years in the period then ended, in conformity with accounting principles generally accepted in the United States of America.
/s/ Deloitte & Touche LLP
DELOITTE & TOUCHE LLP
Boston, Massachusetts
December 21, 2007
Annual Report
Trustees and Officers
The Trustees, Members of the Advisory Board, and executive officers of the trust and funds, as applicable, are listed below. The Board of Trustees governs each fund and is responsible for protecting the interests of shareholders. The Trustees are experienced executives who meet periodically throughout the year to oversee each fund's activities, review contractual arrangements with companies that provide services to each fund, and review each fund's performance. Except for James C. Curvey, each of the Trustees oversees 370 funds advised by FMR or an affiliate. Mr. Curvey oversees 340 funds advised by FMR or an affiliate.
The Trustees hold office without limit in time except that (a) any Trustee may resign; (b) any Trustee may be removed by written instrument, signed by at least two-thirds of the number of Trustees prior to such removal; (c) any Trustee who requests to be retired or who has become incapacitated by illness or injury may be retired by written instrument signed by a majority of the other Trustees; and (d) any Trustee may be removed at any special meeting of shareholders by a two-thirds vote of the outstanding voting securities of the trust. Each Trustee who is not an interested person (as defined in the 1940 Act) (Independent Trustee), shall retire not later than the last day of the calendar year in which his or her 72nd birthday occurs. The Independent Trustees may waive this mandatory retirement age policy with respect to individual Trustees. The executive officers and Advisory Board Members hold office without limit in time, except that any officer and Advisory Board Member may resign or may be removed by a vote of a majority of the Trustees at any regular meeting or any special meeting of the Trustees. Except as indicated, each individual has held the office shown or other offices in the same company for the past five years.
The funds' Statement of Additional Information (SAI) includes more information about the Trustees. To request a free copy, call Fidelity at 1-800-544-8544.
Interested Trustees*:
Correspondence intended for each Trustee who is an interested person may be sent to Fidelity Investments, 82 Devonshire Street, Boston, Massachusetts 02109.
Name, Age; Principal Occupation |
Edward C. Johnson 3d (77) |
| Year of Election or Appointment: 1984 Mr. Johnson is Chairman of the Board of Trustees. Mr. Johnson serves as President (2006-present), Chief Executive Officer, Chairman, and a Director of FMR LLC; Chairman and a Director of FMR; Chairman and a Director of Fidelity Research & Analysis Company (FRAC); Chairman and a Director of Fidelity Investments Money Management, Inc.; and Chairman (2001-present) and a Director of FMR Co., Inc. In addition, Mr. Johnson serves as Chairman and Director of Fidelity International Limited (FIL). |
James C. Curvey (72) |
| Year of Election or Appointment: 2007 Mr. Curvey also serves as a Trustee (2007-present) or Member of the Advisory Board (2007-present) of other investment companies advised by FMR. Mr. Curvey is a Director of FMR and FMR Co., Inc. (2007-present). Mr. Curvey is also Vice Chairman (2006-present) and Director of FMR LLC. Mr. Curvey joined Fidelity in 1982 and served in numerous senior management positions, including President and Chief Operating Officer of FMR LLC (1997-2000) and President of Fidelity Strategic Investments (2000-2002). In addition, he serves as a member of the Board of Directors of Geerlings & Wade, Inc. (wine distribution). |
* Trustees have been determined to be "Interested Trustees" by virtue of, among other things, their affiliation with the trust or various entities under common control with FMR. FMR Corp. merged with FMR LLC on October 1, 2007. Any references to FMR LLC for prior periods are deemed to be references to the prior entity.
Independent Trustees:
Correspondence intended for each Independent Trustee (that is, the Trustees other than the Interested Trustees) may be sent to Fidelity Investments, P.O. Box 55235, Boston, Massachusetts 02205-5235.
Name, Age; Principal Occupation |
Dennis J. Dirks (59) |
| Year of Election or Appointment: 2005 Prior to his retirement in May 2003, Mr. Dirks was Chief Operating Officer and a member of the Board of The Depository Trust & Clearing Corporation (DTCC) (1999-2003). He also served as President, Chief Operating Officer, and Board member of The Depository Trust Company (DTC) (1999-2003) and President and Board member of the National Securities Clearing Corporation (NSCC) (1999-2003). In addition, Mr. Dirks served as Chief Executive Officer and Board member of the Government Securities Clearing Corporation (2001-2003) and Chief Executive Officer and Board member of the Mortgage-Backed Securities Clearing Corporation (2001-2003). Mr. Dirks also serves as a Trustee and a member of the Finance Committee of Manhattan College (2005-present) and a Trustee and a member of the Finance Committee of AHRC of Nassau County (2006-present). |
Albert R. Gamper, Jr. (65) |
| Year of Election or Appointment: 2006 Prior to his retirement in December 2004, Mr. Gamper served as Chairman of the Board of CIT Group Inc. (commercial finance). During his tenure with CIT Group Inc. Mr. Gamper served in numerous senior management positions, including Chairman (1987-1989; 1999-2001; 2002-2004), Chief Executive Officer (1987-2004), and President (1989-2002). He currently serves as a member of the Board of Directors of Public Service Enterprise Group (utilities, 2001-present), Chairman of the Board of Governors, Rutgers University (2004-present), and Chairman of the Board of Saint Barnabas Health Care System. |
George H. Heilmeier (71) |
| Year of Election or Appointment: 2004 Dr. Heilmeier is Chairman Emeritus of Telcordia Technologies (communication software and systems), where prior to his retirement, he served as company Chairman and Chief Executive Officer. He currently serves on the Boards of Directors of The Mitre Corporation (systems engineering and information technology support for the government), and HRL Laboratories (private research and development, 2004-present). He is Chairman of the General Motors Science & Technology Advisory Board and a Life Fellow of the Institute of Electrical and Electronics Engineers (IEEE). Dr. Heilmeier is a member of the Defense Science Board and the National Security Agency Advisory Board. He is also a member of the National Academy of Engineering, the American Academy of Arts and Sciences, and the Board of Overseers of the School of Engineering and Applied Science of the University of Pennsylvania. Previously, Dr. Heilmeier served as a Director of TRW Inc. (automotive, space, defense, and information technology, 1992-2002), Compaq (1994-2002), Automatic Data Processing, Inc. (ADP) (technology-based business outsourcing, 1995-2002), INET Technologies Inc. (telecommunications network surveillance, 2001-2004), and Teletech Holdings (customer management services). He is the recipient of the 2005 Kyoto Prize in Advanced Technology for his invention of the liquid crystal display, and a member of the Consumer Electronics Hall of Fame. |
James H. Keyes (67) |
| Year of Election or Appointment: 2007 Prior to his retirement in 2003, Mr. Keyes was Chairman, President, and Chief Executive Officer of Johnson Controls, Inc. (automotive supplier, 1993-2003). He currently serves as a member of the boards of LSI Logic Corporation (semiconductor technologies), Navistar International Corporation (manufacture and sale of trucks, buses, and diesel engines, 2002-present), and Pitney Bowes, Inc. (integrated mail, messaging, and document management solutions). |
Marie L. Knowles (61) |
| Year of Election or Appointment: 2001 Prior to Ms. Knowles' retirement in June 2000, she served as Executive Vice President and Chief Financial Officer of Atlantic Richfield Company (ARCO) (diversified energy, 1996-2000). From 1993 to 1996, she was a Senior Vice President of ARCO and President of ARCO Transportation Company. She served as a Director of ARCO from 1996 to 1998. She currently serves as a Director of Phelps Dodge Corporation (copper mining and manufacturing) and McKesson Corporation (healthcare service, 2002-present). Ms. Knowles is a Trustee of the Brookings Institution and the Catalina Island Conservancy and also serves as a member of the Advisory Board for the School of Engineering of the University of Southern California. |
Ned C. Lautenbach (63) |
| Year of Election or Appointment: 2000 Mr. Lautenbach is Chairman of the Independent Trustees (2006-present). Mr. Lautenbach has been a partner of Clayton, Dubilier & Rice, Inc. (private equity investment firm) since September 1998. Previously, Mr. Lautenbach was with the International Business Machines Corporation (IBM) from 1968 until his retirement in 1998. Mr. Lautenbach serves as a Director of Sony Corporation (2006-present) and Eaton Corporation (diversified industrial) as well as the Philharmonic Center for the Arts in Naples, Florida. He also is a member of the Board of Trustees of Fairfield University (2005-present), as well as a member of the Council on Foreign Relations. |
Cornelia M. Small (63) |
| Year of Election or Appointment: 2005 Ms. Small is a member (2000-present) and Chairperson (2002-present) of the Investment Committee, and a member (2002-present) of the Board of Trustees of Smith College. Previously, she served as Chief Investment Officer (1999-2000), Director of Global Equity Investments (1996-1999), and a member of the Board of Directors of Scudder, Stevens & Clark (1990-1997) and Scudder Kemper Investments (1997-1999). In addition, Ms. Small served as Co-Chair (2000-2003) of the Annual Fund for the Fletcher School of Law and Diplomacy. |
William S. Stavropoulos (68) |
| Year of Election or Appointment: 2001 Mr. Stavropoulos is Chairman Emeritus of the Board of Directors of The Dow Chemical Company. Since joining The Dow Chemical Company in 1967, Mr. Stavropoulos served in numerous senior management positions, including President (1993-2000; 2002-2003), CEO (1995-2000; 2002-2004), and Chairman of the Executive Committee (2000-2004). Currently, he is a Director of NCR Corporation (data warehousing and technology solutions), Chemical Financial Corporation, Maersk Inc. (industrial conglomerate, 2002-present), Tyco International, Inc. (multinational manufacturing and services, 2007-present), and a member of the Advisory Board for Metalmark Capital (private equity investment firm, 2005-present). He is a special advisor to Clayton, Dubilier & Rice, Inc., a private equity investment firm. He also serves as a member of the Board of Trustees of the American Enterprise Institute for Public Policy Research. In addition, Mr. Stavropoulos is a member of The Business Council, J.P. Morgan International Council and the University of Notre Dame Advisory Council for the College of Science. |
Kenneth L. Wolfe (68) |
| Year of Election or Appointment: 2005 Prior to his retirement in 2001, Mr. Wolfe was Chairman and Chief Executive Officer of Hershey Foods Corporation (1993-2001). He currently serves as a member of the boards of Adelphia Communications Corporation (2003-present), Bausch & Lomb, Inc., and Revlon Inc. (2004-present). |
Advisory Board Members and Executive Officers**:
Correspondence intended for Mr. Mauriello, Mr. Thomas, and Mr. Wiley may be sent to Fidelity Investments, P.O. Box 55235, Boston, Massachusetts 02205-5235. Correspondence intended for each executive officer and Mr. Lynch may be sent to Fidelity Investments, 82 Devonshire Street, Boston, Massachusetts 02109.
Name, Age; Principal Occupation |
Peter S. Lynch (63) |
| Year of Election or Appointment: 2003 Member of the Advisory Board of Fidelity Investment Trust. Mr. Lynch is Vice Chairman and a Director of FMR, and Vice Chairman (2001-present) and a Director of FMR Co., Inc. Previously, Mr. Lynch served as a Trustee of the Fidelity funds (1990-2003). In addition, he serves as a Trustee of Boston College and as the Chairman of the Inner-City Scholarship Fund. |
Joseph Mauriello (63) |
| Year of Election or Appointment: 2007 Member of the Advisory Board of Fidelity Investment Trust. Prior to his retirement in January 2006, Mr. Mauriello served in numerous senior management positions including Deputy Chairman and Chief Operating Officer (2004-2005), and Vice Chairman of Financial Services (2002-2004) of KPMG LLP US (professional services firm, 1965-2005). Mr. Mauriello currently serves as a member of the Board of Directors of XL Capital Ltd., (global insurance and re-insurance company, 2006-present) and of Arcadia Resources Inc., (health care services and products, 2007-present). He also served as a Director of the Hamilton Funds of the Bank of New York (2006-2007). |
David M. Thomas (58) |
| Year of Election or Appointment: 2007 Member of the Advisory Board of Fidelity Investment Trust. Previously, Mr. Thomas served as Executive Chairman (2005-2006) and Chairman and Chief Executive Officer (2000-2005) of IMS Health, Inc. (pharmaceutical and healthcare information solutions). In addition, Mr. Thomas serves as a member of the Board of Directors of Fortune Brands, Inc. (consumer products holding company), and Interpublic Group of Companies, Inc. (marketing communication, 2004-present). |
Michael E. Wiley (57) |
| Year of Election or Appointment: 2007 Member of the Advisory Board of Fidelity Investment Trust. Mr. Wiley also serves as Sr. Energy Advisor of Katzenbach Partners, LLC (consulting firm, 2006-present) and a member of the Board of Trustees of the University of Tulsa (2000-2006; 2007-present). He serves as a Director of Tesoro Corporation (independent oil refiner and marketer, 2005-present), and a Director of Bill Barrett Corporation (exploration and production company, 2005-present). In addition, he also serves as a Director of Post Oak Bank (privately-held bank, 2004-present), and an Advisory Director of Riverstone Holdings (private investment firm). Previously, Mr. Wiley served as Chairman, President, and CEO of Baker Hughes, Inc. (oilfield services company, 2000-2004), and as Director of Spinnaker Exploration Company (exploration and production company, 2001-2005). |
Kimberley H. Monasterio (43) |
| Year of Election or Appointment: 2007 President and Treasurer of Diversified International, Aggressive International, Overseas, and Worldwide. Ms. Monasterio also serves as President and Treasurer of other Fidelity funds (2007-present) and is an employee of FMR (2004-present). Previously, Ms. Monasterio served as Deputy Treasurer of the Fidelity funds (2004-2006). Before joining Fidelity Investments, Ms. Monasterio served as Treasurer (2000-2004) and Chief Financial Officer (2002-2004) of the Franklin Templeton Funds and Senior Vice President of Franklin Templeton Services, LLC (2000-2004). |
Walter C. Donovan (45) |
| Year of Election or Appointment: 2007 Vice President of Diversified International, Aggressive International, Overseas, and Worldwide. Mr. Donovan also serves as Vice President of Fidelity's Equity Funds (2007-present). Mr. Donovan also serves as Executive Vice President of FMR (2005-present) and FMR Co., Inc. (2005-present). Previously, Mr. Donovan served as Vice President of Fidelity's High Income Funds (2005-2007), Fixed-Income Funds (2005-2006), certain Asset Allocation Funds (2005-2006), certain Balanced Funds (2005-2006), and as Vice President and Director of Fidelity's International Equity Trading group (1998-2005). |
Bruce T. Herring (42) |
| Year of Election or Appointment: 2006 Vice President of Worldwide. Mr. Herring also serves as Vice President of certain Equity Funds (2006-present). Mr. Herring is Senior Vice President of FMR (2006-present) and Vice President of FMR Co., Inc. (2001-present). Previously, Mr. Herring served as a portfolio manager for Fidelity U.S. Equity Funds (2001-2005). |
Eric M. Wetlaufer (45) |
| Year of Election or Appointment: 2006 Vice President of Diversified International, Aggressive International, Overseas, and Worldwide. Mr. Wetlaufer also serves as Vice President of certain International Equity Funds (2006-present). Mr. Wetlaufer is Senior Vice President of FMR (2006-present) and FMR Co., Inc. (2006-present), and President and Director of Fidelity Management & Research (U.K.) Inc. (2006-present) and Fidelity Research & Analysis Company (2006-present). Before joining Fidelity Investments in 2005, Mr. Wetlaufer was a partner in Oxhead Capital Management (2004-2005). Previously, Mr. Wetlaufer served as a Chief Investment Officer of Putnam Investments (1997-2003). |
Eric D. Roiter (58) |
| Year of Election or Appointment: 1998 Secretary of Diversified International, Aggressive International, Overseas, and Worldwide. He also serves as Secretary of other Fidelity funds; Vice President, General Counsel, and Secretary of FMR Co., Inc. (2001-present) and FMR; Assistant Secretary of Fidelity Management & Research (U.K.) Inc. (2001-present), Fidelity Research & Analysis Company (2001-present), and Fidelity Investments Money Management, Inc. (2001-present). Mr. Roiter is an Adjunct Member, Faculty of Law, at Boston College Law School (2003-present). Previously, Mr. Roiter served as Vice President and Secretary of Fidelity Distributors Corporation (FDC) (1998-2005). |
Scott C. Goebel (39) |
| Year of Election or Appointment: 2007 Assistant Secretary of Diversified International, Aggressive International, Overseas, and Worldwide. Mr. Goebel also serves as Assistant Secretary of other Fidelity funds (2007-present), and is an employee of FMR. |
R. Stephen Ganis (41) |
| Year of Election or Appointment: 2006 Anti-Money Laundering (AML) officer of Diversified International, Aggressive International, Overseas, and Worldwide. Mr. Ganis also serves as AML officer of other Fidelity funds (2006-present) and FMR LLC (2003-present). Before joining Fidelity Investments, Mr. Ganis practiced law at Goodwin Procter, LLP (2000-2002). |
Joseph B. Hollis (59) |
| Year of Election or Appointment: 2006 Chief Financial Officer of Diversified International, Aggressive International, Overseas, and Worldwide. Mr. Hollis also serves as Chief Financial Officer of other Fidelity funds. Mr. Hollis is President of Fidelity Pricing and Cash Management Services (FPCMS) (2005-present). Mr. Hollis also serves as President and Director of Fidelity Service Company, Inc. (2006-present). Previously, Mr. Hollis served as Senior Vice President of Cash Management Services (1999-2002) and Investment Management Operations (2002-2005). |
Kenneth A. Rathgeber (60) |
| Year of Election or Appointment: 2004 Chief Compliance Officer of Diversified International, Aggressive International, Overseas, and Worldwide. Mr. Rathgeber also serves as Chief Compliance Officer of other Fidelity funds (2004-present) and Executive Vice President of Risk Oversight for Fidelity Investments (2002-present). He is Chief Compliance Officer of FMR (2005-present), FMR Co., Inc. (2005-present), Fidelity Management & Research (U.K.) Inc. (2005-present), Fidelity Research & Analysis Company (2005-present), Fidelity Investments Money Management, Inc. (2005-present), and Strategic Advisers, Inc. (2005-present). Previously, Mr. Rathgeber served as Executive Vice President and Chief Operating Officer for Fidelity Investments Institutional Services Company, Inc. (1998-2002). |
Bryan A. Mehrmann (46) |
| Year of Election or Appointment: 2005 Deputy Treasurer of Diversified International, Aggressive International, Overseas, and Worldwide. Mr. Mehrmann also serves as Deputy Treasurer of other Fidelity funds (2005-present) and is an employee of FMR. Previously, Mr. Mehrmann served as Vice President of Fidelity Investments Institutional Services Group (FIIS)/Fidelity Investments Institutional Operations Corporation, Inc. (FIIOC) Client Services (1998-2004). |
Kenneth B. Robins (38) |
| Year of Election or Appointment: 2005 Deputy Treasurer of Diversified International, Aggressive International, Overseas, and Worldwide. Mr. Robins also serves as Deputy Treasurer of other Fidelity funds (2005-present) and is an employee of FMR (2004-present). Before joining Fidelity Investments, Mr. Robins worked at KPMG LLP, where he was a partner in KPMG's department of professional practice (2002-2004) and a Senior Manager (1999-2000). In addition, Mr. Robins served as Assistant Chief Accountant, United States Securities and Exchange Commission (2000-2002). |
Robert G. Byrnes (40) |
| Year of Election or Appointment: 2005 Assistant Treasurer of Diversified International, Aggressive International, Overseas, and Worldwide. Mr. Byrnes also serves as Assistant Treasurer of other Fidelity funds (2005-present) and is an employee of FMR (2005-present). Previously, Mr. Byrnes served as Vice President of FPCMS (2003-2005). Before joining Fidelity Investments, Mr. Byrnes worked at Deutsche Asset Management where he served as Vice President of the Investment Operations Group (2000-2003). |
Peter L. Lydecker (53) |
| Year of Election or Appointment: 2004 Assistant Treasurer of Diversified International, Aggressive International, Overseas, and Worldwide. Mr. Lydecker also serves as Assistant Treasurer of other Fidelity funds (2004) and is an employee of FMR. |
Paul M. Murphy (60) |
| Year of Election or Appointment: 2007 Assistant Treasurer of Diversified International, Aggressive International, Overseas, and Worldwide. Mr. Murphy also serves as Assistant Treasurer of other Fidelity funds (2007-present) and is an employee of FMR (2007-present). Previously, Mr. Murphy served as Chief Financial Officer of the Fidelity Funds (2005-2006), Vice President and Associate General Counsel of FMR (2007), and Senior Vice President of Fidelity Pricing and Cash Management Services Group (FPCMS) (1994-2007). |
Gary W. Ryan (49) |
| Year of Election or Appointment: 2005 Assistant Treasurer of Diversified International, Aggressive International, Overseas, and Worldwide. Mr. Ryan also serves as Assistant Treasurer of other Fidelity funds (2005-present) and is an employee of FMR (2005-present). Previously, Mr. Ryan served as Vice President of Fund Reporting in FPCMS (1999-2005). |
** FMR Corp. merged with FMR LLC on October 1, 2007. Any references to FMR LLC for prior periods are deemed to be references to the prior entity.
Annual Report
Distributions
The Board of Trustees of each fund voted to pay to shareholders of record at the opening of business on record date the following distributions per share derived from capital gains realized from sales of portfolio securities and dividends derived from net investment income:
| Pay Date | Record Date | Dividends | Capital Gains |
Fidelity Diversified International Fund | 12/10/07 | 12/07/07 | $0.47 | $2.57 |
Fidelity Aggressive International Fund | 12/10/07 | 12/07/07 | $0.14 | $2.39 |
Fidelity Overseas Fund | 12/10/07 | 12/07/07 | $0.57 | $5.75 |
Fidelity Worldwide Fund | 12/10/07 | 12/07/07 | $0.12 | $2.38 |
The funds hereby designate as capital gain dividend the amounts noted below for the taxable year ended October 31, 2007, or, if subsequently determined to be different, the net capital gain of such year.
Fidelity Diversified International Fund | $3,636,066,644 |
Fidelity Aggressive International Fund | $23,482,872 |
Fidelity Overseas Fund | $836,775,446 |
Fidelity Worldwide Fund | $123,890,744 |
A percentage of the dividends distributed during the fiscal year for the following funds qualify for the dividends-received deduction for corporate shareholders:
Fidelity Worldwide Fund | 18% |
A percentage of the dividends distributed during the fiscal year for the following funds may be taken into account as a dividend for purposes of the maximum rate under section 1(h) (11) of the Internal Revenue Code:
Fidelity Diversified International Fund | 100% |
Fidelity Aggressive International Fund | 45% |
Fidelity Overseas Fund | 30% |
Fidelity Worldwide Fund | 42% |
The amounts per share which represent income derived from sources within, and taxes paid to, foreign countries or possessions of the United States are as follows:
| Pay Date | Income | Taxes |
Fidelity Diversified International Fund | 12/11/06 | $0.396 | $0.0301 |
Fidelity Aggressive International Fund | 12/11/06 | $0.277 | $0.0159 |
Fidelity Overseas Fund | 12/04/06 | $0.499 | $0.0509 |
Fidelity Worldwide Fund | 12/11/06 | $0.149 | $0.0134 |
The funds will notify shareholders in January 2008 of amounts for use in preparing 2007 income tax returns.
Annual Report
Board Approval of Investment Advisory Contracts and Management Fees
Broadly Diversified International Equity Funds
Each year, typically in July, the Board of Trustees, including the Independent Trustees (together, the Board), votes on the renewal of the management contract and sub-advisory agreements (together, the Advisory Contracts) for each fund. The Board, assisted by the advice of fund counsel and Independent Trustees' counsel, requests and considers a broad range of information throughout the year.
The Board meets regularly each month except August and takes into account throughout the year matters bearing on Advisory Contracts. The Board, acting directly and through its separate committees, considers at each of its meetings factors that are relevant to the annual renewal of each fund's Advisory Contracts, including the services and support provided to each fund and its shareholders. At the time of the renewal, the Board had 12 standing committees, each composed of Independent Trustees with varying backgrounds, to which the Board has assigned specific subject matter responsibilities in order to enhance effective decision-making by the Board. Each committee has adopted a written charter outlining the structure and purposes of the committee. One such committee, the Equity Contract Committee, meets periodically as needed throughout the year to consider matters specifically related to the annual renewal of Advisory Contracts. The committee requests and receives information on, and makes recommendations to the Independent Trustees concerning, the approval and annual review of the Advisory Contracts.
At its July 2007 meeting, the Board of Trustees, including the Independent Trustees, unanimously determined to renew the Advisory Contracts for each fund. In reaching its determination, the Board considered all factors it believed relevant, including (i) the nature, extent, and quality of the services to be provided to each fund and its shareholders (including the investment performance of each fund); (ii) the competitiveness of the management fee and total expenses of each fund; (iii) the total costs of the services to be provided by and the profits to be realized by the investment adviser and its affiliates from the relationship with each fund; (iv) the extent to which economies of scale would be realized as each fund grows; and (v) whether fee levels reflect these economies of scale, if any, for the benefit of fund shareholders. The Board also approved amendments to each fund's agreements with foreign sub-advisers to clarify that each sub-adviser provides services as an independent contractor.
In determining whether to renew the Advisory Contracts for each fund, the Board ultimately reached a determination, with the assistance of fund counsel and Independent Trustees' counsel, that the renewal of the Advisory Contracts and the compensation to be received by Fidelity under the management contracts is consistent with Fidelity's fiduciary duty under applicable law. In addition to evaluating the specific factors noted above, the Board, in reaching its determination, is aware that shareholders in each fund have a broad range of investment choices available to them, including a wide choice among mutual funds offered by competitors to Fidelity, and that each fund's shareholders, with the opportunity to review and weigh the disclosure provided by the fund in its prospectus and other public disclosures, have chosen to invest in that fund, managed by Fidelity.
Nature, Extent, and Quality of Services Provided. The Board considered staffing within the investment adviser, FMR, and the sub-advisers (together, the Investment Advisers), including the backgrounds of the funds' portfolio managers and the funds' investment objectives and disciplines. The Independent Trustees also had discussions with senior management of Fidelity's investment operations and investment groups. The Board considered the structure of the portfolio manager compensation program and whether this structure provides appropriate incentives.
Resources Dedicated to Investment Management and Support Services. The Board reviewed the size, education, and experience of the Investment Advisers' investment staff, their use of technology, and the Investment Advisers' approach to recruiting, training, and retaining portfolio managers and other research, advisory, and management personnel. The Board considered Fidelity's extensive global research capabilities that enable the Investment Advisers to aggregate data from various sources in an effort to produce positive investment results. The Board noted that Fidelity's analysts have access to a variety of technological tools that enable them to perform both fundamental and quantitative analysis and to specialize in various disciplines. The Board also considered that Fidelity's portfolio managers and analysts have access to daily portfolio attribution that allows for monitoring of a fund's portfolio, as well as an electronic communication system that provides immediate real-time access to research concerning issuers and credit enhancers.
Shareholder and Administrative Services. The Board considered (i) the nature, extent, quality, and cost of advisory, administrative, distribution, and shareholder services performed by the Investment Advisers and their affiliates under the Advisory Contracts and under separate agreements covering transfer agency, pricing and bookkeeping, and securities lending services for each fund; (ii) the nature and extent of the Investment Advisers' supervision of third party service providers, principally custodians and subcustodians; and (iii) the resources devoted to, and the record of compliance with, each fund's compliance policies and procedures. The Board reviewed the allocation of fund brokerage, including allocations to brokers affiliated with the Investment Advisers, the use of brokerage commissions to pay fund expenses, and the use of "soft" commission dollars to pay for research services. The Board also considered that Fidelity voluntarily pays for market data out of its own resources. The Board also considered the agreement reached between the Independent Trustees and Fidelity in December 2006 following an independent review of matters relating to receipt of travel, entertainment, gifts and gratuities in violation of Fidelity policies.
The Board noted that the growth of fund assets across the complex allows Fidelity to reinvest in the development of services designed to enhance the value or convenience of the Fidelity funds as investment vehicles. These services include 24-hour access to account information and market information through phone representatives and over the Internet, and investor education materials and asset allocation tools.
Annual Report
Board Approval of Investment Advisory Contracts and Management Fees - continued
Investment in a Large Fund Family. The Board considered the benefits to shareholders of investing in a Fidelity fund, including the benefits of investing in a fund that is part of a large family of funds offering a variety of investment disciplines and providing for a large variety of mutual fund investor services. For example, fund shareholders are offered the privilege of exchanging shares of a fund for shares of other Fidelity funds, as set forth in the fund's prospectus, without paying a sales charge. The Board noted that, since the last Advisory Contract renewals in July 2006, Fidelity has taken a number of actions that benefited particular funds, including (i) dedicating additional resources to investment research and to restructure the investment research teams; (ii) contractually agreeing to reduce the management fee on Fidelity Advisor Floating Rate High Income Fund; (iii) contractually agreeing to reduce the management fees on Fidelity's California, Massachusetts, New Jersey, and New York AMT Tax-Free Money Market Funds, launching new Institutional Classes and Service Classes of these funds, and contractually agreeing to impose expense limitations on these funds; (iv) eliminating the exchange fee on the Fidelity Select Portfolios and reducing the pricing and bookkeeping fee rates for these funds; (v) reducing the maximum transfer agency fee rates on high income funds and certain equity funds; (vi) proposing amended management contracts that, if approved by shareholders, will add a performance adjustment component to the management fees paid by 18 Fidelity Advisor equity funds; (vii) contractually agreeing to reduce fees for Ultra-Short Central Fund and the money market Central Funds; (viii) waiving the Fidelity Advisor funds' contingent deferred sales charge on certain redemptions made through systematic withdrawal programs; and (ix) amending the management contracts for equity and fixed-income funds whose management contracts incorporate a "group fee" structure by adding four new fee "breakpoints" to the group fee rate schedules.
Investment Performance and Compliance. The Board considered whether each fund has operated within its investment objective, as well as its record of compliance with its investment restrictions. It also reviewed each fund's absolute investment performance, as well as each fund's relative investment performance measured against (i) a broad-based securities market index, and (ii) a peer group of mutual funds (or a custom peer group of mutual funds, in the case of Aggressive International Fund) deemed appropriate by the Board over multiple periods.
For each of Diversified International Fund, Overseas Fund, and Worldwide Fund, the following charts considered by the Board show, over the one-, three-, and five-year periods ended December 31, 2006, the fund's cumulative total returns, the cumulative total returns of a broad-based securities market index ("benchmark"), and a range of cumulative total returns of a peer group of mutual funds identified by Morningstar, Inc. as having an investment style similar to that of the fund based on underlying portfolio holdings.
For Aggressive International Fund, the following charts considered by the Board show, over the one-, three-, and five-year periods ended December 31, 2006, the fund's cumulative total returns, the cumulative total returns of a broad-based securities market index ("benchmark"), and a range of cumulative total returns of a custom peer group of mutual funds defined by FMR based on categories assigned by Morningstar, Inc. The fund's custom peer group, defined by FMR, is a peer group that FMR believes provides a more meaningful performance comparison than the peer group assigned by Morningstar, Inc.
The box within each chart shows the 25th percentile return (bottom of box) and the 75th percentile return (top of box) of the peer group. Returns shown above the box are in the first quartile and returns shown below the box are in the fourth quartile. The percentage beaten number noted below each chart corresponds to the percentile box and represents the percentage of funds in the peer group whose performance was equal to or lower than that of the fund.
Fidelity Diversified International Fund
Annual Report
The Board reviewed the fund's relative investment performance against its peer group and stated that the performance of the fund was in the fourth quartile for the one-year period, the second quartile for the three-year period, and the first quartile for the five-year period. The Board also stated that the investment performance of the fund was lower than its benchmark for the one- and three-year periods, although the fund's five-year cumulative total return compared favorably to its benchmark.
Fidelity Aggressive International Fund
The Board reviewed the fund's relative investment performance against its peer group and stated that the performance of the fund was in the fourth quartile for the one- and three-year periods and the third quartile for the five-year period. The Board also stated that the investment performance of the fund was lower than its benchmark for all the periods shown. The Board discussed with FMR actions to be taken by FMR to improve the fund's disappointing performance relative to its peer group. The Board will continue to closely monitor the performance of the fund in the coming year and discuss with FMR other appropriate actions to address the performance of the fund.
Fidelity Overseas Fund
The Board reviewed the fund's relative investment performance against its peer group and stated that the performance of the fund was in the fourth quartile for the one-year period, the third quartile for the three-year period, and the second quartile for the five-year period. The Board also stated that the investment performance of the fund was lower than its benchmark for all the periods shown. The Board discussed with FMR actions to be taken by FMR to improve the fund's more recent disappointing performance relative to its peer group. The Board will continue to closely monitor the performance of the fund in the coming year.
Annual Report
Board Approval of Investment Advisory Contracts and Management Fees - continued
Fidelity Worldwide Fund
The Board reviewed the fund's relative investment performance against its peer group and stated that the performance of the fund was in the third quartile for the one- and three-year periods and the second quartile for the five-year period. The Board also stated that the investment performance of the fund was lower than its benchmark for the one- and three-year periods, although the fund's five-year cumulative total return was higher than its benchmark. The Board discussed with FMR actions to be taken by FMR to improve the fund's more recent disappointing performance relative to its peer group. The Board will continue to closely monitor the performance of the fund in the coming year.
The Board also considered that each fund's management fee is subject to upward or downward adjustment depending upon whether, and to what extent, the fund's investment performance for the performance period exceeds, or is exceeded by, the record (over the same period) of a Board-approved performance adjustment index. The Board realizes that the performance adjustment provides FMR with a strong economic incentive to seek to achieve superior performance for each fund's shareholders and helps to more closely align the interests of FMR and each fund's shareholders.
The Board considered that FMR has taken steps to refocus and strengthen equity research, equity portfolio management, and compliance.
Based on its review, and giving particular weight to the nature and quality of the resources dedicated by the Investment Advisers to maintain and improve relative performance, the Board concluded that the nature, extent, and quality of the services provided to each fund will benefit each fund's shareholders, particularly in light of the Board's view that each fund's shareholders benefit from investing in a fund that is part of a large family of funds offering a variety of investment disciplines and services.
Competitiveness of Management Fee and Total Fund Expenses. The Board considered each fund's management fee and total expenses compared to "mapped groups" of competitive funds and classes. Fidelity creates "mapped groups" by combining similar Lipper investment objective categories that have comparable management fee characteristics. Combining Lipper investment objective categories aids the Board's management fee and total expense comparisons by broadening the competitive group used for comparison and by reducing the number of universes to which various Fidelity funds are compared. The Board also considered supplemental information about how each fund's management fee and total expenses ranked relative to groups based on Lipper classifications, which take into account a fund's market capitalization and style.
The Board considered two proprietary management fee comparisons for the 12-month periods shown in the charts below. The group of Lipper funds used by the Board for management fee comparisons is referred to below as the "Total Mapped Group." The Total Mapped Group comparison focuses on a fund's standing relative to the total universe of comparable funds available to investors, in terms of gross management fees before expense reimbursements or caps, and without giving effect to a fund's performance adjustment (if applicable). "TMG %" represents the percentage of funds in the Total Mapped Group that had management fees that were lower than a fund's. For example, a TMG % of 13% would mean that 87% of the funds in the Total Mapped Group had higher management fees than a fund. The "Asset-Size Peer Group" (ASPG) comparison focuses on a fund's standing relative to non-Fidelity funds similar in size to the fund within the Total Mapped Group. The ASPG represents at least 15% of the funds in the Total Mapped Group with comparable asset size and management fee characteristics, subject to a minimum of 50 funds (or all funds in the Total Mapped Group if fewer than 50). Additional information, such as the ASPG quartile in which a fund's management fee ranked and the impact of a fund's performance adjustment, is also included in the charts and considered by the Board.
Annual Report
Fidelity Diversified International Fund
The Board noted that the fund's management fee ranked below the median of its Total Mapped Group and below the median of its ASPG for 2006. The Board also noted the effect of the fund's positive performance adjustment on the fund's management fee ranking. The Board noted that the performance adjustment for each year represents calculations for performance periods that differ from the periods shown in the performance charts above.
Fidelity Aggressive International Fund
The Board noted that the fund's management fee ranked below the median of its Total Mapped Group and below the median of its ASPG for 2006. The Board also noted the effect of the fund's negative performance adjustment on the fund's management fee ranking. The Board noted that the performance adjustment for each year represents calculations for performance periods that differ from the periods shown in the performance charts above.
Furthermore, the Board considered that shareholders of Aggressive International Fund approved a prospective change in the index used to calculate the fund's performance adjustment, beginning March 1, 2001. The Board also considered that, because the performance adjustment is based on a rolling 36-month measurement period, during a transition period the fund's performance is compared to a blended index return that reflects the performance of the former index for the portion of the measurement period prior to March 1, 2001 and the performance of the current index for the remainder of the measurement period. The Board noted that the fund's performance adjustments for 2002 through 2004 shown in the chart above reflect the effect of using the blended index return to calculate the fund's performance adjustment.
Annual Report
Board Approval of Investment Advisory Contracts and Management Fees - continued
Fidelity Overseas Fund
The Board noted that the fund's management fee ranked below the median of its Total Mapped Group and below the median of its ASPG for 2006. The Board also noted the effect of the fund's negative performance adjustment on the fund's management fee ranking. The Board noted that the performance adjustment for each year represents calculations for performance periods that differ from the periods shown in the performance charts above.
Fidelity Worldwide Fund
The Board noted that the fund's management fee ranked below the median of its Total Mapped Group and below the median of its ASPG for 2006. The Board also noted the effect of the fund's positive performance adjustment on the fund's management fee ranking. The Board noted that the performance adjustment for each year represents calculations for performance periods that differ from the periods shown in the performance charts above.
Based on its review, the Board concluded that each fund's management fee was fair and reasonable in light of the services that the fund receives and the other factors considered.
In its review of each fund's total expenses, the Board considered the fund's management fee as well as other fund expenses, such as transfer agent fees, pricing and bookkeeping fees, and custodial, legal, and audit fees. The Board also noted the effects of any waivers and reimbursements on fees and expenses, as well as Diversified International Fund's and Worldwide Fund's positive performance adjustment, and Aggressive International Fund's and Overseas Fund's negative performance adjustment. As part of its review, the Board also considered current and historical total expenses of each fund compared to competitive fund median expenses. Each fund is compared to those funds and classes in the Total Mapped Group (used by the Board for management fee comparisons) that have a similar sales load structure.
Annual Report
The Board noted that each fund's total expenses ranked below its competitive median for 2006.
In its review of total expenses, the Board also considered Fidelity fee structures and other information on clients that FMR and its affiliates service in other competitive markets, such as other mutual funds advised or subadvised by FMR or its affiliates, pension plan clients, and other institutional clients.
Based on its review, the Board concluded that each fund's total expenses were reasonable in light of the services that the fund and its shareholders receive and the other factors considered.
Costs of the Services and Profitability. The Board considered the revenues earned and the expenses incurred by Fidelity in conducting the business of developing, marketing, distributing, managing, administering and servicing each fund and its shareholders. The Board also considered the level of Fidelity's profits in respect of all the Fidelity funds.
On an annual basis, FMR presents to the Board Fidelity's profitability for each fund. Fidelity calculates the profitability for each fund, as well as aggregate profitability for groups of Fidelity funds and all Fidelity funds, using a series of detailed revenue and cost allocation methodologies which originate with the audited books and records of Fidelity. The Audit Committee of the Board reviews any significant changes from the prior year's methodologies.
PricewaterhouseCoopers LLP (PwC), independent registered public accounting firm and auditor to Fidelity and certain Fidelity funds, has been engaged annually by the Board as part of the Board's assessment of the results of Fidelity's profitability analysis. PwC's engagement includes the review and assessment of Fidelity's methodologies used in determining the revenues and expenses attributable to Fidelity's mutual fund business, and completion of agreed-upon procedures surrounding the mathematical accuracy of fund profitability and its conformity to allocation methodologies. After considering PwC's reports issued under the engagement and information provided by Fidelity, the Board believes that while other allocation methods may also be reasonable, Fidelity's profitability methodologies are reasonable in all material respects.
The Board has also reviewed Fidelity's non-fund businesses and any fall-out benefits related to the mutual fund business as well as cases where Fidelity's affiliates may benefit from or be related to the funds' business.
The Board considered the costs of the services provided by and the profits realized by Fidelity in connection with the operation of each fund and determined that the amount of profit is a fair entrepreneurial profit for the management of each fund.
Economies of Scale. The Board considered whether there have been economies of scale in respect of the management of the Fidelity funds, whether the Fidelity funds (including each fund) have appropriately benefited from any such economies of scale, and whether there is potential for realization of any further economies of scale. The Board considered the extent to which each fund will benefit from economies of scale through increased services to the fund, through waivers or reimbursements, or through fee or expense reductions, including reductions that occur through operation of the transfer agent agreement. The transfer agent fee varies in part based on the number of accounts in each fund. If the number of accounts decreases or the average account size increases, the overall transfer agent fee rate decreases.
The Board recognized that each fund's management contract incorporates a "group fee" structure, which provides for lower group fee rates as total fund assets under FMR's management increase, and for higher group fee rates as total fund assets under FMR's management decrease. FMR determines the group fee rates based on a tiered asset "breakpoint" schedule. In connection with the renewal of each fund's management contract, the Board approved amendments to each fund's management contract that added four new fee breakpoints to the group fee rate schedule for assets under FMR's management above $1,386 billion. The Board considered that the group fee rate declines under both the present and amended schedules, but that under the amended schedule, the group fee rate declines faster as assets under FMR's management exceed $1,386 billion. The Board considered that the group fee is designed to deliver the benefits of economies of scale to fund shareholders when total fund assets increase, even if assets of any particular fund are unchanged or have declined, because some portion of Fidelity's costs are attributable to services provided to all Fidelity funds, and all funds benefit if those costs can be allocated among more assets. The Board also considered that although Diversified International Fund is partially closed to new investors, it continues to incur investment management expenses, and marketing and distribution expenses related to the retention of existing shareholders and assets. The Board further noted that Diversified International Fund may continue to realize benefits from the group fee structure, even though assets may not be expected to grow significantly at the fund level. The Board concluded that, given the group fee structure, fund shareholders will achieve a certain level of economies of scale as assets under FMR's management increase at the fund complex level, regardless of whether Fidelity achieves any such economies of scale.
The Board further concluded that any potential economies of scale are being shared between fund shareholders and Fidelity in an appropriate manner.
Additional Information Requested by the Board. In order to develop fully the factual basis for consideration of the Fidelity funds' Advisory Contracts, the Board requested and received additional information on several topics, including (i) fund performance trends and actions to be taken by FMR to improve certain funds' overall performance; (ii) Fidelity's portfolio manager compensation structure, including its effects on fund profitability and the extent to which portfolio manager compensation is linked to fund performance; (iii) Fidelity's fee structures; (iv) the funds' sub-advisory arrangements; and (v) accounts managed by Fidelity other than the Fidelity funds.
Annual Report
Board Approval of Investment Advisory Contracts and Management Fees - continued
Based on its evaluation of all of the conclusions noted above, and after considering all material factors, the Board ultimately concluded that the advisory fee structures are fair and reasonable, and that each fund's Advisory Contracts should be renewed.
Annual Report
Investment Adviser
Fidelity Management & Research Company
Boston, MA
Investment Sub-Advisers
FMR Co., Inc.
Fidelity Management & Research (U.K.) Inc.
Fidelity Research & Analysis Company
Fidelity International Investment Advisors
Fidelity International Investment Advisors
(U.K.) Limited
Fidelity Investments Japan Limited
General Distributor
Fidelity Distributors Corporation
Boston, MA
Transfer and Service Agent
Fidelity Service Company, Inc.
Boston, MA
Custodian
JPMorgan Chase Bank
New York, NY
Corporate Headquarters
82 Devonshire Street
Boston, MA 02109
1-800-544-8888
The Fidelity Telephone Connection
Mutual Fund 24-Hour Service
Exchanges/Redemptions
and Account Assistance 1-800-544-6666
Product Information 1-800-544-6666
Retirement Accounts 1-800-544-4774
(8 a.m. - 9 p.m.)
TDD Service 1-800-544-0118
for the deaf and hearing impaired
(9 a.m. - 9 p.m. Eastern time)
Fidelity Automated Service
Telephone (FAST®) (automated graphic) 1-800-544-5555
(automated graphic) Automated line for quickest service
IBD-UANNPRO-1207
1.784774.104
Fidelity's
Targeted International Equity
Funds®
Fidelity® Canada Fund
Fidelity China Region Fund
Fidelity Emerging Markets Fund
Fidelity Europe Fund
Fidelity Europe Capital Appreciation Fund
Fidelity Japan Fund
Fidelity Japan Smaller Companies Fund
Fidelity Latin America Fund
Fidelity Nordic Fund
Fidelity Pacific Basin Fund
Fidelity Southeast Asia Fund
Annual Report
October 31, 2007
(2_fidelity_logos) (Registered_Trademark)
Contents
To view a fund's proxy voting guidelines and proxy voting record for the 12-month period ended June 30, visit http://www.fidelity.com (search for "proxy voting guidelines") or visit the Securities and Exchange Commission's (SEC) web site at http://www.sec.gov. You may also call 1-800-544-8544 to request a free copy of the proxy voting guidelines.
Standard & Poor's, S&P and S&P 500 are registered service marks of The McGraw-Hill Companies, Inc. and have been licensed for use by Fidelity Distributors Corporation.
Other third party marks appearing herein are the property of their respective owners.
All other marks appearing herein are registered or unregistered trademarks or service marks of FMR LLC or an affiliated company.
This report and the financial statements contained herein are submitted for the general information of the shareholders of the funds. This report is not authorized for distribution to prospective investors in the funds unless preceded or accompanied by an effective prospectus.
A fund files its complete schedule of portfolio holdings with the SEC for the first and third quarters of each fiscal year on Form N-Q. Forms N-Q are available on the SEC's web site at http://www.sec.gov. A fund's Forms N-Q may be reviewed and copied at the SEC's Public Reference Room in Washington, DC. Information regarding the operation of the SEC's Public Reference Room may be obtained by calling 1-800-SEC-0330. For a complete list of a fund's portfolio holdings, view each fund's most recent holdings listing, semiannual report, or annual report on Fidelity's web site at http://www.fidelity.com or http://www.advisor.fidelity.com, as applicable.
NOT FDIC INSURED · MAY LOSE VALUE · NO BANK GUARANTEE
Neither the funds nor Fidelity Distributors Corporation is a bank.
Annual Report
Chairman's Message
(Photograph of Edward C. Johnson 3d.)
Dear Shareholder:
Many stock and bond markets around the world have been unsettled of late; however, volatility can often lead to opportunity for patient investors. Financial markets are always unpredictable, but there are a number of time-tested principles that can put the historical odds in your favor.
One of the basic tenets is to invest for the long term. Over time, riding out the markets' inevitable ups and downs has proven much more effective than selling into panic or chasing the hottest trend. Even missing only a few of the markets' best days can significantly diminish investor returns. Patience also affords the benefits of compounding - of earning interest on additional income or reinvested dividends and capital gains. There are tax advantages and cost benefits to consider as well. The more you sell, the more taxes you pay, and the more you trade, the higher the costs. While staying the course doesn't eliminate risk, it can considerably lessen the effect of short-term declines.
You can further manage your investing risk through diversification. And today, more than ever, geographic diversification should be taken into account. Studies
indicate that asset allocation is the single most important determinant of a portfolio's long-term success. The right mix of stocks, bonds and cash - - aligned to your particular risk tolerance and investment objective - is very important. Age-appropriate rebalancing is also an essential aspect of asset allocation. For younger investors, an emphasis on equities - which historically have been the best-performing asset class over time - is encouraged. As investors near their specific goal, such as retirement or sending a child to college, consideration may be given to replacing volatile assets (e.g. common stocks) with more-stable fixed investments (bonds or savings plans).
A third investment principle - investing regularly - can help lower the average cost of your purchases. Investing a certain amount of money each month or quarter helps ensure you won't pay for all your shares at market highs. This strategy - known as dollar cost averaging - also reduces unconstructive "emotion" from investing, helping shareholders avoid selling weak performers just prior to an upswing, or chasing a hot performer just before a correction.
We invite you to contact us via the Internet, through our Investor Centers or over the phone. It is our privilege to provide you the information you need to make the investments that are right for you.
Sincerely,
/s/Edward C. Johnson 3d
Edward C. Johnson 3d
Annual Report
Shareholder Expense Example
As a shareholder of a Fund, you incur two types of costs: (1) transaction costs, including redemption fees and (2) ongoing costs, including management fees, and other Fund expenses. This Example is intended to help you understand your ongoing costs (in dollars) of investing in the Funds and to compare these costs with the ongoing costs of investing in other mutual funds.
The Example is based on an investment of $1,000 invested at the beginning of the period and held for the entire period (May 1, 2007 to October 31, 2007).
Actual Expenses
The first line of the accompanying table for each fund provides information about actual account values and actual expenses. You may use the information in this line, together with the amount you invested, to estimate the expenses that you paid over the period. Simply divide your account value by $1,000.00 (for example, an $8,600 account value divided by $1,000.00 = 8.6), then multiply the result by the number in the first line for a fund under the heading entitled "Expenses Paid During Period" to estimate the expenses you paid on your account during this period. A small balance maintenance fee of $12.00 that is charged once a year may apply for certain accounts with a value of less than $2,000. This fee is not included in the table below. If it was, the estimate of expenses you paid during the period would be higher, and your ending account value lower, by this amount. In addition, each Fund, as a shareholder in the underlying Fidelity Central Funds, will indirectly bear its pro rata share of the fees and expenses incurred by the underlying Fidelity Central Funds. These fees and expenses are not included in the Fund's annualized expense ratio used to calculate the expense estimate in the table below.
Hypothetical Example for Comparison Purposes
The second line of the accompanying table for each fund provides information about hypothetical account values and hypothetical expenses based on a Class' actual expense ratio and an assumed rate of return of 5% per year before expenses, which is not the Fund's actual return. The hypothetical account values and expenses may not be used to estimate the actual ending account balance or expenses you paid for the period. You may use this information to compare the ongoing costs of investing in the Fund and other funds. To do so, compare this 5% hypothetical example with the 5% hypothetical examples that appear in the shareholder reports of the other funds. A small balance maintenance fee of $12.00 that is charged once a year may apply for certain accounts with a value of less than $2,000. This fee is not included in the table below. If it was, the estimate of expenses you paid during the period would be higher, and your ending account value lower, by this amount. In addition, each Fund, as a shareholder in the underlying Fidelity Central Funds, will indirectly bear its pro rata share of the fees and expenses incurred by the underlying Fidelity Central Funds. These fees and expenses are not included in the Fund's annualized expense ratio used to calculate the expense estimate in the table below.
Please note that the expenses shown in the table are meant to highlight your ongoing costs only and do not reflect any transaction costs. Therefore, the second line of the table is useful in comparing ongoing costs only, and will not help you determine the relative total costs of owning different funds. In addition, if these transactional costs were included, your costs would have been higher.
| Beginning
Account Value
May 1, 2007 | Ending
Account Value
October 31, 2007 | Expenses Paid
During Period*
May 1, 2007
to October 31, 2007 |
China Region | | | |
Actual | $ 1,000.00 | $ 1,672.20 | $ 7.14 |
HypotheticalA | $ 1,000.00 | $ 1,019.86 | $ 5.40 |
Emerging Markets | | | |
Actual | $ 1,000.00 | $ 1,413.80 | $ 6.27 |
HypotheticalA | $ 1,000.00 | $ 1,020.01 | $ 5.24 |
Europe | | | |
Actual | $ 1,000.00 | $ 1,105.50 | $ 5.57 |
HypotheticalA | $ 1,000.00 | $ 1,019.91 | $ 5.35 |
Europe Capital Appreciation | | | |
Actual | $ 1,000.00 | $ 1,089.80 | $ 5.69 |
HypotheticalA | $ 1,000.00 | $ 1,019.76 | $ 5.50 |
Japan | | | |
Actual | $ 1,000.00 | $ 1,041.10 | $ 5.76 |
HypotheticalA | $ 1,000.00 | $ 1,019.56 | $ 5.70 |
Japan Smaller Companies | | | |
Actual | $ 1,000.00 | $ 1,040.40 | $ 5.19 |
HypotheticalA | $ 1,000.00 | $ 1,020.11 | $ 5.14 |
Latin America | | | |
Actual | $ 1,000.00 | $ 1,396.80 | $ 5.98 |
HypotheticalA | $ 1,000.00 | $ 1,020.21 | $ 5.04 |
Nordic | | | |
Actual | $ 1,000.00 | $ 1,154.30 | $ 5.70 |
HypotheticalA | $ 1,000.00 | $ 1,019.91 | $ 5.35 |
| Beginning
Account Value
May 1, 2007 | Ending
Account Value
October 31, 2007 | Expenses Paid
During Period*
May 1, 2007
to October 31, 2007 |
Pacific Basin | | | |
Actual | $ 1,000.00 | $ 1,258.20 | $ 6.83 |
HypotheticalA | $ 1,000.00 | $ 1,019.16 | $ 6.11 |
Southeast Asia | | | |
Actual | $ 1,000.00 | $ 1,637.30 | $ 7.05 |
HypotheticalA | $ 1,000.00 | $ 1,019.86 | $ 5.40 |
A 5% return per year before expenses
* Expenses are equal to each Fund's annualized expense ratio (shown in the table below); multiplied by the average account value over the period, multiplied by 184/365 (to reflect the one-half year period).
| Annualized
Expense Ratio |
China Region | 1.06% |
Emerging Markets | 1.03% |
Europe | 1.05% |
Europe Capital Appreciation | 1.08% |
Japan | 1.12% |
Japan Smaller Companies | 1.01% |
Latin America | .99% |
Nordic | 1.05% |
Pacific Basin | 1.20% |
Southeast Asia | 1.06% |
Annual Report
Canada
Shareholder Expense Example
As a shareholder of the Fund, you incur two types of costs: (1) transaction costs, including sales charges (loads) on purchase payments or redemption proceeds, redemption fees, and (2) ongoing costs, including management fees, distribution and/or service (12b-1) fees and other Fund expenses. This Example is intended to help you understand your ongoing costs (in dollars) of investing in the Fund and to compare these costs with the ongoing costs of investing in other mutual funds.
The Example is based on an investment of $1,000 invested at the beginning of the period and held for the entire period (May 1, 2007 to October 31, 2007) for the Canada class and for the entire period (May 2, 2007 to October 31, 2007) for Class A, Class T, Class B, Class C, and Institutional Class.
Actual Expenses
The first line of the accompanying table for each class of the Fund provides information about actual account values and actual expenses. You may use the information in this line, together with the amount you invested, to estimate the expenses that you paid over the period. Simply divide your account value by $1,000.00 (for example, an $8,600 account value divided by $1,000.00 = 8.6), then multiply the result by the number in the first line for a class of the Fund under the heading entitled "Expenses Paid During Period" to estimate the expenses you paid on your account during this period. A small balance maintenance fee of $12.00 that is charged once a year may apply for certain accounts with a value of less than $2,000. This fee is not included in the table below. If it was, the estimate of expenses you paid during the period would be higher, and your ending account value lower, by this amount. In addition, the Fund, as a shareholder in the underlying Fidelity Central Funds, will indirectly bear its pro rata share of the fees and expenses incurred by the underlying Fidelity Central Funds. These fees and expenses are not included in the Fund's annualized expense ratio used to calculate the expense estimate in the table below.
Hypothetical Example for Comparison Purposes
The second line of the accompanying table for each class of the Fund provides information about hypothetical account values and hypothetical expenses based on a Class' actual expense ratio and an assumed rate of return of 5% per year before expenses, which is not the Class' actual return. The hypothetical account values and expenses may not be used to estimate the actual ending account balance or expenses you paid for the period. You may use this information to compare the ongoing costs of investing in the Fund and other funds. To do so, compare this 5% hypothetical example with the 5% hypothetical examples that appear in the shareholder reports of the other funds. A small balance maintenance fee of $12.00 that is charged once a year may apply for certain accounts with a value of less than $2,000. This fee is not included in the table below. If it was, the estimate of expenses you paid during the period would be higher, and your ending account value lower, by this amount. In addition, the Fund, as a shareholder in the underlying Fidelity Central Funds, will indirectly bear its pro rata share of the fees and expenses incurred by the underlying Fidelity Central Funds. These fees and expenses are not included in the Fund's annualized expense ratio used to calculate the expense estimate in the table below.
Please note that the expenses shown in the table are meant to highlight your ongoing costs only and do not reflect any transaction costs. Therefore, the second line of the table is useful in comparing ongoing costs only, and will not help you determine the relative total costs of owning different funds. In addition, if these transactional costs were included, your costs would have been higher.
| Beginning
Account Value
May 1, 2007 | Ending
Account Value
October 31, 2007 | Expenses Paid
During Period*
May 1, 2007
to October 31, 2007 |
Class A | | | |
Actual | $ 1,000.00 | $ 1,299.30 | $ 7.09 |
HypotheticalA | $ 1,000.00 | $ 1,019.00 | $ 6.26 |
Class T | | | |
Actual | $ 1,000.00 | $ 1,298.00 | $ 8.53 |
HypotheticalA | $ 1,000.00 | $ 1,017.74 | $ 7.53 |
Classs B | | | |
Actual | $ 1,000.00 | $ 1,294.10 | $ 11.50 |
HypotheticalA | $ 1,000.00 | $ 1,015.12 | $ 10.16 |
Class C | | | |
Actual | $ 1,000.00 | $ 1,294.60 | $ 11.45 |
HypotheticalA | $ 1,000.00 | $ 1,015.17 | $ 10.11 |
Canada | | | |
Actual | $ 1,000.00 | $ 1,318.80 | $ 5.61 |
HypotheticalA | $ 1,000.00 | $ 1,020.37 | $ 4.89 |
Institutional Class | | | |
Actual | $ 1,000.00 | $ 1,300.90 | $ 5.83 |
HypotheticalA | $ 1,000.00 | $ 1,020.11 | $ 5.14 |
A 5% return per year before expenses
* Expenses are equal to each Class' annualized expense ratio (shown in the table below); multiplied by the average account value over the period, multiplied by 184/365 (to reflect the one-half year period) for the Canada class and multiplied by 183/365 (to reflect the period May 2, 2007 to October 31, 2007) for Class A, Class T, Class B, Class C, and Institutional Class.
Annual Report
Canada
Shareholder Expense Example - continued
| Annualized
Expense Ratio |
Class A | 1.23% |
Class T | 1.48% |
Class B | 2.00% |
Class C | 1.99% |
Canada | .96% |
Institutional Class | 1.01% |
Annual Report
Canada
Performance: The Bottom Line
Average annual total return reflects the change in the value of an investment, assuming reinvestment of the fund's dividend income and capital gains (the profits earned upon the sale of securities that have grown in value) and assuming a constant rate of performance each year. The $10,000 table and the fund's returns do not reflect the deduction of taxes that a shareholder would pay on fund distributions or the redemption of fund shares. During periods of reimbursement by Fidelity, a fund's total returns will be greater than it would be had the reimbursement not occurred. How a fund did yesterday is no guarantee of how it will do tomorrow.
Average Annual Total Returns
Periods ended October 31, 2007 | Past 1
year | Past 5
years | Past 10
years |
Fidelity® Canada Fund | 46.03% | 33.12% | 16.59% |
$10,000 Over 10 Years
Let's say hypothetically that $10,000 was invested in Fidelity® Canada Fund on October 31, 1997. The chart shows how the value of your investment would have changed, and also shows how the S&P/TSX Composite Index performed over the same period.
Annual Report
Canada
Management's Discussion of Fund Performance
Comments from Maxime Lemieux, Portfolio Manager of Fidelity® Canada Fund
Foreign stocks, with a large assist from a weak U.S. dollar, generally had higher returns for U.S. investors than domestic equities during the 12-month period ending October 31, 2007. The backdrop for global stocks was solid, with robust economic growth and relatively high corporate profitability worldwide. Developed international equity markets, as measured by the Morgan Stanley Capital InternationalSM Europe, Australasia, and Far East (MSCI® EAFE®) Index - a performance monitor of established markets outside the United States and Canada - rose 25.09%. In comparison, the Standard & Poor's 500SM Index, a gauge of U.S. stocks, was up 14.56%, while Canada did appreciably better, as measured by the 43.24% advance of the S&P/TSX Composite Index. Among countries making up at least 1% of the EAFE benchmark, Finland had the best showing, soaring nearly 69%, while Hong Kong gained roughly 66%. The United Kingdom and Japan, the two largest components of the index, both underperformed. Fallout from the credit crunch and concerns about export growth tempered UK stocks, while Japan struggled with a slowdown in consumer spending and sluggish domestic growth. Emerging markets were the period's big winners, advancing 68.33% as measured by the MSCI Emerging Markets index.
For the 12 months that ended October 31, 2007, the fund returned 46.03%, solidly outperforming the 43.24% gain of the S&P/TSX Composite Index. Despite an underweighting in the strong-performing energy and materials sectors, prudent stock selection within these and other sectors - notably technology - propelled the fund's return past that of the benchmark. Overweighted positions in technology firm Research In Motion, aluminum producer and takeover target Alcan, engineering firm SNC-Lavalin, T-shirt manufacturer Gildan Activewear and fertilizer giant Potash Corp. of Saskatchewan made these stocks top contributors. Owning only a small stake in poorly performing telecommunications equipment maker Nortel Networks also boosted relative returns. Conversely, we had disappointing results in financials, led by property and casualty insurer ING Canada and Bank of Montreal. Elsewhere, telecom services operator TELUS, and gas and convenience store owner Alimentation Couche-Tard also detracted. Underweighting strong-performing telecom services operator BCE, which is in the process of being acquired, and not owning nickel producer and index component LionOre, which was taken over during the period, also dampened returns.
Note to shareholders: Fidelity Canada Fund may invest up to 35% of its total assets in any industry that represents more than 20% of the Canadian market. As of October 31, 2007, the fund did not have more than 25% of its total assets invested in any one industry.
The views expressed above reflect those of the portfolio manager(s) only through the end of the period as stated on the cover of this report and do not necessarily represent the views of Fidelity or any other person in the Fidelity organization. Any such views are subject to change at any time based upon market or other conditions and Fidelity disclaims any responsibility to update such views. These views may not be relied on as investment advice and, because investment decisions for a Fidelity fund are based on numerous factors, may not be relied on as an indication of trading intent on behalf of any Fidelity fund.
Annual Report
Canada
Investment Changes
Geographic Diversification (% of fund's net assets) |
As of October 31, 2007 |
 | Canada | 94.9% | |
 | United States of America | 5.1% | |

Percentages are adjusted for the effect of futures contracts, if applicable. |
|
As of April 30, 2007 |
| Canada | 96.5% | |
| United States of America | 3.5% | |

Percentages are adjusted for the effect of futures contracts, if applicable. |
Asset Allocation |
| % of fund's
net assets | % of fund's net assets
6 months ago |
Stocks | 96.1 | 97.7 |
Short-Term Investments and Net Other Assets | 3.9 | 2.3 |
Top Ten Stocks as of October 31, 2007 |
| % of fund's
net assets | % of fund's net assets
6 months ago |
Research In Motion Ltd. (Communications Equipment) | 4.8 | 2.6 |
Suncor Energy, Inc. (Oil, Gas & Consumable Fuels) | 4.7 | 3.6 |
Manulife Financial Corp. (Insurance) | 4.5 | 5.0 |
Royal Bank of Canada (Commercial Banks) | 4.0 | 4.7 |
Toronto-Dominion Bank (Commercial Banks) | 3.9 | 4.5 |
Potash Corp. of Saskatchewan, Inc. (Chemicals) | 3.7 | 2.5 |
SNC-Lavalin Group, Inc. (Construction & Engineering) | 3.6 | 1.3 |
Canadian Natural Resources Ltd. (Oil, Gas & Consumable Fuels) | 3.5 | 3.1 |
Rogers Communications, Inc. Class B (non-vtg.) (Wireless Telecommunication Services) | 3.4 | 3.1 |
EnCana Corp. (Oil, Gas & Consumable Fuels) | 3.2 | 3.2 |
| 39.3 | |
Market Sectors as of October 31, 2007 |
| % of fund's
net assets | % of fund's net assets
6 months ago |
Energy | 25.6 | 26.8 |
Financials | 23.7 | 29.7 |
Materials | 10.9 | 9.5 |
Industrials | 10.3 | 8.0 |
Information Technology | 9.5 | 5.9 |
Consumer Discretionary | 6.3 | 7.6 |
Telecommunication Services | 6.3 | 6.6 |
Consumer Staples | 3.4 | 3.6 |
Health Care | 0.1 | 0.0 |
Annual Report
Canada
Investments October 31, 2007
Showing Percentage of Net Assets
Common Stocks - 96.1% |
| Shares | | Value |
CONSUMER DISCRETIONARY - 6.3% |
Hotels, Restaurants & Leisure - 0.7% |
Great Canadian Gaming Corp. (a) | 1,100,000 | | $ 16,310,104 |
Tim Hortons, Inc. | 500,000 | | 18,950,000 |
| | 35,260,104 |
Media - 3.0% |
Aeroplan Income Fund | 718,200 | | 17,038,424 |
Aeroplan Income Fund (a)(e) | 31,800 | | 754,416 |
Astral Media, Inc. Class A (non-vtg.) | 200,000 | | 9,540,352 |
Corus Entertainment, Inc. Class B (non-vtg.) | 550,000 | | 28,979,559 |
Quebecor, Inc. Class B (sub. vtg.) | 975,000 | | 42,337,429 |
Yellow Pages Income Fund | 3,200,000 | | 48,464,308 |
| | 147,114,488 |
Multiline Retail - 0.5% |
Canadian Tire Corp. Ltd. Class A (non-vtg.) | 275,000 | | 25,309,786 |
Textiles, Apparel & Luxury Goods - 2.1% |
Gildan Activewear, Inc. (a) | 2,250,000 | | 103,063,440 |
TOTAL CONSUMER DISCRETIONARY | | 310,747,818 |
CONSUMER STAPLES - 3.4% |
Food & Staples Retailing - 2.6% |
Alimentation Couche-Tard, Inc. Class B (sub. vtg.) | 1,250,000 | | 27,179,093 |
Metro, Inc. Class A (sub. vtg.) | 725,000 | | 27,281,561 |
Shoppers Drug Mart Corp. | 1,250,000 | | 73,316,035 |
| | 127,776,689 |
Food Products - 0.8% |
Saskatchewan Wheat Pool, Inc. (a) | 1,826,500 | | 24,702,823 |
Saskatchewan Wheat Pool, Inc. (a)(e) | 1,273,500 | | 17,223,676 |
| | 41,926,499 |
TOTAL CONSUMER STAPLES | | 169,703,188 |
ENERGY - 25.6% |
Energy Equipment & Services - 0.6% |
CCS Income Trust | 500,000 | | 23,935,607 |
Flint Energy Services Ltd. (a) | 250,000 | | 6,441,961 |
Savanna Energy Services Corp. | 140,000 | | 2,367,931 |
| | 32,745,499 |
Oil, Gas & Consumable Fuels - 25.0% |
AltaGas Income Trust | 700,000 | | 19,868,672 |
Cameco Corp. | 1,000,000 | | 49,300,996 |
Canadian Natural Resources Ltd. | 2,100,000 | | 174,725,694 |
Canadian Oil Sands Trust | 1,700,000 | | 62,476,170 |
Duvernay Oil Corp. (a) | 350,000 | | 12,644,037 |
EnCana Corp. | 2,250,000 | | 157,514,298 |
Galleon Energy, Inc. (a)(e) | 100,000 | | 1,524,042 |
Galleon Energy, Inc. Class A (a) | 700,000 | | 10,668,291 |
Husky Energy, Inc. | 1,400,000 | | 65,284,897 |
Keyera Facilities Income Fund | 1,000,000 | | 17,729,295 |
|
| Shares | | Value |
Nexen, Inc. | 1,250,000 | | $ 42,350,667 |
Niko Resources Ltd. | 475,000 | | 53,224,952 |
Niko Resources Ltd. (e) | 20,000 | | 2,241,051 |
Petro-Canada | 1,232,900 | | 71,164,001 |
Suncor Energy, Inc. | 2,100,000 | | 230,083,669 |
Talisman Energy, Inc. | 3,200,000 | | 69,747,935 |
TransCanada Corp. | 3,700,000 | | 157,451,811 |
Uranium One, Inc. (a) | 1,550,000 | | 17,220,398 |
Valero Energy Corp. | 280,000 | | 19,720,400 |
| | 1,234,941,276 |
TOTAL ENERGY | | 1,267,686,775 |
FINANCIALS - 23.7% |
Capital Markets - 0.6% |
CI Financial Income Fund | 950,000 | | 28,604,639 |
Commercial Banks - 12.9% |
Bank of Montreal | 2,300,000 | | 153,463,249 |
Canadian Imperial Bank of Commerce | 450,000 | | 48,612,582 |
National Bank of Canada | 800,000 | | 46,303,749 |
Royal Bank of Canada | 3,350,000 | | 198,828,638 |
Toronto-Dominion Bank | 2,550,000 | | 192,694,874 |
| | 639,903,092 |
Diversified Financial Services - 0.8% |
Onex Corp. (sub. vtg.) | 425,000 | | 17,887,630 |
TSX Group, Inc. | 375,000 | | 20,231,413 |
| | 38,119,043 |
Insurance - 7.3% |
ING Canada, Inc. | 570,000 | | 27,165,855 |
Manulife Financial Corp. | 4,750,000 | | 222,307,244 |
Power Corp. of Canada (sub. vtg.) | 1,200,000 | | 51,497,564 |
Sun Life Financial, Inc. | 1,000,000 | | 58,133,870 |
| | 359,104,533 |
Real Estate Management & Development - 2.1% |
Brookfield Asset Management, Inc. Class A | 1,850,000 | | 75,610,570 |
Brookfield Properties Corp. | 1,250,000 | | 31,212,508 |
| | 106,823,078 |
TOTAL FINANCIALS | | 1,172,554,385 |
HEALTH CARE - 0.1% |
Health Care Equipment & Supplies - 0.1% |
Noveko International, Inc. (a) | 834,000 | | 6,085,850 |
INDUSTRIALS - 10.3% |
Aerospace & Defense - 2.9% |
Bombardier, Inc. Class B (sub. vtg.) (a) | 16,275,000 | | 96,526,160 |
Common Stocks - continued |
| Shares | | Value |
INDUSTRIALS - continued |
Aerospace & Defense - continued |
CAE, Inc. | 3,300,000 | | $ 44,526,583 |
Mecachrome International, Inc. (a)(e) | 400,000 | | 5,380,216 |
| | 146,432,959 |
Commercial Services & Supplies - 0.4% |
Garda World Security Corp. (a) | 950,000 | | 18,321,860 |
Construction & Engineering - 3.6% |
SNC-Lavalin Group, Inc. | 3,450,000 | | 178,748,146 |
Machinery - 0.2% |
Bucyrus International, Inc. Class A | 100,000 | | 8,250,000 |
Road & Rail - 1.9% |
Canadian National Railway Co. | 1,300,000 | | 72,958,060 |
Canadian Pacific Railway Ltd. | 150,000 | | 10,561,322 |
TransForce Income Fund | 844,237 | | 9,450,948 |
| | 92,970,330 |
Trading Companies & Distributors - 1.3% |
Finning International, Inc. | 1,900,000 | | 65,399,280 |
TOTAL INDUSTRIALS | | 510,122,575 |
INFORMATION TECHNOLOGY - 9.5% |
Communications Equipment - 5.0% |
Nortel Networks Corp. (a) | 550,000 | | 8,877,357 |
Research In Motion Ltd. (a) | 1,900,000 | | 236,569,016 |
| | 245,446,373 |
Electronic Equipment & Instruments - 0.2% |
Miranda Technologies, Inc. (a) | 613,700 | | 6,629,676 |
Miranda Technologies, Inc. (a)(e) | 186,300 | | 2,012,561 |
| | 8,642,237 |
Internet Software & Services - 2.6% |
Google, Inc. Class A (sub. vtg.) (a) | 150,000 | | 106,050,000 |
Open Text Corp. (a)(d) | 675,000 | | 21,096,431 |
| | 127,146,431 |
IT Services - 0.6% |
CGI Group, Inc. Class A (sub. vtg.) (a) | 2,000,000 | | 22,791,781 |
Emergis, Inc. (a) | 700,000 | | 5,552,849 |
| | 28,344,630 |
Semiconductors & Semiconductor Equipment - 0.2% |
Broadcom Corp. Class A (a) | 250,000 | | 8,137,500 |
Tundra Semiconductor Corp. Ltd. (a) | 355,000 | | 1,928,776 |
| | 10,066,276 |
|
| Shares | | Value |
Software - 0.9% |
Cognos, Inc. (a) | 350,000 | | $ 17,615,501 |
MacDonald Dettwiler & Associates Ltd. (a) | 625,000 | | 29,787,121 |
| | 47,402,622 |
TOTAL INFORMATION TECHNOLOGY | | 467,048,569 |
MATERIALS - 10.9% |
Chemicals - 3.7% |
Potash Corp. of Saskatchewan, Inc. | 1,470,000 | | 180,545,409 |
Metals & Mining - 7.2% |
Aber Diamond Corp. | 450,000 | | 19,797,712 |
Barrick Gold Corp. | 1,100,000 | | 48,930,311 |
Eldorado Gold Corp. (a) | 350,000 | | 2,442,809 |
First Quantum Minerals Ltd. | 50,000 | | 5,384,982 |
Fording Canadian Coal Trust | 400,000 | | 14,666,384 |
Goldcorp, Inc. | 2,850,000 | | 100,302,372 |
Kinross Gold Corp. (a) | 3,800,000 | | 75,178,988 |
Shore Gold, Inc. (a) | 3,000,000 | | 14,456,683 |
Teck Cominco Ltd. Class B (sub. vtg.) | 600,000 | | 30,063,546 |
US Gold Corp. (a) | 1,100,000 | | 5,137,000 |
US Gold Corp. warrants 2/22/11 (a)(f) | 200,000 | | 324,084 |
Yamana Gold, Inc. (d) | 2,750,000 | | 41,474,264 |
| | 358,159,135 |
TOTAL MATERIALS | | 538,704,544 |
TELECOMMUNICATION SERVICES - 6.3% |
Diversified Telecommunication Services - 2.6% |
BCE, Inc. | 650,000 | | 28,397,056 |
TELUS Corp. (non-vtg.) | 1,725,000 | | 100,463,620 |
| | 128,860,676 |
Wireless Telecommunication Services - 3.7% |
American Tower Corp. Class A (a) | 325,000 | | 14,358,500 |
Rogers Communications, Inc. Class B (non-vtg.) | 3,250,000 | | 165,701,123 |
| | 180,059,623 |
TOTAL TELECOMMUNICATION SERVICES | | 308,920,299 |
TOTAL COMMON STOCKS (Cost $2,920,644,814) | 4,751,574,003 |
Government Obligations - 2.6% |
| Principal Amount | | |
Canadian Government Treasury Bills yield at date of purchase
3.9104% to 4.5618% 11/1/07 to 2/7/08
(Cost $119,603,328) | CAD | $ 121,450,000 | 127,806,224 |
Money Market Funds - 2.9% |
| Shares | | Value |
Fidelity Cash Central Fund, 4.97% (b) | 129,652,562 | | $ 129,652,562 |
Fidelity Securities Lending Cash Central Fund, 5.02% (b)(c) | 15,247,500 | | 15,247,500 |
TOTAL MONEY MARKET FUNDS (Cost $144,900,062) | 144,900,062 |
TOTAL INVESTMENT PORTFOLIO - 101.6% (Cost $3,185,148,204) | | 5,024,280,289 |
NET OTHER ASSETS - (1.6)% | | (81,336,082) |
NET ASSETS - 100% | $ 4,942,944,207 |
Currency Abbreviations |
CAD | - | Canadian dollar |
Legend |
(a) Non-income producing |
(b) Affiliated fund that is available only to investment companies and other accounts managed by Fidelity Investments. The rate quoted is the annualized seven-day yield of the fund at period end. A complete unaudited listing of the fund's holdings as of its most recent quarter end is available upon request. |
(c) Investment made with cash collateral received from securities on loan. |
(d) Security or a portion of the security is on loan at period end. |
(e) Security exempt from registration under Rule 144A of the Securities Act of 1933. These securities may be resold in transactions exempt from registration, normally to qualified institutional buyers. At the end of the period, the value of these securities amounted to $29,135,962 or 0.6% of net assets. |
(f) Restricted securities - Investment in securities not registered under the Securities Act of 1933 (excluding 144A issues). At the end of the period, the value of restricted securities (excluding 144A issues) amounted to $324,084 or 0.0% of net assets. |
Additional information on each holding is as follows: |
Security | Acquisition Date | Acquisition Cost |
US Gold Corp. warrants 2/22/11 | 2/8/06 | $ 98,359 |
Affiliated Central Funds |
Information regarding fiscal year to date income earned by the Fund from investments in Fidelity Central Funds is as follows: |
Fund | Income earned |
Fidelity Cash Central Fund | $ 3,233,641 |
Fidelity Securities Lending Cash Central Fund | 4,436,261 |
Total | $ 7,669,902 |
Other Affiliated Issuers |
An affiliated company is a company in which the fund has ownership of at least 5% of the voting securities. Fiscal year to date transactions with companies which are or were affiliates are as follows: |
Affiliate | Value, beginning of period | Purchases | Sales Proceeds | Dividend Income | Value, end
of period |
WestJet Airlines Ltd. | $ 3,582,328 | $ 281,310 | $ 5,177,899 | $ - | $ - |
See accompanying notes which are an integral part of the financial statements.
Annual Report
Canada
Financial Statements
Statement of Assets and Liabilities
| October 31, 2007 |
| | |
Assets | | |
Investment in securities, at value (including securities loaned of $15,071,263) - See accompanying schedule: Unaffiliated issuers
(cost $3,040,248,142) | $ 4,879,380,227 | |
Fidelity Central Funds
(cost $144,900,062) | 144,900,062 | |
Total Investments
(cost $3,185,148,204) | | $ 5,024,280,289 |
Cash | | 54,573 |
Foreign currency held at value
(cost $2,187,024) | | 2,190,556 |
Receivable for investments sold | | 11,913,945 |
Receivable for fund shares sold | | 24,997,924 |
Dividends receivable | | 4,574,014 |
Distributions receivable from Fidelity Central Funds | | 817,046 |
Prepaid expenses | | 1,281 |
Other receivables | | 182,735 |
Total assets | | 5,069,012,363 |
| | |
Liabilities | | |
Payable for investments purchased | $ 103,381,374 | |
Payable for fund shares redeemed | 3,704,968 | |
Accrued management fee | 2,706,784 | |
Distribution fees payable | 16,777 | |
Other affiliated payables | 826,650 | |
Other payables and accrued expenses | 184,103 | |
Collateral on securities loaned, at value | 15,247,500 | |
Total liabilities | | 126,068,156 |
| | |
Net Assets | | $ 4,942,944,207 |
Net Assets consist of: | | |
Paid in capital | | $ 2,817,566,476 |
Undistributed net investment income | | 26,450,845 |
Accumulated undistributed net realized gain (loss) on investments and foreign currency transactions | | 259,628,185 |
Net unrealized appreciation (depreciation) on investments and assets and liabilities in foreign currencies | | 1,839,298,701 |
Net Assets | | $ 4,942,944,207 |
Statement of Assets and Liabilities - continued
| October 31, 2007 |
| | |
Calculation of Maximum Offering Price Class A:
Net Asset Value and redemption price per share ($20,911,606 ÷ 298,051 shares) | | $ 70.16 |
| | |
Maximum offering price per share (100/94.25 of $70.16) | | $ 74.44 |
Class T:
Net Asset Value and redemption price per share ($14,522,231 ÷ 207,194 shares) | | $ 70.09 |
| | |
Maximum offering price per share (100/96.50 of $70.09) | | $ 72.63 |
Class B:
Net Asset Value and offering price per share ($4,078,099 ÷ 58,354.4 shares)A | | $ 69.88 |
| | |
Class C:
Net Asset Value and offering price per share ($8,751,799 ÷ 125,182 shares)A | | $ 69.91 |
| | |
| | |
Canada:
Net Asset Value, offering price and redemption price per share ($4,890,616,915 ÷ 69,617,220 shares) | | $ 70.25 |
| | |
Institutional Class:
Net Asset Value, offering price and redemption price per share ($4,063,557 ÷ 57,844 shares) | | $ 70.25 |
A Redemption price per share is equal to net asset value less any applicable contingent deferred sales charge.
See accompanying notes which are an integral part of the financial statements.
Annual Report
Canada
Financial Statements - continued
Statement of Operations
| Year ended October 31, 2007 |
| | |
Investment Income | | |
Dividends | | $ 64,656,558 |
Interest | | 3,366,629 |
Income from Fidelity Central Funds (including $4,436,261 from security lending) | | 7,669,902 |
| | 75,693,089 |
Less foreign taxes withheld | | (9,150,807) |
Total income | | 66,542,282 |
| | |
Expenses | | |
Management fee
Basic fee | $ 25,043,384 | |
Performance adjustment | (579,460) | |
Transfer agent fees | 7,412,777 | |
Distribution fees | 39,582 | |
Accounting and security lending fees | 1,426,984 | |
Custodian fees and expenses | 200,450 | |
Independent trustees' compensation | 11,897 | |
Registration fees | 222,934 | |
Audit | 84,068 | |
Legal | 33,081 | |
Interest | 36,171 | |
Miscellaneous | 119,526 | |
Total expenses before reductions | 34,051,394 | |
Expense reductions | (687,313) | 33,364,081 |
Net investment income (loss) | | 33,178,201 |
Realized and Unrealized Gain (Loss) Net realized gain (loss) on: | | |
Investment securities: | | |
Unaffiliated issuers | 271,498,118 | |
Other affiliated issuers | 1,297,868 | |
Foreign currency transactions | (518,962) | |
Total net realized gain (loss) | | 272,277,024 |
Change in net unrealized appreciation (depreciation) on: Investment securities | 1,120,584,615 | |
Assets and liabilities in foreign currencies | 134,640 | |
Total change in net unrealized appreciation (depreciation) | | 1,120,719,255 |
Net gain (loss) | | 1,392,996,279 |
Net increase (decrease) in net assets resulting from operations | | $ 1,426,174,480 |
See accompanying notes which are an integral part of the financial statements.
Annual Report
Statement of Changes in Net Assets
| Year ended
October 31,
2007 | Year ended
October 31,
2006 |
Increase (Decrease) in Net Assets | | |
Operations | | |
Net investment income (loss) | $ 33,178,201 | $ 19,732,045 |
Net realized gain (loss) | 272,277,024 | 70,228,167 |
Change in net unrealized appreciation (depreciation) | 1,120,719,255 | 455,286,136 |
Net increase (decrease) in net assets resulting from operations | 1,426,174,480 | 545,246,348 |
Distributions to shareholders from net investment income | (22,989,617) | (7,430,512) |
Distributions to shareholders from net realized gain | (65,775,827) | (464,413) |
Total distributions | (88,765,444) | (7,894,925) |
Share transactions - net increase (decrease) | 467,056,549 | 875,768,447 |
Redemption fees | 1,551,369 | 1,291,008 |
Total increase (decrease) in net assets | 1,806,016,954 | 1,414,410,878 |
| | |
Net Assets | | |
Beginning of period | 3,136,927,253 | 1,722,516,375 |
End of period (including undistributed net investment income of $26,450,845 and undistributed net investment income of $17,032,665, respectively) | $ 4,942,944,207 | $ 3,136,927,253 |
Financial Highlights - Class A
Years ended October 31, | 2007 H |
Selected Per-Share Data | |
Net asset value, beginning of period | $ 54.00 |
Income from Investment Operations | |
Net investment income (loss) E | .19 |
Net realized and unrealized gain (loss) | 15.96 |
Total from investment operations | 16.15 |
Redemption fees added to paid in capital E | .01 |
Net asset value, end of period | $ 70.16 |
Total Return B, C, D | 29.93% |
Ratios to Average Net Assets F, I | |
Expenses before reductions | 1.23% A |
Expenses net of fee waivers, if any | 1.23% A |
Expenses net of all reductions | 1.22% A |
Net investment income (loss) | .63% A |
Supplemental Data | |
Net assets, end of period (000 omitted) | $ 20,912 |
Portfolio turnover rate G | 42% |
AAnnualized B Total returns for periods of less than one year are not annualized. C Total returns would have been lower had certain expenses not been reduced during the periods shown. D Total returns do not include the effect of the sales charges. E Calculated based on average shares outstanding during the period. F Fees and expenses of the underlying Fidelity Central Funds are not included in the Fund's expense ratio. The Fund indirectly bears its proportionate share of the expenses of any underlying Fidelity Central Funds. G Amount does not include the portfolio activity of any underlying Fidelity Central Funds. H For the period May 2, 2007 (commencement of sale of shares) to October 31, 2007. I Expense ratios reflect operating expenses of the class. Expenses before reductions do not reflect amounts reimbursed by the investment adviser or reductions from brokerage service arrangements or other expense offset arrangements and do not represent the amount paid by the class during periods when reimbursements or reductions occur. Expense ratios before reductions for start-up periods may not be representative of longer-term operating periods. Expenses net of fee waivers reflect expenses after reimbursement by the investment adviser but prior to reductions from brokerage service arrangements or other expense offset arrangements. Expenses net of all reductions represent the net expenses paid by the class. |
See accompanying notes which are an integral part of the financial statements.
Annual Report
Financial Highlights - Class T
Years ended October 31, | 2007 H |
Selected Per-Share Data | |
Net asset value, beginning of period | $ 54.00 |
Income from Investment Operations | |
Net investment income (loss) E | .09 |
Net realized and unrealized gain (loss) | 15.99 |
Total from investment operations | 16.08 |
Redemption fees added to paid in capital E | .01 |
Net asset value, end of period | $ 70.09 |
Total Return B, C, D | 29.80% |
Ratios to Average Net Assets F, I | |
Expenses before reductions | 1.48% A |
Expenses net of fee waivers, if any | 1.48% A |
Expenses net of all reductions | 1.47% A |
Net investment income (loss) | .30% A |
Supplemental Data | |
Net assets, end of period (000 omitted) | $ 14,522 |
Portfolio turnover rate G | 42% |
A Annualized B Total returns for periods of less than one year are not annualized. C Total returns would have been lower had certain expenses not been reduced during the periods shown. D Total returns do not include the effect of the sales charges. E Calculated based on average shares outstanding during the period. F Fees and expenses of the underlying Fidelity Central Funds are not included in the Fund's expense ratio. The Fund indirectly bears its proportionate share of the expenses of any underlying Fidelity Central Funds. G Amount does not include the portfolio activity of any underlying Fidelity Central Funds. H For the period May 2, 2007 (commencement of sale of shares) to October 31, 2007. I Expense ratios reflect operating expenses of the class. Expenses before reductions do not reflect amounts reimbursed by the investment adviser or reductions from brokerage service arrangements or other expense offset arrangements and do not represent the amount paid by the class during periods when reimbursements or reductions occur. Expense ratios before reductions for start-up periods may not be representative of longer-term operating periods. Expenses net of fee waivers reflect expenses after reimbursement by the investment adviser but prior to reductions from brokerage service arrangements or other expense offset arrangements. Expenses net of all reductions represent the net expenses paid by the class. |
Financial Highlights - Class B
Years ended October 31, | 2007 H |
Selected Per-Share Data | |
Net asset value, beginning of period | $ 54.00 |
Income from Investment Operations | |
Net investment income (loss) E | (.06) |
Net realized and unrealized gain (loss) | 15.93 |
Total from investment operations | 15.87 |
Redemption fees added to paid in capital E | .01 |
Net asset value, end of period | $ 69.88 |
Total Return B, C, D | 29.41% |
Ratios to Average Net Assets F, I | |
Expenses before reductions | 2.00% A |
Expenses net of fee waivers, if any | 2.00% A |
Expenses net of all reductions | 1.99% A |
Net investment income (loss) | (.21)% A |
Supplemental Data | |
Net assets, end of period (000 omitted) | $ 4,078 |
Portfolio turnover rate G | 42% |
A Annualized BTotal returns for periods of less than one year are not annualized. CTotal returns would have been lower had certain expenses not been reduced during the periods shown. DTotal returns do not include the effect of the contingent deferred sales charge. ECalculated based on average shares outstanding during the period. FFees and expenses of the underlying Fidelity Central Funds are not included in the Fund's expense ratio. The Fund indirectly bears its proportionate share of the expenses of any underlying Fidelity Central Funds. GAmount does not include the portfolio activity of any underlying Fidelity Central Funds. HFor the period May 2, 2007 (commencement of sale of shares) to October 31, 2007. IExpense ratios reflect operating expenses of the class. Expenses before reductions do not reflect amounts reimbursed by the investment adviser or reductions from brokerage service arrangements or other expense offset arrangements and do not represent the amount paid by the class during periods when reimbursements or reductions occur. Expense ratios before reductions for start-up periods may not be representative of longer-term operating periods. Expenses net of fee waivers reflect expenses after reimbursement by the investment adviser but prior to reductions from brokerage service arrangements or other expense offset arrangements. Expenses net of all reductions represent the net expenses paid by the class. |
See accompanying notes which are an integral part of the financial statements.
Annual Report
Financial Highlights - Class C
Years ended October 31, | 2007 H |
Selected Per-Share Data | |
Net asset value, beginning of period | $ 54.00 |
Income from Investment Operations | |
Net investment income (loss) E | (.04) |
Net realized and unrealized gain (loss) | 15.94 |
Total from investment operations | 15.90 |
Redemption fees added to paid in capital E | .01 |
Net asset value, end of period | $ 69.91 |
Total Return B, C, D | 29.46% |
Ratios to Average Net Assets F, I | |
Expenses before reductions | 1.99% A |
Expenses net of fee waivers, if any | 1.99% A |
Expenses net of all reductions | 1.97% A |
Net investment income (loss) | (.15)% A |
Supplemental Data | |
Net assets, end of period (000 omitted) | $ 8,752 |
Portfolio turnover rate G | 42% |
A Annualized B Total returns for periods of less than one year are not annualized. C Total returns would have been lower had certain expenses not been reduced during the periods shown. D Total returns do not include the effect of the contingent deferred sales charge. ECalculated based on average shares outstanding during the period. F Fees and expenses of the underlying Fidelity Central Funds are not included in the Fund's expense ratio. The Fund indirectly bears its proportionate share of the expenses of any underlying Fidelity Central Funds. G Amount does not include the portfolio activity of any underlying Fidelity Central Funds. HFor the period May 2, 2007 (commencement of sale of shares) to October 31, 2007. I Expense ratios reflect operating expenses of the class. Expenses before reductions do not reflect amounts reimbursed by the investment adviser or reductions from brokerage service arrangements or other expense offset arrangements and do not represent the amount paid by the class during periods when reimbursements or reductions occur. Expense ratios before reductions for start-up periods may not be representative of longer-term operating periods. Expenses net of fee waivers reflect expenses after reimbursement by the investment adviser but prior to reductions from brokerage service arrangements or other expense offset arrangements. Expenses net of all reductions represent the net expenses paid by the class. |
Financial Highlights - Canada
| | |
Years ended October 31, | 2007 | 2006 | 2005 | 2004 | 2003 |
Selected Per-Share Data | | | | | |
Net asset value, beginning of period | $ 49.48 | $ 39.14 | $ 31.87 | $ 25.13 | $ 17.52 |
Income from Investment Operations | | | | | |
Net investment income (loss) B | .52 | .34 | .20 | .10 | .05 |
Net realized and unrealized gain (loss) | 21.62 | 10.15 | 7.12 | 6.74 | 7.58 |
Total from investment operations | 22.14 | 10.49 | 7.32 | 6.84 | 7.63 |
Distributions from net investment income | (.36) | (.16) | (.08) | (.13) | (.04) |
Distributions from net realized gain | (1.03) | (.01) | - | - | - |
Total distributions | (1.39) | (.17) | (.08) | (.13) | (.04) |
Redemption fees added to paid in capital B | .02 | .02 | .03 | .03 | .02 |
Net asset value, end of period | $ 70.25 | $ 49.48 | $ 39.14 | $ 31.87 | $ 25.13 |
Total Return A | 46.03% | 26.93% | 23.11% | 27.45% | 43.75% |
Ratios to Average Net Assets C, E | | | | | |
Expenses before reductions | .96% | 1.00% | 1.08% | 1.20% | 1.42% |
Expenses net of fee waivers, if any | .96% | 1.00% | 1.08% | 1.20% | 1.42% |
Expenses net of all reductions | .94% | .97% | 1.04% | 1.15% | 1.37% |
Net investment income (loss) | .94% | .74% | .55% | .34% | .26% |
Supplemental Data | | | | | |
Net assets, end of period (000 omitted) | $ 4,890,617 | $ 3,136,927 | $ 1,722,516 | $ 413,319 | $ 167,205 |
Portfolio turnover rate D | 42% | 50% | 24% | 47% | 52% |
A Total returns would have been lower had certain expenses not been reduced during the periods shown. BCalculated based on average shares outstanding during the period. CFees and expenses of the underlying Fidelity Central Funds are not included in the Fund's expense ratio. The Fund indirectly bears its proportionate share of the expenses of any underlying Fidelity Central Funds. DAmount does not include the portfolio activity of any underlying Fidelity Central Funds. E Expense ratios reflect operating expenses of the class. Expenses before reductions do not reflect amounts reimbursed by the investment adviser or reductions from brokerage service arrangements or other expense offset arrangements and do not represent the amount paid by the class during periods when reimbursements or reductions occur. Expenses net of fee waivers reflect expenses after reimbursement by the investment adviser but prior to reductions from brokerage service arrangements or other expense offset arrangements. Expenses net of all reductions represent the net expenses paid by the class. |
See accompanying notes which are an integral part of the financial statements.
Annual Report
Financial Highlights - Institutional Class
Years ended October 31, | 2007 G |
Selected Per-Share Data | |
Net asset value, beginning of period | $ 54.00 |
Income from Investment Operations | |
Net investment income (loss) D | .25 |
Net realized and unrealized gain (loss) | 15.99 |
Total from investment operations | 16.24 |
Redemption fees added to paid in capital D | .01 |
Net asset value, end of period | $ 70.25 |
Total Return B, C | 30.09% |
Ratios to Average Net Assets E, H | |
Expenses before reductions | 1.01% A |
Expenses net of fee waivers, if any | 1.01% A |
Expenses net of all reductions | .99% A |
Net investment income (loss) | .83% A |
Supplemental Data | |
Net assets, end of period (000 omitted) | $ 4,064 |
Portfolio turnover rate F | 42% |
A Annualized BTotal returns for periods of less than one year are not annualized. CTotal returns would have been lower had certain expenses not been reduced during the periods shown. DCalculated based on average shares outstanding during the period. EFees and expenses of the underlying Fidelity Central Funds are not included in the Fund's expense ratio. The Fund indirectly bears its proportionate share of the expenses of any underlying Fidelity Central Funds. FAmount does not include the portfolio activity of any underlying Fidelity Central Funds. GFor the period May 2, 2007 (commencement of sale of shares) to October 31, 2007. H Expense ratios reflect operating expenses of the class. Expenses before reductions do not reflect amounts reimbursed by the investment adviser or reductions from brokerage service arrangements or other expense offset arrangements and do not represent the amount paid by the class during periods when reimbursements or reductions occur. Expense ratios before reductions for start-up periods may not be representative of longer-term operating periods. Expenses net of fee waivers reflect expenses after reimbursement by the investment adviser but prior to reductions from brokerage service arrangements or other expense offset arrangements. Expenses net of all reductions represent the net expenses paid by the class. |
See accompanying notes which are an integral part of the financial statements.
Annual Report
Canada
Notes to Financial Statements
For the period ended October 31, 2007
1. Organization.
Fidelity Canada Fund (the Fund) is a fund of Fidelity Investment Trust (the trust) and is authorized to issue an unlimited number of shares. The trust is registered under the Investment Company Act of 1940, as amended (the 1940 Act), as an open-end management investment company organized as a Massachusetts business trust. The Fund commenced sale of Class A, Class T, Class B, Class C, and Institutional Class shares and the existing class was designated Canada on May 2, 2007. Class B shares will automatically convert to Class A shares after a holding period of seven years from the initial date of purchase. Investment income, realized and unrealized capital gains and losses, the common expenses of the Fund, and certain fund-level expense reductions, if any, are allocated on a pro rata basis to each class based on the relative net assets of each class to the total net assets of the Fund. Each class differs with respect to transfer agent and distribution and service plan fees incurred. Certain expense reductions also differ by class.
2. Investments in Fidelity Central Funds.
The Fund may invest in Fidelity Central Funds, which are open-end investment companies available only to other investment companies and accounts managed by Fidelity Management & Research Company (FMR) and its affiliates. The Fund's Schedule of Investments lists each of the Fidelity Central Funds as an investment of the Fund, but does not include the underlying holdings of each Fidelity Central Fund. As an Investing Fund, the Fund indirectly bears its proportionate share of the expenses of the underlying Fidelity Central Funds.
The Money Market Central Funds seek preservation of capital and current income and are managed by Fidelity Investments Money Management, Inc. (FIMM), an affiliate of FMR.
A complete list of holdings for each Fidelity Central Fund is available upon request or at the SEC's web site at www.sec.gov. In addition, the financial statements of the Fidelity Central Funds, which are not covered by the Fund's Report of Independent Registered Public Accounting Firm, are available on the SEC's web site or upon request.
3. Significant Accounting Policies.
The financial statements have been prepared in conformity with accounting principles generally accepted in the United States of America, which require management to make certain estimates and assumptions at the date of the financial statements. The following summarizes the significant accounting policies of the Fund:
Security Valuation. Investments are valued and net asset value (NAV) per share is calculated (NAV calculation) as of the close of business of the New York Stock Exchange (NYSE), normally 4:00 p.m. Eastern time. Wherever possible, the Fund uses independent pricing services approved by the Board of Trustees to value its investments.
Equity securities, including restricted securities, for which market quotations are readily available, are valued at the last reported sale price or official closing price as reported by an independent pricing service on the primary market or exchange on which they are traded. In the event there were no sales during the day or closing prices are not available, securities are valued at the last quoted bid price. Debt securities, including restricted securities, for which quotations are readily available, are valued by independent pricing services or by dealers who make markets in such securities. Pricing services consider yield or price of bonds of comparable quality, coupon, maturity and type as well as dealer supplied prices. Investments in open-end mutual funds, including the Fidelity Central Funds, are valued at their closing net asset value each business day. Short-term securities with remaining maturities of sixty days or less for which quotations are not readily available are valued at amortized cost, which approximates value.
When current market prices or quotations are not readily available or do not accurately reflect fair value, valuations may be determined in accordance with procedures adopted by the Board of Trustees. For example, when developments occur between the close of a market and the close of the NYSE that may materially affect the value of some or all of the securities, or when trading in a security is halted, those securities may be fair valued. Factors used in the determination of fair value may include monitoring news to identify significant market or security specific events such as changes in the value of U.S. securities markets, reviewing developments in foreign markets and evaluating the performance of ADRs, futures contracts and exchange-traded funds. Because the Fund's utilization of fair value pricing depends on market activity, the frequency with which fair value pricing is used cannot be predicted and may be utilized to a significant extent. The value of securities used for NAV calculation under fair value pricing may differ from published prices for the same securities.
Foreign Currency. The Fund uses foreign currency contracts to facilitate transactions in foreign-denominated securities. Losses from these transactions may arise from changes in the value of the foreign currency or if the counterparties do not perform under the contracts' terms.
Foreign-denominated assets, including investment securities, and liabilities are translated into U.S. dollars at the exchange rate at period end. Purchases and sales of investment securities, income and dividends received and expenses denominated in foreign currencies are translated into U.S. dollars at the exchange rate in effect on the transaction date.
The effects of exchange rate fluctuations on investments are included with the net realized and unrealized gain (loss) on investment securities. Other foreign currency transactions resulting in realized and unrealized gain (loss) are disclosed separately.
Annual Report
Canada
Notes to Financial Statements - continued
3. Significant Accounting Policies - continued
Investment Transactions and Income. For financial reporting purposes, the Fund's investment holdings and NAV include trades executed through the end of the last business day of the period. The NAV for processing shareholder transactions includes trades executed through the end of the prior business day. Gains and losses on securities sold are determined on the basis of identified cost and may include proceeds received from litigation. Dividend income is recorded on the ex-dividend date, except for certain dividends from foreign securities where the ex-dividend date may have passed, which are recorded as soon as the Fund is informed of the ex-dividend date. Non-cash dividends included in dividend income, if any, are recorded at the fair market value of the securities received. Distributions received on securities that represent a return of capital or capital gain are recorded as a reduction of cost of investments and/or as a realized gain. The Fund estimates the components of distributions received that may be considered return of capital distributions or capital gain distributions. Interest income and distributions from the Fidelity Central Funds are accrued as earned. Interest income includes coupon interest and amortization of premium and accretion of discount on debt securities. Investment income is recorded net of foreign taxes withheld where recovery of such taxes is uncertain.
Expenses. Most expenses of the trust can be directly attributed to a fund. Expenses which cannot be directly attributed are apportioned among each Fund in the trust. Expense estimates are accrued in the period to which they relate and adjustments are made when actual amounts are known.
Income Tax Information and Distributions to Shareholders. Each year, the Fund intends to qualify as a regulated investment company by distributing all of its taxable income and realized gains under Subchapter M of the Internal Revenue Code. As a result, no provision for income taxes is required in the accompanying financial statements. Foreign taxes are provided for based on the Fund's understanding of the tax rules and rates that exist in the foreign markets in which it invests.
Distributions are recorded on the ex-dividend date. Income dividends and capital gain distributions are declared separately for each class. Income and capital gain distributions are determined in accordance with income tax regulations, which may differ from generally accepted accounting principles. In addition, the Fund will claim a portion of the payment made to redeeming shareholders as a distribution for income tax purposes.
Capital accounts within the financial statements are adjusted for permanent book-tax differences. Certain adjustments have been made to the accounts relating to prior periods. Collectively, these adjustments have no impact on net assets or the results of operations. Temporary book-tax differences will reverse in a subsequent period.
Book-tax differences are primarily due to foreign currency transactions, passive foreign investment companies (PFIC), market discount, deferred trustees compensation, and losses deferred due to wash sales.
The tax-basis components of distributable earnings and the federal tax cost as of period end were as follows:
Unrealized appreciation | $ 1,850,820,017 | |
Unrealized depreciation | (19,377,264) | |
Net unrealized appreciation (depreciation) | 1,831,442,753 | |
Undistributed ordinary income | 67,424,056 | |
Undistributed long-term capital gain | 190,207,109 | |
| | |
Cost for federal income tax purposes | $ 3,192,837,536 | |
The tax character of distributions paid was as follows:
| October 31, 2007 | October 31, 2006 |
Ordinary Income | $ 44,702,026 | $ 7,894,925 |
Long-term Capital Gains | 44,063,418 | - |
Total | $ 88,765,444 | $ 7,894,925 |
Short-Term Trading (Redemption) Fees. Shares held in the Fund less than 90 days are subject to a redemption fee equal to 1.50% of the proceeds of the redeemed shares. All redemption fees, including any estimated redemption fees paid by FMR, are retained by the Fund and accounted for as an addition to paid in capital.
New Accounting Pronouncements. In July 2006, Financial Accounting Standards Board Interpretation No. 48, Accounting for Uncertainty in Income Taxes - an interpretation of FASB Statement 109 (FIN 48), was issued and is effective on the last business day of the semiannual reporting period for fiscal years beginning after December 15, 2006. FIN 48 sets forth a threshold for financial statement recognition, measurement and disclosure of a tax position taken or expected to be taken on a tax return. Management has concluded that the adoption of FIN 48 will not result in a material impact on the Fund's net assets, results of operations and financial statement disclosures.
Annual Report
3. Significant Accounting Policies - continued
New Accounting Pronouncements - continued
In addition, in September 2006, Statement of Financial Accounting Standards No. 157, Fair Value Measurements (SFAS 157), was issued and is effective for fiscal years beginning after November 15, 2007. SFAS 157 defines fair value, establishes a framework for measuring fair value and expands disclosures about fair value measurements. Management is currently evaluating the impact the adoption of SFAS 157 will have on the Fund's financial statement disclosures.
4. Operating Policies.
Repurchase Agreements. FMR has received an Exemptive Order from the Securities and Exchange Commission (the SEC) which permits the Fund and other affiliated entities of FMR to transfer uninvested cash balances into joint trading accounts which are then invested in repurchase agreements. The Fund may also invest directly with institutions in repurchase agreements. Repurchase agreements are collateralized by government or non-government securities. Upon settlement date, collateral is held in segregated accounts with custodian banks and may be obtained in the event of a default of the counterparty. The Fund monitors, on a daily basis, the value of the collateral to ensure it is at least equal to the principal amount of the repurchase agreement (including accrued interest). In the event of a default by the counterparty, realization of the collateral proceeds could be delayed, during which time the value of the collateral may decline.
Restricted Securities. The Fund may invest in securities that are subject to legal or contractual restrictions on resale. These securities generally may be resold in transactions exempt from registration or to the public if the securities are registered. Disposal of these securities may involve time-consuming negotiations and expense, and prompt sale at an acceptable price may be difficult. Information regarding restricted securities is included at the end of the Fund's Schedule of Investments.
5. Purchases and Sales of Investments.
Purchases and sales of securities other than short-term securities, aggregated $1,761,898,540 and $1,447,644,407, respectively.
6. Fees and Other Transactions with Affiliates.
Management Fee. FMR and its affiliates provide the Fund with investment management related services for which the Fund pays a monthly management fee. The management fee is the sum of an individual fund fee rate that is based on an annual rate of .45% of the Fund's average net assets and a group fee rate that averaged .26% during the period. The group fee rate is based upon the average net assets of all the mutual funds advised by FMR. The group fee rate decreases as assets under management increase and increases as assets under management decrease. In addition, the management fee is subject to a performance adjustment (up to a maximum of ± .20% of the Fund's average net assets over a 36 month performance period). The upward or downward adjustment to the management fee is based on the relative investment performance of the retail class of the Fund, Canada as compared to an appropriate benchmark index. For the period, the total annual management fee rate, including the performance adjustment, was .69% of the Fund's average net assets.
Distribution and Service Plan. In accordance with Rule 12b-1 of the 1940 Act, the Fund has adopted separate Distribution and Service Plans for each class of shares. Certain classes pay Fidelity Distributors Corporation (FDC), an affiliate of FMR, separate Distribution and Service Fees, each of which is based on an annual percentage of each class' average net assets. In addition, FDC may pay financial intermediaries for selling shares of the Fund and providing shareholder support services. For the period, the Distribution and Service Fee rates and the total amounts paid to and retained by FDC were as follows:
| Distribution
Fee | Service
Fee | Paid to
FDC | Retained
by FDC |
Class A | -% | .25% | $ 5,970 | $ 482 |
Class T | .25% | .25% | 10,734 | - |
Class B | .75% | .25% | 9,698 | 7,368 |
Class C | .75% | .25% | 13,180 | 10,333 |
| | | $ 39,582 | $ 18,183 |
Sales Load. FDC receives a front-end sales charge of up to 5.75% for selling Class A shares, and 3.50% for selling Class T shares, some of which is paid to financial intermediaries for selling shares of the Fund. FDC receives the proceeds of contingent deferred sales charges levied on Class A, Class T, Class B, and Class C redemptions. These charges depend on the holding period. The deferred sales charges range from 5% to 1% for Class B, 1% for Class C, 1.00% to .50% for certain purchases of Class A shares and .25% for certain purchases of Class T shares.
Annual Report
Canada
Notes to Financial Statements - continued
6. Fees and Other Transactions with Affiliates - continued
Sales Load - continued
For the period, sales charge amounts retained by FDC were as follows:
| Retained
by FDC |
Class A | $ 50,862 |
Class T | 9,963 |
Class B* | 37,782 |
Class C* | 1,134 |
| $ 99,741 |
* When Class B and Class C shares are initially sold, FDC pays commissions from its own resources to financial intermediaries through which the sales are made.
Transfer Agent Fees. Fidelity Investments Institutional Operations Company, Inc. (FIIOC), an affiliate of FMR, is the transfer, dividend disbursing and shareholder servicing agent for each class of the Fund, except for Canada. Fidelity Service Company, Inc. (FSC), an affiliate of FMR, is the transfer agent for Canada shares. FIIOC and FSC receive account fees and asset-based fees that vary according to the account size and type of account of the shareholders of the respective classes of the Fund. FIIOC and FSC pay for typesetting, printing and mailing of shareholder reports, except proxy statements. For the period, the total transfer agent fees paid by each class to FIIOC or FSC, were as follows:
| Amount | % of
Average
Net Assets |
Class A | $ 5,269 | .22 |
Class T | 4,782 | .22 |
Class B | 2,280 | .23 |
Class C | 3,048 | .23 |
Canada | 7,395,989 | .21 |
Institutional Class | 1,409 | .24 |
| $ 7,412,777 | |
Accounting and Security Lending Fees. FSC maintains the Fund's accounting records. The accounting fee is based on the level of average net assets for the month. Under a separate contract, FSC administers the security lending program. The security lending fee is based on the number and duration of lending transactions.
Brokerage Commissions. The Fund placed a portion of its portfolio transactions with brokerage firms which are affiliates of the investment adviser. The commissions paid to these affiliated firms were $308 for the period.
Interfund Lending Program. Pursuant to an Exemptive Order issued by the SEC, the Fund, along with other registered investment companies having management contracts with FMR, may participate in an interfund lending program. This program provides an alternative credit facility allowing the funds to borrow from, or lend money to, other participating affiliated funds. At period end, there were no interfund loans outstanding. The Fund's activity in this program during the period for which loans were outstanding was as follows:
Borrower or Lender | Average Daily
Loan Balance | Weighted
Average Interest
Rate | Interest Expense |
Borrower | $ 11,734,333 | 5.28% | $ 36,171 |
7. Committed Line of Credit.
The Fund participates with other funds managed by FMR in a $4.2 billion credit facility (the "line of credit") to be utilized for temporary or emergency purposes to fund shareholder redemptions or for other short-term liquidity purposes. The Fund has agreed to pay commitment fees on its pro rata portion of the line of credit, which amounted to $7,075 and is reflected in Miscellaneous Expense on the Statement of Operations. During the period, there were no borrowings on this line of credit.
8. Security Lending.
The Fund lends portfolio securities from time to time in order to earn additional income. On the settlement date of the loan, the Fund receives collateral (in the form of U.S. Treasury obligations, letters of credit and/or cash) against the loaned securities and maintains collateral in an amount not less than 100% of the market value of the loaned securities during the period of the loan. The market value of the loaned securities is determined at the close of business of the Fund and any additional required collateral is delivered to the Fund on the next business day. If the borrower defaults on its obligation to return the securities loaned because of insolvency or other reasons, a fund could experience delays and costs in recovering the securities
Annual Report
8. Security Lending - continued
loaned or in gaining access to the collateral. Any cash collateral received is invested in the Fidelity Securities Lending Cash Central Fund. The value of loaned securities and cash collateral at period end are disclosed on the Fund's Statement of Assets and Liabilities. Security lending income represents the income earned on investing cash collateral, less fees and expenses associated with the loan, plus any premium payments that may be received on the loan of certain types of securities. Security lending income is presented in the Statement of Operations as a component of income from Fidelity Central Funds.
9. Expense Reductions.
FMR voluntarily agreed to reimburse a portion of Canada's operating expenses. During the period, this reimbursement reduced Canada's expenses by $60,108.
Many of the brokers with whom FMR places trades on behalf of the Fund provided services to the Fund in addition to trade execution. These services included payments of certain expenses on behalf of the Fund totaling $472,386 for the period. In addition, through arrangements with the Fund's custodian and each class' transfer agent, credits realized as a result of uninvested cash balances were used to reduce the Fund's expenses. During the period, these credits reduced the Fund's custody expenses by $13,107. During the period, credits reduced each class' transfer agent expense as noted in the table below.
| Transfer Agent
expense reduction | |
Canada | $ 100,637 | |
10. Other.
The Fund's organizational documents provide former and current trustees and officers with a limited indemnification against liabilities arising in connection with the performance of their duties to the Fund. In the normal course of business, the Fund may also enter into contracts that provide general indemnifications. The Fund's maximum exposure under these arrangements is unknown as this would be dependent on future claims that may be made against the Fund. The risk of material loss from such claims is considered remote.
The United States Securities and Exchange Commission ("SEC") is conducting an investigation of FMR (covering the years 2002 to 2004) arising from gifts, gratuities and business entertainment provided by certain brokers to certain individuals who were employed on FMR's domestic equity trading desk during that period. FMR is in discussions with the SEC staff regarding the possible resolution of the matter, but as of period-end no final resolution has been reached.
In December 2006, the Independent Trustees completed their own investigation of the matter with the assistance of independent counsel. The Independent Trustees and FMR agree that, despite the absence of proof that the Fidelity mutual funds experienced diminished execution quality as a result of the improper receipt of gifts and business entertainment, the conduct at issue was serious and is worthy of redress. Accordingly, the Independent Trustees have requested and FMR has agreed to pay $42 million to Fidelity mutual funds, plus interest to be determined at the time that payment is made. A method of allocating this payment among the funds has not yet been determined. The total payment to the Fund is not anticipated to have a material impact on the Fund's net assets. In addition, FMR reimbursed related legal expenses which are recorded in the accompanying Statement of Operations as an expense reduction.
11. Distributions to Shareholders.
Distributions to shareholders of each class were as follows:
Years ended October 31, | 2007 | 2006 |
From net investment income | | |
Canada | $ 22,989,617 | $ 7,430,512 |
From net realized gain | | |
Canada | $ 65,775,827 | $ 464,413 |
Annual Report
Canada
Notes to Financial Statements - continued
12. Share Transactions.
Transactions for each class of shares were as follows:
| Shares A | Dollars A |
Years ended October 31, | 2007 | 2006 | 2007 | 2006 |
Class A | | | | |
Shares sold | 308,956 | - | $ 19,422,841 | $ - |
Shares redeemed | (10,905) | - | (645,019) | - |
Net increase (decrease) | 298,051 | - | $ 18,777,822 | $ - |
Class T | | | | |
Shares sold | 208,648 | - | $ 12,838,431 | $ - |
Shares redeemed | (1,454) | - | (89,047) | - |
Net increase (decrease) | 207,194 | - | $ 12,749,384 | $ - |
Classs B | | | | |
Shares sold | 110,050 | - | $ 6,654,427 | $ - |
Shares redeemed | (51,696) | - | (3,069,986) | - |
Net increase (decrease) | 58,354 | - | $ 3,584,441 | $ - |
Class C | | | | |
Shares sold | 134,518 | - | $ 8,317,609 | $ - |
Shares redeemed | (9,336) | - | (570,425) | - |
Net increase (decrease) | 125,182 | - | $ 7,747,184 | $ - |
Canada | | | | |
Shares sold | 32,853,429 | 39,925,341 | $ 1,882,759,894 | $ 1,811,356,216 |
Reinvestment of distributions | 1,757,370 | 181,418 | 85,654,201 | 7,617,749 |
Shares redeemed | (28,386,777) | (20,723,860) | (1,547,811,990) | (943,205,518) |
Net increase (decrease) | 6,224,022 | 19,382,899 | $ 420,602,105 | $ 875,768,447 |
Institutional Class | | | | |
Shares sold | 61,781 | - | $ 3,830,515 | $ - |
Shares redeemed | (3,937) | - | (234,902) | - |
Net increase (decrease) | 57,844 | - | $ 3,595,613 | $ - |
A Share transactions for Class A, Class T, Class B, Class C, and Institutional Class are for the period May 2, 2007 (commencement of sale of shares) to October 31, 2007.
Annual Report
China Region
Performance: The Bottom Line
Average annual total return reflects the change in the value of an investment, assuming reinvestment of the fund's dividend income and capital gains (the profits earned upon the sale of securities that have grown in value) and assuming a constant rate of performance each year. The $10,000 table and the fund's returns do not reflect the deduction of taxes that a shareholder would pay on fund distributions or the redemption of fund shares. During periods of reimbursement by Fidelity, a fund's total returns will be greater than it would be had the reimbursement not occurred. How a fund did yesterday is no guarantee of how it will do tomorrow.
Average Annual Total Returns
Periods ended October 31, 2007 | Past 1
year | Past 5
years | Past 10
years |
Fidelity China Region Fund | 84.73% | 32.18% | 16.18% |
$10,000 Over 10 Years
Let's say hypothetically that $10,000 was invested in Fidelity China Region Fund on October 31, 1997. The chart shows how the value of your investment would have changed, and also shows how the MSCI Golden Dragon Index and the Hang Seng Index performed over the same period. Effective June 1, 2007, the fund changed its benchmark from the Hang Seng Index to the MSCI Golden Dragon Index because the MSCI Golden Dragon Index conforms more closely to the fund's investment strategy.
Annual Report
China Region
Management's Discussion of Fund Performance
Comments from Wilson Wong, Portfolio Manager of Fidelity® China Region Fund
Foreign stocks, with a large assist from a weak U.S. dollar, generally had higher returns for U.S. investors than domestic equities during the year ending October 31, 2007. The backdrop for global stocks was solid, with robust economic growth and relatively high corporate profitability worldwide. Developed international equity markets, as measured by the Morgan Stanley Capital InternationalSM Europe, Australasia, and Far East (MSCI® EAFE®) Index - a proxy for established markets outside the United States and Canada - rose 25.09%. In comparison, the Standard & Poor's 500SM Index, a gauge of U.S. stocks, was up 14.56%, while Canada did appreciably better, as measured by the 43.24% advance of the S&P/TSX Composite Index. Among countries making up at least 1% of the EAFE benchmark, Finland had the best showing, soaring nearly 69%, while Hong Kong gained roughly 66%. The United Kingdom and Japan, the two largest components of the index, both underperformed. Fallout from the credit crunch and concerns about export growth tempered UK stocks, while Japan struggled with a slowdown in consumer spending and sluggish domestic growth. Emerging markets were the period's big winners, advancing 68.33% as measured by the MSCI Emerging Markets index.
During the past year, the fund returned 84.73%, versus 84.57% for the fund's new benchmark, the MSCI Golden Dragon index, and 76.32% for its old benchmark, the Hang Seng Index. Underweighting the relatively weak information technology sector aided performance the most versus the MSCI index, with stock selection in energy helping as well. An underweighting in the weak-performing financials sector further bolstered our results, although those benefits were largely undercut by ineffective stock picking there. Underweighting Taiwan Semiconductor Manufacturing made the stock our top contributor, as it was hurt by an uncertain outlook for global chip demand, fears of a slowdown in the U.S. economy and the appreciation of Taiwan's currency against the U.S. dollar. Hong Kong Exchanges & Clearing also boosted the fund's performance, along with China Coal Energy Company, Singapore-listed shipbuilder Cosco and China Oilfield Services. The last three stocks were out-of-benchmark positions. Conversely, an average cash position of roughly 7% was detrimental in an exceptionally strong market environment. Unrewarding picks in materials and an overweighting in the consumer discretionary sector also hurt. The biggest detractor by far was multinational bank HSBC Holdings, which suffered amid concerns about its exposure to the U.S. subprime mortgage market. I scaled back this position substantially after the fund adopted its new benchmark, which doesn't include HSBC. A below-benchmark exposure to High Tech Computer and underweighting index component Aluminum Corp. of China hurt as well. Some stocks mentioned in this report were sold by period end.
Notes to shareholders: On June 1, 2007, the fund changed its benchmark from the Hang Seng Index to the MSCI Golden Dragon index because the MSCI index conforms more closely to the fund's investment strategy. In addition, the MSCI Golden Dragon index replaced the MSCI Golden Dragon Plus index in the Fidelity China Region Fund Linked Index for periods after June 1, 2007.
Fidelity China Region Fund may invest up to 35% of its total assets in any industry that represents more than 20% of the Hong Kong, Taiwanese and Chinese market. As of October 31, 2007, the fund did not have more than 25% of its total assets invested in any one industry.
The views expressed above reflect those of the portfolio manager(s) only through the end of the period as stated on the cover of this report and do not necessarily represent the views of Fidelity or any other person in the Fidelity organization. Any such views are subject to change at any time based upon market or other conditions and Fidelity disclaims any responsibility to update such views. These views may not be relied on as investment advice and, because investment decisions for a Fidelity fund are based on numerous factors, may not be relied on as an indication of trading intent on behalf of any Fidelity fund.
Annual Report
China Region
Investment Changes
Geographic Diversification (% of fund's net assets) |
As of October 31, 2007 |
| China | 30.4% | |
 | Hong Kong | 27.9% | |
 | Taiwan | 21.5% | |
 | United States of America | 4.1% | |
 | Australia | 3.6% | |
 | Cayman Islands | 3.0% | |
 | Singapore | 3.0% | |
 | Korea (South) | 2.1% | |
 | Indonesia | 1.9% | |
| Other | 2.5% | |

Percentages are adjusted for the effect of futures contracts, if applicable. |
|
As of April 30, 2007 |
| Hong Kong | 47.4% | |
| Taiwan | 31.2% | |
| China | 8.2% | |
| United Kingdom | 6.6% | |
| Cayman Islands | 2.9% | |
| United States of America | 1.6% | |
| Singapore | 1.0% | |
| Australia | 0.6% | |
| Bermuda | 0.5% | |

Percentages are adjusted for the effect of futures contracts, if applicable. |
Asset Allocation |
| % of fund's
net assets | % of fund's net assets
6 months ago |
Stocks | 95.9 | 98.4 |
Short-Term Investments and Net Other Assets | 4.1 | 1.6 |
Top Ten Stocks as of October 31, 2007 |
| % of fund's
net assets | % of fund's net assets
6 months ago |
China Mobile (Hong Kong) Ltd. (Wireless Telecommunication Services) | 7.0 | 4.5 |
China Life Insurance Co. Ltd. (H Shares) (Insurance) | 3.6 | 0.0 |
Hong Kong Exchanges & Clearing Ltd. (Diversified Financial Services) | 3.3 | 0.0 |
Esprit Holdings Ltd. (Specialty Retail) | 3.1 | 0.0 |
Hon Hai Precision Industry Co. Ltd. (Foxconn) (Electronic Equipment & Instruments) | 2.5 | 5.2 |
CNOOC Ltd. (Oil, Gas & Consumable Fuels) | 2.4 | 0.9 |
PetroChina Co. Ltd. (H Shares) (Oil, Gas & Consumable Fuels) | 2.3 | 1.4 |
Formosa Plastics Corp. (Chemicals) | 2.3 | 0.0 |
Li & Fung Ltd. (Distributors) | 2.1 | 4.4 |
Anhui Conch Cement Co. Ltd. (H Shares) (Construction Materials) | 2.0 | 0.0 |
| 30.6 | |
Market Sectors as of October 31, 2007 |
| % of fund's
net assets | % of fund's net assets
6 months ago |
Financials | 21.8 | 34.3 |
Materials | 21.6 | 4.8 |
Industrials | 12.7 | 4.6 |
Information Technology | 11.5 | 23.3 |
Energy | 10.3 | 3.6 |
Consumer Discretionary | 10.1 | 12.1 |
Telecommunication Services | 7.0 | 6.5 |
Consumer Staples | 0.8 | 5.9 |
Utilities | 0.1 | 3.3 |
Annual Report
China Region
Investments October 31, 2007
Showing Percentage of Net Assets
Common Stocks - 95.9% |
| Shares | | Value |
CONSUMER DISCRETIONARY - 10.1% |
Distributors - 2.1% |
Li & Fung Ltd. | 9,058,600 | | $ 42,985,699 |
Hotels, Restaurants & Leisure - 0.6% |
Ambassador Hotel | 2,761,000 | | 2,778,472 |
Ctrip.com International Ltd. sponsored ADR | 165,300 | | 9,316,308 |
| | 12,094,780 |
Household Durables - 0.2% |
Chong Hong Construction Co. Ltd. | 2,368,782 | | 4,972,285 |
Leisure Equipment & Products - 0.8% |
Li Ning Co. Ltd. | 4,210,000 | | 15,821,596 |
Media - 0.3% |
Focus Media Holding Ltd. ADR (a)(d) | 91,600 | | 5,679,200 |
Multiline Retail - 2.0% |
Far East Department Stores Co. Ltd. | 13,883,240 | | 16,928,167 |
Lifestyle International Holdings Ltd. | 1,953,500 | | 5,368,545 |
Parkson Retail Group Ltd. | 1,542,000 | | 17,598,915 |
| | 39,895,627 |
Specialty Retail - 3.7% |
Belle International Holdings Ltd. | 7,086,000 | | 11,495,320 |
Esprit Holdings Ltd. | 3,779,100 | | 63,115,128 |
Oriental Watch Holdings Ltd. | 5,050,000 | | 1,966,193 |
| | 76,576,641 |
Textiles, Apparel & Luxury Goods - 0.4% |
Embry Holdings Ltd. | 1,237,000 | | 966,508 |
Ports Design Ltd. | 1,075,000 | | 4,058,353 |
Tainan Spinning Co. Ltd. | 7,217,000 | | 3,620,196 |
| | 8,645,057 |
TOTAL CONSUMER DISCRETIONARY | | 206,670,885 |
CONSUMER STAPLES - 0.8% |
Beverages - 0.3% |
Yantai Changyu Pioneer Wine Co.
(B Shares) | 741,863 | | 5,528,320 |
Food Products - 0.5% |
Unified-President Enterprises Corp. | 7,703,080 | | 11,045,163 |
TOTAL CONSUMER STAPLES | | 16,573,483 |
ENERGY - 10.3% |
Energy Equipment & Services - 1.3% |
China Oilfield Services Ltd. (H Shares) | 11,202,000 | | 27,432,048 |
Oil, Gas & Consumable Fuels - 9.0% |
China Coal Energy Co. Ltd. (H Shares) | 5,771,000 | | 19,581,262 |
China Shenhua Energy Co. Ltd.
(H Shares) | 4,500,500 | | 29,002,490 |
CNOOC Ltd. | 22,487,000 | | 48,682,106 |
PetroChina Co. Ltd. (H Shares) | 18,238,000 | | 47,892,988 |
|
| Shares | | Value |
PT Bumi Resources Tbk | 50,372,500 | | $ 27,127,470 |
PT Tambang Batubbara Bukit Asam Tbk | 11,650,500 | | 11,842,168 |
| | 184,128,484 |
TOTAL ENERGY | | 211,560,532 |
FINANCIALS - 21.8% |
Capital Markets - 1.5% |
China Merchants Bank Co. Ltd. warrants (UBS Warrant Programme) 3/12/10 (a) | 685,649 | | 4,213,938 |
Guangzhou Baiyun International Airport warrants (UBS Warrant Programme) 5/28/10 (a) | 3,046,100 | | 7,612,765 |
Hudong Heavy Machinery Co. Ltd. warrants (UBS Warrant Programme) 6/8/10 (a) | 271,638 | | 9,474,121 |
Pingdingshan Tianan Coal Mining Co. Ltd. warrants (UBS Warrant Programme) 3/16/10 (a) | 1,141,650 | | 6,622,989 |
Sany Heavy Industry Co. Ltd. warrants (UBS Warrant Programme) 6/28/10 (a) | 188,255 | | 1,625,956 |
| | 29,549,769 |
Commercial Banks - 3.1% |
Bank of East Asia Ltd. | 848,000 | | 5,769,727 |
China Construction Bank Corp.
(H Shares) | 15,678,000 | | 17,823,537 |
China Merchants Bank Co. Ltd.
(H Shares) | 2,144,000 | | 11,054,921 |
China Merchants Bank Co. Ltd. warrants (Goldman Sachs Warrant Program) 9/14/09 (a) | 141,400 | | 869,032 |
Chinatrust Financial Holding Co. Ltd. (a) | 2,856,000 | | 2,080,617 |
Hang Seng Bank Ltd. | 821,300 | | 16,778,904 |
HSBC Holdings PLC (Hong Kong) (Reg.) | 480,400 | | 9,561,882 |
| | 63,938,620 |
Diversified Financial Services - 6.2% |
Changsha Zoomlion Heavy Industry Science and Technology Development Co. Ltd. warrants (Citigroup Warrant Program) 1/15/10 (a) | 271,707 | | 2,043,748 |
China Everbright Ltd. (a) | 6,364,000 | | 28,622,511 |
China State Shipbuilding Co. Ltd. warrants (Goldman Sachs International Warrant Program) 9/28/09 (a) | 29,476 | | 1,028,056 |
Fuhwa Financial Holding Co. Ltd. (a) | 9,245,000 | | 6,792,128 |
Guangxi Liugong Machinery Co. Ltd. warrants (Citigroup Warrant Program) 1/17/12 (a) | 379,312 | | 2,107,684 |
Guangzhou Baiyun International Airport Co. Ltd. warrants (Goldman Sachs International Warrant Program) 9/21/09 (a) | 487,600 | | 1,218,602 |
Guangzhou Baiyun International Airport warrants (Citigroup Warrant Program) 1/20/10 (a) | 223,051 | | 557,446 |
Hong Kong Exchanges & Clearing Ltd. | 2,031,000 | | 67,798,930 |
Common Stocks - continued |
| Shares | | Value |
FINANCIALS - continued |
Diversified Financial Services - continued |
Sany Heavy Industry Co. Ltd. warrants: | | | |
(Citigroup Warrant Program) 1/20/10 (a) | 117,662 | | $ 1,016,245 |
(Goldman Sachs International Warrant Program) 9/24/09 (a) | 32,800 | | 283,293 |
Singapore Exchange Ltd. | 1,475,000 | | 16,162,464 |
| | 127,631,107 |
Insurance - 5.2% |
China Life Insurance Co. Ltd. (H Shares) | 10,900,000 | | 73,909,267 |
Ping An Insurance (Group) Co. of China, Ltd. (H Shares) | 2,296,500 | | 32,145,817 |
| | 106,055,084 |
Real Estate Management & Development - 5.8% |
China Overseas Land & Investment Ltd. | 6,744,000 | | 16,142,250 |
China Resources Land Ltd. | 4,260,000 | | 10,777,772 |
Hang Lung Properties Ltd. | 4,973,000 | | 23,925,226 |
Hung Poo Real Estate Development Co. Ltd. | 2,137,450 | | 2,124,584 |
Kerry Properties Ltd. | 2,715,500 | | 23,619,719 |
Sinyi Realty, Inc. | 989,245 | | 2,626,179 |
Sun Hung Kai Properties Ltd. | 2,045,000 | | 39,081,391 |
| | 118,297,121 |
TOTAL FINANCIALS | | 445,471,701 |
INDUSTRIALS - 12.7% |
Construction & Engineering - 1.8% |
China Communications Construction Co. Ltd. (H Shares) | 11,348,000 | | 36,006,858 |
Electrical Equipment - 0.2% |
Dongfang Electrical Machinery Co. Ltd. (H Shares) | 420,000 | | 3,754,609 |
Industrial Conglomerates - 3.8% |
Far Eastern Textile Ltd. | 25,761,000 | | 34,035,215 |
Hutchison Whampoa Ltd. | 1,601,000 | | 20,172,600 |
Shanghai Industrial Holdings Ltd.
(H Shares) | 3,880,000 | | 22,889,519 |
| | 77,097,334 |
Machinery - 1.2% |
China Infrastructure Machinery Holdings Ltd. | 2,442,000 | | 5,425,371 |
Weichai Power Co. Ltd. (H Shares) | 926,000 | | 9,536,974 |
Yangzijiang Shipbuilding Holdings Ltd. | 5,553,000 | | 9,888,958 |
| | 24,851,303 |
Marine - 5.2% |
China Cosco Holdings Co. Ltd.
(H Shares) | 6,561,500 | | 29,262,896 |
Cosco Corp. Singapore Ltd. | 6,425,000 | | 34,892,850 |
First Steamship Co. Ltd. (a) | 3,322,000 | | 9,218,947 |
Pacific Basin Shipping Ltd. | 2,449,000 | | 5,486,745 |
|
| Shares | | Value |
Sincere Navigation Corp. | 729,000 | | $ 1,478,478 |
STX Pan Ocean Co. Ltd. | 6,520,000 | | 16,771,918 |
U-Ming Marine Transport Corp. | 2,938,000 | | 9,658,805 |
| | 106,770,639 |
Transportation Infrastructure - 0.5% |
Dalian Port (PDA) Co. Ltd. (H Shares) | 12,268,000 | | 11,359,947 |
TOTAL INDUSTRIALS | | 259,840,690 |
INFORMATION TECHNOLOGY - 11.5% |
Computers & Peripherals - 1.2% |
Innolux Display Corp. | 3,772,420 | | 17,467,603 |
Tatung Co. (a) | 11,779,000 | | 6,417,637 |
| | 23,885,240 |
Electronic Equipment & Instruments - 4.4% |
Delta Electronics, Inc. | 1,484,250 | | 5,956,243 |
Hon Hai Precision Industry Co. Ltd. (Foxconn) | 6,854,543 | | 52,051,785 |
Kingboard Chemical Holdings Ltd. | 575,300 | | 3,778,691 |
Nan Ya Printed Circuit Board Corp. | 23,977 | | 157,281 |
Synnex Technology International Corp. | 4,306,150 | | 14,356,049 |
WPG Holding Co. Ltd. | 8,705,000 | | 14,376,215 |
| | 90,676,264 |
Internet Software & Services - 3.8% |
Alibaba.com Ltd. (a) | 81,000 | | 261,279 |
Baidu.com, Inc. sponsored ADR (a) | 60,300 | | 23,064,147 |
Sina Corp. (a) | 348,700 | | 19,990,971 |
Tencent Holdings Ltd. | 4,020,000 | | 34,460,986 |
| | 77,777,383 |
Semiconductors & Semiconductor Equipment - 2.1% |
Advanced Semiconductor Engineering, Inc. | 3,523,195 | | 4,241,927 |
MediaTek, Inc. | 1,999,810 | | 39,076,392 |
| | 43,318,319 |
TOTAL INFORMATION TECHNOLOGY | | 235,657,206 |
MATERIALS - 21.6% |
Chemicals - 6.2% |
Formosa Plastics Corp. | 15,443,000 | | 47,575,595 |
Nan Ya Plastics Corp. | 11,426,000 | | 34,106,936 |
Oriental Union Chemical Corp. | 4,542,000 | | 6,407,452 |
SINOPEC Yizheng Chemical Fibre Co. Ltd. (H Shares) (a) | 11,352,000 | | 5,920,485 |
Taiwan Fertilizer Co. Ltd. | 12,604,000 | | 32,293,008 |
| | 126,303,476 |
Construction Materials - 3.4% |
Anhui Conch Cement Co. Ltd. (H Shares) | 4,158,000 | | 41,529,603 |
Taiwan Cement Corp. | 13,131,600 | | 22,375,808 |
TCC International Holdings Ltd. (a) | 3,432,000 | | 5,157,707 |
| | 69,063,118 |
Common Stocks - continued |
| Shares | | Value |
MATERIALS - continued |
Metals & Mining - 9.4% |
BHP Billiton Ltd. | 482,527 | | $ 21,052,653 |
China Steel Corp. | 21,985,380 | | 30,947,162 |
Dongkuk Steel Mill Co. Ltd. | 105,106 | | 6,321,843 |
Hidili Industry International Development Ltd. | 5,784,000 | | 8,627,099 |
Hyundai Steel Co. | 102,821 | | 10,254,372 |
Lihir Gold Ltd. (a) | 2,669,084 | | 10,596,582 |
Mount Gibson Iron Ltd. (a)(d) | 11,141,842 | | 31,500,053 |
Newcrest Mining Ltd. | 352,211 | | 10,736,591 |
POSCO | 14,592 | | 10,642,164 |
Rio Tinto Ltd. | 97,695 | | 10,140,670 |
Tung Ho Steel Enterprise Corp. | 5,377,000 | | 7,967,155 |
Xinjiang Xinxin Mining Industry Co. Ltd. Class H | 4,936,000 | | 9,132,780 |
Zijin Mining Group Co. Ltd. (H Shares) | 14,146,000 | | 24,698,485 |
| | 192,617,609 |
Paper & Forest Products - 2.6% |
Lee & Man Paper Manufacturing Ltd. | 4,027,600 | | 16,111,783 |
Nine Dragons Paper (Holdings) Ltd. | 6,747,400 | | 18,277,166 |
Sino-Forest Corp. (a) | 754,500 | | 20,073,120 |
| | 54,462,069 |
TOTAL MATERIALS | | 442,446,272 |
TELECOMMUNICATION SERVICES - 7.0% |
Wireless Telecommunication Services - 7.0% |
China Mobile (Hong Kong) Ltd. | 6,863,500 | | 142,321,535 |
UTILITIES - 0.1% |
Gas Utilities - 0.1% |
Xinao Gas Holdings Ltd. | 644,000 | | 1,225,743 |
TOTAL COMMON STOCKS (Cost $1,334,781,816) | 1,961,768,047 |
Money Market Funds - 6.2% |
| Shares | | Value |
Fidelity Cash Central Fund, 4.97% (b) | 120,453,390 | | $ 120,453,390 |
Fidelity Securities Lending Cash Central Fund, 5.02% (b)(c) | 5,832,578 | | 5,832,578 |
TOTAL MONEY MARKET FUNDS (Cost $126,285,968) | 126,285,968 |
TOTAL INVESTMENT PORTFOLIO - 102.1% (Cost $1,461,067,784) | | 2,088,054,015 |
NET OTHER ASSETS - (2.1)% | | (43,527,037) |
NET ASSETS - 100% | $ 2,044,526,978 |
Legend |
(a) Non-income producing |
(b) Affiliated fund that is available only to investment companies and other accounts managed by Fidelity Investments. The rate quoted is the annualized seven-day yield of the fund at period end. A complete unaudited listing of the fund's holdings as of its most recent quarter end is available upon request. |
(c) Investment made with cash collateral received from securities on loan. |
(d) Security or a portion of the security is on loan at period end. |
Affiliated Central Funds |
Information regarding fiscal year to date income earned by the Fund from investments in Fidelity Central Funds is as follows: |
Fund | Income earned |
Fidelity Cash Central Fund | $ 3,785,951 |
Fidelity Securities Lending Cash Central Fund | 11,681 |
Total | $ 3,797,632 |
See accompanying notes which are an integral part of the financial statements.
Annual Report
China Region
Financial Statements
Statement of Assets and Liabilities
| October 31, 2007 |
| | |
Assets | | |
Investment in securities, at value (including securities loaned of $5,800,310) - See accompanying schedule: Unaffiliated issuers
(cost $1,334,781,816) | $ 1,961,768,047 | |
Fidelity Central Funds
(cost $126,285,968) | 126,285,968 | |
Total Investments
(cost $1,461,067,784) | | $ 2,088,054,015 |
Foreign currency held at value
(cost $1,289,078) | | 1,289,040 |
Receivable for investments sold | | 61,794,200 |
Receivable for fund shares sold | | 25,736,788 |
Dividends receivable | | 610,077 |
Distributions receivable from Fidelity Central Funds | | 456,495 |
Prepaid expenses | | 266 |
Other receivables | | 680,459 |
Total assets | | 2,178,621,340 |
| | |
Liabilities | | |
Payable for investments purchased | $ 123,151,086 | |
Payable for fund shares redeemed | 3,491,128 | |
Accrued management fee | 1,060,806 | |
Other affiliated payables | 304,151 | |
Other payables and accrued expenses | 254,613 | |
Collateral on securities loaned, at value | 5,832,578 | |
Total liabilities | | 134,094,362 |
| | |
Net Assets | | $ 2,044,526,978 |
Net Assets consist of: | | |
Paid in capital | | $ 1,153,354,484 |
Undistributed net investment income | | 16,429,698 |
Accumulated undistributed net realized gain (loss) on investments and foreign currency transactions | | 247,737,803 |
Net unrealized appreciation (depreciation) on investments and assets and liabilities in foreign currencies | | 627,004,993 |
Net Assets, for 49,243,278 shares outstanding | | $ 2,044,526,978 |
Net Asset Value, offering price and redemption price per share ($2,044,526,978 ÷ 49,243,278 shares) | | $ 41.52 |
Statement of Operations
| Year ended October 31, 2007 |
| | |
Investment Income | | |
Dividends | | $ 25,690,626 |
Interest | | 21,060 |
Income from Fidelity Central Funds (including $11,681 from security lending) | | 3,797,632 |
| | 29,509,318 |
Less foreign taxes withheld | | (2,222,495) |
Total income | | 27,286,823 |
| | |
Expenses | | |
Management fee | $ 7,522,684 | |
Transfer agent fees | 2,392,833 | |
Accounting and security lending fees | 489,422 | |
Custodian fees and expenses | 790,660 | |
Independent trustees' compensation | 3,286 | |
Registration fees | 116,250 | |
Audit | 68,971 | |
Legal | 10,124 | |
Interest | 37,855 | |
Miscellaneous | 36,627 | |
Total expenses before reductions | 11,468,712 | |
Expense reductions | (1,668,895) | 9,799,817 |
Net investment income (loss) | | 17,487,006 |
Realized and Unrealized Gain (Loss) Net realized gain (loss) on: | | |
Investment securities: | | |
Unaffiliated issuers | 249,042,037 | |
Foreign currency transactions | (619,328) | |
Total net realized gain (loss) | | 248,422,709 |
Change in net unrealized appreciation (depreciation) on: Investment securities | 471,207,834 | |
Assets and liabilities in foreign currencies | 19,073 | |
Total change in net unrealized appreciation (depreciation) | | 471,226,907 |
Net gain (loss) | | 719,649,616 |
Net increase (decrease) in net assets resulting from operations | | $ 737,136,622 |
See accompanying notes which are an integral part of the financial statements.
Annual Report
Statement of Changes in Net Assets
| Year ended
October 31,
2007 | Year ended
October 31,
2006 |
Increase (Decrease) in Net Assets | | |
Operations | | |
Net investment income (loss) | $ 17,487,006 | $ 11,022,425 |
Net realized gain (loss) | 248,422,709 | 17,130,560 |
Change in net unrealized appreciation (depreciation) | 471,226,907 | 105,873,701 |
Net increase (decrease) in net assets resulting from operations | 737,136,622 | 134,026,686 |
Distributions to shareholders from net investment income | (9,931,797) | (4,953,820) |
Distributions to shareholders from net realized gain | (6,849,518) | - |
Total distributions | (16,781,315) | (4,953,820) |
Share transactions
Proceeds from sales of shares | 1,145,260,346 | 370,937,196 |
Reinvestment of distributions | 16,027,386 | 4,673,740 |
Cost of shares redeemed | (573,113,425) | (167,183,904) |
Net increase (decrease) in net assets resulting from share transactions | 588,174,307 | 208,427,032 |
Redemption fees | 1,203,951 | 388,530 |
Total increase (decrease) in net assets | 1,309,733,565 | 337,888,428 |
| | |
Net Assets | | |
Beginning of period | 734,793,413 | 396,904,985 |
End of period (including undistributed net investment income of $16,429,698 and undistributed net investment income of $10,481,257, respectively) | $ 2,044,526,978 | $ 734,793,413 |
Other Information Shares | | |
Sold | 38,031,904 | 17,430,982 |
Issued in reinvestment of distributions | 675,406 | 249,399 |
Redeemed | (21,493,222) | (8,027,624) |
Net increase (decrease) | 17,214,088 | 9,652,757 |
Financial Highlights
Years ended October 31, | 2007 | 2006 | 2005 | 2004 | 2003 |
Selected Per-Share Data | | | | | |
Net asset value, beginning of period | $ 22.94 | $ 17.74 | $ 15.88 | $ 15.14 | $ 11.16 |
Income from Investment Operations | | | | | |
Net investment income (loss) C | .46 | .42 | .36 | .25 | .25 |
Net realized and unrealized gain (loss) | 18.58 | 4.99 | 1.75 | .73 | 3.91 |
Total from investment operations | 19.04 | 5.41 | 2.11 | .98 | 4.16 |
Distributions from net investment income | (.29) | (.22) | (.26) | (.26) | (.19) |
Distributions from net realized gain | (.20) | - | - | - | - |
Total distributions | (.49) | (.22) | (.26) | (.26) | (.19) |
Redemption fees added to paid in capital C | .03 | .01 | .01 | .02 | .01 |
Net asset value, end of period | $ 41.52 | $ 22.94 | $ 17.74 | $ 15.88 | $ 15.14 |
Total Return A, B | 84.73% | 30.83% | 13.44% | 6.71% | 37.91% |
Ratios to Average Net Assets D, F | | | | | |
Expenses before reductions | 1.08% | 1.14% | 1.16% | 1.22% | 1.30% |
Expenses net of fee waivers, if any | 1.08% | 1.14% | 1.16% | 1.22% | 1.30% |
Expenses net of all reductions | .92% | 1.08% | 1.12% | 1.22% | 1.30% |
Net investment income (loss) | 1.64% | 1.99% | 2.04% | 1.64% | 2.07% |
Supplemental Data | | | | | |
Net assets, end of period (000 omitted) | $ 2,044,527 | $ 734,793 | $ 396,905 | $ 296,004 | $ 231,654 |
Portfolio turnover rate E | 173% | 36% | 44% | 101% | 39% |
A Total returns would have been lower had certain expenses not been reduced during the periods shown. B Total returns do not include the effect of the former sales charges. C Calculated based on average shares outstanding during the period. D Fees and expenses of the underlying Fidelity Central Funds are not included in the Fund's expense ratio. The Fund indirectly bears its proportionate share of the expenses of any underlying Fidelity Central Funds. E Amount does not include the portfolio activity of any underlying Fidelity Central Funds. F Expense ratios reflect operating expenses of the Fund. Expenses before reductions do not reflect amounts reimbursed by the investment adviser or reductions from brokerage service arrangements or other expense offset arrangements and do not represent the amount paid by the Fund during periods when reimbursements or reductions occur. Expenses net of fee waivers reflect expenses after reimbursement by the investment adviser but prior to reductions from brokerage service arrangements or other expense offset arrangements. Expenses net of all reductions represent the net expenses paid by the Fund. |
See accompanying notes which are an integral part of the financial statements.
Annual Report
Emerging Markets
Performance: The Bottom Line
Average annual total return reflects the change in the value of an investment, assuming reinvestment of the fund's dividend income and capital gains (the profits earned upon the sale of securities that have grown in value) and assuming a constant rate of performance each year. The $10,000 table and the fund's returns do not reflect the deduction of taxes that a shareholder would pay on fund distributions or the redemption of fund shares. During periods of reimbursement by Fidelity, a fund's total returns will be greater than it would be had the reimbursement not occurred. How a fund did yesterday is no guarantee of how it will do tomorrow.
Average Annual Total Returns
Periods ended October 31, 2007 | Past 1
year | Past 5
years | Past 10
years |
Fidelity Emerging Markets Fund | 71.81% | 41.13% | 14.66% |
$10,000 Over 10 Years
Let's say hypothetically that $10,000 was invested in Fidelity Emerging Markets Fund on October 31, 1997. The chart shows how the value of your investment would have changed, and also shows how the MSCI Emerging Markets Index performed over the same period.
Annual Report
Emerging Markets
Management's Discussion of Fund Performance
Comments from Robert von Rekowsky, Portfolio Manager of Fidelity® Emerging Markets Fund
Emerging-markets equities continued their sparkling multiyear performance, returning 68.33% as measured by the Morgan Stanley Capital InternationalSM (MSCI®) Emerging Markets Index during the 12-month period ending October 31, 2007. On the whole, developing markets benefited from brisk economic growth, the ongoing build-out of commercial and industrial infrastructure, and rising commodity prices. China led the way with a superlative gain of roughly 168%, reflecting optimism about opportunities within the country's fast-growing economy. Hong Kong surged higher for similar reasons, jumping more than 147%. Brazil, the third-largest component of the MSCI benchmark, rose 111%, fueled largely by its exports of natural resources. However, three of the four largest country weightings in the index trailed its overall return despite very strong absolute performance. South Korea - the index's biggest constituent with a weighting of about 16% on average during the period - was a prime example. It gained almost 57% but still fell about 12 percentage points shy of the MSCI Emerging Markets index. Taiwan and Russia also trailed, despite solid returns of approximately 40% and 33%, respectively.
During the past year, the fund returned 71.81%, beating the MSCI index. Effective stock selection and a modest underweighting in technology added the most value versus the index. Stock picking in telecommunication services and materials also helped. A weak U.S. dollar further bolstered our absolute performance. Geographically, stock picking in South Korea, Russia and India helped, along with underweighting Taiwan. China Coal Energy was a significant contributor, spurred by an attractive valuation to start the period, healthy demand and tight coal supplies. Russian steel producer Evraz Group - - a Luxembourg-incorporated company - further aided performance. China Coal Energy and Evraz were out-of-benchmark positions. Not owning Indian technology services provider and index component Infosys Technologies also added value, as did underweighting Korea-based Kookmin Bank - later sold completely - and Taiwan Semiconductor Manufacturing. Conversely, underweighting the strong-performing Chinese market hurt performance, as did a modest cash position. Not owning index components China Life Insurance, Korean shipbuilder Hyundai Heavy Industries and energy producer Petrochina detracted. Russia-based, U.S. listed television network operator CTC Media - an out-of-benchmark holding - was hurt by revenue concerns.
The views expressed above reflect those of the portfolio manager(s) only through the end of the period as stated on the cover of this report and do not necessarily represent the views of Fidelity or any other person in the Fidelity organization. Any such views are subject to change at any time based upon market or other conditions and Fidelity disclaims any responsibility to update such views. These views may not be relied on as investment advice and, because investment decisions for a Fidelity fund are based on numerous factors, may not be relied on as an indication of trading intent on behalf of any Fidelity fund.
Annual Report
Emerging Markets
Investment Changes
Geographic Diversification (% of fund's net assets) |
As of October 31, 2007 |
| Korea (South) | 14.1% | |
| Brazil | 14.1% | |
| Russia | 10.4% | |
| India | 6.6% | |
| Taiwan | 6.4% | |
| South Africa | 6.4% | |
| Hong Kong | 6.1% | |
| China | 5.1% | |
| Mexico | 3.9% | |
| Other | 26.9% | |

Percentages are adjusted for the effect of futures contracts, if applicable. |
|
As of April 30, 2007 |
| Korea (South) | 14.5% | |
| Brazil | 12.5% | |
| Russia | 10.8% | |
| South Africa | 8.6% | |
| Mexico | 6.5% | |
| India | 5.6% | |
| Taiwan | 5.0% | |
| China | 3.8% | |
| Turkey | 3.4% | |
| Other | 29.3% | |

Percentages are adjusted for the effect of futures contracts, if applicable. |
Asset Allocation |
| % of fund's
net assets | % of fund's net assets
6 months ago |
Stocks and Investment Companies | 98.6 | 98.4 |
Short-Term Investments and Net Other Assets | 1.4 | 1.6 |
Top Ten Stocks as of October 31, 2007 |
| % of fund's
net assets | % of fund's net assets
6 months ago |
China Mobile (Hong Kong) Ltd. (Hong Kong, Wireless Telecommunication Services) | 3.6 | 2.0 |
Companhia Vale do Rio Doce (PN-A) sponsored ADR (Brazil, Metals & Mining) | 3.4 | 2.3 |
OAO Gazprom sponsored ADR (Russia, Oil, Gas & Consumable Fuels) | 3.4 | 3.3 |
Petroleo Brasileiro SA - Petrobras (Brazil, Oil, Gas & Consumable Fuels) | 2.8 | 2.0 |
America Movil SAB de CV Series L sponsored ADR (Mexico, Wireless Telecommunication Services) | 1.9 | 2.9 |
Samsung Electronics Co. Ltd. (Korea (South), Semiconductors & Semiconductor Equipment) | 1.7 | 3.2 |
POSCO (Korea (South), Metals & Mining) | 1.6 | 1.3 |
Reliance Industries Ltd. (India, Oil, Gas & Consumable Fuels) | 1.5 | 0.6 |
Hon Hai Precision Industry Co. Ltd. (Foxconn) (Taiwan, Electronic Equipment & Instruments) | 1.4 | 1.5 |
Banco Bradesco SA (Brazil, Commercial Banks) | 1.3 | 1.2 |
| 22.6 | |
Market Sectors as of October 31, 2007 |
| % of fund's
net assets | % of fund's net assets
6 months ago |
Financials | 20.2 | 20.2 |
Materials | 18.1 | 14.3 |
Energy | 16.5 | 14.9 |
Industrials | 13.3 | 11.1 |
Telecommunication Services | 10.3 | 9.3 |
Information Technology | 8.2 | 11.3 |
Consumer Discretionary | 4.9 | 9.5 |
Consumer Staples | 4.2 | 4.6 |
Utilities | 2.3 | 2.0 |
Health Care | 0.3 | 0.9 |
Annual Report
Emerging Markets
Investments October 31, 2007
Showing Percentage of Net Assets
Common Stocks - 98.1% |
| Shares | | Value |
Argentina - 0.4% |
Banco Macro SA sponsored ADR | 357,400 | | $ 9,882,110 |
Banco Patagonia SA unit | 211,200 | | 5,127,102 |
Pampa Holding SA (a) | 2,297,700 | | 2,055,404 |
Telecom Argentina SA Class B sponsored ADR (a) | 281,800 | | 6,766,018 |
TOTAL ARGENTINA | | 23,830,634 |
Austria - 0.6% |
Raiffeisen International Bank Holding AG | 135,300 | | 22,366,183 |
voestalpine AG | 181,300 | | 16,303,768 |
TOTAL AUSTRIA | | 38,669,951 |
Bahrain - 0.1% |
Gulf Finance House BSC unit (a) | 401,900 | | 9,947,025 |
Bermuda - 2.0% |
Aquarius Platinum Ltd. (Australia) | 549,100 | | 21,651,476 |
C C Land Holdings Ltd. | 3,137,000 | | 6,219,561 |
Central European Media Enterprises Ltd. Class A (a) | 188,800 | | 21,664,800 |
China Grand Forestry Resources Group Ltd. (a) | 29,866,000 | | 10,613,952 |
Credicorp Ltd. (NY Shares) | 207,100 | | 15,393,743 |
Dufry South America Ltd. unit | 462,283 | | 13,496,280 |
Global Digital Creations Holdings Ltd. (a) | 6,800,000 | | 2,588,000 |
Pacific Basin Shipping Ltd. | 2,682,000 | | 6,008,759 |
Samling Global Ltd. | 27,953,000 | | 9,606,037 |
Sinofert Holdings Ltd. | 27,270,900 | | 25,723,822 |
TOTAL BERMUDA | | 132,966,430 |
Brazil - 14.1% |
All America Latina Logistica SA unit | 1,514,800 | | 23,990,243 |
B2W Companhia Global Do Varejo | 326,600 | | 17,631,605 |
Banco Bradesco SA: | | | |
(PN) | 2,110,400 | | 71,725,056 |
(PN) sponsored ADR | 388,000 | | 13,250,200 |
Banco Daycoval SA (PN) | 719,300 | | 8,481,429 |
Banco do Brasil SA | 1,510,300 | | 27,358,420 |
Banco Indusval SA (e) | 258,784 | | 3,784,310 |
Bovespa Holding SA (a) | 139,000 | | 2,647,275 |
BrasilAgro - Compania Brasileira de Propriedades Agricolas (a) | 3,600 | | 2,434,541 |
Companhia Brasileira (a)(e) | 8,900 | | 4,732,674 |
Companhia Brasileira de Distribuicao Grupo Pao de Acucar sponsored ADR (d) | 166,300 | | 5,351,534 |
Companhia de Concessoes Rodoviarias | 486,100 | | 8,937,542 |
Companhia de Saneamento de Minas Gerais | 541,800 | | 10,177,735 |
Companhia Vale do Rio Doce (PN-A) sponsored ADR | 7,213,800 | | 227,739,666 |
CSU Cardsystem SA sponsored ADR (a)(e) | 80,000 | | 1,033,466 |
Duratex SA (PN) | 366,800 | | 12,273,309 |
Eternit SA | 920,240 | | 4,521,149 |
|
| Shares | | Value |
Gafisa SA: | | | |
ADR (a)(d) | 288,300 | | $ 10,280,778 |
warrants 12/28/07 (a) | 266,000 | | 4,742,780 |
GVT Holding SA | 380,100 | | 8,348,535 |
JBS SA | 1,912,945 | | 8,812,307 |
Localiza Rent a Car SA | 1,651,400 | | 19,557,937 |
Lojas Americanas SA (PN) | 1,396,009 | | 16,250,865 |
MRV Engenharia e Participacoes SA | 287,500 | | 5,980,651 |
Multiplan Empreendimentos Imobiliarios SA | 477,000 | | 6,967,106 |
Net Servicos de Comunicacao SA sponsored ADR (a)(d) | 1,392,666 | | 22,394,069 |
Obrascon Huarte Lain Brasil SA | 511,800 | | 9,170,453 |
Petroleo Brasileiro SA - Petrobras: | | | |
(PN) (non-vtg.) | 2,378,200 | | 99,177,579 |
(PN) sponsored ADR (non-vtg.) | 997,000 | | 82,940,430 |
sponsored ADR | 486,000 | | 46,476,180 |
Satipel Industrial SA | 187,300 | | 1,405,210 |
Sul America SA unit | 314,600 | | 5,686,112 |
Tegma Gestao Logistica | 436,700 | | 7,496,671 |
Uniao de Bancos Brasileiros SA (Unibanco): | | | |
unit | 1,968,000 | | 31,144,928 |
GDR | 264,100 | | 41,738,364 |
Usinas Siderurgicas de Minas Gerais SA - Usiminas (PN-A) (non-vtg.) | 642,500 | | 50,390,628 |
Weg SA | 487,200 | | 7,406,138 |
TOTAL BRAZIL | | 932,437,875 |
British Virgin Islands - 0.0% |
Titanium Resources Group Ltd. (a) | 2,180,500 | | 3,422,693 |
Bulgaria - 0.0% |
Kaolin AD | 45,000 | | 651,976 |
Canada - 1.0% |
Addax Petroleum, Inc. | 152,600 | | 6,686,149 |
Addax Petroleum, Inc. (a)(e) | 20,700 | | 906,968 |
Eastern Platinum Ltd. (a) | 4,037,600 | | 12,529,303 |
First Quantum Minerals Ltd. | 167,600 | | 18,050,460 |
Frontera Copper Corp. (a) | 1,588,400 | | 12,919,839 |
JumpTV, Inc. | 862,942 | | 1,736,486 |
Teck Cominco Ltd. Class B (sub. vtg.) | 54,150 | | 2,713,235 |
Uranium One, Inc. (a) | 241,500 | | 2,683,049 |
Uranium One, Inc. (South Africa) (a) | 604,939 | | 6,794,976 |
TOTAL CANADA | | 65,020,465 |
Cayman Islands - 1.7% |
Agile Property Holdings Ltd. | 16,148,000 | | 39,191,370 |
Alibaba.com Ltd. (a) | 263,500 | | 849,962 |
Bosideng International Holdings Ltd. | 2,632,000 | | 1,127,464 |
Chaoda Modern Agriculture (Holdings) Ltd. | 28,637,100 | | 26,135,117 |
China Aoyuan Property Group Ltd. | 596,000 | | 512,921 |
China Dongxiang Group Co. Ltd. | 907,000 | | 693,970 |
CNinsure, Inc. ADR (a) | 27,400 | | 692,946 |
Common Stocks - continued |
| Shares | | Value |
Cayman Islands - continued |
E-House China Holdings Ltd. ADR sponsored ADR (d) | 81,200 | | $ 2,882,600 |
Hidili Industry International Development Ltd. | 633,000 | | 944,148 |
Integra Group unit | 274,000 | | 4,384,000 |
KWG Property Holding Ltd. | 672,500 | | 1,266,846 |
Lee & Man Paper Manufacturing Ltd. | 6,608,700 | | 26,437,070 |
NagaCorp Ltd. | 7,800,000 | | 2,286,419 |
Neo-Neon Holdings Ltd. | 1,187,000 | | 1,398,398 |
NetDragon WebSoft, Inc. (a) | 958,500 | | 1,629,995 |
Niger Uranium Ltd. | 30,547 | | 22,863 |
TOTAL CAYMAN ISLANDS | | 110,456,089 |
Chile - 0.3% |
Lan Airlines SA sponsored ADR | 1,146,800 | | 19,082,752 |
China - 5.1% |
Angang Steel Co. Ltd. (H Shares) | 2,103,000 | | 7,742,851 |
Anhui Conch Cement Co. Ltd. (H Shares) | 2,144,000 | | 21,414,014 |
China Coal Energy Co. Ltd. (H Shares) | 15,678,700 | | 53,198,532 |
China Construction Bank Corp.
(H Shares) | 66,097,000 | | 75,142,388 |
China Gas Holdings Ltd. | 18,639,100 | | 8,933,482 |
China Hongxing Sports Ltd. | 5,160,000 | | 4,627,138 |
China Molybdenum Co. Ltd. (H Shares) | 1,150,000 | | 3,015,803 |
Digital China Holdings Ltd. (H Shares) | 4,263,000 | | 2,815,442 |
First Tractor Co. Ltd. (H Shares) (a) | 9,664,800 | | 6,123,114 |
Golden Eagle Retail Group Ltd.
(H Shares) | 4,654,000 | | 4,835,369 |
Guangzhou R&F Properties Co. Ltd. (H Shares) | 7,090,800 | | 37,330,670 |
Industrial & Commercial Bank of China | 13,448,000 | | 12,844,194 |
Parkson Retail Group Ltd. | 1,124,000 | | 12,828,262 |
Ping An Insurance (Group) Co. of China, Ltd. (H Shares) | 4,673,500 | | 65,418,452 |
Shandong Weigao Group Medical Polymer Co. Ltd. (H Shares) | 1,086,000 | | 2,419,029 |
Shenzhen Expressway Co. Ltd. (H Shares) | 5,130,000 | | 5,333,418 |
Yantai Changyu Pioneer Wine Co. (B Shares) | 1,408,650 | | 10,497,178 |
TOTAL CHINA | | 334,519,336 |
Colombia - 0.3% |
Almacenes Exito SA unit (e) | 308,100 | | 2,379,678 |
BanColombia SA sponsored ADR | 563,000 | | 20,690,250 |
TOTAL COLOMBIA | | 23,069,928 |
Croatia - 0.1% |
T-Hrvatske Telekom ADR (a)(e) | 57,700 | | 4,154,400 |
Cyprus - 0.4% |
Mirland Development Corp. PLC | 903,405 | | 11,119,087 |
|
| Shares | | Value |
Urals Energy Public Co. Ltd. (a) | 924,730 | | $ 5,383,168 |
XXI Century Investments Public Ltd. (a) | 370,000 | | 12,942,606 |
TOTAL CYPRUS | | 29,444,861 |
Czech Republic - 0.8% |
Ceske Energeticke Zavody AS | 707,300 | | 51,125,996 |
Egypt - 1.2% |
Commercial International Bank Ltd. sponsored GDR | 1,188,175 | | 16,456,224 |
Eastern Tobacco Co. | 128,345 | | 9,793,067 |
Egyptian Co. for Mobile Services (MobiNil) | 153,472 | | 5,424,022 |
Orascom Construction Industries SAE: | | | |
GDR | 146,812 | | 26,940,002 |
GDR (e) | 16,120 | | 2,958,020 |
Orascom Hotels & Development (OHD) (a) | 1,503,349 | | 19,478,826 |
TOTAL EGYPT | | 81,050,161 |
Estonia - 0.0% |
Olympic Entertainment Group AS | 260,800 | | 1,995,032 |
Finland - 0.0% |
Rakentajain Konevuokraamo Oyj (B Shares) | 72,566 | | 2,712,447 |
Georgia - 0.2% |
Bank of Georgia: | | | |
ADR (a)(e) | 81,200 | | 2,679,600 |
unit (a) | 225,200 | | 7,431,600 |
TOTAL GEORGIA | | 10,111,200 |
Hong Kong - 6.1% |
China Mobile (Hong Kong) Ltd. | 11,413,400 | | 236,668,262 |
China Overseas Land & Investment Ltd. warrants 8/27/08 (a) | 103,166 | | 85,857 |
China Resources Power Holdings Co. Ltd. | 5,343,500 | | 19,989,304 |
China Seven Star Shopping Ltd. (a) | 12,250,000 | | 651,885 |
CNOOC Ltd. | 29,537,000 | | 63,944,651 |
CNOOC Ltd. sponsored ADR (d) | 68,000 | | 14,721,320 |
CNPC (Hong Kong) Ltd. | 20,552,000 | | 16,758,356 |
Fosun International Ltd. | 1,629,000 | | 2,202,729 |
Kerry Properties Ltd. | 2,360,000 | | 20,527,541 |
REXCAPITAL Financial Holdings Ltd. (a) | 48,545,000 | | 10,099,894 |
Shanghai Industrial Holdings Ltd.
(H Shares) | 2,668,000 | | 15,739,494 |
TOTAL HONG KONG | | 401,389,293 |
Hungary - 0.1% |
OTP Bank Ltd. unit | 51,700 | | 5,609,450 |
India - 6.6% |
Bharat Heavy Electricals Ltd. | 341,036 | | 22,827,165 |
Bharti Airtel Ltd. (a) | 1,199,638 | | 30,992,981 |
Blue Star Ltd. | 733,363 | | 7,296,979 |
Cairn India Ltd. | 1,878,648 | | 10,013,158 |
Common Stocks - continued |
| Shares | | Value |
India - continued |
Federal Bank Ltd.: | | | |
GDR | 249,942 | | $ 2,478,459 |
GDR (e) | 337,300 | | 3,344,713 |
HCL Technologies Ltd. | 1,943,082 | | 15,775,707 |
Hindustan Zinc Ltd. | 112,051 | | 2,609,473 |
Indiabulls Real Estate Ltd. sponsored GDR (a) | 719,116 | | 11,757,547 |
Indian Overseas Bank | 2,779,841 | | 10,099,719 |
ITC Ltd. | 1,500 | | 6,900 |
IVRCL Infrastructures & Projects Ltd. | 1,012,134 | | 13,181,237 |
Jaiprakash Associates Ltd. | 604,733 | | 22,699,630 |
Jindal Saw Ltd. | 142,391 | | 2,881,527 |
JSW Steel Ltd. | 274,072 | | 6,745,548 |
Kalpataru Power Transmission Ltd. | 71,206 | | 3,239,149 |
LANCO Infratech Ltd. | 1,255,702 | | 14,563,892 |
Larsen & Toubro Ltd. | 344,060 | | 37,617,489 |
Pantaloon Retail India Ltd. | 494,132 | | 9,266,740 |
Punjab National Bank | 589,351 | | 9,351,277 |
Reliance Industries Ltd. | 1,343,400 | | 95,892,062 |
Rolta India Ltd. | 1,260,244 | | 22,500,837 |
Rolta India Ltd. sponsored GDR (e) | 242,105 | | 3,631,575 |
Sintex Industries Ltd. | 763,463 | | 9,002,262 |
Sobha Developers Ltd. | 105,767 | | 2,583,341 |
State Bank of India | 443,592 | | 27,833,065 |
Steel Authority of India Ltd. | 3,659,954 | | 24,551,752 |
Tata Power Co. Ltd. | 350,857 | | 10,962,644 |
United Phosphorous Ltd. | 326,000 | | 3,009,463 |
TOTAL INDIA | | 436,716,291 |
Indonesia - 3.3% |
PT Astra Agro Lestari Tbk | 7,732,000 | | 19,442,090 |
PT Bakrie & Brothers Tbk (a) | 424,994,000 | | 15,057,070 |
PT Bank Mandiri Persero Tbk | 52,273,000 | | 22,146,099 |
PT Bank Niaga Tbk | 96,530,000 | | 9,300,443 |
PT Bank Rakyat Indonesia Tbk | 18,013,000 | | 15,625,753 |
PT Bumi Resources Tbk | 99,859,000 | | 53,777,796 |
PT Indocement Tunggal Prakarsa Tbk | 6,053,500 | | 5,535,039 |
PT International Nickel Indonesia Tbk | 2,245,500 | | 22,641,120 |
PT Medco Energi International Tbk | 24,705,000 | | 12,947,955 |
PT Perusahaan Gas Negara Tbk Series B | 19,956,800 | | 31,275,758 |
PT Perusahaan Perkebunan London Sumatra Indonesia Tbk (a) | 9,987,000 | | 10,720,608 |
TOTAL INDONESIA | | 218,469,731 |
Ireland - 0.1% |
Dragon Oil plc (a) | 1,064,000 | | 6,907,311 |
Israel - 1.2% |
Bank Hapoalim BM (Reg.) | 4,372,945 | | 24,060,601 |
First International Bank of Israel (a) | 1,061,610 | | 2,819,860 |
Israel Chemicals Ltd. | 3,110,500 | | 34,228,877 |
Nice Systems Ltd. sponsored ADR (a) | 28,800 | | 1,135,584 |
|
| Shares | | Value |
Ormat Industries Ltd. | 579,600 | | $ 9,487,963 |
Orpak Systems Ltd. | 832,800 | | 2,943,436 |
Queenco Leisure International Ltd. GDR (a) | 171,800 | | 3,011,738 |
Saifun Semiconductors Ltd. (a) | 197,700 | | 2,002,701 |
TOTAL ISRAEL | | 79,690,760 |
Kazakhstan - 0.3% |
JSC Halyk Bank of Kazakhstan: | | | |
GDR (e) | 333,200 | | 6,150,872 |
unit | 234,100 | | 4,321,486 |
KazMunaiGas Exploration & Production JSC (Reg. S) GDR | 378,500 | | 10,219,500 |
TOTAL KAZAKHSTAN | | 20,691,858 |
Korea (South) - 14.0% |
Asia Cement Co. Ltd. | 82,680 | | 6,648,206 |
CJ CheilJedang Corp. (a) | 35,919 | | 11,905,200 |
CJ Corp. | 63,759 | | 7,137,995 |
Daegu Bank Co. Ltd. | 254,500 | | 4,511,138 |
Daewoo Shipbuilding & Marine Engineering Co. Ltd. | 634,070 | | 40,279,660 |
Doosan Co. Ltd. (a) | 144,730 | | 42,564,517 |
GS Engineering & Construction Corp. | 242,260 | | 51,331,156 |
Hanil Cement Co. Ltd. | 22,480 | | 2,431,348 |
Hanjin Heavy Industries & Consolidated Co. Ltd. (a) | 306,461 | | 33,586,170 |
Hanjin Heavy Industries & Construction Holdings | 113,348 | | 7,270,974 |
Hyundai Engineering & Construction Co. Ltd. (a) | 292,058 | | 29,907,652 |
Hyundai Mipo Dockyard Co. Ltd. | 78,853 | | 35,038,560 |
Hyundai Steel Co. | 192,200 | | 19,168,169 |
Industrial Bank of Korea | 754,930 | | 15,478,956 |
Korean Air Lines Co. Ltd. | 136,060 | | 11,967,286 |
Kyeryong Construction Industrial Co. Ltd. | 338,240 | | 15,897,586 |
LG Household & Health Care Ltd. | 134,240 | | 29,929,534 |
LG Petrochemical Co. Ltd. | 159,860 | | 9,536,553 |
Macquarie Korea Infrastructure Fund GDR | 1,179,900 | | 8,176,707 |
MegaStudy Co. Ltd. | 104,119 | | 38,424,732 |
NHN Corp. (a) | 176,161 | | 56,649,531 |
Osstem Implant Co. Ltd. | 116,500 | | 5,410,663 |
POSCO | 144,600 | | 105,458,942 |
Samsung Electronics Co. Ltd. | 183,956 | | 113,439,507 |
Samsung Fire & Marine Insurance Co. Ltd. | 95,800 | | 26,654,462 |
Samsung Heavy Industries Ltd. | 643,250 | | 38,839,326 |
Samwhan Corp. | 238,640 | | 7,999,105 |
Shinhan Financial Group Co. Ltd. | 832,550 | | 54,519,543 |
SK Chemicals Co. Ltd. | 83,950 | | 8,370,375 |
SK Energy Co. Ltd. | 226,574 | | 52,077,308 |
Taewoong Co. Ltd. | 170,686 | | 24,394,384 |
Woori Investment & Securities Co. Ltd. | 437,770 | | 13,496,697 |
TOTAL KOREA (SOUTH) | | 928,501,942 |
Common Stocks - continued |
| Shares | | Value |
Lebanon - 0.1% |
Solidere GDR | 333,800 | | $ 6,081,836 |
Luxembourg - 0.6% |
Evraz Group SA GDR | 497,300 | | 37,546,150 |
Malaysia - 1.3% |
DiGi.com Bhd | 1,275,500 | | 9,607,161 |
Gamuda Bhd | 5,316,400 | | 7,330,173 |
Genting Bhd | 6,762,000 | | 16,830,684 |
IJM Corp. Bhd | 2,748,000 | | 7,218,718 |
KNM Group Bhd | 8,559,600 | | 15,150,988 |
Lion Diversified Holdings Bhd | 2,113,700 | | 1,513,379 |
Parkson Holdings Bhd | 2,747,810 | | 7,927,955 |
Steppe Cement Ltd. (a) | 1,599,200 | | 8,478,283 |
UEM World Bhd | 5,214,400 | | 6,817,759 |
Zelan Bhd | 2,843,500 | | 5,162,622 |
TOTAL MALAYSIA | | 86,037,722 |
Mauritius - 0.1% |
Golden Agri-Resources Ltd. | 6,412,000 | | 7,849,133 |
Mexico - 3.9% |
Alsea SAB de CV | 4,268,500 | | 6,358,823 |
America Movil SAB de CV Series L sponsored ADR | 1,901,400 | | 124,332,546 |
Banco Compartamos SA de CV | 1,766,500 | | 9,114,383 |
Empresas ICA Sociedad Controladora SA de CV sponsored ADR (a) | 69,500 | | 1,944,610 |
Fomento Economico Mexicano SA de CV sponsored ADR | 876,000 | | 31,194,360 |
Grupo Aeroportuario Norte Sab de CV ADR | 515,900 | | 15,750,427 |
Grupo Financiero Banorte SA de CV Series O | 1,484,300 | | 6,976,062 |
Grupo Mexico SA de CV Series B | 4,438,531 | | 40,388,891 |
Urbi, Desarrollos Urbanos, SA de CV (a) | 5,010,600 | | 19,361,209 |
TOTAL MEXICO | | 255,421,311 |
Netherlands - 0.3% |
A&D Pharma Holdings NV (Reg. S) unit | 59,300 | | 1,460,535 |
AmRest Holdings NV (a) | 88,900 | | 4,730,671 |
X5 Retail Group NV unit (a) | 400,000 | | 14,400,000 |
TOTAL NETHERLANDS | | 20,591,206 |
Nigeria - 0.1% |
Guaranty Trust Bank PLC sponsored GDR (a)(e) | 440,800 | | 4,972,224 |
Oman - 0.3% |
BankMuscat SAOG sponsored: | | | |
GDR (e) | 406,257 | | 6,500,112 |
GDR | 848,000 | | 13,568,000 |
TOTAL OMAN | | 20,068,112 |
|
| Shares | | Value |
Pakistan - 0.1% |
MCB Bank Ltd. (a) | 380,190 | | $ 2,379,161 |
MCB Bank Ltd. unit (e) | 192,395 | | 4,619,404 |
TOTAL PAKISTAN | | 6,998,565 |
Panama - 0.1% |
Intergroup Financial Services Corp. (e) | 222,096 | | 3,886,680 |
Philippines - 0.9% |
Alliance Global Group, Inc. (a) | 20,753,000 | | 2,580,684 |
Ayala Corp. | 676,800 | | 9,663,005 |
GMA Networks, Inc. unit | 7,992,000 | | 1,582,757 |
International Container Terminal Services, Inc. | 5,614,000 | | 5,365,135 |
Megaworld Corp. | 79,501,000 | | 8,055,369 |
PNOC Energy Development Corp. | 54,693,000 | | 9,572,062 |
Robinsons Land Corp. | 14,515,000 | | 6,935,780 |
Security Bank Corp. | 2,714,100 | | 4,906,318 |
SM Investments Corp. | 1,302,957 | | 11,401,812 |
TOTAL PHILIPPINES | | 60,062,922 |
Poland - 0.5% |
Bank Handlowy w Warszawie SA | 281,933 | | 13,075,154 |
Globe Trade Centre SA (a) | 756,500 | | 15,576,112 |
PBG SA (a) | 34,633 | | 4,707,734 |
Polimex Mostostal SA | 675,000 | | 2,806,597 |
Vistula & Wolczanka SA (a) | 12,494 | | 74,927 |
TOTAL POLAND | | 36,240,524 |
Romania - 0.1% |
Banca Transilvania SA | 13,211,331 | | 5,201,538 |
Russia - 10.4% |
JSC Chelyabinsk Zinc Plant (a) | 124,200 | | 1,738,800 |
JSC MMC 'Norilsk Nickel' sponsored ADR | 239,200 | | 75,348,000 |
Lukoil Oil Co. sponsored ADR | 330,559 | | 30,361,844 |
Magnitogorsk Iron & Steel Works | 4,231,300 | | 5,500,690 |
Mechel Steel Group OAO sponsored ADR (d) | 168,500 | | 14,179,275 |
Mobile TeleSystems OJSC sponsored ADR | 905,500 | | 75,156,500 |
Novolipetsk Iron & Steel Corp. sponsored GDR (e) | 290,700 | | 11,988,468 |
OAO Gazprom sponsored ADR | 4,522,206 | | 227,240,852 |
OAO Raspadskaya | 660,000 | | 3,372,600 |
OAO TatNeft unit | 210,600 | | 26,272,350 |
OAO TMK (a) | 1,540,400 | | 17,329,500 |
OAO TMK unit | 104,100 | | 4,631,409 |
Open Investments (a) | 9,353 | | 2,581,428 |
Rosinter Restaurants Holding | 64,000 | | 3,584,000 |
Sberbank (Savings Bank of the Russian Federation) (a) | 5,720,000 | | 24,596,000 |
Sberbank (Savings Bank of the Russian Federation) GDR | 131,600 | | 66,636,397 |
Sistema-Hals JSC | 25,221 | | 4,918,095 |
Sistema-Hals JSC unit (a) | 87,000 | | 848,250 |
Common Stocks - continued |
| Shares | | Value |
Russia - continued |
Surgutneftegaz JSC sponsored ADR | 72,876 | | $ 5,043,019 |
Uralkali JSC (a) | 1,708,300 | | 8,541,500 |
Uralkali JSC unit (a) | 231,800 | | 5,818,180 |
Vimpel Communications sponsored ADR | 1,386,000 | | 45,835,020 |
VSMPO-Avisma Corp. (a) | 17,100 | | 5,420,700 |
Wimm-Bill-Dann Foods OJSC sponsored ADR | 163,025 | | 19,522,244 |
TOTAL RUSSIA | | 686,465,121 |
Singapore - 0.7% |
Keppel Corp. Ltd. | 1,231,800 | | 12,661,835 |
Olam International Ltd. | 3,567,000 | | 8,710,587 |
Sino-Environment Technology Group Ltd. (a) | 2,712,000 | | 6,278,826 |
Straits Asia Resources Ltd. | 6,430,000 | | 11,911,243 |
Yangzijiang Shipbuilding Holdings Ltd. | 4,992,000 | | 8,889,911 |
TOTAL SINGAPORE | | 48,452,402 |
South Africa - 6.3% |
African Bank Investments Ltd. | 3,639,526 | | 20,216,478 |
African Rainbow Minerals Ltd. | 429,966 | | 9,923,819 |
Anglo Platinum Ltd. | 107,000 | | 18,357,440 |
Aspen Pharmacare Holdings Ltd. | 2,310,300 | | 13,490,673 |
Bell Equipment Ltd. | 386,197 | | 3,090,051 |
Bidvest Group Ltd. | 1,375,200 | | 28,862,483 |
Exxaro Resources Ltd. | 605,400 | | 9,791,290 |
FirstRand Ltd. | 11,451,256 | | 45,283,471 |
Illovo Sugar Ltd. | 1,526,903 | | 5,403,719 |
Impala Platinum Holdings Ltd. | 1,735,128 | | 65,144,058 |
JSE Ltd. | 70,800 | | 942,330 |
Kumba Iron Ore Ltd. | 488,900 | | 19,107,647 |
Mr. Price Group Ltd. | 2,371,847 | | 9,634,830 |
MTN Group Ltd. | 3,661,600 | | 71,130,482 |
Murray & Roberts Holdings Ltd. | 2,869,800 | | 43,936,775 |
Nedbank Group Ltd. | 1,280,090 | | 28,067,830 |
Raubex Group Ltd. | 2,498,498 | | 13,763,076 |
Shoprite Holdings Ltd. | 2,081,951 | | 12,974,152 |
TOTAL SOUTH AFRICA | | 419,120,604 |
Taiwan - 6.4% |
AU Optronics Corp. | 12,864,000 | | 27,399,784 |
AU Optronics Corp. sponsored ADR (d) | 303,105 | | 6,586,472 |
China Steel Corp. | 21,831,950 | | 30,731,190 |
Chung Hwa Pulp Corp. | 22,177,000 | | 15,300,384 |
Delta Electronics, Inc. | 7,002,677 | | 28,101,497 |
Everlight Electronics Co. Ltd. | 609,713 | | 2,663,201 |
Feng Tay Enterprise Co. Ltd. | 2,150,400 | | 1,852,019 |
Formosa Chemicals & Fibre Corp. | 8,863,000 | | 23,802,469 |
Foxconn Technology Co. Ltd. | 1,455,325 | | 17,520,505 |
Gemtek Technology Corp. | 1,219,955 | | 2,745,322 |
Greatek Electronics, Inc. | 6,472,240 | | 10,129,420 |
Hon Hai Precision Industry Co. Ltd. (Foxconn) | 11,896,828 | | 90,341,709 |
|
| Shares | | Value |
Innolux Display Corp. | 6,283,631 | | $ 29,095,374 |
MediaTek, Inc. | 2,740,700 | | 53,553,421 |
Shin Kong Financial Holding Co. Ltd. | 23,171,164 | | 21,458,093 |
Siliconware Precision Industries Co. Ltd. | 18,629,726 | | 39,277,983 |
Taiwan Cement Corp. | 10,253,400 | | 17,471,452 |
Taiwan Semiconductor Manufacturing Co. Ltd. | 3,247,867 | | 6,396,478 |
TOTAL TAIWAN | | 424,426,773 |
Thailand - 1.0% |
Mermaid Maritime PLC | 562,000 | | 741,927 |
Minor International PCL (For. Reg.) | 24,050,794 | | 12,596,855 |
PTT Public Co. Ltd. (For. Reg.) | 3,717,900 | | 45,509,677 |
Total Access Communication PCL (a) | 3,390,000 | | 4,068,000 |
Total Access Communication PCL unit (a) | 1,923,000 | | 2,319,935 |
TOTAL THAILAND | | 65,236,394 |
Turkey - 3.0% |
Aksigorta AS | 1,408,000 | | 10,384,460 |
Anadolu Efes Biracilik ve Malt Sanyii AS | 1,865,631 | | 22,719,403 |
Asya Katilim Bankasi AS (a) | 2,936,000 | | 24,927,233 |
Atakule Gayrimenkul Yatirim Ortakligi AS | 1,692,000 | | 3,337,421 |
Bagfas Bandirma Gubre Fabrikalari AS | 88,000 | | 4,226,234 |
Enka Insaat ve Sanayi AS | 2,063,072 | | 32,200,944 |
Tofas Turk Otomobil Fabrikasi AS | 2,943,000 | | 15,522,019 |
Tupras-Turkiye Petrol Rafinerileri AS | 1,030,400 | | 29,161,014 |
Turk Hava Yollari AO (a) | 573,000 | | 4,078,642 |
Turkiye Garanti Bankasi AS | 5,417,500 | | 49,712,491 |
TOTAL TURKEY | | 196,269,861 |
United Kingdom - 0.6% |
Aricom Plc (a) | 4,405,800 | | 7,030,207 |
Aricom Plc warrants 6/5/10 (a)(f) | 176,800 | | 117,804 |
Gafisa SA warrants (Deutsche Bank Warrant Program) 12/17/07 (a) | 181,600 | | 3,237,928 |
Hirco PLC | 343,600 | | 2,693,143 |
Imperial Energy PLC (a) | 310,600 | | 8,885,560 |
Prosperity Mineral Holdings Ltd. | 711,000 | | 2,586,858 |
Sibir Energy PLC | 1,280,986 | | 14,474,677 |
TOTAL UNITED KINGDOM | | 39,026,177 |
United States of America - 1.2% |
BMB Munai, Inc. (a) | 562,162 | | 3,288,648 |
Central European Distribution Corp. (a)(d) | 192,300 | | 10,226,514 |
CTC Media, Inc. (a) | 539,017 | | 13,523,937 |
Golden Telecom, Inc. (d) | 306,000 | | 31,655,700 |
NII Holdings, Inc. (a) | 237,400 | | 13,769,200 |
Pricesmart, Inc. | 198,059 | | 5,632,798 |
TOTAL UNITED STATES OF AMERICA | | 78,096,797 |
Common Stocks - continued |
| Shares | | Value |
Vietnam - 0.1% |
Luks Group (Vietnam Holdings) Co. Ltd. | 3,946,000 | | $ 5,232,396 |
TOTAL COMMON STOCKS (Cost $3,828,249,615) | 6,485,930,335 |
Nonconvertible Preferred Stocks - 0.2% |
| | | |
Korea (South) - 0.1% |
Samsung Electronics Co. Ltd. | 14,270 | | 6,797,053 |
South Africa - 0.1% |
Allied Electronics Corp. Ltd. | 628,500 | | 4,545,238 |
TOTAL NONCONVERTIBLE PREFERRED STOCKS (Cost $8,938,881) | 11,342,291 |
Investment Companies - 0.3% |
| | | |
Romania - 0.3% |
SIF 1 Banat-Crisana Arad Fund | 2,651,100 | | 4,117,475 |
SIF 3 Transilvania Brasov Fund | 8,137,600 | | 8,461,178 |
SIF 4 Muntenia Bucuresti Fund | 2,731,000 | | 2,970,286 |
SIF 5 Oltenia Craiova Fund | 1,203,500 | | 2,267,100 |
TOTAL INVESTMENT COMPANIES (Cost $13,001,363) | 17,816,039 |
Convertible Bonds - 0.0% |
| Principal Amount (g) | | |
Brazil - 0.0% |
Companhia de Saneamento de Minas Gerais 2.3% 6/1/13 (f)
(Cost $302,546) | BRL | 4,841 | | 363,754 |
Money Market Funds - 2.0% |
| Shares | | |
Fidelity Cash Central Fund, 4.97% (b) | 84,163,679 | | 84,163,679 |
Fidelity Securities Lending Cash Central Fund, 5.02% (b)(c) | 47,017,800 | | 47,017,800 |
TOTAL MONEY MARKET FUNDS (Cost $131,181,479) | 131,181,479 |
TOTAL INVESTMENT PORTFOLIO - 100.6% (Cost $3,981,673,884) | | 6,646,633,898 |
NET OTHER ASSETS - (0.6)% | | (37,589,315) |
NET ASSETS - 100% | $ 6,609,044,583 |
Currency Abbreviations |
BRL | - | Brazilian real |
Legend |
(a) Non-income producing |
(b) Affiliated fund that is available only to investment companies and other accounts managed by Fidelity Investments. The rate quoted is the annualized seven-day yield of the fund at period end. A complete unaudited listing of the fund's holdings as of its most recent quarter end is available upon request. |
(c) Investment made with cash collateral received from securities on loan. |
(d) Security or a portion of the security is on loan at period end. |
(e) Security exempt from registration under Rule 144A of the Securities Act of 1933. These securities may be resold in transactions exempt from registration, normally to qualified institutional buyers. At the end of the period, the value of these securities amounted to $67,723,164 or 1.0% of net assets. |
(f) Restricted securities - Investment in securities not registered under the Securities Act of 1933 (excluding 144A issues). At the end of the period, the value of restricted securities (excluding 144A issues) amounted to $481,558 or 0.0% of net assets. |
Additional information on each holding is as follows: |
Security | Acquisition Date | Acquisition Cost |
Aricom Plc warrants 6/5/10 | 5/11/07 | $ 0 |
Companhia de Saneamento de Minas Gerais 2.3% 6/1/13 | 8/22/07 | $ 302,546 |
(g) Principal amount is stated in United States dollars unless otherwise noted. |
Affiliated Central Funds |
Information regarding fiscal year to date income earned by the Fund from investments in Fidelity Central Funds is as follows: |
Fund | Income earned |
Fidelity Cash Central Fund | $ 4,350,189 |
Fidelity Securities Lending Cash Central Fund | 270,265 |
Total | $ 4,620,454 |
See accompanying notes which are an integral part of the financial statements.
Annual Report
Fidelity Emerging Markets
Financial Statements
Statement of Assets and Liabilities
| October 31, 2007 |
| | |
Assets | | |
Investment in securities, at value (including securities loaned of $47,489,348) - See accompanying schedule: Unaffiliated issuers
(cost $3,850,492,405) | $ 6,515,452,419 | |
Fidelity Central Funds
(cost $131,181,479) | 131,181,479 | |
Total Investments
(cost $3,981,673,884) | | $ 6,646,633,898 |
Cash | | 269,248 |
Foreign currency held at value
(cost $112,341) | | 108,021 |
Receivable for investments sold | | 29,275,934 |
Receivable for fund shares sold | | 41,686,695 |
Dividends receivable | | 7,775,796 |
Interest receivable | | 27 |
Distributions receivable from Fidelity Central Funds | | 584,638 |
Prepaid expenses | | 1,214 |
Other receivables | | 841,310 |
Total assets | | 6,727,176,781 |
| | |
Liabilities | | |
Payable for investments purchased | $ 49,193,739 | |
Payable for fund shares redeemed | 5,804,296 | |
Accrued management fee | 3,523,135 | |
Other affiliated payables | 960,710 | |
Other payables and accrued expenses | 11,632,518 | |
Collateral on securities loaned, at value | 47,017,800 | |
Total liabilities | | 118,132,198 |
| | |
Net Assets | | $ 6,609,044,583 |
Net Assets consist of: | | |
Paid in capital | | $ 3,683,681,553 |
Undistributed net investment income | | 25,569,936 |
Accumulated undistributed net realized gain (loss) on investments and foreign currency transactions | | 245,394,108 |
Net unrealized appreciation (depreciation) on investments and assets and liabilities in foreign currencies | | 2,654,398,986 |
Net Assets, for 176,029,375 shares outstanding | | $ 6,609,044,583 |
Net Asset Value, offering price and redemption price per share ($6,609,044,583 ÷ 176,029,375 shares) | | $ 37.55 |
Statement of Operations
| Year ended October 31, 2007 |
| | |
Investment Income | | |
Dividends | | $ 81,318,428 |
Interest | | 90,017 |
Income from Fidelity Central Funds (including $270,265 from security lending) | | 4,620,454 |
| | 86,028,899 |
Less foreign taxes withheld | | (8,065,470) |
Total income | | 77,963,429 |
| | |
Expenses | | |
Management fee | $ 29,273,106 | |
Transfer agent fees | 8,297,451 | |
Accounting and security lending fees | 1,509,134 | |
Custodian fees and expenses | 3,685,392 | |
Independent trustees' compensation | 13,947 | |
Registration fees | 167,507 | |
Audit | 160,924 | |
Legal | 36,958 | |
Interest | 63,786 | |
Miscellaneous | 123,012 | |
Total expenses before reductions | 43,331,217 | |
Expense reductions | (2,165,733) | 41,165,484 |
Net investment income (loss) | | 36,797,945 |
Realized and Unrealized Gain (Loss) Net realized gain (loss) on: | | |
Investment securities: | | |
Unaffiliated issuers (net of foreign taxes of $1,493,945) | 282,747,538 | |
Foreign currency transactions | (1,071,518) | |
Total net realized gain (loss) | | 281,676,020 |
Change in net unrealized appreciation (depreciation) on: Investment securities (net of increase in deferred foreign taxes of $8,147,965) | 2,077,319,074 | |
Assets and liabilities in foreign currencies | 105,555 | |
Total change in net unrealized appreciation (depreciation) | | 2,077,424,629 |
Net gain (loss) | | 2,359,100,649 |
Net increase (decrease) in net assets resulting from operations | | $ 2,395,898,594 |
See accompanying notes which are an integral part of the financial statements.
Annual Report
Statement of Changes in Net Assets
| Year ended
October 31,
2007 | Year ended
October 31,
2006 |
Increase (Decrease) in Net Assets | | |
Operations | | |
Net investment income (loss) | $ 36,797,945 | $ 28,066,004 |
Net realized gain (loss) | 281,676,020 | 316,799,295 |
Change in net unrealized appreciation (depreciation) | 2,077,424,629 | 306,336,297 |
Net increase (decrease) in net assets resulting from operations | 2,395,898,594 | 651,201,596 |
Distributions to shareholders from net investment income | (28,224,601) | (21,238,863) |
Share transactions
Proceeds from sales of shares | 2,766,036,681 | 2,470,015,019 |
Reinvestment of distributions | 27,314,929 | 20,504,249 |
Cost of shares redeemed | (1,559,669,286) | (1,510,859,402) |
Net increase (decrease) in net assets resulting from share transactions | 1,233,682,324 | 979,659,866 |
Redemption fees | 2,543,001 | 3,299,389 |
Total increase (decrease) in net assets | 3,603,899,318 | 1,612,921,988 |
| | |
Net Assets | | |
Beginning of period | 3,005,145,265 | 1,392,223,277 |
End of period (including undistributed net investment income of $25,569,936 and undistributed net investment income of $34,483,401, respectively) | $ 6,609,044,583 | $ 3,005,145,265 |
Other Information Shares | | |
Sold | 96,979,878 | 121,916,389 |
Issued in reinvestment of distributions | 1,154,965 | 1,159,761 |
Redeemed | (58,453,895) | (75,344,302) |
Net increase (decrease) | 39,680,948 | 47,731,848 |
Financial Highlights
Years ended October 31, | 2007 | 2006 | 2005 | 2004 | 2003 |
Selected Per-Share Data | | | | | |
Net asset value, beginning of period | $ 22.04 | $ 15.71 | $ 11.30 | $ 9.81 | $ 7.03 |
Income from Investment Operations | | | | | |
Net investment income (loss) C | .25 | .21 | .21 | .14 | .10 |
Net realized and unrealized gain (loss) | 15.44 | 6.31 | 4.30 | 1.46 | 2.73 |
Total from investment operations | 15.69 | 6.52 | 4.51 | 1.60 | 2.83 |
Distributions from net investment income | (.20) | (.21) | (.11) | (.12) | (.05) |
Redemption fees added to paid in capital C | .02 | .02 | .01 | .01 | - G |
Net asset value, end of period | $ 37.55 | $ 22.04 | $ 15.71 | $ 11.30 | $ 9.81 |
Total Return A, B | 71.81% | 41.96% | 40.25% | 16.48% | 40.50% |
Ratios to Average Net Assets D, F | | | | | |
Expenses before reductions | 1.05% | 1.11% | 1.16% | 1.23% | 1.36% |
Expenses net of fee waivers, if any | 1.05% | 1.11% | 1.16% | 1.23% | 1.36% |
Expenses net of all reductions | .99% | 1.01% | 1.07% | 1.18% | 1.36% |
Net investment income (loss) | .89% | 1.04% | 1.53% | 1.27% | 1.31% |
Supplemental Data | | | | | |
Net assets, end of period (000 omitted) | $ 6,609,045 | $ 3,005,145 | $ 1,392,223 | $ 604,550 | $ 430,928 |
Portfolio turnover rate E | 52% | 66% | 68% | 112% | 105% |
A Total returns would have been lower had certain expenses not been reduced during the periods shown. BTotal returns do not include the effect of the former sales charges. CCalculated based on average shares outstanding during the period. DFees and expenses of the underlying Fidelity Central Funds are not included in the Fund's expense ratio. The Fund indirectly bears its proportionate share of the expenses of any underlying Fidelity Central Funds. EAmount does not include the portfolio activity of any underlying Fidelity Central Funds. FExpense ratios reflect operating expenses of the Fund. Expenses before reductions do not reflect amounts reimbursed by the investment adviser or reductions from brokerage service arrangements or other expense offset arrangements and do not represent the amount paid by the Fund during periods when reimbursements or reductions occur. Expenses net of fee waivers reflect expenses after reimbursement by the investment adviser but prior to reductions from brokerage service arrangements or other expense offset arrangements. Expenses net of all reductions represent the net expenses paid by the Fund. GAmount represents less than $.01 per share. |
See accompanying notes which are an integral part of the financial statements.
Annual Report
Europe
Performance: The Bottom Line
Average annual total return reflects the change in the value of an investment, assuming reinvestment of the fund's dividend income and capital gains (the profits earned upon the sale of securities that have grown in value) and assuming a constant rate of performance each year. The $10,000 table and the fund's returns do not reflect the deduction of taxes that a shareholder would pay on fund distributions or the redemption of fund shares. During periods of reimbursement by Fidelity, a fund's total returns will be greater than it would be had the reimbursement not occurred. How a fund did yesterday is no guarantee of how it will do tomorrow.
Average Annual Total Returns
Periods ended October 31, 2007 | Past 1
year | Past 5
years | Past 10
years |
Fidelity Europe Fund | 28.33% | 27.78% | 11.24% |
$10,000 Over 10 Years
Let's say hypothetically that $10,000 was invested in Fidelity Europe Fund on October 31, 1997. The chart shows how the value of your investment would have changed, and also shows how the MSCI Europe Index performed over the same period.
Annual Report
Europe
Management's Discussion of Fund Performance
Comments from Trygve Toraasen, Portfolio Manager of Fidelity® Europe Fund
Foreign stocks, with a large assist from a weak U.S. dollar, generally had higher returns for U.S. investors than domestic equities during the 12-month period ending October 31, 2007. The backdrop for global stocks was solid, with robust economic growth and relatively high corporate profitability worldwide. Developed international equity markets, as measured by the Morgan Stanley Capital InternationalSM Europe, Australasia, and Far East (MSCI® EAFE®) Index - a performance monitor of established markets outside the United States and Canada - rose 25.09%. In comparison, the Standard & Poor's 500SM Index, a gauge of U.S. stocks, was up 14.56%, while Canada did appreciably better, as measured by the 43.24% advance of the S&P/TSX Composite Index. Among countries making up at least 1% of the EAFE benchmark, Finland had the best showing, soaring nearly 69%, while Hong Kong gained roughly 66%. The United Kingdom and Japan, the two largest components of the index, both underperformed. Fallout from the credit crunch and concerns about export growth tempered UK stocks, while Japan struggled with a slowdown in consumer spending and sluggish domestic growth. Emerging markets were the period's big winners, advancing 68.33% as measured by the MSCI Emerging Markets index.
Fidelity Europe Fund returned 28.33% for the 12 months ending October 31, 2007, while the MSCI Europe index gained 28.20%. The period saw a shift in market leadership from highly cyclical stocks to shares of secular-growth companies with the ability to improve earnings even in a slowing economy. I had repositioned the fund in anticipation of this change and this newer focus supported performance in the second half of the period, but not in the first. Overall, stock selection in the industrials sector helped performance, as several capital goods investments fared well on the back of strong revenues in emerging markets. However, my lack of exposure to strong-performing automobile stocks detracted from results, along with a modest stake in cash. Also affecting results were currency movements that added to returns for U.S. investors. Among capital goods investments, the fund had standout contributions from ABB, a Swiss construction and engineering corporation; Hochtief, a German construction and infrastructure management corporation; and Hexagon an out-of benchmark Swedish engineering company that specializes in measuring technology for a variety of industrial processes. Also helping results was Bayer, the German chemical and pharmaceutical corporation. Holding back relative performance, however, were my decisions not to own German auto manufacturers Volkswagen and Daimler because of my skepticism about their earnings growth prospects. Swiss pharmaceutical company Roche Holding underperformed for the period, although I remained optimistic about the earnings potential of its cancer drugs. The Spanish banking institution Banco Bilbao was another investment that lagged.
Note to shareholders: The proposal to merge Fidelity Nordic Fund into Fidelity Europe Fund was not approved by shareholders at the shareholder meeting on June 20, 2007. The in-favor votes failed to exceed the 66.67% threshold required to approve the merger. Nordic Fund, which had been closed to new investors pending shareholder consideration of the merger proposal, was reopened on June 21, 2007.
The views expressed above reflect those of the portfolio manager(s) only through the end of the period as stated on the cover of this report and do not necessarily represent the views of Fidelity or any other person in the Fidelity organization. Any such views are subject to change at any time based upon market or other conditions and Fidelity disclaims any responsibility to update such views. These views may not be relied on as investment advice and, because investment decisions for a Fidelity fund are based on numerous factors, may not be relied on as an indication of trading intent on behalf of any Fidelity fund.
Annual Report
Europe
Investment Changes
Geographic Diversification (% of fund's net assets) |
As of October 31, 2007 |
| United Kingdom | 19.9% | |
| Germany | 18.0% | |
| Switzerland | 12.0% | |
| France | 11.8% | |
| Sweden | 10.0% | |
| Spain | 6.0% | |
| Finland | 4.8% | |
| Luxembourg | 2.9% | |
| Netherlands | 2.8% | |
| Other | 11.8% | |

Percentages are adjusted for the effect of futures contracts, if applicable. |
|
As of April 30, 2007 |
| Switzerland | 18.3% | |
| United Kingdom | 16.1% | |
| Germany | 15.3% | |
| Sweden | 11.8% | |
| France | 11.4% | |
| Netherlands | 9.0% | |
| Spain | 5.5% | |
| Italy | 4.9% | |
| Norway | 3.2% | |
| Other | 4.5% | |

Percentages are adjusted for the effect of futures contracts, if applicable. |
Asset Allocation |
| % of fund's
net assets | % of fund's net assets
6 months ago |
Stocks | 99.7 | 99.2 |
Short-Term Investments and Net Other Assets | 0.3 | 0.8 |
Top Ten Stocks as of October 31, 2007 |
| % of fund's
net assets | % of fund's net assets
6 months ago |
ABB Ltd. (Reg.) (Switzerland, Electrical Equipment) | 4.2 | 4.0 |
Tesco PLC (United Kingdom, Food & Staples Retailing) | 4.2 | 4.0 |
Nokia Corp. (Finland, Communications Equipment) | 4.0 | 1.0 |
Vodafone Group PLC (United Kingdom, Wireless Telecommunication Services) | 3.7 | 1.8 |
Telefonica SA (Spain, Diversified Telecommunication Services) | 3.5 | 1.2 |
E.ON AG (Germany, Electric Utilities) | 3.4 | 1.0 |
Bayer AG (Germany, Chemicals) | 3.3 | 3.7 |
Electricite de France (France, Electric Utilities) | 3.0 | 0.2 |
ArcelorMittal SA (Luxembourg, Metals & Mining) | 2.9 | 0.0 |
Syngenta AG (Switzerland) (Switzerland, Chemicals) | 2.8 | 2.4 |
| 35.0 | |
Market Sectors as of October 31, 2007 |
| % of fund's
net assets | % of fund's net assets
6 months ago |
Industrials | 23.4 | 17.9 |
Materials | 15.5 | 10.6 |
Consumer Staples | 10.5 | 16.0 |
Telecommunication Services | 9.5 | 4.9 |
Utilities | 8.1 | 3.6 |
Consumer Discretionary | 7.8 | 14.1 |
Financials | 7.5 | 19.9 |
Energy | 7.4 | 1.5 |
Information Technology | 6.4 | 5.0 |
Health Care | 3.6 | 5.7 |
Annual Report
Europe
Investments October 31, 2007
Showing Percentage of Net Assets
Common Stocks - 98.5% |
| Shares | | Value |
Austria - 2.0% |
Erste Bank AG | 671,300 | | $ 54,464,449 |
Raiffeisen International Bank Holding AG | 325,500 | | 53,807,780 |
TOTAL AUSTRIA | | 108,272,229 |
Belgium - 1.1% |
InBev SA | 642,400 | | 60,645,007 |
Cyprus - 0.5% |
Marfin Popular Bank Public Co. | 1,833,700 | | 29,807,777 |
Czech Republic - 1.0% |
Ceske Energeticke Zavody AS | 752,000 | | 54,357,061 |
Denmark - 0.6% |
Vestas Wind Systems AS (a) | 390,600 | | 34,848,901 |
Finland - 4.8% |
Metso Corp. | 763,200 | | 46,396,186 |
Nokia Corp. | 5,433,550 | | 215,820,606 |
TOTAL FINLAND | | 262,216,792 |
France - 11.8% |
Cap Gemini SA | 414,300 | | 26,410,465 |
Electricite de France | 1,381,400 | | 165,693,615 |
Essilor International SA | 831,200 | | 52,974,631 |
France Telecom SA | 1,101,200 | | 40,744,400 |
L'Oreal SA | 501,200 | | 65,657,200 |
Sodexho Alliance SA | 666,100 | | 48,030,324 |
Total SA Series B | 997,000 | | 80,368,170 |
Veolia Environnement | 449,500 | | 40,148,675 |
Vinci SA | 1,546,500 | | 126,861,029 |
TOTAL FRANCE | | 646,888,509 |
Germany - 16.8% |
BASF AG | 418,900 | | 58,268,990 |
Bayer AG | 2,216,300 | | 182,623,120 |
Commerzbank AG | 530,600 | | 22,508,511 |
E.ON AG (d) | 965,600 | | 188,581,680 |
Hochtief AG | 710,700 | | 98,137,101 |
Linde AG | 732,200 | | 92,651,265 |
MAN AG | 173,500 | | 30,968,390 |
Siemens AG (Reg.) | 1,028,300 | | 140,229,271 |
Wincor Nixdorf AG | 1,044,300 | | 103,730,036 |
TOTAL GERMANY | | 917,698,364 |
Greece - 0.5% |
National Bank of Greece SA | 405,470 | | 28,185,608 |
Italy - 2.3% |
ENI SpA | 1,104,000 | | 40,340,160 |
Tod's SpA (d) | 586,300 | | 49,207,564 |
Unicredito Italiano SpA | 4,348,700 | | 37,172,340 |
TOTAL ITALY | | 126,720,064 |
Luxembourg - 2.9% |
ArcelorMittal SA | 1,967,800 | | 157,942,556 |
|
| Shares | | Value |
Netherlands - 2.8% |
Heineken NV (Bearer) | 747,100 | | $ 52,147,580 |
Koninklijke Philips Electronics NV | 1,201,800 | | 49,682,412 |
Randstad Holdings NV | 886,600 | | 49,145,203 |
TOTAL NETHERLANDS | | 150,975,195 |
Norway - 2.7% |
Aker Kvaerner ASA | 937,650 | | 32,673,167 |
Norsk Hydro ASA | 910,420 | | 13,383,174 |
StatoilHydro ASA | 1,195,700 | | 40,461,962 |
Telenor ASA | 2,474,200 | | 58,061,227 |
TOTAL NORWAY | | 144,579,530 |
Russia - 0.8% |
OAO Gazprom sponsored ADR | 851,600 | | 42,792,900 |
Spain - 6.0% |
Banco Bilbao Vizcaya Argentaria SA | 995,200 | | 25,118,848 |
Banco Santander Central Hispano SA | 1,303,300 | | 28,323,316 |
Inditex SA | 1,134,400 | | 84,394,687 |
Telefonica SA | 5,711,600 | | 189,339,540 |
TOTAL SPAIN | | 327,176,391 |
Sweden - 10.0% |
AB Volvo (B Shares) | 1,378,100 | | 26,840,822 |
Elekta AB (B Shares) | 1,999,800 | | 38,556,050 |
H&M Hennes & Mauritz AB (B Shares) | 2,075,450 | | 138,172,788 |
Hexagon AB (B Shares) | 3,678,675 | | 88,583,478 |
Nordea Bank AB | 2,365,500 | | 42,293,260 |
Sandvik AB | 951,200 | | 17,964,824 |
Scania AB (B Shares) | 3,527,000 | | 96,310,762 |
SKF AB (B Shares) | 3,097,600 | | 60,087,224 |
SSAB Svenskt Stal AB (B Shares) | 373,400 | | 10,989,699 |
TeliaSonera AB | 2,710,500 | | 26,662,404 |
TOTAL SWEDEN | | 546,461,311 |
Switzerland - 12.0% |
ABB Ltd. (Reg.) | 7,683,663 | | 231,113,541 |
Compagnie Financiere Richemont unit | 867,018 | | 61,865,698 |
Geberit AG (Reg.) | 185,093 | | 24,944,330 |
Roche Holding AG
(participation certificate) | 435,015 | | 74,344,064 |
Schindler Holding AG
(participation certificate) | 777,866 | | 54,396,224 |
SGS Societe Generale de Surveillance Holding SA (Reg.) | 41,536 | | 54,434,644 |
Syngenta AG (Switzerland) | 641,315 | | 155,422,690 |
TOTAL SWITZERLAND | | 656,521,191 |
United Kingdom - 19.9% |
Anglo American PLC (United Kingdom) | 941,100 | | 64,841,524 |
BG Group PLC | 5,173,700 | | 95,454,815 |
BHP Billiton PLC | 1,393,700 | | 53,054,543 |
BP PLC | 5,641,400 | | 73,328,798 |
British American Tobacco PLC | 1,134,900 | | 43,512,066 |
Capita Group PLC | 3,305,516 | | 51,473,775 |
Common Stocks - continued |
| Shares | | Value |
United Kingdom - continued |
Investec PLC | 2,716,400 | | $ 32,812,158 |
Man Group plc | 4,388,200 | | 53,644,929 |
Rio Tinto PLC (Reg.) | 584,300 | | 54,778,125 |
Serco Group PLC | 5,499,900 | | 51,541,312 |
Smith & Nephew PLC | 2,081,900 | | 28,218,073 |
Tesco PLC | 22,409,273 | | 229,695,219 |
Unilever PLC | 1,544,000 | | 52,279,840 |
Vodafone Group PLC | 51,557,500 | | 202,466,308 |
TOTAL UNITED KINGDOM | | 1,087,101,485 |
TOTAL COMMON STOCKS (Cost $4,162,589,791) | 5,383,190,871 |
Nonconvertible Preferred Stocks - 1.2% |
| | | |
Germany - 1.2% |
Henkel KGaA
(Cost $58,042,027) | 1,213,800 | | 61,953,838 |
Money Market Funds - 1.9% |
| | | |
Fidelity Cash Central Fund, 4.97% (b) | 95,116,219 | | 95,116,219 |
Fidelity Securities Lending Cash Central Fund, 5.02% (b)(c) | 10,552,472 | | 10,552,472 |
TOTAL MONEY MARKET FUNDS (Cost $105,668,691) | 105,668,691 |
TOTAL INVESTMENT PORTFOLIO - 101.6% (Cost $4,326,300,509) | | 5,550,813,400 |
NET OTHER ASSETS - (1.6)% | | (86,190,883) |
NET ASSETS - 100% | $ 5,464,622,517 |
Legend |
(a) Non-income producing |
(b) Affiliated fund that is available only to investment companies and other accounts managed by Fidelity Investments. The rate quoted is the annualized seven-day yield of the fund at period end. A complete unaudited listing of the fund's holdings as of its most recent quarter end is available upon request. |
(c) Investment made with cash collateral received from securities on loan. |
(d) Security or a portion of the security is on loan at period end. |
Affiliated Central Funds |
Information regarding fiscal year to date income earned by the Fund from investments in Fidelity Central Funds is as follows: |
Fund | Income earned |
Fidelity Cash Central Fund | $ 4,308,002 |
Fidelity Securities Lending Cash Central Fund | 4,782,576 |
Total | $ 9,090,578 |
See accompanying notes which are an integral part of the financial statements.
Annual Report
Europe
Financial Statements
Statement of Assets and Liabilities
| October 31, 2007 |
| | |
Assets | | |
Investment in securities, at value (including securities loaned of $10,211,876) - See accompanying schedule: Unaffiliated issuers
(cost $4,220,631,818) | $ 5,445,144,709 | |
Fidelity Central Funds
(cost $105,668,691) | 105,668,691 | |
Total Investments
(cost $4,326,300,509) | | $ 5,550,813,400 |
Receivable for investments sold | | 43,950,794 |
Receivable for fund shares sold | | 1,267,688 |
Dividends receivable | | 4,649,811 |
Distributions receivable from Fidelity Central Funds | | 498,152 |
Prepaid expenses | | 1,556 |
Other receivables | | 566,693 |
Total assets | | 5,601,748,094 |
| | |
Liabilities | | |
Payable to custodian bank | $ 97,453 | |
Payable for investments purchased | 80,710,585 | |
Payable for fund shares redeemed | 40,998,670 | |
Accrued management fee | 3,355,372 | |
Other affiliated payables | 1,030,295 | |
Other payables and accrued expenses | 380,730 | |
Collateral on securities loaned, at value | 10,552,472 | |
Total liabilities | | 137,125,577 |
| | |
Net Assets | | $ 5,464,622,517 |
Net Assets consist of: | | |
Paid in capital | | $ 3,780,275,641 |
Undistributed net investment income | | 77,915,917 |
Accumulated undistributed net realized gain (loss) on investments and foreign currency transactions | | 381,743,101 |
Net unrealized appreciation (depreciation) on investments and assets and liabilities in foreign currencies | | 1,224,687,858 |
Net Assets, for 115,136,294 shares outstanding | | $ 5,464,622,517 |
Net Asset Value, offering price and redemption price per share ($5,464,622,517 ÷ 115,136,294 shares) | | $ 47.46 |
Statement of Operations
| Year ended October 31, 2007 |
| | |
Investment Income | | |
Dividends | | $ 130,799,510 |
Interest | | 177,864 |
Income from Fidelity Central Funds (including $4,782,576 from security lending) | | 9,090,578 |
| | 140,067,952 |
Less foreign taxes withheld | | (13,861,027) |
Total income | | 126,206,925 |
| | |
Expenses | | |
Management fee
Basic fee | $ 33,562,140 | |
Performance adjustment | 3,770,585 | |
Transfer agent fees | 10,324,991 | |
Accounting and security lending fees | 1,557,101 | |
Custodian fees and expenses | 875,144 | |
Independent trustees' compensation | 16,303 | |
Registration fees | 64,842 | |
Audit | 92,050 | |
Legal | 38,595 | |
Interest | 26,146 | |
Miscellaneous | 65,522 | |
Total expenses before reductions | 50,393,419 | |
Expense reductions | (2,436,258) | 47,957,161 |
Net investment income (loss) | | 78,249,764 |
Realized and Unrealized Gain (Loss) Net realized gain (loss) on: | | |
Investment securities: | | |
Unaffiliated issuers | 389,733,911 | |
Foreign currency transactions | 578,417 | |
Total net realized gain (loss) | | 390,312,328 |
Change in net unrealized appreciation (depreciation) on: Investment securities | 726,720,925 | |
Assets and liabilities in foreign currencies | 119,937 | |
Total change in net unrealized appreciation (depreciation) | | 726,840,862 |
Net gain (loss) | | 1,117,153,190 |
Net increase (decrease) in net assets resulting from operations | | $ 1,195,402,954 |
See accompanying notes which are an integral part of the financial statements.
Annual Report
Europe
Financial Statements - continued
Statement of Changes in Net Assets
| Year ended
October 31,
2007 | Year ended
October 31,
2006 |
Increase (Decrease) in Net Assets | | |
Operations | | |
Net investment income (loss) | $ 78,249,764 | $ 48,383,095 |
Net realized gain (loss) | 390,312,328 | 528,728,812 |
Change in net unrealized appreciation (depreciation) | 726,840,862 | 164,130,628 |
Net increase (decrease) in net assets resulting from operations | 1,195,402,954 | 741,242,535 |
Distributions to shareholders from net investment income | (44,655,948) | (20,654,281) |
Distributions to shareholders from net realized gain | (492,200,801) | (273,319,238) |
Total distributions | (536,856,749) | (293,973,519) |
Share transactions
Proceeds from sales of shares | 914,445,282 | 1,199,680,149 |
Reinvestment of distributions | 530,000,847 | 289,349,942 |
Cost of shares redeemed | (671,683,034) | (450,913,920) |
Net increase (decrease) in net assets resulting from share transactions | 772,763,095 | 1,038,116,171 |
Redemption fees | 50,173 | 66,135 |
Total increase (decrease) in net assets | 1,431,359,473 | 1,485,451,322 |
| | |
Net Assets | | |
Beginning of period | 4,033,263,044 | 2,547,811,722 |
End of period (including undistributed net investment income of $77,915,917 and undistributed net investment income of $47,287,901, respectively) | $ 5,464,622,517 | $ 4,033,263,044 |
Other Information Shares | | |
Sold | 22,065,177 | 30,327,952 |
Issued in reinvestment of distributions | 13,802,106 | 8,260,061 |
Redeemed | (16,050,210) | (11,647,553) |
Net increase (decrease) | 19,817,073 | 26,940,460 |
Financial Highlights
Years ended October 31, | 2007 | 2006 | 2005 | 2004 | 2003 |
Selected Per-Share Data | | | | | |
Net asset value, beginning of period | $ 42.31 | $ 37.26 | $ 30.42 | $ 24.37 | $ 18.31 |
Income from Investment Operations | | | | | |
Net investment income (loss) C | .69 | .58 | .33 | .09 | .29 |
Net realized and unrealized gain (loss) | 9.99 | 8.74 | 6.68 | 6.25 | 5.91 |
Total from investment operations | 10.68 | 9.32 | 7.01 | 6.34 | 6.20 |
Distributions from net investment income | (.46) | (.30) | (.09) | (.29) | (.14) |
Distributions from net realized gain | (5.07) | (3.97) | (.08) | - | - |
Total distributions | (5.53) | (4.27) | (.17) | (.29) | (.14) |
Redemption fees added to paid in capital C, G | - | - | - | - | - |
Net asset value, end of period | $ 47.46 | $ 42.31 | $ 37.26 | $ 30.42 | $ 24.37 |
Total Return A, B | 28.33% | 27.40% | 23.12% | 26.20% | 34.09% |
Ratios to Average Net Assets D, F | | | | | |
Expenses before reductions | 1.06% | 1.16% | 1.15% | 1.11% | 1.03% |
Expenses net of fee waivers, if any | 1.06% | 1.16% | 1.15% | 1.11% | 1.03% |
Expenses net of all reductions | 1.01% | 1.05% | 1.07% | 1.05% | .98% |
Net investment income (loss) | 1.65% | 1.48% | .95% | .32% | 1.44% |
Supplemental Data | | | | | |
Net assets, end of period (000 omitted) | $ 5,464,623 | $ 4,033,263 | $ 2,547,812 | $ 1,845,440 | $ 1,283,191 |
Portfolio turnover rate E | 100% | 127% | 99% | 106% | 162% |
ATotal returns would have been lower had certain expenses not been reduced during the periods shown. BTotal returns do not include the effect of the former contingent deferred sales charge. CCalculated based on average shares outstanding during the period. DFees and expenses of the underlying Fidelity Central Funds are not included in the Fund's expense ratio. The Fund indirectly bears its proportionate share of the expenses of any underlying Fidelity Central Funds. EAmount does not include the portfolio activity of any underlying Fidelity Central Funds. FExpense ratios reflect operating expenses of the Fund. Expenses before reductions do not reflect amounts reimbursed by the investment adviser or reductions from brokerage service arrangements or other expense offset arrangements and do not represent the amount paid by the Fund during periods when reimbursements or reductions occur. Expenses net of fee waivers reflect expenses after reimbursement by the investment adviser but prior to reductions from brokerage service arrangements or other expense offset arrangements. Expenses net of all reductions represent the net expenses paid by the Fund. GAmount represents less than $.01 per share. |
See accompanying notes which are an integral part of the financial statements.
Annual Report
Europe Capital Appreciation
Performance: The Bottom Line
Average annual total return reflects the change in the value of an investment, assuming reinvestment of the fund's dividend income and capital gains (the profits earned upon the sale of securities that have grown in value) and assuming a constant rate of performance each year. The $10,000 table and the fund's returns do not reflect the deduction of taxes that a shareholder would pay on fund distributions or the redemption of fund shares. During periods of reimbursement by Fidelity, a fund's total returns will be greater than it would be had the reimbursement not occurred. How a fund did yesterday is no guarantee of how it will do tomorrow.
Average Annual Total Returns
Periods ended October 31, 2007 | Past 1
year | Past 5
years | Past 10
years |
Fidelity Europe Capital Appreciation Fund | 29.95% | 24.90% | 12.41% |
$10,000 Over 10 Years
Let's say hypothetically that $10,000 was invested in Fidelity Europe Capital Appreciation Fund on October 31, 1997. The chart shows how the value of your investment would have changed, and also shows how the MSCI Europe Index performed over the same period.
Annual Report
Europe Capital Appreciation
Management's Discussion of Fund Performance
Comments from Melissa Reilly, Portfolio Manager of Fidelity® Europe Capital Appreciation Fund
Foreign stocks, with a large assist from a weak U.S. dollar, generally had higher returns for U.S. investors than domestic equities during the 12-month period ending October 31, 2007. The backdrop for global stocks was solid, with robust economic growth and relatively high corporate profitability worldwide. Developed international equity markets, as measured by the Morgan Stanley Capital InternationalSM Europe, Australasia, and Far East (MSCI® EAFE®) Index - a performance monitor of established markets outside the United States and Canada - rose 25.09%. In comparison, the Standard & Poor's 500SM Index, a gauge of U.S. stocks, was up 14.56%. Among countries making up at least 1% of the EAFE benchmark, Finland had the best showing, soaring nearly 69%, while Hong Kong gained roughly 66%. The United Kingdom and Japan, the two largest components of the index, both underperformed. Fallout from the credit crunch and concerns about export growth tempered UK stocks, while Japan struggled with a slowdown in consumer spending and sluggish domestic growth. Emerging markets were the period's big winners, advancing 68.33% as measured by the MSCI Emerging Markets index.
The fund posted a gain of 29.95% for the year, outpacing the 28.20% advance of its benchmark, the MSCI Europe index. Favorable stock picking was the primary driver of performance, but the fund also benefited from its big underweighting in the generally weak financials group. The best stock picks were in energy, consumer discretionary, industrials and health care, with such top contributors as Arcandor, the large German retailer; Actelion, an out-of-index Swiss biopharmaceuticals firm; and Royal Dutch Shell, the UK-listed integrated oil giant, which I added during the period. The major drag on relative performance came from the materials sector, where not owning some of the index's top-performing stocks, such as BHP Billiton, the UK-listed mining giant, detracted. In addition, weakening business fundamentals at UK cable and telecommunications firm Virgin Media drove down the price of this U.S.-listed stock, making it the period's biggest detractor. Big positions in cash and sovereign bonds also hurt. Virgin Media was not in the portfolio at period end.
The views expressed above reflect those of the portfolio manager(s) only through the end of the period as stated on the cover of this report and do not necessarily represent the views of Fidelity or any other person in the Fidelity organization. Any such views are subject to change at any time based upon market or other conditions and Fidelity disclaims any responsibility to update such views. These views may not be relied on as investment advice and, because investment decisions for a Fidelity fund are based on numerous factors, may not be relied on as an indication of trading intent on behalf of any Fidelity fund.
Annual Report
Europe Capital Appreciation
Investment Changes
Geographic Diversification (% of fund's net assets) |
As of October 31, 2007 |
| United Kingdom | 20.9% | |
| Germany | 19.4% | |
| France | 15.7% | |
| Switzerland | 13.3% | |
| Spain | 4.9% | |
| Italy | 3.3% | |
| Sweden | 2.8% | |
| Finland | 2.4% | |
| Greece | 2.2% | |
| Other | 15.1% | |

Percentages are adjusted for the effect of futures contracts, if applicable. |
|
As of April 30, 2007 |
| France | 16.7% | |
| United Kingdom | 13.4% | |
| United States of America | 12.7% | |
| Germany | 12.0% | |
| Switzerland | 10.8% | |
| Netherlands | 8.6% | |
| Italy | 4.5% | |
| Luxembourg | 4.4% | |
| Finland | 3.8% | |
| Other | 13.1% | |

Percentages are adjusted for the effect of futures contracts, if applicable. |
Asset Allocation |
| % of fund's
net assets | % of fund's net assets
6 months ago |
Stocks | 99.1 | 84.6 |
Bonds | 0.0 | 4.9 |
Short-Term Investments and Net Other Assets | 0.9 | 10.5 |
Top Ten Stocks as of October 31, 2007 |
| % of fund's
net assets | % of fund's net assets
6 months ago |
Royal Dutch Shell PLC Class A (United Kingdom) (United Kingdom, Oil, Gas & Consumable Fuels) | 3.7 | 0.0 |
Vodafone Group PLC (United Kingdom, Wireless Telecommunication Services) | 2.9 | 1.8 |
Roche Holding AG (participation certificate) (Switzerland, Pharmaceuticals) | 2.7 | 0.0 |
E.ON AG (Germany, Electric Utilities) | 2.3 | 2.9 |
Nestle SA (Reg.) (Switzerland, Food Products) | 2.3 | 2.9 |
Telefonica SA sponsored ADR (Spain, Diversified Telecommunication Services) | 2.2 | 0.0 |
Siemens AG (Reg.) (Germany, Industrial Conglomerates) | 1.9 | 0.0 |
HSBC Holdings PLC sponsored ADR (United Kingdom, Commercial Banks) | 1.8 | 0.0 |
ABB Ltd. (Reg.) (Switzerland, Electrical Equipment) | 1.7 | 0.0 |
AXA SA (France, Insurance) | 1.7 | 0.0 |
| 23.2 | |
Market Sectors as of October 31, 2007 |
| % of fund's
net assets | % of fund's net assets
6 months ago |
Financials | 24.7 | 14.2 |
Industrials | 10.7 | 7.2 |
Energy | 10.6 | 5.2 |
Consumer Discretionary | 10.2 | 17.3 |
Consumer Staples | 10.0 | 8.8 |
Materials | 8.6 | 12.3 |
Telecommunication Services | 7.4 | 0.0 |
Health Care | 7.0 | 12.3 |
Utilities | 7.0 | 4.8 |
Information Technology | 2.9 | 2.5 |
Annual Report
Europe Capital Appreciation
Investments October 31, 2007
Showing Percentage of Net Assets
Common Stocks - 98.7% |
| Shares | | Value |
Argentina - 0.5% |
Cresud S.A.C.I.F. y A. sponsored ADR | 287,300 | | $ 7,090,564 |
Australia - 1.1% |
CSL Ltd. | 454,944 | | 15,466,322 |
Austria - 0.8% |
voestalpine AG | 115,200 | | 10,359,592 |
Belgium - 1.9% |
Fortis | 404,100 | | 12,915,249 |
InBev SA | 138,500 | | 13,074,927 |
TOTAL BELGIUM | | 25,990,176 |
Bermuda - 1.2% |
Aquarius Platinum Ltd. (United Kingdom) | 143,100 | | 5,483,147 |
SeaDrill Ltd. (a) | 469,400 | | 11,174,108 |
TOTAL BERMUDA | | 16,657,255 |
Cyprus - 1.2% |
Bank of Cyprus Public Co. Ltd. | 829,600 | | 16,105,788 |
Finland - 2.4% |
Metso Corp. | 191,000 | | 11,611,205 |
Nokia Corp. sponsored ADR | 533,750 | | 21,200,550 |
TOTAL FINLAND | | 32,811,755 |
France - 15.7% |
Alcatel-Lucent SA sponsored ADR | 790,600 | | 7,660,914 |
Alstom SA | 70,300 | | 16,591,469 |
AXA SA | 514,700 | | 23,022,531 |
Bouygues SA | 126,200 | | 12,114,883 |
Cap Gemini SA | 153,500 | | 9,785,195 |
Eutelsat Communications | 296,664 | | 8,015,897 |
Groupe Danone | 169,200 | | 14,593,500 |
LVMH Moet Hennessy - Louis Vuitton | 92,600 | | 11,924,041 |
Pinault Printemps-Redoute SA | 58,300 | | 11,556,507 |
Remy Cointreau SA | 106,500 | | 8,185,467 |
Renault SA | 62,800 | | 10,545,120 |
Societe Generale Series A | 117,500 | | 19,798,750 |
Suez SA (France) | 234,000 | | 15,210,000 |
Total SA sponsored ADR | 213,500 | | 17,210,235 |
Veolia Environnement | 164,487 | | 14,691,735 |
Vinci SA | 166,600 | | 13,666,374 |
TOTAL FRANCE | | 214,572,618 |
Germany - 19.4% |
Adidas-Salomon AG | 176,900 | | 11,802,280 |
Allianz AG (Reg.) | 89,700 | | 20,272,200 |
Arcandor AG (a)(d) | 128,300 | | 4,126,559 |
Bayer AG | 219,466 | | 18,083,998 |
Continental AG | 73,400 | | 11,101,033 |
DaimlerChrysler AG | 142,900 | | 15,740,435 |
Deutsche Boerse AG | 72,500 | | 11,438,638 |
E.ON AG | 160,600 | | 31,365,180 |
|
| Shares | | Value |
Hochtief AG | 97,000 | | $ 13,394,258 |
Lanxess AG | 206,100 | | 10,292,662 |
Linde AG | 87,600 | | 11,084,746 |
MAN AG | 112,600 | | 20,098,217 |
Muenchener Rueckversicherungs-Gesellschaft AG (Reg.) | 92,300 | | 17,707,764 |
RWE AG | 144,700 | | 19,756,602 |
Siemens AG (Reg.) | 187,500 | | 25,569,375 |
SolarWorld AG (d) | 160,900 | | 10,914,300 |
Wacker Chemie AG | 46,800 | | 11,492,751 |
TOTAL GERMANY | | 264,240,998 |
Greece - 2.2% |
Bank of Piraeus | 461,437 | | 18,504,908 |
Cosmote Mobile Telecommunications SA | 342,400 | | 11,816,367 |
TOTAL GREECE | | 30,321,275 |
Ireland - 1.1% |
Anglo Irish Bank Corp. PLC | 432,800 | | 7,273,671 |
CRH PLC | 218,400 | | 8,334,448 |
TOTAL IRELAND | | 15,608,119 |
Italy - 2.9% |
IFIL Finanziaria di Partecipazioni SpA | 138,000 | | 1,573,284 |
Intesa Sanpaolo SpA | 2,423,300 | | 19,158,856 |
Prysmian SpA | 44,800 | | 1,287,156 |
Unicredito Italiano SpA | 1,987,000 | | 16,984,717 |
TOTAL ITALY | | 39,004,013 |
Luxembourg - 2.2% |
Acergy SA | 307,800 | | 8,907,732 |
ArcelorMittal SA (d) | 263,500 | | 21,149,438 |
TOTAL LUXEMBOURG | | 30,057,170 |
Netherlands - 2.0% |
Koninklijke Ahold NV | 572,880 | | 8,621,844 |
Nutreco Holding NV | 139,900 | | 9,556,698 |
SBM Offshore NV | 221,700 | | 8,531,044 |
TOTAL NETHERLANDS | | 26,709,586 |
Norway - 2.2% |
Marine Harvest ASA (a) | 10,232,000 | | 10,372,138 |
Petroleum Geo-Services ASA | 416,000 | | 12,247,834 |
Telenor ASA | 324,000 | | 7,603,200 |
TOTAL NORWAY | | 30,223,172 |
Spain - 4.9% |
Banco Santander Central Hispano SA | 744,400 | | 16,177,301 |
Compania de Distribucion Integral Logista SA | 88,800 | | 6,927,988 |
Inditex SA | 180,900 | | 13,458,215 |
Telefonica SA sponsored ADR | 303,500 | | 30,183,075 |
TOTAL SPAIN | | 66,746,579 |
Common Stocks - continued |
| Shares | | Value |
Sweden - 2.8% |
Atlas Copco AB (A Shares) | 611,000 | | $ 10,217,391 |
H&M Hennes & Mauritz AB (B Shares) | 215,350 | | 14,336,896 |
Investor AB (B Shares) | 320,800 | | 7,926,909 |
SSAB Svenskt Stal AB (B Shares) (d) | 212,000 | | 6,239,465 |
TOTAL SWEDEN | | 38,720,661 |
Switzerland - 13.3% |
ABB Ltd. (Reg.) | 777,893 | | 23,397,904 |
Actelion Ltd. (Reg.) (a) | 231,855 | | 11,519,689 |
Credit Suisse Group (Reg.) | 129,682 | | 8,779,471 |
Julius Baer Holding AG (Bearer) | 138,009 | | 11,938,619 |
Lindt & Spruengli AG | 390 | | 14,848,485 |
Nestle SA (Reg.) | 67,145 | | 31,020,990 |
Pargesa Holding SA | 70,307 | | 8,006,124 |
Roche Holding AG
(participation certificate) | 213,380 | | 36,466,642 |
Sonova Holding AG | 109,991 | | 12,344,669 |
Swiss Life Holding | 52,006 | | 14,367,539 |
UBS AG (Reg.) | 158,930 | | 8,532,952 |
TOTAL SWITZERLAND | | 181,223,084 |
United Kingdom - 20.9% |
3i Group plc | 384,965 | | 8,683,922 |
Barclays PLC | 328,400 | | 4,174,785 |
BG Group PLC | 1,152,400 | | 21,261,791 |
BP PLC | 1,198,800 | | 15,582,402 |
Burberry Group PLC | 643,400 | | 8,226,614 |
GlaxoSmithKline PLC | 420,400 | | 10,772,750 |
Gyrus Group PLC (a) | 1,060,400 | | 9,424,770 |
HSBC Holdings PLC sponsored ADR (d) | 251,200 | | 24,999,424 |
Man Group plc | 909,700 | | 11,120,913 |
Next PLC | 242,500 | | 11,132,065 |
Reckitt Benckiser Group PLC | 288,400 | | 16,722,789 |
Royal Bank of Scotland Group PLC | 707,500 | | 7,597,343 |
Royal Dutch Shell PLC Class A
(United Kingdom) | 1,167,500 | | 51,094,473 |
Scottish & Southern Energy PLC | 442,000 | | 14,298,708 |
Standard Chartered PLC
(United Kingdom) | 417,600 | | 16,200,823 |
Vodafone Group PLC | 3,535,400 | | 13,883,516 |
|
| Shares | | Value |
Vodafone Group PLC sponsored ADR | 643,450 | | $ 25,268,282 |
Xstrata PLC | 216,900 | | 15,544,107 |
TOTAL UNITED KINGDOM | | 285,989,477 |
TOTAL COMMON STOCKS (Cost $1,187,142,283) | 1,347,898,204 |
Nonconvertible Preferred Stocks - 0.4% |
| | | |
Italy - 0.4% |
Istituto Finanziario Industriale SpA (IFI) (a)
(Cost $2,587,620) | 129,911 | | 5,409,301 |
Money Market Funds - 3.7% |
| | | |
Fidelity Cash Central Fund, 4.97% (b) | 13,561,672 | | 13,561,672 |
Fidelity Securities Lending Cash Central Fund, 5.02% (b)(c) | 37,348,005 | | 37,348,005 |
TOTAL MONEY MARKET FUNDS (Cost $50,909,677) | 50,909,677 |
TOTAL INVESTMENT PORTFOLIO - 102.8% (Cost $1,240,639,580) | | 1,404,217,182 |
NET OTHER ASSETS - (2.8)% | | (38,767,848) |
NET ASSETS - 100% | $ 1,365,449,334 |
Legend |
(a) Non-income producing |
(b) Affiliated fund that is available only to investment companies and other accounts managed by Fidelity Investments. The rate quoted is the annualized seven-day yield of the fund at period end. A complete unaudited listing of the fund's holdings as of its most recent quarter end is available upon request. |
(c) Investment made with cash collateral received from securities on loan. |
(d) Security or a portion of the security is on loan at period end. |
Affiliated Central Funds |
Information regarding fiscal year to date income earned by the Fund from investments in Fidelity Central Funds is as follows: |
Fund | Income earned |
Fidelity Cash Central Fund | $ 3,200,042 |
Fidelity Securities Lending Cash Central Fund | 1,808,992 |
Total | $ 5,009,034 |
See accompanying notes which are an integral part of the financial statements.
Annual Report
Europe Capital Appreciation
Financial Statements
Statement of Assets and Liabilities
| October 31, 2007 |
| | |
Assets | | |
Investment in securities, at value (including securities loaned of $36,024,848) - See accompanying schedule: Unaffiliated issuers
(cost $1,189,729,903) | $ 1,353,307,505 | |
Fidelity Central Funds
(cost $50,909,677) | 50,909,677 | |
Total Investments
(cost $1,240,639,580) | | $ 1,404,217,182 |
Foreign currency held at value
(cost $10,878) | | 9,184 |
Receivable for fund shares sold | | 1,159,825 |
Dividends receivable | | 1,339,114 |
Distributions receivable from Fidelity Central Funds | | 68,818 |
Prepaid expenses | | 346 |
Other receivables | | 53,958 |
Total assets | | 1,406,848,427 |
| | |
Liabilities | | |
Payable for fund shares redeemed | $ 2,726,093 | |
Accrued management fee | 930,456 | |
Other affiliated payables | 275,657 | |
Other payables and accrued expenses | 118,882 | |
Collateral on securities loaned, at value | 37,348,005 | |
Total liabilities | | 41,399,093 |
| | |
Net Assets | | $ 1,365,449,334 |
Net Assets consist of: | | |
Paid in capital | | $ 936,289,384 |
Undistributed net investment income | | 28,948,128 |
Accumulated undistributed net realized gain (loss) on investments and foreign currency transactions | | 236,595,430 |
Net unrealized appreciation (depreciation) on investments and assets and liabilities in foreign currencies | | 163,616,392 |
Net Assets, for 41,811,260 shares outstanding | | $ 1,365,449,334 |
Net Asset Value, offering price and redemption price per share ($1,365,449,334 ÷ 41,811,260 shares) | | $ 32.66 |
Statement of Operations
| Year ended October 31, 2007 |
| | |
Investment Income | | |
Dividends | | $ 39,826,168 |
Interest | | 2,210,925 |
Income from Fidelity Central Funds (including $1,808,992 from security lending) | | 5,009,034 |
| | 47,046,127 |
Less foreign taxes withheld | | (3,513,886) |
Total income | | 43,532,241 |
| | |
Expenses | | |
Management fee
Basic fee | $ 9,799,429 | |
Performance adjustment | 689,559 | |
Transfer agent fees | 2,861,794 | |
Accounting and security lending fees | 637,071 | |
Custodian fees and expenses | 274,828 | |
Independent trustees' compensation | 4,691 | |
Registration fees | 86,190 | |
Audit | 61,210 | |
Legal | 12,018 | |
Interest | 20,479 | |
Miscellaneous | 40,581 | |
Total expenses before reductions | 14,487,850 | |
Expense reductions | (574,330) | 13,913,520 |
Net investment income (loss) | | 29,618,721 |
Realized and Unrealized Gain (Loss) Net realized gain (loss) on: | | |
Investment securities: | | |
Unaffiliated issuers | 240,478,861 | |
Foreign currency transactions | 612,200 | |
Total net realized gain (loss) | | 241,091,061 |
Change in net unrealized appreciation (depreciation) on: Investment securities | 70,501,808 | |
Assets and liabilities in foreign currencies | 11,773 | |
Total change in net unrealized appreciation (depreciation) | | 70,513,581 |
Net gain (loss) | | 311,604,642 |
Net increase (decrease) in net assets resulting from operations | | $ 341,223,363 |
See accompanying notes which are an integral part of the financial statements.
Annual Report
Europe Capital Appreciation
Financial Statements - continued
Statement of Changes in Net Assets
| Year ended
October 31,
2007 | Year ended
October 31,
2006 |
Increase (Decrease) in Net Assets | | |
Operations | | |
Net investment income (loss) | $ 29,618,721 | $ 10,698,160 |
Net realized gain (loss) | 241,091,061 | 112,082,857 |
Change in net unrealized appreciation (depreciation) | 70,513,581 | 56,483,312 |
Net increase (decrease) in net assets resulting from operations | 341,223,363 | 179,264,329 |
Distributions to shareholders from net investment income | (9,391,804) | (6,124,444) |
Distributions to shareholders from net realized gain | (96,052,488) | (53,486,694) |
Total distributions | (105,444,292) | (59,611,138) |
Share transactions
Proceeds from sales of shares | 712,149,877 | 647,405,817 |
Reinvestment of distributions | 99,678,932 | 55,944,039 |
Cost of shares redeemed | (752,725,822) | (245,527,974) |
Net increase (decrease) in net assets resulting from share transactions | 59,102,987 | 457,821,882 |
Redemption fees | 102,889 | 201,750 |
Total increase (decrease) in net assets | 294,984,947 | 577,676,823 |
| | |
Net Assets | | |
Beginning of period | 1,070,464,387 | 492,787,564 |
End of period (including undistributed net investment income of $28,948,128 and undistributed net investment income of $10,571,012, respectively) | $ 1,365,449,334 | $ 1,070,464,387 |
Other Information Shares | | |
Sold | 25,057,625 | 24,922,851 |
Issued in reinvestment of distributions | 3,751,559 | 2,608,114 |
Redeemed | (25,963,364) | (9,853,075) |
Net increase (decrease) | 2,845,820 | 17,677,890 |
Financial Highlights
Years ended October 31, | 2007 | 2006 | 2005 | 2004 | 2003 |
Selected Per-Share Data | | | | | |
Net asset value, beginning of period | $ 27.47 | $ 23.15 | $ 19.63 | $ 17.26 | $ 13.85 |
Income from Investment Operations | | | | | |
Net investment income (loss) B | .62 | .38 E | .37 | .13 F | .14 |
Net realized and unrealized gain (loss) | 7.04 | 6.85 | 3.38 | 2.46 | 3.46 |
Total from investment operations | 7.66 | 7.23 | 3.75 | 2.59 | 3.60 |
Distributions from net investment income | (.22) | (.30) | (.17) | (.22) | (.19) |
Distributions from net realized gain | (2.25) | (2.62) | (.06) | - | - |
Total distributions | (2.47) | (2.92) | (.23) | (.22) | (.19) |
Redemption fees added to paid in capital B | - H | .01 | - H | - H | - H |
Net asset value, end of period | $ 32.66 | $ 27.47 | $ 23.15 | $ 19.63 | $ 17.26 |
Total Return A | 29.95% | 34.81% | 19.24% | 15.13% | 26.36% |
Ratios to Average Net Assets C, G | | | | | |
Expenses before reductions | 1.05% | 1.09% | .95% | 1.22% | 1.39% |
Expenses net of fee waivers, if any | 1.05% | 1.09% | .95% | 1.22% | 1.39% |
Expenses net of all reductions | 1.01% | .99% | .84% | 1.15% | 1.32% |
Net investment income (loss) | 2.15% | 1.51% E | 1.66% | .69% F | .94% |
Supplemental Data | | | | | |
Net assets, end of period (000 omitted) | $ 1,365,449 | $ 1,070,464 | $ 492,788 | $ 407,362 | $ 394,015 |
Portfolio turnover rate D | 161% | 143% | 133% | 119% | 184% |
A Total returns would have been lower had certain expenses not been reduced during the periods shown. B Calculated based on average shares outstanding during the period. CFees and expenses of the underlying Fidelity Central Funds are not included in the Fund's expense ratio. The Fund indirectly bears its proportionate share of the expenses of any underlying Fidelity Central Funds. DAmount does not include the portfolio activity of any underlying Fidelity Central Funds. EInvestment income per share reflects a special dividend which amounted to $.11 per share. Excluding the special dividend, the ratio of net investment income (loss) to average net assets would have been 1.06%. FNet investment income per share includes approximately $.01 per share received as a result of a reorganization of an issuer that was in bankruptcy. Excluding this non-recurring amount, the ratio of net investment income (loss) to average net assets would have been .65%. GExpense ratios reflect operating expenses of the Fund. Expenses before reductions do not reflect amounts reimbursed by the investment adviser or reductions from brokerage service arrangements or other expense offset arrangements and do not represent the amount paid by the Fund during periods when reimbursements or reductions occur. Expenses net of fee waivers reflect expenses after reimbursement by the investment adviser but prior to reductions from brokerage service arrangements or other expense offset arrangements. Expenses net of all reductions represent the net expenses paid by the Fund. HAmount represents less than $.01 per share. |
See accompanying notes which are an integral part of the financial statements.
Annual Report
Japan
Performance: The Bottom Line
Average annual total return reflects the change in the value of an investment, assuming reinvestment of the fund's dividend income and capital gains (the profits earned upon the sale of securities that have grown in value) and assuming a constant rate of performance each year. The $10,000 table and the fund's returns do not reflect the deduction of taxes that a shareholder would pay on fund distributions or the redemption of fund shares. During periods of reimbursement by Fidelity, a fund's total returns will be greater than it would be had the reimbursement not occurred. How a fund did yesterday is no guarantee of how it will do tomorrow.
Average Annual Total Returns
Periods ended October 31, 2007 | Past 1
year | Past 5
years | Past 10
years |
Fidelity Japan Fund | 8.36% | 17.28% | 8.01% |
$10,000 Over 10 Years
Let's say hypothetically that $10,000 was invested in Fidelity Japan Fund on October 31, 1997. The chart shows how the value of your investment would have changed, and also shows how the TOPIX performed over the same period.
Annual Report
Japan
Management's Discussion of Fund Performance
Comments from Robert Rowland, Portfolio Manager of Fidelity® Japan Fund
Despite opening with a four-month winning streak, the Japanese stock market - as measured by the Tokyo Stock Exchange Stock Price Index (TOPIX) - gained only 3.07% for the 12-month period ending October 31, 2007, a relatively meager result compared with much of the rest of the world. Japanese equities faced a number of head winds during the past year. Although an appreciation of the yen later in the period provided a small boost in returns for U.S. investors, it also increased prices of Japanese exports, raising fears that reduced demand for Japanese products would dampen economic growth. Meanwhile, concerns that Japanese financial institutions would become embroiled in the U.S. subprime crisis contributed to a nearly 15% decline in the financials sector of the TOPIX, the benchmark's largest component. The political backdrop was a distraction as well, particularly after Prime Minister Shinzo Abe's September announcement of his plans to resign from office. On the positive side, the business environment in Japan continued to improve in the form of corporate governance reforms, but economic growth remained anemic amid weaker-than-expected corporate spending.
During the past year, the fund returned 8.36%, more than doubling the return of the TOPIX. Stock selection and a large overweighting in the strong-performing information technology sector aided performance the most versus the index. Stock picking and overweightings also helped in industrials and materials, and underweighting the weak-performing financials sector added value as well. Video game maker Nintendo, the fund's top contributor, benefited from its fast-selling Wii console, among other factors. Other contributors included trading conglomerate Mitsui & Co., metals producer Sumitomo Metal Mining and Mitsui Engineering & Shipbuilding. The last two stocks in that list were sold during the period. Underweighting poorly performing Mitsubishi UFJ Financial Group, Japan's largest banking group and a major index component, helped as well. Conversely, within consumer discretionary, my picks in the consumer durables and apparel segment hurt, as did an overweighting and unrewarding stock picks in the automobiles and components group. Bank stock Mizuho Financial fared poorly due in part to weakness at the company's consumer finance subsidiaries and the U.S. subprime mortgage crisis. Casio Computer, a maker of digital cameras and other electronic devices, also detracted, as did automaker Toyota Motor and cellular service provider NTT DoCoMo.
The views expressed above reflect those of the portfolio manager(s) only through the end of the period as stated on the cover of this report and do not necessarily represent the views of Fidelity or any other person in the Fidelity organization. Any such views are subject to change at any time based upon market or other conditions and Fidelity disclaims any responsibility to update such views. These views may not be relied on as investment advice and, because investment decisions for a Fidelity fund are based on numerous factors, may not be relied on as an indication of trading intent on behalf of any Fidelity fund.
Annual Report
Japan
Investment Changes
Geographic Diversification (% of fund's net assets) |
As of October 31, 2007 |
| Japan | 98.2% | |
| United States of America | 1.8% | |

Percentages are adjusted for the effect of futures contracts, if applicable. |
|
As of April 30, 2007 |
| Japan | 98.6% | |
| United States of America | 1.4% | |

Percentages are adjusted for the effect of futures contracts, if applicable. |
Asset Allocation |
| % of fund's
net assets | % of fund's net assets
6 months ago |
Stocks | 98.2 | 98.6 |
Short-Term Investments and Net Other Assets | 1.8 | 1.4 |
Top Ten Stocks as of October 31, 2007 |
| % of fund's
net assets | % of fund's net assets
6 months ago |
Toyota Motor Corp. (Automobiles) | 7.5 | 5.7 |
Canon, Inc. (Office Electronics) | 4.0 | 3.4 |
Honda Motor Co. Ltd. (Automobiles) | 3.6 | 2.4 |
Mitsui & Co. Ltd. (Trading Companies & Distributors) | 3.2 | 2.5 |
Mizuho Financial Group, Inc. (Commercial Banks) | 3.2 | 2.7 |
Sumitomo Corp. (Trading Companies & Distributors) | 2.5 | 2.3 |
Nintendo Co. Ltd. (Software) | 2.4 | 3.9 |
Sumitomo Mitsui Financial Group, Inc. (Commercial Banks) | 2.3 | 2.4 |
Mitsubishi Corp. (Trading Companies & Distributors) | 2.3 | 0.5 |
Nippon Electric Glass Co. Ltd. (Electronic Equipment & Instruments) | 2.3 | 1.7 |
| 33.3 | |
Market Sectors as of October 31, 2007 |
| % of fund's
net assets | % of fund's net assets
6 months ago |
Industrials | 26.5 | 21.5 |
Consumer Discretionary | 21.5 | 20.7 |
Financials | 18.9 | 18.0 |
Information Technology | 17.4 | 18.9 |
Materials | 8.4 | 9.2 |
Health Care | 2.4 | 2.7 |
Telecommunication Services | 2.3 | 4.5 |
Consumer Staples | 0.8 | 1.3 |
Utilities | 0.0 | 1.1 |
Energy | 0.0 | 0.7 |
Annual Report
Japan
Investments October 31, 2007
Showing Percentage of Net Assets
Common Stocks - 98.2% |
| Shares | | Value |
CONSUMER DISCRETIONARY - 21.5% |
Auto Components - 4.4% |
Bridgestone Corp. | 490,200 | | $ 10,853,307 |
Denso Corp. | 655,700 | | 26,643,643 |
NGK Spark Plug Co. Ltd. | 365,000 | | 6,142,310 |
NHK Spring Co. Ltd. | 768,000 | | 6,597,009 |
Stanley Electric Co. Ltd. | 1,061,800 | | 23,618,618 |
Toyoda Gosei Co. Ltd. | 141,700 | | 5,090,892 |
| | 78,945,779 |
Automobiles - 12.2% |
Honda Motor Co. Ltd. | 1,730,200 | | 64,761,385 |
Isuzu Motors Ltd. | 1,474,000 | | 7,349,940 |
Toyota Motor Corp. | 2,313,900 | | 132,401,355 |
Yamaha Motor Co. Ltd. | 447,900 | | 12,792,802 |
| | 217,305,482 |
Household Durables - 1.9% |
Casio Computer Co. Ltd. | 1,341,100 | | 12,647,967 |
Haseko Corp. (a) | 8,479,000 | | 20,427,389 |
| | 33,075,356 |
Media - 0.6% |
Fuji Television Network, Inc. | 5,159 | | 10,420,864 |
Multiline Retail - 0.9% |
Marui Group Co. Ltd. | 724,000 | | 7,511,995 |
Mitsukoshi Ltd. | 1,870,000 | | 8,668,108 |
| | 16,180,103 |
Specialty Retail - 1.5% |
Yamada Denki Co. Ltd. | 257,830 | | 26,588,638 |
TOTAL CONSUMER DISCRETIONARY | | 382,516,222 |
CONSUMER STAPLES - 0.8% |
Food & Staples Retailing - 0.8% |
Aeon Co. Ltd. | 939,300 | | 14,789,097 |
FINANCIALS - 18.9% |
Capital Markets - 3.0% |
Daiwa Securities Group, Inc. | 863,000 | | 8,318,576 |
Matsui Securities Co. Ltd. (d) | 2,098,100 | | 16,673,909 |
Nomura Holdings, Inc. | 1,571,800 | | 28,025,195 |
| | 53,017,680 |
Commercial Banks - 8.3% |
Chiba Bank Ltd. | 471,000 | | 3,781,186 |
Mitsubishi UFJ Financial Group, Inc. | 2,390,600 | | 23,810,376 |
Mizuho Financial Group, Inc. | 9,961 | | 55,997,391 |
Sumitomo Mitsui Financial Group, Inc. | 5,074 | | 41,571,789 |
Sumitomo Trust & Banking Co. Ltd. | 3,012,000 | | 22,462,346 |
| | 147,623,088 |
Consumer Finance - 1.0% |
Credit Saison Co. Ltd. | 542,300 | | 17,295,794 |
|
| Shares | | Value |
Insurance - 2.2% |
Millea Holdings, Inc. | 296,900 | | $ 11,656,294 |
T&D Holdings, Inc. | 468,750 | | 28,218,383 |
| | 39,874,677 |
Real Estate Management & Development - 4.4% |
Leopalace21 Corp. | 868,000 | | 27,715,091 |
Mitsubishi Estate Co. Ltd. | 887,000 | | 26,596,498 |
Mitsui Fudosan Co. Ltd. | 321,000 | | 8,882,062 |
Tokyo Tatemono Co. Ltd. | 616,000 | | 7,926,654 |
Tokyu Land Corp. | 755,000 | | 7,823,610 |
| | 78,943,915 |
TOTAL FINANCIALS | | 336,755,154 |
HEALTH CARE - 2.4% |
Health Care Equipment & Supplies - 0.2% |
Olympus Corp. | 84,000 | | 3,498,911 |
Pharmaceuticals - 2.2% |
Daiichi Sankyo Co. Ltd. | 305,000 | | 8,675,477 |
Takeda Pharmaceutical Co. Ltd. | 501,400 | | 31,326,480 |
| | 40,001,957 |
TOTAL HEALTH CARE | | 43,500,868 |
INDUSTRIALS - 26.5% |
Building Products - 1.6% |
Asahi Glass Co. Ltd. | 2,056,000 | | 28,320,836 |
Commercial Services & Supplies - 0.5% |
Dai Nippon Printing Co. Ltd. | 673,000 | | 9,771,781 |
Construction & Engineering - 1.0% |
JGC Corp. | 902,000 | | 18,067,219 |
Electrical Equipment - 4.0% |
Mitsubishi Electric Corp. | 2,910,000 | | 35,486,085 |
Sumitomo Electric Industries Ltd. | 2,233,800 | | 36,173,685 |
| | 71,659,770 |
Machinery - 9.7% |
Fanuc Ltd. | 109,800 | | 12,038,835 |
Kubota Corp. | 3,586,000 | | 30,112,329 |
Mitsubishi Heavy Industries Ltd. | 2,762,000 | | 16,088,844 |
Nabtesco Corp. | 462,000 | | 7,900,076 |
NGK Insulators Ltd. | 474,000 | | 16,807,449 |
NSK Ltd. | 2,822,000 | | 25,025,928 |
OSG Corp. | 599,100 | | 7,580,640 |
SMC Corp. | 105,200 | | 14,094,855 |
Sumitomo Heavy Industries Ltd. | 1,079,000 | | 14,257,586 |
THK Co. Ltd. | 597,700 | | 13,183,109 |
Toshiba Machine Co. Ltd. (d) | 1,940,000 | | 14,820,988 |
| | 171,910,639 |
Road & Rail - 0.8% |
East Japan Railway Co. | 1,718 | | 14,154,870 |
Trading Companies & Distributors - 8.0% |
Mitsubishi Corp. | 1,324,700 | | 41,253,984 |
Common Stocks - continued |
| Shares | | Value |
INDUSTRIALS - continued |
Trading Companies & Distributors - continued |
Mitsui & Co. Ltd. | 2,212,000 | | $ 57,387,431 |
Sumitomo Corp. | 2,498,200 | | 43,537,847 |
| | 142,179,262 |
Transportation Infrastructure - 0.9% |
Mitsui-Soko Co. Ltd. (d) | 791,000 | | 3,811,891 |
The Sumitomo Warehouse Co. Ltd. (d) | 2,000,000 | | 11,526,490 |
| | 15,338,381 |
TOTAL INDUSTRIALS | | 471,402,758 |
INFORMATION TECHNOLOGY - 17.4% |
Electronic Equipment & Instruments - 7.9% |
Citizen Holdings Co. Ltd. | 320,700 | | 3,455,526 |
Dainippon Screen Manufacturing Co. Ltd. | 3,607,000 | | 21,449,593 |
Fujifilm Holdings Corp. | 158,700 | | 7,608,078 |
Kyocera Corp. | 87,300 | | 7,462,404 |
Murata Manufacturing Co. Ltd. | 157,500 | | 9,587,059 |
Nidec Sankyo Corp. (d) | 1,108,000 | | 8,667,674 |
Nippon Electric Glass Co. Ltd. | 2,407,000 | | 40,919,727 |
Omron Corp. | 286,400 | | 7,045,474 |
Yaskawa Electric Corp. | 1,908,000 | | 25,673,272 |
Yokogawa Electric Corp. | 682,600 | | 8,602,303 |
| | 140,471,110 |
IT Services - 0.1% |
Nomura Research Institute Ltd. | 63,800 | | 2,255,654 |
Office Electronics - 6.1% |
Canon, Inc. | 1,405,200 | | 71,060,963 |
Konica Minolta Holdings, Inc. | 2,130,500 | | 37,303,721 |
| | 108,364,684 |
Semiconductors & Semiconductor Equipment - 0.9% |
Advantest Corp. (d) | 228,100 | | 6,619,087 |
Rohm Co. Ltd. | 106,400 | | 9,323,776 |
| | 15,942,863 |
Software - 2.4% |
Nintendo Co. Ltd. | 68,400 | | 42,955,200 |
TOTAL INFORMATION TECHNOLOGY | | 309,989,511 |
MATERIALS - 8.4% |
Chemicals - 3.6% |
JSR Corp. | 774,300 | | 20,109,696 |
Mitsubishi Rayon Co. Ltd. | 1,377,000 | | 7,815,948 |
Nitto Denko Corp. | 390,600 | | 19,073,092 |
|
| Shares | | Value |
Shin-Etsu Chemical Co. Ltd. | 101,400 | | $ 6,505,820 |
Sumitomo Bakelite Co. Ltd. | 1,542,000 | | 9,457,699 |
| | 62,962,255 |
Metals & Mining - 4.8% |
Hitachi Metals Ltd. (d) | 1,648,000 | | 21,383,301 |
JFE Holdings, Inc. | 306,500 | | 17,945,920 |
Nippon Steel Corp. | 2,663,000 | | 17,703,520 |
Sumitomo Metal Industries Ltd. | 5,781,000 | | 28,619,901 |
| | 85,652,642 |
TOTAL MATERIALS | | 148,614,897 |
TELECOMMUNICATION SERVICES - 2.3% |
Wireless Telecommunication Services - 2.3% |
KDDI Corp. | 1,729 | | 13,061,410 |
NTT DoCoMo, Inc. | 18,602 | | 27,158,920 |
| | 40,220,330 |
TOTAL COMMON STOCKS (Cost $1,655,130,228) | 1,747,788,837 |
Money Market Funds - 3.2% |
| | | |
Fidelity Cash Central Fund, 4.97% (b) | 27,990,255 | | 27,990,255 |
Fidelity Securities Lending Cash Central Fund, 5.02% (b)(c) | 27,764,961 | | 27,764,961 |
TOTAL MONEY MARKET FUNDS (Cost $55,755,216) | 55,755,216 |
TOTAL INVESTMENT PORTFOLIO - 101.4% (Cost $1,710,885,444) | | 1,803,544,053 |
NET OTHER ASSETS - (1.4)% | | (24,093,179) |
NET ASSETS - 100% | $ 1,779,450,874 |
Legend |
(a) Non-income producing |
(b) Affiliated fund that is available only to investment companies and other accounts managed by Fidelity Investments. The rate quoted is the annualized seven-day yield of the fund at period end. A complete unaudited listing of the fund's holdings as of its most recent quarter end is available upon request. |
(c) Investment made with cash collateral received from securities on loan. |
(d) Security or a portion of the security is on loan at period end. |
Affiliated Central Funds |
Information regarding fiscal year to date income earned by the Fund from investments in Fidelity Central Funds is as follows: |
Fund | Income earned |
Fidelity Cash Central Fund | $ 917,374 |
Fidelity Securities Lending Cash Central Fund | 487,331 |
Total | $ 1,404,705 |
See accompanying notes which are an integral part of the financial statements.
Annual Report
Japan
Financial Statements
Statement of Assets and Liabilities
| October 31, 2007 |
| | |
Assets | | |
Investment in securities, at value (including securities loaned of $26,339,040) - See accompanying schedule: Unaffiliated issuers (cost $1,655,130,228) | $ 1,747,788,837 | |
Fidelity Central Funds (cost $55,755,216) | 55,755,216 | |
Total Investments (cost $1,710,885,444) | | $ 1,803,544,053 |
Receivable for investments sold | | 24,675,120 |
Receivable for fund shares sold | | 1,016,016 |
Dividends receivable | | 8,002,693 |
Distributions receivable from Fidelity Central Funds | | 183,287 |
Prepaid expenses | | 789 |
Other receivables | | 55,870 |
Total assets | | 1,837,477,828 |
| | |
Liabilities | | |
Payable for investments purchased | $ 26,034,746 | |
Payable for fund shares redeemed | 2,452,774 | |
Accrued management fee | 1,275,042 | |
Other affiliated payables | 376,301 | |
Other payables and accrued expenses | 123,130 | |
Collateral on securities loaned, at value | 27,764,961 | |
Total liabilities | | 58,026,954 |
| | |
Net Assets | | $ 1,779,450,874 |
Net Assets consist of: | | |
Paid in capital | | $ 1,424,454,737 |
Undistributed net investment income | | 3,817,643 |
Accumulated undistributed net realized gain (loss) on investments and foreign currency transactions | | 258,562,477 |
Net unrealized appreciation (depreciation) on investments and assets and liabilities in foreign currencies | | 92,616,017 |
Net Assets, for 98,876,352 shares outstanding | | $ 1,779,450,874 |
Net Asset Value, offering price and redemption price per share ($1,779,450,874 ÷ 98,876,352 shares) | | $ 18.00 |
Statement of Operations
| Year ended October 31, 2007 |
| | |
Investment Income | | |
Dividends | | $ 23,374,218 |
Interest | | 12,756 |
Income from Fidelity Central Funds (including $487,331 from security lending) | | 1,404,705 |
| | 24,791,679 |
Less foreign taxes withheld | | (1,636,106) |
Total income | | 23,155,573 |
| | |
Expenses | | |
Management fee
Basic fee | $ 12,648,301 | |
Performance adjustment | 1,432,366 | |
Transfer agent fees | 3,880,252 | |
Accounting and security lending fees | 810,739 | |
Custodian fees and expenses | 319,250 | |
Independent trustees' compensation | 6,122 | |
Registration fees | 37,629 | |
Audit | 73,352 | |
Miscellaneous | 26,242 | |
Total expenses before reductions | 19,234,253 | |
Expense reductions | (335,577) | 18,898,676 |
Net investment income (loss) | | 4,256,897 |
Realized and Unrealized Gain (Loss) Net realized gain (loss) on: | | |
Investment securities: | | |
Unaffiliated issuers | 259,159,703 | |
Foreign currency transactions | 65,206 | |
Total net realized gain (loss) | | 259,224,909 |
Change in net unrealized appreciation (depreciation) on: Investment securities | (123,168,633) | |
Assets and liabilities in foreign currencies | 7,196 | |
Total change in net unrealized appreciation (depreciation) | | (123,161,437) |
Net gain (loss) | | 136,063,472 |
Net increase (decrease) in net assets resulting from operations | | $ 140,320,369 |
See accompanying notes which are an integral part of the financial statements.
Annual Report
Japan
Financial Statements - continued
Statement of Changes in Net Assets
| Year ended
October 31,
2007 | Year ended
October 31,
2006 |
Increase (Decrease) in Net Assets | | |
Operations | | |
Net investment income (loss) | $ 4,256,897 | $ 1,415,844 |
Net realized gain (loss) | 259,224,909 | 89,269,693 |
Change in net unrealized appreciation (depreciation) | (123,161,437) | 21,910,399 |
Net increase (decrease) in net assets resulting from operations | 140,320,369 | 112,595,936 |
Distributions to shareholders from net investment income | (1,030,851) | (1,655,031) |
Distributions to shareholders from net realized gain | (23,709,588) | (827,515) |
Total distributions | (24,740,439) | (2,482,546) |
Share transactions
Proceeds from sales of shares | 480,536,650 | 1,451,989,405 |
Reinvestment of distributions | 22,903,100 | 2,233,026 |
Cost of shares redeemed | (603,458,144) | (878,409,948) |
Net increase (decrease) in net assets resulting from share transactions | (100,018,394) | 575,812,483 |
Redemption fees | 502,211 | 2,315,810 |
Total increase (decrease) in net assets | 16,063,747 | 688,241,683 |
| | |
Net Assets | | |
Beginning of period | 1,763,387,127 | 1,075,145,444 |
End of period (including undistributed net investment income of $3,817,643 and undistributed net investment income of $1,292,579, respectively) | $ 1,779,450,874 | $ 1,763,387,127 |
Other Information Shares | | |
Sold | 27,723,445 | 83,073,775 |
Issued in reinvestment of distributions | 1,371,443 | 136,493 |
Redeemed | (34,840,570) | (50,278,685) |
Net increase (decrease) | (5,745,682) | 32,931,583 |
Financial Highlights
Years ended October 31, | 2007 | 2006 | 2005 | 2004 | 2003 |
Selected Per-Share Data | | | | | |
Net asset value, beginning of period | $ 16.85 | $ 15.00 | $ 11.63 | $ 11.19 | $ 8.25 |
Income from Investment Operations | | | | | |
Net investment income (loss) C | .04 | .01 | .03 | (.01) | - G |
Net realized and unrealized gain (loss) | 1.35 | 1.85 | 3.34 | .45 | 2.93 |
Total from investment operations | 1.39 | 1.86 | 3.37 | .44 | 2.93 |
Distributions from net investment income | (.01) | (.02) | - | (.01) | - |
Distributions from net realized gain | (.23) | (.01) | - | - | - |
Total distributions | (.24) | (.03) | - | (.01) | - |
Redemption fees added to paid in capital C | - G | .02 | - G | .01 | .01 |
Net asset value, end of period | $ 18.00 | $ 16.85 | $ 15.00 | $ 11.63 | $ 11.19 |
Total Return A, B | 8.36% | 12.54% | 28.98% | 4.03% | 35.64% |
Ratios to Average Net Assets D, F | | | | | |
Expenses before reductions | 1.08% | 1.08% | 1.03% | 1.04% | 1.03% |
Expenses net of fee waivers, if any | 1.08% | 1.08% | 1.03% | 1.04% | 1.03% |
Expenses net of all reductions | 1.06% | 1.05% | 1.02% | 1.04% | 1.03% |
Net investment income (loss) | .24% | .08% | .20% | (.04)% | (.04)% |
Supplemental Data | | | | | |
Net assets, end of period (000 omitted) | $ 1,779,451 | $ 1,763,387 | $ 1,075,145 | $ 647,453 | $ 529,352 |
Portfolio turnover rate E | 158% | 78% | 74% | 99% | 86% |
A Total returns would have been lower had certain expenses not been reduced during the periods shown. B Total returns do not include the effect of the former sales charges. C Calculated based on average shares outstanding during the period. D Fees and expenses of the underlying Fidelity Central Funds are not included in the Fund's expense ratio. The Fund indirectly bears its proportionate share of the expenses of any underlying Fidelity Central Funds. E Amount does not include the portfolio activity of any underlying Fidelity Central Funds. F Expense ratios reflect operating expenses of the Fund. Expenses before reductions do not reflect amounts reimbursed by the investment adviser or reductions from brokerage service arrangements or other expense offset arrangements and do not represent the amount paid by the Fund during periods when reimbursements or reductions occur. Expenses net of fee waivers reflect expenses after reimbursement by the investment adviser but prior to reductions from brokerage service arrangements or other expense offset arrangements. Expenses net of all reductions represent the net expenses paid by the Fund. G Amount represents less than $.01 per share. |
See accompanying notes which are an integral part of the financial statements.
Annual Report
Japan Smaller Companies
Performance: The Bottom Line
Average annual total return reflects the change in the value of an investment, assuming reinvestment of the fund's dividend income and capital gains (the profits earned upon the sale of securities that have grown in value) and assuming a constant rate of performance each year. The $10,000 table and the fund's returns do not reflect the deduction of taxes that a shareholder would pay on fund distributions or the redemption of fund shares. During periods of reimbursement by Fidelity, a fund's total returns will be greater than it would be had the reimbursement not occurred. How a fund did yesterday is no guarantee of how it will do tomorrow.
Average Annual Total Returns
Periods ended October 31, 2007 | Past 1
year | Past 5
years | Past 10 years |
Fidelity Japan Smaller Companies Fund | -3.27% | 16.24% | 12.56% |
$10,000 Over 10 years
Let's say hypothetically that $10,000 was invested in Fidelity Japan Smaller Companies Fund on October 31, 1997. The chart shows how the value of your investment would have changed, and also shows how the Russell/Nomura Small Cap Index performed over the same period.
Annual Report
Japan Smaller Companies
Management's Discussion of Fund Performance
Comments from Kenichi Mizushita, Portfolio Manager of Fidelity® Japan Smaller Companies Fund
Despite opening with a four-month winning streak, the Japanese stock market - as measured by the Tokyo Stock Exchange Stock Price Index (TOPIX) - gained only 3.07% for the 12-month period ending October 31, 2007, a relatively meager result compared with much of the rest of the world. Japanese equities faced a number of head winds during the past year. Although an appreciation of the yen later in the period provided a small boost in returns for U.S. investors, it also increased prices of Japanese exports, raising fears that reduced demand for Japanese products would dampen economic growth. Meanwhile, concerns that Japanese financial institutions would become embroiled in the U.S. subprime crisis contributed to a nearly 15% decline in the financials sector of the TOPIX, the benchmark's largest component. The political backdrop was a distraction as well, particularly after Prime Minister Shinzo Abe's September announcement of his plans to resign from office. On the positive side, the business environment in Japan continued to improve in the form of corporate governance reforms, but economic growth remained anemic amid weaker-than-expected corporate spending.
For the 12 months ending October 31, 2007, the fund declined 3.27%. By comparison, the Russell/Nomura Small CapTM Index fell 2.95%. The fund's underperformance relative to the index was due primarily to poor stock selection in commercial services and supplies, automobiles and components, technology hardware and equipment, retailing, and consumer durables and apparel. Conversely, my choices within capital goods and financials benefited results. Individual detractors included regional construction company Token, whose share price fell sharply as rising costs eroded its earnings. Career Design Center, a large recruiting agency, saw its share price fall after it replaced more-experienced retirees with young sales staff, reducing the company's revenues. I sold the fund's position in this stock. Rising costs fueled concerns that retailer/diversified communications company Hikari Tsushin would be unable to meet its full-year targets. I sold this position from the portfolio as well. Contributors to performance included Hitachi Construction Machinery, the fund's largest holding and Japan's second-largest manufacturer of construction and mining machinery. The company benefited from strong export demand, particularly from China. Demand for electronic-parts producer NGK Insulators' products expanded, and its share price rose significantly.
The views expressed above reflect those of the portfolio manager(s) only through the end of the period as stated on the cover of this report and do not necessarily represent the views of Fidelity or any other person in the Fidelity organization. Any such views are subject to change at any time based upon market or other conditions and Fidelity disclaims any responsibility to update such views. These views may not be relied on as investment advice and, because investment decisions for a Fidelity fund are based on numerous factors, may not be relied on as an indication of trading intent on behalf of any Fidelity fund.
Annual Report
Japan Smaller Companies
Investment Changes
Geographic Diversification (% of fund's net assets) |
As of October 31, 2007 |
| Japan | 95.6% | |
| United States of America | 3.4% | |
 | Bermuda | 0.5% | |
| Cayman Islands | 0.5% | |

Percentages are adjusted for the effect of futures contracts, if applicable. |
|
As of April 30, 2007 |
| Japan | 98.1% | |
| United States of America | 1.6% | |
| Bermuda | 0.3% | |

Percentages are adjusted for the effect of futures contracts, if applicable. |
Asset Allocation |
| % of fund's
net assets | % of fund's net assets
6 months ago |
Stocks | 96.6 | 98.4 |
Short-Term Investments and Net Other Assets | 3.4 | 1.6 |
Top Ten Stocks as of October 31, 2007 |
| % of fund's
net assets | % of fund's net assets
6 months ago |
Hitachi Construction Machinery Co. Ltd. (Machinery) | 3.3 | 2.5 |
NGK Insulators Ltd. (Machinery) | 3.0 | 1.5 |
Kawasaki Kisen Kaisha Ltd. (Marine) | 2.5 | 0.0 |
Ibiden Co. Ltd. (Electronic Equipment & Instruments) | 2.5 | 0.8 |
C. Uyemura & Co. Ltd. (Chemicals) | 2.4 | 2.2 |
Itochu Corp. (Trading Companies & Distributors) | 2.1 | 1.4 |
Yamada Denki Co. Ltd. (Specialty Retail) | 2.1 | 1.6 |
Mitsui O.S.K. Lines Ltd. (Marine) | 2.1 | 0.0 |
Daikin Industries Ltd. (Building Products) | 2.1 | 0.0 |
Nippon Seiki Co. Ltd. (Auto Components) | 2.0 | 1.6 |
| 24.1 | |
Market Sectors as of October 31, 2007 |
| % of fund's
net assets | % of fund's net assets
6 months ago |
Industrials | 34.2 | 25.5 |
Consumer Discretionary | 18.9 | 24.0 |
Information Technology | 17.2 | 19.0 |
Financials | 9.0 | 9.3 |
Materials | 7.8 | 10.4 |
Health Care | 5.8 | 5.3 |
Consumer Staples | 1.9 | 3.9 |
Energy | 1.8 | 0.6 |
Utilities | 0.0 | 0.4 |
Annual Report
Japan Smaller Companies
Investments October 31, 2007
Showing Percentage of Net Assets
Common Stocks - 96.6% |
| Shares | | Value |
CONSUMER DISCRETIONARY - 18.9% |
Auto Components - 6.2% |
F-Tech, Inc. | 321,800 | | $ 7,653,528 |
Fuji Kiko Co. Ltd. (d) | 538,000 | | 1,254,440 |
H-One Co. Ltd. | 326,700 | | 3,766,515 |
Nippon Seiki Co. Ltd. | 712,000 | | 16,575,068 |
Nissin Kogyo Co. Ltd. | 123,300 | | 3,222,583 |
Toyota Boshoku Corp. | 406,600 | | 13,367,047 |
TS tech Co. Ltd. (d) | 85,500 | | 4,660,051 |
| | 50,499,232 |
Automobiles - 0.6% |
Isuzu Motors Ltd. | 500,000 | | 2,493,195 |
Yachiyo Industry Co. Ltd. | 190,600 | | 2,447,319 |
| | 4,940,514 |
Diversified Consumer Services - 0.5% |
Best Bridal, Inc. | 1,558 | | 4,051,175 |
Hotels, Restaurants & Leisure - 1.3% |
Accordia Golf Co. Ltd. | 1,204 | | 1,358,235 |
Kappa Create Co. Ltd. (d) | 232,300 | | 4,361,652 |
St. Marc Holdings Co. Ltd. | 31,100 | | 1,538,929 |
VIA Holdings, Inc. | 23,700 | | 167,047 |
Zensho Co. Ltd. (d) | 310,108 | | 3,158,073 |
| | 10,583,936 |
Household Durables - 3.0% |
Juki Corp. | 809,000 | | 6,907,398 |
Makita Corp. | 53,900 | | 2,597,290 |
Rinnai Corp. (d) | 100,000 | | 3,113,667 |
Token Corp. (d) | 250,150 | | 11,800,192 |
| | 24,418,547 |
Internet & Catalog Retail - 0.5% |
DeNA Co. Ltd. | 650 | | 4,072,337 |
Leisure Equipment & Products - 2.7% |
Namco Bandai Holdings, Inc. | 353,100 | | 5,445,156 |
Nikon Corp. (d) | 482,000 | | 15,471,579 |
Noritsu Koki Co. Ltd. (d) | 46,600 | | 958,891 |
Tamron Co. Ltd. | 10,400 | | 404,009 |
| | 22,279,635 |
Media - 1.0% |
Asia Media Co. Ltd. (d) | 448,000 | | 4,153,245 |
cyber communications, Inc. | 1,500 | | 1,177,933 |
Usen Corp. | 260,930 | | 2,394,547 |
| | 7,725,725 |
Specialty Retail - 2.6% |
I.K Co. Ltd. | 38 | | 41,204 |
K'S Denki Corp. | 165,900 | | 3,615,340 |
Village Vanguard Co. Ltd. | 110 | | 690,494 |
Yamada Denki Co. Ltd. | 165,060 | | 17,021,761 |
| | 21,368,799 |
|
| Shares | | Value |
Textiles, Apparel & Luxury Goods - 0.5% |
Seiren Co. Ltd. | 488,200 | | $ 3,844,214 |
TOTAL CONSUMER DISCRETIONARY | | 153,784,114 |
CONSUMER STAPLES - 1.9% |
Food & Staples Retailing - 1.2% |
Create SD Co. Ltd. | 89,900 | | 1,925,456 |
Daikokutenbussan Co. Ltd. | 183,500 | | 1,385,165 |
Valor Co. Ltd. | 582,600 | | 6,503,717 |
| | 9,814,338 |
Food Products - 0.7% |
Frente Co. Ltd. | 179,300 | | 3,099,542 |
Hokuto Corp. (d) | 134,500 | | 2,098,384 |
| | 5,197,926 |
TOTAL CONSUMER STAPLES | | 15,012,264 |
ENERGY - 1.8% |
Energy Equipment & Services - 1.0% |
Shinko Plantech Co. Ltd. | 517,000 | | 8,166,582 |
Oil, Gas & Consumable Fuels - 0.8% |
AOC Holdings, Inc. | 414,000 | | 6,356,705 |
TOTAL ENERGY | | 14,523,287 |
FINANCIALS - 9.0% |
Capital Markets - 0.4% |
Risa Partners, Inc. (d) | 1,446 | | 3,233,397 |
Commercial Banks - 3.3% |
Bank of Yokohama Ltd. | 1,144,000 | | 8,119,430 |
Chiba Bank Ltd. | 1,031,000 | | 8,276,864 |
The Keiyo Bank Ltd. | 1,025,000 | | 5,292,299 |
Tokyo Tomin Bank Ltd. (d) | 157,800 | | 5,253,365 |
| | 26,941,958 |
Diversified Financial Services - 1.5% |
Money Partners Co. Ltd. (d) | 3,080 | | 12,096,757 |
Real Estate Management & Development - 3.8% |
ARDEPRO CO., Ltd. (d) | 42,745 | | 14,372,639 |
Daiwasystem Co. Ltd. | 208,800 | | 5,859,250 |
Suruga Corp. | 91,100 | | 2,126,338 |
Urban Corp. | 489,000 | | 8,567,694 |
| | 30,925,921 |
TOTAL FINANCIALS | | 73,198,033 |
HEALTH CARE - 5.8% |
Health Care Equipment & Supplies - 3.9% |
Hogy Medical Co. (d) | 304,000 | | 13,375,955 |
Nakanishi, Inc. | 23,200 | | 2,937,051 |
Nipro Corp. | 159,000 | | 3,034,243 |
Sysmex Corp. (d) | 287,600 | | 11,782,756 |
| | 31,130,005 |
Common Stocks - continued |
| Shares | | Value |
HEALTH CARE - continued |
Life Sciences Tools & Services - 0.5% |
Shin Nippon Biomedical Laboratories Ltd. (d) | 264,900 | | $ 4,047,446 |
Pharmaceuticals - 1.4% |
Fuji Pharma Co. Ltd. | 156,700 | | 2,898,521 |
JCR Pharmaceuticals Co. Ltd. | 18,000 | | 67,520 |
Nichi-iko Pharmaceutical Co. Ltd. (d) | 252,500 | | 4,309,615 |
Sawai Pharmaceutical Co. Ltd. (d) | 71,400 | | 1,892,704 |
Towa Pharmaceutical Co. Ltd. (d) | 67,500 | | 2,358,606 |
| | 11,526,966 |
TOTAL HEALTH CARE | | 46,704,417 |
INDUSTRIALS - 34.2% |
Air Freight & Logistics - 1.2% |
Kintetsu World Express, Inc. | 165,600 | | 5,921,202 |
Yusen Air & Sea Service Co. Ltd. (d) | 200,600 | | 4,094,329 |
| | 10,015,531 |
Building Products - 2.6% |
Comany, Inc. | 247,200 | | 4,103,143 |
Daikin Industries Ltd. | 333,900 | | 16,820,865 |
| | 20,924,008 |
Commercial Services & Supplies - 2.1% |
Asahi Pretec Corp. | 128,600 | | 4,440,098 |
Benefit One, Inc. | 133 | | 127,423 |
China Boqi Environmental Solutions Technology (Holding) Co. Ltd. (d) | 2,196 | | 4,150,581 |
Intelligence Ltd. (d) | 2,604 | | 5,976,933 |
Nissha Printing Co. Ltd. (d) | 75,800 | | 2,184,341 |
| | 16,879,376 |
Electrical Equipment - 2.6% |
Daihen Corp. (a) | 686,000 | | 4,804,831 |
Endo Lighting Corp. | 99,500 | | 536,814 |
FCM Co. Ltd. | 16,900 | | 760,124 |
Iwabuchi Corp. | 40,000 | | 213,081 |
Nippon Carbon Co. Ltd. (d) | 1,334,000 | | 8,418,347 |
Sec Carbon Ltd. | 30,000 | | 511,962 |
Sumitomo Electric Industries Ltd. | 254,460 | | 4,120,671 |
Terasaki Electric Co. Ltd. | 88,000 | | 1,750,670 |
| | 21,116,500 |
Machinery - 13.7% |
Harmonic Drive Systems, Inc. | 387 | | 1,456,951 |
Hitachi Construction Machinery Co. Ltd. | 659,200 | | 27,043,373 |
Japan Steel Works Ltd. | 305,000 | | 4,990,126 |
Nabtesco Corp. | 277,000 | | 4,736,626 |
NGK Insulators Ltd. | 684,000 | | 24,253,788 |
NTN Corp. | 1,239,000 | | 11,781,359 |
Obara Corp. | 75 | | 1,461 |
Produce Co. Ltd. (a)(d) | 954 | | 3,662,873 |
Shima Seiki Manufacturing Ltd. (d) | 268,200 | | 13,737,735 |
|
| Shares | | Value |
Sumitomo Heavy Industries Ltd. | 766,000 | | $ 10,121,697 |
Taiho Kogyo Co. Ltd. | 446,900 | | 6,700,760 |
TCM Corp. | 821,000 | | 2,969,925 |
| | 111,456,674 |
Marine - 5.9% |
Daiichi Chuo Kisen Kaisha | 237,000 | | 1,981,031 |
Iino Kaiun Kaisha Ltd. (d) | 604,400 | | 8,557,291 |
Kawasaki Kinkai Kisen Kaisha Ltd. | 17,000 | | 105,597 |
Kawasaki Kisen Kaisha Ltd. | 1,448,000 | | 20,102,962 |
Mitsui O.S.K. Lines Ltd. | 1,021,000 | | 16,878,267 |
| | 47,625,148 |
Road & Rail - 0.5% |
Hamakyorex Co. Ltd. | 172,600 | | 3,658,085 |
Sankyu, Inc. | 72,000 | | 410,914 |
| | 4,068,999 |
Trading Companies & Distributors - 5.6% |
Itochu Corp. | 1,385,000 | | 17,505,386 |
JFE Shoji Holdings, Inc. | 613,000 | | 4,721,399 |
Marubeni Corp. | 1,855,000 | | 15,931,323 |
Meiji Electric Industries Co. Ltd. | 12,400 | | 106,884 |
Sojitz Corp. | 1,605,000 | | 7,369,108 |
| | 45,634,100 |
TOTAL INDUSTRIALS | | 277,720,336 |
INFORMATION TECHNOLOGY - 17.2% |
Communications Equipment - 0.0% |
Mitsui Knowledge Industry Co. Ltd. (d) | 1,753 | | 388,856 |
Electronic Equipment & Instruments - 11.0% |
Ferrotec Corp. | 22,100 | | 229,337 |
Furuno Electric Co. Ltd. | 54,500 | | 824,364 |
Hamamatsu Photonics KK (d) | 365,600 | | 11,498,134 |
Ibiden Co. Ltd. | 236,600 | | 20,059,761 |
Meiko Electronics Co. Ltd. (d) | 430,300 | | 14,980,205 |
Murata Manufacturing Co. Ltd. | 75,300 | | 4,583,527 |
Nagano Keiki Co. Ltd. (d) | 272,382 | | 3,629,340 |
Nihon Dempa Kogyo Co. Ltd. (d) | 27,400 | | 1,368,440 |
Nippon Electric Glass Co. Ltd. | 852,000 | | 14,484,257 |
Shibaura Electronics Co. Ltd. | 57,600 | | 1,449,273 |
Shizuki Electric Co., Inc. | 149,000 | | 557,651 |
Star Micronics Co. Ltd. | 298,700 | | 9,431,886 |
Sunx Ltd. (d) | 953,100 | | 5,816,136 |
| | 88,912,311 |
Internet Software & Services - 2.2% |
Telewave, Inc. | 10,411 | | 8,981,077 |
Yahoo! Japan Corp. | 19,959 | | 8,886,691 |
| | 17,867,768 |
IT Services - 1.3% |
Otsuka Corp. (d) | 112,000 | | 10,735,769 |
Semiconductors & Semiconductor Equipment - 1.3% |
Elpida Memory, Inc. (a) | 10,300 | | 355,375 |
Common Stocks - continued |
| Shares | | Value |
INFORMATION TECHNOLOGY - continued |
Semiconductors & Semiconductor Equipment - continued |
Micronics Japan Co. Ltd. (d) | 281,000 | | $ 7,687,686 |
United Technology Holdings Co. Ltd. | 1,293 | | 2,636,472 |
| | 10,679,533 |
Software - 1.4% |
AQ Interactive, Inc. (d) | 670 | | 4,369,265 |
Atlus Co. Ltd. | 92,200 | | 476,702 |
Celsys, Inc. | 679 | | 796,840 |
Works Applications Co. Ltd. (d) | 5,447 | | 5,754,412 |
| | 11,397,219 |
TOTAL INFORMATION TECHNOLOGY | | 139,981,456 |
MATERIALS - 7.8% |
Chemicals - 5.2% |
Adeka Corp. | 165,100 | | 1,655,046 |
C. Uyemura & Co. Ltd. (a) | 324,600 | | 19,745,497 |
Taiyo Kagaku Co. Ltd. | 237,400 | | 1,515,902 |
Tohcello Co. Ltd. (d) | 693,500 | | 5,058,640 |
Tokai Carbon Co. Ltd. | 1,149,000 | | 14,412,332 |
| | 42,387,417 |
Metals & Mining - 2.6% |
Chuo Denki Kogyo Co. Ltd. | 191,000 | | 2,022,624 |
Hitachi Metals Ltd. | 219,000 | | 2,841,592 |
Nippon Denko Co. Ltd. (d) | 1,243,000 | | 9,371,555 |
Toyo Kohan Co. Ltd. (d) | 778,000 | | 4,353,023 |
Yamato Kogyo Co. Ltd. | 51,900 | | 2,428,025 |
| | 21,016,819 |
TOTAL MATERIALS | | 63,404,236 |
TOTAL COMMON STOCKS (Cost $597,130,936) | 784,328,143 |
Money Market Funds - 12.2% |
| | | |
Fidelity Cash Central Fund, 4.97% (b) | 19,646,714 | | 19,646,714 |
Fidelity Securities Lending Cash Central Fund, 5.02% (b)(c) | 78,985,949 | | 78,985,949 |
TOTAL MONEY MARKET FUNDS (Cost $98,632,663) | 98,632,663 |
TOTAL INVESTMENT PORTFOLIO - 108.8% (Cost $695,763,599) | | 882,960,806 |
NET OTHER ASSETS - (8.8)% | | (71,307,882) |
NET ASSETS - 100% | $ 811,652,924 |
Legend |
(a) Non-income producing |
(b) Affiliated fund that is available only to investment companies and other accounts managed by Fidelity Investments. The rate quoted is the annualized seven-day yield of the fund at period end. A complete unaudited listing of the fund's holdings as of its most recent quarter end is available upon request. |
(c) Investment made with cash collateral received from securities on loan. |
(d) Security or a portion of the security is on loan at period end. |
Affiliated Central Funds |
Information regarding fiscal year to date income earned by the Fund from investments in Fidelity Central Funds is as follows: |
Fund | Income earned |
Fidelity Cash Central Fund | $ 936,347 |
Fidelity Securities Lending Cash Central Fund | 1,561,832 |
Total | $ 2,498,179 |
Other Affiliated Issuers |
An affiliated company is a company in which the fund has ownership of at least 5% of the voting securities. Fiscal year to date transactions with companies which are or were affiliates are as follows: |
Affiliate | Value, beginning of period | Purchases | Sales Proceeds | Dividend Income | Value,
end of
period |
Career Design Center Co. Ltd. | $ 9,006,840 | $ - | $ 1,875,638 | $ 15,766 | $ - |
See accompanying notes which are an integral part of the financial statements.
Annual Report
Japan Smaller Companies
Financial Statements
Statement of Assets and Liabilities
| October 31, 2007 |
| | |
Assets | | |
Investment in securities, at value (including securities loaned of $75,078,324) - See accompanying schedule: Unaffiliated issuers (cost $597,130,936) | $ 784,328,143 | |
Fidelity Central Funds (cost $98,632,663) | 98,632,663 | |
Total Investments (cost $695,763,599) | | $ 882,960,806 |
Foreign currency held at value (cost $11,197) | | 11,195 |
Receivable for investments sold | | 8,562,920 |
Receivable for fund shares sold | | 420,870 |
Dividends receivable | | 2,980,949 |
Distributions receivable from Fidelity Central Funds | | 257,444 |
Prepaid expenses | | 646 |
Other receivables | | 32,087 |
Total assets | | 895,226,917 |
| | |
Liabilities | | |
Payable for investments purchased | $ 2,378,125 | |
Payable for fund shares redeemed | 1,460,203 | |
Accrued management fee | 473,990 | |
Other affiliated payables | 169,090 | |
Other payables and accrued expenses | 106,636 | |
Collateral on securities loaned, at value | 78,985,949 | |
Total liabilities | | 83,573,993 |
| | |
Net Assets | | $ 811,652,924 |
Net Assets consist of: | | |
Paid in capital | | $ 597,114,822 |
Undistributed net investment income | | 1,918,752 |
Accumulated undistributed net realized gain (loss) on investments and foreign currency transactions | | 25,436,685 |
Net unrealized appreciation (depreciation) on investments and assets and liabilities in foreign currencies | | 187,182,665 |
Net Assets, for 64,266,837 shares outstanding | | $ 811,652,924 |
Net Asset Value, offering price and redemption price per share ($811,652,924 ÷ 64,266,837 shares) | | $ 12.63 |
Statement of Operations
| Year ended October 31, 2007 |
| | |
Investment Income | | |
Dividends (including $15,766 received from other affiliated issuers) | | $ 9,728,893 |
Interest | | 5,526 |
Income from Fidelity Central Funds (including $1,561,832 from security lending) | | 2,498,179 |
| | 12,232,598 |
Less foreign taxes withheld | | (681,023) |
Total income | | 11,551,575 |
| | |
Expenses | | |
Management fee | $ 6,665,526 | |
Transfer agent fees | 1,939,838 | |
Accounting and security lending fees | 460,385 | |
Custodian fees and expenses | 388,456 | |
Independent trustees' compensation | 3,342 | |
Registration fees | 30,391 | |
Audit | 59,400 | |
Miscellaneous | 18,144 | |
Total expenses before reductions | 9,565,482 | |
Expense reductions | (166,627) | 9,398,855 |
Net investment income (loss) | | 2,152,720 |
Realized and Unrealized Gain (Loss) Net realized gain (loss) on: | | |
Investment securities: | | |
Unaffiliated issuers | 33,783,078 | |
Other affiliated issuers | (6,852,522) | |
Foreign currency transactions | (247,751) | |
Total net realized gain (loss) | | 26,682,805 |
Change in net unrealized appreciation (depreciation) on: Investment securities | (71,679,900) | |
Assets and liabilities in foreign currencies | 36,937 | |
Total change in net unrealized appreciation (depreciation) | | (71,642,963) |
Net gain (loss) | | (44,960,158) |
Net increase (decrease) in net assets resulting from operations | | $ (42,807,438) |
See accompanying notes which are an integral part of the financial statements.
Annual Report
Statement of Changes in Net Assets
| Year ended
October 31,
2007 | Year ended
October 31,
2006 |
Increase (Decrease) in Net Assets | | |
Operations | | |
Net investment income (loss) | $ 2,152,720 | $ 1,483,059 |
Net realized gain (loss) | 26,682,805 | 72,603,100 |
Change in net unrealized appreciation (depreciation) | (71,642,963) | (136,387,455) |
Net increase (decrease) in net assets resulting from operations | (42,807,438) | (62,301,296) |
Distributions to shareholders from net investment income | (857,665) | (2,096,615) |
Distributions to shareholders from net realized gain | (30,875,932) | (87,009,291) |
Total distributions | (31,733,597) | (89,105,906) |
Share transactions
Proceeds from sales of shares | 82,370,930 | 937,781,955 |
Reinvestment of distributions | 27,705,629 | 81,250,595 |
Cost of shares redeemed | (441,231,069) | (1,059,732,471) |
Net increase (decrease) in net assets resulting from share transactions | (331,154,510) | (40,699,921) |
Redemption fees | 109,393 | 2,673,266 |
Total increase (decrease) in net assets | (405,586,152) | (189,433,857) |
| | |
Net Assets | | |
Beginning of period | 1,217,239,076 | 1,406,672,933 |
End of period (including undistributed net investment income of $1,918,752 and undistributed net investment income of $1,482,630, respectively) | $ 811,652,924 | $ 1,217,239,076 |
Other Information Shares | | |
Sold | 6,576,733 | 57,660,133 |
Issued in reinvestment of distributions | 2,141,084 | 5,471,421 |
Redeemed | (35,107,344) | (71,185,943) |
Net increase (decrease) | (26,389,527) | (8,054,389) |
Financial Highlights
Years ended October 31, | 2007 | 2006 | 2005 | 2004 | 2003 |
Selected Per-Share Data | | | | | |
Net asset value, beginning of period | $ 13.43 | $ 14.25 | $ 11.58 | $ 10.35 | $ 6.52 |
Income from Investment Operations | | | | | |
Net investment income (loss) C | .03 | .01 | .03 | .01 | .01 |
Net realized and unrealized gain (loss) | (.46) | - G | 2.69 | 1.20 | 3.81 |
Total from investment operations | (.43) | .01 | 2.72 | 1.21 | 3.82 |
Distributions from net investment income | (.01) | (.02) | (.01) | (.02) | - |
Distributions from net realized gain | (.36) | (.83) | (.05) | - | - |
Total distributions | (.37) | (.85) | (.06) | (.02) | - |
Redemption fees added to paid in capital C | - G | .02 | .01 | .04 | .01 |
Net asset value, end of period | $ 12.63 | $ 13.43 | $ 14.25 | $ 11.58 | $ 10.35 |
Total Return A, B | (3.27)% | (.36)% | 23.69% | 12.12% | 58.74% |
Ratios to Average Net Assets D, F | | | | | |
Expenses before reductions | 1.02% | 1.02% | 1.02% | 1.04% | 1.12% |
Expenses net of fee waivers, if any | 1.02% | 1.02% | 1.02% | 1.04% | 1.12% |
Expenses net of all reductions | 1.00% | 1.01% | 1.01% | 1.04% | 1.12% |
Net investment income (loss) | .23% | .09% | .22% | .11% | .19% |
Supplemental Data | | | | | |
Net assets, end of period (000 omitted) | $ 811,653 | $ 1,217,239 | $ 1,406,673 | $ 1,279,091 | $ 931,728 |
Portfolio turnover rate E | 76% | 98% | 65% | 57% | 43% |
A Total returns would have been lower had certain expenses not been reduced during the periods shown. B Total returns do not include the effect of the former sales charges. C Calculated based on average shares outstanding during the period. D Fees and expenses of the underlying Fidelity Central Funds are not included in the Fund's expense ratio. The Fund indirectly bears its proportionate share of the expenses of any underlying Fidelity Central Funds. E Amount does not include the portfolio activity of any underlying Fidelity Central Funds. F Expense ratios reflect operating expenses of the Fund. Expenses before reductions do not reflect amounts reimbursed by the investment adviser or reductions from brokerage service arrangements or other expense offset arrangements and do not represent the amount paid by the Fund during periods when reimbursements or reductions occur. Expenses net of fee waivers reflect expenses after reimbursement by the investment adviser but prior to reductions from brokerage service arrangements or other expense offset arrangements. Expenses net of all reductions represent the net expenses paid by the Fund. G Amount represents less than $.01 per share. |
See accompanying notes which are an integral part of the financial statements.
Annual Report
Latin America
Performance: The Bottom Line
Average annual total return reflects the change in the value of an investment, assuming reinvestment of the fund's dividend income and capital gains (the profits earned upon the sale of securities that have grown in value) and assuming a constant rate of performance each year. The $10,000 table and the fund's returns do not reflect the deduction of taxes that a shareholder would pay on fund distributions or the redemption of fund shares. During periods of reimbursement by Fidelity, a fund's total returns will be greater than it would be had the reimbursement not occurred. How a fund did yesterday is no guarantee of how it will do tomorrow.
Average Annual Total Returns
Periods ended October 31, 2007 | Past 1
year | Past 5
years | Past 10
years |
Fidelity Latin America Fund | 70.35% | 53.33% | 18.01% |
$10,000 Over 10 Years
Let's say hypothetically that $10,000 was invested in Fidelity Latin America Fund on October 31, 1997. The chart shows how the value of your investment would have changed, and also shows how the MSCI EM - Latin America Index performed over the same period.
Annual Report
Latin America
Management's Discussion of Fund Performance
Comments from Brent Bottamini, Portfolio Manager of Fidelity® Latin America Fund
Emerging-markets equities continued their sparkling multiyear performance, returning 68.33% as measured by the Morgan Stanley Capital
InternationalSM (MSCI®) Emerging Markets Index during the 12-month period ending October 31, 2007. On the whole, developing markets
benefited from brisk economic growth, the ongoing build-out of commercial and industrial infrastructure, and rising commodity prices.
China led the way with a superlative gain of roughly 168%, reflecting optimism about opportunities within the country's fast-growing economy.
Hong Kong surged higher for similar reasons, jumping more than 147%. Brazil, the third-largest component of the MSCI benchmark, rose 111%,
fueled largely by its exports of natural resources. However, three of the four largest country weightings in the index trailed its overall
return despite very strong absolute performance. South Korea - the index's biggest constituent with a weighting of about 16% on average during the
period - was a prime example. It gained almost 57% but still fell about 12 percentage points shy of the MSCI Emerging Markets index. Taiwan and
Russia also trailed, despite solid returns of approximately 40% and 33%, respectively.
For the 12 months ending October 31, 2007, the fund returned 70.35%, compared with 78.51% for the MSCI Emerging Markets - Latin America Index. The fund's performance relative to the index was held back by unfavorable security selection and an underweighting in the materials sector, as well as by less-than-successful stock selection and an overweighting in the consumer discretionary area. The fund's modest cash position also dampened returns in a market that posted very strong returns. On the positive side, good stock selection in telecommunication services buoyed relative performance, as did an underweighting in electric utilities. The weakening U.S. dollar also had a favorable effect on the performance of the fund's overseas stocks. Geographically, the fund lost ground through weak stock selection in Brazil and Mexico, but was helped by strong security selection in Chile and by overweighting Brazil. Individual detractors included Brazilian airline TAM, Mexican homebuilder Corporacion Geo, and underweighting three materials stocks that performed well - Companhia Vale do Rio Doce (CVRD) from Brazil, Grupo Mexico and Southern Copper, domiciled in the United States but with operations in Peru. Brazilian online retailer Submarino - merged with Americanas.com to form B2W - Chilean iron ore and steel producer CAP, Brazilian wood-products manufacturer Duratex, and an underweighting in Mexican cement producer Cemex contributed.
Note to shareholders: Fidelity Latin America Fund may invest up to 35% of its total assets in any industry that represents more than 20% of the Latin American market. As of October 31, 2007, the fund did not have more than 25% of its total assets invested in any one industry.
The views expressed above reflect those of the portfolio manager(s) only through the end of the period as stated on the cover of this report and do not necessarily represent the views of Fidelity or any other person in the Fidelity organization. Any such views are subject to change at any time based upon market or other conditions and Fidelity disclaims any responsibility to update such views. These views may not be relied on as investment advice and, because investment decisions for a Fidelity fund are based on numerous factors, may not be relied on as an indication of trading intent on behalf of any Fidelity fund.
Annual Report
Latin America
Investment Changes
Geographic Diversification (% of fund's net assets) |
As of October 31, 2007 |
| Brazil | 66.5% | |
| Mexico | 21.8% | |
| Chile | 4.0% | |
| United States of America | 2.5% | |
| Bermuda | 1.8% | |
| Luxembourg | 1.0% | |
| Colombia | 1.0% | |
| Argentina | 0.7% | |
| Panama | 0.7% | |

Percentages are adjusted for the effect of futures contracts, if applicable. |
|
As of April 30, 2007 |
| Brazil | 58.2% | |
| Mexico | 29.3% | |
| Chile | 7.4% | |
| United States of America | 2.6% | |
| Luxembourg | 0.9% | |
| Bermuda | 0.5% | |
| Panama | 0.4% | |
| United Kingdom | 0.4% | |
| Argentina | 0.2% | |
| Other | 0.1% | |

Percentages are adjusted for the effect of futures contracts, if applicable. |
Asset Allocation |
| % of fund's
net assets | % of fund's net assets
6 months ago |
Stocks | 98.6 | 98.0 |
Short-Term Investments and Net Other Assets | 1.4 | 2.0 |
Top Ten Stocks as of October 31, 2007 |
| % of fund's
net assets | % of fund's net assets
6 months ago |
Companhia Vale do Rio Doce (PN-A) (Brazil, Metals & Mining) | 9.0 | 7.0 |
Petroleo Brasileiro SA - Petrobras (PN) (non-vtg.) (Brazil, Oil, Gas & Consumable Fuels) | 9.0 | 6.4 |
America Movil SAB de CV
Series L sponsored ADR (Mexico, Wireless Telecommunication Services) | 9.0 | 11.9 |
Petroleo Brasileiro SA - Petrobras (ON) (Brazil, Oil, Gas & Consumable Fuels) | 6.9 | 4.8 |
Companhia Vale do Rio Doce sponsored ADR (Brazil, Metals & Mining) | 6.3 | 4.8 |
Banco Bradesco SA (PN) (Brazil, Commercial Banks) | 4.8 | 4.4 |
Uniao de Bancos Brasileiros SA (Unibanco) (Brazil, Commercial Banks) | 3.6 | 4.4 |
Banco Itau Holding Financeira SA (non-vtg.) (Brazil, Commercial Banks) | 2.9 | 4.5 |
Usinas Siderurgicas de Minas Gerais SA - Usiminas (PN-A) (non-vtg.) (Brazil, Metals & Mining) | 2.4 | 1.7 |
Companhia de Bebidas das Americas (AmBev) (PN) sponsored ADR (Brazil, Beverages) | 2.2 | 1.8 |
| 56.1 | |
Market Sectors as of October 31, 2007 |
| % of fund's
net assets | % of fund's net assets
6 months ago |
Materials | 26.9 | 24.1 |
Financials | 17.0 | 15.4 |
Energy | 16.9 | 11.6 |
Telecommunication Services | 13.2 | 15.6 |
Consumer Discretionary | 8.2 | 8.7 |
Industrials | 6.6 | 8.1 |
Consumer Staples | 5.8 | 8.1 |
Utilities | 2.6 | 4.6 |
Information Technology | 0.8 | 0.8 |
Health Care | 0.6 | 1.0 |
Annual Report
Latin America
Investments October 31, 2007
Showing Percentage of Net Assets
Common Stocks - 95.7% |
| Shares | | Value |
Argentina - 0.7% |
Banco Patagonia SA unit | 411,100 | | $ 9,979,887 |
Grupo Clarin SA GDR (a)(f) | 769,300 | | 15,386,000 |
Telecom Argentina SA Class B sponsored ADR (a) | 874,200 | | 20,989,542 |
TOTAL ARGENTINA | | 46,355,429 |
Bermuda - 1.8% |
Credicorp Ltd. (NY Shares) | 686,100 | | 50,997,813 |
Dufry South America Ltd. unit | 1,898,805 | | 55,435,316 |
Laep Investments Ltd. unit (a) | 1,229,848 | | 5,047,061 |
TOTAL BERMUDA | | 111,480,190 |
Brazil - 63.6% |
Acucar Guarani SA | 1,897,700 | | 11,089,386 |
AES Tiete SA (PN) (non-vtg.) | 549,900,000 | | 19,293,064 |
All America Latina Logistica SA unit | 3,523,200 | | 55,797,746 |
Amil Participacoes SA (a) | 1,042,800 | | 9,824,658 |
B2W Companhia Global Do Varejo | 1,068,000 | | 57,656,320 |
Banco ABC Brasil SA | 2,247,224 | | 20,132,924 |
Banco Bradesco SA: | | | |
(PN) | 2,403,608 | | 81,690,163 |
(PN) sponsored ADR (e) | 6,406,000 | | 218,764,900 |
Banco Daycoval SA (PN) | 2,189,700 | | 25,819,247 |
Banco do Brasil SA | 1,702,800 | | 30,845,473 |
Banco do Estado do Rio Grande do Sul SA (a)(f) | 2,281,569 | | 15,495,310 |
Banco Indusval SA (f) | 560,088 | | 8,190,409 |
Banco Itau Holding Financeira SA sponsored ADR (non-vtg.) | 2,027,200 | | 57,876,560 |
Bovespa Holding SA (a) | 134,000 | | 2,552,049 |
Brasil Telecom Participacoes SA sponsored ADR | 911,200 | | 67,784,168 |
Companhia Brasileira (a)(f) | 19,000 | | 10,103,462 |
Companhia de Bebidas das Americas (AmBev): | | | |
(PN) sponsored ADR | 1,702,926 | | 139,146,083 |
sponsored ADR | 66,745 | | 5,339,600 |
Companhia de Saneamento de Minas Gerais | 1,514,300 | | 28,446,188 |
Companhia Providencia Industria e Comercio | 2,096,500 | | 16,116,670 |
Companhia Siderurgica Nacional SA (CSN) sponsored ADR (e) | 1,020,100 | | 81,505,990 |
Companhia Vale do Rio Doce: | | | |
(PN-A) sponsored ADR | 16,161,900 | | 510,231,183 |
sponsored ADR | 10,376,800 | | 390,997,824 |
Construtora Tenda SA | 2,299,600 | | 11,563,794 |
Duratex SA (PN) | 2,353,600 | | 78,752,618 |
Eletropaulo Metropolitana SA (PN-B) | 343,540,000 | | 26,508,635 |
Gafisa SA (a) | 877,600 | | 15,775,597 |
Gafisa SA ADR (a)(e) | 349,300 | | 12,456,038 |
GVT Holding SA | 3,037,300 | | 66,711,404 |
|
| Shares | | Value |
Inpar SA | 980,000 | | $ 11,730,998 |
Localiza Rent a Car SA | 1,302,499 | | 15,425,816 |
MRV Engenharia e Participacoes SA | 1,073,700 | | 22,335,393 |
Multiplan Empreendimentos Imobiliarios SA | 1,734,900 | | 25,340,109 |
Net Servicos de Comunicacao SA: | | | |
sponsored ADR (a) | 167,000 | | 2,685,360 |
(PN) (a) | 3,460,400 | | 55,563,211 |
Petroleo Brasileiro SA - Petrobras: | | | |
(ON) | 185,400 | | 8,851,535 |
(PN) (non-vtg.) | 3,538,780 | | 147,577,005 |
(PN) sponsored ADR (non-vtg.) | 4,930,400 | | 410,159,976 |
sponsored ADR (e) | 4,401,160 | | 420,882,931 |
Profarma Distribuidora de Produtos Farmaceuticos SA | 1,142,000 | | 22,112,595 |
Sao Carlos Empreen E Part SA (a) | 1,017,600 | | 12,204,612 |
Satipel Industrial SA | 1,187,200 | | 8,906,916 |
SEB - Sistema Educacional Brasileiro SA unit (a) | 322,300 | | 5,540,259 |
Sul America SA unit | 342,500 | | 6,190,379 |
TAM SA: | | | |
(PN) (ltd.-vtg.) | 1,098,300 | | 32,369,410 |
(PN) sponsored ADR (ltd. vtg.) (e) | 398,700 | | 11,761,650 |
Tegma Gestao Logistica | 1,994,000 | | 34,230,276 |
Terna Participacoes SA unit | 1,590,200 | | 30,340,733 |
TIM Participacoes SA | 1,633,200 | | 7,608,573 |
TIM Participacoes SA sponsored ADR (non-vtg.) (e) | 571,600 | | 26,522,240 |
Totvs SA | 1,260,800 | | 47,368,360 |
Tractebel Energia SA | 1,957,400 | | 27,334,133 |
Uniao de Bancos Brasileiros SA (Unibanco): | | | |
unit | 431,200 | | 6,824,031 |
GDR | 1,366,500 | | 215,961,660 |
Usinas Siderurgicas de Minas Gerais SA - Usiminas | 266,800 | | 22,391,399 |
Usinas Siderurgicas de Minas Gerais SA - Usiminas (PN-A) (non-vtg.) | 1,888,300 | | 148,097,467 |
Votorantim Celulose e Papel SA: | | | |
(PN) (non-vtg.) | 96,565 | | 3,038,552 |
sponsored ADR (non-vtg.) (e) | 2,965,050 | | 92,954,318 |
TOTAL BRAZIL | | 3,958,777,360 |
Chile - 4.0% |
CAP SA | 3,234,656 | | 104,244,232 |
Inversiones Aguas Metropolitanas SA ADR (f) | 1,319,610 | | 32,672,231 |
Lan Airlines SA sponsored ADR (e) | 5,258,200 | | 87,496,448 |
Masisa SA | 65,781,698 | | 15,752,900 |
Vina Concha y Toro SA sponsored ADR | 210,150 | | 10,913,090 |
TOTAL CHILE | | 251,078,901 |
Common Stocks - continued |
| Shares | | Value |
Colombia - 1.0% |
Almacenes Exito SA unit (f) | 3,111,600 | | $ 24,033,129 |
BanColombia SA sponsored ADR | 1,014,200 | | 37,271,850 |
TOTAL COLOMBIA | | 61,304,979 |
Luxembourg - 1.0% |
Tenaris SA sponsored ADR (e) | 1,183,300 | | 63,661,540 |
Mexico - 21.8% |
Alsea SAB de CV | 21,912,900 | | 32,643,844 |
America Movil SAB de CV Series L sponsored ADR | 8,518,800 | | 557,044,333 |
Axtel SAB de CV unit (a) | 18,160,142 | | 45,997,470 |
Banco Compartamos SA de CV | 5,618,800 | | 28,990,600 |
Cemex SA de CV sponsored ADR (a) | 3,188,518 | | 97,791,847 |
Corporacion Geo SA de CV
Series B (a) | 15,090,200 | | 55,633,770 |
Desarrolladora Homex Sab de CV (a) | 795,000 | | 7,512,369 |
Desarrolladora Homex Sab de CV sponsored ADR (a) | 277,700 | | 15,692,827 |
Empresas ICA Sociedad Controladora SA de CV (a) | 1,070,600 | | 7,520,453 |
Fomento Economico Mexicano SA de CV sponsored ADR | 3,130,995 | | 111,494,732 |
Grupo Aeroportuario del Pacifico SA de CV sponsored ADR | 853,600 | | 44,771,320 |
Grupo Aeroportuario Norte Sab de CV ADR | 314,300 | | 9,595,579 |
Grupo Mexico SA de CV Series B | 4,283,082 | | 38,974,367 |
Grupo Televisa SA de CV | 1,507,400 | | 7,518,758 |
Grupo Televisa SA de CV (CPO) sponsored ADR | 5,223,700 | | 129,808,945 |
Industrias Penoles SA de CV | 2,247,800 | | 53,349,350 |
Maxcom Telecomunicaciones SA de CV ADR (a) | 327,300 | | 5,681,928 |
Urbi, Desarrollos Urbanos, SA de CV (a) | 12,521,900 | | 48,385,247 |
Wal-Mart de Mexico SA de CV
Series V | 13,924,116 | | 56,559,618 |
TOTAL MEXICO | | 1,354,967,357 |
Panama - 0.7% |
Copa Holdings SA Class A | 577,500 | | 21,835,275 |
Intergroup Financial Services Corp. | 917,903 | | 16,063,303 |
Intergroup Financial Services Corp. (f) | 249,320 | | 4,363,100 |
TOTAL PANAMA | | 42,261,678 |
United States of America - 1.1% |
NII Holdings, Inc. (a) | 342,100 | | 19,841,800 |
Southern Copper Corp. | 327,259 | | 45,718,082 |
TOTAL UNITED STATES OF AMERICA | | 65,559,882 |
TOTAL COMMON STOCKS (Cost $3,050,873,711) | 5,955,447,316 |
Nonconvertible Preferred Stocks - 2.9% |
| Shares | | Value |
Brazil - 2.9% |
Banco Itau Holding Financeira SA (PN) (non-vtg.) | 4,226,480 | | $ 119,946,921 |
Brasil Telecom Participacoes SA (PN) | 379,300 | | 5,667,248 |
Companhia Vale do Rio Doce (PN-A) | 1,661,000 | | 52,419,282 |
Empresa Nacional de Comercio Redito e Participacoes SA (PN) 0.00% (a) | 11,465 | | 205,430 |
TOTAL NONCONVERTIBLE PREFERRED STOCKS (Cost $44,918,128) | 178,238,881 |
Convertible Bonds - 0.0% |
| Principal Amount (d) | | |
Brazil - 0.0% |
Companhia de Saneamento de Minas Gerais 2.3% 6/1/13 (g)
(Cost $958,433) | BRL | 15,278 | | 1,147,991 |
Money Market Funds - 4.2% |
| Shares | | |
Fidelity Cash Central Fund, 4.97% (b) | 74,790,051 | | 74,790,051 |
Fidelity Securities Lending Cash Central Fund, 5.02% (b)(c) | 184,690,850 | | 184,690,850 |
TOTAL MONEY MARKET FUNDS (Cost $259,480,901) | 259,480,901 |
TOTAL INVESTMENT PORTFOLIO - 102.8% (Cost $3,356,231,173) | | 6,394,315,089 |
NET OTHER ASSETS - (2.8)% | | (174,624,799) |
NET ASSETS - 100% | $ 6,219,690,290 |
Currency Abbreviations |
BRL | - | Brazilian real |
Legend |
(a) Non-income producing |
(b) Affiliated fund that is available only to investment companies and other accounts managed by Fidelity Investments. The rate quoted is the annualized seven-day yield of the fund at period end. A complete unaudited listing of the fund's holdings as of its most recent quarter end is available upon request. |
(c) Investment made with cash collateral received from securities on loan. |
(d) Principal amount is stated in United States dollars unless otherwise noted. |
(e) Security or a portion of the security is on loan at period end. |
(f) Security exempt from registration under Rule 144A of the Securities Act of 1933. These securities may be resold in transactions exempt from registration, normally to qualified institutional buyers. At the end of the period, the value of these securities amounted to $110,243,641 or 1.8% of net assets. |
(g) Restricted securities - Investment in securities not registered under the Securities Act of 1933 (excluding 144A issues). At the end of the period, the value of restricted securities (excluding 144A issues) amounted to $1,147,991 or 0.0% of net assets. |
Additional information on each holding is as follows: |
Security | Acquisition Date | Acquisition Cost |
Companhia de Saneamento de Minas Gerais 2.3% 6/1/13 | 8/20/07 | $ 958,433 |
Affiliated Central Funds |
Information regarding fiscal year to date income earned by the Fund from investments in Fidelity Central Funds is as follows: |
Fund | Income earned |
Fidelity Cash Central Fund | $ 4,871,435 |
Fidelity Securities Lending Cash Central Fund | 1,016,365 |
Total | $ 5,887,800 |
See accompanying notes which are an integral part of the financial statements.
Annual Report
Latin America
Financial Statements
Statement of Assets and Liabilities
| October 31, 2007 |
| | |
Assets | | |
Investment in securities, at value (including securities loaned of $186,305,565) - See accompanying schedule: Unaffiliated issuers (cost $3,096,750,272) | $ 6,134,834,188 | |
Fidelity Central Funds (cost $259,480,901) | 259,480,901 | |
Total Investments (cost $3,356,231,173) | | $ 6,394,315,089 |
Foreign currency held at value (cost $3,030,434) | | 3,041,503 |
Receivable for investments sold | | 29,814,150 |
Receivable for fund shares sold | | 19,909,358 |
Dividends receivable | | 17,512,979 |
Distributions receivable from Fidelity Central Funds | | 397,843 |
Prepaid expenses | | 13,188 |
Other receivables | | 304,233 |
Total assets | | 6,465,308,343 |
| | |
Liabilities | | |
Payable to custodian bank | $ 57,600 | |
Payable for investments purchased | 45,460,790 | |
Payable for fund shares redeemed | 10,389,867 | |
Accrued management fee | 3,426,808 | |
Other affiliated payables | 946,979 | |
Other payables and accrued expenses | 645,159 | |
Collateral on securities loaned, at value | 184,690,850 | |
Total liabilities | | 245,618,053 |
| | |
Net Assets | | $ 6,219,690,290 |
Net Assets consist of: | | |
Paid in capital | | $ 2,991,184,724 |
Undistributed net investment income | | 45,170,603 |
Accumulated undistributed net realized gain (loss) on investments and foreign currency transactions | | 145,184,700 |
Net unrealized appreciation (depreciation) on investments and assets and liabilities in foreign currencies | | 3,038,150,263 |
Net Assets, for 91,607,193 shares outstanding | | $ 6,219,690,290 |
Net Asset Value, offering price and redemption price per share ($6,219,690,290 ÷ 91,607,193 shares) | | $ 67.90 |
Statement of Operations
| Year ended October 31, 2007 |
| | |
Investment Income | | |
Dividends | | $ 105,704,969 |
Interest | | 59,261 |
Income from Fidelity Central Funds (including $1,016,365 from security lending) | | 5,887,800 |
| | 111,652,030 |
Less foreign taxes withheld | | (10,838,610) |
Total income | | 100,813,420 |
| | |
Expenses | | |
Management fee | $ 30,750,559 | |
Transfer agent fees | 8,418,508 | |
Accounting and security lending fees | 1,546,949 | |
Custodian fees and expenses | 2,224,593 | |
Independent trustees' compensation | 14,915 | |
Registration fees | 231,770 | |
Audit | 98,603 | |
Legal | 30,602 | |
Interest | 65,890 | |
Miscellaneous | 118,017 | |
Total expenses before reductions | 43,500,406 | |
Expense reductions | (667,648) | 42,832,758 |
Net investment income (loss) | | 57,980,662 |
Realized and Unrealized Gain (Loss) Net realized gain (loss) on: | | |
Investment securities: | | |
Unaffiliated issuers | 189,262,602 | |
Foreign currency transactions | (2,613,196) | |
Total net realized gain (loss) | | 186,649,406 |
Change in net unrealized appreciation (depreciation) on: Investment securities | 2,089,300,884 | |
Assets and liabilities in foreign currencies | 52,779 | |
Total change in net unrealized appreciation (depreciation) | | 2,089,353,663 |
Net gain (loss) | | 2,276,003,069 |
Net increase (decrease) in net assets resulting from operations | | $ 2,333,983,731 |
See accompanying notes which are an integral part of the financial statements.
Annual Report
Statement of Changes in Net Assets
| Year ended
October 31,
2007 | Year ended
October 31,
2006 |
Increase (Decrease) in Net Assets | | |
Operations | | |
Net investment income (loss) | $ 57,980,662 | $ 57,985,237 |
Net realized gain (loss) | 186,649,406 | 36,588,919 |
Change in net unrealized appreciation (depreciation) | 2,089,353,663 | 585,339,744 |
Net increase (decrease) in net assets resulting from operations | 2,333,983,731 | 679,913,900 |
Distributions to shareholders from net investment income | (48,023,908) | (25,559,551) |
Distributions to shareholders from net realized gain | (60,491,350) | (20,858,777) |
Total distributions | (108,515,258) | (46,418,328) |
Share transactions
Proceeds from sales of shares | 2,669,988,018 | 2,691,422,984 |
Reinvestment of distributions | 105,191,757 | 44,620,920 |
Cost of shares redeemed | (1,907,140,342) | (1,635,956,243) |
Net increase (decrease) in net assets resulting from share transactions | 868,039,433 | 1,100,087,661 |
Redemption fees | 3,709,798 | 4,806,595 |
Total increase (decrease) in net assets | 3,097,217,704 | 1,738,389,828 |
| | |
Net Assets | | |
Beginning of period | 3,122,472,586 | 1,384,082,758 |
End of period (including undistributed net investment income of $45,170,603 and undistributed net investment income of $48,654,473, respectively) | $ 6,219,690,290 | $ 3,122,472,586 |
Other Information Shares | | |
Sold | 51,731,157 | 73,372,373 |
Issued in reinvestment of distributions | 2,427,062 | 1,389,117 |
Redeemed | (38,465,997) | (45,918,289) |
Net increase (decrease) | 15,692,222 | 28,843,201 |
Financial Highlights
Years ended October 31, | 2007 | 2006 | 2005 | 2004 | 2003 |
Selected Per-Share Data | | | | | |
Net asset value, beginning of period | $ 41.13 | $ 29.40 | $ 18.10 | $ 13.38 | $ 8.92 |
Income from Investment Operations | | | | | |
Net investment income (loss) C | .68 | .82 | .57 | .40 | .20 |
Net realized and unrealized gain (loss) | 27.43 | 11.68 | 10.98 | 4.53 | 4.42 |
Total from investment operations | 28.11 | 12.50 | 11.55 | 4.93 | 4.62 |
Distributions from net investment income | (.61) | (.46) | (.30) | (.23) | (.17) |
Distributions from net realized gain | (.77) | (.38) | - | - | - |
Total distributions | (1.38) | (.84) | (.30) | (.23) | (.17) |
Redemption fees added to paid in capital C | .04 | .07 | .05 | .02 | .01 |
Net asset value, end of period | $ 67.90 | $ 41.13 | $ 29.40 | $ 18.10 | $ 13.38 |
Total Return A, B | 70.35% | 43.57% | 64.94% | 37.47% | 52.83% |
Ratios to Average Net Assets D, F | | | | | |
Expenses before reductions | 1.00% | 1.05% | 1.10% | 1.19% | 1.31% |
Expenses net of fee waivers, if any | 1.00% | 1.05% | 1.10% | 1.19% | 1.31% |
Expenses net of all reductions | .98% | 1.02% | 1.04% | 1.16% | 1.31% |
Net investment income (loss) | 1.33% | 2.23% | 2.38% | 2.56% | 1.89% |
Supplemental Data | | | | | |
Net assets, end of period (000 omitted) | $ 6,219,690 | $ 3,122,473 | $ 1,384,083 | $ 357,335 | $ 219,519 |
Portfolio turnover rate E | 52% | 60% | 40% | 25% | 28% |
A Total returns would have been lower had certain expenses not been reduced during the periods shown. B Total returns do not include the effect of the former sales charges. C Calculated based on average shares outstanding during the period. D Fees and expenses of the underlying Fidelity Central Funds are not included in the Fund's expense ratio. The Fund indirectly bears its proportionate share of the expenses of any underlying Fidelity Central Funds. E Amount does not include the portfolio activity of any underlying Fidelity Central Funds. F Expense ratios reflect operating expenses of the Fund. Expenses before reductions do not reflect amounts reimbursed by the investment adviser or reductions from brokerage service arrangements or other expense offset arrangements and do not represent the amount paid by the Fund during periods when reimbursements or reductions occur. Expenses net of fee waivers reflect expenses after reimbursement by the investment adviser but prior to reductions from brokerage service arrangements or other expense offset arrangements. Expenses net of all reductions represent the net expenses paid by the Fund. |
See accompanying notes which are an integral part of the financial statements.
Annual Report
Nordic
Performance: The Bottom Line
Average annual total return reflects the change in the value of an investment, assuming reinvestment of the fund's dividend income and capital gains (the profits earned upon the sale of securities that have grown in value) and assuming a constant rate of performance each year. The $10,000 table and the fund's returns do not reflect the deduction of taxes that a shareholder would pay on fund distributions or the redemption of fund shares. During periods of reimbursement by Fidelity, a fund's total returns will be greater than it would be had the reimbursement not occurred. How a fund did yesterday is no guarantee of how it will do tomorrow.
Average Annual Total Returns
Periods ended October 31, 2007 | Past 1
year | Past 5
years | Past 10
years |
Fidelity Nordic Fund | 47.38% | 31.54% | 15.60% |
$10,000 Over 10 years
Let's say hypothetically that $10,000 was invested in Fidelity Nordic Fund on October 31, 1997. The chart shows how the value of your investment would have changed, and also shows how the FTSE World Nordic Index performed over the same period.
Annual Report
Nordic
Management's Discussion of Fund Performance
Comments from Trygve Toraasen, Portfolio Manager of Fidelity® Nordic Fund
Foreign stocks, with a large assist from a weak U.S. dollar, generally had higher returns for U.S. investors than domestic equities during the 12-month period ending October 31, 2007. The backdrop for global stocks was solid, with robust economic growth and relatively high corporate profitability worldwide. Developed international equity markets, as measured by the Morgan Stanley Capital InternationalSM Europe, Australasia, and Far East (MSCI® EAFE®) Index - a performance monitor of established markets outside the United States and Canada - rose 25.09%. In comparison, the Standard & Poor's 500SM Index, a gauge of U.S. stocks, was up 14.56%, while Canada did appreciably better, as measured by the 43.24% advance of the S&P/TSX Composite Index. Among countries making up at least 1% of the EAFE benchmark, Finland had the best showing, soaring nearly 69%, while Hong Kong gained roughly 66%. The United Kingdom and Japan, the two largest components of the index, both underperformed. Fallout from the credit crunch and concerns about export growth tempered UK stocks, while Japan struggled with a slowdown in consumer spending and sluggish domestic growth. Emerging markets were the period's big winners, advancing 68.33% as measured by the MSCI Emerging Markets index.
Fidelity Nordic Fund returned 47.38% during the past 12 months, while the Financial Times Stock Exchange (FTSE) World Nordic Index gained 44.61% in a period of strong growth throughout the region. I emphasized attractively priced companies with interesting long-term growth prospects. While this positioning did not help in the first half of the period when highly cyclical stocks outperformed, it proved more successful during the second half of the period. Stock selection in industrials, financials and materials were particularly successful, while my positioning in health care tended to hold back results. Also affecting results were currency movements that added to the returns of U.S. investors. As in the past, the region's two giant telecommunications companies, Nokia and Ericsson, had a major impact on results. The largest component of the FTSE index, Nokia, posted solid results on the strength of its improving wireless handset sales. However, for risk control reasons, I kept it underweighted. As a consequence, it was the biggest contributor to absolute results but the largest detractor from results relative to the index. Conversely, Ericsson struggled, though its underweighted position made it a significant contributor to relative performance. Major contributors for the 12 months included ABB, a Swiss global construction and engineering company not included in the index; Nokian Tyres of Finland; and Norway's Yara International, a major fertilizer manufacturer. Holding back results were my underweightings of truck manufacturer Volvo and steel maker SSAB Svenskt, both of Sweden. Another Swedish company, health care equipment company Elekta, underperformed as well, further dampening relative performance.
Notes to shareholders: The proposal to merge Fidelity Nordic Fund into Fidelity Europe Fund was not approved by shareholders at the shareholder meeting on June 20, 2007. The in-favor votes failed to exceed the 66.67% threshold required to approve the merger. Nordic Fund, which had been closed to new investors pending shareholder consideration of the merger proposal, was reopened on June 21, 2007.
Nordic Fund may invest up to 35% of its total assets in any industry that represents more than 20% of the Nordic market. As of October 31, 2007, the fund did not have more than 20% of its assets in any one industry.
The views expressed above reflect those of the portfolio manager(s) only through the end of the period as stated on the cover of this report and do not necessarily represent the views of Fidelity or any other person in the Fidelity organization. Any such views are subject to change at any time based upon market or other conditions and Fidelity disclaims any responsibility to update such views. These views may not be relied on as investment advice and, because investment decisions for a Fidelity fund are based on numerous factors, may not be relied on as an indication of trading intent on behalf of any Fidelity fund.
Annual Report
Nordic
Investment Changes
Geographic Diversification (% of fund's net assets) |
As of October 31, 2007 |
| Sweden | 51.4% | |
| Finland | 19.9% | |
| Norway | 18.8% | |
| Denmark | 9.2% | |
| United States of America | 0.6% | |
| Iceland | 0.1% | |

Percentages are adjusted for the effect of futures contracts, if applicable. |
|
As of April 30, 2007 |
| Sweden | 53.0% | |
| Norway | 22.7% | |
| Finland | 13.8% | |
| Denmark | 6.3% | |
| Iceland | 1.5% | |
| United States of America | 0.9% | |
| Estonia | 0.8% | |
| Canada | 0.4% | |
| Liberia | 0.4% | |
| Other | 0.2% | |

Percentages are adjusted for the effect of futures contracts, if applicable. |
Asset Allocation |
| % of fund's
net assets | % of fund's net assets
6 months ago |
Stocks | 99.4 | 99.1 |
Short-Term Investments and Net Other Assets | 0.6 | 0.9 |
Top Ten Stocks as of October 31, 2007 |
| % of fund's
net assets | % of fund's net assets
6 months ago |
Nokia Corp. (Finland, Communications Equipment) | 15.7 | 9.2 |
Nordea Bank AB (Sweden, Commercial Banks) | 4.8 | 5.1 |
Scania AB (B Shares) (Sweden, Machinery) | 4.2 | 3.1 |
StatoilHydro ASA (Norway, Oil, Gas & Consumable Fuels) | 3.9 | 0.0 |
ABB Ltd. (Sweden) (Sweden, Electrical Equipment) | 3.8 | 3.0 |
Novo Nordisk AS Series B (Denmark, Pharmaceuticals) | 3.6 | 0.8 |
Elekta AB (B Shares) (Sweden, Health Care Equipment & Supplies) | 3.2 | 1.0 |
H&M Hennes & Mauritz AB (B Shares) (Sweden, Specialty Retail) | 2.9 | 3.6 |
Hexagon AB (B Shares) (Sweden, Machinery) | 2.8 | 1.1 |
Norsk Hydro ASA (Norway, Metals & Mining) | 2.7 | 3.2 |
| 47.6 | |
Market Sectors as of October 31, 2007 |
| % of fund's
net assets | % of fund's net assets
6 months ago |
Industrials | 33.5 | 24.2 |
Information Technology | 18.0 | 17.0 |
Financials | 10.7 | 22.8 |
Consumer Discretionary | 9.7 | 11.9 |
Health Care | 8.1 | 3.1 |
Telecommunication Services | 7.2 | 5.9 |
Materials | 6.9 | 4.3 |
Energy | 5.3 | 7.8 |
Consumer Staples | 0.0 | 1.6 |
Utilities | 0.0 | 0.5 |
Annual Report
Nordic
Investments October 31, 2007
Showing Percentage of Net Assets
Common Stocks - 99.4% |
| Shares | | Value |
Denmark - 9.2% |
Coloplast AS Series B | 66,950 | | $ 6,480,732 |
FLS Industries | 109,550 | | 11,882,033 |
Novo Nordisk AS Series B | 287,895 | | 35,702,528 |
Novozymes AS Series B | 49,900 | | 5,431,662 |
Rockwool International AS Series B | 47,700 | | 15,214,971 |
Vestas Wind Systems AS (a) | 198,200 | | 17,683,185 |
TOTAL DENMARK | | 92,395,111 |
Finland - 19.9% |
Metso Corp. | 266,000 | | 16,170,578 |
Nokia Corp. | 3,937,250 | | 156,387,572 |
Nokian Tyres Ltd. | 691,130 | | 26,034,038 |
TOTAL FINLAND | | 198,592,188 |
Iceland - 0.1% |
Ossur hf (a) | 689,370 | | 1,200,913 |
Norway - 18.8% |
Aker ASA (A Shares) | 57,140 | | 4,120,596 |
Aker Kvaerner ASA | 155,000 | | 5,401,099 |
Awilco Offshore ASA (a)(d) | 294,500 | | 3,665,816 |
Blom ASA (a) | 499,000 | | 6,601,882 |
Norsk Hydro ASA | 1,823,790 | | 26,809,713 |
Northern Logistic Property ASA | 303,200 | | 2,655,437 |
Norwegian Air Shuttle AS (a)(d) | 534,421 | | 16,033,128 |
Orkla ASA (A Shares) | 879,950 | | 16,347,902 |
Pronova BioPharma ASA | 1,100,000 | | 5,062,890 |
Renewable Energy Corp. AS (a)(d) | 103,600 | | 5,279,903 |
Schibsted ASA (B Shares) | 88,600 | | 5,035,498 |
StatoilHydro ASA | 1,155,946 | | 39,116,704 |
Telenor ASA | 1,114,000 | | 26,141,867 |
Yara International ASA | 654,000 | | 25,317,898 |
TOTAL NORWAY | | 187,590,333 |
Sweden - 51.4% |
AB Volvo (B Shares) | 1,001,000 | | 19,496,164 |
ABB Ltd. (Sweden) | 1,275,000 | | 38,327,759 |
Alfa Laval AB | 249,000 | | 19,712,296 |
Assa Abloy AB (B Shares) | 675,002 | | 14,129,493 |
Atlas Copco AB (B Shares) | 797,800 | | 12,430,801 |
Bergman & Beving AB (B Shares) | 57,600 | | 1,903,758 |
Elekta AB (B Shares) | 1,635,100 | | 31,524,651 |
H&M Hennes & Mauritz AB (B Shares) | 431,340 | | 28,716,399 |
Hexagon AB (B Shares) | 1,160,975 | | 27,956,589 |
Intrum Justitia AB | 108,600 | | 1,734,865 |
Investment AB Kinnevik | 676,600 | | 16,771,906 |
Modern Times Group MTG AB (B Shares) | 328,100 | | 23,056,722 |
NeoNet AB | 1,068,900 | | 7,402,180 |
Nordea Bank AB | 2,674,500 | | 47,817,934 |
|
| Shares | | Value |
Orexo AB (a)(d) | 107,800 | | $ 1,247,027 |
Ratos AB (B Shares) | 76,200 | | 2,236,679 |
RNB Retail & Brands AB | 1,204,250 | | 13,883,346 |
Sandvik AB | 1,277,000 | | 24,118,041 |
Scania AB (B Shares) | 1,546,800 | | 42,238,017 |
Skandinaviska Enskilda Banken AB (A Shares) | 663,400 | | 20,307,897 |
Skanska AB (B Shares) | 658,400 | | 13,004,792 |
SKF AB (B Shares) | 722,300 | | 14,011,171 |
SSAB Svenskt Stal AB (A Shares) | 371,400 | | 12,041,456 |
Swedbank AB (A Shares) | 315,400 | | 9,830,419 |
TELE2 AB (B Shares) | 884,550 | | 20,812,941 |
Telefonaktiebolaget LM Ericsson (B Shares) | 7,488,000 | | 22,501,440 |
TeliaSonera AB | 2,569,500 | | 25,275,428 |
TOTAL SWEDEN | | 512,490,171 |
TOTAL COMMON STOCKS (Cost $757,680,095) | 992,268,716 |
Money Market Funds - 2.1% |
| | | |
Fidelity Cash Central Fund, 4.97% (b) | 14,968,507 | | 14,968,507 |
Fidelity Securities Lending Cash Central Fund, 5.02% (b)(c) | 5,768,738 | | 5,768,738 |
TOTAL MONEY MARKET FUNDS (Cost $20,737,245) | 20,737,245 |
TOTAL INVESTMENT PORTFOLIO - 101.5% (Cost $778,417,340) | | 1,013,005,961 |
NET OTHER ASSETS - (1.5)% | | (15,280,011) |
NET ASSETS - 100% | $ 997,725,950 |
Legend |
(a) Non-income producing |
(b) Affiliated fund that is available only to investment companies and other accounts managed by Fidelity Investments. The rate quoted is the annualized seven-day yield of the fund at period end. A complete unaudited listing of the fund's holdings as of its most recent quarter end is available upon request. |
(c) Investment made with cash collateral received from securities on loan. |
(d) Security or a portion of the security is on loan at period end. |
Affiliated Central Funds |
Information regarding fiscal year to date income earned by the Fund from investments in Fidelity Central Funds is as follows: |
Fund | Income earned |
Fidelity Cash Central Fund | $ 704,137 |
Fidelity Securities Lending Cash Central Fund | 972,393 |
Total | $ 1,676,530 |
See accompanying notes which are an integral part of the financial statements.
Annual Report
Nordic
Financial Statements
Statement of Assets and Liabilities
| October 31, 2007 |
| | |
Assets | | |
Investment in securities, at value (including securities loaned of $5,520,966) - See accompanying schedule: Unaffiliated issuers (cost $757,680,095) | $ 992,268,716 | |
Fidelity Central Funds (cost $20,737,245) | 20,737,245 | |
Total Investments (cost $778,417,340) | | $ 1,013,005,961 |
Receivable for investments sold | | 11,805,159 |
Receivable for fund shares sold | | 4,614,064 |
Dividends receivable | | 150,539 |
Distributions receivable from Fidelity Central Funds | | 77,554 |
Prepaid expenses | | 143 |
Other receivables | | 28,235 |
Total assets | | 1,029,681,655 |
| | |
Liabilities | | |
Payable for investments purchased | $ 23,055,548 | |
Payable for fund shares redeemed | 2,248,902 | |
Accrued management fee | 558,132 | |
Other affiliated payables | 201,906 | |
Other payables and accrued expenses | 122,479 | |
Collateral on securities loaned, at value | 5,768,738 | |
Total liabilities | | 31,955,705 |
| | |
Net Assets | | $ 997,725,950 |
Net Assets consist of: | | |
Paid in capital | | $ 678,884,615 |
Undistributed net investment income | | 36,941,058 |
Accumulated undistributed net realized gain (loss) on investments and foreign currency transactions | | 47,295,092 |
Net unrealized appreciation (depreciation) on investments and assets and liabilities in foreign currencies | | 234,605,185 |
Net Assets, for 18,894,484 shares outstanding | | $ 997,725,950 |
Net Asset Value, offering price and redemption price per share ($997,725,950 ÷ 18,894,484 shares) | | $ 52.81 |
Statement of Operations
| Year ended October 31, 2007 |
| | |
Investment Income | | |
Dividends | | $ 19,967,627 |
Special dividends | | 25,091,231 |
Interest | | 8 |
Income from Fidelity Central Funds (including $972,393 from security lending) | | 1,676,530 |
| | 46,735,396 |
Less foreign taxes withheld | | (2,635,245) |
Total income | | 44,100,151 |
| | |
Expenses | | |
Management fee | $ 4,858,539 | |
Transfer agent fees | 1,607,995 | |
Accounting and security lending fees | 337,151 | |
Custodian fees and expenses | 254,858 | |
Independent trustees' compensation | 2,149 | |
Registration fees | 94,249 | |
Audit | 57,833 | |
Legal | 37,386 | |
Interest | 16,310 | |
Miscellaneous | 27,044 | |
Total expenses before reductions | 7,293,514 | |
Expense reductions | (163,190) | 7,130,324 |
Net investment income (loss) | | 36,969,827 |
Realized and Unrealized Gain (Loss) Net realized gain (loss) on: | | |
Investment securities: | | |
Unaffiliated issuers | 48,208,750 | |
Foreign currency transactions | (522,566) | |
Total net realized gain (loss) | | 47,686,184 |
Change in net unrealized appreciation (depreciation) on: Investment securities | 167,099,316 | |
Assets and liabilities in foreign currencies | 15,267 | |
Total change in net unrealized appreciation (depreciation) | | 167,114,583 |
Net gain (loss) | | 214,800,767 |
Net increase (decrease) in net assets resulting from operations | | $ 251,770,594 |
See accompanying notes which are an integral part of the financial statements.
Annual Report
Nordic
Financial Statements - continued
Statement of Changes in Net Assets
| Year ended
October 31,
2007 | Year ended
October 31,
2006 |
Increase (Decrease) in Net Assets | | |
Operations | | |
Net investment income (loss) | $ 36,969,827 | $ 3,999,365 |
Net realized gain (loss) | 47,686,184 | 7,924,426 |
Change in net unrealized appreciation (depreciation) | 167,114,583 | 41,900,739 |
Net increase (decrease) in net assets resulting from operations | 251,770,594 | 53,824,530 |
Distributions to shareholders from net investment income | (3,011,989) | (2,048,598) |
Distributions to shareholders from net realized gain | (5,296,944) | (14,574,214) |
Total distributions | (8,308,933) | (16,622,812) |
Share transactions
Proceeds from sales of shares | 678,676,171 | 241,880,689 |
Reinvestment of distributions | 8,060,493 | 16,097,675 |
Cost of shares redeemed | (281,558,904) | (135,218,842) |
Net increase (decrease) in net assets resulting from share transactions | 405,177,760 | 122,759,522 |
Redemption fees | 604,174 | 509,855 |
Total increase (decrease) in net assets | 649,243,595 | 160,471,095 |
| | |
Net Assets | | |
Beginning of period | 348,482,355 | 188,011,260 |
End of period (including undistributed net investment income of $36,941,058 and undistributed net investment income of $3,970,778, respectively) | $ 997,725,950 | $ 348,482,355 |
Other Information Shares | | |
Sold | 15,469,184 | 7,006,522 |
Issued in reinvestment of distributions | 210,073 | 544,945 |
Redeemed | (6,310,586) | (4,105,858) |
Net increase (decrease) | 9,368,671 | 3,445,609 |
Financial Highlights
Years ended October 31, | 2007 | 2006 | 2005 | 2004 | 2003 |
Selected Per-Share Data | | | | | |
Net asset value, beginning of period | $ 36.58 | $ 30.92 | $ 24.44 | $ 19.49 | $ 15.36 |
Income from Investment Operations | | | | | |
Net investment income (loss) C | 2.39 F | .50 | .55 | .26 | .11 |
Net realized and unrealized gain (loss) | 14.60 | 7.94 | 6.12 | 4.80 | 4.14 |
Total from investment operations | 16.99 | 8.44 | 6.67 | 5.06 | 4.25 |
Distributions from net investment income | (.29) | (.35) | (.22) | (.15) | (.12) |
Distributions from net realized gain | (.51) | (2.49) | - | - | - |
Total distributions | (.80) | (2.84) | (.22) | (.15) | (.12) |
Redemption fees added to paid in capital C | .04 | .06 | .03 | .04 | - H |
Net asset value, end of period | $ 52.81 | $ 36.58 | $ 30.92 | $ 24.44 | $ 19.49 |
Total Return A, B | 47.38% | 29.68% | 27.56% | 26.31% | 27.87% |
Ratios to Average Net Assets D, G | | | | | |
Expenses before reductions | 1.06% | 1.14% | 1.17% | 1.28% | 1.43% |
Expenses net of fee waivers, if any | 1.06% | 1.14% | 1.17% | 1.28% | 1.43% |
Expenses net of all reductions | 1.03% | 1.10% | 1.13% | 1.24% | 1.40% |
Net investment income (loss) | 5.37% F | 1.49% | 1.89% | 1.16% | .67% |
Supplemental Data | | | | | |
Net assets, end of period (000 omitted) | $ 997,726 | $ 348,482 | $ 188,011 | $ 116,493 | $ 81,337 |
Portfolio turnover rate E | 62% | 67% | 76% | 90% | 96% |
A Total returns would have been lower had certain expenses not been reduced during the periods shown. B Total returns do not include the effect of the former sales charges. C Calculated based on average shares outstanding during the period. D Fees and expenses of the underlying Fidelity Central Funds are not included in the Fund's expense ratio. The Fund indirectly bears its proportionate share of the expenses of any underlying Fidelity Central Funds. E Amount does not include the portfolio activity of any underlying Fidelity Central Funds. F Investment income per share reflects a special dividend which amounted to $1.62 per share. Excluding the special dividend, the ratio of net investment income (loss) to average net assets would have been 1.72%. G Expense ratios reflect operating expenses of the Fund. Expenses before reductions do not reflect amounts reimbursed by the investment adviser or reductions from brokerage service arrangements or other expense offset arrangements and do not represent the amount paid by the Fund during periods when reimbursements or reductions occur. Expenses net of fee waivers reflect expenses after reimbursement by the investment adviser but prior to reductions from brokerage service arrangements or other expense offset arrangements. Expenses net of all reductions represent the net expenses paid by the Fund. H Amount represents less than $.01 per share. |
See accompanying notes which are an integral part of the financial statements.
Annual Report
Pacific Basin
Performance: The Bottom Line
Average annual total return reflects the change in the value of an investment, assuming reinvestment of the fund's dividend income and capital gains (the profits earned upon the sale of securities that have grown in value) and assuming a constant rate of performance each year. The $10,000 table and the fund's returns do not reflect the deduction of taxes that a shareholder would pay on fund distributions or the redemption of fund shares. During periods of reimbursement by Fidelity, a fund's total returns will be greater than it would be had the reimbursement not occurred. How a fund did yesterday is no guarantee of how it will do tomorrow.
Average Annual Total Returns
Periods ended October 31, 2007 | Past 1
year | Past 5
years | Past 10
years |
Fidelity Pacific Basin Fund | 48.86% | 27.23% | 13.39% |
$10,000 Over 10 Years
Let's say hypothetically that $10,000 was invested in Fidelity Pacific Basin Fund on October 31, 1997. The chart shows how the value of your investment would have changed, and also shows how the MSCI All Country Pacific Index performed over the same period.

Annual Report
Pacific Basin
Management's Discussion of Fund Performance
Comments from Dale Nicholls, Portfolio Manager of Fidelity® Pacific Basin Fund
Foreign stocks, with a large assist from a weak U.S. dollar, generally had higher returns for U.S. investors than domestic equities during the 12-month period ending October 31, 2007. The backdrop for global stocks was solid, with robust economic growth and relatively high corporate profitability worldwide. Developed international equity markets, as measured by the Morgan Stanley Capital InternationalSM Europe, Australasia, and Far East (MSCI® EAFE®) Index - a performance monitor of established markets outside the United States and Canada - rose 25.09%. In comparison, the Standard & Poor's 500SM Index, a gauge of U.S. stocks, was up 14.56%, while Canada did appreciably better, as measured by the 43.24% advance of the S&P/TSX Composite Index. Among countries making up at least 1% of the EAFE benchmark, Finland had the best showing, soaring nearly 69%, while Hong Kong gained roughly 66%. The United Kingdom and Japan, the two largest components of the index, both underperformed. Fallout from the credit crunch and concerns about export growth tempered UK stocks, while Japan struggled with a slowdown in consumer spending and sluggish domestic growth. Emerging markets were the period's big winners, advancing 68.33% as measured by the MSCI Emerging Markets index.
During the past year, the fund's return was 48.86%, topping the 30.42% return of the MSCI All Country Pacific index. Versus the index, performance benefited from stock selection and an overweighting in industrials, as well as from stock picking in information technology and consumer discretionary, among other sectors, and an overweighting in technology. Among countries, my picks in South Korea, Hong Kong, Singapore, India, Malaysia and Taiwan fared well, while overweighting China and underweighting Japan proved timely. Out-of-index holding China State Construction International Holdings, a Hong Kong construction and engineering play, benefited from a reasonable valuation to start the period and continued strong growth in its order book. Other contributors were South Korea-based Internet search portal NHN; Cosco, a Singapore-based ship repair company; and Korea's Doosan Heavy Industries & Construction. Not owning Japan's largest bank, Mitsubishi UFJ Financial Group, helped as well, as this major index component's price fell due to disappointing earnings growth. Conversely, both stock selection and an underweighting in materials hurt our results. At the stock level, performance suffered due to underweighting Australian metals and mining company BHP Billiton - a position I liquidated during the period - along with not owning wireless services provider and index component China Mobile. Meanwhile, Misawa Homes, an out-of benchmark position, also hurt.
The views expressed above reflect those of the portfolio manager(s) only through the end of the period as stated on the cover of this report and do not necessarily represent the views of Fidelity or any other person in the Fidelity organization. Any such views are subject to change at any time based upon market or other conditions and Fidelity disclaims any responsibility to update such views. These views may not be relied on as investment advice and, because investment decisions for a Fidelity fund are based on numerous factors, may not be relied on as an indication of trading intent on behalf of any Fidelity fund.
Annual Report
Pacific Basin
Investment Changes
Geographic Diversification (% of fund's net assets) |
As of October 31, 2007 |
| Japan | 24.8% | |
| Australia | 12.5% | |
| Korea (South) | 10.6% | |
| Hong Kong | 10.5% | |
| Singapore | 8.4% | |
| China | 6.2% | |
| Cayman Islands | 4.4% | |
| Taiwan | 4.0% | |
| India | 3.9% | |
| Other | 14.7% | |

Percentages are adjusted for the effect of futures contracts, if applicable. |
|
As of April 30, 2007 |
| Japan | 29.6% | |
| Australia | 13.6% | |
| Korea (South) | 11.8% | |
| Singapore | 8.7% | |
| Hong Kong | 7.4% | |
| China | 5.0% | |
| India | 4.1% | |
| Taiwan | 4.1% | |
| Malaysia | 3.9% | |
| Other | 11.8% | |

Percentages are adjusted for the effect of futures contracts, if applicable. |
Asset Allocation |
| % of fund's
net assets | % of fund's net assets
6 months ago |
Stocks | 98.7 | 99.1 |
Short-Term Investments and Net Other Assets | 1.3 | 0.9 |
Top Ten Stocks as of October 31, 2007 |
| % of fund's
net assets | % of fund's net assets
6 months ago |
China State Construction International Holdings Ltd. (Hong Kong, Construction & Engineering) | 1.9 | 1.0 |
Keppel Corp. Ltd. (Singapore, Industrial Conglomerates) | 1.6 | 1.3 |
Goodpack Ltd. (Singapore, Air Freight & Logistics) | 1.4 | 0.4 |
Toyota Motor Corp.
(Japan, Automobiles) | 1.3 | 2.4 |
NHN Corp. (Korea (South), Internet Software & Services) | 1.3 | 1.0 |
Nintendo Co. Ltd.
(Japan, Software) | 1.2 | 1.0 |
Commonwealth Bank of Australia (Australia, Commercial Banks) | 1.1 | 0.0 |
CSL Ltd. (Australia, Biotechnology) | 1.1 | 1.0 |
Hang Lung Properties Ltd. (Hong Kong, Real Estate Management & Development) | 1.1 | 0.8 |
Mitsui & Co. Ltd. (Japan, Trading Companies & Distributors) | 1.1 | 0.6 |
| 13.1 | |
Market Sectors as of October 31, 2007 |
| % of fund's
net assets | % of fund's net assets
6 months ago |
Industrials | 23.7 | 20.5 |
Consumer Discretionary | 19.6 | 19.1 |
Information Technology | 16.5 | 16.9 |
Financials | 15.3 | 22.2 |
Materials | 6.6 | 4.9 |
Energy | 5.0 | 2.5 |
Consumer Staples | 4.7 | 6.4 |
Health Care | 4.5 | 4.4 |
Telecommunication Services | 2.0 | 1.1 |
Utilities | 0.8 | 1.1 |
Annual Report
Pacific Basin
Investments October 31, 2007
Showing Percentage of Net Assets
Common Stocks - 98.7% |
| Shares | | Value |
Australia - 12.5% |
Ausenco Ltd. | 503,500 | | $ 7,108,951 |
Austal Ltd. | 1,132,945 | | 3,404,490 |
Babcock & Brown Ltd. | 283,201 | | 8,200,216 |
Billabong International Ltd. (d) | 271,443 | | 3,833,412 |
Brambles Ltd. | 298,898 | | 3,978,640 |
Cochlear Ltd. | 90,585 | | 5,824,804 |
Commonwealth Bank of Australia | 253,090 | | 14,576,511 |
CSL Ltd. | 400,172 | | 13,604,287 |
Gunns Ltd. | 1,832,474 | | 6,459,859 |
HFA Holdings Ltd. | 1,422,475 | | 3,428,120 |
Incitec Pivot Ltd. | 103,709 | | 8,613,783 |
Iress Market Technology Ltd. | 608,632 | | 4,706,941 |
Macquarie Airports unit | 1,135,340 | | 4,665,879 |
Macquarie Bank Ltd. | 71,772 | | 5,732,133 |
Macquarie Infrastructure Group unit | 1,250,875 | | 3,713,112 |
QBE Insurance Group Ltd. | 246,479 | | 7,542,890 |
Reverse Corp. Ltd. | 533,839 | | 2,312,454 |
Rio Tinto Ltd. (d) | 90,218 | | 9,364,563 |
Seek Ltd. | 804,568 | | 7,041,379 |
Sunland Group Ltd. | 1,031,338 | | 4,416,657 |
United Group Ltd. | 612,476 | | 12,258,586 |
WildHorse Energy Ltd. (d) | 1,232,928 | | 2,695,657 |
WorleyParsons Ltd. | 233,088 | | 10,536,296 |
Wotif.com Holdings Ltd. | 859,373 | | 4,835,398 |
TOTAL AUSTRALIA | | 158,855,018 |
Bermuda - 3.2% |
Asia Media Co. Ltd. (d) | 547,500 | | 5,075,673 |
DVN Holdings Ltd. (a) | 10,409,000 | | 1,746,709 |
Huabao International Holdings Ltd. | 4,475,000 | | 4,266,572 |
Mingyuan Medicare Development Co. Ltd. (d) | 23,450,000 | | 3,594,686 |
Noble Group Ltd. | 3,643,000 | | 6,001,569 |
Peace Mark Holdings Ltd. | 3,985,750 | | 6,566,848 |
Ports Design Ltd. | 1,451,500 | | 5,479,721 |
Samling Global Ltd. | 3,576,000 | | 1,228,891 |
Sinofert Holdings Ltd. (d) | 5,452,600 | | 5,143,274 |
Sinolink Worldwide Holdings Ltd. | 5,634,000 | | 1,914,080 |
TOTAL BERMUDA | | 41,018,023 |
Cayman Islands - 4.4% |
Alibaba.com Ltd. (a) | 51,000 | | 164,509 |
Chaoda Modern Agriculture (Holdings) Ltd. | 4,882,000 | | 4,455,466 |
China Boqi Environmental Solutions Technology (Holding) Co. Ltd. | 1,117 | | 2,111,202 |
China Medical Technologies, Inc. sponsored ADR (d) | 55,200 | | 2,575,080 |
Ctrip.com International Ltd. sponsored ADR | 120,310 | | 6,780,672 |
Hembly International Holdings Ltd. | 5,170,000 | | 3,045,223 |
Kingboard Chemical Holdings Ltd. | 808,900 | | 5,313,025 |
Kingdee International Software Group Co. Ltd. | 2,468,232 | | 1,860,497 |
|
| Shares | | Value |
Lee & Man Paper Manufacturing Ltd. | 1,128,000 | | $ 4,512,387 |
Longtop Financial Technologies Ltd. ADR (a) | 1,500 | | 42,600 |
New Oriental Education & Technology Group, Inc. sponsored ADR | 108,100 | | 9,677,112 |
Samson Holding Ltd. | 2,615,000 | | 797,951 |
SinoCom Software Group Ltd. | 18,138,000 | | 4,211,596 |
Wuxi Pharmatech Cayman, Inc. Sponsored ADR (d) | 219,100 | | 8,433,159 |
Xinao Gas Holdings Ltd. | 562,000 | | 1,069,670 |
TOTAL CAYMAN ISLANDS | | 55,050,149 |
China - 6.2% |
51job, Inc. sponsored ADR (a) | 32,917 | | 733,720 |
AMVIG Holdings Ltd. | 3,812,000 | | 5,323,126 |
Anhui Conch Cement Co. Ltd. (H Shares) | 204,000 | | 2,037,527 |
Baidu.com, Inc. sponsored ADR (a) | 16,596 | | 6,347,804 |
BYD Co. Ltd. (H Shares) | 453,000 | | 4,271,706 |
China Coal Energy Co. Ltd. (H Shares) | 895,000 | | 3,036,775 |
China Hongxing Sports Ltd. | 1,636,000 | | 1,467,054 |
China Oilfield Services Ltd. (H Shares) | 2,650,000 | | 6,489,460 |
China Shenhua Energy Co. Ltd.
(H Shares) | 1,127,000 | | 7,262,705 |
China Shipping Development Co. Ltd. (H Shares) | 1,206,000 | | 4,120,753 |
Chitaly Holdings Ltd. | 8,165,308 | | 1,668,879 |
Jiangsu Expressway Co. Ltd. (H Shares) | 4,840,013 | | 5,599,265 |
Li Ning Co. Ltd. | 2,142,000 | | 8,049,847 |
Minth Group Ltd. | 1,784,000 | | 2,723,698 |
Sina Corp. (a) | 78,849 | | 4,520,413 |
Tencent Holdings Ltd. | 648,000 | | 5,554,905 |
Weichai Power Co. Ltd. (H Shares) | 398,000 | | 4,099,045 |
Xinjiang Xinxin Mining Industry Co. Ltd. Class H | 30,000 | | 55,507 |
Yantai Changyu Pioneer Wine Co. (B Shares) | 669,000 | | 4,985,349 |
TOTAL CHINA | | 78,347,538 |
Hong Kong - 10.5% |
Bank of East Asia Ltd. | 759,228 | | 5,165,729 |
Cafe de Coral Holdings Ltd. | 1,308,789 | | 2,646,211 |
China Insurance International Holdings Co. Ltd. (a) | 1,530,000 | | 4,994,751 |
China Overseas Land & Investment Ltd. | 1,327,750 | | 3,178,065 |
China Overseas Land & Investment Ltd. warrants 8/27/08 (a) | 110,145 | | 91,665 |
China Resources Enterprise Ltd. | 890,000 | | 3,903,836 |
China State Construction International Holdings Ltd. | 11,324,688 | | 23,721,417 |
China Unicom Ltd. | 4,356,000 | | 10,680,912 |
Esprit Holdings Ltd. | 487,500 | | 8,141,786 |
Far East Consortium International Ltd. | 9,270,648 | | 4,337,244 |
Galaxy Entertainment Group Ltd. (a) | 1,348,000 | | 1,472,112 |
Golden Meditech Co. Ltd. | 7,376,000 | | 3,465,571 |
Hang Lung Properties Ltd. | 2,760,000 | | 13,278,428 |
Hong Kong Exchanges & Clearing Ltd. | 234,500 | | 7,828,089 |
Common Stocks - continued |
| Shares | | Value |
Hong Kong - continued |
IPE Group Ltd. | 18,870,000 | | $ 2,604,637 |
Li & Fung Ltd. | 1,378,539 | | 6,541,570 |
PYI Corp. Ltd. | 9,444,215 | | 4,315,095 |
REXCAPITAL Financial Holdings Ltd. (a) | 34,236,967 | | 7,123,076 |
Shanghai Industrial Holdings Ltd.
(H Shares) | 1,094,000 | | 6,453,900 |
Television Broadcasts Ltd. | 435,792 | | 2,822,994 |
Tian An China Investments Co. Ltd. | 3,050,000 | | 4,626,565 |
Tingyi (Cayman Island) Holding Corp. | 3,522,742 | | 5,390,927 |
TOTAL HONG KONG | | 132,784,580 |
India - 3.9% |
Alembic Ltd. | 41,851 | | 110,210 |
Bharti Airtel Ltd. (a) | 52,591 | | 1,358,703 |
Educomp Solutions Ltd. | 104,742 | | 8,752,092 |
Financial Technologi India Ltd. | 100,689 | | 6,701,146 |
Geodesic Information Systems Ltd. | 663,857 | | 3,051,098 |
INFO Edge India Ltd. | 115,509 | | 3,582,000 |
Pantaloon Retail India Ltd. | 296,105 | | 5,553,027 |
Reliance Industries Ltd. | 67,398 | | 4,810,878 |
Shopper's Stop Ltd. | 125,024 | | 1,680,941 |
State Bank of India | 120,324 | | 7,549,698 |
Suzlon Energy Ltd. | 75,624 | | 3,836,889 |
United Spirits Ltd. | 25,571 | | 1,316,140 |
Zee Entertainment Enterprises Ltd. | 158,498 | | 1,348,979 |
TOTAL INDIA | | 49,651,801 |
Indonesia - 1.6% |
PT Astra International Tbk | 2,361,000 | | 6,754,549 |
PT Bakrie & Brothers Tbk (a) | 71,685,500 | | 2,539,738 |
PT Bank Niaga Tbk | 25,637,000 | | 2,470,066 |
PT Perusahaan Gas Negara Tbk Series B | 5,741,348 | | 8,997,686 |
TOTAL INDONESIA | | 20,762,039 |
Japan - 24.8% |
ABC-Mart, Inc. | 152,600 | | 3,142,889 |
Access Co. Ltd. (a)(d) | 847 | | 4,071,016 |
Aeon Co. Ltd. | 283,300 | | 4,460,504 |
Aeon Fantasy Co. Ltd. (d) | 113,500 | | 2,784,294 |
Aeon Mall Co. Ltd. | 118,500 | | 3,082,452 |
ARDEPRO CO., Ltd. | 15,624 | | 5,253,436 |
ARRK Corp. (d) | 199,500 | | 1,413,898 |
Aruze Corp. | 84,800 | | 3,671,922 |
Asics Corp. | 282,000 | | 4,497,803 |
Asunaro Aoki Construction Co. Ltd. | 30,000 | | 176,941 |
Avex Group Holdings, Inc. | 85,000 | | 1,239,431 |
Canon Marketing Japan, Inc. | 194,900 | | 3,819,881 |
Canon, Inc. | 107,200 | | 5,421,104 |
Chofu Seisakusho Co. Ltd. | 106,400 | | 1,748,736 |
Citizen Holdings Co. Ltd. | 318,400 | | 3,430,744 |
DeNA Co. Ltd. | 562 | | 3,521,005 |
Denso Corp. | 153,100 | | 6,221,049 |
Digital Garage, Inc. (a)(d) | 2,515 | | 4,259,087 |
|
| Shares | | Value |
eAccess Ltd. (d) | 3,893 | | $ 2,467,938 |
Fuji Machine Manufacturing Co. Ltd. | 58,300 | | 1,301,488 |
Fujifilm Holdings Corp. | 143,600 | | 6,884,184 |
Fujitsu Business Systems Ltd. | 154,300 | | 2,364,084 |
Fujitsu Ltd. (d) | 1,012,000 | | 7,947,686 |
Funai Electric Co. Ltd. | 77,200 | | 3,282,994 |
H.I.S. Co. Ltd. | 213,800 | | 4,063,767 |
Hamakyorex Co. Ltd. | 188,600 | | 3,997,189 |
Hikari Tsushin, Inc. | 98,400 | | 3,005,427 |
Hitachi Metals Ltd. | 256,000 | | 3,321,678 |
Ibiden Co. Ltd. | 68,700 | | 5,824,622 |
Inpex Holdings, Inc. | 503 | | 5,423,669 |
Internet Initiative Japan, Inc. | 97 | | 380,746 |
ISE Chemical Corp. (d) | 391,000 | | 3,863,980 |
Japan Airport Terminal Co. Ltd. | 10,400 | | 204,051 |
Kato Works Co. Ltd. | 621,000 | | 3,753,828 |
Keihanshin Real Estate Co. Ltd. | 40,000 | | 205,730 |
Kenedix Realty Investment Corp. | 343 | | 2,388,874 |
KK daVinci Advisors (a) | 2,928 | | 3,055,408 |
Konica Minolta Holdings, Inc. | 345,000 | | 6,040,734 |
Kubota Corp. | 515,000 | | 4,324,554 |
Kyoritsu Maintenance Co. Ltd. (d) | 159,000 | | 3,094,277 |
Leopalace21 Corp. | 162,100 | | 5,175,825 |
Marubeni Corp. | 759,000 | | 6,518,531 |
Misawa Homes Co. Ltd. (a)(d) | 132,300 | | 1,306,404 |
Mitsui & Co. Ltd. | 511,000 | | 13,257,223 |
Namco Bandai Holdings, Inc. | 281,300 | | 4,337,928 |
Nikon Corp. | 194,000 | | 6,227,150 |
Nintendo Co. Ltd. | 23,500 | | 14,758,000 |
Nippon Electric Glass Co. Ltd. | 368,000 | | 6,256,111 |
Nippon Parkerizing Co. Ltd. | 197,000 | | 2,101,720 |
Nippon Seiki Co. Ltd. | 129,000 | | 3,003,067 |
Nitta Corp. | 233,800 | | 5,006,604 |
Nittoku Engineering Co. Ltd. | 291,400 | | 1,879,356 |
Rakuten, Inc. | 8,822 | | 4,315,315 |
Renown, Inc. (a) | 314,200 | | 2,401,097 |
Round One Corp. (d) | 1,763 | | 4,187,497 |
Sankyo Seiko Co. Ltd. | 425,800 | | 1,341,114 |
Seikoh Giken Co. Ltd. | 16,100 | | 252,689 |
SFCG Co. Ltd. | 20,530 | | 3,405,942 |
Shimachu Co. Ltd. | 72,900 | | 2,099,197 |
Softbank Corp. | 251,200 | | 5,868,008 |
Sompo Japan Insurance, Inc. | 272,000 | | 3,199,724 |
Stanley Electric Co. Ltd. | 137,800 | | 3,065,215 |
Sumitomo Electric Industries Ltd. | 217,700 | | 3,525,388 |
Sumitomo Metal Industries Ltd. | 750,000 | | 3,713,013 |
Sumitomo Mitsui Financial Group, Inc. | 1,563 | | 12,805,815 |
Take & Give Needs Co. Ltd. | 8,908 | | 2,126,767 |
Telewave, Inc. (d) | 4,050 | | 3,493,743 |
The Nippon Synthetic Chemical Industry Co. Ltd. (d) | 437,000 | | 2,918,520 |
The Sumitomo Warehouse Co. Ltd. (d) | 401,000 | | 2,311,061 |
Tohcello Co. Ltd. | 330,000 | | 2,407,139 |
Topcon Corp. (d) | 205,000 | | 2,994,253 |
Common Stocks - continued |
| Shares | | Value |
Japan - continued |
Torishima Pump Manufacturing Co. Ltd. (d) | 427,600 | | $ 5,655,307 |
Toyoda Gosei Co. Ltd. | 118,400 | | 4,253,787 |
Toyota Motor Corp. | 293,000 | | 16,765,460 |
Ube Industries Ltd. | 891,000 | | 3,200,031 |
Urban Corp. | 173,400 | | 3,038,115 |
Usen Corp. | 258,010 | | 2,367,750 |
Valor Co. Ltd. | 222,000 | | 2,478,244 |
TOTAL JAPAN | | 313,431,210 |
Korea (South) - 10.6% |
CDNetworks Co. Ltd. (a) | 120,643 | | 2,447,490 |
Cheil Industries, Inc. | 59,473 | | 3,940,866 |
CJ CheilJedang Corp. (a) | 3,144 | | 1,042,065 |
CJ Corp. | 17,477 | | 1,956,598 |
Doosan Heavy Industries & Construction Co. Ltd. | 61,211 | | 11,303,752 |
Duzon Digital Ware Co. Ltd. | 111,625 | | 2,155,091 |
Empas Corp. (a) | 77,786 | | 3,582,806 |
eSang Networks Co. Ltd. | 54,991 | | 1,779,641 |
Hana Tour Service, Inc. | 39,061 | | 3,522,729 |
Hyundai Engineering & Construction Co. Ltd. (a) | 60,806 | | 6,226,725 |
Hyunjin Materials Co. Ltd. | 80,780 | | 5,307,822 |
Infopia Co. Ltd. | 20,408 | | 1,384,554 |
Korean Reinsurance Co. | 279,506 | | 4,986,283 |
Kyeryong Construction Industrial Co. Ltd. | 67,780 | | 3,185,721 |
LG Household & Health Care Ltd. | 39,854 | | 8,885,665 |
Mobilians Co. Ltd. | 144,281 | | 1,030,932 |
NHN Corp. (a) | 50,717 | | 16,309,480 |
Nice e-Banking Services | 49,777 | | 3,751,943 |
S.M. Entertainment Co. Ltd. (a) | 336,955 | | 1,171,432 |
Samsung Fire & Marine Insurance Co. Ltd. | 28,064 | | 7,808,255 |
Seoul Semiconductor Co. Ltd. | 101,217 | | 3,275,763 |
SFA Engineering Corp. | 125,300 | | 9,611,431 |
Shinhan Financial Group Co. Ltd. | 95,711 | | 6,267,636 |
SK Chemicals Co. Ltd. | 13,368 | | 1,332,879 |
TK Corp. | 237,587 | | 10,148,368 |
TSM Tech Co. Ltd. | 133,520 | | 2,616,998 |
Woongjin Coway Co. Ltd. | 108,280 | | 4,150,486 |
YBM Sisa.com, Inc. | 138,305 | | 2,281,532 |
Yuhan Corp. | 13,309 | | 2,848,631 |
TOTAL KOREA (SOUTH) | | 134,313,574 |
Malaysia - 3.6% |
Bumiputra-Commerce Holdings Bhd | 1,600,200 | | 5,565,155 |
Gamuda Bhd | 6,586,342 | | 9,081,150 |
IJM Corp. Bhd | 1,348,100 | | 3,541,322 |
IOI Corp. Bhd | 1,982,555 | | 4,523,081 |
JobStreet Corp. Bhd | 259,400 | | 170,920 |
KNM Group Bhd | 1,776,600 | | 3,144,685 |
MMC Corp. Bhd | 1,898,877 | | 4,944,490 |
|
| Shares | | Value |
Muhibbah Engineering (M) Bhd | 1,890,500 | | $ 2,220,999 |
Parkson Holdings Bhd | 1,349,413 | | 3,893,313 |
Resorts World Bhd | 3,449,700 | | 3,996,728 |
Scomi Group Bhd | 2,678,800 | | 1,341,677 |
Zelan Bhd | 1,551,400 | | 2,816,702 |
TOTAL MALAYSIA | | 45,240,222 |
New Zealand - 0.2% |
Pumpkin Patch Ltd. | 810,238 | | 1,899,561 |
Papua New Guinea - 0.9% |
Lihir Gold Ltd. (a) | 1,592,440 | | 6,322,177 |
Oil Search Ltd. | 1,394,295 | | 5,580,391 |
TOTAL PAPUA NEW GUINEA | | 11,902,568 |
Philippines - 0.5% |
Alliance Global Group, Inc. (a) | 49,353,542 | | 6,137,228 |
DMCI Holdings, Inc. | 845,000 | | 233,506 |
Vista Land & Lifescapes, Inc. | 3,277,000 | | 415,049 |
TOTAL PHILIPPINES | | 6,785,783 |
Singapore - 8.4% |
China Petrotech Holdings Ltd. | 8,933,000 | | 2,841,933 |
Cosco Corp. Singapore Ltd. | 2,252,000 | | 12,230,148 |
CSE Global Ltd. | 6,939,500 | | 6,053,670 |
DBS Group Holdings Ltd. | 589,000 | | 9,218,900 |
Ezra Holdings Ltd. | 1,466,000 | | 7,069,891 |
Gallant Venture Ltd. (a) | 3,052,000 | | 2,409,088 |
Goodpack Ltd. | 11,964,000 | | 17,974,093 |
Goodpack Ltd. warrants 7/16/09 (a) | 1,143,125 | | 553,074 |
Keppel Corp. Ltd. | 1,941,000 | | 19,951,796 |
KS Energy Services Ltd. | 1,016,000 | | 2,666,913 |
Olam International Ltd. | 4,819,000 | | 11,767,961 |
Parkway Holdings Ltd. | 3,582,000 | | 10,389,009 |
Pertama Holdings Ltd. | 10,644,000 | | 3,752,032 |
TOTAL SINGAPORE | | 106,878,508 |
Taiwan - 4.0% |
Apex Biotechnology Corp. | 440,000 | | 1,089,304 |
D-Link Corp. | 1,857,700 | | 4,157,532 |
E-Life Mall Corp. Ltd. | 1,346,050 | | 2,700,826 |
Everlight Electronics Co. Ltd. | 575,760 | | 2,514,895 |
Gemtek Technology Corp. | 651,510 | | 1,466,124 |
Hon Hai Precision Industry Co. Ltd. (Foxconn) | 1,549,462 | | 11,766,249 |
Johnson Health Tech Co. Ltd. | 479,600 | | 1,450,866 |
MediaTek, Inc. | 444,642 | | 8,688,328 |
Phoenix Precision Technology Corp. | 2,667,589 | | 3,367,939 |
Siliconware Precision Industries Co. Ltd. | 1,315,450 | | 2,773,429 |
Taishin Financial Holdings Co. Ltd. (a) | 4,941,000 | | 2,425,124 |
Tsann Kuen Enterprise Co. Ltd. | 2,204,000 | | 3,347,331 |
Wistron Corp. | 2,262,881 | | 4,505,505 |
TOTAL TAIWAN | | 50,253,452 |
Common Stocks - continued |
| Shares | | Value |
Thailand - 3.2% |
ACL Bank PCL (For. Reg.) (a) | 5,636,200 | | $ 970,186 |
Bumrungrad Hospital PCL (For. Reg.) | 4,920,300 | | 6,406,452 |
Central Pattana PCL (For. Reg.) | 2,958,071 | | 2,241,293 |
Italian-Thai Development PCL (a) | 9,381,900 | | 2,346,510 |
Khon Kaen Sugar Industry PCL (For. Reg.) | 7,105,600 | | 2,801,678 |
Minor International PCL (For. Reg.) | 12,251,586 | | 6,416,897 |
Siam Commercial Bank PCL (For. Reg.) | 2,275,952 | | 6,362,084 |
Thai Oil PCL (For. Reg.) | 992,000 | | 2,802,177 |
Thai Stanley Electric PCL | 410,190 | | 1,846,670 |
Ticon Industrial Connection PCL (For. Reg.) | 7,222,400 | | 4,356,604 |
Total Access Communication PCL (a) | 2,788,180 | | 3,345,816 |
True Corp. PCL (For. Reg.) rights 4/30/08 (a) | 206,113 | | 0 |
TOTAL THAILAND | | 39,896,367 |
Vietnam - 0.2% |
Luks Group (Vietnam Holdings) Co. Ltd. | 2,080,000 | | 2,758,080 |
TOTAL COMMON STOCKS (Cost $821,781,254) | 1,249,828,473 |
Money Market Funds - 4.2% |
| | | |
Fidelity Cash Central Fund, 4.97% (b) | 14,679,372 | | 14,679,372 |
Fidelity Securities Lending Cash Central Fund, 5.02% (b)(c) | 39,115,331 | | 39,115,331 |
TOTAL MONEY MARKET FUNDS (Cost $53,794,703) | 53,794,703 |
TOTAL INVESTMENT PORTFOLIO - 102.9% (Cost $875,575,957) | | 1,303,623,176 |
NET OTHER ASSETS - (2.9)% | | (37,109,675) |
NET ASSETS - 100% | $ 1,266,513,501 |
Legend |
(a) Non-income producing |
(b) Affiliated fund that is available only to investment companies and other accounts managed by Fidelity Investments. The rate quoted is the annualized seven-day yield of the fund at period end. A complete unaudited listing of the fund's holdings as of its most recent quarter end is available upon request. |
(c) Investment made with cash collateral received from securities on loan. |
(d) Security or a portion of the security is on loan at period end. |
Affiliated Central Funds |
Information regarding fiscal year to date income earned by the Fund from investments in Fidelity Central Funds is as follows: |
Fund | Income earned |
Fidelity Cash Central Fund | $ 401,893 |
Fidelity Securities Lending Cash Central Fund | 574,429 |
Total | $ 976,322 |
See accompanying notes which are an integral part of the financial statements.
Annual Report
Pacific Basin
Financial Statements
Statement of Assets and Liabilities
| October 31, 2007 |
| | |
Assets | | |
Investment in securities, at value (including securities loaned of $37,194,928) - See accompanying schedule: Unaffiliated issuers (cost $821,781,254) | $ 1,249,828,473 | |
Fidelity Central Funds (cost $53,794,703) | 53,794,703 | |
Total Investments (cost $875,575,957) | | $ 1,303,623,176 |
Foreign currency held at value (cost $152) | | 153 |
Receivable for investments sold | | 16,309,173 |
Receivable for fund shares sold | | 3,392,922 |
Dividends receivable | | 1,657,110 |
Distributions receivable from Fidelity Central Funds | | 135,802 |
Prepaid expenses | | 480 |
Other receivables | | 208,200 |
Total assets | | 1,325,327,016 |
| | |
Liabilities | | |
Payable for investments purchased | $ 15,964,305 | |
Payable for fund shares redeemed | 1,054,848 | |
Accrued management fee | 845,777 | |
Other affiliated payables | 252,020 | |
Other payables and accrued expenses | 1,581,234 | |
Collateral on securities loaned, at value | 39,115,331 | |
Total liabilities | | 58,813,515 |
| | |
Net Assets | | $ 1,266,513,501 |
Net Assets consist of: | | |
Paid in capital | | $ 678,471,394 |
Undistributed net investment income | | 7,712,722 |
Accumulated undistributed net realized gain (loss) on investments and foreign currency transactions | | 153,679,049 |
Net unrealized appreciation (depreciation) on investments and assets and liabilities in foreign currencies | | 426,650,336 |
Net Assets, for 33,937,165 shares outstanding | | $ 1,266,513,501 |
Net Asset Value, offering price and redemption price per share ($1,266,513,501 ÷ 33,937,165 shares) | | $ 37.32 |
Statement of Operations
| Year ended October 31, 2007 |
| | |
Investment Income | | |
Dividends | | $ 20,505,367 |
Interest | | 6,029 |
Income from Fidelity Central Funds (including $574,429 from security lending) | | 976,322 |
| | 21,487,718 |
Less foreign taxes withheld | | (1,420,842) |
Total income | | 20,066,876 |
| | |
Expenses | | |
Management fee
Basic fee | $ 7,729,637 | |
Performance adjustment | 1,402,037 | |
Transfer agent fees | 2,422,611 | |
Accounting and security lending fees | 507,864 | |
Custodian fees and expenses | 703,313 | |
Independent trustees' compensation | 4,089 | |
Registration fees | 47,524 | |
Audit | 137,673 | |
Legal | 2,550 | |
Interest | 37,765 | |
Miscellaneous | 38,833 | |
Total expenses before reductions | 13,033,896 | |
Expense reductions | (745,077) | 12,288,819 |
Net investment income (loss) | | 7,778,057 |
Realized and Unrealized Gain (Loss) Net realized gain (loss) on: | | |
Investment securities: | | |
Unaffiliated issuers (net of foreign taxes of $238,421) | 165,594,051 | |
Foreign currency transactions | 237,415 | |
Total net realized gain (loss) | | 165,831,466 |
Change in net unrealized appreciation (depreciation) on: Investment securities (net of increase in deferred foreign taxes of $922,570) | 264,201,947 | |
Assets and liabilities in foreign currencies | (62,896) | |
Total change in net unrealized appreciation (depreciation) | | 264,139,051 |
Net gain (loss) | | 429,970,517 |
Net increase (decrease) in net assets resulting from operations | | $ 437,748,574 |
See accompanying notes which are an integral part of the financial statements.
Annual Report
Pacific Basin
Financial Statements - continued
Statement of Changes in Net Assets
| Year ended
October 31,
2007 | Year ended
October 31,
2006 |
Increase (Decrease) in Net Assets | | |
Operations | | |
Net investment income (loss) | $ 7,778,057 | $ 6,138,792 |
Net realized gain (loss) | 165,831,466 | 97,497,094 |
Change in net unrealized appreciation (depreciation) | 264,139,051 | 59,273,598 |
Net increase (decrease) in net assets resulting from operations | 437,748,574 | 162,909,484 |
Distributions to shareholders from net investment income | (5,493,694) | (5,529,029) |
Distributions to shareholders from net realized gain | (78,016,295) | (9,829,319) |
Total distributions | (83,509,989) | (15,358,348) |
Share transactions
Proceeds from sales of shares | 356,516,330 | 667,355,117 |
Reinvestment of distributions | 78,904,207 | 14,211,173 |
Cost of shares redeemed | (496,318,818) | (505,973,121) |
Net increase (decrease) in net assets resulting from share transactions | (60,898,281) | 175,593,169 |
Redemption fees | 368,023 | 810,944 |
Total increase (decrease) in net assets | 293,708,327 | 323,955,249 |
| | |
Net Assets | | |
Beginning of period | 972,805,174 | 648,849,925 |
End of period (including undistributed net investment income of $7,712,722 and undistributed net investment income of $5,642,285, respectively) | $ 1,266,513,501 | $ 972,805,174 |
Other Information Shares | | |
Sold | 11,592,776 | 25,188,605 |
Issued in reinvestment of distributions | 2,961,664 | 586,996 |
Redeemed | (16,176,357) | (19,160,860) |
Net increase (decrease) | (1,621,917) | 6,614,741 |
Financial Highlights
Years ended October 31, | 2007 | 2006 | 2005 | 2004 | 2003 |
Selected Per-Share Data | | | | | |
Net asset value, beginning of period | $ 27.36 | $ 22.42 | $ 17.91 | $ 17.06 | $ 12.73 |
Income from Investment Operations | | | | | |
Net investment income (loss) D | .22 | .16 | .22 G | .07 | .06 |
Net realized and unrealized gain (loss) | 12.16 | 5.26 | 4.49 | .92 | 4.26 |
Total from investment operations | 12.38 | 5.42 | 4.71 | .99 | 4.32 |
Distributions from net investment income | (.16) | (.18) | (.08) | (.16) | - |
Distributions from net realized gain | (2.27) | (.32) | (.13) | - | - |
Total distributions | (2.43) | (.50) | (.21) | (.16) | - |
Redemption fees added to paid in capital D | .01 | .02 | .01 | .02 | .01 |
Net asset value, end of period | $ 37.32 | $ 27.36 | $ 22.42 | $ 17.91 | $ 17.06 |
Total Return A, B, C | 48.86% | 24.55% | 26.62% | 5.98% | 34.01% |
Ratios to Average Net Assets E, H | | | | | |
Expenses before reductions | 1.19% | 1.14% | 1.10% | 1.20% | 1.17% |
Expenses net of fee waivers, if any | 1.19% | 1.14% | 1.10% | 1.20% | 1.17% |
Expenses net of all reductions | 1.13% | 1.08% | 1.05% | 1.19% | 1.17% |
Net investment income (loss) | .71% | .60% | 1.09% G | .42% | .41% |
Supplemental Data | | | | | |
Net assets, end of period (000 omitted) | $ 1,266,514 | $ 972,805 | $ 648,850 | $ 445,127 | $ 419,251 |
Portfolio turnover rate F | 91% | 75% | 78% | 145% | 97% |
A Total returns would have been lower had certain expenses not been reduced during the periods shown. B Total returns do not include the effect of the former sales charges. C Total returns do not include the effect of the former contingent deferred sales charge. D Calculated based on average shares outstanding during the period. E Fees and expenses of the underlying Fidelity Central Funds are not included in the Fund's expense ratio. The Fund indirectly bears its proportionate share of the expenses of any underlying Fidelity Central Funds. F Amount does not include the portfolio activity of any underlying Fidelity Central Funds. G Investment income per share reflects a special dividend which amounted to $.05 per share. Excluding the special dividend, the ratio of net investment income (loss) to average net assets would have been .84%. H Expense ratios reflect operating expenses of the Fund. Expenses before reductions do not reflect amounts reimbursed by the investment adviser or reductions from brokerage service arrangements or other expense offset arrangements and do not represent the amount paid by the Fund during periods when reimbursements or reductions occur. Expenses net of fee waivers reflect expenses after reimbursement by the investment adviser but prior to reductions from brokerage service arrangements or other expense offset arrangements. Expenses net of all reductions represent the net expenses paid by the Fund. |
See accompanying notes which are an integral part of the financial statements.
Annual Report
Southeast Asia
Performance: The Bottom Line
Average annual total return reflects the change in the value of an investment, assuming reinvestment of the fund's dividend income and capital gains (the profits earned upon the sale of securities that have grown in value) and assuming a constant rate of performance each year. The $10,000 table and the fund's returns do not reflect the deduction of taxes that a shareholder would pay on fund distributions or the redemption of fund shares. During periods of reimbursement by Fidelity, a fund's total returns will be greater than it would be had the reimbursement not occurred. How a fund did yesterday is no guarantee of how it will do tomorrow.
Average Annual Total Returns
Periods ended October 31, 2007 | Past 1
year | Past 5
years | Past 10
years |
Fidelity Southeast Asia Fund | 104.22% | 40.96% | 19.36% |
$10,000 Over 10 Years
Let's say hypothetically that $10,000 was invested in Fidelity Southeast Asia Fund on October 31, 1997. The chart shows how the value of your investment would have changed, and also shows how the MSCI AC Far East ex Japan Index performed over the same period.
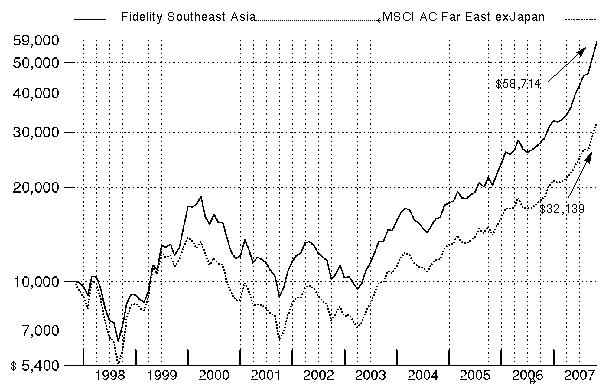
Annual Report
Southeast Asia
Management's Discussion of Fund Performance
Comments from Allan Liu, Portfolio Manager of Fidelity® Southeast Asia Fund
Foreign stocks, with a large assist from a weak U.S. dollar, generally had higher returns for U.S. investors than domestic equities during the 12-month period ending October 31, 2007. The backdrop for global stocks was solid, with robust economic growth and relatively high corporate profitability worldwide. Developed international equity markets, as measured by the Morgan Stanley Capital InternationalSM Europe, Australasia, and Far East (MSCI® EAFE®) Index - a performance monitor of established markets outside the United States and Canada - rose 25.09%. In comparison, the Standard & Poor's 500SM Index, a gauge of U.S. stocks, was up 14.56%, while Canada did appreciably better, as measured by the 43.24% advance of the S&P/TSX Composite Index. Among countries making up at least 1% of the EAFE benchmark, Finland had the best showing, soaring nearly 69%, while Hong Kong gained roughly 66%. The United Kingdom and Japan, the two largest components of the index, both underperformed. Fallout from the credit crunch and concerns about export growth tempered UK stocks, while Japan struggled with a slowdown in consumer spending and sluggish domestic growth. Emerging markets were the period's big winners, advancing 68.33% as measured by the MSCI Emerging Markets index.
During the past year, the fund returned 104.22%, far ahead of the 72.24% return of the MSCI All Country Far East ex Japan index. Favorable stock selection in industrials - along with a substantial overweighting in that strong-performing sector - were the biggest drivers of performance versus the index. Overweighting the diversified financials segment also added considerable value, as did underweighting banks. Underweighting information technology, the benchmark sector with the most modest gain, further boosted performance. The top contributor on a country basis was China, where the fund benefited from both a large overweighting and rewarding stock picking. Stock selection in South Korea, Singapore and Hong Kong also added value. Singapore-listed Cosco, a ship repairer and builder, benefited from robust shipping activity, among other factors. China Cosco Holdings, the leading shipping company in China, also helped our results, as did two Korean engineering and construction companies, Doosan Heavy Industries & Construction and Hyundai Heavy Industries. Further, underweighting Korea-based Samsung Electronics, a major index component, proved beneficial. Conversely, my stock selection in utilities detracted a bit, and a modest cash position hurt given the extraordinarily strong market environment. Among countries, Indonesia detracted modestly due to ineffective stock selection, mostly due to gas transportation and distribution company Perusahaan Gas Negara, which declined following news of delays in some pipeline projects. Underweighting SK Corp., a Korean oil refiner that I sold during the period, and China's Ping An Insurance also hurt our results.
The views expressed above reflect those of the portfolio manager(s) only through the end of the period as stated on the cover of this report and do not necessarily represent the views of Fidelity or any other person in the Fidelity organization. Any such views are subject to change at any time based upon market or other conditions and Fidelity disclaims any responsibility to update such views. These views may not be relied on as investment advice and, because investment decisions for a Fidelity fund are based on numerous factors, may not be relied on as an indication of trading intent on behalf of any Fidelity fund.
Annual Report
Southeast Asia
Investment Changes
Geographic Diversification (% of fund's net assets) |
As of October 31, 2007 |
| Korea (South) | 28.6% | |
| China | 25.0% | |
| Hong Kong | 15.3% | |
| Taiwan | 9.9% | |
| Singapore | 8.9% | |
| Indonesia | 4.5% | |
| Malaysia | 2.4% | |
| United States of America | 2.1% | |
| Cayman Islands | 2.1% | |
| Other | 1.2% | |

Percentages are adjusted for the effect of futures contracts, if applicable. |
|
As of April 30, 2007 |
| Korea (South) | 26.6% | |
| China | 17.3% | |
| Hong Kong | 14.6% | |
| Taiwan | 12.7% | |
| Singapore | 8.9% | |
| Malaysia | 6.3% | |
| Indonesia | 3.7% | |
| Cayman Islands | 3.4% | |
| United States of America | 2.5% | |
| Other | 4.0% | |

Percentages are adjusted for the effect of futures contracts, if applicable. |
Asset Allocation |
| % of fund's
net assets | % of fund's net assets
6 months ago |
Stocks and Investment Companies | 97.9 | 97.5 |
Short-Term Investments and Net Other Assets | 2.1 | 2.5 |
Top Ten Stocks as of October 31, 2007 |
| % of fund's
net assets | % of fund's net assets
6 months ago |
China Mobile (Hong Kong) Ltd. (Hong Kong, Wireless Telecommunication Services) | 4.3 | 3.3 |
Cosco Corp. Singapore Ltd. (Singapore, Marine) | 2.8 | 1.5 |
POSCO (Korea (South), Metals & Mining) | 2.7 | 2.4 |
Samsung Electronics Co. Ltd. (Korea (South), Semiconductors & Semiconductor Equipment) | 2.1 | 2.6 |
PetroChina Co. Ltd. (H Shares) (China, Oil, Gas & Consumable Fuels) | 2.1 | 1.3 |
Hon Hai Precision Industry Co. Ltd. (Foxconn) (Taiwan, Electronic Equipment & Instruments) | 1.8 | 2.5 |
China Life Insurance Co. Ltd. (H Shares) (China, Insurance) | 1.7 | 1.5 |
Hyundai Heavy Industries Co. Ltd. (Korea (South), Machinery) | 1.7 | 1.8 |
Taiwan Semiconductor Manufacturing Co. Ltd. (Taiwan, Semiconductors & Semiconductor Equipment) | 1.6 | 1.7 |
Hong Kong Exchanges & Clearing Ltd. (Hong Kong, Diversified Financial Services) | 1.6 | 0.9 |
| 22.4 | |
Market Sectors as of October 31, 2007 |
| % of fund's
net assets | % of fund's net assets
6 months ago |
Financials | 25.1 | 30.5 |
Industrials | 25.2 | 21.8 |
Materials | 9.3 | 8.5 |
Information Technology | 9.1 | 10.6 |
Consumer Discretionary | 8.8 | 5.9 |
Energy | 8.0 | 5.5 |
Telecommunication Services | 6.0 | 4.5 |
Consumer Staples | 3.8 | 4.0 |
Utilities | 1.2 | 4.0 |
Health Care | 0.7 | 0.8 |
Annual Report
Southeast Asia
Investments October 31, 2007
Showing Percentage of Net Assets
Common Stocks - 97.2% |
| Shares | | Value |
Australia - 0.5% |
WorleyParsons Ltd. | 647,344 | | $ 29,261,945 |
Bermuda - 0.3% |
Ports Design Ltd. | 4,197,000 | | 15,844,566 |
Cayman Islands - 2.1% |
Alibaba.com Ltd. (a) | 255,500 | | 824,156 |
Belle International Holdings Ltd. | 31,440,000 | | 51,003,792 |
China Infrastructure Machinery Holdings Ltd. | 15,538,000 | | 34,520,646 |
CNinsure, Inc. ADR (a) | 26,500 | | 670,185 |
Enviro Energy International Holdings Ltd. (a) | 19,520,000 | | 6,165,581 |
Mindray Medical International Ltd. sponsored ADR (d) | 210,000 | | 8,349,600 |
NetDragon WebSoft, Inc. (a) | 929,000 | | 1,579,828 |
New World China Land Ltd. | 3,333,600 | | 3,915,562 |
The Ming An (Holdings) Co. Ltd. | 14,400,000 | | 6,200,960 |
Tianjin Port Development Holdings Ltd. | 15,560,000 | | 16,172,011 |
Times Ltd. | 462,000 | | 246,190 |
Wuxi Pharmatech Cayman, Inc. Sponsored ADR | 137,751 | | 5,302,036 |
TOTAL CAYMAN ISLANDS | | 134,950,547 |
China - 25.0% |
Angang Steel Co. Ltd.: | | | |
rights 11/5/07 (a) | 1,619,200 | | 2,548,819 |
(H Shares) | 7,960,000 | | 29,307,224 |
Anhui Conch Cement Co. Ltd. (H Shares) | 3,700,000 | | 36,955,155 |
Baidu.com, Inc. sponsored ADR (a) | 54,000 | | 20,654,460 |
BYD Co. Ltd. (H Shares) | 3,229,000 | | 30,448,872 |
Changsha Zoomlion Heavy Industry Science and Technology Development Co. Ltd. (UBS Warrant Programme) 1/15/10 (a) | 2,245,755 | | 16,892,304 |
Changsha Zoomlion Heavy Industry Science and Technology Development Co. Ltd. warrants: | | | |
(Citigroup Warrant Program) 1/15/10 (a) | 480,267 | | 3,612,512 |
(JPMorgan Warrant Program) 2/13/12 (a)(e) | 398,412 | | 2,996,808 |
China Coal Energy Co. Ltd. (H Shares) | 3,600,000 | | 12,214,961 |
China Construction Bank Corp.
(H Shares) | 23,600,000 | | 26,829,665 |
China Cosco Holdings Co. Ltd.
(H Shares) | 18,962,500 | | 84,568,720 |
China Life Insurance Co. Ltd. (H Shares) | 16,082,000 | | 109,046,681 |
China Mengniu Dairy Co. Ltd. | 8,889,000 | | 37,761,180 |
China Merchants Bank Co. Ltd.
(H Shares) | 11,456,500 | | 59,072,154 |
China Merchants Bank Co. Ltd. warrants (UBS Warrant Programme) 3/12/10 (a) | 4,900,000 | | 30,114,967 |
China Molybdenum Co. Ltd. (H Shares) | 5,400,000 | | 14,161,163 |
China Oilfield Services Ltd. (H Shares) | 24,000,000 | | 58,772,465 |
|
| Shares | | Value |
China Petroleum & Chemical Corp.
(H Shares) | 40,340,000 | | $ 66,928,094 |
China Resources Land Ltd. | 7,448,000 | | 18,843,392 |
China Shipping Container Lines Co. Ltd. (H Shares) | 25,864,100 | | 34,306,380 |
China Shipping Development Co. Ltd.
(H Shares) | 6,440,000 | | 22,004,685 |
China Vanke Co. Ltd. (B Shares) | 2,770,000 | | 8,402,442 |
Citic Securities Co. Ltd. warrants: | | | |
(Goldman Sachs International Warrant Program) 9/7/10 (a) | 440,000 | | 6,299,891 |
(UBS Warrant Programme) 9/7/10 (a) | 1,070,000 | | 15,320,188 |
Dongfang Electrical Machinery Co. Ltd. (H Shares) | 2,280,000 | | 20,382,164 |
Dongfeng Motor Group Co. Ltd. (H Shares) | 22,800,000 | | 21,023,248 |
Focus Media Holding Ltd. ADR (a)(d) | 830,000 | | 51,460,000 |
Guangzhou R&F Properties Co. Ltd.
(H Shares) | 1,620,000 | | 8,528,754 |
Guangzhou Shipyard International Co. Ltd. (a) | 1,700,000 | | 14,116,265 |
Harbin Power Equipment Co. Ltd.
(H Shares) | 14,392,000 | | 47,107,494 |
Henan Pinggao Electric Co. Ltd. warrants (UBS Warrant Programme) 7/12/10 (a) | 2,020,554 | | 5,748,889 |
Huadian Power International Corp. Ltd. (H shares) | 9,800,000 | | 6,789,059 |
Huaneng Power International, Inc.
(H Shares) | 19,200,000 | | 23,064,000 |
Hudong Heavy Machinery Co. Ltd. warrants (UBS Warrant Programme) 6/8/10 (a) | 1,195,812 | | 41,707,225 |
Industrial & Commercial Bank of China | 43,840,000 | | 41,871,615 |
Inner Mongolia Baotou Steel Union Co. Ltd. warrants: | | | |
(Citigroup Warrant Program) 1/17/12 (a) | 557,033 | | 4,361,600 |
(UBS Warrant Programme) 10/24/08 (a) | 808,532 | | 6,330,851 |
Jinan Diesel Engine Co. Ltd. warrants: | | | |
(JPMorgan Warrant Program) 8/8/12 (a)(e) | 221,300 | | 1,510,547 |
(UBS Warrant Programme) 6/11/10 (a) | 3,046,643 | | 20,795,736 |
Jingwei Textile Machinery Co. Ltd.
(H Shares) | 7,000,000 | | 4,360,836 |
Li Ning Co. Ltd. | 14,006,000 | | 52,635,930 |
Nine Dragons Paper (Holdings) Ltd. | 14,320,000 | | 38,789,611 |
Offshore Oil Engine Co. Ltd. warrants (UBS Warrant Programme) 7/30/08 (a) | 2,770,747 | | 18,983,685 |
Offshore Oil Engineering Co. Ltd. warrants: | | | |
(Citigroup Warrant Program) 1/20/10 (a) | 319,998 | | 2,192,456 |
(Goldman Sachs International Warrant Program) 9/24/09 (a) | 240,000 | | 1,644,352 |
Common Stocks - continued |
| Shares | | Value |
China - continued |
Offshore Oil Engineering Co. Ltd. warrants: - continued | | | |
(JPMorgan Warrant Program) 8/8/12 (a)(e) | 170,440 | | $ 1,167,764 |
PetroChina Co. Ltd. (H Shares) | 49,178,000 | | 129,141,428 |
Ping An Insurance (Group) Co. of China, Ltd. (H Shares) | 960,000 | | 13,437,833 |
Pingdingshan Tianan Coal Mining Co. Ltd. warrants (UBS Warrant Programme) 3/16/10 (a) | 5,089,251 | | 29,523,982 |
Sany Heavy Industry Co. Ltd. warrants: | | | |
(Goldman Sachs International Warrant Program) 9/24/09 (a) | 200,000 | | 1,727,397 |
(UBS Warrant Programme) 6/28/10 (a) | 2,651,187 | | 22,898,265 |
Shandong Weigao Group Medical Polymer Co. Ltd. (H Shares) | 9,600,000 | | 21,383,678 |
Shanghai Electric (Group) Corp.
(H Shares) | 13,800,000 | | 13,703,675 |
Shanghai International Airport warrants (UBS Warrant Programme) 1/15/10 (a) | 1,258,927 | | 6,091,790 |
Shanghai Zhenhua Port Machinery Co. Ltd. (B Shares) | 10,000,000 | | 34,558,250 |
Shenyang Machine Tool Co. Ltd. warrants: | | | |
(Goldman Sachs International Warrant Program) 9/16/09 (a) | 1,060,000 | | 2,879,806 |
(JPMorgan Warrant Program) 8/8/12 (a)(e) | 270,800 | | 735,709 |
(UBS Warrant Programme) 8/1/08 (a) | 6,591,787 | | 17,908,556 |
Shenzhen Chiwan Wharf Holding Ltd.
(B Shares) | 522,589 | | 1,258,641 |
Tencent Holdings Ltd. | 3,072,000 | | 26,334,365 |
Tsingtao Brewery Co. Ltd. (H Shares) | 2,080,000 | | 7,423,643 |
Weichai Power Co. Ltd. (H Shares) | 3,775,000 | | 38,879,132 |
Yantai Changyu Pioneer Wine Co. (B Shares) | 2,171,100 | | 16,178,912 |
Zhejiang Glass Co. Ltd. Class H (a) | 4,737,000 | | 6,249,789 |
TOTAL CHINA | | 1,572,950,114 |
Hong Kong - 14.6% |
Asia Financial Holdings Ltd. | 9,400,000 | | 5,341,432 |
ASM Pacific Technology Ltd. | 1,485,000 | | 11,642,891 |
Bank of East Asia Ltd. | 2,960,000 | | 20,139,612 |
Cheung Kong Holdings Ltd. | 2,945,000 | | 57,766,685 |
China Insurance International Holdings Co. Ltd. (a) | 4,600,000 | | 15,016,898 |
China Mobile (Hong Kong) Ltd. | 13,080,800 | | 271,243,467 |
China Overseas Land & Investment Ltd. | 18,400,000 | | 44,041,725 |
China Overseas Land & Investment Ltd. warrants 8/27/08 (a) | 933,333 | | 776,739 |
China Travel International Investment HK Ltd. | 31,200,000 | | 25,066,679 |
Citic Pacific Ltd. | 2,000,000 | | 12,611,588 |
|
| Shares | | Value |
CNOOC Ltd. | 36,220,000 | | $ 78,412,678 |
Cosco International Holdings Ltd. | 10,300,000 | | 15,867,930 |
Cosco Pacific Ltd. | 17,096,000 | | 53,274,812 |
Dynasty Fine Wines Group Ltd. | 1,122,000 | | 496,437 |
Esprit Holdings Ltd. | 4,236,700 | | 70,757,552 |
Hong Kong Aircraft & Engineering Co. | 820,000 | | 20,845,345 |
Hong Kong Exchanges & Clearing Ltd. | 2,918,000 | | 97,408,802 |
Hong Kong Land Holdings Ltd. | 233,000 | | 1,160,340 |
Kerry Properties Ltd. | 1,120,000 | | 9,741,884 |
Li & Fung Ltd. | 9,700,000 | | 46,029,329 |
New World Development Co. Ltd. | 2,980,000 | | 10,740,508 |
Orient Overseas International Ltd. | 1,228,500 | | 12,682,666 |
PYI Corp. Ltd. | 10,797,180 | | 4,933,269 |
Sun Hung Kai Properties Ltd. | 1,724,000 | | 32,946,855 |
TOTAL HONG KONG | | 918,946,123 |
Indonesia - 4.5% |
Ciputra Surya Tbk PT (a) | 17,000,000 | | 1,863,061 |
PT Apexindo Pratama Duta Tbk | 19,544,500 | | 5,447,981 |
PT Astra International Tbk | 10,000,000 | | 28,608,850 |
PT Bakrie & Brothers Tbk (a) | 217,044,500 | | 7,689,648 |
PT Bakrie Sumatera Plantations Tbk | 61,750,000 | | 13,763,458 |
PT Bakrie Sumatera Plantations Tbk warrants 9/10/10 (a) | 5,937,500 | | 713,502 |
PT Bank Mandiri Persero Tbk | 38,000,000 | | 16,099,167 |
PT Bank Negara Indonesia (Persero) Tbk | 18,000,000 | | 4,002,518 |
PT Bank Niaga Tbk | 139,911,500 | | 13,480,151 |
PT Bank Rakyat Indonesia Tbk | 17,800,000 | | 15,440,982 |
PT Hexindo Adiperkasa Tbk | 22,500,000 | | 2,048,886 |
PT Indosat Tbk | 17,400,000 | | 16,848,457 |
PT International Nickel Indonesia Tbk | 2,470,500 | | 24,909,769 |
PT Jakarta International Hotel & Development Tbk (a) | 52,000,000 | | 6,077,542 |
PT Perusahaan Gas Negara Tbk Series B | 30,000,000 | | 47,015,190 |
PT Tambang Batubbara Bukit Asam Tbk | 38,500,000 | | 39,133,383 |
PT Telkomunikasi Indonesia Tbk Series B | 30,200,000 | | 36,425,217 |
PT Truba Alam Manunggal Engineering Tbk | 30,000,000 | | 5,019,534 |
TOTAL INDONESIA | | 284,587,296 |
Korea (South) - 28.6% |
Amorepacific Corp. | 31,500 | | 30,098,235 |
Cheil Industries, Inc. | 562,000 | | 37,239,869 |
CJ CheilJedang Corp. (a) | 48,000 | | 15,909,396 |
CJ Home Shopping | 61,801 | | 4,619,275 |
Daelim Industrial Co. | 195,000 | | 42,855,972 |
Dongbu Insurance Co. Ltd. | 220,000 | | 13,384,825 |
Dongbu Securities Co. Ltd. | 400,000 | | 8,396,850 |
Dongkuk Steel Mill Co. Ltd. | 511,268 | | 30,751,396 |
Doosan Construction & Engineering Co. Ltd. (a) | 850,000 | | 18,472,689 |
Doosan Heavy Industries & Construction Co. Ltd. | 338,864 | | 62,577,554 |
Common Stocks - continued |
| Shares | | Value |
Korea (South) - continued |
GS Engineering & Construction Corp. | 207,000 | | $ 43,860,106 |
Hanjin Transportation Co. | 202,000 | | 12,086,881 |
Hanla Level Co. Ltd. | 235,000 | | 5,271,478 |
Hyundai Department Store Co. Ltd. | 420,685 | | 58,857,100 |
Hyundai Engineering & Construction Co. Ltd. (a) | 536,962 | | 54,986,588 |
Hyundai Heavy Industries Co. Ltd. | 187,760 | | 105,579,422 |
Hyundai Industrial Development & Construction Co. | 416,000 | | 46,607,739 |
Hyundai Mipo Dockyard Co. Ltd. | 85,000 | | 37,769,997 |
Hyundai Securities Co. Ltd. | 805,000 | | 19,296,290 |
Hyundai Securities Co. Ltd. rights 11/2/07 (a) | 129,317 | | 682,052 |
Hyundai Steel Co. | 370,000 | | 36,900,221 |
Kolon Industries, Inc. (a) | 270,000 | | 13,199,301 |
Kookmin Bank | 857,000 | | 70,088,850 |
Korea Exchange Bank | 1,420,000 | | 23,488,717 |
Korea Investment Holdings Co. Ltd. | 590,000 | | 52,929,611 |
Korea Iron & Steel Co. Ltd. | 125,169 | | 12,389,506 |
Korean Air Lines Co. Ltd. | 52,706 | | 4,635,806 |
Kumho Industrial Co. Ltd. | 280,000 | | 26,018,936 |
Kyobo Securities Co. Ltd. | 630,000 | | 15,214,719 |
Lotte Shopping Co. Ltd. | 39,000 | | 18,298,210 |
Meritz Fire & Marine Insurance Co. Ltd. | 1,319,173 | | 19,287,554 |
Meritz Securities Co. Ltd. | 1,267,726 | | 16,370,407 |
Mirae Asset Securities Co. Ltd. | 47,111 | | 8,993,850 |
NHN Corp. (a) | 183,978 | | 59,163,308 |
POSCO | 236,331 | | 172,359,731 |
Pulmuone Co. Ltd. | 85,000 | | 5,736,016 |
Samsung Electronics Co. Ltd. | 211,585 | | 130,477,386 |
Samsung Electronics Co. Ltd. GDR | 8,200 | | 2,501,000 |
Samsung Engineering Co. Ltd. | 595,000 | | 80,150,179 |
Samsung Fire & Marine Insurance Co. Ltd. | 266,500 | | 74,148,373 |
Samsung Techwin Co. Ltd. | 585,000 | | 35,898,605 |
Seoul Securities Co. Ltd. | 5,917,099 | | 16,609,014 |
Shinhan Financial Group Co. Ltd. | 1,480,320 | | 96,938,767 |
Shinheung Securities Co. Ltd. | 370,000 | | 5,756,382 |
Shinsegae Co. Ltd. | 72,832 | | 57,390,893 |
SK Energy Co. Ltd. | 219,000 | | 50,336,449 |
SK Securities Co. Ltd. | 3,300,000 | | 15,752,426 |
Solomon Mutual Savings Bank | 81,412 | | 1,331,200 |
STX Engine Co. Ltd. | 308,117 | | 30,692,004 |
UI Energy Corp. (a) | 98,215 | | 890,793 |
TOTAL KOREA (SOUTH) | | 1,803,251,928 |
Malaysia - 2.4% |
Bursa Malaysia Bhd | 3,550,000 | | 16,881,336 |
Cement Industries of Malaysia Bhd | 1,799,900 | | 3,759,858 |
DiGi.com Bhd | 5,050,000 | | 38,036,975 |
DNP Holdings Bhd (a) | 3,696,800 | | 2,478,855 |
Golden Hope Plantation Bhd | 8,600,000 | | 23,466,267 |
|
| Shares | | Value |
Hap Seng Plantations Holdings Bhd (a)(f) | 1,191,600 | | $ 1,089,769 |
Lingkaran Transportation Kota Holdings Bhd | 2,000,000 | | 2,444,226 |
Malaysian Airline System Bhd | 70,733 | | 115,139 |
MMC Corp. Bhd | 2,700,000 | | 7,030,536 |
Public Bank Bhd | 2,100,000 | | 7,025,145 |
Public Bank Bhd (For. Reg.) | 5,390,625 | | 18,537,183 |
SapuraCrest Petroleum Bhd | 9,599,100 | | 5,368,530 |
Sime Darby Bhd | 7,200,000 | | 24,179,910 |
UEM Builders Bhd | 6,216,900 | | 2,678,599 |
TOTAL MALAYSIA | | 153,092,328 |
Philippines - 0.2% |
Philippine Long Distance Telephone Co. | 140,280 | | 9,707,344 |
Singapore - 8.9% |
Banyan Tree Holdings Ltd. | 8,354,000 | | 12,203,500 |
CDL Hospitality Trusts unit | 8,000,000 | | 13,749,457 |
Cosco Corp. Singapore Ltd. | 32,200,000 | | 174,871,560 |
DBS Group Holdings Ltd. | 1,200,000 | | 18,782,140 |
Keppel Corp. Ltd. | 7,220,000 | | 74,215,337 |
Pan-United Corp. Ltd. | 8,797,000 | | 5,351,534 |
Parkway Holdings Ltd. | 2,300,000 | | 6,670,776 |
Raffles Medical Group Ltd. | 5,213,600 | | 5,546,907 |
Rotary Engineering Ltd. | 9,000,000 | | 9,150,183 |
SembCorp Industries Ltd. | 5,000,000 | | 20,652,565 |
SembCorp Marine Ltd. | 7,420,000 | | 23,036,501 |
SIA Engineering Co. Ltd. | 3,800,000 | | 12,499,126 |
Singapore Exchange Ltd. | 7,800,000 | | 85,469,300 |
Straits Asia Resources Ltd. | 14,224,000 | | 26,349,226 |
Yangzijiang Shipbuilding Holdings Ltd. | 38,500,000 | | 68,562,017 |
TOTAL SINGAPORE | | 557,110,129 |
Taiwan - 9.9% |
Acer, Inc. | 6,800,000 | | 16,016,052 |
Advanced Semiconductor Engineering, Inc. | 35,187,065 | | 42,365,226 |
Ambassador Hotel | 11,555,000 | | 11,628,122 |
Ardentec Corp. | 6,679,154 | | 5,927,633 |
China Steel Corp. | 31,000,000 | | 43,636,363 |
Chinatrust Financial Holding Co. Ltd. (a) | 7,422,501 | | 5,407,348 |
Chong Hong Construction Co. Ltd. | 4,430,550 | | 9,300,120 |
Far East Department Stores Co. Ltd. | 13,000,000 | | 15,851,211 |
Farglory Land Developt Co. Ltd. | 2,000,000 | | 5,000,772 |
Formosa Plastics Corp. | 17,900,000 | | 55,144,929 |
Fubon No 2 (REIT) | 7,000,000 | | 2,210,526 |
Fuhwa Financial Holding Co. Ltd. (a) | 14,175,500 | | 10,414,474 |
Goldsun Development & Construction Co. Ltd. | 14,700,000 | | 8,508,257 |
Hon Hai Precision Industry Co. Ltd. (Foxconn) | 15,341,030 | | 116,496,167 |
Huaku Construction Co. Ltd. | 6,380,000 | | 12,722,581 |
Hung Poo Real Estate Development Co. Ltd. | 5,832,750 | | 5,797,640 |
KEE TAI Properties Co. Ltd. | 3,726,450 | | 2,559,454 |
Kindom Construction Co. Ltd. | 10,000,000 | | 4,599,475 |
Common Stocks - continued |
| Shares | | Value |
Taiwan - continued |
Nan Ya Plastics Corp. | 7,200,000 | | $ 21,492,205 |
Shin Kong No 1 REIT | 4,000,000 | | 1,243,402 |
Siliconware Precision Industries Co. Ltd. | 13,707,151 | | 28,899,472 |
Ta Chong Bank (a) | 39,796,000 | | 14,557,265 |
Tainan Spinning Co. Ltd. | 16,000,000 | | 8,025,930 |
Taiwan Chi Cheng Enterprise Co. Ltd. | 1,649,751 | | 3,478,253 |
Taiwan Fertilizer Co. Ltd. | 16,400,000 | | 42,018,830 |
Taiwan Semiconductor Manufacturing Co. Ltd. | 50,003,104 | | 98,478,099 |
Unified-President Enterprises Corp. | 16,200,000 | | 23,228,584 |
WPG Holding Co. Ltd. | 5,200,000 | | 8,587,745 |
Youngtek Electronics Corp. | 232,854 | | 635,416 |
TOTAL TAIWAN | | 624,231,551 |
Thailand - 0.2% |
Central Pattana PCL (For. Reg.) | 5,216,600 | | 3,952,551 |
PTT Chemical PCL | 2,800,000 | | 11,287,333 |
True Corp. PCL (For. Reg.) (a) | 100 | | 22 |
TOTAL THAILAND | | 15,239,906 |
TOTAL COMMON STOCKS (Cost $3,747,398,623) | 6,119,173,777 |
Investment Companies - 0.7% |
| | | |
Hong Kong - 0.7% |
iShares FTSE/Xinhua A50 China Tracker
(Cost $12,891,017) | 11,107,200 | | 39,697,490 |
Money Market Funds - 4.8% |
| | | |
Fidelity Cash Central Fund, 4.97% (b) | 267,882,700 | | 267,882,700 |
Fidelity Securities Lending Cash Central Fund, 5.02% (b)(c) | 35,355,675 | | 35,355,675 |
TOTAL MONEY MARKET FUNDS (Cost $303,238,375) | 303,238,375 |
TOTAL INVESTMENT PORTFOLIO - 102.7% (Cost $4,063,528,015) | | 6,462,109,642 |
NET OTHER ASSETS - (2.7)% | | (168,173,148) |
NET ASSETS - 100% | $ 6,293,936,494 |
Legend |
(a) Non-income producing |
(b) Affiliated fund that is available only to investment companies and other accounts managed by Fidelity Investments. The rate quoted is the annualized seven-day yield of the fund at period end. A complete unaudited listing of the fund's holdings as of its most recent quarter end is available upon request. |
(c) Investment made with cash collateral received from securities on loan. |
(d) Security or a portion of the security is on loan at period end. |
(e) Security exempt from registration under Rule 144A of the Securities Act of 1933. These securities may be resold in transactions exempt from registration, normally to qualified institutional buyers. At the end of the period, the value of these securities amounted to $6,410,828 or 0.1% of net assets. |
(f) Security or a portion of the security purchased on a delayed delivery or when-issued basis. |
Affiliated Central Funds |
Information regarding fiscal year to date income earned by the Fund from investments in Fidelity Central Funds is as follows: |
Fund | Income earned |
Fidelity Cash Central Fund | $ 5,347,872 |
Fidelity Securities Lending Cash Central Fund | 181,763 |
Total | $ 5,529,635 |
See accompanying notes which are an integral part of the financial statements.
Annual Report
Southeast Asia
Financial Statements
Statement of Assets and Liabilities
| October 31, 2007 |
| | |
Assets | | |
Investment in securities, at value (including securities loaned of $35,229,800) - See accompanying schedule: Unaffiliated issuers (cost $3,760,289,640) | $ 6,158,871,267 | |
Fidelity Central Funds (cost $303,238,375) | 303,238,375 | |
Total Investments (cost $4,063,528,015) | | $ 6,462,109,642 |
Cash | | 1,021,991 |
Foreign currency held at value (cost $2,604,820) | | 2,605,958 |
Receivable for investments sold | | 79,250,764 |
Receivable for fund shares sold | | 51,086,468 |
Dividends receivable | | 1,015,493 |
Distributions receivable from Fidelity Central Funds | | 1,452,658 |
Prepaid expenses | | 594 |
Other receivables | | 1,420,175 |
Total assets | | 6,599,963,743 |
| | |
Liabilities | | |
Payable for investments purchased
Regular delivery | $ 160,382,038 | |
Delayed delivery | 1,100,667 | |
Payable for fund shares redeemed | 104,106,679 | |
Accrued management fee | 3,675,818 | |
Other affiliated payables | 851,667 | |
Other payables and accrued expenses | 554,705 | |
Collateral on securities loaned, at value | 35,355,675 | |
Total liabilities | | 306,027,249 |
| | |
Net Assets | | $ 6,293,936,494 |
Net Assets consist of: | | |
Paid in capital | | $ 3,482,641,770 |
Undistributed net investment income | | 27,443,001 |
Accumulated undistributed net realized gain (loss) on investments and foreign currency transactions | | 385,438,794 |
Net unrealized appreciation (depreciation) on investments and assets and liabilities in foreign currencies | | 2,398,412,929 |
Net Assets, for 127,442,813 shares outstanding | | $ 6,293,936,494 |
Net Asset Value, offering price and redemption price per share ($6,293,936,494 ÷ 127,442,813 shares) | | $ 49.39 |
Statement of Operations
| Year ended October 31, 2007 |
| | |
Investment Income | | |
Dividends | | $ 60,737,880 |
Interest | | 124,012 |
Income from Fidelity Central Funds (including $181,763 from security lending) | | 5,529,635 |
| | 66,391,527 |
Less foreign taxes withheld | | (7,293,179) |
Total income | | 59,098,348 |
| | |
Expenses | | |
Management fee
Basic fee | $ 21,412,562 | |
Performance adjustment | 2,267,874 | |
Transfer agent fees | 5,878,359 | |
Accounting and security lending fees | 1,181,450 | |
Custodian fees and expenses | 1,769,226 | |
Independent trustees' compensation | 9,923 | |
Registration fees | 309,444 | |
Audit | 108,405 | |
Legal | 4,350 | |
Interest | 37,947 | |
Miscellaneous | 79,097 | |
Total expenses before reductions | 33,058,637 | |
Expense reductions | (3,223,569) | 29,835,068 |
Net investment income (loss) | | 29,263,280 |
Realized and Unrealized Gain (Loss) Net realized gain (loss) on: | | |
Investment securities: | | |
Unaffiliated issuers (net of foreign taxes of $(508)) | 391,511,297 | |
Investment not meeting investment restrictions | 2,280 | |
Foreign currency transactions | (2,210,328) | |
Total net realized gain (loss) | | 389,303,249 |
Change in net unrealized appreciation (depreciation) on: Investment securities | 2,028,002,084 | |
Assets and liabilities in foreign currencies | (193,287) | |
Total change in net unrealized appreciation (depreciation) | | 2,027,808,797 |
Net gain (loss) | | 2,417,112,046 |
Net increase (decrease) in net assets resulting from operations | | $ 2,446,375,326 |
See accompanying notes which are an integral part of the financial statements.
Annual Report
Southeast Asia
Financial Statements - continued
Statement of Changes in Net Assets
| Year ended October 31,
2007 | Year ended
October 31,
2006 |
Increase (Decrease) in Net Assets | | |
Operations | | |
Net investment income (loss) | $ 29,263,280 | $ 17,990,728 |
Net realized gain (loss) | 389,303,249 | 101,570,768 |
Change in net unrealized appreciation (depreciation) | 2,027,808,797 | 243,787,082 |
Net increase (decrease) in net assets resulting from operations | 2,446,375,326 | 363,348,578 |
Distributions to shareholders from net investment income | (15,348,089) | (11,222,484) |
Distributions to shareholders from net realized gain | (86,082,743) | (18,514,528) |
Total distributions | (101,430,832) | (29,737,012) |
Share transactions
Proceeds from sales of shares | 3,409,321,043 | 839,465,156 |
Reinvestment of distributions | 97,580,587 | 28,757,013 |
Cost of shares redeemed | (1,154,364,384) | (393,593,644) |
Net increase (decrease) in net assets resulting from share transactions | 2,352,537,246 | 474,628,525 |
Redemption fees | 3,507,067 | 942,767 |
Total increase (decrease) in net assets | 4,700,988,807 | 809,182,858 |
| | |
Net Assets | | |
Beginning of period | 1,592,947,687 | 783,764,829 |
End of period (including undistributed net investment income of $27,443,001 and undistributed net investment income of $13,779,108, respectively) | $ 6,293,936,494 | $ 1,592,947,687 |
Other Information Shares | | |
Sold | 94,400,629 | 36,006,623 |
Issued in reinvestment of distributions | 3,728,720 | 1,416,326 |
Redeemed | (32,941,955) | (17,069,282) |
Net increase (decrease) | 65,187,394 | 20,353,667 |
Financial Highlights
Years ended October 31, | 2007 | 2006 | 2005 | 2004 | 2003 |
Selected Per-Share Data | | | | | |
Net asset value, beginning of period | $ 25.59 | $ 18.70 | $ 14.87 | $ 13.72 | $ 9.96 |
Income from Investment Operations | | | | | |
Net investment income (loss) C | .33 | .33 | .30 | .16 | .15 |
Net realized and unrealized gain (loss) | 24.95 | 7.23 | 3.66 | 1.10 | 3.68 |
Total from investment operations | 25.28 | 7.56 | 3.96 | 1.26 | 3.83 |
Distributions from net investment income | (.23) | (.26) | (.14) | (.13) | (.08) |
Distributions from net realized gain | (1.29) | (.43) | - | - | - |
Total distributions | (1.52) | (.69) | (.14) | (.13) | (.08) |
Redemption fees added to paid in capital C | .04 | .02 | .01 | .02 | .01 |
Net asset value, end of period | $ 49.39 | $ 25.59 | $ 18.70 | $ 14.87 | $ 13.72 |
Total Return A, B | 104.22% | 41.50% | 26.84% | 9.39% | 38.81% |
Ratios to Average Net Assets D, F | | | | | |
Expenses before reductions | 1.08% | 1.21% | 1.20% | 1.21% | 1.32% |
Expenses net of fee waivers, if any | 1.08% | 1.21% | 1.20% | 1.21% | 1.32% |
Expenses net of all reductions | .98% | 1.04% | 1.09% | 1.20% | 1.32% |
Net investment income (loss) | .96% | 1.44% | 1.71% | 1.11% | 1.35% |
Supplemental Data | | | | | |
Net assets, end of period (000 omitted) | $ 6,293,936 | $ 1,592,948 | $ 783,765 | $ 464,874 | $ 395,554 |
Portfolio turnover rate E | 72% | 100% | 109% | 131% | 115% |
A Total returns would have been lower had certain expenses not been reduced during the periods shown. B Total returns do not include the effect of the former sales charges. C Calculated based on average shares outstanding during the period. D Fees and expenses of the underlying Fidelity Central Funds are not included in the Fund's expense ratio. The Fund indirectly bears its proportionate share of the expenses of any underlying Fidelity Central Funds. E Amount does not include the portfolio activity of any underlying Fidelity Central Funds. F Expense ratios reflect operating expenses of the Fund. Expenses before reductions do not reflect amounts reimbursed by the investment adviser or reductions from brokerage service arrangements or other expense offset arrangements and do not represent the amount paid by the Fund during periods when reimbursements or reductions occur. Expenses net of fee waivers reflect expenses after reimbursement by the investment adviser but prior to reductions from brokerage service arrangements or other expense offset arrangements. Expenses net of all reductions represent the net expenses paid by the Fund. |
See accompanying notes which are an integral part of the financial statements.
Annual Report
Notes to Financial Statements
For the period ended October 31, 2007
1. Organization.
Fidelity China Region Fund, Fidelity Emerging Markets Fund, Fidelity Europe Fund, Fidelity Europe Capital Appreciation Fund, Fidelity Japan Fund, Fidelity Japan Smaller Companies Fund, Fidelity Latin America Fund, Fidelity Nordic Fund, Fidelity Pacific Basin Fund and Fidelity Southeast Asia Fund (the Funds) are funds of Fidelity Investment Trust (the trust). The trust is registered under the Investment Company Act of 1940, as amended (the 1940 Act), as an open-end management investment company organized as a Massachusetts business trust. The Funds are diversified with the exception of Fidelity Latin America Fund. Each Fund is authorized to issue an unlimited number of shares. The Fidelity Japan Smaller Companies Fund is currently closed to most new accounts. Fidelity Nordic Fund was closed to most new accounts effective the close of business on March 14, 2007 and reopened on June 21, 2007. Certain Funds' investments in emerging markets can be subject to social, economic, regulatory, and political uncertainties and can be extremely volatile.
2. Investments in Fidelity Central Funds.
The Funds may invest in Fidelity Central Funds, which are open-end investment companies available only to other investment companies and accounts managed by Fidelity Management & Research Company (FMR) and its affiliates. The Funds' Schedules of Investments list each of the Fidelity Central Funds as an investment of each Fund, but does not include the underlying holdings of each Fidelity Central Fund. As an Investing Fund, the Funds indirectly bear their proportionate share of the expenses of the underlying Fidelity Central Funds.
The Money Market Central Funds seek preservation of capital and current income and are managed by Fidelity Investments Money Management, Inc. (FIMM), an affiliate of FMR.
A complete list of holdings for each Fidelity Central Fund is available upon request or at the SEC's web site at www.sec.gov. In addition, the financial statements of the Fidelity Central Funds, which are not covered by the Funds' Report of Independent Registered Public Accounting Firm, are available on the SEC's web site or upon request.
3. Significant Accounting Policies.
The financial statements have been prepared in conformity with accounting principles generally accepted in the United States of America, which require management to make certain estimates and assumptions at the date of the financial statements. The following summarizes the significant accounting policies of the Funds:
Security Valuation. Investments are valued and net asset value (NAV) per share is calculated (NAV calculation) as of the close of business of the New York Stock Exchange (NYSE), normally 4:00 p.m. Eastern time. Wherever possible, each Fund uses independent pricing services approved by the Board of Trustees to value their investments.
Equity securities, including restricted securities, for which market quotations are readily available, are valued at the last reported sale price or official closing price as reported by an independent pricing service on the primary market or exchange on which they are traded. In the event there were no sales during the day or closing prices are not available, securities are valued at the last quoted bid price. Debt securities, including restricted securities, for which quotations are readily available, are valued by independent pricing services or by dealers who make markets in such securities. Pricing services consider yield or price of bonds of comparable quality, coupon, maturity and type as well as dealer supplied prices. Investments in open-end mutual funds, including the Fidelity Central Funds, are valued at their closing net asset value each business day. Short-term securities with remaining maturities of sixty days or less for which quotations are not readily available are valued at amortized cost, which approximates value.
When current market prices or quotations are not readily available or do not accurately reflect fair value, valuations may be determined in accordance with procedures adopted by the Board of Trustees. For example, when developments occur between the close of a market and the close of the NYSE that may materially affect the value of some or all of the securities, or when trading in a security is halted, those securities may be fair valued. Factors used in the determination of fair value may include monitoring news to identify significant market or security specific events such as changes in the value of U.S. securities markets, reviewing developments in foreign markets and evaluating the performance of ADRs, futures contracts and exchange-traded funds. Because each Fund's utilization of fair value pricing depends on market activity, the frequency with which fair value pricing is used cannot be predicted and may be utilized to a significant extent. The value of securities used for NAV calculation under fair value pricing may differ from published prices for the same securities.
Foreign Currency. Certain Funds may use foreign currency contracts to facilitate transactions in foreign-denominated securities. Losses from these transactions may arise from changes in the value of the foreign currency or if the counterparties do not perform under the contracts' terms.
Foreign-denominated assets, including investment securities, and liabilities are translated into U.S. dollars at the exchange rate at period end. Purchases and sales of investment securities, income and dividends received and expenses denominated in foreign currencies are translated into U.S. dollars at the exchange rate in effect on the transaction date.
The effects of exchange rate fluctuations on investments are included with the net realized and unrealized gain (loss) on investment securities. Other foreign currency transactions resulting in realized and unrealized gain (loss) are disclosed separately.
Annual Report
Notes to Financial Statements - continued
3. Significant Accounting Policies - continued
Investment Transactions and Income. For financial reporting purposes, the Funds' investment holdings and NAV include trades executed through the end of the last business day of the period. The NAV for processing shareholder transactions includes trades executed through the end of the prior business day. Gains and losses on securities sold are determined on the basis of identified cost and may include proceeds received from litigation. Dividend income is recorded on the ex-dividend date, except for certain dividends from foreign securities where the ex-dividend date may have passed, which are recorded as soon as the Funds are informed of the ex-dividend date. Non-cash dividends included in dividend income, if any, are recorded at the fair market value of the securities received. Distributions received on securities that represent a return of capital or capital gain are recorded as a reduction of cost of investments and/or as a realized gain. The Funds estimate the components of distributions received that may be considered return of capital distributions or capital gain distributions. Large, non-recurring dividends recognized by the Funds are presented separately on the Statement of Operations as "Special Dividends" and the impact of these dividends is presented in the Financial Highlights. Interest income and distributions from the Fidelity Central Funds are accrued as earned. Interest income includes coupon interest and amortization of premium and accretion of discount on debt securities. Investment income is recorded net of foreign taxes withheld where recovery of such taxes is uncertain.
Expenses. Most expenses of the trust can be directly attributed to a fund. Expenses which cannot be directly attributed are apportioned among each Fund in the trust. Expense estimates are accrued in the period to which they relate and adjustments are made when actual amounts are known.
Income Tax Information and Distributions to Shareholders. Each year, each Fund intends to qualify as a regulated investment company by distributing all of its taxable income and realized gains under Subchapter M of the Internal Revenue Code. As a result, no provision for income taxes is required in the accompanying financial statements. Foreign taxes are provided for based on each Fund's understanding of the tax rules and rates that exist in the foreign markets in which it invests.
Distributions are recorded on the ex-dividend date. Income and capital gain distributions are determined in accordance with income tax regulations, which may differ from generally accepted accounting principles. In addition, certain Funds will claim a portion of the payment made to redeeming shareholders as a distribution for income tax purposes.
Capital accounts within the financial statements are adjusted for permanent book-tax differences. For Southeast Asia, certain adjustments have been made to the accounts relating to prior periods. Collectively, these adjustments have no impact on net assets or the results of operations. Temporary book-tax differences will reverse in a subsequent period.
Book-tax differences are primarily due to short-term capital gains, foreign currency transactions, certain foreign taxes, passive foreign investment companies (PFIC), market discount, deferred trustees compensation and losses deferred due to wash sales.
The tax-basis components of distributable earnings and the federal tax cost as of period end were as follows for each Fund:
| Cost for Federal
Income Tax
Purposes | Unrealized
Appreciation | Unrealized
Depreciation | Net Unrealized
Appreciation/
(Depreciation) |
China Region | $ 1,474,950,533 | $ 619,380,901 | $ (6,277,419) | $ 613,103,482 |
Emerging Markets | 3,988,247,100 | 2,697,394,232 | (39,007,434) | 2,658,386,798 |
Europe | 4,330,181,812 | 1,264,110,896 | (43,479,308) | 1,220,631,588 |
Europe Capital Appreciation | 1,242,226,906 | 199,142,312 | (37,152,036) | 161,990,276 |
Japan | 1,723,443,063 | 176,823,731 | (96,722,741) | 80,100,990 |
Japan Smaller Companies | 696,328,451 | 212,372,199 | (25,739,844) | 186,632,355 |
Latin America | 3,394,637,630 | 3,036,219,574 | (36,542,115) | 2,999,677,459 |
Nordic | 779,645,570 | 257,714,030 | (24,353,639) | 233,360,391 |
Pacific Basin | 886,185,914 | 456,554,848 | (39,117,586) | 417,437,262 |
Southeast Asia | 4,096,037,898 | 2,409,186,117 | (43,114,373) | 2,366,071,744 |
| Undistributed
Ordinary Income | Undistributed
Long-term Capital Gain |
China Region | $ 48,067,693 | $ 189,357,820 |
Emerging Markets | 29,197,294 | 237,521,922 |
Europe | 141,852,748 | 287,697,272 |
Europe Capital Appreciation | 73,005,458 | 119,871,659 |
Japan | 3,332,694 | 236,604,730 |
Japan Smaller Companies | 989,490 | 13,400,175 |
Latin America | 38,058,370 | 154,731,686 |
Nordic | 43,631,347 | 31,126,716 |
Pacific Basin | 6,214,164 | 131,216,448 |
Southeast Asia | 225,928,663 | 163,399,302 |
Annual Report
3. Significant Accounting Policies - continued
Income Tax Information and Distributions to Shareholders - continued
The tax character of distributions paid was as follows:
October 31, 2007 | | | |
| Ordinary Income | Long-term Capital Gains | Total |
China Region | $ 9,931,797 | $ 6,849,518 | $ 16,781,315 |
Emerging Markets | 28,224,601 | - | 28,224,601 |
Europe | 118,437,528 | 418,419,221 | 536,856,749 |
Europe Capital Appreciation | 20,918,102 | 84,526,190 | 105,444,292 |
Japan | 1,030,851 | 23,709,588 | 24,740,439 |
Japan Smaller Companies | 857,665 | 30,875,932 | 31,733,597 |
Latin America | 48,023,908 | 60,491,350 | 108,515,258 |
Nordic | 3,011,989 | 5,296,944 | 8,308,933 |
Pacific Basin | 16,899,819 | 66,610,170 | 83,509,989 |
Southeast Asia | 37,369,256 | 64,061,576 | 101,430,832 |
October 31, 2006 | | | |
| Ordinary Income | Long-term Capital Gains | Total |
China Region | $ 4,953,820 | $ - | $ 4,953,820 |
Emerging Markets | 21,238,863 | - | 21,238,863 |
Europe | 123,923,515 | 170,050,004 | 293,973,519 |
Europe Capital Appreciation | 20,210,635 | 39,400,503 | 59,611,138 |
Japan | 2,482,546 | - | 2,482,546 |
Japan Smaller Companies | 2,096,615 | 87,009,291 | 89,105,906 |
Latin America | 25,559,551 | 20,858,777 | 46,418,328 |
Nordic | 2,048,598 | 14,574,214 | 16,622,812 |
Pacific Basin | 10,443,689 | 4,914,659 | 15,358,348 |
Southeast Asia | 11,222,484 | 18,514,528 | 29,737,012 |
Short-Term Trading (Redemption) Fees. Shares held in China Region, Emerging Markets, Japan, Japan Smaller Companies, Latin America, Nordic, Pacific Basin and Southeast Asia less than 90 days are subject to a redemption fee equal to 1.50% of the proceeds of the redeemed shares. Shares held in Europe and Europe Capital Appreciation less than 30 days are subject to a redemption fee equal to 1.00% of the proceeds of the redeemed shares. All redemption fees, including any estimated redemption fees paid by FMR, are retained by the Funds and accounted for as an addition to paid in capital.
New Accounting Pronouncements. In July 2006, Financial Accounting Standards Board Interpretation No. 48, Accounting for Uncertainty in Income Taxes - an interpretation of FASB Statement 109 (FIN 48), was issued and is effective on the last business day of the semiannual reporting period for fiscal years beginning after December 15, 2006. FIN 48 sets forth a threshold for financial statement recognition, measurement and disclosure of a tax position taken or expected to be taken on a tax return. Management has concluded that the adoption of FIN 48 will not result in a material impact on the Funds' net assets, results of operations and financial statement disclosures.
In addition, in September 2006, Statement of Financial Accounting Standards No. 157, Fair Value Measurements (SFAS 157), was issued and is effective for fiscal years beginning after November 15, 2007. SFAS 157 defines fair value, establishes a framework for measuring fair value and expands disclosures about fair value measurements. Management is currently evaluating the impact the adoption of SFAS 157 will have on the Funds' financial statement disclosures.
4. Operating Policies.
Forward Foreign Currency Contracts. Europe Capital Appreciation generally uses foreign currency contracts to facilitate transactions in foreign-denominated securities and to manage the Fund's currency exposure. Contracts to sell generally are used to hedge the Fund's investments against currency fluctuations, while contracts to buy generally are used to offset a previous contract to sell. Also, a contract to buy can be used to acquire exposure to foreign currencies and a contract to sell can be used to offset a previous contract to buy. Losses may arise from changes in the value of foreign currency or if the counterparties do not perform under the contracts' terms.
Annual Report
Notes to Financial Statements - continued
4. Operating Policies - continued
Forward Foreign Currency Contracts - continued
The U.S. dollar value of forward foreign currency contracts is determined using forward currency exchange rates supplied by a quotation service. Purchases and sales of forward foreign currency contracts having the same settlement date and broker are offset and any realized gain (loss) recognized on the date of offset: otherwise, gain (loss) is recognized on settlement date.
Repurchase Agreements. FMR has received an Exemptive Order from the Securities and Exchange Commission (the SEC) which permits certain Funds and other affiliated entities of FMR to transfer uninvested cash balances into joint trading accounts which are then invested in repurchase agreements. Certain Funds may also invest directly with institutions in repurchase agreements. Repurchase agreements are collateralized by government or non-government securities. Upon settlement date, collateral is held in segregated accounts with custodian banks and may be obtained in the event of a default of the counterparty. Each applicable Fund monitors, on a daily basis, the value of the collateral to ensure it is at least equal to the principal amount of the repurchase agreement (including accrued interest). In the event of a default by the counterparty, realization of the collateral proceeds could be delayed, during which time the value of the collateral may decline.
Delayed Delivery Transactions and When-Issued Securities. Certain Funds may purchase or sell securities on a delayed delivery or when-issued basis. Payment and delivery may take place after the customary settlement period for that security. The price of the underlying securities and the date when the securities will be delivered and paid for are fixed at the time the transaction is negotiated. During the time a delayed delivery sell is outstanding, the contract is marked-to-market daily and equivalent deliverable securities are held for the transaction. The value of the securities purchased on a delayed delivery or when-issued basis are identified as such in each applicable Fund's Schedule of Investments. Certain Funds may receive compensation for interest forgone in the purchase of a delayed delivery or when-issued security. With respect to purchase commitments, each applicable Fund identifies securities as segregated in its records with a value at least equal to the amount of the commitment. Losses may arise due to changes in the value of the underlying securities or if the counterparty does not perform under the contract's terms, or if the issuer does not issue the securities due to political, economic, or other factors.
Restricted Securities. Certain Funds may invest in securities that are subject to legal or contractual restrictions on resale. These securities generally may be resold in transactions exempt from registration or to the public if the securities are registered. Disposal of these securities may involve time-consuming negotiations and expense, and prompt sale at an acceptable price may be difficult. Information regarding restricted securities is included at the end of each applicable Fund's Schedule of Investments.
5. Purchases and Sales of Investments.
Purchases and sales of securities, other than short-term securities, are noted in the table below.
| Purchases ($) | Sales ($) |
China Region | 2,352,806,592 | 1,757,875,609 |
Emerging Markets | 3,360,132,883 | 2,163,767,596 |
Europe | 5,013,965,911 | 4,651,581,391 |
Europe Capital Appreciation | 2,164,925,647 | 2,004,672,328 |
Japan | 2,790,722,909 | 2,902,855,220 |
Japan Smaller Companies | 705,448,522 | 1,033,888,519 |
Latin America | 3,038,292,972 | 2,220,290,128 |
Nordic | 853,612,641 | 419,175,433 |
Pacific Basin | 985,112,329 | 1,135,748,058 |
Southeast Asia | 4,350,114,619 | 2,156,887,458 |
Southeast Asia realized a gain on the sale of an investment not meeting the investment restrictions of the fund.
6. Fees and Other Transactions with Affiliates.
Management Fee. FMR and its affiliates provide the Funds with investment management related services for which the Funds pay a monthly management fee. The management fee is the sum of an individual fund fee rate and a group fee rate. The individual fund fee rate is applied to each Fund's average net assets. The group fee rate is based upon the average net assets of all the mutual funds advised by FMR. The group fee rate decreases as assets under management increase and increases as assets under management decrease. In addition, the management fee for Europe, Europe Capital Appreciation, Japan, Pacific Basin and Southeast Asia is subject to a performance adjustment (up to a maximum ± .20% of each applicable Fund's average net assets over a 36 month performance period). The upward or downward adjustment to the management fee is based on each Fund's relative
Annual Report
6. Fees and Other Transactions with Affiliates - continued
Management Fee - continued
investment performance as compared to an appropriate benchmark index. For the period, each Fund's annual management fee rate expressed as a percentage of each Fund's average net assets, including the performance adjustment, if applicable, was as follows:
| Individual Rate | Group Rate | Total |
China Region | .45% | .26% | .71% |
Emerging Markets | .45% | .26% | .71% |
Europe | .45% | .26% | .79% |
Europe Capital Appreciation | .45% | .26% | .76% |
Japan | .45% | .26% | .79% |
Japan Smaller Companies | .45% | .26% | .71% |
Latin America | .45% | .26% | .71% |
Nordic | .45% | .26% | .71% |
Pacific Basin | .45% | .26% | .84% |
Southeast Asia | .45% | .26% | .78% |
Transfer Agent Fees. Fidelity Service Company, Inc. (FSC), an affiliate of FMR, is the Funds' transfer, dividend disbursing and shareholder servicing agent. FSC receives account fees and asset-based fees that vary according to account size and type of account. FSC pays for typesetting, printing and mailing of shareholder reports, except proxy statements. For the period, the transfer agent fees were equivalent to the following annual rates expressed as a percentage of average net assets:
China Region | .22% |
Emerging Markets | .20% |
Europe | .22% |
Europe Capital Appreciation | .21% |
Japan | .22% |
Japan Smaller Companies | .21% |
Latin America | .19% |
Nordic | .23% |
Pacific Basin | .22% |
Southeast Asia | .19% |
Accounting and Security Lending Fees. FSC maintains each Fund's accounting records. The accounting fee is based on the level of average net assets for the month. Under a separate contract, FSC administers the security lending program. The security lending fee is based on the number and duration of lending transactions.
Brokerage Commissions. Certain Funds placed a portion of their portfolio transactions with brokerage firms which are affiliates of the investment adviser. The commissions paid to these affiliated firms were as follows:
| Amount |
China Region | $ 12 |
Emerging Markets | 549 |
Europe Capital Appreciation | 355 |
Latin America | 737 |
Pacific Basin | 2 |
Interfund Lending Program. Pursuant to an Exemptive Order issued by the SEC, the Funds, along with other registered investment companies having management contracts with FMR, may participate in an interfund lending program. This program provides an alternative credit facility allowing the funds to borrow from, or lend money to, other participating affiliated funds. At period end, there were no interfund loans outstanding. Each applicable fund's activity in this program during the period for which loans were outstanding was as follows:
| Borrower or
Lender | Average Daily Loan Balance | Weighted
Average
Interest Rate | Interest Expense |
China Region | Borrower | $ 18,049,714 | 5.39% | $ 37,855 |
Emerging Markets | Borrower | 38,881,364 | 5.37% | 63,786 |
Europe | Borrower | 43,540,000 | 5.40% | 26,146 |
Europe Capital Appreciation | Borrower | 17,087,375 | 5.39% | 20,479 |
Latin America | Borrower | 88,695,200 | 5.35% | 65,890 |
Nordic | Borrower | 7,822,286 | 5.36% | 16,310 |
Pacific Basin | Borrower | 11,275,826 | 5.22% | 37,765 |
Southeast Asia | Borrower | 23,180,727 | 5.36% | 37,947 |
Annual Report
Notes to Financial Statements - continued
7. Committed Line of Credit.
Certain Funds participate with other funds managed by FMR in a $4.2 billion credit facility (the "line of credit") to be utilized for temporary or emergency purposes to fund shareholder redemptions or for other short-term liquidity purposes. The participating funds have agreed to pay commitment fees on their pro rata portion of the line of credit, which is reflected in Miscellaneous Expense on the Statement of Operations, and is as follows:
China Region | $ 2,006 |
Emerging Markets | 7,973 |
Europe | 9,615 |
Europe Capital Appreciation | 2,813 |
Japan | 3,755 |
Japan Smaller Companies | 2,111 |
Latin America | 8,430 |
Nordic | 1,268 |
Pacific Basin | 2,240 |
Southeast Asia | 5,340 |
During the period, there were no borrowings on this line of credit.
8. Security Lending.
Certain Funds lend portfolio securities from time to time in order to earn additional income. On the settlement date of the loan, each applicable Fund receives collateral (in the form of U.S. Treasury obligations, letters of credit and/or cash) against the loaned securities and maintains collateral in an amount not less than 100% of the market value of the loaned securities during the period of the loan. The market value of the loaned securities is determined at the close of business of the Funds and any additional required collateral is delivered to the Funds on the next business day. If the borrower defaults on its obligation to return the securities loaned because of insolvency or other reasons, a fund could experience delays and costs in recovering the securities loaned or in gaining access to the collateral. Any cash collateral received is invested in the Fidelity Securities Lending Cash Central Fund. The value of loaned securities and cash collateral at period end are disclosed on each applicable Fund's Statement of Assets and Liabilities. Security lending income represents the income earned on investing cash collateral, less fees and expenses associated with the loan, plus any premium payments that may be received on the loan of certain types of securities. Security lending income is presented on each applicable Fund's Statement of Operations as a component of income from Fidelity Central Funds.
9. Expense Reductions.
Many of the brokers with whom FMR places trades on behalf of certain Funds provided services to these Funds in addition to trade execution. These services included payments of expenses on behalf of each applicable Fund. In addition, through arrangements with each applicable Fund's custodian and transfer agent, credits realized as a result of uninvested cash balances were used to reduce each applicable Fund's expenses. All of the applicable expense reductions are noted in the table below.
| Brokerage Service Arrangements | Custody
expense reduction | Transfer Agent
expense reduction |
China Region | $ 1,630,978 | $ 9,879 | $ 19,316 |
Emerging Markets | 1,981,526 | 3,332 | 140,069 |
Europe | 1,941,341 | 8,808 | 434,751 |
Europe Capital Appreciation | 541,464 | - | 21,573 |
Japan | 222,012 | - | 113,565 |
Japan Smaller Companies | 150,680 | 1,010 | 14,937 |
Latin America | 526,950 | 10,834 | 90,368 |
Nordic | 151,529 | - | 11,661 |
Pacific Basin | 702,683 | - | 42,394 |
Southeast Asia | 3,131,916 | 3,566 | 88,087 |
Annual Report
10. Other.
The Funds' organizational documents provide former and current trustees and officers with a limited indemnification against liabilities arising in connection with the performance of their duties to the Funds. In the normal course of business, the Funds may also enter into contracts that provide general indemnifications. The Funds' maximum exposure under these arrangements is unknown as this would be dependent on future claims that may be made against the Funds. The risk of material loss from such claims is considered remote.
At the end of the period, Freedom Fund 2010 was the owner of record of approximately 10% of Europe. Fidelity Freedom Fund 2020 was the owner of record of approximately 19% and 15% of the total outstanding shares of Europe and Japan, respectively. Fidelity Freedom Fund 2030 was the owner of record of approximately 15% and 12% of the total outstanding shares of Europe and Japan, respectively. The Fidelity Freedom Funds were the owners of record, in the aggregate, of approximately 69% and 56% of the total outstanding shares of Europe and Japan, respectively. FMR or its affiliates were the owners of record of 22% of the total outstanding shares of Japan Smaller Companies.
11. Other Matters Regarding China Region, Emerging Markets, Europe, Europe Capital Appreciation and Latin America.
The United States Securities and Exchange Commission ("SEC") is conducting an investigation of FMR (covering the years 2002 to 2004) arising from gifts, gratuities and business entertainment provided by certain brokers to certain individuals who were employed on FMR's domestic equity trading desk during that period. FMR is in discussions with the SEC staff regarding the possible resolution of the matter, but as of period-end no final resolution has been reached.
In December 2006, the Independent Trustees completed their own investigation of the matter with the assistance of independent counsel. The Independent Trustees and FMR agree that, despite the absence of proof that the Fidelity mutual funds experienced diminished execution quality as a result of the improper receipt of gifts and business entertainment, the conduct at issue was serious and is worthy of redress. Accordingly, the Independent Trustees have requested and FMR has agreed to pay $42 million to Fidelity mutual funds, plus interest to be determined at the time that payment is made. A method of allocating this payment among the funds has not yet been determined. The total payment to each of the Funds is not anticipated to have a material impact on such Fund's net assets. In addition, FMR reimbursed related legal expenses which are recorded in the accompanying Statements of Operations as an expense reduction.
12. Shareholder Meeting Results Regarding Europe and Nordic.
The proposal to merge Fidelity Nordic Fund into Fidelity Europe Fund did not receive the number of votes required for shareholder approval at the shareholder meeting on June 20, 2007. All expenses in connection with the proxy were paid by FMR.
Annual Report
Report of Independent Registered Public Accounting Firm
To the Trustees of Fidelity Investment Trust and the Shareholders of:
Fidelity Canada Fund,
Fidelity China Region Fund,
Fidelity Emerging Markets Fund,
Fidelity Europe Fund,
Fidelity Japan Fund,
Fidelity Japan Smaller Companies Fund,
Fidelity Latin America Fund,
Fidelity Nordic Fund,
Fidelity Pacific Basin Fund,
Fidelity Southeast Asia Fund
In our opinion, the accompanying statements of assets and liabilities, including the schedules of investments, and the related statements of operations and of changes in net assets and the financial highlights present fairly, in all material respects, the financial position of Fidelity Canada Fund, Fidelity China Region Fund, Fidelity Emerging Markets Fund, Fidelity Europe Fund, Fidelity Japan Fund, Fidelity Japan Smaller Companies Fund, Fidelity Latin America Fund, Fidelity Nordic Fund, Fidelity Pacific Basin Fund and Fidelity Southeast Asia Fund (funds of Fidelity Investment Trust) at October 31, 2007 and the results of their operations for the year then ended, the changes in their net assets for each of the two years in the period then ended and the financial highlights for the periods then indicated, in conformity with accounting principles generally accepted in the United States of America. These financial statements and financial highlights (hereafter referred to as "financial statements") are the responsibility of the Fidelity Investment Trust's management. Our responsibility is to express an opinion on these financial statements based on our audits. We conducted our audits of these financial statements in accordance with the standards of the Public Company Accounting Oversight Board (United States). Those standards require that we plan and perform the audit to obtain reasonable assurance about whether the financial statements are free of material misstatement. An audit includes examining, on a test basis, evidence supporting the amounts and disclosures in the financial statements, assessing the accounting principles used and significant estimates made by management, and evaluating the overall financial statement presentation. We believe that our audits, which included confirmation of securities at October 31, 2007 by correspondence with the custodians and brokers, provide a reasonable basis for our opinion.
/s/ PricewaterhouseCoopers LLP
PricewaterhouseCoopers LLP
Boston, Massachusetts
December 20, 2007
Annual Report
Report of Independent Registered Public Accounting Firm
To the Trustees of Fidelity Investment Trust and Shareholders of Fidelity Europe Capital Appreciation Fund:
We have audited the accompanying statement of assets and liabilities of Fidelity Europe Capital Appreciation Fund (the Fund), a fund of Fidelity Investment Trust (the Trust), including the schedule of investments, as of October 31, 2007, and the related statement of operations for the year then ended, the statement of changes in net assets for each of the two years in the period then ended, and the financial highlights for each of the five years in the period then ended. These financial statements and financial highlights are the responsibility of the Fund's management. Our responsibility is to express an opinion on these financial statements and financial highlights based on our audits.
We conducted our audits in accordance with standards of the Public Company Accounting Oversight Board (United States). Those standards require that we plan and perform the audit to obtain reasonable assurance about whether the financial statements and financial highlights are free of material misstatement. The Fund is not required to have, nor were we engaged to perform, an audit of its internal control over financial reporting. Our audits included consideration of internal control over financial reporting as a basis for designing audit procedures that are appropriate in the circumstances, but not for the purpose of expressing an opinion on the effectiveness of the Fund's internal control over financial reporting. Accordingly, we express no such opinion. An audit also includes examining, on a test basis, evidence supporting the amounts and disclosures in the financial statements, assessing the accounting principles used and significant estimates made by management, as well as evaluating the overall financial statement presentation. Our procedures included confirmation of securities owned as of October 31, 2007. We believe that our audits provide a reasonable basis for our opinion.
In our opinion, the financial statements and financial highlights referred to above present fairly, in all material respects, the financial position of Fidelity Europe Capital Appreciation Fund as of October 31, 2007, the results of its operations for the year then ended, the changes in its net assets for each of the two years in the period then ended, and its financial highlights for each of the five years in the period then ended, in conformity with accounting principles generally accepted in the United States of America.
/s/ Deloitte & Touche LLP
DELOITTE & TOUCHE LLP
Boston, Massachusetts
December 20, 2007
Annual Report
Trustees and Officers
The Trustees, Members of the Advisory Board, and executive officers of the trust and funds, as applicable, are listed below. The Board of Trustees governs each fund and is responsible for protecting the interests of shareholders. The Trustees are experienced executives who meet periodically throughout the year to oversee each fund's activities, review contractual arrangements with companies that provide services to each fund, and review each fund's performance. Except for James C. Curvey, each of the Trustees oversees 370 funds advised by FMR or an affiliate. Mr. Curvey oversees 340 funds advised by FMR or an affiliate.
The Trustees hold office without limit in time except that (a) any Trustee may resign; (b) any Trustee may be removed by written instrument, signed by at least two-thirds of the number of Trustees prior to such removal; (c) any Trustee who requests to be retired or who has become incapacitated by illness or injury may be retired by written instrument signed by a majority of the other Trustees; and (d) any Trustee may be removed at any special meeting of shareholders by a two-thirds vote of the outstanding voting securities of the trust. Each Trustee who is not an interested person (as defined in the 1940 Act) (Independent Trustee), shall retire not later than the last day of the calendar year in which his or her 72nd birthday occurs. The Independent Trustees may waive this mandatory retirement age policy with respect to individual Trustees. The executive officers and Advisory Board Members hold office without limit in time, except that any officer and Advisory Board Member may resign or may be removed by a vote of a majority of the Trustees at any regular meeting or any special meeting of the Trustees. Except as indicated, each individual has held the office shown or other offices in the same company for the past five years.
The funds' Statement of Additional Information (SAI) includes more information about the Trustees. To request a free copy, call Fidelity at 1-800-544-8544.
Interested Trustees*:
Correspondence intended for each Trustee who is an interested person may be sent to Fidelity Investments, 82 Devonshire Street, Boston, Massachusetts 02109.
Name, Age; Principal Occupation |
Edward C. Johnson 3d (77) |
| Year of Election or Appointment: 1984 Mr. Johnson is Chairman of the Board of Trustees. Mr. Johnson serves as President (2006-present), Chief Executive Officer, Chairman, and a Director of FMR LLC; Chairman and a Director of FMR; Chairman and a Director of Fidelity Research & Analysis Company (FRAC); Chairman and a Director of Fidelity Investments Money Management, Inc.; and Chairman (2001-present) and a Director of FMR Co., Inc. In addition, Mr. Johnson serves as Chairman and Director of Fidelity International Limited (FIL). |
James C. Curvey (72) |
| Year of Election or Appointment: 2007 Mr. Curvey also serves as Trustee (2007-present) or Member of the Advisory Board (2007-present) of other investment companies advised by FMR. Mr. Curvey is a Director of FMR and FMR Co., Inc. (2007-present). Mr. Curvey is also Vice Chairman (2006-present) and Director of FMR LLC. Mr. Curvey joined Fidelity in 1982 and served in numerous senior management positions, including President and Chief Operating Officer of FMR LLC (1997-2000) and President of Fidelity Strategic Investments (2000-2002). In addition, he serves as a member of the Board of Directors of Geerlings & Wade, Inc. (wine distribution). |
* Trustees have been determined to be "Interested Trustees" by virtue of, among other things, their affiliation with the trust or various entities under common control with FMR. FMR Corp. merged with FMR LLC on October 1, 2007. Any references to FMR LLC for prior periods are deemed to be references to the prior entity.
Independent Trustees:
Correspondence intended for each Independent Trustee (that is, the Trustees other than the Interested Trustees) may be sent to Fidelity Investments, P.O. Box 55235, Boston, Massachusetts 02205-5235.
Name, Age; Principal Occupation |
Dennis J. Dirks (59) |
| Year of Election or Appointment: 2005 Prior to his retirement in May 2003, Mr. Dirks was Chief Operating Officer and a member of the Board of The Depository Trust & Clearing Corporation (DTCC) (1999-2003). He also served as President, Chief Operating Officer, and Board member of The Depository Trust Company (DTC) (1999-2003) and President and Board member of the National Securities Clearing Corporation (NSCC) (1999-2003). In addition, Mr. Dirks served as Chief Executive Officer and Board member of the Government Securities Clearing Corporation (2001-2003) and Chief Executive Officer and Board member of the Mortgage-Backed Securities Clearing Corporation (2001-2003). Mr. Dirks also serves as a Trustee and a member of the Finance Committee of Manhattan College (2005-present) and a Trustee and a member of the Finance Committee of AHRC of Nassau County (2006-present). |
Albert R. Gamper, Jr. (65) |
| Year of Election or Appointment: 2006 Prior to his retirement in December 2004, Mr. Gamper served as Chairman of the Board of CIT Group Inc. (commercial finance). During his tenure with CIT Group Inc. Mr. Gamper served in numerous senior management positions, including Chairman (1987-1989; 1999-2001; 2002-2004), Chief Executive Officer (1987-2004), and President (1989-2002). He currently serves as a member of the Board of Directors of Public Service Enterprise Group (utilities, 2001-present), Chairman of the Board of Governors, Rutgers University (2004-present), and Chairman of the Board of Saint Barnabas Health Care System. |
George H. Heilmeier (71) |
| Year of Election or Appointment: 2004 Dr. Heilmeier is Chairman Emeritus of Telcordia Technologies (communication software and systems), where prior to his retirement, he served as company Chairman and Chief Executive Officer. He currently serves on the Boards of Directors of The Mitre Corporation (systems engineering and information technology support for the government), and HRL Laboratories (private research and development, 2004-present). He is Chairman of the General Motors Science & Technology Advisory Board and a Life Fellow of the Institute of Electrical and Electronics Engineers (IEEE). Dr. Heilmeier is a member of the Defense Science Board and the National Security Agency Advisory Board. He is also a member of the National Academy of Engineering, the American Academy of Arts and Sciences, and the Board of Overseers of the School of Engineering and Applied Science of the University of Pennsylvania. Previously, Dr. Heilmeier served as a Director of TRW Inc. (automotive, space, defense, and information technology, 1992-2002), Compaq (1994-2002), Automatic Data Processing, Inc. (ADP) (technology-based business outsourcing, 1995-2002), INET Technologies Inc. (telecommunications network surveillance, 2001-2004), and Teletech Holdings (customer management services). He is the recipient of the 2005 Kyoto Prize in Advanced Technology for his invention of the liquid crystal display, and a member of the Consumer Electronics Hall of Fame. |
James H. Keyes (67) |
| Year of Election or Appointment: 2007 Prior to his retirement in 2003, Mr. Keyes was Chairman, President, and Chief Executive Officer of Johnson Controls, Inc. (automotive supplier, 1993-2003). He currently serves as a member of the boards of LSI Logic Corporation (semiconductor technologies), Navistar International Corporation (manufacture and sale of trucks, buses, and diesel engines, 2002-present), and Pitney Bowes, Inc. (integrated mail, messaging, and document management solutions). |
Marie L. Knowles (61) |
| Year of Election or Appointment: 2001 Prior to Ms. Knowles' retirement in June 2000, she served as Executive Vice President and Chief Financial Officer of Atlantic Richfield Company (ARCO) (diversified energy, 1996-2000). From 1993 to 1996, she was a Senior Vice President of ARCO and President of ARCO Transportation Company. She served as a Director of ARCO from 1996 to 1998. She currently serves as a Director of Phelps Dodge Corporation (copper mining and manufacturing) and McKesson Corporation (healthcare service, 2002-present). Ms. Knowles is a Trustee of the Brookings Institution and the Catalina Island Conservancy and also serves as a member of the Advisory Board for the School of Engineering of the University of Southern California. |
Ned C. Lautenbach (63) |
| Year of Election or Appointment: 2000 Mr. Lautenbach is Chairman of the Independent Trustees (2006-present). Mr. Lautenbach has been a partner of Clayton, Dubilier & Rice, Inc. (private equity investment firm) since September 1998. Previously, Mr. Lautenbach was with the International Business Machines Corporation (IBM) from 1968 until his retirement in 1998. Mr. Lautenbach serves as a Director of Sony Corporation (2006-present) and Eaton Corporation (diversified industrial) as well as the Philharmonic Center for the Arts in Naples, Florida. He also is a member of the Board of Trustees of Fairfield University (2005-present), as well as a member of the Council on Foreign Relations. |
Cornelia M. Small (63) |
| Year of Election or Appointment: 2005 Ms. Small is a member (2000-present) and Chairperson (2002-present) of the Investment Committee, and a member (2002-present) of the Board of Trustees of Smith College. Previously, she served as Chief Investment Officer (1999-2000), Director of Global Equity Investments (1996-1999), and a member of the Board of Directors of Scudder, Stevens & Clark (1990-1997) and Scudder Kemper Investments (1997-1999). In addition, Ms. Small served as Co-Chair (2000-2003) of the Annual Fund for the Fletcher School of Law and Diplomacy. |
William S. Stavropoulos (68) |
| Year of Election or Appointment: 2001 Mr. Stavropoulos is Chairman Emeritus of the Board of Directors of The Dow Chemical Company. Since joining The Dow Chemical Company in 1967, Mr. Stavropoulos served in numerous senior management positions, including President (1993-2000; 2002-2003), CEO (1995-2000; 2002-2004), and Chairman of the Executive Committee (2000-2004). Currently, he is a Director of NCR Corporation (data warehousing and technology solutions), Chemical Financial Corporation, Maersk Inc. (industrial conglomerate, 2002-present), Tyco International, Inc. (multinational manufacturing and services, 2007-present), and a member of the Advisory Board for Metalmark Capital (private equity investment firm, 2005-present). He is a special advisor to Clayton, Dubilier & Rice, Inc., a private equity investment firm. He also serves as a member of the Board of Trustees of the American Enterprise Institute for Public Policy Research. In addition, Mr. Stavropoulos is a member of The Business Council, J.P. Morgan International Council and the University of Notre Dame Advisory Council for the College of Science. |
Kenneth L. Wolfe (68) |
| Year of Election or Appointment: 2005 Prior to his retirement in 2001, Mr. Wolfe was Chairman and Chief Executive Officer of Hershey Foods Corporation (1993-2001). He currently serves as a member of the boards of Adelphia Communications Corporation (2003-present), Bausch & Lomb, Inc., and Revlon Inc. (2004-present). |
Advisory Board Members and Executive Officers**:
Correspondence intended for Mr. Mauriello, Mr. Thomas, and Mr. Wiley may be sent to Fidelity Investments, P.O. Box 55235, Boston, Massachusetts 02205-5235. Correspondence intended for each executive officer and Mr. Lynch may be sent to Fidelity Investments, 82 Devonshire Street, Boston, Massachusetts 02109.
Name, Age; Principal Occupation |
Peter S. Lynch (63) |
| Year of Election or Appointment: 2003 Member of the Advisory Board of Fidelity Investment Trust. Mr. Lynch is Vice Chairman and a Director of FMR, and Vice Chairman (2001-present) and a Director of FMR Co., Inc. Previously, Mr. Lynch served as a Trustee of the Fidelity funds (1990-2003). In addition, he serves as a Trustee of Boston College and as the Chairman of the Inner-City Scholarship Fund. |
Joseph Mauriello (63) |
| Year of Election or Appointment: 2007 Member of the Advisory Board of Fidelity Investment Trust. Prior to his retirement in January 2006, Mr. Mauriello served in numerous senior management positions including Deputy Chairman and Chief Operating Officer (2004-2005), and Vice Chairman of Financial Services (2002-2004) of KPMG LLP US (professional services firm, 1965-2005). Mr. Mauriello currently serves as a member of the Board of Directors of XL Capital Ltd., (global insurance and re-insurance company, 2006-present) and of Arcadia Resources Inc., (health care services and products, 2007-present). He also served as a Director of the Hamilton Funds of the Bank of New York (2006-2007). |
David M. Thomas (58) |
| Year of Election or Appointment: 2007 Member of the Advisory Board of Fidelity Investment Trust. Previously, Mr. Thomas served as Executive Chairman (2005-2006) and Chairman and Chief Executive Officer (2000-2005) of IMS Health, Inc. (pharmaceutical and healthcare information solutions). In addition, Mr. Thomas serves as a member of the Board of Directors of Fortune Brands, Inc. (consumer products holding company), and Interpublic Group of Companies, Inc. (marketing communication, 2004-present). |
Michael E. Wiley (57) |
| Year of Election or Appointment: 2007 Member of the Advisory Board of Fidelity Investment Trust. Mr. Wiley also serves as Sr. Energy Advisor of Katzenbach Partners, LLC (consulting firm, 2006-present) and a member of the Board of Trustees of the University of Tulsa (2000-2006; 2007-present). He serves as a Director of Tesoro Corporation (independent oil refiner and marketer, 2005-present), and a Director of Bill Barrett Corporation (exploration and production company, 2005-present). In addition, he also serves as a Director of Post Oak Bank (privately-held bank, 2004-present), and an Advisory Director of Riverstone Holdings (private investment firm). Previously, Mr. Wiley served as Chairman, President, and CEO of Baker Hughes, Inc. (oilfield services company, 2000-2004), and as Director of Spinnaker Exploration Company (exploration and production company, 2001-2005). |
Kimberley H. Monasterio (43) |
| Year of Election or Appointment: 2007 President and Treasurer of Canada, China Region, Emerging Markets, Europe, Europe Capital Appreciation, Japan, Japan Smaller Companies, Latin America, Nordic, Pacific Basin, and Southeast Asia. Ms. Monasterio also serves as President and Treasurer of other Fidelity funds (2007-present) and is an employee of FMR (2004-present). Previously, Ms. Monasterio served as Deputy Treasurer of the Fidelity funds (2004-2006). Before joining Fidelity Investments, Ms. Monasterio served as Treasurer (2000-2004) and Chief Financial Officer (2002-2004) of the Franklin Templeton Funds and Senior Vice President of Franklin Templeton Services, LLC (2000-2004). |
Walter C. Donovan (45) |
| Year of Election or Appointment: 2007 Vice President of Canada, China Region, Emerging Markets, Europe, Europe Capital Appreciation, Japan, Japan Smaller Companies, Latin America, Nordic, Pacific Basin, and Southeast Asia. Mr. Donovan also serves as Vice President of Fidelity's Equity Funds (2007-present). Mr. Donovan also serves as Executive Vice President of FMR (2005-present) and FMR Co., Inc. (2005-present). Previously, Mr. Donovan served as Vice President of Fidelity's High Income Funds (2005-2007), Fixed-Income Funds (2005-2006), certain Asset Allocation Funds (2005-2006), certain Balanced Funds (2005-2006), and as Vice President and Director of Fidelity's International Equity Trading group (1998-2005). |
Eric M. Wetlaufer (45) |
| Year of Election or Appointment: 2006 Vice President of Canada, China Region, Emerging Markets, Europe, Europe Capital Appreciation, Japan, Japan Smaller Companies, Latin America, Nordic, Pacific Basin, and Southeast Asia. Mr. Wetlaufer also serves as Vice President of certain International Equity Funds (2006-present). Mr. Wetlaufer is Senior Vice President of FMR (2006-present) and FMR Co., Inc. (2006-present), and President and Director of Fidelity Management & Research (U.K.) Inc. (2006-present) and Fidelity Research & Analysis Company (2006-present). Before joining Fidelity Investments in 2005, Mr. Wetlaufer was a partner in Oxhead Capital Management (2004-2005). Previously, Mr. Wetlaufer served as a Chief Investment Officer of Putnam Investments (1997-2003). |
Eric D. Roiter (58) |
| Year of Election or Appointment: 1998 Secretary of Canada, China Region, Emerging Markets, Europe, Europe Capital Appreciation, Japan, Japan Smaller Companies, Latin America, Nordic, Pacific Basin, and Southeast Asia. He also serves as Secretary of other Fidelity funds; Vice President, General Counsel, and Secretary of FMR Co., Inc. (2001-present) and FMR; Assistant Secretary of Fidelity Management & Research (U.K.) Inc. (2001-present), Fidelity Research & Analysis Company (2001-present), and Fidelity Investments Money Management, Inc. (2001-present). Mr. Roiter is an Adjunct Member, Faculty of Law, at Boston College Law School (2003-present). Previously, Mr. Roiter served as Vice President and Secretary of Fidelity Distributors Corporation (FDC) (1998-2005). |
Scott C. Goebel (39) |
| Year of Election or Appointment: 2007 Assistant Secretary of Canada, China Region, Emerging Markets, Europe, Europe Capital Appreciation, Japan, Japan Smaller Companies, Latin America, Nordic, Pacific Basin, and Southeast Asia. Mr. Goebel also serves as Assistant Secretary of other Fidelity funds (2007-present), and is an employee of FMR. |
R. Stephen Ganis (41) |
| Year of Election or Appointment: 2006 Anti-Money Laundering (AML) officer of Canada, China Region, Emerging Markets, Europe, Europe Capital Appreciation, Japan, Japan Smaller Companies, Latin America, Nordic, Pacific Basin, and Southeast Asia. Mr. Ganis also serves as AML officer of other Fidelity funds (2006-present) and FMR LLC (2003-present). Before joining Fidelity Investments, Mr. Ganis practiced law at Goodwin Procter, LLP (2000-2002). |
Joseph B. Hollis (59) |
| Year of Election or Appointment: 2006 Chief Financial Officer of Canada, China Region, Emerging Markets, Europe, Europe Capital Appreciation, Japan, Japan Smaller Companies, Latin America, Nordic, Pacific Basin, and Southeast Asia. Mr. Hollis also serves as Chief Financial Officer of other Fidelity funds. Mr. Hollis is President of Fidelity Pricing and Cash Management Services (FPCMS) (2005-present). Mr. Hollis also serves as President and Director of Fidelity Service Company, Inc. (2006-present). Previously, Mr. Hollis served as Senior Vice President of Cash Management Services (1999-2002) and Investment Management Operations (2002-2005). |
Kenneth A. Rathgeber (60) |
| Year of Election or Appointment: 2004 Chief Compliance Officer of Canada, China Region, Emerging Markets, Europe, Europe Capital Appreciation, Japan, Japan Smaller Companies, Latin America, Nordic, Pacific Basin, and Southeast Asia. Mr. Rathgeber also serves as Chief Compliance Officer of other Fidelity funds (2004-present) and Executive Vice President of Risk Oversight for Fidelity Investments (2002-present). He is Chief Compliance Officer of FMR (2005-present), FMR Co., Inc. (2005-present), Fidelity Management & Research (U.K.) Inc. (2005-present), Fidelity Research & Analysis Company (2005-present), Fidelity Investments Money Management, Inc. (2005-present), and Strategic Advisers, Inc. (2005-present). Previously, Mr. Rathgeber served as Executive Vice President and Chief Operating Officer for Fidelity Investments Institutional Services Company, Inc. (1998-2002). |
Bryan A. Mehrmann (46) |
| Year of Election or Appointment: 2005 Deputy Treasurer of Canada, China Region, Emerging Markets, Europe, Europe Capital Appreciation, Japan, Japan Smaller Companies, Latin America, Nordic, Pacific Basin, and Southeast Asia. Mr. Mehrmann also serves as Deputy Treasurer of other Fidelity funds (2005-present) and is an employee of FMR. Previously, Mr. Mehrmann served as Vice President of Fidelity Investments Institutional Services Group (FIIS)/Fidelity Investments Institutional Operations Corporation, Inc. (FIIOC) Client Services (1998-2004). |
Kenneth B. Robins (38) |
| Year of Election or Appointment: 2005 Deputy Treasurer of Canada, China Region, Emerging Markets, Europe, Europe Capital Appreciation, Japan, Japan Smaller Companies, Latin America, Nordic, Pacific Basin, and Southeast Asia. Mr. Robins also serves as Deputy Treasurer of other Fidelity funds (2005-present) and is an employee of FMR (2004-present). Before joining Fidelity Investments, Mr. Robins worked at KPMG LLP, where he was a partner in KPMG's department of professional practice (2002-2004) and a Senior Manager (1999-2000). In addition, Mr. Robins served as Assistant Chief Accountant, United States Securities and Exchange Commission (2000-2002). |
Robert G. Byrnes (40) |
| Year of Election or Appointment: 2005 Assistant Treasurer of Canada, China Region, Emerging Markets, Europe, Europe Capital Appreciation, Japan, Japan Smaller Companies, Latin America, Nordic, Pacific Basin, and Southeast Asia. Mr. Byrnes also serves as Assistant Treasurer of other Fidelity funds (2005-present) and is an employee of FMR (2005-present). Previously, Mr. Byrnes served as Vice President of FPCMS (2003-2005). Before joining Fidelity Investments, Mr. Byrnes worked at Deutsche Asset Management where he served as Vice President of the Investment Operations Group (2000-2003). |
Peter L. Lydecker (53) |
| Year of Election or Appointment: 2004 Assistant Treasurer of Canada, China Region, Emerging Markets, Europe, Europe Capital Appreciation, Japan, Japan Smaller Companies, Latin America, Nordic, Pacific Basin, and Southeast Asia. Mr. Lydecker also serves as Assistant Treasurer of other Fidelity funds (2004) and is an employee of FMR. |
Paul M. Murphy (60) |
| Year of Election or Appointment: 2007 Assistant Treasurer of Canada, China Region, Emerging Markets, Europe, Europe Capital Appreciation, Japan, Japan Smaller Companies, Latin America, Nordic, Pacific Basin, and Southeast Asia. Mr. Murphy also serves as Assistant Treasurer of other Fidelity funds (2007-present) and is an employee of FMR (2007-present). Previously, Mr. Murphy served as Chief Financial Officer of the Fidelity Funds (2005-2006), Vice President and Associate General Counsel of FMR (2007), and Senior Vice President of Fidelity Pricing and Cash Management Services Group (FPCMS) (1994-2007). |
Gary W. Ryan (49) |
| Year of Election or Appointment: 2005 Assistant Treasurer of Canada, China Region, Emerging Markets, Europe, Europe Capital Appreciation, Japan, Japan Smaller Companies, Latin America, Nordic, Pacific Basin, and Southeast Asia. Mr. Ryan also serves as Assistant Treasurer of other Fidelity funds (2005-present) and is an employee of FMR (2005-present). Previously, Mr. Ryan served as Vice President of Fund Reporting in FPCMS (1999-2005). |
** FMR Corp. merged with FMR LLC on October 1, 2007. Any references to FMR LLC for prior periods are deemed to be references to the prior entity.
Annual Report
Distributions
The Board of Trustees of each fund voted to pay to shareholders of record at the opening of business on record date, the following distributions per share derived from capital gains realized from sales of portfolio securities, and dividends derived from net investment income:
| Pay Date | Record Date | Dividends | Capital Gains |
Fidelity Canada Fund | 12/10/07 | 12/07/07 | $.403 | $3.27 |
Fidelity China Region Fund | 12/10/07 | 12/07/07 | $.32 | $4.53 |
Fidelity Emerging Markets Fund | 12/10/07 | 12/07/07 | $.19 | $1.37 |
Fidelity Europe Fund | 12/10/07 | 12/07/07 | $.65 | $3.08 |
Fidelity Europe Capital Appreciation Fund | 12/10/07 | 12/07/07 | $.56 | $4.22 |
Fidelity Japan Fund | 12/10/07 | 12/07/07 | $.04 | $2.39 |
Fidelity Japan Smaller Companies Fund | 12/10/07 | 12/07/07 | $.02 | $0.21 |
Fidelity Latin America Fund | 12/10/07 | 12/07/07 | $.65 | $1.72 |
Fidelity Nordic Fund | 12/10/07 | 12/07/07 | $1.73 | $2.28 |
Fidelity Pacific Basin Fund | 12/10/07 | 12/07/07 | $.22 | $3.88 |
Fidelity Southeast Asia Fund | 12/10/07 | 12/07/07 | $.28 | $2.89 |
The funds hereby designate as capital gain dividend the amounts noted below for the taxable year ended October 31, 2007, or, if subsequently determined to be different, the net capital gain of such year.
Fidelity Canada Fund | $190,207,109 |
Fidelity China Region Fund | $189,424,560 |
Fidelity Emerging Markets Fund | $254,680,914 |
Fidelity Europe Fund | $288,152,802 |
Fidelity Europe Capital Appreciation Fund | $121,926,688 |
Fidelity Japan Fund | $255,942,926 |
Fidelity Japan Smaller Companies Fund | $26,074,875 |
Fidelity Latin America Fund | $184,203,991 |
Fidelity Nordic Fund | $31,132,765 |
Fidelity Pacific Basin Fund | $141,641,758 |
Fidelity Southeast Asia Fund | $164,027,569 |
A percentage of the dividends distributed during the fiscal year for the following funds may be taken into account as a dividend for purposes of the maximum rate under section 1(h) (11) of the Internal Revenue Code:
Fidelity Canada Fund | 42% |
Fidelity China Region Fund | 36% |
Fidelity Emerging Markets Fund | 94% |
Fidelity Europe Fund | 42% |
Fidelity Europe Capital Appreciation Fund | 49% |
Fidelity Japan Fund | 84% |
Fidelity Japan Smaller Companies Fund | 100% |
Fidelity Latin America Fund | 100% |
Fidelity Nordic Fund | 100% |
Fidelity Southeast Asia Fund | 31% |
Fidelity Pacific Basin designates 69% and 100% of the dividends distributed in December and September, respectively, during the fiscal year as amounts which may be taken into account as a dividend for the purposes of the maximum rate under section 1(h)(11) of the Internal Revenue Code.
Annual Report
Distributions - continued
The amounts per share which represent income derived from sources within, and taxes paid to, foreign countries or possessions of the United States are as follows:
| Pay Date | Income | Taxes |
Fidelity Canada Fund | 12/04/06 | $0.535 | $0.0442 |
Fidelity China Region Fund | 12/04/06 | $0.328 | $0.0382 |
Fidelity Emerging Markets Fund | 12/11/06 | $0.208 | $0.0424 |
Fidelity Europe Fund | 12/11/06 | $0.504 | $0.0346 |
Fidelity Europe Capital Appreciation Fund | 12/11/06 | $0.209 | $0.0260 |
Fidelity Japan Fund | 12/04/06 | $0.020 | $0.0104 |
Fidelity Japan Smaller Companies Fund | 12/11/06 | $0.020 | $0.0097 |
Fidelity Latin America Fund | 12/11/06 | $0.579 | $0.0747 |
| 01/02/07 | $0.027 | $0.0000 |
Fidelity Nordic Fund | 12/11/06 | $0.347 | $0.0566 |
Fidelity Pacific Basin Fund | 12/11/06 | $0.281 | $0.0396 |
Fidelity Southeast Asia Fund | 12/11/06 | $0.360 | $0.0471 |
The funds will notify shareholders in January 2008 of amounts for use in preparing 2007 income tax returns.
Annual Report
Board Approval of Investment Advisory Contracts and Management Fees
Targeted International Equity Funds
Each year, typically in July, the Board of Trustees, including the Independent Trustees (together, the Board), votes on the renewal of the management contract and sub-advisory agreements (together, the Advisory Contracts) for each fund. The Board, assisted by the advice of fund counsel and Independent Trustees' counsel, requests and considers a broad range of information throughout the year.
The Board meets regularly each month except August and takes into account throughout the year matters bearing on Advisory Contracts. The Board, acting directly and through its separate committees, considers at each of its meetings factors that are relevant to the annual renewal of each fund's Advisory Contracts, including the services and support provided to each fund and its shareholders. At the time of the renewal, the Board had 12 standing committees, each composed of Independent Trustees with varying backgrounds, to which the Board has assigned specific subject matter responsibilities in order to enhance effective decision-making by the Board. Each committee has adopted a written charter outlining the structure and purposes of the committee. One such committee, the Equity Contract Committee, meets periodically as needed throughout the year to consider matters specifically related to the annual renewal of Advisory Contracts. The committee requests and receives information on, and makes recommendations to the Independent Trustees concerning, the approval and annual review of the Advisory Contracts.
At its July 2007 meeting, the Board of Trustees, including the Independent Trustees, unanimously determined to renew the Advisory Contracts for each fund. In reaching its determination, the Board considered all factors it believed relevant, including (i) the nature, extent, and quality of the services to be provided to each fund and its shareholders (including the investment performance of each fund); (ii) the competitiveness of the management fee and total expenses of each fund; (iii) the total costs of the services to be provided by and the profits to be realized by the investment adviser and its affiliates from the relationship with each fund; (iv) the extent to which economies of scale would be realized as each fund grows; and (v) whether fee levels reflect these economies of scale, if any, for the benefit of fund shareholders. The Board also approved amendments to each fund's agreements with foreign sub-advisers to clarify that each sub-adviser provides services as an independent contractor.
In determining whether to renew the Advisory Contracts for each fund, the Board ultimately reached a determination, with the assistance of fund counsel and Independent Trustees' counsel, that the renewal of the Advisory Contracts and the compensation to be received by Fidelity under the management contracts is consistent with Fidelity's fiduciary duty under applicable law. In addition to evaluating the specific factors noted above, the Board, in reaching its determination, is aware that shareholders in each fund have a broad range of investment choices available to them, including a wide choice among mutual funds offered by competitors to Fidelity, and that each fund's shareholders, with the opportunity to review and weigh the disclosure provided by the fund in its prospectus and other public disclosures, have chosen to invest in that fund, managed by Fidelity.
Nature, Extent, and Quality of Services Provided. The Board considered staffing within the investment adviser, FMR, and the sub-advisers (together, the Investment Advisers), including the backgrounds of the funds' portfolio managers and the funds' investment objectives and disciplines. The Independent Trustees also had discussions with senior management of Fidelity's investment operations and investment groups. The Board considered the structure of the portfolio manager compensation program and whether this structure provides appropriate incentives.
Resources Dedicated to Investment Management and Support Services. The Board reviewed the size, education, and experience of the Investment Advisers' investment staff, their use of technology, and the Investment Advisers' approach to recruiting, training, and retaining portfolio managers and other research, advisory, and management personnel. The Board considered Fidelity's extensive global research capabilities that enable the Investment Advisers to aggregate data from various sources in an effort to produce positive investment results. The Board noted that Fidelity's analysts have access to a variety of technological tools that enable them to perform both fundamental and quantitative analysis and to specialize in various disciplines. The Board also considered that Fidelity's portfolio managers and analysts have access to daily portfolio attribution that allows for monitoring of a fund's portfolio, as well as an electronic communication system that provides immediate real-time access to research concerning issuers and credit enhancers.
Shareholder and Administrative Services. The Board considered (i) the nature, extent, quality, and cost of advisory, administrative, distribution, and shareholder services performed by the Investment Advisers and their affiliates under the Advisory Contracts and under separate agreements covering transfer agency, pricing and bookkeeping, and securities lending services for each fund; (ii) the nature and extent of the Investment Advisers' supervision of third party service providers, principally custodians and subcustodians; and (iii) the resources devoted to, and the record of compliance with, each fund's compliance policies and procedures. The Board reviewed the allocation of fund brokerage, including allocations to brokers affiliated with the Investment Advisers, the use of brokerage commissions to pay fund expenses, and the use of "soft" commission dollars to pay for research services. The Board also considered that Fidelity voluntarily pays for market data out of its own resources. The Board also considered the agreement reached between the Independent Trustees and Fidelity in December 2006 following an independent review of matters relating to receipt of travel, entertainment, gifts and gratuities in violation of Fidelity policies.
The Board noted that the growth of fund assets across the complex allows Fidelity to reinvest in the development of services designed to enhance the value or convenience of the Fidelity funds as investment vehicles. These services include 24-hour access to account information and market information through phone representatives and over the Internet, and investor education materials and asset allocation tools.
Annual Report
Board Approval of Investment Advisory Contracts and Management Fees - continued
Investment in a Large Fund Family. The Board considered the benefits to shareholders of investing in a Fidelity fund, including the benefits of investing in a fund that is part of a large family of funds offering a variety of investment disciplines and providing for a large variety of mutual fund investor services. For example, fund shareholders are offered the privilege of exchanging shares of a fund for shares of other Fidelity funds, as set forth in the fund's prospectus, without paying a sales charge. The Board noted that, since the last Advisory Contract renewals in July 2006, Fidelity has taken a number of actions that benefited particular funds, including (i) dedicating additional resources to investment research and to restructure the investment research teams; (ii) contractually agreeing to reduce the management fee on Fidelity Advisor Floating Rate High Income Fund; (iii) contractually agreeing to reduce the management fees on Fidelity's California, Massachusetts, New Jersey, and New York AMT Tax-Free Money Market Funds, launching new Institutional Classes and Service Classes of these funds, and contractually agreeing to impose expense limitations on these funds; (iv) eliminating the exchange fee on the Fidelity Select Portfolios and reducing the pricing and bookkeeping fee rates for these funds; (v) reducing the maximum transfer agency fee rates on high income funds and certain equity funds; (vi) proposing amended management contracts that, if approved by shareholders, will add a performance adjustment component to the management fees paid by 18 Fidelity Advisor equity funds; (vii) contractually agreeing to reduce fees for Ultra-Short Central Fund and the money market Central Funds; (viii) waiving the Fidelity Advisor funds' contingent deferred sales charge on certain redemptions made through systematic withdrawal programs; and (ix) amending the management contracts for equity and fixed-income funds whose management contracts incorporate a "group fee" structure by adding four new fee "breakpoints" to the group fee rate schedules.
Investment Performance and Compliance (except Emerging Markets Fund, Europe Capital Appreciation Fund, Europe Fund and Japan Fund). The Board considered whether each fund has operated within its investment objective, as well as its record of compliance with its investment restrictions. It also reviewed each fund's absolute investment performance, as well as each fund's relative investment performance measured against a broad-based securities market index over multiple periods. The Board noted that FMR does not believe that a meaningful peer group exists against which to compare any of the funds' performance. For each fund, the following charts considered by the Board show, over the one-, three-, and five-year periods ended December 31, 2006, the fund's cumulative total returns and the cumulative total returns of a broad-based securities market index ("benchmark"). (Canada Fund did not offer Advisor classes as of December 31, 2006.)
Fidelity Canada Fund
The Board stated that the relative investment performance of the fund was lower than its benchmark for the one- and three-year periods, although the fund's five-year cumulative total return compared favorably to its benchmark. The Board discussed with FMR actions to be taken by FMR to improve the fund's below-benchmark performance.
Annual Report
Fidelity China Region Fund
The Board stated that the relative investment performance of the fund was lower than its benchmark for the one- and five-year periods, although the fund's three-year cumulative total return compared favorably to its benchmark.
Fidelity Japan Smaller Companies Fund
The Board stated that the relative investment performance of the fund was lower than its benchmark for all the periods shown. The Board discussed with FMR actions to be taken by FMR to improve the fund's below-benchmark performance.
Annual Report
Board Approval of Investment Advisory Contracts and Management Fees - continued
Fidelity Latin America Fund
The Board stated that the relative investment performance of the fund compared favorably to its benchmark for all the periods shown.
Fidelity Nordic Fund
The Board stated that the relative investment performance of the fund compared favorably to its benchmark for the three- and five-year periods, although the fund's one-year cumulative total return was lower than its benchmark.
Annual Report
Fidelity Pacific Basin Fund
The Board stated that the relative investment performance of the fund compared favorably to its benchmark for all the periods shown.
Fidelity Southeast Asia Fund
The Board stated that the relative investment performance of the fund compared favorably to its benchmark for all the periods shown.
The Board also considered that each of Canada Fund's, Pacific Basin Fund's, and Southeast Asia Fund's management fee is subject to upward or downward adjustment depending upon whether, and to what extent, the fund's investment performance for the performance period exceeds, or is exceeded by, the record (over the same period) of a Board-approved performance adjustment index. The Board realizes that the performance adjustment provides FMR with a strong economic incentive to seek to achieve superior performance for each fund's shareholders and helps to more closely align the interests of FMR and each fund's shareholders.
The Board considered that FMR has taken steps to refocus and strengthen equity research, equity portfolio management, and compliance.
Based on its review, and giving particular weight to the nature and quality of the resources dedicated by the Investment Advisers to maintain and improve relative performance, the Board concluded that the nature, extent, and quality of the services provided to each fund will benefit each fund's shareholders, particularly in light of the Board's view that each fund's shareholders benefit from investing in a fund that is part of a large family of funds offering a variety of investment disciplines and services.
Annual Report
Board Approval of Investment Advisory Contracts and Management Fees - continued
Investment Performance and Compliance (Emerging Markets Fund and Europe Capital Appreciation Fund). The Board considered whether each fund has operated within its investment objective, as well as its record of compliance with its investment restrictions. It also reviewed each fund's absolute investment performance, as well as each fund's relative investment performance measured against (i) a broad-based securities market index, and (ii) a peer group of mutual funds deemed appropriate by the Board over multiple periods. For each fund, the following charts considered by the Board show, over the one-, three-, and five-year periods ended December 31, 2006, the fund's cumulative total returns, the cumulative total returns of a broad-based securities market index ("benchmark"), and a range of cumulative total returns of a peer group of mutual funds identified by Morningstar, Inc. as having an investment style similar to that of the fund based on underlying portfolio holdings. The box within each chart shows the 25th percentile return (bottom of box) and the 75th percentile return (top of box) of the peer group. Returns shown above the box are in the first quartile and returns shown below the box are in the fourth quartile. The percentage beaten number noted below each chart corresponds to the percentile box and represents the percentage of funds in the peer group whose performance was equal to or lower than that of the fund.
Fidelity Emerging Markets Fund
The Board reviewed the fund's relative investment performance against its peer group and stated that the performance of the fund was in the second quartile for the one- and five-year periods and the first quartile for the three-year period. The Board also stated that the investment performance of the fund compared favorably to its benchmark for the one- and three-year periods, although the fund's five-year cumulative total return was lower than its benchmark.
Fidelity Europe Capital Appreciation Fund
Annual Report
The Board reviewed the fund's relative investment performance against its peer group and stated that the performance of the fund was in the second quartile for all the periods shown. The Board also stated that the investment performance of the fund compared favorably to its benchmark for all the periods shown.
The Board also considered that Europe Capital Appreciation Fund's management fee is subject to upward or downward adjustment depending upon whether, and to what extent, the fund's investment performance for the performance period exceeds, or is exceeded by, the record (over the same period) of a Board-approved performance adjustment index. The Board realizes that the performance adjustment provides FMR with a strong economic incentive to seek to achieve superior performance for the fund's shareholders and helps to more closely align the interests of FMR and the fund's shareholders.
The Board considered that FMR has taken steps to refocus and strengthen equity research, equity portfolio management, and compliance.
Based on its review, and giving particular weight to the nature and quality of the resources dedicated by the Investment Advisers to maintain and improve relative performance, the Board concluded that the nature, extent, and quality of the services provided to each fund will benefit each fund's shareholders, particularly in light of the Board's view that each fund's shareholders benefit from investing in a fund that is part of a large family of funds offering a variety of investment disciplines and services.
Investment Performance and Compliance (Europe Fund and Japan Fund). The Board considered whether each fund has operated within its investment objective, as well as its record of compliance with its investment restrictions. It also reviewed each fund's absolute investment performance, as well as each fund's relative investment performance measured against (i) a broad-based securities market index, and (ii) a peer group of mutual funds deemed appropriate by the Board over multiple periods. For each fund, the following charts considered by the Board show, over the one-, three-, and five-year periods ended December 31, 2006, the fund's cumulative total returns, the cumulative total returns of a broad-based securities market index ("benchmark"), and a range of cumulative total returns of a peer group of mutual funds identified by Lipper Inc. as having an investment objective similar to that of the fund. The box within each chart shows the 25th percentile return (bottom of box) and the 75th percentile return (top of box) of the peer group. Returns shown above the box are in the first quartile and returns shown below the box are in the fourth quartile. The percentage beaten number noted below each chart corresponds to the percentile box and represents the percentage of funds in the peer group whose performance was equal to or lower than that of the fund.
Fidelity Europe Fund
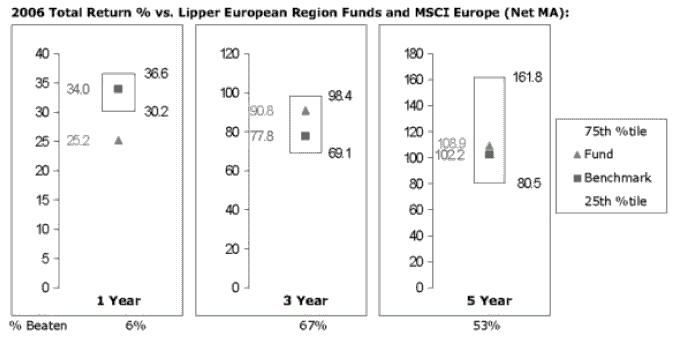
The Board reviewed the fund's relative investment performance against its peer group and stated that the performance of the fund was in the fourth quartile for the one-year period and the second quartile for the three- and five-year periods. The Board also stated that the investment performance of the fund compared favorably to its benchmark for the three- and five-year periods, although the fund's one-year cumulative total return was lower than its benchmark.
Annual Report
Board Approval of Investment Advisory Contracts and Management Fees - continued
Fidelity Japan Fund
The Board reviewed the fund's relative investment performance against its peer group and stated that the performance of the fund was in the third quartile for the one-year period, the second quartile for the three-year period, and the first quartile for the five-year period. The Board also stated that the investment performance of the fund compared favorably to its benchmark for the three- and five-year periods, although the fund's one-year cumulative total return was lower than its benchmark.
The Board also considered that each fund's management fee is subject to upward or downward adjustment depending upon whether, and to what extent, the fund's investment performance for the performance period exceeds, or is exceeded by, the record (over the same period) of a Board-approved performance adjustment index. The Board realizes that the performance adjustment provides FMR with a strong economic incentive to seek to achieve superior performance for each fund's shareholders and helps to more closely align the interests of FMR and each fund's shareholders.
The Board considered that FMR has taken steps to refocus and strengthen equity research, equity portfolio management, and compliance.
Based on its review, and giving particular weight to the nature and quality of the resources dedicated by the Investment Advisers to maintain and improve relative performance, the Board concluded that the nature, extent, and quality of the services provided to each fund will benefit each fund's shareholders, particularly in light of the Board's view that each fund's shareholders benefit from investing in a fund that is part of a large family of funds offering a variety of investment disciplines and services.
Competitiveness of Management Fee and Total Fund Expenses. The Board considered each fund's management fee and total expenses compared to "mapped groups" of competitive funds and classes. Fidelity creates "mapped groups" by combining similar Lipper investment objective categories that have comparable management fee characteristics. Combining Lipper investment objective categories aids the Board's management fee and total expense comparisons by broadening the competitive group used for comparison and by reducing the number of universes to which various Fidelity funds are compared. The Board also considered supplemental information about how each fund's management fee and total expenses ranked relative to groups based on Lipper classifications, which take into account a fund's market capitalization and style.
The Board considered two proprietary management fee comparisons for the 12-month periods shown in the charts below. The group of Lipper funds used by the Board for management fee comparisons is referred to below as the "Total Mapped Group" (and, for each of Europe Fund and Japan Fund, for the reasons explained above, is broader than the Lipper peer group used by the Board for performance comparisons). The Total Mapped Group comparison focuses on a fund's standing relative to the total universe of comparable funds available to investors, in terms of gross management fees before expense reimbursements or caps, and without giving effect to a fund's performance adjustment (if applicable). "TMG %" represents the percentage of funds in the Total Mapped Group that had management fees that were lower than a fund's. For example, a TMG % of 15% would mean that 85% of the funds in the Total Mapped Group had higher management fees than a fund. The "Asset-Size Peer Group" (ASPG) comparison focuses on a fund's standing relative to non-Fidelity funds similar in size to the fund within the Total Mapped Group. The ASPG represents at least 15% of the funds in the Total Mapped Group with comparable asset size and management fee characteristics, subject to a minimum of 50 funds (or all funds in the Total Mapped Group if fewer than 50). Additional information, such as the ASPG quartile in which a fund's management fee ranked and the impact of a fund's performance adjustment (if applicable), is also included in the charts and considered by the Board.
Annual Report
Fidelity Canada Fund
The Board noted that the fund's management fee ranked below the median of its Total Mapped Group and below the median of its ASPG for 2006. The Board also noted the effect of the fund's negative performance adjustment on the fund's management fee ranking. The Board noted that the performance adjustment for each year represents calculations for performance periods that differ from the periods shown in the performance charts above.
In connection with the renewal of the fund's management contract, the Board also approved non-material amendments to the fund's management contract to clarify certain provisions regarding the calculation of the fund's performance adjustment.
Fidelity China Region Fund
The Board noted that the fund's management fee ranked below the median of its Total Mapped Group and below the median of its ASPG for 2006.
Annual Report
Board Approval of Investment Advisory Contracts and Management Fees - continued
Fidelity Japan Smaller Companies Fund
The Board noted that the fund's management fee ranked below the median of its Total Mapped Group and below the median of its ASPG for 2006.
Fidelity Latin America Fund
The Board noted that the fund's management fee ranked below the median of its Total Mapped Group and below the median of its ASPG for 2006.
Annual Report
Fidelity Nordic Fund
The Board noted that the fund's management fee ranked below the median of its Total Mapped Group and below the median of its ASPG for 2006.
Fidelity Pacific Basin Fund
The Board noted that the fund's management fee ranked below the median of its Total Mapped Group and below the median of its ASPG for 2006. The Board also noted the effect of the fund's positive performance adjustment on the fund's management fee ranking. The Board noted that the performance adjustment for each year represents calculations for performance periods that differ from the periods shown in the performance charts above.
Furthermore, the Board considered that shareholders of Pacific Basin Fund approved a prospective change in the index used to calculate the fund's performance adjustment, beginning April 1, 2001. The Board also considered that, because the performance adjustment is based on a rolling 36-month measurement period, during a transition period the fund's performance is compared to a blended index return that reflects the performance of the former index for the portion of the measurement period prior to April 1, 2001 and the performance of the current index for the remainder of the measurement period. The Board noted that the fund's performance adjustments for 2002 through 2004 shown in the chart above reflect the effect of using the blended index return to calculate the fund's performance adjustment.
Annual Report
Board Approval of Investment Advisory Contracts and Management Fees - continued
Fidelity Southeast Asia Fund
The Board noted that the fund's management fee ranked below the median of its Total Mapped Group and below the median of its ASPG for 2006. The Board also noted the effect of the fund's positive performance adjustment on the fund's management fee ranking. The Board noted that the performance adjustment for each year represents calculations for performance periods that differ from the periods shown in the performance charts above.
Fidelity Emerging Markets Fund
The Board noted that the fund's management fee ranked below the median of its Total Mapped Group and below the median of its ASPG for 2006.
Annual Report
Fidelity Europe Capital Appreciation Fund
The Board noted that the fund's management fee ranked below the median of its Total Mapped Group and below the median of its ASPG for 2006. The Board also noted the effect of the fund's positive performance adjustment on the fund's management fee ranking. The Board noted that the performance adjustment for each year represents calculations for performance periods that differ from the periods shown in the performance charts above.
Fidelity Europe Fund
The Board noted that the fund's management fee ranked below the median of its Total Mapped Group and below the median of its ASPG for 2006. The Board also noted the effect of the fund's positive performance adjustment on the fund's management fee ranking. The Board noted that the performance adjustment for each year represents calculations for performance periods that differ from the periods shown in the performance charts above.
Annual Report
Board Approval of Investment Advisory Contracts and Management Fees - continued
Fidelity Japan Fund
The Board noted that the fund's management fee ranked below the median of its Total Mapped Group and below the median of its ASPG for 2006. The Board also noted the effect of the fund's positive performance adjustment on the fund's management fee ranking. The Board noted that the performance adjustment for each year represents calculations for performance periods that differ from the periods shown in the performance charts above.
Based on its review, the Board concluded that each fund's management fee was fair and reasonable in light of the services that the fund receives and the other factors considered.
In its review of each fund's total expenses, the Board considered the fund's management fee as well as other fund expenses, such as transfer agent fees, pricing and bookkeeping fees, and custodial, legal, and audit fees. The Board also noted the effects of any waivers and reimbursements on fees and expenses, as well as Europe Fund's, Europe Capital Appreciation Fund's, Japan Fund's, Pacific Basin Fund's and Southeast Asia Fund's positive performance adjustment, and Canada Fund's negative performance adjustment. As part of its review, the Board also considered current and historical total expenses of each fund compared to competitive fund median expenses. Each fund is compared to those funds and classes in the Total Mapped Group (used by the Board for management fee comparisons) that have a similar sales load structure.
The Board noted that each fund's total expenses ranked below its competitive median for 2006.
In its review of total expenses, the Board also considered Fidelity fee structures and other information on clients that FMR and its affiliates service in other competitive markets, such as other mutual funds advised or subadvised by FMR or its affiliates, pension plan clients, and other institutional clients.
Based on its review, the Board concluded that each fund's total expenses were reasonable in light of the services that the fund and its shareholders receive and the other factors considered.
Costs of the Services and Profitability. The Board considered the revenues earned and the expenses incurred by Fidelity in conducting the business of developing, marketing, distributing, managing, administering and servicing each fund and its shareholders. The Board also considered the level of Fidelity's profits in respect of all the Fidelity funds.
On an annual basis, FMR presents to the Board Fidelity's profitability for each fund. Fidelity calculates the profitability for each fund, as well as aggregate profitability for groups of Fidelity funds and all Fidelity funds, using a series of detailed revenue and cost allocation methodologies which originate with the audited books and records of Fidelity. The Audit Committee of the Board reviews any significant changes from the prior year's methodologies.
PricewaterhouseCoopers LLP (PwC), independent registered public accounting firm and auditor to Fidelity and certain Fidelity funds, has been engaged annually by the Board as part of the Board's assessment of the results of Fidelity's profitability analysis. PwC's engagement includes the review and assessment of Fidelity's methodologies used in determining the revenues and expenses attributable to Fidelity's mutual fund business, and completion of agreed-upon procedures surrounding the mathematical accuracy of fund profitability and its conformity to allocation methodologies. After considering PwC's reports issued under the engagement and information provided by Fidelity, the Board believes that while other allocation methods may also be reasonable, Fidelity's profitability methodologies are reasonable in all material respects.
Annual Report
The Board has also reviewed Fidelity's non-fund businesses and any fall-out benefits related to the mutual fund business as well as cases where Fidelity's affiliates may benefit from or be related to the funds' business.
The Board considered the costs of the services provided by and the profits realized by Fidelity in connection with the operation of each fund and determined that the amount of profit is a fair entrepreneurial profit for the management of each fund.
Economies of Scale. The Board considered whether there have been economies of scale in respect of the management of the Fidelity funds, whether the Fidelity funds (including each fund) have appropriately benefited from any such economies of scale, and whether there is potential for realization of any further economies of scale. The Board considered the extent to which each fund will benefit from economies of scale through increased services to the fund, through waivers or reimbursements, or through fee or expense reductions, including reductions that occur through operation of the transfer agent agreement. The transfer agent fee varies in part based on the number of accounts in each fund. If the number of accounts decreases or the average account size increases, the overall transfer agent fee rate decreases.
The Board recognized that each fund's management contract incorporates a "group fee" structure, which provides for lower group fee rates as total fund assets under FMR's management increase, and for higher group fee rates as total fund assets under FMR's management decrease. FMR determines the group fee rates based on a tiered asset "breakpoint" schedule. In connection with the renewal of each fund's management contract, the Board approved amendments to each fund's management contract that added four new fee breakpoints to the group fee rate schedule for assets under FMR's management above $1,386 billion. The Board considered that the group fee rate declines under both the present and amended schedules, but that under the amended schedule, the group fee rate declines faster as assets under FMR's management exceed $1,386 billion. The Board considered that the group fee is designed to deliver the benefits of economies of scale to fund shareholders when total fund assets increase, even if assets of any particular fund are unchanged or have declined, because some portion of Fidelity's costs are attributable to services provided to all Fidelity funds, and all funds benefit if those costs can be allocated among more assets. The Board also considered that although Japan Smaller Companies Fund is partially closed to new investors, it continues to incur investment management expenses, and marketing and distribution expenses related to the retention of existing shareholders and assets. The Board further noted that Japan Smaller Companies Fund may continue to realize benefits from the group fee structure, even though assets may not be expected to grow significantly at the fund level. The Board concluded that, given the group fee structure, fund shareholders will achieve a certain level of economies of scale as assets under FMR's management increase at the fund complex level, regardless of whether Fidelity achieves any such economies of scale.
The Board further concluded that any potential economies of scale are being shared between fund shareholders and Fidelity in an appropriate manner.
Additional Information Requested by the Board. In order to develop fully the factual basis for consideration of the Fidelity funds' Advisory Contracts, the Board requested and received additional information on several topics, including (i) fund performance trends and actions to be taken by FMR to improve certain funds' overall performance; (ii) Fidelity's portfolio manager compensation structure, including its effects on fund profitability and the extent to which portfolio manager compensation is linked to fund performance; (iii) Fidelity's fee structures; (iv) the funds' sub-advisory arrangements; and (v) accounts managed by Fidelity other than the Fidelity funds.
Based on its evaluation of all of the conclusions noted above, and after considering all material factors, the Board ultimately concluded that the advisory fee structures are fair and reasonable, and that each fund's Advisory Contracts should be renewed.
Annual Report
Annual Report

Fidelity Advisor
Canada Fund
Class A, Class T, Class B and Class C
Class A, Class T, Class B and Class C
are classes of Fidelity® Canada Fund
Annual Report
October 31, 2007
(2_fidelity_logos) (Registered_Trademark)
Contents
Chairman's Message | <Click Here> | Ned Johnson's message to shareholders. |
Performance | <Click Here> | How the fund has done over time. |
Management's Discussion | <Click Here> | The manager's review of fund performance, strategy and outlook. |
Shareholder Expense Example | <Click Here> | An example of shareholder expenses. |
Investment Changes | <Click Here> | A summary of major shifts in the fund's investments over the past six months. |
Investments | <Click Here> | A complete list of the fund's investments with their market values. |
Financial Statements | <Click Here> | Statements of assets and liabilities, operations, and changes in net assets,
as well as financial highlights. |
Notes | <Click Here> | Notes to the financial statements. |
Report of Independent Registered Public Accounting Firm | <Click Here> | |
Trustees and Officers | <Click Here> | |
Distributions | <Click Here> | |
Board Approval of Investment Advisory Contracts and Management Fees | <Click Here> | |
To view a fund's proxy voting guidelines and proxy voting record for the 12-month period ended June 30, visit http://www.fidelity.com (search for "proxy voting guidelines") or visit the Securities and Exchange Commission's (SEC) web site at http://www.sec.gov. You may also call 1-877-208-0098 to request a free copy of the proxy voting guidelines.
Standard & Poor's, S&P and S&P 500 are registered service marks of The McGraw-Hill Companies, Inc. and have been licensed for use by Fidelity Distributors Corporation.
Other third party marks appearing herein are the property of their respective owners.
All other marks appearing herein are registered or unregistered trademarks or service marks of FMR LLC or an affiliated company.
This report and the financial statements contained herein are submitted for the general information of the shareholders of the fund. This report is not authorized for distribution to prospective investors in the fund unless preceded or accompanied by an effective prospectus.
A fund files its complete schedule of portfolio holdings with the SEC for the first and third quarters of each fiscal year on Form N-Q. Forms N-Q are available on the SEC's web site at http://www.sec.gov. A fund's Forms N-Q may be reviewed and copied at the SEC's Public Reference Room in Washington, DC. Information regarding the operation of the SEC's Public Reference Room may be obtained by calling 1-800-SEC-0330. For a complete list of a fund's portfolio holdings, view the most recent holdings listing, semiannual report, or annual report on Fidelity's web site at http://www.fidelity.com or http://www.advisor.fidelity.com, as applicable.
NOT FDIC INSURED · MAY LOSE VALUE · NO BANK GUARANTEE
Neither the fund nor Fidelity Distributors Corporation is a bank.
Annual Report
Chairman's Message
(Photograph of Edward C. Johnson 3d.)
Dear Shareholder:
Many stock and bond markets around the world have been unsettled of late; however, volatility can often lead to opportunity for patient investors. Financial markets are always unpredictable, but there are a number of time-tested principles that can put the historical odds in your favor.
One of the basic tenets is to invest for the long term. Over time, riding out the markets' inevitable ups and downs has proven much more effective than selling into panic or chasing the hottest trend. Even missing only a few of the markets' best days can significantly diminish investor returns. Patience also affords the benefits of compounding - of earning interest on additional income or reinvested dividends and capital gains. There are tax advantages and cost benefits to consider as well. The more you sell, the more taxes you pay, and the more you trade, the higher the costs. While staying the course doesn't eliminate risk, it can considerably lessen the effect of short-term declines.
You can further manage your investing risk through diversification. And today, more than ever, geographic diversification should be taken into account. Studies
indicate that asset allocation is the single most important determinant of a portfolio's long-term success. The right mix of stocks, bonds and cash - aligned to your particular risk tolerance and investment objective - is very important. Age-appropriate rebalancing is also an essential aspect of asset allocation. For younger investors, an emphasis on equities - which historically have been the best-performing asset class over time - is encouraged. As investors near their specific goal, such as retirement or sending a child to college, consideration may be given to replacing volatile assets (e.g. common stocks) with more-stable fixed investments (bonds or savings plans).
A third investment principle - investing regularly - can help lower the average cost of your purchases. Investing a certain amount of money each month or quarter helps ensure you won't pay for all your shares at market highs. This strategy - known as dollar cost averaging - also reduces unconstructive "emotion" from investing, helping shareholders avoid selling weak performers just prior to an upswing, or chasing a hot performer just before a correction.
We invite you to contact us via the Internet, through our Investor Centers or over the phone. It is our privilege to provide you the information you need to make the investments that are right for you.
Sincerely,
/s/Edward C. Johnson 3d
Edward C. Johnson 3d
Annual Report
Performance: The Bottom Line
Average annual total return reflects the change in the value of an investment, assuming reinvestment of the class' dividend income and capital gains (the profits earned upon the sale of securities that have grown in value) and assuming a constant rate of performance each year. The $10,000 table and the fund's returns do not reflect the deduction of taxes that a shareholder would pay on fund distributions or the redemption of fund shares. During periods of reimbursement by Fidelity, a fund's total returns will be greater than it would be had the reimbursement not occurred. How a fund did yesterday is no guarantee of how it will do tomorrow.
Average Annual Total Returns
Periods ended October 31, 2007 | Past 1
year | Past 5
years | Past 10
years |
Class A (incl. 5.75% sales charge)A | 37.45% | 31.52% | 15.89% |
Class T (incl. 3.50% sales charge) B | 40.59% | 32.12% | 16.15% |
Class B (incl. contingent deferred sales charge) C | 40.26% | 32.85% | 16.53% |
Class C (incl. contingent deferred sales charge) D | 44.32% | 32.99% | 16.53% |
A Class A shares bear a 0.25% 12b-1 fee. The initial offering of Class A shares took place on May 2, 2007. Returns prior to May 2, 2007 are those of Canada, the original retail class of the fund, which has no 12b-1 fee. Had Class A shares' 12b-1 fee been reflected, returns prior to May 2, 2007 would have been lower.
B Class T shares bear a 0.50% 12b-1 fee. The initial offering of Class T shares took place on May 2, 2007. Returns prior to May 2, 2007 are those of Canada, the original retail class of the fund, which has no 12b-1 fee. Had Class T shares' 12b-1 fee been reflected, returns prior to May 2, 2007 would have been lower.
C Class B shares bear a 1.00% 12b-1 fee. The initial offering of Class B shares took place on May 2, 2007. Returns prior to May 2, 2007 are those of Canada, the original retail class of the fund, which has no 12b-1 fee. Had Class B shares' 12b-1 fee been reflected, returns prior to May 2, 2007 would have been lower. Class B shares' contingent deferred sales charge included in the past one year, past five years, and past 10 years total return figures are 5%, 2%, and 0% respectively.
D Class C shares bear a 1.00% 12b-1 fee. The initial offering of Class C shares took place on May 2, 2007. Returns prior to May 2, 2007 are those of Canada, the original retail class of the fund, which has no 12b-1 fee. Had Class C shares' 12b-1 fee been reflected, returns prior to May 2, 2007 would have been lower. Class C shares' contingent deferred sales charge included in the past one year, past five years, and past 10 years total return figures are 1%, 1%, and 0%, respectively.
$10,000 Over 10 Years
Let's say hypothetically that $10,000 was invested in Fidelity® Canada Fund - Class T on October 31, 1997, and the current 3.50% sales charge was paid. The chart shows how the value of your investment would have changed, and also shows how the S&P/TSX Composite Index performed over the same period. The initial offering of Class T took place on May 2, 2007. See above for additional information regarding the performance of Class T.
Annual Report
Management's Discussion of Fund Performance
Comments from Maxime Lemieux, Portfolio Manager of Fidelity Advisor Canada Fund
Foreign stocks, with a large assist from a weak U.S. dollar, generally had higher returns for U.S. investors than domestic equities during the 12-month period ending October 31, 2007. The backdrop for global stocks was solid, with robust economic growth and relatively high corporate profitability worldwide. Developed international equity markets, as measured by the Morgan Stanley Capital InternationalSM Europe, Australasia, and Far East (MSCI® EAFE®) Index - a performance monitor of established markets outside the United States and Canada - rose 25.09%. In comparison, the Standard & Poor's 500SM Index, a gauge of U.S. stocks, was up 14.56%, while Canada did appreciably better, as measured by the 43.24% advance of the S&P/TSX Composite Index. Among countries making up at least 1% of the EAFE benchmark, Finland had the best showing, soaring nearly 69%, while Hong Kong gained roughly 66%. The United Kingdom and Japan, the two largest components of the index, both underperformed. Fallout from the credit crunch and concerns about export growth tempered UK stocks, while Japan struggled with a slowdown in consumer spending and sluggish domestic growth. Emerging markets were the period's big winners, advancing 68.33% as measured by the MSCI Emerging Markets index.
For the 12 months that ended October 31, 2007, the fund (excluding sales charges) solidly beat the 43.24% gain of the S&P/TSX Composite Index. (For specific class-level performance results, please refer to the performance section of this report.) Despite an underweighting in the strong-performing energy and materials sectors, prudent stock selection within these and other sectors - notably technology - propelled the fund's return past that of the benchmark. Overweighted positions in technology firm Research In Motion, aluminum producer and takeover target Alcan, engineering firm SNC-Lavalin, T-shirt manufacturer Gildan Activewear and fertilizer giant Potash Corp. of Saskatchewan made these stocks top contributors. Owning only a small stake in poorly performing telecommunications equipment maker Nortel Networks also boosted relative returns. Conversely, we had disappointing results in financials, led by property and casualty insurer ING Canada and Bank of Montreal. Elsewhere, telecom services operator TELUS and gas and convenience store owner Alimentation Couche-Tard also detracted. Underweighting strong-performing telecom services operator BCE, which is in the process of being acquired, and not owning nickel producer and index component LionOre, which was taken over during the period, also dampened returns.
Note to shareholders: Fidelity Advisor Canada Fund may invest up to 35% of its total assets in any industry that represents more than 20% of the Canadian market. As of October 31, 2007, the fund did not have more than 25% of its total assets invested in any one industry.
The views expressed above reflect those of the portfolio manager(s) only through the end of the period as stated on the cover of this report and do not necessarily represent the views of Fidelity or any other person in the Fidelity organization. Any such views are subject to change at any time based upon market or other conditions and Fidelity disclaims any responsibility to update such views. These views may not be relied on as investment advice and, because investment decisions for a Fidelity fund are based on numerous factors, may not be relied on as an indication of trading intent on behalf of any Fidelity fund.
Annual Report
Canada
Shareholder Expense Example
As a shareholder of the Fund, you incur two types of costs: (1) transaction costs, including sales charges (loads) on purchase payments or redemption proceeds, redemption fees, and (2) ongoing costs, including management fees, distribution and/or service (12b-1) fees and other Fund expenses. This Example is intended to help you understand your ongoing costs (in dollars) of investing in the Fund and to compare these costs with the ongoing costs of investing in other mutual funds.
The Example is based on an investment of $1,000 invested at the beginning of the period and held for the entire period (May 1, 2007 to October 31, 2007) for the Canada class and for the entire period (May 2, 2007 to October 31, 2007) for Class A, Class T, Class B, Class C, and Institutional Class.
Actual Expenses
The first line of the accompanying table for each class of the Fund provides information about actual account values and actual expenses. You may use the information in this line, together with the amount you invested, to estimate the expenses that you paid over the period. Simply divide your account value by $1,000.00 (for example, an $8,600 account value divided by $1,000.00 = 8.6), then multiply the result by the number in the first line for a class of the Fund under the heading entitled "Expenses Paid During Period" to estimate the expenses you paid on your account during this period. A small balance maintenance fee of $12.00 that is charged once a year may apply for certain accounts with a value of less than $2,000. This fee is not included in the table below. If it was, the estimate of expenses you paid during the period would be higher, and your ending account value lower, by this amount. In addition, the Fund, as a shareholder in the underlying Fidelity Central Funds, will indirectly bear its pro rata share of the fees and expenses incurred by the underlying Fidelity Central Funds. These fees and expenses are not included in the Fund's annualized expense ratio used to calculate the expense estimate in the table below.
Hypothetical Example for Comparison Purposes
The second line of the accompanying table for each class of the Fund provides information about hypothetical account values and hypothetical expenses based on a Class' actual expense ratio and an assumed rate of return of 5% per year before expenses, which is not the Class' actual return. The hypothetical account values and expenses may not be used to estimate the actual ending account balance or expenses you paid for the period. You may use this information to compare the ongoing costs of investing in the Fund and other funds. To do so, compare this 5% hypothetical example with the 5% hypothetical examples that appear in the shareholder reports of the other funds. A small balance maintenance fee of $12.00 that is charged once a year may apply for certain accounts with a value of less than $2,000. This fee is not included in the table below. If it was, the estimate of expenses you paid during the period would be higher, and your ending account value lower, by this amount. In addition, the Fund, as a shareholder in the underlying Fidelity Central Funds, will indirectly bear its pro rata share of the fees and expenses incurred by the underlying Fidelity Central Funds. These fees and expenses are not included in the Fund's annualized expense ratio used to calculate the expense estimate in the table below.
Please note that the expenses shown in the table are meant to highlight your ongoing costs only and do not reflect any transaction costs. Therefore, the second line of the table is useful in comparing ongoing costs only, and will not help you determine the relative total costs of owning different funds. In addition, if these transactional costs were included, your costs would have been higher.
| Beginning
Account Value
May 1, 2007 | Ending
Account Value
October 31, 2007 | Expenses Paid
During Period*
May 1, 2007
to October 31, 2007 |
Class A | | | |
Actual | $ 1,000.00 | $ 1,299.30 | $ 7.09 |
HypotheticalA | $ 1,000.00 | $ 1,019.00 | $ 6.26 |
Class T | | | |
Actual | $ 1,000.00 | $ 1,298.00 | $ 8.53 |
HypotheticalA | $ 1,000.00 | $ 1,017.74 | $ 7.53 |
Classs B | | | |
Actual | $ 1,000.00 | $ 1,294.10 | $ 11.50 |
HypotheticalA | $ 1,000.00 | $ 1,015.12 | $ 10.16 |
Class C | | | |
Actual | $ 1,000.00 | $ 1,294.60 | $ 11.45 |
HypotheticalA | $ 1,000.00 | $ 1,015.17 | $ 10.11 |
Canada | | | |
Actual | $ 1,000.00 | $ 1,318.80 | $ 5.61 |
HypotheticalA | $ 1,000.00 | $ 1,020.37 | $ 4.89 |
Institutional Class | | | |
Actual | $ 1,000.00 | $ 1,300.90 | $ 5.83 |
HypotheticalA | $ 1,000.00 | $ 1,020.11 | $ 5.14 |
A 5% return per year before expenses
* Expenses are equal to each Class' annualized expense ratio (shown in the table below); multiplied by the average account value over the period, multiplied by 184/365 (to reflect the one-half year period) for the Canada class and multiplied by 183/365 (to reflect the period May 2, 2007 to October 31, 2007) for Class A, Class T, Class B, Class C, and Institutional Class.
Annual Report
| Annualized
Expense Ratio |
Class A | 1.23% |
Class T | 1.48% |
Class B | 2.00% |
Class C | 1.99% |
Canada | .96% |
Institutional Class | 1.01% |
Annual Report
Canada
Investment Changes
Geographic Diversification (% of fund's net assets) |
As of October 31, 2007 |
 | Canada | 94.9% | |
 | United States of America | 5.1% | |

Percentages are adjusted for the effect of futures contracts, if applicable. |
|
As of April 30, 2007 |
| Canada | 96.5% | |
| United States of America | 3.5% | |

Percentages are adjusted for the effect of futures contracts, if applicable. |
Asset Allocation |
| % of fund's
net assets | % of fund's net assets
6 months ago |
Stocks | 96.1 | 97.7 |
Short-Term Investments and Net Other Assets | 3.9 | 2.3 |
Top Ten Stocks as of October 31, 2007 |
| % of fund's
net assets | % of fund's net assets
6 months ago |
Research In Motion Ltd. (Communications Equipment) | 4.8 | 2.6 |
Suncor Energy, Inc. (Oil, Gas & Consumable Fuels) | 4.7 | 3.6 |
Manulife Financial Corp. (Insurance) | 4.5 | 5.0 |
Royal Bank of Canada (Commercial Banks) | 4.0 | 4.7 |
Toronto-Dominion Bank (Commercial Banks) | 3.9 | 4.5 |
Potash Corp. of Saskatchewan, Inc. (Chemicals) | 3.7 | 2.5 |
SNC-Lavalin Group, Inc. (Construction & Engineering) | 3.6 | 1.3 |
Canadian Natural Resources Ltd. (Oil, Gas & Consumable Fuels) | 3.5 | 3.1 |
Rogers Communications, Inc. Class B (non-vtg.) (Wireless Telecommunication Services) | 3.4 | 3.1 |
EnCana Corp. (Oil, Gas & Consumable Fuels) | 3.2 | 3.2 |
| 39.3 | |
Market Sectors as of October 31, 2007 |
| % of fund's
net assets | % of fund's net assets
6 months ago |
Energy | 25.6 | 26.8 |
Financials | 23.7 | 29.7 |
Materials | 10.9 | 9.5 |
Industrials | 10.3 | 8.0 |
Information Technology | 9.5 | 5.9 |
Consumer Discretionary | 6.3 | 7.6 |
Telecommunication Services | 6.3 | 6.6 |
Consumer Staples | 3.4 | 3.6 |
Health Care | 0.1 | 0.0 |
Annual Report
Canada
Investments October 31, 2007
Showing Percentage of Net Assets
Common Stocks - 96.1% |
| Shares | | Value |
CONSUMER DISCRETIONARY - 6.3% |
Hotels, Restaurants & Leisure - 0.7% |
Great Canadian Gaming Corp. (a) | 1,100,000 | | $ 16,310,104 |
Tim Hortons, Inc. | 500,000 | | 18,950,000 |
| | 35,260,104 |
Media - 3.0% |
Aeroplan Income Fund | 718,200 | | 17,038,424 |
Aeroplan Income Fund (a)(e) | 31,800 | | 754,416 |
Astral Media, Inc. Class A (non-vtg.) | 200,000 | | 9,540,352 |
Corus Entertainment, Inc. Class B (non-vtg.) | 550,000 | | 28,979,559 |
Quebecor, Inc. Class B (sub. vtg.) | 975,000 | | 42,337,429 |
Yellow Pages Income Fund | 3,200,000 | | 48,464,308 |
| | 147,114,488 |
Multiline Retail - 0.5% |
Canadian Tire Corp. Ltd. Class A (non-vtg.) | 275,000 | | 25,309,786 |
Textiles, Apparel & Luxury Goods - 2.1% |
Gildan Activewear, Inc. (a) | 2,250,000 | | 103,063,440 |
TOTAL CONSUMER DISCRETIONARY | | 310,747,818 |
CONSUMER STAPLES - 3.4% |
Food & Staples Retailing - 2.6% |
Alimentation Couche-Tard, Inc. Class B (sub. vtg.) | 1,250,000 | | 27,179,093 |
Metro, Inc. Class A (sub. vtg.) | 725,000 | | 27,281,561 |
Shoppers Drug Mart Corp. | 1,250,000 | | 73,316,035 |
| | 127,776,689 |
Food Products - 0.8% |
Saskatchewan Wheat Pool, Inc. (a) | 1,826,500 | | 24,702,823 |
Saskatchewan Wheat Pool, Inc. (a)(e) | 1,273,500 | | 17,223,676 |
| | 41,926,499 |
TOTAL CONSUMER STAPLES | | 169,703,188 |
ENERGY - 25.6% |
Energy Equipment & Services - 0.6% |
CCS Income Trust | 500,000 | | 23,935,607 |
Flint Energy Services Ltd. (a) | 250,000 | | 6,441,961 |
Savanna Energy Services Corp. | 140,000 | | 2,367,931 |
| | 32,745,499 |
Oil, Gas & Consumable Fuels - 25.0% |
AltaGas Income Trust | 700,000 | | 19,868,672 |
Cameco Corp. | 1,000,000 | | 49,300,996 |
Canadian Natural Resources Ltd. | 2,100,000 | | 174,725,694 |
Canadian Oil Sands Trust | 1,700,000 | | 62,476,170 |
Duvernay Oil Corp. (a) | 350,000 | | 12,644,037 |
EnCana Corp. | 2,250,000 | | 157,514,298 |
Galleon Energy, Inc. (a)(e) | 100,000 | | 1,524,042 |
Galleon Energy, Inc. Class A (a) | 700,000 | | 10,668,291 |
Husky Energy, Inc. | 1,400,000 | | 65,284,897 |
Keyera Facilities Income Fund | 1,000,000 | | 17,729,295 |
|
| Shares | | Value |
Nexen, Inc. | 1,250,000 | | $ 42,350,667 |
Niko Resources Ltd. | 475,000 | | 53,224,952 |
Niko Resources Ltd. (e) | 20,000 | | 2,241,051 |
Petro-Canada | 1,232,900 | | 71,164,001 |
Suncor Energy, Inc. | 2,100,000 | | 230,083,669 |
Talisman Energy, Inc. | 3,200,000 | | 69,747,935 |
TransCanada Corp. | 3,700,000 | | 157,451,811 |
Uranium One, Inc. (a) | 1,550,000 | | 17,220,398 |
Valero Energy Corp. | 280,000 | | 19,720,400 |
| | 1,234,941,276 |
TOTAL ENERGY | | 1,267,686,775 |
FINANCIALS - 23.7% |
Capital Markets - 0.6% |
CI Financial Income Fund | 950,000 | | 28,604,639 |
Commercial Banks - 12.9% |
Bank of Montreal | 2,300,000 | | 153,463,249 |
Canadian Imperial Bank of Commerce | 450,000 | | 48,612,582 |
National Bank of Canada | 800,000 | | 46,303,749 |
Royal Bank of Canada | 3,350,000 | | 198,828,638 |
Toronto-Dominion Bank | 2,550,000 | | 192,694,874 |
| | 639,903,092 |
Diversified Financial Services - 0.8% |
Onex Corp. (sub. vtg.) | 425,000 | | 17,887,630 |
TSX Group, Inc. | 375,000 | | 20,231,413 |
| | 38,119,043 |
Insurance - 7.3% |
ING Canada, Inc. | 570,000 | | 27,165,855 |
Manulife Financial Corp. | 4,750,000 | | 222,307,244 |
Power Corp. of Canada (sub. vtg.) | 1,200,000 | | 51,497,564 |
Sun Life Financial, Inc. | 1,000,000 | | 58,133,870 |
| | 359,104,533 |
Real Estate Management & Development - 2.1% |
Brookfield Asset Management, Inc. Class A | 1,850,000 | | 75,610,570 |
Brookfield Properties Corp. | 1,250,000 | | 31,212,508 |
| | 106,823,078 |
TOTAL FINANCIALS | | 1,172,554,385 |
HEALTH CARE - 0.1% |
Health Care Equipment & Supplies - 0.1% |
Noveko International, Inc. (a) | 834,000 | | 6,085,850 |
INDUSTRIALS - 10.3% |
Aerospace & Defense - 2.9% |
Bombardier, Inc. Class B (sub. vtg.) (a) | 16,275,000 | | 96,526,160 |
Common Stocks - continued |
| Shares | | Value |
INDUSTRIALS - continued |
Aerospace & Defense - continued |
CAE, Inc. | 3,300,000 | | $ 44,526,583 |
Mecachrome International, Inc. (a)(e) | 400,000 | | 5,380,216 |
| | 146,432,959 |
Commercial Services & Supplies - 0.4% |
Garda World Security Corp. (a) | 950,000 | | 18,321,860 |
Construction & Engineering - 3.6% |
SNC-Lavalin Group, Inc. | 3,450,000 | | 178,748,146 |
Machinery - 0.2% |
Bucyrus International, Inc. Class A | 100,000 | | 8,250,000 |
Road & Rail - 1.9% |
Canadian National Railway Co. | 1,300,000 | | 72,958,060 |
Canadian Pacific Railway Ltd. | 150,000 | | 10,561,322 |
TransForce Income Fund | 844,237 | | 9,450,948 |
| | 92,970,330 |
Trading Companies & Distributors - 1.3% |
Finning International, Inc. | 1,900,000 | | 65,399,280 |
TOTAL INDUSTRIALS | | 510,122,575 |
INFORMATION TECHNOLOGY - 9.5% |
Communications Equipment - 5.0% |
Nortel Networks Corp. (a) | 550,000 | | 8,877,357 |
Research In Motion Ltd. (a) | 1,900,000 | | 236,569,016 |
| | 245,446,373 |
Electronic Equipment & Instruments - 0.2% |
Miranda Technologies, Inc. (a) | 613,700 | | 6,629,676 |
Miranda Technologies, Inc. (a)(e) | 186,300 | | 2,012,561 |
| | 8,642,237 |
Internet Software & Services - 2.6% |
Google, Inc. Class A (sub. vtg.) (a) | 150,000 | | 106,050,000 |
Open Text Corp. (a)(d) | 675,000 | | 21,096,431 |
| | 127,146,431 |
IT Services - 0.6% |
CGI Group, Inc. Class A (sub. vtg.) (a) | 2,000,000 | | 22,791,781 |
Emergis, Inc. (a) | 700,000 | | 5,552,849 |
| | 28,344,630 |
Semiconductors & Semiconductor Equipment - 0.2% |
Broadcom Corp. Class A (a) | 250,000 | | 8,137,500 |
Tundra Semiconductor Corp. Ltd. (a) | 355,000 | | 1,928,776 |
| | 10,066,276 |
|
| Shares | | Value |
Software - 0.9% |
Cognos, Inc. (a) | 350,000 | | $ 17,615,501 |
MacDonald Dettwiler & Associates Ltd. (a) | 625,000 | | 29,787,121 |
| | 47,402,622 |
TOTAL INFORMATION TECHNOLOGY | | 467,048,569 |
MATERIALS - 10.9% |
Chemicals - 3.7% |
Potash Corp. of Saskatchewan, Inc. | 1,470,000 | | 180,545,409 |
Metals & Mining - 7.2% |
Aber Diamond Corp. | 450,000 | | 19,797,712 |
Barrick Gold Corp. | 1,100,000 | | 48,930,311 |
Eldorado Gold Corp. (a) | 350,000 | | 2,442,809 |
First Quantum Minerals Ltd. | 50,000 | | 5,384,982 |
Fording Canadian Coal Trust | 400,000 | | 14,666,384 |
Goldcorp, Inc. | 2,850,000 | | 100,302,372 |
Kinross Gold Corp. (a) | 3,800,000 | | 75,178,988 |
Shore Gold, Inc. (a) | 3,000,000 | | 14,456,683 |
Teck Cominco Ltd. Class B (sub. vtg.) | 600,000 | | 30,063,546 |
US Gold Corp. (a) | 1,100,000 | | 5,137,000 |
US Gold Corp. warrants 2/22/11 (a)(f) | 200,000 | | 324,084 |
Yamana Gold, Inc. (d) | 2,750,000 | | 41,474,264 |
| | 358,159,135 |
TOTAL MATERIALS | | 538,704,544 |
TELECOMMUNICATION SERVICES - 6.3% |
Diversified Telecommunication Services - 2.6% |
BCE, Inc. | 650,000 | | 28,397,056 |
TELUS Corp. (non-vtg.) | 1,725,000 | | 100,463,620 |
| | 128,860,676 |
Wireless Telecommunication Services - 3.7% |
American Tower Corp. Class A (a) | 325,000 | | 14,358,500 |
Rogers Communications, Inc. Class B (non-vtg.) | 3,250,000 | | 165,701,123 |
| | 180,059,623 |
TOTAL TELECOMMUNICATION SERVICES | | 308,920,299 |
TOTAL COMMON STOCKS (Cost $2,920,644,814) | 4,751,574,003 |
Government Obligations - 2.6% |
| Principal Amount | | |
Canadian Government Treasury Bills yield at date of purchase
3.9104% to 4.5618% 11/1/07 to 2/7/08
(Cost $119,603,328) | CAD | $ 121,450,000 | 127,806,224 |
Money Market Funds - 2.9% |
| Shares | | Value |
Fidelity Cash Central Fund, 4.97% (b) | 129,652,562 | | $ 129,652,562 |
Fidelity Securities Lending Cash Central Fund, 5.02% (b)(c) | 15,247,500 | | 15,247,500 |
TOTAL MONEY MARKET FUNDS (Cost $144,900,062) | 144,900,062 |
TOTAL INVESTMENT PORTFOLIO - 101.6% (Cost $3,185,148,204) | | 5,024,280,289 |
NET OTHER ASSETS - (1.6)% | | (81,336,082) |
NET ASSETS - 100% | $ 4,942,944,207 |
Currency Abbreviations |
CAD | - | Canadian dollar |
Legend |
(a) Non-income producing |
(b) Affiliated fund that is available only to investment companies and other accounts managed by Fidelity Investments. The rate quoted is the annualized seven-day yield of the fund at period end. A complete unaudited listing of the fund's holdings as of its most recent quarter end is available upon request. |
(c) Investment made with cash collateral received from securities on loan. |
(d) Security or a portion of the security is on loan at period end. |
(e) Security exempt from registration under Rule 144A of the Securities Act of 1933. These securities may be resold in transactions exempt from registration, normally to qualified institutional buyers. At the end of the period, the value of these securities amounted to $29,135,962 or 0.6% of net assets. |
(f) Restricted securities - Investment in securities not registered under the Securities Act of 1933 (excluding 144A issues). At the end of the period, the value of restricted securities (excluding 144A issues) amounted to $324,084 or 0.0% of net assets. |
Additional information on each holding is as follows: |
Security | Acquisition Date | Acquisition Cost |
US Gold Corp. warrants 2/22/11 | 2/8/06 | $ 98,359 |
Affiliated Central Funds |
Information regarding fiscal year to date income earned by the Fund from investments in Fidelity Central Funds is as follows: |
Fund | Income earned |
Fidelity Cash Central Fund | $ 3,233,641 |
Fidelity Securities Lending Cash Central Fund | 4,436,261 |
Total | $ 7,669,902 |
Other Affiliated Issuers |
An affiliated company is a company in which the fund has ownership of at least 5% of the voting securities. Fiscal year to date transactions with companies which are or were affiliates are as follows: |
Affiliate | Value, beginning of period | Purchases | Sales Proceeds | Dividend Income | Value, end
of period |
WestJet Airlines Ltd. | $ 3,582,328 | $ 281,310 | $ 5,177,899 | $ - | $ - |
See accompanying notes which are an integral part of the financial statements.
Annual Report
Canada
Financial Statements
Statement of Assets and Liabilities
| October 31, 2007 |
| | |
Assets | | |
Investment in securities, at value (including securities loaned of $15,071,263) - See accompanying schedule: Unaffiliated issuers
(cost $3,040,248,142) | $ 4,879,380,227 | |
Fidelity Central Funds
(cost $144,900,062) | 144,900,062 | |
Total Investments
(cost $3,185,148,204) | | $ 5,024,280,289 |
Cash | | 54,573 |
Foreign currency held at value
(cost $2,187,024) | | 2,190,556 |
Receivable for investments sold | | 11,913,945 |
Receivable for fund shares sold | | 24,997,924 |
Dividends receivable | | 4,574,014 |
Distributions receivable from Fidelity Central Funds | | 817,046 |
Prepaid expenses | | 1,281 |
Other receivables | | 182,735 |
Total assets | | 5,069,012,363 |
| | |
Liabilities | | |
Payable for investments purchased | $ 103,381,374 | |
Payable for fund shares redeemed | 3,704,968 | |
Accrued management fee | 2,706,784 | |
Distribution fees payable | 16,777 | |
Other affiliated payables | 826,650 | |
Other payables and accrued expenses | 184,103 | |
Collateral on securities loaned, at value | 15,247,500 | |
Total liabilities | | 126,068,156 |
| | |
Net Assets | | $ 4,942,944,207 |
Net Assets consist of: | | |
Paid in capital | | $ 2,817,566,476 |
Undistributed net investment income | | 26,450,845 |
Accumulated undistributed net realized gain (loss) on investments and foreign currency transactions | | 259,628,185 |
Net unrealized appreciation (depreciation) on investments and assets and liabilities in foreign currencies | | 1,839,298,701 |
Net Assets | | $ 4,942,944,207 |
Statement of Assets and Liabilities - continued
| October 31, 2007 |
| | |
Calculation of Maximum Offering Price Class A:
Net Asset Value and redemption price per share ($20,911,606 ÷ 298,051 shares) | | $ 70.16 |
| | |
Maximum offering price per share (100/94.25 of $70.16) | | $ 74.44 |
Class T:
Net Asset Value and redemption price per share ($14,522,231 ÷ 207,194 shares) | | $ 70.09 |
| | |
Maximum offering price per share (100/96.50 of $70.09) | | $ 72.63 |
Class B:
Net Asset Value and offering price per share ($4,078,099 ÷ 58,354.4 shares)A | | $ 69.88 |
| | |
Class C:
Net Asset Value and offering price per share ($8,751,799 ÷ 125,182 shares)A | | $ 69.91 |
| | |
| | |
Canada:
Net Asset Value, offering price and redemption price per share ($4,890,616,915 ÷ 69,617,220 shares) | | $ 70.25 |
| | |
Institutional Class:
Net Asset Value, offering price and redemption price per share ($4,063,557 ÷ 57,844 shares) | | $ 70.25 |
A Redemption price per share is equal to net asset value less any applicable contingent deferred sales charge.
See accompanying notes which are an integral part of the financial statements.
Annual Report
Statement of Operations
| Year ended October 31, 2007 |
| | |
Investment Income | | |
Dividends | | $ 64,656,558 |
Interest | | 3,366,629 |
Income from Fidelity Central Funds (including $4,436,261 from security lending) | | 7,669,902 |
| | 75,693,089 |
Less foreign taxes withheld | | (9,150,807) |
Total income | | 66,542,282 |
| | |
Expenses | | |
Management fee
Basic fee | $ 25,043,384 | |
Performance adjustment | (579,460) | |
Transfer agent fees | 7,412,777 | |
Distribution fees | 39,582 | |
Accounting and security lending fees | 1,426,984 | |
Custodian fees and expenses | 200,450 | |
Independent trustees' compensation | 11,897 | |
Registration fees | 222,934 | |
Audit | 84,068 | |
Legal | 33,081 | |
Interest | 36,171 | |
Miscellaneous | 119,526 | |
Total expenses before reductions | 34,051,394 | |
Expense reductions | (687,313) | 33,364,081 |
Net investment income (loss) | | 33,178,201 |
Realized and Unrealized Gain (Loss) Net realized gain (loss) on: | | |
Investment securities: | | |
Unaffiliated issuers | 271,498,118 | |
Other affiliated issuers | 1,297,868 | |
Foreign currency transactions | (518,962) | |
Total net realized gain (loss) | | 272,277,024 |
Change in net unrealized appreciation (depreciation) on: Investment securities | 1,120,584,615 | |
Assets and liabilities in foreign currencies | 134,640 | |
Total change in net unrealized appreciation (depreciation) | | 1,120,719,255 |
Net gain (loss) | | 1,392,996,279 |
Net increase (decrease) in net assets resulting from operations | | $ 1,426,174,480 |
See accompanying notes which are an integral part of the financial statements.
Annual Report
Canada
Financial Statements - continued
Statement of Changes in Net Assets
| Year ended
October 31,
2007 | Year ended
October 31,
2006 |
Increase (Decrease) in Net Assets | | |
Operations | | |
Net investment income (loss) | $ 33,178,201 | $ 19,732,045 |
Net realized gain (loss) | 272,277,024 | 70,228,167 |
Change in net unrealized appreciation (depreciation) | 1,120,719,255 | 455,286,136 |
Net increase (decrease) in net assets resulting from operations | 1,426,174,480 | 545,246,348 |
Distributions to shareholders from net investment income | (22,989,617) | (7,430,512) |
Distributions to shareholders from net realized gain | (65,775,827) | (464,413) |
Total distributions | (88,765,444) | (7,894,925) |
Share transactions - net increase (decrease) | 467,056,549 | 875,768,447 |
Redemption fees | 1,551,369 | 1,291,008 |
Total increase (decrease) in net assets | 1,806,016,954 | 1,414,410,878 |
| | |
Net Assets | | |
Beginning of period | 3,136,927,253 | 1,722,516,375 |
End of period (including undistributed net investment income of $26,450,845 and undistributed net investment income of $17,032,665, respectively) | $ 4,942,944,207 | $ 3,136,927,253 |
Financial Highlights - Class A
Years ended October 31, | 2007 H |
Selected Per-Share Data | |
Net asset value, beginning of period | $ 54.00 |
Income from Investment Operations | |
Net investment income (loss) E | .19 |
Net realized and unrealized gain (loss) | 15.96 |
Total from investment operations | 16.15 |
Redemption fees added to paid in capital E | .01 |
Net asset value, end of period | $ 70.16 |
Total Return B, C, D | 29.93% |
Ratios to Average Net Assets F, I | |
Expenses before reductions | 1.23% A |
Expenses net of fee waivers, if any | 1.23% A |
Expenses net of all reductions | 1.22% A |
Net investment income (loss) | .63% A |
Supplemental Data | |
Net assets, end of period (000 omitted) | $ 20,912 |
Portfolio turnover rate G | 42% |
AAnnualized B Total returns for periods of less than one year are not annualized. C Total returns would have been lower had certain expenses not been reduced during the periods shown. D Total returns do not include the effect of the sales charges. E Calculated based on average shares outstanding during the period. F Fees and expenses of the underlying Fidelity Central Funds are not included in the Fund's expense ratio. The Fund indirectly bears its proportionate share of the expenses of any underlying Fidelity Central Funds. G Amount does not include the portfolio activity of any underlying Fidelity Central Funds. H For the period May 2, 2007 (commencement of sale of shares) to October 31, 2007. I Expense ratios reflect operating expenses of the class. Expenses before reductions do not reflect amounts reimbursed by the investment adviser or reductions from brokerage service arrangements or other expense offset arrangements and do not represent the amount paid by the class during periods when reimbursements or reductions occur. Expense ratios before reductions for start-up periods may not be representative of longer-term operating periods. Expenses net of fee waivers reflect expenses after reimbursement by the investment adviser but prior to reductions from brokerage service arrangements or other expense offset arrangements. Expenses net of all reductions represent the net expenses paid by the class. |
See accompanying notes which are an integral part of the financial statements.
Annual Report
Financial Highlights - Class T
Years ended October 31, | 2007 H |
Selected Per-Share Data | |
Net asset value, beginning of period | $ 54.00 |
Income from Investment Operations | |
Net investment income (loss) E | .09 |
Net realized and unrealized gain (loss) | 15.99 |
Total from investment operations | 16.08 |
Redemption fees added to paid in capital E | .01 |
Net asset value, end of period | $ 70.09 |
Total Return B, C, D | 29.80% |
Ratios to Average Net Assets F, I | |
Expenses before reductions | 1.48% A |
Expenses net of fee waivers, if any | 1.48% A |
Expenses net of all reductions | 1.47% A |
Net investment income (loss) | .30% A |
Supplemental Data | |
Net assets, end of period (000 omitted) | $ 14,522 |
Portfolio turnover rate G | 42% |
A Annualized B Total returns for periods of less than one year are not annualized. C Total returns would have been lower had certain expenses not been reduced during the periods shown. D Total returns do not include the effect of the sales charges. E Calculated based on average shares outstanding during the period. F Fees and expenses of the underlying Fidelity Central Funds are not included in the Fund's expense ratio. The Fund indirectly bears its proportionate share of the expenses of any underlying Fidelity Central Funds. G Amount does not include the portfolio activity of any underlying Fidelity Central Funds. H For the period May 2, 2007 (commencement of sale of shares) to October 31, 2007. I Expense ratios reflect operating expenses of the class. Expenses before reductions do not reflect amounts reimbursed by the investment adviser or reductions from brokerage service arrangements or other expense offset arrangements and do not represent the amount paid by the class during periods when reimbursements or reductions occur. Expense ratios before reductions for start-up periods may not be representative of longer-term operating periods. Expenses net of fee waivers reflect expenses after reimbursement by the investment adviser but prior to reductions from brokerage service arrangements or other expense offset arrangements. Expenses net of all reductions represent the net expenses paid by the class. |
Financial Highlights - Class B
Years ended October 31, | 2007 H |
Selected Per-Share Data | |
Net asset value, beginning of period | $ 54.00 |
Income from Investment Operations | |
Net investment income (loss) E | (.06) |
Net realized and unrealized gain (loss) | 15.93 |
Total from investment operations | 15.87 |
Redemption fees added to paid in capital E | .01 |
Net asset value, end of period | $ 69.88 |
Total Return B, C, D | 29.41% |
Ratios to Average Net Assets F, I | |
Expenses before reductions | 2.00% A |
Expenses net of fee waivers, if any | 2.00% A |
Expenses net of all reductions | 1.99% A |
Net investment income (loss) | (.21)% A |
Supplemental Data | |
Net assets, end of period (000 omitted) | $ 4,078 |
Portfolio turnover rate G | 42% |
A Annualized BTotal returns for periods of less than one year are not annualized. CTotal returns would have been lower had certain expenses not been reduced during the periods shown. DTotal returns do not include the effect of the contingent deferred sales charge. ECalculated based on average shares outstanding during the period. FFees and expenses of the underlying Fidelity Central Funds are not included in the Fund's expense ratio. The Fund indirectly bears its proportionate share of the expenses of any underlying Fidelity Central Funds. GAmount does not include the portfolio activity of any underlying Fidelity Central Funds. HFor the period May 2, 2007 (commencement of sale of shares) to October 31, 2007. IExpense ratios reflect operating expenses of the class. Expenses before reductions do not reflect amounts reimbursed by the investment adviser or reductions from brokerage service arrangements or other expense offset arrangements and do not represent the amount paid by the class during periods when reimbursements or reductions occur. Expense ratios before reductions for start-up periods may not be representative of longer-term operating periods. Expenses net of fee waivers reflect expenses after reimbursement by the investment adviser but prior to reductions from brokerage service arrangements or other expense offset arrangements. Expenses net of all reductions represent the net expenses paid by the class. |
See accompanying notes which are an integral part of the financial statements.
Annual Report
Financial Highlights - Class C
Years ended October 31, | 2007 H |
Selected Per-Share Data | |
Net asset value, beginning of period | $ 54.00 |
Income from Investment Operations | |
Net investment income (loss) E | (.04) |
Net realized and unrealized gain (loss) | 15.94 |
Total from investment operations | 15.90 |
Redemption fees added to paid in capital E | .01 |
Net asset value, end of period | $ 69.91 |
Total Return B, C, D | 29.46% |
Ratios to Average Net Assets F, I | |
Expenses before reductions | 1.99% A |
Expenses net of fee waivers, if any | 1.99% A |
Expenses net of all reductions | 1.97% A |
Net investment income (loss) | (.15)% A |
Supplemental Data | |
Net assets, end of period (000 omitted) | $ 8,752 |
Portfolio turnover rate G | 42% |
A Annualized B Total returns for periods of less than one year are not annualized. C Total returns would have been lower had certain expenses not been reduced during the periods shown. D Total returns do not include the effect of the contingent deferred sales charge. ECalculated based on average shares outstanding during the period. F Fees and expenses of the underlying Fidelity Central Funds are not included in the Fund's expense ratio. The Fund indirectly bears its proportionate share of the expenses of any underlying Fidelity Central Funds. G Amount does not include the portfolio activity of any underlying Fidelity Central Funds. HFor the period May 2, 2007 (commencement of sale of shares) to October 31, 2007. I Expense ratios reflect operating expenses of the class. Expenses before reductions do not reflect amounts reimbursed by the investment adviser or reductions from brokerage service arrangements or other expense offset arrangements and do not represent the amount paid by the class during periods when reimbursements or reductions occur. Expense ratios before reductions for start-up periods may not be representative of longer-term operating periods. Expenses net of fee waivers reflect expenses after reimbursement by the investment adviser but prior to reductions from brokerage service arrangements or other expense offset arrangements. Expenses net of all reductions represent the net expenses paid by the class. |
Financial Highlights - Canada
| | |
Years ended October 31, | 2007 | 2006 | 2005 | 2004 | 2003 |
Selected Per-Share Data | | | | | |
Net asset value, beginning of period | $ 49.48 | $ 39.14 | $ 31.87 | $ 25.13 | $ 17.52 |
Income from Investment Operations | | | | | |
Net investment income (loss) B | .52 | .34 | .20 | .10 | .05 |
Net realized and unrealized gain (loss) | 21.62 | 10.15 | 7.12 | 6.74 | 7.58 |
Total from investment operations | 22.14 | 10.49 | 7.32 | 6.84 | 7.63 |
Distributions from net investment income | (.36) | (.16) | (.08) | (.13) | (.04) |
Distributions from net realized gain | (1.03) | (.01) | - | - | - |
Total distributions | (1.39) | (.17) | (.08) | (.13) | (.04) |
Redemption fees added to paid in capital B | .02 | .02 | .03 | .03 | .02 |
Net asset value, end of period | $ 70.25 | $ 49.48 | $ 39.14 | $ 31.87 | $ 25.13 |
Total Return A | 46.03% | 26.93% | 23.11% | 27.45% | 43.75% |
Ratios to Average Net Assets C, E | | | | | |
Expenses before reductions | .96% | 1.00% | 1.08% | 1.20% | 1.42% |
Expenses net of fee waivers, if any | .96% | 1.00% | 1.08% | 1.20% | 1.42% |
Expenses net of all reductions | .94% | .97% | 1.04% | 1.15% | 1.37% |
Net investment income (loss) | .94% | .74% | .55% | .34% | .26% |
Supplemental Data | | | | | |
Net assets, end of period (000 omitted) | $ 4,890,617 | $ 3,136,927 | $ 1,722,516 | $ 413,319 | $ 167,205 |
Portfolio turnover rate D | 42% | 50% | 24% | 47% | 52% |
A Total returns would have been lower had certain expenses not been reduced during the periods shown. BCalculated based on average shares outstanding during the period. CFees and expenses of the underlying Fidelity Central Funds are not included in the Fund's expense ratio. The Fund indirectly bears its proportionate share of the expenses of any underlying Fidelity Central Funds. DAmount does not include the portfolio activity of any underlying Fidelity Central Funds. E Expense ratios reflect operating expenses of the class. Expenses before reductions do not reflect amounts reimbursed by the investment adviser or reductions from brokerage service arrangements or other expense offset arrangements and do not represent the amount paid by the class during periods when reimbursements or reductions occur. Expenses net of fee waivers reflect expenses after reimbursement by the investment adviser but prior to reductions from brokerage service arrangements or other expense offset arrangements. Expenses net of all reductions represent the net expenses paid by the class. |
See accompanying notes which are an integral part of the financial statements.
Annual Report
Financial Highlights - Institutional Class
Years ended October 31, | 2007 G |
Selected Per-Share Data | |
Net asset value, beginning of period | $ 54.00 |
Income from Investment Operations | |
Net investment income (loss) D | .25 |
Net realized and unrealized gain (loss) | 15.99 |
Total from investment operations | 16.24 |
Redemption fees added to paid in capital D | .01 |
Net asset value, end of period | $ 70.25 |
Total Return B, C | 30.09% |
Ratios to Average Net Assets E, H | |
Expenses before reductions | 1.01% A |
Expenses net of fee waivers, if any | 1.01% A |
Expenses net of all reductions | .99% A |
Net investment income (loss) | .83% A |
Supplemental Data | |
Net assets, end of period (000 omitted) | $ 4,064 |
Portfolio turnover rate F | 42% |
A Annualized BTotal returns for periods of less than one year are not annualized. CTotal returns would have been lower had certain expenses not been reduced during the periods shown. DCalculated based on average shares outstanding during the period. EFees and expenses of the underlying Fidelity Central Funds are not included in the Fund's expense ratio. The Fund indirectly bears its proportionate share of the expenses of any underlying Fidelity Central Funds. FAmount does not include the portfolio activity of any underlying Fidelity Central Funds. GFor the period May 2, 2007 (commencement of sale of shares) to October 31, 2007. H Expense ratios reflect operating expenses of the class. Expenses before reductions do not reflect amounts reimbursed by the investment adviser or reductions from brokerage service arrangements or other expense offset arrangements and do not represent the amount paid by the class during periods when reimbursements or reductions occur. Expense ratios before reductions for start-up periods may not be representative of longer-term operating periods. Expenses net of fee waivers reflect expenses after reimbursement by the investment adviser but prior to reductions from brokerage service arrangements or other expense offset arrangements. Expenses net of all reductions represent the net expenses paid by the class. |
See accompanying notes which are an integral part of the financial statements.
Annual Report
Canada
Notes to Financial Statements
For the period ended October 31, 2007
1. Organization.
Fidelity Canada Fund (the Fund) is a fund of Fidelity Investment Trust (the trust) and is authorized to issue an unlimited number of shares. The trust is registered under the Investment Company Act of 1940, as amended (the 1940 Act), as an open-end management investment company organized as a Massachusetts business trust. The Fund commenced sale of Class A, Class T, Class B, Class C, and Institutional Class shares and the existing class was designated Canada on May 2, 2007. Class B shares will automatically convert to Class A shares after a holding period of seven years from the initial date of purchase. Investment income, realized and unrealized capital gains and losses, the common expenses of the Fund, and certain fund-level expense reductions, if any, are allocated on a pro rata basis to each class based on the relative net assets of each class to the total net assets of the Fund. Each class differs with respect to transfer agent and distribution and service plan fees incurred. Certain expense reductions also differ by class.
2. Investments in Fidelity Central Funds.
The Fund may invest in Fidelity Central Funds, which are open-end investment companies available only to other investment companies and accounts managed by Fidelity Management & Research Company (FMR) and its affiliates. The Fund's Schedule of Investments lists each of the Fidelity Central Funds as an investment of the Fund, but does not include the underlying holdings of each Fidelity Central Fund. As an Investing Fund, the Fund indirectly bears its proportionate share of the expenses of the underlying Fidelity Central Funds.
The Money Market Central Funds seek preservation of capital and current income and are managed by Fidelity Investments Money Management, Inc. (FIMM), an affiliate of FMR.
A complete list of holdings for each Fidelity Central Fund is available upon request or at the SEC's web site at www.sec.gov. In addition, the financial statements of the Fidelity Central Funds, which are not covered by the Fund's Report of Independent Registered Public Accounting Firm, are available on the SEC's web site or upon request.
3. Significant Accounting Policies.
The financial statements have been prepared in conformity with accounting principles generally accepted in the United States of America, which require management to make certain estimates and assumptions at the date of the financial statements. The following summarizes the significant accounting policies of the Fund:
Security Valuation. Investments are valued and net asset value (NAV) per share is calculated (NAV calculation) as of the close of business of the New York Stock Exchange (NYSE), normally 4:00 p.m. Eastern time. Wherever possible, the Fund uses independent pricing services approved by the Board of Trustees to value its investments.
Equity securities, including restricted securities, for which market quotations are readily available, are valued at the last reported sale price or official closing price as reported by an independent pricing service on the primary market or exchange on which they are traded. In the event there were no sales during the day or closing prices are not available, securities are valued at the last quoted bid price. Debt securities, including restricted securities, for which quotations are readily available, are valued by independent pricing services or by dealers who make markets in such securities. Pricing services consider yield or price of bonds of comparable quality, coupon, maturity and type as well as dealer supplied prices. Investments in open-end mutual funds, including the Fidelity Central Funds, are valued at their closing net asset value each business day. Short-term securities with remaining maturities of sixty days or less for which quotations are not readily available are valued at amortized cost, which approximates value.
When current market prices or quotations are not readily available or do not accurately reflect fair value, valuations may be determined in accordance with procedures adopted by the Board of Trustees. For example, when developments occur between the close of a market and the close of the NYSE that may materially affect the value of some or all of the securities, or when trading in a security is halted, those securities may be fair valued. Factors used in the determination of fair value may include monitoring news to identify significant market or security specific events such as changes in the value of U.S. securities markets, reviewing developments in foreign markets and evaluating the performance of ADRs, futures contracts and exchange-traded funds. Because the Fund's utilization of fair value pricing depends on market activity, the frequency with which fair value pricing is used cannot be predicted and may be utilized to a significant extent. The value of securities used for NAV calculation under fair value pricing may differ from published prices for the same securities.
Foreign Currency. The Fund uses foreign currency contracts to facilitate transactions in foreign-denominated securities. Losses from these transactions may arise from changes in the value of the foreign currency or if the counterparties do not perform under the contracts' terms.
Foreign-denominated assets, including investment securities, and liabilities are translated into U.S. dollars at the exchange rate at period end. Purchases and sales of investment securities, income and dividends received and expenses denominated in foreign currencies are translated into U.S. dollars at the exchange rate in effect on the transaction date.
The effects of exchange rate fluctuations on investments are included with the net realized and unrealized gain (loss) on investment securities. Other foreign currency transactions resulting in realized and unrealized gain (loss) are disclosed separately.
Annual Report
3. Significant Accounting Policies - continued
Investment Transactions and Income. For financial reporting purposes, the Fund's investment holdings and NAV include trades executed through the end of the last business day of the period. The NAV for processing shareholder transactions includes trades executed through the end of the prior business day. Gains and losses on securities sold are determined on the basis of identified cost and may include proceeds received from litigation. Dividend income is recorded on the ex-dividend date, except for certain dividends from foreign securities where the ex-dividend date may have passed, which are recorded as soon as the Fund is informed of the ex-dividend date. Non-cash dividends included in dividend income, if any, are recorded at the fair market value of the securities received. Distributions received on securities that represent a return of capital or capital gain are recorded as a reduction of cost of investments and/or as a realized gain. The Fund estimates the components of distributions received that may be considered return of capital distributions or capital gain distributions. Interest income and distributions from the Fidelity Central Funds are accrued as earned. Interest income includes coupon interest and amortization of premium and accretion of discount on debt securities. Investment income is recorded net of foreign taxes withheld where recovery of such taxes is uncertain.
Expenses. Most expenses of the trust can be directly attributed to a fund. Expenses which cannot be directly attributed are apportioned among each Fund in the trust. Expense estimates are accrued in the period to which they relate and adjustments are made when actual amounts are known.
Income Tax Information and Distributions to Shareholders. Each year, the Fund intends to qualify as a regulated investment company by distributing all of its taxable income and realized gains under Subchapter M of the Internal Revenue Code. As a result, no provision for income taxes is required in the accompanying financial statements. Foreign taxes are provided for based on the Fund's understanding of the tax rules and rates that exist in the foreign markets in which it invests.
Distributions are recorded on the ex-dividend date. Income dividends and capital gain distributions are declared separately for each class. Income and capital gain distributions are determined in accordance with income tax regulations, which may differ from generally accepted accounting principles. In addition, the Fund will claim a portion of the payment made to redeeming shareholders as a distribution for income tax purposes.
Capital accounts within the financial statements are adjusted for permanent book-tax differences. Certain adjustments have been made to the accounts relating to prior periods. Collectively, these adjustments have no impact on net assets or the results of operations. Temporary book-tax differences will reverse in a subsequent period.
Book-tax differences are primarily due to foreign currency transactions, passive foreign investment companies (PFIC), market discount, deferred trustees compensation, and losses deferred due to wash sales.
The tax-basis components of distributable earnings and the federal tax cost as of period end were as follows:
Unrealized appreciation | $ 1,850,820,017 | |
Unrealized depreciation | (19,377,264) | |
Net unrealized appreciation (depreciation) | 1,831,442,753 | |
Undistributed ordinary income | 67,424,056 | |
Undistributed long-term capital gain | 190,207,109 | |
| | |
Cost for federal income tax purposes | $ 3,192,837,536 | |
The tax character of distributions paid was as follows:
| October 31, 2007 | October 31, 2006 |
Ordinary Income | $ 44,702,026 | $ 7,894,925 |
Long-term Capital Gains | 44,063,418 | - |
Total | $ 88,765,444 | $ 7,894,925 |
Short-Term Trading (Redemption) Fees. Shares held in the Fund less than 90 days are subject to a redemption fee equal to 1.50% of the proceeds of the redeemed shares. All redemption fees, including any estimated redemption fees paid by FMR, are retained by the Fund and accounted for as an addition to paid in capital.
New Accounting Pronouncements. In July 2006, Financial Accounting Standards Board Interpretation No. 48, Accounting for Uncertainty in Income Taxes - an interpretation of FASB Statement 109 (FIN 48), was issued and is effective on the last business day of the semiannual reporting period for fiscal years beginning after December 15, 2006. FIN 48 sets forth a threshold for financial statement recognition, measurement and disclosure of a tax position taken or expected to be taken on a tax return. Management has concluded that the adoption of FIN 48 will not result in a material impact on the Fund's net assets, results of operations and financial statement disclosures.
Annual Report
Canada
Notes to Financial Statements - continued
3. Significant Accounting Policies - continued
New Accounting Pronouncements - continued
In addition, in September 2006, Statement of Financial Accounting Standards No. 157, Fair Value Measurements (SFAS 157), was issued and is effective for fiscal years beginning after November 15, 2007. SFAS 157 defines fair value, establishes a framework for measuring fair value and expands disclosures about fair value measurements. Management is currently evaluating the impact the adoption of SFAS 157 will have on the Fund's financial statement disclosures.
4. Operating Policies.
Repurchase Agreements. FMR has received an Exemptive Order from the Securities and Exchange Commission (the SEC) which permits the Fund and other affiliated entities of FMR to transfer uninvested cash balances into joint trading accounts which are then invested in repurchase agreements. The Fund may also invest directly with institutions in repurchase agreements. Repurchase agreements are collateralized by government or non-government securities. Upon settlement date, collateral is held in segregated accounts with custodian banks and may be obtained in the event of a default of the counterparty. The Fund monitors, on a daily basis, the value of the collateral to ensure it is at least equal to the principal amount of the repurchase agreement (including accrued interest). In the event of a default by the counterparty, realization of the collateral proceeds could be delayed, during which time the value of the collateral may decline.
Restricted Securities. The Fund may invest in securities that are subject to legal or contractual restrictions on resale. These securities generally may be resold in transactions exempt from registration or to the public if the securities are registered. Disposal of these securities may involve time-consuming negotiations and expense, and prompt sale at an acceptable price may be difficult. Information regarding restricted securities is included at the end of the Fund's Schedule of Investments.
5. Purchases and Sales of Investments.
Purchases and sales of securities other than short-term securities, aggregated $1,761,898,540 and $1,447,644,407, respectively.
6. Fees and Other Transactions with Affiliates.
Management Fee. FMR and its affiliates provide the Fund with investment management related services for which the Fund pays a monthly management fee. The management fee is the sum of an individual fund fee rate that is based on an annual rate of .45% of the Fund's average net assets and a group fee rate that averaged .26% during the period. The group fee rate is based upon the average net assets of all the mutual funds advised by FMR. The group fee rate decreases as assets under management increase and increases as assets under management decrease. In addition, the management fee is subject to a performance adjustment (up to a maximum of ± .20% of the Fund's average net assets over a 36 month performance period). The upward or downward adjustment to the management fee is based on the relative investment performance of the retail class of the Fund, Canada as compared to an appropriate benchmark index. For the period, the total annual management fee rate, including the performance adjustment, was .69% of the Fund's average net assets.
Distribution and Service Plan. In accordance with Rule 12b-1 of the 1940 Act, the Fund has adopted separate Distribution and Service Plans for each class of shares. Certain classes pay Fidelity Distributors Corporation (FDC), an affiliate of FMR, separate Distribution and Service Fees, each of which is based on an annual percentage of each class' average net assets. In addition, FDC may pay financial intermediaries for selling shares of the Fund and providing shareholder support services. For the period, the Distribution and Service Fee rates and the total amounts paid to and retained by FDC were as follows:
| Distribution
Fee | Service
Fee | Paid to
FDC | Retained
by FDC |
Class A | -% | .25% | $ 5,970 | $ 482 |
Class T | .25% | .25% | 10,734 | - |
Class B | .75% | .25% | 9,698 | 7,368 |
Class C | .75% | .25% | 13,180 | 10,333 |
| | | $ 39,582 | $ 18,183 |
Sales Load. FDC receives a front-end sales charge of up to 5.75% for selling Class A shares, and 3.50% for selling Class T shares, some of which is paid to financial intermediaries for selling shares of the Fund. FDC receives the proceeds of contingent deferred sales charges levied on Class A, Class T, Class B, and Class C redemptions. These charges depend on the holding period. The deferred sales charges range from 5% to 1% for Class B, 1% for Class C, 1.00% to .50% for certain purchases of Class A shares and .25% for certain purchases of Class T shares.
Annual Report
6. Fees and Other Transactions with Affiliates - continued
Sales Load - continued
For the period, sales charge amounts retained by FDC were as follows:
| Retained
by FDC |
Class A | $ 50,862 |
Class T | 9,963 |
Class B* | 37,782 |
Class C* | 1,134 |
| $ 99,741 |
* When Class B and Class C shares are initially sold, FDC pays commissions from its own resources to financial intermediaries through which the sales are made.
Transfer Agent Fees. Fidelity Investments Institutional Operations Company, Inc. (FIIOC), an affiliate of FMR, is the transfer, dividend disbursing and shareholder servicing agent for each class of the Fund, except for Canada. Fidelity Service Company, Inc. (FSC), an affiliate of FMR, is the transfer agent for Canada shares. FIIOC and FSC receive account fees and asset-based fees that vary according to the account size and type of account of the shareholders of the respective classes of the Fund. FIIOC and FSC pay for typesetting, printing and mailing of shareholder reports, except proxy statements. For the period, the total transfer agent fees paid by each class to FIIOC or FSC, were as follows:
| Amount | % of
Average
Net Assets |
Class A | $ 5,269 | .22 |
Class T | 4,782 | .22 |
Class B | 2,280 | .23 |
Class C | 3,048 | .23 |
Canada | 7,395,989 | .21 |
Institutional Class | 1,409 | .24 |
| $ 7,412,777 | |
Accounting and Security Lending Fees. FSC maintains the Fund's accounting records. The accounting fee is based on the level of average net assets for the month. Under a separate contract, FSC administers the security lending program. The security lending fee is based on the number and duration of lending transactions.
Brokerage Commissions. The Fund placed a portion of its portfolio transactions with brokerage firms which are affiliates of the investment adviser. The commissions paid to these affiliated firms were $308 for the period.
Interfund Lending Program. Pursuant to an Exemptive Order issued by the SEC, the Fund, along with other registered investment companies having management contracts with FMR, may participate in an interfund lending program. This program provides an alternative credit facility allowing the funds to borrow from, or lend money to, other participating affiliated funds. At period end, there were no interfund loans outstanding. The Fund's activity in this program during the period for which loans were outstanding was as follows:
Borrower or Lender | Average Daily
Loan Balance | Weighted
Average Interest
Rate | Interest Expense |
Borrower | $ 11,734,333 | 5.28% | $ 36,171 |
7. Committed Line of Credit.
The Fund participates with other funds managed by FMR in a $4.2 billion credit facility (the "line of credit") to be utilized for temporary or emergency purposes to fund shareholder redemptions or for other short-term liquidity purposes. The Fund has agreed to pay commitment fees on its pro rata portion of the line of credit, which amounted to $7,075 and is reflected in Miscellaneous Expense on the Statement of Operations. During the period, there were no borrowings on this line of credit.
8. Security Lending.
The Fund lends portfolio securities from time to time in order to earn additional income. On the settlement date of the loan, the Fund receives collateral (in the form of U.S. Treasury obligations, letters of credit and/or cash) against the loaned securities and maintains collateral in an amount not less than 100% of the market value of the loaned securities during the period of the loan. The market value of the loaned securities is determined at the close of business of the Fund and any additional required collateral is delivered to the Fund on the next business day. If the borrower defaults on its obligation to return the securities loaned because of insolvency or other reasons, a fund could experience delays and costs in recovering the securities
Annual Report
Canada
Notes to Financial Statements - continued
8. Security Lending - continued
loaned or in gaining access to the collateral. Any cash collateral received is invested in the Fidelity Securities Lending Cash Central Fund. The value of loaned securities and cash collateral at period end are disclosed on the Fund's Statement of Assets and Liabilities. Security lending income represents the income earned on investing cash collateral, less fees and expenses associated with the loan, plus any premium payments that may be received on the loan of certain types of securities. Security lending income is presented in the Statement of Operations as a component of income from Fidelity Central Funds.
9. Expense Reductions.
FMR voluntarily agreed to reimburse a portion of Canada's operating expenses. During the period, this reimbursement reduced Canada's expenses by $60,108.
Many of the brokers with whom FMR places trades on behalf of the Fund provided services to the Fund in addition to trade execution. These services included payments of certain expenses on behalf of the Fund totaling $472,386 for the period. In addition, through arrangements with the Fund's custodian and each class' transfer agent, credits realized as a result of uninvested cash balances were used to reduce the Fund's expenses. During the period, these credits reduced the Fund's custody expenses by $13,107. During the period, credits reduced each class' transfer agent expense as noted in the table below.
| Transfer Agent
expense reduction | |
Canada | $ 100,637 | |
10. Other.
The Fund's organizational documents provide former and current trustees and officers with a limited indemnification against liabilities arising in connection with the performance of their duties to the Fund. In the normal course of business, the Fund may also enter into contracts that provide general indemnifications. The Fund's maximum exposure under these arrangements is unknown as this would be dependent on future claims that may be made against the Fund. The risk of material loss from such claims is considered remote.
The United States Securities and Exchange Commission ("SEC") is conducting an investigation of FMR (covering the years 2002 to 2004) arising from gifts, gratuities and business entertainment provided by certain brokers to certain individuals who were employed on FMR's domestic equity trading desk during that period. FMR is in discussions with the SEC staff regarding the possible resolution of the matter, but as of period-end no final resolution has been reached.
In December 2006, the Independent Trustees completed their own investigation of the matter with the assistance of independent counsel. The Independent Trustees and FMR agree that, despite the absence of proof that the Fidelity mutual funds experienced diminished execution quality as a result of the improper receipt of gifts and business entertainment, the conduct at issue was serious and is worthy of redress. Accordingly, the Independent Trustees have requested and FMR has agreed to pay $42 million to Fidelity mutual funds, plus interest to be determined at the time that payment is made. A method of allocating this payment among the funds has not yet been determined. The total payment to the Fund is not anticipated to have a material impact on the Fund's net assets. In addition, FMR reimbursed related legal expenses which are recorded in the accompanying Statement of Operations as an expense reduction.
11. Distributions to Shareholders.
Distributions to shareholders of each class were as follows:
Years ended October 31, | 2007 | 2006 |
From net investment income | | |
Canada | $ 22,989,617 | $ 7,430,512 |
From net realized gain | | |
Canada | $ 65,775,827 | $ 464,413 |
Annual Report
12. Share Transactions.
Transactions for each class of shares were as follows:
| Shares A | Dollars A |
Years ended October 31, | 2007 | 2006 | 2007 | 2006 |
Class A | | | | |
Shares sold | 308,956 | - | $ 19,422,841 | $ - |
Shares redeemed | (10,905) | - | (645,019) | - |
Net increase (decrease) | 298,051 | - | $ 18,777,822 | $ - |
Class T | | | | |
Shares sold | 208,648 | - | $ 12,838,431 | $ - |
Shares redeemed | (1,454) | - | (89,047) | - |
Net increase (decrease) | 207,194 | - | $ 12,749,384 | $ - |
Classs B | | | | |
Shares sold | 110,050 | - | $ 6,654,427 | $ - |
Shares redeemed | (51,696) | - | (3,069,986) | - |
Net increase (decrease) | 58,354 | - | $ 3,584,441 | $ - |
Class C | | | | |
Shares sold | 134,518 | - | $ 8,317,609 | $ - |
Shares redeemed | (9,336) | - | (570,425) | - |
Net increase (decrease) | 125,182 | - | $ 7,747,184 | $ - |
Canada | | | | |
Shares sold | 32,853,429 | 39,925,341 | $ 1,882,759,894 | $ 1,811,356,216 |
Reinvestment of distributions | 1,757,370 | 181,418 | 85,654,201 | 7,617,749 |
Shares redeemed | (28,386,777) | (20,723,860) | (1,547,811,990) | (943,205,518) |
Net increase (decrease) | 6,224,022 | 19,382,899 | $ 420,602,105 | $ 875,768,447 |
Institutional Class | | | | |
Shares sold | 61,781 | - | $ 3,830,515 | $ - |
Shares redeemed | (3,937) | - | (234,902) | - |
Net increase (decrease) | 57,844 | - | $ 3,595,613 | $ - |
A Share transactions for Class A, Class T, Class B, Class C, and Institutional Class are for the period May 2, 2007 (commencement of sale of shares) to October 31, 2007.
Annual Report
Report of Independent Registered Public Accounting Firm
To the Trustees of Fidelity Investment Trust and the Shareholders of Fidelity Canada Fund:
In our opinion, the accompanying statement of assets and liabilities, including the schedule of investments, and the related statements of operations and of changes in net assets and the financial highlights present fairly, in all material respects, the financial position of Fidelity Canada Fund (a fund of Fidelity Investment Trust) at October 31, 2007, and the results of its operations for the year then ended, the changes in its net assets for each of the two years in the period then ended and the financial highlights for each of the periods then indicated, in conformity with accounting principles generally accepted in the United States of America. These financial statements and financial highlights (hereafter referred to as "financial statements") are the responsibility of the Fidelity Canada Fund's management. Our responsibility is to express an opinion on these financial statements based on our audits. We conducted our audits of these financial statements in accordance with the standards of the Public Company Accounting Oversight Board (United States). Those standards require that we plan and perform the audit to obtain reasonable assurance about whether the financial statements are free of material misstatement. An audit includes examining, on a test basis, evidence supporting the amounts and disclosures in the financial statements, assessing the accounting principles used and significant estimates made by management, and evaluating the overall financial statement presentation. We believe that our audits, which included confirmation of securities at October 31, 2007 by correspondence with the custodian and brokers, provide a reasonable basis for our opinion.
/s/ PricewaterhouseCoopers LLP
PricewaterhouseCoopers LLP
Boston, Massachusetts
December 20, 2007
Annual Report
Trustees and Officers
The Trustees, Members of the Advisory Board, and executive officers of the trust and fund, as applicable, are listed below. The Board of Trustees governs the fund and is responsible for protecting the interests of shareholders. The Trustees are experienced executives who meet periodically throughout the year to oversee the fund's activities, review contractual arrangements with companies that provide services to the fund, and review the fund's performance. Except for James C. Curvey, each of the Trustees oversees 370 funds advised by FMR or an affiliate. Mr. Curvey oversees 340 funds advised by FMR or an affiliate.
The Trustees hold office without limit in time except that (a) any Trustee may resign; (b) any Trustee may be removed by written instrument, signed by at least two-thirds of the number of Trustees prior to such removal; (c) any Trustee who requests to be retired or who has become incapacitated by illness or injury may be retired by written instrument signed by a majority of the other Trustees; and (d) any Trustee may be removed at any special meeting of shareholders by a two-thirds vote of the outstanding voting securities of the trust. Each Trustee who is not an interested person (as defined in the 1940 Act) (Independent Trustee), shall retire not later than the last day of the calendar year in which his or her 72nd birthday occurs. The Independent Trustees may waive this mandatory retirement age policy with respect to individual Trustees. The executive officers and Advisory Board Members hold office without limit in time, except that any officer and Advisory Board Member may resign or may be removed by a vote of a majority of the Trustees at any regular meeting or any special meeting of the Trustees. Except as indicated, each individual has held the office shown or other offices in the same company for the past five years.
The fund's Statement of Additional Information (SAI) includes more information about the Trustees. To request a free copy, call Fidelity at 1-877-208-0098.
Interested Trustees*:
Correspondence intended for each Trustee who is an interested person may be sent to Fidelity Investments, 82 Devonshire Street, Boston, Massachusetts 02109.
Name, Age; Principal Occupation |
Edward C. Johnson 3d (77) |
| Year of Election or Appointment: 1984 Mr. Johnson is Chairman of the Board of Trustees. Mr. Johnson serves as President (2006-present), Chief Executive Officer, Chairman, and a Director of FMR LLC; Chairman and a Director of FMR; Chairman and a Director of Fidelity Research & Analysis Company (FRAC); Chairman and a Director of Fidelity Investments Money Management, Inc.; and Chairman (2001-present) and a Director of FMR Co., Inc. In addition, Mr. Johnson serves as Chairman and Director of Fidelity International Limited (FIL). |
James C. Curvey (72) |
| Year of Election or Appointment: 2007 Mr. Curvey also serves as Trustee (2007-present) or Member of the Advisory Board (2007-present) of other investment companies advised by FMR. Mr. Curvey is a Director of FMR and FMR Co., Inc. (2007-present). Mr. Curvey is also Vice Chairman (2006-present) and Director of FMR LLC. Mr. Curvey joined Fidelity in 1982 and served in numerous senior management positions, including President and Chief Operating Officer of FMR LLC (1997-2000) and President of Fidelity Strategic Investments (2000-2002). In addition, he serves as a member of the Board of Directors of Geerlings & Wade, Inc. (wine distribution). |
* Trustees have been determined to be "Interested Trustees" by virtue of, among other things, their affiliation with the trust or various entities under common control with FMR. FMR Corp. merged with FMR LLC on October 1, 2007. Any references to FMR LLC for prior periods are deemed to be references to the prior entity.
Independent Trustees:
Correspondence intended for each Independent Trustee (that is, the Trustees other than the Interested Trustees) may be sent to Fidelity Investments, P.O. Box 55235, Boston, Massachusetts 02205-5235.
Name, Age; Principal Occupation |
Dennis J. Dirks (59) |
| Year of Election or Appointment: 2005 Prior to his retirement in May 2003, Mr. Dirks was Chief Operating Officer and a member of the Board of The Depository Trust & Clearing Corporation (DTCC) (1999-2003). He also served as President, Chief Operating Officer, and Board member of The Depository Trust Company (DTC) (1999-2003) and President and Board member of the National Securities Clearing Corporation (NSCC) (1999-2003). In addition, Mr. Dirks served as Chief Executive Officer and Board member of the Government Securities Clearing Corporation (2001-2003) and Chief Executive Officer and Board member of the Mortgage-Backed Securities Clearing Corporation (2001-2003). Mr. Dirks also serves as a Trustee and a member of the Finance Committee of Manhattan College (2005-present) and a Trustee and a member of the Finance Committee of AHRC of Nassau County (2006-present). |
Albert R. Gamper, Jr. (65) |
| Year of Election or Appointment: 2006 Prior to his retirement in December 2004, Mr. Gamper served as Chairman of the Board of CIT Group Inc. (commercial finance). During his tenure with CIT Group Inc. Mr. Gamper served in numerous senior management positions, including Chairman (1987-1989; 1999-2001; 2002-2004), Chief Executive Officer (1987-2004), and President (1989-2002). He currently serves as a member of the Board of Directors of Public Service Enterprise Group (utilities, 2001-present), Chairman of the Board of Governors, Rutgers University (2004-present), and Chairman of the Board of Saint Barnabas Health Care System. |
George H. Heilmeier (71) |
| Year of Election or Appointment: 2004 Dr. Heilmeier is Chairman Emeritus of Telcordia Technologies (communication software and systems), where prior to his retirement, he served as company Chairman and Chief Executive Officer. He currently serves on the Boards of Directors of The Mitre Corporation (systems engineering and information technology support for the government), and HRL Laboratories (private research and development, 2004-present). He is Chairman of the General Motors Science & Technology Advisory Board and a Life Fellow of the Institute of Electrical and Electronics Engineers (IEEE). Dr. Heilmeier is a member of the Defense Science Board and the National Security Agency Advisory Board. He is also a member of the National Academy of Engineering, the American Academy of Arts and Sciences, and the Board of Overseers of the School of Engineering and Applied Science of the University of Pennsylvania. Previously, Dr. Heilmeier served as a Director of TRW Inc. (automotive, space, defense, and information technology, 1992-2002), Compaq (1994-2002), Automatic Data Processing, Inc. (ADP) (technology-based business outsourcing, 1995-2002), INET Technologies Inc. (telecommunications network surveillance, 2001-2004), and Teletech Holdings (customer management services). He is the recipient of the 2005 Kyoto Prize in Advanced Technology for his invention of the liquid crystal display, and a member of the Consumer Electronics Hall of Fame. |
James H. Keyes (67) |
| Year of Election or Appointment: 2007 Prior to his retirement in 2003, Mr. Keyes was Chairman, President, and Chief Executive Officer of Johnson Controls, Inc. (automotive supplier, 1993-2003). He currently serves as a member of the boards of LSI Logic Corporation (semiconductor technologies), Navistar International Corporation (manufacture and sale of trucks, buses, and diesel engines, 2002-present), and Pitney Bowes, Inc. (integrated mail, messaging, and document management solutions). |
Marie L. Knowles (61) |
| Year of Election or Appointment: 2001 Prior to Ms. Knowles' retirement in June 2000, she served as Executive Vice President and Chief Financial Officer of Atlantic Richfield Company (ARCO) (diversified energy, 1996-2000). From 1993 to 1996, she was a Senior Vice President of ARCO and President of ARCO Transportation Company. She served as a Director of ARCO from 1996 to 1998. She currently serves as a Director of Phelps Dodge Corporation (copper mining and manufacturing) and McKesson Corporation (healthcare service, 2002-present). Ms. Knowles is a Trustee of the Brookings Institution and the Catalina Island Conservancy and also serves as a member of the Advisory Board for the School of Engineering of the University of Southern California. |
Ned C. Lautenbach (63) |
| Year of Election or Appointment: 2000 Mr. Lautenbach is Chairman of the Independent Trustees (2006-present). Mr. Lautenbach has been a partner of Clayton, Dubilier & Rice, Inc. (private equity investment firm) since September 1998. Previously, Mr. Lautenbach was with the International Business Machines Corporation (IBM) from 1968 until his retirement in 1998. Mr. Lautenbach serves as a Director of Sony Corporation (2006-present) and Eaton Corporation (diversified industrial) as well as the Philharmonic Center for the Arts in Naples, Florida. He also is a member of the Board of Trustees of Fairfield University (2005-present), as well as a member of the Council on Foreign Relations. |
Cornelia M. Small (63) |
| Year of Election or Appointment: 2005 Ms. Small is a member (2000-present) and Chairperson (2002-present) of the Investment Committee, and a member (2002-present) of the Board of Trustees of Smith College. Previously, she served as Chief Investment Officer (1999-2000), Director of Global Equity Investments (1996-1999), and a member of the Board of Directors of Scudder, Stevens & Clark (1990-1997) and Scudder Kemper Investments (1997-1999). In addition, Ms. Small served as Co-Chair (2000-2003) of the Annual Fund for the Fletcher School of Law and Diplomacy. |
William S. Stavropoulos (68) |
| Year of Election or Appointment: 2001 Mr. Stavropoulos is Chairman Emeritus of the Board of Directors of The Dow Chemical Company. Since joining The Dow Chemical Company in 1967, Mr. Stavropoulos served in numerous senior management positions, including President (1993-2000; 2002-2003), CEO (1995-2000; 2002-2004), and Chairman of the Executive Committee (2000-2004). Currently, he is a Director of NCR Corporation (data warehousing and technology solutions), Chemical Financial Corporation, Maersk Inc. (industrial conglomerate, 2002-present), Tyco International, Inc. (multinational manufacturing and services, 2007-present), and a member of the Advisory Board for Metalmark Capital (private equity investment firm, 2005-present). He is a special advisor to Clayton, Dubilier & Rice, Inc., a private equity investment firm. He also serves as a member of the Board of Trustees of the American Enterprise Institute for Public Policy Research. In addition, Mr. Stavropoulos is a member of The Business Council, J.P. Morgan International Council and the University of Notre Dame Advisory Council for the College of Science. |
Kenneth L. Wolfe (68) |
| Year of Election or Appointment: 2005 Prior to his retirement in 2001, Mr. Wolfe was Chairman and Chief Executive Officer of Hershey Foods Corporation (1993-2001). He currently serves as a member of the boards of Adelphia Communications Corporation (2003-present), Bausch & Lomb, Inc., and Revlon Inc. (2004-present). |
Advisory Board Members and Executive Officers**:
Correspondence intended for Mr. Mauriello, Mr. Thomas, and Mr. Wiley may be sent to Fidelity Investments, P.O. Box 55235, Boston, Massachusetts 02205-5235. Correspondence intended for each executive officer and Mr. Lynch may be sent to Fidelity Investments, 82 Devonshire Street, Boston, Massachusetts 02109.
Name, Age; Principal Occupation |
Peter S. Lynch (63) |
| Year of Election or Appointment: 2003 Member of the Advisory Board of Fidelity Investment Trust. Mr. Lynch is Vice Chairman and a Director of FMR, and Vice Chairman (2001-present) and a Director of FMR Co., Inc. Previously, Mr. Lynch served as a Trustee of the Fidelity funds (1990-2003). In addition, he serves as a Trustee of Boston College and as the Chairman of the Inner-City Scholarship Fund. |
Joseph Mauriello (63) |
| Year of Election or Appointment: 2007 Member of the Advisory Board of Fidelity Investment Trust. Prior to his retirement in January 2006, Mr. Mauriello served in numerous senior management positions including Deputy Chairman and Chief Operating Officer (2004-2005), and Vice Chairman of Financial Services (2002-2004) of KPMG LLP US (professional services firm, 1965-2005). Mr. Mauriello currently serves as a member of the Board of Directors of XL Capital Ltd., (global insurance and re-insurance company, 2006-present) and of Arcadia Resources Inc., (health care services and products, 2007-present). He also served as a Director of the Hamilton Funds of the Bank of New York (2006-2007). |
David M. Thomas (58) |
| Year of Election or Appointment: 2007 Member of the Advisory Board of Fidelity Investment Trust. Previously, Mr. Thomas served as Executive Chairman (2005-2006) and Chairman and Chief Executive Officer (2000-2005) of IMS Health, Inc. (pharmaceutical and healthcare information solutions). In addition, Mr. Thomas serves as a member of the Board of Directors of Fortune Brands, Inc. (consumer products holding company), and Interpublic Group of Companies, Inc. (marketing communication, 2004-present). |
Michael E. Wiley (57) |
| Year of Election or Appointment: 2007 Member of the Advisory Board of Fidelity Investment Trust. Mr. Wiley also serves as Sr. Energy Advisor of Katzenbach Partners, LLC (consulting firm, 2006-present) and a member of the Board of Trustees of the University of Tulsa (2000-2006; 2007-present). He serves as a Director of Tesoro Corporation (independent oil refiner and marketer, 2005-present), and a Director of Bill Barrett Corporation (exploration and production company, 2005-present). In addition, he also serves as a Director of Post Oak Bank (privately-held bank, 2004-present), and an Advisory Director of Riverstone Holdings (private investment firm). Previously, Mr. Wiley served as Chairman, President, and CEO of Baker Hughes, Inc. (oilfield services company, 2000-2004), and as Director of Spinnaker Exploration Company (exploration and production company, 2001-2005). |
Kimberley H. Monasterio (43) |
| Year of Election or Appointment: 2007 President and Treasurer of the fund. Ms. Monasterio also serves as President and Treasurer of other Fidelity funds (2007-present) and is an employee of FMR (2004-present). Previously, Ms. Monasterio served as Deputy Treasurer of the Fidelity funds (2004-2006). Before joining Fidelity Investments, Ms. Monasterio served as Treasurer (2000-2004) and Chief Financial Officer (2002-2004) of the Franklin Templeton Funds and Senior Vice President of Franklin Templeton Services, LLC (2000-2004). |
Walter C. Donovan (45) |
| Year of Election or Appointment: 2007 Vice President of the fund. Mr. Donovan also serves as Vice President of Fidelity's Equity Funds (2007-present). Mr. Donovan also serves as Executive Vice President of FMR (2005-present) and FMR Co., Inc. (2005-present). Previously, Mr. Donovan served as Vice President of Fidelity's High Income Funds (2005-2007), Fixed-Income Funds (2005-2006), certain Asset Allocation Funds (2005-2006), certain Balanced Funds (2005-2006), and as Vice President and Director of Fidelity's International Equity Trading group (1998-2005). |
Eric M. Wetlaufer (45) |
| Year of Election or Appointment: 2006 Vice President of the fund. Mr. Wetlaufer also serves as Vice President of certain International Equity Funds (2006-present). Mr. Wetlaufer is Senior Vice President of FMR (2006-present) and FMR Co., Inc. (2006-present), and President and Director of Fidelity Management & Research (U.K.) Inc. (2006-present) and Fidelity Research & Analysis Company (2006-present). Before joining Fidelity Investments in 2005, Mr. Wetlaufer was a partner in Oxhead Capital Management (2004-2005). Previously, Mr. Wetlaufer served as a Chief Investment Officer of Putnam Investments (1997-2003). |
Eric D. Roiter (58) |
| Year of Election or Appointment: 1998 Secretary of the fund. He also serves as Secretary of other Fidelity funds; Vice President, General Counsel, and Secretary of FMR Co., Inc. (2001-present) and FMR; Assistant Secretary of Fidelity Management & Research (U.K.) Inc. (2001-present), Fidelity Research & Analysis Company (2001-present), and Fidelity Investments Money Management, Inc. (2001-present). Mr. Roiter is an Adjunct Member, Faculty of Law, at Boston College Law School (2003-present). Previously, Mr. Roiter served as Vice President and Secretary of Fidelity Distributors Corporation (FDC) (1998-2005). |
Scott C. Goebel (39) |
| Year of Election or Appointment: 2007 Assistant Secretary of the fund. Mr. Goebel also serves as Assistant Secretary of other Fidelity funds (2007-present), and is an employee of FMR. |
R. Stephen Ganis (41) |
| Year of Election or Appointment: 2006 Anti-Money Laundering (AML) officer of the fund. Mr. Ganis also serves as AML officer of other Fidelity funds (2006-present) and FMR LLC (2003-present). Before joining Fidelity Investments, Mr. Ganis practiced law at Goodwin Procter, LLP (2000-2002). |
Joseph B. Hollis (59) |
| Year of Election or Appointment: 2006 Chief Financial Officer of the fund. Mr. Hollis also serves as Chief Financial Officer of other Fidelity funds. Mr. Hollis is President of Fidelity Pricing and Cash Management Services (FPCMS) (2005-present). Mr. Hollis also serves as President and Director of Fidelity Service Company, Inc. (2006-present). Previously, Mr. Hollis served as Senior Vice President of Cash Management Services (1999-2002) and Investment Management Operations (2002-2005). |
Kenneth A. Rathgeber (60) |
| Year of Election or Appointment: 2004 Chief Compliance Officer of the fund. Mr. Rathgeber also serves as Chief Compliance Officer of other Fidelity funds (2004-present) and Executive Vice President of Risk Oversight for Fidelity Investments (2002-present). He is Chief Compliance Officer of FMR (2005-present), FMR Co., Inc. (2005-present), Fidelity Management & Research (U.K.) Inc. (2005-present), Fidelity Research & Analysis Company (2005-present), Fidelity Investments Money Management, Inc. (2005-present), and Strategic Advisers, Inc. (2005-present). Previously, Mr. Rathgeber served as Executive Vice President and Chief Operating Officer for Fidelity Investments Institutional Services Company, Inc. (1998-2002). |
Bryan A. Mehrmann (46) |
| Year of Election or Appointment: 2005 Deputy Treasurer of the fund. Mr. Mehrmann also serves as Deputy Treasurer of other Fidelity funds (2005-present) and is an employee of FMR. Previously, Mr. Mehrmann served as Vice President of Fidelity Investments Institutional Services Group (FIIS)/Fidelity Investments Institutional Operations Corporation, Inc. (FIIOC) Client Services (1998-2004). |
Kenneth B. Robins (38) |
| Year of Election or Appointment: 2005 Deputy Treasurer of the fund. Mr. Robins also serves as Deputy Treasurer of other Fidelity funds (2005-present) and is an employee of FMR (2004-present). Before joining Fidelity Investments, Mr. Robins worked at KPMG LLP, where he was a partner in KPMG's department of professional practice (2002-2004) and a Senior Manager (1999-2000). In addition, Mr. Robins served as Assistant Chief Accountant, United States Securities and Exchange Commission (2000-2002). |
Robert G. Byrnes (40) |
| Year of Election or Appointment: 2005 Assistant Treasurer of the fund. Mr. Byrnes also serves as Assistant Treasurer of other Fidelity funds (2005-present) and is an employee of FMR (2005-present). Previously, Mr. Byrnes served as Vice President of FPCMS (2003-2005). Before joining Fidelity Investments, Mr. Byrnes worked at Deutsche Asset Management where he served as Vice President of the Investment Operations Group (2000-2003). |
Peter L. Lydecker (53) |
| Year of Election or Appointment: 2004 Assistant Treasurer of the fund. Mr. Lydecker also serves as Assistant Treasurer of other Fidelity funds (2004) and is an employee of FMR. |
Paul M. Murphy (60) |
| Year of Election or Appointment: 2007 Assistant Treasurer of the fund. Mr. Murphy also serves as Assistant Treasurer of other Fidelity funds (2007-present) and is an employee of FMR (2007-present). Previously, Mr. Murphy served as Chief Financial Officer of the Fidelity Funds (2005-2006), Vice President and Associate General Counsel of FMR (2007), and Senior Vice President of Fidelity Pricing and Cash Management Services Group (FPCMS) (1994-2007). |
Gary W. Ryan (49) |
| Year of Election or Appointment: 2005 Assistant Treasurer of the fund. Mr. Ryan also serves as Assistant Treasurer of other Fidelity funds (2005-present) and is an employee of FMR (2005-present). Previously, Mr. Ryan served as Vice President of Fund Reporting in FPCMS (1999-2005). |
** FMR Corp. merged with FMR LLC on October 1, 2007. Any references to FMR LLC for prior periods are deemed to be references to the prior entity.
Annual Report
Distributions
The Board of Trustees of Advisor Canada Fund voted to pay to shareholders of record at the opening of business on record date, the following distributions per share derived from capital gains realized from sales of portfolio securities, and dividends derived from net investment
income:
| Pay Date | Record Date | Dividends | Capital Gains |
Class A | 12/10/07 | 12/07/07 | $0.412 | $3.27 |
Class T | 12/10/07 | 12/07/07 | $0.328 | $3.27 |
Class B | 12/10/07 | 12/07/07 | $0.138 | $3.27 |
Class C | 12/10/07 | 12/07/07 | $0.27 | $3.27 |
The fund hereby designates as a capital gain dividend with respect to the taxable year ended October 31, 2007, $190,207,109, or, if subsequently determined to be different, the net capital gain of such year.
The fund will notify shareholders in January 2008 of amounts for use in preparing 2007 income tax returns.
Annual Report
Board Approval of Investment Advisory Contracts and Management Fees
Fidelity Canada
Each year, typically in July, the Board of Trustees, including the Independent Trustees (together, the Board), votes on the renewal of the management contract and sub-advisory agreements (together, the Advisory Contracts) for the fund. The Board, assisted by the advice of fund counsel and Independent Trustees' counsel, requests and considers a broad range of information throughout the year.
The Board meets regularly each month except August and takes into account throughout the year matters bearing on Advisory Contracts. The Board, acting directly and through its separate committees, considers at each of its meetings factors that are relevant to the annual renewal of the fund's Advisory Contracts, including the services and support provided to the fund and its shareholders. At the time of the renewal, the Board had 12 standing committees, each composed of Independent Trustees with varying backgrounds, to which the Board has assigned specific subject matter responsibilities in order to enhance effective decision-making by the Board. Each committee has adopted a written charter outlining the structure and purposes of the committee. One such committee, the Equity Contract Committee, meets periodically as needed throughout the year to consider matters specifically related to the annual renewal of Advisory Contracts. The committee requests and receives information on, and makes recommendations to the Independent Trustees concerning, the approval and annual review of the Advisory Contracts.
At its July 2007 meeting, the Board of Trustees, including the Independent Trustees, unanimously determined to renew the Advisory Contracts for the fund. In reaching its determination, the Board considered all factors it believed relevant, including (i) the nature, extent, and quality of the services to be provided to the fund and its shareholders (including the investment performance of the fund); (ii) the competitiveness of the management fee and total expenses of the fund; (iii) the total costs of the services to be provided by and the profits to be realized by the investment adviser and its affiliates from the relationship with the fund; (iv) the extent to which economies of scale would be realized as the fund grows; and (v) whether fee levels reflect these economies of scale, if any, for the benefit of fund shareholders. The Board also approved amendments to the fund's agreements with foreign sub-advisers to clarify that each sub-adviser provides services as an independent contractor.
In determining whether to renew the Advisory Contracts for the fund, the Board ultimately reached a determination, with the assistance of fund counsel and Independent Trustees' counsel, that the renewal of the Advisory Contracts and the compensation to be received by Fidelity under the management contract is consistent with Fidelity's fiduciary duty under applicable law. In addition to evaluating the specific factors noted above, the Board, in reaching its determination, is aware that shareholders in the fund have a broad range of investment choices available to them, including a wide choice among mutual funds offered by competitors to Fidelity, and that the fund's shareholders, with the opportunity to review and weigh the disclosure provided by the fund in its prospectus and other public disclosures, have chosen to invest in this fund, managed by Fidelity.
Nature, Extent, and Quality of Services Provided. The Board considered staffing within the investment adviser, FMR, and the sub-advisers (together, the Investment Advisers), including the background of the fund's portfolio manager and the fund's investment objective and discipline. The Independent Trustees also had discussions with senior management of Fidelity's investment operations and investment groups. The Board considered the structure of the portfolio manager compensation program and whether this structure provides appropriate incentives.
Resources Dedicated to Investment Management and Support Services. The Board reviewed the size, education, and experience of the Investment Advisers' investment staff, their use of technology, and the Investment Advisers' approach to recruiting, training, and retaining portfolio managers and other research, advisory, and management personnel. The Board considered Fidelity's extensive global research capabilities that enable the Investment Advisers to aggregate data from various sources in an effort to produce positive investment results. The Board noted that Fidelity's analysts have access to a variety of technological tools that enable them to perform both fundamental and quantitative analysis and to specialize in various disciplines. The Board also considered that Fidelity's portfolio managers and analysts have access to daily portfolio attribution that allows for monitoring of a fund's portfolio, as well as an electronic communication system that provides immediate real-time access to research concerning issuers and credit enhancers.
Shareholder and Administrative Services. The Board considered (i) the nature, extent, quality, and cost of advisory, administrative, distribution, and shareholder services performed by the Investment Advisers and their affiliates under the Advisory Contracts and under separate agreements covering transfer agency, pricing and bookkeeping, and securities lending services for the fund; (ii) the nature and extent of the Investment Advisers' supervision of third party service providers, principally custodians and subcustodians; and (iii) the resources devoted to, and the record of compliance with, the fund's compliance policies and procedures. The Board reviewed the allocation of fund brokerage, including allocations to brokers affiliated with the Investment Advisers, the use of brokerage commissions to pay fund expenses, and the use of "soft" commission dollars to pay for research services. The Board also considered that Fidelity voluntarily pays for market data out of its own resources. The Board also considered the agreement reached between the Independent Trustees and Fidelity in December 2006 following an independent review of matters relating to receipt of travel, entertainment, gifts and gratuities in violation of Fidelity policies.
The Board noted that the growth of fund assets across the complex allows Fidelity to reinvest in the development of services designed to enhance the value or convenience of the Fidelity funds as investment vehicles. These services include 24-hour access to account information and market information through phone representatives and over the Internet, and investor education materials and asset allocation tools.
Annual Report
Board Approval of Investment Advisory Contracts and Management Fees - continued
Investment in a Large Fund Family. The Board considered the benefits to shareholders of investing in a Fidelity fund, including the benefits of investing in a fund that is part of a large family of funds offering a variety of investment disciplines and providing for a large variety of mutual fund investor services. For example, fund shareholders are offered the privilege of exchanging shares of the fund for shares of other Fidelity funds, as set forth in the fund's prospectus, without paying a sales charge. The Board noted that, since the last Advisory Contract renewals in July 2006, Fidelity has taken a number of actions that benefited particular funds, including (i) dedicating additional resources to investment research and to restructure the investment research teams; (ii) contractually agreeing to reduce the management fee on Fidelity Advisor Floating Rate High Income Fund; (iii) contractually agreeing to reduce the management fees on Fidelity's California, Massachusetts, New Jersey, and New York AMT Tax-Free Money Market Funds, launching new Institutional Classes and Service Classes of these funds, and contractually agreeing to impose expense limitations on these funds; (iv) eliminating the exchange fee on the Fidelity Select Portfolios and reducing the pricing and bookkeeping fee rates for these funds; (v) reducing the maximum transfer agency fee rates on high income funds and certain equity funds; (vi) proposing amended management contracts that, if approved by shareholders, will add a performance adjustment component to the management fees paid by 18 Fidelity Advisor equity funds; (vii) contractually agreeing to reduce fees for Ultra-Short Central Fund and the money market Central Funds; (viii) waiving the Fidelity Advisor funds' contingent deferred sales charge on certain redemptions made through systematic withdrawal programs; and (ix) amending the management contracts for equity and fixed-income funds whose management contracts incorporate a "group fee" structure by adding four new fee "breakpoints" to the group fee rate schedules.
Investment Performance and Compliance. The Board considered whether the fund has operated within its investment objective, as well as its record of compliance with its investment restrictions. It also reviewed the fund's absolute investment performance, as well as the fund's relative investment performance measured against a broad-based securities market index over multiple periods. The Board noted that FMR does not believe that a meaningful peer group exists against which to compare the fund's performance. The following charts considered by the Board show, over the one-, three-, and five-year periods ended December 31, 2006, the fund's cumulative total returns and the cumulative total returns of a broad-based securities market index ("benchmark"). (Canada Fund did not offer Advisor classes as of December 31, 2006.)
Fidelity Canada Fund

The Board stated that the relative investment performance of the fund was lower than its benchmark for the one- and three-year periods, although the fund's five-year cumulative total return compared favorably to its benchmark. The Board discussed with FMR actions to be taken by FMR to improve the fund's below-benchmark performance.
The Board also considered that the fund's management fee is subject to upward or downward adjustment depending upon whether, and to what extent, the fund's investment performance for the performance period exceeds, or is exceeded by, the record (over the same period) of a Board-approved performance adjustment index. The Board realizes that the performance adjustment provides FMR with a strong economic incentive to seek to achieve superior performance for the fund's shareholders and helps to more closely align the interests of FMR and the fund's shareholders.
The Board considered that FMR has taken steps to refocus and strengthen equity research, equity portfolio management, and compliance.
Based on its review, and giving particular weight to the nature and quality of the resources dedicated by the Investment Advisers to maintain and improve relative performance, the Board concluded that the nature, extent, and quality of the services provided to the fund will benefit the fund's shareholders, particularly in light of the Board's view that the fund's shareholders benefit from investing in a fund that is part of a large family of funds offering a variety of investment disciplines and services.
Annual Report
Competitiveness of Management Fee and Total Fund Expenses. The Board considered the fund's management fee and total expenses compared to "mapped groups" of competitive funds and classes. Fidelity creates "mapped groups" by combining similar Lipper investment objective categories that have comparable management fee characteristics. Combining Lipper investment objective categories aids the Board's management fee and total expense comparisons by broadening the competitive group used for comparison and by reducing the number of universes to which various Fidelity funds are compared. The Board also considered supplemental information about how the fund's management fee and total expenses ranked relative to groups based on Lipper classifications, which take into account a fund's market capitalization and style.
The Board considered two proprietary management fee comparisons for the 12-month periods shown in the chart below. The group of Lipper funds used by the Board for management fee comparisons is referred to below as the "Total Mapped Group." The Total Mapped Group comparison focuses on a fund's standing relative to the total universe of comparable funds available to investors, in terms of gross management fees before expense reimbursements or caps, and without giving effect to the fund's performance adjustment. "TMG %" represents the percentage of funds in the Total Mapped Group that had management fees that were lower than the fund's. For example, a TMG % of 13% means that 87% of the funds in the Total Mapped Group had higher management fees than the fund. The "Asset-Size Peer Group" (ASPG) comparison focuses on a fund's standing relative to non-Fidelity funds similar in size to the fund within the Total Mapped Group. The ASPG represents at least 15% of the funds in the Total Mapped Group with comparable asset size and management fee characteristics, subject to a minimum of 50 funds (or all funds in the Total Mapped Group if fewer than 50). Additional information, such as the ASPG quartile in which the fund's management fee ranked and the impact of the fund's performance adjustment, is also included in the chart and considered by the Board.
Fidelity Canada Fund
The Board noted that the fund's management fee ranked below the median of its Total Mapped Group and below the median of its ASPG for 2006. The Board also noted the effect of the fund's negative performance adjustment on the fund's management fee ranking. The Board noted that the performance adjustment for each year represents calculations for performance periods that differ from the periods shown in the performance charts above.
In connection with the renewal of the fund's management contract, the Board also approved non-material amendments to the fund's management contract to clarify certain provisions regarding the calculation of the fund's performance adjustment.
Based on its review, the Board concluded that the fund's management fee was fair and reasonable in light of the services that the fund receives and the other factors considered.
In its review of the fund's total expenses, the Board considered the fund's management fee as well as other fund expenses, such as transfer agent fees, pricing and bookkeeping fees, and custodial, legal, and audit fees. The Board also noted the effects of any waivers and reimbursements on fees and expenses, as well as the fund's negative performance adjustment. As part of its review, the Board also considered current and historical total expenses of the fund compared to competitive fund median expenses. The fund is compared to those funds and classes in the Total Mapped Group (used by the Board for management fee comparisons) that have a similar sales load structure.
The Board noted that the fund's total expenses ranked below its competitive median for 2006.
Annual Report
Board Approval of Investment Advisory Contracts and Management Fees - continued
In its review of total expenses, the Board also considered Fidelity fee structures and other information on clients that FMR and its affiliates service in other competitive markets, such as other mutual funds advised or subadvised by FMR or its affiliates, pension plan clients, and other institutional clients.
Based on its review, the Board concluded that the fund's total expenses were reasonable in light of the services that the fund and its shareholders receive and the other factors considered.
Costs of the Services and Profitability. The Board considered the revenues earned and the expenses incurred by Fidelity in conducting the business of developing, marketing, distributing, managing, administering and servicing the fund and its shareholders. The Board also considered the level of Fidelity's profits in respect of all the Fidelity funds.
On an annual basis, FMR presents to the Board Fidelity's profitability for the fund. Fidelity calculates the profitability for each fund, as well as aggregate profitability for groups of Fidelity funds and all Fidelity funds, using a series of detailed revenue and cost allocation methodologies which originate with the audited books and records of Fidelity. The Audit Committee of the Board reviews any significant changes from the prior year's methodologies.
PricewaterhouseCoopers LLP (PwC), independent registered public accounting firm and auditor to Fidelity and certain Fidelity funds, has been engaged annually by the Board as part of the Board's assessment of the results of Fidelity's profitability analysis. PwC's engagement includes the review and assessment of Fidelity's methodologies used in determining the revenues and expenses attributable to Fidelity's mutual fund business, and completion of agreed-upon procedures surrounding the mathematical accuracy of fund profitability and its conformity to allocation methodologies. After considering PwC's reports issued under the engagement and information provided by Fidelity, the Board believes that while other allocation methods may also be reasonable, Fidelity's profitability methodologies are reasonable in all material respects.
The Board has also reviewed Fidelity's non-fund businesses and any fall-out benefits related to the mutual fund business as well as cases where Fidelity's affiliates may benefit from or be related to the fund's business.
The Board considered the costs of the services provided by and the profits realized by Fidelity in connection with the operation of the fund and determined that the amount of profit is a fair entrepreneurial profit for the management of the fund.
Economies of Scale. The Board considered whether there have been economies of scale in respect of the management of the Fidelity funds, whether the Fidelity funds (including the fund) have appropriately benefited from any such economies of scale, and whether there is potential for realization of any further economies of scale. The Board considered the extent to which the fund will benefit from economies of scale through increased services to the fund, through waivers or reimbursements, or through fee or expense reductions, including reductions that occur through operation of the transfer agent agreement. The transfer agent fee varies in part based on the number of accounts in the fund. If the number of accounts decreases or the average account size increases, the overall transfer agent fee rate decreases.
The Board recognized that the fund's management contract incorporates a "group fee" structure, which provides for lower group fee rates as total fund assets under FMR's management increase, and for higher group fee rates as total fund assets under FMR's management decrease. FMR determines the group fee rates based on a tiered asset "breakpoint" schedule. In connection with the renewal of the fund's management contract, the Board approved amendments to the fund's management contract that added four new fee breakpoints to the group fee rate schedule for assets under FMR's management above $1,386 billion. The Board considered that the group fee rate declines under both the present and amended schedules, but that under the amended schedule, the group fee rate declines faster as assets under FMR's management exceed $1,386 billion. The Board considered that the group fee is designed to deliver the benefits of economies of scale to fund shareholders when total fund assets increase, even if assets of any particular fund are unchanged or have declined, because some portion of Fidelity's costs are attributable to services provided to all Fidelity funds, and all funds benefit if those costs can be allocated among more assets. The Board concluded that, given the group fee structure, fund shareholders will achieve a certain level of economies of scale as assets under FMR's management increase at the fund complex level, regardless of whether Fidelity achieves any such economies of scale.
The Board further concluded that any potential economies of scale are being shared between fund shareholders and Fidelity in an appropriate manner.
Additional Information Requested by the Board. In order to develop fully the factual basis for consideration of the Fidelity funds' Advisory Contracts, the Board requested and received additional information on several topics, including (i) fund performance trends and actions to be taken by FMR to improve certain funds' overall performance; (ii) Fidelity's portfolio manager compensation structure, including its effects on fund profitability and the extent to which portfolio manager compensation is linked to fund performance; (iii) Fidelity's fee structures; (iv) the funds' sub-advisory arrangements; and (v) accounts managed by Fidelity other than the Fidelity funds.
Based on its evaluation of all of the conclusions noted above, and after considering all material factors, the Board ultimately concluded that the advisory fee structures are fair and reasonable, and that the fund's Advisory Contracts should be renewed.
Annual Report
Annual Report
Annual Report
Annual Report
Annual Report
Annual Report
Investment Adviser
Fidelity Management & Research Company
Boston, MA
Investment Sub-Advisers
FMR Co., Inc.
Fidelity Management & Research
(U.K.) Inc.
Fidelity Research & Analysis Company
Fidelity Investments Japan Limited
Fidelity International Investment Advisors
Fidelity International Investment Advisors
(U.K. Limited)
General Distributor
Fidelity Distributors Corporation
Boston, MA
Transfer and Service Agents
Fidelity Investments Institutional
Operations Company, Inc.
Boston, MA
Fidelity Service Company, Inc.
Boston, MA
Custodian
Mellon Bank, N.A.
Pittsburgh, PA
ACAN-UANN-1207
1.843164.100
(Fidelity Investment logo)(registered trademark)
Corporate Headquarters
82 Devonshire St., Boston, MA 02109
www.fidelity.com
Fidelity Advisor
Canada Fund
Institutional Class
Institutional Class is a class of
Fidelity® Canada Fund
Annual Report
October 31, 2007
(2_fidelity_logos) (Registered_Trademark)
Contents
Chairman's Message | <Click Here> | Ned Johnson's message to shareholders. |
Performance | <Click Here> | How the fund has done over time. |
Management's Discussion | <Click Here> | The manager's review of fund performance, strategy and outlook. |
Shareholder Expense Example | <Click Here> | An example of shareholder expenses. |
Investment Changes | <Click Here> | A summary of major shifts in the fund's investments over the past six months. |
Investments | <Click Here> | A complete list of the fund's investments with their market values. |
Financial Statements | <Click Here> | Statements of assets and liabilities, operations, and changes in net assets,
as well as financial highlights. |
Notes | <Click Here> | Notes to the financial statements. |
Report of Independent Registered Public Accounting Firm | <Click Here> | |
Trustees and Officers | <Click Here> | |
Distributions | <Click Here> | |
Board Approval of Investment Advisory Contracts and Management Fees | <Click Here> | |
To view a fund's proxy voting guidelines and proxy voting record for the 12-month period ended June 30, visit http://www.fidelity.com (search for "proxy voting guidelines") or visit the Securities and Exchange Commission's (SEC) web site at http://www.sec.gov. You may also call 1-877-208-0098 to request a free copy of the proxy voting guidelines.
Standard & Poor's, S&P and S&P 500 are registered service marks of The McGraw-Hill Companies, Inc. and have been licensed for use by Fidelity Distributors Corporation.
Other third party marks appearing herein are the property of their respective owners.
All other marks appearing herein are registered or unregistered trademarks or service marks of FMR LLC or an affiliated company.
This report and the financial statements contained herein are submitted for the general information of the shareholders of the fund. This report is not authorized for distribution to prospective investors in the fund unless preceded or accompanied by an effective prospectus.
A fund files its complete schedule of portfolio holdings with the SEC for the first and third quarters of each fiscal year on Form N-Q. Forms N-Q are available on the SEC's web site at http://www.sec.gov. A fund's Forms N-Q may be reviewed and copied at the SEC's Public Reference Room in Washington, DC. Information regarding the operation of the SEC's Public Reference Room may be obtained by calling 1-800-SEC-0330. For a complete list of a fund's portfolio holdings, view the most recent holdings listing, semiannual report, or annual report on Fidelity's web site at http://www.fidelity.com or http://www.advisor.fidelity.com, as applicable.
NOT FDIC INSURED · MAY LOSE VALUE · NO BANK GUARANTEE
Neither the funds nor Fidelity Distributors Corporation is a bank.
Annual Report
Chairman's Message
(Photograph of Edward C. Johnson 3d.)
Dear Shareholder:
Many stock and bond markets around the world have been unsettled of late; however, volatility can often lead to opportunity for patient investors. Financial markets are always unpredictable, but there are a number of time-tested principles that can put the historical odds in your favor.
One of the basic tenets is to invest for the long term. Over time, riding out the markets' inevitable ups and downs has proven much more effective than selling into panic or chasing the hottest trend. Even missing only a few of the markets' best days can significantly diminish investor returns. Patience also affords the benefits of compounding - of earning interest on additional income or reinvested dividends and capital gains. There are tax advantages and cost benefits to consider as well. The more you sell, the more taxes you pay, and the more you trade, the higher the costs. While staying the course doesn't eliminate risk, it can considerably lessen the effect of short-term declines.
You can further manage your investing risk through diversification. And today, more than ever, geographic diversification should be taken into account. Studies
indicate that asset allocation is the single most important determinant of a portfolio's long-term success. The right mix of stocks, bonds and cash - aligned to your particular risk tolerance and investment objective - is very important. Age-appropriate rebalancing is also an essential aspect of asset allocation. For younger investors, an emphasis on equities - which historically have been the best-performing asset class over time - is encouraged. As investors near their specific goal, such as retirement or sending a child to college, consideration may be given to replacing volatile assets (e.g. common stocks) with more-stable fixed investments (bonds or savings plans).
A third investment principle - investing regularly - can help lower the average cost of your purchases. Investing a certain amount of money each month or quarter helps ensure you won't pay for all your shares at market highs. This strategy - known as dollar cost averaging - also reduces unconstructive "emotion" from investing, helping shareholders avoid selling weak performers just prior to an upswing, or chasing a hot performer just before a correction.
We invite you to contact us via the Internet, through our Investor Centers or over the phone. It is our privilege to provide you the information you need to make the investments that are right for you.
Sincerely,
/s/Edward C. Johnson 3d
Edward C. Johnson 3d
Annual Report
Fidelity Advisor Canada Fund - Institutional Class
Performance: The Bottom Line
Average annual total return reflects the change in the value of an investment, assuming reinvestment of the class'dividend income and capital gains (the profits earned upon the sale of securities that have grown in value) and assuming a constant rate of performance each year. The $10,000 table and the fund's returns do not reflect the deduction of taxes that a shareholder would pay on fund distributions or the redemption of fund shares. During periods of reimbursement by Fidelity, a fund's total returns will be greater than it would be had the reimbursement not occurred. How a fund did yesterday is no guarantee of how it will do tomorrow.
Average Annual Total Returns
Periods ended October 31, 2007 | Past 1
year | Past 5
years | Past 10
years |
Institutional ClassA | 46.03% | 33.12% | 16.59% |
A The initial offering of Institutional Class shares took place on May 2, 2007. Returns prior to May 2, 2007 are those of Canada, the original retail class of the fund.
$10,000 Over 10 Years
Let's say hypothetically that $10,000 was invested in Fidelity® Canada Fund - Institutional Class on October 31, 1997. The chart shows how the value of your investment would have changed, and also shows how the S&P/TSX Composite Index performed over the same period. The inital offering of Institutional Class took place on May 2, 2007. See above for additional information regarding the performance of Institutional Class.

Annual Report
Management's Discussion of Fund Performance
Comments from Maxime Lemieux, Portfolio Manager of Fidelity Advisor Canada Fund
Foreign stocks, with a large assist from a weak U.S. dollar, generally had higher returns for U.S. investors than domestic equities during the 12-month period ending October 31, 2007. The backdrop for global stocks was solid, with robust economic growth and relatively high corporate profitability worldwide. Developed international equity markets, as measured by the Morgan Stanley Capital InternationalSM Europe, Australasia, and Far East (MSCI® EAFE®) Index-a performance monitor of established markets outside the United States and Canada - rose 25.09%. In comparison, the Standard & Poor's 500SM Index, a gauge of U.S. stocks, was up 14.56%, while Canada did appreciably better, as measured by the 43.24% advance of the S&P/TSX Composite Index. Among countries making up at least 1% of the EAFE benchmark, Finland had the best showing, soaring nearly 69%, while Hong Kong gained roughly 66%. The United Kingdom and Japan, the two largest components of the index, both underperformed. Fallout from the credit crunch and concerns about export growth tempered UK stocks, while Japan struggled with a slowdown in consumer spending and sluggish domestic growth. Emerging markets were the period's big winners, advancing 68.33% as measured by the MSCI Emerging Markets index.
For the 12 months that ended October 31, 2007, the fund solidly beat the 43.24% gain of the S&P/TSX Composite Index. (For specific class-level performance results, please refer to the performance section of this report.) Despite an underweighting in the strong-performing energy and materials sectors, prudent stock selection within these and other sectors - notably technology - propelled the fund's return past that of the benchmark. Overweighted positions in technology firm Research In Motion, aluminum producer and takeover target Alcan, engineering firm SNC-Lavalin, T-shirt manufacturer Gildan Activewear and fertilizer giant Potash Corp. of Saskatchewan made these stocks top contributors. Owning only a small stake in poorly performing telecommunications equipment maker Nortel Networks also boosted relative returns. Conversely, we had disappointing results in financials, led by property and casualty insurer ING Canada and Bank of Montreal. Elsewhere, telecom services operator TELUS, and gas and convenience store owner Alimentation Couche-Tard also detracted. Underweighting strong-performing telecom services operator BCE, which is in the process of being acquired, and not owning nickel producer and index component LionOre, which was taken over during the period, also dampened returns.
Note to shareholders: Fidelity Advisor Canada Fund may invest up to 35% of its total assets in any industry that represents more than 20% of the Canadian market. As of October 31, 2007, the fund did not have more than 25% of its total assets invested in any one industry.
The views expressed above reflect those of the portfolio manager(s) only through the end of the period as stated on the cover of this report and do not necessarily represent the views of Fidelity or any other person in the Fidelity organization. Any such views are subject to change at any time based upon market or other conditions and Fidelity disclaims any responsibility to update such views. These views may not be relied on as investment advice and, because investment decisions for a Fidelity fund are based on numerous factors, may not be relied on as an indication of trading intent on behalf of any Fidelity fund.
Annual Report
Canada
Shareholder Expense Example
As a shareholder of the Fund, you incur two types of costs: (1) transaction costs, including sales charges (loads) on purchase payments or redemption proceeds, redemption fees, and (2) ongoing costs, including management fees, distribution and/or service (12b-1) fees and other Fund expenses. This Example is intended to help you understand your ongoing costs (in dollars) of investing in the Fund and to compare these costs with the ongoing costs of investing in other mutual funds.
The Example is based on an investment of $1,000 invested at the beginning of the period and held for the entire period (May 1, 2007 to October 31, 2007) for the Canada class and for the entire period (May 2, 2007 to October 31, 2007) for Class A, Class T, Class B, Class C, and Institutional Class.
Actual Expenses
The first line of the accompanying table for each class of the Fund provides information about actual account values and actual expenses. You may use the information in this line, together with the amount you invested, to estimate the expenses that you paid over the period. Simply divide your account value by $1,000.00 (for example, an $8,600 account value divided by $1,000.00 = 8.6), then multiply the result by the number in the first line for a class of the Fund under the heading entitled "Expenses Paid During Period" to estimate the expenses you paid on your account during this period. A small balance maintenance fee of $12.00 that is charged once a year may apply for certain accounts with a value of less than $2,000. This fee is not included in the table below. If it was, the estimate of expenses you paid during the period would be higher, and your ending account value lower, by this amount. In addition, the Fund, as a shareholder in the underlying Fidelity Central Funds, will indirectly bear its pro rata share of the fees and expenses incurred by the underlying Fidelity Central Funds. These fees and expenses are not included in the Fund's annualized expense ratio used to calculate the expense estimate in the table below.
Hypothetical Example for Comparison Purposes
The second line of the accompanying table for each class of the Fund provides information about hypothetical account values and hypothetical expenses based on a Class' actual expense ratio and an assumed rate of return of 5% per year before expenses, which is not the Class' actual return. The hypothetical account values and expenses may not be used to estimate the actual ending account balance or expenses you paid for the period. You may use this information to compare the ongoing costs of investing in the Fund and other funds. To do so, compare this 5% hypothetical example with the 5% hypothetical examples that appear in the shareholder reports of the other funds. A small balance maintenance fee of $12.00 that is charged once a year may apply for certain accounts with a value of less than $2,000. This fee is not included in the table below. If it was, the estimate of expenses you paid during the period would be higher, and your ending account value lower, by this amount. In addition, the Fund, as a shareholder in the underlying Fidelity Central Funds, will indirectly bear its pro rata share of the fees and expenses incurred by the underlying Fidelity Central Funds. These fees and expenses are not included in the Fund's annualized expense ratio used to calculate the expense estimate in the table below.
Please note that the expenses shown in the table are meant to highlight your ongoing costs only and do not reflect any transaction costs. Therefore, the second line of the table is useful in comparing ongoing costs only, and will not help you determine the relative total costs of owning different funds. In addition, if these transactional costs were included, your costs would have been higher.
| Beginning
Account Value
May 1, 2007 | Ending
Account Value
October 31, 2007 | Expenses Paid
During Period*
May 1, 2007
to October 31, 2007 |
Class A | | | |
Actual | $ 1,000.00 | $ 1,299.30 | $ 7.09 |
HypotheticalA | $ 1,000.00 | $ 1,019.00 | $ 6.26 |
Class T | | | |
Actual | $ 1,000.00 | $ 1,298.00 | $ 8.53 |
HypotheticalA | $ 1,000.00 | $ 1,017.74 | $ 7.53 |
Classs B | | | |
Actual | $ 1,000.00 | $ 1,294.10 | $ 11.50 |
HypotheticalA | $ 1,000.00 | $ 1,015.12 | $ 10.16 |
Class C | | | |
Actual | $ 1,000.00 | $ 1,294.60 | $ 11.45 |
HypotheticalA | $ 1,000.00 | $ 1,015.17 | $ 10.11 |
Canada | | | |
Actual | $ 1,000.00 | $ 1,318.80 | $ 5.61 |
HypotheticalA | $ 1,000.00 | $ 1,020.37 | $ 4.89 |
Institutional Class | | | |
Actual | $ 1,000.00 | $ 1,300.90 | $ 5.83 |
HypotheticalA | $ 1,000.00 | $ 1,020.11 | $ 5.14 |
A 5% return per year before expenses
* Expenses are equal to each Class' annualized expense ratio (shown in the table below); multiplied by the average account value over the period, multiplied by 184/365 (to reflect the one-half year period) for the Canada class and multiplied by 183/365 (to reflect the period May 2, 2007 to October 31, 2007) for Class A, Class T, Class B, Class C, and Institutional Class.
Annual Report
| Annualized
Expense Ratio |
Class A | 1.23% |
Class T | 1.48% |
Class B | 2.00% |
Class C | 1.99% |
Canada | .96% |
Institutional Class | 1.01% |
Annual Report
Canada
Investment Changes
Geographic Diversification (% of fund's net assets) |
As of October 31, 2007 |
 | Canada | 94.9% | |
 | United States of America | 5.1% | |

Percentages are adjusted for the effect of futures contracts, if applicable. |
|
As of April 30, 2007 |
| Canada | 96.5% | |
| United States of America | 3.5% | |

Percentages are adjusted for the effect of futures contracts, if applicable. |
Asset Allocation |
| % of fund's
net assets | % of fund's net assets
6 months ago |
Stocks | 96.1 | 97.7 |
Short-Term Investments and Net Other Assets | 3.9 | 2.3 |
Top Ten Stocks as of October 31, 2007 |
| % of fund's
net assets | % of fund's net assets
6 months ago |
Research In Motion Ltd. (Communications Equipment) | 4.8 | 2.6 |
Suncor Energy, Inc. (Oil, Gas & Consumable Fuels) | 4.7 | 3.6 |
Manulife Financial Corp. (Insurance) | 4.5 | 5.0 |
Royal Bank of Canada (Commercial Banks) | 4.0 | 4.7 |
Toronto-Dominion Bank (Commercial Banks) | 3.9 | 4.5 |
Potash Corp. of Saskatchewan, Inc. (Chemicals) | 3.7 | 2.5 |
SNC-Lavalin Group, Inc. (Construction & Engineering) | 3.6 | 1.3 |
Canadian Natural Resources Ltd. (Oil, Gas & Consumable Fuels) | 3.5 | 3.1 |
Rogers Communications, Inc. Class B (non-vtg.) (Wireless Telecommunication Services) | 3.4 | 3.1 |
EnCana Corp. (Oil, Gas & Consumable Fuels) | 3.2 | 3.2 |
| 39.3 | |
Market Sectors as of October 31, 2007 |
| % of fund's
net assets | % of fund's net assets
6 months ago |
Energy | 25.6 | 26.8 |
Financials | 23.7 | 29.7 |
Materials | 10.9 | 9.5 |
Industrials | 10.3 | 8.0 |
Information Technology | 9.5 | 5.9 |
Consumer Discretionary | 6.3 | 7.6 |
Telecommunication Services | 6.3 | 6.6 |
Consumer Staples | 3.4 | 3.6 |
Health Care | 0.1 | 0.0 |
Annual Report
Canada
Investments October 31, 2007
Showing Percentage of Net Assets
Common Stocks - 96.1% |
| Shares | | Value |
CONSUMER DISCRETIONARY - 6.3% |
Hotels, Restaurants & Leisure - 0.7% |
Great Canadian Gaming Corp. (a) | 1,100,000 | | $ 16,310,104 |
Tim Hortons, Inc. | 500,000 | | 18,950,000 |
| | 35,260,104 |
Media - 3.0% |
Aeroplan Income Fund | 718,200 | | 17,038,424 |
Aeroplan Income Fund (a)(e) | 31,800 | | 754,416 |
Astral Media, Inc. Class A (non-vtg.) | 200,000 | | 9,540,352 |
Corus Entertainment, Inc. Class B (non-vtg.) | 550,000 | | 28,979,559 |
Quebecor, Inc. Class B (sub. vtg.) | 975,000 | | 42,337,429 |
Yellow Pages Income Fund | 3,200,000 | | 48,464,308 |
| | 147,114,488 |
Multiline Retail - 0.5% |
Canadian Tire Corp. Ltd. Class A (non-vtg.) | 275,000 | | 25,309,786 |
Textiles, Apparel & Luxury Goods - 2.1% |
Gildan Activewear, Inc. (a) | 2,250,000 | | 103,063,440 |
TOTAL CONSUMER DISCRETIONARY | | 310,747,818 |
CONSUMER STAPLES - 3.4% |
Food & Staples Retailing - 2.6% |
Alimentation Couche-Tard, Inc. Class B (sub. vtg.) | 1,250,000 | | 27,179,093 |
Metro, Inc. Class A (sub. vtg.) | 725,000 | | 27,281,561 |
Shoppers Drug Mart Corp. | 1,250,000 | | 73,316,035 |
| | 127,776,689 |
Food Products - 0.8% |
Saskatchewan Wheat Pool, Inc. (a) | 1,826,500 | | 24,702,823 |
Saskatchewan Wheat Pool, Inc. (a)(e) | 1,273,500 | | 17,223,676 |
| | 41,926,499 |
TOTAL CONSUMER STAPLES | | 169,703,188 |
ENERGY - 25.6% |
Energy Equipment & Services - 0.6% |
CCS Income Trust | 500,000 | | 23,935,607 |
Flint Energy Services Ltd. (a) | 250,000 | | 6,441,961 |
Savanna Energy Services Corp. | 140,000 | | 2,367,931 |
| | 32,745,499 |
Oil, Gas & Consumable Fuels - 25.0% |
AltaGas Income Trust | 700,000 | | 19,868,672 |
Cameco Corp. | 1,000,000 | | 49,300,996 |
Canadian Natural Resources Ltd. | 2,100,000 | | 174,725,694 |
Canadian Oil Sands Trust | 1,700,000 | | 62,476,170 |
Duvernay Oil Corp. (a) | 350,000 | | 12,644,037 |
EnCana Corp. | 2,250,000 | | 157,514,298 |
Galleon Energy, Inc. (a)(e) | 100,000 | | 1,524,042 |
Galleon Energy, Inc. Class A (a) | 700,000 | | 10,668,291 |
Husky Energy, Inc. | 1,400,000 | | 65,284,897 |
Keyera Facilities Income Fund | 1,000,000 | | 17,729,295 |
|
| Shares | | Value |
Nexen, Inc. | 1,250,000 | | $ 42,350,667 |
Niko Resources Ltd. | 475,000 | | 53,224,952 |
Niko Resources Ltd. (e) | 20,000 | | 2,241,051 |
Petro-Canada | 1,232,900 | | 71,164,001 |
Suncor Energy, Inc. | 2,100,000 | | 230,083,669 |
Talisman Energy, Inc. | 3,200,000 | | 69,747,935 |
TransCanada Corp. | 3,700,000 | | 157,451,811 |
Uranium One, Inc. (a) | 1,550,000 | | 17,220,398 |
Valero Energy Corp. | 280,000 | | 19,720,400 |
| | 1,234,941,276 |
TOTAL ENERGY | | 1,267,686,775 |
FINANCIALS - 23.7% |
Capital Markets - 0.6% |
CI Financial Income Fund | 950,000 | | 28,604,639 |
Commercial Banks - 12.9% |
Bank of Montreal | 2,300,000 | | 153,463,249 |
Canadian Imperial Bank of Commerce | 450,000 | | 48,612,582 |
National Bank of Canada | 800,000 | | 46,303,749 |
Royal Bank of Canada | 3,350,000 | | 198,828,638 |
Toronto-Dominion Bank | 2,550,000 | | 192,694,874 |
| | 639,903,092 |
Diversified Financial Services - 0.8% |
Onex Corp. (sub. vtg.) | 425,000 | | 17,887,630 |
TSX Group, Inc. | 375,000 | | 20,231,413 |
| | 38,119,043 |
Insurance - 7.3% |
ING Canada, Inc. | 570,000 | | 27,165,855 |
Manulife Financial Corp. | 4,750,000 | | 222,307,244 |
Power Corp. of Canada (sub. vtg.) | 1,200,000 | | 51,497,564 |
Sun Life Financial, Inc. | 1,000,000 | | 58,133,870 |
| | 359,104,533 |
Real Estate Management & Development - 2.1% |
Brookfield Asset Management, Inc. Class A | 1,850,000 | | 75,610,570 |
Brookfield Properties Corp. | 1,250,000 | | 31,212,508 |
| | 106,823,078 |
TOTAL FINANCIALS | | 1,172,554,385 |
HEALTH CARE - 0.1% |
Health Care Equipment & Supplies - 0.1% |
Noveko International, Inc. (a) | 834,000 | | 6,085,850 |
INDUSTRIALS - 10.3% |
Aerospace & Defense - 2.9% |
Bombardier, Inc. Class B (sub. vtg.) (a) | 16,275,000 | | 96,526,160 |
Common Stocks - continued |
| Shares | | Value |
INDUSTRIALS - continued |
Aerospace & Defense - continued |
CAE, Inc. | 3,300,000 | | $ 44,526,583 |
Mecachrome International, Inc. (a)(e) | 400,000 | | 5,380,216 |
| | 146,432,959 |
Commercial Services & Supplies - 0.4% |
Garda World Security Corp. (a) | 950,000 | | 18,321,860 |
Construction & Engineering - 3.6% |
SNC-Lavalin Group, Inc. | 3,450,000 | | 178,748,146 |
Machinery - 0.2% |
Bucyrus International, Inc. Class A | 100,000 | | 8,250,000 |
Road & Rail - 1.9% |
Canadian National Railway Co. | 1,300,000 | | 72,958,060 |
Canadian Pacific Railway Ltd. | 150,000 | | 10,561,322 |
TransForce Income Fund | 844,237 | | 9,450,948 |
| | 92,970,330 |
Trading Companies & Distributors - 1.3% |
Finning International, Inc. | 1,900,000 | | 65,399,280 |
TOTAL INDUSTRIALS | | 510,122,575 |
INFORMATION TECHNOLOGY - 9.5% |
Communications Equipment - 5.0% |
Nortel Networks Corp. (a) | 550,000 | | 8,877,357 |
Research In Motion Ltd. (a) | 1,900,000 | | 236,569,016 |
| | 245,446,373 |
Electronic Equipment & Instruments - 0.2% |
Miranda Technologies, Inc. (a) | 613,700 | | 6,629,676 |
Miranda Technologies, Inc. (a)(e) | 186,300 | | 2,012,561 |
| | 8,642,237 |
Internet Software & Services - 2.6% |
Google, Inc. Class A (sub. vtg.) (a) | 150,000 | | 106,050,000 |
Open Text Corp. (a)(d) | 675,000 | | 21,096,431 |
| | 127,146,431 |
IT Services - 0.6% |
CGI Group, Inc. Class A (sub. vtg.) (a) | 2,000,000 | | 22,791,781 |
Emergis, Inc. (a) | 700,000 | | 5,552,849 |
| | 28,344,630 |
Semiconductors & Semiconductor Equipment - 0.2% |
Broadcom Corp. Class A (a) | 250,000 | | 8,137,500 |
Tundra Semiconductor Corp. Ltd. (a) | 355,000 | | 1,928,776 |
| | 10,066,276 |
|
| Shares | | Value |
Software - 0.9% |
Cognos, Inc. (a) | 350,000 | | $ 17,615,501 |
MacDonald Dettwiler & Associates Ltd. (a) | 625,000 | | 29,787,121 |
| | 47,402,622 |
TOTAL INFORMATION TECHNOLOGY | | 467,048,569 |
MATERIALS - 10.9% |
Chemicals - 3.7% |
Potash Corp. of Saskatchewan, Inc. | 1,470,000 | | 180,545,409 |
Metals & Mining - 7.2% |
Aber Diamond Corp. | 450,000 | | 19,797,712 |
Barrick Gold Corp. | 1,100,000 | | 48,930,311 |
Eldorado Gold Corp. (a) | 350,000 | | 2,442,809 |
First Quantum Minerals Ltd. | 50,000 | | 5,384,982 |
Fording Canadian Coal Trust | 400,000 | | 14,666,384 |
Goldcorp, Inc. | 2,850,000 | | 100,302,372 |
Kinross Gold Corp. (a) | 3,800,000 | | 75,178,988 |
Shore Gold, Inc. (a) | 3,000,000 | | 14,456,683 |
Teck Cominco Ltd. Class B (sub. vtg.) | 600,000 | | 30,063,546 |
US Gold Corp. (a) | 1,100,000 | | 5,137,000 |
US Gold Corp. warrants 2/22/11 (a)(f) | 200,000 | | 324,084 |
Yamana Gold, Inc. (d) | 2,750,000 | | 41,474,264 |
| | 358,159,135 |
TOTAL MATERIALS | | 538,704,544 |
TELECOMMUNICATION SERVICES - 6.3% |
Diversified Telecommunication Services - 2.6% |
BCE, Inc. | 650,000 | | 28,397,056 |
TELUS Corp. (non-vtg.) | 1,725,000 | | 100,463,620 |
| | 128,860,676 |
Wireless Telecommunication Services - 3.7% |
American Tower Corp. Class A (a) | 325,000 | | 14,358,500 |
Rogers Communications, Inc. Class B (non-vtg.) | 3,250,000 | | 165,701,123 |
| | 180,059,623 |
TOTAL TELECOMMUNICATION SERVICES | | 308,920,299 |
TOTAL COMMON STOCKS (Cost $2,920,644,814) | 4,751,574,003 |
Government Obligations - 2.6% |
| Principal Amount | | |
Canadian Government Treasury Bills yield at date of purchase
3.9104% to 4.5618% 11/1/07 to 2/7/08
(Cost $119,603,328) | CAD | $ 121,450,000 | 127,806,224 |
Money Market Funds - 2.9% |
| Shares | | Value |
Fidelity Cash Central Fund, 4.97% (b) | 129,652,562 | | $ 129,652,562 |
Fidelity Securities Lending Cash Central Fund, 5.02% (b)(c) | 15,247,500 | | 15,247,500 |
TOTAL MONEY MARKET FUNDS (Cost $144,900,062) | 144,900,062 |
TOTAL INVESTMENT PORTFOLIO - 101.6% (Cost $3,185,148,204) | | 5,024,280,289 |
NET OTHER ASSETS - (1.6)% | | (81,336,082) |
NET ASSETS - 100% | $ 4,942,944,207 |
Currency Abbreviations |
CAD | - | Canadian dollar |
Legend |
(a) Non-income producing |
(b) Affiliated fund that is available only to investment companies and other accounts managed by Fidelity Investments. The rate quoted is the annualized seven-day yield of the fund at period end. A complete unaudited listing of the fund's holdings as of its most recent quarter end is available upon request. |
(c) Investment made with cash collateral received from securities on loan. |
(d) Security or a portion of the security is on loan at period end. |
(e) Security exempt from registration under Rule 144A of the Securities Act of 1933. These securities may be resold in transactions exempt from registration, normally to qualified institutional buyers. At the end of the period, the value of these securities amounted to $29,135,962 or 0.6% of net assets. |
(f) Restricted securities - Investment in securities not registered under the Securities Act of 1933 (excluding 144A issues). At the end of the period, the value of restricted securities (excluding 144A issues) amounted to $324,084 or 0.0% of net assets. |
Additional information on each holding is as follows: |
Security | Acquisition Date | Acquisition Cost |
US Gold Corp. warrants 2/22/11 | 2/8/06 | $ 98,359 |
Affiliated Central Funds |
Information regarding fiscal year to date income earned by the Fund from investments in Fidelity Central Funds is as follows: |
Fund | Income earned |
Fidelity Cash Central Fund | $ 3,233,641 |
Fidelity Securities Lending Cash Central Fund | 4,436,261 |
Total | $ 7,669,902 |
Other Affiliated Issuers |
An affiliated company is a company in which the fund has ownership of at least 5% of the voting securities. Fiscal year to date transactions with companies which are or were affiliates are as follows: |
Affiliate | Value, beginning of period | Purchases | Sales Proceeds | Dividend Income | Value, end
of period |
WestJet Airlines Ltd. | $ 3,582,328 | $ 281,310 | $ 5,177,899 | $ - | $ - |
See accompanying notes which are an integral part of the financial statements.
Annual Report
Canada
Financial Statements
Statement of Assets and Liabilities
| October 31, 2007 |
| | |
Assets | | |
Investment in securities, at value (including securities loaned of $15,071,263) - See accompanying schedule: Unaffiliated issuers
(cost $3,040,248,142) | $ 4,879,380,227 | |
Fidelity Central Funds
(cost $144,900,062) | 144,900,062 | |
Total Investments
(cost $3,185,148,204) | | $ 5,024,280,289 |
Cash | | 54,573 |
Foreign currency held at value
(cost $2,187,024) | | 2,190,556 |
Receivable for investments sold | | 11,913,945 |
Receivable for fund shares sold | | 24,997,924 |
Dividends receivable | | 4,574,014 |
Distributions receivable from Fidelity Central Funds | | 817,046 |
Prepaid expenses | | 1,281 |
Other receivables | | 182,735 |
Total assets | | 5,069,012,363 |
| | |
Liabilities | | |
Payable for investments purchased | $ 103,381,374 | |
Payable for fund shares redeemed | 3,704,968 | |
Accrued management fee | 2,706,784 | |
Distribution fees payable | 16,777 | |
Other affiliated payables | 826,650 | |
Other payables and accrued expenses | 184,103 | |
Collateral on securities loaned, at value | 15,247,500 | |
Total liabilities | | 126,068,156 |
| | |
Net Assets | | $ 4,942,944,207 |
Net Assets consist of: | | |
Paid in capital | | $ 2,817,566,476 |
Undistributed net investment income | | 26,450,845 |
Accumulated undistributed net realized gain (loss) on investments and foreign currency transactions | | 259,628,185 |
Net unrealized appreciation (depreciation) on investments and assets and liabilities in foreign currencies | | 1,839,298,701 |
Net Assets | | $ 4,942,944,207 |
Statement of Assets and Liabilities - continued
| October 31, 2007 |
| | |
Calculation of Maximum Offering Price Class A:
Net Asset Value and redemption price per share ($20,911,606 ÷ 298,051 shares) | | $ 70.16 |
| | |
Maximum offering price per share (100/94.25 of $70.16) | | $ 74.44 |
Class T:
Net Asset Value and redemption price per share ($14,522,231 ÷ 207,194 shares) | | $ 70.09 |
| | |
Maximum offering price per share (100/96.50 of $70.09) | | $ 72.63 |
Class B:
Net Asset Value and offering price per share ($4,078,099 ÷ 58,354.4 shares)A | | $ 69.88 |
| | |
Class C:
Net Asset Value and offering price per share ($8,751,799 ÷ 125,182 shares)A | | $ 69.91 |
| | |
| | |
Canada:
Net Asset Value, offering price and redemption price per share ($4,890,616,915 ÷ 69,617,220 shares) | | $ 70.25 |
| | |
Institutional Class:
Net Asset Value, offering price and redemption price per share ($4,063,557 ÷ 57,844 shares) | | $ 70.25 |
A Redemption price per share is equal to net asset value less any applicable contingent deferred sales charge.
See accompanying notes which are an integral part of the financial statements.
Annual Report
Statement of Operations
| Year ended October 31, 2007 |
| | |
Investment Income | | |
Dividends | | $ 64,656,558 |
Interest | | 3,366,629 |
Income from Fidelity Central Funds (including $4,436,261 from security lending) | | 7,669,902 |
| | 75,693,089 |
Less foreign taxes withheld | | (9,150,807) |
Total income | | 66,542,282 |
| | |
Expenses | | |
Management fee
Basic fee | $ 25,043,384 | |
Performance adjustment | (579,460) | |
Transfer agent fees | 7,412,777 | |
Distribution fees | 39,582 | |
Accounting and security lending fees | 1,426,984 | |
Custodian fees and expenses | 200,450 | |
Independent trustees' compensation | 11,897 | |
Registration fees | 222,934 | |
Audit | 84,068 | |
Legal | 33,081 | |
Interest | 36,171 | |
Miscellaneous | 119,526 | |
Total expenses before reductions | 34,051,394 | |
Expense reductions | (687,313) | 33,364,081 |
Net investment income (loss) | | 33,178,201 |
Realized and Unrealized Gain (Loss) Net realized gain (loss) on: | | |
Investment securities: | | |
Unaffiliated issuers | 271,498,118 | |
Other affiliated issuers | 1,297,868 | |
Foreign currency transactions | (518,962) | |
Total net realized gain (loss) | | 272,277,024 |
Change in net unrealized appreciation (depreciation) on: Investment securities | 1,120,584,615 | |
Assets and liabilities in foreign currencies | 134,640 | |
Total change in net unrealized appreciation (depreciation) | | 1,120,719,255 |
Net gain (loss) | | 1,392,996,279 |
Net increase (decrease) in net assets resulting from operations | | $ 1,426,174,480 |
See accompanying notes which are an integral part of the financial statements.
Annual Report
Canada
Financial Statements - continued
Statement of Changes in Net Assets
| Year ended
October 31,
2007 | Year ended
October 31,
2006 |
Increase (Decrease) in Net Assets | | |
Operations | | |
Net investment income (loss) | $ 33,178,201 | $ 19,732,045 |
Net realized gain (loss) | 272,277,024 | 70,228,167 |
Change in net unrealized appreciation (depreciation) | 1,120,719,255 | 455,286,136 |
Net increase (decrease) in net assets resulting from operations | 1,426,174,480 | 545,246,348 |
Distributions to shareholders from net investment income | (22,989,617) | (7,430,512) |
Distributions to shareholders from net realized gain | (65,775,827) | (464,413) |
Total distributions | (88,765,444) | (7,894,925) |
Share transactions - net increase (decrease) | 467,056,549 | 875,768,447 |
Redemption fees | 1,551,369 | 1,291,008 |
Total increase (decrease) in net assets | 1,806,016,954 | 1,414,410,878 |
| | |
Net Assets | | |
Beginning of period | 3,136,927,253 | 1,722,516,375 |
End of period (including undistributed net investment income of $26,450,845 and undistributed net investment income of $17,032,665, respectively) | $ 4,942,944,207 | $ 3,136,927,253 |
Financial Highlights - Class A
Years ended October 31, | 2007 H |
Selected Per-Share Data | |
Net asset value, beginning of period | $ 54.00 |
Income from Investment Operations | |
Net investment income (loss) E | .19 |
Net realized and unrealized gain (loss) | 15.96 |
Total from investment operations | 16.15 |
Redemption fees added to paid in capital E | .01 |
Net asset value, end of period | $ 70.16 |
Total Return B, C, D | 29.93% |
Ratios to Average Net Assets F, I | |
Expenses before reductions | 1.23% A |
Expenses net of fee waivers, if any | 1.23% A |
Expenses net of all reductions | 1.22% A |
Net investment income (loss) | .63% A |
Supplemental Data | |
Net assets, end of period (000 omitted) | $ 20,912 |
Portfolio turnover rate G | 42% |
AAnnualized B Total returns for periods of less than one year are not annualized. C Total returns would have been lower had certain expenses not been reduced during the periods shown. D Total returns do not include the effect of the sales charges. E Calculated based on average shares outstanding during the period. F Fees and expenses of the underlying Fidelity Central Funds are not included in the Fund's expense ratio. The Fund indirectly bears its proportionate share of the expenses of any underlying Fidelity Central Funds. G Amount does not include the portfolio activity of any underlying Fidelity Central Funds. H For the period May 2, 2007 (commencement of sale of shares) to October 31, 2007. I Expense ratios reflect operating expenses of the class. Expenses before reductions do not reflect amounts reimbursed by the investment adviser or reductions from brokerage service arrangements or other expense offset arrangements and do not represent the amount paid by the class during periods when reimbursements or reductions occur. Expense ratios before reductions for start-up periods may not be representative of longer-term operating periods. Expenses net of fee waivers reflect expenses after reimbursement by the investment adviser but prior to reductions from brokerage service arrangements or other expense offset arrangements. Expenses net of all reductions represent the net expenses paid by the class. |
See accompanying notes which are an integral part of the financial statements.
Annual Report
Financial Highlights - Class T
Years ended October 31, | 2007 H |
Selected Per-Share Data | |
Net asset value, beginning of period | $ 54.00 |
Income from Investment Operations | |
Net investment income (loss) E | .09 |
Net realized and unrealized gain (loss) | 15.99 |
Total from investment operations | 16.08 |
Redemption fees added to paid in capital E | .01 |
Net asset value, end of period | $ 70.09 |
Total Return B, C, D | 29.80% |
Ratios to Average Net Assets F, I | |
Expenses before reductions | 1.48% A |
Expenses net of fee waivers, if any | 1.48% A |
Expenses net of all reductions | 1.47% A |
Net investment income (loss) | .30% A |
Supplemental Data | |
Net assets, end of period (000 omitted) | $ 14,522 |
Portfolio turnover rate G | 42% |
A Annualized B Total returns for periods of less than one year are not annualized. C Total returns would have been lower had certain expenses not been reduced during the periods shown. D Total returns do not include the effect of the sales charges. E Calculated based on average shares outstanding during the period. F Fees and expenses of the underlying Fidelity Central Funds are not included in the Fund's expense ratio. The Fund indirectly bears its proportionate share of the expenses of any underlying Fidelity Central Funds. G Amount does not include the portfolio activity of any underlying Fidelity Central Funds. H For the period May 2, 2007 (commencement of sale of shares) to October 31, 2007. I Expense ratios reflect operating expenses of the class. Expenses before reductions do not reflect amounts reimbursed by the investment adviser or reductions from brokerage service arrangements or other expense offset arrangements and do not represent the amount paid by the class during periods when reimbursements or reductions occur. Expense ratios before reductions for start-up periods may not be representative of longer-term operating periods. Expenses net of fee waivers reflect expenses after reimbursement by the investment adviser but prior to reductions from brokerage service arrangements or other expense offset arrangements. Expenses net of all reductions represent the net expenses paid by the class. |
Financial Highlights - Class B
Years ended October 31, | 2007 H |
Selected Per-Share Data | |
Net asset value, beginning of period | $ 54.00 |
Income from Investment Operations | |
Net investment income (loss) E | (.06) |
Net realized and unrealized gain (loss) | 15.93 |
Total from investment operations | 15.87 |
Redemption fees added to paid in capital E | .01 |
Net asset value, end of period | $ 69.88 |
Total Return B, C, D | 29.41% |
Ratios to Average Net Assets F, I | |
Expenses before reductions | 2.00% A |
Expenses net of fee waivers, if any | 2.00% A |
Expenses net of all reductions | 1.99% A |
Net investment income (loss) | (.21)% A |
Supplemental Data | |
Net assets, end of period (000 omitted) | $ 4,078 |
Portfolio turnover rate G | 42% |
A Annualized BTotal returns for periods of less than one year are not annualized. CTotal returns would have been lower had certain expenses not been reduced during the periods shown. DTotal returns do not include the effect of the contingent deferred sales charge. ECalculated based on average shares outstanding during the period. FFees and expenses of the underlying Fidelity Central Funds are not included in the Fund's expense ratio. The Fund indirectly bears its proportionate share of the expenses of any underlying Fidelity Central Funds. GAmount does not include the portfolio activity of any underlying Fidelity Central Funds. HFor the period May 2, 2007 (commencement of sale of shares) to October 31, 2007. IExpense ratios reflect operating expenses of the class. Expenses before reductions do not reflect amounts reimbursed by the investment adviser or reductions from brokerage service arrangements or other expense offset arrangements and do not represent the amount paid by the class during periods when reimbursements or reductions occur. Expense ratios before reductions for start-up periods may not be representative of longer-term operating periods. Expenses net of fee waivers reflect expenses after reimbursement by the investment adviser but prior to reductions from brokerage service arrangements or other expense offset arrangements. Expenses net of all reductions represent the net expenses paid by the class. |
See accompanying notes which are an integral part of the financial statements.
Annual Report
Financial Highlights - Class C
Years ended October 31, | 2007 H |
Selected Per-Share Data | |
Net asset value, beginning of period | $ 54.00 |
Income from Investment Operations | |
Net investment income (loss) E | (.04) |
Net realized and unrealized gain (loss) | 15.94 |
Total from investment operations | 15.90 |
Redemption fees added to paid in capital E | .01 |
Net asset value, end of period | $ 69.91 |
Total Return B, C, D | 29.46% |
Ratios to Average Net Assets F, I | |
Expenses before reductions | 1.99% A |
Expenses net of fee waivers, if any | 1.99% A |
Expenses net of all reductions | 1.97% A |
Net investment income (loss) | (.15)% A |
Supplemental Data | |
Net assets, end of period (000 omitted) | $ 8,752 |
Portfolio turnover rate G | 42% |
A Annualized B Total returns for periods of less than one year are not annualized. C Total returns would have been lower had certain expenses not been reduced during the periods shown. D Total returns do not include the effect of the contingent deferred sales charge. ECalculated based on average shares outstanding during the period. F Fees and expenses of the underlying Fidelity Central Funds are not included in the Fund's expense ratio. The Fund indirectly bears its proportionate share of the expenses of any underlying Fidelity Central Funds. G Amount does not include the portfolio activity of any underlying Fidelity Central Funds. HFor the period May 2, 2007 (commencement of sale of shares) to October 31, 2007. I Expense ratios reflect operating expenses of the class. Expenses before reductions do not reflect amounts reimbursed by the investment adviser or reductions from brokerage service arrangements or other expense offset arrangements and do not represent the amount paid by the class during periods when reimbursements or reductions occur. Expense ratios before reductions for start-up periods may not be representative of longer-term operating periods. Expenses net of fee waivers reflect expenses after reimbursement by the investment adviser but prior to reductions from brokerage service arrangements or other expense offset arrangements. Expenses net of all reductions represent the net expenses paid by the class. |
Financial Highlights - Canada
| | |
Years ended October 31, | 2007 | 2006 | 2005 | 2004 | 2003 |
Selected Per-Share Data | | | | | |
Net asset value, beginning of period | $ 49.48 | $ 39.14 | $ 31.87 | $ 25.13 | $ 17.52 |
Income from Investment Operations | | | | | |
Net investment income (loss) B | .52 | .34 | .20 | .10 | .05 |
Net realized and unrealized gain (loss) | 21.62 | 10.15 | 7.12 | 6.74 | 7.58 |
Total from investment operations | 22.14 | 10.49 | 7.32 | 6.84 | 7.63 |
Distributions from net investment income | (.36) | (.16) | (.08) | (.13) | (.04) |
Distributions from net realized gain | (1.03) | (.01) | - | - | - |
Total distributions | (1.39) | (.17) | (.08) | (.13) | (.04) |
Redemption fees added to paid in capital B | .02 | .02 | .03 | .03 | .02 |
Net asset value, end of period | $ 70.25 | $ 49.48 | $ 39.14 | $ 31.87 | $ 25.13 |
Total Return A | 46.03% | 26.93% | 23.11% | 27.45% | 43.75% |
Ratios to Average Net Assets C, E | | | | | |
Expenses before reductions | .96% | 1.00% | 1.08% | 1.20% | 1.42% |
Expenses net of fee waivers, if any | .96% | 1.00% | 1.08% | 1.20% | 1.42% |
Expenses net of all reductions | .94% | .97% | 1.04% | 1.15% | 1.37% |
Net investment income (loss) | .94% | .74% | .55% | .34% | .26% |
Supplemental Data | | | | | |
Net assets, end of period (000 omitted) | $ 4,890,617 | $ 3,136,927 | $ 1,722,516 | $ 413,319 | $ 167,205 |
Portfolio turnover rate D | 42% | 50% | 24% | 47% | 52% |
A Total returns would have been lower had certain expenses not been reduced during the periods shown. BCalculated based on average shares outstanding during the period. CFees and expenses of the underlying Fidelity Central Funds are not included in the Fund's expense ratio. The Fund indirectly bears its proportionate share of the expenses of any underlying Fidelity Central Funds. DAmount does not include the portfolio activity of any underlying Fidelity Central Funds. E Expense ratios reflect operating expenses of the class. Expenses before reductions do not reflect amounts reimbursed by the investment adviser or reductions from brokerage service arrangements or other expense offset arrangements and do not represent the amount paid by the class during periods when reimbursements or reductions occur. Expenses net of fee waivers reflect expenses after reimbursement by the investment adviser but prior to reductions from brokerage service arrangements or other expense offset arrangements. Expenses net of all reductions represent the net expenses paid by the class. |
See accompanying notes which are an integral part of the financial statements.
Annual Report
Financial Highlights - Institutional Class
Years ended October 31, | 2007 G |
Selected Per-Share Data | |
Net asset value, beginning of period | $ 54.00 |
Income from Investment Operations | |
Net investment income (loss) D | .25 |
Net realized and unrealized gain (loss) | 15.99 |
Total from investment operations | 16.24 |
Redemption fees added to paid in capital D | .01 |
Net asset value, end of period | $ 70.25 |
Total Return B, C | 30.09% |
Ratios to Average Net Assets E, H | |
Expenses before reductions | 1.01% A |
Expenses net of fee waivers, if any | 1.01% A |
Expenses net of all reductions | .99% A |
Net investment income (loss) | .83% A |
Supplemental Data | |
Net assets, end of period (000 omitted) | $ 4,064 |
Portfolio turnover rate F | 42% |
A Annualized BTotal returns for periods of less than one year are not annualized. CTotal returns would have been lower had certain expenses not been reduced during the periods shown. DCalculated based on average shares outstanding during the period. EFees and expenses of the underlying Fidelity Central Funds are not included in the Fund's expense ratio. The Fund indirectly bears its proportionate share of the expenses of any underlying Fidelity Central Funds. FAmount does not include the portfolio activity of any underlying Fidelity Central Funds. GFor the period May 2, 2007 (commencement of sale of shares) to October 31, 2007. H Expense ratios reflect operating expenses of the class. Expenses before reductions do not reflect amounts reimbursed by the investment adviser or reductions from brokerage service arrangements or other expense offset arrangements and do not represent the amount paid by the class during periods when reimbursements or reductions occur. Expense ratios before reductions for start-up periods may not be representative of longer-term operating periods. Expenses net of fee waivers reflect expenses after reimbursement by the investment adviser but prior to reductions from brokerage service arrangements or other expense offset arrangements. Expenses net of all reductions represent the net expenses paid by the class. |
See accompanying notes which are an integral part of the financial statements.
Annual Report
Canada
Notes to Financial Statements
For the period ended October 31, 2007
1. Organization.
Fidelity Canada Fund (the Fund) is a fund of Fidelity Investment Trust (the trust) and is authorized to issue an unlimited number of shares. The trust is registered under the Investment Company Act of 1940, as amended (the 1940 Act), as an open-end management investment company organized as a Massachusetts business trust. The Fund commenced sale of Class A, Class T, Class B, Class C, and Institutional Class shares and the existing class was designated Canada on May 2, 2007. Class B shares will automatically convert to Class A shares after a holding period of seven years from the initial date of purchase. Investment income, realized and unrealized capital gains and losses, the common expenses of the Fund, and certain fund-level expense reductions, if any, are allocated on a pro rata basis to each class based on the relative net assets of each class to the total net assets of the Fund. Each class differs with respect to transfer agent and distribution and service plan fees incurred. Certain expense reductions also differ by class.
2. Investments in Fidelity Central Funds.
The Fund may invest in Fidelity Central Funds, which are open-end investment companies available only to other investment companies and accounts managed by Fidelity Management & Research Company (FMR) and its affiliates. The Fund's Schedule of Investments lists each of the Fidelity Central Funds as an investment of the Fund, but does not include the underlying holdings of each Fidelity Central Fund. As an Investing Fund, the Fund indirectly bears its proportionate share of the expenses of the underlying Fidelity Central Funds.
The Money Market Central Funds seek preservation of capital and current income and are managed by Fidelity Investments Money Management, Inc. (FIMM), an affiliate of FMR.
A complete list of holdings for each Fidelity Central Fund is available upon request or at the SEC's web site at www.sec.gov. In addition, the financial statements of the Fidelity Central Funds, which are not covered by the Fund's Report of Independent Registered Public Accounting Firm, are available on the SEC's web site or upon request.
3. Significant Accounting Policies.
The financial statements have been prepared in conformity with accounting principles generally accepted in the United States of America, which require management to make certain estimates and assumptions at the date of the financial statements. The following summarizes the significant accounting policies of the Fund:
Security Valuation. Investments are valued and net asset value (NAV) per share is calculated (NAV calculation) as of the close of business of the New York Stock Exchange (NYSE), normally 4:00 p.m. Eastern time. Wherever possible, the Fund uses independent pricing services approved by the Board of Trustees to value its investments.
Equity securities, including restricted securities, for which market quotations are readily available, are valued at the last reported sale price or official closing price as reported by an independent pricing service on the primary market or exchange on which they are traded. In the event there were no sales during the day or closing prices are not available, securities are valued at the last quoted bid price. Debt securities, including restricted securities, for which quotations are readily available, are valued by independent pricing services or by dealers who make markets in such securities. Pricing services consider yield or price of bonds of comparable quality, coupon, maturity and type as well as dealer supplied prices. Investments in open-end mutual funds, including the Fidelity Central Funds, are valued at their closing net asset value each business day. Short-term securities with remaining maturities of sixty days or less for which quotations are not readily available are valued at amortized cost, which approximates value.
When current market prices or quotations are not readily available or do not accurately reflect fair value, valuations may be determined in accordance with procedures adopted by the Board of Trustees. For example, when developments occur between the close of a market and the close of the NYSE that may materially affect the value of some or all of the securities, or when trading in a security is halted, those securities may be fair valued. Factors used in the determination of fair value may include monitoring news to identify significant market or security specific events such as changes in the value of U.S. securities markets, reviewing developments in foreign markets and evaluating the performance of ADRs, futures contracts and exchange-traded funds. Because the Fund's utilization of fair value pricing depends on market activity, the frequency with which fair value pricing is used cannot be predicted and may be utilized to a significant extent. The value of securities used for NAV calculation under fair value pricing may differ from published prices for the same securities.
Foreign Currency. The Fund uses foreign currency contracts to facilitate transactions in foreign-denominated securities. Losses from these transactions may arise from changes in the value of the foreign currency or if the counterparties do not perform under the contracts' terms.
Foreign-denominated assets, including investment securities, and liabilities are translated into U.S. dollars at the exchange rate at period end. Purchases and sales of investment securities, income and dividends received and expenses denominated in foreign currencies are translated into U.S. dollars at the exchange rate in effect on the transaction date.
The effects of exchange rate fluctuations on investments are included with the net realized and unrealized gain (loss) on investment securities. Other foreign currency transactions resulting in realized and unrealized gain (loss) are disclosed separately.
Annual Report
3. Significant Accounting Policies - continued
Investment Transactions and Income. For financial reporting purposes, the Fund's investment holdings and NAV include trades executed through the end of the last business day of the period. The NAV for processing shareholder transactions includes trades executed through the end of the prior business day. Gains and losses on securities sold are determined on the basis of identified cost and may include proceeds received from litigation. Dividend income is recorded on the ex-dividend date, except for certain dividends from foreign securities where the ex-dividend date may have passed, which are recorded as soon as the Fund is informed of the ex-dividend date. Non-cash dividends included in dividend income, if any, are recorded at the fair market value of the securities received. Distributions received on securities that represent a return of capital or capital gain are recorded as a reduction of cost of investments and/or as a realized gain. The Fund estimates the components of distributions received that may be considered return of capital distributions or capital gain distributions. Interest income and distributions from the Fidelity Central Funds are accrued as earned. Interest income includes coupon interest and amortization of premium and accretion of discount on debt securities. Investment income is recorded net of foreign taxes withheld where recovery of such taxes is uncertain.
Expenses. Most expenses of the trust can be directly attributed to a fund. Expenses which cannot be directly attributed are apportioned among each Fund in the trust. Expense estimates are accrued in the period to which they relate and adjustments are made when actual amounts are known.
Income Tax Information and Distributions to Shareholders. Each year, the Fund intends to qualify as a regulated investment company by distributing all of its taxable income and realized gains under Subchapter M of the Internal Revenue Code. As a result, no provision for income taxes is required in the accompanying financial statements. Foreign taxes are provided for based on the Fund's understanding of the tax rules and rates that exist in the foreign markets in which it invests.
Distributions are recorded on the ex-dividend date. Income dividends and capital gain distributions are declared separately for each class. Income and capital gain distributions are determined in accordance with income tax regulations, which may differ from generally accepted accounting principles. In addition, the Fund will claim a portion of the payment made to redeeming shareholders as a distribution for income tax purposes.
Capital accounts within the financial statements are adjusted for permanent book-tax differences. Certain adjustments have been made to the accounts relating to prior periods. Collectively, these adjustments have no impact on net assets or the results of operations. Temporary book-tax differences will reverse in a subsequent period.
Book-tax differences are primarily due to foreign currency transactions, passive foreign investment companies (PFIC), market discount, deferred trustees compensation, and losses deferred due to wash sales.
The tax-basis components of distributable earnings and the federal tax cost as of period end were as follows:
Unrealized appreciation | $ 1,850,820,017 | |
Unrealized depreciation | (19,377,264) | |
Net unrealized appreciation (depreciation) | 1,831,442,753 | |
Undistributed ordinary income | 67,424,056 | |
Undistributed long-term capital gain | 190,207,109 | |
| | |
Cost for federal income tax purposes | $ 3,192,837,536 | |
The tax character of distributions paid was as follows:
| October 31, 2007 | October 31, 2006 |
Ordinary Income | $ 44,702,026 | $ 7,894,925 |
Long-term Capital Gains | 44,063,418 | - |
Total | $ 88,765,444 | $ 7,894,925 |
Short-Term Trading (Redemption) Fees. Shares held in the Fund less than 90 days are subject to a redemption fee equal to 1.50% of the proceeds of the redeemed shares. All redemption fees, including any estimated redemption fees paid by FMR, are retained by the Fund and accounted for as an addition to paid in capital.
New Accounting Pronouncements. In July 2006, Financial Accounting Standards Board Interpretation No. 48, Accounting for Uncertainty in Income Taxes - an interpretation of FASB Statement 109 (FIN 48), was issued and is effective on the last business day of the semiannual reporting period for fiscal years beginning after December 15, 2006. FIN 48 sets forth a threshold for financial statement recognition, measurement and disclosure of a tax position taken or expected to be taken on a tax return. Management has concluded that the adoption of FIN 48 will not result in a material impact on the Fund's net assets, results of operations and financial statement disclosures.
Annual Report
Canada
Notes to Financial Statements - continued
3. Significant Accounting Policies - continued
New Accounting Pronouncements - continued
In addition, in September 2006, Statement of Financial Accounting Standards No. 157, Fair Value Measurements (SFAS 157), was issued and is effective for fiscal years beginning after November 15, 2007. SFAS 157 defines fair value, establishes a framework for measuring fair value and expands disclosures about fair value measurements. Management is currently evaluating the impact the adoption of SFAS 157 will have on the Fund's financial statement disclosures.
4. Operating Policies.
Repurchase Agreements. FMR has received an Exemptive Order from the Securities and Exchange Commission (the SEC) which permits the Fund and other affiliated entities of FMR to transfer uninvested cash balances into joint trading accounts which are then invested in repurchase agreements. The Fund may also invest directly with institutions in repurchase agreements. Repurchase agreements are collateralized by government or non-government securities. Upon settlement date, collateral is held in segregated accounts with custodian banks and may be obtained in the event of a default of the counterparty. The Fund monitors, on a daily basis, the value of the collateral to ensure it is at least equal to the principal amount of the repurchase agreement (including accrued interest). In the event of a default by the counterparty, realization of the collateral proceeds could be delayed, during which time the value of the collateral may decline.
Restricted Securities. The Fund may invest in securities that are subject to legal or contractual restrictions on resale. These securities generally may be resold in transactions exempt from registration or to the public if the securities are registered. Disposal of these securities may involve time-consuming negotiations and expense, and prompt sale at an acceptable price may be difficult. Information regarding restricted securities is included at the end of the Fund's Schedule of Investments.
5. Purchases and Sales of Investments.
Purchases and sales of securities other than short-term securities, aggregated $1,761,898,540 and $1,447,644,407, respectively.
6. Fees and Other Transactions with Affiliates.
Management Fee. FMR and its affiliates provide the Fund with investment management related services for which the Fund pays a monthly management fee. The management fee is the sum of an individual fund fee rate that is based on an annual rate of .45% of the Fund's average net assets and a group fee rate that averaged .26% during the period. The group fee rate is based upon the average net assets of all the mutual funds advised by FMR. The group fee rate decreases as assets under management increase and increases as assets under management decrease. In addition, the management fee is subject to a performance adjustment (up to a maximum of ± .20% of the Fund's average net assets over a 36 month performance period). The upward or downward adjustment to the management fee is based on the relative investment performance of the retail class of the Fund, Canada as compared to an appropriate benchmark index. For the period, the total annual management fee rate, including the performance adjustment, was .69% of the Fund's average net assets.
Distribution and Service Plan. In accordance with Rule 12b-1 of the 1940 Act, the Fund has adopted separate Distribution and Service Plans for each class of shares. Certain classes pay Fidelity Distributors Corporation (FDC), an affiliate of FMR, separate Distribution and Service Fees, each of which is based on an annual percentage of each class' average net assets. In addition, FDC may pay financial intermediaries for selling shares of the Fund and providing shareholder support services. For the period, the Distribution and Service Fee rates and the total amounts paid to and retained by FDC were as follows:
| Distribution
Fee | Service
Fee | Paid to
FDC | Retained
by FDC |
Class A | -% | .25% | $ 5,970 | $ 482 |
Class T | .25% | .25% | 10,734 | - |
Class B | .75% | .25% | 9,698 | 7,368 |
Class C | .75% | .25% | 13,180 | 10,333 |
| | | $ 39,582 | $ 18,183 |
Sales Load. FDC receives a front-end sales charge of up to 5.75% for selling Class A shares, and 3.50% for selling Class T shares, some of which is paid to financial intermediaries for selling shares of the Fund. FDC receives the proceeds of contingent deferred sales charges levied on Class A, Class T, Class B, and Class C redemptions. These charges depend on the holding period. The deferred sales charges range from 5% to 1% for Class B, 1% for Class C, 1.00% to .50% for certain purchases of Class A shares and .25% for certain purchases of Class T shares.
Annual Report
6. Fees and Other Transactions with Affiliates - continued
Sales Load - continued
For the period, sales charge amounts retained by FDC were as follows:
| Retained
by FDC |
Class A | $ 50,862 |
Class T | 9,963 |
Class B* | 37,782 |
Class C* | 1,134 |
| $ 99,741 |
* When Class B and Class C shares are initially sold, FDC pays commissions from its own resources to financial intermediaries through which the sales are made.
Transfer Agent Fees. Fidelity Investments Institutional Operations Company, Inc. (FIIOC), an affiliate of FMR, is the transfer, dividend disbursing and shareholder servicing agent for each class of the Fund, except for Canada. Fidelity Service Company, Inc. (FSC), an affiliate of FMR, is the transfer agent for Canada shares. FIIOC and FSC receive account fees and asset-based fees that vary according to the account size and type of account of the shareholders of the respective classes of the Fund. FIIOC and FSC pay for typesetting, printing and mailing of shareholder reports, except proxy statements. For the period, the total transfer agent fees paid by each class to FIIOC or FSC, were as follows:
| Amount | % of
Average
Net Assets |
Class A | $ 5,269 | .22 |
Class T | 4,782 | .22 |
Class B | 2,280 | .23 |
Class C | 3,048 | .23 |
Canada | 7,395,989 | .21 |
Institutional Class | 1,409 | .24 |
| $ 7,412,777 | |
Accounting and Security Lending Fees. FSC maintains the Fund's accounting records. The accounting fee is based on the level of average net assets for the month. Under a separate contract, FSC administers the security lending program. The security lending fee is based on the number and duration of lending transactions.
Brokerage Commissions. The Fund placed a portion of its portfolio transactions with brokerage firms which are affiliates of the investment adviser. The commissions paid to these affiliated firms were $308 for the period.
Interfund Lending Program. Pursuant to an Exemptive Order issued by the SEC, the Fund, along with other registered investment companies having management contracts with FMR, may participate in an interfund lending program. This program provides an alternative credit facility allowing the funds to borrow from, or lend money to, other participating affiliated funds. At period end, there were no interfund loans outstanding. The Fund's activity in this program during the period for which loans were outstanding was as follows:
Borrower or Lender | Average Daily
Loan Balance | Weighted
Average Interest
Rate | Interest Expense |
Borrower | $ 11,734,333 | 5.28% | $ 36,171 |
7. Committed Line of Credit.
The Fund participates with other funds managed by FMR in a $4.2 billion credit facility (the "line of credit") to be utilized for temporary or emergency purposes to fund shareholder redemptions or for other short-term liquidity purposes. The Fund has agreed to pay commitment fees on its pro rata portion of the line of credit, which amounted to $7,075 and is reflected in Miscellaneous Expense on the Statement of Operations. During the period, there were no borrowings on this line of credit.
8. Security Lending.
The Fund lends portfolio securities from time to time in order to earn additional income. On the settlement date of the loan, the Fund receives collateral (in the form of U.S. Treasury obligations, letters of credit and/or cash) against the loaned securities and maintains collateral in an amount not less than 100% of the market value of the loaned securities during the period of the loan. The market value of the loaned securities is determined at the close of business of the Fund and any additional required collateral is delivered to the Fund on the next business day. If the borrower defaults on its obligation to return the securities loaned because of insolvency or other reasons, a fund could experience delays and costs in recovering the securities
Annual Report
Canada
Notes to Financial Statements - continued
8. Security Lending - continued
loaned or in gaining access to the collateral. Any cash collateral received is invested in the Fidelity Securities Lending Cash Central Fund. The value of loaned securities and cash collateral at period end are disclosed on the Fund's Statement of Assets and Liabilities. Security lending income represents the income earned on investing cash collateral, less fees and expenses associated with the loan, plus any premium payments that may be received on the loan of certain types of securities. Security lending income is presented in the Statement of Operations as a component of income from Fidelity Central Funds.
9. Expense Reductions.
FMR voluntarily agreed to reimburse a portion of Canada's operating expenses. During the period, this reimbursement reduced Canada's expenses by $60,108.
Many of the brokers with whom FMR places trades on behalf of the Fund provided services to the Fund in addition to trade execution. These services included payments of certain expenses on behalf of the Fund totaling $472,386 for the period. In addition, through arrangements with the Fund's custodian and each class' transfer agent, credits realized as a result of uninvested cash balances were used to reduce the Fund's expenses. During the period, these credits reduced the Fund's custody expenses by $13,107. During the period, credits reduced each class' transfer agent expense as noted in the table below.
| Transfer Agent
expense reduction | |
Canada | $ 100,637 | |
10. Other.
The Fund's organizational documents provide former and current trustees and officers with a limited indemnification against liabilities arising in connection with the performance of their duties to the Fund. In the normal course of business, the Fund may also enter into contracts that provide general indemnifications. The Fund's maximum exposure under these arrangements is unknown as this would be dependent on future claims that may be made against the Fund. The risk of material loss from such claims is considered remote.
The United States Securities and Exchange Commission ("SEC") is conducting an investigation of FMR (covering the years 2002 to 2004) arising from gifts, gratuities and business entertainment provided by certain brokers to certain individuals who were employed on FMR's domestic equity trading desk during that period. FMR is in discussions with the SEC staff regarding the possible resolution of the matter, but as of period-end no final resolution has been reached.
In December 2006, the Independent Trustees completed their own investigation of the matter with the assistance of independent counsel. The Independent Trustees and FMR agree that, despite the absence of proof that the Fidelity mutual funds experienced diminished execution quality as a result of the improper receipt of gifts and business entertainment, the conduct at issue was serious and is worthy of redress. Accordingly, the Independent Trustees have requested and FMR has agreed to pay $42 million to Fidelity mutual funds, plus interest to be determined at the time that payment is made. A method of allocating this payment among the funds has not yet been determined. The total payment to the Fund is not anticipated to have a material impact on the Fund's net assets. In addition, FMR reimbursed related legal expenses which are recorded in the accompanying Statement of Operations as an expense reduction.
11. Distributions to Shareholders.
Distributions to shareholders of each class were as follows:
Years ended October 31, | 2007 | 2006 |
From net investment income | | |
Canada | $ 22,989,617 | $ 7,430,512 |
From net realized gain | | |
Canada | $ 65,775,827 | $ 464,413 |
Annual Report
12. Share Transactions.
Transactions for each class of shares were as follows:
| Shares A | Dollars A |
Years ended October 31, | 2007 | 2006 | 2007 | 2006 |
Class A | | | | |
Shares sold | 308,956 | - | $ 19,422,841 | $ - |
Shares redeemed | (10,905) | - | (645,019) | - |
Net increase (decrease) | 298,051 | - | $ 18,777,822 | $ - |
Class T | | | | |
Shares sold | 208,648 | - | $ 12,838,431 | $ - |
Shares redeemed | (1,454) | - | (89,047) | - |
Net increase (decrease) | 207,194 | - | $ 12,749,384 | $ - |
Classs B | | | | |
Shares sold | 110,050 | - | $ 6,654,427 | $ - |
Shares redeemed | (51,696) | - | (3,069,986) | - |
Net increase (decrease) | 58,354 | - | $ 3,584,441 | $ - |
Class C | | | | |
Shares sold | 134,518 | - | $ 8,317,609 | $ - |
Shares redeemed | (9,336) | - | (570,425) | - |
Net increase (decrease) | 125,182 | - | $ 7,747,184 | $ - |
Canada | | | | |
Shares sold | 32,853,429 | 39,925,341 | $ 1,882,759,894 | $ 1,811,356,216 |
Reinvestment of distributions | 1,757,370 | 181,418 | 85,654,201 | 7,617,749 |
Shares redeemed | (28,386,777) | (20,723,860) | (1,547,811,990) | (943,205,518) |
Net increase (decrease) | 6,224,022 | 19,382,899 | $ 420,602,105 | $ 875,768,447 |
Institutional Class | | | | |
Shares sold | 61,781 | - | $ 3,830,515 | $ - |
Shares redeemed | (3,937) | - | (234,902) | - |
Net increase (decrease) | 57,844 | - | $ 3,595,613 | $ - |
A Share transactions for Class A, Class T, Class B, Class C, and Institutional Class are for the period May 2, 2007 (commencement of sale of shares) to October 31, 2007.
Annual Report
Report of Independent Registered Public Accounting Firm
To the Trustees of Fidelity Investment Trust and the Shareholders of Fidelity Canada Fund:
In our opinion, the accompanying statement of assets and liabilities, including the schedule of investments, and the related statements of operations and of changes in net assets and the financial highlights present fairly, in all material respects, the financial position of Fidelity Canada Fund (a fund of Fidelity Investment Trust) at October 31, 2007, and the results of its operations for the year then ended, the changes in its net assets for each of the two years in the period then ended and the financial highlights for each of the periods then indicated, in conformity with accounting principles generally accepted in the United States of America. These financial statements and financial highlights (hereafter referred to as "financial statements") are the responsibility of the Fidelity Canada Fund's management. Our responsibility is to express an opinion on these financial statements based on our audits. We conducted our audits of these financial statements in accordance with the standards of the Public Company Accounting Oversight Board (United States). Those standards require that we plan and perform the audit to obtain reasonable assurance about whether the financial statements are free of material misstatement. An audit includes examining, on a test basis, evidence supporting the amounts and disclosures in the financial statements, assessing the accounting principles used and significant estimates made by management, and evaluating the overall financial statement presentation. We believe that our audits, which included confirmation of securities at October 31, 2007 by correspondence with the custodian and brokers, provide a reasonable basis for our opinion.
/s/ PricewaterhouseCoopers LLP
PricewaterhouseCoopers LLP
Boston, Massachusetts
December 20, 2007
Annual Report
Trustees and Officers
The Trustees, Members of the Advisory Board, and executive officers of the trust and fund, as applicable, are listed below. The Board of Trustees governs the fund and is responsible for protecting the interests of shareholders. The Trustees are experienced executives who meet periodically throughout the year to oversee the fund's activities, review contractual arrangements with companies that provide services to the fund, and review the fund's performance. Except for James C. Curvey, each of the Trustees oversees 370 funds advised by FMR or an affiliate. Mr. Curvey oversees 340 funds advised by FMR or an affiliate.
The Trustees hold office without limit in time except that (a) any Trustee may resign; (b) any Trustee may be removed by written instrument, signed by at least two-thirds of the number of Trustees prior to such removal; (c) any Trustee who requests to be retired or who has become incapacitated by illness or injury may be retired by written instrument signed by a majority of the other Trustees; and (d) any Trustee may be removed at any special meeting of shareholders by a two-thirds vote of the outstanding voting securities of the trust. Each Trustee who is not an interested person (as defined in the 1940 Act) (Independent Trustee), shall retire not later than the last day of the calendar year in which his or her 72nd birthday occurs. The Independent Trustees may waive this mandatory retirement age policy with respect to individual Trustees. The executive officers and Advisory Board Members hold office without limit in time, except that any officer and Advisory Board Member may resign or may be removed by a vote of a majority of the Trustees at any regular meeting or any special meeting of the Trustees. Except as indicated, each individual has held the office shown or other offices in the same company for the past five years.
The fund's Statement of Additional Information (SAI) includes more information about the Trustees. To request a free copy, call Fidelity at 1-877-208-0098.
Interested Trustees*:
Correspondence intended for each Trustee who is an interested person may be sent to Fidelity Investments, 82 Devonshire Street, Boston, Massachusetts 02109.
Name, Age; Principal Occupation |
Edward C. Johnson 3d (77) |
| Year of Election or Appointment: 1984 Mr. Johnson is Chairman of the Board of Trustees. Mr. Johnson serves as President (2006-present), Chief Executive Officer, Chairman, and a Director of FMR LLC; Chairman and a Director of FMR; Chairman and a Director of Fidelity Research & Analysis Company (FRAC); Chairman and a Director of Fidelity Investments Money Management, Inc.; and Chairman (2001-present) and a Director of FMR Co., Inc. In addition, Mr. Johnson serves as Chairman and Director of Fidelity International Limited (FIL). |
James C. Curvey (72) |
| Year of Election or Appointment: 2007 Mr. Curvey also serves as Trustee (2007-present) or Member of the Advisory Board (2007-present) of other investment companies advised by FMR. Mr. Curvey is a Director of FMR and FMR Co., Inc. (2007-present). Mr. Curvey is also Vice Chairman (2006-present) and Director of FMR LLC. Mr. Curvey joined Fidelity in 1982 and served in numerous senior management positions, including President and Chief Operating Officer of FMR LLC (1997-2000) and President of Fidelity Strategic Investments (2000-2002). In addition, he serves as a member of the Board of Directors of Geerlings & Wade, Inc. (wine distribution). |
* Trustees have been determined to be "Interested Trustees" by virtue of, among other things, their affiliation with the trust or various entities under common control with FMR. FMR Corp. merged with FMR LLC on October 1, 2007. Any references to FMR LLC for prior periods are deemed to be references to the prior entity.
Independent Trustees:
Correspondence intended for each Independent Trustee (that is, the Trustees other than the Interested Trustees) may be sent to Fidelity Investments, P.O. Box 55235, Boston, Massachusetts 02205-5235.
Name, Age; Principal Occupation |
Dennis J. Dirks (59) |
| Year of Election or Appointment: 2005 Prior to his retirement in May 2003, Mr. Dirks was Chief Operating Officer and a member of the Board of The Depository Trust & Clearing Corporation (DTCC) (1999-2003). He also served as President, Chief Operating Officer, and Board member of The Depository Trust Company (DTC) (1999-2003) and President and Board member of the National Securities Clearing Corporation (NSCC) (1999-2003). In addition, Mr. Dirks served as Chief Executive Officer and Board member of the Government Securities Clearing Corporation (2001-2003) and Chief Executive Officer and Board member of the Mortgage-Backed Securities Clearing Corporation (2001-2003). Mr. Dirks also serves as a Trustee and a member of the Finance Committee of Manhattan College (2005-present) and a Trustee and a member of the Finance Committee of AHRC of Nassau County (2006-present). |
Albert R. Gamper, Jr. (65) |
| Year of Election or Appointment: 2006 Prior to his retirement in December 2004, Mr. Gamper served as Chairman of the Board of CIT Group Inc. (commercial finance). During his tenure with CIT Group Inc. Mr. Gamper served in numerous senior management positions, including Chairman (1987-1989; 1999-2001; 2002-2004), Chief Executive Officer (1987-2004), and President (1989-2002). He currently serves as a member of the Board of Directors of Public Service Enterprise Group (utilities, 2001-present), Chairman of the Board of Governors, Rutgers University (2004-present), and Chairman of the Board of Saint Barnabas Health Care System. |
George H. Heilmeier (71) |
| Year of Election or Appointment: 2004 Dr. Heilmeier is Chairman Emeritus of Telcordia Technologies (communication software and systems), where prior to his retirement, he served as company Chairman and Chief Executive Officer. He currently serves on the Boards of Directors of The Mitre Corporation (systems engineering and information technology support for the government), and HRL Laboratories (private research and development, 2004-present). He is Chairman of the General Motors Science & Technology Advisory Board and a Life Fellow of the Institute of Electrical and Electronics Engineers (IEEE). Dr. Heilmeier is a member of the Defense Science Board and the National Security Agency Advisory Board. He is also a member of the National Academy of Engineering, the American Academy of Arts and Sciences, and the Board of Overseers of the School of Engineering and Applied Science of the University of Pennsylvania. Previously, Dr. Heilmeier served as a Director of TRW Inc. (automotive, space, defense, and information technology, 1992-2002), Compaq (1994-2002), Automatic Data Processing, Inc. (ADP) (technology-based business outsourcing, 1995-2002), INET Technologies Inc. (telecommunications network surveillance, 2001-2004), and Teletech Holdings (customer management services). He is the recipient of the 2005 Kyoto Prize in Advanced Technology for his invention of the liquid crystal display, and a member of the Consumer Electronics Hall of Fame. |
James H. Keyes (67) |
| Year of Election or Appointment: 2007 Prior to his retirement in 2003, Mr. Keyes was Chairman, President, and Chief Executive Officer of Johnson Controls, Inc. (automotive supplier, 1993-2003). He currently serves as a member of the boards of LSI Logic Corporation (semiconductor technologies), Navistar International Corporation (manufacture and sale of trucks, buses, and diesel engines, 2002-present), and Pitney Bowes, Inc. (integrated mail, messaging, and document management solutions). |
Marie L. Knowles (61) |
| Year of Election or Appointment: 2001 Prior to Ms. Knowles' retirement in June 2000, she served as Executive Vice President and Chief Financial Officer of Atlantic Richfield Company (ARCO) (diversified energy, 1996-2000). From 1993 to 1996, she was a Senior Vice President of ARCO and President of ARCO Transportation Company. She served as a Director of ARCO from 1996 to 1998. She currently serves as a Director of Phelps Dodge Corporation (copper mining and manufacturing) and McKesson Corporation (healthcare service, 2002-present). Ms. Knowles is a Trustee of the Brookings Institution and the Catalina Island Conservancy and also serves as a member of the Advisory Board for the School of Engineering of the University of Southern California. |
Ned C. Lautenbach (63) |
| Year of Election or Appointment: 2000 Mr. Lautenbach is Chairman of the Independent Trustees (2006-present). Mr. Lautenbach has been a partner of Clayton, Dubilier & Rice, Inc. (private equity investment firm) since September 1998. Previously, Mr. Lautenbach was with the International Business Machines Corporation (IBM) from 1968 until his retirement in 1998. Mr. Lautenbach serves as a Director of Sony Corporation (2006-present) and Eaton Corporation (diversified industrial) as well as the Philharmonic Center for the Arts in Naples, Florida. He also is a member of the Board of Trustees of Fairfield University (2005-present), as well as a member of the Council on Foreign Relations. |
Cornelia M. Small (63) |
| Year of Election or Appointment: 2005 Ms. Small is a member (2000-present) and Chairperson (2002-present) of the Investment Committee, and a member (2002-present) of the Board of Trustees of Smith College. Previously, she served as Chief Investment Officer (1999-2000), Director of Global Equity Investments (1996-1999), and a member of the Board of Directors of Scudder, Stevens & Clark (1990-1997) and Scudder Kemper Investments (1997-1999). In addition, Ms. Small served as Co-Chair (2000-2003) of the Annual Fund for the Fletcher School of Law and Diplomacy. |
William S. Stavropoulos (68) |
| Year of Election or Appointment: 2001 Mr. Stavropoulos is Chairman Emeritus of the Board of Directors of The Dow Chemical Company. Since joining The Dow Chemical Company in 1967, Mr. Stavropoulos served in numerous senior management positions, including President (1993-2000; 2002-2003), CEO (1995-2000; 2002-2004), and Chairman of the Executive Committee (2000-2004). Currently, he is a Director of NCR Corporation (data warehousing and technology solutions), Chemical Financial Corporation, Maersk Inc. (industrial conglomerate, 2002-present), Tyco International, Inc. (multinational manufacturing and services, 2007-present), and a member of the Advisory Board for Metalmark Capital (private equity investment firm, 2005-present). He is a special advisor to Clayton, Dubilier & Rice, Inc., a private equity investment firm. He also serves as a member of the Board of Trustees of the American Enterprise Institute for Public Policy Research. In addition, Mr. Stavropoulos is a member of The Business Council, J.P. Morgan International Council and the University of Notre Dame Advisory Council for the College of Science. |
Kenneth L. Wolfe (68) |
| Year of Election or Appointment: 2005 Prior to his retirement in 2001, Mr. Wolfe was Chairman and Chief Executive Officer of Hershey Foods Corporation (1993-2001). He currently serves as a member of the boards of Adelphia Communications Corporation (2003-present), Bausch & Lomb, Inc., and Revlon Inc. (2004-present). |
Advisory Board Members and Executive Officers**:
Correspondence intended for Mr. Mauriello, Mr. Thomas, and Mr. Wiley may be sent to Fidelity Investments, P.O. Box 55235, Boston, Massachusetts 02205-5235. Correspondence intended for each executive officer and Mr. Lynch may be sent to Fidelity Investments, 82 Devonshire Street, Boston, Massachusetts 02109.
Name, Age; Principal Occupation |
Peter S. Lynch (63) |
| Year of Election or Appointment: 2003 Member of the Advisory Board of Fidelity Investment Trust. Mr. Lynch is Vice Chairman and a Director of FMR, and Vice Chairman (2001-present) and a Director of FMR Co., Inc. Previously, Mr. Lynch served as a Trustee of the Fidelity funds (1990-2003). In addition, he serves as a Trustee of Boston College and as the Chairman of the Inner-City Scholarship Fund. |
Joseph Mauriello (63) |
| Year of Election or Appointment: 2007 Member of the Advisory Board of Fidelity Investment Trust. Prior to his retirement in January 2006, Mr. Mauriello served in numerous senior management positions including Deputy Chairman and Chief Operating Officer (2004-2005), and Vice Chairman of Financial Services (2002-2004) of KPMG LLP US (professional services firm, 1965-2005). Mr. Mauriello currently serves as a member of the Board of Directors of XL Capital Ltd., (global insurance and re-insurance company, 2006-present) and of Arcadia Resources Inc., (health care services and products, 2007-present). He also served as a Director of the Hamilton Funds of the Bank of New York (2006-2007). |
David M. Thomas (58) |
| Year of Election or Appointment: 2007 Member of the Advisory Board of Fidelity Investment Trust. Previously, Mr. Thomas served as Executive Chairman (2005-2006) and Chairman and Chief Executive Officer (2000-2005) of IMS Health, Inc. (pharmaceutical and healthcare information solutions). In addition, Mr. Thomas serves as a member of the Board of Directors of Fortune Brands, Inc. (consumer products holding company), and Interpublic Group of Companies, Inc. (marketing communication, 2004-present). |
Michael E. Wiley (57) |
| Year of Election or Appointment: 2007 Member of the Advisory Board of Fidelity Investment Trust. Mr. Wiley also serves as Sr. Energy Advisor of Katzenbach Partners, LLC (consulting firm, 2006-present) and a member of the Board of Trustees of the University of Tulsa (2000-2006; 2007-present). He serves as a Director of Tesoro Corporation (independent oil refiner and marketer, 2005-present), and a Director of Bill Barrett Corporation (exploration and production company, 2005-present). In addition, he also serves as a Director of Post Oak Bank (privately-held bank, 2004-present), and an Advisory Director of Riverstone Holdings (private investment firm). Previously, Mr. Wiley served as Chairman, President, and CEO of Baker Hughes, Inc. (oilfield services company, 2000-2004), and as Director of Spinnaker Exploration Company (exploration and production company, 2001-2005). |
Kimberley H. Monasterio (43) |
| Year of Election or Appointment: 2007 President and Treasurer of the fund. Ms. Monasterio also serves as President and Treasurer of other Fidelity funds (2007-present) and is an employee of FMR (2004-present). Previously, Ms. Monasterio served as Deputy Treasurer of the Fidelity funds (2004-2006). Before joining Fidelity Investments, Ms. Monasterio served as Treasurer (2000-2004) and Chief Financial Officer (2002-2004) of the Franklin Templeton Funds and Senior Vice President of Franklin Templeton Services, LLC (2000-2004). |
Walter C. Donovan (45) |
| Year of Election or Appointment: 2007 Vice President of the fund. Mr. Donovan also serves as Vice President of Fidelity's Equity Funds (2007-present). Mr. Donovan also serves as Executive Vice President of FMR (2005-present) and FMR Co., Inc. (2005-present). Previously, Mr. Donovan served as Vice President of Fidelity's High Income Funds (2005-2007), Fixed-Income Funds (2005-2006), certain Asset Allocation Funds (2005-2006), certain Balanced Funds (2005-2006), and as Vice President and Director of Fidelity's International Equity Trading group (1998-2005). |
Eric M. Wetlaufer (45) |
| Year of Election or Appointment: 2006 Vice President of the fund. Mr. Wetlaufer also serves as Vice President of certain International Equity Funds (2006-present). Mr. Wetlaufer is Senior Vice President of FMR (2006-present) and FMR Co., Inc. (2006-present), and President and Director of Fidelity Management & Research (U.K.) Inc. (2006-present) and Fidelity Research & Analysis Company (2006-present). Before joining Fidelity Investments in 2005, Mr. Wetlaufer was a partner in Oxhead Capital Management (2004-2005). Previously, Mr. Wetlaufer served as a Chief Investment Officer of Putnam Investments (1997-2003). |
Eric D. Roiter (58) |
| Year of Election or Appointment: 1998 Secretary of the fund. He also serves as Secretary of other Fidelity funds; Vice President, General Counsel, and Secretary of FMR Co., Inc. (2001-present) and FMR; Assistant Secretary of Fidelity Management & Research (U.K.) Inc. (2001-present), Fidelity Research & Analysis Company (2001-present), and Fidelity Investments Money Management, Inc. (2001-present). Mr. Roiter is an Adjunct Member, Faculty of Law, at Boston College Law School (2003-present). Previously, Mr. Roiter served as Vice President and Secretary of Fidelity Distributors Corporation (FDC) (1998-2005). |
Scott C. Goebel (39) |
| Year of Election or Appointment: 2007 Assistant Secretary of the fund. Mr. Goebel also serves as Assistant Secretary of other Fidelity funds (2007-present), and is an employee of FMR. |
R. Stephen Ganis (41) |
| Year of Election or Appointment: 2006 Anti-Money Laundering (AML) officer of the fund. Mr. Ganis also serves as AML officer of other Fidelity funds (2006-present) and FMR LLC (2003-present). Before joining Fidelity Investments, Mr. Ganis practiced law at Goodwin Procter, LLP (2000-2002). |
Joseph B. Hollis (59) |
| Year of Election or Appointment: 2006 Chief Financial Officer of the fund. Mr. Hollis also serves as Chief Financial Officer of other Fidelity funds. Mr. Hollis is President of Fidelity Pricing and Cash Management Services (FPCMS) (2005-present). Mr. Hollis also serves as President and Director of Fidelity Service Company, Inc. (2006-present). Previously, Mr. Hollis served as Senior Vice President of Cash Management Services (1999-2002) and Investment Management Operations (2002-2005). |
Kenneth A. Rathgeber (60) |
| Year of Election or Appointment: 2004 Chief Compliance Officer of the fund. Mr. Rathgeber also serves as Chief Compliance Officer of other Fidelity funds (2004-present) and Executive Vice President of Risk Oversight for Fidelity Investments (2002-present). He is Chief Compliance Officer of FMR (2005-present), FMR Co., Inc. (2005-present), Fidelity Management & Research (U.K.) Inc. (2005-present), Fidelity Research & Analysis Company (2005-present), Fidelity Investments Money Management, Inc. (2005-present), and Strategic Advisers, Inc. (2005-present). Previously, Mr. Rathgeber served as Executive Vice President and Chief Operating Officer for Fidelity Investments Institutional Services Company, Inc. (1998-2002). |
Bryan A. Mehrmann (46) |
| Year of Election or Appointment: 2005 Deputy Treasurer of the fund. Mr. Mehrmann also serves as Deputy Treasurer of other Fidelity funds (2005-present) and is an employee of FMR. Previously, Mr. Mehrmann served as Vice President of Fidelity Investments Institutional Services Group (FIIS)/Fidelity Investments Institutional Operations Corporation, Inc. (FIIOC) Client Services (1998-2004). |
Kenneth B. Robins (38) |
| Year of Election or Appointment: 2005 Deputy Treasurer of the fund. Mr. Robins also serves as Deputy Treasurer of other Fidelity funds (2005-present) and is an employee of FMR (2004-present). Before joining Fidelity Investments, Mr. Robins worked at KPMG LLP, where he was a partner in KPMG's department of professional practice (2002-2004) and a Senior Manager (1999-2000). In addition, Mr. Robins served as Assistant Chief Accountant, United States Securities and Exchange Commission (2000-2002). |
Robert G. Byrnes (40) |
| Year of Election or Appointment: 2005 Assistant Treasurer of the fund. Mr. Byrnes also serves as Assistant Treasurer of other Fidelity funds (2005-present) and is an employee of FMR (2005-present). Previously, Mr. Byrnes served as Vice President of FPCMS (2003-2005). Before joining Fidelity Investments, Mr. Byrnes worked at Deutsche Asset Management where he served as Vice President of the Investment Operations Group (2000-2003). |
Peter L. Lydecker (53) |
| Year of Election or Appointment: 2004 Assistant Treasurer of the fund. Mr. Lydecker also serves as Assistant Treasurer of other Fidelity funds (2004) and is an employee of FMR. |
Paul M. Murphy (60) |
| Year of Election or Appointment: 2007 Assistant Treasurer of the fund. Mr. Murphy also serves as Assistant Treasurer of other Fidelity funds (2007-present) and is an employee of FMR (2007-present). Previously, Mr. Murphy served as Chief Financial Officer of the Fidelity Funds (2005-2006), Vice President and Associate General Counsel of FMR (2007), and Senior Vice President of Fidelity Pricing and Cash Management Services Group (FPCMS) (1994-2007). |
Gary W. Ryan (49) |
| Year of Election or Appointment: 2005 Assistant Treasurer of the fund. Mr. Ryan also serves as Assistant Treasurer of other Fidelity funds (2005-present) and is an employee of FMR (2005-present). Previously, Mr. Ryan served as Vice President of Fund Reporting in FPCMS (1999-2005). |
** FMR Corp. merged with FMR LLC on October 1, 2007. Any references to FMR LLC for prior periods are deemed to be references to the prior entity.
Annual Report
Distributions
The Board of Trustees of Advisor Canada Fund voted to pay to shareholders of record at the opening of business on record date, the following distributions per share derived from capital gains realized from sales of portfolio securities, and dividends derived from net investment income:
| Pay Date | Record Date | Dividends | Capital Gains |
Institutional Class | 12/10/07 | 12/07/07 | $0.45 | $3.27 |
The fund hereby designates as a capital gain dividend with respect to the taxable year ended October 31, 2007, $190,207,109, or, if subsequently determined to be different, the net capital gain of such year.
The fund will notify shareholders in January 2008 of amounts for use in preparing 2007 income tax returns.
Annual Report
Board Approval of Investment Advisory Contracts and Management Fees
Fidelity Canada
Each year, typically in July, the Board of Trustees, including the Independent Trustees (together, the Board), votes on the renewal of the management contract and sub-advisory agreements (together, the Advisory Contracts) for the fund. The Board, assisted by the advice of fund counsel and Independent Trustees' counsel, requests and considers a broad range of information throughout the year.
The Board meets regularly each month except August and takes into account throughout the year matters bearing on Advisory Contracts. The Board, acting directly and through its separate committees, considers at each of its meetings factors that are relevant to the annual renewal of the fund's Advisory Contracts, including the services and support provided to the fund and its shareholders. At the time of the renewal, the Board had 12 standing committees, each composed of Independent Trustees with varying backgrounds, to which the Board has assigned specific subject matter responsibilities in order to enhance effective decision-making by the Board. Each committee has adopted a written charter outlining the structure and purposes of the committee. One such committee, the Equity Contract Committee, meets periodically as needed throughout the year to consider matters specifically related to the annual renewal of Advisory Contracts. The committee requests and receives information on, and makes recommendations to the Independent Trustees concerning, the approval and annual review of the Advisory Contracts.
At its July 2007 meeting, the Board of Trustees, including the Independent Trustees, unanimously determined to renew the Advisory Contracts for the fund. In reaching its determination, the Board considered all factors it believed relevant, including (i) the nature, extent, and quality of the services to be provided to the fund and its shareholders (including the investment performance of the fund); (ii) the competitiveness of the management fee and total expenses of the fund; (iii) the total costs of the services to be provided by and the profits to be realized by the investment adviser and its affiliates from the relationship with the fund; (iv) the extent to which economies of scale would be realized as the fund grows; and (v) whether fee levels reflect these economies of scale, if any, for the benefit of fund shareholders. The Board also approved amendments to the fund's agreements with foreign sub-advisers to clarify that each sub-adviser provides services as an independent contractor.
In determining whether to renew the Advisory Contracts for the fund, the Board ultimately reached a determination, with the assistance of fund counsel and Independent Trustees' counsel, that the renewal of the Advisory Contracts and the compensation to be received by Fidelity under the management contract is consistent with Fidelity's fiduciary duty under applicable law. In addition to evaluating the specific factors noted above, the Board, in reaching its determination, is aware that shareholders in the fund have a broad range of investment choices available to them, including a wide choice among mutual funds offered by competitors to Fidelity, and that the fund's shareholders, with the opportunity to review and weigh the disclosure provided by the fund in its prospectus and other public disclosures, have chosen to invest in this fund, managed by Fidelity.
Nature, Extent, and Quality of Services Provided. The Board considered staffing within the investment adviser, FMR, and the sub-advisers (together, the Investment Advisers), including the background of the fund's portfolio manager and the fund's investment objective and discipline. The Independent Trustees also had discussions with senior management of Fidelity's investment operations and investment groups. The Board considered the structure of the portfolio manager compensation program and whether this structure provides appropriate incentives.
Resources Dedicated to Investment Management and Support Services. The Board reviewed the size, education, and experience of the Investment Advisers' investment staff, their use of technology, and the Investment Advisers' approach to recruiting, training, and retaining portfolio managers and other research, advisory, and management personnel. The Board considered Fidelity's extensive global research capabilities that enable the Investment Advisers to aggregate data from various sources in an effort to produce positive investment results. The Board noted that Fidelity's analysts have access to a variety of technological tools that enable them to perform both fundamental and quantitative analysis and to specialize in various disciplines. The Board also considered that Fidelity's portfolio managers and analysts have access to daily portfolio attribution that allows for monitoring of a fund's portfolio, as well as an electronic communication system that provides immediate real-time access to research concerning issuers and credit enhancers.
Shareholder and Administrative Services. The Board considered (i) the nature, extent, quality, and cost of advisory, administrative, distribution, and shareholder services performed by the Investment Advisers and their affiliates under the Advisory Contracts and under separate agreements covering transfer agency, pricing and bookkeeping, and securities lending services for the fund; (ii) the nature and extent of the Investment Advisers' supervision of third party service providers, principally custodians and subcustodians; and (iii) the resources devoted to, and the record of compliance with, the fund's compliance policies and procedures. The Board reviewed the allocation of fund brokerage, including allocations to brokers affiliated with the Investment Advisers, the use of brokerage commissions to pay fund expenses, and the use of "soft" commission dollars to pay for research services. The Board also considered that Fidelity voluntarily pays for market data out of its own resources. The Board also considered the agreement reached between the Independent Trustees and Fidelity in December 2006 following an independent review of matters relating to receipt of travel, entertainment, gifts and gratuities in violation of Fidelity policies.
The Board noted that the growth of fund assets across the complex allows Fidelity to reinvest in the development of services designed to enhance the value or convenience of the Fidelity funds as investment vehicles. These services include 24-hour access to account information and market information through phone representatives and over the Internet, and investor education materials and asset allocation tools.
Annual Report
Board Approval of Investment Advisory Contracts and Management Fees - continued
Investment in a Large Fund Family. The Board considered the benefits to shareholders of investing in a Fidelity fund, including the benefits of investing in a fund that is part of a large family of funds offering a variety of investment disciplines and providing for a large variety of mutual fund investor services. For example, fund shareholders are offered the privilege of exchanging shares of the fund for shares of other Fidelity funds, as set forth in the fund's prospectus, without paying a sales charge. The Board noted that, since the last Advisory Contract renewals in July 2006, Fidelity has taken a number of actions that benefited particular funds, including (i) dedicating additional resources to investment research and to restructure the investment research teams; (ii) contractually agreeing to reduce the management fee on Fidelity Advisor Floating Rate High Income Fund; (iii) contractually agreeing to reduce the management fees on Fidelity's California, Massachusetts, New Jersey, and New York AMT Tax-Free Money Market Funds, launching new Institutional Classes and Service Classes of these funds, and contractually agreeing to impose expense limitations on these funds; (iv) eliminating the exchange fee on the Fidelity Select Portfolios and reducing the pricing and bookkeeping fee rates for these funds; (v) reducing the maximum transfer agency fee rates on high income funds and certain equity funds; (vi) proposing amended management contracts that, if approved by shareholders, will add a performance adjustment component to the management fees paid by 18 Fidelity Advisor equity funds; (vii) contractually agreeing to reduce fees for Ultra-Short Central Fund and the money market Central Funds; (viii) waiving the Fidelity Advisor funds' contingent deferred sales charge on certain redemptions made through systematic withdrawal programs; and (ix) amending the management contracts for equity and fixed-income funds whose management contracts incorporate a "group fee" structure by adding four new fee "breakpoints" to the group fee rate schedules.
Investment Performance and Compliance. The Board considered whether the fund has operated within its investment objective, as well as its record of compliance with its investment restrictions. It also reviewed the fund's absolute investment performance, as well as the fund's relative investment performance measured against a broad-based securities market index over multiple periods. The Board noted that FMR does not believe that a meaningful peer group exists against which to compare the fund's performance. The following charts considered by the Board show, over the one-, three-, and five-year periods ended December 31, 2006, the fund's cumulative total returns and the cumulative total returns of a broad-based securities market index ("benchmark"). (Canada Fund did not offer Advisor classes as of December 31, 2006.)
Fidelity Canada Fund
The Board stated that the relative investment performance of the fund was lower than its benchmark for the one- and three-year periods, although the fund's five-year cumulative total return compared favorably to its benchmark. The Board discussed with FMR actions to be taken by FMR to improve the fund's below-benchmark performance.
The Board also considered that the fund's management fee is subject to upward or downward adjustment depending upon whether, and to what extent, the fund's investment performance for the performance period exceeds, or is exceeded by, the record (over the same period) of a Board-approved performance adjustment index. The Board realizes that the performance adjustment provides FMR with a strong economic incentive to seek to achieve superior performance for the fund's shareholders and helps to more closely align the interests of FMR and the fund's shareholders.
The Board considered that FMR has taken steps to refocus and strengthen equity research, equity portfolio management, and compliance.
Based on its review, and giving particular weight to the nature and quality of the resources dedicated by the Investment Advisers to maintain and improve relative performance, the Board concluded that the nature, extent, and quality of the services provided to the fund will benefit the fund's shareholders, particularly in light of the Board's view that the fund's shareholders benefit from investing in a fund that is part of a large family of funds offering a variety of investment disciplines and services.
Annual Report
Competitiveness of Management Fee and Total Fund Expenses. The Board considered the fund's management fee and total expenses compared to "mapped groups" of competitive funds and classes. Fidelity creates "mapped groups" by combining similar Lipper investment objective categories that have comparable management fee characteristics. Combining Lipper investment objective categories aids the Board's management fee and total expense comparisons by broadening the competitive group used for comparison and by reducing the number of universes to which various Fidelity funds are compared. The Board also considered supplemental information about how the fund's management fee and total expenses ranked relative to groups based on Lipper classifications, which take into account a fund's market capitalization and style.
The Board considered two proprietary management fee comparisons for the 12-month periods shown in the chart below. The group of Lipper funds used by the Board for management fee comparisons is referred to below as the "Total Mapped Group." The Total Mapped Group comparison focuses on a fund's standing relative to the total universe of comparable funds available to investors, in terms of gross management fees before expense reimbursements or caps, and without giving effect to the fund's performance adjustment. "TMG %" represents the percentage of funds in the Total Mapped Group that had management fees that were lower than the fund's. For example, a TMG % of 13% means that 87% of the funds in the Total Mapped Group had higher management fees than the fund. The "Asset-Size Peer Group" (ASPG) comparison focuses on a fund's standing relative to non-Fidelity funds similar in size to the fund within the Total Mapped Group. The ASPG represents at least 15% of the funds in the Total Mapped Group with comparable asset size and management fee characteristics, subject to a minimum of 50 funds (or all funds in the Total Mapped Group if fewer than 50). Additional information, such as the ASPG quartile in which the fund's management fee ranked and the impact of the fund's performance adjustment, is also included in the chart and considered by the Board.
Fidelity Canada Fund

The Board noted that the fund's management fee ranked below the median of its Total Mapped Group and below the median of its ASPG for 2006. The Board also noted the effect of the fund's negative performance adjustment on the fund's management fee ranking. The Board noted that the performance adjustment for each year represents calculations for performance periods that differ from the periods shown in the performance charts above.
In connection with the renewal of the fund's management contract, the Board also approved non-material amendments to the fund's management contract to clarify certain provisions regarding the calculation of the fund's performance adjustment.
Based on its review, the Board concluded that the fund's management fee was fair and reasonable in light of the services that the fund receives and the other factors considered.
In its review of the fund's total expenses, the Board considered the fund's management fee as well as other fund expenses, such as transfer agent fees, pricing and bookkeeping fees, and custodial, legal, and audit fees. The Board also noted the effects of any waivers and reimbursements on fees and expenses, as well as the fund's negative performance adjustment. As part of its review, the Board also considered current and historical total expenses of the fund compared to competitive fund median expenses. The fund is compared to those funds and classes in the Total Mapped Group (used by the Board for management fee comparisons) that have a similar sales load structure.
The Board noted that the fund's total expenses ranked below its competitive median for 2006.
Annual Report
Board Approval of Investment Advisory Contracts and Management Fees - continued
In its review of total expenses, the Board also considered Fidelity fee structures and other information on clients that FMR and its affiliates service in other competitive markets, such as other mutual funds advised or subadvised by FMR or its affiliates, pension plan clients, and other institutional clients.
Based on its review, the Board concluded that the fund's total expenses were reasonable in light of the services that the fund and its shareholders receive and the other factors considered.
Costs of the Services and Profitability. The Board considered the revenues earned and the expenses incurred by Fidelity in conducting the business of developing, marketing, distributing, managing, administering and servicing the fund and its shareholders. The Board also considered the level of Fidelity's profits in respect of all the Fidelity funds.
On an annual basis, FMR presents to the Board Fidelity's profitability for the fund. Fidelity calculates the profitability for each fund, as well as aggregate profitability for groups of Fidelity funds and all Fidelity funds, using a series of detailed revenue and cost allocation methodologies which originate with the audited books and records of Fidelity. The Audit Committee of the Board reviews any significant changes from the prior year's methodologies.
PricewaterhouseCoopers LLP (PwC), independent registered public accounting firm and auditor to Fidelity and certain Fidelity funds, has been engaged annually by the Board as part of the Board's assessment of the results of Fidelity's profitability analysis. PwC's engagement includes the review and assessment of Fidelity's methodologies used in determining the revenues and expenses attributable to Fidelity's mutual fund business, and completion of agreed-upon procedures surrounding the mathematical accuracy of fund profitability and its conformity to allocation methodologies. After considering PwC's reports issued under the engagement and information provided by Fidelity, the Board believes that while other allocation methods may also be reasonable, Fidelity's profitability methodologies are reasonable in all material respects.
The Board has also reviewed Fidelity's non-fund businesses and any fall-out benefits related to the mutual fund business as well as cases where Fidelity's affiliates may benefit from or be related to the fund's business.
The Board considered the costs of the services provided by and the profits realized by Fidelity in connection with the operation of the fund and determined that the amount of profit is a fair entrepreneurial profit for the management of the fund.
Economies of Scale. The Board considered whether there have been economies of scale in respect of the management of the Fidelity funds, whether the Fidelity funds (including the fund) have appropriately benefited from any such economies of scale, and whether there is potential for realization of any further economies of scale. The Board considered the extent to which the fund will benefit from economies of scale through increased services to the fund, through waivers or reimbursements, or through fee or expense reductions, including reductions that occur through operation of the transfer agent agreement. The transfer agent fee varies in part based on the number of accounts in the fund. If the number of accounts decreases or the average account size increases, the overall transfer agent fee rate decreases.
The Board recognized that the fund's management contract incorporates a "group fee" structure, which provides for lower group fee rates as total fund assets under FMR's management increase, and for higher group fee rates as total fund assets under FMR's management decrease. FMR determines the group fee rates based on a tiered asset "breakpoint" schedule. In connection with the renewal of the fund's management contract, the Board approved amendments to the fund's management contract that added four new fee breakpoints to the group fee rate schedule for assets under FMR's management above $1,386 billion. The Board considered that the group fee rate declines under both the present and amended schedules, but that under the amended schedule, the group fee rate declines faster as assets under FMR's management exceed $1,386 billion. The Board considered that the group fee is designed to deliver the benefits of economies of scale to fund shareholders when total fund assets increase, even if assets of any particular fund are unchanged or have declined, because some portion of Fidelity's costs are attributable to services provided to all Fidelity funds, and all funds benefit if those costs can be allocated among more assets. The Board concluded that, given the group fee structure, fund shareholders will achieve a certain level of economies of scale as assets under FMR's management increase at the fund complex level, regardless of whether Fidelity achieves any such economies of scale.
The Board further concluded that any potential economies of scale are being shared between fund shareholders and Fidelity in an appropriate manner.
Additional Information Requested by the Board. In order to develop fully the factual basis for consideration of the Fidelity funds' Advisory Contracts, the Board requested and received additional information on several topics, including (i) fund performance trends and actions to be taken by FMR to improve certain funds' overall performance; (ii) Fidelity's portfolio manager compensation structure, including its effects on fund profitability and the extent to which portfolio manager compensation is linked to fund performance; (iii) Fidelity's fee structures; (iv) the funds' sub-advisory arrangements; and (v) accounts managed by Fidelity other than the Fidelity funds.
Based on its evaluation of all of the conclusions noted above, and after considering all material factors, the Board ultimately concluded that the advisory fee structures are fair and reasonable, and that the fund's Advisory Contracts should be renewed.
Annual Report
Annual Report
Annual Report
Annual Report
Annual Report
Annual Report
Investment Adviser
Fidelity Management & Research Company
Boston, MA
Investment Sub-Advisers
FMR Co., Inc.
Fidelity Management & Research
(U.K.) Inc.
Fidelity Research & Analysis Company
Fidelity Investments Japan Limited
Fidelity International Investment Advisors
Fidelity International Investment Advisors
(U.K. Limited)
General Distributor
Fidelity Distributors Corporation
Boston, MA
Transfer and Service Agents
Fidelity Investments Institutional
Operations Company, Inc.
Boston, MA
Fidelity Service Company, Inc.
Boston, MA
Custodian
Mellon Bank, N.A.
Pittsburgh, PA
ACANI-UANN-1207
1.843157.100
(Fidelity Investment logo)(registered trademark)
Corporate Headquarters
82 Devonshire St., Boston, MA 02109
www.fidelity.com
Fidelity®
International Discovery
Fund
Annual Report
October 31, 2007
(2_fidelity_logos) (Registered_Trademark)
Contents
Chairman's Message | <Click Here> | Ned Johnson's message to shareholders. |
Performance | <Click Here> | How the fund has done over time. |
Management's Discussion | <Click Here> | The manager's review of fund performance, strategy and outlook. |
Shareholder Expense Example | <Click Here> | An example of shareholder expenses. |
Investment Changes | <Click Here> | A summary of major shifts in the fund's investments over the past six months. |
Investments | <Click Here> | A complete list of the fund's investments with their market values. |
Financial Statements | <Click Here> | Statements of assets and liabilities, operations, and changes in net assets,
as well as financial highlights. |
Notes | <Click Here> | Notes to the financial statements. |
Report of Independent Registered Public Accounting Firm | <Click Here> | |
Trustees and Officers | <Click Here> | |
Distributions | <Click Here> | |
Board Approval of Investment Advisory Contracts and Management Fees | <Click Here> | |
To view a fund's proxy voting guidelines and proxy voting record for the 12-month period ended June 30, visit http://www.fidelity.com (search for "proxy voting guidelines") or visit the Securities and Exchange Commission's (SEC) web site at http://www.sec.gov. You may also call 1-800-544-8544 to request a free copy of the proxy voting guidelines.
Standard & Poor's, S&P and S&P 500 are registered service marks of The McGraw-Hill Companies, Inc. and have been licensed for use by Fidelity Distributors Corporation.
Other third party marks appearing herein are the property of their respective owners.
All other marks appearing herein are registered or unregistered trademarks or service marks of FMR LLC or an affiliated company.
Annual Report
This report and the financial statements contained herein are submitted for the general information of the shareholders of the fund. This report is not authorized for distribution to prospective investors in the fund unless preceded or accompanied by an effective prospectus.
A fund files its complete schedule of portfolio holdings with the SEC for the first and third quarters of each fiscal year on Form N-Q. Forms N-Q are available on the SEC's web site at http://www.sec.gov. A fund's Forms N-Q may be reviewed and copied at the SEC's Public Reference Room in Washington, DC. Information regarding the operation of the SEC's Public Reference Room may be obtained by calling 1-800-SEC-0330. For a complete list of a fund's portfolio holdings, view the most recent holdings listing, semiannual report, or annual report on Fidelity's web site at http://www.fidelity.com or http://www.fidelity.com/holdings, as applicable.
NOT FDIC INSURED · MAY LOSE VALUE · NO BANK GUARANTEE
Neither the fund nor Fidelity Distributors Corporation is a bank.
Annual Report
Chairman's Message
(photo_of_Edward_C_Johnson_3d)
Dear Shareholder:
Many stock and bond markets around the world have been unsettled of late; however, volatility can often lead to opportunity for patient investors. Financial markets are always unpredictable, but there are a number of time-tested principles that can put the historical odds in your favor.
One of the basic tenets is to invest for the long term. Over time, riding out the markets' inevitable ups and downs has proven much more effective than selling into panic or chasing the hottest trend. Even missing only a few of the markets' best days can significantly diminish investor returns. Patience also affords the benefits of compounding - of earning interest on additional income or reinvested dividends and capital gains. There are tax advantages and cost benefits to consider as well. The more you sell, the more taxes you pay, and the more you trade, the higher the costs. While staying the course doesn't eliminate risk, it can considerably lessen the effect of short-term declines.
You can further manage your investing risk through diversification. And today, more than ever, geographic diversification should be taken into account. Studies indicate that asset allocation is the single most important determinant of a portfolio's long-term success. The right mix of stocks, bonds and cash - aligned to your particular risk tolerance and investment objective - is very important. Age-appropriate rebalancing is also an essential aspect of asset allocation. For younger investors, an emphasis on equities - which historically have been the best-performing asset class over time - is encouraged. As investors near their specific goal, such as retirement or sending a child to college, consideration may be given to replacing volatile assets (e.g. common stocks) with more-stable fixed investments (bonds or savings plans).
A third investment principle - investing regularly - can help lower the average cost of your purchases. Investing a certain amount of money each month or quarter helps ensure you won't pay for all your shares at market highs. This strategy - known as dollar cost averaging - also reduces unconstructive "emotion" from investing, helping shareholders avoid selling weak performers just prior to an upswing, or chasing a hot performer just before a correction.
We invite you to contact us via the Internet, through our Investor Centers or over the phone. It is our privilege to provide you the information you need to make the investments that are right for you.
Sincerely,
/s/Edward C. Johnson 3d
Edward C. Johnson 3d
Annual Report
Performance: The Bottom Line
Average annual total return reflects the change in the value of an investment, assuming reinvestment of International Discovery's dividend income and capital gains (the profits earned upon the sale of securities that have grown in value) and assuming a constant rate of performance each year. The $10,000 table and the fund's returns do not reflect the deduction of taxes that a shareholder would pay on fund distributions or the redemption of fund shares. During periods of reimbursement by Fidelity, a fund's total return will be greater than it would be had the reimbursement not occurred. How a fund did yesterday is no guarantee of how it will do tomorrow.
Average Annual Total Returns
Periods ended October 31, 2007 | Past 1
year | Past 5
years | Past 10
years |
International Discovery A | 34.85% | 26.25% | 13.11% |
A Prior to October 1, 2004, International Discovery Fund operated under certain different investment policies. Accordingly, the fund's historical performance may not represent its current investment policies.
$10,000 Over 10 Years
Let's say hypothetically that $10,000 was invested in International Discovery on October 31, 1997. The chart shows how the value of your investment would have changed, and also shows how the Morgan Stanley Capital InternationalSM Europe, Australasia, Far East (MSCI® EAFE®) Index performed over the same period.
Annual Report
Management's Discussion of Fund Performance
Comments from William Kennedy, Portfolio Manager of Fidelity® International Discovery Fund
Foreign stocks, with a large assist from a weak U.S. dollar, generally had higher returns for U.S. investors than domestic equities during the 12-month period ending October 31, 2007. The backdrop for global stocks was solid, with robust economic growth and relatively high corporate profitability worldwide. Developed international equity markets, as measured by the Morgan Stanley Capital InternationalSM Europe, Australasia, and Far East (MSCI® EAFE®) Index - a performance monitor of established markets outside the United States and Canada - rose 25.09%. In comparison, the Standard & Poor's 500SM Index, a gauge of U.S. stocks, was up 14.56%. Among countries making up at least 1% of the EAFE benchmark, Finland had the best showing, soaring nearly 69%, while Hong Kong gained roughly 66%. The United Kingdom and Japan, the two largest components of the index, both underperformed. Fallout from the credit crunch and concerns about export growth tempered UK stocks, while Japan struggled with a slowdown in consumer spending and sluggish domestic growth. Emerging markets were the period's big winners, advancing 68.33% as measured by the MSCI Emerging Markets index.
For the 12 months ending October 31, 2007, International Discovery returned 34.85%, soundly beating the MSCI EAFE index. Strong stock picking - especially within industrials, health care and technology - helped the fund outperform. Stock selection in Europe and in emerging markets, which are not represented in the index, further aided performance. Top individual contributors to relative performance included Nintendo, the Japanese electronic game company, and CSL, an Australian biotechnology company. Nintendo benefited from the introduction of new games and products, while CSL saw improved pricing in its blood plasma business and growing royalty income from a new vaccine to protect against cervical cancer. NHN, the dominant Internet search engine in South Korea, and LG Household & Health Care, a recently restructured Korean consumer products company, rallied sharply. Neither was in the index. The fund sustained limited losses from an underweighting in Hong Kong - where stocks soared - weak stock selection in real estate, and a modest cash position. Disappointments included having an overall underweighting in BHP Billiton, an Anglo-Australian mining company, and not owning Volkswagen, a German car manufacturer, as both stocks rallied sharply.
The views expressed above reflect those of the portfolio manager(s) only through the end of the period as stated on the cover of this report and do not necessarily represent the views of Fidelity or any other person in the Fidelity organization. Any such views are subject to change at any time based upon market or other conditions and Fidelity disclaims any responsibility to update such views. These views may not be relied on as investment advice and, because investment decisions for a Fidelity fund are based on numerous factors, may not be relied on as an indication of trading intent on behalf of any Fidelity fund.
Annual Report
Shareholder Expense Example
As a shareholder of the Fund, you incur two types of costs: (1) transaction costs, including sales charges (loads) on purchase payments or redemption proceeds, and redemption fees, and (2) ongoing costs, including management fees, distribution and/or service (12b-1) fees and other Fund expenses. This Example is intended to help you understand your ongoing costs (in dollars) of investing in the Fund and to compare these costs with the ongoing costs of investing in other mutual funds.
The Example is based on an investment of $1,000 invested at the beginning of the period and held for the entire period (May 1, 2007 to October 31, 2007).
Actual Expenses
The first line of the accompanying table for each class of the Fund provides information about actual account values and actual expenses. You may use the information in this line, together with the amount you invested, to estimate the expenses that you paid over the period. Simply divide your account value by $1,000.00 (for example, an $8,600 account value divided by $1,000.00 = 8.6), then multiply the result by the number in the first line for a class of the Fund under the heading entitled "Expenses Paid During Period" to estimate the expenses you paid on your account during this period. A small balance maintenance fee of $12.00 that is charged once a year may apply for certain accounts with a value of less than $2,000. This fee is not included in the table below. If it was, the estimate of expenses you paid during the period would be higher, and your ending account value lower, by this amount. In addition, the Fund, as a shareholder in the underlying Fidelity Central Funds, will indirectly bear its pro rata share of the fees and expenses incurred by the underlying Fidelity Central Funds. These fees and expenses are not included in the Fund's annualized expense ratio used to calculate the expense estimate in the table below.
Hypothetical Example for Comparison Purposes
The second line of the accompanying table for each class of the Fund provides information about hypothetical account values and hypothetical expenses based on a Class' actual expense ratio and an assumed rate of return of 5% per year before expenses, which is not the Class' actual return. The hypothetical account values and expenses may not be used to estimate the actual ending account balance or expenses you paid for the period. You may use this information to compare the ongoing costs of investing in the Fund and other funds. To do so, compare this 5% hypothetical example with the 5% hypothetical examples that appear in the shareholder reports of the other funds. A small balance maintenance fee of $12.00 that is charged once a year may apply for certain accounts with a value of less than $2,000. This fee is not included in the table below. If it was, the estimate of expenses you paid during the period would be higher, and your ending account value lower, by this amount. In addition, the Fund, as a shareholder in the underlying Fidelity Central Funds, will indirectly bear its pro rata share of the fees and expenses incurred by the underlying Fidelity Central Funds. These fees and expenses are not included in the Fund's annualized expense ratio used to calculate the expense estimate in the table below.
Annual Report
Shareholder Expense Example - continued
Please note that the expenses shown in the table are meant to highlight your ongoing costs only and do not reflect any transaction costs. Therefore, the second line of the table is useful in comparing ongoing costs only, and will not help you determine the relative total costs of owning different funds. In addition, if these transactional costs were included, your costs would have been higher.
| Beginning
Account Value
May 1, 2007 | Ending
Account Value
October 31, 2007 | Expenses Paid
During Period*
May 1, 2007 to
October 31, 2007 |
Class A | | | |
Actual | $ 1,000.00 | $ 1,162.90 | $ 6.92 |
Hypothetical A | $ 1,000.00 | $ 1,018.80 | $ 6.46 |
Class T | | | |
Actual | $ 1,000.00 | $ 1,160.80 | $ 8.99 |
Hypothetical A | $ 1,000.00 | $ 1,016.89 | $ 8.39 |
Class B | | | |
Actual | $ 1,000.00 | $ 1,157.90 | $ 11.69 |
Hypothetical A | $ 1,000.00 | $ 1,014.37 | $ 10.92 |
Class C | | | |
Actual | $ 1,000.00 | $ 1,158.10 | $ 11.64 |
Hypothetical A | $ 1,000.00 | $ 1,014.42 | $ 10.87 |
International Discovery | | | |
Actual | $ 1,000.00 | $ 1,164.30 | $ 5.73 |
Hypothetical A | $ 1,000.00 | $ 1,019.91 | $ 5.35 |
Institutional Class | | | |
Actual | $ 1,000.00 | $ 1,164.40 | $ 5.35 |
Hypothetical A | $ 1,000.00 | $ 1,020.27 | $ 4.99 |
A 5% return per year before expenses
* Expenses are equal to each Class' annualized expense ratio (shown in the table below); multiplied by the average account value over the period, multiplied by 184/365 (to reflect the one-half year period).
| Annualized
Expense Ratio |
Class A | 1.27% |
Class T | 1.65% |
Class B | 2.15% |
Class C | 2.14% |
International Discovery | 1.05% |
Institutional Class | .98% |
Annual Report
Investment Changes
Geographic Diversification (% of fund's net assets) |
As of October 31, 2007 |
 | United Kingdom 14.7% | |
 | Japan 14.3% | |
 | Germany 11.1% | |
 | France 9.4% | |
 | Switzerland 8.5% | |
 | Australia 7.2% | |
 | United States of America 4.6% | |
 | Spain 3.2% | |
 | Norway 2.7% | |
 | Other 24.3% | |

Percentages are adjusted for the effect of futures contracts, if applicable. |
|
As of April 30, 2007 |
| Japan 16.4% | |
| United Kingdom 15.5% | |
| France 10.7% | |
| Germany 10.6% | |
| Switzerland 9.4% | |
| Australia 6.6% | |
| Netherlands 3.6% | |
| United States of America 3.6% | |
| Spain 2.9% | |
| Other 20.7% | |

Percentages are adjusted for the effect of futures contracts, if applicable. |
Asset Allocation |
| % of fund's net assets | % of fund's net assets
6 months ago |
Stocks and Equity Futures | 96.2 | 97.3 |
Short-Term Investments and Net Other Assets | 3.8 | 2.7 |
Top Ten Stocks as of October 31, 2007 |
| % of fund's
net assets | % of fund's net assets
6 months ago |
E.ON AG (Germany, Electric Utilities) | 1.6 | 1.3 |
Vodafone Group PLC (United Kingdom, Wireless Telecommunication Services) | 1.6 | 0.8 |
Telefonica SA (Spain, Diversified Telecommunication Services) | 1.5 | 0.7 |
CSL Ltd. (Australia, Biotechnology) | 1.3 | 1.0 |
Bayer AG sponsored ADR (Germany, Chemicals) | 1.2 | 1.0 |
Roche Holding AG (participation certificate) (Switzerland, Pharmaceuticals) | 1.2 | 1.5 |
Nestle SA (Reg.) (Switzerland, Food Products) | 1.2 | 1.1 |
BHP Billiton PLC (United Kingdom, Metals & Mining) | 1.2 | 0.8 |
Royal Dutch Shell PLC Class B (United Kingdom, Oil, Gas & Consumable Fuels) | 1.1 | 1.1 |
Nintendo Co. Ltd. (Japan, Software) | 1.0 | 0.9 |
| 12.9 | |
Market Sectors as of October 31, 2007 |
| % of fund's
net assets | % of fund's net assets
6 months ago |
Financials | 17.3 | 22.7 |
Industrials | 15.1 | 14.5 |
Consumer Discretionary | 12.6 | 15.1 |
Information Technology | 8.9 | 8.5 |
Materials | 8.1 | 6.5 |
Consumer Staples | 7.8 | 7.5 |
Health Care | 7.6 | 7.8 |
Energy | 7.4 | 5.8 |
Utilities | 6.1 | 5.2 |
Telecommunication Services | 4.9 | 3.2 |
Annual Report
Investments October 31, 2007
Showing Percentage of Net Assets
Common Stocks - 94.7% |
| Shares | | Value (000s) |
Australia - 7.2% |
AMP Ltd. | 2,150,200 | | $ 20,588 |
Aristocrat Leisure Ltd. (d) | 1,674,900 | | 16,383 |
AXA Asia Pacific Holdings Ltd. | 3,809,600 | | 29,145 |
Babcock & Brown Japan Property Trust | 14,813,600 | | 23,189 |
Babcock & Brown Ltd. | 2,614,622 | | 75,708 |
Babcock & Brown Wind Partners | 7,081,600 | | 12,186 |
Brambles Ltd. | 3,727,909 | | 49,622 |
Cochlear Ltd. | 750,661 | | 48,269 |
Commonwealth Bank of Australia | 1,313,800 | | 75,667 |
Computershare Ltd. | 6,601,384 | | 53,227 |
CSL Ltd. | 5,651,034 | | 192,113 |
Downer EDI Ltd. | 3,907,684 | | 24,368 |
Goodman Group unit | 4,741,905 | | 30,738 |
Macquarie Bank Ltd. | 588,675 | | 47,015 |
Mortgage Choice Ltd. | 2,899,300 | | 6,677 |
National Australia Bank Ltd. | 2,313,706 | | 93,608 |
Oxiana Ltd. | 2,673,571 | | 10,655 |
QBE Insurance Group Ltd. | 2,000,792 | | 61,229 |
Seek Ltd. | 2,000,000 | | 17,504 |
United Group Ltd. | 556,800 | | 11,144 |
Woolworths Ltd. | 2,722,574 | | 85,330 |
WorleyParsons Ltd. | 1,755,648 | | 79,361 |
TOTAL AUSTRALIA | | 1,063,726 |
Austria - 0.4% |
Raiffeisen International Bank Holding AG | 316,025 | | 52,241 |
Strabag SE (a) | 117,400 | | 9,217 |
TOTAL AUSTRIA | | 61,458 |
Belgium - 0.2% |
InBev SA | 365,300 | | 34,486 |
Bermuda - 0.8% |
Aquarius Platinum Ltd. (United Kingdom) | 1,493,400 | | 57,222 |
Ports Design Ltd. | 4,763,900 | | 17,985 |
Sinofert Holdings Ltd. | 38,748,900 | | 36,551 |
TOTAL BERMUDA | | 111,758 |
Brazil - 0.9% |
B2W Companhia Global Do Varejo | 1,134,400 | | 61,241 |
Bovespa Holding SA (a) | 787,000 | | 14,989 |
Uniao de Bancos Brasileiros SA (Unibanco) GDR | 337,000 | | 53,259 |
TOTAL BRAZIL | | 129,489 |
Common Stocks - continued |
| Shares | | Value (000s) |
Canada - 1.2% |
Niko Resources Ltd. | 498,400 | | $ 55,847 |
Open Text Corp. (a)(d) | 1,310,000 | | 40,943 |
Potash Corp. of Saskatchewan, Inc. | 615,500 | | 75,596 |
TOTAL CANADA | | 172,386 |
Cayman Islands - 0.8% |
Alibaba.com Ltd. (a) | 598,500 | | 1,931 |
Chaoda Modern Agriculture (Holdings) Ltd. | 12,600,000 | | 11,499 |
Lee & Man Paper Manufacturing Ltd. | 9,312,600 | | 37,254 |
Subsea 7, Inc. (a)(d) | 791,800 | | 23,238 |
Suntech Power Holdings Co. Ltd. sponsored ADR (a) | 842,200 | | 49,597 |
TOTAL CAYMAN ISLANDS | | 123,519 |
China - 0.3% |
Jiangsu Expressway Co. Ltd. (H Shares) | 13,585,200 | | 15,716 |
Nine Dragons Paper (Holdings) Ltd. | 10,409,000 | | 28,196 |
TOTAL CHINA | | 43,912 |
Cyprus - 0.3% |
Aisi Realty Public Ltd. (e) | 10,023,000 | | 8,752 |
Marfin Popular Bank Public Co. | 2,596,559 | | 42,208 |
TOTAL CYPRUS | | 50,960 |
Czech Republic - 0.3% |
Ceske Energeticke Zavody AS | 584,800 | | 42,271 |
Denmark - 0.7% |
Vestas Wind Systems AS (a) | 1,176,600 | | 104,975 |
Finland - 1.3% |
Citycon Oyj | 791,225 | | 5,158 |
Nokia Corp. sponsored ADR | 3,652,100 | | 145,061 |
Wartsila Corp. (B Shares) | 431,600 | | 35,267 |
TOTAL FINLAND | | 185,486 |
France - 9.4% |
Alcatel-Lucent SA | 1,089,900 | | 10,561 |
Alstom SA | 476,200 | | 112,388 |
AXA SA | 1,619,466 | | 72,439 |
BNP Paribas SA | 419,639 | | 46,261 |
Cap Gemini SA | 621,000 | | 39,587 |
CNP Assurances | 210,300 | | 26,809 |
Electricite de France | 886,200 | | 106,296 |
Gaz de France | 805,800 | | 45,764 |
Common Stocks - continued |
| Shares | | Value (000s) |
France - continued |
Geodis SA | 73,700 | | $ 15,910 |
Groupe Danone | 483,400 | | 41,693 |
Icade SA | 581,289 | | 42,900 |
L'Oreal SA | 247,100 | | 32,370 |
LVMH Moet Hennessy - Louis Vuitton | 357,300 | | 46,009 |
Neopost SA | 264,700 | | 30,745 |
Neuf Cegetel | 688,313 | | 34,803 |
Orpea (a) | 540,928 | | 34,193 |
Pinault Printemps-Redoute SA | 155,200 | | 30,764 |
Remy Cointreau SA | 304,500 | | 23,404 |
Renault SA | 461,500 | | 77,493 |
Sechilienne-Sidec | 174,000 | | 15,625 |
Societe Generale Series A | 181,820 | | 30,637 |
Suez SA (France) | 1,184,600 | | 76,999 |
Total SA Series B | 1,866,176 | | 150,432 |
Veolia Environnement | 916,962 | | 81,902 |
Vinci SA | 1,336,700 | | 109,651 |
Vivendi | 1,098,719 | | 49,474 |
TOTAL FRANCE | | 1,385,109 |
Germany - 10.1% |
Adidas-Salomon AG | 487,400 | | 32,518 |
Allianz AG (Reg.) | 607,130 | | 137,211 |
Bayer AG sponsored ADR | 2,183,200 | | 179,896 |
CompuGROUP Holding AG (a) | 519,400 | | 10,798 |
Continental AG | 228,600 | | 34,574 |
DaimlerChrysler AG (Reg.) | 669,000 | | 73,690 |
Deutsche Boerse AG | 727,200 | | 114,733 |
E.ON AG | 1,219,500 | | 238,172 |
Gerresheimer AG | 331,000 | | 18,223 |
Hochtief AG | 519,000 | | 71,666 |
K&S AG | 237,600 | | 49,677 |
Linde AG | 512,128 | | 64,804 |
MAN AG | 362,600 | | 64,721 |
MTU Aero Engines Holding AG | 63,600 | | 3,883 |
Muenchener Rueckversicherungs-Gesellschaft AG (Reg.) | 381,600 | | 73,210 |
Q-Cells AG (a) | 461,100 | | 58,721 |
SGL Carbon AG (a) | 637,600 | | 37,200 |
Siemens AG (Reg.) | 887,100 | | 120,974 |
SolarWorld AG | 1,099,600 | | 74,589 |
Wincor Nixdorf AG | 247,400 | | 24,574 |
TOTAL GERMANY | | 1,483,834 |
Common Stocks - continued |
| Shares | | Value (000s) |
Greece - 0.6% |
EFG Eurobank Ergasias SA | 871,328 | | $ 33,908 |
Marfin Financial Group Holdings SA | 1,328,400 | | 12,625 |
National Bank of Greece SA | 545,000 | | 37,885 |
TOTAL GREECE | | 84,418 |
Hong Kong - 1.4% |
China Mobile (Hong Kong) Ltd. | 1,539,000 | | 31,913 |
Esprit Holdings Ltd. | 6,854,500 | | 114,478 |
Li & Fung Ltd. | 11,401,900 | | 54,105 |
TOTAL HONG KONG | | 200,496 |
India - 1.6% |
Bharti Airtel Ltd. (a) | 2,771,992 | | 71,615 |
Infosys Technologies Ltd. | 991,984 | | 47,073 |
Reliance Industries Ltd. | 1,179,321 | | 84,180 |
Satyam Computer Services Ltd. | 3,147,843 | | 38,690 |
TOTAL INDIA | | 241,558 |
Indonesia - 0.2% |
PT Perusahaan Gas Negara Tbk Series B | 16,035,500 | | 25,130 |
Ireland - 0.3% |
Paddy Power PLC (Ireland) | 623,197 | | 25,777 |
Ryanair Holdings PLC sponsored ADR (a) | 486,900 | | 23,951 |
TOTAL IRELAND | | 49,728 |
Israel - 0.6% |
Israel Chemicals Ltd. | 4,076,700 | | 44,861 |
Nice Systems Ltd. sponsored ADR (a) | 995,600 | | 39,257 |
TOTAL ISRAEL | | 84,118 |
Italy - 2.1% |
AEM SpA | 7,233,100 | | 30,432 |
Edison SpA | 9,489,400 | | 32,267 |
ENI SpA | 288,800 | | 10,553 |
ENI SpA sponsored ADR | 389,450 | | 28,461 |
Fiat SpA | 2,581,600 | | 83,295 |
Impregilo SpA (a) | 1,279,394 | | 10,250 |
Prysmian SpA | 1,016,400 | | 29,202 |
Unicredito Italiano SpA | 9,354,300 | | 79,960 |
TOTAL ITALY | | 304,420 |
Japan - 13.9% |
Aeon Mall Co. Ltd. | 793,600 | | 20,643 |
Common Stocks - continued |
| Shares | | Value (000s) |
Japan - continued |
Asahi Glass Co. Ltd. | 1,924,000 | | $ 26,503 |
Asics Corp. | 3,270,000 | | 52,155 |
Canon, Inc. | 2,444,050 | | 123,596 |
Chiba Bank Ltd. | 2,187,000 | | 17,557 |
East Japan Railway Co. | 3,681 | | 30,328 |
Fujifilm Holdings Corp. | 1,518,000 | | 72,773 |
Honda Motor Co. Ltd. | 1,548,900 | | 57,975 |
Ibiden Co. Ltd. | 449,700 | | 38,127 |
Japan Tobacco, Inc. | 12,452 | | 72,594 |
Kawasaki Kisen Kaisha Ltd. | 2,345,000 | | 32,556 |
Keyence Corp. | 82,600 | | 19,039 |
Konica Minolta Holdings, Inc. | 2,904,500 | | 50,856 |
Kubota Corp. | 5,875,000 | | 49,334 |
Leopalace21 Corp. | 329,500 | | 10,521 |
Matsui Securities Co. Ltd. (d) | 2,233,300 | | 17,748 |
Mitsubishi Corp. | 1,383,500 | | 43,085 |
Mitsubishi Estate Co. Ltd. | 2,029,400 | | 60,851 |
Mitsui & Co. Ltd. | 3,209,000 | | 83,253 |
Mitsui Fudosan Co. Ltd. | 2,335,000 | | 64,609 |
Murata Manufacturing Co. Ltd. | 652,800 | | 39,736 |
Namco Bandai Holdings, Inc. | 1,763,600 | | 27,196 |
NGK Insulators Ltd. | 2,226,000 | | 78,931 |
Nintendo Co. Ltd. | 245,400 | | 154,111 |
Nippon Building Fund, Inc. | 2,498 | | 36,244 |
Nippon Electric Glass Co. Ltd. | 855,000 | | 14,535 |
Nippon Steel Corp. | 4,753,000 | | 31,598 |
Nomura Holdings, Inc. | 2,914,300 | | 51,962 |
NSK Ltd. | 3,609,000 | | 32,005 |
ORIX Corp. | 264,680 | | 54,305 |
Sony Corp. sponsored ADR | 808,600 | | 39,993 |
Sony Financial Holdings, Inc. | 1,085 | | 3,904 |
Sumco Corp. | 1,074,700 | | 39,232 |
Sumitomo Corp. | 1,889,600 | | 32,931 |
Sumitomo Electric Industries Ltd. | 1,786,100 | | 28,924 |
Sumitomo Metal Industries Ltd. | 1,557,000 | | 7,708 |
Sumitomo Mitsui Financial Group, Inc. | 11,632 | | 95,302 |
Sumitomo Trust & Banking Co. Ltd. | 2,478,800 | | 18,486 |
Takeda Pharmaceutical Co. Ltd. | 1,988,100 | | 124,213 |
Tokuyama Corp. | 3,364,900 | | 47,010 |
Toyota Motor Corp. | 2,645,700 | | 151,387 |
TOTAL JAPAN | | 2,053,816 |
Common Stocks - continued |
| Shares | | Value (000s) |
Korea (South) - 2.0% |
Korean Reinsurance Co. | 946,600 | | $ 16,887 |
LG Household & Health Care Ltd. | 441,970 | | 98,540 |
NHN Corp. (a) | 286,270 | | 92,058 |
Samsung Fire & Marine Insurance Co. Ltd. | 217,180 | | 60,426 |
Shinhan Financial Group Co. Ltd. | 385,130 | | 25,220 |
TOTAL KOREA (SOUTH) | | 293,131 |
Luxembourg - 1.2% |
Acergy SA | 1,124,500 | | 32,543 |
ArcelorMittal SA (d) | 730,900 | | 58,665 |
ArcelorMittal SA (NY Shares) Class A | 654,000 | | 52,287 |
SES SA (A Shares) FDR unit | 1,567,368 | | 37,695 |
TOTAL LUXEMBOURG | | 181,190 |
Malaysia - 1.1% |
DiGi.com Bhd | 3,860,800 | | 29,080 |
Gamuda Bhd | 53,435,000 | | 73,675 |
IJM Corp. Bhd | 8,525,300 | | 22,395 |
KNM Group Bhd | 19,276,000 | | 34,120 |
TOTAL MALAYSIA | | 159,270 |
Mexico - 0.6% |
America Movil SAB de CV Series L sponsored ADR | 1,217,900 | | 79,638 |
Urbi, Desarrollos Urbanos, SA de CV (a) | 4,121,400 | | 15,925 |
TOTAL MEXICO | | 95,563 |
Netherlands - 2.1% |
CNH Global NV | 730,700 | | 47,919 |
Heineken NV (Bearer) | 924,100 | | 64,502 |
ING Groep NV (Certificaten Van Aandelen) | 310,544 | | 13,971 |
Koninklijke KPN NV | 1,912,000 | | 36,067 |
Koninklijke Numico NV | 341,600 | | 27,220 |
Koninklijke Philips Electronics NV | 1,291,900 | | 53,407 |
Nutreco Holding NV | 653,700 | | 44,655 |
SBM Offshore NV | 706,779 | | 27,197 |
TOTAL NETHERLANDS | | 314,938 |
Norway - 2.7% |
Aker Kvaerner ASA | 3,278,985 | | 114,259 |
Hafslund ASA (B Shares) | 674,550 | | 19,986 |
Marine Harvest ASA (a) | 42,140,100 | | 42,717 |
Petroleum Geo-Services ASA | 1,889,000 | | 55,616 |
Pronova BioPharma ASA | 6,445,100 | | 29,664 |
Common Stocks - continued |
| Shares | | Value (000s) |
Norway - continued |
Renewable Energy Corp. AS (a)(d) | 1,148,900 | | $ 58,553 |
StatoilHydro ASA | 2,088,100 | | 70,660 |
TOTAL NORWAY | | 391,455 |
Papua New Guinea - 0.2% |
Lihir Gold Ltd. (a) | 9,432,800 | | 37,449 |
Singapore - 0.6% |
Keppel Corp. Ltd. | 2,332,000 | | 23,971 |
Singapore Exchange Ltd. | 5,755,000 | | 63,061 |
TOTAL SINGAPORE | | 87,032 |
South Africa - 0.0% |
JSE Ltd. | 166,821 | | 2,220 |
Spain - 3.2% |
Banco Santander Central Hispano SA | 5,543,700 | | 120,476 |
Compania de Distribucion Integral Logista SA | 163,800 | | 12,779 |
Inditex SA | 1,531,400 | | 113,930 |
Sol Melia SA | 279,295 | | 5,362 |
Telefonica SA | 6,849,600 | | 227,064 |
TOTAL SPAIN | | 479,611 |
Sweden - 1.5% |
H&M Hennes & Mauritz AB (B Shares) | 1,161,450 | | 77,323 |
Modern Times Group MTG AB (B Shares) | 1,049,300 | | 73,738 |
Scania AB (B Shares) | 2,390,600 | | 65,279 |
TOTAL SWEDEN | | 216,340 |
Switzerland - 8.5% |
ABB Ltd. sponsored ADR | 4,624,400 | | 139,749 |
Actelion Ltd. (Reg.) (a) | 1,287,650 | | 63,977 |
BB Biotech AG | 341,699 | | 30,002 |
Compagnie Financiere Richemont unit | 529,630 | | 37,792 |
Credit Suisse Group (Reg.) | 935,480 | | 63,332 |
EFG International | 528,000 | | 24,684 |
Julius Baer Holding AG (Bearer) | 971,965 | | 84,081 |
Lindt & Spruengli AG (participation certificate) | 16,084 | | 55,543 |
Nestle SA (Reg.) | 377,747 | | 174,519 |
Novartis AG (Reg.) | 736,880 | | 39,180 |
Roche Holding AG (participation certificate) | 1,047,428 | | 179,005 |
SGS Societe Generale de Surveillance Holding SA (Reg.) | 24,415 | | 31,997 |
Sonova Holding AG | 659,300 | | 73,996 |
Swiss Life Holding | 95,891 | | 26,492 |
Common Stocks - continued |
| Shares | | Value (000s) |
Switzerland - continued |
Syngenta AG (Switzerland) | 196,292 | | $ 47,571 |
Tecan Group AG | 212,300 | | 14,205 |
The Swatch Group AG (Reg.) | 1,277,012 | | 80,206 |
UBS AG (NY Shares) | 1,020,700 | | 54,801 |
Zurich Financial Services AG (Reg.) | 113,749 | | 34,248 |
TOTAL SWITZERLAND | | 1,255,380 |
Taiwan - 0.9% |
Gemtek Technology Corp. | 416,925 | | 938 |
Hon Hai Precision Industry Co. Ltd. (Foxconn) | 8,704,668 | | 66,101 |
PixArt Imaging, Inc. | 174,000 | | 1,523 |
Shin Kong Financial Holding Co. Ltd. | 10,525,009 | | 9,747 |
Siliconware Precision Industries Co. Ltd. | 12,427,433 | | 26,201 |
Wistron Corp. | 14,679,615 | | 29,228 |
TOTAL TAIWAN | | 133,738 |
United Kingdom - 14.7% |
Anglo American PLC (United Kingdom) | 946,654 | | 65,224 |
Autonomy Corp. PLC (a) | 2,701,500 | | 55,183 |
BAE Systems PLC | 4,314,809 | | 44,674 |
Barclays PLC | 1,431,400 | | 18,197 |
BG Group PLC | 1,454,900 | | 26,843 |
BG Group PLC sponsored ADR | 200,000 | | 18,450 |
BHP Billiton PLC | 4,518,500 | | 172,008 |
Blinkx PLC | 2,595,500 | | 1,713 |
BP PLC sponsored ADR | 922,600 | | 71,954 |
British American Tobacco PLC | 1,891,700 | | 72,528 |
British American Tobacco PLC sponsored ADR | 390,200 | | 29,921 |
Burberry Group PLC | 789,000 | | 10,088 |
Capita Group PLC | 1,161,193 | | 18,082 |
Clipper Windpower PLC (a) | 2,006,200 | | 27,737 |
GlaxoSmithKline PLC sponsored ADR | 956,700 | | 49,031 |
Gyrus Group PLC (a) | 3,384,500 | | 30,081 |
HSBC Holdings PLC (Hong Kong) (Reg.) | 1,445,244 | | 28,766 |
Informa PLC | 1,379,400 | | 15,343 |
International Power PLC | 9,114,700 | | 92,665 |
Investec PLC | 3,130,100 | | 37,809 |
John Wood Group PLC | 3,062,900 | | 26,586 |
Marks & Spencer Group PLC | 1,936,800 | | 26,254 |
Misys PLC | 1,173,500 | | 5,898 |
N Brown Group PLC | 4,180,000 | | 25,137 |
National Grid PLC | 3,373,200 | | 56,210 |
Common Stocks - continued |
| Shares | | Value (000s) |
United Kingdom - continued |
Next PLC | 907,000 | | $ 41,636 |
Pearson PLC | 2,492,100 | | 41,320 |
Punch Taverns Ltd. | 871,700 | | 18,214 |
Reckitt Benckiser Group PLC | 1,970,700 | | 114,270 |
Renovo Group PLC (a)(e) | 10,125,200 | | 42,523 |
Rio Tinto PLC sponsored ADR | 162,300 | | 60,863 |
Rolls-Royce Group PLC | 4,072,789 | | 45,555 |
Royal Bank of Scotland Group PLC | 6,689,857 | | 71,838 |
Royal Dutch Shell PLC Class B | 3,593,359 | | 156,760 |
RPS Group PLC | 4,353,400 | | 35,253 |
Shire PLC | 2,143,300 | | 53,690 |
SSL International PLC | 6,991,900 | | 74,863 |
Tesco PLC | 10,185,112 | | 104,397 |
Vodafone Group PLC | 59,492,135 | | 233,626 |
Xstrata PLC | 676,400 | | 48,474 |
TOTAL UNITED KINGDOM | | 2,169,664 |
United States of America - 0.8% |
Fluor Corp. | 275,900 | | 43,592 |
Macquarie Infrastructure Co. LLC | 131,000 | | 5,471 |
Sunpower Corp. Class A (a) | 433,600 | | 54,833 |
Washington Group International, Inc. (a) | 167,200 | | 16,277 |
TOTAL UNITED STATES OF AMERICA | | 120,173 |
TOTAL COMMON STOCKS (Cost $9,813,829) | 13,974,207 |
Nonconvertible Preferred Stocks - 1.1% |
| | | |
Germany - 1.0% |
Fresenius AG (non-vtg.) | 573,700 | | 45,490 |
Porsche AG | 21,495 | | 57,271 |
ProSiebenSat.1 Media AG | 1,396,900 | | 40,821 |
TOTAL GERMANY | | 143,582 |
Italy - 0.1% |
Intesa Sanpaolo SpA | 1,669,602 | | 12,673 |
Nonconvertible Preferred Stocks - continued |
| Shares | | Value (000s) |
United Kingdom - 0.0% |
Rolls-Royce Group PLC: | | | |
B Shares | 3,257 | | $ 0 |
B Shares (a) | 164,540,675 | | 342 |
TOTAL UNITED KINGDOM | | 342 |
TOTAL NONCONVERTIBLE PREFERRED STOCKS (Cost $102,519) | 156,597 |
Government Obligations - 0.0% |
| Principal Amount (000s) | | |
United States of America - 0.0% |
U.S. Treasury Bills, yield at date of purchase 3.64% to 4.85% 11/1/07 to 1/31/08 (f)
(Cost $5,151) | | $ 5,175 | | 5,151 |
Money Market Funds - 4.7% |
| Shares | | |
Fidelity Cash Central Fund, 4.97% (b) | 635,283,797 | | 635,284 |
Fidelity Securities Lending Cash Central Fund, 5.02% (b)(c) | 52,174,509 | | 52,175 |
TOTAL MONEY MARKET FUNDS (Cost $687,459) | 687,459 |
TOTAL INVESTMENT PORTFOLIO - 100.5% (Cost $10,608,958) | | 14,823,414 |
NET OTHER ASSETS - (0.5)% | | (75,062) |
NET ASSETS - 100% | $ 14,748,352 |
Futures Contracts |
| Expiration Date | | Underlying Face Amount at Value (000s) | | Unrealized Appreciation/
(Depreciation) (000s) |
Purchased |
Equity Index Contracts |
753 Nikkei 225 Index Contracts (Japan) | Dec. 2007 | | $ 63,459 | | $ 3,158 |
|
The face value of futures purchased as a percentage of net assets - 0.4% |
Legend |
(a) Non-income producing |
(b) Affiliated fund that is available only to investment companies and other accounts managed by Fidelity Investments. The rate quoted is the annualized seven-day yield of the fund at period end. A complete unaudited listing of the fund's holdings as of its most recent quarter end is available upon request. |
(c) Investment made with cash collateral received from securities on loan. |
(d) Security or a portion of the security is on loan at period end. |
(e) Affiliated company |
(f) Security or a portion of the security was pledged to cover margin requirements for futures contracts. At the period end, the value of securities pledged amounted to $3,171,000. |
Affiliated Central Funds |
Information regarding fiscal year to date income earned by the Fund from investments in Fidelity Central Funds is as follows: |
Fund | Income earned
(Amounts in thousands) |
Fidelity Cash Central Fund | $ 22,121 |
Fidelity Securities Lending Cash Central Fund | 8,932 |
Total | $ 31,053 |
Other Affiliated Issuers |
An affiliated company is a company in which the fund has ownership of at least 5% of the voting securities. Fiscal year to date transactions with companies which are or were affiliates are as follows: |
Affiliates
(Amounts in thousands) | Value, beginning of period | Purchases | Sales Proceeds | Dividend Income | Value,
end of
period |
Aisi Realty Public Ltd. | $ - | $ 6,615 | $ - | $ - | $ 8,752 |
Renovo Group PLC | 14,540 | 18,435 | 586 | - | 42,523 |
Total | $ 14,540 | $ 25,050 | $ 586 | $ - | $ 51,275 |
See accompanying notes which are an integral part of the financial statements.
Annual Report
Financial Statements
Statement of Assets and Liabilities
Amounts in thousands (except per-share amounts) | October 31, 2007 |
Assets | | |
Investment in securities, at value (including securities loaned of $49,933) - See accompanying schedule: Unaffiliated issuers (cost $9,887,754) | $ 14,084,680 | |
Fidelity Central Funds (cost $687,459) | 687,459 | |
Other affiliated issuers (cost $33,745) | 51,275 | |
Total Investments (cost $10,608,958) | | $ 14,823,414 |
Foreign currency held at value (cost $9,235) | | 9,250 |
Receivable for investments sold | | 6,597 |
Receivable for fund shares sold | | 38,047 |
Dividends receivable | | 15,806 |
Distributions receivable from Fidelity Central Funds | | 2,866 |
Receivable for daily variation on futures contracts | | 791 |
Prepaid expenses | | 11 |
Other receivables | | 760 |
Total assets | | 14,897,542 |
| | |
Liabilities | | |
Payable for investments purchased | $ 70,473 | |
Payable for fund shares redeemed | 9,685 | |
Accrued management fee | 9,391 | |
Distribution fees payable | 131 | |
Other affiliated payables | 2,347 | |
Other payables and accrued expenses | 4,988 | |
Collateral on securities loaned, at value | 52,175 | |
Total liabilities | | 149,190 |
| | |
Net Assets | | $ 14,748,352 |
Net Assets consist of: | | |
Paid in capital | | $ 9,827,187 |
Undistributed net investment income | | 137,292 |
Accumulated undistributed net realized gain (loss) on investments and foreign currency transactions | | 570,379 |
Net unrealized appreciation (depreciation) on investments and assets and liabilities in foreign currencies | | 4,213,494 |
Net Assets | | 14,748,352 |
See accompanying notes which are an integral part of the financial statements.
Annual Report
Financial Statements - continued
Statement of Assets and Liabilities - continued
Amounts in thousands (except per-share amounts) | October 31, 2007 |
Calculation of Maximum Offering Price
Class A:
Net Asset Value and redemption price per share ($416,784 ÷ 8,803.3 shares) | | $ 47.34 |
| | |
Maximum offering price per share (100/94.25 of $47.34) | | $ 50.23 |
Class T:
Net Asset Value and redemption price per share ($53,207 ÷ 1,130.6 shares) | | $ 47.06 |
| | |
Maximum offering price per share (100/96.50 of $47.06) | | $ 48.77 |
Class B:
Net Asset Value and offering price per share ($17,172 ÷ 367.7 shares)A | | $ 46.70 |
| | |
Class C:
Net Asset Value and offering price per share ($27,736 ÷ 592.4 shares)A | | $ 46.82 |
| | |
| | |
International Discovery
Net Asset Value, offering price and redemption price per share ($14,175,728 ÷ 297,335 shares) | | $ 47.68 |
| | |
Institutional Class:
Net Asset Value, offering price and redemption price per share ($57,725 ÷ 1,209.3 shares) | | $ 47.73 |
A Redemption price per share is equal to net asset value less any applicable contingent deferred sales charge.
See accompanying notes which are an integral part of the financial statements.
Annual Report
Statement of Operations
Amounts in thousands | Year ended October 31, 2007 |
Investment Income | | |
Dividends | | $ 248,233 |
Interest | | 571 |
Income from Fidelity Central Funds | | 31,053 |
| | 279,857 |
Less foreign taxes withheld | | (22,164) |
Total income | | 257,693 |
| | |
Expenses | | |
Management fee
Basic fee | $ 79,274 | |
Performance adjustment | 8,620 | |
Transfer agent fees | 23,362 | |
Distribution fees | 933 | |
Accounting and security lending fees | 1,888 | |
Custodian fees and expenses | 2,250 | |
Independent trustees' compensation | 37 | |
Registration fees | 527 | |
Audit | 172 | |
Legal | 99 | |
Miscellaneous | 336 | |
Total expenses before reductions | 117,498 | |
Expense reductions | (4,263) | 113,235 |
Net investment income (loss) | | 144,458 |
Realized and Unrealized Gain (Loss) Net realized gain (loss) on: | | |
Investment securities: | | |
Unaffiliated issuers (net of foreign taxes of $434) | 609,692 | |
Other affiliated issuers | 8 | |
Foreign currency transactions | 228 | |
Futures contracts | (1,828) | |
Total net realized gain (loss) | | 608,100 |
Change in net unrealized appreciation (depreciation) on: Investment securities (net of increase in deferred foreign taxes of $2,428) | 2,676,076 | |
Assets and liabilities in foreign currencies | 18 | |
Futures contracts | 1,873 | |
Total change in net unrealized appreciation (depreciation) | | 2,677,967 |
Net gain (loss) | | 3,286,067 |
Net increase (decrease) in net assets resulting from operations | | $ 3,430,525 |
See accompanying notes which are an integral part of the financial statements.
Annual Report
Financial Statements - continued
Statement of Changes in Net Assets
Amounts in thousands | Year ended
October 31,
2007 | Year ended
October 31,
2006 |
Increase (Decrease) in Net Assets | | |
Operations | | |
Net investment income (loss) | $ 144,458 | $ 89,022 |
Net realized gain (loss) | 608,100 | 238,999 |
Change in net unrealized appreciation (depreciation) | 2,677,967 | 940,196 |
Net increase (decrease) in net assets resulting
from operations | 3,430,525 | 1,268,217 |
Distributions to shareholders from net investment income | (85,862) | (41,324) |
Distributions to shareholders from net realized gain | (224,325) | (189,744) |
Total distributions | (310,187) | (231,068) |
Share transactions - net increase (decrease) | 3,385,409 | 3,239,823 |
Redemption fees | 502 | 380 |
Total increase (decrease) in net assets | 6,506,249 | 4,277,352 |
| | |
Net Assets | | |
Beginning of period | 8,242,103 | 3,964,751 |
End of period (including undistributed net investment income of $137,292 and undistributed net investment income of $83,948, respectively) | $ 14,748,352 | $ 8,242,103 |
See accompanying notes which are an integral part of the financial statements.
Annual Report
Financial Highlights - Class A
Years ended October 31, | 2007 | 2006 | 2005 H |
Selected Per-Share Data | | | |
Net asset value, beginning of period | $ 36.47 | $ 30.57 | $ 27.41 |
Income from Investment Operations | | | |
Net investment income (loss) E | .44 | .42 | .28 |
Net realized and unrealized gain (loss) | 11.76 | 7.19 | 2.88 |
Total from investment operations | 12.20 | 7.61 | 3.16 |
Distributions from net investment income | (.35) | (.31) | - |
Distributions from net realized gain | (.98) | (1.40) | - |
Total distributions | (1.33) | (1.71) | - |
Redemption fees added to paid in capital E | - J | - J | - J |
Net asset value, end of period | $ 47.34 | $ 36.47 | $ 30.57 |
Total Return B, C, D | 34.54% | 26.01% | 11.53% |
Ratios to Average Net Assets F, I | | | |
Expenses before reductions | 1.25% | 1.27% | 1.42% A |
Expenses net of fee waivers, if any | 1.25% | 1.27% | 1.42% A |
Expenses net of all reductions | 1.22% | 1.21% | 1.36% A |
Net investment income (loss) | 1.08% | 1.22% | 1.15% A |
Supplemental Data | | | |
Net assets, end of period (in millions) | $ 417 | $ 140 | $ 2 |
Portfolio turnover rate G | 56% | 56% | 75% |
A Annualized
B Total returns for periods of less than one year are not annualized.
C Total returns would have been lower had certain expenses not been reduced during the periods shown.
D Total returns do not include the effect of the sales charges.
E Calculated based on average shares outstanding during the period.
F Fees and expenses of the underlying Fidelity Central Funds are not included in the Fund's expense ratio. The Fund indirectly bears its proportionate share of the expenses of any underlying Fidelity Central Funds.
G Amount does not include the portfolio activity of any underlying Fidelity Central Funds.
H For the period January 6, 2005 (commencement of sale of shares) to October 31, 2005.
I Expense ratios reflect operating expenses of the class. Expenses before reductions do not reflect amounts reimbursed by the investment adviser or reductions from brokerage service arrangements or other expense offset arrangements and do not represent the amount paid by the class during periods when reimbursements or reductions occur. Expense ratios before reductions for start-up periods may not be representative of longer-term operating periods. Expenses net of fee waivers reflect expenses after reimbursement by the investment adviser but prior to reductions from brokerage service arrangements or other expense offset arrangements. Expenses net of all reductions represent the net expenses paid by the class.
J Amount represents less than $.01 per share.
See accompanying notes which are an integral part of the financial statements.
Annual Report
Financial Highlights - Class T
Years ended October 31, | 2007 | 2006 | 2005 H |
Selected Per-Share Data | | | |
Net asset value, beginning of period | $ 36.30 | $ 30.49 | $ 27.41 |
Income from Investment Operations | | | |
Net investment income (loss) E | .29 | .27 | .20 |
Net realized and unrealized gain (loss) | 11.71 | 7.18 | 2.88 |
Total from investment operations | 12.00 | 7.45 | 3.08 |
Distributions from net investment income | (.26) | (.24) | - |
Distributions from net realized gain | (.98) | (1.40) | - |
Total distributions | (1.24) | (1.64) | - |
Redemption fees added to paid in capital E | - J | - J | - J |
Net asset value, end of period | $ 47.06 | $ 36.30 | $ 30.49 |
Total Return B, C, D | 34.08% | 25.49% | 11.24% |
Ratios to Average Net Assets F, I | | | |
Expenses before reductions | 1.63% | 1.71% | 1.75% A |
Expenses net of fee waivers, if any | 1.63% | 1.71% | 1.75% A |
Expenses net of all reductions | 1.60% | 1.65% | 1.69% A |
Net investment income (loss) | .70% | .78% | .83% A |
Supplemental Data | | | |
Net assets, end of period (in millions) | $ 53 | $ 10 | $ 2 |
Portfolio turnover rate G | 56% | 56% | 75% |
A Annualized
B Total returns for periods of less than one year are not annualized.
C Total returns would have been lower had certain expenses not been reduced during the periods shown.
D Total returns do not include the effect of the sales charges.
E Calculated based on average shares outstanding during the period.
F Fees and expenses of the underlying Fidelity Central Funds are not included in the Fund's expense ratio. The Fund indirectly bears its proportionate share of the expenses of any underlying Fidelity Central Funds.
G Amount does not include the portfolio activity of any underlying Fidelity Central Funds.
H For the period January 6, 2005 (commencement of sale of shares) to October 31, 2005.
I Expense ratios reflect operating expenses of the class. Expenses before reductions do not reflect amounts reimbursed by the investment adviser or reductions from brokerage service arrangements or other expense offset arrangements and do not represent the amount paid by the class during periods when reimbursements or reductions occur. Expense ratios before reductions for start-up periods may not be representative of longer-term operating periods. Expenses net of fee waivers reflect expenses after reimbursement by the investment adviser but prior to reductions from brokerage service arrangements or other expense offset arrangements. Expenses net of all reductions represent the net expenses paid by the class.
J Amount represents less than $.01 per share.
See accompanying notes which are an integral part of the financial statements.
Annual Report
Financial Highlights - Class B
Years ended October 31, | 2007 | 2006 | 2005 H |
Selected Per-Share Data | | | |
Net asset value, beginning of period | $ 36.12 | $ 30.36 | $ 27.41 |
Income from Investment Operations | | | |
Net investment income (loss) E | .08 | .08 | .08 |
Net realized and unrealized gain (loss) | 11.64 | 7.19 | 2.87 |
Total from investment operations | 11.72 | 7.27 | 2.95 |
Distributions from net investment income | (.16) | (.11) | - |
Distributions from net realized gain | (.98) | (1.40) | - |
Total distributions | (1.14) | (1.51) | - |
Redemption fees added to paid in capital E | - J | - J | - J |
Net asset value, end of period | $ 46.70 | $ 36.12 | $ 30.36 |
Total Return B, C, D | 33.37% | 24.91% | 10.76% |
Ratios to Average Net Assets F, I | | | |
Expenses before reductions | 2.14% | 2.27% | 2.24% A |
Expenses net of fee waivers, if any | 2.14% | 2.25% | 2.24% A |
Expenses net of all reductions | 2.10% | 2.19% | 2.18% A |
Net investment income (loss) | .19% | .24% | .33% A |
Supplemental Data | | | |
Net assets, end of period (in millions) | $ 17 | $ 4 | $ 1 |
Portfolio turnover rate G | 56% | 56% | 75% |
A Annualized
B Total returns for periods of less than one year are not annualized.
C Total returns would have been lower had certain expenses not been reduced during the periods shown.
D Total returns do not include the effect of the contingent deferred sales charge.
E Calculated based on average shares outstanding during the period.
F Fees and expenses of the underlying Fidelity Central Funds are not included in the Fund's expense ratio. The Fund indirectly bears its proportionate share of the expenses of any underlying Fidelity Central Funds.
G Amount does not include the portfolio activity of any underlying Fidelity Central Funds.
H For the period January 6, 2005 (commencement of sale of shares) to October 31, 2005.
I Expense ratios reflect operating expenses of the class. Expenses before reductions do not reflect amounts reimbursed by the investment adviser or reductions from brokerage service arrangements or other expense offset arrangements and do not represent the amount paid by the class during periods when reimbursements or reductions occur. Expense ratios before reductions for start-up periods may not be representative of longer-term operating periods. Expenses net of fee waivers reflect expenses after reimbursement by the investment adviser but prior to reductions from brokerage service arrangements or other expense offset arrangements. Expenses net of all reductions represent the net expenses paid by the class.
J Amount represents less than $.01 per share.
See accompanying notes which are an integral part of the financial statements.
Annual Report
Financial Highlights - Class C
Years ended October 31, | 2007 | 2006 | 2005 H |
Selected Per-Share Data | | | |
Net asset value, beginning of period | $ 36.19 | $ 30.41 | $ 27.41 |
Income from Investment Operations | | | |
Net investment income (loss) E | .09 | .11 | .13 |
Net realized and unrealized gain (loss) | 11.66 | 7.19 | 2.87 |
Total from investment operations | 11.75 | 7.30 | 3.00 |
Distributions from net investment income | (.14) | (.12) | - |
Distributions from net realized gain | (.98) | (1.40) | - |
Total distributions | (1.12) | (1.52) | - |
Redemption fees added to paid in capital E | - J | - J | - J |
Net asset value, end of period | $ 46.82 | $ 36.19 | $ 30.41 |
Total Return B, C, D | 33.38% | 24.97% | 10.94% |
Ratios to Average Net Assets F, I | | | |
Expenses before reductions | 2.11% | 2.16% | 2.04% A |
Expenses net of fee waivers, if any | 2.11% | 2.16% | 2.04% A |
Expenses net of all reductions | 2.08% | 2.11% | 1.98% A |
Net investment income (loss) | .22% | .33% | .53% A |
Supplemental Data | | | |
Net assets, end of period (in millions) | $ 28 | $ 6 | $ 2 |
Portfolio turnover rate G | 56% | 56% | 75% |
A Annualized
B Total returns for periods of less than one year are not annualized.
C Total returns would have been lower had certain expenses not been reduced during the periods shown.
D Total returns do not include the effect of the contingent deferred sales charge.
E Calculated based on average shares outstanding during the period.
F Fees and expenses of the underlying Fidelity Central Funds are not included in the Fund's expense ratio. The Fund indirectly bears its proportionate share of the expenses of any underlying Fidelity Central Funds.
G Amount does not include the portfolio activity of any underlying Fidelity Central Funds.
H For the period January 6, 2005 (commencement of sale of shares) to October 31, 2005.
I Expense ratios reflect operating expenses of the class. Expenses before reductions do not reflect amounts reimbursed by the investment adviser or reductions from brokerage service arrangements or other expense offset arrangements and do not represent the amount paid by the class during periods when reimbursements or reductions occur. Expense ratios before reductions for start-up periods may not be representative of longer-term operating periods. Expenses net of fee waivers reflect expenses after reimbursement by the investment adviser but prior to reductions from brokerage service arrangements or other expense offset arrangements. Expenses net of all reductions represent the net expenses paid by the class.
J Amount represents less than $.01 per share.
See accompanying notes which are an integral part of the financial statements.
Annual Report
Financial Highlights - International Discovery
Years ended October 31, | 2007 | 2006 | 2005 | 2004 | 2003 |
Selected Per-Share Data | | | | | |
Net asset value, beginning of period | $ 36.67 | $ 30.65 | $ 25.31 | $ 21.87 | $ 16.66 |
Income from Investment Operations | | | | | |
Net investment income (loss) B | .53 | .48 | .37 | .22 | .19 |
Net realized and unrealized gain (loss) | 11.84 | 7.25 | 5.24 | 3.40 | 5.11 |
Total from investment operations | 12.37 | 7.73 | 5.61 | 3.62 | 5.30 |
Distributions from net investment income | (.38) | (.31) | (.15) | (.18) | (.09) |
Distributions from net realized gain | (.98) | (1.40) | (.12) | - | - |
Total distributions | (1.36) | (1.71) | (.27) | (.18) | (.09) |
Redemption fees added to paid in capital B | - F | - F | - F | - F | - F |
Net asset value, end of period | $ 47.68 | $ 36.67 | $ 30.65 | $ 25.31 | $ 21.87 |
Total Return A | 34.85% | 26.34% | 22.29% | 16.65% | 31.97% |
Ratios to Average Net Assets C, E | | | | | |
Expenses before reductions | 1.04% | 1.09% | 1.08% | 1.10% | 1.14% |
Expenses net of fee waivers, if any | 1.04% | 1.08% | 1.07% | 1.10% | 1.14% |
Expenses net of all reductions | 1.00% | 1.03% | 1.01% | 1.06% | 1.11% |
Net investment income (loss) | 1.30% | 1.41% | 1.35% | .92% | 1.08% |
Supplemental Data | | | | | |
Net assets, end of period (in millions) | $ 14,176 | $ 8,054 | $ 3,949 | $ 2,193 | $ 1,243 |
Portfolio turnover rate D | 56% | 56% | 75% | 87% | 81% |
A Total returns would have been lower had certain expenses not been reduced during the periods shown.
B Calculated based on average shares outstanding during the period.
C Fees and expenses of the underlying Fidelity Central Funds are not included in the Fund's expense ratio. The Fund indirectly bears its proportionate share of the expenses of any underlying Fidelity Central Funds.
D Amount does not include the portfolio activity of any underlying Fidelity Central Funds.
E Expense ratios reflect operating expenses of the class. Expenses before reductions do not reflect amounts reimbursed by the investment adviser or reductions from brokerage service arrangements or other expense offset arrangements and do not represent the amount paid by the class during periods when reimbursements or reductions occur. Expenses net of fee waivers reflect expenses after reimbursement by the investment adviser but prior to reductions from brokerage service arrangements or other expense offset arrangements. Expenses net of all reductions represent the net expenses paid by the class.
F Amount represents less than $.01 per share.
See accompanying notes which are an integral part of the financial statements.
Annual Report
Financial Highlights - Institutional Class
Years ended October 31, | 2007 | 2006 | 2005 G |
Selected Per-Share Data | | | |
Net asset value, beginning of period | $ 36.71 | $ 30.68 | $ 27.41 |
Income from Investment Operations | | | |
Net investment income (loss) D | .55 | .51 | .38 |
Net realized and unrealized gain (loss) | 11.85 | 7.25 | 2.89 |
Total from investment operations | 12.40 | 7.76 | 3.27 |
Distributions from net investment income | (.40) | (.33) | - |
Distributions from net realized gain | (.98) | (1.40) | - |
Total distributions | (1.38) | (1.73) | - |
Redemption fees added to paid in capital D | - I | - I | - I |
Net asset value, end of period | $ 47.73 | $ 36.71 | $ 30.68 |
Total Return B, C | 34.93% | 26.45% | 11.93% |
Ratios to Average Net Assets E, H | | | |
Expenses before reductions | .97% | 1.00% | .97% A |
Expenses net of fee waivers, if any | .97% | 1.00% | .97% A |
Expenses net of all reductions | .94% | .95% | .90% A |
Net investment income (loss) | 1.36% | 1.49% | 1.60% A |
Supplemental Data | | | |
Net assets, end of period (in millions) | $ 58 | $ 28 | $ 10 |
Portfolio turnover rate F | 56% | 56% | 75% |
A Annualized
B Total returns for periods of less than one year are not annualized.
C Total returns would have been lower had certain expenses not been reduced during the periods shown.
D Calculated based on average shares outstanding during the period.
E Fees and expenses of the underlying Fidelity Central Funds are not included in the Fund's expense ratio. The Fund indirectly bears its proportionate share of the expenses of any underlying Fidelity Central Funds.
F Amount does not include the portfolio activity of any underlying Fidelity Central Funds.
G For the period January 6, 2005 (commencement of sale of shares) to October 31, 2005.
H Expense ratios reflect operating expenses of the class. Expenses before reductions do not reflect amounts reimbursed by the investment adviser or reductions from brokerage service arrangements or other expense offset arrangements and do not represent the amount paid by the class during periods when reimbursements or reductions occur. Expense ratios before reductions for start-up periods may not be representative of longer-term operating periods. Expenses net of fee waivers reflect expenses after reimbursement by the investment adviser but prior to reductions from brokerage service arrangements or other expense offset arrangements. Expenses net of all reductions represent the net expenses paid by the class.
I Amount represents less than $.01 per share.
See accompanying notes which are an integral part of the financial statements.
Annual Report
Notes to Financial Statements
For the period ended October 31, 2007
(Amounts in thousands except ratios)
1. Organization.
Fidelity International Discovery Fund (the Fund) is a fund of Fidelity Investment Trust (the trust) and is authorized to issue an unlimited number of shares. The trust is registered under the Investment Company Act of 1940, as amended (the 1940 Act), as an open-end management investment company organized as a Massachusetts business trust. The Fund offers Class A, Class T, Class B, Class C, International Discovery, and Institutional Class shares, each of which has equal rights as to assets and voting privileges. Each class has exclusive voting rights with respect to matters that affect that class. Class B shares will automatically convert to Class A shares after a holding period of seven years from the initial date of purchase. Investment income, realized and unrealized capital gains and losses, the common expenses of the Fund, and certain fund-level expense reductions, if any, are allocated on a pro rata basis to each class based on the relative net assets of each class to the total net assets of the Fund. Each class differs with respect to transfer agent and distribution and service plan fees incurred. Certain expense reductions also differ by class. The Fund's investments in emerging markets can be subject to social, economic, regulatory, and political uncertainties and can be extremely volatile.
2. Investments in Fidelity Central Funds.
The Fund may invest in Fidelity Central Funds, which are open-end investment companies available only to other investment companies and accounts managed by Fidelity Management & Research Company (FMR) and its affiliates. The Fund's Schedule of Investments lists each of the Fidelity Central Funds as an investment of the Fund, but does not include the underlying holdings of each Fidelity Central Fund. As an Investing Fund, the Fund indirectly bears its proportionate share of the expenses of the underlying Fidelity Central Funds.
The Money Market Central Funds seek preservation of capital and current income and are managed by Fidelity Investments Money Management, Inc. (FIMM), an affiliate of FMR.
A complete list of holdings for each Fidelity Central Fund is available upon request or at the SEC's web site at www.sec.gov. In addition, the financial statements of the Fidelity Central Funds, are available on the SEC's web site or upon request.
3. Significant Accounting Policies.
The financial statements have been prepared in conformity with accounting principles generally accepted in the United States of America, which require management to make certain estimates and assumptions at the date of the financial statements. The following summarizes the significant accounting policies of the Fund:
Annual Report
Notes to Financial Statements - continued
(Amounts in thousands except ratios)
3. Significant Accounting Policies - continued
Security Valuation. Investments are valued and net asset value (NAV) per share is calculated (NAV calculation) as of the close of business of the New York Stock Exchange (NYSE), normally 4:00 p.m. Eastern time. Wherever possible, the Fund uses independent pricing services approved by the Board of Trustees to value its investments.
Equity securities, including restricted securities, for which market quotations are readily available, are valued at the last reported sale price or official closing price as reported by an independent pricing service on the primary market or exchange on which they are traded. In the event there were no sales during the day or closing prices are not available, securities are valued at the last quoted bid price. Investments in open-end mutual funds, including the Fidelity Central Funds, are valued at their closing net asset value each business day. Short-term securities with remaining maturities of sixty days or less for which quotations are not readily available are valued at amortized cost, which approximates value.
When current market prices or quotations are not readily available or do not accurately reflect fair value, valuations may be determined in accordance with procedures adopted by the Board of Trustees. For example, when developments occur between the close of a market and the close of the NYSE that may materially affect the value of some or all of the securities, or when trading in a security is halted, those securities may be fair valued. Factors used in the determination of fair value may include monitoring news to identify significant market or security specific events such as changes in the value of U.S. securities markets, reviewing developments in foreign markets and evaluating the performance of ADRs, futures contracts and exchange-traded funds. Because the Fund's utilization of fair value pricing depends on market activity, the frequency with which fair value pricing is used cannot be predicted and may be utilized to a significant extent. The value of securities used for NAV calculation under fair value pricing may differ from published prices for the same securities.
Foreign Currency. The Fund uses foreign currency contracts to facilitate transactions in foreign-denominated securities. Losses from these transactions may arise from changes in the value of the foreign currency or if the counterparties do not perform under the contracts' terms.
Foreign-denominated assets, including investment securities, and liabilities are translated into U.S. dollars at the exchange rate at period end. Purchases and sales of investment securities, income and dividends received and expenses denominated in foreign currencies are translated into U.S. dollars at the exchange rate in effect on the transaction date.
The effects of exchange rate fluctuations on investments are included with the net realized and unrealized gain (loss) on investment securities. Other foreign currency transactions resulting in realized and unrealized gain (loss) are disclosed separately.
Annual Report
3. Significant Accounting Policies - continued
Investment Transactions and Income. For financial reporting purposes, the Fund's investment holdings and NAV include trades executed through the end of the last business day of the period. The NAV for processing shareholder transactions includes trades executed through the end of the prior business day. Gains and losses on securities sold are determined on the basis of identified cost and may include proceeds received from litigation. Dividend income is recorded on the ex-dividend date, except for certain dividends from foreign securities where the ex-dividend date may have passed, which are recorded as soon as the Fund is informed of the ex-dividend date. Non-cash dividends included in dividend income, if any, are recorded at the fair market value of the securities received. Distributions received on securities that represent a return of capital or capital gain are recorded as a reduction of cost of investments and/or as a realized gain. The Fund estimates the components of distributions received that may be considered return of capital distributions or capital gain distributions. Interest income and distributions from the Fidelity Central Funds are accrued as earned. Interest income includes coupon interest and amortization of premium and accretion of discount on debt securities. Investment income is recorded net of foreign taxes withheld where recovery of such taxes is uncertain.
Expenses. Most expenses of the trust can be directly attributed to a fund. Expenses which cannot be directly attributed are apportioned among each Fund in the trust. Expense estimates are accrued in the period to which they relate and adjustments are made when actual amounts are known.
Income Tax Information and Distributions to Shareholders. Each year, the Fund intends to qualify as a regulated investment company by distributing all of its taxable income and realized gains under Subchapter M of the Internal Revenue Code. As a result, no provision for income taxes is required in the accompanying financial statements. Foreign taxes are provided for based on the Fund's understanding of the tax rules and rates that exist in the foreign markets in which it invests.
Distributions are recorded on the ex-dividend date. Income dividends and capital gain distributions are declared separately for each class. Income and capital gain distributions are determined in accordance with income tax regulations, which may differ from generally accepted accounting principles. In addition, the Fund will claim a portion of the payment made to redeeming shareholders as a distribution for income tax purposes.
Capital accounts within the financial statements are adjusted for permanent book-tax differences. These adjustments have no impact on net assets or the results of operations. Temporary book-tax differences will reverse in a subsequent period.
Annual Report
Notes to Financial Statements - continued
(Amounts in thousands except ratios)
3. Significant Accounting Policies - continued
Income Tax Information and Distributions to Shareholders - continued
Book-tax differences are primarily due to futures transactions, foreign currency transactions, certain foreign taxes, passive foreign investment companies (PFIC), market discount, deferred trustees compensation and losses deferred due to wash sales.
The tax-basis components of distributable earnings and the federal tax cost as of period end were as follows:
Unrealized appreciation | $ 4,321,525 | |
Unrealized depreciation | (139,903) | |
Net unrealized appreciation (depreciation) | 4,181,622 | |
Undistributed ordinary income | 152,966 | |
Undistributed long-term capital gain | 495,087 | |
Cost for federal income tax purposes | $ 10,641,792 | |
The tax character of distributions paid was as follows:
| October 31, 2007 | October 31, 2006 |
Ordinary Income | $ 145,377 | $ 106,379 |
Long-term Capital Gains | 164,810 | 124,689 |
Total | $ 310,187 | $ 231,068 |
Short-Term Trading (Redemption) Fees. Shares held in the Fund less than 30 days are subject to a redemption fee equal to 1.00% of the proceeds of the redeemed shares. All redemption fees, including any estimated redemption fees paid by FMR, are retained by the Fund and accounted for as an addition to paid in capital.
New Accounting Pronouncements. In July 2006, Financial Accounting Standards Board Interpretation No. 48, Accounting for Uncertainty in Income Taxes - an interpretation of FASB Statement 109 (FIN 48), was issued and is effective on the last business day of the semiannual reporting period for fiscal years beginning after December 15, 2006. FIN 48 sets forth a threshold for financial statement recognition, measurement and disclosure of a tax position taken or expected to be taken on a tax return. Management has concluded that the adoption of FIN 48 will not result in a material impact on the Fund's net assets, results of operations and financial statement disclosures.
In addition, in September 2006, Statement of Financial Accounting Standards No. 157, Fair Value Measurements (SFAS 157), was issued and is effective for fiscal years beginning after November 15, 2007. SFAS 157 defines fair value, establishes a framework for measuring fair value and expands disclosures about fair value measurements. Management is currently evaluating the impact the adoption of SFAS 157 will have on the Fund's financial statement disclosures.
Annual Report
4. Operating Policies.
Repurchase Agreements. FMR has received an Exemptive Order from the Securities and Exchange Commission (the SEC) which permits the Fund and other affiliated entities of FMR to transfer uninvested cash balances into joint trading accounts which are then invested in repurchase agreements. The Fund may also invest directly with institutions in repurchase agreements. Repurchase agreements are collateralized by government or non-government securities. Upon settlement date, collateral is held in segregated accounts with custodian banks and may be obtained in the event of a default of the counterparty. The Fund monitors, on a daily basis, the value of the collateral to ensure it is at least equal to the principal amount of the repurchase agreement (including accrued interest). In the event of a default by the counterparty, realization of the collateral proceeds could be delayed, during which time the value of the collateral may decline.
Futures Contracts. The Fund may use futures contracts to manage its exposure to the stock markets. Buying futures tends to increase a fund's exposure to the underlying instrument, while selling futures tends to decrease a fund's exposure to the underlying instrument or hedge other fund investments. Upon entering into a futures contract, a fund is required to deposit with a clearing broker, no later than the following business day, an amount ("initial margin") equal to a certain percentage of the face value of the contract. The initial margin may be in the form of cash or securities and is transferred to a segregated account on settlement date. Subsequent payments ("variation margin") are made or received by a fund depending on the daily fluctuations in the value of the futures contract and are accounted for as unrealized gains or losses. Realized gains (losses) are recorded upon the expiration or closing of the futures contract. Securities deposited to meet margin requirements are identified in the Schedule of Investments. Futures contracts involve, to varying degrees, risk of loss in excess of any futures variation margin reflected in the Statement of Assets and Liabilities. The underlying face amount at value of any open futures contracts at period end is shown in the Schedule of Investments under the caption "Futures Contracts." This amount reflects each contract's exposure to the underlying instrument at period end. Losses may arise from changes in the value of the underlying instruments or if the counterparties do not perform under the contract's terms. Futures contracts are valued at the settlement price established each day by the board of trade or exchange on which they are traded.
5. Purchases and Sales of Investments.
Purchases and sales of securities, other than short-term securities, aggregated $9,077,103 and $6,122,723, respectively.
Annual Report
Notes to Financial Statements - continued
(Amounts in thousands except ratios)
6. Fees and Other Transactions with Affiliates.
Management Fee. FMR and its affiliates provide the Fund with investment management related services for which the Fund pays a monthly management fee. The management fee is the sum of an individual fund fee rate that is based on an annual rate of .45% of the Fund's average net assets and a group fee rate that averaged ..26% during the period. The group fee rate is based upon the average net assets of all the mutual funds advised by FMR. The group fee rate decreases as assets under management increase and increases as assets under management decrease. In addition, the management fee is subject to a performance adjustment (up to a maximum of ± .20% of the Fund's average net assets over a 36 month performance period). The upward or downward adjustment to the management fee is based on the investment performance of the asset-weighted return of all classes relative investment performance of the retail class of the Fund, International Discovery, as compared to an appropriate benchmark index. For the period, the total annual management fee rate, including the performance adjustment, was .78% of the Fund's average net assets.
Distribution and Service Plan. In accordance with Rule 12b-1 of the 1940 Act, the Fund has adopted separate Distribution and Service Plans for each class of shares. Certain classes pay Fidelity Distributors Corporation (FDC), an affiliate of FMR, separate Distribution and Service Fees, each of which is based on an annual percentage of each class' average net assets. In addition, FDC may pay financial intermediaries for selling shares of the Fund and providing shareholder support services. For the period, the Distribution and Service Fee rates and the total amounts paid to and retained by FDC were as follows:
| Distribution
Fee | Service
Fee | Paid to
FDC | Retained
by FDC |
Class A | 0% | .25% | $ 583 | $ 37 |
Class T | .25% | .25% | 129 | 4 |
Class B | .75% | .25% | 87 | 65 |
Class C | .75% | 25% | 134 | 65 |
| | | $ 933 | $ 171 |
Sales Load. FDC receives a front-end sales charge of up to 5.75% for selling Class A shares, and 3.50% for selling Class T shares, some of which is paid to financial intermediaries for selling shares of the Fund. FDC receives the proceeds of contingent deferred sales charges levied on Class A, Class T, Class B, and Class C redemptions. These charges depend on the holding period. The deferred sales charges range from 5% to 1% for Class B, 1% for Class C, 1% to .50% for certain purchases of Class A shares and .25% for certain purchases of Class T shares.
Annual Report
6. Fees and Other Transactions with Affiliates - continued
Sales Load - continued
For the period, sales charge amounts retained by FDC were as follows:
| Retained
by FDC |
Class A | $ 128 |
Class T | 24 |
Class B* | 12 |
Class C* | 5 |
| $ 169 |
* When Class B and Class C shares are initially sold, FDC pays commissions from its own resources to financial intermediaries through which the sales are made.
Transfer Agent Fees. Fidelity Investments Institutional Operations Company, Inc. (FIIOC), an affiliate of FMR, is the transfer, dividend disbursing and shareholder servicing agent for each class of the Fund, except for International Discovery. Fidelity Service Company, Inc. (FSC), an affiliate of FMR, is the transfer agent for International Discovery shares. FIIOC and FSC receive account fees and asset-based fees that vary according to the account size and type of account of the shareholders of the respective classes of the Fund. FIIOC and FSC pay for typesetting, printing and mailing of shareholder reports, except proxy statements. For the period, the total transfer agent fees paid by each class to FIIOC or FSC, were as follows:
| Amount | % of
Average
Net Assets |
Class A | $ 404 | .17 |
Class T | 80 | .30 |
Class B | 28 | .32 |
Class C | 40 | .29 |
International Discovery | 22,756 | .21 |
Institutional Class | 54 | .14 |
| $ 23,362 | |
Accounting and Security Lending Fees. FSC maintains the Fund's accounting records. The accounting fee is based on the level of average net assets for the month. Under a separate contract, FSC administers the security lending program. The security lending fee is based on the number and duration of lending transactions.
Brokerage Commissions. The Fund placed a portion of its portfolio transactions with brokerage firms which are affiliates of the investment adviser. The commissions paid to these affiliated firms were $1 for the period.
Annual Report
Notes to Financial Statements - continued
(Amounts in thousands except ratios)
7. Committed Line of Credit.
The Fund participates with other funds managed by FMR in a $4.2 billion credit facility (the "line of credit") to be utilized for temporary or emergency purposes to fund shareholder redemptions or for other short-term liquidity purposes. The Fund has agreed to pay commitment fees on its pro rata portion of the line of credit, which amounted to $22 and is reflected in Miscellaneous Expense on the Statement of Operations. During the period, there were no borrowings on this line of credit.
8. Security Lending.
The Fund lends portfolio securities from time to time in order to earn additional income. On the settlement date of the loan, the Fund receives collateral (in the form of U.S. Treasury obligations, letters of credit and/or cash) against the loaned securities and maintains collateral in an amount not less than 100% of the market value of the loaned securities during the period of the loan. The market value of the loaned securities is determined at the close of business of the Fund and any additional required collateral is delivered to the Fund on the next business day. If the borrower defaults on its obligation to return the securities loaned because of insolvency or other reasons, a fund could experience delays and costs in recovering the securities loaned or in gaining access to the collateral. Any cash collateral received is invested in the Fidelity Securities Lending Cash Central Fund. The value of loaned securities and cash collateral at period end are disclosed on the Fund's Statement of Assets and Liabilities. Security lending income represents the income earned on investing cash collateral, less fees and expenses associated with the loan, plus any premium payments that may be received on the loan of certain types of securities. Security lending income is presented in the Statement of Operations as a component of income from Fidelity Central Funds. Net income from lending portfolio securities during the period amounted to $8,932.
9. Expense Reductions.
Many of the brokers with whom FMR places trades on behalf of the Fund provided services to the Fund in addition to trade execution. These services included payments of certain expenses on behalf of the Fund totaling $3,703 for the period. In addition, through arrangements with the Fund's custodian and each class' transfer agent, credits realized as a result of uninvested cash balances were used to reduce the Fund's expenses. During the period, these credits reduced the Fund's custody expenses by $11. During the period, credits reduced each class' transfer agent expense as noted in the table below.
| Transfer Agent
expense reduction | |
International Discovery | $ 433 | |
Annual Report
10. Other.
The Fund's organizational documents provide former and current trustees and officers with a limited indemnification against liabilities arising in connection with the performance of their duties to the Fund. In the normal course of business, the Fund may also enter into contracts that provide general indemnifications. The Fund's maximum exposure under these arrangements is unknown as this would be dependent on future claims that may be made against the Fund. The risk of material loss from such claims is considered remote.
In September 2006, FIIOC, a transfer agent of the Fund, notified the Fund that the Fund's books and records did not reflect a conversion of certain Class B to Class A shares upon their conversion date. In March 2007, FIIOC converted the relevant Class B shares to Class A shares and recorded the conversion in the books and records of the Fund which did not result in a material impact to the Fund's reported net assets or results of operations in the accompanying financial statements. FIIOC has remediated affected shareholders and reimbursed the Fund for all related audit and legal expenses.
The United States Securities and Exchange Commission ("SEC") is conducting an investigation of FMR (covering the years 2002 to 2004) arising from gifts, gratuities and business entertainment provided by certain brokers to certain individuals who were employed on FMR's domestic equity trading desk during that period. FMR is in discussions with the SEC staff regarding the possible resolution of the matter, but as of period-end no final resolution has been reached.
In December 2006, the Independent Trustees completed their own investigation of the matter with the assistance of independent counsel. The Independent Trustees and FMR agree that, despite the absence of proof that the Fidelity mutual funds experienced diminished execution quality as a result of the improper receipt of gifts and business entertainment, the conduct at issue was serious and is worthy of redress. Accordingly, the Independent Trustees have requested and FMR has agreed to pay $42 million to Fidelity mutual funds, plus interest to be determined at the time that payment is made. A method of allocating this payment among the funds has not yet been determined. The total payment to the Fund is not anticipated to have a material impact on the Fund's net assets. In addition, FMR reimbursed related legal expenses which are recorded in the accompanying Statement of Operations as an expense reduction.
Annual Report
Notes to Financial Statements - continued
(Amounts in thousands except ratios)
11. Distributions to Shareholders.
Distributions to shareholders of each class were as follows:
| Years ended October 31, |
| 2007 | 2006 |
From net investment income | | |
Class A | $ 1,387 | $ 38 |
Class T | 80 | 18 |
Class B | 21 | 3 |
Class C | 24 | 8 |
International Discovery | 84,038 | 41,152 |
Institutional Class | 312 | 105 |
Total | 85,862 | 41,324 |
From net realized gain | | |
Class A | 3,929 | 173 |
Class T | 302 | 102 |
Class B | 130 | 40 |
Class C | 170 | 94 |
International Discovery | 219,032 | 188,890 |
Institutional Class | 762 | 445 |
Total | $ 224,325 | $ 189,744 |
Annual Report
12. Share Transactions.
Transactions for each class of shares were as follows:
| Shares
Years ended October 31, | Dollars
Years ended October 31, |
| 2007 | 2006 | 2007 | 2006 |
Class A | | | | |
Shares sold | 5,675 | 3,952 | $ 234,633 | $ 133,777 |
Reinvestment of distributions | 63 | 5 | 2,271 | 160 |
Shares redeemed | (770) | (183) | (31,203) | (6,217) |
Net increase (decrease) | 4,968 | 3,774 | $ 205,701 | $ 127,720 |
Class T | | | | |
Shares sold | 1,031 | 248 | $ 42,252 | $ 8,469 |
Reinvestment of distributions | 10 | 4 | 371 | 112 |
Shares redeemed | (187) | (36) | (7,614) | (1,223) |
Net increase (decrease) | 854 | 216 | $ 35,009 | $ 7,358 |
Class B | | | | |
Shares sold | 293 | 112 | $ 11,952 | $ 3,875 |
Reinvestment of distributions | 4 | 1 | 136 | 37 |
Shares redeemed | (53) | (14) | (2,096) | (489) |
Net increase (decrease) | 244 | 99 | $ 9,992 | $ 3,423 |
Class C | | | | |
Shares sold | 481 | 130 | $ 19,749 | $ 4,409 |
Reinvestment of distributions | 4 | 1 | 139 | 41 |
Shares redeemed | (55) | (32) | (2,234) | (1,088) |
Net increase (decrease) | 430 | 99 | $ 17,654 | $ 3,362 |
International Discovery | | | | |
Shares sold | 133,089 | 123,095 | $ 5,367,776 | $ 4,201,412 |
Reinvestment of distributions | 7,929 | 7,089 | 289,550 | 215,944 |
Shares redeemed | (63,328) | (39,365) | (2,558,324) | (1,334,783) |
Net increase (decrease) | 77,690 | 90,819 | $ 3,099,002 | $ 3,082,573 |
Institutional Class | | | | |
Shares sold | 538 | 512 | $ 22,351 | $ 17,352 |
Reinvestment of distributions | 19 | 4 | 700 | 121 |
Shares redeemed | (120) | (61) | (5,000) | (2,086) |
Net increase (decrease) | 437 | 455 | $ 18,051 | $ 15,387 |
Annual Report
Report of Independent Registered Public Accounting Firm
To the Trustees of Fidelity Investment Trust and the Shareholders of Fidelity International Discovery Fund:
In our opinion, the accompanying statement of assets and liabilities, including the schedule of investments, and the related statements of operations and of changes in net assets and the financial highlights present fairly, in all material respects, the financial position of Fidelity International Discovery Fund (a fund of Fidelity Investment Trust) at October 31, 2007, the results of its operations for the year then ended, the changes in its net assets for each of the two years in the period then ended and the financial highlights for each of the periods indicated, in conformity with accounting principles generally accepted in the United States of America. These financial statements and financial highlights (hereafter referred to as "financial statements") are the responsibility of the Fidelity International Discovery Fund's management. Our responsibility is to express an opinion on these financial statements based on our audits. We conducted our audits of these financial statements in accordance with the standards of the Public Company Accounting Oversight Board (United States). Those standards require that we plan and perform the audit to obtain reasonable assurance about whether the financial statements are free of material misstatement. An audit includes examining, on a test basis, evidence supporting the amounts and disclosures in the financial statements, assessing the accounting principles used and significant estimates made by management, and evaluating the overall financial statement presentation. We believe that our audits, which included confirmation of securities at October 31, 2007 by correspondence with the custodian and brokers, provide a reasonable basis for our opinion.
/s/ PricewaterhouseCoopers LLP
PricewaterhouseCoopers LLP
Boston, Massachusetts
December 20, 2007
Annual Report
Trustees and Officers
The Trustees, Members of the Advisory Board, and executive officers of the trust, as applicable, are listed below. The Board of Trustees governs the fund and is responsible for protecting the interests of shareholders. The Trustees are experienced executives who meet periodically throughout the year to oversee the fund's activities, review contractual arrangements with companies that provide services to the fund, and review the fund's performance. Except for James C. Curvey, each of the Trustees oversees 370 funds advised by FMR or an affiliate. Mr. Curvey oversees 340 funds advised by FMR or an affiliate.
The Trustees hold office without limit in time except that (a) any Trustee may resign; (b) any Trustee may be removed by written instrument, signed by at least two-thirds of the number of Trustees prior to such removal; (c) any Trustee who requests to be retired or who has become incapacitated by illness or injury may be retired by written instrument signed by a majority of the other Trustees; and (d) any Trustee may be removed at any special meeting of shareholders by a two-thirds vote of the outstanding voting securities of the trust. Each Trustee who is not an interested person (as defined in the 1940 Act) (Independent Trustee), shall retire not later than the last day of the calendar year in which his or her 72nd birthday occurs. The Independent Trustees may waive this mandatory retirement age policy with respect to individual Trustees. The executive officers and Advisory Board Members hold office without limit in time, except that any officer and Advisory Board Member may resign or may be removed by a vote of a majority of the Trustees at any regular meeting or any special meeting of the Trustees. Except as indicated, each individual has held the office shown or other offices in the same company for the past five years.
The fund's Statement of Additional Information (SAI) includes more information about the Trustees. To request a free copy, call Fidelity at 1-800-544-8544.
Interested Trustees*:
Correspondence intended for each Trustee who is an interested person may be sent to Fidelity Investments, 82 Devonshire Street, Boston, Massachusetts 02109.
Name, Age; Principal Occupation |
Edward C. Johnson 3d (77) |
| Year of Election or Appointment: 1984 Mr. Johnson is Chairman of the Board of Trustees. Mr. Johnson serves as President (2006-present), Chief Executive Officer, Chairman, and a Director of FMR LLC; Chairman and a Director of FMR; Chairman and a Director of Fidelity Research & Analysis Company (FRAC); Chairman and a Director of Fidelity Investments Money Management, Inc.; and Chairman (2001-present) and a Director of FMR Co., Inc. In addition, Mr. Johnson serves as Chairman and Director of Fidelity International Limited (FIL). |
James C. Curvey (72) |
| Year of Election or Appointment: 2007 Mr. Curvey also serves as Trustee (2007-present) or Member of the Advisory Board (2007-present) of other investment companies advised by FMR. Mr. Curvey is a Director of FMR and FMR Co., Inc. (2007-present). Mr. Curvey is also Vice Chairman (2006-present) and Director of FMR LLC. Mr. Curvey joined Fidelity in 1982 and served in numerous senior management positions, including President and Chief Operating Officer of FMR LLC (1997-2000) and President of Fidelity Strategic Investments (2000-2002). In addition, he serves as a member of the Board of Directors of Geerlings & Wade, Inc. (wine distribution). |
* Trustees have been determined to be "Interested Trustees" by virtue of, among other things, their affiliation with the trust or various entities under common control with FMR. FMR Corp. merged with FMR LLC on October 1, 2007. Any references to FMR LLC for prior periods are deemed to be references to the prior entity.
Independent Trustees:
Correspondence intended for each Independent Trustee (that is, the Trustees other than the Interested Trustees) may be sent to Fidelity Investments, P.O. Box 55235, Boston, Massachusetts 02205-5235.
Name, Age; Principal Occupation |
Dennis J. Dirks (59) |
| Year of Election or Appointment: 2005 Prior to his retirement in May 2003, Mr. Dirks was Chief Operating Officer and a member of the Board of The Depository Trust & Clearing Corporation (DTCC) (1999-2003). He also served as President, Chief Operating Officer, and Board member of The Depository Trust Company (DTC) (1999-2003) and President and Board member of the National Securities Clearing Corporation (NSCC) (1999-2003). In addition, Mr. Dirks served as Chief Executive Officer and Board member of the Government Securities Clearing Corporation (2001-2003) and Chief Executive Officer and Board member of the Mortgage-Backed Securities Clearing Corporation (2001-2003). Mr. Dirks also serves as a Trustee and a member of the Finance Committee of Manhattan College (2005-present) and a Trustee and a member of the Finance Committee of AHRC of Nassau County (2006-present). |
Albert R. Gamper, Jr. (65) |
| Year of Election or Appointment: 2006 Prior to his retirement in December 2004, Mr. Gamper served as Chairman of the Board of CIT Group Inc. (commercial finance). During his tenure with CIT Group Inc. Mr. Gamper served in numerous senior management positions, including Chairman (1987-1989; 1999-2001; 2002-2004), Chief Executive Officer (1987-2004), and President (1989-2002). He currently serves as a member of the Board of Directors of Public Service Enterprise Group (utilities, 2001-present), Chairman of the Board of Governors, Rutgers University (2004-present), and Chairman of the Board of Saint Barnabas Health Care System. |
George H. Heilmeier (71) |
| Year of Election or Appointment: 2004 Dr. Heilmeier is Chairman Emeritus of Telcordia Technologies (communication software and systems), where prior to his retirement, he served as company Chairman and Chief Executive Officer. He currently serves on the Boards of Directors of The Mitre Corporation (systems engineering and information technology support for the government), and HRL Laboratories (private research and development, 2004-present). He is Chairman of the General Motors Science & Technology Advisory Board and a Life Fellow of the Institute of Electrical and Electronics Engineers (IEEE). Dr. Heilmeier is a member of the Defense Science Board and the National Security Agency Advisory Board. He is also a member of the National Academy of Engineering, the American Academy of Arts and Sciences, and the Board of Overseers of the School of Engineering and Applied Science of the University of Pennsylvania. Previously, Dr. Heilmeier served as a Director of TRW Inc. (automotive, space, defense, and information technology, 1992-2002), Compaq (1994-2002), Automatic Data Processing, Inc. (ADP) (technology-based business outsourcing, 1995-2002), INET Technologies Inc. (telecommunications network surveillance, 2001-2004), and Teletech Holdings (customer management services). He is the recipient of the 2005 Kyoto Prize in Advanced Technology for his invention of the liquid crystal display, and a member of the Consumer Electronics Hall of Fame. |
James H. Keyes (67) |
| Year of Election or Appointment: 2007 Prior to his retirement in 2003, Mr. Keyes was Chairman, President, and Chief Executive Officer of Johnson Controls, Inc. (automotive supplier, 1993-2003). He currently serves as a member of the boards of LSI Logic Corporation (semiconductor technologies), Navistar International Corporation (manufacture and sale of trucks, buses, and diesel engines, 2002-present), and Pitney Bowes, Inc. (integrated mail, messaging, and document management solutions). |
Marie L. Knowles (61) |
| Year of Election or Appointment: 2001 Prior to Ms. Knowles' retirement in June 2000, she served as Executive Vice President and Chief Financial Officer of Atlantic Richfield Company (ARCO) (diversified energy, 1996-2000). From 1993 to 1996, she was a Senior Vice President of ARCO and President of ARCO Transportation Company. She served as a Director of ARCO from 1996 to 1998. She currently serves as a Director of Phelps Dodge Corporation (copper mining and manufacturing) and McKesson Corporation (healthcare service, 2002-present). Ms. Knowles is a Trustee of the Brookings Institution and the Catalina Island Conservancy and also serves as a member of the Advisory Board for the School of Engineering of the University of Southern California. |
Ned C. Lautenbach (63) |
| Year of Election or Appointment: 2000 Mr. Lautenbach is Chairman of the Independent Trustees (2006-present). Mr. Lautenbach has been a partner of Clayton, Dubilier & Rice, Inc. (private equity investment firm) since September 1998. Previously, Mr. Lautenbach was with the International Business Machines Corporation (IBM) from 1968 until his retirement in 1998. Mr. Lautenbach serves as a Director of Sony Corporation (2006-present) and Eaton Corporation (diversified industrial) as well as the Philharmonic Center for the Arts in Naples, Florida. He also is a member of the Board of Trustees of Fairfield University (2005-present), as well as a member of the Council on Foreign Relations. |
Cornelia M. Small (63) |
| Year of Election or Appointment: 2005 Ms. Small is a member (2000-present) and Chairperson (2002-present) of the Investment Committee, and a member (2002-present) of the Board of Trustees of Smith College. Previously, she served as Chief Investment Officer (1999-2000), Director of Global Equity Investments (1996-1999), and a member of the Board of Directors of Scudder, Stevens & Clark (1990-1997) and Scudder Kemper Investments (1997-1999). In addition, Ms. Small served as Co-Chair (2000-2003) of the Annual Fund for the Fletcher School of Law and Diplomacy. |
William S. Stavropoulos (68) |
| Year of Election or Appointment: 2001 Mr. Stavropoulos is Chairman Emeritus of the Board of Directors of The Dow Chemical Company. Since joining The Dow Chemical Company in 1967, Mr. Stavropoulos served in numerous senior management positions, including President (1993-2000; 2002-2003), CEO (1995-2000; 2002-2004), and Chairman of the Executive Committee (2000-2004). Currently, he is a Director of NCR Corporation (data warehousing and technology solutions), Chemical Financial Corporation, Maersk Inc. (industrial conglomerate, 2002-present), Tyco International, Inc. (multinational manufacturing and services, 2007-present), and a member of the Advisory Board for Metalmark Capital (private equity investment firm, 2005-present). He is a special advisor to Clayton, Dubilier & Rice, Inc., a private equity investment firm. He also serves as a member of the Board of Trustees of the American Enterprise Institute for Public Policy Research. In addition, Mr. Stavropoulos is a member of The Business Council, J.P. Morgan International Council and the University of Notre Dame Advisory Council for the College of Science. |
Kenneth L. Wolfe (68) |
| Year of Election or Appointment: 2005 Prior to his retirement in 2001, Mr. Wolfe was Chairman and Chief Executive Officer of Hershey Foods Corporation (1993-2001). He currently serves as a member of the boards of Adelphia Communications Corporation (2003-present), Bausch & Lomb, Inc., and Revlon Inc. (2004-present). |
Advisory Board Members and Executive Officers**:
Correspondence intended for Mr. Mauriello and Mr. Wiley may be sent to Fidelity Investments, P.O. Box 55235, Boston, Massachusetts 02205-5235. Correspondence intended for each executive officer and Mr. Lynch may be sent to Fidelity Investments, 82 Devonshire Street, Boston, Massachusetts 02109.
Name, Age; Principal Occupation |
Peter S. Lynch (63) |
| Year of Election or Appointment: 2003 Member of the Advisory Board of Fidelity Investment Trust. Mr. Lynch is Vice Chairman and a Director of FMR, and Vice Chairman (2001-present) and a Director of FMR Co., Inc. Previously, Mr. Lynch served as a Trustee of the Fidelity funds (1990-2003). In addition, he serves as a Trustee of Boston College and as the Chairman of the Inner-City Scholarship Fund. |
Joseph Mauriello (63) |
| Year of Election or Appointment: 2007 Member of the Advisory Board of Fidelity Investment Trust. Prior to his retirement in January 2006, Mr. Mauriello served in numerous senior management positions including Deputy Chairman and Chief Operating Officer (2004-2005), and Vice Chairman of Financial Services (2002-2004) of KPMG LLP US (professional services firm, 1965-2005). Mr. Mauriello currently serves as a member of the Board of Directors of XL Capital Ltd., (global insurance and re-insurance company, 2006-present) and of Arcadia Resources Inc., (health care services and products, 2007-present). He also served as a Director of the Hamilton Funds of the Bank of New York (2006-2007). |
David M. Thomas (58) |
| Year of Election or Appointment: 2007 Previously, Mr. Thomas served as Executive Chairman (2005-2006) and Chairman and Chief Executive Officer (2000-2005) of IMS Health, Inc. (pharmaceutical and healthcare information solutions). In addition, Mr. Thomas serves as a member of the Board of Directors of Fortune Brands, Inc. (consumer products holding company), and Interpublic Group of Companies, Inc. (marketing communication, 2004-present). |
Michael E. Wiley (57) |
| Year of Election or Appointment: 2007 Member of the Advisory Board of Fidelity Investment Trust. Mr. Wiley also serves as Sr. Energy Advisor of Katzenbach Partners, LLC (consulting firm, 2006-present) and a member of the Board of Trustees of the University of Tulsa (2000-2006; 2007-present). He serves as a Director of Tesoro Corporation (independent oil refiner and marketer, 2005-present), and a Director of Bill Barrett Corporation (exploration and production company, 2005-present). In addition, he also serves as a Director of Post Oak Bank (privately-held bank, 2004-present), and an Advisory Director of Riverstone Holdings (private investment firm). Previously, Mr. Wiley served as Chairman, President, and CEO of Baker Hughes, Inc. (oilfield services company, 2000-2004), and as Director of Spinnaker Exploration Company (exploration and production company, 2001-2005). |
Kimberley H. Monasterio (43) |
| Year of Election or Appointment: 2007 President and Treasurer of International Discovery. Ms. Monasterio also serves as President and Treasurer of other Fidelity funds (2007-present) and is an employee of FMR (2004-present). Previously, Ms. Monasterio served as Deputy Treasurer of the Fidelity funds (2004-2006). Before joining Fidelity Investments, Ms. Monasterio served as Treasurer (2000-2004) and Chief Financial Officer (2002-2004) of the Franklin Templeton Funds and Senior Vice President of Franklin Templeton Services, LLC (2000-2004). |
Walter C. Donovan (45) |
| Year of Election or Appointment: 2007 Vice President of International Discovery. Mr. Donovan also serves as Vice President of Fidelity's Equity Funds (2007-present). Mr. Donovan also serves as Executive Vice President of FMR (2005-present) and FMR Co., Inc. (2005-present). Previously, Mr. Donovan served as Vice President of Fidelity's High Income Funds (2005-2007), Fixed-Income Funds (2005-2006), certain Asset Allocation Funds (2005-2006), certain Balanced Funds (2005-2006), and as Vice President and Director of Fidelity's International Equity Trading group (1998-2005). |
Eric M. Wetlaufer (45) |
| Year of Election or Appointment: 2006 Vice President of International Discovery. Mr. Wetlaufer also serves as Vice President of certain International Equity Funds (2006-present). Mr. Wetlaufer is Senior Vice President of FMR (2006-present) and FMR Co., Inc. (2006-present), and President and Director of Fidelity Management & Research (U.K.) Inc. (2006-present) and Fidelity Research & Analysis Company (2006-present). Before joining Fidelity Investments in 2005, Mr. Wetlaufer was a partner in Oxhead Capital Management (2004-2005). Previously, Mr. Wetlaufer served as a Chief Investment Officer of Putnam Investments (1997-2003). |
Eric D. Roiter (58) |
| Year of Election or Appointment: 1998 Secretary of International Discovery. He also serves as Secretary of other Fidelity funds; Vice President, General Counsel, and Secretary of FMR Co., Inc. (2001-present) and FMR; Assistant Secretary of Fidelity Management & Research (U.K.) Inc. (2001-present), Fidelity Research & Analysis Company (2001-present), and Fidelity Investments Money Management, Inc. (2001-present). Mr. Roiter is an Adjunct Member, Faculty of Law, at Boston College Law School (2003-present). Previously, Mr. Roiter served as Vice President and Secretary of Fidelity Distributors Corporation (FDC) (1998-2005). |
Scott C. Goebel (39) |
| Year of Election or Appointment: 2007 Assistant Secretary of International Discovery. Mr. Goebel also serves as Assistant Secretary of other Fidelity funds (2007-present), and is an employee of FMR. |
R. Stephen Ganis (41) |
| Year of Election or Appointment: 2006 Anti-Money Laundering (AML) officer of International Discovery. Mr. Ganis also serves as AML officer of other Fidelity funds (2006-present) and FMR LLC (2003-present). Before joining Fidelity Investments, Mr. Ganis practiced law at Goodwin Procter, LLP (2000-2002). |
Joseph B. Hollis (59) |
| Year of Election or Appointment: 2006 Chief Financial Officer of International Discovery. Mr. Hollis also serves as Chief Financial Officer of other Fidelity funds. Mr. Hollis is President of Fidelity Pricing and Cash Management Services (FPCMS) (2005-present). Mr. Hollis also serves as President and Director of Fidelity Service Company, Inc. (2006-present). Previously, Mr. Hollis served as Senior Vice President of Cash Management Services (1999-2002) and Investment Management Operations (2002-2005). |
Kenneth A. Rathgeber (60) |
| Year of Election or Appointment: 2004 Chief Compliance Officer of International Discovery. Mr. Rathgeber also serves as Chief Compliance Officer of other Fidelity funds (2004-present) and Executive Vice President of Risk Oversight for Fidelity Investments (2002-present). He is Chief Compliance Officer of FMR (2005-present), FMR Co., Inc. (2005-present), Fidelity Management & Research (U.K.) Inc. (2005-present), Fidelity Research & Analysis Company (2005-present), Fidelity Investments Money Management, Inc. (2005-present), and Strategic Advisers, Inc. (2005-present). Previously, Mr. Rathgeber served as Executive Vice President and Chief Operating Officer for Fidelity Investments Institutional Services Company, Inc. (1998-2002). |
Bryan A. Mehrmann (46) |
| Year of Election or Appointment: 2005 Deputy Treasurer of International Discovery. Mr. Mehrmann also serves as Deputy Treasurer of other Fidelity funds (2005-present) and is an employee of FMR. Previously, Mr. Mehrmann served as Vice President of Fidelity Investments Institutional Services Group (FIIS)/Fidelity Investments Institutional Operations Corporation, Inc. (FIIOC) Client Services (1998-2004). |
Kenneth B. Robins (38) |
| Year of Election or Appointment: 2005 Deputy Treasurer of International Discovery. Mr. Robins also serves as Deputy Treasurer of other Fidelity funds (2005-present) and is an employee of FMR (2004-present). Before joining Fidelity Investments, Mr. Robins worked at KPMG LLP, where he was a partner in KPMG's department of professional practice (2002-2004) and a Senior Manager (1999-2000). In addition, Mr. Robins served as Assistant Chief Accountant, United States Securities and Exchange Commission (2000-2002). |
Robert G. Byrnes (40) |
| Year of Election or Appointment: 2005 Assistant Treasurer of International Discovery. Mr. Byrnes also serves as Assistant Treasurer of other Fidelity funds (2005-present) and is an employee of FMR (2005-present). Previously, Mr. Byrnes served as Vice President of FPCMS (2003-2005). Before joining Fidelity Investments, Mr. Byrnes worked at Deutsche Asset Management where he served as Vice President of the Investment Operations Group (2000-2003). |
Peter L. Lydecker (53) |
| Year of Election or Appointment: 2004 Assistant Treasurer of International Discovery. Mr. Lydecker also serves as Assistant Treasurer of other Fidelity funds (2004) and is an employee of FMR. |
Paul M. Murphy (60) |
| Year of Election or Appointment: 2007 Assistant Treasurer of International Discovery. Mr. Murphy also serves as Assistant Treasurer of other Fidelity funds (2007-present) and is an employee of FMR (2007-present). Previously, Mr. Murphy served as Chief Financial Officer of the Fidelity Funds (2005-2006), Vice President and Associate General Counsel of FMR (2007), and Senior Vice President of Fidelity Pricing and Cash Management Services Group (FPCMS) (1994-2007). |
Gary W. Ryan (49) |
| Year of Election or Appointment: 2005 Assistant Treasurer of International Discovery. Mr. Ryan also serves as Assistant Treasurer of other Fidelity funds (2005-present) and is an employee of FMR (2005-present). Previously, Mr. Ryan served as Vice President of Fund Reporting in FPCMS (1999-2005). |
** FMR Corp. merged with FMR LLC on October 1, 2007. Any references to FMR LLC for prior periods are deemed to be references to the prior entity.
Annual Report
Distributions
The Board of Trustees of International Discovery Fund voted to pay to shareholders of record at the opening of business on record date, the following distributions per share derived from capital gains realized from sales of portfolio securities, and dividends derived from net investment income:
| Pay Date | Record Date | Dividends | Capital Gains |
International
Discovery | 12/10/07 | 12/07/07 | $0.412 | $1.67 |
The fund hereby designates as a capital gain dividend with respect to the taxable year ended October 31, 2007 $495,087,413 or, if subsequently determined to be different, the net capital gain of such year.
International Discovery Fund designates 69% of the dividend distributed during the fiscal year as amounts which may be taken into account as a dividend for purposes of the maximum rate under section 1(h)(11) of the Internal Revenue Code.
The amounts per share which represent income derived from sources within, and taxes paid to, foreign countries or possessions of the United States are as follows:
| Pay Date | Income | Taxes |
International
Discovery | 12/04/06 | $.364 | $.0278 |
The fund will notify shareholders in January 2008 of amounts for use in preparing 2007 income tax returns.
Annual Report
Board Approval of Investment Advisory Contracts and Management Fees
Fidelity International Discovery Fund
Each year, typically in July, the Board of Trustees, including the Independent Trustees (together, the Board), votes on the renewal of the management contract and sub-advisory agreements (together, the Advisory Contracts) for the fund. The Board, assisted by the advice of fund counsel and Independent Trustees' counsel, requests and considers a broad range of information throughout the year.
The Board meets regularly each month except August and takes into account throughout the year matters bearing on Advisory Contracts. The Board, acting directly and through its separate committees, considers at each of its meetings factors that are relevant to the annual renewal of the fund's Advisory Contracts, including the services and support provided to the fund and its shareholders. At the time of the renewal, the Board had 12 standing committees, each composed of Independent Trustees with varying backgrounds, to which the Board has assigned specific subject matter responsibilities in order to enhance effective decision-making by the Board. Each committee has adopted a written charter outlining the structure and purposes of the committee. One such committee, the Equity Contract Committee, meets periodically as needed throughout the year to consider matters specifically related to the annual renewal of Advisory Contracts. The committee requests and receives information on, and makes recommendations to the Independent Trustees concerning, the approval and annual review of the Advisory Contracts.
At its July 2007 meeting, the Board of Trustees, including the Independent Trustees, unanimously determined to renew the Advisory Contracts for the fund. In reaching its determination, the Board considered all factors it believed relevant, including (i) the nature, extent, and quality of the services to be provided to the fund and its shareholders (including the investment performance of the fund); (ii) the competitiveness of the management fee and total expenses of the fund; (iii) the total costs of the services to be provided by and the profits to be realized by the investment adviser and its affiliates from the relationship with the fund; (iv) the extent to which economies of scale would be realized as the fund grows; and (v) whether fee levels reflect these economies of scale, if any, for the benefit of fund shareholders. The Board also approved amendments to the fund's agreements with foreign sub-advisers to clarify that each sub-adviser provides services as an independent contractor.
In determining whether to renew the Advisory Contracts for the fund, the Board ultimately reached a determination, with the assistance of fund counsel and Independent Trustees' counsel, that the renewal of the Advisory Contracts and the compensation to be received by Fidelity under the management contract is consistent with Fidelity's fiduciary duty under applicable law. In addition to evaluating the specific factors noted above, the Board, in reaching its determination, is aware that shareholders in the fund have a broad range of investment choices available to them, including a wide choice among mutual funds offered by competitors to Fidelity, and that the fund's shareholders, with the opportunity to review and weigh the disclosure provided by the fund in its prospectus and other public disclosures, have chosen to invest in this fund, managed by Fidelity.
Annual Report
Nature, Extent, and Quality of Services Provided. The Board considered staffing within the investment adviser, FMR, and the sub-advisers (together, the Investment Advisers), including the background of the fund's portfolio manager and the fund's investment objective and discipline. The Independent Trustees also had discussions with senior management of Fidelity's investment operations and investment groups. The Board considered the structure of the portfolio manager compensation program and whether this structure provides appropriate incentives.
Resources Dedicated to Investment Management and Support Services. The Board reviewed the size, education, and experience of the Investment Advisers' investment staff, their use of technology, and the Investment Advisers' approach to recruiting, training, and retaining portfolio managers and other research, advisory, and management personnel. The Board considered Fidelity's extensive global research capabilities that enable the Investment Advisers to aggregate data from various sources in an effort to produce positive investment results. The Board noted that Fidelity's analysts have access to a variety of technological tools that enable them to perform both fundamental and quantitative analysis and to specialize in various disciplines. The Board also considered that Fidelity's portfolio managers and analysts have access to daily portfolio attribution that allows for monitoring of a fund's portfolio, as well as an electronic communication system that provides immediate real-time access to research concerning issuers and credit enhancers.
Shareholder and Administrative Services. The Board considered (i) the nature, extent, quality, and cost of advisory, administrative, distribution, and shareholder services performed by the Investment Advisers and their affiliates under the Advisory Contracts and under separate agreements covering transfer agency, pricing and bookkeeping, and securities lending services for the fund; (ii) the nature and extent of the Investment Advisers' supervision of third party service providers, principally custodians and subcustodians; and (iii) the resources devoted to, and the record of compliance with, the fund's compliance policies and procedures. The Board reviewed the allocation of fund brokerage, including allocations to brokers affiliated with the Investment Advisers, the use of brokerage commissions to pay fund expenses, and the use of "soft" commission dollars to pay for research services. The Board also considered that Fidelity voluntarily pays for market data out of its own resources. The Board also considered the agreement reached between the Independent Trustees and Fidelity in December 2006 following an independent review of matters relating to receipt of travel, entertainment, gifts and gratuities in violation of Fidelity policies.
Annual Report
Board Approval of Investment Advisory Contracts and
Management Fees - continued
The Board noted that the growth of fund assets across the complex allows Fidelity to reinvest in the development of services designed to enhance the value or convenience of the Fidelity funds as investment vehicles. These services include 24-hour access to account information and market information through phone representatives and over the Internet, and investor education materials and asset allocation tools.
Investment in a Large Fund Family. The Board considered the benefits to shareholders of investing in a Fidelity fund, including the benefits of investing in a fund that is part of a large family of funds offering a variety of investment disciplines and providing for a large variety of mutual fund investor services. For example, fund shareholders are offered the privilege of exchanging shares of the fund for shares of other Fidelity funds, as set forth in the fund's prospectus, without paying a sales charge. The Board noted that, since the last Advisory Contract renewals in July 2006, Fidelity has taken a number of actions that benefited particular funds, including (i) dedicating additional resources to investment research and to restructure the investment research teams; (ii) contractually agreeing to reduce the management fee on Fidelity Advisor Floating Rate High Income Fund; (iii) contractually agreeing to reduce the management fees on Fidelity's California, Massachusetts, New Jersey, and New York AMT Tax-Free Money Market Funds, launching new Institutional Classes and Service Classes of these funds, and contractually agreeing to impose expense limitations on these funds; (iv) eliminating the exchange fee on the Fidelity Select Portfolios and reducing the pricing and bookkeeping fee rates for these funds; (v) reducing the maximum transfer agency fee rates on high income funds and certain equity funds; (vi) proposing amended management contracts that, if approved by shareholders, will add a performance adjustment component to the management fees paid by 18 Fidelity Advisor equity funds; (vii) contractually agreeing to reduce fees for Ultra-Short Central Fund and the money market Central Funds; (viii) waiving the Fidelity Advisor funds' contingent deferred sales charge on certain redemptions made through systematic withdrawal programs; and (ix) amending the management contracts for equity and fixed-income funds whose management contracts incorporate a "group fee" structure by adding four new fee "breakpoints" to the group fee rate schedules.
Investment Performance and Compliance. The Board considered whether the fund has operated within its investment objective, as well as its record of compliance with its investment restrictions. It also reviewed the fund's absolute investment performance for each class, as well as the fund's relative investment performance for each class measured against (i) a broad-based securities market index, and (ii) a peer group of mutual funds deemed appropriate by the Board over multiple periods. The following charts considered by the Board show, over the one-, three-, and five-year periods ended December 31, 2006, as available, the cumulative total returns of Fidelity International Discovery (retail class) and Class C of the fund, the cumulative total returns of a broad-based securities market index ("benchmark"), and a range of cumulative total returns of a peer group of mutual funds identified by Morningstar, Inc. as having an investment style similar to that of the fund based on underlying portfolio holdings. The returns of Fidelity International Discovery (retail class) and Class C show the performance of the highest and lowest performing classes, respectively. The box within each chart shows the 25th percentile return (bottom of box) and the 75th percentile return (top of box) of the peer group. Returns shown above the box are in the first quartile and returns shown below the box are in the fourth quartile. The percentage beaten numbers noted below each chart correspond to the percentile box and represent the percentage of funds in the peer group whose performance was equal to or lower than that of the class indicated.
Annual Report
Fidelity International Discovery Fund
The Board reviewed the fund's relative investment performance against its peer group and stated that the performance of Fidelity International Discovery (retail class) was in the third quartile for the one-year period and the first quartile for the three- and five-year periods. The Board also stated that the investment performance of Fidelity International Discovery (retail class) compared favorably to its benchmark for the three- and five-year periods, although the fund's one-year cumulative total return was lower than its benchmark. The Board considered that the variations in performance among the fund's classes reflect the variations in class expenses, which result in lower performance for higher expense classes.
The Board also considered that the fund's management fee is subject to upward or downward adjustment depending upon whether, and to what extent, the fund's investment performance for the performance period exceeds, or is exceeded by, the record (over the same period) of a Board-approved performance adjustment index. The Board realizes that the performance adjustment provides FMR with a strong economic incentive to seek to achieve superior performance for the fund's shareholders and helps to more closely align the interests of FMR and the fund's shareholders.
Annual Report
Board Approval of Investment Advisory Contracts and
Management Fees - continued
The Board considered that FMR has taken steps to refocus and strengthen equity research, equity portfolio management, and compliance.
Based on its review, and giving particular weight to the nature and quality of the resources dedicated by the Investment Advisers to maintain and improve relative performance, the Board concluded that the nature, extent, and quality of the services provided to the fund will benefit the fund's shareholders, particularly in light of the Board's view that the fund's shareholders benefit from investing in a fund that is part of a large family of funds offering a variety of investment disciplines and services.
Competitiveness of Management Fee and Total Fund Expenses. The Board considered the fund's management fee and total expenses compared to "mapped groups" of competitive funds and classes. Fidelity creates "mapped groups" by combining similar Lipper investment objective categories that have comparable management fee characteristics. Combining Lipper investment objective categories aids the Board's management fee and total expense comparisons by broadening the competitive group used for comparison and by reducing the number of universes to which various Fidelity funds are compared. The Board also considered supplemental information about how the fund's management fee and total expenses ranked relative to groups based on Lipper classifications, which take into account a fund's market capitalization and style.
The Board considered two proprietary management fee comparisons for the 12-month periods shown in the chart below. The group of Lipper funds used by the Board for management fee comparisons is referred to below as the "Total Mapped Group." The Total Mapped Group comparison focuses on a fund's standing relative to the total universe of comparable funds available to investors, in terms of gross management fees before expense reimbursements or caps, and without giving effect to the fund's performance adjustment. "TMG %" represents the percentage of funds in the Total Mapped Group that had management fees that were lower than the fund's. For example, a TMG % of 13% means that 87% of the funds in the Total Mapped Group had higher management fees than the fund. The "Asset-Size Peer Group" (ASPG) comparison focuses on a fund's standing relative to non-Fidelity funds similar in size to the fund within the Total Mapped Group. The ASPG represents at least 15% of the funds in the Total Mapped Group with comparable asset size and management fee characteristics, subject to a minimum of 50 funds (or all funds in the Total Mapped Group if fewer than 50). Additional information, such as the ASPG quartile in which the fund's management fee ranked and the impact of the fund's performance adjustment, is also included in the chart and considered by the Board.
Annual Report
Fidelity International Discovery Fund

The Board noted that the fund's management fee ranked below the median of its Total Mapped Group and below the median of its ASPG for 2006. The Board also noted the effect of the fund's positive performance adjustment on the fund's management fee ranking. The Board noted that the performance adjustment for each year represents calculations for performance periods that differ from the periods shown in the performance charts above.
Based on its review, the Board concluded that the fund's management fee was fair and reasonable in light of the services that the fund receives and the other factors considered.
In its review of each class's total expenses, the Board considered the fund's management fee as well as other fund or class expenses, as applicable, such as transfer agent fees, pricing and bookkeeping fees, fund-paid 12b-1 fees, and custodial, legal, and audit fees. The Board also noted the effects of any waivers and reimbursements on fees and expenses, as well as the fund's positive performance adjustment. As part of its review, the Board also considered current and historical total expenses of each class of the fund compared to competitive fund median expenses. Each class of the fund is compared to those funds and classes in the Total Mapped Group (used by the Board for management fee comparisons) that have a similar sales load structure.
The Board noted that the total expenses of each of Class A, Class C, Institutional Class and Fidelity International Discovery (retail class) ranked below its competitive median for 2006, the total expenses of Class B ranked equal to its competitive median for 2006, and the total expenses of Class T ranked above its competitive median for 2006. The Board noted that the fund offers multiple classes, each of which has a different sales load and 12b-1 fee structure, and that the multiple structures are intended to offer a range of pricing options for the intermediary market. The Board also noted that the total expenses of the classes vary primarily by the level of their 12b-1 fees, although differences in transfer agent fees may also cause expenses to vary from class to class.
Annual Report
Board Approval of Investment Advisory Contracts and
Management Fees - continued
In its review of total expenses, the Board also considered Fidelity fee structures and other information on clients that FMR and its affiliates service in other competitive markets, such as other mutual funds advised or subadvised by FMR or its affiliates, pension plan clients, and other institutional clients.
Based on its review, the Board concluded that the total expenses of each class of the fund were reasonable, although in one case above the median of the universe presented for comparison, in light of the services that the fund and its shareholders receive and the other factors considered.
Costs of the Services and Profitability. The Board considered the revenues earned and the expenses incurred by Fidelity in conducting the business of developing, marketing, distributing, managing, administering and servicing the fund and its shareholders. The Board also considered the level of Fidelity's profits in respect of all the Fidelity funds.
On an annual basis, FMR presents to the Board Fidelity's profitability for the fund. Fidelity calculates the profitability for each fund, as well as aggregate profitability for groups of Fidelity funds and all Fidelity funds, using a series of detailed revenue and cost allocation methodologies which originate with the audited books and records of Fidelity. The Audit Committee of the Board reviews any significant changes from the prior year's methodologies.
PricewaterhouseCoopers LLP (PwC), independent registered public accounting firm and auditor to Fidelity and certain Fidelity funds, has been engaged annually by the Board as part of the Board's assessment of the results of Fidelity's profitability analysis. PwC's engagement includes the review and assessment of Fidelity's methodologies used in determining the revenues and expenses attributable to Fidelity's mutual fund business, and completion of agreed-upon procedures surrounding the mathematical accuracy of fund profitability and its conformity to allocation methodologies. After considering PwC's reports issued under the engagement and information provided by Fidelity, the Board believes that while other allocation methods may also be reasonable, Fidelity's profitability methodologies are reasonable in all material respects.
The Board has also reviewed Fidelity's non-fund businesses and any fall-out benefits related to the mutual fund business as well as cases where Fidelity's affiliates may benefit from or be related to the fund's business.
The Board considered the costs of the services provided by and the profits realized by Fidelity in connection with the operation of the fund and determined that the amount of profit is a fair entrepreneurial profit for the management of the fund.
Annual Report
Economies of Scale. The Board considered whether there have been economies of scale in respect of the management of the Fidelity funds, whether the Fidelity funds (including the fund) have appropriately benefited from any such economies of scale, and whether there is potential for realization of any further economies of scale. The Board considered the extent to which the fund will benefit from economies of scale through increased services to the fund, through waivers or reimbursements, or through fee or expense reductions, including reductions that occur through operation of the transfer agent agreement. The transfer agent fee varies in part based on the number of accounts in the fund. If the number of accounts decreases or the average account size increases, the overall transfer agent fee rate decreases.
The Board recognized that the fund's management contract incorporates a "group fee" structure, which provides for lower group fee rates as total fund assets under FMR's management increase, and for higher group fee rates as total fund assets under FMR's management decrease. FMR determines the group fee rates based on a tiered asset "breakpoint" schedule. In connection with the renewal of the fund's management contract, the Board approved amendments to the fund's management contract that added four new fee breakpoints to the group fee rate schedule for assets under FMR's management above $1,386 billion. The Board considered that the group fee rate declines under both the present and amended schedules, but that under the amended schedule, the group fee rate declines faster as assets under FMR's management exceed $1,386 billion. The Board considered that the group fee is designed to deliver the benefits of economies of scale to fund shareholders when total fund assets increase, even if assets of any particular fund are unchanged or have declined, because some portion of Fidelity's costs are attributable to services provided to all Fidelity funds, and all funds benefit if those costs can be allocated among more assets. The Board concluded that, given the group fee structure, fund shareholders will achieve a certain level of economies of scale as assets under FMR's management increase at the fund complex level, regardless of whether Fidelity achieves any such economies of scale.
The Board further concluded that any potential economies of scale are being shared between fund shareholders and Fidelity in an appropriate manner.
Additional Information Requested by the Board. In order to develop fully the factual basis for consideration of the Fidelity funds' Advisory Contracts, the Board requested and received additional information on several topics, including (i) fund performance trends and actions to be taken by FMR to improve certain funds' overall performance; (ii) Fidelity's portfolio manager compensation structure, including its effects on fund profitability and the extent to which portfolio manager compensation is linked to fund performance; (iii) Fidelity's fee structures; (iv) the funds' sub-advisory arrangements; and (v) accounts managed by Fidelity other than the Fidelity funds.
Annual Report
Board Approval of Investment Advisory Contracts and
Management Fees - continued
Based on its evaluation of all of the conclusions noted above, and after considering all material factors, the Board ultimately concluded that the advisory fee structures are fair and reasonable, and that the fund's Advisory Contracts should be renewed.
Annual Report
Managing Your Investments
Fidelity offers several ways to conveniently manage your personal investments via your telephone or PC. You can access your account information, conduct trades and research your investments 24 hours a day.
By Phone
Fidelity Automated Service Telephone provides a single toll-free number to access account balances, positions, quotes and trading. It's easy to navigate the service, and on your first call, the system will help you create a personal identification number (PIN) for security.
(phone_graphic)
Fidelity Automated
Service Telephone (FAST®)
1-800-544-5555
Press
1 For mutual fund and brokerage trading.
2 For quotes.*
3 For account balances and holdings.
4 To review orders and mutual
fund activity.
5 To change your PIN.
*0 To speak to a Fidelity representative.
By PC
Fidelity's web site on the Internet provides a wide range of information, including daily financial news, fund performance, interactive planning tools and news about Fidelity products and services.
(computer_graphic)
Fidelity's Web Site
www.fidelity.com
* When you call the quotes line, please remember that a fund's yield and return will vary and, except for money market funds, share price will also vary. This means that you may have a gain or loss when you sell your shares. There is no assurance that money market funds will be able to maintain a stable $1 share price; an investment in a money market fund is not insured or guaranteed by the U.S. government. Total returns are historical and include changes in share price, reinvestment of dividends and capital gains, and the effects of any sales charges.
Annual Report
To Visit Fidelity
For directions and hours,
please call 1-800-544-9797.
Arizona
7001 West Ray Road
Chandler, AZ
15445 N. Scottsdale Road
Scottsdale, AZ
California
815 East Birch Street
Brea, CA
1411 Chapin Avenue
Burlingame, CA
851 East Hamilton Avenue
Campbell, CA
19200 Von Karman Avenue
Irvine, CA
601 Larkspur Landing Circle
Larkspur, CA
10100 Santa Monica Blvd.
Los Angeles, CA
27101 Puerta Real
Mission Viejo, CA
73-575 El Paseo
Palm Desert, CA
251 University Avenue
Palo Alto, CA
123 South Lake Avenue
Pasadena, CA
16995 Bernardo Ctr. Drive
Rancho Bernardo, CA
1220 Roseville Parkway
Roseville, CA
1740 Arden Way
Sacramento, CA
7676 Hazard Center Drive
San Diego, CA
11943 El Camino Real
San Diego, CA
8 Montgomery Street
San Francisco, CA
3793 State Street
Santa Barbara, CA
1200 Wilshire Boulevard
Santa Monica, CA
21701 Hawthorne Boulevard
Torrance, CA
2001 North Main Street
Walnut Creek, CA
6300 Canoga Avenue
Woodland Hills, CA
Colorado
1625 Broadway
Denver, CO
9185 Westview Road
Lone Tree, CO
Connecticut
48 West Putnam Avenue
Greenwich, CT
265 Church Street
New Haven, CT
300 Atlantic Street
Stamford, CT
29 South Main Street
West Hartford, CT
Delaware
400 Delaware Avenue
Wilmington, DE
Florida
4400 N. Federal Highway
Boca Raton, FL
121 Alhambra Plaza
Coral Gables, FL
2948 N. Federal Highway
Ft. Lauderdale, FL
4671 Town Center Parkway
Jacksonville, FL
1907 West State Road 434
Longwood, FL
8880 Tamiami Trail, North
Naples, FL
3501 PGA Boulevard
Palm Beach Gardens, FL
3550 Tamiami Trail, South
Sarasota, FL
1502 N. Westshore Blvd.
Tampa, FL
2465 State Road 7
Wellington, FL
Georgia
3445 Peachtree Road, N.E.
Atlanta, GA
1000 Abernathy Road
Atlanta, GA
Illinois
One North LaSalle Street
Chicago, IL
875 North Michigan Ave.
Chicago, IL
1415 West 22nd Street
Oak Brook, IL
1572 East Golf Road
Schaumburg, IL
3232 Lake Avenue
Wilmette, IL
Indiana
4729 East 82nd Street
Indianapolis, IN
Kansas
5400 College Boulevard
Overland Park, KS
Maine
Three Canal Plaza
Portland, ME
Maryland
7315 Wisconsin Avenue
Bethesda, MD
One W. Pennsylvania Ave.
Towson, MD
Massachusetts
801 Boylston Street
Boston, MA
155 Congress Street
Boston, MA
300 Granite Street
Braintree, MA
44 Mall Road
Burlington, MA
238 Main Street
Cambridge, MA
405 Cochituate Road
Framingham, MA
416 Belmont Street
Worcester, MA
Annual Report
Michigan
500 E. Eisenhower Pkwy.
Ann Arbor, MI
280 Old N. Woodward Ave.
Birmingham, MI
43420 Grand River Avenue
Novi, MI
29155 Northwestern Hwy.
Southfield, MI
Minnesota
7600 France Avenue South
Edina, MN
Missouri
1524 South Lindbergh Blvd.
St. Louis, MO
Nevada
2225 Village Walk Drive
Henderson, NV
New Jersey
150 Essex Street
Millburn, NJ
56 South Street
Morristown, NJ
396 Route 17, North
Paramus, NJ
3518 Route 1 North
Princeton, NJ
530 Broad Street
Shrewsbury, NJ
New York
1055 Franklin Avenue
Garden City, NY
37 West Jericho Turnpike
Huntington Station, NY
1271 Avenue of the Americas
New York, NY
980 Madison Avenue
New York, NY
61 Broadway
New York, NY
350 Park Avenue
New York, NY
200 Fifth Avenue
New York, NY
733 Third Avenue
New York, NY
11 Penn Plaza
New York, NY
2070 Broadway
New York, NY
1075 Northern Blvd.
Roslyn, NY
799 Central Park Avenue
Scarsdale, NY
North Carolina
4611 Sharon Road
Charlotte, NC
7011 Fayetteville Road
Durham, NC
Ohio
3805 Edwards Road
Cincinnati, OH
1324 Polaris Parkway
Columbus, OH
28699 Chagrin Boulevard
Woodmere Village, OH
Oregon
7493 SW Bridgeport Road
Tigard, OR
Pennsylvania
600 West DeKalb Pike
King of Prussia, PA
1735 Market Street
Philadelphia, PA
12001 Perry Highway
Wexford, PA
Rhode Island
47 Providence Place
Providence, RI
Tennessee
6150 Poplar Avenue
Memphis, TN
Texas
10000 Research Boulevard
Austin, TX
4001 Northwest Parkway
Dallas, TX
12532 Memorial Drive
Houston, TX
2701 Drexel Drive
Houston, TX
6560 Fannin Street
Houston, TX
6500 N. MacArthur Blvd.
Irving, TX
6005 West Park Boulevard
Plano, TX
14100 San Pedro
San Antonio, TX
1576 East Southlake Blvd.
Southlake, TX
19740 IH 45 North
Spring, TX
Utah
279 West South Temple
Salt Lake City, UT
Virginia
1861 International Drive
McLean, VA
Washington
411 108th Avenue, N.E.
Bellevue, WA
1518 6th Avenue
Seattle, WA
Washington, DC
1900 K Street, N.W.
Washington, DC
Wisconsin
595 North Barker Road
Brookfield, WI
Fidelity Brokerage Services, Inc., 100 Summer St., Boston, MA 02110 Member NYSE/SIPC
Annual Report
To Write Fidelity
We'll give your correspondence immediate attention and send you written confirmation upon completion of your request.
(letter_graphic)
Making Changes
To Your Account
(such as changing name, address, bank, etc.)
Fidelity Investments
P.O. Box 770001
Cincinnati, OH 45277-0002
(letter_graphic)
For Non-Retirement
Accounts
Buying shares
Fidelity Investments
P.O. Box 770001
Cincinnati, OH 45277-0003
Overnight Express
Fidelity Investments
Attn: Distribution Services
100 Crosby Parkway - KC1H
Covington, KY 41015
Selling shares
Fidelity Investments
P.O. Box 770001
Cincinnati, OH 45277-0035
Overnight Express
Fidelity Investments
Attn: Distribution Services
100 Crosby Parkway - KC1H
Covington, KY 41015
General Correspondence
Fidelity Investments
P.O. Box 500
Merrimack, NH 03054-0500
(letter_graphic)
For Retirement
Accounts
Buying shares
Fidelity Investments
P.O. Box 770001
Cincinnati, OH 45277-0003
Selling shares
Fidelity Investments
P.O. Box 770001
Cincinnati, OH 45277-0035
Overnight Express
Fidelity Investments
Attn: Distribution Services
100 Crosby Parkway - KC1H
Covington, KY 41015
General Correspondence
Fidelity Investments
P.O. Box 500
Merrimack, NH 03054-0500
Annual Report
Annual Report
Annual Report
Annual Report
Investment Adviser
Fidelity Management & Research Company
Boston, MA
Investment Sub-Advisers
FMR Co., Inc.
Fidelity Management & Research
(U.K.) Inc.
Fidelity Research & Analysis Company
Fidelity International Investment
Advisors
Fidelity Investments Japan Limited
Fidelity International Investment
Advisors (U.K.) Limited
General Distributor
Fidelity Distributors Corporation
Boston, MA
Transfer and Service Agent
Fidelity Service Company, Inc.
Boston, MA
Custodian
The Northern Trust Company
Chicago, IL
The Fidelity Telephone Connection
Mutual Fund 24-Hour Service
Exchanges/Redemptions
and Account Assistance 1-800-544-6666
Product Information 1-800-544-8888
Retirement Accounts 1-800-544-4774
(8 a.m. - 9 p.m.)
TDD Service 1-800-544-0118
for the deaf and hearing impaired
(9 a.m. - 9 p.m. Eastern time)
Fidelity Automated Service
Telephone (FAST®) (automated graphic) 1-800-544-5555
(automated graphic) Automated line for quickest service
IGI-UANN-1207
1.807257.103
(Fidelity Investment logo)(registered trademark)
Corporate Headquarters
82 Devonshire St., Boston, MA 02109
www.fidelity.com
(Fidelity Investment logo)(registered trademark)
Fidelity Advisor
International Discovery
Fund - Class A, Class T, Class B
and Class C
Annual Report
October 31, 2007
Class A, Class T, Class B, and Class C are classes of Fidelity® International Discovery Fund
(2_fidelity_logos) (Registered_Trademark)
Contents
Chairman's Message | <Click Here> | Ned Johnson's message to shareholders. |
Performance | <Click Here> | How the fund has done over time. |
Management's Discussion | 7 | The manager's review of fund performance, strategy and outlook. |
Shareholder Expense Example | <Click Here> | An example of shareholder expenses. |
Investment Changes | <Click Here> | A summary of major shifts in the fund's investments over the past six months. |
Investments | <Click Here> | A complete list of the fund's investments with their market values. |
Financial Statements | <Click Here> | Statements of assets and liabilities, operations, and changes in net assets,
as well as financial highlights. |
Notes | <Click Here> | Notes to the financial statements. |
Report of Independent Registered Public Accounting Firm | <Click Here> | |
Trustees and Officers | <Click Here> | |
Distributions | <Click Here> | |
Board Approval of Investment Advisory Contracts and Management Fees | <Click Here> | |
To view a fund's proxy voting guidelines and proxy voting record for the 12-month period ended June 30, visit http://www.fidelity.com (search for "proxy voting guidelines") or visit the Securities and Exchange Commission's (SEC) web site at http://www.sec.gov. You may also call 1-877-208-0098 to request a free copy of the proxy voting guidelines.
Standard & Poor's, S&P and S&P 500 are registered service marks of The McGraw-Hill Companies, Inc. and have been licensed for use by Fidelity Distributors Corporation.
Other third party marks appearing herein are the property of their respective owners.
All other marks appearing herein are registered or unregistered trademarks or service marks of FMR LLC or an affiliated company.
Annual Report
This report and the financial statements contained herein are submitted for the general information of the shareholders of the fund. This report is not authorized for distribution to prospective investors in the fund unless preceded or accompanied by an effective prospectus.
A fund files its complete schedule of portfolio holdings with the SEC for the first and third quarters of each fiscal year on Form N-Q. Forms N-Q are available on the SEC's web site at http://www.sec.gov. A fund's Forms N-Q may be reviewed and copied at the SEC's Public Reference Room in Washington, DC. Information regarding the operation of the SEC's Public Reference Room may be obtained by calling 1-800-SEC-0330. For a complete list of a fund's portfolio holdings, view the most recent holdings listing, semiannual report, or annual report on Fidelity's web site at http://www.fidelity.com or http://www.advisor.fidelity.com, as applicable.
NOT FDIC INSURED · MAY LOSE VALUE · NO BANK GUARANTEE
Neither the fund nor Fidelity Distributors Corporation is a bank.
Annual Report
Chairman's Message
(photo_of_Edward_C_Johnson_3d)
Dear Shareholder:
Many stock and bond markets around the world have been unsettled of late; however, volatility can often lead to opportunity for patient investors. Financial markets are always unpredictable, but there are a number of time-tested principles that can put the historical odds in your favor.
One of the basic tenets is to invest for the long term. Over time, riding out the markets' inevitable ups and downs has proven much more effective than selling into panic or chasing the hottest trend. Even missing only a few of the markets' best days can significantly diminish investor returns. Patience also affords the benefits of compounding - of earning interest on additional income or reinvested dividends and capital gains. There are tax advantages and cost benefits to consider as well. The more you sell, the more taxes you pay, and the more you trade, the higher the costs. While staying the course doesn't eliminate risk, it can considerably lessen the effect of short-term declines.
You can further manage your investing risk through diversification. And today, more than ever, geographic diversification should be taken into account. Studies indicate that asset allocation is the single most important determinant of a portfolio's long-term success. The right mix of stocks, bonds and cash - aligned to your particular risk tolerance and investment objective - is very important. Age-appropriate rebalancing is also an essential aspect of asset allocation. For younger investors, an emphasis on equities - which historically have been the best-performing asset class over time - is encouraged. As investors near their specific goal, such as retirement or sending a child to college, consideration may be given to replacing volatile assets (e.g. common stocks) with more-stable fixed investments (bonds or savings plans).
A third investment principle - investing regularly - can help lower the average cost of your purchases. Investing a certain amount of money each month or quarter helps ensure you won't pay for all your shares at market highs. This strategy - known as dollar cost averaging - also reduces unconstructive "emotion" from investing, helping shareholders avoid selling weak performers just prior to an upswing, or chasing a hot performer just before a correction.
We invite you to contact us via the Internet, through our Investor Centers or over the phone. It is our privilege to provide you the information you need to make the investments that are right for you.
Sincerely,
/s/Edward C. Johnson 3d
Edward C. Johnson 3d
Annual Report
Fidelity Advisor International Discovery Fund - Class A, T, B, and C
Performance: The Bottom Line
Average annual total return reflects the change in the value of an investment, assuming reinvestment of the class' dividend income and capital gains (the profits earned upon the sale of securities that have grown in value) and assuming a constant rate of performance each year. The $10,000 table and the fund's returns do not reflect the deduction of taxes that a shareholder would pay on fund distributions or the redemption of fund shares. During periods of reimbursement by Fidelity, a fund's total return will be greater than it would be had the reimbursement not occurred. How a fund did yesterday is no guarantee of how it will do tomorrow.
Average Annual Total Returns
Periods ended October 31, 2007 | Past 1
year | Past 5
years | Past 10
years |
Class A (incl. 5.75% sales charge) A, E | 26.81% | 24.57% | 12.35% |
Class T (incl. 3.50% sales charge) B, E | 29.38% | 24.91% | 12.51% |
Class B (incl. contingent deferred sales charge) C, E | 28.37% | 25.28% | 12.75% |
Class C (incl. contingent deferred sales charge) D , E | 32.38% | 25.50% | 12.77% |
A Class A shares bear a 0.25% 12b-1 fee. The initial offering of Class A shares took place on Janu-ary 6, 2005. Returns prior to January 6, 2005 are those of International Discovery, the original class of the fund, which has no 12b-1 fee. Had Class A shares' 12b-1 fee been reflected, returns prior to January 6, 2005 would have been lower.
B Class T shares bear a 0.50% 12b-1 fee. The initial offering of Class T shares took place on Janu-ary 6, 2005. Returns prior to January 6, 2005 are those of International Discovery, the original class of the fund, which has no 12b-1 fee. Had Class T shares' 12b-1 fee been reflected, returns prior to January 6, 2005 would have been lower.
C Class B shares bear a 1.00% 12b-1 fee. The initial offering of Class B shares took place on Janu-ary 6, 2005. Returns prior to January 6, 2005 are those of International Discovery, the original class of the fund, which has no 12b-1 fee. Had Class B shares' 12b-1 fee been reflected, returns prior to January 6, 2005 would have been lower. Class B shares' contingent deferred sales charges included in the past one year, past five year, and past 10 year total return figures are 5%, 2%, and 0% respectively.
D Class C shares bear a 1.00% 12b-1 fee. The initial offering of Class C shares took place on Janu-ary 6, 2005. Returns prior to January 6, 2005 are those of International Discovery, the original class of the fund, which has no 12b-1 fee. Had Class C shares' 12b-1 fee been reflected, returns prior to January 6, 2005 would have been lower. Class C shares' contingent deferred sales charges included in the past one year, past five year, and past 10 year total return figures are 1%, 0%, and 0% respectively.
E Prior to October 1, 2004, the fund operated under certain different investment policies. Accordingly, the fund's historical performance may not represent its current investment policies.
Annual Report
Performance - continued
$10,000 Over 10 Years
Let's say hypothetically that $10,000 was invested in Fidelity Advisor International Discovery Fund - Class T, a class of the fund, on October 31, 1997 and the current 3.50% sales charge was paid. The chart shows how the value of your investment would have changed, and also shows how the Morgan Stanley Capital InternationalSM Europe, Australasia, Far East (MSCI® EAFE®) Index performed over the same period. The initial offering of Class T took place on January 6, 2005. See the previous page for additional information regarding the performance of Class T.
Annual Report
Management's Discussion of Fund Performance
Comments from William Kennedy, Portfolio Manager of Fidelity Advisor International Discovery Fund
Foreign stocks, with a large assist from a weak U.S. dollar, generally had higher returns for U.S. investors than domestic equities during the 12-month period ending October 31, 2007. The backdrop for global stocks was solid, with robust economic growth and relatively high corporate profitability worldwide. Developed international equity markets, as measured by the Morgan Stanley Capital InternationalSM Europe, Australasia, and Far East (MSCI® EAFE®) Index - a performance monitor of established markets outside the United States and Canada - rose 25.09%. In comparison, the Standard & Poor's 500SM Index, a gauge of U.S. stocks, was up 14.56%. Among countries making up at least 1% of the EAFE benchmark, Finland had the best showing, soaring nearly 69%, while Hong Kong gained roughly 66%. The United Kingdom and Japan, the two largest components of the index, both underperformed. Fallout from the credit crunch and concerns about export growth tempered UK stocks, while Japan struggled with a slowdown in consumer spending and sluggish domestic growth. Emerging markets were the period's big winners, advancing 68.33% as measured by the MSCI Emerging Markets index.
For the 12 months ending October 31, 2007, the fund's Class A, Class T, Class B and Class C shares returned 34.54%, 34.08%, 33.37% and 33.38%, respectively (excluding sales charges), soundly beating the MSCI EAFE index. Strong stock picking - especially within industrials, health care and technology - helped the fund outperform. Stock selection in Europe and in emerging markets, which are not represented in the index, further aided performance. Top individual contributors to relative performance included Nintendo, the Japanese electronic game company, and CSL, an Australian biotechnology company. Nintendo benefited from the introduction of new games and products, while CSL saw improved pricing in its blood plasma business and growing royalty income from a new vaccine to protect against cervical cancer. NHN, the dominant Internet search engine in South Korea, and LG Household & Health Care, a recently restructured Korean consumer products company, rallied sharply. Neither was in the index. The fund sustained limited losses from an underweighting in Hong Kong, where stocks soared, weak stock selection in real estate, and a modest cash position. Disappointments included having an overall underweighting in BHP Billiton, an Anglo-Australian mining company, and not owning Volkswagen, a German car manufacturer, as both stocks rallied sharply.
The views expressed above reflect those of the portfolio manager(s) only through the end of the period as stated on the cover of this report and do not necessarily represent the views of Fidelity or any other person in the Fidelity organization. Any such views are subject to change at any time based upon market or other conditions and Fidelity disclaims any responsibility to update such views. These views may not be relied on as investment advice and, because investment decisions for a Fidelity fund are based on numerous factors, may not be relied on as an indication of trading intent on behalf of any Fidelity fund.
Annual Report
Shareholder Expense Example
As a shareholder of the Fund, you incur two types of costs: (1) transaction costs, including sales charges (loads) on purchase payments or redemption proceeds, and redemption fees, and (2) ongoing costs, including management fees, distribution and/or service (12b-1) fees and other Fund expenses. This Example is intended to help you understand your ongoing costs (in dollars) of investing in the Fund and to compare these costs with the ongoing costs of investing in other mutual funds.
The Example is based on an investment of $1,000 invested at the beginning of the period and held for the entire period (May 1, 2007 to October 31, 2007).
Actual Expenses
The first line of the accompanying table for each class of the Fund provides information about actual account values and actual expenses. You may use the information in this line, together with the amount you invested, to estimate the expenses that you paid over the period. Simply divide your account value by $1,000.00 (for example, an $8,600 account value divided by $1,000.00 = 8.6), then multiply the result by the number in the first line for a class of the Fund under the heading entitled "Expenses Paid During Period" to estimate the expenses you paid on your account during this period. A small balance maintenance fee of $12.00 that is charged once a year may apply for certain accounts with a value of less than $2,000. This fee is not included in the table below. If it was, the estimate of expenses you paid during the period would be higher, and your ending account value lower, by this amount. In addition, the Fund, as a shareholder in the underlying Fidelity Central Funds, will indirectly bear its pro rata share of the fees and expenses incurred by the underlying Fidelity Central Funds. These fees and expenses are not included in the Fund's annualized expense ratio used to calculate the expense estimate in the table below.
Hypothetical Example for Comparison Purposes
The second line of the accompanying table for each class of the Fund provides information about hypothetical account values and hypothetical expenses based on a Class' actual expense ratio and an assumed rate of return of 5% per year before expenses, which is not the Class' actual return. The hypothetical account values and expenses may not be used to estimate the actual ending account balance or expenses you paid for the period. You may use this information to compare the ongoing costs of investing in the Fund and other funds. To do so, compare this 5% hypothetical example with the 5% hypothetical examples that appear in the shareholder reports of the other funds. A small balance maintenance fee of $12.00 that is charged once a year may apply for certain accounts with a value of less than $2,000. This fee is not included in the table below. If it was, the estimate of expenses you paid during the period would be higher, and your ending account value lower, by this amount. In addition, the Fund, as a shareholder in the underlying Fidelity Central Funds, will indirectly bear its pro rata share of the fees and expenses incurred by the underlying Fidelity Central Funds. These fees and expenses are not included in the Fund's annualized expense ratio used to calculate the expense estimate in the table below.
Annual Report
Please note that the expenses shown in the table are meant to highlight your ongoing costs only and do not reflect any transaction costs. Therefore, the second line of the table is useful in comparing ongoing costs only, and will not help you determine the relative total costs of owning different funds. In addition, if these transactional costs were included, your costs would have been higher.
| Beginning
Account Value
May 1, 2007 | Ending
Account Value
October 31, 2007 | Expenses Paid
During Period*
May 1, 2007 to
October 31, 2007 |
Class A | | | |
Actual | $ 1,000.00 | $ 1,162.90 | $ 6.92 |
Hypothetical A | $ 1,000.00 | $ 1,018.80 | $ 6.46 |
Class T | | | |
Actual | $ 1,000.00 | $ 1,160.80 | $ 8.99 |
Hypothetical A | $ 1,000.00 | $ 1,016.89 | $ 8.39 |
Class B | | | |
Actual | $ 1,000.00 | $ 1,157.90 | $ 11.69 |
Hypothetical A | $ 1,000.00 | $ 1,014.37 | $ 10.92 |
Class C | | | |
Actual | $ 1,000.00 | $ 1,158.10 | $ 11.64 |
Hypothetical A | $ 1,000.00 | $ 1,014.42 | $ 10.87 |
International Discovery | | | |
Actual | $ 1,000.00 | $ 1,164.30 | $ 5.73 |
Hypothetical A | $ 1,000.00 | $ 1,019.91 | $ 5.35 |
Institutional Class | | | |
Actual | $ 1,000.00 | $ 1,164.40 | $ 5.35 |
Hypothetical A | $ 1,000.00 | $ 1,020.27 | $ 4.99 |
A 5% return per year before expenses
* Expenses are equal to each Class' annualized expense ratio (shown in the table below); multiplied by the average account value over the period, multiplied by 184/365 (to reflect the one-half year period).
| Annualized
Expense Ratio |
Class A | 1.27% |
Class T | 1.65% |
Class B | 2.15% |
Class C | 2.14% |
International Discovery | 1.05% |
Institutional Class | .98% |
Annual Report
Investment Changes
Geographic Diversification (% of fund's net assets) |
As of October 31, 2007 |
| United Kingdom 14.7% | |
| Japan 14.3% | |
| Germany 11.1% | |
| France 9.4% | |
| Switzerland 8.5% | |
| Australia 7.2% | |
| United States of America 4.6% | |
| Spain 3.2% | |
| Norway 2.7% | |
| Other 24.3% | |

Percentages are adjusted for the effect of futures contracts, if applicable. |
|
As of April 30, 2007 |
| Japan 16.4% | |
| United Kingdom 15.5% | |
| France 10.7% | |
 | Germany 10.6% | |
| Switzerland 9.4% | |
| Australia 6.6% | |
| Netherlands 3.6% | |
| United States of America 3.6% | |
| Spain 2.9% | |
| Other 20.7% | |

Percentages are adjusted for the effect of futures contracts, if applicable. |
Asset Allocation |
| % of fund's net assets | % of fund's net assets
6 months ago |
Stocks and Equity Futures | 96.2 | 97.3 |
Short-Term Investments and Net Other Assets | 3.8 | 2.7 |
Top Ten Stocks as of October 31, 2007 |
| % of fund's
net assets | % of fund's net assets
6 months ago |
E.ON AG (Germany, Electric Utilities) | 1.6 | 1.3 |
Vodafone Group PLC (United Kingdom, Wireless Telecommunication Services) | 1.6 | 0.8 |
Telefonica SA (Spain, Diversified Telecommunication Services) | 1.5 | 0.7 |
CSL Ltd. (Australia, Biotechnology) | 1.3 | 1.0 |
Bayer AG sponsored ADR (Germany, Chemicals) | 1.2 | 1.0 |
Roche Holding AG (participation certificate) (Switzerland, Pharmaceuticals) | 1.2 | 1.5 |
Nestle SA (Reg.) (Switzerland, Food Products) | 1.2 | 1.1 |
BHP Billiton PLC (United Kingdom, Metals & Mining) | 1.2 | 0.8 |
Royal Dutch Shell PLC Class B (United Kingdom, Oil, Gas & Consumable Fuels) | 1.1 | 1.1 |
Nintendo Co. Ltd. (Japan, Software) | 1.0 | 0.9 |
| 12.9 | |
Market Sectors as of October 31, 2007 |
| % of fund's
net assets | % of fund's net assets
6 months ago |
Financials | 17.3 | 22.7 |
Industrials | 15.1 | 14.5 |
Consumer Discretionary | 12.6 | 15.1 |
Information Technology | 8.9 | 8.5 |
Materials | 8.1 | 6.5 |
Consumer Staples | 7.8 | 7.5 |
Health Care | 7.6 | 7.8 |
Energy | 7.4 | 5.8 |
Utilities | 6.1 | 5.2 |
Telecommunication Services | 4.9 | 3.2 |
Annual Report
Investments October 31, 2007
Showing Percentage of Net Assets
Common Stocks - 94.7% |
| Shares | | Value (000s) |
Australia - 7.2% |
AMP Ltd. | 2,150,200 | | $ 20,588 |
Aristocrat Leisure Ltd. (d) | 1,674,900 | | 16,383 |
AXA Asia Pacific Holdings Ltd. | 3,809,600 | | 29,145 |
Babcock & Brown Japan Property Trust | 14,813,600 | | 23,189 |
Babcock & Brown Ltd. | 2,614,622 | | 75,708 |
Babcock & Brown Wind Partners | 7,081,600 | | 12,186 |
Brambles Ltd. | 3,727,909 | | 49,622 |
Cochlear Ltd. | 750,661 | | 48,269 |
Commonwealth Bank of Australia | 1,313,800 | | 75,667 |
Computershare Ltd. | 6,601,384 | | 53,227 |
CSL Ltd. | 5,651,034 | | 192,113 |
Downer EDI Ltd. | 3,907,684 | | 24,368 |
Goodman Group unit | 4,741,905 | | 30,738 |
Macquarie Bank Ltd. | 588,675 | | 47,015 |
Mortgage Choice Ltd. | 2,899,300 | | 6,677 |
National Australia Bank Ltd. | 2,313,706 | | 93,608 |
Oxiana Ltd. | 2,673,571 | | 10,655 |
QBE Insurance Group Ltd. | 2,000,792 | | 61,229 |
Seek Ltd. | 2,000,000 | | 17,504 |
United Group Ltd. | 556,800 | | 11,144 |
Woolworths Ltd. | 2,722,574 | | 85,330 |
WorleyParsons Ltd. | 1,755,648 | | 79,361 |
TOTAL AUSTRALIA | | 1,063,726 |
Austria - 0.4% |
Raiffeisen International Bank Holding AG | 316,025 | | 52,241 |
Strabag SE (a) | 117,400 | | 9,217 |
TOTAL AUSTRIA | | 61,458 |
Belgium - 0.2% |
InBev SA | 365,300 | | 34,486 |
Bermuda - 0.8% |
Aquarius Platinum Ltd. (United Kingdom) | 1,493,400 | | 57,222 |
Ports Design Ltd. | 4,763,900 | | 17,985 |
Sinofert Holdings Ltd. | 38,748,900 | | 36,551 |
TOTAL BERMUDA | | 111,758 |
Brazil - 0.9% |
B2W Companhia Global Do Varejo | 1,134,400 | | 61,241 |
Bovespa Holding SA (a) | 787,000 | | 14,989 |
Uniao de Bancos Brasileiros SA (Unibanco) GDR | 337,000 | | 53,259 |
TOTAL BRAZIL | | 129,489 |
Common Stocks - continued |
| Shares | | Value (000s) |
Canada - 1.2% |
Niko Resources Ltd. | 498,400 | | $ 55,847 |
Open Text Corp. (a)(d) | 1,310,000 | | 40,943 |
Potash Corp. of Saskatchewan, Inc. | 615,500 | | 75,596 |
TOTAL CANADA | | 172,386 |
Cayman Islands - 0.8% |
Alibaba.com Ltd. (a) | 598,500 | | 1,931 |
Chaoda Modern Agriculture (Holdings) Ltd. | 12,600,000 | | 11,499 |
Lee & Man Paper Manufacturing Ltd. | 9,312,600 | | 37,254 |
Subsea 7, Inc. (a)(d) | 791,800 | | 23,238 |
Suntech Power Holdings Co. Ltd. sponsored ADR (a) | 842,200 | | 49,597 |
TOTAL CAYMAN ISLANDS | | 123,519 |
China - 0.3% |
Jiangsu Expressway Co. Ltd. (H Shares) | 13,585,200 | | 15,716 |
Nine Dragons Paper (Holdings) Ltd. | 10,409,000 | | 28,196 |
TOTAL CHINA | | 43,912 |
Cyprus - 0.3% |
Aisi Realty Public Ltd. (e) | 10,023,000 | | 8,752 |
Marfin Popular Bank Public Co. | 2,596,559 | | 42,208 |
TOTAL CYPRUS | | 50,960 |
Czech Republic - 0.3% |
Ceske Energeticke Zavody AS | 584,800 | | 42,271 |
Denmark - 0.7% |
Vestas Wind Systems AS (a) | 1,176,600 | | 104,975 |
Finland - 1.3% |
Citycon Oyj | 791,225 | | 5,158 |
Nokia Corp. sponsored ADR | 3,652,100 | | 145,061 |
Wartsila Corp. (B Shares) | 431,600 | | 35,267 |
TOTAL FINLAND | | 185,486 |
France - 9.4% |
Alcatel-Lucent SA | 1,089,900 | | 10,561 |
Alstom SA | 476,200 | | 112,388 |
AXA SA | 1,619,466 | | 72,439 |
BNP Paribas SA | 419,639 | | 46,261 |
Cap Gemini SA | 621,000 | | 39,587 |
CNP Assurances | 210,300 | | 26,809 |
Electricite de France | 886,200 | | 106,296 |
Gaz de France | 805,800 | | 45,764 |
Common Stocks - continued |
| Shares | | Value (000s) |
France - continued |
Geodis SA | 73,700 | | $ 15,910 |
Groupe Danone | 483,400 | | 41,693 |
Icade SA | 581,289 | | 42,900 |
L'Oreal SA | 247,100 | | 32,370 |
LVMH Moet Hennessy - Louis Vuitton | 357,300 | | 46,009 |
Neopost SA | 264,700 | | 30,745 |
Neuf Cegetel | 688,313 | | 34,803 |
Orpea (a) | 540,928 | | 34,193 |
Pinault Printemps-Redoute SA | 155,200 | | 30,764 |
Remy Cointreau SA | 304,500 | | 23,404 |
Renault SA | 461,500 | | 77,493 |
Sechilienne-Sidec | 174,000 | | 15,625 |
Societe Generale Series A | 181,820 | | 30,637 |
Suez SA (France) | 1,184,600 | | 76,999 |
Total SA Series B | 1,866,176 | | 150,432 |
Veolia Environnement | 916,962 | | 81,902 |
Vinci SA | 1,336,700 | | 109,651 |
Vivendi | 1,098,719 | | 49,474 |
TOTAL FRANCE | | 1,385,109 |
Germany - 10.1% |
Adidas-Salomon AG | 487,400 | | 32,518 |
Allianz AG (Reg.) | 607,130 | | 137,211 |
Bayer AG sponsored ADR | 2,183,200 | | 179,896 |
CompuGROUP Holding AG (a) | 519,400 | | 10,798 |
Continental AG | 228,600 | | 34,574 |
DaimlerChrysler AG (Reg.) | 669,000 | | 73,690 |
Deutsche Boerse AG | 727,200 | | 114,733 |
E.ON AG | 1,219,500 | | 238,172 |
Gerresheimer AG | 331,000 | | 18,223 |
Hochtief AG | 519,000 | | 71,666 |
K&S AG | 237,600 | | 49,677 |
Linde AG | 512,128 | | 64,804 |
MAN AG | 362,600 | | 64,721 |
MTU Aero Engines Holding AG | 63,600 | | 3,883 |
Muenchener Rueckversicherungs-Gesellschaft AG (Reg.) | 381,600 | | 73,210 |
Q-Cells AG (a) | 461,100 | | 58,721 |
SGL Carbon AG (a) | 637,600 | | 37,200 |
Siemens AG (Reg.) | 887,100 | | 120,974 |
SolarWorld AG | 1,099,600 | | 74,589 |
Wincor Nixdorf AG | 247,400 | | 24,574 |
TOTAL GERMANY | | 1,483,834 |
Common Stocks - continued |
| Shares | | Value (000s) |
Greece - 0.6% |
EFG Eurobank Ergasias SA | 871,328 | | $ 33,908 |
Marfin Financial Group Holdings SA | 1,328,400 | | 12,625 |
National Bank of Greece SA | 545,000 | | 37,885 |
TOTAL GREECE | | 84,418 |
Hong Kong - 1.4% |
China Mobile (Hong Kong) Ltd. | 1,539,000 | | 31,913 |
Esprit Holdings Ltd. | 6,854,500 | | 114,478 |
Li & Fung Ltd. | 11,401,900 | | 54,105 |
TOTAL HONG KONG | | 200,496 |
India - 1.6% |
Bharti Airtel Ltd. (a) | 2,771,992 | | 71,615 |
Infosys Technologies Ltd. | 991,984 | | 47,073 |
Reliance Industries Ltd. | 1,179,321 | | 84,180 |
Satyam Computer Services Ltd. | 3,147,843 | | 38,690 |
TOTAL INDIA | | 241,558 |
Indonesia - 0.2% |
PT Perusahaan Gas Negara Tbk Series B | 16,035,500 | | 25,130 |
Ireland - 0.3% |
Paddy Power PLC (Ireland) | 623,197 | | 25,777 |
Ryanair Holdings PLC sponsored ADR (a) | 486,900 | | 23,951 |
TOTAL IRELAND | | 49,728 |
Israel - 0.6% |
Israel Chemicals Ltd. | 4,076,700 | | 44,861 |
Nice Systems Ltd. sponsored ADR (a) | 995,600 | | 39,257 |
TOTAL ISRAEL | | 84,118 |
Italy - 2.1% |
AEM SpA | 7,233,100 | | 30,432 |
Edison SpA | 9,489,400 | | 32,267 |
ENI SpA | 288,800 | | 10,553 |
ENI SpA sponsored ADR | 389,450 | | 28,461 |
Fiat SpA | 2,581,600 | | 83,295 |
Impregilo SpA (a) | 1,279,394 | | 10,250 |
Prysmian SpA | 1,016,400 | | 29,202 |
Unicredito Italiano SpA | 9,354,300 | | 79,960 |
TOTAL ITALY | | 304,420 |
Japan - 13.9% |
Aeon Mall Co. Ltd. | 793,600 | | 20,643 |
Common Stocks - continued |
| Shares | | Value (000s) |
Japan - continued |
Asahi Glass Co. Ltd. | 1,924,000 | | $ 26,503 |
Asics Corp. | 3,270,000 | | 52,155 |
Canon, Inc. | 2,444,050 | | 123,596 |
Chiba Bank Ltd. | 2,187,000 | | 17,557 |
East Japan Railway Co. | 3,681 | | 30,328 |
Fujifilm Holdings Corp. | 1,518,000 | | 72,773 |
Honda Motor Co. Ltd. | 1,548,900 | | 57,975 |
Ibiden Co. Ltd. | 449,700 | | 38,127 |
Japan Tobacco, Inc. | 12,452 | | 72,594 |
Kawasaki Kisen Kaisha Ltd. | 2,345,000 | | 32,556 |
Keyence Corp. | 82,600 | | 19,039 |
Konica Minolta Holdings, Inc. | 2,904,500 | | 50,856 |
Kubota Corp. | 5,875,000 | | 49,334 |
Leopalace21 Corp. | 329,500 | | 10,521 |
Matsui Securities Co. Ltd. (d) | 2,233,300 | | 17,748 |
Mitsubishi Corp. | 1,383,500 | | 43,085 |
Mitsubishi Estate Co. Ltd. | 2,029,400 | | 60,851 |
Mitsui & Co. Ltd. | 3,209,000 | | 83,253 |
Mitsui Fudosan Co. Ltd. | 2,335,000 | | 64,609 |
Murata Manufacturing Co. Ltd. | 652,800 | | 39,736 |
Namco Bandai Holdings, Inc. | 1,763,600 | | 27,196 |
NGK Insulators Ltd. | 2,226,000 | | 78,931 |
Nintendo Co. Ltd. | 245,400 | | 154,111 |
Nippon Building Fund, Inc. | 2,498 | | 36,244 |
Nippon Electric Glass Co. Ltd. | 855,000 | | 14,535 |
Nippon Steel Corp. | 4,753,000 | | 31,598 |
Nomura Holdings, Inc. | 2,914,300 | | 51,962 |
NSK Ltd. | 3,609,000 | | 32,005 |
ORIX Corp. | 264,680 | | 54,305 |
Sony Corp. sponsored ADR | 808,600 | | 39,993 |
Sony Financial Holdings, Inc. | 1,085 | | 3,904 |
Sumco Corp. | 1,074,700 | | 39,232 |
Sumitomo Corp. | 1,889,600 | | 32,931 |
Sumitomo Electric Industries Ltd. | 1,786,100 | | 28,924 |
Sumitomo Metal Industries Ltd. | 1,557,000 | | 7,708 |
Sumitomo Mitsui Financial Group, Inc. | 11,632 | | 95,302 |
Sumitomo Trust & Banking Co. Ltd. | 2,478,800 | | 18,486 |
Takeda Pharmaceutical Co. Ltd. | 1,988,100 | | 124,213 |
Tokuyama Corp. | 3,364,900 | | 47,010 |
Toyota Motor Corp. | 2,645,700 | | 151,387 |
TOTAL JAPAN | | 2,053,816 |
Common Stocks - continued |
| Shares | | Value (000s) |
Korea (South) - 2.0% |
Korean Reinsurance Co. | 946,600 | | $ 16,887 |
LG Household & Health Care Ltd. | 441,970 | | 98,540 |
NHN Corp. (a) | 286,270 | | 92,058 |
Samsung Fire & Marine Insurance Co. Ltd. | 217,180 | | 60,426 |
Shinhan Financial Group Co. Ltd. | 385,130 | | 25,220 |
TOTAL KOREA (SOUTH) | | 293,131 |
Luxembourg - 1.2% |
Acergy SA | 1,124,500 | | 32,543 |
ArcelorMittal SA (d) | 730,900 | | 58,665 |
ArcelorMittal SA (NY Shares) Class A | 654,000 | | 52,287 |
SES SA (A Shares) FDR unit | 1,567,368 | | 37,695 |
TOTAL LUXEMBOURG | | 181,190 |
Malaysia - 1.1% |
DiGi.com Bhd | 3,860,800 | | 29,080 |
Gamuda Bhd | 53,435,000 | | 73,675 |
IJM Corp. Bhd | 8,525,300 | | 22,395 |
KNM Group Bhd | 19,276,000 | | 34,120 |
TOTAL MALAYSIA | | 159,270 |
Mexico - 0.6% |
America Movil SAB de CV Series L sponsored ADR | 1,217,900 | | 79,638 |
Urbi, Desarrollos Urbanos, SA de CV (a) | 4,121,400 | | 15,925 |
TOTAL MEXICO | | 95,563 |
Netherlands - 2.1% |
CNH Global NV | 730,700 | | 47,919 |
Heineken NV (Bearer) | 924,100 | | 64,502 |
ING Groep NV (Certificaten Van Aandelen) | 310,544 | | 13,971 |
Koninklijke KPN NV | 1,912,000 | | 36,067 |
Koninklijke Numico NV | 341,600 | | 27,220 |
Koninklijke Philips Electronics NV | 1,291,900 | | 53,407 |
Nutreco Holding NV | 653,700 | | 44,655 |
SBM Offshore NV | 706,779 | | 27,197 |
TOTAL NETHERLANDS | | 314,938 |
Norway - 2.7% |
Aker Kvaerner ASA | 3,278,985 | | 114,259 |
Hafslund ASA (B Shares) | 674,550 | | 19,986 |
Marine Harvest ASA (a) | 42,140,100 | | 42,717 |
Petroleum Geo-Services ASA | 1,889,000 | | 55,616 |
Pronova BioPharma ASA | 6,445,100 | | 29,664 |
Common Stocks - continued |
| Shares | | Value (000s) |
Norway - continued |
Renewable Energy Corp. AS (a)(d) | 1,148,900 | | $ 58,553 |
StatoilHydro ASA | 2,088,100 | | 70,660 |
TOTAL NORWAY | | 391,455 |
Papua New Guinea - 0.2% |
Lihir Gold Ltd. (a) | 9,432,800 | | 37,449 |
Singapore - 0.6% |
Keppel Corp. Ltd. | 2,332,000 | | 23,971 |
Singapore Exchange Ltd. | 5,755,000 | | 63,061 |
TOTAL SINGAPORE | | 87,032 |
South Africa - 0.0% |
JSE Ltd. | 166,821 | | 2,220 |
Spain - 3.2% |
Banco Santander Central Hispano SA | 5,543,700 | | 120,476 |
Compania de Distribucion Integral Logista SA | 163,800 | | 12,779 |
Inditex SA | 1,531,400 | | 113,930 |
Sol Melia SA | 279,295 | | 5,362 |
Telefonica SA | 6,849,600 | | 227,064 |
TOTAL SPAIN | | 479,611 |
Sweden - 1.5% |
H&M Hennes & Mauritz AB (B Shares) | 1,161,450 | | 77,323 |
Modern Times Group MTG AB (B Shares) | 1,049,300 | | 73,738 |
Scania AB (B Shares) | 2,390,600 | | 65,279 |
TOTAL SWEDEN | | 216,340 |
Switzerland - 8.5% |
ABB Ltd. sponsored ADR | 4,624,400 | | 139,749 |
Actelion Ltd. (Reg.) (a) | 1,287,650 | | 63,977 |
BB Biotech AG | 341,699 | | 30,002 |
Compagnie Financiere Richemont unit | 529,630 | | 37,792 |
Credit Suisse Group (Reg.) | 935,480 | | 63,332 |
EFG International | 528,000 | | 24,684 |
Julius Baer Holding AG (Bearer) | 971,965 | | 84,081 |
Lindt & Spruengli AG (participation certificate) | 16,084 | | 55,543 |
Nestle SA (Reg.) | 377,747 | | 174,519 |
Novartis AG (Reg.) | 736,880 | | 39,180 |
Roche Holding AG (participation certificate) | 1,047,428 | | 179,005 |
SGS Societe Generale de Surveillance Holding SA (Reg.) | 24,415 | | 31,997 |
Sonova Holding AG | 659,300 | | 73,996 |
Swiss Life Holding | 95,891 | | 26,492 |
Common Stocks - continued |
| Shares | | Value (000s) |
Switzerland - continued |
Syngenta AG (Switzerland) | 196,292 | | $ 47,571 |
Tecan Group AG | 212,300 | | 14,205 |
The Swatch Group AG (Reg.) | 1,277,012 | | 80,206 |
UBS AG (NY Shares) | 1,020,700 | | 54,801 |
Zurich Financial Services AG (Reg.) | 113,749 | | 34,248 |
TOTAL SWITZERLAND | | 1,255,380 |
Taiwan - 0.9% |
Gemtek Technology Corp. | 416,925 | | 938 |
Hon Hai Precision Industry Co. Ltd. (Foxconn) | 8,704,668 | | 66,101 |
PixArt Imaging, Inc. | 174,000 | | 1,523 |
Shin Kong Financial Holding Co. Ltd. | 10,525,009 | | 9,747 |
Siliconware Precision Industries Co. Ltd. | 12,427,433 | | 26,201 |
Wistron Corp. | 14,679,615 | | 29,228 |
TOTAL TAIWAN | | 133,738 |
United Kingdom - 14.7% |
Anglo American PLC (United Kingdom) | 946,654 | | 65,224 |
Autonomy Corp. PLC (a) | 2,701,500 | | 55,183 |
BAE Systems PLC | 4,314,809 | | 44,674 |
Barclays PLC | 1,431,400 | | 18,197 |
BG Group PLC | 1,454,900 | | 26,843 |
BG Group PLC sponsored ADR | 200,000 | | 18,450 |
BHP Billiton PLC | 4,518,500 | | 172,008 |
Blinkx PLC | 2,595,500 | | 1,713 |
BP PLC sponsored ADR | 922,600 | | 71,954 |
British American Tobacco PLC | 1,891,700 | | 72,528 |
British American Tobacco PLC sponsored ADR | 390,200 | | 29,921 |
Burberry Group PLC | 789,000 | | 10,088 |
Capita Group PLC | 1,161,193 | | 18,082 |
Clipper Windpower PLC (a) | 2,006,200 | | 27,737 |
GlaxoSmithKline PLC sponsored ADR | 956,700 | | 49,031 |
Gyrus Group PLC (a) | 3,384,500 | | 30,081 |
HSBC Holdings PLC (Hong Kong) (Reg.) | 1,445,244 | | 28,766 |
Informa PLC | 1,379,400 | | 15,343 |
International Power PLC | 9,114,700 | | 92,665 |
Investec PLC | 3,130,100 | | 37,809 |
John Wood Group PLC | 3,062,900 | | 26,586 |
Marks & Spencer Group PLC | 1,936,800 | | 26,254 |
Misys PLC | 1,173,500 | | 5,898 |
N Brown Group PLC | 4,180,000 | | 25,137 |
National Grid PLC | 3,373,200 | | 56,210 |
Common Stocks - continued |
| Shares | | Value (000s) |
United Kingdom - continued |
Next PLC | 907,000 | | $ 41,636 |
Pearson PLC | 2,492,100 | | 41,320 |
Punch Taverns Ltd. | 871,700 | | 18,214 |
Reckitt Benckiser Group PLC | 1,970,700 | | 114,270 |
Renovo Group PLC (a)(e) | 10,125,200 | | 42,523 |
Rio Tinto PLC sponsored ADR | 162,300 | | 60,863 |
Rolls-Royce Group PLC | 4,072,789 | | 45,555 |
Royal Bank of Scotland Group PLC | 6,689,857 | | 71,838 |
Royal Dutch Shell PLC Class B | 3,593,359 | | 156,760 |
RPS Group PLC | 4,353,400 | | 35,253 |
Shire PLC | 2,143,300 | | 53,690 |
SSL International PLC | 6,991,900 | | 74,863 |
Tesco PLC | 10,185,112 | | 104,397 |
Vodafone Group PLC | 59,492,135 | | 233,626 |
Xstrata PLC | 676,400 | | 48,474 |
TOTAL UNITED KINGDOM | | 2,169,664 |
United States of America - 0.8% |
Fluor Corp. | 275,900 | | 43,592 |
Macquarie Infrastructure Co. LLC | 131,000 | | 5,471 |
Sunpower Corp. Class A (a) | 433,600 | | 54,833 |
Washington Group International, Inc. (a) | 167,200 | | 16,277 |
TOTAL UNITED STATES OF AMERICA | | 120,173 |
TOTAL COMMON STOCKS (Cost $9,813,829) | 13,974,207 |
Nonconvertible Preferred Stocks - 1.1% |
| | | |
Germany - 1.0% |
Fresenius AG (non-vtg.) | 573,700 | | 45,490 |
Porsche AG | 21,495 | | 57,271 |
ProSiebenSat.1 Media AG | 1,396,900 | | 40,821 |
TOTAL GERMANY | | 143,582 |
Italy - 0.1% |
Intesa Sanpaolo SpA | 1,669,602 | | 12,673 |
Nonconvertible Preferred Stocks - continued |
| Shares | | Value (000s) |
United Kingdom - 0.0% |
Rolls-Royce Group PLC: | | | |
B Shares | 3,257 | | $ 0 |
B Shares (a) | 164,540,675 | | 342 |
TOTAL UNITED KINGDOM | | 342 |
TOTAL NONCONVERTIBLE PREFERRED STOCKS (Cost $102,519) | 156,597 |
Government Obligations - 0.0% |
| Principal Amount (000s) | | |
United States of America - 0.0% |
U.S. Treasury Bills, yield at date of purchase 3.64% to 4.85% 11/1/07 to 1/31/08 (f)
(Cost $5,151) | | $ 5,175 | | 5,151 |
Money Market Funds - 4.7% |
| Shares | | |
Fidelity Cash Central Fund, 4.97% (b) | 635,283,797 | | 635,284 |
Fidelity Securities Lending Cash Central Fund, 5.02% (b)(c) | 52,174,509 | | 52,175 |
TOTAL MONEY MARKET FUNDS (Cost $687,459) | 687,459 |
TOTAL INVESTMENT PORTFOLIO - 100.5% (Cost $10,608,958) | | 14,823,414 |
NET OTHER ASSETS - (0.5)% | | (75,062) |
NET ASSETS - 100% | $ 14,748,352 |
Futures Contracts |
| Expiration Date | | Underlying Face Amount at Value (000s) | | Unrealized Appreciation/
(Depreciation) (000s) |
Purchased |
Equity Index Contracts |
753 Nikkei 225 Index Contracts (Japan) | Dec. 2007 | | $ 63,459 | | $ 3,158 |
|
The face value of futures purchased as a percentage of net assets - 0.4% |
Legend |
(a) Non-income producing |
(b) Affiliated fund that is available only to investment companies and other accounts managed by Fidelity Investments. The rate quoted is the annualized seven-day yield of the fund at period end. A complete unaudited listing of the fund's holdings as of its most recent quarter end is available upon request. |
(c) Investment made with cash collateral received from securities on loan. |
(d) Security or a portion of the security is on loan at period end. |
(e) Affiliated company |
(f) Security or a portion of the security was pledged to cover margin requirements for futures contracts. At the period end, the value of securities pledged amounted to $3,171,000. |
Affiliated Central Funds |
Information regarding fiscal year to date income earned by the Fund from investments in Fidelity Central Funds is as follows: |
Fund | Income earned
(Amounts in thousands) |
Fidelity Cash Central Fund | $ 22,121 |
Fidelity Securities Lending Cash Central Fund | 8,932 |
Total | $ 31,053 |
Other Affiliated Issuers |
An affiliated company is a company in which the fund has ownership of at least 5% of the voting securities. Fiscal year to date transactions with companies which are or were affiliates are as follows: |
Affiliates
(Amounts in thousands) | Value, beginning of period | Purchases | Sales Proceeds | Dividend Income | Value,
end of
period |
Aisi Realty Public Ltd. | $ - | $ 6,615 | $ - | $ - | $ 8,752 |
Renovo Group PLC | 14,540 | 18,435 | 586 | - | 42,523 |
Total | $ 14,540 | $ 25,050 | $ 586 | $ - | $ 51,275 |
See accompanying notes which are an integral part of the financial statements.
Annual Report
Financial Statements
Statement of Assets and Liabilities
Amounts in thousands (except per-share amounts) | October 31, 2007 |
Assets | | |
Investment in securities, at value (including securities loaned of $49,933) - See accompanying schedule: Unaffiliated issuers (cost $9,887,754) | $ 14,084,680 | |
Fidelity Central Funds (cost $687,459) | 687,459 | |
Other affiliated issuers (cost $33,745) | 51,275 | |
Total Investments (cost $10,608,958) | | $ 14,823,414 |
Foreign currency held at value (cost $9,235) | | 9,250 |
Receivable for investments sold | | 6,597 |
Receivable for fund shares sold | | 38,047 |
Dividends receivable | | 15,806 |
Distributions receivable from Fidelity Central Funds | | 2,866 |
Receivable for daily variation on futures contracts | | 791 |
Prepaid expenses | | 11 |
Other receivables | | 760 |
Total assets | | 14,897,542 |
| | |
Liabilities | | |
Payable for investments purchased | $ 70,473 | |
Payable for fund shares redeemed | 9,685 | |
Accrued management fee | 9,391 | |
Distribution fees payable | 131 | |
Other affiliated payables | 2,347 | |
Other payables and accrued expenses | 4,988 | |
Collateral on securities loaned, at value | 52,175 | |
Total liabilities | | 149,190 |
| | |
Net Assets | | $ 14,748,352 |
Net Assets consist of: | | |
Paid in capital | | $ 9,827,187 |
Undistributed net investment income | | 137,292 |
Accumulated undistributed net realized gain (loss) on investments and foreign currency transactions | | 570,379 |
Net unrealized appreciation (depreciation) on investments and assets and liabilities in foreign currencies | | 4,213,494 |
Net Assets | | 14,748,352 |
See accompanying notes which are an integral part of the financial statements.
Annual Report
Statement of Assets and Liabilities - continued
Amounts in thousands (except per-share amounts) | October 31, 2007 |
Calculation of Maximum Offering Price
Class A:
Net Asset Value and redemption price per share ($416,784 ÷ 8,803.3 shares) | | $ 47.34 |
| | |
Maximum offering price per share (100/94.25 of $47.34) | | $ 50.23 |
Class T:
Net Asset Value and redemption price per share ($53,207 ÷ 1,130.6 shares) | | $ 47.06 |
| | |
Maximum offering price per share (100/96.50 of $47.06) | | $ 48.77 |
Class B:
Net Asset Value and offering price per share ($17,172 ÷ 367.7 shares)A | | $ 46.70 |
| | |
Class C:
Net Asset Value and offering price per share ($27,736 ÷ 592.4 shares)A | | $ 46.82 |
| | |
| | |
International Discovery
Net Asset Value, offering price and redemption price per share ($14,175,728 ÷ 297,335 shares) | | $ 47.68 |
| | |
Institutional Class:
Net Asset Value, offering price and redemption price per share ($57,725 ÷ 1,209.3 shares) | | $ 47.73 |
A Redemption price per share is equal to net asset value less any applicable contingent deferred sales charge.
See accompanying notes which are an integral part of the financial statements.
Annual Report
Financial Statements - continued
Statement of Operations
Amounts in thousands | Year ended October 31, 2007 |
Investment Income | | |
Dividends | | $ 248,233 |
Interest | | 571 |
Income from Fidelity Central Funds | | 31,053 |
| | 279,857 |
Less foreign taxes withheld | | (22,164) |
Total income | | 257,693 |
| | |
Expenses | | |
Management fee
Basic fee | $ 79,274 | |
Performance adjustment | 8,620 | |
Transfer agent fees | 23,362 | |
Distribution fees | 933 | |
Accounting and security lending fees | 1,888 | |
Custodian fees and expenses | 2,250 | |
Independent trustees' compensation | 37 | |
Registration fees | 527 | |
Audit | 172 | |
Legal | 99 | |
Miscellaneous | 336 | |
Total expenses before reductions | 117,498 | |
Expense reductions | (4,263) | 113,235 |
Net investment income (loss) | | 144,458 |
Realized and Unrealized Gain (Loss) Net realized gain (loss) on: | | |
Investment securities: | | |
Unaffiliated issuers (net of foreign taxes of $434) | 609,692 | |
Other affiliated issuers | 8 | |
Foreign currency transactions | 228 | |
Futures contracts | (1,828) | |
Total net realized gain (loss) | | 608,100 |
Change in net unrealized appreciation (depreciation) on: Investment securities (net of increase in deferred foreign taxes of $2,428) | 2,676,076 | |
Assets and liabilities in foreign currencies | 18 | |
Futures contracts | 1,873 | |
Total change in net unrealized appreciation (depreciation) | | 2,677,967 |
Net gain (loss) | | 3,286,067 |
Net increase (decrease) in net assets resulting from operations | | $ 3,430,525 |
See accompanying notes which are an integral part of the financial statements.
Annual Report
Statement of Changes in Net Assets
Amounts in thousands | Year ended
October 31,
2007 | Year ended
October 31,
2006 |
Increase (Decrease) in Net Assets | | |
Operations | | |
Net investment income (loss) | $ 144,458 | $ 89,022 |
Net realized gain (loss) | 608,100 | 238,999 |
Change in net unrealized appreciation (depreciation) | 2,677,967 | 940,196 |
Net increase (decrease) in net assets resulting
from operations | 3,430,525 | 1,268,217 |
Distributions to shareholders from net investment income | (85,862) | (41,324) |
Distributions to shareholders from net realized gain | (224,325) | (189,744) |
Total distributions | (310,187) | (231,068) |
Share transactions - net increase (decrease) | 3,385,409 | 3,239,823 |
Redemption fees | 502 | 380 |
Total increase (decrease) in net assets | 6,506,249 | 4,277,352 |
| | |
Net Assets | | |
Beginning of period | 8,242,103 | 3,964,751 |
End of period (including undistributed net investment income of $137,292 and undistributed net investment income of $83,948, respectively) | $ 14,748,352 | $ 8,242,103 |
See accompanying notes which are an integral part of the financial statements.
Annual Report
Financial Highlights - Class A
Years ended October 31, | 2007 | 2006 | 2005 H |
Selected Per-Share Data | | | |
Net asset value, beginning of period | $ 36.47 | $ 30.57 | $ 27.41 |
Income from Investment Operations | | | |
Net investment income (loss) E | .44 | .42 | .28 |
Net realized and unrealized gain (loss) | 11.76 | 7.19 | 2.88 |
Total from investment operations | 12.20 | 7.61 | 3.16 |
Distributions from net investment income | (.35) | (.31) | - |
Distributions from net realized gain | (.98) | (1.40) | - |
Total distributions | (1.33) | (1.71) | - |
Redemption fees added to paid in capital E | - J | - J | - J |
Net asset value, end of period | $ 47.34 | $ 36.47 | $ 30.57 |
Total Return B, C, D | 34.54% | 26.01% | 11.53% |
Ratios to Average Net Assets F, I | | | |
Expenses before reductions | 1.25% | 1.27% | 1.42% A |
Expenses net of fee waivers, if any | 1.25% | 1.27% | 1.42% A |
Expenses net of all reductions | 1.22% | 1.21% | 1.36% A |
Net investment income (loss) | 1.08% | 1.22% | 1.15% A |
Supplemental Data | | | |
Net assets, end of period (in millions) | $ 417 | $ 140 | $ 2 |
Portfolio turnover rate G | 56% | 56% | 75% |
A Annualized
B Total returns for periods of less than one year are not annualized.
C Total returns would have been lower had certain expenses not been reduced during the periods shown.
D Total returns do not include the effect of the sales charges.
E Calculated based on average shares outstanding during the period.
F Fees and expenses of the underlying Fidelity Central Funds are not included in the Fund's expense ratio. The Fund indirectly bears its proportionate share of the expenses of any underlying Fidelity Central Funds.
G Amount does not include the portfolio activity of any underlying Fidelity Central Funds.
H For the period January 6, 2005 (commencement of sale of shares) to October 31, 2005.
I Expense ratios reflect operating expenses of the class. Expenses before reductions do not reflect amounts reimbursed by the investment adviser or reductions from brokerage service arrangements or other expense offset arrangements and do not represent the amount paid by the class during periods when reimbursements or reductions occur. Expense ratios before reductions for start-up periods may not be representative of longer-term operating periods. Expenses net of fee waivers reflect expenses after reimbursement by the investment adviser but prior to reductions from brokerage service arrangements or other expense offset arrangements. Expenses net of all reductions represent the net expenses paid by the class.
J Amount represents less than $.01 per share.
See accompanying notes which are an integral part of the financial statements.
Annual Report
Financial Highlights - Class T
Years ended October 31, | 2007 | 2006 | 2005 H |
Selected Per-Share Data | | | |
Net asset value, beginning of period | $ 36.30 | $ 30.49 | $ 27.41 |
Income from Investment Operations | | | |
Net investment income (loss) E | .29 | .27 | .20 |
Net realized and unrealized gain (loss) | 11.71 | 7.18 | 2.88 |
Total from investment operations | 12.00 | 7.45 | 3.08 |
Distributions from net investment income | (.26) | (.24) | - |
Distributions from net realized gain | (.98) | (1.40) | - |
Total distributions | (1.24) | (1.64) | - |
Redemption fees added to paid in capital E | - J | - J | - J |
Net asset value, end of period | $ 47.06 | $ 36.30 | $ 30.49 |
Total Return B, C, D | 34.08% | 25.49% | 11.24% |
Ratios to Average Net Assets F, I | | | |
Expenses before reductions | 1.63% | 1.71% | 1.75% A |
Expenses net of fee waivers, if any | 1.63% | 1.71% | 1.75% A |
Expenses net of all reductions | 1.60% | 1.65% | 1.69% A |
Net investment income (loss) | .70% | .78% | .83% A |
Supplemental Data | | | |
Net assets, end of period (in millions) | $ 53 | $ 10 | $ 2 |
Portfolio turnover rate G | 56% | 56% | 75% |
A Annualized
B Total returns for periods of less than one year are not annualized.
C Total returns would have been lower had certain expenses not been reduced during the periods shown.
D Total returns do not include the effect of the sales charges.
E Calculated based on average shares outstanding during the period.
F Fees and expenses of the underlying Fidelity Central Funds are not included in the Fund's expense ratio. The Fund indirectly bears its proportionate share of the expenses of any underlying Fidelity Central Funds.
G Amount does not include the portfolio activity of any underlying Fidelity Central Funds.
H For the period January 6, 2005 (commencement of sale of shares) to October 31, 2005.
I Expense ratios reflect operating expenses of the class. Expenses before reductions do not reflect amounts reimbursed by the investment adviser or reductions from brokerage service arrangements or other expense offset arrangements and do not represent the amount paid by the class during periods when reimbursements or reductions occur. Expense ratios before reductions for start-up periods may not be representative of longer-term operating periods. Expenses net of fee waivers reflect expenses after reimbursement by the investment adviser but prior to reductions from brokerage service arrangements or other expense offset arrangements. Expenses net of all reductions represent the net expenses paid by the class.
J Amount represents less than $.01 per share.
See accompanying notes which are an integral part of the financial statements.
Annual Report
Financial Highlights - Class B
Years ended October 31, | 2007 | 2006 | 2005 H |
Selected Per-Share Data | | | |
Net asset value, beginning of period | $ 36.12 | $ 30.36 | $ 27.41 |
Income from Investment Operations | | | |
Net investment income (loss) E | .08 | .08 | .08 |
Net realized and unrealized gain (loss) | 11.64 | 7.19 | 2.87 |
Total from investment operations | 11.72 | 7.27 | 2.95 |
Distributions from net investment income | (.16) | (.11) | - |
Distributions from net realized gain | (.98) | (1.40) | - |
Total distributions | (1.14) | (1.51) | - |
Redemption fees added to paid in capital E | - J | - J | - J |
Net asset value, end of period | $ 46.70 | $ 36.12 | $ 30.36 |
Total Return B, C, D | 33.37% | 24.91% | 10.76% |
Ratios to Average Net Assets F, I | | | |
Expenses before reductions | 2.14% | 2.27% | 2.24% A |
Expenses net of fee waivers, if any | 2.14% | 2.25% | 2.24% A |
Expenses net of all reductions | 2.10% | 2.19% | 2.18% A |
Net investment income (loss) | .19% | .24% | .33% A |
Supplemental Data | | | |
Net assets, end of period (in millions) | $ 17 | $ 4 | $ 1 |
Portfolio turnover rate G | 56% | 56% | 75% |
A Annualized
B Total returns for periods of less than one year are not annualized.
C Total returns would have been lower had certain expenses not been reduced during the periods shown.
D Total returns do not include the effect of the contingent deferred sales charge.
E Calculated based on average shares outstanding during the period.
F Fees and expenses of the underlying Fidelity Central Funds are not included in the Fund's expense ratio. The Fund indirectly bears its proportionate share of the expenses of any underlying Fidelity Central Funds.
G Amount does not include the portfolio activity of any underlying Fidelity Central Funds.
H For the period January 6, 2005 (commencement of sale of shares) to October 31, 2005.
I Expense ratios reflect operating expenses of the class. Expenses before reductions do not reflect amounts reimbursed by the investment adviser or reductions from brokerage service arrangements or other expense offset arrangements and do not represent the amount paid by the class during periods when reimbursements or reductions occur. Expense ratios before reductions for start-up periods may not be representative of longer-term operating periods. Expenses net of fee waivers reflect expenses after reimbursement by the investment adviser but prior to reductions from brokerage service arrangements or other expense offset arrangements. Expenses net of all reductions represent the net expenses paid by the class.
J Amount represents less than $.01 per share.
See accompanying notes which are an integral part of the financial statements.
Annual Report
Financial Highlights - Class C
Years ended October 31, | 2007 | 2006 | 2005 H |
Selected Per-Share Data | | | |
Net asset value, beginning of period | $ 36.19 | $ 30.41 | $ 27.41 |
Income from Investment Operations | | | |
Net investment income (loss) E | .09 | .11 | .13 |
Net realized and unrealized gain (loss) | 11.66 | 7.19 | 2.87 |
Total from investment operations | 11.75 | 7.30 | 3.00 |
Distributions from net investment income | (.14) | (.12) | - |
Distributions from net realized gain | (.98) | (1.40) | - |
Total distributions | (1.12) | (1.52) | - |
Redemption fees added to paid in capital E | - J | - J | - J |
Net asset value, end of period | $ 46.82 | $ 36.19 | $ 30.41 |
Total Return B, C, D | 33.38% | 24.97% | 10.94% |
Ratios to Average Net Assets F, I | | | |
Expenses before reductions | 2.11% | 2.16% | 2.04% A |
Expenses net of fee waivers, if any | 2.11% | 2.16% | 2.04% A |
Expenses net of all reductions | 2.08% | 2.11% | 1.98% A |
Net investment income (loss) | .22% | .33% | .53% A |
Supplemental Data | | | |
Net assets, end of period (in millions) | $ 28 | $ 6 | $ 2 |
Portfolio turnover rate G | 56% | 56% | 75% |
A Annualized
B Total returns for periods of less than one year are not annualized.
C Total returns would have been lower had certain expenses not been reduced during the periods shown.
D Total returns do not include the effect of the contingent deferred sales charge.
E Calculated based on average shares outstanding during the period.
F Fees and expenses of the underlying Fidelity Central Funds are not included in the Fund's expense ratio. The Fund indirectly bears its proportionate share of the expenses of any underlying Fidelity Central Funds.
G Amount does not include the portfolio activity of any underlying Fidelity Central Funds.
H For the period January 6, 2005 (commencement of sale of shares) to October 31, 2005.
I Expense ratios reflect operating expenses of the class. Expenses before reductions do not reflect amounts reimbursed by the investment adviser or reductions from brokerage service arrangements or other expense offset arrangements and do not represent the amount paid by the class during periods when reimbursements or reductions occur. Expense ratios before reductions for start-up periods may not be representative of longer-term operating periods. Expenses net of fee waivers reflect expenses after reimbursement by the investment adviser but prior to reductions from brokerage service arrangements or other expense offset arrangements. Expenses net of all reductions represent the net expenses paid by the class.
J Amount represents less than $.01 per share.
See accompanying notes which are an integral part of the financial statements.
Annual Report
Financial Highlights - International Discovery
Years ended October 31, | 2007 | 2006 | 2005 | 2004 | 2003 |
Selected Per-Share Data | | | | | |
Net asset value, beginning of period | $ 36.67 | $ 30.65 | $ 25.31 | $ 21.87 | $ 16.66 |
Income from Investment Operations | | | | | |
Net investment income (loss) B | .53 | .48 | .37 | .22 | .19 |
Net realized and unrealized gain (loss) | 11.84 | 7.25 | 5.24 | 3.40 | 5.11 |
Total from investment operations | 12.37 | 7.73 | 5.61 | 3.62 | 5.30 |
Distributions from net investment income | (.38) | (.31) | (.15) | (.18) | (.09) |
Distributions from net realized gain | (.98) | (1.40) | (.12) | - | - |
Total distributions | (1.36) | (1.71) | (.27) | (.18) | (.09) |
Redemption fees added to paid in capital B | - F | - F | - F | - F | - F |
Net asset value, end of period | $ 47.68 | $ 36.67 | $ 30.65 | $ 25.31 | $ 21.87 |
Total Return A | 34.85% | 26.34% | 22.29% | 16.65% | 31.97% |
Ratios to Average Net Assets C, E | | | | | |
Expenses before reductions | 1.04% | 1.09% | 1.08% | 1.10% | 1.14% |
Expenses net of fee waivers, if any | 1.04% | 1.08% | 1.07% | 1.10% | 1.14% |
Expenses net of all reductions | 1.00% | 1.03% | 1.01% | 1.06% | 1.11% |
Net investment income (loss) | 1.30% | 1.41% | 1.35% | .92% | 1.08% |
Supplemental Data | | | | | |
Net assets, end of period (in millions) | $ 14,176 | $ 8,054 | $ 3,949 | $ 2,193 | $ 1,243 |
Portfolio turnover rate D | 56% | 56% | 75% | 87% | 81% |
A Total returns would have been lower had certain expenses not been reduced during the periods shown.
B Calculated based on average shares outstanding during the period.
C Fees and expenses of the underlying Fidelity Central Funds are not included in the Fund's expense ratio. The Fund indirectly bears its proportionate share of the expenses of any underlying Fidelity Central Funds.
D Amount does not include the portfolio activity of any underlying Fidelity Central Funds.
E Expense ratios reflect operating expenses of the class. Expenses before reductions do not reflect amounts reimbursed by the investment adviser or reductions from brokerage service arrangements or other expense offset arrangements and do not represent the amount paid by the class during periods when reimbursements or reductions occur. Expenses net of fee waivers reflect expenses after reimbursement by the investment adviser but prior to reductions from brokerage service arrangements or other expense offset arrangements. Expenses net of all reductions represent the net expenses paid by the class.
F Amount represents less than $.01 per share.
See accompanying notes which are an integral part of the financial statements.
Annual Report
Financial Highlights - Institutional Class
Years ended October 31, | 2007 | 2006 | 2005 G |
Selected Per-Share Data | | | |
Net asset value, beginning of period | $ 36.71 | $ 30.68 | $ 27.41 |
Income from Investment Operations | | | |
Net investment income (loss) D | .55 | .51 | .38 |
Net realized and unrealized gain (loss) | 11.85 | 7.25 | 2.89 |
Total from investment operations | 12.40 | 7.76 | 3.27 |
Distributions from net investment income | (.40) | (.33) | - |
Distributions from net realized gain | (.98) | (1.40) | - |
Total distributions | (1.38) | (1.73) | - |
Redemption fees added to paid in capital D | - I | - I | - I |
Net asset value, end of period | $ 47.73 | $ 36.71 | $ 30.68 |
Total Return B, C | 34.93% | 26.45% | 11.93% |
Ratios to Average Net Assets E, H | | | |
Expenses before reductions | .97% | 1.00% | .97% A |
Expenses net of fee waivers, if any | .97% | 1.00% | .97% A |
Expenses net of all reductions | .94% | .95% | .90% A |
Net investment income (loss) | 1.36% | 1.49% | 1.60% A |
Supplemental Data | | | |
Net assets, end of period (in millions) | $ 58 | $ 28 | $ 10 |
Portfolio turnover rate F | 56% | 56% | 75% |
A Annualized
B Total returns for periods of less than one year are not annualized.
C Total returns would have been lower had certain expenses not been reduced during the periods shown.
D Calculated based on average shares outstanding during the period.
E Fees and expenses of the underlying Fidelity Central Funds are not included in the Fund's expense ratio. The Fund indirectly bears its proportionate share of the expenses of any underlying Fidelity Central Funds.
F Amount does not include the portfolio activity of any underlying Fidelity Central Funds.
G For the period January 6, 2005 (commencement of sale of shares) to October 31, 2005.
H Expense ratios reflect operating expenses of the class. Expenses before reductions do not reflect amounts reimbursed by the investment adviser or reductions from brokerage service arrangements or other expense offset arrangements and do not represent the amount paid by the class during periods when reimbursements or reductions occur. Expense ratios before reductions for start-up periods may not be representative of longer-term operating periods. Expenses net of fee waivers reflect expenses after reimbursement by the investment adviser but prior to reductions from brokerage service arrangements or other expense offset arrangements. Expenses net of all reductions represent the net expenses paid by the class.
I Amount represents less than $.01 per share.
See accompanying notes which are an integral part of the financial statements.
Annual Report
Notes to Financial Statements
For the period ended October 31, 2007
(Amounts in thousands except ratios)
1. Organization.
Fidelity International Discovery Fund (the Fund) is a fund of Fidelity Investment Trust (the trust) and is authorized to issue an unlimited number of shares. The trust is registered under the Investment Company Act of 1940, as amended (the 1940 Act), as an open-end management investment company organized as a Massachusetts business trust. The Fund offers Class A, Class T, Class B, Class C, International Discovery, and Institutional Class shares, each of which has equal rights as to assets and voting privileges. Each class has exclusive voting rights with respect to matters that affect that class. Class B shares will automatically convert to Class A shares after a holding period of seven years from the initial date of purchase. Investment income, realized and unrealized capital gains and losses, the common expenses of the Fund, and certain fund-level expense reductions, if any, are allocated on a pro rata basis to each class based on the relative net assets of each class to the total net assets of the Fund. Each class differs with respect to transfer agent and distribution and service plan fees incurred. Certain expense reductions also differ by class. The Fund's investments in emerging markets can be subject to social, economic, regulatory, and political uncertainties and can be extremely volatile.
2. Investments in Fidelity Central Funds.
The Fund may invest in Fidelity Central Funds, which are open-end investment companies available only to other investment companies and accounts managed by Fidelity Management & Research Company (FMR) and its affiliates. The Fund's Schedule of Investments lists each of the Fidelity Central Funds as an investment of the Fund, but does not include the underlying holdings of each Fidelity Central Fund. As an Investing Fund, the Fund indirectly bears its proportionate share of the expenses of the underlying Fidelity Central Funds.
The Money Market Central Funds seek preservation of capital and current income and are managed by Fidelity Investments Money Management, Inc. (FIMM), an affiliate of FMR.
A complete list of holdings for each Fidelity Central Fund is available upon request or at the SEC's web site at www.sec.gov. In addition, the financial statements of the Fidelity Central Funds, are available on the SEC's web site or upon request.
3. Significant Accounting Policies.
The financial statements have been prepared in conformity with accounting principles generally accepted in the United States of America, which require management to make certain estimates and assumptions at the date of the financial statements. The following summarizes the significant accounting policies of the Fund:
Annual Report
3. Significant Accounting Policies - continued
Security Valuation. Investments are valued and net asset value (NAV) per share is calculated (NAV calculation) as of the close of business of the New York Stock Exchange (NYSE), normally 4:00 p.m. Eastern time. Wherever possible, the Fund uses independent pricing services approved by the Board of Trustees to value its investments.
Equity securities, including restricted securities, for which market quotations are readily available, are valued at the last reported sale price or official closing price as reported by an independent pricing service on the primary market or exchange on which they are traded. In the event there were no sales during the day or closing prices are not available, securities are valued at the last quoted bid price. Investments in open-end mutual funds, including the Fidelity Central Funds, are valued at their closing net asset value each business day. Short-term securities with remaining maturities of sixty days or less for which quotations are not readily available are valued at amortized cost, which approximates value.
When current market prices or quotations are not readily available or do not accurately reflect fair value, valuations may be determined in accordance with procedures adopted by the Board of Trustees. For example, when developments occur between the close of a market and the close of the NYSE that may materially affect the value of some or all of the securities, or when trading in a security is halted, those securities may be fair valued. Factors used in the determination of fair value may include monitoring news to identify significant market or security specific events such as changes in the value of U.S. securities markets, reviewing developments in foreign markets and evaluating the performance of ADRs, futures contracts and exchange-traded funds. Because the Fund's utilization of fair value pricing depends on market activity, the frequency with which fair value pricing is used cannot be predicted and may be utilized to a significant extent. The value of securities used for NAV calculation under fair value pricing may differ from published prices for the same securities.
Foreign Currency. The Fund uses foreign currency contracts to facilitate transactions in foreign-denominated securities. Losses from these transactions may arise from changes in the value of the foreign currency or if the counterparties do not perform under the contracts' terms.
Foreign-denominated assets, including investment securities, and liabilities are translated into U.S. dollars at the exchange rate at period end. Purchases and sales of investment securities, income and dividends received and expenses denominated in foreign currencies are translated into U.S. dollars at the exchange rate in effect on the transaction date.
The effects of exchange rate fluctuations on investments are included with the net realized and unrealized gain (loss) on investment securities. Other foreign currency transactions resulting in realized and unrealized gain (loss) are disclosed separately.
Annual Report
Notes to Financial Statements - continued
(Amounts in thousands except ratios)
3. Significant Accounting Policies - continued
Investment Transactions and Income. For financial reporting purposes, the Fund's investment holdings and NAV include trades executed through the end of the last business day of the period. The NAV for processing shareholder transactions includes trades executed through the end of the prior business day. Gains and losses on securities sold are determined on the basis of identified cost and may include proceeds received from litigation. Dividend income is recorded on the ex-dividend date, except for certain dividends from foreign securities where the ex-dividend date may have passed, which are recorded as soon as the Fund is informed of the ex-dividend date. Non-cash dividends included in dividend income, if any, are recorded at the fair market value of the securities received. Distributions received on securities that represent a return of capital or capital gain are recorded as a reduction of cost of investments and/or as a realized gain. The Fund estimates the components of distributions received that may be considered return of capital distributions or capital gain distributions. Interest income and distributions from the Fidelity Central Funds are accrued as earned. Interest income includes coupon interest and amortization of premium and accretion of discount on debt securities. Investment income is recorded net of foreign taxes withheld where recovery of such taxes is uncertain.
Expenses. Most expenses of the trust can be directly attributed to a fund. Expenses which cannot be directly attributed are apportioned among each Fund in the trust. Expense estimates are accrued in the period to which they relate and adjustments are made when actual amounts are known.
Income Tax Information and Distributions to Shareholders. Each year, the Fund intends to qualify as a regulated investment company by distributing all of its taxable income and realized gains under Subchapter M of the Internal Revenue Code. As a result, no provision for income taxes is required in the accompanying financial statements. Foreign taxes are provided for based on the Fund's understanding of the tax rules and rates that exist in the foreign markets in which it invests.
Distributions are recorded on the ex-dividend date. Income dividends and capital gain distributions are declared separately for each class. Income and capital gain distributions are determined in accordance with income tax regulations, which may differ from generally accepted accounting principles. In addition, the Fund will claim a portion of the payment made to redeeming shareholders as a distribution for income tax purposes.
Capital accounts within the financial statements are adjusted for permanent book-tax differences. These adjustments have no impact on net assets or the results of operations. Temporary book-tax differences will reverse in a subsequent period.
Annual Report
3. Significant Accounting Policies - continued
Income Tax Information and Distributions to Shareholders - continued
Book-tax differences are primarily due to futures transactions, foreign currency transactions, certain foreign taxes, passive foreign investment companies (PFIC), market discount, deferred trustees compensation and losses deferred due to wash sales.
The tax-basis components of distributable earnings and the federal tax cost as of period end were as follows:
Unrealized appreciation | $ 4,321,525 | |
Unrealized depreciation | (139,903) | |
Net unrealized appreciation (depreciation) | 4,181,622 | |
Undistributed ordinary income | 152,966 | |
Undistributed long-term capital gain | 495,087 | |
Cost for federal income tax purposes | $ 10,641,792 | |
The tax character of distributions paid was as follows:
| October 31, 2007 | October 31, 2006 |
Ordinary Income | $ 145,377 | $ 106,379 |
Long-term Capital Gains | 164,810 | 124,689 |
Total | $ 310,187 | $ 231,068 |
Short-Term Trading (Redemption) Fees. Shares held in the Fund less than 30 days are subject to a redemption fee equal to 1.00% of the proceeds of the redeemed shares. All redemption fees, including any estimated redemption fees paid by FMR, are retained by the Fund and accounted for as an addition to paid in capital.
New Accounting Pronouncements. In July 2006, Financial Accounting Standards Board Interpretation No. 48, Accounting for Uncertainty in Income Taxes - an interpretation of FASB Statement 109 (FIN 48), was issued and is effective on the last business day of the semiannual reporting period for fiscal years beginning after December 15, 2006. FIN 48 sets forth a threshold for financial statement recognition, measurement and disclosure of a tax position taken or expected to be taken on a tax return. Management has concluded that the adoption of FIN 48 will not result in a material impact on the Fund's net assets, results of operations and financial statement disclosures.
In addition, in September 2006, Statement of Financial Accounting Standards No. 157, Fair Value Measurements (SFAS 157), was issued and is effective for fiscal years beginning after November 15, 2007. SFAS 157 defines fair value, establishes a framework for measuring fair value and expands disclosures about fair value measurements. Management is currently evaluating the impact the adoption of SFAS 157 will have on the Fund's financial statement disclosures.
Annual Report
Notes to Financial Statements - continued
(Amounts in thousands except ratios)
4. Operating Policies.
Repurchase Agreements. FMR has received an Exemptive Order from the Securities and Exchange Commission (the SEC) which permits the Fund and other affiliated entities of FMR to transfer uninvested cash balances into joint trading accounts which are then invested in repurchase agreements. The Fund may also invest directly with institutions in repurchase agreements. Repurchase agreements are collateralized by government or non-government securities. Upon settlement date, collateral is held in segregated accounts with custodian banks and may be obtained in the event of a default of the counterparty. The Fund monitors, on a daily basis, the value of the collateral to ensure it is at least equal to the principal amount of the repurchase agreement (including accrued interest). In the event of a default by the counterparty, realization of the collateral proceeds could be delayed, during which time the value of the collateral may decline.
Futures Contracts. The Fund may use futures contracts to manage its exposure to the stock markets. Buying futures tends to increase a fund's exposure to the underlying instrument, while selling futures tends to decrease a fund's exposure to the underlying instrument or hedge other fund investments. Upon entering into a futures contract, a fund is required to deposit with a clearing broker, no later than the following business day, an amount ("initial margin") equal to a certain percentage of the face value of the contract. The initial margin may be in the form of cash or securities and is transferred to a segregated account on settlement date. Subsequent payments ("variation margin") are made or received by a fund depending on the daily fluctuations in the value of the futures contract and are accounted for as unrealized gains or losses. Realized gains (losses) are recorded upon the expiration or closing of the futures contract. Securities deposited to meet margin requirements are identified in the Schedule of Investments. Futures contracts involve, to varying degrees, risk of loss in excess of any futures variation margin reflected in the Statement of Assets and Liabilities. The underlying face amount at value of any open futures contracts at period end is shown in the Schedule of Investments under the caption "Futures Contracts." This amount reflects each contract's exposure to the underlying instrument at period end. Losses may arise from changes in the value of the underlying instruments or if the counterparties do not perform under the contract's terms. Futures contracts are valued at the settlement price established each day by the board of trade or exchange on which they are traded.
5. Purchases and Sales of Investments.
Purchases and sales of securities, other than short-term securities, aggregated $9,077,103 and $6,122,723, respectively.
Annual Report
6. Fees and Other Transactions with Affiliates.
Management Fee. FMR and its affiliates provide the Fund with investment management related services for which the Fund pays a monthly management fee. The management fee is the sum of an individual fund fee rate that is based on an annual rate of .45% of the Fund's average net assets and a group fee rate that averaged ..26% during the period. The group fee rate is based upon the average net assets of all the mutual funds advised by FMR. The group fee rate decreases as assets under management increase and increases as assets under management decrease. In addition, the management fee is subject to a performance adjustment (up to a maximum of ± .20% of the Fund's average net assets over a 36 month performance period). The upward or downward adjustment to the management fee is based on the investment performance of the asset-weighted return of all classes relative investment performance of the retail class of the Fund, International Discovery, as compared to an appropriate benchmark index. For the period, the total annual management fee rate, including the performance adjustment, was .78% of the Fund's average net assets.
Distribution and Service Plan. In accordance with Rule 12b-1 of the 1940 Act, the Fund has adopted separate Distribution and Service Plans for each class of shares. Certain classes pay Fidelity Distributors Corporation (FDC), an affiliate of FMR, separate Distribution and Service Fees, each of which is based on an annual percentage of each class' average net assets. In addition, FDC may pay financial intermediaries for selling shares of the Fund and providing shareholder support services. For the period, the Distribution and Service Fee rates and the total amounts paid to and retained by FDC were as follows:
| Distribution
Fee | Service
Fee | Paid to
FDC | Retained
by FDC |
Class A | 0% | .25% | $ 583 | $ 37 |
Class T | .25% | .25% | 129 | 4 |
Class B | .75% | .25% | 87 | 65 |
Class C | .75% | 25% | 134 | 65 |
| | | $ 933 | $ 171 |
Sales Load. FDC receives a front-end sales charge of up to 5.75% for selling Class A shares, and 3.50% for selling Class T shares, some of which is paid to financial intermediaries for selling shares of the Fund. FDC receives the proceeds of contingent deferred sales charges levied on Class A, Class T, Class B, and Class C redemptions. These charges depend on the holding period. The deferred sales charges range from 5% to 1% for Class B, 1% for Class C, 1% to .50% for certain purchases of Class A shares and .25% for certain purchases of Class T shares.
Annual Report
Notes to Financial Statements - continued
(Amounts in thousands except ratios)
6. Fees and Other Transactions with Affiliates - continued
Sales Load - continued
For the period, sales charge amounts retained by FDC were as follows:
| Retained
by FDC |
Class A | $ 128 |
Class T | 24 |
Class B* | 12 |
Class C* | 5 |
| $ 169 |
* When Class B and Class C shares are initially sold, FDC pays commissions from its own resources to financial intermediaries through which the sales are made.
Transfer Agent Fees. Fidelity Investments Institutional Operations Company, Inc. (FIIOC), an affiliate of FMR, is the transfer, dividend disbursing and shareholder servicing agent for each class of the Fund, except for International Discovery. Fidelity Service Company, Inc. (FSC), an affiliate of FMR, is the transfer agent for International Discovery shares. FIIOC and FSC receive account fees and asset-based fees that vary according to the account size and type of account of the shareholders of the respective classes of the Fund. FIIOC and FSC pay for typesetting, printing and mailing of shareholder reports, except proxy statements. For the period, the total transfer agent fees paid by each class to FIIOC or FSC, were as follows:
| Amount | % of
Average
Net Assets |
Class A | $ 404 | .17 |
Class T | 80 | .30 |
Class B | 28 | .32 |
Class C | 40 | .29 |
International Discovery | 22,756 | .21 |
Institutional Class | 54 | .14 |
| $ 23,362 | |
Accounting and Security Lending Fees. FSC maintains the Fund's accounting records. The accounting fee is based on the level of average net assets for the month. Under a separate contract, FSC administers the security lending program. The security lending fee is based on the number and duration of lending transactions.
Brokerage Commissions. The Fund placed a portion of its portfolio transactions with brokerage firms which are affiliates of the investment adviser. The commissions paid to these affiliated firms were $1 for the period.
Annual Report
7. Committed Line of Credit.
The Fund participates with other funds managed by FMR in a $4.2 billion credit facility (the "line of credit") to be utilized for temporary or emergency purposes to fund shareholder redemptions or for other short-term liquidity purposes. The Fund has agreed to pay commitment fees on its pro rata portion of the line of credit, which amounted to $22 and is reflected in Miscellaneous Expense on the Statement of Operations. During the period, there were no borrowings on this line of credit.
8. Security Lending.
The Fund lends portfolio securities from time to time in order to earn additional income. On the settlement date of the loan, the Fund receives collateral (in the form of U.S. Treasury obligations, letters of credit and/or cash) against the loaned securities and maintains collateral in an amount not less than 100% of the market value of the loaned securities during the period of the loan. The market value of the loaned securities is determined at the close of business of the Fund and any additional required collateral is delivered to the Fund on the next business day. If the borrower defaults on its obligation to return the securities loaned because of insolvency or other reasons, a fund could experience delays and costs in recovering the securities loaned or in gaining access to the collateral. Any cash collateral received is invested in the Fidelity Securities Lending Cash Central Fund. The value of loaned securities and cash collateral at period end are disclosed on the Fund's Statement of Assets and Liabilities. Security lending income represents the income earned on investing cash collateral, less fees and expenses associated with the loan, plus any premium payments that may be received on the loan of certain types of securities. Security lending income is presented in the Statement of Operations as a component of income from Fidelity Central Funds. Net income from lending portfolio securities during the period amounted to $8,932.
9. Expense Reductions.
Many of the brokers with whom FMR places trades on behalf of the Fund provided services to the Fund in addition to trade execution. These services included payments of certain expenses on behalf of the Fund totaling $3,703 for the period. In addition, through arrangements with the Fund's custodian and each class' transfer agent, credits realized as a result of uninvested cash balances were used to reduce the Fund's expenses. During the period, these credits reduced the Fund's custody expenses by $11. During the period, credits reduced each class' transfer agent expense as noted in the table below.
| Transfer Agent
expense reduction | |
International Discovery | $ 433 | |
Annual Report
Notes to Financial Statements - continued
(Amounts in thousands except ratios)
10. Other.
The Fund's organizational documents provide former and current trustees and officers with a limited indemnification against liabilities arising in connection with the performance of their duties to the Fund. In the normal course of business, the Fund may also enter into contracts that provide general indemnifications. The Fund's maximum exposure under these arrangements is unknown as this would be dependent on future claims that may be made against the Fund. The risk of material loss from such claims is considered remote.
In September 2006, FIIOC, a transfer agent of the Fund, notified the Fund that the Fund's books and records did not reflect a conversion of certain Class B to Class A shares upon their conversion date. In March 2007, FIIOC converted the relevant Class B shares to Class A shares and recorded the conversion in the books and records of the Fund which did not result in a material impact to the Fund's reported net assets or results of operations in the accompanying financial statements. FIIOC has remediated affected shareholders and reimbursed the Fund for all related audit and legal expenses.
The United States Securities and Exchange Commission ("SEC") is conducting an investigation of FMR (covering the years 2002 to 2004) arising from gifts, gratuities and business entertainment provided by certain brokers to certain individuals who were employed on FMR's domestic equity trading desk during that period. FMR is in discussions with the SEC staff regarding the possible resolution of the matter, but as of period-end no final resolution has been reached.
In December 2006, the Independent Trustees completed their own investigation of the matter with the assistance of independent counsel. The Independent Trustees and FMR agree that, despite the absence of proof that the Fidelity mutual funds experienced diminished execution quality as a result of the improper receipt of gifts and business entertainment, the conduct at issue was serious and is worthy of redress. Accordingly, the Independent Trustees have requested and FMR has agreed to pay $42 million to Fidelity mutual funds, plus interest to be determined at the time that payment is made. A method of allocating this payment among the funds has not yet been determined. The total payment to the Fund is not anticipated to have a material impact on the Fund's net assets. In addition, FMR reimbursed related legal expenses which are recorded in the accompanying Statement of Operations as an expense reduction.
Annual Report
11. Distributions to Shareholders.
Distributions to shareholders of each class were as follows:
| Years ended October 31, |
| 2007 | 2006 |
From net investment income | | |
Class A | $ 1,387 | $ 38 |
Class T | 80 | 18 |
Class B | 21 | 3 |
Class C | 24 | 8 |
International Discovery | 84,038 | 41,152 |
Institutional Class | 312 | 105 |
Total | 85,862 | 41,324 |
From net realized gain | | |
Class A | 3,929 | 173 |
Class T | 302 | 102 |
Class B | 130 | 40 |
Class C | 170 | 94 |
International Discovery | 219,032 | 188,890 |
Institutional Class | 762 | 445 |
Total | $ 224,325 | $ 189,744 |
Annual Report
Notes to Financial Statements - continued
(Amounts in thousands except ratios)
12. Share Transactions.
Transactions for each class of shares were as follows:
| Shares
Years ended October 31, | Dollars
Years ended October 31, |
| 2007 | 2006 | 2007 | 2006 |
Class A | | | | |
Shares sold | 5,675 | 3,952 | $ 234,633 | $ 133,777 |
Reinvestment of distributions | 63 | 5 | 2,271 | 160 |
Shares redeemed | (770) | (183) | (31,203) | (6,217) |
Net increase (decrease) | 4,968 | 3,774 | $ 205,701 | $ 127,720 |
Class T | | | | |
Shares sold | 1,031 | 248 | $ 42,252 | $ 8,469 |
Reinvestment of distributions | 10 | 4 | 371 | 112 |
Shares redeemed | (187) | (36) | (7,614) | (1,223) |
Net increase (decrease) | 854 | 216 | $ 35,009 | $ 7,358 |
Class B | | | | |
Shares sold | 293 | 112 | $ 11,952 | $ 3,875 |
Reinvestment of distributions | 4 | 1 | 136 | 37 |
Shares redeemed | (53) | (14) | (2,096) | (489) |
Net increase (decrease) | 244 | 99 | $ 9,992 | $ 3,423 |
Class C | | | | |
Shares sold | 481 | 130 | $ 19,749 | $ 4,409 |
Reinvestment of distributions | 4 | 1 | 139 | 41 |
Shares redeemed | (55) | (32) | (2,234) | (1,088) |
Net increase (decrease) | 430 | 99 | $ 17,654 | $ 3,362 |
International Discovery | | | | |
Shares sold | 133,089 | 123,095 | $ 5,367,776 | $ 4,201,412 |
Reinvestment of distributions | 7,929 | 7,089 | 289,550 | 215,944 |
Shares redeemed | (63,328) | (39,365) | (2,558,324) | (1,334,783) |
Net increase (decrease) | 77,690 | 90,819 | $ 3,099,002 | $ 3,082,573 |
Institutional Class | | | | |
Shares sold | 538 | 512 | $ 22,351 | $ 17,352 |
Reinvestment of distributions | 19 | 4 | 700 | 121 |
Shares redeemed | (120) | (61) | (5,000) | (2,086) |
Net increase (decrease) | 437 | 455 | $ 18,051 | $ 15,387 |
Annual Report
Report of Independent Registered Public Accounting Firm
To the Trustees of Fidelity Investment Trust and the Shareholders of Fidelity International Discovery Fund:
In our opinion, the accompanying statement of assets and liabilities, including the schedule of investments, and the related statements of operations and of changes in net assets and the financial highlights present fairly, in all material respects, the financial position of Fidelity International Discovery Fund (a fund of Fidelity Investment Trust) at October 31, 2007, the results of its operations for the year then ended, the changes in its net assets for each of the two years in the period then ended and the financial highlights for each of the periods indicated, in conformity with accounting principles generally accepted in the United States of America. These financial statements and financial highlights (hereafter referred to as "financial statements") are the responsibility of the Fidelity International Discovery Fund's management. Our responsibility is to express an opinion on these financial statements based on our audits. We conducted our audits of these financial statements in accordance with the standards of the Public Company Accounting Oversight Board (United States). Those standards require that we plan and perform the audit to obtain reasonable assurance about whether the financial statements are free of material misstatement. An audit includes examining, on a test basis, evidence supporting the amounts and disclosures in the financial statements, assessing the accounting principles used and significant estimates made by management, and evaluating the overall financial statement presentation. We believe that our audits, which included confirmation of securities at October 31, 2007 by correspondence with the custodian and brokers, provide a reasonable basis for our opinion.
/s/ PricewaterhouseCoopers LLP
PricewaterhouseCoopers LLP
Boston, Massachusetts
December 20, 2007
Annual Report
Trustees and Officers
The Trustees, Members of the Advisory Board, and executive officers of the trust, as applicable, are listed below. The Board of Trustees governs the fund and is responsible for protecting the interests of shareholders. The Trustees are experienced executives who meet periodically throughout the year to oversee the fund's activities, review contractual arrangements with companies that provide services to the fund, and review the fund's performance. Except for James C. Curvey, each of the Trustees oversees 370 funds advised by FMR or an affiliate. Mr. Curvey oversees 340 funds advised by FMR or an affiliate.
The Trustees hold office without limit in time except that (a) any Trustee may resign; (b) any Trustee may be removed by written instrument, signed by at least two-thirds of the number of Trustees prior to such removal; (c) any Trustee who requests to be retired or who has become incapacitated by illness or injury may be retired by written instrument signed by a majority of the other Trustees; and (d) any Trustee may be removed at any special meeting of shareholders by a two-thirds vote of the outstanding voting securities of the trust. Each Trustee who is not an interested person (as defined in the 1940 Act) (Independent Trustee), shall retire not later than the last day of the calendar year in which his or her 72nd birthday occurs. The Independent Trustees may waive this mandatory retirement age policy with respect to individual Trustees. The executive officers and Advisory Board Members hold office without limit in time, except that any officer and Advisory Board Member may resign or may be removed by a vote of a majority of the Trustees at any regular meeting or any special meeting of the Trustees. Except as indicated, each individual has held the office shown or other offices in the same company for the past five years.
The fund's Statement of Additional Information (SAI) includes more information about the Trustees. To request a free copy, call Fidelity at 1-877-208-0098.
Interested Trustees*:
Correspondence intended for each Trustee who is an interested person may be sent to Fidelity Investments, 82 Devonshire Street, Boston, Massachusetts 02109.
Name, Age; Principal Occupation |
Edward C. Johnson 3d (77) |
| Year of Election or Appointment: 1984 Mr. Johnson is Chairman of the Board of Trustees. Mr. Johnson serves as President (2006-present), Chief Executive Officer, Chairman, and a Director of FMR LLC; Chairman and a Director of FMR; Chairman and a Director of Fidelity Research & Analysis Company (FRAC); Chairman and a Director of Fidelity Investments Money Management, Inc.; and Chairman (2001-present) and a Director of FMR Co., Inc. In addition, Mr. Johnson serves as Chairman and Director of Fidelity International Limited (FIL). |
James C. Curvey (72) |
| Year of Election or Appointment: 2007 Mr. Curvey also serves as Trustee (2007-present) or Member of the Advisory Board (2007-present) of other investment companies advised by FMR. Mr. Curvey is a Director of FMR and FMR Co., Inc. (2007-
present). Mr. Curvey is also Vice Chairman (2006-present) and Director of FMR LLC. Mr. Curvey joined Fidelity in 1982 and served in numerous senior management positions, including President and Chief Operating Officer of FMR LLC (1997-2000) and President of Fidelity Strategic Investments (2000-2002). In addition, he serves as a member of the Board of Directors of Geerlings & Wade, Inc. (wine distribution). |
* Trustees have been determined to be "Interested Trustees" by virtue of, among other things, their affiliation with the trust or various entities under common control with FMR. FMR Corp. merged with FMR LLC on October 1, 2007. Any references to FMR LLC for prior periods are deemed to be references to the prior entity.
Independent Trustees:
Correspondence intended for each Independent Trustee (that is, the Trustees other than the Interested Trustees) may be sent to Fidelity Investments, P.O. Box 55235, Boston, Massachusetts 02205-5235.
Name, Age; Principal Occupation |
Dennis J. Dirks (59) |
| Year of Election or Appointment: 2005 Prior to his retirement in May 2003, Mr. Dirks was Chief Operating Officer and a member of the Board of The Depository Trust & Clearing Corporation (DTCC) (1999-2003). He also served as President, Chief Operating Officer, and Board member of The Depository Trust Company (DTC) (1999-2003) and President and Board member of the National Securities Clearing Corporation (NSCC) (1999-2003). In addition, Mr. Dirks served as Chief Executive Officer and Board member of the Government Securities Clearing Corporation (2001-2003) and Chief Executive Officer and Board member of the Mortgage-Backed Securities Clearing Corporation (2001-2003). Mr. Dirks also serves as a Trustee and a member of the Finance Committee of Manhattan College (2005-present) and a Trustee and a member of the Finance Committee of AHRC of Nassau County (2006-present). |
Albert R. Gamper, Jr. (65) |
| Year of Election or Appointment: 2006 Prior to his retirement in December 2004, Mr. Gamper served as Chairman of the Board of CIT Group Inc. (commercial finance). During his tenure with CIT Group Inc. Mr. Gamper served in numerous senior management positions, including Chairman (1987-1989; 1999-2001; 2002-2004), Chief Executive Officer (1987-2004), and President (1989-2002). He currently serves as a member of the Board of Directors of Public Service Enterprise Group (utilities, 2001-present), Chairman of the Board of Governors, Rutgers University (2004-present), and Chairman of the Board of Saint Barnabas Health Care System. |
George H. Heilmeier (71) |
| Year of Election or Appointment: 2004 Dr. Heilmeier is Chairman Emeritus of Telcordia Technologies (communication software and systems), where prior to his retirement, he served as company Chairman and Chief Executive Officer. He currently serves on the Boards of Directors of The Mitre Corporation (systems engineering and information technology support for the government), and HRL Laboratories (private research and development, 2004-present). He is Chairman of the General Motors Science & Technology Advisory Board and a Life Fellow of the Institute of Electrical and Electronics Engineers (IEEE). Dr. Heilmeier is a member of the Defense Science Board and the National Security Agency Advisory Board. He is also a member of the National Academy of Engineering, the American Academy of Arts and Sciences, and the Board of Overseers of the School of Engineering and Applied Science of the University of Pennsylvania. Previously, Dr. Heilmeier served as a Director of TRW Inc. (automotive, space, defense, and information technology, 1992-2002), Compaq (1994-2002), Automatic Data Processing, Inc. (ADP) (technology-based business outsourcing, 1995-2002), INET Technologies Inc. (telecommunications network surveillance, 2001-2004), and Teletech Holdings (customer management services). He is the recipient of the 2005 Kyoto Prize in Advanced Technology for his invention of the liquid crystal display, and a member of the Consumer Electronics Hall of Fame. |
James H. Keyes (67) |
| Year of Election or Appointment: 2007 Prior to his retirement in 2003, Mr. Keyes was Chairman, President, and Chief Executive Officer of Johnson Controls, Inc. (automotive supplier, 1993-2003). He currently serves as a member of the boards of LSI Logic Corporation (semiconductor technologies), Navistar International Corporation (manufacture and sale of trucks, buses, and diesel engines, 2002-present), and Pitney Bowes, Inc. (integrated mail, messaging, and document management solutions). |
Marie L. Knowles (61) |
| Year of Election or Appointment: 2001 Prior to Ms. Knowles' retirement in June 2000, she served as Executive Vice President and Chief Financial Officer of Atlantic Richfield Company (ARCO) (diversified energy, 1996-2000). From 1993 to 1996, she was a Senior Vice President of ARCO and President of ARCO Transportation Company. She served as a Director of ARCO from 1996 to 1998. She currently serves as a Director of Phelps Dodge Corporation (copper mining and manufacturing) and McKesson Corporation (healthcare service, 2002-present). Ms. Knowles is a Trustee of the Brookings Institution and the Catalina Island Conservancy and also serves as a member of the Advisory Board for the School of Engineering of the University of Southern California. |
Ned C. Lautenbach (63) |
| Year of Election or Appointment: 2000 Mr. Lautenbach is Chairman of the Independent Trustees (2006-present). Mr. Lautenbach has been a partner of Clayton, Dubilier & Rice, Inc. (private equity investment firm) since September 1998. Previously, Mr. Lautenbach was with the International Business Machines Corporation (IBM) from 1968 until his retirement in 1998. Mr. Lautenbach serves as a Director of Sony Corporation (2006-present) and Eaton Corporation (diversified industrial) as well as the Philharmonic Center for the Arts in Naples, Florida. He also is a member of the Board of Trustees of Fairfield University (2005-present), as well as a member of the Council on Foreign Relations. |
Cornelia M. Small (63) |
| Year of Election or Appointment: 2005 Ms. Small is a member (2000-present) and Chairperson (2002-present) of the Investment Committee, and a member (2002-present) of the Board of Trustees of Smith College. Previously, she served as Chief Investment Officer (1999-2000), Director of Global Equity Investments (1996-1999), and a member of the Board of Directors of Scudder, Stevens & Clark (1990-1997) and Scudder Kemper Investments (1997-1999). In addition, Ms. Small served as Co-Chair (2000-2003) of the Annual Fund for the Fletcher School of Law and Diplomacy. |
William S. Stavropoulos (68) |
| Year of Election or Appointment: 2001 Mr. Stavropoulos is Chairman Emeritus of the Board of Directors of The Dow Chemical Company. Since joining The Dow Chemical Company in 1967, Mr. Stavropoulos served in numerous senior management positions, including President (1993-2000; 2002-2003), CEO (1995-2000; 2002-2004), and Chairman of the Executive Committee (2000-2004). Currently, he is a Director of NCR Corporation (data warehousing and technology solutions), Chemical Financial Corporation, Maersk Inc. (industrial conglomerate, 2002-present), Tyco International, Inc. (multinational manufacturing and services, 2007-present), and a member of the Advisory Board for Metalmark Capital (private equity investment firm, 2005-present). He is a special advisor to Clayton, Dubilier & Rice, Inc., a private equity investment firm. He also serves as a member of the Board of Trustees of the American Enterprise Institute for Public Policy Research. In addition, Mr. Stavropoulos is a member of The Business Council, J.P. Morgan International Council and the University of Notre Dame Advisory Council for the College of Science. |
Kenneth L. Wolfe (68) |
| Year of Election or Appointment: 2005 Prior to his retirement in 2001, Mr. Wolfe was Chairman and Chief Executive Officer of Hershey Foods Corporation (1993-2001). He currently serves as a member of the boards of Adelphia Communications Corporation (2003-present), Bausch & Lomb, Inc., and Revlon Inc. (2004-present). |
Advisory Board Members and Executive Officers**:
Correspondence intended for Mr. Mauriello, Mr. Thomas, and Mr. Wiley may be sent to Fidelity Investments, P.O. Box 55235, Boston, Massachusetts 02205-5235. Correspondence intended for each executive officer and Mr. Lynch may be sent to Fidelity Investments, 82 Devonshire Street, Boston, Massachusetts 02109.
Name, Age; Principal Occupation |
Peter S. Lynch (63) |
| Year of Election or Appointment: 2003 Member of the Advisory Board of Fidelity Investment Trust. Mr. Lynch is Vice Chairman and a Director of FMR, and Vice Chairman (2001-present) and a Director of FMR Co., Inc. Previously, Mr. Lynch served as a Trustee of the Fidelity funds (1990-2003). In addition, he serves as a Trustee of Boston College and as the Chairman of the Inner-City Scholarship Fund. |
Joseph Mauriello (63) |
| Year of Election or Appointment: 2007 Member of the Advisory Board of Fidelity Investment Trust. Prior to his retirement in January 2006, Mr. Mauriello served in numerous senior management positions including Deputy Chairman and Chief Operating Officer (2004-2005), and Vice Chairman of Financial Services (2002-2004) of KPMG LLP US (professional services firm, 1965-2005). Mr. Mauriello currently serves as a member of the Board of Directors of XL Capital Ltd., (global insurance and re-insurance company, 2006-present) and of Arcadia Resources Inc., (health care services and products, 2007-present). He also served as a Director of the Hamilton Funds of the Bank of New York (2006-2007). |
David M. Thomas (58) |
| Year of Election or Appointment: 2007 Member of the Advisory Board of Fidelity Investment Trust. Previously, Mr. Thomas served as Executive Chairman (2005-2006) and Chairman and Chief Executive Officer (2000-2005) of IMS Health, Inc. (pharmaceutical and healthcare information solutions). In addition, Mr. Thomas serves as a member of the Board of Directors of Fortune Brands, Inc. (consumer products holding company), and Interpublic Group of Companies, Inc. (marketing communication, 2004-present). |
Michael E. Wiley (57) |
| Year of Election or Appointment: 2007 Member of the Advisory Board of Fidelity Investment Trust. Mr. Wiley also serves as Sr. Energy Advisor of Katzenbach Partners, LLC (consulting firm, 2006-present) and a member of the Board of Trustees of the University of Tulsa (2000-2006; 2007-present). He serves as a Director of Tesoro Corporation (independent oil refiner and marketer, 2005-present), and a Director of Bill Barrett Corporation (exploration and production company, 2005-present). In addition, he also serves as a Director of Post Oak Bank (privately-held bank, 2004-present), and an Advisory Director of Riverstone Holdings (private investment firm). Previously, Mr. Wiley served as Chairman, President, and CEO of Baker Hughes, Inc. (oilfield services company, 2000-2004), and as Director of Spinnaker Exploration Company (exploration and production company, 2001-2005). |
Kimberley H. Monasterio (43) |
| Year of Election or Appointment: 2007 President and Treasurer of the fund. Ms. Monasterio also serves as President and Treasurer of other Fidelity funds (2007-present) and is an employee of FMR (2004-present). Previously, Ms. Monasterio served as Deputy Treasurer of the Fidelity funds (2004-2006). Before joining Fidelity Investments, Ms. Monasterio served as Treasurer (2000-2004) and Chief Financial Officer (2002-2004) of the Franklin Templeton Funds and Senior Vice President of Franklin Templeton Services, LLC (2000-2004). |
Walter C. Donovan (45) |
| Year of Election or Appointment: 2007 Vice President of the fund. Mr. Donovan also serves as Vice President of Fidelity's Equity Funds (2007-present). Mr. Donovan also serves as Executive Vice President of FMR (2005-present) and FMR Co., Inc. (2005-present). Previously, Mr. Donovan served as Vice President of Fidelity's High Income Funds (2005-2007), Fixed-Income Funds (2005-2006), certain Asset Allocation Funds (2005-2006), certain Balanced Funds (2005-2006), and as Vice President and Director of Fidelity's International Equity Trading group (1998-2005). |
Eric M. Wetlaufer (45) |
| Year of Election or Appointment: 2006 Vice President of the fund. Mr. Wetlaufer also serves as Vice President of certain International Equity Funds (2006-present). Mr. Wetlaufer is Senior Vice President of FMR (2006-present) and FMR Co., Inc. (2006-present), and President and Director of Fidelity Management & Research (U.K.) Inc. (2006-present) and Fidelity Research & Analysis Company (2006-present). Before joining Fidelity Investments in 2005, Mr. Wetlaufer was a partner in Oxhead Capital Management (2004-2005). Previously, Mr. Wetlaufer served as a Chief Investment Officer of Putnam Investments (1997-2003). |
Eric D. Roiter (58) |
| Year of Election or Appointment: 1998 Secretary of the fund. He also serves as Secretary of other Fidelity funds; Vice President, General Counsel, and Secretary of FMR Co., Inc. (2001-present) and FMR; Assistant Secretary of Fidelity Management & Research (U.K.) Inc. (2001-present), Fidelity Research & Analysis Company (2001-present), and Fidelity Investments Money Management, Inc. (2001-present). Mr. Roiter is an Adjunct Member, Faculty of Law, at Boston College Law School (2003-present). Previously, Mr. Roiter served as Vice President and Secretary of Fidelity Distributors Corporation (FDC) (1998-2005). |
Scott C. Goebel (39) |
| Year of Election or Appointment: 2007 Assistant Secretary of the fund. Mr. Goebel also serves as Assistant Secretary of other Fidelity funds (2007-present), and is an employee of FMR. |
R. Stephen Ganis (41) |
| Year of Election or Appointment: 2006 Anti-Money Laundering (AML) officer of the fund. Mr. Ganis also serves as AML officer of other Fidelity funds (2006-present) and FMR LLC (2003-present). Before joining Fidelity Investments, Mr. Ganis practiced law at Goodwin Procter, LLP (2000-2002). |
Joseph B. Hollis (59) |
| Year of Election or Appointment: 2006 Chief Financial Officer of the fund. Mr. Hollis also serves as Chief Financial Officer of other Fidelity funds. Mr. Hollis is President of Fidelity Pricing and Cash Management Services (FPCMS) (2005-present). Mr. Hollis also serves as President and Director of Fidelity Service Company, Inc. (2006-present). Previously, Mr. Hollis served as Senior Vice President of Cash Management Services (1999-2002) and Investment Management Operations (2002-2005). |
Kenneth A. Rathgeber (60) |
| Year of Election or Appointment: 2004 Chief Compliance Officer of the fund. Mr. Rathgeber also serves as Chief Compliance Officer of other Fidelity funds (2004-present) and Executive Vice President of Risk Oversight for Fidelity Investments (2002-present). He is Chief Compliance Officer of FMR (2005-present), FMR Co., Inc. (2005-present), Fidelity Management & Research (U.K.) Inc. (2005-present), Fidelity Research & Analysis Company (2005-present), Fidelity Investments Money Management, Inc. (2005-present), and Strategic Advisers, Inc. (2005-present). Previously, Mr. Rathgeber served as Executive Vice President and Chief Operating Officer for Fidelity Investments Institutional Services Company, Inc. (1998-2002). |
Bryan A. Mehrmann (46) |
| Year of Election or Appointment: 2005 Deputy Treasurer of the fund. Mr. Mehrmann also serves as Deputy Treasurer of other Fidelity funds (2005-present) and is an employee of FMR. Previously, Mr. Mehrmann served as Vice President of Fidelity Investments Institutional Services Group (FIIS)/Fidelity Investments Institutional Operations Corporation, Inc. (FIIOC) Client Services (1998-2004). |
Kenneth B. Robins (38) |
| Year of Election or Appointment: 2005 Deputy Treasurer of the fund. Mr. Robins also serves as Deputy Treasurer of other Fidelity funds (2005-present) and is an employee of FMR (2004-present). Before joining Fidelity Investments, Mr. Robins worked at KPMG LLP, where he was a partner in KPMG's department of professional practice (2002-2004) and a Senior Manager (1999-2000). In addition, Mr. Robins served as Assistant Chief Accountant, United States Securities and Exchange Commission (2000-2002). |
Robert G. Byrnes (40) |
| Year of Election or Appointment: 2005 Assistant Treasurer of the fund. Mr. Byrnes also serves as Assistant Treasurer of other Fidelity funds (2005-present) and is an employee of FMR (2005-present). Previously, Mr. Byrnes served as Vice President of FPCMS (2003-2005). Before joining Fidelity Investments, Mr. Byrnes worked at Deutsche Asset Management where he served as Vice President of the Investment Operations Group (2000-2003). |
Peter L. Lydecker (53) |
| Year of Election or Appointment: 2004 Assistant Treasurer of the fund. Mr. Lydecker also serves as Assistant Treasurer of other Fidelity funds (2004) and is an employee of FMR. |
Paul M. Murphy (60) |
| Year of Election or Appointment: 2007 Assistant Treasurer of the fund. Mr. Murphy also serves as Assistant Treasurer of other Fidelity funds (2007-present) and is an employee of FMR (2007-present). Previously, Mr. Murphy served as Chief Financial Officer of the Fidelity Funds (2005-2006), Vice President and Associate General Counsel of FMR (2007), and Senior Vice President of Fidelity Pricing and Cash Management Services Group (FPCMS) (1994-2007). |
Gary W. Ryan (49) |
| Year of Election or Appointment: 2005 Assistant Treasurer of the fund. Mr. Ryan also serves as Assistant Treasurer of other Fidelity funds (2005-present) and is an employee of FMR (2005-present). Previously, Mr. Ryan served as Vice President of Fund Reporting in FPCMS (1999-2005). |
** FMR Corp. merged with FMR LLC on October 1, 2007. Any references to FMR LLC for prior periods are deemed to be references to the prior entity.
Annual Report
Distributions
The Board of Trustees of International Discovery Fund voted to pay to shareholders of record at the opening of business on record date, the following distributions per share derived from capital gains realized from sales of portfolio securities, and dividends derived from net investment income:
| Pay Date | Record Date | Dividends | Capital Gains |
Class A | 12/10/07 | 12/07/07 | $0.366 | $1.67 |
Class T | 12/10/07 | 12/07/07 | $0.288 | $1.67 |
Class B | 12/10/07 | 12/07/07 | $0.156 | $1.67 |
Class C | 12/10/07 | 12/07/07 | $0.173 | $1.67 |
The fund hereby designates as a capital gain dividend with respect to the taxable year ended October 31, 2007 $495,087,413 or, if subsequently determined to be different, the net capital gain of such year.
Class A designates 73%, Class T designates 84%, Class B designates 100% and Class C designates 100% of the dividends distributed during the fiscal year as amounts which may be taken into account as a dividend for purposes of the maximum rate under section 1(h)(11) of the Internal Revenue Code.
The amounts per share which represent income derived from sources within, and taxes paid to, foreign countries or possessions of the United States are as follows:
| Pay Date | Income | Taxes |
Class A | 12/04/06 | $.347 | $.0278 |
Class T | 12/04/06 | $.300 | $.0278 |
Class B | 12/04/06 | $.246 | $.0278 |
Class C | 12/04/06 | $.235 | $.0278 |
The fund will notify shareholders in January 2008 of amounts for use in preparing 2007 income tax returns.
Annual Report
Board Approval of Investment Advisory Contracts and Management Fees
Fidelity International Discovery Fund
Each year, typically in July, the Board of Trustees, including the Independent Trustees (together, the Board), votes on the renewal of the management contract and sub-advisory agreements (together, the Advisory Contracts) for the fund. The Board, assisted by the advice of fund counsel and Independent Trustees' counsel, requests and considers a broad range of information throughout the year.
The Board meets regularly each month except August and takes into account throughout the year matters bearing on Advisory Contracts. The Board, acting directly and through its separate committees, considers at each of its meetings factors that are relevant to the annual renewal of the fund's Advisory Contracts, including the services and support provided to the fund and its shareholders. At the time of the renewal, the Board had 12 standing committees, each composed of Independent Trustees with varying backgrounds, to which the Board has assigned specific subject matter responsibilities in order to enhance effective decision-making by the Board. Each committee has adopted a written charter outlining the structure and purposes of the committee. One such committee, the Equity Contract Committee, meets periodically as needed throughout the year to consider matters specifically related to the annual renewal of Advisory Contracts. The committee requests and receives information on, and makes recommendations to the Independent Trustees concerning, the approval and annual review of the Advisory Contracts.
At its July 2007 meeting, the Board of Trustees, including the Independent Trustees, unanimously determined to renew the Advisory Contracts for the fund. In reaching its determination, the Board considered all factors it believed relevant, including (i) the nature, extent, and quality of the services to be provided to the fund and its shareholders (including the investment performance of the fund); (ii) the competitiveness of the management fee and total expenses of the fund; (iii) the total costs of the services to be provided by and the profits to be realized by the investment adviser and its affiliates from the relationship with the fund; (iv) the extent to which economies of scale would be realized as the fund grows; and (v) whether fee levels reflect these economies of scale, if any, for the benefit of fund shareholders. The Board also approved amendments to the fund's agreements with foreign sub-advisers to clarify that each sub-adviser provides services as an independent contractor.
In determining whether to renew the Advisory Contracts for the fund, the Board ultimately reached a determination, with the assistance of fund counsel and Independent Trustees' counsel, that the renewal of the Advisory Contracts and the compensation to be received by Fidelity under the management contract is consistent with Fidelity's fiduciary duty under applicable law. In addition to evaluating the specific factors noted above, the Board, in reaching its determination, is aware that shareholders in the fund have a broad range of investment choices available to them, including a wide choice among mutual funds offered by competitors to Fidelity, and that the fund's shareholders, with the opportunity to review and weigh the disclosure provided by the fund in its prospectus and other public disclosures, have chosen to invest in this fund, managed by Fidelity.
Annual Report
Board Approval of Investment Advisory Contracts and
Management Fees - continued
Nature, Extent, and Quality of Services Provided. The Board considered staffing within the investment adviser, FMR, and the sub-advisers (together, the Investment Advisers), including the background of the fund's portfolio manager and the fund's investment objective and discipline. The Independent Trustees also had discussions with senior management of Fidelity's investment operations and investment groups. The Board considered the structure of the portfolio manager compensation program and whether this structure provides appropriate incentives.
Resources Dedicated to Investment Management and Support Services. The Board reviewed the size, education, and experience of the Investment Advisers' investment staff, their use of technology, and the Investment Advisers' approach to recruiting, training, and retaining portfolio managers and other research, advisory, and management personnel. The Board considered Fidelity's extensive global research capabilities that enable the Investment Advisers to aggregate data from various sources in an effort to produce positive investment results. The Board noted that Fidelity's analysts have access to a variety of technological tools that enable them to perform both fundamental and quantitative analysis and to specialize in various disciplines. The Board also considered that Fidelity's portfolio managers and analysts have access to daily portfolio attribution that allows for monitoring of a fund's portfolio, as well as an electronic communication system that provides immediate real-time access to research concerning issuers and credit enhancers.
Shareholder and Administrative Services. The Board considered (i) the nature, extent, quality, and cost of advisory, administrative, distribution, and shareholder services performed by the Investment Advisers and their affiliates under the Advisory Contracts and under separate agreements covering transfer agency, pricing and bookkeeping, and securities lending services for the fund; (ii) the nature and extent of the Investment Advisers' supervision of third party service providers, principally custodians and subcustodians; and (iii) the resources devoted to, and the record of compliance with, the fund's compliance policies and procedures. The Board reviewed the allocation of fund brokerage, including allocations to brokers affiliated with the Investment Advisers, the use of brokerage commissions to pay fund expenses, and the use of "soft" commission dollars to pay for research services. The Board also considered that Fidelity voluntarily pays for market data out of its own resources. The Board also considered the agreement reached between the Independent Trustees and Fidelity in December 2006 following an independent review of matters relating to receipt of travel, entertainment, gifts and gratuities in violation of Fidelity policies.
Annual Report
The Board noted that the growth of fund assets across the complex allows Fidelity to reinvest in the development of services designed to enhance the value or convenience of the Fidelity funds as investment vehicles. These services include 24-hour access to account information and market information through phone representatives and over the Internet, and investor education materials and asset allocation tools.
Investment in a Large Fund Family. The Board considered the benefits to shareholders of investing in a Fidelity fund, including the benefits of investing in a fund that is part of a large family of funds offering a variety of investment disciplines and providing for a large variety of mutual fund investor services. For example, fund shareholders are offered the privilege of exchanging shares of the fund for shares of other Fidelity funds, as set forth in the fund's prospectus, without paying a sales charge. The Board noted that, since the last Advisory Contract renewals in July 2006, Fidelity has taken a number of actions that benefited particular funds, including (i) dedicating additional resources to investment research and to restructure the investment research teams; (ii) contractually agreeing to reduce the management fee on Fidelity Advisor Floating Rate High Income Fund; (iii) contractually agreeing to reduce the management fees on Fidelity's California, Massachusetts, New Jersey, and New York AMT Tax-Free Money Market Funds, launching new Institutional Classes and Service Classes of these funds, and contractually agreeing to impose expense limitations on these funds; (iv) eliminating the exchange fee on the Fidelity Select Portfolios and reducing the pricing and bookkeeping fee rates for these funds; (v) reducing the maximum transfer agency fee rates on high income funds and certain equity funds; (vi) proposing amended management contracts that, if approved by shareholders, will add a performance adjustment component to the management fees paid by 18 Fidelity Advisor equity funds; (vii) contractually agreeing to reduce fees for Ultra-Short Central Fund and the money market Central Funds; (viii) waiving the Fidelity Advisor funds' contingent deferred sales charge on certain redemptions made through systematic withdrawal programs; and (ix) amending the management contracts for equity and fixed-income funds whose management contracts incorporate a "group fee" structure by adding four new fee "breakpoints" to the group fee rate schedules.
Investment Performance and Compliance. The Board considered whether the fund has operated within its investment objective, as well as its record of compliance with its investment restrictions. It also reviewed the fund's absolute investment performance for each class, as well as the fund's relative investment performance for each class measured against (i) a broad-based securities market index, and (ii) a peer group of mutual funds deemed appropriate by the Board over multiple periods. The following charts considered by the Board show, over the one-, three-, and five-year periods ended December 31, 2006, as available, the cumulative total returns of Fidelity International Discovery (retail class) and Class C of the fund, the cumulative total returns of a broad-based securities market index ("benchmark"), and a range of cumulative total returns of a peer group of mutual funds identified by Morningstar, Inc. as having an investment style similar to that of the fund based on underlying portfolio holdings. The returns of Fidelity International Discovery (retail class) and Class C show the performance of the highest and lowest performing classes, respectively. The box within each chart shows the 25th percentile return (bottom of box) and the 75th percentile return (top of box) of the peer group. Returns shown above the box are in the first quartile and returns shown below the box are in the fourth quartile. The percentage beaten numbers noted below each chart correspond to the percentile box and represent the percentage of funds in the peer group whose performance was equal to or lower than that of the class indicated.
Annual Report
Board Approval of Investment Advisory Contracts and
Management Fees - continued
Fidelity International Discovery Fund

The Board reviewed the fund's relative investment performance against its peer group and stated that the performance of Fidelity International Discovery (retail class) was in the third quartile for the one-year period and the first quartile for the three- and five-year periods. The Board also stated that the investment performance of Fidelity International Discovery (retail class) compared favorably to its benchmark for the three- and five-year periods, although the fund's one-year cumulative total return was lower than its benchmark. The Board considered that the variations in performance among the fund's classes reflect the variations in class expenses, which result in lower performance for higher expense classes.
The Board also considered that the fund's management fee is subject to upward or downward adjustment depending upon whether, and to what extent, the fund's investment performance for the performance period exceeds, or is exceeded by, the record (over the same period) of a Board-approved performance adjustment index. The Board realizes that the performance adjustment provides FMR with a strong economic incentive to seek to achieve superior performance for the fund's shareholders and helps to more closely align the interests of FMR and the fund's shareholders.
Annual Report
The Board considered that FMR has taken steps to refocus and strengthen equity research, equity portfolio management, and compliance.
Based on its review, and giving particular weight to the nature and quality of the resources dedicated by the Investment Advisers to maintain and improve relative performance, the Board concluded that the nature, extent, and quality of the services provided to the fund will benefit the fund's shareholders, particularly in light of the Board's view that the fund's shareholders benefit from investing in a fund that is part of a large family of funds offering a variety of investment disciplines and services.
Competitiveness of Management Fee and Total Fund Expenses. The Board considered the fund's management fee and total expenses compared to "mapped groups" of competitive funds and classes. Fidelity creates "mapped groups" by combining similar Lipper investment objective categories that have comparable management fee characteristics. Combining Lipper investment objective categories aids the Board's management fee and total expense comparisons by broadening the competitive group used for comparison and by reducing the number of universes to which various Fidelity funds are compared. The Board also considered supplemental information about how the fund's management fee and total expenses ranked relative to groups based on Lipper classifications, which take into account a fund's market capitalization and style.
The Board considered two proprietary management fee comparisons for the 12-month periods shown in the chart below. The group of Lipper funds used by the Board for management fee comparisons is referred to below as the "Total Mapped Group." The Total Mapped Group comparison focuses on a fund's standing relative to the total universe of comparable funds available to investors, in terms of gross management fees before expense reimbursements or caps, and without giving effect to the fund's performance adjustment. "TMG %" represents the percentage of funds in the Total Mapped Group that had management fees that were lower than the fund's. For example, a TMG % of 13% means that 87% of the funds in the Total Mapped Group had higher management fees than the fund. The "Asset-Size Peer Group" (ASPG) comparison focuses on a fund's standing relative to non-Fidelity funds similar in size to the fund within the Total Mapped Group. The ASPG represents at least 15% of the funds in the Total Mapped Group with comparable asset size and management fee characteristics, subject to a minimum of 50 funds (or all funds in the Total Mapped Group if fewer than 50). Additional information, such as the ASPG quartile in which the fund's management fee ranked and the impact of the fund's performance adjustment, is also included in the chart and considered by the Board.
Annual Report
Board Approval of Investment Advisory Contracts and
Management Fees - continued
Fidelity International Discovery Fund
The Board noted that the fund's management fee ranked below the median of its Total Mapped Group and below the median of its ASPG for 2006. The Board also noted the effect of the fund's positive performance adjustment on the fund's management fee ranking. The Board noted that the performance adjustment for each year represents calculations for performance periods that differ from the periods shown in the performance charts above.
Based on its review, the Board concluded that the fund's management fee was fair and reasonable in light of the services that the fund receives and the other factors considered.
In its review of each class's total expenses, the Board considered the fund's management fee as well as other fund or class expenses, as applicable, such as transfer agent fees, pricing and bookkeeping fees, fund-paid 12b-1 fees, and custodial, legal, and audit fees. The Board also noted the effects of any waivers and reimbursements on fees and expenses, as well as the fund's positive performance adjustment. As part of its review, the Board also considered current and historical total expenses of each class of the fund compared to competitive fund median expenses. Each class of the fund is compared to those funds and classes in the Total Mapped Group (used by the Board for management fee comparisons) that have a similar sales load structure.
The Board noted that the total expenses of each of Class A, Class C, Institutional Class and Fidelity International Discovery (retail class) ranked below its competitive median for 2006, the total expenses of Class B ranked equal to its competitive median for 2006, and the total expenses of Class T ranked above its competitive median for 2006. The Board noted that the fund offers multiple classes, each of which has a different sales load and 12b-1 fee structure, and that the multiple structures are intended to offer a range of pricing options for the intermediary market. The Board also noted that the total expenses of the classes vary primarily by the level of their 12b-1 fees, although differences in transfer agent fees may also cause expenses to vary from class to class.
Annual Report
In its review of total expenses, the Board also considered Fidelity fee structures and other information on clients that FMR and its affiliates service in other competitive markets, such as other mutual funds advised or subadvised by FMR or its affiliates, pension plan clients, and other institutional clients.
Based on its review, the Board concluded that the total expenses of each class of the fund were reasonable, although in one case above the median of the universe presented for comparison, in light of the services that the fund and its shareholders receive and the other factors considered.
Costs of the Services and Profitability. The Board considered the revenues earned and the expenses incurred by Fidelity in conducting the business of developing, marketing, distributing, managing, administering and servicing the fund and its shareholders. The Board also considered the level of Fidelity's profits in respect of all the Fidelity funds.
On an annual basis, FMR presents to the Board Fidelity's profitability for the fund. Fidelity calculates the profitability for each fund, as well as aggregate profitability for groups of Fidelity funds and all Fidelity funds, using a series of detailed revenue and cost allocation methodologies which originate with the audited books and records of Fidelity. The Audit Committee of the Board reviews any significant changes from the prior year's methodologies.
PricewaterhouseCoopers LLP (PwC), independent registered public accounting firm and auditor to Fidelity and certain Fidelity funds, has been engaged annually by the Board as part of the Board's assessment of the results of Fidelity's profitability analysis. PwC's engagement includes the review and assessment of Fidelity's methodologies used in determining the revenues and expenses attributable to Fidelity's mutual fund business, and completion of agreed-upon procedures surrounding the mathematical accuracy of fund profitability and its conformity to allocation methodologies. After considering PwC's reports issued under the engagement and information provided by Fidelity, the Board believes that while other allocation methods may also be reasonable, Fidelity's profitability methodologies are reasonable in all material respects.
The Board has also reviewed Fidelity's non-fund businesses and any fall-out benefits related to the mutual fund business as well as cases where Fidelity's affiliates may benefit from or be related to the fund's business.
The Board considered the costs of the services provided by and the profits realized by Fidelity in connection with the operation of the fund and determined that the amount of profit is a fair entrepreneurial profit for the management of the fund.
Annual Report
Board Approval of Investment Advisory Contracts and
Management Fees - continued
Economies of Scale. The Board considered whether there have been economies of scale in respect of the management of the Fidelity funds, whether the Fidelity funds (including the fund) have appropriately benefited from any such economies of scale, and whether there is potential for realization of any further economies of scale. The Board considered the extent to which the fund will benefit from economies of scale through increased services to the fund, through waivers or reimbursements, or through fee or expense reductions, including reductions that occur through operation of the transfer agent agreement. The transfer agent fee varies in part based on the number of accounts in the fund. If the number of accounts decreases or the average account size increases, the overall transfer agent fee rate decreases.
The Board recognized that the fund's management contract incorporates a "group fee" structure, which provides for lower group fee rates as total fund assets under FMR's management increase, and for higher group fee rates as total fund assets under FMR's management decrease. FMR determines the group fee rates based on a tiered asset "breakpoint" schedule. In connection with the renewal of the fund's management contract, the Board approved amendments to the fund's management contract that added four new fee breakpoints to the group fee rate schedule for assets under FMR's management above $1,386 billion. The Board considered that the group fee rate declines under both the present and amended schedules, but that under the amended schedule, the group fee rate declines faster as assets under FMR's management exceed $1,386 billion. The Board considered that the group fee is designed to deliver the benefits of economies of scale to fund shareholders when total fund assets increase, even if assets of any particular fund are unchanged or have declined, because some portion of Fidelity's costs are attributable to services provided to all Fidelity funds, and all funds benefit if those costs can be allocated among more assets. The Board concluded that, given the group fee structure, fund shareholders will achieve a certain level of economies of scale as assets under FMR's management increase at the fund complex level, regardless of whether Fidelity achieves any such economies of scale.
The Board further concluded that any potential economies of scale are being shared between fund shareholders and Fidelity in an appropriate manner.
Additional Information Requested by the Board. In order to develop fully the factual basis for consideration of the Fidelity funds' Advisory Contracts, the Board requested and received additional information on several topics, including (i) fund performance trends and actions to be taken by FMR to improve certain funds' overall performance; (ii) Fidelity's portfolio manager compensation structure, including its effects on fund profitability and the extent to which portfolio manager compensation is linked to fund performance; (iii) Fidelity's fee structures; (iv) the funds' sub-advisory arrangements; and (v) accounts managed by Fidelity other than the Fidelity funds.
Annual Report
Based on its evaluation of all of the conclusions noted above, and after considering all material factors, the Board ultimately concluded that the advisory fee structures are fair and reasonable, and that the fund's Advisory Contracts should be renewed.
Annual Report
Annual Report
Annual Report
Annual Report
Annual Report
Investment Adviser
Fidelity Management & Research Company
Boston, MA
Investment Sub-Advisers
FMR Co., Inc.
Fidelity Management & Research
(U.K.) Inc.
Fidelity Research & Analysis Company
Fidelity International
Investment Advisors
Fidelity Investments Japan Limited
Fidelity International Investment Advisors (U.K.) Limited
General Distributor
Fidelity Distributors Corporation
Boston, MA
Transfer and Service Agents
Fidelity Investments Institutional Operations Company, Inc.
Boston, MA
Fidelity Service Company, Inc.
Boston, MA
Custodian
The Northern Trust Company
Chicago, IL
AID-UANN-1207
1.806656.102
(Fidelity Investment logo)(registered trademark)
Corporate Headquarters
82 Devonshire St., Boston, MA 02109
www.fidelity.com
(Fidelity Investment logo)(registered trademark)
Fidelity Advisor
International Discovery
Fund - Institutional Class
Annual Report
October 31, 2007
Institutional Class is
a class of Fidelity®
International Discovery Fund
(2_fidelity_logos) (Registered_Trademark)
Contents
Chairman's Message | <Click Here> | Ned Johnson's message to shareholders. |
Performance | <Click Here> | How the fund has done over time. |
Management's Discussion | 6 | The manager's review of fund performance, strategy and outlook. |
Shareholder Expense Example | <Click Here> | An example of shareholder expenses. |
Investment Changes | <Click Here> | A summary of major shifts in the fund's investments over the past six months. |
Investments | <Click Here> | A complete list of the fund's investments with their market values. |
Financial Statements | <Click Here> | Statements of assets and liabilities, operations, and changes in net assets,
as well as financial highlights. |
Notes | <Click Here> | Notes to the financial statements. |
Report of Independent Registered Public Accounting Firm | <Click Here> | |
Trustees and Officers | <Click Here> | |
Distributions | <Click Here> | |
Board Approval of Investment Advisory Contracts and Management Fees | <Click Here> | |
To view a fund's proxy voting guidelines and proxy voting record for the 12-month period ended June 30, visit http://www.fidelity.com (search for "proxy voting guidelines") or visit the Securities and Exchange Commission's (SEC) web site at http://www.sec.gov. You may also call 1-877-208-0098 to request a free copy of the proxy voting guidelines.
Standard & Poor's, S&P and S&P 500 are registered service marks of The McGraw-Hill Companies, Inc. and have been licensed for use by Fidelity Distributors Corporation.
Other third party marks appearing herein are the property of their respective owners.
All other marks appearing herein are registered or unregistered trademarks or service marks of FMR LLC or an affiliated company.
Annual Report
This report and the financial statements contained herein are submitted for the general information of the shareholders of the fund. This report is not authorized for distribution to prospective investors in the fund unless preceded or accompanied by an effective prospectus.
A fund files its complete schedule of portfolio holdings with the SEC for the first and third quarters of each fiscal year on Form N-Q. Forms N-Q are available on the SEC's web site at http://www.sec.gov. A fund's Forms N-Q may be reviewed and copied at the SEC's Public Reference Room in Washington, DC. Information regarding the operation of the SEC's Public Reference Room may be obtained by calling 1-800-SEC-0330. For a complete list of a fund's portfolio holdings, view the fund's most recent holdings listing, semiannual report, or annual report on Fidelity's web site at http://www.fidelity.com or http://www.advisor.fidelity.com, as applicable.
NOT FDIC INSURED · MAY LOSE VALUE · NO BANK GUARANTEE
Neither the fund nor Fidelity Distributors Corporation is a bank.
Annual Report
Chairman's Message
(photo_of_Edward_C_Johnson_3d)
Dear Shareholder:
Many stock and bond markets around the world have been unsettled of late; however, volatility can often lead to opportunity for patient investors. Financial markets are always unpredictable, but there are a number of time-tested principles that can put the historical odds in your favor.
One of the basic tenets is to invest for the long term. Over time, riding out the markets' inevitable ups and downs has proven much more effective than selling into panic or chasing the hottest trend. Even missing only a few of the markets' best days can significantly diminish investor returns. Patience also affords the benefits of compounding - of earning interest on additional income or reinvested dividends and capital gains. There are tax advantages and cost benefits to consider as well. The more you sell, the more taxes you pay, and the more you trade, the higher the costs. While staying the course doesn't eliminate risk, it can considerably lessen the effect of short-term declines.
You can further manage your investing risk through diversification. And today, more than ever, geographic diversification should be taken into account. Studies indicate that asset allocation is the single most important determinant of a portfolio's long-term success. The right mix of stocks, bonds and cash - aligned to your particular risk tolerance and investment objective - is very important. Age-appropriate rebalancing is also an essential aspect of asset allocation. For younger investors, an emphasis on equities - which historically have been the best-performing asset class over time - is encouraged. As investors near their specific goal, such as retirement or sending a child to college, consideration may be given to replacing volatile assets (e.g. common stocks) with more-stable fixed investments (bonds or savings plans).
A third investment principle - investing regularly - can help lower the average cost of your purchases. Investing a certain amount of money each month or quarter helps ensure you won't pay for all your shares at market highs. This strategy - known as dollar cost averaging - also reduces unconstructive "emotion" from investing, helping shareholders avoid selling weak performers just prior to an upswing, or chasing a hot performer just before a correction.
We invite you to contact us via the Internet, through our Investor Centers or over the phone. It is our privilege to provide you the information you need to make the investments that are right for you.
Sincerely,
/s/Edward C. Johnson 3d
Edward C. Johnson 3d
Annual Report
Fidelity Advisor International Discovery Fund - Institutional Class
Performance: The Bottom Line
Average annual total return reflects the change in the value of an investment, assuming reinvestment of the class' dividend income and capital gains (the profits earned upon the sale of securities that have grown in value) and assuming a constant rate of performance each year. The $10,000 table and the fund's returns do not reflect the deduction of taxes that a shareholder would pay on fund distributions or the redemption of fund shares. During periods of reimbursement by Fidelity, a fund's total return will be greater than it would be had the reimbursement not occurred. How a fund did yesterday is no guarantee of how it will do tomorrow.
Average Annual Total Returns
Periods ended October 31, 2007 | Past 1
year | Past 5
years | Past 10 years |
Institutional Class A, B | 34.93% | 26.31% | 13.13% |
A The initial offering of Institutional Class shares took place on January 6, 2005. Returns prior to January 6, 2005 are those of International Discovery, the original class of the fund.
B Prior to October 1, 2004, the fund operated under certain different investment policies.
Accordingly, the fund's historical performance may not represent its current investment policies.
$10,000 Over 10 Years
Let's say hypothetically that $10,000 was invested in Fidelity Advisor International Discovery Fund - Institutional Class, a class of the fund, on October 31, 1997. The chart shows how the value of your investment would have changed, and also shows how the Morgan Stanley Capital InternationalSM Europe, Australasia, Far East (MSCI® EAFE®) Index performed over the same period. The initial offering of Institutional Class took place on January 6, 2005. See above for additional information regarding the performance of Institutional Class.
Annual Report
Management's Discussion of Fund Performance
Comments from William Kennedy, Portfolio Manager of Fidelity Advisor International Discovery Fund
Foreign stocks, with a large assist from a weak U.S. dollar, generally had higher returns for U.S. investors than domestic equities during the 12-month period ending October 31, 2007. The backdrop for global stocks was solid, with robust economic growth and relatively high corporate profitability worldwide. Developed international equity markets, as measured by the Morgan Stanley Capital InternationalSM Europe, Australasia, and Far East (MSCI® EAFE®) Index - a performance monitor of established markets outside the United States and Canada - rose 25.09%. In comparison, the Standard & Poor's 500SM Index, a gauge of U.S. stocks, was up 14.56%. Among countries making up at least 1% of the EAFE benchmark, Finland had the best showing, soaring nearly 69%, while Hong Kong gained roughly 66%. The United Kingdom and Japan, the two largest components of the index, both underperformed. Fallout from the credit crunch and concerns about export growth tempered UK stocks, while Japan struggled with a slowdown in consumer spending and sluggish domestic growth. Emerging markets were the period's big winners, advancing 68.33% as measured by the MSCI Emerging Markets index.
For the 12 months ending October 31, 2007, the fund's Institutional Class shares returned 34.93%, soundly beating the MSCI EAFE index. Strong stock picking - especially within industrials, health care and technology - helped the fund outperform. Stock selection in Europe and in emerging markets, which are not represented in the index, further aided performance. Top individual contributors to relative performance included Nintendo, the Japanese electronic game company, and CSL, an Australian biotechnology company. Nintendo benefited from the introduction of new games and products, while CSL saw improved pricing in its blood plasma business and growing royalty income from a new vaccine to protect against cervical cancer. NHN, the dominant Internet search engine in South Korea, and LG Household & Health Care, a recently restructured Korean consumer products company, rallied sharply. Neither was in the index. The fund sustained limited losses from an underweighting in Hong Kong, where stocks soared, weak stock selection in real estate, and a modest cash position. Disappointments included having an overall underweighting in BHP Billiton, an Anglo-Australian mining company, and not owning Volkswagen, a German car manufacturer, as both stocks rallied sharply.
The views expressed above reflect those of the portfolio manager(s) only through the end of the period as stated on the cover of this report and do not necessarily represent the views of Fidelity or any other person in the Fidelity organization. Any such views are subject to change at any time based upon market or other conditions and Fidelity disclaims any responsibility to update such views. These views may not be relied on as investment advice and, because investment decisions for a Fidelity fund are based on numerous factors, may not be relied on as an indication of trading intent on behalf of any Fidelity fund.
Annual Report
Shareholder Expense Example
As a shareholder of the Fund, you incur two types of costs: (1) transaction costs, including sales charges (loads) on purchase payments or redemption proceeds, and redemption fees, and (2) ongoing costs, including management fees, distribution and/or service (12b-1) fees and other Fund expenses. This Example is intended to help you understand your ongoing costs (in dollars) of investing in the Fund and to compare these costs with the ongoing costs of investing in other mutual funds.
The Example is based on an investment of $1,000 invested at the beginning of the period and held for the entire period (May 1, 2007 to October 31, 2007).
Actual Expenses
The first line of the accompanying table for each class of the Fund provides information about actual account values and actual expenses. You may use the information in this line, together with the amount you invested, to estimate the expenses that you paid over the period. Simply divide your account value by $1,000.00 (for example, an $8,600 account value divided by $1,000.00 = 8.6), then multiply the result by the number in the first line for a class of the Fund under the heading entitled "Expenses Paid During Period" to estimate the expenses you paid on your account during this period. A small balance maintenance fee of $12.00 that is charged once a year may apply for certain accounts with a value of less than $2,000. This fee is not included in the table below. If it was, the estimate of expenses you paid during the period would be higher, and your ending account value lower, by this amount. In addition, the Fund, as a shareholder in the underlying Fidelity Central Funds, will indirectly bear its pro rata share of the fees and expenses incurred by the underlying Fidelity Central Funds. These fees and expenses are not included in the Fund's annualized expense ratio used to calculate the expense estimate in the table below.
Hypothetical Example for Comparison Purposes
The second line of the accompanying table for each class of the Fund provides information about hypothetical account values and hypothetical expenses based on a Class' actual expense ratio and an assumed rate of return of 5% per year before expenses, which is not the Class' actual return. The hypothetical account values and expenses may not be used to estimate the actual ending account balance or expenses you paid for the period. You may use this information to compare the ongoing costs of investing in the Fund and other funds. To do so, compare this 5% hypothetical example with the 5% hypothetical examples that appear in the shareholder reports of the other funds. A small balance maintenance fee of $12.00 that is charged once a year may apply for certain accounts with a value of less than $2,000. This fee is not included in the table below. If it was, the estimate of expenses you paid during the period would be higher, and your ending account value lower, by this amount. In addition, the Fund, as a shareholder in the underlying Fidelity Central Funds, will indirectly bear its pro rata share of the fees and expenses incurred by the underlying Fidelity Central Funds. These fees and expenses are not included in the Fund's annualized expense ratio used to calculate the expense estimate in the table below.
Annual Report
Shareholder Expense Example - continued
Please note that the expenses shown in the table are meant to highlight your ongoing costs only and do not reflect any transaction costs. Therefore, the second line of the table is useful in comparing ongoing costs only, and will not help you determine the relative total costs of owning different funds. In addition, if these transactional costs were included, your costs would have been higher.
| Beginning
Account Value
May 1, 2007 | Ending
Account Value
October 31, 2007 | Expenses Paid
During Period*
May 1, 2007 to
October 31, 2007 |
Class A | | | |
Actual | $ 1,000.00 | $ 1,162.90 | $ 6.92 |
Hypothetical A | $ 1,000.00 | $ 1,018.80 | $ 6.46 |
Class T | | | |
Actual | $ 1,000.00 | $ 1,160.80 | $ 8.99 |
Hypothetical A | $ 1,000.00 | $ 1,016.89 | $ 8.39 |
Class B | | | |
Actual | $ 1,000.00 | $ 1,157.90 | $ 11.69 |
Hypothetical A | $ 1,000.00 | $ 1,014.37 | $ 10.92 |
Class C | | | |
Actual | $ 1,000.00 | $ 1,158.10 | $ 11.64 |
Hypothetical A | $ 1,000.00 | $ 1,014.42 | $ 10.87 |
International Discovery | | | |
Actual | $ 1,000.00 | $ 1,164.30 | $ 5.73 |
Hypothetical A | $ 1,000.00 | $ 1,019.91 | $ 5.35 |
Institutional Class | | | |
Actual | $ 1,000.00 | $ 1,164.40 | $ 5.35 |
Hypothetical A | $ 1,000.00 | $ 1,020.27 | $ 4.99 |
A 5% return per year before expenses
* Expenses are equal to each Class' annualized expense ratio (shown in the table below); multiplied by the average account value over the period, multiplied by 184/365 (to reflect the one-half year period).
| Annualized
Expense Ratio |
Class A | 1.27% |
Class T | 1.65% |
Class B | 2.15% |
Class C | 2.14% |
International Discovery | 1.05% |
Institutional Class | .98% |
Annual Report
Investment Changes
Geographic Diversification (% of fund's net assets) |
As of October 31, 2007 |
| United Kingdom 14.7% | |
| Japan 14.3% | |
| Germany 11.1% | |
| France 9.4% | |
| Switzerland 8.5% | |
| Australia 7.2% | |
| United States of America 4.6% | |
| Spain 3.2% | |
| Norway 2.7% | |
| Other 24.3% | |

Percentages are adjusted for the effect of futures contracts, if applicable. |
|
As of April 30, 2007 |
| Japan 16.4% | |
| United Kingdom 15.5% | |
| France 10.7% | |
| Germany 10.6% | |
 | Switzerland 9.4% | |
| Australia 6.6% | |
| Netherlands 3.6% | |
| United States of America 3.6% | |
| Spain 2.9% | |
| Other 20.7% | |

Percentages are adjusted for the effect of futures contracts, if applicable. |
Asset Allocation |
| % of fund's net assets | % of fund's net assets
6 months ago |
Stocks and Equity Futures | 96.2 | 97.3 |
Short-Term Investments and Net Other Assets | 3.8 | 2.7 |
Top Ten Stocks as of October 31, 2007 |
| % of fund's
net assets | % of fund's net assets
6 months ago |
E.ON AG (Germany, Electric Utilities) | 1.6 | 1.3 |
Vodafone Group PLC (United Kingdom, Wireless Telecommunication Services) | 1.6 | 0.8 |
Telefonica SA (Spain, Diversified Telecommunication Services) | 1.5 | 0.7 |
CSL Ltd. (Australia, Biotechnology) | 1.3 | 1.0 |
Bayer AG sponsored ADR (Germany, Chemicals) | 1.2 | 1.0 |
Roche Holding AG (participation certificate) (Switzerland, Pharmaceuticals) | 1.2 | 1.5 |
Nestle SA (Reg.) (Switzerland, Food Products) | 1.2 | 1.1 |
BHP Billiton PLC (United Kingdom, Metals & Mining) | 1.2 | 0.8 |
Royal Dutch Shell PLC Class B (United Kingdom, Oil, Gas & Consumable Fuels) | 1.1 | 1.1 |
Nintendo Co. Ltd. (Japan, Software) | 1.0 | 0.9 |
| 12.9 | |
Market Sectors as of October 31, 2007 |
| % of fund's
net assets | % of fund's net assets
6 months ago |
Financials | 17.3 | 22.7 |
Industrials | 15.1 | 14.5 |
Consumer Discretionary | 12.6 | 15.1 |
Information Technology | 8.9 | 8.5 |
Materials | 8.1 | 6.5 |
Consumer Staples | 7.8 | 7.5 |
Health Care | 7.6 | 7.8 |
Energy | 7.4 | 5.8 |
Utilities | 6.1 | 5.2 |
Telecommunication Services | 4.9 | 3.2 |
Annual Report
Investments October 31, 2007
Showing Percentage of Net Assets
Common Stocks - 94.7% |
| Shares | | Value (000s) |
Australia - 7.2% |
AMP Ltd. | 2,150,200 | | $ 20,588 |
Aristocrat Leisure Ltd. (d) | 1,674,900 | | 16,383 |
AXA Asia Pacific Holdings Ltd. | 3,809,600 | | 29,145 |
Babcock & Brown Japan Property Trust | 14,813,600 | | 23,189 |
Babcock & Brown Ltd. | 2,614,622 | | 75,708 |
Babcock & Brown Wind Partners | 7,081,600 | | 12,186 |
Brambles Ltd. | 3,727,909 | | 49,622 |
Cochlear Ltd. | 750,661 | | 48,269 |
Commonwealth Bank of Australia | 1,313,800 | | 75,667 |
Computershare Ltd. | 6,601,384 | | 53,227 |
CSL Ltd. | 5,651,034 | | 192,113 |
Downer EDI Ltd. | 3,907,684 | | 24,368 |
Goodman Group unit | 4,741,905 | | 30,738 |
Macquarie Bank Ltd. | 588,675 | | 47,015 |
Mortgage Choice Ltd. | 2,899,300 | | 6,677 |
National Australia Bank Ltd. | 2,313,706 | | 93,608 |
Oxiana Ltd. | 2,673,571 | | 10,655 |
QBE Insurance Group Ltd. | 2,000,792 | | 61,229 |
Seek Ltd. | 2,000,000 | | 17,504 |
United Group Ltd. | 556,800 | | 11,144 |
Woolworths Ltd. | 2,722,574 | | 85,330 |
WorleyParsons Ltd. | 1,755,648 | | 79,361 |
TOTAL AUSTRALIA | | 1,063,726 |
Austria - 0.4% |
Raiffeisen International Bank Holding AG | 316,025 | | 52,241 |
Strabag SE (a) | 117,400 | | 9,217 |
TOTAL AUSTRIA | | 61,458 |
Belgium - 0.2% |
InBev SA | 365,300 | | 34,486 |
Bermuda - 0.8% |
Aquarius Platinum Ltd. (United Kingdom) | 1,493,400 | | 57,222 |
Ports Design Ltd. | 4,763,900 | | 17,985 |
Sinofert Holdings Ltd. | 38,748,900 | | 36,551 |
TOTAL BERMUDA | | 111,758 |
Brazil - 0.9% |
B2W Companhia Global Do Varejo | 1,134,400 | | 61,241 |
Bovespa Holding SA (a) | 787,000 | | 14,989 |
Uniao de Bancos Brasileiros SA (Unibanco) GDR | 337,000 | | 53,259 |
TOTAL BRAZIL | | 129,489 |
Common Stocks - continued |
| Shares | | Value (000s) |
Canada - 1.2% |
Niko Resources Ltd. | 498,400 | | $ 55,847 |
Open Text Corp. (a)(d) | 1,310,000 | | 40,943 |
Potash Corp. of Saskatchewan, Inc. | 615,500 | | 75,596 |
TOTAL CANADA | | 172,386 |
Cayman Islands - 0.8% |
Alibaba.com Ltd. (a) | 598,500 | | 1,931 |
Chaoda Modern Agriculture (Holdings) Ltd. | 12,600,000 | | 11,499 |
Lee & Man Paper Manufacturing Ltd. | 9,312,600 | | 37,254 |
Subsea 7, Inc. (a)(d) | 791,800 | | 23,238 |
Suntech Power Holdings Co. Ltd. sponsored ADR (a) | 842,200 | | 49,597 |
TOTAL CAYMAN ISLANDS | | 123,519 |
China - 0.3% |
Jiangsu Expressway Co. Ltd. (H Shares) | 13,585,200 | | 15,716 |
Nine Dragons Paper (Holdings) Ltd. | 10,409,000 | | 28,196 |
TOTAL CHINA | | 43,912 |
Cyprus - 0.3% |
Aisi Realty Public Ltd. (e) | 10,023,000 | | 8,752 |
Marfin Popular Bank Public Co. | 2,596,559 | | 42,208 |
TOTAL CYPRUS | | 50,960 |
Czech Republic - 0.3% |
Ceske Energeticke Zavody AS | 584,800 | | 42,271 |
Denmark - 0.7% |
Vestas Wind Systems AS (a) | 1,176,600 | | 104,975 |
Finland - 1.3% |
Citycon Oyj | 791,225 | | 5,158 |
Nokia Corp. sponsored ADR | 3,652,100 | | 145,061 |
Wartsila Corp. (B Shares) | 431,600 | | 35,267 |
TOTAL FINLAND | | 185,486 |
France - 9.4% |
Alcatel-Lucent SA | 1,089,900 | | 10,561 |
Alstom SA | 476,200 | | 112,388 |
AXA SA | 1,619,466 | | 72,439 |
BNP Paribas SA | 419,639 | | 46,261 |
Cap Gemini SA | 621,000 | | 39,587 |
CNP Assurances | 210,300 | | 26,809 |
Electricite de France | 886,200 | | 106,296 |
Gaz de France | 805,800 | | 45,764 |
Common Stocks - continued |
| Shares | | Value (000s) |
France - continued |
Geodis SA | 73,700 | | $ 15,910 |
Groupe Danone | 483,400 | | 41,693 |
Icade SA | 581,289 | | 42,900 |
L'Oreal SA | 247,100 | | 32,370 |
LVMH Moet Hennessy - Louis Vuitton | 357,300 | | 46,009 |
Neopost SA | 264,700 | | 30,745 |
Neuf Cegetel | 688,313 | | 34,803 |
Orpea (a) | 540,928 | | 34,193 |
Pinault Printemps-Redoute SA | 155,200 | | 30,764 |
Remy Cointreau SA | 304,500 | | 23,404 |
Renault SA | 461,500 | | 77,493 |
Sechilienne-Sidec | 174,000 | | 15,625 |
Societe Generale Series A | 181,820 | | 30,637 |
Suez SA (France) | 1,184,600 | | 76,999 |
Total SA Series B | 1,866,176 | | 150,432 |
Veolia Environnement | 916,962 | | 81,902 |
Vinci SA | 1,336,700 | | 109,651 |
Vivendi | 1,098,719 | | 49,474 |
TOTAL FRANCE | | 1,385,109 |
Germany - 10.1% |
Adidas-Salomon AG | 487,400 | | 32,518 |
Allianz AG (Reg.) | 607,130 | | 137,211 |
Bayer AG sponsored ADR | 2,183,200 | | 179,896 |
CompuGROUP Holding AG (a) | 519,400 | | 10,798 |
Continental AG | 228,600 | | 34,574 |
DaimlerChrysler AG (Reg.) | 669,000 | | 73,690 |
Deutsche Boerse AG | 727,200 | | 114,733 |
E.ON AG | 1,219,500 | | 238,172 |
Gerresheimer AG | 331,000 | | 18,223 |
Hochtief AG | 519,000 | | 71,666 |
K&S AG | 237,600 | | 49,677 |
Linde AG | 512,128 | | 64,804 |
MAN AG | 362,600 | | 64,721 |
MTU Aero Engines Holding AG | 63,600 | | 3,883 |
Muenchener Rueckversicherungs-Gesellschaft AG (Reg.) | 381,600 | | 73,210 |
Q-Cells AG (a) | 461,100 | | 58,721 |
SGL Carbon AG (a) | 637,600 | | 37,200 |
Siemens AG (Reg.) | 887,100 | | 120,974 |
SolarWorld AG | 1,099,600 | | 74,589 |
Wincor Nixdorf AG | 247,400 | | 24,574 |
TOTAL GERMANY | | 1,483,834 |
Common Stocks - continued |
| Shares | | Value (000s) |
Greece - 0.6% |
EFG Eurobank Ergasias SA | 871,328 | | $ 33,908 |
Marfin Financial Group Holdings SA | 1,328,400 | | 12,625 |
National Bank of Greece SA | 545,000 | | 37,885 |
TOTAL GREECE | | 84,418 |
Hong Kong - 1.4% |
China Mobile (Hong Kong) Ltd. | 1,539,000 | | 31,913 |
Esprit Holdings Ltd. | 6,854,500 | | 114,478 |
Li & Fung Ltd. | 11,401,900 | | 54,105 |
TOTAL HONG KONG | | 200,496 |
India - 1.6% |
Bharti Airtel Ltd. (a) | 2,771,992 | | 71,615 |
Infosys Technologies Ltd. | 991,984 | | 47,073 |
Reliance Industries Ltd. | 1,179,321 | | 84,180 |
Satyam Computer Services Ltd. | 3,147,843 | | 38,690 |
TOTAL INDIA | | 241,558 |
Indonesia - 0.2% |
PT Perusahaan Gas Negara Tbk Series B | 16,035,500 | | 25,130 |
Ireland - 0.3% |
Paddy Power PLC (Ireland) | 623,197 | | 25,777 |
Ryanair Holdings PLC sponsored ADR (a) | 486,900 | | 23,951 |
TOTAL IRELAND | | 49,728 |
Israel - 0.6% |
Israel Chemicals Ltd. | 4,076,700 | | 44,861 |
Nice Systems Ltd. sponsored ADR (a) | 995,600 | | 39,257 |
TOTAL ISRAEL | | 84,118 |
Italy - 2.1% |
AEM SpA | 7,233,100 | | 30,432 |
Edison SpA | 9,489,400 | | 32,267 |
ENI SpA | 288,800 | | 10,553 |
ENI SpA sponsored ADR | 389,450 | | 28,461 |
Fiat SpA | 2,581,600 | | 83,295 |
Impregilo SpA (a) | 1,279,394 | | 10,250 |
Prysmian SpA | 1,016,400 | | 29,202 |
Unicredito Italiano SpA | 9,354,300 | | 79,960 |
TOTAL ITALY | | 304,420 |
Japan - 13.9% |
Aeon Mall Co. Ltd. | 793,600 | | 20,643 |
Common Stocks - continued |
| Shares | | Value (000s) |
Japan - continued |
Asahi Glass Co. Ltd. | 1,924,000 | | $ 26,503 |
Asics Corp. | 3,270,000 | | 52,155 |
Canon, Inc. | 2,444,050 | | 123,596 |
Chiba Bank Ltd. | 2,187,000 | | 17,557 |
East Japan Railway Co. | 3,681 | | 30,328 |
Fujifilm Holdings Corp. | 1,518,000 | | 72,773 |
Honda Motor Co. Ltd. | 1,548,900 | | 57,975 |
Ibiden Co. Ltd. | 449,700 | | 38,127 |
Japan Tobacco, Inc. | 12,452 | | 72,594 |
Kawasaki Kisen Kaisha Ltd. | 2,345,000 | | 32,556 |
Keyence Corp. | 82,600 | | 19,039 |
Konica Minolta Holdings, Inc. | 2,904,500 | | 50,856 |
Kubota Corp. | 5,875,000 | | 49,334 |
Leopalace21 Corp. | 329,500 | | 10,521 |
Matsui Securities Co. Ltd. (d) | 2,233,300 | | 17,748 |
Mitsubishi Corp. | 1,383,500 | | 43,085 |
Mitsubishi Estate Co. Ltd. | 2,029,400 | | 60,851 |
Mitsui & Co. Ltd. | 3,209,000 | | 83,253 |
Mitsui Fudosan Co. Ltd. | 2,335,000 | | 64,609 |
Murata Manufacturing Co. Ltd. | 652,800 | | 39,736 |
Namco Bandai Holdings, Inc. | 1,763,600 | | 27,196 |
NGK Insulators Ltd. | 2,226,000 | | 78,931 |
Nintendo Co. Ltd. | 245,400 | | 154,111 |
Nippon Building Fund, Inc. | 2,498 | | 36,244 |
Nippon Electric Glass Co. Ltd. | 855,000 | | 14,535 |
Nippon Steel Corp. | 4,753,000 | | 31,598 |
Nomura Holdings, Inc. | 2,914,300 | | 51,962 |
NSK Ltd. | 3,609,000 | | 32,005 |
ORIX Corp. | 264,680 | | 54,305 |
Sony Corp. sponsored ADR | 808,600 | | 39,993 |
Sony Financial Holdings, Inc. | 1,085 | | 3,904 |
Sumco Corp. | 1,074,700 | | 39,232 |
Sumitomo Corp. | 1,889,600 | | 32,931 |
Sumitomo Electric Industries Ltd. | 1,786,100 | | 28,924 |
Sumitomo Metal Industries Ltd. | 1,557,000 | | 7,708 |
Sumitomo Mitsui Financial Group, Inc. | 11,632 | | 95,302 |
Sumitomo Trust & Banking Co. Ltd. | 2,478,800 | | 18,486 |
Takeda Pharmaceutical Co. Ltd. | 1,988,100 | | 124,213 |
Tokuyama Corp. | 3,364,900 | | 47,010 |
Toyota Motor Corp. | 2,645,700 | | 151,387 |
TOTAL JAPAN | | 2,053,816 |
Common Stocks - continued |
| Shares | | Value (000s) |
Korea (South) - 2.0% |
Korean Reinsurance Co. | 946,600 | | $ 16,887 |
LG Household & Health Care Ltd. | 441,970 | | 98,540 |
NHN Corp. (a) | 286,270 | | 92,058 |
Samsung Fire & Marine Insurance Co. Ltd. | 217,180 | | 60,426 |
Shinhan Financial Group Co. Ltd. | 385,130 | | 25,220 |
TOTAL KOREA (SOUTH) | | 293,131 |
Luxembourg - 1.2% |
Acergy SA | 1,124,500 | | 32,543 |
ArcelorMittal SA (d) | 730,900 | | 58,665 |
ArcelorMittal SA (NY Shares) Class A | 654,000 | | 52,287 |
SES SA (A Shares) FDR unit | 1,567,368 | | 37,695 |
TOTAL LUXEMBOURG | | 181,190 |
Malaysia - 1.1% |
DiGi.com Bhd | 3,860,800 | | 29,080 |
Gamuda Bhd | 53,435,000 | | 73,675 |
IJM Corp. Bhd | 8,525,300 | | 22,395 |
KNM Group Bhd | 19,276,000 | | 34,120 |
TOTAL MALAYSIA | | 159,270 |
Mexico - 0.6% |
America Movil SAB de CV Series L sponsored ADR | 1,217,900 | | 79,638 |
Urbi, Desarrollos Urbanos, SA de CV (a) | 4,121,400 | | 15,925 |
TOTAL MEXICO | | 95,563 |
Netherlands - 2.1% |
CNH Global NV | 730,700 | | 47,919 |
Heineken NV (Bearer) | 924,100 | | 64,502 |
ING Groep NV (Certificaten Van Aandelen) | 310,544 | | 13,971 |
Koninklijke KPN NV | 1,912,000 | | 36,067 |
Koninklijke Numico NV | 341,600 | | 27,220 |
Koninklijke Philips Electronics NV | 1,291,900 | | 53,407 |
Nutreco Holding NV | 653,700 | | 44,655 |
SBM Offshore NV | 706,779 | | 27,197 |
TOTAL NETHERLANDS | | 314,938 |
Norway - 2.7% |
Aker Kvaerner ASA | 3,278,985 | | 114,259 |
Hafslund ASA (B Shares) | 674,550 | | 19,986 |
Marine Harvest ASA (a) | 42,140,100 | | 42,717 |
Petroleum Geo-Services ASA | 1,889,000 | | 55,616 |
Pronova BioPharma ASA | 6,445,100 | | 29,664 |
Common Stocks - continued |
| Shares | | Value (000s) |
Norway - continued |
Renewable Energy Corp. AS (a)(d) | 1,148,900 | | $ 58,553 |
StatoilHydro ASA | 2,088,100 | | 70,660 |
TOTAL NORWAY | | 391,455 |
Papua New Guinea - 0.2% |
Lihir Gold Ltd. (a) | 9,432,800 | | 37,449 |
Singapore - 0.6% |
Keppel Corp. Ltd. | 2,332,000 | | 23,971 |
Singapore Exchange Ltd. | 5,755,000 | | 63,061 |
TOTAL SINGAPORE | | 87,032 |
South Africa - 0.0% |
JSE Ltd. | 166,821 | | 2,220 |
Spain - 3.2% |
Banco Santander Central Hispano SA | 5,543,700 | | 120,476 |
Compania de Distribucion Integral Logista SA | 163,800 | | 12,779 |
Inditex SA | 1,531,400 | | 113,930 |
Sol Melia SA | 279,295 | | 5,362 |
Telefonica SA | 6,849,600 | | 227,064 |
TOTAL SPAIN | | 479,611 |
Sweden - 1.5% |
H&M Hennes & Mauritz AB (B Shares) | 1,161,450 | | 77,323 |
Modern Times Group MTG AB (B Shares) | 1,049,300 | | 73,738 |
Scania AB (B Shares) | 2,390,600 | | 65,279 |
TOTAL SWEDEN | | 216,340 |
Switzerland - 8.5% |
ABB Ltd. sponsored ADR | 4,624,400 | | 139,749 |
Actelion Ltd. (Reg.) (a) | 1,287,650 | | 63,977 |
BB Biotech AG | 341,699 | | 30,002 |
Compagnie Financiere Richemont unit | 529,630 | | 37,792 |
Credit Suisse Group (Reg.) | 935,480 | | 63,332 |
EFG International | 528,000 | | 24,684 |
Julius Baer Holding AG (Bearer) | 971,965 | | 84,081 |
Lindt & Spruengli AG (participation certificate) | 16,084 | | 55,543 |
Nestle SA (Reg.) | 377,747 | | 174,519 |
Novartis AG (Reg.) | 736,880 | | 39,180 |
Roche Holding AG (participation certificate) | 1,047,428 | | 179,005 |
SGS Societe Generale de Surveillance Holding SA (Reg.) | 24,415 | | 31,997 |
Sonova Holding AG | 659,300 | | 73,996 |
Swiss Life Holding | 95,891 | | 26,492 |
Common Stocks - continued |
| Shares | | Value (000s) |
Switzerland - continued |
Syngenta AG (Switzerland) | 196,292 | | $ 47,571 |
Tecan Group AG | 212,300 | | 14,205 |
The Swatch Group AG (Reg.) | 1,277,012 | | 80,206 |
UBS AG (NY Shares) | 1,020,700 | | 54,801 |
Zurich Financial Services AG (Reg.) | 113,749 | | 34,248 |
TOTAL SWITZERLAND | | 1,255,380 |
Taiwan - 0.9% |
Gemtek Technology Corp. | 416,925 | | 938 |
Hon Hai Precision Industry Co. Ltd. (Foxconn) | 8,704,668 | | 66,101 |
PixArt Imaging, Inc. | 174,000 | | 1,523 |
Shin Kong Financial Holding Co. Ltd. | 10,525,009 | | 9,747 |
Siliconware Precision Industries Co. Ltd. | 12,427,433 | | 26,201 |
Wistron Corp. | 14,679,615 | | 29,228 |
TOTAL TAIWAN | | 133,738 |
United Kingdom - 14.7% |
Anglo American PLC (United Kingdom) | 946,654 | | 65,224 |
Autonomy Corp. PLC (a) | 2,701,500 | | 55,183 |
BAE Systems PLC | 4,314,809 | | 44,674 |
Barclays PLC | 1,431,400 | | 18,197 |
BG Group PLC | 1,454,900 | | 26,843 |
BG Group PLC sponsored ADR | 200,000 | | 18,450 |
BHP Billiton PLC | 4,518,500 | | 172,008 |
Blinkx PLC | 2,595,500 | | 1,713 |
BP PLC sponsored ADR | 922,600 | | 71,954 |
British American Tobacco PLC | 1,891,700 | | 72,528 |
British American Tobacco PLC sponsored ADR | 390,200 | | 29,921 |
Burberry Group PLC | 789,000 | | 10,088 |
Capita Group PLC | 1,161,193 | | 18,082 |
Clipper Windpower PLC (a) | 2,006,200 | | 27,737 |
GlaxoSmithKline PLC sponsored ADR | 956,700 | | 49,031 |
Gyrus Group PLC (a) | 3,384,500 | | 30,081 |
HSBC Holdings PLC (Hong Kong) (Reg.) | 1,445,244 | | 28,766 |
Informa PLC | 1,379,400 | | 15,343 |
International Power PLC | 9,114,700 | | 92,665 |
Investec PLC | 3,130,100 | | 37,809 |
John Wood Group PLC | 3,062,900 | | 26,586 |
Marks & Spencer Group PLC | 1,936,800 | | 26,254 |
Misys PLC | 1,173,500 | | 5,898 |
N Brown Group PLC | 4,180,000 | | 25,137 |
National Grid PLC | 3,373,200 | | 56,210 |
Common Stocks - continued |
| Shares | | Value (000s) |
United Kingdom - continued |
Next PLC | 907,000 | | $ 41,636 |
Pearson PLC | 2,492,100 | | 41,320 |
Punch Taverns Ltd. | 871,700 | | 18,214 |
Reckitt Benckiser Group PLC | 1,970,700 | | 114,270 |
Renovo Group PLC (a)(e) | 10,125,200 | | 42,523 |
Rio Tinto PLC sponsored ADR | 162,300 | | 60,863 |
Rolls-Royce Group PLC | 4,072,789 | | 45,555 |
Royal Bank of Scotland Group PLC | 6,689,857 | | 71,838 |
Royal Dutch Shell PLC Class B | 3,593,359 | | 156,760 |
RPS Group PLC | 4,353,400 | | 35,253 |
Shire PLC | 2,143,300 | | 53,690 |
SSL International PLC | 6,991,900 | | 74,863 |
Tesco PLC | 10,185,112 | | 104,397 |
Vodafone Group PLC | 59,492,135 | | 233,626 |
Xstrata PLC | 676,400 | | 48,474 |
TOTAL UNITED KINGDOM | | 2,169,664 |
United States of America - 0.8% |
Fluor Corp. | 275,900 | | 43,592 |
Macquarie Infrastructure Co. LLC | 131,000 | | 5,471 |
Sunpower Corp. Class A (a) | 433,600 | | 54,833 |
Washington Group International, Inc. (a) | 167,200 | | 16,277 |
TOTAL UNITED STATES OF AMERICA | | 120,173 |
TOTAL COMMON STOCKS (Cost $9,813,829) | 13,974,207 |
Nonconvertible Preferred Stocks - 1.1% |
| | | |
Germany - 1.0% |
Fresenius AG (non-vtg.) | 573,700 | | 45,490 |
Porsche AG | 21,495 | | 57,271 |
ProSiebenSat.1 Media AG | 1,396,900 | | 40,821 |
TOTAL GERMANY | | 143,582 |
Italy - 0.1% |
Intesa Sanpaolo SpA | 1,669,602 | | 12,673 |
Nonconvertible Preferred Stocks - continued |
| Shares | | Value (000s) |
United Kingdom - 0.0% |
Rolls-Royce Group PLC: | | | |
B Shares | 3,257 | | $ 0 |
B Shares (a) | 164,540,675 | | 342 |
TOTAL UNITED KINGDOM | | 342 |
TOTAL NONCONVERTIBLE PREFERRED STOCKS (Cost $102,519) | 156,597 |
Government Obligations - 0.0% |
| Principal Amount (000s) | | |
United States of America - 0.0% |
U.S. Treasury Bills, yield at date of purchase 3.64% to 4.85% 11/1/07 to 1/31/08 (f)
(Cost $5,151) | | $ 5,175 | | 5,151 |
Money Market Funds - 4.7% |
| Shares | | |
Fidelity Cash Central Fund, 4.97% (b) | 635,283,797 | | 635,284 |
Fidelity Securities Lending Cash Central Fund, 5.02% (b)(c) | 52,174,509 | | 52,175 |
TOTAL MONEY MARKET FUNDS (Cost $687,459) | 687,459 |
TOTAL INVESTMENT PORTFOLIO - 100.5% (Cost $10,608,958) | | 14,823,414 |
NET OTHER ASSETS - (0.5)% | | (75,062) |
NET ASSETS - 100% | $ 14,748,352 |
Futures Contracts |
| Expiration Date | | Underlying Face Amount at Value (000s) | | Unrealized Appreciation/
(Depreciation) (000s) |
Purchased |
Equity Index Contracts |
753 Nikkei 225 Index Contracts (Japan) | Dec. 2007 | | $ 63,459 | | $ 3,158 |
|
The face value of futures purchased as a percentage of net assets - 0.4% |
Legend |
(a) Non-income producing |
(b) Affiliated fund that is available only to investment companies and other accounts managed by Fidelity Investments. The rate quoted is the annualized seven-day yield of the fund at period end. A complete unaudited listing of the fund's holdings as of its most recent quarter end is available upon request. |
(c) Investment made with cash collateral received from securities on loan. |
(d) Security or a portion of the security is on loan at period end. |
(e) Affiliated company |
(f) Security or a portion of the security was pledged to cover margin requirements for futures contracts. At the period end, the value of securities pledged amounted to $3,171,000. |
Affiliated Central Funds |
Information regarding fiscal year to date income earned by the Fund from investments in Fidelity Central Funds is as follows: |
Fund | Income earned
(Amounts in thousands) |
Fidelity Cash Central Fund | $ 22,121 |
Fidelity Securities Lending Cash Central Fund | 8,932 |
Total | $ 31,053 |
Other Affiliated Issuers |
An affiliated company is a company in which the fund has ownership of at least 5% of the voting securities. Fiscal year to date transactions with companies which are or were affiliates are as follows: |
Affiliates
(Amounts in thousands) | Value, beginning of period | Purchases | Sales Proceeds | Dividend Income | Value,
end of
period |
Aisi Realty Public Ltd. | $ - | $ 6,615 | $ - | $ - | $ 8,752 |
Renovo Group PLC | 14,540 | 18,435 | 586 | - | 42,523 |
Total | $ 14,540 | $ 25,050 | $ 586 | $ - | $ 51,275 |
See accompanying notes which are an integral part of the financial statements.
Annual Report
Financial Statements
Statement of Assets and Liabilities
Amounts in thousands (except per-share amounts) | October 31, 2007 |
Assets | | |
Investment in securities, at value (including securities loaned of $49,933) - See accompanying schedule: Unaffiliated issuers (cost $9,887,754) | $ 14,084,680 | |
Fidelity Central Funds (cost $687,459) | 687,459 | |
Other affiliated issuers (cost $33,745) | 51,275 | |
Total Investments (cost $10,608,958) | | $ 14,823,414 |
Foreign currency held at value (cost $9,235) | | 9,250 |
Receivable for investments sold | | 6,597 |
Receivable for fund shares sold | | 38,047 |
Dividends receivable | | 15,806 |
Distributions receivable from Fidelity Central Funds | | 2,866 |
Receivable for daily variation on futures contracts | | 791 |
Prepaid expenses | | 11 |
Other receivables | | 760 |
Total assets | | 14,897,542 |
| | |
Liabilities | | |
Payable for investments purchased | $ 70,473 | |
Payable for fund shares redeemed | 9,685 | |
Accrued management fee | 9,391 | |
Distribution fees payable | 131 | |
Other affiliated payables | 2,347 | |
Other payables and accrued expenses | 4,988 | |
Collateral on securities loaned, at value | 52,175 | |
Total liabilities | | 149,190 |
| | |
Net Assets | | $ 14,748,352 |
Net Assets consist of: | | |
Paid in capital | | $ 9,827,187 |
Undistributed net investment income | | 137,292 |
Accumulated undistributed net realized gain (loss) on investments and foreign currency transactions | | 570,379 |
Net unrealized appreciation (depreciation) on investments and assets and liabilities in foreign currencies | | 4,213,494 |
Net Assets | | 14,748,352 |
See accompanying notes which are an integral part of the financial statements.
Annual Report
Financial Statements - continued
Statement of Assets and Liabilities - continued
Amounts in thousands (except per-share amounts) | October 31, 2007 |
Calculation of Maximum Offering Price
Class A:
Net Asset Value and redemption price per share ($416,784 ÷ 8,803.3 shares) | | $ 47.34 |
| | |
Maximum offering price per share (100/94.25 of $47.34) | | $ 50.23 |
Class T:
Net Asset Value and redemption price per share ($53,207 ÷ 1,130.6 shares) | | $ 47.06 |
| | |
Maximum offering price per share (100/96.50 of $47.06) | | $ 48.77 |
Class B:
Net Asset Value and offering price per share ($17,172 ÷ 367.7 shares)A | | $ 46.70 |
| | |
Class C:
Net Asset Value and offering price per share ($27,736 ÷ 592.4 shares)A | | $ 46.82 |
| | |
| | |
International Discovery
Net Asset Value, offering price and redemption price per share ($14,175,728 ÷ 297,335 shares) | | $ 47.68 |
| | |
Institutional Class:
Net Asset Value, offering price and redemption price per share ($57,725 ÷ 1,209.3 shares) | | $ 47.73 |
A Redemption price per share is equal to net asset value less any applicable contingent deferred sales charge.
See accompanying notes which are an integral part of the financial statements.
Annual Report
Statement of Operations
Amounts in thousands | Year ended October 31, 2007 |
Investment Income | | |
Dividends | | $ 248,233 |
Interest | | 571 |
Income from Fidelity Central Funds | | 31,053 |
| | 279,857 |
Less foreign taxes withheld | | (22,164) |
Total income | | 257,693 |
| | |
Expenses | | |
Management fee
Basic fee | $ 79,274 | |
Performance adjustment | 8,620 | |
Transfer agent fees | 23,362 | |
Distribution fees | 933 | |
Accounting and security lending fees | 1,888 | |
Custodian fees and expenses | 2,250 | |
Independent trustees' compensation | 37 | |
Registration fees | 527 | |
Audit | 172 | |
Legal | 99 | |
Miscellaneous | 336 | |
Total expenses before reductions | 117,498 | |
Expense reductions | (4,263) | 113,235 |
Net investment income (loss) | | 144,458 |
Realized and Unrealized Gain (Loss) Net realized gain (loss) on: | | |
Investment securities: | | |
Unaffiliated issuers (net of foreign taxes of $434) | 609,692 | |
Other affiliated issuers | 8 | |
Foreign currency transactions | 228 | |
Futures contracts | (1,828) | |
Total net realized gain (loss) | | 608,100 |
Change in net unrealized appreciation (depreciation) on: Investment securities (net of increase in deferred foreign taxes of $2,428) | 2,676,076 | |
Assets and liabilities in foreign currencies | 18 | |
Futures contracts | 1,873 | |
Total change in net unrealized appreciation (depreciation) | | 2,677,967 |
Net gain (loss) | | 3,286,067 |
Net increase (decrease) in net assets resulting from operations | | $ 3,430,525 |
See accompanying notes which are an integral part of the financial statements.
Annual Report
Financial Statements - continued
Statement of Changes in Net Assets
Amounts in thousands | Year ended
October 31,
2007 | Year ended
October 31,
2006 |
Increase (Decrease) in Net Assets | | |
Operations | | |
Net investment income (loss) | $ 144,458 | $ 89,022 |
Net realized gain (loss) | 608,100 | 238,999 |
Change in net unrealized appreciation (depreciation) | 2,677,967 | 940,196 |
Net increase (decrease) in net assets resulting
from operations | 3,430,525 | 1,268,217 |
Distributions to shareholders from net investment income | (85,862) | (41,324) |
Distributions to shareholders from net realized gain | (224,325) | (189,744) |
Total distributions | (310,187) | (231,068) |
Share transactions - net increase (decrease) | 3,385,409 | 3,239,823 |
Redemption fees | 502 | 380 |
Total increase (decrease) in net assets | 6,506,249 | 4,277,352 |
| | |
Net Assets | | |
Beginning of period | 8,242,103 | 3,964,751 |
End of period (including undistributed net investment income of $137,292 and undistributed net investment income of $83,948, respectively) | $ 14,748,352 | $ 8,242,103 |
See accompanying notes which are an integral part of the financial statements.
Annual Report
Financial Highlights - Class A
Years ended October 31, | 2007 | 2006 | 2005 H |
Selected Per-Share Data | | | |
Net asset value, beginning of period | $ 36.47 | $ 30.57 | $ 27.41 |
Income from Investment Operations | | | |
Net investment income (loss) E | .44 | .42 | .28 |
Net realized and unrealized gain (loss) | 11.76 | 7.19 | 2.88 |
Total from investment operations | 12.20 | 7.61 | 3.16 |
Distributions from net investment income | (.35) | (.31) | - |
Distributions from net realized gain | (.98) | (1.40) | - |
Total distributions | (1.33) | (1.71) | - |
Redemption fees added to paid in capital E | - J | - J | - J |
Net asset value, end of period | $ 47.34 | $ 36.47 | $ 30.57 |
Total Return B, C, D | 34.54% | 26.01% | 11.53% |
Ratios to Average Net Assets F, I | | | |
Expenses before reductions | 1.25% | 1.27% | 1.42% A |
Expenses net of fee waivers, if any | 1.25% | 1.27% | 1.42% A |
Expenses net of all reductions | 1.22% | 1.21% | 1.36% A |
Net investment income (loss) | 1.08% | 1.22% | 1.15% A |
Supplemental Data | | | |
Net assets, end of period (in millions) | $ 417 | $ 140 | $ 2 |
Portfolio turnover rate G | 56% | 56% | 75% |
A Annualized
B Total returns for periods of less than one year are not annualized.
C Total returns would have been lower had certain expenses not been reduced during the periods shown.
D Total returns do not include the effect of the sales charges.
E Calculated based on average shares outstanding during the period.
F Fees and expenses of the underlying Fidelity Central Funds are not included in the Fund's expense ratio. The Fund indirectly bears its proportionate share of the expenses of any underlying Fidelity Central Funds.
G Amount does not include the portfolio activity of any underlying Fidelity Central Funds.
H For the period January 6, 2005 (commencement of sale of shares) to October 31, 2005.
I Expense ratios reflect operating expenses of the class. Expenses before reductions do not reflect amounts reimbursed by the investment adviser or reductions from brokerage service arrangements or other expense offset arrangements and do not represent the amount paid by the class during periods when reimbursements or reductions occur. Expense ratios before reductions for start-up periods may not be representative of longer-term operating periods. Expenses net of fee waivers reflect expenses after reimbursement by the investment adviser but prior to reductions from brokerage service arrangements or other expense offset arrangements. Expenses net of all reductions represent the net expenses paid by the class.
J Amount represents less than $.01 per share.
See accompanying notes which are an integral part of the financial statements.
Annual Report
Financial Highlights - Class T
Years ended October 31, | 2007 | 2006 | 2005 H |
Selected Per-Share Data | | | |
Net asset value, beginning of period | $ 36.30 | $ 30.49 | $ 27.41 |
Income from Investment Operations | | | |
Net investment income (loss) E | .29 | .27 | .20 |
Net realized and unrealized gain (loss) | 11.71 | 7.18 | 2.88 |
Total from investment operations | 12.00 | 7.45 | 3.08 |
Distributions from net investment income | (.26) | (.24) | - |
Distributions from net realized gain | (.98) | (1.40) | - |
Total distributions | (1.24) | (1.64) | - |
Redemption fees added to paid in capital E | - J | - J | - J |
Net asset value, end of period | $ 47.06 | $ 36.30 | $ 30.49 |
Total Return B, C, D | 34.08% | 25.49% | 11.24% |
Ratios to Average Net Assets F, I | | | |
Expenses before reductions | 1.63% | 1.71% | 1.75% A |
Expenses net of fee waivers, if any | 1.63% | 1.71% | 1.75% A |
Expenses net of all reductions | 1.60% | 1.65% | 1.69% A |
Net investment income (loss) | .70% | .78% | .83% A |
Supplemental Data | | | |
Net assets, end of period (in millions) | $ 53 | $ 10 | $ 2 |
Portfolio turnover rate G | 56% | 56% | 75% |
A Annualized
B Total returns for periods of less than one year are not annualized.
C Total returns would have been lower had certain expenses not been reduced during the periods shown.
D Total returns do not include the effect of the sales charges.
E Calculated based on average shares outstanding during the period.
F Fees and expenses of the underlying Fidelity Central Funds are not included in the Fund's expense ratio. The Fund indirectly bears its proportionate share of the expenses of any underlying Fidelity Central Funds.
G Amount does not include the portfolio activity of any underlying Fidelity Central Funds.
H For the period January 6, 2005 (commencement of sale of shares) to October 31, 2005.
I Expense ratios reflect operating expenses of the class. Expenses before reductions do not reflect amounts reimbursed by the investment adviser or reductions from brokerage service arrangements or other expense offset arrangements and do not represent the amount paid by the class during periods when reimbursements or reductions occur. Expense ratios before reductions for start-up periods may not be representative of longer-term operating periods. Expenses net of fee waivers reflect expenses after reimbursement by the investment adviser but prior to reductions from brokerage service arrangements or other expense offset arrangements. Expenses net of all reductions represent the net expenses paid by the class.
J Amount represents less than $.01 per share.
See accompanying notes which are an integral part of the financial statements.
Annual Report
Financial Highlights - Class B
Years ended October 31, | 2007 | 2006 | 2005 H |
Selected Per-Share Data | | | |
Net asset value, beginning of period | $ 36.12 | $ 30.36 | $ 27.41 |
Income from Investment Operations | | | |
Net investment income (loss) E | .08 | .08 | .08 |
Net realized and unrealized gain (loss) | 11.64 | 7.19 | 2.87 |
Total from investment operations | 11.72 | 7.27 | 2.95 |
Distributions from net investment income | (.16) | (.11) | - |
Distributions from net realized gain | (.98) | (1.40) | - |
Total distributions | (1.14) | (1.51) | - |
Redemption fees added to paid in capital E | - J | - J | - J |
Net asset value, end of period | $ 46.70 | $ 36.12 | $ 30.36 |
Total Return B, C, D | 33.37% | 24.91% | 10.76% |
Ratios to Average Net Assets F, I | | | |
Expenses before reductions | 2.14% | 2.27% | 2.24% A |
Expenses net of fee waivers, if any | 2.14% | 2.25% | 2.24% A |
Expenses net of all reductions | 2.10% | 2.19% | 2.18% A |
Net investment income (loss) | .19% | .24% | .33% A |
Supplemental Data | | | |
Net assets, end of period (in millions) | $ 17 | $ 4 | $ 1 |
Portfolio turnover rate G | 56% | 56% | 75% |
A Annualized
B Total returns for periods of less than one year are not annualized.
C Total returns would have been lower had certain expenses not been reduced during the periods shown.
D Total returns do not include the effect of the contingent deferred sales charge.
E Calculated based on average shares outstanding during the period.
F Fees and expenses of the underlying Fidelity Central Funds are not included in the Fund's expense ratio. The Fund indirectly bears its proportionate share of the expenses of any underlying Fidelity Central Funds.
G Amount does not include the portfolio activity of any underlying Fidelity Central Funds.
H For the period January 6, 2005 (commencement of sale of shares) to October 31, 2005.
I Expense ratios reflect operating expenses of the class. Expenses before reductions do not reflect amounts reimbursed by the investment adviser or reductions from brokerage service arrangements or other expense offset arrangements and do not represent the amount paid by the class during periods when reimbursements or reductions occur. Expense ratios before reductions for start-up periods may not be representative of longer-term operating periods. Expenses net of fee waivers reflect expenses after reimbursement by the investment adviser but prior to reductions from brokerage service arrangements or other expense offset arrangements. Expenses net of all reductions represent the net expenses paid by the class.
J Amount represents less than $.01 per share.
See accompanying notes which are an integral part of the financial statements.
Annual Report
Financial Highlights - Class C
Years ended October 31, | 2007 | 2006 | 2005 H |
Selected Per-Share Data | | | |
Net asset value, beginning of period | $ 36.19 | $ 30.41 | $ 27.41 |
Income from Investment Operations | | | |
Net investment income (loss) E | .09 | .11 | .13 |
Net realized and unrealized gain (loss) | 11.66 | 7.19 | 2.87 |
Total from investment operations | 11.75 | 7.30 | 3.00 |
Distributions from net investment income | (.14) | (.12) | - |
Distributions from net realized gain | (.98) | (1.40) | - |
Total distributions | (1.12) | (1.52) | - |
Redemption fees added to paid in capital E | - J | - J | - J |
Net asset value, end of period | $ 46.82 | $ 36.19 | $ 30.41 |
Total Return B, C, D | 33.38% | 24.97% | 10.94% |
Ratios to Average Net Assets F, I | | | |
Expenses before reductions | 2.11% | 2.16% | 2.04% A |
Expenses net of fee waivers, if any | 2.11% | 2.16% | 2.04% A |
Expenses net of all reductions | 2.08% | 2.11% | 1.98% A |
Net investment income (loss) | .22% | .33% | .53% A |
Supplemental Data | | | |
Net assets, end of period (in millions) | $ 28 | $ 6 | $ 2 |
Portfolio turnover rate G | 56% | 56% | 75% |
A Annualized
B Total returns for periods of less than one year are not annualized.
C Total returns would have been lower had certain expenses not been reduced during the periods shown.
D Total returns do not include the effect of the contingent deferred sales charge.
E Calculated based on average shares outstanding during the period.
F Fees and expenses of the underlying Fidelity Central Funds are not included in the Fund's expense ratio. The Fund indirectly bears its proportionate share of the expenses of any underlying Fidelity Central Funds.
G Amount does not include the portfolio activity of any underlying Fidelity Central Funds.
H For the period January 6, 2005 (commencement of sale of shares) to October 31, 2005.
I Expense ratios reflect operating expenses of the class. Expenses before reductions do not reflect amounts reimbursed by the investment adviser or reductions from brokerage service arrangements or other expense offset arrangements and do not represent the amount paid by the class during periods when reimbursements or reductions occur. Expense ratios before reductions for start-up periods may not be representative of longer-term operating periods. Expenses net of fee waivers reflect expenses after reimbursement by the investment adviser but prior to reductions from brokerage service arrangements or other expense offset arrangements. Expenses net of all reductions represent the net expenses paid by the class.
J Amount represents less than $.01 per share.
See accompanying notes which are an integral part of the financial statements.
Annual Report
Financial Highlights - International Discovery
Years ended October 31, | 2007 | 2006 | 2005 | 2004 | 2003 |
Selected Per-Share Data | | | | | |
Net asset value, beginning of period | $ 36.67 | $ 30.65 | $ 25.31 | $ 21.87 | $ 16.66 |
Income from Investment Operations | | | | | |
Net investment income (loss) B | .53 | .48 | .37 | .22 | .19 |
Net realized and unrealized gain (loss) | 11.84 | 7.25 | 5.24 | 3.40 | 5.11 |
Total from investment operations | 12.37 | 7.73 | 5.61 | 3.62 | 5.30 |
Distributions from net investment income | (.38) | (.31) | (.15) | (.18) | (.09) |
Distributions from net realized gain | (.98) | (1.40) | (.12) | - | - |
Total distributions | (1.36) | (1.71) | (.27) | (.18) | (.09) |
Redemption fees added to paid in capital B | - F | - F | - F | - F | - F |
Net asset value, end of period | $ 47.68 | $ 36.67 | $ 30.65 | $ 25.31 | $ 21.87 |
Total Return A | 34.85% | 26.34% | 22.29% | 16.65% | 31.97% |
Ratios to Average Net Assets C, E | | | | | |
Expenses before reductions | 1.04% | 1.09% | 1.08% | 1.10% | 1.14% |
Expenses net of fee waivers, if any | 1.04% | 1.08% | 1.07% | 1.10% | 1.14% |
Expenses net of all reductions | 1.00% | 1.03% | 1.01% | 1.06% | 1.11% |
Net investment income (loss) | 1.30% | 1.41% | 1.35% | .92% | 1.08% |
Supplemental Data | | | | | |
Net assets, end of period (in millions) | $ 14,176 | $ 8,054 | $ 3,949 | $ 2,193 | $ 1,243 |
Portfolio turnover rate D | 56% | 56% | 75% | 87% | 81% |
A Total returns would have been lower had certain expenses not been reduced during the periods shown.
B Calculated based on average shares outstanding during the period.
C Fees and expenses of the underlying Fidelity Central Funds are not included in the Fund's expense ratio. The Fund indirectly bears its proportionate share of the expenses of any underlying Fidelity Central Funds.
D Amount does not include the portfolio activity of any underlying Fidelity Central Funds.
E Expense ratios reflect operating expenses of the class. Expenses before reductions do not reflect amounts reimbursed by the investment adviser or reductions from brokerage service arrangements or other expense offset arrangements and do not represent the amount paid by the class during periods when reimbursements or reductions occur. Expenses net of fee waivers reflect expenses after reimbursement by the investment adviser but prior to reductions from brokerage service arrangements or other expense offset arrangements. Expenses net of all reductions represent the net expenses paid by the class.
F Amount represents less than $.01 per share.
See accompanying notes which are an integral part of the financial statements.
Annual Report
Financial Highlights - Institutional Class
Years ended October 31, | 2007 | 2006 | 2005 G |
Selected Per-Share Data | | | |
Net asset value, beginning of period | $ 36.71 | $ 30.68 | $ 27.41 |
Income from Investment Operations | | | |
Net investment income (loss) D | .55 | .51 | .38 |
Net realized and unrealized gain (loss) | 11.85 | 7.25 | 2.89 |
Total from investment operations | 12.40 | 7.76 | 3.27 |
Distributions from net investment income | (.40) | (.33) | - |
Distributions from net realized gain | (.98) | (1.40) | - |
Total distributions | (1.38) | (1.73) | - |
Redemption fees added to paid in capital D | - I | - I | - I |
Net asset value, end of period | $ 47.73 | $ 36.71 | $ 30.68 |
Total Return B, C | 34.93% | 26.45% | 11.93% |
Ratios to Average Net Assets E, H | | | |
Expenses before reductions | .97% | 1.00% | .97% A |
Expenses net of fee waivers, if any | .97% | 1.00% | .97% A |
Expenses net of all reductions | .94% | .95% | .90% A |
Net investment income (loss) | 1.36% | 1.49% | 1.60% A |
Supplemental Data | | | |
Net assets, end of period (in millions) | $ 58 | $ 28 | $ 10 |
Portfolio turnover rate F | 56% | 56% | 75% |
A Annualized
B Total returns for periods of less than one year are not annualized.
C Total returns would have been lower had certain expenses not been reduced during the periods shown.
D Calculated based on average shares outstanding during the period.
E Fees and expenses of the underlying Fidelity Central Funds are not included in the Fund's expense ratio. The Fund indirectly bears its proportionate share of the expenses of any underlying Fidelity Central Funds.
F Amount does not include the portfolio activity of any underlying Fidelity Central Funds.
G For the period January 6, 2005 (commencement of sale of shares) to October 31, 2005.
H Expense ratios reflect operating expenses of the class. Expenses before reductions do not reflect amounts reimbursed by the investment adviser or reductions from brokerage service arrangements or other expense offset arrangements and do not represent the amount paid by the class during periods when reimbursements or reductions occur. Expense ratios before reductions for start-up periods may not be representative of longer-term operating periods. Expenses net of fee waivers reflect expenses after reimbursement by the investment adviser but prior to reductions from brokerage service arrangements or other expense offset arrangements. Expenses net of all reductions represent the net expenses paid by the class.
I Amount represents less than $.01 per share.
See accompanying notes which are an integral part of the financial statements.
Annual Report
Notes to Financial Statements
For the period ended October 31, 2007
(Amounts in thousands except ratios)
1. Organization.
Fidelity International Discovery Fund (the Fund) is a fund of Fidelity Investment Trust (the trust) and is authorized to issue an unlimited number of shares. The trust is registered under the Investment Company Act of 1940, as amended (the 1940 Act), as an open-end management investment company organized as a Massachusetts business trust. The Fund offers Class A, Class T, Class B, Class C, International Discovery, and Institutional Class shares, each of which has equal rights as to assets and voting privileges. Each class has exclusive voting rights with respect to matters that affect that class. Class B shares will automatically convert to Class A shares after a holding period of seven years from the initial date of purchase. Investment income, realized and unrealized capital gains and losses, the common expenses of the Fund, and certain fund-level expense reductions, if any, are allocated on a pro rata basis to each class based on the relative net assets of each class to the total net assets of the Fund. Each class differs with respect to transfer agent and distribution and service plan fees incurred. Certain expense reductions also differ by class. The Fund's investments in emerging markets can be subject to social, economic, regulatory, and political uncertainties and can be extremely volatile.
2. Investments in Fidelity Central Funds.
The Fund may invest in Fidelity Central Funds, which are open-end investment companies available only to other investment companies and accounts managed by Fidelity Management & Research Company (FMR) and its affiliates. The Fund's Schedule of Investments lists each of the Fidelity Central Funds as an investment of the Fund, but does not include the underlying holdings of each Fidelity Central Fund. As an Investing Fund, the Fund indirectly bears its proportionate share of the expenses of the underlying Fidelity Central Funds.
The Money Market Central Funds seek preservation of capital and current income and are managed by Fidelity Investments Money Management, Inc. (FIMM), an affiliate of FMR.
A complete list of holdings for each Fidelity Central Fund is available upon request or at the SEC's web site at www.sec.gov. In addition, the financial statements of the Fidelity Central Funds, are available on the SEC's web site or upon request.
3. Significant Accounting Policies.
The financial statements have been prepared in conformity with accounting principles generally accepted in the United States of America, which require management to make certain estimates and assumptions at the date of the financial statements. The following summarizes the significant accounting policies of the Fund:
Annual Report
Notes to Financial Statements - continued
(Amounts in thousands except ratios)
3. Significant Accounting Policies - continued
Security Valuation. Investments are valued and net asset value (NAV) per share is calculated (NAV calculation) as of the close of business of the New York Stock Exchange (NYSE), normally 4:00 p.m. Eastern time. Wherever possible, the Fund uses independent pricing services approved by the Board of Trustees to value its investments.
Equity securities, including restricted securities, for which market quotations are readily available, are valued at the last reported sale price or official closing price as reported by an independent pricing service on the primary market or exchange on which they are traded. In the event there were no sales during the day or closing prices are not available, securities are valued at the last quoted bid price. Investments in open-end mutual funds, including the Fidelity Central Funds, are valued at their closing net asset value each business day. Short-term securities with remaining maturities of sixty days or less for which quotations are not readily available are valued at amortized cost, which approximates value.
When current market prices or quotations are not readily available or do not accurately reflect fair value, valuations may be determined in accordance with procedures adopted by the Board of Trustees. For example, when developments occur between the close of a market and the close of the NYSE that may materially affect the value of some or all of the securities, or when trading in a security is halted, those securities may be fair valued. Factors used in the determination of fair value may include monitoring news to identify significant market or security specific events such as changes in the value of U.S. securities markets, reviewing developments in foreign markets and evaluating the performance of ADRs, futures contracts and exchange-traded funds. Because the Fund's utilization of fair value pricing depends on market activity, the frequency with which fair value pricing is used cannot be predicted and may be utilized to a significant extent. The value of securities used for NAV calculation under fair value pricing may differ from published prices for the same securities.
Foreign Currency. The Fund uses foreign currency contracts to facilitate transactions in foreign-denominated securities. Losses from these transactions may arise from changes in the value of the foreign currency or if the counterparties do not perform under the contracts' terms.
Foreign-denominated assets, including investment securities, and liabilities are translated into U.S. dollars at the exchange rate at period end. Purchases and sales of investment securities, income and dividends received and expenses denominated in foreign currencies are translated into U.S. dollars at the exchange rate in effect on the transaction date.
The effects of exchange rate fluctuations on investments are included with the net realized and unrealized gain (loss) on investment securities. Other foreign currency transactions resulting in realized and unrealized gain (loss) are disclosed separately.
Annual Report
3. Significant Accounting Policies - continued
Investment Transactions and Income. For financial reporting purposes, the Fund's investment holdings and NAV include trades executed through the end of the last business day of the period. The NAV for processing shareholder transactions includes trades executed through the end of the prior business day. Gains and losses on securities sold are determined on the basis of identified cost and may include proceeds received from litigation. Dividend income is recorded on the ex-dividend date, except for certain dividends from foreign securities where the ex-dividend date may have passed, which are recorded as soon as the Fund is informed of the ex-dividend date. Non-cash dividends included in dividend income, if any, are recorded at the fair market value of the securities received. Distributions received on securities that represent a return of capital or capital gain are recorded as a reduction of cost of investments and/or as a realized gain. The Fund estimates the components of distributions received that may be considered return of capital distributions or capital gain distributions. Interest income and distributions from the Fidelity Central Funds are accrued as earned. Interest income includes coupon interest and amortization of premium and accretion of discount on debt securities. Investment income is recorded net of foreign taxes withheld where recovery of such taxes is uncertain.
Expenses. Most expenses of the trust can be directly attributed to a fund. Expenses which cannot be directly attributed are apportioned among each Fund in the trust. Expense estimates are accrued in the period to which they relate and adjustments are made when actual amounts are known.
Income Tax Information and Distributions to Shareholders. Each year, the Fund intends to qualify as a regulated investment company by distributing all of its taxable income and realized gains under Subchapter M of the Internal Revenue Code. As a result, no provision for income taxes is required in the accompanying financial statements. Foreign taxes are provided for based on the Fund's understanding of the tax rules and rates that exist in the foreign markets in which it invests.
Distributions are recorded on the ex-dividend date. Income dividends and capital gain distributions are declared separately for each class. Income and capital gain distributions are determined in accordance with income tax regulations, which may differ from generally accepted accounting principles. In addition, the Fund will claim a portion of the payment made to redeeming shareholders as a distribution for income tax purposes.
Capital accounts within the financial statements are adjusted for permanent book-tax differences. These adjustments have no impact on net assets or the results of operations. Temporary book-tax differences will reverse in a subsequent period.
Annual Report
Notes to Financial Statements - continued
(Amounts in thousands except ratios)
3. Significant Accounting Policies - continued
Income Tax Information and Distributions to Shareholders - continued
Book-tax differences are primarily due to futures transactions, foreign currency transactions, certain foreign taxes, passive foreign investment companies (PFIC), market discount, deferred trustees compensation and losses deferred due to wash sales.
The tax-basis components of distributable earnings and the federal tax cost as of period end were as follows:
Unrealized appreciation | $ 4,321,525 | |
Unrealized depreciation | (139,903) | |
Net unrealized appreciation (depreciation) | 4,181,622 | |
Undistributed ordinary income | 152,966 | |
Undistributed long-term capital gain | 495,087 | |
Cost for federal income tax purposes | $ 10,641,792 | |
The tax character of distributions paid was as follows:
| October 31, 2007 | October 31, 2006 |
Ordinary Income | $ 145,377 | $ 106,379 |
Long-term Capital Gains | 164,810 | 124,689 |
Total | $ 310,187 | $ 231,068 |
Short-Term Trading (Redemption) Fees. Shares held in the Fund less than 30 days are subject to a redemption fee equal to 1.00% of the proceeds of the redeemed shares. All redemption fees, including any estimated redemption fees paid by FMR, are retained by the Fund and accounted for as an addition to paid in capital.
New Accounting Pronouncements. In July 2006, Financial Accounting Standards Board Interpretation No. 48, Accounting for Uncertainty in Income Taxes - an interpretation of FASB Statement 109 (FIN 48), was issued and is effective on the last business day of the semiannual reporting period for fiscal years beginning after December 15, 2006. FIN 48 sets forth a threshold for financial statement recognition, measurement and disclosure of a tax position taken or expected to be taken on a tax return. Management has concluded that the adoption of FIN 48 will not result in a material impact on the Fund's net assets, results of operations and financial statement disclosures.
In addition, in September 2006, Statement of Financial Accounting Standards No. 157, Fair Value Measurements (SFAS 157), was issued and is effective for fiscal years beginning after November 15, 2007. SFAS 157 defines fair value, establishes a framework for measuring fair value and expands disclosures about fair value measurements. Management is currently evaluating the impact the adoption of SFAS 157 will have on the Fund's financial statement disclosures.
Annual Report
4. Operating Policies.
Repurchase Agreements. FMR has received an Exemptive Order from the Securities and Exchange Commission (the SEC) which permits the Fund and other affiliated entities of FMR to transfer uninvested cash balances into joint trading accounts which are then invested in repurchase agreements. The Fund may also invest directly with institutions in repurchase agreements. Repurchase agreements are collateralized by government or non-government securities. Upon settlement date, collateral is held in segregated accounts with custodian banks and may be obtained in the event of a default of the counterparty. The Fund monitors, on a daily basis, the value of the collateral to ensure it is at least equal to the principal amount of the repurchase agreement (including accrued interest). In the event of a default by the counterparty, realization of the collateral proceeds could be delayed, during which time the value of the collateral may decline.
Futures Contracts. The Fund may use futures contracts to manage its exposure to the stock markets. Buying futures tends to increase a fund's exposure to the underlying instrument, while selling futures tends to decrease a fund's exposure to the underlying instrument or hedge other fund investments. Upon entering into a futures contract, a fund is required to deposit with a clearing broker, no later than the following business day, an amount ("initial margin") equal to a certain percentage of the face value of the contract. The initial margin may be in the form of cash or securities and is transferred to a segregated account on settlement date. Subsequent payments ("variation margin") are made or received by a fund depending on the daily fluctuations in the value of the futures contract and are accounted for as unrealized gains or losses. Realized gains (losses) are recorded upon the expiration or closing of the futures contract. Securities deposited to meet margin requirements are identified in the Schedule of Investments. Futures contracts involve, to varying degrees, risk of loss in excess of any futures variation margin reflected in the Statement of Assets and Liabilities. The underlying face amount at value of any open futures contracts at period end is shown in the Schedule of Investments under the caption "Futures Contracts." This amount reflects each contract's exposure to the underlying instrument at period end. Losses may arise from changes in the value of the underlying instruments or if the counterparties do not perform under the contract's terms. Futures contracts are valued at the settlement price established each day by the board of trade or exchange on which they are traded.
5. Purchases and Sales of Investments.
Purchases and sales of securities, other than short-term securities, aggregated $9,077,103 and $6,122,723, respectively.
Annual Report
Notes to Financial Statements - continued
(Amounts in thousands except ratios)
6. Fees and Other Transactions with Affiliates.
Management Fee. FMR and its affiliates provide the Fund with investment management related services for which the Fund pays a monthly management fee. The management fee is the sum of an individual fund fee rate that is based on an annual rate of .45% of the Fund's average net assets and a group fee rate that averaged ..26% during the period. The group fee rate is based upon the average net assets of all the mutual funds advised by FMR. The group fee rate decreases as assets under management increase and increases as assets under management decrease. In addition, the management fee is subject to a performance adjustment (up to a maximum of ± .20% of the Fund's average net assets over a 36 month performance period). The upward or downward adjustment to the management fee is based on the investment performance of the asset-weighted return of all classes relative investment performance of the retail class of the Fund, International Discovery, as compared to an appropriate benchmark index. For the period, the total annual management fee rate, including the performance adjustment, was .78% of the Fund's average net assets.
Distribution and Service Plan. In accordance with Rule 12b-1 of the 1940 Act, the Fund has adopted separate Distribution and Service Plans for each class of shares. Certain classes pay Fidelity Distributors Corporation (FDC), an affiliate of FMR, separate Distribution and Service Fees, each of which is based on an annual percentage of each class' average net assets. In addition, FDC may pay financial intermediaries for selling shares of the Fund and providing shareholder support services. For the period, the Distribution and Service Fee rates and the total amounts paid to and retained by FDC were as follows:
| Distribution
Fee | Service
Fee | Paid to
FDC | Retained
by FDC |
Class A | 0% | .25% | $ 583 | $ 37 |
Class T | .25% | .25% | 129 | 4 |
Class B | .75% | .25% | 87 | 65 |
Class C | .75% | 25% | 134 | 65 |
| | | $ 933 | $ 171 |
Sales Load. FDC receives a front-end sales charge of up to 5.75% for selling Class A shares, and 3.50% for selling Class T shares, some of which is paid to financial intermediaries for selling shares of the Fund. FDC receives the proceeds of contingent deferred sales charges levied on Class A, Class T, Class B, and Class C redemptions. These charges depend on the holding period. The deferred sales charges range from 5% to 1% for Class B, 1% for Class C, 1% to .50% for certain purchases of Class A shares and .25% for certain purchases of Class T shares.
Annual Report
6. Fees and Other Transactions with Affiliates - continued
Sales Load - continued
For the period, sales charge amounts retained by FDC were as follows:
| Retained
by FDC |
Class A | $ 128 |
Class T | 24 |
Class B* | 12 |
Class C* | 5 |
| $ 169 |
* When Class B and Class C shares are initially sold, FDC pays commissions from its own resources to financial intermediaries through which the sales are made.
Transfer Agent Fees. Fidelity Investments Institutional Operations Company, Inc. (FIIOC), an affiliate of FMR, is the transfer, dividend disbursing and shareholder servicing agent for each class of the Fund, except for International Discovery. Fidelity Service Company, Inc. (FSC), an affiliate of FMR, is the transfer agent for International Discovery shares. FIIOC and FSC receive account fees and asset-based fees that vary according to the account size and type of account of the shareholders of the respective classes of the Fund. FIIOC and FSC pay for typesetting, printing and mailing of shareholder reports, except proxy statements. For the period, the total transfer agent fees paid by each class to FIIOC or FSC, were as follows:
| Amount | % of
Average
Net Assets |
Class A | $ 404 | .17 |
Class T | 80 | .30 |
Class B | 28 | .32 |
Class C | 40 | .29 |
International Discovery | 22,756 | .21 |
Institutional Class | 54 | .14 |
| $ 23,362 | |
Accounting and Security Lending Fees. FSC maintains the Fund's accounting records. The accounting fee is based on the level of average net assets for the month. Under a separate contract, FSC administers the security lending program. The security lending fee is based on the number and duration of lending transactions.
Brokerage Commissions. The Fund placed a portion of its portfolio transactions with brokerage firms which are affiliates of the investment adviser. The commissions paid to these affiliated firms were $1 for the period.
Annual Report
Notes to Financial Statements - continued
(Amounts in thousands except ratios)
7. Committed Line of Credit.
The Fund participates with other funds managed by FMR in a $4.2 billion credit facility (the "line of credit") to be utilized for temporary or emergency purposes to fund shareholder redemptions or for other short-term liquidity purposes. The Fund has agreed to pay commitment fees on its pro rata portion of the line of credit, which amounted to $22 and is reflected in Miscellaneous Expense on the Statement of Operations. During the period, there were no borrowings on this line of credit.
8. Security Lending.
The Fund lends portfolio securities from time to time in order to earn additional income. On the settlement date of the loan, the Fund receives collateral (in the form of U.S. Treasury obligations, letters of credit and/or cash) against the loaned securities and maintains collateral in an amount not less than 100% of the market value of the loaned securities during the period of the loan. The market value of the loaned securities is determined at the close of business of the Fund and any additional required collateral is delivered to the Fund on the next business day. If the borrower defaults on its obligation to return the securities loaned because of insolvency or other reasons, a fund could experience delays and costs in recovering the securities loaned or in gaining access to the collateral. Any cash collateral received is invested in the Fidelity Securities Lending Cash Central Fund. The value of loaned securities and cash collateral at period end are disclosed on the Fund's Statement of Assets and Liabilities. Security lending income represents the income earned on investing cash collateral, less fees and expenses associated with the loan, plus any premium payments that may be received on the loan of certain types of securities. Security lending income is presented in the Statement of Operations as a component of income from Fidelity Central Funds. Net income from lending portfolio securities during the period amounted to $8,932.
9. Expense Reductions.
Many of the brokers with whom FMR places trades on behalf of the Fund provided services to the Fund in addition to trade execution. These services included payments of certain expenses on behalf of the Fund totaling $3,703 for the period. In addition, through arrangements with the Fund's custodian and each class' transfer agent, credits realized as a result of uninvested cash balances were used to reduce the Fund's expenses. During the period, these credits reduced the Fund's custody expenses by $11. During the period, credits reduced each class' transfer agent expense as noted in the table below.
| Transfer Agent
expense reduction | |
International Discovery | $ 433 | |
Annual Report
10. Other.
The Fund's organizational documents provide former and current trustees and officers with a limited indemnification against liabilities arising in connection with the performance of their duties to the Fund. In the normal course of business, the Fund may also enter into contracts that provide general indemnifications. The Fund's maximum exposure under these arrangements is unknown as this would be dependent on future claims that may be made against the Fund. The risk of material loss from such claims is considered remote.
In September 2006, FIIOC, a transfer agent of the Fund, notified the Fund that the Fund's books and records did not reflect a conversion of certain Class B to Class A shares upon their conversion date. In March 2007, FIIOC converted the relevant Class B shares to Class A shares and recorded the conversion in the books and records of the Fund which did not result in a material impact to the Fund's reported net assets or results of operations in the accompanying financial statements. FIIOC has remediated affected shareholders and reimbursed the Fund for all related audit and legal expenses.
The United States Securities and Exchange Commission ("SEC") is conducting an investigation of FMR (covering the years 2002 to 2004) arising from gifts, gratuities and business entertainment provided by certain brokers to certain individuals who were employed on FMR's domestic equity trading desk during that period. FMR is in discussions with the SEC staff regarding the possible resolution of the matter, but as of period-end no final resolution has been reached.
In December 2006, the Independent Trustees completed their own investigation of the matter with the assistance of independent counsel. The Independent Trustees and FMR agree that, despite the absence of proof that the Fidelity mutual funds experienced diminished execution quality as a result of the improper receipt of gifts and business entertainment, the conduct at issue was serious and is worthy of redress. Accordingly, the Independent Trustees have requested and FMR has agreed to pay $42 million to Fidelity mutual funds, plus interest to be determined at the time that payment is made. A method of allocating this payment among the funds has not yet been determined. The total payment to the Fund is not anticipated to have a material impact on the Fund's net assets. In addition, FMR reimbursed related legal expenses which are recorded in the accompanying Statement of Operations as an expense reduction.
Annual Report
Notes to Financial Statements - continued
(Amounts in thousands except ratios)
11. Distributions to Shareholders.
Distributions to shareholders of each class were as follows:
| Years ended October 31, |
| 2007 | 2006 |
From net investment income | | |
Class A | $ 1,387 | $ 38 |
Class T | 80 | 18 |
Class B | 21 | 3 |
Class C | 24 | 8 |
International Discovery | 84,038 | 41,152 |
Institutional Class | 312 | 105 |
Total | 85,862 | 41,324 |
From net realized gain | | |
Class A | 3,929 | 173 |
Class T | 302 | 102 |
Class B | 130 | 40 |
Class C | 170 | 94 |
International Discovery | 219,032 | 188,890 |
Institutional Class | 762 | 445 |
Total | $ 224,325 | $ 189,744 |
Annual Report
12. Share Transactions.
Transactions for each class of shares were as follows:
| Shares
Years ended October 31, | Dollars
Years ended October 31, |
| 2007 | 2006 | 2007 | 2006 |
Class A | | | | |
Shares sold | 5,675 | 3,952 | $ 234,633 | $ 133,777 |
Reinvestment of distributions | 63 | 5 | 2,271 | 160 |
Shares redeemed | (770) | (183) | (31,203) | (6,217) |
Net increase (decrease) | 4,968 | 3,774 | $ 205,701 | $ 127,720 |
Class T | | | | |
Shares sold | 1,031 | 248 | $ 42,252 | $ 8,469 |
Reinvestment of distributions | 10 | 4 | 371 | 112 |
Shares redeemed | (187) | (36) | (7,614) | (1,223) |
Net increase (decrease) | 854 | 216 | $ 35,009 | $ 7,358 |
Class B | | | | |
Shares sold | 293 | 112 | $ 11,952 | $ 3,875 |
Reinvestment of distributions | 4 | 1 | 136 | 37 |
Shares redeemed | (53) | (14) | (2,096) | (489) |
Net increase (decrease) | 244 | 99 | $ 9,992 | $ 3,423 |
Class C | | | | |
Shares sold | 481 | 130 | $ 19,749 | $ 4,409 |
Reinvestment of distributions | 4 | 1 | 139 | 41 |
Shares redeemed | (55) | (32) | (2,234) | (1,088) |
Net increase (decrease) | 430 | 99 | $ 17,654 | $ 3,362 |
International Discovery | | | | |
Shares sold | 133,089 | 123,095 | $ 5,367,776 | $ 4,201,412 |
Reinvestment of distributions | 7,929 | 7,089 | 289,550 | 215,944 |
Shares redeemed | (63,328) | (39,365) | (2,558,324) | (1,334,783) |
Net increase (decrease) | 77,690 | 90,819 | $ 3,099,002 | $ 3,082,573 |
Institutional Class | | | | |
Shares sold | 538 | 512 | $ 22,351 | $ 17,352 |
Reinvestment of distributions | 19 | 4 | 700 | 121 |
Shares redeemed | (120) | (61) | (5,000) | (2,086) |
Net increase (decrease) | 437 | 455 | $ 18,051 | $ 15,387 |
Annual Report
Report of Independent Registered Public Accounting Firm
To the Trustees of Fidelity Investment Trust and the Shareholders of Fidelity International Discovery Fund:
In our opinion, the accompanying statement of assets and liabilities, including the schedule of investments, and the related statements of operations and of changes in net assets and the financial highlights present fairly, in all material respects, the financial position of Fidelity International Discovery Fund (a fund of Fidelity Investment Trust) at October 31, 2007, the results of its operations for the year then ended, the changes in its net assets for each of the two years in the period then ended and the financial highlights for each of the periods indicated, in conformity with accounting principles generally accepted in the United States of America. These financial statements and financial highlights (hereafter referred to as "financial statements") are the responsibility of the Fidelity International Discovery Fund's management. Our responsibility is to express an opinion on these financial statements based on our audits. We conducted our audits of these financial statements in accordance with the standards of the Public Company Accounting Oversight Board (United States). Those standards require that we plan and perform the audit to obtain reasonable assurance about whether the financial statements are free of material misstatement. An audit includes examining, on a test basis, evidence supporting the amounts and disclosures in the financial statements, assessing the accounting principles used and significant estimates made by management, and evaluating the overall financial statement presentation. We believe that our audits, which included confirmation of securities at October 31, 2007 by correspondence with the custodian and brokers, provide a reasonable basis for our opinion.
/s/ PricewaterhouseCoopers LLP
PricewaterhouseCoopers LLP
Boston, Massachusetts
December 20, 2007
Annual Report
Trustees and Officers
The Trustees, Members of the Advisory Board, and executive officers of the trust, as applicable, are listed below. The Board of Trustees governs the fund and is responsible for protecting the interests of shareholders. The Trustees are experienced executives who meet periodically throughout the year to oversee the fund's activities, review contractual arrangements with companies that provide services to the fund, and review the fund's performance. Except for James C. Curvey, each of the Trustees oversees 370 funds advised by FMR or an affiliate. Mr. Curvey oversees 340 funds advised by FMR or an affiliate.
The Trustees hold office without limit in time except that (a) any Trustee may resign; (b) any Trustee may be removed by written instrument, signed by at least two-thirds of the number of Trustees prior to such removal; (c) any Trustee who requests to be retired or who has become incapacitated by illness or injury may be retired by written instrument signed by a majority of the other Trustees; and (d) any Trustee may be removed at any special meeting of shareholders by a two-thirds vote of the outstanding voting securities of the trust. Each Trustee who is not an interested person (as defined in the 1940 Act) (Independent Trustee), shall retire not later than the last day of the calendar year in which his or her 72nd birthday occurs. The Independent Trustees may waive this mandatory retirement age policy with respect to individual Trustees. The executive officers and Advisory Board Members hold office without limit in time, except that any officer and Advisory Board Member may resign or may be removed by a vote of a majority of the Trustees at any regular meeting or any special meeting of the Trustees. Except as indicated, each individual has held the office shown or other offices in the same company for the past five years.
The fund's Statement of Additional Information (SAI) includes more information about the Trustees. To request a free copy, call Fidelity at 1-877-208-0098.
Interested Trustees*:
Correspondence intended for each Trustee who is an interested person may be sent to Fidelity Investments, 82 Devonshire Street, Boston, Massachusetts 02109.
Name, Age; Principal Occupation |
Edward C. Johnson 3d (77) |
| Year of Election or Appointment: 1984 Mr. Johnson is Chairman of the Board of Trustees. Mr. Johnson serves as President (2006-present), Chief Executive Officer, Chairman, and a Director of FMR LLC; Chairman and a Director of FMR; Chairman and a Director of Fidelity Research & Analysis Company (FRAC); Chairman and a Director of Fidelity Investments Money Management, Inc.; and Chairman (2001-present) and a Director of FMR Co., Inc. In addition, Mr. Johnson serves as Chairman and Director of Fidelity International Limited (FIL). |
James C. Curvey (72) |
| Year of Election or Appointment: 2007 Mr. Curvey also serves as Trustee (2007-present) or Member of the Advisory Board (2007-present) of other investment companies advised by FMR. Mr. Curvey is a Director of FMR and FMR Co., Inc. (2007-
present). Mr. Curvey is also Vice Chairman (2006-present) and Director of FMR LLC. Mr. Curvey joined Fidelity in 1982 and served in numerous senior management positions, including President and Chief Operating Officer of FMR LLC (1997-2000) and President of Fidelity Strategic Investments (2000-2002). In addition, he serves as a member of the Board of Directors of Geerlings & Wade, Inc. (wine distribution). |
* Trustees have been determined to be "Interested Trustees" by virtue of, among other things, their affiliation with the trust or various entities under common control with FMR. FMR Corp. merged with FMR LLC on October 1, 2007. Any references to FMR LLC for prior periods are deemed to be references to the prior entity.
Independent Trustees:
Correspondence intended for each Independent Trustee (that is, the Trustees other than the Interested Trustees) may be sent to Fidelity Investments, P.O. Box 55235, Boston, Massachusetts 02205-5235.
Name, Age; Principal Occupation |
Dennis J. Dirks (59) |
| Year of Election or Appointment: 2005 Prior to his retirement in May 2003, Mr. Dirks was Chief Operating Officer and a member of the Board of The Depository Trust & Clearing Corporation (DTCC) (1999-2003). He also served as President, Chief Operating Officer, and Board member of The Depository Trust Company (DTC) (1999-2003) and President and Board member of the National Securities Clearing Corporation (NSCC) (1999-2003). In addition, Mr. Dirks served as Chief Executive Officer and Board member of the Government Securities Clearing Corporation (2001-2003) and Chief Executive Officer and Board member of the Mortgage-Backed Securities Clearing Corporation (2001-2003). Mr. Dirks also serves as a Trustee and a member of the Finance Committee of Manhattan College (2005-present) and a Trustee and a member of the Finance Committee of AHRC of Nassau County (2006-present). |
Albert R. Gamper, Jr. (65) |
| Year of Election or Appointment: 2006 Prior to his retirement in December 2004, Mr. Gamper served as Chairman of the Board of CIT Group Inc. (commercial finance). During his tenure with CIT Group Inc. Mr. Gamper served in numerous senior management positions, including Chairman (1987-1989; 1999-2001; 2002-2004), Chief Executive Officer (1987-2004), and President (1989-2002). He currently serves as a member of the Board of Directors of Public Service Enterprise Group (utilities, 2001-present), Chairman of the Board of Governors, Rutgers University (2004-present), and Chairman of the Board of Saint Barnabas Health Care System. |
George H. Heilmeier (71) |
| Year of Election or Appointment: 2004 Dr. Heilmeier is Chairman Emeritus of Telcordia Technologies (communication software and systems), where prior to his retirement, he served as company Chairman and Chief Executive Officer. He currently serves on the Boards of Directors of The Mitre Corporation (systems engineering and information technology support for the government), and HRL Laboratories (private research and development, 2004-present). He is Chairman of the General Motors Science & Technology Advisory Board and a Life Fellow of the Institute of Electrical and Electronics Engineers (IEEE). Dr. Heilmeier is a member of the Defense Science Board and the National Security Agency Advisory Board. He is also a member of the National Academy of Engineering, the American Academy of Arts and Sciences, and the Board of Overseers of the School of Engineering and Applied Science of the University of Pennsylvania. Previously, Dr. Heilmeier served as a Director of TRW Inc. (automotive, space, defense, and information technology, 1992-2002), Compaq (1994-2002), Automatic Data Processing, Inc. (ADP) (technology-based business outsourcing, 1995-2002), INET Technologies Inc. (telecommunications network surveillance, 2001-2004), and Teletech Holdings (customer management services). He is the recipient of the 2005 Kyoto Prize in Advanced Technology for his invention of the liquid crystal display, and a member of the Consumer Electronics Hall of Fame. |
James H. Keyes (67) |
| Year of Election or Appointment: 2007 Prior to his retirement in 2003, Mr. Keyes was Chairman, President, and Chief Executive Officer of Johnson Controls, Inc. (automotive supplier, 1993-2003). He currently serves as a member of the boards of LSI Logic Corporation (semiconductor technologies), Navistar International Corporation (manufacture and sale of trucks, buses, and diesel engines, 2002-present), and Pitney Bowes, Inc. (integrated mail, messaging, and document management solutions). |
Marie L. Knowles (61) |
| Year of Election or Appointment: 2001 Prior to Ms. Knowles' retirement in June 2000, she served as Executive Vice President and Chief Financial Officer of Atlantic Richfield Company (ARCO) (diversified energy, 1996-2000). From 1993 to 1996, she was a Senior Vice President of ARCO and President of ARCO Transportation Company. She served as a Director of ARCO from 1996 to 1998. She currently serves as a Director of Phelps Dodge Corporation (copper mining and manufacturing) and McKesson Corporation (healthcare service, 2002-present). Ms. Knowles is a Trustee of the Brookings Institution and the Catalina Island Conservancy and also serves as a member of the Advisory Board for the School of Engineering of the University of Southern California. |
Ned C. Lautenbach (63) |
| Year of Election or Appointment: 2000 Mr. Lautenbach is Chairman of the Independent Trustees (2006-present). Mr. Lautenbach has been a partner of Clayton, Dubilier & Rice, Inc. (private equity investment firm) since September 1998. Previously, Mr. Lautenbach was with the International Business Machines Corporation (IBM) from 1968 until his retirement in 1998. Mr. Lautenbach serves as a Director of Sony Corporation (2006-present) and Eaton Corporation (diversified industrial) as well as the Philharmonic Center for the Arts in Naples, Florida. He also is a member of the Board of Trustees of Fairfield University (2005-present), as well as a member of the Council on Foreign Relations. |
Cornelia M. Small (63) |
| Year of Election or Appointment: 2005 Ms. Small is a member (2000-present) and Chairperson (2002-present) of the Investment Committee, and a member (2002-present) of the Board of Trustees of Smith College. Previously, she served as Chief Investment Officer (1999-2000), Director of Global Equity Investments (1996-1999), and a member of the Board of Directors of Scudder, Stevens & Clark (1990-1997) and Scudder Kemper Investments (1997-1999). In addition, Ms. Small served as Co-Chair (2000-2003) of the Annual Fund for the Fletcher School of Law and Diplomacy. |
William S. Stavropoulos (68) |
| Year of Election or Appointment: 2001 Mr. Stavropoulos is Chairman Emeritus of the Board of Directors of The Dow Chemical Company. Since joining The Dow Chemical Company in 1967, Mr. Stavropoulos served in numerous senior management positions, including President (1993-2000; 2002-2003), CEO (1995-2000; 2002-2004), and Chairman of the Executive Committee (2000-2004). Currently, he is a Director of NCR Corporation (data warehousing and technology solutions), Chemical Financial Corporation, Maersk Inc. (industrial conglomerate, 2002-present), Tyco International, Inc. (multinational manufacturing and services, 2007-present), and a member of the Advisory Board for Metalmark Capital (private equity investment firm, 2005-present). He is a special advisor to Clayton, Dubilier & Rice, Inc., a private equity investment firm. He also serves as a member of the Board of Trustees of the American Enterprise Institute for Public Policy Research. In addition, Mr. Stavropoulos is a member of The Business Council, J.P. Morgan International Council and the University of Notre Dame Advisory Council for the College of Science. |
Kenneth L. Wolfe (68) |
| Year of Election or Appointment: 2005 Prior to his retirement in 2001, Mr. Wolfe was Chairman and Chief Executive Officer of Hershey Foods Corporation (1993-2001). He currently serves as a member of the boards of Adelphia Communications Corporation (2003-present), Bausch & Lomb, Inc., and Revlon Inc. (2004-present). |
Advisory Board Members and Executive Officers**:
Correspondence intended for Mr. Mauriello, Mr. Thomas, and Mr. Wiley may be sent to Fidelity Investments, P.O. Box 55235, Boston, Massachusetts 02205-5235. Correspondence intended for each executive officer and Mr. Lynch may be sent to Fidelity Investments, 82 Devonshire Street, Boston, Massachusetts 02109.
Annual Report
Trustees and Officers - continued
Name, Age; Principal Occupation |
Peter S. Lynch (63) |
| Year of Election or Appointment: 2003 Member of the Advisory Board of Fidelity Investment Trust. Mr. Lynch is Vice Chairman and a Director of FMR, and Vice Chairman (2001-present) and a Director of FMR Co., Inc. Previously, Mr. Lynch served as a Trustee of the Fidelity funds (1990-2003). In addition, he serves as a Trustee of Boston College and as the Chairman of the Inner-City Scholarship Fund. |
Joseph Mauriello (63) |
| Year of Election or Appointment: 2007 Member of the Advisory Board of Fidelity Investment Trust. Prior to his retirement in January 2006, Mr. Mauriello served in numerous senior management positions including Deputy Chairman and Chief Operating Officer (2004-2005), and Vice Chairman of Financial Services (2002-2004) of KPMG LLP US (professional services firm, 1965-2005). Mr. Mauriello currently serves as a member of the Board of Directors of XL Capital Ltd., (global insurance and re-insurance company, 2006-present) and of Arcadia Resources Inc., (health care services and products, 2007-present). He also served as a Director of the Hamilton Funds of the Bank of New York (2006-2007). |
David M. Thomas (58) |
| Year of Election or Appointment: 2007 Member of the Advisory Board of Fidelity Investment Trust. Previously, Mr. Thomas served as Executive Chairman (2005-2006) and Chairman and Chief Executive Officer (2000-2005) of IMS Health, Inc. (pharmaceutical and healthcare information solutions). In addition, Mr. Thomas serves as a member of the Board of Directors of Fortune Brands, Inc. (consumer products holding company), and Interpublic Group of Companies, Inc. (marketing communication, 2004-present). |
Michael E. Wiley (57) |
| Year of Election or Appointment: 2007 Member of the Advisory Board of Fidelity Investment Trust. Mr. Wiley also serves as Sr. Energy Advisor of Katzenbach Partners, LLC (consulting firm, 2006-present) and a member of the Board of Trustees of the University of Tulsa (2000-2006; 2007-present). He serves as a Director of Tesoro Corporation (independent oil refiner and marketer, 2005-present), and a Director of Bill Barrett Corporation (exploration and production company, 2005-present). In addition, he also serves as a Director of Post Oak Bank (privately-held bank, 2004-present), and an Advisory Director of Riverstone Holdings (private investment firm). Previously, Mr. Wiley served as Chairman, President, and CEO of Baker Hughes, Inc. (oilfield services company, 2000-2004), and as Director of Spinnaker Exploration Company (exploration and production company, 2001-2005). |
Kimberley H. Monasterio (43) |
| Year of Election or Appointment: 2007 President and Treasurer of the fund. Ms. Monasterio also serves as President and Treasurer of other Fidelity funds (2007-present) and is an employee of FMR (2004-present). Previously, Ms. Monasterio served as Deputy Treasurer of the Fidelity funds (2004-2006). Before joining Fidelity Investments, Ms. Monasterio served as Treasurer (2000-2004) and Chief Financial Officer (2002-2004) of the Franklin Templeton Funds and Senior Vice President of Franklin Templeton Services, LLC (2000-2004). |
Walter C. Donovan (45) |
| Year of Election or Appointment: 2007 Vice President of the fund. Mr. Donovan also serves as Vice President of Fidelity's Equity Funds (2007-present). Mr. Donovan also serves as Executive Vice President of FMR (2005-present) and FMR Co., Inc. (2005-present). Previously, Mr. Donovan served as Vice President of Fidelity's High Income Funds (2005-2007), Fixed-Income Funds (2005-2006), certain Asset Allocation Funds (2005-2006), certain Balanced Funds (2005-2006), and as Vice President and Director of Fidelity's International Equity Trading group (1998-2005). |
Eric M. Wetlaufer (45) |
| Year of Election or Appointment: 2006 Vice President of the fund. Mr. Wetlaufer also serves as Vice President of certain International Equity Funds (2006-present). Mr. Wetlaufer is Senior Vice President of FMR (2006-present) and FMR Co., Inc. (2006-present), and President and Director of Fidelity Management & Research (U.K.) Inc. (2006-present) and Fidelity Research & Analysis Company (2006-present). Before joining Fidelity Investments in 2005, Mr. Wetlaufer was a partner in Oxhead Capital Management (2004-2005). Previously, Mr. Wetlaufer served as a Chief Investment Officer of Putnam Investments (1997-2003). |
Eric D. Roiter (58) |
| Year of Election or Appointment: 1998 Secretary of the fund. He also serves as Secretary of other Fidelity funds; Vice President, General Counsel, and Secretary of FMR Co., Inc. (2001-present) and FMR; Assistant Secretary of Fidelity Management & Research (U.K.) Inc. (2001-present), Fidelity Research & Analysis Company (2001-present), and Fidelity Investments Money Management, Inc. (2001-present). Mr. Roiter is an Adjunct Member, Faculty of Law, at Boston College Law School (2003-present). Previously, Mr. Roiter served as Vice President and Secretary of Fidelity Distributors Corporation (FDC) (1998-2005). |
Scott C. Goebel (39) |
| Year of Election or Appointment: 2007 Assistant Secretary of the fund. Mr. Goebel also serves as Assistant Secretary of other Fidelity funds (2007-present), and is an employee of FMR. |
R. Stephen Ganis (41) |
| Year of Election or Appointment: 2006 Anti-Money Laundering (AML) officer of the fund. Mr. Ganis also serves as AML officer of other Fidelity funds (2006-present) and FMR LLC (2003-present). Before joining Fidelity Investments, Mr. Ganis practiced law at Goodwin Procter, LLP (2000-2002). |
Joseph B. Hollis (59) |
| Year of Election or Appointment: 2006 Chief Financial Officer of the fund. Mr. Hollis also serves as Chief Financial Officer of other Fidelity funds. Mr. Hollis is President of Fidelity Pricing and Cash Management Services (FPCMS) (2005-present). Mr. Hollis also serves as President and Director of Fidelity Service Company, Inc. (2006-present). Previously, Mr. Hollis served as Senior Vice President of Cash Management Services (1999-2002) and Investment Management Operations (2002-2005). |
Kenneth A. Rathgeber (60) |
| Year of Election or Appointment: 2004 Chief Compliance Officer of the fund. Mr. Rathgeber also serves as Chief Compliance Officer of other Fidelity funds (2004-present) and Executive Vice President of Risk Oversight for Fidelity Investments (2002-present). He is Chief Compliance Officer of FMR (2005-present), FMR Co., Inc. (2005-present), Fidelity Management & Research (U.K.) Inc. (2005-present), Fidelity Research & Analysis Company (2005-present), Fidelity Investments Money Management, Inc. (2005-present), and Strategic Advisers, Inc. (2005-present). Previously, Mr. Rathgeber served as Executive Vice President and Chief Operating Officer for Fidelity Investments Institutional Services Company, Inc. (1998-2002). |
Bryan A. Mehrmann (46) |
| Year of Election or Appointment: 2005 Deputy Treasurer of the fund. Mr. Mehrmann also serves as Deputy Treasurer of other Fidelity funds (2005-present) and is an employee of FMR. Previously, Mr. Mehrmann served as Vice President of Fidelity Investments Institutional Services Group (FIIS)/Fidelity Investments Institutional Operations Corporation, Inc. (FIIOC) Client Services (1998-2004). |
Kenneth B. Robins (38) |
| Year of Election or Appointment: 2005 Deputy Treasurer of the fund. Mr. Robins also serves as Deputy Treasurer of other Fidelity funds (2005-present) and is an employee of FMR (2004-present). Before joining Fidelity Investments, Mr. Robins worked at KPMG LLP, where he was a partner in KPMG's department of professional practice (2002-2004) and a Senior Manager (1999-2000). In addition, Mr. Robins served as Assistant Chief Accountant, United States Securities and Exchange Commission (2000-2002). |
Robert G. Byrnes (40) |
| Year of Election or Appointment: 2005 Assistant Treasurer of the fund. Mr. Byrnes also serves as Assistant Treasurer of other Fidelity funds (2005-present) and is an employee of FMR (2005-present). Previously, Mr. Byrnes served as Vice President of FPCMS (2003-2005). Before joining Fidelity Investments, Mr. Byrnes worked at Deutsche Asset Management where he served as Vice President of the Investment Operations Group (2000-2003). |
Peter L. Lydecker (53) |
| Year of Election or Appointment: 2004 Assistant Treasurer of the fund. Mr. Lydecker also serves as Assistant Treasurer of other Fidelity funds (2004) and is an employee of FMR. |
Paul M. Murphy (60) |
| Year of Election or Appointment: 2007 Assistant Treasurer of the fund. Mr. Murphy also serves as Assistant Treasurer of other Fidelity funds (2007-present) and is an employee of FMR (2007-present). Previously, Mr. Murphy served as Chief Financial Officer of the Fidelity Funds (2005-2006), Vice President and Associate General Counsel of FMR (2007), and Senior Vice President of Fidelity Pricing and Cash Management Services Group (FPCMS) (1994-2007). |
Gary W. Ryan (49) |
| Year of Election or Appointment: 2005 Assistant Treasurer of the fund. Mr. Ryan also serves as Assistant Treasurer of other Fidelity funds (2005-present) and is an employee of FMR (2005-present). Previously, Mr. Ryan served as Vice President of Fund Reporting in FPCMS (1999-2005). |
** FMR Corp. merged with FMR LLC on October 1, 2007. Any references to FMR LLC for prior periods are deemed to be references to the prior entity.
Annual Report
Distributions
The Board of Trustees of International Discovery Fund voted to pay to shareholders of record at the opening of business on record date, the following distributions per share derived from capital gains realized from sales of portfolio securities, and dividends derived from net investment income:
| Pay Date | Record Date | Dividends | Capital Gains |
Institutional Class | 12/10/07 | 12/07/07 | $0.441 | $1.67 |
The fund hereby designates as a capital gain dividend with respect to the taxable year ended October 31, 2007 $495,087,413 or, if subsequently determined to be different, the net capital gain of such year.
Institutional Class designates 67% of the dividend distributed during the fiscal year as amounts which may be taken into account as a dividend for purposes of the maximum rate under section 1(h)(11) of the Internal Revenue Code.
The amounts per share which represent income derived from sources within, and taxes paid to, foreign countries or possessions of the United States are as follows:
| Pay Date | Income | Taxes |
Institutional Class | 12/04/06 | $.378 | $.0278 |
The fund will notify shareholders in January 2008 of amounts for use in preparing 2007 income tax returns.
Annual Report
Board Approval of Investment Advisory Contracts and Management Fees
Fidelity International Discovery Fund
Each year, typically in July, the Board of Trustees, including the Independent Trustees (together, the Board), votes on the renewal of the management contract and sub-advisory agreements (together, the Advisory Contracts) for the fund. The Board, assisted by the advice of fund counsel and Independent Trustees' counsel, requests and considers a broad range of information throughout the year.
The Board meets regularly each month except August and takes into account throughout the year matters bearing on Advisory Contracts. The Board, acting directly and through its separate committees, considers at each of its meetings factors that are relevant to the annual renewal of the fund's Advisory Contracts, including the services and support provided to the fund and its shareholders. At the time of the renewal, the Board had 12 standing committees, each composed of Independent Trustees with varying backgrounds, to which the Board has assigned specific subject matter responsibilities in order to enhance effective decision-making by the Board. Each committee has adopted a written charter outlining the structure and purposes of the committee. One such committee, the Equity Contract Committee, meets periodically as needed throughout the year to consider matters specifically related to the annual renewal of Advisory Contracts. The committee requests and receives information on, and makes recommendations to the Independent Trustees concerning, the approval and annual review of the Advisory Contracts.
At its July 2007 meeting, the Board of Trustees, including the Independent Trustees, unanimously determined to renew the Advisory Contracts for the fund. In reaching its determination, the Board considered all factors it believed relevant, including (i) the nature, extent, and quality of the services to be provided to the fund and its shareholders (including the investment performance of the fund); (ii) the competitiveness of the management fee and total expenses of the fund; (iii) the total costs of the services to be provided by and the profits to be realized by the investment adviser and its affiliates from the relationship with the fund; (iv) the extent to which economies of scale would be realized as the fund grows; and (v) whether fee levels reflect these economies of scale, if any, for the benefit of fund shareholders. The Board also approved amendments to the fund's agreements with foreign sub-advisers to clarify that each sub-adviser provides services as an independent contractor.
In determining whether to renew the Advisory Contracts for the fund, the Board ultimately reached a determination, with the assistance of fund counsel and Independent Trustees' counsel, that the renewal of the Advisory Contracts and the compensation to be received by Fidelity under the management contract is consistent with Fidelity's fiduciary duty under applicable law. In addition to evaluating the specific factors noted above, the Board, in reaching its determination, is aware that shareholders in the fund have a broad range of investment choices available to them, including a wide choice among mutual funds offered by competitors to Fidelity, and that the fund's shareholders, with the opportunity to review and weigh the disclosure provided by the fund in its prospectus and other public disclosures, have chosen to invest in this fund, managed by Fidelity.
Annual Report
Nature, Extent, and Quality of Services Provided. The Board considered staffing within the investment adviser, FMR, and the sub-advisers (together, the Investment Advisers), including the background of the fund's portfolio manager and the fund's investment objective and discipline. The Independent Trustees also had discussions with senior management of Fidelity's investment operations and investment groups. The Board considered the structure of the portfolio manager compensation program and whether this structure provides appropriate incentives.
Resources Dedicated to Investment Management and Support Services. The Board reviewed the size, education, and experience of the Investment Advisers' investment staff, their use of technology, and the Investment Advisers' approach to recruiting, training, and retaining portfolio managers and other research, advisory, and management personnel. The Board considered Fidelity's extensive global research capabilities that enable the Investment Advisers to aggregate data from various sources in an effort to produce positive investment results. The Board noted that Fidelity's analysts have access to a variety of technological tools that enable them to perform both fundamental and quantitative analysis and to specialize in various disciplines. The Board also considered that Fidelity's portfolio managers and analysts have access to daily portfolio attribution that allows for monitoring of a fund's portfolio, as well as an electronic communication system that provides immediate real-time access to research concerning issuers and credit enhancers.
Shareholder and Administrative Services. The Board considered (i) the nature, extent, quality, and cost of advisory, administrative, distribution, and shareholder services performed by the Investment Advisers and their affiliates under the Advisory Contracts and under separate agreements covering transfer agency, pricing and bookkeeping, and securities lending services for the fund; (ii) the nature and extent of the Investment Advisers' supervision of third party service providers, principally custodians and subcustodians; and (iii) the resources devoted to, and the record of compliance with, the fund's compliance policies and procedures. The Board reviewed the allocation of fund brokerage, including allocations to brokers affiliated with the Investment Advisers, the use of brokerage commissions to pay fund expenses, and the use of "soft" commission dollars to pay for research services. The Board also considered that Fidelity voluntarily pays for market data out of its own resources. The Board also considered the agreement reached between the Independent Trustees and Fidelity in December 2006 following an independent review of matters relating to receipt of travel, entertainment, gifts and gratuities in violation of Fidelity policies.
Annual Report
Board Approval of Investment Advisory Contracts and
Management Fees - continued
The Board noted that the growth of fund assets across the complex allows Fidelity to reinvest in the development of services designed to enhance the value or convenience of the Fidelity funds as investment vehicles. These services include 24-hour access to account information and market information through phone representatives and over the Internet, and investor education materials and asset allocation tools.
Investment in a Large Fund Family. The Board considered the benefits to shareholders of investing in a Fidelity fund, including the benefits of investing in a fund that is part of a large family of funds offering a variety of investment disciplines and providing for a large variety of mutual fund investor services. For example, fund shareholders are offered the privilege of exchanging shares of the fund for shares of other Fidelity funds, as set forth in the fund's prospectus, without paying a sales charge. The Board noted that, since the last Advisory Contract renewals in July 2006, Fidelity has taken a number of actions that benefited particular funds, including (i) dedicating additional resources to investment research and to restructure the investment research teams; (ii) contractually agreeing to reduce the management fee on Fidelity Advisor Floating Rate High Income Fund; (iii) contractually agreeing to reduce the management fees on Fidelity's California, Massachusetts, New Jersey, and New York AMT Tax-Free Money Market Funds, launching new Institutional Classes and Service Classes of these funds, and contractually agreeing to impose expense limitations on these funds; (iv) eliminating the exchange fee on the Fidelity Select Portfolios and reducing the pricing and bookkeeping fee rates for these funds; (v) reducing the maximum transfer agency fee rates on high income funds and certain equity funds; (vi) proposing amended management contracts that, if approved by shareholders, will add a performance adjustment component to the management fees paid by 18 Fidelity Advisor equity funds; (vii) contractually agreeing to reduce fees for Ultra-Short Central Fund and the money market Central Funds; (viii) waiving the Fidelity Advisor funds' contingent deferred sales charge on certain redemptions made through systematic withdrawal programs; and (ix) amending the management contracts for equity and fixed-income funds whose management contracts incorporate a "group fee" structure by adding four new fee "breakpoints" to the group fee rate schedules.
Investment Performance and Compliance. The Board considered whether the fund has operated within its investment objective, as well as its record of compliance with its investment restrictions. It also reviewed the fund's absolute investment performance for each class, as well as the fund's relative investment performance for each class measured against (i) a broad-based securities market index, and (ii) a peer group of mutual funds deemed appropriate by the Board over multiple periods. The following charts considered by the Board show, over the one-, three-, and five-year periods ended December 31, 2006, as available, the cumulative total returns of Fidelity International Discovery (retail class) and Class C of the fund, the cumulative total returns of a broad-based securities market index ("benchmark"), and a range of cumulative total returns of a peer group of mutual funds identified by Morningstar, Inc. as having an investment style similar to that of the fund based on underlying portfolio holdings. The returns of Fidelity International Discovery (retail class) and Class C show the performance of the highest and lowest performing classes, respectively. The box within each chart shows the 25th percentile return (bottom of box) and the 75th percentile return (top of box) of the peer group. Returns shown above the box are in the first quartile and returns shown below the box are in the fourth quartile. The percentage beaten numbers noted below each chart correspond to the percentile box and represent the percentage of funds in the peer group whose performance was equal to or lower than that of the class indicated.
Annual Report
Fidelity International Discovery Fund

The Board reviewed the fund's relative investment performance against its peer group and stated that the performance of Fidelity International Discovery (retail class) was in the third quartile for the one-year period and the first quartile for the three- and five-year periods. The Board also stated that the investment performance of Fidelity International Discovery (retail class) compared favorably to its benchmark for the three- and five-year periods, although the fund's one-year cumulative total return was lower than its benchmark. The Board considered that the variations in performance among the fund's classes reflect the variations in class expenses, which result in lower performance for higher expense classes.
The Board also considered that the fund's management fee is subject to upward or downward adjustment depending upon whether, and to what extent, the fund's investment performance for the performance period exceeds, or is exceeded by, the record (over the same period) of a Board-approved performance adjustment index. The Board realizes that the performance adjustment provides FMR with a strong economic incentive to seek to achieve superior performance for the fund's shareholders and helps to more closely align the interests of FMR and the fund's shareholders.
Annual Report
Board Approval of Investment Advisory Contracts and
Management Fees - continued
The Board considered that FMR has taken steps to refocus and strengthen equity research, equity portfolio management, and compliance.
Based on its review, and giving particular weight to the nature and quality of the resources dedicated by the Investment Advisers to maintain and improve relative performance, the Board concluded that the nature, extent, and quality of the services provided to the fund will benefit the fund's shareholders, particularly in light of the Board's view that the fund's shareholders benefit from investing in a fund that is part of a large family of funds offering a variety of investment disciplines and services.
Competitiveness of Management Fee and Total Fund Expenses. The Board considered the fund's management fee and total expenses compared to "mapped groups" of competitive funds and classes. Fidelity creates "mapped groups" by combining similar Lipper investment objective categories that have comparable management fee characteristics. Combining Lipper investment objective categories aids the Board's management fee and total expense comparisons by broadening the competitive group used for comparison and by reducing the number of universes to which various Fidelity funds are compared. The Board also considered supplemental information about how the fund's management fee and total expenses ranked relative to groups based on Lipper classifications, which take into account a fund's market capitalization and style.
The Board considered two proprietary management fee comparisons for the 12-month periods shown in the chart below. The group of Lipper funds used by the Board for management fee comparisons is referred to below as the "Total Mapped Group." The Total Mapped Group comparison focuses on a fund's standing relative to the total universe of comparable funds available to investors, in terms of gross management fees before expense reimbursements or caps, and without giving effect to the fund's performance adjustment. "TMG %" represents the percentage of funds in the Total Mapped Group that had management fees that were lower than the fund's. For example, a TMG % of 13% means that 87% of the funds in the Total Mapped Group had higher management fees than the fund. The "Asset-Size Peer Group" (ASPG) comparison focuses on a fund's standing relative to non-Fidelity funds similar in size to the fund within the Total Mapped Group. The ASPG represents at least 15% of the funds in the Total Mapped Group with comparable asset size and management fee characteristics, subject to a minimum of 50 funds (or all funds in the Total Mapped Group if fewer than 50). Additional information, such as the ASPG quartile in which the fund's management fee ranked and the impact of the fund's performance adjustment, is also included in the chart and considered by the Board.
Annual Report
Fidelity International Discovery Fund

The Board noted that the fund's management fee ranked below the median of its Total Mapped Group and below the median of its ASPG for 2006. The Board also noted the effect of the fund's positive performance adjustment on the fund's management fee ranking. The Board noted that the performance adjustment for each year represents calculations for performance periods that differ from the periods shown in the performance charts above.
Based on its review, the Board concluded that the fund's management fee was fair and reasonable in light of the services that the fund receives and the other factors considered.
In its review of each class's total expenses, the Board considered the fund's management fee as well as other fund or class expenses, as applicable, such as transfer agent fees, pricing and bookkeeping fees, fund-paid 12b-1 fees, and custodial, legal, and audit fees. The Board also noted the effects of any waivers and reimbursements on fees and expenses, as well as the fund's positive performance adjustment. As part of its review, the Board also considered current and historical total expenses of each class of the fund compared to competitive fund median expenses. Each class of the fund is compared to those funds and classes in the Total Mapped Group (used by the Board for management fee comparisons) that have a similar sales load structure.
The Board noted that the total expenses of each of Class A, Class C, Institutional Class and Fidelity International Discovery (retail class) ranked below its competitive median for 2006, the total expenses of Class B ranked equal to its competitive median for 2006, and the total expenses of Class T ranked above its competitive median for 2006. The Board noted that the fund offers multiple classes, each of which has a different sales load and 12b-1 fee structure, and that the multiple structures are intended to offer a range of pricing options for the intermediary market. The Board also noted that the total expenses of the classes vary primarily by the level of their 12b-1 fees, although differences in transfer agent fees may also cause expenses to vary from class to class.
Annual Report
Board Approval of Investment Advisory Contracts and
Management Fees - continued
In its review of total expenses, the Board also considered Fidelity fee structures and other information on clients that FMR and its affiliates service in other competitive markets, such as other mutual funds advised or subadvised by FMR or its affiliates, pension plan clients, and other institutional clients.
Based on its review, the Board concluded that the total expenses of each class of the fund were reasonable, although in one case above the median of the universe presented for comparison, in light of the services that the fund and its shareholders receive and the other factors considered.
Costs of the Services and Profitability. The Board considered the revenues earned and the expenses incurred by Fidelity in conducting the business of developing, marketing, distributing, managing, administering and servicing the fund and its shareholders. The Board also considered the level of Fidelity's profits in respect of all the Fidelity funds.
On an annual basis, FMR presents to the Board Fidelity's profitability for the fund. Fidelity calculates the profitability for each fund, as well as aggregate profitability for groups of Fidelity funds and all Fidelity funds, using a series of detailed revenue and cost allocation methodologies which originate with the audited books and records of Fidelity. The Audit Committee of the Board reviews any significant changes from the prior year's methodologies.
PricewaterhouseCoopers LLP (PwC), independent registered public accounting firm and auditor to Fidelity and certain Fidelity funds, has been engaged annually by the Board as part of the Board's assessment of the results of Fidelity's profitability analysis. PwC's engagement includes the review and assessment of Fidelity's methodologies used in determining the revenues and expenses attributable to Fidelity's mutual fund business, and completion of agreed-upon procedures surrounding the mathematical accuracy of fund profitability and its conformity to allocation methodologies. After considering PwC's reports issued under the engagement and information provided by Fidelity, the Board believes that while other allocation methods may also be reasonable, Fidelity's profitability methodologies are reasonable in all material respects.
The Board has also reviewed Fidelity's non-fund businesses and any fall-out benefits related to the mutual fund business as well as cases where Fidelity's affiliates may benefit from or be related to the fund's business.
The Board considered the costs of the services provided by and the profits realized by Fidelity in connection with the operation of the fund and determined that the amount of profit is a fair entrepreneurial profit for the management of the fund.
Annual Report
Economies of Scale. The Board considered whether there have been economies of scale in respect of the management of the Fidelity funds, whether the Fidelity funds (including the fund) have appropriately benefited from any such economies of scale, and whether there is potential for realization of any further economies of scale. The Board considered the extent to which the fund will benefit from economies of scale through increased services to the fund, through waivers or reimbursements, or through fee or expense reductions, including reductions that occur through operation of the transfer agent agreement. The transfer agent fee varies in part based on the number of accounts in the fund. If the number of accounts decreases or the average account size increases, the overall transfer agent fee rate decreases.
The Board recognized that the fund's management contract incorporates a "group fee" structure, which provides for lower group fee rates as total fund assets under FMR's management increase, and for higher group fee rates as total fund assets under FMR's management decrease. FMR determines the group fee rates based on a tiered asset "breakpoint" schedule. In connection with the renewal of the fund's management contract, the Board approved amendments to the fund's management contract that added four new fee breakpoints to the group fee rate schedule for assets under FMR's management above $1,386 billion. The Board considered that the group fee rate declines under both the present and amended schedules, but that under the amended schedule, the group fee rate declines faster as assets under FMR's management exceed $1,386 billion. The Board considered that the group fee is designed to deliver the benefits of economies of scale to fund shareholders when total fund assets increase, even if assets of any particular fund are unchanged or have declined, because some portion of Fidelity's costs are attributable to services provided to all Fidelity funds, and all funds benefit if those costs can be allocated among more assets. The Board concluded that, given the group fee structure, fund shareholders will achieve a certain level of economies of scale as assets under FMR's management increase at the fund complex level, regardless of whether Fidelity achieves any such economies of scale.
The Board further concluded that any potential economies of scale are being shared between fund shareholders and Fidelity in an appropriate manner.
Additional Information Requested by the Board. In order to develop fully the factual basis for consideration of the Fidelity funds' Advisory Contracts, the Board requested and received additional information on several topics, including (i) fund performance trends and actions to be taken by FMR to improve certain funds' overall performance; (ii) Fidelity's portfolio manager compensation structure, including its effects on fund profitability and the extent to which portfolio manager compensation is linked to fund performance; (iii) Fidelity's fee structures; (iv) the funds' sub-advisory arrangements; and (v) accounts managed by Fidelity other than the Fidelity funds.
Annual Report
Board Approval of Investment Advisory Contracts and
Management Fees - continued
Based on its evaluation of all of the conclusions noted above, and after considering all material factors, the Board ultimately concluded that the advisory fee structures are fair and reasonable, and that the fund's Advisory Contracts should be renewed.
Annual Report
Annual Report
Annual Report
Annual Report
Annual Report
Annual Report
Annual Report
Annual Report
Investment Adviser
Fidelity Management & Research Company
Boston, MA
Investment Sub-Advisers
FMR Co., Inc.
Fidelity Management & Research
(U.K.) Inc.
Fidelity Research & Analysis Company
Fidelity International
Investment Advisors
Fidelity Investments Japan Limited
Fidelity International Investment Advisors (U.K.) Limited
General Distributor
Fidelity Distributors Corporation
Boston, MA
Transfer and Service Agents
Fidelity Investments Institutional Operations Company, Inc.
Boston, MA
Fidelity Service Company, Inc.
Boston, MA
Custodian
The Northern Trust Company
Chicago, IL
AIDI-UANN-1207
1.806657.102
(Fidelity Investment logo)(registered trademark)
Corporate Headquarters
82 Devonshire St., Boston, MA 02109
www.fidelity.com
Fidelity®
International Small Cap
Fund
Annual Report
October 31, 2007
(2_fidelity_logos) (Registered_Trademark)
Contents
Chairman's Message | <Click Here> | Ned Johnson's message to shareholders. |
Performance | <Click Here> | How the fund has done over time. |
Management's Discussion | <Click Here> | The managers' review of fund performance, strategy and outlook. |
Shareholder Expense Example | <Click Here> | An example of shareholder expenses. |
Investment Changes | <Click Here> | A summary of major shifts in the fund's investments over the past six months. |
Investments | <Click Here> | A complete list of the fund's investments with their market values. |
Financial Statements | <Click Here> | Statements of assets and liabilities, operations, and changes in net assets,
as well as financial highlights. |
Notes | <Click Here> | Notes to the financial statements. |
Report of Independent Registered Public Accounting Firm | <Click Here> | |
Trustees and Officers | <Click Here> | |
Distributions | <Click Here> | |
Board Approval of Investment Advisory Contracts and Management Fees | <Click Here> | |
To view a fund's proxy voting guidelines and proxy voting record for the 12-month period ended June 30, visit http://www.fidelity.com (search for "proxy voting guidelines") or visit the Securities and Exchange Commission's (SEC) web site at http://www.sec.gov. You may also call 1-800-544-8544 to request a free copy of the proxy voting guidelines.
Standard & Poor's, S&P and S&P 500 are registered service marks of The McGraw-Hill Companies, Inc. and have been licensed for use by Fidelity Distributors Corporation.
Other third party marks appearing herein are the property of their respective owners.
All other marks appearing herein are registered or unregistered trademarks or service marks of FMR LLC or an affiliated company.
Annual Report
This report and the financial statements contained herein are submitted for the general information of the shareholders of the fund. This report is not authorized for distribution to prospective investors in the fund unless preceded or accompanied by an effective prospectus.
A fund files its complete schedule of portfolio holdings with the SEC for the first and third quarters of each fiscal year on Form N-Q. Forms N-Q are available on the SEC's web site at http://www.sec.gov. A fund's Forms N-Q may be reviewed and copied at the SEC's Public Reference Room in Washington, DC. Information regarding the operation of the SEC's Public Reference Room may be obtained by calling 1-800-SEC-0330. For a complete list of a fund's portfolio holdings, view the most recent holdings listing, semiannual report, or annual report on Fidelity's web site at http://www.fidelity.com or http://www.advisor.fidelity.com, as applicable.
NOT FDIC INSURED · MAY LOSE VALUE · NO BANK GUARANTEE
Neither the fund nor Fidelity Distributors Corporation is a bank.
Annual Report
Chairman's Message
(photo_of_Edward_C_Johnson_3d)
Dear Shareholder:
Many stock and bond markets around the world have been unsettled of late; however, volatility can often lead to opportunity for patient investors. Financial markets are always unpredictable, but there are a number of time-tested principles that can put the historical odds in your favor.
One of the basic tenets is to invest for the long term. Over time, riding out the markets' inevitable ups and downs has proven much more effective than selling into panic or chasing the hottest trend. Even missing only a few of the markets' best days can significantly diminish investor returns. Patience also affords the benefits of compounding - of earning interest on additional income or reinvested dividends and capital gains. There are tax advantages and cost benefits to consider as well. The more you sell, the more taxes you pay, and the more you trade, the higher the costs. While staying the course doesn't eliminate risk, it can considerably lessen the effect of short-term declines.
You can further manage your investing risk through diversification. And today, more than ever, geographic diversification should be taken into account. Studies indicate that asset allocation is the single most important determinant of a portfolio's long-term success. The right mix of stocks, bonds and cash - aligned to your particular risk tolerance and investment objective - is very important. Age-appropriate rebalancing is also an essential aspect of asset allocation. For younger investors, an emphasis on equities - which historically have been the best-performing asset class over time - is encouraged. As investors near their specific goal, such as retirement or sending a child to college, consideration may be given to replacing volatile assets (e.g. common stocks) with more-stable fixed investments (bonds or savings plans).
A third investment principle - investing regularly - can help lower the average cost of your purchases. Investing a certain amount of money each month or quarter helps ensure you won't pay for all your shares at market highs. This strategy - known as dollar cost averaging - also reduces unconstructive "emotion" from investing, helping shareholders avoid selling weak performers just prior to an upswing, or chasing a hot performer just before a correction.
We invite you to contact us via the Internet, through our Investor Centers or over the phone. It is our privilege to provide you the information you need to make the investments that are right for you.
Sincerely,
/s/Edward C. Johnson 3d
Edward C. Johnson 3d
Annual Report
Performance: The Bottom Line
Average annual total return reflects the change in the value of an investment, assuming reinvestment of the class' dividend income and capital gains (the profits earned upon the sale of securities that have grown in value) and assuming a constant rate of performance each year. The $10,000 table and the fund's returns do not reflect the deduction of taxes that a shareholder would pay on fund distributions or the redemption of fund shares. During periods of reimbursement by Fidelity, a fund's total return will be greater than it would be had the reimbursement not occurred. How a fund did yesterday is no guarantee of how it will do tomorrow.
Average Annual Total Returns
Periods ended October 31, 2007 | Past 1
year | Past 5
years | Life of
fund A |
International Small Cap | 33.82% | 36.04% | 34.71% |
A From September 18, 2002.
$10,000 Over Life of Fund
Let's say hypothetically that $10,000 was invested in International Small Cap, a class of the fund, on September 18, 2002, when the fund started. The chart shows how the value of your investment would have changed, and also shows how the MSCI® EAFE® Small Cap Index performed over the same period.
Annual Report
Management's Discussion of Fund Performance
Comments from Ben Paton, Tokuya Sano and Wilson Wong, Co-Portfolio Managers of Fidelity® International Small Cap Fund
Foreign stocks, with a large assist from a weak U.S. dollar, generally had higher returns for U.S. investors than domestic equities during the year ending October 31, 2007. The backdrop for global stocks was solid, with robust economic growth and relatively high corporate profitability worldwide. Developed international equity markets, as measured by the Morgan Stanley Capital InternationalSM Europe, Australasia, and Far East (MSCI® EAFE®) Index - a proxy for established markets outside the United States and Canada - rose 25.09%. In comparison, the Standard & Poor's 500SM Index, a gauge of U.S. stocks, was up 14.56%. Among countries making up at least 1% of the EAFE benchmark, Finland had the best showing, soaring nearly 69%, while Hong Kong gained roughly 66%. The United Kingdom and Japan, the two largest components of the index, both underperformed. Fallout from the credit crunch and concerns about export growth tempered UK stocks, while Japan struggled with a slowdown in consumer spending and sluggish domestic growth. Emerging markets were the period's big winners, advancing 68.33% as measured by the MSCI Emerging Markets index.
During the past year, International Small Cap returned 33.82%, versus 22.17% for the MSCI EAFE Small Cap index. Stock selection in materials, industrials, energy and consumer staples aided performance, as did overweighting utilities. Geographically, our picks in Australia, Canada, China and Norway helped. Both the Asia Pacific ex Japan and Europe/Africa/Middle East subportfolios handily beat their respective benchmarks; the Japanese subportfolio had roughly in-line results. South Africa-based, Australia-listed Sylvania Resources, which reprocesses chrome tailings, contributed, along with Stepstone, a Norwegian online employment company; Cosco Corporation, a Singapore-listed Chinese ship-builder; Bradken, Australia's leading supplier of consumable mining and rail industry products; and Japan's Hitachi Construction Machinery and ferro-alloy producer Nippon Denko. Conversely, stock picking in information technology and consumer discretionary detracted. Geographically, our choices in Italy and Japan hurt. The fund's biggest detractor was Banca Italease. Japanese stocks Hikari Tsushin and NOK - the latter of which we sold - hurt as well, along with an index component we didn't own, Orient Resources Group, a Hong Kong-based real estate developer incorporated in Bermuda. Most stocks we've mentioned were out-of-index holdings.
The views expressed above reflect those of the portfolio manager(s) only through the end of the period as stated on the cover of this report and do not necessarily represent the views of Fidelity or any other person in the Fidelity organization. Any such views are subject to change at any time based upon market or other conditions and Fidelity disclaims any responsibility to update such views. These views may not be relied on as investment advice and, because investment decisions for a Fidelity fund are based on numerous factors, may not be relied on as an indication of trading intent on behalf of any Fidelity fund.
Annual Report
Shareholder Expense Example
As a shareholder of the Fund, you incur two types of costs: (1) transaction costs, including sales charges (loads) on purchase payments or redemption proceeds, redemption fees, and (2) ongoing costs, including management fees, distribution and/or service (12b-1) fees and other Fund expenses. This Example is intended to help you understand your ongoing costs (in dollars) of investing in the Fund and to compare these costs with the ongoing costs of investing in other mutual funds.
The Example is based on an investment of $1,000 invested at the beginning of the period and held for the entire period (May 1, 2007 to October 31, 2007).
Actual Expenses
The first line of the accompanying table for each class of the Fund provides information about actual account values and actual expenses. You may use the information in this line, together with the amount you invested, to estimate the expenses that you paid over the period. Simply divide your account value by $1,000.00 (for example, an $8,600 account value divided by $1,000.00 = 8.6), then multiply the result by the number in the first line for a class of the Fund under the heading entitled "Expenses Paid During Period" to estimate the expenses you paid on your account during this period. A small balance maintenance fee of $12.00 that is charged once a year may apply for certain accounts with a value of less than $2,000. This fee is not included in the table below. If it was, the estimate of expenses you paid during the period would be higher, and your ending account value lower, by this amount. In addition, the Fund, as a shareholder in the underlying Fidelity Central Funds, will indirectly bear its pro rata share of the fees and expenses incurred by the underlying Fidelity Central Funds. These fees and expenses are not included in the Fund's annualized expense ratio used to calculate the expense estimate in the table below.
Hypothetical Example for Comparison Purposes
The second line of the accompanying table for each class of the Fund provides information about hypothetical account values and hypothetical expenses based on a Class' actual expense ratio and an assumed rate of return of 5% per year before expenses, which is not the Class' actual return. The hypothetical account values and expenses may not be used to estimate the actual ending account balance or expenses you paid for the period. You may use this information to compare the ongoing costs of investing in the Fund and other funds. To do so, compare this 5% hypothetical example with the 5% hypothetical examples that appear in the shareholder reports of the other funds. A small balance maintenance fee of $12.00 that is charged once a year may apply for certain accounts with a value of less than $2,000. This fee is not included in the table below. If it was, the estimate of expenses you paid during the period would be higher, and your ending account value lower, by this amount. In addition, the Fund, as a shareholder in the underlying Fidelity Central Funds, will indirectly bear its pro rata share of the fees and expenses incurred by the underlying Fidelity Central Funds. These fees and expenses are not included in the Fund's annualized expense ratio used to calculate the expense estimate in the table below.
Annual Report
Shareholder Expense Example - continued
Please note that the expenses shown in the table are meant to highlight your ongoing costs only and do not reflect any transaction costs. Therefore, the second line of the table is useful in comparing ongoing costs only, and will not help you determine the relative total costs of owning different funds. In addition, if these transactional costs were included, your costs would have been higher.
| Beginning
Account Value
May 1, 2007 | Ending
Account Value
October 31, 2007 | Expenses Paid
During Period*
May 1, 2007 to
October 31, 2007 |
Class A | | | |
Actual | $ 1,000.00 | $ 1,135.30 | $ 8.88 |
HypotheticalA | $ 1,000.00 | $ 1,016.89 | $ 8.39 |
Class T | | | |
Actual | $ 1,000.00 | $ 1,133.20 | $ 10.22 |
HypotheticalA | $ 1,000.00 | $ 1,015.63 | $ 9.65 |
Class B | | | |
Actual | $ 1,000.00 | $ 1,130.50 | $ 12.89 |
HypotheticalA | $ 1,000.00 | $ 1,013.11 | $ 12.18 |
Class C | | | |
Actual | $ 1,000.00 | $ 1,130.70 | $ 12.89 |
HypotheticalA | $ 1,000.00 | $ 1,013.11 | $ 12.18 |
International Small Cap | | | |
Actual | $ 1,000.00 | $ 1,136.70 | $ 7.22 |
HypotheticalA | $ 1,000.00 | $ 1,018.45 | $ 6.82 |
Institutional Class | | | |
Actual | $ 1,000.00 | $ 1,137.00 | $ 7.22 |
HypotheticalA | $ 1,000.00 | $ 1,018.45 | $ 6.82 |
A 5% return per year before expenses
* Expenses are equal to each Class' annualized expense ratio (shown in the table below); multiplied by the average account value over the period, multiplied by 184/365 (to reflect the one-half year period).
| Annualized
Expense Ratio |
Class A | 1.65% |
Class T | 1.90% |
Class B | 2.40% |
Class C | 2.40% |
International Small Cap | 1.34% |
Institutional Class | 1.34% |
Annual Report
Investment Changes
Geographic Diversification (% of fund's net assets) |
As of October 31, 2007 |
 | Japan 27.2% | |
 | United Kingdom 15.0% | |
 | Australia 13.1% | |
 | United States of America 6.2% | |
 | Canada 4.5% | |
 | France 3.9% | |
 | Germany 2.9% | |
 | Italy 2.9% | |
 | Norway 2.2% | |
 | Other 22.1% | |

Percentages are adjusted for the effect of futures contracts, if applicable. |
|
As of April 30, 2007 |
| Japan 26.8% | |
| United Kingdom 16.8% | |
| Australia 13.2% | |
| Italy 5.3% | |
| United States of America 5.3% | |
| Germany 3.4% | |
| France 3.2% | |
| Canada 3.2% | |
| South Africa 2.8% | |
| Other 20.0% | |

Percentages are adjusted for the effect of futures contracts, if applicable. |
Asset Allocation |
| % of fund's
net assets | % of fund's net assets
6 months ago |
Stocks | 95.8 | 96.6 |
Bonds | 0.3 | 0.2 |
Short-Term Investments and Net Other Assets | 3.9 | 3.2 |
Top Ten Stocks as of October 31, 2007 |
| % of fund's
net assets | % of fund's net assets
6 months ago |
Stepstone ASA (Norway, Commercial
Services & Supplies) | 1.6 | 1.1 |
Phorm, Inc. (United States of America, Media) | 1.6 | 0.0 |
Sylvania Resources Ltd. (Australia,
Metals & Mining) | 1.4 | 0.6 |
Max Petroleum PLC (United Kingdom,
Oil, Gas & Consumable Fuels) | 1.3 | 2.0 |
Oilexco, Inc. (Canada, Oil, Gas & Consumable Fuels) | 1.3 | 0.6 |
Sarantis SA (Reg.) (Greece, Personal Products) | 1.2 | 0.7 |
Nissin Kogyo Co. Ltd. (Japan, Auto Components) | 1.1 | 1.1 |
E.ON AG (Germany, Electric Utilities) | 1.0 | 0.8 |
Stanley Electric Co. Ltd. (Japan, Auto Components) | 1.0 | 0.4 |
Nippon Seiki Co. Ltd. (Japan, Auto Components) | 1.0 | 0.8 |
| 12.5 | |
Market Sectors as of October 31, 2007 |
| % of fund's
net assets | % of fund's net assets
6 months ago |
Industrials | 22.5 | 20.0 |
Materials | 18.0 | 15.0 |
Consumer Discretionary | 15.9 | 17.1 |
Information Technology | 8.9 | 8.4 |
Energy | 8.6 | 9.0 |
Financials | 8.7 | 13.4 |
Health Care | 4.6 | 4.3 |
Utilities | 4.4 | 5.2 |
Consumer Staples | 4.0 | 3.7 |
Telecommunication Services | 0.5 | 0.7 |
Annual Report
Investments October 31, 2007
Showing Percentage of Net Assets
Common Stocks - 95.8% |
| Shares | | Value
(000s) |
Australia - 13.1% |
Allied Gold Ltd. (a) | 15,017,696 | | $ 12,802 |
Allied Gold Ltd. (UK) (a) | 461,700 | | 410 |
Ausenco Ltd. | 716,966 | | 10,123 |
Australian Wealth Management Ltd. (e) | 1,555,487 | | 4,023 |
Bradken Ltd. | 724,595 | | 10,008 |
Capital-XX Ltd. (a) | 2,262,572 | | 3,105 |
Centamin Egypt Ltd. (a) | 3,589,755 | | 4,870 |
Centennial Coal Co. Ltd. (e) | 592,395 | | 2,389 |
Crane Group Ltd. | 92,339 | | 1,455 |
David Jones Ltd. | 432,290 | | 2,002 |
Downer EDI Ltd. | 256,593 | | 1,600 |
DUET Group | 623,838 | | 2,044 |
Dwyka Resources Ltd. (a) | 5,235,220 | | 4,680 |
European Gas Ltd. (a) | 2,137,690 | | 1,750 |
Gunns Ltd. | 502,803 | | 1,772 |
Hastie Group Ltd. | 749,674 | | 3,232 |
IBT Education Ltd. | 490,152 | | 1,188 |
Incitec Pivot Ltd. (e) | 103,561 | | 8,601 |
International Ferro Metals (a) | 1,666,176 | | 4,070 |
Iress Market Technology Ltd. | 194,246 | | 1,502 |
JB Hi-Fi Ltd. | 709,791 | | 10,931 |
Jubilee Mines NL | 264,180 | | 5,887 |
Kingsgate Consolidated NL | 242,615 | | 1,217 |
MacArthur Coal Ltd. (e) | 482,429 | | 4,106 |
Macmahon Holdings Ltd. | 2,833,056 | | 4,585 |
Meo Australia Ltd. (a) | 9,450,100 | | 10,724 |
Monto Minerals Ltd. (a) | 8,325,252 | | 1,688 |
Monto Minerals Ltd. warrants 5/25/09 (a) | 1,485,934 | | 39 |
Mortgage Choice Ltd. | 2,022,538 | | 4,658 |
Mount Gibson Iron Ltd. (a) | 5,473,584 | | 15,475 |
Nomad Building Solutions Ltd. | 755,846 | | 2,313 |
Oakton Ltd. | 122,815 | | 682 |
Perilya Mines Ltd. | 554,900 | | 2,052 |
Phosphagenics Ltd. (a) | 9,040,000 | | 2,123 |
Reverse Corp. Ltd. | 446,400 | | 1,934 |
Roc Oil Co. Ltd. (United Kingdom) (a) | 2,864,489 | | 8,754 |
Seek Ltd. | 1,321,589 | | 11,566 |
Silex Systems Ltd. | 200,000 | | 1,457 |
Sims Group Ltd. | 28,822 | | 761 |
SMS Management & Technology Ltd. | 134,800 | | 907 |
Sylvania Resources Ltd. (a)(f) | 9,009,881 | | 25,111 |
Sylvania Resources Ltd. (United Kingdom) (a)(f) | 4,910,360 | | 13,425 |
Common Stocks - continued |
| Shares | | Value
(000s) |
Australia - continued |
Tanami Gold NL (a) | 26,452,484 | | $ 2,887 |
Tassal Group Ltd. | 1,148,600 | | 4,074 |
United Group Ltd. | 353,321 | | 7,072 |
WorleyParsons Ltd. | 102,033 | | 4,612 |
Wotif.com Holdings Ltd. | 636,700 | | 3,582 |
TOTAL AUSTRALIA | | 234,248 |
Bermuda - 1.8% |
African Minerals Ltd. (a) | 575,020 | | 1,979 |
Oriental Watch Holdings Ltd. | 4,082,000 | | 1,589 |
Pacific Basin Shipping Ltd. | 4,044,000 | | 9,060 |
Peace Mark Holdings Ltd. | 814,000 | | 1,341 |
Petra Diamonds Ltd. (a) | 1,212,621 | | 3,656 |
Ports Design Ltd. | 784,000 | | 2,960 |
Tanzanite One Ltd. (f) | 5,808,701 | | 8,937 |
Trefoil Ltd. (a) | 385,100 | | 2,225 |
Xceldiam Ltd. warrants 11/16/07 (a) | 1,659,127 | | 52 |
TOTAL BERMUDA | | 31,799 |
British Virgin Islands - 0.3% |
Albidon Ltd. unit (a) | 1,469,000 | | 4,169 |
Kalahari Energy (g) | 1,451,000 | | 1,814 |
TOTAL BRITISH VIRGIN ISLANDS | | 5,983 |
Canada - 4.2% |
AirSea Lines (a)(g) | 1,862,300 | | 1,349 |
AirSea Lines warrants 8/4/11 (a)(g) | 1,862,300 | | 0 |
Altius Minerals Corp. (a) | 257,006 | | 7,485 |
Antrim Energy, Inc. (a) | 245,700 | | 1,652 |
Antrim Energy, Inc. (United Kingdom) (a) | 800,000 | | 5,430 |
Bankers Petroleum Ltd. (a) | 3,767,000 | | 2,434 |
Equinox Minerals Ltd. (a) | 1,206,050 | | 6,604 |
Equinox Minerals Ltd. unit (a) | 588,859 | | 3,208 |
MagIndustries Corp. (a) | 3,635,960 | | 6,739 |
Oilexco, Inc. (a) | 1,237,525 | | 22,596 |
Rock Well Petroleum, Inc. (g) | 770,400 | | 3,461 |
Sino-Forest Corp. (a) | 106,000 | | 2,820 |
Starfield Resources, Inc. (a) | 1,313,025 | | 2,086 |
Starfield Resources, Inc. warrants 1/20/08 (a)(g) | 1,678,100 | | 1,114 |
Stealth Ventures Ltd. (a) | 593,200 | | 452 |
Stealth Ventures Ltd. warrants 3/12/08 (a)(g) | 483,250 | | 1 |
Visual Defence, Inc. (a)(f) | 4,664,100 | | 1,503 |
Common Stocks - continued |
| Shares | | Value
(000s) |
Canada - continued |
Western Canadian Coal Corp. (a) | 1,554,418 | | $ 4,116 |
Western Canadian Coal Corp. (United Kingdom) (a) | 548,286 | | 1,453 |
TOTAL CANADA | | 74,503 |
Cayman Islands - 0.9% |
Ctrip.com International Ltd. sponsored ADR | 31,000 | | 1,747 |
Embry Holdings Ltd. | 1,081,000 | | 845 |
Hidili Industry International Development Ltd. | 808,000 | | 1,205 |
International Consolidated Minerals, Inc. (a) | 852,927 | | 6,397 |
Ju Teng International Holdings Ltd. (a) | 656,000 | | 249 |
Lee & Man Paper Manufacturing Ltd. | 1,002,000 | | 4,008 |
TCC International Holdings Ltd. (a) | 894,000 | | 1,344 |
TOTAL CAYMAN ISLANDS | | 15,795 |
China - 0.8% |
Anhui Conch Cement Co. Ltd. (H Shares) | 78,000 | | 779 |
Baidu.com, Inc. sponsored ADR (a) | 4,600 | | 1,759 |
China Oilfield Services Ltd. (H Shares) | 1,892,000 | | 4,633 |
China Resources Land Ltd. | 448,000 | | 1,133 |
Dongfang Electrical Machinery Co. Ltd. (H Shares) | 84,000 | | 751 |
Sina Corp. (a) | 63,000 | | 3,612 |
Xinjiang Xinxin Mining Industry Co. Ltd. Class H | 740,000 | | 1,369 |
Yantai Changyu Pioneer Wine Co. (B Shares) | 118,810 | | 885 |
TOTAL CHINA | | 14,921 |
Cyprus - 0.1% |
Buried Hill Energy (Cyprus) PCL (g) | 1,947,000 | | 2,142 |
Czech Republic - 0.1% |
Ceske Energeticke Zavody AS | 35,860 | | 2,592 |
Denmark - 0.4% |
DSV de Sammensluttede Vognmaend AS | 259,300 | | 6,855 |
Finland - 1.6% |
Inion OY (a) | 3,590,300 | | 2,146 |
Nokian Tyres Ltd. | 430,910 | | 16,232 |
Rakentajain Konevuokraamo Oyj (B Shares) | 222,030 | | 8,299 |
Ramirent Oyj | 74,140 | | 1,646 |
TOTAL FINLAND | | 28,323 |
Common Stocks - continued |
| Shares | | Value
(000s) |
France - 3.9% |
Carbone Lorraine | 27,400 | | $ 2,452 |
Electricite de France | 90,900 | | 10,903 |
Geodis SA | 42,180 | | 9,105 |
Guerbet SA | 8,400 | | 1,901 |
Icade SA | 123,018 | | 9,079 |
Laurent-Perrier Group | 31,960 | | 5,963 |
Norbert Dentressangle SA | 15,064 | | 1,811 |
Seche Environment SA | 11,560 | | 2,122 |
Societe Internationale de Plantations d'Heveas SA | 2,580 | | 2,063 |
Veolia Environnement | 161,180 | | 14,396 |
Vilmorin & Cie | 67,700 | | 9,840 |
TOTAL FRANCE | | 69,635 |
Germany - 2.9% |
E.ON AG | 93,000 | | 18,163 |
Fresenius Medical Care AG | 130,010 | | 6,868 |
Interhyp AG | 35,270 | | 3,033 |
Kontron AG | 154,620 | | 3,918 |
MLP AG | 89,150 | | 1,182 |
Praktiker Bau- und Heimwerkermaerkte Holding AG | 63,860 | | 2,309 |
SGL Carbon AG (a) | 272,200 | | 15,881 |
TOTAL GERMANY | | 51,354 |
Greece - 1.6% |
Fourlis Holdings SA | 110,000 | | 4,430 |
Hellenic Technodomiki Tev SA | 223,750 | | 3,397 |
Sarantis SA (Reg.) | 1,076,638 | | 21,463 |
TOTAL GREECE | | 29,290 |
Hong Kong - 1.3% |
China Everbright Ltd. (a) | 1,328,000 | | 5,973 |
China Overseas Land & Investment Ltd. | 616,000 | | 1,474 |
Esprit Holdings Ltd. | 246,000 | | 4,108 |
Hang Lung Properties Ltd. | 499,000 | | 2,401 |
Li & Fung Ltd. | 924,000 | | 4,385 |
Midland Holdings Ltd. | 3,114,000 | | 3,857 |
PYI Corp. Ltd. | 600,000 | | 274 |
TOTAL HONG KONG | | 22,472 |
India - 1.2% |
Ess Dee Aluminium Ltd. | 49,516 | | 894 |
Gujarat NRE Coke Ltd. | 507,690 | | 1,499 |
Common Stocks - continued |
| Shares | | Value
(000s) |
India - continued |
INFO Edge India Ltd. | 109,253 | | $ 3,388 |
Jindal Steel & Power Ltd. | 22,836 | | 6,980 |
JSW Steel Ltd. | 156,958 | | 3,863 |
Sesa Goa Ltd. | 48,209 | | 4,618 |
TOTAL INDIA | | 21,242 |
Indonesia - 0.1% |
PT Bakrie Sumatera Plantations Tbk warrants 9/10/10 (a) | 31 | | 0 |
PT International Nickel Indonesia Tbk | 51,500 | | 519 |
PT Tambang Batubbara Bukit Asam Tbk | 1,732,500 | | 1,761 |
TOTAL INDONESIA | | 2,280 |
Ireland - 0.4% |
Adwalker PLC (a) | 9,125,000 | | 379 |
Kenmare Resources PLC (a) | 2,640,000 | | 3,389 |
Kenmare Resources PLC warrants 7/23/09 (a) | 1,712,500 | | 1,513 |
Petroceltic International PLC (a) | 13,644,934 | | 2,406 |
Vimio PLC (a) | 867,300 | | 198 |
TOTAL IRELAND | | 7,885 |
Israel - 0.6% |
Israel Chemicals Ltd. | 611,900 | | 6,734 |
RADWARE Ltd. (a) | 227,160 | | 3,844 |
TOTAL ISRAEL | | 10,578 |
Italy - 2.9% |
Ansaldo STS SpA (a) | 214,670 | | 3,121 |
ASM SpA | 925,100 | | 6,483 |
Banca Italease SpA (e) | 530,760 | | 11,163 |
Enel SpA | 543,800 | | 6,513 |
Hera SpA | 1,510,160 | | 6,789 |
Seldovia Native Association, Inc. (SNAI) (a)(e) | 1,541,160 | | 15,641 |
Teleunit SpA (a)(f) | 12,719,158 | | 1,025 |
TOTAL ITALY | | 50,735 |
Japan - 27.2% |
ABC-Mart, Inc. | 233,100 | | 4,801 |
Access Co. Ltd. | 464 | | 594 |
Adeka Corp. | 69,000 | | 692 |
Ahresty Corp. | 34,400 | | 695 |
Common Stocks - continued |
| Shares | | Value
(000s) |
Japan - continued |
Ai Holdings Corp. | 79,000 | | $ 475 |
Airport Facilities Co. Ltd. | 93,800 | | 616 |
AOC Holdings, Inc. | 79,400 | | 1,219 |
AOI Electronics Co. Ltd. | 64,300 | | 837 |
Apamanshop Holdings Co. Ltd. | 15,040 | | 5,865 |
ARDEPRO CO., Ltd. (e) | 43,989 | | 14,791 |
Atlus Co. Ltd. | 88,000 | | 455 |
Atrium Co. Ltd. | 64,400 | | 1,796 |
Avex Group Holdings, Inc. | 200,000 | | 2,916 |
Bit-isle, Inc. (a)(e) | 988 | | 744 |
Bookoff Corp. (e) | 88,300 | | 861 |
C. Uyemura & Co. Ltd. (a) | 46,000 | | 2,798 |
Chiba Bank Ltd. | 177,000 | | 1,421 |
Chugoku Marine Paints Ltd. | 134,000 | | 1,821 |
Citizen Holdings Co. Ltd. | 142,800 | | 1,539 |
CMIC Co. Ltd. | 4,860 | | 1,161 |
Create SD Co. Ltd. | 42,400 | | 908 |
cyber communications, Inc. | 1,365 | | 1,072 |
Dai-ichi Seiko Co. Ltd. | 55,100 | | 882 |
Daicel Chemical Industries Ltd. | 207,000 | | 1,525 |
Daido Steel Co. Ltd. | 269,000 | | 1,836 |
Daikin Industries Ltd. | 99,500 | | 5,013 |
Daikokutenbussan Co. Ltd. | 31,300 | | 236 |
Daiseki Co. Ltd. (e) | 76,300 | | 2,582 |
Daito Gyorui Co. Ltd. | 381,000 | | 673 |
Daiwa Securities Group, Inc. | 132,000 | | 1,272 |
Daiwabo Information System Ltd. (e) | 162,500 | | 2,160 |
Daiwasystem Co. Ltd. | 39,800 | | 1,117 |
DeNA Co. Ltd. | 451 | | 2,826 |
Denyo Co. Ltd. (e) | 72,900 | | 758 |
Endo Lighting Corp. | 2,300 | | 12 |
EPS Co. Ltd. (e) | 1,239 | | 4,800 |
F&M Co. Ltd. | 1,998 | | 562 |
FCM Co. Ltd. | 30,800 | | 1,385 |
Fuji Heavy Industries Ltd. | 418,000 | | 2,173 |
Fujitsu Component Ltd. (a) | 478 | | 622 |
Furuno Electric Co. Ltd. | 100,400 | | 1,519 |
GMO Hosting & Security, Inc. | 451 | | 515 |
Gmo Internet, Inc. (e) | 400,900 | | 1,530 |
Common Stocks - continued |
| Shares | | Value
(000s) |
Japan - continued |
H-One Co. Ltd. | 21,800 | | $ 251 |
Harakosan Co. Ltd. (e) | 5,676 | | 13,457 |
Harmonic Drive Systems, Inc. | 587 | | 2,210 |
Hikari Tsushin, Inc. (e) | 258,000 | | 7,880 |
Hisaka Works Ltd. (e) | 153,000 | | 3,422 |
Hitachi Construction Machinery Co. Ltd. | 100,200 | | 4,111 |
Hitachi Metals Ltd. | 322,000 | | 4,178 |
Hokuto Corp. | 171,200 | | 2,671 |
Hosiden Corp. (e) | 320,300 | | 5,682 |
Ibiden Co. Ltd. | 62,200 | | 5,274 |
Ichirokudo Co. Ltd. (a) | 1,014 | | 369 |
Ichiyoshi Securities Co. Ltd. | 141,400 | | 1,547 |
IDU Co. (e) | 2,213 | | 3,427 |
Index Holdings (e) | 3,190 | | 1,334 |
Inpex Holdings, Inc. | 890 | | 9,597 |
Intelligence Ltd. (e) | 2,492 | | 5,720 |
Isuzu Motors Ltd. | 359,000 | | 1,790 |
Itochu Corp. | 557,000 | | 7,040 |
Japan Airport Terminal Co. Ltd. | 12,400 | | 243 |
Japan Aviation Electronics Industry Ltd. | 250,000 | | 3,858 |
Japan Steel Works Ltd. | 157,000 | | 2,569 |
Japan Vilene Co. Ltd. (e) | 194,000 | | 1,176 |
Jastec Co. Ltd. | 450,200 | | 4,459 |
Juki Corp. | 500,000 | | 4,269 |
Juroku Bank Ltd. | 149,000 | | 902 |
Kitagawa Seiki Co. Ltd. | 84,000 | | 447 |
Komori Corp. | 154,000 | | 4,074 |
Konica Minolta Holdings, Inc. | 112,500 | | 1,970 |
Kura Corp. Ltd. | 5,016 | | 10,922 |
Kurita Water Industries Ltd. | 62,000 | | 2,072 |
LAC Holdings, Inc. (a) | 154,700 | | 453 |
Lawson, Inc. | 66,400 | | 2,296 |
MCJ Co. Ltd. (a)(e) | 3,338 | | 1,747 |
Meiko Electronics Co. Ltd. | 126,600 | | 4,407 |
Message Co. Ltd. | 584 | | 1,077 |
Micronics Japan Co. Ltd. | 91,500 | | 2,503 |
Mitsuba Corp. | 79,000 | | 508 |
Mitsui O.S.K. Lines Ltd. | 333,000 | | 5,505 |
Mitsumi Electric Co. Ltd. | 67,100 | | 3,093 |
Miura Co. Ltd. | 78,500 | | 2,459 |
Common Stocks - continued |
| Shares | | Value
(000s) |
Japan - continued |
Miyano Machinery, Inc. | 429,000 | | $ 1,197 |
Money Partners Co. Ltd. | 2,705 | | 10,624 |
Mori Seiki Co. Ltd. | 102,000 | | 2,591 |
NIC Corp. | 65,400 | | 508 |
Nidec Corp. | 22,400 | | 1,683 |
Nihon Dempa Kogyo Co. Ltd. (e) | 315,000 | | 15,732 |
Nihon Kohden Corp. | 75,100 | | 1,431 |
Nihon Trim Co. Ltd. (e) | 199,250 | | 6,365 |
Nihonwasou Holdings, Inc. | 782 | | 274 |
Nikon Corp. | 348,000 | | 11,170 |
Nippon Carbon Co. Ltd. (e) | 264,000 | | 1,666 |
Nippon Chemi-con Corp. | 292,000 | | 2,317 |
Nippon Denko Co. Ltd. (e) | 622,000 | | 4,690 |
Nippon Oil Corp. | 256,000 | | 2,268 |
Nippon Seiki Co. Ltd. | 745,000 | | 17,343 |
Nissha Printing Co. Ltd. | 51,000 | | 1,470 |
Nissin Kogyo Co. Ltd. | 757,400 | | 19,795 |
NTN Corp. | 452,000 | | 4,298 |
Obara Corp. | 50 | | 1 |
Oiles Corp. (e) | 77,040 | | 1,666 |
Otsuka Corp. | 21,300 | | 2,042 |
Pigeon Corp. (e) | 87,700 | | 1,508 |
Produce Co. Ltd. (a)(e) | 1,432 | | 5,498 |
Properst Co. Ltd. (e) | 536 | | 1,003 |
Renown, Inc. (a) | 65,400 | | 500 |
Rinnai Corp. | 115,000 | | 3,581 |
Rohto Pharmaceutical Co. Ltd. | 375,000 | | 4,463 |
Round One Corp. (e) | 1,306 | | 3,102 |
Ryobi Ltd. | 226,000 | | 1,523 |
Sammy NetWorks Co. Ltd. | 1,062 | | 1,802 |
Sansha Electric Manufacturing Co. Ltd. | 56,000 | | 546 |
Sanyo Denki Co. Ltd. | 271,000 | | 1,548 |
Sato Corp. (e) | 200,300 | | 3,885 |
Sawada Holdings Co. Ltd. (a) | 91,000 | | 646 |
SBI E*TRADE Securities Co. Ltd. (e) | 790 | | 848 |
Sec Carbon Ltd. | 132,000 | | 2,253 |
Seria Co. Ltd. | 482 | | 663 |
Shibaura Electronics Co. Ltd. (e) | 97,800 | | 2,461 |
Shimachu Co. Ltd. | 80,600 | | 2,321 |
Shin Nippon Biomedical Laboratories Ltd. (e) | 101,900 | | 1,557 |
Shin-Kobe Electric Machinery Co. Ltd. | 419,000 | | 1,957 |
Shinohara Systems of Construction Co. Ltd. (e) | 1,206 | | 1,250 |
Common Stocks - continued |
| Shares | | Value
(000s) |
Japan - continued |
Shizuki Electric Co., Inc. | 146,000 | | $ 546 |
Sojitz Corp. | 714,000 | | 3,278 |
SRI Sports Ltd. | 1,337 | | 1,642 |
Stanley Electric Co. Ltd. | 800,200 | | 17,800 |
Star Micronics Co. Ltd. | 16,200 | | 512 |
Starbucks Coffee Japan Ltd. (e) | 3,551 | | 1,697 |
Stella Chemifa Corp. (e) | 31,900 | | 902 |
Sumco Corp. | 26,200 | | 956 |
Sumitomo Corp. | 451,100 | | 7,862 |
Sumitomo Heavy Industries Ltd. | 216,000 | | 2,854 |
Sumitomo Metal Industries Ltd. | 434,000 | | 2,149 |
Sumitomo Trust & Banking Co. Ltd. | 160,000 | | 1,193 |
Sun Frontier Fudousan Co. Ltd. | 755 | | 1,731 |
Sunx Ltd. (e) | 150,200 | | 917 |
Suruga Corp. | 341,000 | | 7,959 |
Sysmex Corp. | 97,500 | | 3,995 |
T&D Holdings, Inc. | 18,300 | | 1,102 |
Taiho Kogyo Co. Ltd. | 88,100 | | 1,321 |
Taiyo Kagaku Co. Ltd. | 62,900 | | 402 |
Takara Holdings, Inc. (e) | 324,000 | | 1,905 |
Takeei Corp. (e) | 95,000 | | 3,591 |
Takiron Co. Ltd. | 121,000 | | 331 |
Takisawa Machine Tool Co. Ltd. | 524,000 | | 1,005 |
Telewave, Inc. | 692 | | 597 |
TMS Entertainment Ltd. (e) | 152,000 | | 446 |
TOA Valve Holding, Inc. (e) | 352 | | 2,121 |
Toagosei Co. Ltd. | 354,000 | | 1,243 |
Tohcello Co. Ltd. | 149,500 | | 1,091 |
Toho Zinc Co. Ltd. | 272,000 | | 2,470 |
Tohoku Electric Power Co., Inc. | 46,300 | | 979 |
Tokai Carbon Co. Ltd. | 635,000 | | 7,965 |
Tokai Rubber Industries Ltd. | 124,300 | | 2,447 |
Tokyo Gas Co. Ltd. | 248,000 | | 1,106 |
Tokyo Seimitsu Co. Ltd. (e) | 165,100 | | 3,895 |
TonenGeneral Sekiyu KK | 122,000 | | 1,229 |
Topcon Corp. | 87,400 | | 1,277 |
Toray Industries, Inc. | 157,000 | | 1,212 |
Trancom Co. Ltd. | 7,300 | | 111 |
Tyo, Inc. (e) | 113,000 | | 242 |
Ube Industries Ltd. | 683,000 | | 2,453 |
Unicom Group Holdings, Inc. | 121,300 | | 921 |
VarioSecure Networks, Inc. (e) | 648 | | 756 |
Common Stocks - continued |
| Shares | | Value
(000s) |
Japan - continued |
Wacom Co. Ltd. (e) | 1,144 | | $ 2,830 |
Yachiyo Industry Co. Ltd. | 119,200 | | 1,531 |
Yamada Denki Co. Ltd. | 54,740 | | 5,645 |
Yonkyu Co. Ltd. | 135,500 | | 1,053 |
Yume No Machi Souzou Iinkai Co. Ltd. | 527 | | 501 |
TOTAL JAPAN | | 484,861 |
Korea (South) - 0.9% |
LG Household & Health Care Ltd. | 4,230 | | 943 |
MegaStudy Co. Ltd. | 3,746 | | 1,382 |
NHN Corp. (a) | 5,675 | | 1,825 |
Samsung Engineering Co. Ltd. | 27,560 | | 3,713 |
STX Engine Co. Ltd. | 9,514 | | 948 |
STX Pan Ocean Co. Ltd. | 928,000 | | 2,387 |
Sung Kwang Bend Co. Ltd. | 13,764 | | 564 |
Taewoong Co. Ltd. | 23,528 | | 3,363 |
TOTAL KOREA (SOUTH) | | 15,125 |
Luxembourg - 0.2% |
SES SA FDR (France) unit | 142,650 | | 3,522 |
Malaysia - 0.2% |
KNM Group Bhd | 1,756,600 | | 3,109 |
Malta - 0.3% |
Unibet Group plc unit | 178,456 | | 5,758 |
Netherlands - 0.3% |
Engel East Europe NV | 975,032 | | 1,622 |
Koninklijke Boskalis Westminster NV (Certificaten Van Aandelen) | 53,740 | | 3,261 |
TOTAL NETHERLANDS | | 4,883 |
Norway - 2.2% |
Aker Kvaerner ASA | 150,140 | | 5,232 |
Pertra AS (A Shares) | 175,642 | | 2,651 |
Schibsted ASA (B Shares) | 48,600 | | 2,762 |
Stepstone ASA (a) | 5,397,154 | | 28,454 |
TOTAL NORWAY | | 39,099 |
Papua New Guinea - 0.5% |
Lihir Gold Ltd. (a) | 2,053,833 | | 8,154 |
Philippines - 0.3% |
Alliance Global Group, Inc. (a) | 10,090,000 | | 1,255 |
Common Stocks - continued |
| Shares | | Value
(000s) |
Philippines - continued |
SM Prime Holdings, Inc. | 6,628,000 | | $ 1,832 |
Vista Land & Lifescapes, Inc. | 14,466,000 | | 1,832 |
TOTAL PHILIPPINES | | 4,919 |
Portugal - 0.2% |
Banif SGPS SA | 484,850 | | 3,604 |
Singapore - 1.6% |
Advent Air Ltd. (f) | 14,719,299 | | 4,437 |
Banyan Tree Holdings Ltd. | 2,051,000 | | 2,996 |
Cosco Corp. Singapore Ltd. | 1,577,000 | | 8,564 |
Keppel Corp. Ltd. | 136,000 | | 1,398 |
Parkway Holdings Ltd. | 1,648,300 | | 4,781 |
Raffles Medical Group Ltd. | 905,000 | | 963 |
Straits Asia Resources Ltd. | 636,000 | | 1,178 |
Yangzijiang Shipbuilding Holdings Ltd. | 2,262,000 | | 4,028 |
TOTAL SINGAPORE | | 28,345 |
South Africa - 1.8% |
African Rainbow Minerals Ltd. | 291,610 | | 6,730 |
Investec Ltd. | 491,707 | | 6,117 |
JD Group Ltd. | 147,340 | | 1,412 |
Mvelaphanda Group Ltd. | 3,277,360 | | 5,295 |
Telkom SA Ltd. | 146,300 | | 3,984 |
Wilson Bayly Holmes-Ovcon Ltd. | 446,856 | | 9,008 |
TOTAL SOUTH AFRICA | | 32,546 |
Spain - 0.9% |
Grifols SA | 319,170 | | 8,439 |
Obrascon Huarte Lain SA | 166,010 | | 7,506 |
TOTAL SPAIN | | 15,945 |
Sweden - 2.2% |
Hexagon AB (B Shares) | 718,533 | | 17,302 |
Meda AB (A Shares) | 324,460 | | 4,890 |
Modern Times Group MTG AB (B Shares) | 199,460 | | 14,017 |
RNB Retail & Brands AB | 207,990 | | 2,398 |
TOTAL SWEDEN | | 38,607 |
Switzerland - 1.1% |
Actelion Ltd. (Reg.) (a) | 82,940 | | 4,121 |
Bucher Industries AG | 15,811 | | 3,754 |
Partners Group Holding | 32,420 | | 4,394 |
Common Stocks - continued |
| Shares | | Value
(000s) |
Switzerland - continued |
Sulzer AG (Reg.) | 2,070 | | $ 3,320 |
Vontobel Holdings AG | 86,450 | | 4,441 |
TOTAL SWITZERLAND | | 20,030 |
Taiwan - 0.3% |
Far Eastern Textile Ltd. | 734,000 | | 970 |
First Steamship Co. Ltd. (a) | 580,000 | | 1,610 |
Oriental Union Chemical Corp. | 642,000 | | 906 |
PixArt Imaging, Inc. | 6,600 | | 58 |
Sinyi Realty, Inc. | 617,837 | | 1,640 |
WPG Holding Co. Ltd. | 547,000 | | 903 |
TOTAL TAIWAN | | 6,087 |
Thailand - 0.1% |
Central Pattana PCL unit | 904,600 | | 690 |
Thoresen Thai Agencies PCL unit | 449,500 | | 809 |
TOTAL THAILAND | | 1,499 |
United Kingdom - 15.0% |
Advanced Fluid Connections PLC (a) | 7,009,687 | | 0 |
ADVFN PLC (a)(f) | 35,175,780 | | 2,066 |
AeroBox PLC (a) | 5,694,657 | | 0 |
Afren PLC (a) | 1,722,490 | | 3,322 |
African Consolidated Resources PLC (a) | 10,333,334 | | 2,847 |
African Copper PLC (a) | 1,677,884 | | 3,192 |
Air Partner PLC | 45,000 | | 1,118 |
Anglo Asian Mining PLC (a) | 3,657,000 | | 950 |
Appian Technology PLC (a) | 1,968,888 | | 297 |
Appian Technology PLC warrants 2/28/08 (a)(g) | 479,045 | | 45 |
Ascent Resources PLC warrants 12/22/07 (a) | 1,500,000 | | 159 |
Autonomy Corp. PLC (a) | 168,090 | | 3,434 |
Baltic Oil Terminals PLC (a) | 1,314,300 | | 2,883 |
Belitung Zinc Corp. PLC (g) | 7,435,490 | | 1,546 |
BioCare Solutions PLC (f) | 4,849,670 | | 1,260 |
Blackstar Investors PLC (a) | 1,826,860 | | 4,330 |
Block Shield Corp. PLC (a) | 1,653,400 | | 3,266 |
Cambrian Mining PLC | 4,026,100 | | 8,810 |
CareCapital Group PLC (a) | 511,000 | | 279 |
Celsis International PLC (a) | 443,648 | | 1,909 |
Central African Mining & Exploration Co. PLC (a) | 9,125,633 | | 5,407 |
Centurion Electronics PLC (a)(f) | 748,299 | | 89 |
Clapham House Group PLC (a) | 226,950 | | 1,500 |
Common Stocks - continued |
| Shares | | Value
(000s) |
United Kingdom - continued |
Corac Group PLC (a)(f) | 4,609,104 | | $ 5,414 |
Countermine PLC (a)(g) | 4,939 | | 265 |
Countermine PLC warrants 7/26/06 (a)(g) | 4,939 | | 0 |
CustomVis plc (a)(f) | 8,417,536 | | 591 |
Datacash Group PLC | 1,110,470 | | 6,649 |
Eclipse Energy Co. Ltd. (g) | 102,000 | | 1,590 |
Europa Oil & Gas Holdings PLC warrants 11/11/07 (a) | 500,000 | | 1 |
Forum Energy PLC (a) | 800,270 | | 507 |
Gemfields Resources PLC (a) | 3,909,100 | | 2,438 |
Global Coal Management PLC (a) | 1,052,149 | | 2,166 |
Gyrus Group PLC (a) | 365,900 | | 3,252 |
Hardide Ltd. (a) | 6,848,580 | | 1,602 |
Healthcare Enterprise Group PLC (a)(f) | 18,312,440 | | 373 |
Healthcare Enterprise Group PLC warrants 6/30/08 (a) | 1,851,769 | | 19 |
Hot Tuna International PLC (a) | 1,049,400 | | 166 |
Hot Tuna International PLC warrants 2/25/08 (a)(g) | 1,179,700 | | 0 |
Hydrodec Group PLC (a)(f) | 10,002,286 | | 3,795 |
Ideal Shopping Direct PLC | 661,592 | | 2,703 |
IG Group Holdings plc | 794,850 | | 6,875 |
Impact Holdings PLC (a)(f) | 10,414,000 | | 650 |
Inmarsat PLC | 314,800 | | 3,358 |
Inova Holding PLC (a) | 1,443,461 | | 231 |
Intertek Group PLC | 94,110 | | 2,013 |
iomart Group PLC | 1,618,840 | | 1,969 |
ITE Group PLC | 2,116,540 | | 7,712 |
ITM Power PLC (a) | 1,400,980 | | 3,291 |
Jubilee Platinum PLC (a) | 4,124,543 | | 8,189 |
Keronite PLC (a)(g) | 13,620,267 | | 1,699 |
KimCor Diamonds PLC warrants 3/15/08 (a) | 2,185,000 | | 159 |
Landround plc warrants 12/11/09 (a)(g) | 166,666 | | 11 |
London Asia Chinese Private Equity Fund Ltd. warrants 3/31/11 (a) | 105,400 | | 50 |
Max Petroleum PLC (a) | 11,111,220 | | 23,678 |
Meggitt PLC | 1,632,419 | | 11,582 |
Meldex International PLC (a)(e) | 4,394,616 | | 4,386 |
MicroEmissive Displays (a) | 2,821,600 | | 3,344 |
Motivcom PLC (f) | 1,820,500 | | 5,545 |
NDS Group PLC sponsored ADR (a) | 271,300 | | 16,169 |
Petrofac Ltd. | 336,540 | | 3,603 |
Proteome Sciences PLC (a) | 1,322,532 | | 1,299 |
Pureprofile Media PLC (g) | 1,108,572 | | 864 |
Pursuit Dynamics PLC (a) | 666,667 | | 3,659 |
Common Stocks - continued |
| Shares | | Value
(000s) |
United Kingdom - continued |
Rambler Metals & Mining PLC (a) | 600,000 | | $ 661 |
RGI International Ltd. | 589,470 | | 6,119 |
Rheochem PLC warrants 12/30/07 (a) | 4,364,150 | | 15 |
Sarantel Group PLC Class A (a) | 3,310,900 | | 344 |
Scottish & Southern Energy PLC | 209,000 | | 6,761 |
SDL plc (a) | 1,090,022 | | 6,799 |
Serco Group PLC | 439,640 | | 4,120 |
Sinclair Pharma PLC (a) | 1,128,371 | | 1,935 |
Sinosoft Technology PLC (a) | 2,051,400 | | 768 |
SPI Lasers PLC (a)(f) | 3,461,200 | | 3,778 |
Stem Cell Sciences PLC (a) | 716,649 | | 432 |
SubSea Resources PLC (a) | 4,678,800 | | 122 |
SubSea Resources PLC warrants 11/4/09 (a) | 1,805,625 | | 6 |
Target Resources PLC (a) | 1,020,000 | | 488 |
Target Resources PLC warrants 7/12/08 (a) | 1,020,000 | | 64 |
TMO Biotec (a)(g) | 1,000,000 | | 1,445 |
Toledo Mining Corp. PLC (a)(e) | 1,292,424 | | 6,785 |
Triple Plate Junction PLC (a) | 1,539,200 | | 672 |
UK Coal PLC (a) | 409,200 | | 4,339 |
Unite Group PLC | 256,110 | | 2,216 |
Vectura Group PLC (a) | 3,556,060 | | 5,157 |
Virotec International PLC (a) | 3,361,132 | | 445 |
VT Group PLC | 620,780 | | 7,770 |
York Pharma PLC (a) | 633,000 | | 1,421 |
Zenergy Power PLC (a) | 1,469,780 | | 8,495 |
ZincOx Resources PLC (a) | 693,100 | | 5,714 |
TOTAL UNITED KINGDOM | | 267,447 |
United States of America - 2.3% |
Cyberview Technology, Inc. (a)(f) | 996,527 | | 3,802 |
Frontera Resources Corp. (a) | 1,157,200 | | 1,660 |
Frontier Mining Ltd. (a)(f) | 6,771,600 | | 1,619 |
Phorm, Inc. (a)(f) | 664,000 | | 28,335 |
Spacelabs Healthcare, Inc. (a) | 707,250 | | 1,169 |
XL TechGroup, Inc. (a) | 1,329,250 | | 3,634 |
TOTAL UNITED STATES OF AMERICA | | 40,219 |
TOTAL COMMON STOCKS (Cost $1,200,018) | 1,706,391 |
Convertible Bonds - 0.3% |
| Principal
Amount (000s)(d) | | Value
(000s) |
Canada - 0.3% |
Western Canadian Coal Corp. 7.5% 3/24/11 (d)
(Cost $4,061) | CAD | 4,714 | | $ 4,443 |
Money Market Funds - 9.4% |
| Shares | | |
Fidelity Cash Central Fund, 4.97% (b) | 72,630,783 | | 72,631 |
Fidelity Securities Lending Cash Central Fund, 5.02% (b)(c) | 95,477,489 | | 95,477 |
TOTAL MONEY MARKET FUNDS (Cost $168,108) | 168,108 |
TOTAL INVESTMENT PORTFOLIO - 105.5% (Cost $1,372,187) | | 1,878,942 |
NET OTHER ASSETS - (5.5)% | | (97,201) |
NET ASSETS - 100% | $ 1,781,741 |
Currency Abbreviation |
CAD | - | Canadian dollar |
Legend |
(a) Non-income producing |
(b) Affiliated fund that is available only to investment companies and other accounts managed by Fidelity Investments. The rate quoted is the annualized seven-day yield of the fund at period end. A complete unaudited listing of the fund's holdings as of its most recent quarter end is available upon request. |
(c) Investment made with cash collateral received from securities on loan. |
(d) Principal amount is stated in United States dollars unless otherwise noted. |
(e) Security or a portion of the security is on loan at period end. |
(f) Affiliated company |
(g) Restricted securities - Investment in securities not registered under the Securities Act of 1933 (excluding 144A issues). At the end of the period, the value of restricted securities (excluding 144A issues) amounted to $17,345,000 or 1.0% of net assets. |
Additional information on each holding is as follows: |
Security | Acquisition Date | Acquisition Cost (000s) |
AirSea Lines | 8/4/06 | $ 1,199 |
AirSea Lines warrants 8/4/11 | 8/4/06 | $ 0 |
Appian Technology PLC warrants 2/28/08 | 2/18/05 | $ 0 |
Belitung Zinc Corp. PLC | 1/12/06 | $ 1,308 |
Security | Acquisition Date | Acquisition Cost (000s) |
Buried Hill Energy (Cyprus) PCL | 8/18/06 | $ 2,142 |
Countermine PLC | 12/22/05 | $ 443 |
Countermine PLC warrants 7/26/06 | 12/22/05 | $ 0 |
Eclipse Energy Co. Ltd. | 4/28/05 | $ 1,459 |
Hot Tuna International PLC warrants 2/25/08 | 2/14/06 | $ 0 |
Kalahari Energy | 9/1/06 | $ 1,814 |
Keronite PLC | 8/16/06 | $ 1,549 |
Landround plc warrants 12/11/09 | 12/12/06 | $ 0 |
Pureprofile Media PLC | 5/3/05 - 1/11/06 | $ 1,173 |
Rock Well Petroleum, Inc. | 4/13/06 | $ 1,004 |
Starfield Resources, Inc. warrants 1/20/08 | 1/17/06 | $ 0 |
Stealth Ventures Ltd. warrants 3/12/08 | 9/21/06 | $ 0 |
TMO Biotec | 10/27/05 | $ 535 |
Affiliated Central Funds |
Information regarding fiscal year to date income earned by the Fund from investments in Fidelity Central Funds is as follows: |
Fund | Income earned
(Amounts in thousands) |
Fidelity Cash Central Fund | $ 2,959 |
Fidelity Securities Lending Cash Central Fund | 1,663 |
Total | $ 4,622 |
Other Affiliated Issuers |
An affiliated company is a company in which the fund has ownership of at least 5% of the voting securities. Fiscal year to date transactions with companies which are or were affiliates are as follows: |
Affiliate
(Amounts in thousands) | Value, beginning of period | Purchases | Sales Proceeds | Dividend Income | Value,
end of
period |
121Media, Inc. | $ 11,748 | $ - | $ - | $ - | $ - |
Advent Air Ltd. | 2,948 | - | - | 80 | 4,437 |
ADVFN PLC | 1,120 | 922 | 29 | - | 2,066 |
Adwalker PLC | 413 | - | - | - | - |
Avanti Screenmedia Group PLC | 9,335 | - | 8,831 | - | - |
BDI Mining Corp. | 3,288 | - | 6,306 | - | - |
BioCare Solutions PLC | 2,270 | - | 150 | - | 1,260 |
Bioprogress PLC | 9,152 | - | 4,712 | - | - |
Cambrian Mining PLC | 15,845 | - | 5,408 | 182 | - |
Centurion Electronics PLC | 432 | - | 37 | - | 89 |
Corac Group PLC | 3,538 | - | 438 | - | 5,414 |
CustomVis plc | 134 | 715 | - | - | 591 |
Cyberscan Technology, Inc. | 4,562 | - | - | - | - |
Cyberview Technology, Inc. | - | - | - | - | 3,802 |
DA Group PLC | 1,236 | - | 953 | - | - |
Financial Payment Systems Ltd. | 1,485 | - | 385 | - | - |
Frontier Mining Ltd. | 1,808 | - | - | - | 1,619 |
Gasol PLC | 1,257 | - | 897 | - | - |
Gemfields Resources PLC | 5,589 | - | 1,823 | - | - |
GMA Resources PLC | 3,939 | - | 3,863 | - | - |
Affiliate
(Amounts in thousands) | Value, beginning of period | Purchases | Sales Proceeds | Dividend Income | Value,
end of
period |
Hardide Ltd. | $ 1,711 | $ - | $ 233 | $ - | $ - |
Healthcare Enterprise Group PLC | 1,010 | 431 | 411 | - | 373 |
Hydrodec Group PLC | 8,231 | - | 1,677 | - | 3,795 |
ID Data PLC | 925 | - | 1,169 | - | - |
Imagelinx PLC | 1,948 | 340 | 816 | - | - |
Impact Holdings PLC | 2,086 | - | - | - | 650 |
Inion OY | 1,677 | - | 111 | - | - |
Interbulk Group PLC | 1,682 | - | 1,528 | - | - |
International Ferro Metals | 17,682 | 1,265 | 32,938 | - | - |
Jubilee Platinum PLC | 8,789 | 1,994 | 5,851 | - | - |
KimCor Diamonds PLC | 1,185 | - | 736 | - | - |
Landround plc | 188 | 197 | 286 | - | - |
Metals Exploration PLC | 2,126 | - | 2,280 | - | - |
MicroEmissive Displays | 1,672 | 409 | 685 | - | - |
Mineral Commodities Ltd. | 948 | - | 730 | - | - |
Motivcom PLC | 3,085 | - | 186 | 51 | 5,545 |
Phorm, Inc. | - | 1,326 | - | - | 28,335 |
Platinum Mining Corp. of India PLC | 2,418 | - | 2,829 | - | - |
Rheochem PLC | 2,034 | - | 2,015 | - | - |
Sarantel Group PLC Class A | 677 | 463 | 37 | - | - |
Solomon Gold PLC | 905 | - | 502 | - | - |
SPI Lasers PLC | 2,024 | 1,863 | 709 | - | 3,778 |
Starfield Resources, Inc. | 3,247 | 908 | 2,924 | - | - |
SubSea Resources PLC | 2,630 | - | 79 | - | - |
Sylvania Resources Ltd. | 5,331 | 4,057 | 2,385 | - | 25,111 |
Sylvania Resources Ltd. (United Kingdom) | 3,616 | 5,253 | 7,089 | - | 13,425 |
Tanzanite One Ltd. | 9,086 | - | - | 524 | 8,937 |
Teleunit SpA | 1,122 | - | - | - | 1,025 |
Toledo Mining Corp. PLC | 3,742 | 511 | 1,770 | - | - |
Visual Defence, Inc. | 2,673 | - | 430 | - | 1,503 |
Xceldiam Ltd. | 1,946 | - | 65 | 3,814 | - |
Total | $ 176,495 | $ 20,654 | $ 104,303 | $ 4,651 | $ 111,755 |
See accompanying notes which are an integral part of the financial statements.
Annual Report
Financial Statements
Statement of Assets and Liabilities
Amounts in thousands (except per-share amounts) | October 31, 2007 |
Assets | | |
Investment in securities, at value (including securities loaned of $90,915) - See accompanying schedule: Unaffiliated issuers (cost $1,131,366) | $ 1,599,079 | |
Fidelity Central Funds (cost $168,108) | 168,108 | |
Other affiliated issuers (cost $72,713) | 111,755 | |
Total Investments (cost $1,372,187) | | $ 1,878,942 |
Receivable for investments sold | | 21,599 |
Receivable for fund shares sold | | 634 |
Dividends receivable | | 2,392 |
Interest receivable | | 38 |
Distributions receivable from Fidelity Central Funds | | 457 |
Prepaid expenses | | 1 |
Other receivables | | 218 |
Total assets | | 1,904,281 |
| | |
Liabilities | | |
Payable to custodian bank | $ 1,373 | |
Payable for investments purchased | 19,762 | |
Payable for fund shares redeemed | 2,863 | |
Accrued management fee | 1,563 | |
Distribution fees payable | 49 | |
Other affiliated payables | 358 | |
Other payables and accrued expenses | 1,095 | |
Collateral on securities loaned, at value | 95,477 | |
Total liabilities | | 122,540 |
| | |
Net Assets | | $ 1,781,741 |
Net Assets consist of: | | |
Paid in capital | | $ 1,016,289 |
Undistributed net investment income | | 7,171 |
Accumulated undistributed net realized gain (loss) on investments and foreign currency transactions | | 252,123 |
Net unrealized appreciation (depreciation) on investments and assets and liabilities in foreign currencies | | 506,158 |
Net Assets | | $ 1,781,741 |
See accompanying notes which are an integral part of the financial statements.
Annual Report
Financial Statements - continued
Statement of Assets and Liabilities - continued
Amounts in thousands (except per-share amounts) | October 31, 2007 |
Calculation of Maximum Offering Price
Class A:
Net Asset Value and redemption price per share ($38,585 ÷ 1,239 shares) | | $ 31.14 |
| | |
Maximum offering price per share (100/94.25 of $31.14) | | $ 33.04 |
Class T:
Net Asset Value and redemption price per share ($40,823 ÷ 1,318 shares) | | $ 30.96 |
| | |
Maximum offering price per share (100/96.50 of $30.96) | | $ 32.08 |
Class B:
Net Asset Value and offering price per share ($10,704 ÷ 351 shares)A | | $ 30.49 |
| | |
Class C:
Net Asset Value and offering price per share ($20,094 ÷ 656 shares)A | | $ 30.62 |
| | |
International Small Cap:
Net Asset Value, offering price and redemption price per share ($1,663,761 ÷ 52,912 shares) | | $ 31.44 |
| | |
Institutional Class:
Net Asset Value, offering price and redemption price per share ($7,774 ÷ 248 shares) | | $ 31.38 |
A Redemption price per share is equal to net asset value less any applicable contingent deferred sales charge.
See accompanying notes which are an integral part of the financial statements.
Annual Report
Statement of Operations
Amounts in thousands | Year ended October 31, 2007 |
Investment Income | | |
Dividends (including $4,651 earned from other affiliated issuers) | | $ 24,214 |
Interest | | 410 |
Income from Fidelity Central Funds (including $1,663 from security lending) | | 4,622 |
| | 29,246 |
Less foreign taxes withheld | | (1,717) |
Total income | | 27,529 |
| | |
Expenses | | |
Management fee
Basic fee | $ 14,855 | |
Performance adjustment | 336 | |
Transfer agent fees | 3,688 | |
Distribution fees | 586 | |
Accounting and security lending fees | 797 | |
Custodian fees and expenses | 641 | |
Independent trustees' compensation | 6 | |
Registration fees | 81 | |
Audit | 138 | |
Legal | 42 | |
Miscellaneous | 62 | |
Total expenses before reductions | 21,232 | |
Expense reductions | (743) | 20,489 |
Net investment income (loss) | | 7,040 |
Realized and Unrealized Gain (Loss) Net realized gain (loss) on: | | |
Investment securities: | | |
Unaffiliated issuers (net of foreign taxes of $21) | 294,358 | |
Other affiliated issuers | (4,327) | |
Foreign currency transactions | (128) | |
Total net realized gain (loss) | | 289,903 |
Change in net unrealized appreciation (depreciation) on: Investment securities (net of increase in deferred foreign taxes of $762) | 201,533 | |
Assets and liabilities in foreign currencies | 242 | |
Total change in net unrealized appreciation (depreciation) | | 201,775 |
Net gain (loss) | | 491,678 |
Net increase (decrease) in net assets resulting from operations | | $ 498,718 |
See accompanying notes which are an integral part of the financial statements.
Annual Report
Financial Statements - continued
Statement of Changes in Net Assets
Amounts in thousands | Year ended
October 31,
2007 | Year ended
October 31,
2006 |
Increase (Decrease) in Net Assets | | |
Operations | | |
Net investment income (loss) | $ 7,040 | $ 6,181 |
Net realized gain (loss) | 289,903 | 461,201 |
Change in net unrealized appreciation (depreciation) | 201,775 | (42,338) |
Net increase (decrease) in net assets resulting
from operations | 498,718 | 425,044 |
Distributions to shareholders from net investment income | (3,787) | (10,829) |
Distributions to shareholders from net realized gain | (351,004) | (234,438) |
Total distributions | (354,791) | (245,267) |
Share transactions - net increase (decrease) | (298,912) | (456,221) |
Redemption fees | 245 | 565 |
Total increase (decrease) in net assets | (154,740) | (275,879) |
| | |
Net Assets | | |
Beginning of period | 1,936,481 | 2,212,360 |
End of period (including undistributed net investment income of $7,171 and undistributed net investment income of $5,133, respectively) | $ 1,781,741 | $ 1,936,481 |
See accompanying notes which are an integral part of the financial statements.
Annual Report
Financial Highlights - Class A
Years ended October 31, | 2007 | 2006 | 2005 | 2004 | 2003 I |
Selected Per-Share Data | | | | | |
Net asset value, beginning of period | $ 28.79 | $ 26.69 | $ 21.25 | $ 17.69 | $ 12.35 |
Income from Investment Operations | | | | | |
Net investment income (loss) E | .03 | (.02) | .05 | .02 | .02 H |
Net realized and unrealized gain (loss) | 7.97 | 5.05 | 6.16 | 3.83 | 5.30 |
Total from investment operations | 8.00 | 5.03 | 6.21 | 3.85 | 5.32 |
Distributions from net investment income | - | (.05) | (.02) | (.02) | - |
Distributions from net realized gain | (5.65) | (2.89) | (.77) | (.31) | - |
Total distributions | (5.65) | (2.94) | (.79) | (.33) | - |
Redemption fees added to paid
in capital E | - K | .01 | .02 | .04 | .02 |
Net asset value, end of period | $ 31.14 | $ 28.79 | $ 26.69 | $ 21.25 | $ 17.69 |
Total Return B,C,D | 33.43% | 20.22% | 30.16% | 22.36% | 43.24% |
Ratios to Average Net Assets F,J | | | | | |
Expenses before reductions | 1.53% | 1.64% | 1.66% | 1.71% | 1.77% A |
Expenses net of fee waivers, if any | 1.53% | 1.64% | 1.66% | 1.71% | 1.77% A |
Expenses net of all reductions | 1.49% | 1.58% | 1.63% | 1.69% | 1.74% A |
Net investment income (loss) | .10% | (.08)% | .21% | .09% | .28% A |
Supplemental Data | | | | | |
Net assets, end of period
(in millions) | $ 39 | $ 37 | $ 35 | $ 13 | $ 5 |
Portfolio turnover rateG | 70% | 84% | 79% | 77% | 84% A |
A Annualized
B Total returns for periods of less than one year are not annualized.
C Total returns would have been lower had certain expenses not been reduced during the periods shown.
D Total returns do not include the effect of the sales charges.
E Calculated based on average shares outstanding during the period.
F Fees and expenses of the underlying Fidelity Central Funds are not included in the Fund's expense ratio. The Fund indirectly bears its proportionate share of the expenses of any underlying Fidelity Central Funds.
G Amount does not include the portfolio activity of any underlying Fidelity Central Funds.
H Investment income per share reflects a special dividend which amounted to $.01 per share.
I For the period May 27, 2003 (commencement of sale of shares) to October 31, 2003.
J Expense ratios reflect operating expenses of the class. Expenses before reductions do not reflect amounts reimbursed by the investment adviser or reductions from brokerage service arrangements or other expense offset arrangements and do not represent the amount paid by the class during periods when reimbursements or reductions occur. Expense ratios before reductions for start-up periods may not be representative of longer-term operating periods. Expenses net of fee waivers reflect expenses after reimbursement by the investment adviser but prior to reductions from brokerage service arrangements or other expense offset arrangements. Expenses net of all reductions represent the net expenses paid by the class.
K Amount represents less than $.01 per share.
See accompanying notes which are an integral part of the financial statements.
Annual Report
Financial Highlights - Class T
Years ended October 31, | 2007 | 2006 | 2005 | 2004 | 2003 I |
Selected Per-Share Data | | | | | |
Net asset value, beginning of period | $ 28.64 | $ 26.57 | $ 21.20 | $ 17.68 | $ 12.35 |
Income from Investment Operations | | | | | |
Net investment income (loss) E | (.04) | (.09) | (.01) | (.03) | - H,K |
Net realized and unrealized gain (loss) | 7.93 | 5.03 | 6.12 | 3.83 | 5.31 |
Total from investment operations | 7.89 | 4.94 | 6.11 | 3.80 | 5.31 |
Distributions from net investment income | - | - | - | (.01) | - |
Distributions from net realized gain | (5.57) | (2.88) | (.76) | (.31) | - |
Total distributions | (5.57) | (2.88) | (.76) | (.32) | - |
Redemption fees added to paid
in capital E | - K | .01 | .02 | .04 | .02 |
Net asset value, end of period | $ 30.96 | $ 28.64 | $ 26.57 | $ 21.20 | $ 17.68 |
Total Return B,C,D | 33.07% | 19.93% | 29.72% | 22.07% | 43.16% |
Ratios to Average Net Assets F,J | | | | | |
Expenses before reductions | 1.77% | 1.89% | 1.92% | 1.94% | 2.12% A |
Expenses net of fee waivers,
if any | 1.77% | 1.89% | 1.91% | 1.94% | 2.12% A |
Expenses net of all reductions | 1.73% | 1.83% | 1.88% | 1.92% | 2.09% A |
Net investment income (loss) | (.14)% | (.32)% | (.04)% | (.14)% | (.07)% A |
Supplemental Data | | | | | |
Net assets, end of period
(in millions) | $ 41 | $ 42 | $ 42 | $ 15 | $ 4 |
Portfolio turnover rate G | 70% | 84% | 79% | 77% | 84% A |
A Annualized
B Total returns for periods of less than one year are not annualized.
C Total returns would have been lower had certain expenses not been reduced during the periods shown.
D Total returns do not include the effect of the sales charges.
E Calculated based on average shares outstanding during the period.
F Fees and expenses of the underlying Fidelity Central Funds are not included in the Fund's expense ratio. The Fund indirectly bears its proportionate share of the expenses of any underlying Fidelity Central Funds.
G Amount does not include the portfolio activity of any underlying Fidelity Central Funds.
H Investment income per share reflects a special dividend which amounted to $.01 per share.
I For the period May 27, 2003 (commencement of sale of shares) to October 31, 2003.
J Expense ratios reflect operating expenses of the class. Expenses before reductions do not reflect amounts reimbursed by the investment adviser or reductions from brokerage service arrangements or other expense offset arrangements and do not represent the amount paid by the class during periods when reimbursements or reductions occur. Expense ratios before reductions for start-up periods may not be representative of longer-term operating periods. Expenses net of fee waivers reflect expenses after reimbursement by the investment adviser but prior to reductions from brokerage service arrangements or other expense offset arrangements. Expenses net of all reductions represent the net expenses paid by the class.
K Amount represents less than $.01 per share.
See accompanying notes which are an integral part of the financial statements.
Annual Report
Financial Highlights - Class B
Years ended October 31, | 2007 | 2006 | 2005 | 2004 | 2003 I |
Selected Per-Share Data | | | | | |
Net asset value, beginning of period | $ 28.26 | $ 26.24 | $ 20.99 | $ 17.62 | $ 12.35 |
Income from Investment Operations | | | | | |
Net investment income (loss) E | (.18) | (.24) | (.14) | (.16) | (.05) H |
Net realized and unrealized gain (loss) | 7.82 | 4.98 | 6.08 | 3.80 | 5.30 |
Total from investment operations | 7.64 | 4.74 | 5.94 | 3.64 | 5.25 |
Distributions from net realized gain | (5.41) | (2.73) | (.71) | (.31) | - |
Redemption fees added to paid
in capital E | - K | .01 | .02 | .04 | .02 |
Net asset value, end of period | $ 30.49 | $ 28.26 | $ 26.24 | $ 20.99 | $ 17.62 |
Total Return B,C,D | 32.38% | 19.28% | 29.13% | 21.21% | 42.67% |
Ratios to Average Net Assets F,J | | | | | |
Expenses before reductions | 2.30% | 2.48% | 2.49% | 2.63% | 2.76% A |
Expenses net of fee waivers, if any | 2.30% | 2.40% | 2.43% | 2.63% | 2.76% A |
Expenses net of all reductions | 2.26% | 2.34% | 2.40% | 2.60% | 2.73% A |
Net investment income (loss) | (.66)% | (.84)% | (.56)% | (.83)% | (.71)% A |
Supplemental Data | | | | | |
Net assets, end of period
(in millions) | $ 11 | $ 11 | $ 13 | $ 5 | $ 1 |
Portfolio turnover rate G | 70% | 84% | 79% | 77% | 84% A |
A Annualized
B Total returns for periods of less than one year are not annualized.
C Total returns would have been lower had certain expenses not been reduced during the periods shown.
D Total returns do not include the effect of the contingent deferred sales charge.
E Calculated based on average shares outstanding during the period.
F Fees and expenses of the underlying Fidelity Central Funds are not included in the Fund's expense ratio. The Fund indirectly bears its proportionate share of the expenses of any underlying Fidelity Central Funds.
G Amount does not include the portfolio activity of any underlying Fidelity Central Funds.
H Investment income per share reflects a special dividend which amounted to $.01 per share.
I For the period May 27, 2003 (commencement of sale of shares) to October 31, 2003.
J Expense ratios reflect operating expenses of the class. Expenses before reductions do not reflect amounts reimbursed by the investment adviser or reductions from brokerage service arrangements or other expense offset arrangements and do not represent the amount paid by the class during periods when reimbursements or reductions occur. Expense ratios before reductions for start-up periods may not be representative of longer-term operating periods. Expenses net of fee waivers reflect expenses after reimbursement by the investment adviser but prior to reductions from brokerage service arrangements or other expense offset arrangements. Expenses net of all reductions represent the net expenses paid by the class.
K Amount represents less than $.01 per share.
See accompanying notes which are an integral part of the financial statements.
Annual Report
Financial Highlights - Class C
Years ended October 31, | 2007 | 2006 | 2005 | 2004 | 2003 I |
Selected Per-Share Data | | | | | |
Net asset value, beginning of period | $ 28.33 | $ 26.31 | $ 21.04 | $ 17.64 | $ 12.35 |
Income from Investment Operations | | | | | |
Net investment income (loss) E | (.17) | (.23) | (.13) | (.12) | (.04) H |
Net realized and unrealized gain (loss) | 7.85 | 4.99 | 6.10 | 3.80 | 5.31 |
Total from investment operations | 7.68 | 4.76 | 5.97 | 3.68 | 5.27 |
Distributions from net investment income | - | - | - | (.01) | - |
Distributions from net realized gain | (5.39) | (2.75) | (.72) | (.31) | - |
Total distributions | (5.39) | (2.75) | (.72) | (.32) | - |
Redemption fees added to paid in capital E | - K | .01 | .02 | .04 | .02 |
Net asset value, end of period | $ 30.62 | $ 28.33 | $ 26.31 | $ 21.04 | $ 17.64 |
Total Return B,C,D | 32.39% | 19.34% | 29.22% | 21.43% | 42.83% |
Ratios to Average Net Assets F,J | | | | | |
Expenses before reductions | 2.26% | 2.38% | 2.41% | 2.43% | 2.57% A |
Expenses net of fee waivers,
if any | 2.26% | 2.38% | 2.41% | 2.43% | 2.57% A |
Expenses net of all reductions | 2.22% | 2.32% | 2.38% | 2.40% | 2.55% A |
Net investment income (loss) | (.62)% | (.81)% | (.54)% | (.62)% | (.52)% A |
Supplemental Data | | | | | |
Net assets, end of period
(in millions) | $ 20 | $ 21 | $ 25 | $ 9 | $ 1 |
Portfolio turnover rate G | 70% | 84% | 79% | 77% | 84% A |
A Annualized
B Total returns for periods of less than one year are not annualized.
C Total returns would have been lower had certain expenses not been reduced during the periods shown.
D Total returns do not include the effect of the contingent deferred sales charge.
E Calculated based on average shares outstanding during the period.
F Fees and expenses of the underlying Fidelity Central Funds are not included in the Fund's expense ratio. The Fund indirectly bears its proportionate share of the expenses of any underlying Fidelity Central Funds.
G Amount does not include the portfolio activity of any underlying Fidelity Central Funds.
H Investment income per share reflects a special dividend which amounted to $.01 per share.
I For the period May 27, 2003 (commencement of sale of shares) to October 31, 2003.
J Expense ratios reflect operating expenses of the class. Expenses before reductions do not reflect amounts reimbursed by the investment adviser or reductions from brokerage service arrangements or other expense offset arrangements and do not represent the amount paid by the class during periods when reimbursements or reductions occur. Expense ratios before reductions for start-up periods may not be representative of longer-term operating periods. Expenses net of fee waivers reflect expenses after reimbursement by the investment adviser but prior to reductions from brokerage service arrangements or other expense offset arrangements. Expenses net of all reductions represent the net expenses paid by the class.
K Amount represents less than $.01 per share.
See accompanying notes which are an integral part of the financial statements.
Annual Report
Financial Highlights - International Small Cap
Years ended October 31, | 2007 | 2006 | 2005 | 2004 | 2003 |
Selected Per-Share Data | | | | | |
Net asset value, beginning of period | $ 29.03 | $ 26.89 | $ 21.36 | $ 17.71 | $ 9.87 |
Income from Investment Operations | | | | | |
Net investment income (loss) C | .12 | .08 | .15 | .10 | .07 F |
Net realized and unrealized gain (loss) | 8.03 | 5.08 | 6.19 | 3.84 | 7.75 |
Total from investment operations | 8.15 | 5.16 | 6.34 | 3.94 | 7.82 |
Distributions from net investment income | (.07) | (.14) | (.06) | (.02) | - |
Distributions from net realized gain | (5.67) | (2.89) | (.77) | (.31) | (.02) |
Total distributions | (5.74) | (3.03) | (.83) | (.33) | (.02) |
Redemption fees added to paid in capital C | - H | .01 | .02 | .04 | .04 |
Net asset value, end of period | $ 31.44 | $ 29.03 | $ 26.89 | $ 21.36 | $ 17.71 |
Total Return A,B | 33.82% | 20.65% | 30.67% | 22.84% | 79.78% |
Ratios to Average Net Assets D,G | | | | | |
Expenses before reductions | 1.19% | 1.28% | 1.28% | 1.30% | 1.54% |
Expenses net of fee waivers,
if any | 1.19% | 1.28% | 1.28% | 1.30% | 1.54% |
Expenses net of all reductions | 1.15% | 1.22% | 1.25% | 1.28% | 1.51% |
Net investment income (loss) | .45% | .29% | .59% | .50% | .46% |
Supplemental Data | | | | | |
Net assets, end of period
(in millions) | $ 1,664 | $ 1,816 | $ 2,090 | $ 1,091 | $ 547 |
Portfolio turnover rate E | 70% | 84% | 79% | 77% | 84% |
A Total returns for periods of less than one year are not annualized.
B Total returns would have been lower had certain expenses not been reduced during the periods shown.
C Calculated based on average shares outstanding during the period.
D Fees and expenses of the underlying Fidelity Central Funds are not included in the Fund's expense ratio. The Fund indirectly bears its proportionate share of the expenses of any underlying Fidelity Central Funds.
E Amount does not include the portfolio activity of any underlying Fidelity Central Funds.
F Investment income per share reflects a special dividend which amounted to $.03 per share.
G Expense ratios reflect operating expenses of the class. Expenses before reductions do not reflect amounts reimbursed by the investment adviser or reductions from brokerage service arrangements or other expense offset arrangements and do not represent the amount paid by the class during periods when reimbursements or reductions occur. Expenses net of fee waivers reflect expenses after reimbursement by the investment adviser but prior to reductions from brokerage service arrangements or other expense offset arrangements. Expenses net of all reductions represent the net expenses paid by the class.
H Amount represents less than $.01 per share.
See accompanying notes which are an integral part of the financial statements.
Annual Report
Financial Highlights - Institutional Class
Years ended October 31, | 2007 | 2006 | 2005 | 2004 | 2003 H |
Selected Per-Share Data | | | | | |
Net asset value, beginning of period | $ 28.99 | $ 26.86 | $ 21.36 | $ 17.72 | $ 12.35 |
Income from Investment Operations | | | | | |
Net investment income (loss) D | .12 | .08 | .14 | .10 | .04 G |
Net realized and unrealized gain (loss) | 8.01 | 5.07 | 6.18 | 3.84 | 5.31 |
Total from investment operations | 8.13 | 5.15 | 6.32 | 3.94 | 5.35 |
Distributions from net investment income | (.07) | (.14) | (.07) | (.03) | - |
Distributions from net realized gain | (5.67) | (2.89) | (.77) | (.31) | - |
Total distributions | (5.74) | (3.03) | (.84) | (.34) | - |
Redemption fees added to paid in capital D | - J | .01 | .02 | .04 | .02 |
Net asset value, end of period | $ 31.38 | $ 28.99 | $ 26.86 | $ 21.36 | $ 17.72 |
Total Return B,C | 33.84% | 20.65% | 30.59% | 22.84% | 43.48% |
Ratios to Average Net Assets E,I |
| | | | |
Expenses before reductions | 1.18% | 1.29% | 1.30% | 1.32% | 1.51% A |
Expenses net of fee waivers,
if any | 1.18% | 1.29% | 1.30% | 1.32% | 1.51% A |
Expenses net of all reductions | 1.14% | 1.23% | 1.27% | 1.29% | 1.48% A |
Net investment income (loss) | .45% | .28% | .57% | .49% | .54% A |
Supplemental Data | | | | | |
Net assets, end of period
(in millions) | $ 8 | $ 9 | $ 7 | $ 3 | $ .4 |
Portfolio turnover rate F | 70% | 84% | 79% | 77% | 84% A |
A Annualized
B Total returns for periods of less than one year are not annualized.
C Total returns would have been lower had certain expenses not been reduced during the periods shown.
D Calculated based on average shares outstanding during the period.
E Fees and expenses of the underlying Fidelity Central Funds are not included in the Fund's expense ratio. The Fund indirectly bears its proportionate share of the expenses of any underlying Fidelity Central Funds.
F Amount does not include the portfolio activity of any underlying Fidelity Central Funds.
G Investment income per share reflects a special dividend which amounted to $.01 per share.
H For the period May 27, 2003 (commencement of sale of shares) to October 31, 2003.
I Expense ratios reflect operating expenses of the class. Expenses before reductions do not reflect amounts reimbursed by the investment adviser or reductions from brokerage service arrangements or other expense offset arrangements and do not represent the amount paid by the class during periods when reimbursements or reductions occur. Expense ratios before reductions for start-up periods may not be representative of longer-term operating periods. Expenses net of fee waivers reflect expenses after reimbursement by the investment adviser but prior to reductions from brokerage service arrangements or other expense offset arrangements. Expenses net of all reductions represent the net expenses paid by the class.
J Amount represents less than $.01 per share.
See accompanying notes which are an integral part of the financial statements.
Annual Report
Notes to Financial Statements
For the period ended October 31, 2007
(Amounts in thousands except ratios)
1. Organization.
Fidelity International Small Cap Fund (the Fund) is a fund of Fidelity Investment Trust (the trust) and is authorized to issue an unlimited number of shares. The trust is registered under the Investment Company Act of 1940, as amended (the 1940 Act), as an open-end management investment company organized as a Massachusetts business trust.
The Fund offers Class A, Class T, Class B, Class C, International Small Cap and Institutional Class shares, each of which has equal rights as to assets and voting privileges. Each class has exclusive voting rights with respect to matters that affect that class. Class B shares will automatically convert to Class A shares after a holding period of seven years from the initial date of purchase. Investment income, realized and unrealized capital gains and losses, the common expenses of the Fund, and certain fund-level expense reductions, if any, are allocated on a pro rata basis to each class based on the relative net assets of each class to the total net assets of the Fund. Each class differs with respect to transfer agent and distribution and service plan fees incurred. Certain expense reductions also differ by class.
2. Investments in Fidelity Central Funds.
The Fund may invest in Fidelity Central Funds, which are open-end investment companies available only to other investment companies and accounts managed by Fidelity Management & Research Company (FMR) and its affiliates. The Fund's Schedule of Investments lists each of the Fidelity Central Funds as an investment of the Fund, but does not include the underlying holdings of each Fidelity Central Fund. As an Investing Fund, the Fund indirectly bears its proportionate share of the expenses of the underlying Fidelity Central Funds.
The Money Market Central Funds seek preservation of capital and current income and are managed by Fidelity Investments Money Management, Inc. (FIMM), an affiliate of FMR.
A complete list of holdings for each Fidelity Central Fund is available upon request or at the SEC's web site at www.sec.gov. In addition, the financial statements of the Fidelity Central Funds, which are not covered by the Fund's Report of Independent Registered Public Accounting Firm, are available on the SEC's web site or upon request.
3. Significant Accounting Policies.
The financial statements have been prepared in conformity with accounting principles generally accepted in the United States of America, which require management to make certain estimates and assumptions at the date of the financial statements. The following summarizes the significant accounting policies of the Fund:
Annual Report
Notes to Financial Statements - continued
(Amounts in thousands except ratios)
3. Significant Accounting Policies - continued
Security Valuation. Investments are valued and net asset value (NAV) per share is calculated (NAV calculation) as of the close of business of the New York Stock Exchange (NYSE), normally 4:00 p.m. Eastern time. Wherever possible, the Fund uses independent pricing services approved by the Board of Trustees to value its investments.
Equity securities, including restricted securities, for which market quotations are readily available, are valued at the last reported sale price or official closing price as reported by an independent pricing service on the primary market or exchange on which they are traded. In the event there were no sales during the day or closing prices are not available, securities are valued at the last quoted bid price. Debt securities, including restricted securities, for which quotations are readily available, are valued by independent pricing services or by dealers who make markets in such securities. Pricing services consider yield or price of bonds of comparable quality, coupon, maturity and type as well as dealer supplied prices. Investments in open-end mutual funds, including the Fidelity Central Funds, are valued at their closing net asset value each business day. Short-term securities with remaining maturities of sixty days or less for which quotations are not readily available are valued at amortized cost, which approximates value.
When current market prices or quotations are not readily available or do not accurately reflect fair value, valuations may be determined in accordance with procedures adopted by the Board of Trustees. For example, when developments occur between the close of a market and the close of the NYSE that may materially affect the value of some or all of the securities, or when trading in a security is halted, those securities may be fair valued. Factors used in the determination of fair value may include monitoring news to identify significant market or security specific events such as changes in the value of U.S. securities markets, reviewing developments in foreign markets and evaluating the performance of ADRs, futures contracts and exchange-traded funds. Because the Fund's utilization of fair value pricing depends on market activity, the frequency with which fair value pricing is used cannot be predicted and may be utilized to a significant extent. The value of securities used for NAV calculation under fair value pricing may differ from published prices for the same securities.
Foreign Currency. The Fund uses foreign currency contracts to facilitate transactions in foreign-denominated securities. Losses from these transactions may arise from changes in the value of the foreign currency or if the counterparties do not perform under the contracts' terms.
Foreign-denominated assets, including investment securities, and liabilities are translated into U.S. dollars at the exchange rate at period end. Purchases and sales of investment securities, income and dividends received and expenses denominated in foreign currencies are translated into U.S. dollars at the exchange rate in effect on the transaction date.
Annual Report
3. Significant Accounting Policies - continued
Foreign Currency - continued
The effects of exchange rate fluctuations on investments are included with the net realized and unrealized gain (loss) on investment securities. Other foreign currency transactions resulting in realized and unrealized gain (loss) are disclosed separately.
Investment Transactions and Income. For financial reporting purposes, the Fund's investment holdings and NAV include trades executed through the end of the last business day of the period. The NAV for processing shareholder transactions includes trades executed through the end of the prior business day. Gains and losses on securities sold are determined on the basis of identified cost. Dividend income is recorded on the ex-dividend date, except for certain dividends from foreign securities where the ex-dividend date may have passed, which are recorded as soon as the Fund is informed of the ex-dividend date. Non-cash dividends included in dividend income, if any, are recorded at the fair market value of the securities received. Distributions received on securities that represent a return of capital or capital gain are recorded as a reduction of cost of investments and/or as a realized gain. The Fund estimates the components of distributions received that may be considered return of capital distributions or capital gain distributions. Interest income and distributions from the Fidelity Central Funds are accrued as earned. Interest income includes coupon interest and amortization of premium and accretion of discount on debt securities. Investment income is recorded net of foreign taxes withheld where recovery of such taxes is uncertain.
Expenses. Most expenses of the trust can be directly attributed to a fund. Expenses which cannot be directly attributed are apportioned among each Fund in the trust. Expense estimates are accrued in the period to which they relate and adjustments are made when actual amounts are known.
Income Tax Information and Distributions to Shareholders. Each year, the Fund intends to qualify as a regulated investment company by distributing all of its taxable income and realized gains under Subchapter M of the Internal Revenue Code. As a result, no provision for income taxes is required in the accompanying financial statements. Foreign taxes are provided for based on the Fund's understanding of the tax rules and rates that exist in the foreign markets in which it invests.
Distributions are recorded on the ex-dividend date. Income dividends and capital gain distributions are declared separately for each class. Income and capital gain distributions are determined in accordance with income tax regulations, which may differ from generally accepted accounting principles. In addition, the Fund will claim a portion of the payment made to redeeming shareholders as a distribution for income tax purposes.
Annual Report
Notes to Financial Statements - continued
(Amounts in thousands except ratios)
3. Significant Accounting Policies - continued
Income Tax Information and Distributions to Shareholders - continued
Capital accounts within the financial statements are adjusted for permanent book-tax differences. Certain adjustments have been made to the accounts relating to prior periods. Collectively, these adjustments have no impact on net assets or the results of operations. Temporary book-tax differences will reverse in a subsequent period.
Book-tax differences are primarily due to foreign currency transactions, certain foreign taxes, passive foreign investment companies (PFIC) and losses deferred due to wash sales.
The tax-basis components of distributable earnings and the federal tax cost as of period end were as follows:
Unrealized appreciation | $ 557,218 |
Unrealized depreciation | (127,347) |
Net unrealized appreciation (depreciation) | 429,871 |
Undistributed ordinary income | 79,370 |
Undistributed long-term capital gain | 220,528 |
| |
Cost for federal income tax purposes | $ 1,449,071 |
The tax character of distributions paid was as follows:
| October 31, 2007 | October 31, 2006 |
Ordinary Income | $ 43,869 | $ 66,631 |
Long-term Capital Gains | 310,922 | 178,636 |
Total | $ 354,791 | $ 245,267 |
Short-Term Trading (Redemption) Fees. Shares held in the Fund less than 90 days are subject to a redemption fee equal to 2.00% of the proceeds of the redeemed shares. All redemption fees, including any estimated redemption fees paid by FMR, are retained by the Fund and accounted for as an addition to paid in capital.
New Accounting Pronouncements. In July 2006, Financial Accounting Standards Board Interpretation No. 48, Accounting for Uncertainty in Income Taxes - an interpretation of FASB Statement 109 (FIN 48), was issued and is effective on the last business day of the semiannual reporting period for fiscal years beginning after December 15, 2006. FIN 48 sets forth a threshold for financial statement recognition, measurement and disclosure of a tax position taken or expected to be taken on a tax return. Management has concluded that the adoption of FIN 48 will not result in a material impact on the Fund's net assets, results of operations and financial statement disclosures.
Annual Report
3. Significant Accounting Policies - continued
New Accounting Pronouncements - continued
In addition, in September 2006, Statement of Financial Accounting Standards No. 157, Fair Value Measurements (SFAS 157), was issued and is effective for fiscal years beginning after November 15, 2007. SFAS 157 defines fair value, establishes a framework for measuring fair value and expands disclosures about fair value measurements. Management is currently evaluating the impact the adoption of SFAS 157 will have on the Fund's financial statement disclosures.
4. Operating Policies.
Repurchase Agreements. FMR has received an Exemptive Order from the Securities and Exchange Commission (the SEC) which permits the Fund and other affiliated entities of FMR to transfer uninvested cash balances into joint trading accounts which are then invested in repurchase agreements. The Fund may also invest directly with institutions in repurchase agreements. Repurchase agreements are collateralized by government or non-government securities. Upon settlement date, collateral is held in segregated accounts with custodian banks and may be obtained in the event of a default of the counterparty. The Fund monitors, on a daily basis, the value of the collateral to ensure it is at least equal to the principal amount of the repurchase agreement (including accrued interest). In the event of a default by the counterparty, realization of the collateral proceeds could be delayed, during which time the value of the collateral may decline.
Restricted Securities. The Fund may invest in securities that are subject to legal or contractual restrictions on resale. These securities generally may be resold in transactions exempt from registration or to the public if the securities are registered. Disposal of these securities may involve time-consuming negotiations and expense, and prompt sale at an acceptable price may be difficult. Information regarding restricted securities is included at the end of the Fund's Schedule of Investments.
5. Purchases and Sales of Investments.
Purchases and sales of securities, other than short-term securities and U.S. government securities, aggregated $1,176,947 and $1,820,033, respectively.
6. Fees and Other Transactions with Affiliates.
Management Fee. FMR and its affiliates provide the Fund with investment management related services for which the Fund pays a monthly management fee. The management fee is the sum of an individual fund fee rate that is based on an annual rate of .60% of the Fund's average net assets and a group fee rate that averaged ..26% during the
Annual Report
Notes to Financial Statements - continued
(Amounts in thousands except ratios)
6. Fees and Other Transactions with Affiliates - continued
Management Fee - continued
period. The group fee rate is based upon the average net assets of all the mutual funds advised by FMR. The group fee rate decreases as assets under management increase and increases as assets under management decrease. In addition, the management fee is subject to a performance adjustment (up to a maximum of ± .20% of the Fund's average net assets over a 36 month performance period). The upward or downward adjustment to the management fee is based on the relative investment performance of the retail class of the Fund, International Small Cap as compared to an appropriate benchmark index. For the period, the total annual management fee rate, including the performance adjustment, was .88% of the Fund's average net assets.
Distribution and Service Plan. In accordance with Rule 12b-1 of the 1940 Act, the Fund has adopted separate Distribution and Service Plans for each class of shares. Certain classes pay Fidelity Distributors Corporation (FDC), an affiliate of FMR, separate Distribution and Service Fees, each of which is based on an annual percentage of each class' average net assets. In addition, FDC may pay financial intermediaries for selling shares of the Fund and providing shareholder support services. For the period, the Distribution and Service Fee rates and the total amounts paid to and retained by FDC were as follows:
| Distribution
Fee | Service
Fee | Paid to
FDC | Retained
by FDC |
Class A | 0% | .25% | $ 89 | $ 5 |
Class T | .25% | .25% | 195 | - |
Class B | .75% | .25% | 107 | 80 |
Class C | .75% | .25% | 195 | 19 |
| | | $ 586 | $ 104 |
Sales Load. FDC receives a front-end sales charge of up to 5.75% for selling Class A shares, and 3.50% for selling Class T shares, some of which is paid to financial intermediaries for selling shares of the Fund. FDC receives the proceeds of contingent deferred sales charges levied on Class A, Class T, Class B, and Class C redemptions. These charges depend on the holding period. The deferred sales charges range from 5% to 1% for Class B, 1% for Class C, 1.00% to .50% for certain purchases of Class A shares and .25% for certain purchases of Class T shares.
Annual Report
6. Fees and Other Transactions with Affiliates - continued
Sales Load - continued
For the period, sales charge amounts retained by FDC were as follows:
| Retained
by FDC |
Class A | $ 4 |
Class T | 3 |
Class B* | 20 |
Class C* | 3 |
| $ 30 |
* When Class B and Class C shares are initially sold, FDC pays commissions from its own resources to financial intermediaries through which the sales are made.
Transfer Agent Fees. Fidelity Investments Institutional Operations Company, Inc. (FIIOC), an affiliate of FMR, is the transfer, dividend disbursing and shareholder servicing agent for each class of the Fund, except for International Small Cap. Fidelity Service Company, Inc. (FSC), an affiliate of FMR, is the transfer agent for International Small Cap shares. FIIOC and FSC receive account fees and asset-based fees that vary according to the account size and type of account of the shareholders of the respective classes of the Fund. FIIOC and FSC pay for typesetting, printing and mailing of shareholder reports, except proxy statements. For the period, the total transfer agent fees paid by each class to FIIOC or FSC, were as follows:
| Amount | % of
Average
Net Assets |
Class A | $ 107 | .30 |
Class T | 114 | .29 |
Class B | 34 | .32 |
Class C | 54 | .28 |
International Small Cap | 3,363 | .21 |
Institutional Class | 16 | .20 |
| $ 3,688 | |
Accounting and Security Lending Fees. FSC maintains the Fund's accounting records. The accounting fee is based on the level of average net assets for the month. Under a separate contract, FSC administers the security lending program. The security lending fee is based on the number and duration of lending transactions.
Annual Report
Notes to Financial Statements - continued
(Amounts in thousands except ratios)
7. Committed Line of Credit.
The Fund participates with other funds managed by FMR in a $4.2 billion credit facility (the "line of credit") to be utilized for temporary or emergency purposes to fund shareholder redemptions or for other short-term liquidity purposes. The Fund has agreed to pay commitment fees on its pro rata portion of the line of credit, which amounted to $4 and is reflected in Miscellaneous Expense on the Statement of Operations. During the period, there were no borrowings on this line of credit.
8. Security Lending.
The Fund lends portfolio securities from time to time in order to earn additional income. On the settlement date of the loan, the Fund receives collateral (in the form of U.S. Treasury obligations, letters of credit and/or cash) against the loaned securities and maintains collateral in an amount not less than 100% of the market value of the loaned securities during the period of the loan. The market value of the loaned securities is determined at the close of business of the Fund and any additional required collateral is delivered to the Fund on the next business day. If the borrower defaults on its obligation to return the securities loaned because of insolvency or other reasons, a fund could experience delays and costs in recovering the securities loaned or in gaining access to the collateral. Any cash collateral received is invested in the Fidelity Securities Lending Cash Central Fund. The value of loaned securities and cash collateral at period end are disclosed on the Fund's Statement of Assets and Liabilities. Security lending income represents the income earned on investing cash collateral, less fees and expenses associated with the loan, plus any premium payments that may be received on the loan of certain types of securities. Security lending income is presented in the Statement of Operations as a component of income from Fidelity Central Funds.
9. Expense Reductions.
Many of the brokers with whom FMR places trades on behalf of the Fund provided services to the Fund in addition to trade execution. These services included payments of certain expenses on behalf of the Fund totaling $673 for the period. During the period, these credits reduced the Fund's custody expenses by $1. During the period, credits reduced each class' transfer agent expense as noted in the table below.
| Transfer Agent
expense reduction | |
International Small Cap | $ 32 | |
Annual Report
10. Other.
The Fund's organizational documents provide former and current trustees and officers with a limited indemnification against liabilities arising in connection with the performance of their duties to the Fund. In the normal course of business, the Fund may also enter into contracts that provide general indemnifications. The Fund's maximum exposure under these arrangements is unknown as this would be dependent on future claims that may be made against the Fund. The risk of material loss from such claims is considered remote.
In September 2006, FIIOC, the Fund's transfer agent, notified the Fund that the Fund's books and records did not reflect a conversion of certain Class B to Class A shares upon their conversion date. In March 2007, FIIOC converted the relevant Class B shares to Class A shares and recorded the conversion in the books and records of the Fund which did not result in a material impact to the Fund's reported net assets or results of operations in the accompanying financial statements. FIIOC has remediated affected shareholders and reimbursed the Fund for all related audit and legal expenses.
The United States Securities and Exchange Commission ("SEC") is conducting an investigation of FMR (covering the years 2002 to 2004) arising from gifts, gratuities and business entertainment provided by certain brokers to certain individuals who were employed on FMR's domestic equity trading desk during that period. FMR is in discussions with the SEC staff regarding the possible resolution of the matter, but as of period-end no final resolution has been reached.
In December 2006, the Independent Trustees completed their own investigation of the matter with the assistance of independent counsel. The Independent Trustees and FMR agree that, despite the absence of proof that the Fidelity mutual funds experienced diminished execution quality as a result of the improper receipt of gifts and business entertainment, the conduct at issue was serious and is worthy of redress. Accordingly, the Independent Trustees have requested and FMR has agreed to pay $42 million to Fidelity mutual funds, plus interest to be determined at the time that payment is made. A method of allocating this payment among the funds has not yet been determined. The total payment to the Fund is not anticipated to have a material impact on the Fund's net assets. In addition, FMR reimbursed related legal expenses which are recorded in the accompanying Statement of Operations as an expense reduction.
Annual Report
Notes to Financial Statements - continued
(Amounts in thousands except ratios)
11. Distributions to Shareholders.
Distributions to shareholders of each class were as follows:
| Years ended October 31, |
| 2007 | 2006 |
From net investment income | | |
Class A | $ - | $ 62 |
International Small Cap | 3,765 | 10,726 |
Institutional Class | 22 | 42 |
Total | $ 3,787 | $ 10,829 |
From net realized gain | | |
Class A | $ 6,864 | $ 3,713 |
Class T | 7,706 | 4,531 |
Class B | 2,092 | 1,339 |
Class C | 3,882 | 2,560 |
International Small Cap | 328,782 | 221,459 |
Institutional Class | 1,678 | 836 |
Total | $ 351,004 | $ 234,438 |
12. Share Transactions.
Transactions for each class of shares were as follows:
| Shares | Dollars |
| Years ended October 31, | Years ended October 31, |
| 2007 | 2006 | 2007 | 2006 |
Class A | | | | |
Shares sold | 268 | 335 | $ 7,316 | $ 9,788 |
Reinvestment of distributions | 252 | 125 | 6,096 | 3,194 |
Shares redeemed | (556) | (490) | (14,980) | (14,008) |
Net increase (decrease) | (36) | (30) | $ (1,568) | $ (1,026) |
Class T | | | | |
Shares sold | 226 | 413 | $ 6,120 | $ 11,877 |
Reinvestment of distributions | 297 | 165 | 7,166 | 4,209 |
Shares redeemed | (671) | (679) | (17,855) | (19,325) |
Net increase (decrease) | (148) | (101) | $ (4,569) | $ (3,239) |
Class B | | | | |
Shares sold | 19 | 69 | $ 519 | $ 1,926 |
Reinvestment of distributions | 79 | 48 | 1,892 | 1,211 |
Shares redeemed | (149) | (202) | (3,957) | (5,665) |
Net increase (decrease) | (51) | (85) | $ (1,546) | $ (2,528) |
Annual Report
12. Share Transactions - continued
| Shares | Dollars |
| Years ended October 31, | Years ended October 31, |
| 2007 | 2006 | 2007 | 2006 |
Class C | | | | |
Shares sold | 56 | 146 | $ 1,462 | $ 4,106 |
Reinvestment of distributions | 124 | 80 | 2,967 | 2,033 |
Shares redeemed | (277) | (431) | (7,298) | (11,929) |
Net increase (decrease) | (97) | (205) | $ (2,869) | $ (5,790) |
International Small Cap | | | | |
Shares sold | 7,028 | 17,580 | $ 194,113 | $ 512,573 |
Reinvestment of distributions | 12,767 | 8,379 | 311,000 | 216,010 |
Shares redeemed | (29,445) | (41,151) | (791,655) | (1,173,251) |
Net increase (decrease) | (9,650) | (15,192) | $ (286,542) | $ (444,668) |
Institutional Class | | | | |
Shares sold | 47 | 124 | $ 1,226 | $ 3,656 |
Reinvestment of distributions | 39 | 20 | 938 | 506 |
Shares redeemed | (150) | (109) | (3,984) | (3,132) |
Net increase (decrease) | (64) | 35 | $ (1,820) | $ 1,030 |
Annual Report
Report of Independent Registered Public Accounting Firm
To the Trustees of Fidelity Investment Trust and Shareholders of Fidelity International Small Cap Fund:
We have audited the accompanying statement of assets and liabilities of Fidelity International Small Cap Fund (the Fund), a fund of Fidelity Investment Trust, including the schedule of investments, as of October 31, 2007, and the related statement of operations for the year then ended, the statement of changes in net assets for each of the two years in the period then ended, and the financial highlights for each of the four years in the period then ended and for the period from May 27, 2003 (commencement of operations) to October 31, 2003. These financial statements and financial highlights are the responsibility of the Fund's management. Our responsibility is to express an opinion on these financial statements and financial highlights based on our audits.
We conducted our audits in accordance with standards of the Public Company Accounting Oversight Board (United States). Those standards require that we plan and perform the audit to obtain reasonable assurance about whether the financial statements and financial highlights are free of material misstatement. The Fund is not required to have, nor were we engaged to perform, an audit of its internal control over financial reporting. Our audits included consideration of internal control over financial reporting as a basis for designing audit procedures that are appropriate in the circumstances, but not for the purpose of expressing an opinion on the effectiveness of the Fund's internal control over financial reporting. Accordingly, we express no such opinion. An audit also includes examining, on a test basis, evidence supporting the amounts and disclosures in the financial statements, assessing the accounting principles used and significant estimates made by management, as well as evaluating the overall financial statement presentation. Our procedures included confirmation of securities owned as of October 31, 2007, by correspondence with the custodians and brokers; where replies were not received from brokers, we performed other auditing procedures. We believe that our audits provide a reasonable basis for our opinion.
In our opinion, the financial statements and financial highlights referred to above present fairly, in all material respects, the financial position of Fidelity International Small Cap Fund as of October 31, 2007, the results of its operations for the year then ended, the changes in its net assets for each of the two years in the period then ended, and its financial highlights for each of the four years in the period then ended and for the period from May 27, 2003 (commencement of operations) to October 31, 2003, in conformity with accounting principles generally accepted in the United States of America.
/s/ Deloitte & Touche LLP
DELOITTE & TOUCHE LLP
Boston, Massachusetts
December 21, 2007
Annual Report
Trustees and Officers
The Trustees, Members of the Advisory Board, and executive officers of the trust and fund, as applicable, are listed below. The Board of Trustees governs the fund and is responsible for protecting the interests of shareholders. The Trustees are experienced executives who meet periodically throughout the year to oversee the fund's activities, review contractual arrangements with companies that provide services to the fund, and review the fund's performance. Except for James C. Curvey, each of the Trustees oversees 370 funds advised by FMR or an affiliate. Mr. Curvey oversees 340 funds advised by FMR or an affiliate.
The Trustees hold office without limit in time except that (a) any Trustee may resign; (b) any Trustee may be removed by written instrument, signed by at least two-thirds of the number of Trustees prior to such removal; (c) any Trustee who requests to be retired or who has become incapacitated by illness or injury may be retired by written instrument signed by a majority of the other Trustees; and (d) any Trustee may be removed at any special meeting of shareholders by a two-thirds vote of the outstanding voting securities of the trust. Each Trustee who is not an interested person (as defined in the 1940 Act) (Independent Trustee), shall retire not later than the last day of the calendar year in which his or her 72nd birthday occurs. The Independent Trustees may waive this mandatory retirement age policy with respect to individual Trustees. The executive officers and Advisory Board Members hold office without limit in time, except that any officer and Advisory Board Member may resign or may be removed by a vote of a majority of the Trustees at any regular meeting or any special meeting of the Trustees. Except as indicated, each individual has held the office shown or other offices in the same company for the past five years.
The fund's Statement of Additional Information (SAI) includes more information about the Trustees. To request a free copy, call Fidelity at 1-800-544-8544.
Interested Trustees*:
Correspondence intended for each Trustee who is an interested person may be sent to Fidelity Investments, 82 Devonshire Street, Boston, Massachusetts 02109.
Name, Age; Principal Occupation |
Edward C. Johnson 3d (77) |
| Year of Election or Appointment: 1984 Mr. Johnson is Chairman of the Board of Trustees. Mr. Johnson serves as President (2006-present), Chief Executive Officer, Chairman, and a Director of FMR LLC; Chairman and a Director of FMR; Chairman and a Director of Fidelity Research & Analysis Company (FRAC); Chairman and a Director of Fidelity Investments Money Management, Inc.; and Chairman (2001-present) and a Director of FMR Co., Inc. In addition, Mr. Johnson serves as Chairman and Director of Fidelity International Limited (FIL). |
Name, Age; Principal Occupation |
James C. Curvey (72) |
| Year of Election or Appointment: 2007 Mr. Curvey also serves as Trustee (2007-present) or Member of the Advisory Board (2007-present) of other investment companies advised by FMR. Mr. Curvey is a Director of FMR and FMR Co., Inc. (2007- present). Mr. Curvey is also Vice Chairman (2006-present) and Director of FMR LLC. Mr. Curvey joined Fidelity in 1982 and served in numerous senior management positions, including President and Chief Operating Officer of FMR LLC (1997-2000) and President of Fidelity Strategic Investments (2000-2002). In addition, he serves as a member of the Board of Directors of Geerlings & Wade, Inc. (wine distribution). |
* Trustees have been determined to be "Interested Trustees" by virtue of, among other things, their affiliation with the trust or various entities under common control with FMR. FMR Corp. merged with FMR LLC on October 1, 2007. Any references to FMR LLC for prior periods are deemed to be references to the prior entity.
Independent Trustees:
Correspondence intended for each Independent Trustee (that is, the Trustees other than the Interested Trustees) may be sent to Fidelity Investments, P.O. Box 55235, Boston, Massachusetts 02205-5235.
Name, Age; Principal Occupation |
Dennis J. Dirks (59) |
| Year of Election or Appointment: 2005 Prior to his retirement in May 2003, Mr. Dirks was Chief Operating Officer and a member of the Board of The Depository Trust & Clearing Corporation (DTCC) (1999-2003). He also served as President, Chief Operating Officer, and Board member of The Depository Trust Com-pany (DTC) (1999-2003) and President and Board member of the National Securities Clearing Corporation (NSCC) (1999-2003). In addition, Mr. Dirks served as Chief Executive Officer and Board member of the Government Securities Clearing Corporation (2001-2003) and Chief Executive Officer and Board member of the Mortgage-Backed Securities Clearing Corporation (2001-2003). Mr. Dirks also serves as a Trustee and a member of the Finance Committee of Manhattan College (2005-
present) and a Trustee and a member of the Finance Committee of AHRC of Nassau County (2006-present). |
Albert R. Gamper, Jr. (65) |
| Year of Election or Appointment: 2006 Prior to his retirement in December 2004, Mr. Gamper served as Chairman of the Board of CIT Group Inc. (commercial finance). During his tenure with CIT Group Inc. Mr. Gamper served in numerous senior management positions, including Chairman (1987-1989; 1999-2001; 2002-2004), Chief Executive Officer (1987-2004), and President (1989-2002). He currently serves as a member of the Board of Directors of Public Service Enterprise Group (utilities, 2001-present), Chairman of the Board of Governors, Rutgers University (2004-present), and Chairman of the Board of Saint Barnabas Health Care System. |
George H. Heilmeier (71) |
| Year of Election or Appointment: 2004 Dr. Heilmeier is Chairman Emeritus of Telcordia Technologies (communication software and systems), where prior to his retirement, he served as company Chairman and Chief Executive Officer. He currently serves on the Boards of Directors of The Mitre Corporation (systems engineering and information technology support for the government), and HRL Laboratories (private research and development, 2004-present). He is Chairman of the General Motors Science & Technology Advisory Board and a Life Fellow of the Institute of Electrical and Electronics Engineers (IEEE). Dr. Heilmeier is a member of the Defense Science Board and the National Security Agency Advisory Board. He is also a member of the National Academy of Engineering, the American Academy of Arts and Sciences, and the Board of Overseers of the School of Engineering and Applied Science of the University of Pennsylvania. Previously, Dr. Heilmeier served as a Director of TRW Inc. (automotive, space, defense, and information technology, 1992-2002), Compaq (1994-2002), Automatic Data Processing, Inc. (ADP) (technology-based business outsourcing, 1995-2002), INET Technologies Inc. (telecommunications network surveillance, 2001-2004), and Teletech Holdings (customer management services). He is the recipient of the 2005 Kyoto Prize in Advanced Technology for his invention of the liquid crystal display, and a member of the Consumer Electronics Hall of Fame. |
James H. Keyes (67) |
| Year of Election or Appointment: 2007 Prior to his retirement in 2003, Mr. Keyes was Chairman, President, and Chief Executive Officer of Johnson Controls, Inc. (automotive supplier, 1993-2003). He currently serves as a member of the boards of LSI Logic Corporation (semiconductor technologies), Navistar International Corporation (manufacture and sale of trucks, buses, and diesel engines, 2002-present), and Pitney Bowes, Inc. (integrated mail, messaging, and document management solutions). |
Marie L. Knowles (61) |
| Year of Election or Appointment: 2001 Prior to Ms. Knowles' retirement in June 2000, she served as Executive Vice President and Chief Financial Officer of Atlantic Richfield Company (ARCO) (diversified energy, 1996-2000). From 1993 to 1996, she was a Senior Vice President of ARCO and President of ARCO Transportation Company. She served as a Director of ARCO from 1996 to 1998. She currently serves as a Director of Phelps Dodge Corporation (copper mining and manufacturing) and McKesson Corporation (healthcare service, 2002-present). Ms. Knowles is a Trustee of the Brookings Institution and the Catalina Island Conservancy and also serves as a member of the Advisory Board for the School of Engineering of the University of Southern California. |
Ned C. Lautenbach (63) |
| Year of Election or Appointment: 2000 Mr. Lautenbach is Chairman of the Independent Trustees (2006-present). Mr. Lautenbach has been a partner of Clayton, Dubilier & Rice, Inc. (private equity investment firm) since September 1998. Previously, Mr. Lautenbach was with the International Business Machines Corporation (IBM) from 1968 until his retirement in 1998. Mr. Lautenbach serves as a Director of Sony Corporation (2006-present) and Eaton Corporation (diversified industrial) as well as the Philharmonic Center for the Arts in Naples, Florida. He also is a member of the Board of Trustees of Fairfield University (2005-present), as well as a member of the Council on Foreign Relations. |
Cornelia M. Small (63) |
| Year of Election or Appointment: 2005 Ms. Small is a member (2000-present) and Chairperson (2002-present) of the Investment Committee, and a member (2002-present) of the Board of Trustees of Smith College. Previously, she served as Chief Investment Officer (1999-2000), Director of Global Equity Investments (1996-1999), and a member of the Board of Directors of Scudder, Stevens & Clark (1990-1997) and Scudder Kemper Investments (1997-
1999). In addition, Ms. Small served as Co-Chair (2000-2003) of the Annual Fund for the Fletcher School of Law and Diplomacy. |
William S. Stavropoulos (68) |
| Year of Election or Appointment: 2001 Mr. Stavropoulos is Chairman Emeritus of the Board of Directors of The Dow Chemical Company. Since joining The Dow Chemical Company in 1967, Mr. Stavropoulos served in numerous senior management positions, including President (1993-2000; 2002-2003), CEO (1995-2000; 2002-2004), and Chairman of the Executive Committee (2000-2004). Currently, he is a Director of NCR Corporation (data warehousing and technology solutions), Chemical Financial Corporation, Maersk Inc. (industrial conglomerate, 2002-present), Tyco International, Inc. (multinational manufacturing and services, 2007-present), and a member of the Advisory Board for Metalmark Capital (private equity investment firm, 2005-present). He is a special advisor to Clayton, Dubilier & Rice, Inc., a private equity investment firm. He also serves as a member of the Board of Trustees of the American Enterprise Institute for Public Policy Research. In addition, Mr. Stavropoulos is a member of The Business Council, J.P. Morgan International Council and the University of Notre Dame Advisory Council for the College of Science. |
Kenneth L. Wolfe (68) |
| Year of Election or Appointment: 2005 Prior to his retirement in 2001, Mr. Wolfe was Chairman and Chief Executive Officer of Hershey Foods Corporation (1993-2001). He currently serves as a member of the boards of Adelphia Communications Corporation (2003-present), Bausch & Lomb, Inc., and Revlon Inc. (2004-present). |
Advisory Board Members and Executive Officers**:
Correspondence intended for Mr. Mauriello, Mr. Thomas, and Mr. Wiley may be sent to Fidelity Investments, P.O. Box 55235, Boston, Massachusetts 02205-5235. Correspondence intended for each executive officer and Mr. Lynch may be sent to Fidelity Investments, 82 Devonshire Street, Boston, Massachusetts 02109.
Peter S. Lynch (63) |
| Year of Election or Appointment: 2003 Member of the Advisory Board of Fidelity Investment Trust. Mr. Lynch is Vice Chairman and a Director of FMR, and Vice Chairman (2001-
present) and a Director of FMR Co., Inc. Previously, Mr. Lynch served as a Trustee of the Fidelity funds (1990-2003). In addition, he serves as a Trustee of Boston College and as the Chairman of the Inner-City Scholarship Fund. |
Joseph Mauriello (63) |
| Year of Election or Appointment: 2007 Member of the Advisory Board of Fidelity Investment Trust. Prior to his retirement in January 2006, Mr. Mauriello served in numerous senior management positions including Deputy Chairman and Chief Operating Officer (2004-2005), and Vice Chairman of Financial Services (2002-
2004) of KPMG LLP US (professional services firm, 1965-2005). Mr. Mauriello currently serves as a member of the Board of Directors of XL Capital Ltd., (global insurance and re-insurance company, 2006-
present) and of Arcadia Resources Inc., (health care services and products, 2007-present). He also served as a Director of the Hamilton Funds of the Bank of New York (2006-2007). |
David M. Thomas (58) |
| Year of Election or Appointment: 2007 Member of the Advisory Board of Fidelity Investment Trust. Previously, Mr. Thomas served as Executive Chairman (2005-2006) and Chairman and Chief Executive Officer (2000-2005) of IMS Health, Inc. (pharmaceutical and healthcare information solutions). In addition, Mr. Thomas serves as a member of the Board of Directors of Fortune Brands, Inc. (consumer products holding company), and Interpublic Group of Companies, Inc. (marketing communication, 2004-present). |
Michael E. Wiley (57) |
| Year of Election or Appointment: 2007 Member of the Advisory Board of Fidelity Investment Trust. Mr. Wiley also serves as Sr. Energy Advisor of Katzenbach Partners, LLC (consulting firm, 2006-present) and a member of the Board of Trustees of the University of Tulsa (2000-2006; 2007-present). He serves as a Director of Tesoro Corporation (independent oil refiner and marketer, 2005-
present), and a Director of Bill Barrett Corporation (exploration and production company, 2005-present). In addition, he also serves as a Director of Post Oak Bank (privately-held bank, 2004-present), and an Advisory Director of Riverstone Holdings (private investment firm). Previously, Mr. Wiley served as Chairman, President, and CEO of Baker Hughes, Inc. (oilfield services company, 2000-2004), and as Director of Spinnaker Exploration Company (exploration and production company, 2001-2005). |
Kimberley H. Monasterio (43) |
| Year of Election or Appointment: 2007 President and Treasurer of International Small Cap. Ms. Monasterio also serves as President and Treasurer of other Fidelity funds (2007-present) and is an employee of FMR (2004-present). Previously, Ms. Monasterio served as Deputy Treasurer of the Fidelity funds (2004-2006). Before joining Fidelity Investments, Ms. Monasterio served as Treasurer (2000-
2004) and Chief Financial Officer (2002-2004) of the Franklin Templeton Funds and Senior Vice President of Franklin Templeton Services, LLC (2000-2004). |
Walter C. Donovan (45) |
| Year of Election or Appointment: 2007 Vice President of International Small Cap. Mr. Donovan also serves as Vice President of Fidelity's Equity Funds (2007-present). Mr. Donovan also serves as Executive Vice President of FMR (2005-present) and FMR Co., Inc. (2005-present). Previously, Mr. Donovan served as Vice President of Fidelity's High Income Funds (2005-2007), Fixed-Income Funds (2005-2006), certain Asset Allocation Funds (2005-2006), certain Balanced Funds (2005-2006), and as Vice President and Director of Fidelity's International Equity Trading group (1998-2005). |
Eric M. Wetlaufer (45) |
| Year of Election or Appointment: 2006 Vice President of International Small Cap. Mr. Wetlaufer also serves as Vice President of certain International Equity Funds (2006-present). Mr. Wetlaufer is Senior Vice President of FMR (2006-present) and FMR Co., Inc. (2006-present), and President and Director of Fidelity Management & Research (U.K.) Inc. (2006-present) and Fidelity Research & Analysis Company (2006-present). Before joining Fidelity Investments in 2005, Mr. Wetlaufer was a partner in Oxhead Capital Management (2004-2005). Previously, Mr. Wetlaufer served as a Chief Investment Officer of Putnam Investments (1997-2003). |
Eric D. Roiter (58) |
| Year of Election or Appointment: 2002 Secretary of International Small Cap. He also serves as Secretary of other Fidelity funds; Vice President, General Counsel, and Secretary of FMR Co., Inc. (2001-present) and FMR; Assistant Secretary of Fidelity Management & Research (U.K.) Inc. (2001-present), Fidelity Research & Analysis Company (2001-present), and Fidelity Investments Money Management, Inc. (2001-present). Mr. Roiter is an Adjunct Member, Faculty of Law, at Boston College Law School (2003-present). Previously, Mr. Roiter served as Vice President and Secretary of Fidelity Distributors Corporation (FDC) (1998-2005). |
Scott C. Goebel (39) |
| Year of Election or Appointment: 2007 Assistant Secretary of International Small Cap. Mr. Goebel also serves as Assistant Secretary of other Fidelity funds (2007-present), and is an employee of FMR. |
R. Stephen Ganis (41) |
| Year of Election or Appointment: 2006 Anti-Money Laundering (AML) officer of International Small Cap. Mr. Ganis also serves as AML officer of other Fidelity funds (2006-
present) and FMR LLC (2003-present). Before joining Fidelity Investments, Mr. Ganis practiced law at Goodwin Procter, LLP (2000-2002). |
Joseph B. Hollis (59) |
| Year of Election or Appointment: 2006 Chief Financial Officer of International Small Cap. Mr. Hollis also serves as Chief Financial Officer of other Fidelity funds. Mr. Hollis is President of Fidelity Pricing and Cash Management Services (FPCMS) (2005-
present). Mr. Hollis also serves as President and Director of Fidelity Service Company, Inc. (2006-present). Previously, Mr. Hollis served as Senior Vice President of Cash Management Services (1999-2002) and Investment Management Operations (2002-2005). |
Kenneth A. Rathgeber (60) |
| Year of Election or Appointment: 2004 Chief Compliance Officer of International Small Cap. Mr. Rathgeber also serves as Chief Compliance Officer of other Fidelity funds (2004-present) and Executive Vice President of Risk Oversight for Fidelity Investments (2002-present). He is Chief Compliance Officer of FMR (2005-present), FMR Co., Inc. (2005-present), Fidelity Management & Research (U.K.) Inc. (2005-present), Fidelity Research & Analysis Company (2005-present), Fidelity Investments Money Management, Inc. (2005-present), and Strategic Advisers, Inc. (2005-present). Previously, Mr. Rathgeber served as Executive Vice President and Chief Operating Officer for Fidelity Investments Institutional Services Company, Inc. (1998-2002). |
Bryan A. Mehrmann (46) |
| Year of Election or Appointment: 2005 Deputy Treasurer of International Small Cap. Mr. Mehrmann also serves as Deputy Treasurer of other Fidelity funds (2005-present) and is an employee of FMR. Previously, Mr. Mehrmann served as Vice President of Fidelity Investments Institutional Services Group (FIIS)/Fidelity Investments Institutional Operations Corporation, Inc. (FIIOC) Client Services (1998-2004). |
Kenneth B. Robins (38) |
| Year of Election or Appointment: 2005 Deputy Treasurer of International Small Cap. Mr. Robins also serves as Deputy Treasurer of other Fidelity funds (2005-present) and is an employee of FMR (2004-present). Before joining Fidelity Investments, Mr. Robins worked at KPMG LLP, where he was a partner in KPMG's department of professional practice (2002-2004) and a Senior Manager (1999-2000). In addition, Mr. Robins served as Assistant Chief Accountant, United States Securities and Exchange Commission (2000-2002). |
Robert G. Byrnes (40) |
| Year of Election or Appointment: 2005 Assistant Treasurer of International Small Cap. Mr. Byrnes also serves as Assistant Treasurer of other Fidelity funds (2005-present) and is an employee of FMR (2005-present). Previously, Mr. Byrnes served as Vice President of FPCMS (2003-2005). Before joining Fidelity Investments, Mr. Byrnes worked at Deutsche Asset Management where he served as Vice President of the Investment Operations Group (2000-2003). |
Peter L. Lydecker (53) |
| Year of Election or Appointment: 2004 Assistant Treasurer of International Small Cap. Mr. Lydecker also serves as Assistant Treasurer of other Fidelity funds (2004) and is an employee of FMR. |
Paul M. Murphy (60) |
| Year of Election or Appointment: 2007 Assistant Treasurer of International Small Cap. Mr. Murphy also serves as Assistant Treasurer of other Fidelity funds (2007-present) and is an employee of FMR (2007-present). Previously, Mr. Murphy served as Chief Financial Officer of the Fidelity Funds (2005-2006), Vice President and Associate General Counsel of FMR (2007), and Senior Vice President of Fidelity Pricing and Cash Management Services Group (FPCMS) (1994-2007). |
Gary W. Ryan (49) |
| Year of Election or Appointment: 2005 Assistant Treasurer of International Small Cap. Mr. Ryan also serves as Assistant Treasurer of other Fidelity funds (2005-present) and is an employee of FMR (2005-present). Previously, Mr. Ryan served as Vice President of Fund Reporting in FPCMS (1999-2005). |
** FMR Corp. merged with FMR LLC on October 1, 2007. Any references to FMR LLC for prior periods are deemed to be references to the prior entity.
Annual Report
Distributions
The Board of Trustees of Fidelity International Small Cap Fund voted to pay to shareholders of record at the opening of business on record date, the following distributions per share derived from capital gains realized from sales of portfolio securities, and dividends derived from net investment income:
| Pay Date | Record Date | Dividends | Capital Gains |
Fidelity International Small Cap Fund | 12/10/07 | 12/7/07 | $.120 | $5.176 |
The fund hereby designates as a capital gain dividend with respect to the taxable year ended October 31, 2007, $221,145,898 or, if subsequently determined to be different, the net capital gain of such year.
The amounts per share which represent income derived from sources within, and taxes paid to, foreign countries or possessions of the United States are as follows:
| Pay Date | Income | Taxes |
Fidelity International
Small Cap Fund | 12/11/2006 | $.322 | $.027 |
The fund will notify shareholders in January 2008 of amounts for use in preparing 2007 income tax returns.
Annual Report
Board Approval of Investment Advisory Contracts and Management Fees
Fidelity International Small Cap Fund
Each year, typically in July, the Board of Trustees, including the Independent Trustees (together, the Board), votes on the renewal of the management contract and sub-advisory agreements (together, the Advisory Contracts) for the fund. The Board, assisted by the advice of fund counsel and Independent Trustees' counsel, requests and considers a broad range of information throughout the year.
The Board meets regularly each month except August and takes into account throughout the year matters bearing on Advisory Contracts. The Board, acting directly and through its separate committees, considers at each of its meetings factors that are relevant to the annual renewal of the fund's Advisory Contracts, including the services and support provided to the fund and its shareholders. At the time of the renewal, the Board had 12 standing committees, each composed of Independent Trustees with varying backgrounds, to which the Board has assigned specific subject matter responsibilities in order to enhance effective decision-making by the Board. Each committee has adopted a written charter outlining the structure and purposes of the committee. One such committee, the Equity Contract Committee, meets periodically as needed throughout the year to consider matters specifically related to the annual renewal of Advisory Contracts. The committee requests and receives information on, and makes recommendations to the Independent Trustees concerning, the approval and annual review of the Advisory Contracts.
At its July 2007 meeting, the Board of Trustees, including the Independent Trustees, unanimously determined to renew the Advisory Contracts for the fund. In reaching its determination, the Board considered all factors it believed relevant, including (i) the nature, extent, and quality of the services to be provided to the fund and its shareholders (including the investment performance of the fund); (ii) the competitiveness of the management fee and total expenses of the fund; (iii) the total costs of the services to be provided by and the profits to be realized by the investment adviser and its affiliates from the relationship with the fund; (iv) the extent to which economies of scale would be realized as the fund grows; and (v) whether fee levels reflect these economies of scale, if any, for the benefit of fund shareholders. The Board also approved amendments to the fund's agreements with foreign sub-advisers to clarify that each sub-adviser provides services as an independent contractor.
In determining whether to renew the Advisory Contracts for the fund, the Board ultimately reached a determination, with the assistance of fund counsel and Independent Trustees' counsel, that the renewal of the Advisory Contracts and the compensation to be received by Fidelity under the management contract is consistent with Fidelity's fiduciary duty under applicable law. In addition to evaluating the specific factors noted above, the Board, in reaching its determination, is aware that shareholders in the fund have a broad range of investment choices available to them, including a wide choice among mutual funds offered by competitors to Fidelity, and that the fund's shareholders, with the opportunity to review and weigh the disclosure provided by the fund in its prospectus and other public disclosures, have chosen to invest in this fund, managed by Fidelity.
Annual Report
Board Approval of Investment Advisory Contracts and
Management Fees - continued
Nature, Extent, and Quality of Services Provided. The Board considered staffing within the investment adviser, FMR, and the sub-advisers (together, the Investment Advisers), including the backgrounds of the fund's portfolio managers and the fund's investment objective and discipline. The Independent Trustees also had discussions with senior management of Fidelity's investment operations and investment groups. The Board considered the structure of the portfolio manager compensation program and whether this structure provides appropriate incentives.
Resources Dedicated to Investment Management and Support Services. The Board reviewed the size, education, and experience of the Investment Advisers' investment staff, their use of technology, and the Investment Advisers' approach to recruiting, training, and retaining portfolio managers and other research, advisory, and management personnel. The Board considered Fidelity's extensive global research capabilities that enable the Investment Advisers to aggregate data from various sources in an effort to produce positive investment results. The Board noted that Fidelity's analysts have access to a variety of technological tools that enable them to perform both fundamental and quantitative analysis and to specialize in various disciplines. The Board also considered that Fidelity's portfolio managers and analysts have access to daily portfolio attribution that allows for monitoring of a fund's portfolio, as well as an electronic communication system that provides immediate real-time access to research concerning issuers and credit enhancers.
Shareholder and Administrative Services. The Board considered (i) the nature, extent, quality, and cost of advisory, administrative, distribution, and shareholder services performed by the Investment Advisers and their affiliates under the Advisory Contracts and under separate agreements covering transfer agency, pricing and bookkeeping, and securities lending services for the fund; (ii) the nature and extent of the Investment Advisers' supervision of third party service providers, principally custodians and subcustodians; and (iii) the resources devoted to, and the record of compliance with, the fund's compliance policies and procedures. The Board reviewed the allocation of fund brokerage, including allocations to brokers affiliated with the Investment Advisers, the use of brokerage commissions to pay fund expenses, and the use of "soft" commission dollars to pay for research services. The Board also considered that Fidelity voluntarily pays for market data out of its own resources. The Board also considered the agreement reached between the Independent Trustees and Fidelity in December 2006 following an independent review of matters relating to receipt of travel, entertainment, gifts and gratuities in violation of Fidelity policies.
Annual Report
The Board noted that the growth of fund assets across the complex allows Fidelity to reinvest in the development of services designed to enhance the value or convenience of the Fidelity funds as investment vehicles. These services include 24-hour access to account information and market information through phone representatives and over the Internet, and investor education materials and asset allocation tools.
Investment in a Large Fund Family. The Board considered the benefits to shareholders of investing in a Fidelity fund, including the benefits of investing in a fund that is part of a large family of funds offering a variety of investment disciplines and providing for a large variety of mutual fund investor services. For example, fund shareholders are offered the privilege of exchanging shares of the fund for shares of other Fidelity funds, as set forth in the fund's prospectus, without paying a sales charge. The Board noted that, since the last Advisory Contract renewals in July 2006, Fidelity has taken a number of actions that benefited particular funds, including (i) dedicating additional resources to investment research and to restructure the investment research teams; (ii) contractually agreeing to reduce the management fee on Fidelity Advisor Floating Rate High Income Fund; (iii) contractually agreeing to reduce the management fees on Fidelity's California, Massachusetts, New Jersey, and New York AMT Tax-Free Money Market Funds, launching new Institutional Classes and Service Classes of these funds, and contractually agreeing to impose expense limitations on these funds; (iv) eliminating the exchange fee on the Fidelity Select Portfolios and reducing the pricing and bookkeeping fee rates for these funds; (v) reducing the maximum transfer agency fee rates on high income funds and certain equity funds; (vi) proposing amended management contracts that, if approved by shareholders, will add a performance adjustment component to the management fees paid by 18 Fidelity Advisor equity funds; (vii) contractually agreeing to reduce fees for Ultra-Short Central Fund and the money market Central Funds; (viii) waiving the Fidelity Advisor funds' contingent deferred sales charge on certain redemptions made through systematic withdrawal programs; and (ix) amending the management contracts for equity and fixed-income funds whose management contracts incorporate a "group fee" structure by adding four new fee "breakpoints" to the group fee rate schedules.
Investment Performance and Compliance. The Board considered whether the fund has operated within its investment objective, as well as its record of compliance with its investment restrictions. It also reviewed the fund's absolute investment performance for each class, as well as the fund's relative investment performance for each class measured against (i) a broad-based securities market index, and (ii) a peer group of mutual funds deemed appropriate by the Board over multiple periods. Because the fund had been in existence less than five calendar years, the following charts considered by the Board show, over the one- and three-year periods ended December 31, 2006, the cumulative total returns of Fidelity International Small Cap (retail class) and Class B of the fund, the cumulative total returns of a broad-based securities market index ("benchmark"), and a range of cumulative total returns of a peer group of mutual funds identified by Lipper Inc. as having an investment objective similar to that of the fund. The returns of Fidelity International Small Cap (retail class) and Class B show the performance of the highest and lowest performing classes, respectively (based on three-year performance). The box within each chart shows the 25th percentile return (bottom of box) and the 75th percentile return (top of box) of the peer group. Returns shown above the box are in the first quartile and returns shown below the box are in the fourth quartile. The percentage beaten numbers noted below each chart correspond to the percentile box and represent the percentage of funds in the peer group whose performance was equal to or lower than that of the class indicated.
Annual Report
Board Approval of Investment Advisory Contracts and
Management Fees - continued
Fidelity International Small Cap Fund

The Board reviewed the fund's relative investment performance against its peer group and stated that the performance of Fidelity International Small Cap (retail class) was in the fourth quartile for the one-year period and the third quartile for the three-year period. The Board also stated that the investment performance of the fund was lower than its benchmark for all the periods shown. The Board considered that the variations in performance among the fund's classes reflect the variations in class expenses, which result in lower performance for higher expense classes. The Board discussed with FMR actions to be taken by FMR to improve the fund's disappointing performance relative to its peer group. The Board will continue to closely monitor the performance of the fund in the coming year.
The Board also considered that the fund's management fee is subject to upward or downward adjustment depending upon whether, and to what extent, the fund's investment performance for the performance period exceeds, or is exceeded by, the record (over the same period) of a Board-approved performance adjustment index. The Board realizes that the performance adjustment provides FMR with a strong economic incentive to seek to achieve superior performance for the fund's shareholders and helps to more closely align the interests of FMR and the fund's shareholders.
Annual Report
The Board considered that FMR has taken steps to refocus and strengthen equity research, equity portfolio management, and compliance.
Based on its review, and giving particular weight to the nature and quality of the resources dedicated by the Investment Advisers to maintain and improve relative performance, the Board concluded that the nature, extent, and quality of the services provided to the fund will benefit the fund's shareholders, particularly in light of the Board's view that the fund's shareholders benefit from investing in a fund that is part of a large family of funds offering a variety of investment disciplines and services.
Competitiveness of Management Fee and Total Fund Expenses. The Board considered the fund's management fee and total expenses compared to "mapped groups" of competitive funds and classes. Fidelity creates "mapped groups" by combining similar Lipper investment objective categories that have comparable management fee characteristics. Combining Lipper investment objective categories aids the Board's management fee and total expense comparisons by broadening the competitive group used for comparison and by reducing the number of universes to which various Fidelity funds are compared. The Board also considered supplemental information about how the fund's management fee and total expenses ranked relative to groups based on Lipper classifications, which take into account a fund's market capitalization and style.
The Board considered two proprietary management fee comparisons for the 12-month (or shorter) periods shown in the chart below. The group of Lipper funds used by the Board for management fee comparisons is referred to below as the "Total Mapped Group" and, for the reasons explained above, is broader than the Lipper peer group used by the Board for performance comparisons. The Total Mapped Group comparison focuses on a fund's standing relative to the total universe of comparable funds available to investors, in terms of gross management fees before expense reimbursements or caps, and without giving effect to the fund's performance adjustment. "TMG %" represents the percentage of funds in the Total Mapped Group that had management fees that were lower than the fund's. For example, a TMG % of 23% means that 77% of the funds in the Total Mapped Group had higher management fees than the fund. The "Asset-Size Peer Group" (ASPG) comparison focuses on a fund's standing relative to non-Fidelity funds similar in size to the fund within the Total Mapped Group. The ASPG represents at least 15% of the funds in the Total Mapped Group with comparable asset size and management fee characteristics, subject to a minimum of 50 funds (or all funds in the Total Mapped Group if fewer than 50). Additional information, such as the ASPG quartile in which the fund's management fee ranked and the impact of the fund's performance adjustment, is also included in the chart and considered by the Board.
Annual Report
Board Approval of Investment Advisory Contracts and
Management Fees - continued
Fidelity International Small Cap Fund

The Board noted that the fund's management fee ranked below the median of its Total Mapped Group and below the median of its ASPG for 2006. The Board also noted the effect of the fund's positive performance adjustment on the fund's management fee ranking. The Board noted that the performance adjustment for each year represents calculations for performance periods that differ from the periods shown in the performance charts above.
Based on its review, the Board concluded that the fund's management fee was fair and reasonable in light of the services that the fund receives and the other factors considered.
In its review of each class's total expenses, the Board considered the fund's management fee as well as other fund or class expenses, as applicable, such as transfer agent fees, pricing and bookkeeping fees, fund-paid 12b-1 fees, and custodial, legal, and audit fees. The Board also noted the effects of any waivers and reimbursements on fees and expenses, as well as the fund's positive performance adjustment. As part of its review, the Board also considered current and historical total expenses of each class of the fund compared to competitive fund median expenses. Each class of the fund is compared to those funds and classes in the Total Mapped Group (used by the Board for management fee comparisons) that have a similar sales load structure.
The Board noted that the total expenses of each of Class A, Class B, Class C, Institutional Class and Fidelity International Small Cap (retail class) ranked below its competitive median for 2006, and the total expenses of Class T ranked above its competitive median for 2006. The Board noted that the fund offers multiple classes, each of which has a different sales load and 12b-1 fee structure, and that the multiple structures are intended to offer a range of pricing options for the intermediary market. The Board also noted that the total expenses of the classes vary primarily by the level of their 12b-1 fees, although differences in transfer agent fees may also cause expenses to vary from class to class.
Annual Report
In its review of total expenses, the Board also considered Fidelity fee structures and other information on clients that FMR and its affiliates service in other competitive markets, such as other mutual funds advised or subadvised by FMR or its affiliates, pension plan clients, and other institutional clients.
Based on its review, the Board concluded that the total expenses of each class of the fund were reasonable, although in one case above the median of the universe presented for comparison, in light of the services that the fund and its shareholders receive and the other factors considered.
Costs of the Services and Profitability. The Board considered the revenues earned and the expenses incurred by Fidelity in conducting the business of developing, marketing, distributing, managing, administering and servicing the fund and its shareholders. The Board also considered the level of Fidelity's profits in respect of all the Fidelity funds.
On an annual basis, FMR presents to the Board Fidelity's profitability for the fund. Fidelity calculates the profitability for each fund, as well as aggregate profitability for groups of Fidelity funds and all Fidelity funds, using a series of detailed revenue and cost allocation methodologies which originate with the audited books and records of Fidelity. The Audit Committee of the Board reviews any significant changes from the prior year's methodologies.
PricewaterhouseCoopers LLP (PwC), independent registered public accounting firm and auditor to Fidelity and certain Fidelity funds, has been engaged annually by the Board as part of the Board's assessment of the results of Fidelity's profitability analysis. PwC's engagement includes the review and assessment of Fidelity's methodologies used in determining the revenues and expenses attributable to Fidelity's mutual fund business, and completion of agreed-upon procedures surrounding the mathematical accuracy of fund profitability and its conformity to allocation methodologies. After considering PwC's reports issued under the engagement and information provided by Fidelity, the Board believes that while other allocation methods may also be reasonable, Fidelity's profitability methodologies are reasonable in all material respects.
The Board has also reviewed Fidelity's non-fund businesses and any fall-out benefits related to the mutual fund business as well as cases where Fidelity's affiliates may benefit from or be related to the fund's business.
Annual Report
Board Approval of Investment Advisory Contracts and
Management Fees - continued
The Board considered the costs of the services provided by and the profits realized by Fidelity in connection with the operation of the fund and determined that the amount of profit is a fair entrepreneurial profit for the management of the fund.
Economies of Scale. The Board considered whether there have been economies of scale in respect of the management of the Fidelity funds, whether the Fidelity funds (including the fund) have appropriately benefited from any such economies of scale, and whether there is potential for realization of any further economies of scale. The Board considered the extent to which the fund will benefit from economies of scale through increased services to the fund, through waivers or reimbursements, or through fee or expense reductions, including reductions that occur through operation of the transfer agent agreement. The transfer agent fee varies in part based on the number of accounts in the fund. If the number of accounts decreases or the average account size increases, the overall transfer agent fee rate decreases.
The Board recognized that the fund's management contract incorporates a "group fee" structure, which provides for lower group fee rates as total fund assets under FMR's management increase, and for higher group fee rates as total fund assets under FMR's management decrease. FMR determines the group fee rates based on a tiered asset "breakpoint" schedule. In connection with the renewal of the fund's management contract, the Board approved amendments to the fund's management contract that added four new fee breakpoints to the group fee rate schedule for assets under FMR's management above $1,386 billion. The Board considered that the group fee rate declines under both the present and amended schedules, but that under the amended schedule, the group fee rate declines faster as assets under FMR's management exceed $1,386 billion. The Board considered that the group fee is designed to deliver the benefits of economies of scale to fund shareholders when total fund assets increase, even if assets of any particular fund are unchanged or have declined, because some portion of Fidelity's costs are attributable to services provided to all Fidelity funds, and all funds benefit if those costs can be allocated among more assets. The Board also considered that although the fund is partially closed to new investors, it continues to incur investment management expenses, and marketing and distribution expenses related to the retention of existing shareholders and assets. The Board further noted that the fund may continue to realize benefits from the group fee structure, even though assets may not be expected to grow significantly at the fund level. The Board concluded that, given the group fee structure, fund shareholders will achieve a certain level of economies of scale as assets under FMR's management increase at the fund complex level, regardless of whether Fidelity achieves any such economies of scale.
The Board further concluded that any potential economies of scale are being shared between fund shareholders and Fidelity in an appropriate manner.
Annual Report
Additional Information Requested by the Board. In order to develop fully the factual basis for consideration of the Fidelity funds' Advisory Contracts, the Board requested and received additional information on several topics, including (i) fund performance trends and actions to be taken by FMR to improve certain funds' overall performance; (ii) Fidelity's portfolio manager compensation structure, including its effects on fund profitability and the extent to which portfolio manager compensation is linked to fund performance; (iii) Fidelity's fee structures; (iv) the funds' sub-advisory arrangements; and (v) accounts managed by Fidelity other than the Fidelity funds.
Based on its evaluation of all of the conclusions noted above, and after considering all material factors, the Board ultimately concluded that the advisory fee structures are fair and reasonable, and that the fund's Advisory Contracts should be renewed.
Annual Report
Managing Your Investments
Fidelity offers several ways to conveniently manage your personal investments via your telephone or PC. You can access your account information, conduct trades and research your investments 24 hours a day.
By Phone
Fidelity Automated Service Telephone provides a single toll-free number to access account balances, positions, quotes and trading. It's easy to navigate the service, and on your first call, the system will help you create a personal identification number (PIN) for security.
(phone_graphic)
Fidelity Automated
Service Telephone (FAST®)
1-800-544-5555
Press
1 For mutual fund and brokerage trading.
2 For quotes.*
3 For account balances and holdings.
4 To review orders and mutual
fund activity.
5 To change your PIN.
*0 To speak to a Fidelity representative.
By PC
Fidelity's web site on the Internet provides a wide range of information, including daily financial news, fund performance, interactive planning tools and news about Fidelity products and services.
(computer_graphic)
Fidelity's Web Site
www.fidelity.com
* When you call the quotes line, please remember that a fund's yield and return will vary and, except for money market funds, share price will also vary. This means that you may have a gain or loss when you sell your shares. There is no assurance that money market funds will be able to maintain a stable $1 share price; an investment in a money market fund is not insured or guaranteed by the U.S. government. Total returns are historical and include changes in share price, reinvestment of dividends and capital gains, and the effects of any sales charges.
Annual Report
Investment Adviser
Fidelity Management & Research Company
Boston, MA
Investment Sub-Advisers
FMR Co., Inc.
Fidelity Management & Research
(U.K.) Inc.
Fidelity Research & Analysis
Company
Fidelity International Investment
Advisors
Fidelity Investments Japan Limited
Fidelity International Investment
Advisors (U.K.) Limited
General Distributor
Fidelity Distributors Corporation
Boston, MA
Transfer and Service Agent
Fidelity Service Company, Inc.
Boston, MA
Custodian
Mellon Bank
Pittsburgh, PA
The Fidelity Telephone Connection
Mutual Fund 24-Hour Service
Exchanges/Redemptions
and Account Assistance 1-800-544-6666
Product Information 1-800-544-8888
Retirement Accounts 1-800-544-4774
(8 a.m. - 9 p.m.)
TDD Service 1-800-544-0118
for the deaf and hearing impaired
(9 a.m. - 9 p.m. Eastern time)
Fidelity Automated Service
Telephone (FAST®) (automated graphic) 1-800-544-5555
(automated graphic) Automated line for quickest service
ISC-UANN-1207
1.793584.104
(Fidelity Investment logo)(registered trademark)
Corporate Headquarters
82 Devonshire St., Boston, MA 02109
www.fidelity.com
(Fidelity Investment logo)(registered trademark)
Fidelity Advisor
International Small Cap
Fund - Class A, Class T, Class B
and Class C
Annual Report
October 31, 2007
Class A, Class T, Class B, and Class C are classes of Fidelity®
International Small Cap Fund
(2_fidelity_logos) (Registered_Trademark)
Contents
Chairman's Message | <Click Here> | Ned Johnson's message to shareholders. |
Performance | <Click Here> | How the fund has done over time. |
Management's Discussion | <Click Here> | The managers' review of fund performance, strategy and outlook. |
Shareholder Expense Example | <Click Here> | An example of shareholder expenses. |
Investment Changes | <Click Here> | A summary of major shifts in the fund's investments over the past six months. |
Investments | <Click Here> | A complete list of the fund's investments with their market values. |
Financial Statements | <Click Here> | Statements of assets and liabilities, operations, and changes in net assets,
as well as financial highlights. |
Notes | <Click Here> | Notes to the financial statements. |
Report of Independent Registered Public Accounting Firm | <Click Here> | |
Trustees and Officers | <Click Here> | |
Distributions | <Click Here> | |
Board Approval of Investment Advisory Contracts and Management Fees | <Click Here> | |
To view a fund's proxy voting guidelines and proxy voting record for the 12-month period ended June 30, visit http://www.fidelity.com (search for "proxy voting guidelines") or visit the Securities and Exchange Commission's (SEC) web site at http://www.sec.gov. You may also call 1-877-208-0098 to request a free copy of the proxy voting guidelines.
Standard & Poor's, S&P and S&P 500 are registered service marks of The McGraw-Hill Companies, Inc. and have been licensed for use by Fidelity Distributors Corporation.
Other third party marks appearing herein are the property of their respective owners.
All other marks appearing herein are registered or unregistered trademarks or service marks of FMR LLC or an affiliated company.
Annual Report
This report and the financial statements contained herein are submitted for the general information of the shareholders of the fund. This report is not authorized for distribution to prospective investors in the fund unless preceded or accompanied by an effective prospectus.
A fund files its complete schedule of portfolio holdings with the SEC for the first and third quarters of each fiscal year on Form N-Q. Forms N-Q are available on the SEC's web site at http://www.sec.gov. A fund's Forms N-Q may be reviewed and copied at the SEC's Public Reference Room in Washington, DC. Information regarding the operation of the SEC's Public Reference Room may be obtained by calling 1-800-SEC-0330. For a complete list of a fund's portfolio holdings, view the most recent holdings listing, semiannual report, or annual report on Fidelity's web site at http://www.fidelity.com or http://www.advisor.fidelity.com, as applicable.
NOT FDIC INSURED · MAY LOSE VALUE · NO BANK GUARANTEE
Neither the fund nor Fidelity Distributors Corporation is a bank.
Annual Report
Chairman's Message
(photo_of_Edward_C_Johnson_3d)
Dear Shareholder:
Many stock and bond markets around the world have been unsettled of late; however, volatility can often lead to opportunity for patient investors. Financial markets are always unpredictable, but there are a number of time-tested principles that can put the historical odds in your favor.
One of the basic tenets is to invest for the long term. Over time, riding out the markets' inevitable ups and downs has proven much more effective than selling into panic or chasing the hottest trend. Even missing only a few of the markets' best days can significantly diminish investor returns. Patience also affords the benefits of compounding - of earning interest on additional income or reinvested dividends and capital gains. There are tax advantages and cost benefits to consider as well. The more you sell, the more taxes you pay, and the more you trade, the higher the costs. While staying the course doesn't eliminate risk, it can considerably lessen the effect of short-term declines.
You can further manage your investing risk through diversification. And today, more than ever, geographic diversification should be taken into account. Studies indicate that asset allocation is the single most important determinant of a portfolio's long-term success. The right mix of stocks, bonds and cash - aligned to your particular risk tolerance and investment objective - is very important. Age-appropriate rebalancing is also an essential aspect of asset allocation. For younger investors, an emphasis on equities - which historically have been the best-performing asset class over time - is encouraged. As investors near their specific goal, such as retirement or sending a child to college, consideration may be given to replacing volatile assets (e.g. common stocks) with more-stable fixed investments (bonds or savings plans).
A third investment principle - investing regularly - can help lower the average cost of your purchases. Investing a certain amount of money each month or quarter helps ensure you won't pay for all your shares at market highs. This strategy - known as dollar cost averaging - also reduces unconstructive "emotion" from investing, helping shareholders avoid selling weak performers just prior to an upswing, or chasing a hot performer just before a correction.
We invite you to contact us via the Internet, through our Investor Centers or over the phone. It is our privilege to provide you the information you need to make the investments that are right for you.
Sincerely,
/s/Edward C. Johnson 3d
Edward C. Johnson 3d
Annual Report
Fidelity Advisor International Small Cap Fund - Class A, T, B, and C
Performance: The Bottom Line
Average annual total return reflects the change in the value of an investment, assuming reinvestment of the class' dividend income and capital gains (the profits earned upon the sale of securities that have grown in value) and assuming a constant rate of performance each year. The $10,000 table and the fund's returns do not reflect the deduction of taxes that a shareholder would pay on fund distributions or the redemption of fund shares. During periods of reimbursement by Fidelity, a fund's total return will be greater than it would be had the reimbursement not occurred. How a fund did yesterday is no guarantee of how it will do tomorrow.
Average Annual Total Returns
Periods ended October 31, 2007 | Past 1
year | Past 5
years | Life of
Fund A |
Class A (incl. 5.75% sales charge) B | 25.75% | 34.02% | 32.76% |
Class T (incl. 3.50% sales charge) C | 28.41% | 34.34% | 33.07% |
Class B (incl. contingent deferred sales charge) D | 27.38% | 34.49% | 33.27% |
Class C (incl. contingent deferred sales charge) E | 31.39% | 34.73% | 33.44% |
A From September 18, 2002.
B Class A shares bear a 0.25% 12b-1 fee. The initial offering of Class A shares took place on May 27, 2003. Returns prior to May 27, 2003, are those of International Small Cap, the original class of the fund, which has no 12b-1 fee. Had Class A shares' 12b-1 fee been reflected, returns prior to May 27, 2003, would have been lower.
C Class T shares bear a 0.50% 12b-1 fee. The initial offering of Class T shares took place on May 27, 2003. Returns prior to May 27, 2003, are those of International Small Cap, the original class of the fund, which has no 12b-1 fee. Had Class T shares' 12b-1 fee been reflected, returns prior to May 27, 2003, would have been lower.
D Class B shares bear a 1.00% 12b-1 fee. The initial offering of Class B shares took place on May 27, 2003. Returns prior to May 27, 2003, are those of International Small Cap, the original class of the fund, which has no 12b-1 fee. Had Class B shares' 12b-1 fee been reflected, returns prior to May 27, 2003, would have been lower. Class B shares' contingent deferred sales charge included in the past one year, five years, and life of fund total return figures are 5%, 2%, and 1%, respectively.
E Class C shares bear a 1.00% 12b-1 fee. The initial offering of Class C shares took place on May 27, 2003. Returns prior to May 27, 2003, are those of International Small Cap, the original class of the fund, which has no 12b-1 fee. Had Class C shares' 12b-1 fee been reflected, returns prior to May 27, 2003, would have been lower. Class C shares' contingent deferred sales charge included in the past one year, five years, and life of fund total return figures are 1%, 0%, and 0%, respectively.
Annual Report
Fidelity Advisor International Small Cap Fund - Class A, T, B, and C
Performance: The Bottom Line - continued
$10,000 Over Life of Fund
Let's say hypothetically that $10,000 was invested in Fidelity Advisor International Small Cap Fund - Class T, a class of the fund, on September 18, 2002, when the fund started, and the current 3.50% sales charge was paid. The chart shows how the value of your investment would have changed, and also shows how the MSCI® EAFE® Small Cap Index performed over the same period.
Annual Report
Management's Discussion of Fund Performance
Comments from Ben Paton, Tokuya Sano and Wilson Wong, Co-Portfolio Managers of Fidelity Advisor International Small Cap Fund
Foreign stocks, with a large assist from a weak U.S. dollar, generally had higher returns for U.S. investors than domestic equities during the year ending October 31, 2007. The backdrop for global stocks was solid, with robust economic growth and relatively high corporate profitability worldwide. Developed international equity markets, as measured by the Morgan Stanley Capital InternationalSM Europe, Australasia, and Far East (MSCI® EAFE®) Index - a proxy for established markets outside the United States and Canada - rose 25.09%. In comparison, the Standard & Poor's 500SM Index, a gauge of U.S. stocks, was up 14.56%. Among countries making up at least 1% of the EAFE benchmark, Finland had the best showing, soaring nearly 69%, while Hong Kong gained roughly 66%. The United Kingdom and Japan, the two largest components of the index, both underperformed. Fallout from the credit crunch and concerns about export growth tempered UK stocks, while Japan struggled with a slowdown in consumer spending and sluggish domestic growth. Emerging markets were the period's big winners, advancing 68.33% as measured by the MSCI Emerging Markets index.
During the past year, the fund's Class A, Class T, Class B and Class C shares returned 33.43%, 33.07%, 32.38% and 32.39%, respectively (excluding sales charges), versus 22.17% for the MSCI EAFE Small Cap index. Stock selection in materials, industrials, energy and consumer staples aided performance, as did overweighting utilities. Geographically, our picks in Australia, Canada, China and Norway helped. Both the Asia Pacific ex Japan and Europe/Africa/Middle East subportfolios handily beat their respective benchmarks; the Japanese subportfolio had roughly in-line results. South Africa-based, Australia-listed Sylvania Resources, which reprocesses chrome tailings, contributed, along with Stepstone, a Norwegian online employment company; Cosco Corporation, a Singapore-listed Chinese shipbuilder; Bradken, Australia's leading supplier of consumable mining and rail industry products; and Japan's Hitachi Construction Machinery and ferro-alloy producer Nippon Denko. Conversely, stock picking in information technology and consumer discretionary detracted. Geographically, our choices in Italy and Japan hurt. The fund's biggest detractor was Banca Italease. Japanese stocks Hikari Tsushin and NOK - the latter of which we sold - hurt as well, along with an index component we didn't own, Orient Resources Group, a Hong Kong-based real estate developer incorporated in Bermuda. Most stocks we've mentioned were out-of-index holdings.
The views expressed above reflect those of the portfolio manager(s) only through the end of the period as stated on the cover of this report and do not necessarily represent the views of Fidelity or any other person in the Fidelity organization. Any such views are subject to change at any time based upon market or other conditions and Fidelity disclaims any responsibility to update such views. These views may not be relied on as investment advice and, because investment decisions for a Fidelity fund are based on numerous factors, may not be relied on as an indication of trading intent on behalf of any Fidelity fund.
Annual Report
Shareholder Expense Example
As a shareholder of the Fund, you incur two types of costs: (1) transaction costs, including sales charges (loads) on purchase payments or redemption proceeds, redemption fees, and (2) ongoing costs, including management fees, distribution and/or service (12b-1) fees and other Fund expenses. This Example is intended to help you understand your ongoing costs (in dollars) of investing in the Fund and to compare these costs with the ongoing costs of investing in other mutual funds.
The Example is based on an investment of $1,000 invested at the beginning of the period and held for the entire period (May 1, 2007 to October 31, 2007).
Actual Expenses
The first line of the accompanying table for each class of the Fund provides information about actual account values and actual expenses. You may use the information in this line, together with the amount you invested, to estimate the expenses that you paid over the period. Simply divide your account value by $1,000.00 (for example, an $8,600 account value divided by $1,000.00 = 8.6), then multiply the result by the number in the first line for a class of the Fund under the heading entitled "Expenses Paid During Period" to estimate the expenses you paid on your account during this period. A small balance maintenance fee of $12.00 that is charged once a year may apply for certain accounts with a value of less than $2,000. This fee is not included in the table below. If it was, the estimate of expenses you paid during the period would be higher, and your ending account value lower, by this amount. In addition, the Fund, as a shareholder in the underlying Fidelity Central Funds, will indirectly bear its pro rata share of the fees and expenses incurred by the underlying Fidelity Central Funds. These fees and expenses are not included in the Fund's annualized expense ratio used to calculate the expense estimate in the table below.
Hypothetical Example for Comparison Purposes
The second line of the accompanying table for each class of the Fund provides information about hypothetical account values and hypothetical expenses based on a Class' actual expense ratio and an assumed rate of return of 5% per year before expenses, which is not the Class' actual return. The hypothetical account values and expenses may not be used to estimate the actual ending account balance or expenses you paid for the period. You may use this information to compare the ongoing costs of investing in the Fund and other funds. To do so, compare this 5% hypothetical example with the 5% hypothetical examples that appear in the shareholder reports of the other funds. A small balance maintenance fee of $12.00 that is charged once a year may apply for certain accounts with a value of less than $2,000. This fee is not included in the table below. If it was, the estimate of expenses you paid during the period would be higher, and your ending account value lower, by this amount. In addition, the Fund, as a shareholder in the underlying Fidelity Central Funds, will indirectly bear its pro rata share of the fees and expenses incurred by the underlying Fidelity Central Funds. These fees and expenses are not included in the Fund's annualized expense ratio used to calculate the expense estimate in the table below.
Annual Report
Please note that the expenses shown in the table are meant to highlight your ongoing costs only and do not reflect any transaction costs. Therefore, the second line of the table is useful in comparing ongoing costs only, and will not help you determine the relative total costs of owning different funds. In addition, if these transactional costs were included, your costs would have been higher.
| Beginning
Account Value
May 1, 2007 | Ending
Account Value
October 31, 2007 | Expenses Paid
During Period*
May 1, 2007 to
October 31, 2007 |
Class A | | | |
Actual | $ 1,000.00 | $ 1,135.30 | $ 8.88 |
HypotheticalA | $ 1,000.00 | $ 1,016.89 | $ 8.39 |
Class T | | | |
Actual | $ 1,000.00 | $ 1,133.20 | $ 10.22 |
HypotheticalA | $ 1,000.00 | $ 1,015.63 | $ 9.65 |
Class B | | | |
Actual | $ 1,000.00 | $ 1,130.50 | $ 12.89 |
HypotheticalA | $ 1,000.00 | $ 1,013.11 | $ 12.18 |
Class C | | | |
Actual | $ 1,000.00 | $ 1,130.70 | $ 12.89 |
HypotheticalA | $ 1,000.00 | $ 1,013.11 | $ 12.18 |
International Small Cap | | | |
Actual | $ 1,000.00 | $ 1,136.70 | $ 7.22 |
HypotheticalA | $ 1,000.00 | $ 1,018.45 | $ 6.82 |
Institutional Class | | | |
Actual | $ 1,000.00 | $ 1,137.00 | $ 7.22 |
HypotheticalA | $ 1,000.00 | $ 1,018.45 | $ 6.82 |
A 5% return per year before expenses
* Expenses are equal to each Class' annualized expense ratio (shown in the table below); multiplied by the average account value over the period, multiplied by 184/365 (to reflect the one-half year period).
| Annualized
Expense Ratio |
Class A | 1.65% |
Class T | 1.90% |
Class B | 2.40% |
Class C | 2.40% |
International Small Cap | 1.34% |
Institutional Class | 1.34% |
Annual Report
Investment Changes
Geographic Diversification (% of fund's net assets) |
As of October 31, 2007 |
| Japan 27.2% | |
| United Kingdom 15.0% | |
| Australia 13.1% | |
| United States of America 6.2% | |
| Canada 4.5% | |
| France 3.9% | |
| Germany 2.9% | |
| Italy 2.9% | |
| Norway 2.2% | |
| Other 22.1% | |

Percentages are adjusted for the effect of futures contracts, if applicable. |
|
As of April 30, 2007 |
| Japan 26.8% | |
| United Kingdom 16.8% | |
| Australia 13.2% | |
| Italy 5.3% | |
| United States of America 5.3% | |
| Germany 3.4% | |
| France 3.2% | |
| Canada 3.2% | |
| South Africa 2.8% | |
| Other 20.0% | |

Percentages are adjusted for the effect of futures contracts, if applicable. |
Asset Allocation |
| % of fund's
net assets | % of fund's net assets
6 months ago |
Stocks | 95.8 | 96.6 |
Bonds | 0.3 | 0.2 |
Short-Term Investments and Net Other Assets | 3.9 | 3.2 |
Top Ten Stocks as of October 31, 2007 |
| % of fund's
net assets | % of fund's net assets
6 months ago |
Stepstone ASA (Norway, Commercial
Services & Supplies) | 1.6 | 1.1 |
Phorm, Inc. (United States of America, Media) | 1.6 | 0.0 |
Sylvania Resources Ltd. (Australia,
Metals & Mining) | 1.4 | 0.6 |
Max Petroleum PLC (United Kingdom,
Oil, Gas & Consumable Fuels) | 1.3 | 2.0 |
Oilexco, Inc. (Canada, Oil, Gas & Consumable Fuels) | 1.3 | 0.6 |
Sarantis SA (Reg.) (Greece, Personal Products) | 1.2 | 0.7 |
Nissin Kogyo Co. Ltd. (Japan, Auto Components) | 1.1 | 1.1 |
E.ON AG (Germany, Electric Utilities) | 1.0 | 0.8 |
Stanley Electric Co. Ltd. (Japan, Auto Components) | 1.0 | 0.4 |
Nippon Seiki Co. Ltd. (Japan, Auto Components) | 1.0 | 0.8 |
| 12.5 | |
Market Sectors as of October 31, 2007 |
| % of fund's
net assets | % of fund's net assets
6 months ago |
Industrials | 22.5 | 20.0 |
Materials | 18.0 | 15.0 |
Consumer Discretionary | 15.9 | 17.1 |
Information Technology | 8.9 | 8.4 |
Energy | 8.6 | 9.0 |
Financials | 8.7 | 13.4 |
Health Care | 4.6 | 4.3 |
Utilities | 4.4 | 5.2 |
Consumer Staples | 4.0 | 3.7 |
Telecommunication Services | 0.5 | 0.7 |
Annual Report
Investments October 31, 2007
Showing Percentage of Net Assets
Common Stocks - 95.8% |
| Shares | | Value
(000s) |
Australia - 13.1% |
Allied Gold Ltd. (a) | 15,017,696 | | $ 12,802 |
Allied Gold Ltd. (UK) (a) | 461,700 | | 410 |
Ausenco Ltd. | 716,966 | | 10,123 |
Australian Wealth Management Ltd. (e) | 1,555,487 | | 4,023 |
Bradken Ltd. | 724,595 | | 10,008 |
Capital-XX Ltd. (a) | 2,262,572 | | 3,105 |
Centamin Egypt Ltd. (a) | 3,589,755 | | 4,870 |
Centennial Coal Co. Ltd. (e) | 592,395 | | 2,389 |
Crane Group Ltd. | 92,339 | | 1,455 |
David Jones Ltd. | 432,290 | | 2,002 |
Downer EDI Ltd. | 256,593 | | 1,600 |
DUET Group | 623,838 | | 2,044 |
Dwyka Resources Ltd. (a) | 5,235,220 | | 4,680 |
European Gas Ltd. (a) | 2,137,690 | | 1,750 |
Gunns Ltd. | 502,803 | | 1,772 |
Hastie Group Ltd. | 749,674 | | 3,232 |
IBT Education Ltd. | 490,152 | | 1,188 |
Incitec Pivot Ltd. (e) | 103,561 | | 8,601 |
International Ferro Metals (a) | 1,666,176 | | 4,070 |
Iress Market Technology Ltd. | 194,246 | | 1,502 |
JB Hi-Fi Ltd. | 709,791 | | 10,931 |
Jubilee Mines NL | 264,180 | | 5,887 |
Kingsgate Consolidated NL | 242,615 | | 1,217 |
MacArthur Coal Ltd. (e) | 482,429 | | 4,106 |
Macmahon Holdings Ltd. | 2,833,056 | | 4,585 |
Meo Australia Ltd. (a) | 9,450,100 | | 10,724 |
Monto Minerals Ltd. (a) | 8,325,252 | | 1,688 |
Monto Minerals Ltd. warrants 5/25/09 (a) | 1,485,934 | | 39 |
Mortgage Choice Ltd. | 2,022,538 | | 4,658 |
Mount Gibson Iron Ltd. (a) | 5,473,584 | | 15,475 |
Nomad Building Solutions Ltd. | 755,846 | | 2,313 |
Oakton Ltd. | 122,815 | | 682 |
Perilya Mines Ltd. | 554,900 | | 2,052 |
Phosphagenics Ltd. (a) | 9,040,000 | | 2,123 |
Reverse Corp. Ltd. | 446,400 | | 1,934 |
Roc Oil Co. Ltd. (United Kingdom) (a) | 2,864,489 | | 8,754 |
Seek Ltd. | 1,321,589 | | 11,566 |
Silex Systems Ltd. | 200,000 | | 1,457 |
Sims Group Ltd. | 28,822 | | 761 |
SMS Management & Technology Ltd. | 134,800 | | 907 |
Sylvania Resources Ltd. (a)(f) | 9,009,881 | | 25,111 |
Sylvania Resources Ltd. (United Kingdom) (a)(f) | 4,910,360 | | 13,425 |
Common Stocks - continued |
| Shares | | Value
(000s) |
Australia - continued |
Tanami Gold NL (a) | 26,452,484 | | $ 2,887 |
Tassal Group Ltd. | 1,148,600 | | 4,074 |
United Group Ltd. | 353,321 | | 7,072 |
WorleyParsons Ltd. | 102,033 | | 4,612 |
Wotif.com Holdings Ltd. | 636,700 | | 3,582 |
TOTAL AUSTRALIA | | 234,248 |
Bermuda - 1.8% |
African Minerals Ltd. (a) | 575,020 | | 1,979 |
Oriental Watch Holdings Ltd. | 4,082,000 | | 1,589 |
Pacific Basin Shipping Ltd. | 4,044,000 | | 9,060 |
Peace Mark Holdings Ltd. | 814,000 | | 1,341 |
Petra Diamonds Ltd. (a) | 1,212,621 | | 3,656 |
Ports Design Ltd. | 784,000 | | 2,960 |
Tanzanite One Ltd. (f) | 5,808,701 | | 8,937 |
Trefoil Ltd. (a) | 385,100 | | 2,225 |
Xceldiam Ltd. warrants 11/16/07 (a) | 1,659,127 | | 52 |
TOTAL BERMUDA | | 31,799 |
British Virgin Islands - 0.3% |
Albidon Ltd. unit (a) | 1,469,000 | | 4,169 |
Kalahari Energy (g) | 1,451,000 | | 1,814 |
TOTAL BRITISH VIRGIN ISLANDS | | 5,983 |
Canada - 4.2% |
AirSea Lines (a)(g) | 1,862,300 | | 1,349 |
AirSea Lines warrants 8/4/11 (a)(g) | 1,862,300 | | 0 |
Altius Minerals Corp. (a) | 257,006 | | 7,485 |
Antrim Energy, Inc. (a) | 245,700 | | 1,652 |
Antrim Energy, Inc. (United Kingdom) (a) | 800,000 | | 5,430 |
Bankers Petroleum Ltd. (a) | 3,767,000 | | 2,434 |
Equinox Minerals Ltd. (a) | 1,206,050 | | 6,604 |
Equinox Minerals Ltd. unit (a) | 588,859 | | 3,208 |
MagIndustries Corp. (a) | 3,635,960 | | 6,739 |
Oilexco, Inc. (a) | 1,237,525 | | 22,596 |
Rock Well Petroleum, Inc. (g) | 770,400 | | 3,461 |
Sino-Forest Corp. (a) | 106,000 | | 2,820 |
Starfield Resources, Inc. (a) | 1,313,025 | | 2,086 |
Starfield Resources, Inc. warrants 1/20/08 (a)(g) | 1,678,100 | | 1,114 |
Stealth Ventures Ltd. (a) | 593,200 | | 452 |
Stealth Ventures Ltd. warrants 3/12/08 (a)(g) | 483,250 | | 1 |
Visual Defence, Inc. (a)(f) | 4,664,100 | | 1,503 |
Common Stocks - continued |
| Shares | | Value
(000s) |
Canada - continued |
Western Canadian Coal Corp. (a) | 1,554,418 | | $ 4,116 |
Western Canadian Coal Corp. (United Kingdom) (a) | 548,286 | | 1,453 |
TOTAL CANADA | | 74,503 |
Cayman Islands - 0.9% |
Ctrip.com International Ltd. sponsored ADR | 31,000 | | 1,747 |
Embry Holdings Ltd. | 1,081,000 | | 845 |
Hidili Industry International Development Ltd. | 808,000 | | 1,205 |
International Consolidated Minerals, Inc. (a) | 852,927 | | 6,397 |
Ju Teng International Holdings Ltd. (a) | 656,000 | | 249 |
Lee & Man Paper Manufacturing Ltd. | 1,002,000 | | 4,008 |
TCC International Holdings Ltd. (a) | 894,000 | | 1,344 |
TOTAL CAYMAN ISLANDS | | 15,795 |
China - 0.8% |
Anhui Conch Cement Co. Ltd. (H Shares) | 78,000 | | 779 |
Baidu.com, Inc. sponsored ADR (a) | 4,600 | | 1,759 |
China Oilfield Services Ltd. (H Shares) | 1,892,000 | | 4,633 |
China Resources Land Ltd. | 448,000 | | 1,133 |
Dongfang Electrical Machinery Co. Ltd. (H Shares) | 84,000 | | 751 |
Sina Corp. (a) | 63,000 | | 3,612 |
Xinjiang Xinxin Mining Industry Co. Ltd. Class H | 740,000 | | 1,369 |
Yantai Changyu Pioneer Wine Co. (B Shares) | 118,810 | | 885 |
TOTAL CHINA | | 14,921 |
Cyprus - 0.1% |
Buried Hill Energy (Cyprus) PCL (g) | 1,947,000 | | 2,142 |
Czech Republic - 0.1% |
Ceske Energeticke Zavody AS | 35,860 | | 2,592 |
Denmark - 0.4% |
DSV de Sammensluttede Vognmaend AS | 259,300 | | 6,855 |
Finland - 1.6% |
Inion OY (a) | 3,590,300 | | 2,146 |
Nokian Tyres Ltd. | 430,910 | | 16,232 |
Rakentajain Konevuokraamo Oyj (B Shares) | 222,030 | | 8,299 |
Ramirent Oyj | 74,140 | | 1,646 |
TOTAL FINLAND | | 28,323 |
Common Stocks - continued |
| Shares | | Value
(000s) |
France - 3.9% |
Carbone Lorraine | 27,400 | | $ 2,452 |
Electricite de France | 90,900 | | 10,903 |
Geodis SA | 42,180 | | 9,105 |
Guerbet SA | 8,400 | | 1,901 |
Icade SA | 123,018 | | 9,079 |
Laurent-Perrier Group | 31,960 | | 5,963 |
Norbert Dentressangle SA | 15,064 | | 1,811 |
Seche Environment SA | 11,560 | | 2,122 |
Societe Internationale de Plantations d'Heveas SA | 2,580 | | 2,063 |
Veolia Environnement | 161,180 | | 14,396 |
Vilmorin & Cie | 67,700 | | 9,840 |
TOTAL FRANCE | | 69,635 |
Germany - 2.9% |
E.ON AG | 93,000 | | 18,163 |
Fresenius Medical Care AG | 130,010 | | 6,868 |
Interhyp AG | 35,270 | | 3,033 |
Kontron AG | 154,620 | | 3,918 |
MLP AG | 89,150 | | 1,182 |
Praktiker Bau- und Heimwerkermaerkte Holding AG | 63,860 | | 2,309 |
SGL Carbon AG (a) | 272,200 | | 15,881 |
TOTAL GERMANY | | 51,354 |
Greece - 1.6% |
Fourlis Holdings SA | 110,000 | | 4,430 |
Hellenic Technodomiki Tev SA | 223,750 | | 3,397 |
Sarantis SA (Reg.) | 1,076,638 | | 21,463 |
TOTAL GREECE | | 29,290 |
Hong Kong - 1.3% |
China Everbright Ltd. (a) | 1,328,000 | | 5,973 |
China Overseas Land & Investment Ltd. | 616,000 | | 1,474 |
Esprit Holdings Ltd. | 246,000 | | 4,108 |
Hang Lung Properties Ltd. | 499,000 | | 2,401 |
Li & Fung Ltd. | 924,000 | | 4,385 |
Midland Holdings Ltd. | 3,114,000 | | 3,857 |
PYI Corp. Ltd. | 600,000 | | 274 |
TOTAL HONG KONG | | 22,472 |
India - 1.2% |
Ess Dee Aluminium Ltd. | 49,516 | | 894 |
Gujarat NRE Coke Ltd. | 507,690 | | 1,499 |
Common Stocks - continued |
| Shares | | Value
(000s) |
India - continued |
INFO Edge India Ltd. | 109,253 | | $ 3,388 |
Jindal Steel & Power Ltd. | 22,836 | | 6,980 |
JSW Steel Ltd. | 156,958 | | 3,863 |
Sesa Goa Ltd. | 48,209 | | 4,618 |
TOTAL INDIA | | 21,242 |
Indonesia - 0.1% |
PT Bakrie Sumatera Plantations Tbk warrants 9/10/10 (a) | 31 | | 0 |
PT International Nickel Indonesia Tbk | 51,500 | | 519 |
PT Tambang Batubbara Bukit Asam Tbk | 1,732,500 | | 1,761 |
TOTAL INDONESIA | | 2,280 |
Ireland - 0.4% |
Adwalker PLC (a) | 9,125,000 | | 379 |
Kenmare Resources PLC (a) | 2,640,000 | | 3,389 |
Kenmare Resources PLC warrants 7/23/09 (a) | 1,712,500 | | 1,513 |
Petroceltic International PLC (a) | 13,644,934 | | 2,406 |
Vimio PLC (a) | 867,300 | | 198 |
TOTAL IRELAND | | 7,885 |
Israel - 0.6% |
Israel Chemicals Ltd. | 611,900 | | 6,734 |
RADWARE Ltd. (a) | 227,160 | | 3,844 |
TOTAL ISRAEL | | 10,578 |
Italy - 2.9% |
Ansaldo STS SpA (a) | 214,670 | | 3,121 |
ASM SpA | 925,100 | | 6,483 |
Banca Italease SpA (e) | 530,760 | | 11,163 |
Enel SpA | 543,800 | | 6,513 |
Hera SpA | 1,510,160 | | 6,789 |
Seldovia Native Association, Inc. (SNAI) (a)(e) | 1,541,160 | | 15,641 |
Teleunit SpA (a)(f) | 12,719,158 | | 1,025 |
TOTAL ITALY | | 50,735 |
Japan - 27.2% |
ABC-Mart, Inc. | 233,100 | | 4,801 |
Access Co. Ltd. | 464 | | 594 |
Adeka Corp. | 69,000 | | 692 |
Ahresty Corp. | 34,400 | | 695 |
Common Stocks - continued |
| Shares | | Value
(000s) |
Japan - continued |
Ai Holdings Corp. | 79,000 | | $ 475 |
Airport Facilities Co. Ltd. | 93,800 | | 616 |
AOC Holdings, Inc. | 79,400 | | 1,219 |
AOI Electronics Co. Ltd. | 64,300 | | 837 |
Apamanshop Holdings Co. Ltd. | 15,040 | | 5,865 |
ARDEPRO CO., Ltd. (e) | 43,989 | | 14,791 |
Atlus Co. Ltd. | 88,000 | | 455 |
Atrium Co. Ltd. | 64,400 | | 1,796 |
Avex Group Holdings, Inc. | 200,000 | | 2,916 |
Bit-isle, Inc. (a)(e) | 988 | | 744 |
Bookoff Corp. (e) | 88,300 | | 861 |
C. Uyemura & Co. Ltd. (a) | 46,000 | | 2,798 |
Chiba Bank Ltd. | 177,000 | | 1,421 |
Chugoku Marine Paints Ltd. | 134,000 | | 1,821 |
Citizen Holdings Co. Ltd. | 142,800 | | 1,539 |
CMIC Co. Ltd. | 4,860 | | 1,161 |
Create SD Co. Ltd. | 42,400 | | 908 |
cyber communications, Inc. | 1,365 | | 1,072 |
Dai-ichi Seiko Co. Ltd. | 55,100 | | 882 |
Daicel Chemical Industries Ltd. | 207,000 | | 1,525 |
Daido Steel Co. Ltd. | 269,000 | | 1,836 |
Daikin Industries Ltd. | 99,500 | | 5,013 |
Daikokutenbussan Co. Ltd. | 31,300 | | 236 |
Daiseki Co. Ltd. (e) | 76,300 | | 2,582 |
Daito Gyorui Co. Ltd. | 381,000 | | 673 |
Daiwa Securities Group, Inc. | 132,000 | | 1,272 |
Daiwabo Information System Ltd. (e) | 162,500 | | 2,160 |
Daiwasystem Co. Ltd. | 39,800 | | 1,117 |
DeNA Co. Ltd. | 451 | | 2,826 |
Denyo Co. Ltd. (e) | 72,900 | | 758 |
Endo Lighting Corp. | 2,300 | | 12 |
EPS Co. Ltd. (e) | 1,239 | | 4,800 |
F&M Co. Ltd. | 1,998 | | 562 |
FCM Co. Ltd. | 30,800 | | 1,385 |
Fuji Heavy Industries Ltd. | 418,000 | | 2,173 |
Fujitsu Component Ltd. (a) | 478 | | 622 |
Furuno Electric Co. Ltd. | 100,400 | | 1,519 |
GMO Hosting & Security, Inc. | 451 | | 515 |
Gmo Internet, Inc. (e) | 400,900 | | 1,530 |
Common Stocks - continued |
| Shares | | Value
(000s) |
Japan - continued |
H-One Co. Ltd. | 21,800 | | $ 251 |
Harakosan Co. Ltd. (e) | 5,676 | | 13,457 |
Harmonic Drive Systems, Inc. | 587 | | 2,210 |
Hikari Tsushin, Inc. (e) | 258,000 | | 7,880 |
Hisaka Works Ltd. (e) | 153,000 | | 3,422 |
Hitachi Construction Machinery Co. Ltd. | 100,200 | | 4,111 |
Hitachi Metals Ltd. | 322,000 | | 4,178 |
Hokuto Corp. | 171,200 | | 2,671 |
Hosiden Corp. (e) | 320,300 | | 5,682 |
Ibiden Co. Ltd. | 62,200 | | 5,274 |
Ichirokudo Co. Ltd. (a) | 1,014 | | 369 |
Ichiyoshi Securities Co. Ltd. | 141,400 | | 1,547 |
IDU Co. (e) | 2,213 | | 3,427 |
Index Holdings (e) | 3,190 | | 1,334 |
Inpex Holdings, Inc. | 890 | | 9,597 |
Intelligence Ltd. (e) | 2,492 | | 5,720 |
Isuzu Motors Ltd. | 359,000 | | 1,790 |
Itochu Corp. | 557,000 | | 7,040 |
Japan Airport Terminal Co. Ltd. | 12,400 | | 243 |
Japan Aviation Electronics Industry Ltd. | 250,000 | | 3,858 |
Japan Steel Works Ltd. | 157,000 | | 2,569 |
Japan Vilene Co. Ltd. (e) | 194,000 | | 1,176 |
Jastec Co. Ltd. | 450,200 | | 4,459 |
Juki Corp. | 500,000 | | 4,269 |
Juroku Bank Ltd. | 149,000 | | 902 |
Kitagawa Seiki Co. Ltd. | 84,000 | | 447 |
Komori Corp. | 154,000 | | 4,074 |
Konica Minolta Holdings, Inc. | 112,500 | | 1,970 |
Kura Corp. Ltd. | 5,016 | | 10,922 |
Kurita Water Industries Ltd. | 62,000 | | 2,072 |
LAC Holdings, Inc. (a) | 154,700 | | 453 |
Lawson, Inc. | 66,400 | | 2,296 |
MCJ Co. Ltd. (a)(e) | 3,338 | | 1,747 |
Meiko Electronics Co. Ltd. | 126,600 | | 4,407 |
Message Co. Ltd. | 584 | | 1,077 |
Micronics Japan Co. Ltd. | 91,500 | | 2,503 |
Mitsuba Corp. | 79,000 | | 508 |
Mitsui O.S.K. Lines Ltd. | 333,000 | | 5,505 |
Mitsumi Electric Co. Ltd. | 67,100 | | 3,093 |
Miura Co. Ltd. | 78,500 | | 2,459 |
Common Stocks - continued |
| Shares | | Value
(000s) |
Japan - continued |
Miyano Machinery, Inc. | 429,000 | | $ 1,197 |
Money Partners Co. Ltd. | 2,705 | | 10,624 |
Mori Seiki Co. Ltd. | 102,000 | | 2,591 |
NIC Corp. | 65,400 | | 508 |
Nidec Corp. | 22,400 | | 1,683 |
Nihon Dempa Kogyo Co. Ltd. (e) | 315,000 | | 15,732 |
Nihon Kohden Corp. | 75,100 | | 1,431 |
Nihon Trim Co. Ltd. (e) | 199,250 | | 6,365 |
Nihonwasou Holdings, Inc. | 782 | | 274 |
Nikon Corp. | 348,000 | | 11,170 |
Nippon Carbon Co. Ltd. (e) | 264,000 | | 1,666 |
Nippon Chemi-con Corp. | 292,000 | | 2,317 |
Nippon Denko Co. Ltd. (e) | 622,000 | | 4,690 |
Nippon Oil Corp. | 256,000 | | 2,268 |
Nippon Seiki Co. Ltd. | 745,000 | | 17,343 |
Nissha Printing Co. Ltd. | 51,000 | | 1,470 |
Nissin Kogyo Co. Ltd. | 757,400 | | 19,795 |
NTN Corp. | 452,000 | | 4,298 |
Obara Corp. | 50 | | 1 |
Oiles Corp. (e) | 77,040 | | 1,666 |
Otsuka Corp. | 21,300 | | 2,042 |
Pigeon Corp. (e) | 87,700 | | 1,508 |
Produce Co. Ltd. (a)(e) | 1,432 | | 5,498 |
Properst Co. Ltd. (e) | 536 | | 1,003 |
Renown, Inc. (a) | 65,400 | | 500 |
Rinnai Corp. | 115,000 | | 3,581 |
Rohto Pharmaceutical Co. Ltd. | 375,000 | | 4,463 |
Round One Corp. (e) | 1,306 | | 3,102 |
Ryobi Ltd. | 226,000 | | 1,523 |
Sammy NetWorks Co. Ltd. | 1,062 | | 1,802 |
Sansha Electric Manufacturing Co. Ltd. | 56,000 | | 546 |
Sanyo Denki Co. Ltd. | 271,000 | | 1,548 |
Sato Corp. (e) | 200,300 | | 3,885 |
Sawada Holdings Co. Ltd. (a) | 91,000 | | 646 |
SBI E*TRADE Securities Co. Ltd. (e) | 790 | | 848 |
Sec Carbon Ltd. | 132,000 | | 2,253 |
Seria Co. Ltd. | 482 | | 663 |
Shibaura Electronics Co. Ltd. (e) | 97,800 | | 2,461 |
Shimachu Co. Ltd. | 80,600 | | 2,321 |
Shin Nippon Biomedical Laboratories Ltd. (e) | 101,900 | | 1,557 |
Shin-Kobe Electric Machinery Co. Ltd. | 419,000 | | 1,957 |
Shinohara Systems of Construction Co. Ltd. (e) | 1,206 | | 1,250 |
Common Stocks - continued |
| Shares | | Value
(000s) |
Japan - continued |
Shizuki Electric Co., Inc. | 146,000 | | $ 546 |
Sojitz Corp. | 714,000 | | 3,278 |
SRI Sports Ltd. | 1,337 | | 1,642 |
Stanley Electric Co. Ltd. | 800,200 | | 17,800 |
Star Micronics Co. Ltd. | 16,200 | | 512 |
Starbucks Coffee Japan Ltd. (e) | 3,551 | | 1,697 |
Stella Chemifa Corp. (e) | 31,900 | | 902 |
Sumco Corp. | 26,200 | | 956 |
Sumitomo Corp. | 451,100 | | 7,862 |
Sumitomo Heavy Industries Ltd. | 216,000 | | 2,854 |
Sumitomo Metal Industries Ltd. | 434,000 | | 2,149 |
Sumitomo Trust & Banking Co. Ltd. | 160,000 | | 1,193 |
Sun Frontier Fudousan Co. Ltd. | 755 | | 1,731 |
Sunx Ltd. (e) | 150,200 | | 917 |
Suruga Corp. | 341,000 | | 7,959 |
Sysmex Corp. | 97,500 | | 3,995 |
T&D Holdings, Inc. | 18,300 | | 1,102 |
Taiho Kogyo Co. Ltd. | 88,100 | | 1,321 |
Taiyo Kagaku Co. Ltd. | 62,900 | | 402 |
Takara Holdings, Inc. (e) | 324,000 | | 1,905 |
Takeei Corp. (e) | 95,000 | | 3,591 |
Takiron Co. Ltd. | 121,000 | | 331 |
Takisawa Machine Tool Co. Ltd. | 524,000 | | 1,005 |
Telewave, Inc. | 692 | | 597 |
TMS Entertainment Ltd. (e) | 152,000 | | 446 |
TOA Valve Holding, Inc. (e) | 352 | | 2,121 |
Toagosei Co. Ltd. | 354,000 | | 1,243 |
Tohcello Co. Ltd. | 149,500 | | 1,091 |
Toho Zinc Co. Ltd. | 272,000 | | 2,470 |
Tohoku Electric Power Co., Inc. | 46,300 | | 979 |
Tokai Carbon Co. Ltd. | 635,000 | | 7,965 |
Tokai Rubber Industries Ltd. | 124,300 | | 2,447 |
Tokyo Gas Co. Ltd. | 248,000 | | 1,106 |
Tokyo Seimitsu Co. Ltd. (e) | 165,100 | | 3,895 |
TonenGeneral Sekiyu KK | 122,000 | | 1,229 |
Topcon Corp. | 87,400 | | 1,277 |
Toray Industries, Inc. | 157,000 | | 1,212 |
Trancom Co. Ltd. | 7,300 | | 111 |
Tyo, Inc. (e) | 113,000 | | 242 |
Ube Industries Ltd. | 683,000 | | 2,453 |
Unicom Group Holdings, Inc. | 121,300 | | 921 |
VarioSecure Networks, Inc. (e) | 648 | | 756 |
Common Stocks - continued |
| Shares | | Value
(000s) |
Japan - continued |
Wacom Co. Ltd. (e) | 1,144 | | $ 2,830 |
Yachiyo Industry Co. Ltd. | 119,200 | | 1,531 |
Yamada Denki Co. Ltd. | 54,740 | | 5,645 |
Yonkyu Co. Ltd. | 135,500 | | 1,053 |
Yume No Machi Souzou Iinkai Co. Ltd. | 527 | | 501 |
TOTAL JAPAN | | 484,861 |
Korea (South) - 0.9% |
LG Household & Health Care Ltd. | 4,230 | | 943 |
MegaStudy Co. Ltd. | 3,746 | | 1,382 |
NHN Corp. (a) | 5,675 | | 1,825 |
Samsung Engineering Co. Ltd. | 27,560 | | 3,713 |
STX Engine Co. Ltd. | 9,514 | | 948 |
STX Pan Ocean Co. Ltd. | 928,000 | | 2,387 |
Sung Kwang Bend Co. Ltd. | 13,764 | | 564 |
Taewoong Co. Ltd. | 23,528 | | 3,363 |
TOTAL KOREA (SOUTH) | | 15,125 |
Luxembourg - 0.2% |
SES SA FDR (France) unit | 142,650 | | 3,522 |
Malaysia - 0.2% |
KNM Group Bhd | 1,756,600 | | 3,109 |
Malta - 0.3% |
Unibet Group plc unit | 178,456 | | 5,758 |
Netherlands - 0.3% |
Engel East Europe NV | 975,032 | | 1,622 |
Koninklijke Boskalis Westminster NV (Certificaten Van Aandelen) | 53,740 | | 3,261 |
TOTAL NETHERLANDS | | 4,883 |
Norway - 2.2% |
Aker Kvaerner ASA | 150,140 | | 5,232 |
Pertra AS (A Shares) | 175,642 | | 2,651 |
Schibsted ASA (B Shares) | 48,600 | | 2,762 |
Stepstone ASA (a) | 5,397,154 | | 28,454 |
TOTAL NORWAY | | 39,099 |
Papua New Guinea - 0.5% |
Lihir Gold Ltd. (a) | 2,053,833 | | 8,154 |
Philippines - 0.3% |
Alliance Global Group, Inc. (a) | 10,090,000 | | 1,255 |
Common Stocks - continued |
| Shares | | Value
(000s) |
Philippines - continued |
SM Prime Holdings, Inc. | 6,628,000 | | $ 1,832 |
Vista Land & Lifescapes, Inc. | 14,466,000 | | 1,832 |
TOTAL PHILIPPINES | | 4,919 |
Portugal - 0.2% |
Banif SGPS SA | 484,850 | | 3,604 |
Singapore - 1.6% |
Advent Air Ltd. (f) | 14,719,299 | | 4,437 |
Banyan Tree Holdings Ltd. | 2,051,000 | | 2,996 |
Cosco Corp. Singapore Ltd. | 1,577,000 | | 8,564 |
Keppel Corp. Ltd. | 136,000 | | 1,398 |
Parkway Holdings Ltd. | 1,648,300 | | 4,781 |
Raffles Medical Group Ltd. | 905,000 | | 963 |
Straits Asia Resources Ltd. | 636,000 | | 1,178 |
Yangzijiang Shipbuilding Holdings Ltd. | 2,262,000 | | 4,028 |
TOTAL SINGAPORE | | 28,345 |
South Africa - 1.8% |
African Rainbow Minerals Ltd. | 291,610 | | 6,730 |
Investec Ltd. | 491,707 | | 6,117 |
JD Group Ltd. | 147,340 | | 1,412 |
Mvelaphanda Group Ltd. | 3,277,360 | | 5,295 |
Telkom SA Ltd. | 146,300 | | 3,984 |
Wilson Bayly Holmes-Ovcon Ltd. | 446,856 | | 9,008 |
TOTAL SOUTH AFRICA | | 32,546 |
Spain - 0.9% |
Grifols SA | 319,170 | | 8,439 |
Obrascon Huarte Lain SA | 166,010 | | 7,506 |
TOTAL SPAIN | | 15,945 |
Sweden - 2.2% |
Hexagon AB (B Shares) | 718,533 | | 17,302 |
Meda AB (A Shares) | 324,460 | | 4,890 |
Modern Times Group MTG AB (B Shares) | 199,460 | | 14,017 |
RNB Retail & Brands AB | 207,990 | | 2,398 |
TOTAL SWEDEN | | 38,607 |
Switzerland - 1.1% |
Actelion Ltd. (Reg.) (a) | 82,940 | | 4,121 |
Bucher Industries AG | 15,811 | | 3,754 |
Partners Group Holding | 32,420 | | 4,394 |
Common Stocks - continued |
| Shares | | Value
(000s) |
Switzerland - continued |
Sulzer AG (Reg.) | 2,070 | | $ 3,320 |
Vontobel Holdings AG | 86,450 | | 4,441 |
TOTAL SWITZERLAND | | 20,030 |
Taiwan - 0.3% |
Far Eastern Textile Ltd. | 734,000 | | 970 |
First Steamship Co. Ltd. (a) | 580,000 | | 1,610 |
Oriental Union Chemical Corp. | 642,000 | | 906 |
PixArt Imaging, Inc. | 6,600 | | 58 |
Sinyi Realty, Inc. | 617,837 | | 1,640 |
WPG Holding Co. Ltd. | 547,000 | | 903 |
TOTAL TAIWAN | | 6,087 |
Thailand - 0.1% |
Central Pattana PCL unit | 904,600 | | 690 |
Thoresen Thai Agencies PCL unit | 449,500 | | 809 |
TOTAL THAILAND | | 1,499 |
United Kingdom - 15.0% |
Advanced Fluid Connections PLC (a) | 7,009,687 | | 0 |
ADVFN PLC (a)(f) | 35,175,780 | | 2,066 |
AeroBox PLC (a) | 5,694,657 | | 0 |
Afren PLC (a) | 1,722,490 | | 3,322 |
African Consolidated Resources PLC (a) | 10,333,334 | | 2,847 |
African Copper PLC (a) | 1,677,884 | | 3,192 |
Air Partner PLC | 45,000 | | 1,118 |
Anglo Asian Mining PLC (a) | 3,657,000 | | 950 |
Appian Technology PLC (a) | 1,968,888 | | 297 |
Appian Technology PLC warrants 2/28/08 (a)(g) | 479,045 | | 45 |
Ascent Resources PLC warrants 12/22/07 (a) | 1,500,000 | | 159 |
Autonomy Corp. PLC (a) | 168,090 | | 3,434 |
Baltic Oil Terminals PLC (a) | 1,314,300 | | 2,883 |
Belitung Zinc Corp. PLC (g) | 7,435,490 | | 1,546 |
BioCare Solutions PLC (f) | 4,849,670 | | 1,260 |
Blackstar Investors PLC (a) | 1,826,860 | | 4,330 |
Block Shield Corp. PLC (a) | 1,653,400 | | 3,266 |
Cambrian Mining PLC | 4,026,100 | | 8,810 |
CareCapital Group PLC (a) | 511,000 | | 279 |
Celsis International PLC (a) | 443,648 | | 1,909 |
Central African Mining & Exploration Co. PLC (a) | 9,125,633 | | 5,407 |
Centurion Electronics PLC (a)(f) | 748,299 | | 89 |
Clapham House Group PLC (a) | 226,950 | | 1,500 |
Common Stocks - continued |
| Shares | | Value
(000s) |
United Kingdom - continued |
Corac Group PLC (a)(f) | 4,609,104 | | $ 5,414 |
Countermine PLC (a)(g) | 4,939 | | 265 |
Countermine PLC warrants 7/26/06 (a)(g) | 4,939 | | 0 |
CustomVis plc (a)(f) | 8,417,536 | | 591 |
Datacash Group PLC | 1,110,470 | | 6,649 |
Eclipse Energy Co. Ltd. (g) | 102,000 | | 1,590 |
Europa Oil & Gas Holdings PLC warrants 11/11/07 (a) | 500,000 | | 1 |
Forum Energy PLC (a) | 800,270 | | 507 |
Gemfields Resources PLC (a) | 3,909,100 | | 2,438 |
Global Coal Management PLC (a) | 1,052,149 | | 2,166 |
Gyrus Group PLC (a) | 365,900 | | 3,252 |
Hardide Ltd. (a) | 6,848,580 | | 1,602 |
Healthcare Enterprise Group PLC (a)(f) | 18,312,440 | | 373 |
Healthcare Enterprise Group PLC warrants 6/30/08 (a) | 1,851,769 | | 19 |
Hot Tuna International PLC (a) | 1,049,400 | | 166 |
Hot Tuna International PLC warrants 2/25/08 (a)(g) | 1,179,700 | | 0 |
Hydrodec Group PLC (a)(f) | 10,002,286 | | 3,795 |
Ideal Shopping Direct PLC | 661,592 | | 2,703 |
IG Group Holdings plc | 794,850 | | 6,875 |
Impact Holdings PLC (a)(f) | 10,414,000 | | 650 |
Inmarsat PLC | 314,800 | | 3,358 |
Inova Holding PLC (a) | 1,443,461 | | 231 |
Intertek Group PLC | 94,110 | | 2,013 |
iomart Group PLC | 1,618,840 | | 1,969 |
ITE Group PLC | 2,116,540 | | 7,712 |
ITM Power PLC (a) | 1,400,980 | | 3,291 |
Jubilee Platinum PLC (a) | 4,124,543 | | 8,189 |
Keronite PLC (a)(g) | 13,620,267 | | 1,699 |
KimCor Diamonds PLC warrants 3/15/08 (a) | 2,185,000 | | 159 |
Landround plc warrants 12/11/09 (a)(g) | 166,666 | | 11 |
London Asia Chinese Private Equity Fund Ltd. warrants 3/31/11 (a) | 105,400 | | 50 |
Max Petroleum PLC (a) | 11,111,220 | | 23,678 |
Meggitt PLC | 1,632,419 | | 11,582 |
Meldex International PLC (a)(e) | 4,394,616 | | 4,386 |
MicroEmissive Displays (a) | 2,821,600 | | 3,344 |
Motivcom PLC (f) | 1,820,500 | | 5,545 |
NDS Group PLC sponsored ADR (a) | 271,300 | | 16,169 |
Petrofac Ltd. | 336,540 | | 3,603 |
Proteome Sciences PLC (a) | 1,322,532 | | 1,299 |
Pureprofile Media PLC (g) | 1,108,572 | | 864 |
Pursuit Dynamics PLC (a) | 666,667 | | 3,659 |
Common Stocks - continued |
| Shares | | Value
(000s) |
United Kingdom - continued |
Rambler Metals & Mining PLC (a) | 600,000 | | $ 661 |
RGI International Ltd. | 589,470 | | 6,119 |
Rheochem PLC warrants 12/30/07 (a) | 4,364,150 | | 15 |
Sarantel Group PLC Class A (a) | 3,310,900 | | 344 |
Scottish & Southern Energy PLC | 209,000 | | 6,761 |
SDL plc (a) | 1,090,022 | | 6,799 |
Serco Group PLC | 439,640 | | 4,120 |
Sinclair Pharma PLC (a) | 1,128,371 | | 1,935 |
Sinosoft Technology PLC (a) | 2,051,400 | | 768 |
SPI Lasers PLC (a)(f) | 3,461,200 | | 3,778 |
Stem Cell Sciences PLC (a) | 716,649 | | 432 |
SubSea Resources PLC (a) | 4,678,800 | | 122 |
SubSea Resources PLC warrants 11/4/09 (a) | 1,805,625 | | 6 |
Target Resources PLC (a) | 1,020,000 | | 488 |
Target Resources PLC warrants 7/12/08 (a) | 1,020,000 | | 64 |
TMO Biotec (a)(g) | 1,000,000 | | 1,445 |
Toledo Mining Corp. PLC (a)(e) | 1,292,424 | | 6,785 |
Triple Plate Junction PLC (a) | 1,539,200 | | 672 |
UK Coal PLC (a) | 409,200 | | 4,339 |
Unite Group PLC | 256,110 | | 2,216 |
Vectura Group PLC (a) | 3,556,060 | | 5,157 |
Virotec International PLC (a) | 3,361,132 | | 445 |
VT Group PLC | 620,780 | | 7,770 |
York Pharma PLC (a) | 633,000 | | 1,421 |
Zenergy Power PLC (a) | 1,469,780 | | 8,495 |
ZincOx Resources PLC (a) | 693,100 | | 5,714 |
TOTAL UNITED KINGDOM | | 267,447 |
United States of America - 2.3% |
Cyberview Technology, Inc. (a)(f) | 996,527 | | 3,802 |
Frontera Resources Corp. (a) | 1,157,200 | | 1,660 |
Frontier Mining Ltd. (a)(f) | 6,771,600 | | 1,619 |
Phorm, Inc. (a)(f) | 664,000 | | 28,335 |
Spacelabs Healthcare, Inc. (a) | 707,250 | | 1,169 |
XL TechGroup, Inc. (a) | 1,329,250 | | 3,634 |
TOTAL UNITED STATES OF AMERICA | | 40,219 |
TOTAL COMMON STOCKS (Cost $1,200,018) | 1,706,391 |
Convertible Bonds - 0.3% |
| Principal
Amount (000s)(d) | | Value
(000s) |
Canada - 0.3% |
Western Canadian Coal Corp. 7.5% 3/24/11 (d)
(Cost $4,061) | CAD | 4,714 | | $ 4,443 |
Money Market Funds - 9.4% |
| Shares | | |
Fidelity Cash Central Fund, 4.97% (b) | 72,630,783 | | 72,631 |
Fidelity Securities Lending Cash Central Fund, 5.02% (b)(c) | 95,477,489 | | 95,477 |
TOTAL MONEY MARKET FUNDS (Cost $168,108) | 168,108 |
TOTAL INVESTMENT PORTFOLIO - 105.5% (Cost $1,372,187) | | 1,878,942 |
NET OTHER ASSETS - (5.5)% | | (97,201) |
NET ASSETS - 100% | $ 1,781,741 |
Currency Abbreviation |
CAD | - | Canadian dollar |
Legend |
(a) Non-income producing |
(b) Affiliated fund that is available only to investment companies and other accounts managed by Fidelity Investments. The rate quoted is the annualized seven-day yield of the fund at period end. A complete unaudited listing of the fund's holdings as of its most recent quarter end is available upon request. |
(c) Investment made with cash collateral received from securities on loan. |
(d) Principal amount is stated in United States dollars unless otherwise noted. |
(e) Security or a portion of the security is on loan at period end. |
(f) Affiliated company |
(g) Restricted securities - Investment in securities not registered under the Securities Act of 1933 (excluding 144A issues). At the end of the period, the value of restricted securities (excluding 144A issues) amounted to $17,345,000 or 1.0% of net assets. |
Additional information on each holding is as follows: |
Security | Acquisition Date | Acquisition Cost (000s) |
AirSea Lines | 8/4/06 | $ 1,199 |
AirSea Lines warrants 8/4/11 | 8/4/06 | $ 0 |
Appian Technology PLC warrants 2/28/08 | 2/18/05 | $ 0 |
Belitung Zinc Corp. PLC | 1/12/06 | $ 1,308 |
Security | Acquisition Date | Acquisition Cost (000s) |
Buried Hill Energy (Cyprus) PCL | 8/18/06 | $ 2,142 |
Countermine PLC | 12/22/05 | $ 443 |
Countermine PLC warrants 7/26/06 | 12/22/05 | $ 0 |
Eclipse Energy Co. Ltd. | 4/28/05 | $ 1,459 |
Hot Tuna International PLC warrants 2/25/08 | 2/14/06 | $ 0 |
Kalahari Energy | 9/1/06 | $ 1,814 |
Keronite PLC | 8/16/06 | $ 1,549 |
Landround plc warrants 12/11/09 | 12/12/06 | $ 0 |
Pureprofile Media PLC | 5/3/05 - 1/11/06 | $ 1,173 |
Rock Well Petroleum, Inc. | 4/13/06 | $ 1,004 |
Starfield Resources, Inc. warrants 1/20/08 | 1/17/06 | $ 0 |
Stealth Ventures Ltd. warrants 3/12/08 | 9/21/06 | $ 0 |
TMO Biotec | 10/27/05 | $ 535 |
Affiliated Central Funds |
Information regarding fiscal year to date income earned by the Fund from investments in Fidelity Central Funds is as follows: |
Fund | Income earned
(Amounts in thousands) |
Fidelity Cash Central Fund | $ 2,959 |
Fidelity Securities Lending Cash Central Fund | 1,663 |
Total | $ 4,622 |
Other Affiliated Issuers |
An affiliated company is a company in which the fund has ownership of at least 5% of the voting securities. Fiscal year to date transactions with companies which are or were affiliates are as follows: |
Affiliate
(Amounts in thousands) | Value, beginning of period | Purchases | Sales Proceeds | Dividend Income | Value,
end of
period |
121Media, Inc. | $ 11,748 | $ - | $ - | $ - | $ - |
Advent Air Ltd. | 2,948 | - | - | 80 | 4,437 |
ADVFN PLC | 1,120 | 922 | 29 | - | 2,066 |
Adwalker PLC | 413 | - | - | - | - |
Avanti Screenmedia Group PLC | 9,335 | - | 8,831 | - | - |
BDI Mining Corp. | 3,288 | - | 6,306 | - | - |
BioCare Solutions PLC | 2,270 | - | 150 | - | 1,260 |
Bioprogress PLC | 9,152 | - | 4,712 | - | - |
Cambrian Mining PLC | 15,845 | - | 5,408 | 182 | - |
Centurion Electronics PLC | 432 | - | 37 | - | 89 |
Corac Group PLC | 3,538 | - | 438 | - | 5,414 |
CustomVis plc | 134 | 715 | - | - | 591 |
Cyberscan Technology, Inc. | 4,562 | - | - | - | - |
Cyberview Technology, Inc. | - | - | - | - | 3,802 |
DA Group PLC | 1,236 | - | 953 | - | - |
Financial Payment Systems Ltd. | 1,485 | - | 385 | - | - |
Frontier Mining Ltd. | 1,808 | - | - | - | 1,619 |
Gasol PLC | 1,257 | - | 897 | - | - |
Gemfields Resources PLC | 5,589 | - | 1,823 | - | - |
GMA Resources PLC | 3,939 | - | 3,863 | - | - |
Affiliate
(Amounts in thousands) | Value, beginning of period | Purchases | Sales Proceeds | Dividend Income | Value,
end of
period |
Hardide Ltd. | $ 1,711 | $ - | $ 233 | $ - | $ - |
Healthcare Enterprise Group PLC | 1,010 | 431 | 411 | - | 373 |
Hydrodec Group PLC | 8,231 | - | 1,677 | - | 3,795 |
ID Data PLC | 925 | - | 1,169 | - | - |
Imagelinx PLC | 1,948 | 340 | 816 | - | - |
Impact Holdings PLC | 2,086 | - | - | - | 650 |
Inion OY | 1,677 | - | 111 | - | - |
Interbulk Group PLC | 1,682 | - | 1,528 | - | - |
International Ferro Metals | 17,682 | 1,265 | 32,938 | - | - |
Jubilee Platinum PLC | 8,789 | 1,994 | 5,851 | - | - |
KimCor Diamonds PLC | 1,185 | - | 736 | - | - |
Landround plc | 188 | 197 | 286 | - | - |
Metals Exploration PLC | 2,126 | - | 2,280 | - | - |
MicroEmissive Displays | 1,672 | 409 | 685 | - | - |
Mineral Commodities Ltd. | 948 | - | 730 | - | - |
Motivcom PLC | 3,085 | - | 186 | 51 | 5,545 |
Phorm, Inc. | - | 1,326 | - | - | 28,335 |
Platinum Mining Corp. of India PLC | 2,418 | - | 2,829 | - | - |
Rheochem PLC | 2,034 | - | 2,015 | - | - |
Sarantel Group PLC Class A | 677 | 463 | 37 | - | - |
Solomon Gold PLC | 905 | - | 502 | - | - |
SPI Lasers PLC | 2,024 | 1,863 | 709 | - | 3,778 |
Starfield Resources, Inc. | 3,247 | 908 | 2,924 | - | - |
SubSea Resources PLC | 2,630 | - | 79 | - | - |
Sylvania Resources Ltd. | 5,331 | 4,057 | 2,385 | - | 25,111 |
Sylvania Resources Ltd. (United Kingdom) | 3,616 | 5,253 | 7,089 | - | 13,425 |
Tanzanite One Ltd. | 9,086 | - | - | 524 | 8,937 |
Teleunit SpA | 1,122 | - | - | - | 1,025 |
Toledo Mining Corp. PLC | 3,742 | 511 | 1,770 | - | - |
Visual Defence, Inc. | 2,673 | - | 430 | - | 1,503 |
Xceldiam Ltd. | 1,946 | - | 65 | 3,814 | - |
Total | $ 176,495 | $ 20,654 | $ 104,303 | $ 4,651 | $ 111,755 |
See accompanying notes which are an integral part of the financial statements.
Annual Report
Financial Statements
Statement of Assets and Liabilities
Amounts in thousands (except per-share amounts) | October 31, 2007 |
Assets | | |
Investment in securities, at value (including securities loaned of $90,915) - See accompanying schedule: Unaffiliated issuers (cost $1,131,366) | $ 1,599,079 | |
Fidelity Central Funds (cost $168,108) | 168,108 | |
Other affiliated issuers (cost $72,713) | 111,755 | |
Total Investments (cost $1,372,187) | | $ 1,878,942 |
Receivable for investments sold | | 21,599 |
Receivable for fund shares sold | | 634 |
Dividends receivable | | 2,392 |
Interest receivable | | 38 |
Distributions receivable from Fidelity Central Funds | | 457 |
Prepaid expenses | | 1 |
Other receivables | | 218 |
Total assets | | 1,904,281 |
| | |
Liabilities | | |
Payable to custodian bank | $ 1,373 | |
Payable for investments purchased | 19,762 | |
Payable for fund shares redeemed | 2,863 | |
Accrued management fee | 1,563 | |
Distribution fees payable | 49 | |
Other affiliated payables | 358 | |
Other payables and accrued expenses | 1,095 | |
Collateral on securities loaned, at value | 95,477 | |
Total liabilities | | 122,540 |
| | |
Net Assets | | $ 1,781,741 |
Net Assets consist of: | | |
Paid in capital | | $ 1,016,289 |
Undistributed net investment income | | 7,171 |
Accumulated undistributed net realized gain (loss) on investments and foreign currency transactions | | 252,123 |
Net unrealized appreciation (depreciation) on investments and assets and liabilities in foreign currencies | | 506,158 |
Net Assets | | $ 1,781,741 |
See accompanying notes which are an integral part of the financial statements.
Annual Report
Statement of Assets and Liabilities - continued
Amounts in thousands (except per-share amounts) | October 31, 2007 |
Calculation of Maximum Offering Price
Class A:
Net Asset Value and redemption price per share ($38,585 ÷ 1,239 shares) | | $ 31.14 |
| | |
Maximum offering price per share (100/94.25 of $31.14) | | $ 33.04 |
Class T:
Net Asset Value and redemption price per share ($40,823 ÷ 1,318 shares) | | $ 30.96 |
| | |
Maximum offering price per share (100/96.50 of $30.96) | | $ 32.08 |
Class B:
Net Asset Value and offering price per share ($10,704 ÷ 351 shares)A | | $ 30.49 |
| | |
Class C:
Net Asset Value and offering price per share ($20,094 ÷ 656 shares)A | | $ 30.62 |
| | |
International Small Cap:
Net Asset Value, offering price and redemption price per share ($1,663,761 ÷ 52,912 shares) | | $ 31.44 |
| | |
Institutional Class:
Net Asset Value, offering price and redemption price per share ($7,774 ÷ 248 shares) | | $ 31.38 |
A Redemption price per share is equal to net asset value less any applicable contingent deferred sales charge.
See accompanying notes which are an integral part of the financial statements.
Annual Report
Financial Statements - continued
Statement of Operations
Amounts in thousands | Year ended October 31, 2007 |
Investment Income | | |
Dividends (including $4,651 earned from other affiliated issuers) | | $ 24,214 |
Interest | | 410 |
Income from Fidelity Central Funds (including $1,663 from security lending) | | 4,622 |
| | 29,246 |
Less foreign taxes withheld | | (1,717) |
Total income | | 27,529 |
| | |
Expenses | | |
Management fee
Basic fee | $ 14,855 | |
Performance adjustment | 336 | |
Transfer agent fees | 3,688 | |
Distribution fees | 586 | |
Accounting and security lending fees | 797 | |
Custodian fees and expenses | 641 | |
Independent trustees' compensation | 6 | |
Registration fees | 81 | |
Audit | 138 | |
Legal | 42 | |
Miscellaneous | 62 | |
Total expenses before reductions | 21,232 | |
Expense reductions | (743) | 20,489 |
Net investment income (loss) | | 7,040 |
Realized and Unrealized Gain (Loss) Net realized gain (loss) on: | | |
Investment securities: | | |
Unaffiliated issuers (net of foreign taxes of $21) | 294,358 | |
Other affiliated issuers | (4,327) | |
Foreign currency transactions | (128) | |
Total net realized gain (loss) | | 289,903 |
Change in net unrealized appreciation (depreciation) on: Investment securities (net of increase in deferred foreign taxes of $762) | 201,533 | |
Assets and liabilities in foreign currencies | 242 | |
Total change in net unrealized appreciation (depreciation) | | 201,775 |
Net gain (loss) | | 491,678 |
Net increase (decrease) in net assets resulting from operations | | $ 498,718 |
See accompanying notes which are an integral part of the financial statements.
Annual Report
Statement of Changes in Net Assets
Amounts in thousands | Year ended
October 31,
2007 | Year ended
October 31,
2006 |
Increase (Decrease) in Net Assets | | |
Operations | | |
Net investment income (loss) | $ 7,040 | $ 6,181 |
Net realized gain (loss) | 289,903 | 461,201 |
Change in net unrealized appreciation (depreciation) | 201,775 | (42,338) |
Net increase (decrease) in net assets resulting
from operations | 498,718 | 425,044 |
Distributions to shareholders from net investment income | (3,787) | (10,829) |
Distributions to shareholders from net realized gain | (351,004) | (234,438) |
Total distributions | (354,791) | (245,267) |
Share transactions - net increase (decrease) | (298,912) | (456,221) |
Redemption fees | 245 | 565 |
Total increase (decrease) in net assets | (154,740) | (275,879) |
| | |
Net Assets | | |
Beginning of period | 1,936,481 | 2,212,360 |
End of period (including undistributed net investment income of $7,171 and undistributed net investment income of $5,133, respectively) | $ 1,781,741 | $ 1,936,481 |
See accompanying notes which are an integral part of the financial statements.
Annual Report
Financial Highlights - Class A
Years ended October 31, | 2007 | 2006 | 2005 | 2004 | 2003 I |
Selected Per-Share Data | | | | | |
Net asset value, beginning of period | $ 28.79 | $ 26.69 | $ 21.25 | $ 17.69 | $ 12.35 |
Income from Investment Operations | | | | | |
Net investment income (loss) E | .03 | (.02) | .05 | .02 | .02 H |
Net realized and unrealized gain (loss) | 7.97 | 5.05 | 6.16 | 3.83 | 5.30 |
Total from investment operations | 8.00 | 5.03 | 6.21 | 3.85 | 5.32 |
Distributions from net investment income | - | (.05) | (.02) | (.02) | - |
Distributions from net realized gain | (5.65) | (2.89) | (.77) | (.31) | - |
Total distributions | (5.65) | (2.94) | (.79) | (.33) | - |
Redemption fees added to paid
in capital E | - K | .01 | .02 | .04 | .02 |
Net asset value, end of period | $ 31.14 | $ 28.79 | $ 26.69 | $ 21.25 | $ 17.69 |
Total Return B,C,D | 33.43% | 20.22% | 30.16% | 22.36% | 43.24% |
Ratios to Average Net Assets F,J | | | | | |
Expenses before reductions | 1.53% | 1.64% | 1.66% | 1.71% | 1.77% A |
Expenses net of fee waivers, if any | 1.53% | 1.64% | 1.66% | 1.71% | 1.77% A |
Expenses net of all reductions | 1.49% | 1.58% | 1.63% | 1.69% | 1.74% A |
Net investment income (loss) | .10% | (.08)% | .21% | .09% | .28% A |
Supplemental Data | | | | | |
Net assets, end of period
(in millions) | $ 39 | $ 37 | $ 35 | $ 13 | $ 5 |
Portfolio turnover rateG | 70% | 84% | 79% | 77% | 84% A |
A Annualized
B Total returns for periods of less than one year are not annualized.
C Total returns would have been lower had certain expenses not been reduced during the periods shown.
D Total returns do not include the effect of the sales charges.
E Calculated based on average shares outstanding during the period.
F Fees and expenses of the underlying Fidelity Central Funds are not included in the Fund's expense ratio. The Fund indirectly bears its proportionate share of the expenses of any underlying Fidelity Central Funds.
G Amount does not include the portfolio activity of any underlying Fidelity Central Funds.
H Investment income per share reflects a special dividend which amounted to $.01 per share.
I For the period May 27, 2003 (commencement of sale of shares) to October 31, 2003.
J Expense ratios reflect operating expenses of the class. Expenses before reductions do not reflect amounts reimbursed by the investment adviser or reductions from brokerage service arrangements or other expense offset arrangements and do not represent the amount paid by the class during periods when reimbursements or reductions occur. Expense ratios before reductions for start-up periods may not be representative of longer-term operating periods. Expenses net of fee waivers reflect expenses after reimbursement by the investment adviser but prior to reductions from brokerage service arrangements or other expense offset arrangements. Expenses net of all reductions represent the net expenses paid by the class.
K Amount represents less than $.01 per share.
See accompanying notes which are an integral part of the financial statements.
Annual Report
Financial Highlights - Class T
Years ended October 31, | 2007 | 2006 | 2005 | 2004 | 2003 I |
Selected Per-Share Data | | | | | |
Net asset value, beginning of period | $ 28.64 | $ 26.57 | $ 21.20 | $ 17.68 | $ 12.35 |
Income from Investment Operations | | | | | |
Net investment income (loss) E | (.04) | (.09) | (.01) | (.03) | - H,K |
Net realized and unrealized gain (loss) | 7.93 | 5.03 | 6.12 | 3.83 | 5.31 |
Total from investment operations | 7.89 | 4.94 | 6.11 | 3.80 | 5.31 |
Distributions from net investment income | - | - | - | (.01) | - |
Distributions from net realized gain | (5.57) | (2.88) | (.76) | (.31) | - |
Total distributions | (5.57) | (2.88) | (.76) | (.32) | - |
Redemption fees added to paid
in capital E | - K | .01 | .02 | .04 | .02 |
Net asset value, end of period | $ 30.96 | $ 28.64 | $ 26.57 | $ 21.20 | $ 17.68 |
Total Return B,C,D | 33.07% | 19.93% | 29.72% | 22.07% | 43.16% |
Ratios to Average Net Assets F,J | | | | | |
Expenses before reductions | 1.77% | 1.89% | 1.92% | 1.94% | 2.12% A |
Expenses net of fee waivers,
if any | 1.77% | 1.89% | 1.91% | 1.94% | 2.12% A |
Expenses net of all reductions | 1.73% | 1.83% | 1.88% | 1.92% | 2.09% A |
Net investment income (loss) | (.14)% | (.32)% | (.04)% | (.14)% | (.07)% A |
Supplemental Data | | | | | |
Net assets, end of period
(in millions) | $ 41 | $ 42 | $ 42 | $ 15 | $ 4 |
Portfolio turnover rate G | 70% | 84% | 79% | 77% | 84% A |
A Annualized
B Total returns for periods of less than one year are not annualized.
C Total returns would have been lower had certain expenses not been reduced during the periods shown.
D Total returns do not include the effect of the sales charges.
E Calculated based on average shares outstanding during the period.
F Fees and expenses of the underlying Fidelity Central Funds are not included in the Fund's expense ratio. The Fund indirectly bears its proportionate share of the expenses of any underlying Fidelity Central Funds.
G Amount does not include the portfolio activity of any underlying Fidelity Central Funds.
H Investment income per share reflects a special dividend which amounted to $.01 per share.
I For the period May 27, 2003 (commencement of sale of shares) to October 31, 2003.
J Expense ratios reflect operating expenses of the class. Expenses before reductions do not reflect amounts reimbursed by the investment adviser or reductions from brokerage service arrangements or other expense offset arrangements and do not represent the amount paid by the class during periods when reimbursements or reductions occur. Expense ratios before reductions for start-up periods may not be representative of longer-term operating periods. Expenses net of fee waivers reflect expenses after reimbursement by the investment adviser but prior to reductions from brokerage service arrangements or other expense offset arrangements. Expenses net of all reductions represent the net expenses paid by the class.
K Amount represents less than $.01 per share.
See accompanying notes which are an integral part of the financial statements.
Annual Report
Financial Highlights - Class B
Years ended October 31, | 2007 | 2006 | 2005 | 2004 | 2003 I |
Selected Per-Share Data | | | | | |
Net asset value, beginning of period | $ 28.26 | $ 26.24 | $ 20.99 | $ 17.62 | $ 12.35 |
Income from Investment Operations | | | | | |
Net investment income (loss) E | (.18) | (.24) | (.14) | (.16) | (.05) H |
Net realized and unrealized gain (loss) | 7.82 | 4.98 | 6.08 | 3.80 | 5.30 |
Total from investment operations | 7.64 | 4.74 | 5.94 | 3.64 | 5.25 |
Distributions from net realized gain | (5.41) | (2.73) | (.71) | (.31) | - |
Redemption fees added to paid
in capital E | - K | .01 | .02 | .04 | .02 |
Net asset value, end of period | $ 30.49 | $ 28.26 | $ 26.24 | $ 20.99 | $ 17.62 |
Total Return B,C,D | 32.38% | 19.28% | 29.13% | 21.21% | 42.67% |
Ratios to Average Net Assets F,J | | | | | |
Expenses before reductions | 2.30% | 2.48% | 2.49% | 2.63% | 2.76% A |
Expenses net of fee waivers, if any | 2.30% | 2.40% | 2.43% | 2.63% | 2.76% A |
Expenses net of all reductions | 2.26% | 2.34% | 2.40% | 2.60% | 2.73% A |
Net investment income (loss) | (.66)% | (.84)% | (.56)% | (.83)% | (.71)% A |
Supplemental Data | | | | | |
Net assets, end of period
(in millions) | $ 11 | $ 11 | $ 13 | $ 5 | $ 1 |
Portfolio turnover rate G | 70% | 84% | 79% | 77% | 84% A |
A Annualized
B Total returns for periods of less than one year are not annualized.
C Total returns would have been lower had certain expenses not been reduced during the periods shown.
D Total returns do not include the effect of the contingent deferred sales charge.
E Calculated based on average shares outstanding during the period.
F Fees and expenses of the underlying Fidelity Central Funds are not included in the Fund's expense ratio. The Fund indirectly bears its proportionate share of the expenses of any underlying Fidelity Central Funds.
G Amount does not include the portfolio activity of any underlying Fidelity Central Funds.
H Investment income per share reflects a special dividend which amounted to $.01 per share.
I For the period May 27, 2003 (commencement of sale of shares) to October 31, 2003.
J Expense ratios reflect operating expenses of the class. Expenses before reductions do not reflect amounts reimbursed by the investment adviser or reductions from brokerage service arrangements or other expense offset arrangements and do not represent the amount paid by the class during periods when reimbursements or reductions occur. Expense ratios before reductions for start-up periods may not be representative of longer-term operating periods. Expenses net of fee waivers reflect expenses after reimbursement by the investment adviser but prior to reductions from brokerage service arrangements or other expense offset arrangements. Expenses net of all reductions represent the net expenses paid by the class.
K Amount represents less than $.01 per share.
See accompanying notes which are an integral part of the financial statements.
Annual Report
Financial Highlights - Class C
Years ended October 31, | 2007 | 2006 | 2005 | 2004 | 2003 I |
Selected Per-Share Data | | | | | |
Net asset value, beginning of period | $ 28.33 | $ 26.31 | $ 21.04 | $ 17.64 | $ 12.35 |
Income from Investment Operations | | | | | |
Net investment income (loss) E | (.17) | (.23) | (.13) | (.12) | (.04) H |
Net realized and unrealized gain (loss) | 7.85 | 4.99 | 6.10 | 3.80 | 5.31 |
Total from investment operations | 7.68 | 4.76 | 5.97 | 3.68 | 5.27 |
Distributions from net investment income | - | - | - | (.01) | - |
Distributions from net realized gain | (5.39) | (2.75) | (.72) | (.31) | - |
Total distributions | (5.39) | (2.75) | (.72) | (.32) | - |
Redemption fees added to paid in capital E | - K | .01 | .02 | .04 | .02 |
Net asset value, end of period | $ 30.62 | $ 28.33 | $ 26.31 | $ 21.04 | $ 17.64 |
Total Return B,C,D | 32.39% | 19.34% | 29.22% | 21.43% | 42.83% |
Ratios to Average Net Assets F,J | | | | | |
Expenses before reductions | 2.26% | 2.38% | 2.41% | 2.43% | 2.57% A |
Expenses net of fee waivers,
if any | 2.26% | 2.38% | 2.41% | 2.43% | 2.57% A |
Expenses net of all reductions | 2.22% | 2.32% | 2.38% | 2.40% | 2.55% A |
Net investment income (loss) | (.62)% | (.81)% | (.54)% | (.62)% | (.52)% A |
Supplemental Data | | | | | |
Net assets, end of period
(in millions) | $ 20 | $ 21 | $ 25 | $ 9 | $ 1 |
Portfolio turnover rate G | 70% | 84% | 79% | 77% | 84% A |
A Annualized
B Total returns for periods of less than one year are not annualized.
C Total returns would have been lower had certain expenses not been reduced during the periods shown.
D Total returns do not include the effect of the contingent deferred sales charge.
E Calculated based on average shares outstanding during the period.
F Fees and expenses of the underlying Fidelity Central Funds are not included in the Fund's expense ratio. The Fund indirectly bears its proportionate share of the expenses of any underlying Fidelity Central Funds.
G Amount does not include the portfolio activity of any underlying Fidelity Central Funds.
H Investment income per share reflects a special dividend which amounted to $.01 per share.
I For the period May 27, 2003 (commencement of sale of shares) to October 31, 2003.
J Expense ratios reflect operating expenses of the class. Expenses before reductions do not reflect amounts reimbursed by the investment adviser or reductions from brokerage service arrangements or other expense offset arrangements and do not represent the amount paid by the class during periods when reimbursements or reductions occur. Expense ratios before reductions for start-up periods may not be representative of longer-term operating periods. Expenses net of fee waivers reflect expenses after reimbursement by the investment adviser but prior to reductions from brokerage service arrangements or other expense offset arrangements. Expenses net of all reductions represent the net expenses paid by the class.
K Amount represents less than $.01 per share.
See accompanying notes which are an integral part of the financial statements.
Annual Report
Financial Highlights - International Small Cap
Years ended October 31, | 2007 | 2006 | 2005 | 2004 | 2003 |
Selected Per-Share Data | | | | | |
Net asset value, beginning of period | $ 29.03 | $ 26.89 | $ 21.36 | $ 17.71 | $ 9.87 |
Income from Investment Operations | | | | | |
Net investment income (loss) C | .12 | .08 | .15 | .10 | .07 F |
Net realized and unrealized gain (loss) | 8.03 | 5.08 | 6.19 | 3.84 | 7.75 |
Total from investment operations | 8.15 | 5.16 | 6.34 | 3.94 | 7.82 |
Distributions from net investment income | (.07) | (.14) | (.06) | (.02) | - |
Distributions from net realized gain | (5.67) | (2.89) | (.77) | (.31) | (.02) |
Total distributions | (5.74) | (3.03) | (.83) | (.33) | (.02) |
Redemption fees added to paid in capital C | - H | .01 | .02 | .04 | .04 |
Net asset value, end of period | $ 31.44 | $ 29.03 | $ 26.89 | $ 21.36 | $ 17.71 |
Total Return A,B | 33.82% | 20.65% | 30.67% | 22.84% | 79.78% |
Ratios to Average Net Assets D,G | | | | | |
Expenses before reductions | 1.19% | 1.28% | 1.28% | 1.30% | 1.54% |
Expenses net of fee waivers,
if any | 1.19% | 1.28% | 1.28% | 1.30% | 1.54% |
Expenses net of all reductions | 1.15% | 1.22% | 1.25% | 1.28% | 1.51% |
Net investment income (loss) | .45% | .29% | .59% | .50% | .46% |
Supplemental Data | | | | | |
Net assets, end of period
(in millions) | $ 1,664 | $ 1,816 | $ 2,090 | $ 1,091 | $ 547 |
Portfolio turnover rate E | 70% | 84% | 79% | 77% | 84% |
A Total returns for periods of less than one year are not annualized.
B Total returns would have been lower had certain expenses not been reduced during the periods shown.
C Calculated based on average shares outstanding during the period.
D Fees and expenses of the underlying Fidelity Central Funds are not included in the Fund's expense ratio. The Fund indirectly bears its proportionate share of the expenses of any underlying Fidelity Central Funds.
E Amount does not include the portfolio activity of any underlying Fidelity Central Funds.
F Investment income per share reflects a special dividend which amounted to $.03 per share.
G Expense ratios reflect operating expenses of the class. Expenses before reductions do not reflect amounts reimbursed by the investment adviser or reductions from brokerage service arrangements or other expense offset arrangements and do not represent the amount paid by the class during periods when reimbursements or reductions occur. Expenses net of fee waivers reflect expenses after reimbursement by the investment adviser but prior to reductions from brokerage service arrangements or other expense offset arrangements. Expenses net of all reductions represent the net expenses paid by the class.
H Amount represents less than $.01 per share.
See accompanying notes which are an integral part of the financial statements.
Annual Report
Financial Highlights - Institutional Class
Years ended October 31, | 2007 | 2006 | 2005 | 2004 | 2003 H |
Selected Per-Share Data | | | | | |
Net asset value, beginning of period | $ 28.99 | $ 26.86 | $ 21.36 | $ 17.72 | $ 12.35 |
Income from Investment Operations | | | | | |
Net investment income (loss) D | .12 | .08 | .14 | .10 | .04 G |
Net realized and unrealized gain (loss) | 8.01 | 5.07 | 6.18 | 3.84 | 5.31 |
Total from investment operations | 8.13 | 5.15 | 6.32 | 3.94 | 5.35 |
Distributions from net investment income | (.07) | (.14) | (.07) | (.03) | - |
Distributions from net realized gain | (5.67) | (2.89) | (.77) | (.31) | - |
Total distributions | (5.74) | (3.03) | (.84) | (.34) | - |
Redemption fees added to paid in capital D | - J | .01 | .02 | .04 | .02 |
Net asset value, end of period | $ 31.38 | $ 28.99 | $ 26.86 | $ 21.36 | $ 17.72 |
Total Return B,C | 33.84% | 20.65% | 30.59% | 22.84% | 43.48% |
Ratios to Average Net Assets E,I |
| | | | |
Expenses before reductions | 1.18% | 1.29% | 1.30% | 1.32% | 1.51% A |
Expenses net of fee waivers,
if any | 1.18% | 1.29% | 1.30% | 1.32% | 1.51% A |
Expenses net of all reductions | 1.14% | 1.23% | 1.27% | 1.29% | 1.48% A |
Net investment income (loss) | .45% | .28% | .57% | .49% | .54% A |
Supplemental Data | | | | | |
Net assets, end of period
(in millions) | $ 8 | $ 9 | $ 7 | $ 3 | $ .4 |
Portfolio turnover rate F | 70% | 84% | 79% | 77% | 84% A |
A Annualized
B Total returns for periods of less than one year are not annualized.
C Total returns would have been lower had certain expenses not been reduced during the periods shown.
D Calculated based on average shares outstanding during the period.
E Fees and expenses of the underlying Fidelity Central Funds are not included in the Fund's expense ratio. The Fund indirectly bears its proportionate share of the expenses of any underlying Fidelity Central Funds.
F Amount does not include the portfolio activity of any underlying Fidelity Central Funds.
G Investment income per share reflects a special dividend which amounted to $.01 per share.
H For the period May 27, 2003 (commencement of sale of shares) to October 31, 2003.
I Expense ratios reflect operating expenses of the class. Expenses before reductions do not reflect amounts reimbursed by the investment adviser or reductions from brokerage service arrangements or other expense offset arrangements and do not represent the amount paid by the class during periods when reimbursements or reductions occur. Expense ratios before reductions for start-up periods may not be representative of longer-term operating periods. Expenses net of fee waivers reflect expenses after reimbursement by the investment adviser but prior to reductions from brokerage service arrangements or other expense offset arrangements. Expenses net of all reductions represent the net expenses paid by the class.
J Amount represents less than $.01 per share.
See accompanying notes which are an integral part of the financial statements.
Annual Report
Notes to Financial Statements
For the period ended October 31, 2007
(Amounts in thousands except ratios)
1. Organization.
Fidelity International Small Cap Fund (the Fund) is a fund of Fidelity Investment Trust (the trust) and is authorized to issue an unlimited number of shares. The trust is registered under the Investment Company Act of 1940, as amended (the 1940 Act), as an open-end management investment company organized as a Massachusetts business trust.
The Fund offers Class A, Class T, Class B, Class C, International Small Cap and Institutional Class shares, each of which has equal rights as to assets and voting privileges. Each class has exclusive voting rights with respect to matters that affect that class. Class B shares will automatically convert to Class A shares after a holding period of seven years from the initial date of purchase. Investment income, realized and unrealized capital gains and losses, the common expenses of the Fund, and certain fund-level expense reductions, if any, are allocated on a pro rata basis to each class based on the relative net assets of each class to the total net assets of the Fund. Each class differs with respect to transfer agent and distribution and service plan fees incurred. Certain expense reductions also differ by class.
2. Investments in Fidelity Central Funds.
The Fund may invest in Fidelity Central Funds, which are open-end investment companies available only to other investment companies and accounts managed by Fidelity Management & Research Company (FMR) and its affiliates. The Fund's Schedule of Investments lists each of the Fidelity Central Funds as an investment of the Fund, but does not include the underlying holdings of each Fidelity Central Fund. As an Investing Fund, the Fund indirectly bears its proportionate share of the expenses of the underlying Fidelity Central Funds.
The Money Market Central Funds seek preservation of capital and current income and are managed by Fidelity Investments Money Management, Inc. (FIMM), an affiliate of FMR.
A complete list of holdings for each Fidelity Central Fund is available upon request or at the SEC's web site at www.sec.gov. In addition, the financial statements of the Fidelity Central Funds, which are not covered by the Fund's Report of Independent Registered Public Accounting Firm, are available on the SEC's web site or upon request.
3. Significant Accounting Policies.
The financial statements have been prepared in conformity with accounting principles generally accepted in the United States of America, which require management to make certain estimates and assumptions at the date of the financial statements. The following summarizes the significant accounting policies of the Fund:
Annual Report
3. Significant Accounting Policies - continued
Security Valuation. Investments are valued and net asset value (NAV) per share is calculated (NAV calculation) as of the close of business of the New York Stock Exchange (NYSE), normally 4:00 p.m. Eastern time. Wherever possible, the Fund uses independent pricing services approved by the Board of Trustees to value its investments.
Equity securities, including restricted securities, for which market quotations are readily available, are valued at the last reported sale price or official closing price as reported by an independent pricing service on the primary market or exchange on which they are traded. In the event there were no sales during the day or closing prices are not available, securities are valued at the last quoted bid price. Debt securities, including restricted securities, for which quotations are readily available, are valued by independent pricing services or by dealers who make markets in such securities. Pricing services consider yield or price of bonds of comparable quality, coupon, maturity and type as well as dealer supplied prices. Investments in open-end mutual funds, including the Fidelity Central Funds, are valued at their closing net asset value each business day. Short-term securities with remaining maturities of sixty days or less for which quotations are not readily available are valued at amortized cost, which approximates value.
When current market prices or quotations are not readily available or do not accurately reflect fair value, valuations may be determined in accordance with procedures adopted by the Board of Trustees. For example, when developments occur between the close of a market and the close of the NYSE that may materially affect the value of some or all of the securities, or when trading in a security is halted, those securities may be fair valued. Factors used in the determination of fair value may include monitoring news to identify significant market or security specific events such as changes in the value of U.S. securities markets, reviewing developments in foreign markets and evaluating the performance of ADRs, futures contracts and exchange-traded funds. Because the Fund's utilization of fair value pricing depends on market activity, the frequency with which fair value pricing is used cannot be predicted and may be utilized to a significant extent. The value of securities used for NAV calculation under fair value pricing may differ from published prices for the same securities.
Foreign Currency. The Fund uses foreign currency contracts to facilitate transactions in foreign-denominated securities. Losses from these transactions may arise from changes in the value of the foreign currency or if the counterparties do not perform under the contracts' terms.
Foreign-denominated assets, including investment securities, and liabilities are translated into U.S. dollars at the exchange rate at period end. Purchases and sales of investment securities, income and dividends received and expenses denominated in foreign currencies are translated into U.S. dollars at the exchange rate in effect on the transaction date.
Annual Report
Notes to Financial Statements - continued
(Amounts in thousands except ratios)
3. Significant Accounting Policies - continued
Foreign Currency - continued
The effects of exchange rate fluctuations on investments are included with the net realized and unrealized gain (loss) on investment securities. Other foreign currency transactions resulting in realized and unrealized gain (loss) are disclosed separately.
Investment Transactions and Income. For financial reporting purposes, the Fund's investment holdings and NAV include trades executed through the end of the last business day of the period. The NAV for processing shareholder transactions includes trades executed through the end of the prior business day. Gains and losses on securities sold are determined on the basis of identified cost. Dividend income is recorded on the ex-dividend date, except for certain dividends from foreign securities where the ex-dividend date may have passed, which are recorded as soon as the Fund is informed of the ex-dividend date. Non-cash dividends included in dividend income, if any, are recorded at the fair market value of the securities received. Distributions received on securities that represent a return of capital or capital gain are recorded as a reduction of cost of investments and/or as a realized gain. The Fund estimates the components of distributions received that may be considered return of capital distributions or capital gain distributions. Interest income and distributions from the Fidelity Central Funds are accrued as earned. Interest income includes coupon interest and amortization of premium and accretion of discount on debt securities. Investment income is recorded net of foreign taxes withheld where recovery of such taxes is uncertain.
Expenses. Most expenses of the trust can be directly attributed to a fund. Expenses which cannot be directly attributed are apportioned among each Fund in the trust. Expense estimates are accrued in the period to which they relate and adjustments are made when actual amounts are known.
Income Tax Information and Distributions to Shareholders. Each year, the Fund intends to qualify as a regulated investment company by distributing all of its taxable income and realized gains under Subchapter M of the Internal Revenue Code. As a result, no provision for income taxes is required in the accompanying financial statements. Foreign taxes are provided for based on the Fund's understanding of the tax rules and rates that exist in the foreign markets in which it invests.
Distributions are recorded on the ex-dividend date. Income dividends and capital gain distributions are declared separately for each class. Income and capital gain distributions are determined in accordance with income tax regulations, which may differ from generally accepted accounting principles. In addition, the Fund will claim a portion of the payment made to redeeming shareholders as a distribution for income tax purposes.
Annual Report
3. Significant Accounting Policies - continued
Income Tax Information and Distributions to Shareholders - continued
Capital accounts within the financial statements are adjusted for permanent book-tax differences. Certain adjustments have been made to the accounts relating to prior periods. Collectively, these adjustments have no impact on net assets or the results of operations. Temporary book-tax differences will reverse in a subsequent period.
Book-tax differences are primarily due to foreign currency transactions, certain foreign taxes, passive foreign investment companies (PFIC) and losses deferred due to wash sales.
The tax-basis components of distributable earnings and the federal tax cost as of period end were as follows:
Unrealized appreciation | $ 557,218 |
Unrealized depreciation | (127,347) |
Net unrealized appreciation (depreciation) | 429,871 |
Undistributed ordinary income | 79,370 |
Undistributed long-term capital gain | 220,528 |
| |
Cost for federal income tax purposes | $ 1,449,071 |
The tax character of distributions paid was as follows:
| October 31, 2007 | October 31, 2006 |
Ordinary Income | $ 43,869 | $ 66,631 |
Long-term Capital Gains | 310,922 | 178,636 |
Total | $ 354,791 | $ 245,267 |
Short-Term Trading (Redemption) Fees. Shares held in the Fund less than 90 days are subject to a redemption fee equal to 2.00% of the proceeds of the redeemed shares. All redemption fees, including any estimated redemption fees paid by FMR, are retained by the Fund and accounted for as an addition to paid in capital.
New Accounting Pronouncements. In July 2006, Financial Accounting Standards Board Interpretation No. 48, Accounting for Uncertainty in Income Taxes - an interpretation of FASB Statement 109 (FIN 48), was issued and is effective on the last business day of the semiannual reporting period for fiscal years beginning after December 15, 2006. FIN 48 sets forth a threshold for financial statement recognition, measurement and disclosure of a tax position taken or expected to be taken on a tax return. Management has concluded that the adoption of FIN 48 will not result in a material impact on the Fund's net assets, results of operations and financial statement disclosures.
Annual Report
Notes to Financial Statements - continued
(Amounts in thousands except ratios)
3. Significant Accounting Policies - continued
New Accounting Pronouncements - continued
In addition, in September 2006, Statement of Financial Accounting Standards No. 157, Fair Value Measurements (SFAS 157), was issued and is effective for fiscal years beginning after November 15, 2007. SFAS 157 defines fair value, establishes a framework for measuring fair value and expands disclosures about fair value measurements. Management is currently evaluating the impact the adoption of SFAS 157 will have on the Fund's financial statement disclosures.
4. Operating Policies.
Repurchase Agreements. FMR has received an Exemptive Order from the Securities and Exchange Commission (the SEC) which permits the Fund and other affiliated entities of FMR to transfer uninvested cash balances into joint trading accounts which are then invested in repurchase agreements. The Fund may also invest directly with institutions in repurchase agreements. Repurchase agreements are collateralized by government or non-government securities. Upon settlement date, collateral is held in segregated accounts with custodian banks and may be obtained in the event of a default of the counterparty. The Fund monitors, on a daily basis, the value of the collateral to ensure it is at least equal to the principal amount of the repurchase agreement (including accrued interest). In the event of a default by the counterparty, realization of the collateral proceeds could be delayed, during which time the value of the collateral may decline.
Restricted Securities. The Fund may invest in securities that are subject to legal or contractual restrictions on resale. These securities generally may be resold in transactions exempt from registration or to the public if the securities are registered. Disposal of these securities may involve time-consuming negotiations and expense, and prompt sale at an acceptable price may be difficult. Information regarding restricted securities is included at the end of the Fund's Schedule of Investments.
5. Purchases and Sales of Investments.
Purchases and sales of securities, other than short-term securities and U.S. government securities, aggregated $1,176,947 and $1,820,033, respectively.
6. Fees and Other Transactions with Affiliates.
Management Fee. FMR and its affiliates provide the Fund with investment management related services for which the Fund pays a monthly management fee. The management fee is the sum of an individual fund fee rate that is based on an annual rate of .60% of the Fund's average net assets and a group fee rate that averaged ..26% during the
Annual Report
6. Fees and Other Transactions with Affiliates - continued
Management Fee - continued
period. The group fee rate is based upon the average net assets of all the mutual funds advised by FMR. The group fee rate decreases as assets under management increase and increases as assets under management decrease. In addition, the management fee is subject to a performance adjustment (up to a maximum of ± .20% of the Fund's average net assets over a 36 month performance period). The upward or downward adjustment to the management fee is based on the relative investment performance of the retail class of the Fund, International Small Cap as compared to an appropriate benchmark index. For the period, the total annual management fee rate, including the performance adjustment, was .88% of the Fund's average net assets.
Distribution and Service Plan. In accordance with Rule 12b-1 of the 1940 Act, the Fund has adopted separate Distribution and Service Plans for each class of shares. Certain classes pay Fidelity Distributors Corporation (FDC), an affiliate of FMR, separate Distribution and Service Fees, each of which is based on an annual percentage of each class' average net assets. In addition, FDC may pay financial intermediaries for selling shares of the Fund and providing shareholder support services. For the period, the Distribution and Service Fee rates and the total amounts paid to and retained by FDC were as follows:
| Distribution
Fee | Service
Fee | Paid to
FDC | Retained
by FDC |
Class A | 0% | .25% | $ 89 | $ 5 |
Class T | .25% | .25% | 195 | - |
Class B | .75% | .25% | 107 | 80 |
Class C | .75% | .25% | 195 | 19 |
| | | $ 586 | $ 104 |
Sales Load. FDC receives a front-end sales charge of up to 5.75% for selling Class A shares, and 3.50% for selling Class T shares, some of which is paid to financial intermediaries for selling shares of the Fund. FDC receives the proceeds of contingent deferred sales charges levied on Class A, Class T, Class B, and Class C redemptions. These charges depend on the holding period. The deferred sales charges range from 5% to 1% for Class B, 1% for Class C, 1.00% to .50% for certain purchases of Class A shares and .25% for certain purchases of Class T shares.
Annual Report
Notes to Financial Statements - continued
(Amounts in thousands except ratios)
6. Fees and Other Transactions with Affiliates - continued
Sales Load - continued
For the period, sales charge amounts retained by FDC were as follows:
| Retained
by FDC |
Class A | $ 4 |
Class T | 3 |
Class B* | 20 |
Class C* | 3 |
| $ 30 |
* When Class B and Class C shares are initially sold, FDC pays commissions from its own resources to financial intermediaries through which the sales are made.
Transfer Agent Fees. Fidelity Investments Institutional Operations Company, Inc. (FIIOC), an affiliate of FMR, is the transfer, dividend disbursing and shareholder servicing agent for each class of the Fund, except for International Small Cap. Fidelity Service Company, Inc. (FSC), an affiliate of FMR, is the transfer agent for International Small Cap shares. FIIOC and FSC receive account fees and asset-based fees that vary according to the account size and type of account of the shareholders of the respective classes of the Fund. FIIOC and FSC pay for typesetting, printing and mailing of shareholder reports, except proxy statements. For the period, the total transfer agent fees paid by each class to FIIOC or FSC, were as follows:
| Amount | % of
Average
Net Assets |
Class A | $ 107 | .30 |
Class T | 114 | .29 |
Class B | 34 | .32 |
Class C | 54 | .28 |
International Small Cap | 3,363 | .21 |
Institutional Class | 16 | .20 |
| $ 3,688 | |
Accounting and Security Lending Fees. FSC maintains the Fund's accounting records. The accounting fee is based on the level of average net assets for the month. Under a separate contract, FSC administers the security lending program. The security lending fee is based on the number and duration of lending transactions.
Annual Report
7. Committed Line of Credit.
The Fund participates with other funds managed by FMR in a $4.2 billion credit facility (the "line of credit") to be utilized for temporary or emergency purposes to fund shareholder redemptions or for other short-term liquidity purposes. The Fund has agreed to pay commitment fees on its pro rata portion of the line of credit, which amounted to $4 and is reflected in Miscellaneous Expense on the Statement of Operations. During the period, there were no borrowings on this line of credit.
8. Security Lending.
The Fund lends portfolio securities from time to time in order to earn additional income. On the settlement date of the loan, the Fund receives collateral (in the form of U.S. Treasury obligations, letters of credit and/or cash) against the loaned securities and maintains collateral in an amount not less than 100% of the market value of the loaned securities during the period of the loan. The market value of the loaned securities is determined at the close of business of the Fund and any additional required collateral is delivered to the Fund on the next business day. If the borrower defaults on its obligation to return the securities loaned because of insolvency or other reasons, a fund could experience delays and costs in recovering the securities loaned or in gaining access to the collateral. Any cash collateral received is invested in the Fidelity Securities Lending Cash Central Fund. The value of loaned securities and cash collateral at period end are disclosed on the Fund's Statement of Assets and Liabilities. Security lending income represents the income earned on investing cash collateral, less fees and expenses associated with the loan, plus any premium payments that may be received on the loan of certain types of securities. Security lending income is presented in the Statement of Operations as a component of income from Fidelity Central Funds.
9. Expense Reductions.
Many of the brokers with whom FMR places trades on behalf of the Fund provided services to the Fund in addition to trade execution. These services included payments of certain expenses on behalf of the Fund totaling $673 for the period. During the period, these credits reduced the Fund's custody expenses by $1. During the period, credits reduced each class' transfer agent expense as noted in the table below.
| Transfer Agent
expense reduction | |
International Small Cap | $ 32 | |
Annual Report
Notes to Financial Statements - continued
(Amounts in thousands except ratios)
10. Other.
The Fund's organizational documents provide former and current trustees and officers with a limited indemnification against liabilities arising in connection with the performance of their duties to the Fund. In the normal course of business, the Fund may also enter into contracts that provide general indemnifications. The Fund's maximum exposure under these arrangements is unknown as this would be dependent on future claims that may be made against the Fund. The risk of material loss from such claims is considered remote.
In September 2006, FIIOC, the Fund's transfer agent, notified the Fund that the Fund's books and records did not reflect a conversion of certain Class B to Class A shares upon their conversion date. In March 2007, FIIOC converted the relevant Class B shares to Class A shares and recorded the conversion in the books and records of the Fund which did not result in a material impact to the Fund's reported net assets or results of operations in the accompanying financial statements. FIIOC has remediated affected shareholders and reimbursed the Fund for all related audit and legal expenses.
The United States Securities and Exchange Commission ("SEC") is conducting an investigation of FMR (covering the years 2002 to 2004) arising from gifts, gratuities and business entertainment provided by certain brokers to certain individuals who were employed on FMR's domestic equity trading desk during that period. FMR is in discussions with the SEC staff regarding the possible resolution of the matter, but as of period-end no final resolution has been reached.
In December 2006, the Independent Trustees completed their own investigation of the matter with the assistance of independent counsel. The Independent Trustees and FMR agree that, despite the absence of proof that the Fidelity mutual funds experienced diminished execution quality as a result of the improper receipt of gifts and business entertainment, the conduct at issue was serious and is worthy of redress. Accordingly, the Independent Trustees have requested and FMR has agreed to pay $42 million to Fidelity mutual funds, plus interest to be determined at the time that payment is made. A method of allocating this payment among the funds has not yet been determined. The total payment to the Fund is not anticipated to have a material impact on the Fund's net assets. In addition, FMR reimbursed related legal expenses which are recorded in the accompanying Statement of Operations as an expense reduction.
Annual Report
11. Distributions to Shareholders.
Distributions to shareholders of each class were as follows:
| Years ended October 31, |
| 2007 | 2006 |
From net investment income | | |
Class A | $ - | $ 62 |
International Small Cap | 3,765 | 10,726 |
Institutional Class | 22 | 42 |
Total | $ 3,787 | $ 10,829 |
From net realized gain | | |
Class A | $ 6,864 | $ 3,713 |
Class T | 7,706 | 4,531 |
Class B | 2,092 | 1,339 |
Class C | 3,882 | 2,560 |
International Small Cap | 328,782 | 221,459 |
Institutional Class | 1,678 | 836 |
Total | $ 351,004 | $ 234,438 |
12. Share Transactions.
Transactions for each class of shares were as follows:
| Shares | Dollars |
| Years ended October 31, | Years ended October 31, |
| 2007 | 2006 | 2007 | 2006 |
Class A | | | | |
Shares sold | 268 | 335 | $ 7,316 | $ 9,788 |
Reinvestment of distributions | 252 | 125 | 6,096 | 3,194 |
Shares redeemed | (556) | (490) | (14,980) | (14,008) |
Net increase (decrease) | (36) | (30) | $ (1,568) | $ (1,026) |
Class T | | | | |
Shares sold | 226 | 413 | $ 6,120 | $ 11,877 |
Reinvestment of distributions | 297 | 165 | 7,166 | 4,209 |
Shares redeemed | (671) | (679) | (17,855) | (19,325) |
Net increase (decrease) | (148) | (101) | $ (4,569) | $ (3,239) |
Class B | | | | |
Shares sold | 19 | 69 | $ 519 | $ 1,926 |
Reinvestment of distributions | 79 | 48 | 1,892 | 1,211 |
Shares redeemed | (149) | (202) | (3,957) | (5,665) |
Net increase (decrease) | (51) | (85) | $ (1,546) | $ (2,528) |
Annual Report
Notes to Financial Statements - continued
(Amounts in thousands except ratios)
12. Share Transactions - continued
| Shares | Dollars |
| Years ended October 31, | Years ended October 31, |
| 2007 | 2006 | 2007 | 2006 |
Class C | | | | |
Shares sold | 56 | 146 | $ 1,462 | $ 4,106 |
Reinvestment of distributions | 124 | 80 | 2,967 | 2,033 |
Shares redeemed | (277) | (431) | (7,298) | (11,929) |
Net increase (decrease) | (97) | (205) | $ (2,869) | $ (5,790) |
International Small Cap | | | | |
Shares sold | 7,028 | 17,580 | $ 194,113 | $ 512,573 |
Reinvestment of distributions | 12,767 | 8,379 | 311,000 | 216,010 |
Shares redeemed | (29,445) | (41,151) | (791,655) | (1,173,251) |
Net increase (decrease) | (9,650) | (15,192) | $ (286,542) | $ (444,668) |
Institutional Class | | | | |
Shares sold | 47 | 124 | $ 1,226 | $ 3,656 |
Reinvestment of distributions | 39 | 20 | 938 | 506 |
Shares redeemed | (150) | (109) | (3,984) | (3,132) |
Net increase (decrease) | (64) | 35 | $ (1,820) | $ 1,030 |
Annual Report
Report of Independent Registered Public Accounting Firm
To the Trustees of Fidelity Investment Trust and Shareholders of Fidelity International Small Cap Fund:
We have audited the accompanying statement of assets and liabilities of Fidelity International Small Cap Fund (the Fund), a fund of Fidelity Investment Trust, including the schedule of investments, as of October 31, 2007, and the related statement of operations for the year then ended, the statement of changes in net assets for each of the two years in the period then ended, and the financial highlights for each of the four years in the period then ended and for the period from May 27, 2003 (commencement of operations) to October 31, 2003. These financial statements and financial highlights are the responsibility of the Fund's management. Our responsibility is to express an opinion on these financial statements and financial highlights based on our audits.
We conducted our audits in accordance with standards of the Public Company Accounting Oversight Board (United States). Those standards require that we plan and perform the audit to obtain reasonable assurance about whether the financial statements and financial highlights are free of material misstatement. The Fund is not required to have, nor were we engaged to perform, an audit of its internal control over financial reporting. Our audits included consideration of internal control over financial reporting as a basis for designing audit procedures that are appropriate in the circumstances, but not for the purpose of expressing an opinion on the effectiveness of the Fund's internal control over financial reporting. Accordingly, we express no such opinion. An audit also includes examining, on a test basis, evidence supporting the amounts and disclosures in the financial statements, assessing the accounting principles used and significant estimates made by management, as well as evaluating the overall financial statement presentation. Our procedures included confirmation of securities owned as of October 31, 2007, by correspondence with the custodians and brokers; where replies were not received from brokers, we performed other auditing procedures. We believe that our audits provide a reasonable basis for our opinion.
In our opinion, the financial statements and financial highlights referred to above present fairly, in all material respects, the financial position of Fidelity International Small Cap Fund as of October 31, 2007, the results of its operations for the year then ended, the changes in its net assets for each of the two years in the period then ended, and its financial highlights for each of the four years in the period then ended and for the period from May 27, 2003 (commencement of operations) to October 31, 2003, in conformity with accounting principles generally accepted in the United States of America.
/s/ Deloitte & Touche LLP
DELOITTE & TOUCHE LLP
Boston, Massachusetts
December 21, 2007
Annual Report
Trustees and Officers
The Trustees, Members of the Advisory Board, and executive officers of the trust and fund, as applicable, are listed below. The Board of Trustees governs the fund and is responsible for protecting the interests of shareholders. The Trustees are experienced executives who meet periodically throughout the year to oversee the fund's activities, review contractual arrangements with companies that provide services to the fund, and review the fund's performance. Except for James C. Curvey, each of the Trustees oversees 370 funds advised by FMR or an affiliate. Mr. Curvey oversees 340 funds advised by FMR or an affiliate.
The Trustees hold office without limit in time except that (a) any Trustee may resign; (b) any Trustee may be removed by written instrument, signed by at least two-thirds of the number of Trustees prior to such removal; (c) any Trustee who requests to be retired or who has become incapacitated by illness or injury may be retired by written instrument signed by a majority of the other Trustees; and (d) any Trustee may be removed at any special meeting of shareholders by a two-thirds vote of the outstanding voting securities of the trust. Each Trustee who is not an interested person (as defined in the 1940 Act) (Independent Trustee), shall retire not later than the last day of the calendar year in which his or her 72nd birthday occurs. The Independent Trustees may waive this mandatory retirement age policy with respect to individual Trustees. The executive officers and Advisory Board Members hold office without limit in time, except that any officer and Advisory Board Member may resign or may be removed by a vote of a majority of the Trustees at any regular meeting or any special meeting of the Trustees. Except as indicated, each individual has held the office shown or other offices in the same company for the past five years.
The fund's Statement of Additional Information (SAI) includes more information about the Trustees. To request a free copy, call Fidelity at 1-877-208-0098.
Interested Trustees*:
Correspondence intended for each Trustee who is an interested person may be sent to Fidelity Investments, 82 Devonshire Street, Boston, Massachusetts 02109.
Name, Age; Principal Occupation |
Edward C. Johnson 3d (77) |
| Year of Election or Appointment: 1984 Mr. Johnson is Chairman of the Board of Trustees. Mr. Johnson serves as President (2006-present), Chief Executive Officer, Chairman, and a Director of FMR LLC; Chairman and a Director of FMR; Chairman and a Director of Fidelity Research & Analysis Company (FRAC); Chairman and a Director of Fidelity Investments Money Management, Inc.; and Chairman (2001-present) and a Director of FMR Co., Inc. In addition, Mr. Johnson serves as Chairman and Director of Fidelity International Limited (FIL). |
Name, Age; Principal Occupation |
James C. Curvey (72) |
| Year of Election or Appointment: 2007 Mr. Curvey also serves as Trustee (2007-present) or Member of the Advisory Board (2007-present) of other investment companies advised by FMR. Mr. Curvey is a Director of FMR and FMR Co., Inc. (2007- present). Mr. Curvey is also Vice Chairman (2006-present) and Director of FMR LLC. Mr. Curvey joined Fidelity in 1982 and served in numerous senior management positions, including President and Chief Operating Officer of FMR LLC (1997-2000) and President of Fidelity Strategic Investments (2000-2002). In addition, he serves as a member of the Board of Directors of Geerlings & Wade, Inc. (wine distribution). |
* Trustees have been determined to be "Interested Trustees" by virtue of, among other things, their affiliation with the trust or various entities under common control with FMR. FMR Corp. merged with FMR LLC on October 1, 2007. Any references to FMR LLC for prior periods are deemed to be references to the prior entity.
Independent Trustees:
Correspondence intended for each Independent Trustee (that is, the Trustees other than the Interested Trustees) may be sent to Fidelity Investments, P.O. Box 55235, Boston, Massachusetts 02205-5235.
Name, Age; Principal Occupation |
Dennis J. Dirks (59) |
| Year of Election or Appointment: 2005 Prior to his retirement in May 2003, Mr. Dirks was Chief Operating Officer and a member of the Board of The Depository Trust & Clearing Corporation (DTCC) (1999-2003). He also served as President, Chief Operating Officer, and Board member of The Depository Trust Company (DTC) (1999-2003) and President and Board member of the National Securities Clearing Corporation (NSCC) (1999-2003). In addition, Mr. Dirks served as Chief Executive Officer and Board member of the Government Securities Clearing Corporation (2001-2003) and Chief Executive Officer and Board member of the Mortgage-Backed Securities Clearing Corporation (2001-2003). Mr. Dirks also serves as a Trustee and a member of the Finance Committee of Manhattan College (2005-
present) and a Trustee and a member of the Finance Committee of AHRC of Nassau County (2006-present). |
Albert R. Gamper, Jr. (65) |
| Year of Election or Appointment: 2006 Prior to his retirement in December 2004, Mr. Gamper served as Chairman of the Board of CIT Group Inc. (commercial finance). During his tenure with CIT Group Inc. Mr. Gamper served in numerous senior management positions, including Chairman (1987-1989; 1999-2001; 2002-2004), Chief Executive Officer (1987-2004), and President (1989-2002). He currently serves as a member of the Board of Directors of Public Service Enterprise Group (utilities, 2001-present), Chairman of the Board of Governors, Rutgers University (2004-present), and Chairman of the Board of Saint Barnabas Health Care System. |
George H. Heilmeier (71) |
| Year of Election or Appointment: 2004 Dr. Heilmeier is Chairman Emeritus of Telcordia Technologies (communication software and systems), where prior to his retirement, he served as company Chairman and Chief Executive Officer. He currently serves on the Boards of Directors of The Mitre Corporation (systems engineering and information technology support for the government), and HRL Laboratories (private research and development, 2004-present). He is Chairman of the General Motors Science & Technology Advisory Board and a Life Fellow of the Institute of Electrical and Electronics Engineers (IEEE). Dr. Heilmeier is a member of the Defense Science Board and the National Security Agency Advisory Board. He is also a member of the National Academy of Engineering, the American Academy of Arts and Sciences, and the Board of Overseers of the School of Engineering and Applied Science of the University of Pennsylvania. Previously, Dr. Heilmeier served as a Director of TRW Inc. (automotive, space, defense, and information technology, 1992-2002), Compaq (1994-2002), Automatic Data Processing, Inc. (ADP) (technology-based business outsourcing, 1995-2002), INET Technologies Inc. (telecommunications network surveillance, 2001-2004), and Teletech Holdings (customer management services). He is the recipient of the 2005 Kyoto Prize in Advanced Technology for his invention of the liquid crystal display, and a member of the Consumer Electronics Hall of Fame. |
James H. Keyes (67) |
| Year of Election or Appointment: 2007 Prior to his retirement in 2003, Mr. Keyes was Chairman, President, and Chief Executive Officer of Johnson Controls, Inc. (automotive supplier, 1993-2003). He currently serves as a member of the boards of LSI Logic Corporation (semiconductor technologies), Navistar International Corporation (manufacture and sale of trucks, buses, and diesel engines, 2002-present), and Pitney Bowes, Inc. (integrated mail, messaging, and document management solutions). |
Marie L. Knowles (61) |
| Year of Election or Appointment: 2001 Prior to Ms. Knowles' retirement in June 2000, she served as Executive Vice President and Chief Financial Officer of Atlantic Richfield Company (ARCO) (diversified energy, 1996-2000). From 1993 to 1996, she was a Senior Vice President of ARCO and President of ARCO Transportation Company. She served as a Director of ARCO from 1996 to 1998. She currently serves as a Director of Phelps Dodge Corporation (copper mining and manufacturing) and McKesson Corporation (healthcare service, 2002-present). Ms. Knowles is a Trustee of the Brookings Institution and the Catalina Island Conservancy and also serves as a member of the Advisory Board for the School of Engineering of the University of Southern California. |
Ned C. Lautenbach (63) |
| Year of Election or Appointment: 2000 Mr. Lautenbach is Chairman of the Independent Trustees (2006-present). Mr. Lautenbach has been a partner of Clayton, Dubilier & Rice, Inc. (private equity investment firm) since September 1998. Previously, Mr. Lautenbach was with the International Business Machines Corporation (IBM) from 1968 until his retirement in 1998. Mr. Lautenbach serves as a Director of Sony Corporation (2006-present) and Eaton Corporation (diversified industrial) as well as the Philharmonic Center for the Arts in Naples, Florida. He also is a member of the Board of Trustees of Fairfield University (2005-present), as well as a member of the Council on Foreign Relations. |
Cornelia M. Small (63) |
| Year of Election or Appointment: 2005 Ms. Small is a member (2000-present) and Chairperson (2002-present) of the Investment Committee, and a member (2002-present) of the Board of Trustees of Smith College. Previously, she served as Chief Investment Officer (1999-2000), Director of Global Equity Investments (1996-1999), and a member of the Board of Directors of Scudder, Stevens & Clark (1990-1997) and Scudder Kemper Investments (1997-
1999). In addition, Ms. Small served as Co-Chair (2000-2003) of the Annual Fund for the Fletcher School of Law and Diplomacy. |
William S. Stavropoulos (68) |
| Year of Election or Appointment: 2001 Mr. Stavropoulos is Chairman Emeritus of the Board of Directors of The Dow Chemical Company. Since joining The Dow Chemical Company in 1967, Mr. Stavropoulos served in numerous senior management positions, including President (1993-2000; 2002-2003), CEO (1995-2000; 2002-2004), and Chairman of the Executive Committee (2000-2004). Currently, he is a Director of NCR Corporation (data warehousing and technology solutions), Chemical Financial Corporation, Maersk Inc. (industrial conglomerate, 2002-present), Tyco International, Inc. (multinational manufacturing and services, 2007-present), and a member of the Advisory Board for Metalmark Capital (private equity investment firm, 2005-present). He is a special advisor to Clayton, Dubilier & Rice, Inc., a private equity investment firm. He also serves as a member of the Board of Trustees of the American Enterprise Institute for Public Policy Research. In addition, Mr. Stavropoulos is a member of The Business Council, J.P. Morgan International Council and the University of Notre Dame Advisory Council for the College of Science. |
Kenneth L. Wolfe (68) |
| Year of Election or Appointment: 2005 Prior to his retirement in 2001, Mr. Wolfe was Chairman and Chief Executive Officer of Hershey Foods Corporation (1993-2001). He currently serves as a member of the boards of Adelphia Communications Corporation (2003-present), Bausch & Lomb, Inc., and Revlon Inc. (2004-present). |
Annual Report
Trustees and Officers - continued
Advisory Board Members and Executive Officers**:
Correspondence intended for Mr. Mauriello, Mr. Thomas, and Mr. Wiley may be sent to Fidelity Investments, P.O. Box 55235, Boston, Massachusetts 02205-5235. Correspondence intended for each executive officer and Mr. Lynch may be sent to Fidelity Investments, 82 Devonshire Street, Boston, Massachusetts 02109.
Peter S. Lynch (63) |
| Year of Election or Appointment: 2003 Member of the Advisory Board of Fidelity Investment Trust. Mr. Lynch is Vice Chairman and a Director of FMR, and Vice Chairman (2001-
present) and a Director of FMR Co., Inc. Previously, Mr. Lynch served as a Trustee of the Fidelity funds (1990-2003). In addition, he serves as a Trustee of Boston College and as the Chairman of the Inner-City Scholarship Fund. |
Joseph Mauriello (63) |
| Year of Election or Appointment: 2007 Member of the Advisory Board of Fidelity Investment Trust. Prior to his retirement in January 2006, Mr. Mauriello served in numerous senior management positions including Deputy Chairman and Chief Operating Officer (2004-2005), and Vice Chairman of Financial Services (2002-
2004) of KPMG LLP US (professional services firm, 1965-2005). Mr. Mauriello currently serves as a member of the Board of Directors of XL Capital Ltd., (global insurance and re-insurance company, 2006-
present) and of Arcadia Resources Inc., (health care services and products, 2007-present). He also served as a Director of the Hamilton Funds of the Bank of New York (2006-2007). |
David M. Thomas (58) |
| Year of Election or Appointment: 2007 Member of the Advisory Board of Fidelity Investment Trust. Previously, Mr. Thomas served as Executive Chairman (2005-2006) and Chairman and Chief Executive Officer (2000-2005) of IMS Health, Inc. (pharmaceutical and healthcare information solutions). In addition, Mr. Thomas serves as a member of the Board of Directors of Fortune Brands, Inc. (consumer products holding company), and Interpublic Group of Companies, Inc. (marketing communication, 2004-present). |
Michael E. Wiley (57) |
| Year of Election or Appointment: 2007 Member of the Advisory Board of Fidelity Investment Trust. Mr. Wiley also serves as Sr. Energy Advisor of Katzenbach Partners, LLC (consulting firm, 2006-present) and a member of the Board of Trustees of the University of Tulsa (2000-2006; 2007-present). He serves as a Director of Tesoro Corporation (independent oil refiner and marketer, 2005-
present), and a Director of Bill Barrett Corporation (exploration and production company, 2005-present). In addition, he also serves as a Director of Post Oak Bank (privately-held bank, 2004-present), and an Advisory Director of Riverstone Holdings (private investment firm). Previously, Mr. Wiley served as Chairman, President, and CEO of Baker Hughes, Inc. (oilfield services company, 2000-2004), and as Director of Spinnaker Exploration Company (exploration and production company, 2001-2005). |
Kimberley H. Monasterio (43) |
| Year of Election or Appointment: 2007 President and Treasurer of the fund. Ms. Monasterio also serves as President and Treasurer of other Fidelity funds (2007-present) and is an employee of FMR (2004-present). Previously, Ms. Monasterio served as Deputy Treasurer of the Fidelity funds (2004-2006). Before joining Fidelity Investments, Ms. Monasterio served as Treasurer (2000-2004) and Chief Financial Officer (2002-2004) of the Franklin Templeton Funds and Senior Vice President of Franklin Templeton Services, LLC (2000-2004). |
Walter C. Donovan (45) |
| Year of Election or Appointment: 2007 Vice President of the fund. Mr. Donovan also serves as Vice President of Fidelity's Equity Funds (2007-present). Mr. Donovan also serves as Executive Vice President of FMR (2005-present) and FMR Co., Inc. (2005-present). Previously, Mr. Donovan served as Vice President of Fidelity's High Income Funds (2005-2007), Fixed-Income Funds (2005-
2006), certain Asset Allocation Funds (2005-2006), certain Balanced Funds (2005-2006), and as Vice President and Director of Fidelity's International Equity Trading group (1998-2005). |
Eric M. Wetlaufer (45) |
| Year of Election or Appointment: 2006 Vice President of the fund. Mr. Wetlaufer also serves as Vice President of certain International Equity Funds (2006-present). Mr. Wetlaufer is Senior Vice President of FMR (2006-present) and FMR Co., Inc. (2006-
present), and President and Director of Fidelity Management & Research (U.K.) Inc. (2006-present) and Fidelity Research & Analysis Company (2006-present). Before joining Fidelity Investments in 2005, Mr. Wetlaufer was a partner in Oxhead Capital Management (2004-
2005). Previously, Mr. Wetlaufer served as a Chief Investment Officer of Putnam Investments (1997-2003). |
Eric D. Roiter (58) |
| Year of Election or Appointment: 2002 Secretary of the fund. He also serves as Secretary of other Fidelity funds; Vice President, General Counsel, and Secretary of FMR Co., Inc. (2001-present) and FMR; Assistant Secretary of Fidelity Management & Research (U.K.) Inc. (2001-present), Fidelity Research & Analysis Company (2001-present), and Fidelity Investments Money Management, Inc. (2001-present). Mr. Roiter is an Adjunct Member, Faculty of Law, at Boston College Law School (2003-present). Previously, Mr. Roiter served as Vice President and Secretary of Fidelity Distributors Corporation (FDC) (1998-2005). |
Scott C. Goebel (39) |
| Year of Election or Appointment: 2007 Assistant Secretary of the fund. Mr. Goebel also serves as Assistant Secretary of other Fidelity funds (2007-present), and is an employee of FMR. |
R. Stephen Ganis (41) |
| Year of Election or Appointment: 2006 Anti-Money Laundering (AML) officer of the fund. Mr. Ganis also serves as AML officer of other Fidelity funds (2006-present) and FMR LLC (2003-present). Before joining Fidelity Investments, Mr. Ganis practiced law at Goodwin Procter, LLP (2000-2002). |
Joseph B. Hollis (59) |
| Year of Election or Appointment: 2006 Chief Financial Officer of the fund. Mr. Hollis also serves as Chief Financial Officer of other Fidelity funds. Mr. Hollis is President of Fidelity Pricing and Cash Management Services (FPCMS) (2005-present). Mr. Hollis also serves as President and Director of Fidelity Service Company, Inc. (2006-present). Previously, Mr. Hollis served as Senior Vice President of Cash Management Services (1999-2002) and Investment Management Operations (2002-2005). |
Kenneth A. Rathgeber (60) |
| Year of Election or Appointment: 2004 Chief Compliance Officer of the fund. Mr. Rathgeber also serves as Chief Compliance Officer of other Fidelity funds (2004-present) and Executive Vice President of Risk Oversight for Fidelity Investments (2002-
present). He is Chief Compliance Officer of FMR (2005-present), FMR Co., Inc. (2005-present), Fidelity Management & Research (U.K.) Inc. (2005-present), Fidelity Research & Analysis Company (2005-present), Fidelity Investments Money Management, Inc. (2005-present), and Strategic Advisers, Inc. (2005-present). Previously, Mr. Rathgeber served as Executive Vice President and Chief Operating Officer for Fidelity Investments Institutional Services Company, Inc. (1998-2002). |
Bryan A. Mehrmann (46) |
| Year of Election or Appointment: 2005 Deputy Treasurer of the fund. Mr. Mehrmann also serves as Deputy Treasurer of other Fidelity funds (2005-present) and is an employee of FMR. Previously, Mr. Mehrmann served as Vice President of Fidelity Investments Institutional Services Group (FIIS)/Fidelity Investments Institutional Operations Corporation, Inc. (FIIOC) Client Services (1998-2004). |
Kenneth B. Robins (38) |
| Year of Election or Appointment: 2005 Deputy Treasurer of the fund. Mr. Robins also serves as Deputy Treasurer of other Fidelity funds (2005-present) and is an employee of FMR (2004-present). Before joining Fidelity Investments, Mr. Robins worked at KPMG LLP, where he was a partner in KPMG's department of professional practice (2002-2004) and a Senior Manager (1999-2000). In addition, Mr. Robins served as Assistant Chief Accountant, United States Securities and Exchange Commission (2000-2002). |
Robert G. Byrnes (40) |
| Year of Election or Appointment: 2005 Assistant Treasurer of the fund. Mr. Byrnes also serves as Assistant Treasurer of other Fidelity funds (2005-present) and is an employee of FMR (2005-present). Previously, Mr. Byrnes served as Vice President of FPCMS (2003-2005). Before joining Fidelity Investments, Mr. Byrnes worked at Deutsche Asset Management where he served as Vice President of the Investment Operations Group (2000-2003). |
Peter L. Lydecker (53) |
| Year of Election or Appointment: 2004 Assistant Treasurer of the fund. Mr. Lydecker also serves as Assistant Treasurer of other Fidelity funds (2004) and is an employee of FMR. |
Paul M. Murphy (60) |
| Year of Election or Appointment: 2007 Assistant Treasurer of the fund. Mr. Murphy also serves as Assistant Treasurer of other Fidelity funds (2007-present) and is an employee of FMR (2007-present). Previously, Mr. Murphy served as Chief Financial Officer of the Fidelity Funds (2005-2006), Vice President and Associate General Counsel of FMR (2007), and Senior Vice President of Fidelity Pricing and Cash Management Services Group (FPCMS) (1994-2007). |
Gary W. Ryan (49) |
| Year of Election or Appointment: 2005 Assistant Treasurer of the fund. Mr. Ryan also serves as Assistant Treasurer of other Fidelity funds (2005-present) and is an employee of FMR (2005-present). Previously, Mr. Ryan served as Vice President of Fund Reporting in FPCMS (1999-2005). |
** FMR Corp. merged with FMR LLC on October 1, 2007. Any references to FMR LLC for prior periods are deemed to be references to the prior entity.
Annual Report
Distributions
The Board of Trustees of Advisor International Small Cap Fund voted to pay to shareholders of record at the opening of business on record date, the following distributions per share derived from capital gains realized from sales of portfolio securities, and dividends derived from net investment income:
| Pay Date | Record Date | Dividends | Capital Gains |
Class A | 12/10/07 | 12/7/07 | $.026 | $5.176 |
Class T | 12/10/07 | 12/7/07 | $.00 | $5.123 |
Class B | 12/10/07 | 12/7/07 | $.00 | $4.949 |
Class C | 12/10/07 | 12/7/07 | $.00 | $4.975 |
The fund hereby designates as a capital gain dividend with respect to the taxable year ended October 31, 2007, $221,145,898, or, if subsequently determined to be different, the net capital gain of such year.
The amounts per share which represent income derived from sources within, and taxes paid to, foreign countries or possessions of the United States are as follows:
| Pay Date | Income | Taxes |
Class A | 12/11/2006 | $.283 | $.027 |
Class T | 12/11/2006 | $.248 | $.027 |
Class B | 12/11/2006 | $.181 | $.027 |
Class C | 12/11/2006 | $.170 | $.027 |
The fund will notify shareholders in January 2008 of amounts for use in preparing 2007 income tax returns.
Annual Report
Board Approval of Investment Advisory Contracts and Management Fees
Fidelity International Small Cap Fund
Each year, typically in July, the Board of Trustees, including the Independent Trustees (together, the Board), votes on the renewal of the management contract and sub-advisory agreements (together, the Advisory Contracts) for the fund. The Board, assisted by the advice of fund counsel and Independent Trustees' counsel, requests and considers a broad range of information throughout the year.
The Board meets regularly each month except August and takes into account throughout the year matters bearing on Advisory Contracts. The Board, acting directly and through its separate committees, considers at each of its meetings factors that are relevant to the annual renewal of the fund's Advisory Contracts, including the services and support provided to the fund and its shareholders. At the time of the renewal, the Board had 12 standing committees, each composed of Independent Trustees with varying backgrounds, to which the Board has assigned specific subject matter responsibilities in order to enhance effective decision-making by the Board. Each committee has adopted a written charter outlining the structure and purposes of the committee. One such committee, the Equity Contract Committee, meets periodically as needed throughout the year to consider matters specifically related to the annual renewal of Advisory Contracts. The committee requests and receives information on, and makes recommendations to the Independent Trustees concerning, the approval and annual review of the Advisory Contracts.
At its July 2007 meeting, the Board of Trustees, including the Independent Trustees, unanimously determined to renew the Advisory Contracts for the fund. In reaching its determination, the Board considered all factors it believed relevant, including (i) the nature, extent, and quality of the services to be provided to the fund and its shareholders (including the investment performance of the fund); (ii) the competitiveness of the management fee and total expenses of the fund; (iii) the total costs of the services to be provided by and the profits to be realized by the investment adviser and its affiliates from the relationship with the fund; (iv) the extent to which economies of scale would be realized as the fund grows; and (v) whether fee levels reflect these economies of scale, if any, for the benefit of fund shareholders. The Board also approved amendments to the fund's agreements with foreign sub-advisers to clarify that each sub-adviser provides services as an independent contractor.
In determining whether to renew the Advisory Contracts for the fund, the Board ultimately reached a determination, with the assistance of fund counsel and Independent Trustees' counsel, that the renewal of the Advisory Contracts and the compensation to be received by Fidelity under the management contract is consistent with Fidelity's fiduciary duty under applicable law. In addition to evaluating the specific factors noted above, the Board, in reaching its determination, is aware that shareholders in the fund have a broad range of investment choices available to them, including a wide choice among mutual funds offered by competitors to Fidelity, and that the fund's shareholders, with the opportunity to review and weigh the disclosure provided by the fund in its prospectus and other public disclosures, have chosen to invest in this fund, managed by Fidelity.
Annual Report
Nature, Extent, and Quality of Services Provided. The Board considered staffing within the investment adviser, FMR, and the sub-advisers (together, the Investment Advisers), including the backgrounds of the fund's portfolio managers and the fund's investment objective and discipline. The Independent Trustees also had discussions with senior management of Fidelity's investment operations and investment groups. The Board considered the structure of the portfolio manager compensation program and whether this structure provides appropriate incentives.
Resources Dedicated to Investment Management and Support Services. The Board reviewed the size, education, and experience of the Investment Advisers' investment staff, their use of technology, and the Investment Advisers' approach to recruiting, training, and retaining portfolio managers and other research, advisory, and management personnel. The Board considered Fidelity's extensive global research capabilities that enable the Investment Advisers to aggregate data from various sources in an effort to produce positive investment results. The Board noted that Fidelity's analysts have access to a variety of technological tools that enable them to perform both fundamental and quantitative analysis and to specialize in various disciplines. The Board also considered that Fidelity's portfolio managers and analysts have access to daily portfolio attribution that allows for monitoring of a fund's portfolio, as well as an electronic communication system that provides immediate real-time access to research concerning issuers and credit enhancers.
Shareholder and Administrative Services. The Board considered (i) the nature, extent, quality, and cost of advisory, administrative, distribution, and shareholder services performed by the Investment Advisers and their affiliates under the Advisory Contracts and under separate agreements covering transfer agency, pricing and bookkeeping, and securities lending services for the fund; (ii) the nature and extent of the Investment Advisers' supervision of third party service providers, principally custodians and subcustodians; and (iii) the resources devoted to, and the record of compliance with, the fund's compliance policies and procedures. The Board reviewed the allocation of fund brokerage, including allocations to brokers affiliated with the Investment Advisers, the use of brokerage commissions to pay fund expenses, and the use of "soft" commission dollars to pay for research services. The Board also considered that Fidelity voluntarily pays for market data out of its own resources. The Board also considered the agreement reached between the Independent Trustees and Fidelity in December 2006 following an independent review of matters relating to receipt of travel, entertainment, gifts and gratuities in violation of Fidelity policies.
Annual Report
Board Approval of Investment Advisory Contracts and
Management Fees - continued
The Board noted that the growth of fund assets across the complex allows Fidelity to reinvest in the development of services designed to enhance the value or convenience of the Fidelity funds as investment vehicles. These services include 24-hour access to account information and market information through phone representatives and over the Internet, and investor education materials and asset allocation tools.
Investment in a Large Fund Family. The Board considered the benefits to shareholders of investing in a Fidelity fund, including the benefits of investing in a fund that is part of a large family of funds offering a variety of investment disciplines and providing for a large variety of mutual fund investor services. For example, fund shareholders are offered the privilege of exchanging shares of the fund for shares of other Fidelity funds, as set forth in the fund's prospectus, without paying a sales charge. The Board noted that, since the last Advisory Contract renewals in July 2006, Fidelity has taken a number of actions that benefited particular funds, including (i) dedicating additional resources to investment research and to restructure the investment research teams; (ii) contractually agreeing to reduce the management fee on Fidelity Advisor Floating Rate High Income Fund; (iii) contractually agreeing to reduce the management fees on Fidelity's California, Massachusetts, New Jersey, and New York AMT Tax-Free Money Market Funds, launching new Institutional Classes and Service Classes of these funds, and contractually agreeing to impose expense limitations on these funds; (iv) eliminating the exchange fee on the Fidelity Select Portfolios and reducing the pricing and bookkeeping fee rates for these funds; (v) reducing the maximum transfer agency fee rates on high income funds and certain equity funds; (vi) proposing amended management contracts that, if approved by shareholders, will add a performance adjustment component to the management fees paid by 18 Fidelity Advisor equity funds; (vii) contractually agreeing to reduce fees for Ultra-Short Central Fund and the money market Central Funds; (viii) waiving the Fidelity Advisor funds' contingent deferred sales charge on certain redemptions made through systematic withdrawal programs; and (ix) amending the management contracts for equity and fixed-income funds whose management contracts incorporate a "group fee" structure by adding four new fee "breakpoints" to the group fee rate schedules.
Investment Performance and Compliance. The Board considered whether the fund has operated within its investment objective, as well as its record of compliance with its investment restrictions. It also reviewed the fund's absolute investment performance for each class, as well as the fund's relative investment performance for each class measured against (i) a broad-based securities market index, and (ii) a peer group of mutual funds deemed appropriate by the Board over multiple periods. Because the fund had been in existence less than five calendar years, the following charts considered by the Board show, over the one- and three-year periods ended December 31, 2006, the cumulative total returns of Fidelity International Small Cap (retail class) and Class B of the fund, the cumulative total returns of a broad-based securities market index ("benchmark"), and a range of cumulative total returns of a peer group of mutual funds identified by Lipper Inc. as having an investment objective similar to that of the fund. The returns of Fidelity International Small Cap (retail class) and Class B show the performance of the highest and lowest performing classes, respectively (based on three-year performance). The box within each chart shows the 25th percentile return (bottom of box) and the 75th percentile return (top of box) of the peer group. Returns shown above the box are in the first quartile and returns shown below the box are in the fourth quartile. The percentage beaten numbers noted below each chart correspond to the percentile box and represent the percentage of funds in the peer group whose performance was equal to or lower than that of the class indicated.
Annual Report
Fidelity International Small Cap Fund
The Board reviewed the fund's relative investment performance against its peer group and stated that the performance of Fidelity International Small Cap (retail class) was in the fourth quartile for the one-year period and the third quartile for the three-year period. The Board also stated that the investment performance of the fund was lower than its benchmark for all the periods shown. The Board considered that the variations in performance among the fund's classes reflect the variations in class expenses, which result in lower performance for higher expense classes. The Board discussed with FMR actions to be taken by FMR to improve the fund's disappointing performance relative to its peer group. The Board will continue to closely monitor the performance of the fund in the coming year.
The Board also considered that the fund's management fee is subject to upward or downward adjustment depending upon whether, and to what extent, the fund's investment performance for the performance period exceeds, or is exceeded by, the record (over the same period) of a Board-approved performance adjustment index. The Board realizes that the performance adjustment provides FMR with a strong economic incentive to seek to achieve superior performance for the fund's shareholders and helps to more closely align the interests of FMR and the fund's shareholders.
Annual Report
Board Approval of Investment Advisory Contracts and
Management Fees - continued
The Board considered that FMR has taken steps to refocus and strengthen equity research, equity portfolio management, and compliance.
Based on its review, and giving particular weight to the nature and quality of the resources dedicated by the Investment Advisers to maintain and improve relative performance, the Board concluded that the nature, extent, and quality of the services provided to the fund will benefit the fund's shareholders, particularly in light of the Board's view that the fund's shareholders benefit from investing in a fund that is part of a large family of funds offering a variety of investment disciplines and services.
Competitiveness of Management Fee and Total Fund Expenses. The Board considered the fund's management fee and total expenses compared to "mapped groups" of competitive funds and classes. Fidelity creates "mapped groups" by combining similar Lipper investment objective categories that have comparable management fee characteristics. Combining Lipper investment objective categories aids the Board's management fee and total expense comparisons by broadening the competitive group used for comparison and by reducing the number of universes to which various Fidelity funds are compared. The Board also considered supplemental information about how the fund's management fee and total expenses ranked relative to groups based on Lipper classifications, which take into account a fund's market capitalization and style.
The Board considered two proprietary management fee comparisons for the 12-month (or shorter) periods shown in the chart below. The group of Lipper funds used by the Board for management fee comparisons is referred to below as the "Total Mapped Group" and, for the reasons explained above, is broader than the Lipper peer group used by the Board for performance comparisons. The Total Mapped Group comparison focuses on a fund's standing relative to the total universe of comparable funds available to investors, in terms of gross management fees before expense reimbursements or caps, and without giving effect to the fund's performance adjustment. "TMG %" represents the percentage of funds in the Total Mapped Group that had management fees that were lower than the fund's. For example, a TMG % of 23% means that 77% of the funds in the Total Mapped Group had higher management fees than the fund. The "Asset-Size Peer Group" (ASPG) comparison focuses on a fund's standing relative to non-Fidelity funds similar in size to the fund within the Total Mapped Group. The ASPG represents at least 15% of the funds in the Total Mapped Group with comparable asset size and management fee characteristics, subject to a minimum of 50 funds (or all funds in the Total Mapped Group if fewer than 50). Additional information, such as the ASPG quartile in which the fund's management fee ranked and the impact of the fund's performance adjustment, is also included in the chart and considered by the Board.
Annual Report
Fidelity International Small Cap Fund
The Board noted that the fund's management fee ranked below the median of its Total Mapped Group and below the median of its ASPG for 2006. The Board also noted the effect of the fund's positive performance adjustment on the fund's management fee ranking. The Board noted that the performance adjustment for each year represents calculations for performance periods that differ from the periods shown in the performance charts above.
Based on its review, the Board concluded that the fund's management fee was fair and reasonable in light of the services that the fund receives and the other factors considered.
In its review of each class's total expenses, the Board considered the fund's management fee as well as other fund or class expenses, as applicable, such as transfer agent fees, pricing and bookkeeping fees, fund-paid 12b-1 fees, and custodial, legal, and audit fees. The Board also noted the effects of any waivers and reimbursements on fees and expenses, as well as the fund's positive performance adjustment. As part of its review, the Board also considered current and historical total expenses of each class of the fund compared to competitive fund median expenses. Each class of the fund is compared to those funds and classes in the Total Mapped Group (used by the Board for management fee comparisons) that have a similar sales load structure.
The Board noted that the total expenses of each of Class A, Class B, Class C, Institutional Class and Fidelity International Small Cap (retail class) ranked below its competitive median for 2006, and the total expenses of Class T ranked above its competitive median for 2006. The Board noted that the fund offers multiple classes, each of which has a different sales load and 12b-1 fee structure, and that the multiple structures are intended to offer a range of pricing options for the intermediary market. The Board also noted that the total expenses of the classes vary primarily by the level of their 12b-1 fees, although differences in transfer agent fees may also cause expenses to vary from class to class.
Annual Report
Board Approval of Investment Advisory Contracts and
Management Fees - continued
In its review of total expenses, the Board also considered Fidelity fee structures and other information on clients that FMR and its affiliates service in other competitive markets, such as other mutual funds advised or subadvised by FMR or its affiliates, pension plan clients, and other institutional clients.
Based on its review, the Board concluded that the total expenses of each class of the fund were reasonable, although in one case above the median of the universe presented for comparison, in light of the services that the fund and its shareholders receive and the other factors considered.
Costs of the Services and Profitability. The Board considered the revenues earned and the expenses incurred by Fidelity in conducting the business of developing, marketing, distributing, managing, administering and servicing the fund and its shareholders. The Board also considered the level of Fidelity's profits in respect of all the Fidelity funds.
On an annual basis, FMR presents to the Board Fidelity's profitability for the fund. Fidelity calculates the profitability for each fund, as well as aggregate profitability for groups of Fidelity funds and all Fidelity funds, using a series of detailed revenue and cost allocation methodologies which originate with the audited books and records of Fidelity. The Audit Committee of the Board reviews any significant changes from the prior year's methodologies.
PricewaterhouseCoopers LLP (PwC), independent registered public accounting firm and auditor to Fidelity and certain Fidelity funds, has been engaged annually by the Board as part of the Board's assessment of the results of Fidelity's profitability analysis. PwC's engagement includes the review and assessment of Fidelity's methodologies used in determining the revenues and expenses attributable to Fidelity's mutual fund business, and completion of agreed-upon procedures surrounding the mathematical accuracy of fund profitability and its conformity to allocation methodologies. After considering PwC's reports issued under the engagement and information provided by Fidelity, the Board believes that while other allocation methods may also be reasonable, Fidelity's profitability methodologies are reasonable in all material respects.
The Board has also reviewed Fidelity's non-fund businesses and any fall-out benefits related to the mutual fund business as well as cases where Fidelity's affiliates may benefit from or be related to the fund's business.
Annual Report
The Board considered the costs of the services provided by and the profits realized by Fidelity in connection with the operation of the fund and determined that the amount of profit is a fair entrepreneurial profit for the management of the fund.
Economies of Scale. The Board considered whether there have been economies of scale in respect of the management of the Fidelity funds, whether the Fidelity funds (including the fund) have appropriately benefited from any such economies of scale, and whether there is potential for realization of any further economies of scale. The Board considered the extent to which the fund will benefit from economies of scale through increased services to the fund, through waivers or reimbursements, or through fee or expense reductions, including reductions that occur through operation of the transfer agent agreement. The transfer agent fee varies in part based on the number of accounts in the fund. If the number of accounts decreases or the average account size increases, the overall transfer agent fee rate decreases.
The Board recognized that the fund's management contract incorporates a "group fee" structure, which provides for lower group fee rates as total fund assets under FMR's management increase, and for higher group fee rates as total fund assets under FMR's management decrease. FMR determines the group fee rates based on a tiered asset "breakpoint" schedule. In connection with the renewal of the fund's management contract, the Board approved amendments to the fund's management contract that added four new fee breakpoints to the group fee rate schedule for assets under FMR's management above $1,386 billion. The Board considered that the group fee rate declines under both the present and amended schedules, but that under the amended schedule, the group fee rate declines faster as assets under FMR's management exceed $1,386 billion. The Board considered that the group fee is designed to deliver the benefits of economies of scale to fund shareholders when total fund assets increase, even if assets of any particular fund are unchanged or have declined, because some portion of Fidelity's costs are attributable to services provided to all Fidelity funds, and all funds benefit if those costs can be allocated among more assets. The Board also considered that although the fund is partially closed to new investors, it continues to incur investment management expenses, and marketing and distribution expenses related to the retention of existing shareholders and assets. The Board further noted that the fund may continue to realize benefits from the group fee structure, even though assets may not be expected to grow significantly at the fund level. The Board concluded that, given the group fee structure, fund shareholders will achieve a certain level of economies of scale as assets under FMR's management increase at the fund complex level, regardless of whether Fidelity achieves any such economies of scale.
The Board further concluded that any potential economies of scale are being shared between fund shareholders and Fidelity in an appropriate manner.
Annual Report
Board Approval of Investment Advisory Contracts and
Management Fees - continued
Additional Information Requested by the Board. In order to develop fully the factual basis for consideration of the Fidelity funds' Advisory Contracts, the Board requested and received additional information on several topics, including (i) fund performance trends and actions to be taken by FMR to improve certain funds' overall performance; (ii) Fidelity's portfolio manager compensation structure, including its effects on fund profitability and the extent to which portfolio manager compensation is linked to fund performance; (iii) Fidelity's fee structures; (iv) the funds' sub-advisory arrangements; and (v) accounts managed by Fidelity other than the Fidelity funds.
Based on its evaluation of all of the conclusions noted above, and after considering all material factors, the Board ultimately concluded that the advisory fee structures are fair and reasonable, and that the fund's Advisory Contracts should be renewed.
Annual Report
Annual Report
Annual Report
Annual Report
Annual Report
Annual Report
Annual Report
Investment Adviser
Fidelity Management & Research Company
Boston, MA
Investment Sub-Advisers
FMR Co., Inc.
Fidelity Management & Research
(U.K.) Inc.
Fidelity Research & Analysis
Company
Fidelity International
Investment Advisors
Fidelity Investments Japan Limited
Fidelity International Investment Advisors (U.K.) Limited
General Distributor
Fidelity Distributors Corporation
Boston, MA
Transfer and Service Agents
Fidelity Investments Institutional Operations Company, Inc.
Boston, MA
Fidelity Service Company, Inc.
Boston, MA
Custodian
Mellon Bank
Pittsburgh, PA
AISC-UANN-1207
1.793568.104
(Fidelity Investment logo)(registered trademark)
Corporate Headquarters
82 Devonshire St., Boston, MA 02109
www.fidelity.com
(Fidelity Investment logo)(registered trademark)
Fidelity Advisor
International Small Cap
Fund - Institutional Class
Annual Report
October 31, 2007
Institutional Class is a class of
Fidelity® International Small Cap Fund
(2_fidelity_logos) (Registered_Trademark)
Contents
Chairman's Message | <Click Here> | Ned Johnson's message to shareholders. |
Performance | <Click Here> | How the fund has done over time. |
Management's Discussion | <Click Here> | The managers' review of fund performance, strategy and outlook. |
Shareholder Expense Example | <Click Here> | An example of shareholder expenses. |
Investment Changes | <Click Here> | A summary of major shifts in the fund's investments over the past six months. |
Investments | <Click Here> | A complete list of the fund's investments with their market values. |
Financial Statements | <Click Here> | Statements of assets and liabilities, operations, and changes in net assets,
as well as financial highlights. |
Notes | <Click Here> | Notes to the financial statements. |
Report of Independent Registered Public Accounting Firm | <Click Here> | |
Trustees and Officers | <Click Here> | |
Distributions | <Click Here> | |
Board Approval of Investment Advisory Contracts and Management Fees | <Click Here> | |
To view a fund's proxy voting guidelines and proxy voting record for the 12-month period ended June 30, visit http://www.fidelity.com (search for "proxy voting guidelines") or visit the Securities and Exchange Commission's (SEC) web site at http://www.sec.gov. You may also call 1-877-208-0098 to request a free copy of the proxy voting guidelines.
Standard & Poor's, S&P and S&P 500 are registered service marks of The McGraw-Hill Companies, Inc. and have been licensed for use by Fidelity Distributors Corporation.
Other third party marks appearing herein are the property of their respective owners.
All other marks appearing herein are registered or unregistered trademarks or service marks of FMR LLC or an affiliated company.
Annual Report
This report and the financial statements contained herein are submitted for the general information of the shareholders of the fund. This report is not authorized for distribution to prospective investors in the fund unless preceded or accompanied by an effective prospectus.
A fund files its complete schedule of portfolio holdings with the SEC for the first and third quarters of each fiscal year on Form N-Q. Forms N-Q are available on the SEC's web site at http://www.sec.gov. A fund's Forms N-Q may be reviewed and copied at the SEC's Public Reference Room in Washington, DC. Information regarding the operation of the SEC's Public Reference Room may be obtained by calling 1-800-SEC-0330. For a complete list of a fund's portfolio holdings, view the most recent holdings listing, semiannual report, or annual report on Fidelity's web site at http://www.fidelity.com or http://www.advisor.fidelity.com, as applicable.
NOT FDIC INSURED · MAY LOSE VALUE · NO BANK GUARANTEE
Neither the fund nor Fidelity Distributors Corporation is a bank.
Annual Report
Chairman's Message
(photo_of_Edward_C_Johnson_3d)
Dear Shareholder:
Many stock and bond markets around the world have been unsettled of late; however, volatility can often lead to opportunity for patient investors. Financial markets are always unpredictable, but there are a number of time-tested principles that can put the historical odds in your favor.
One of the basic tenets is to invest for the long term. Over time, riding out the markets' inevitable ups and downs has proven much more effective than selling into panic or chasing the hottest trend. Even missing only a few of the markets' best days can significantly diminish investor returns. Patience also affords the benefits of compounding - of earning interest on additional income or reinvested dividends and capital gains. There are tax advantages and cost benefits to consider as well. The more you sell, the more taxes you pay, and the more you trade, the higher the costs. While staying the course doesn't eliminate risk, it can considerably lessen the effect of short-term declines.
You can further manage your investing risk through diversification. And today, more than ever, geographic diversification should be taken into account. Studies indicate that asset allocation is the single most important determinant of a portfolio's long-term success. The right mix of stocks, bonds and cash - aligned to your particular risk tolerance and investment objective - is very important. Age-appropriate rebalancing is also an essential aspect of asset allocation. For younger investors, an emphasis on equities - which historically have been the best-performing asset class over time - is encouraged. As investors near their specific goal, such as retirement or sending a child to college, consideration may be given to replacing volatile assets (e.g. common stocks) with more-stable fixed investments (bonds or savings plans).
A third investment principle - investing regularly - can help lower the average cost of your purchases. Investing a certain amount of money each month or quarter helps ensure you won't pay for all your shares at market highs. This strategy - known as dollar cost averaging - also reduces unconstructive "emotion" from investing, helping shareholders avoid selling weak performers just prior to an upswing, or chasing a hot performer just before a correction.
We invite you to contact us via the Internet, through our Investor Centers or over the phone. It is our privilege to provide you the information you need to make the investments that are right for you.
Sincerely,
/s/Edward C. Johnson 3d
Edward C. Johnson 3d
Annual Report
Fidelity Advisor International Small Cap Fund - Institutional Class
Performance: The Bottom Line
Average annual total return reflects the change in the value of an investment, assuming reinvestment of the class' dividend income and capital gains (the profits earned upon the sale of securities that have grown in value) and assuming a constant rate of performance each year. The $10,000 table and the fund's returns do not reflect the deduction of taxes that a shareholder would pay on fund distributions or the redemption of fund shares. During periods of reimbursement by Fidelity, a fund's total return will be greater than it would be had the reimbursement not occurred. How a fund did yesterday is no guarantee of how it will do tomorrow.
Average Annual Total Returns
Periods ended October 31, 2007 | Past 1
year | Past 5
years | Life of
FundA |
Institutional Class B | 33.84% | 36.04% | 34.71% |
A From September 18, 2002.
B The initial offering of Institutional Class shares took place on May 27, 2003. Returns prior to May 27, 2003 are those of International Small Cap, the original class of the fund.
$10,000 Over Life of Fund
Let's say hypothetically that $10,000 was invested in Fidelity Advisor International Small Cap Fund - Institutional Class, a class of the fund, on September 18, 2002, when the fund started. The chart shows how the value of your investment would have changed, and also shows how the MSCI® EAFE® Small Cap Index performed over the same period.
Annual Report
Management's Discussion of Fund Performance
Comments from Ben Paton, Tokuya Sano and Wilson Wong, Co-Portfolio Managers of Fidelity Advisor International Small Cap Fund
Foreign stocks, with a large assist from a weak U.S. dollar, generally had higher returns for U.S. investors than domestic equities during the year ending October 31, 2007. The backdrop for global stocks was solid, with robust economic growth and relatively high corporate profitability worldwide. Developed international equity markets, as measured by the Morgan Stanley Capital InternationalSM Europe, Australasia, and Far East (MSCI® EAFE®) Index - a proxy for established markets outside the United States and Canada - rose 25.09%. In comparison, the Standard & Poor's 500SM Index, a gauge of U.S. stocks, was up 14.56%. Among countries making up at least 1% of the EAFE benchmark, Finland had the best showing, soaring nearly 69%, while Hong Kong gained roughly 66%. The United Kingdom and Japan, the two largest components of the index, both underperformed. Fallout from the credit crunch and concerns about export growth tempered UK stocks, while Japan struggled with a slowdown in consumer spending and sluggish domestic growth. Emerging markets were the period's big winners, advancing 68.33% as measured by the MSCI Emerging Markets index.
During the past year, the fund's Institutional Class shares returned 33.84%, versus 22.17% for the MSCI EAFE Small Cap index. Stock selection in materials, industrials, energy and consumer staples aided performance, as did overweighting utilities. Geographically, our picks in Australia, Canada, China and Norway helped. Both the Asia Pacific ex Japan and Europe/Africa/Middle East subportfolios handily beat their respective benchmarks; the Japanese subportfolio had roughly in-line results. South Africa-based, Australia-listed Sylvania Resources, which reprocesses chrome tailings, contributed, along with Stepstone, a Norwegian online employment company; Cosco Corporation, a Singapore-listed Chinese shipbuilder; Bradken, Australia's leading supplier of consumable mining and rail industry products; and Japan's Hitachi Construction Machinery and ferro-alloy producer Nippon Denko. Conversely, stock picking in information technology and consumer discretionary detracted. Geographically, our choices in Italy and Japan hurt. The fund's biggest detractor was Banca Italease. Japanese stocks Hikari Tsushin and NOK - the latter of which we sold - hurt as well, along with an index component we didn't own, Orient Resources Group, a Hong Kong-based real estate developer incorporated in Bermuda. Most stocks we've mentioned were out-of-index holdings.
The views expressed above reflect those of the portfolio manager(s) only through the end of the period as stated on the cover of this report and do not necessarily represent the views of Fidelity or any other person in the Fidelity organization. Any such views are subject to change at any time based upon market or other conditions and Fidelity disclaims any responsibility to update such views. These views may not be relied on as investment advice and, because investment decisions for a Fidelity fund are based on numerous factors, may not be relied on as an indication of trading intent on behalf of any Fidelity fund.
Annual Report
Shareholder Expense Example
As a shareholder of the Fund, you incur two types of costs: (1) transaction costs, including sales charges (loads) on purchase payments or redemption proceeds, redemption fees, and (2) ongoing costs, including management fees, distribution and/or service (12b-1) fees and other Fund expenses. This Example is intended to help you understand your ongoing costs (in dollars) of investing in the Fund and to compare these costs with the ongoing costs of investing in other mutual funds.
The Example is based on an investment of $1,000 invested at the beginning of the period and held for the entire period (May 1, 2007 to October 31, 2007).
Actual Expenses
The first line of the accompanying table for each class of the Fund provides information about actual account values and actual expenses. You may use the information in this line, together with the amount you invested, to estimate the expenses that you paid over the period. Simply divide your account value by $1,000.00 (for example, an $8,600 account value divided by $1,000.00 = 8.6), then multiply the result by the number in the first line for a class of the Fund under the heading entitled "Expenses Paid During Period" to estimate the expenses you paid on your account during this period. A small balance maintenance fee of $12.00 that is charged once a year may apply for certain accounts with a value of less than $2,000. This fee is not included in the table below. If it was, the estimate of expenses you paid during the period would be higher, and your ending account value lower, by this amount. In addition, the Fund, as a shareholder in the underlying Fidelity Central Funds, will indirectly bear its pro rata share of the fees and expenses incurred by the underlying Fidelity Central Funds. These fees and expenses are not included in the Fund's annualized expense ratio used to calculate the expense estimate in the table below.
Hypothetical Example for Comparison Purposes
The second line of the accompanying table for each class of the Fund provides information about hypothetical account values and hypothetical expenses based on a Class' actual expense ratio and an assumed rate of return of 5% per year before expenses, which is not the Class' actual return. The hypothetical account values and expenses may not be used to estimate the actual ending account balance or expenses you paid for the period. You may use this information to compare the ongoing costs of investing in the Fund and other funds. To do so, compare this 5% hypothetical example with the 5% hypothetical examples that appear in the shareholder reports of the other funds. A small balance maintenance fee of $12.00 that is charged once a year may apply for certain accounts with a value of less than $2,000. This fee is not included in the table below. If it was, the estimate of expenses you paid during the period would be higher, and your ending account value lower, by this amount. In addition, the Fund, as a shareholder in the underlying Fidelity Central Funds, will indirectly bear its pro rata share of the fees and expenses incurred by the underlying Fidelity Central Funds. These fees and expenses are not included in the Fund's annualized expense ratio used to calculate the expense estimate in the table below.
Annual Report
Shareholder Expense Example - continued
Please note that the expenses shown in the table are meant to highlight your ongoing costs only and do not reflect any transaction costs. Therefore, the second line of the table is useful in comparing ongoing costs only, and will not help you determine the relative total costs of owning different funds. In addition, if these transactional costs were included, your costs would have been higher.
| Beginning
Account Value
May 1, 2007 | Ending
Account Value
October 31, 2007 | Expenses Paid
During Period*
May 1, 2007 to
October 31, 2007 |
Class A | | | |
Actual | $ 1,000.00 | $ 1,135.30 | $ 8.88 |
HypotheticalA | $ 1,000.00 | $ 1,016.89 | $ 8.39 |
Class T | | | |
Actual | $ 1,000.00 | $ 1,133.20 | $ 10.22 |
HypotheticalA | $ 1,000.00 | $ 1,015.63 | $ 9.65 |
Class B | | | |
Actual | $ 1,000.00 | $ 1,130.50 | $ 12.89 |
HypotheticalA | $ 1,000.00 | $ 1,013.11 | $ 12.18 |
Class C | | | |
Actual | $ 1,000.00 | $ 1,130.70 | $ 12.89 |
HypotheticalA | $ 1,000.00 | $ 1,013.11 | $ 12.18 |
International Small Cap | | | |
Actual | $ 1,000.00 | $ 1,136.70 | $ 7.22 |
HypotheticalA | $ 1,000.00 | $ 1,018.45 | $ 6.82 |
Institutional Class | | | |
Actual | $ 1,000.00 | $ 1,137.00 | $ 7.22 |
HypotheticalA | $ 1,000.00 | $ 1,018.45 | $ 6.82 |
A 5% return per year before expenses
* Expenses are equal to each Class' annualized expense ratio (shown in the table below); multiplied by the average account value over the period, multiplied by 184/365 (to reflect the one-half year period).
| Annualized
Expense Ratio |
Class A | 1.65% |
Class T | 1.90% |
Class B | 2.40% |
Class C | 2.40% |
International Small Cap | 1.34% |
Institutional Class | 1.34% |
Annual Report
Investment Changes
Geographic Diversification (% of fund's net assets) |
As of October 31, 2007 |
| Japan 27.2% | |
| United Kingdom 15.0% | |
| Australia 13.1% | |
| United States of America 6.2% | |
| Canada 4.5% | |
| France 3.9% | |
| Germany 2.9% | |
| Italy 2.9% | |
| Norway 2.2% | |
| Other 22.1% | |

Percentages are adjusted for the effect of futures contracts, if applicable. |
|
As of April 30, 2007 |
| Japan 26.8% | |
| United Kingdom 16.8% | |
| Australia 13.2% | |
| Italy 5.3% | |
| United States of America 5.3% | |
| Germany 3.4% | |
| France 3.2% | |
| Canada 3.2% | |
| South Africa 2.8% | |
| Other 20.0% | |

Percentages are adjusted for the effect of futures contracts, if applicable. |
Asset Allocation |
| % of fund's
net assets | % of fund's net assets
6 months ago |
Stocks | 95.8 | 96.6 |
Bonds | 0.3 | 0.2 |
Short-Term Investments and Net Other Assets | 3.9 | 3.2 |
Top Ten Stocks as of October 31, 2007 |
| % of fund's
net assets | % of fund's net assets
6 months ago |
Stepstone ASA (Norway, Commercial
Services & Supplies) | 1.6 | 1.1 |
Phorm, Inc. (United States of America, Media) | 1.6 | 0.0 |
Sylvania Resources Ltd. (Australia,
Metals & Mining) | 1.4 | 0.6 |
Max Petroleum PLC (United Kingdom,
Oil, Gas & Consumable Fuels) | 1.3 | 2.0 |
Oilexco, Inc. (Canada, Oil, Gas & Consumable Fuels) | 1.3 | 0.6 |
Sarantis SA (Reg.) (Greece, Personal Products) | 1.2 | 0.7 |
Nissin Kogyo Co. Ltd. (Japan, Auto Components) | 1.1 | 1.1 |
E.ON AG (Germany, Electric Utilities) | 1.0 | 0.8 |
Stanley Electric Co. Ltd. (Japan, Auto Components) | 1.0 | 0.4 |
Nippon Seiki Co. Ltd. (Japan, Auto Components) | 1.0 | 0.8 |
| 12.5 | |
Market Sectors as of October 31, 2007 |
| % of fund's
net assets | % of fund's net assets
6 months ago |
Industrials | 22.5 | 20.0 |
Materials | 18.0 | 15.0 |
Consumer Discretionary | 15.9 | 17.1 |
Information Technology | 8.9 | 8.4 |
Energy | 8.6 | 9.0 |
Financials | 8.7 | 13.4 |
Health Care | 4.6 | 4.3 |
Utilities | 4.4 | 5.2 |
Consumer Staples | 4.0 | 3.7 |
Telecommunication Services | 0.5 | 0.7 |
Annual Report
Investments October 31, 2007
Showing Percentage of Net Assets
Common Stocks - 95.8% |
| Shares | | Value
(000s) |
Australia - 13.1% |
Allied Gold Ltd. (a) | 15,017,696 | | $ 12,802 |
Allied Gold Ltd. (UK) (a) | 461,700 | | 410 |
Ausenco Ltd. | 716,966 | | 10,123 |
Australian Wealth Management Ltd. (e) | 1,555,487 | | 4,023 |
Bradken Ltd. | 724,595 | | 10,008 |
Capital-XX Ltd. (a) | 2,262,572 | | 3,105 |
Centamin Egypt Ltd. (a) | 3,589,755 | | 4,870 |
Centennial Coal Co. Ltd. (e) | 592,395 | | 2,389 |
Crane Group Ltd. | 92,339 | | 1,455 |
David Jones Ltd. | 432,290 | | 2,002 |
Downer EDI Ltd. | 256,593 | | 1,600 |
DUET Group | 623,838 | | 2,044 |
Dwyka Resources Ltd. (a) | 5,235,220 | | 4,680 |
European Gas Ltd. (a) | 2,137,690 | | 1,750 |
Gunns Ltd. | 502,803 | | 1,772 |
Hastie Group Ltd. | 749,674 | | 3,232 |
IBT Education Ltd. | 490,152 | | 1,188 |
Incitec Pivot Ltd. (e) | 103,561 | | 8,601 |
International Ferro Metals (a) | 1,666,176 | | 4,070 |
Iress Market Technology Ltd. | 194,246 | | 1,502 |
JB Hi-Fi Ltd. | 709,791 | | 10,931 |
Jubilee Mines NL | 264,180 | | 5,887 |
Kingsgate Consolidated NL | 242,615 | | 1,217 |
MacArthur Coal Ltd. (e) | 482,429 | | 4,106 |
Macmahon Holdings Ltd. | 2,833,056 | | 4,585 |
Meo Australia Ltd. (a) | 9,450,100 | | 10,724 |
Monto Minerals Ltd. (a) | 8,325,252 | | 1,688 |
Monto Minerals Ltd. warrants 5/25/09 (a) | 1,485,934 | | 39 |
Mortgage Choice Ltd. | 2,022,538 | | 4,658 |
Mount Gibson Iron Ltd. (a) | 5,473,584 | | 15,475 |
Nomad Building Solutions Ltd. | 755,846 | | 2,313 |
Oakton Ltd. | 122,815 | | 682 |
Perilya Mines Ltd. | 554,900 | | 2,052 |
Phosphagenics Ltd. (a) | 9,040,000 | | 2,123 |
Reverse Corp. Ltd. | 446,400 | | 1,934 |
Roc Oil Co. Ltd. (United Kingdom) (a) | 2,864,489 | | 8,754 |
Seek Ltd. | 1,321,589 | | 11,566 |
Silex Systems Ltd. | 200,000 | | 1,457 |
Sims Group Ltd. | 28,822 | | 761 |
SMS Management & Technology Ltd. | 134,800 | | 907 |
Sylvania Resources Ltd. (a)(f) | 9,009,881 | | 25,111 |
Sylvania Resources Ltd. (United Kingdom) (a)(f) | 4,910,360 | | 13,425 |
Common Stocks - continued |
| Shares | | Value
(000s) |
Australia - continued |
Tanami Gold NL (a) | 26,452,484 | | $ 2,887 |
Tassal Group Ltd. | 1,148,600 | | 4,074 |
United Group Ltd. | 353,321 | | 7,072 |
WorleyParsons Ltd. | 102,033 | | 4,612 |
Wotif.com Holdings Ltd. | 636,700 | | 3,582 |
TOTAL AUSTRALIA | | 234,248 |
Bermuda - 1.8% |
African Minerals Ltd. (a) | 575,020 | | 1,979 |
Oriental Watch Holdings Ltd. | 4,082,000 | | 1,589 |
Pacific Basin Shipping Ltd. | 4,044,000 | | 9,060 |
Peace Mark Holdings Ltd. | 814,000 | | 1,341 |
Petra Diamonds Ltd. (a) | 1,212,621 | | 3,656 |
Ports Design Ltd. | 784,000 | | 2,960 |
Tanzanite One Ltd. (f) | 5,808,701 | | 8,937 |
Trefoil Ltd. (a) | 385,100 | | 2,225 |
Xceldiam Ltd. warrants 11/16/07 (a) | 1,659,127 | | 52 |
TOTAL BERMUDA | | 31,799 |
British Virgin Islands - 0.3% |
Albidon Ltd. unit (a) | 1,469,000 | | 4,169 |
Kalahari Energy (g) | 1,451,000 | | 1,814 |
TOTAL BRITISH VIRGIN ISLANDS | | 5,983 |
Canada - 4.2% |
AirSea Lines (a)(g) | 1,862,300 | | 1,349 |
AirSea Lines warrants 8/4/11 (a)(g) | 1,862,300 | | 0 |
Altius Minerals Corp. (a) | 257,006 | | 7,485 |
Antrim Energy, Inc. (a) | 245,700 | | 1,652 |
Antrim Energy, Inc. (United Kingdom) (a) | 800,000 | | 5,430 |
Bankers Petroleum Ltd. (a) | 3,767,000 | | 2,434 |
Equinox Minerals Ltd. (a) | 1,206,050 | | 6,604 |
Equinox Minerals Ltd. unit (a) | 588,859 | | 3,208 |
MagIndustries Corp. (a) | 3,635,960 | | 6,739 |
Oilexco, Inc. (a) | 1,237,525 | | 22,596 |
Rock Well Petroleum, Inc. (g) | 770,400 | | 3,461 |
Sino-Forest Corp. (a) | 106,000 | | 2,820 |
Starfield Resources, Inc. (a) | 1,313,025 | | 2,086 |
Starfield Resources, Inc. warrants 1/20/08 (a)(g) | 1,678,100 | | 1,114 |
Stealth Ventures Ltd. (a) | 593,200 | | 452 |
Stealth Ventures Ltd. warrants 3/12/08 (a)(g) | 483,250 | | 1 |
Visual Defence, Inc. (a)(f) | 4,664,100 | | 1,503 |
Common Stocks - continued |
| Shares | | Value
(000s) |
Canada - continued |
Western Canadian Coal Corp. (a) | 1,554,418 | | $ 4,116 |
Western Canadian Coal Corp. (United Kingdom) (a) | 548,286 | | 1,453 |
TOTAL CANADA | | 74,503 |
Cayman Islands - 0.9% |
Ctrip.com International Ltd. sponsored ADR | 31,000 | | 1,747 |
Embry Holdings Ltd. | 1,081,000 | | 845 |
Hidili Industry International Development Ltd. | 808,000 | | 1,205 |
International Consolidated Minerals, Inc. (a) | 852,927 | | 6,397 |
Ju Teng International Holdings Ltd. (a) | 656,000 | | 249 |
Lee & Man Paper Manufacturing Ltd. | 1,002,000 | | 4,008 |
TCC International Holdings Ltd. (a) | 894,000 | | 1,344 |
TOTAL CAYMAN ISLANDS | | 15,795 |
China - 0.8% |
Anhui Conch Cement Co. Ltd. (H Shares) | 78,000 | | 779 |
Baidu.com, Inc. sponsored ADR (a) | 4,600 | | 1,759 |
China Oilfield Services Ltd. (H Shares) | 1,892,000 | | 4,633 |
China Resources Land Ltd. | 448,000 | | 1,133 |
Dongfang Electrical Machinery Co. Ltd. (H Shares) | 84,000 | | 751 |
Sina Corp. (a) | 63,000 | | 3,612 |
Xinjiang Xinxin Mining Industry Co. Ltd. Class H | 740,000 | | 1,369 |
Yantai Changyu Pioneer Wine Co. (B Shares) | 118,810 | | 885 |
TOTAL CHINA | | 14,921 |
Cyprus - 0.1% |
Buried Hill Energy (Cyprus) PCL (g) | 1,947,000 | | 2,142 |
Czech Republic - 0.1% |
Ceske Energeticke Zavody AS | 35,860 | | 2,592 |
Denmark - 0.4% |
DSV de Sammensluttede Vognmaend AS | 259,300 | | 6,855 |
Finland - 1.6% |
Inion OY (a) | 3,590,300 | | 2,146 |
Nokian Tyres Ltd. | 430,910 | | 16,232 |
Rakentajain Konevuokraamo Oyj (B Shares) | 222,030 | | 8,299 |
Ramirent Oyj | 74,140 | | 1,646 |
TOTAL FINLAND | | 28,323 |
Common Stocks - continued |
| Shares | | Value
(000s) |
France - 3.9% |
Carbone Lorraine | 27,400 | | $ 2,452 |
Electricite de France | 90,900 | | 10,903 |
Geodis SA | 42,180 | | 9,105 |
Guerbet SA | 8,400 | | 1,901 |
Icade SA | 123,018 | | 9,079 |
Laurent-Perrier Group | 31,960 | | 5,963 |
Norbert Dentressangle SA | 15,064 | | 1,811 |
Seche Environment SA | 11,560 | | 2,122 |
Societe Internationale de Plantations d'Heveas SA | 2,580 | | 2,063 |
Veolia Environnement | 161,180 | | 14,396 |
Vilmorin & Cie | 67,700 | | 9,840 |
TOTAL FRANCE | | 69,635 |
Germany - 2.9% |
E.ON AG | 93,000 | | 18,163 |
Fresenius Medical Care AG | 130,010 | | 6,868 |
Interhyp AG | 35,270 | | 3,033 |
Kontron AG | 154,620 | | 3,918 |
MLP AG | 89,150 | | 1,182 |
Praktiker Bau- und Heimwerkermaerkte Holding AG | 63,860 | | 2,309 |
SGL Carbon AG (a) | 272,200 | | 15,881 |
TOTAL GERMANY | | 51,354 |
Greece - 1.6% |
Fourlis Holdings SA | 110,000 | | 4,430 |
Hellenic Technodomiki Tev SA | 223,750 | | 3,397 |
Sarantis SA (Reg.) | 1,076,638 | | 21,463 |
TOTAL GREECE | | 29,290 |
Hong Kong - 1.3% |
China Everbright Ltd. (a) | 1,328,000 | | 5,973 |
China Overseas Land & Investment Ltd. | 616,000 | | 1,474 |
Esprit Holdings Ltd. | 246,000 | | 4,108 |
Hang Lung Properties Ltd. | 499,000 | | 2,401 |
Li & Fung Ltd. | 924,000 | | 4,385 |
Midland Holdings Ltd. | 3,114,000 | | 3,857 |
PYI Corp. Ltd. | 600,000 | | 274 |
TOTAL HONG KONG | | 22,472 |
India - 1.2% |
Ess Dee Aluminium Ltd. | 49,516 | | 894 |
Gujarat NRE Coke Ltd. | 507,690 | | 1,499 |
Common Stocks - continued |
| Shares | | Value
(000s) |
India - continued |
INFO Edge India Ltd. | 109,253 | | $ 3,388 |
Jindal Steel & Power Ltd. | 22,836 | | 6,980 |
JSW Steel Ltd. | 156,958 | | 3,863 |
Sesa Goa Ltd. | 48,209 | | 4,618 |
TOTAL INDIA | | 21,242 |
Indonesia - 0.1% |
PT Bakrie Sumatera Plantations Tbk warrants 9/10/10 (a) | 31 | | 0 |
PT International Nickel Indonesia Tbk | 51,500 | | 519 |
PT Tambang Batubbara Bukit Asam Tbk | 1,732,500 | | 1,761 |
TOTAL INDONESIA | | 2,280 |
Ireland - 0.4% |
Adwalker PLC (a) | 9,125,000 | | 379 |
Kenmare Resources PLC (a) | 2,640,000 | | 3,389 |
Kenmare Resources PLC warrants 7/23/09 (a) | 1,712,500 | | 1,513 |
Petroceltic International PLC (a) | 13,644,934 | | 2,406 |
Vimio PLC (a) | 867,300 | | 198 |
TOTAL IRELAND | | 7,885 |
Israel - 0.6% |
Israel Chemicals Ltd. | 611,900 | | 6,734 |
RADWARE Ltd. (a) | 227,160 | | 3,844 |
TOTAL ISRAEL | | 10,578 |
Italy - 2.9% |
Ansaldo STS SpA (a) | 214,670 | | 3,121 |
ASM SpA | 925,100 | | 6,483 |
Banca Italease SpA (e) | 530,760 | | 11,163 |
Enel SpA | 543,800 | | 6,513 |
Hera SpA | 1,510,160 | | 6,789 |
Seldovia Native Association, Inc. (SNAI) (a)(e) | 1,541,160 | | 15,641 |
Teleunit SpA (a)(f) | 12,719,158 | | 1,025 |
TOTAL ITALY | | 50,735 |
Japan - 27.2% |
ABC-Mart, Inc. | 233,100 | | 4,801 |
Access Co. Ltd. | 464 | | 594 |
Adeka Corp. | 69,000 | | 692 |
Ahresty Corp. | 34,400 | | 695 |
Common Stocks - continued |
| Shares | | Value
(000s) |
Japan - continued |
Ai Holdings Corp. | 79,000 | | $ 475 |
Airport Facilities Co. Ltd. | 93,800 | | 616 |
AOC Holdings, Inc. | 79,400 | | 1,219 |
AOI Electronics Co. Ltd. | 64,300 | | 837 |
Apamanshop Holdings Co. Ltd. | 15,040 | | 5,865 |
ARDEPRO CO., Ltd. (e) | 43,989 | | 14,791 |
Atlus Co. Ltd. | 88,000 | | 455 |
Atrium Co. Ltd. | 64,400 | | 1,796 |
Avex Group Holdings, Inc. | 200,000 | | 2,916 |
Bit-isle, Inc. (a)(e) | 988 | | 744 |
Bookoff Corp. (e) | 88,300 | | 861 |
C. Uyemura & Co. Ltd. (a) | 46,000 | | 2,798 |
Chiba Bank Ltd. | 177,000 | | 1,421 |
Chugoku Marine Paints Ltd. | 134,000 | | 1,821 |
Citizen Holdings Co. Ltd. | 142,800 | | 1,539 |
CMIC Co. Ltd. | 4,860 | | 1,161 |
Create SD Co. Ltd. | 42,400 | | 908 |
cyber communications, Inc. | 1,365 | | 1,072 |
Dai-ichi Seiko Co. Ltd. | 55,100 | | 882 |
Daicel Chemical Industries Ltd. | 207,000 | | 1,525 |
Daido Steel Co. Ltd. | 269,000 | | 1,836 |
Daikin Industries Ltd. | 99,500 | | 5,013 |
Daikokutenbussan Co. Ltd. | 31,300 | | 236 |
Daiseki Co. Ltd. (e) | 76,300 | | 2,582 |
Daito Gyorui Co. Ltd. | 381,000 | | 673 |
Daiwa Securities Group, Inc. | 132,000 | | 1,272 |
Daiwabo Information System Ltd. (e) | 162,500 | | 2,160 |
Daiwasystem Co. Ltd. | 39,800 | | 1,117 |
DeNA Co. Ltd. | 451 | | 2,826 |
Denyo Co. Ltd. (e) | 72,900 | | 758 |
Endo Lighting Corp. | 2,300 | | 12 |
EPS Co. Ltd. (e) | 1,239 | | 4,800 |
F&M Co. Ltd. | 1,998 | | 562 |
FCM Co. Ltd. | 30,800 | | 1,385 |
Fuji Heavy Industries Ltd. | 418,000 | | 2,173 |
Fujitsu Component Ltd. (a) | 478 | | 622 |
Furuno Electric Co. Ltd. | 100,400 | | 1,519 |
GMO Hosting & Security, Inc. | 451 | | 515 |
Gmo Internet, Inc. (e) | 400,900 | | 1,530 |
Common Stocks - continued |
| Shares | | Value
(000s) |
Japan - continued |
H-One Co. Ltd. | 21,800 | | $ 251 |
Harakosan Co. Ltd. (e) | 5,676 | | 13,457 |
Harmonic Drive Systems, Inc. | 587 | | 2,210 |
Hikari Tsushin, Inc. (e) | 258,000 | | 7,880 |
Hisaka Works Ltd. (e) | 153,000 | | 3,422 |
Hitachi Construction Machinery Co. Ltd. | 100,200 | | 4,111 |
Hitachi Metals Ltd. | 322,000 | | 4,178 |
Hokuto Corp. | 171,200 | | 2,671 |
Hosiden Corp. (e) | 320,300 | | 5,682 |
Ibiden Co. Ltd. | 62,200 | | 5,274 |
Ichirokudo Co. Ltd. (a) | 1,014 | | 369 |
Ichiyoshi Securities Co. Ltd. | 141,400 | | 1,547 |
IDU Co. (e) | 2,213 | | 3,427 |
Index Holdings (e) | 3,190 | | 1,334 |
Inpex Holdings, Inc. | 890 | | 9,597 |
Intelligence Ltd. (e) | 2,492 | | 5,720 |
Isuzu Motors Ltd. | 359,000 | | 1,790 |
Itochu Corp. | 557,000 | | 7,040 |
Japan Airport Terminal Co. Ltd. | 12,400 | | 243 |
Japan Aviation Electronics Industry Ltd. | 250,000 | | 3,858 |
Japan Steel Works Ltd. | 157,000 | | 2,569 |
Japan Vilene Co. Ltd. (e) | 194,000 | | 1,176 |
Jastec Co. Ltd. | 450,200 | | 4,459 |
Juki Corp. | 500,000 | | 4,269 |
Juroku Bank Ltd. | 149,000 | | 902 |
Kitagawa Seiki Co. Ltd. | 84,000 | | 447 |
Komori Corp. | 154,000 | | 4,074 |
Konica Minolta Holdings, Inc. | 112,500 | | 1,970 |
Kura Corp. Ltd. | 5,016 | | 10,922 |
Kurita Water Industries Ltd. | 62,000 | | 2,072 |
LAC Holdings, Inc. (a) | 154,700 | | 453 |
Lawson, Inc. | 66,400 | | 2,296 |
MCJ Co. Ltd. (a)(e) | 3,338 | | 1,747 |
Meiko Electronics Co. Ltd. | 126,600 | | 4,407 |
Message Co. Ltd. | 584 | | 1,077 |
Micronics Japan Co. Ltd. | 91,500 | | 2,503 |
Mitsuba Corp. | 79,000 | | 508 |
Mitsui O.S.K. Lines Ltd. | 333,000 | | 5,505 |
Mitsumi Electric Co. Ltd. | 67,100 | | 3,093 |
Miura Co. Ltd. | 78,500 | | 2,459 |
Common Stocks - continued |
| Shares | | Value
(000s) |
Japan - continued |
Miyano Machinery, Inc. | 429,000 | | $ 1,197 |
Money Partners Co. Ltd. | 2,705 | | 10,624 |
Mori Seiki Co. Ltd. | 102,000 | | 2,591 |
NIC Corp. | 65,400 | | 508 |
Nidec Corp. | 22,400 | | 1,683 |
Nihon Dempa Kogyo Co. Ltd. (e) | 315,000 | | 15,732 |
Nihon Kohden Corp. | 75,100 | | 1,431 |
Nihon Trim Co. Ltd. (e) | 199,250 | | 6,365 |
Nihonwasou Holdings, Inc. | 782 | | 274 |
Nikon Corp. | 348,000 | | 11,170 |
Nippon Carbon Co. Ltd. (e) | 264,000 | | 1,666 |
Nippon Chemi-con Corp. | 292,000 | | 2,317 |
Nippon Denko Co. Ltd. (e) | 622,000 | | 4,690 |
Nippon Oil Corp. | 256,000 | | 2,268 |
Nippon Seiki Co. Ltd. | 745,000 | | 17,343 |
Nissha Printing Co. Ltd. | 51,000 | | 1,470 |
Nissin Kogyo Co. Ltd. | 757,400 | | 19,795 |
NTN Corp. | 452,000 | | 4,298 |
Obara Corp. | 50 | | 1 |
Oiles Corp. (e) | 77,040 | | 1,666 |
Otsuka Corp. | 21,300 | | 2,042 |
Pigeon Corp. (e) | 87,700 | | 1,508 |
Produce Co. Ltd. (a)(e) | 1,432 | | 5,498 |
Properst Co. Ltd. (e) | 536 | | 1,003 |
Renown, Inc. (a) | 65,400 | | 500 |
Rinnai Corp. | 115,000 | | 3,581 |
Rohto Pharmaceutical Co. Ltd. | 375,000 | | 4,463 |
Round One Corp. (e) | 1,306 | | 3,102 |
Ryobi Ltd. | 226,000 | | 1,523 |
Sammy NetWorks Co. Ltd. | 1,062 | | 1,802 |
Sansha Electric Manufacturing Co. Ltd. | 56,000 | | 546 |
Sanyo Denki Co. Ltd. | 271,000 | | 1,548 |
Sato Corp. (e) | 200,300 | | 3,885 |
Sawada Holdings Co. Ltd. (a) | 91,000 | | 646 |
SBI E*TRADE Securities Co. Ltd. (e) | 790 | | 848 |
Sec Carbon Ltd. | 132,000 | | 2,253 |
Seria Co. Ltd. | 482 | | 663 |
Shibaura Electronics Co. Ltd. (e) | 97,800 | | 2,461 |
Shimachu Co. Ltd. | 80,600 | | 2,321 |
Shin Nippon Biomedical Laboratories Ltd. (e) | 101,900 | | 1,557 |
Shin-Kobe Electric Machinery Co. Ltd. | 419,000 | | 1,957 |
Shinohara Systems of Construction Co. Ltd. (e) | 1,206 | | 1,250 |
Common Stocks - continued |
| Shares | | Value
(000s) |
Japan - continued |
Shizuki Electric Co., Inc. | 146,000 | | $ 546 |
Sojitz Corp. | 714,000 | | 3,278 |
SRI Sports Ltd. | 1,337 | | 1,642 |
Stanley Electric Co. Ltd. | 800,200 | | 17,800 |
Star Micronics Co. Ltd. | 16,200 | | 512 |
Starbucks Coffee Japan Ltd. (e) | 3,551 | | 1,697 |
Stella Chemifa Corp. (e) | 31,900 | | 902 |
Sumco Corp. | 26,200 | | 956 |
Sumitomo Corp. | 451,100 | | 7,862 |
Sumitomo Heavy Industries Ltd. | 216,000 | | 2,854 |
Sumitomo Metal Industries Ltd. | 434,000 | | 2,149 |
Sumitomo Trust & Banking Co. Ltd. | 160,000 | | 1,193 |
Sun Frontier Fudousan Co. Ltd. | 755 | | 1,731 |
Sunx Ltd. (e) | 150,200 | | 917 |
Suruga Corp. | 341,000 | | 7,959 |
Sysmex Corp. | 97,500 | | 3,995 |
T&D Holdings, Inc. | 18,300 | | 1,102 |
Taiho Kogyo Co. Ltd. | 88,100 | | 1,321 |
Taiyo Kagaku Co. Ltd. | 62,900 | | 402 |
Takara Holdings, Inc. (e) | 324,000 | | 1,905 |
Takeei Corp. (e) | 95,000 | | 3,591 |
Takiron Co. Ltd. | 121,000 | | 331 |
Takisawa Machine Tool Co. Ltd. | 524,000 | | 1,005 |
Telewave, Inc. | 692 | | 597 |
TMS Entertainment Ltd. (e) | 152,000 | | 446 |
TOA Valve Holding, Inc. (e) | 352 | | 2,121 |
Toagosei Co. Ltd. | 354,000 | | 1,243 |
Tohcello Co. Ltd. | 149,500 | | 1,091 |
Toho Zinc Co. Ltd. | 272,000 | | 2,470 |
Tohoku Electric Power Co., Inc. | 46,300 | | 979 |
Tokai Carbon Co. Ltd. | 635,000 | | 7,965 |
Tokai Rubber Industries Ltd. | 124,300 | | 2,447 |
Tokyo Gas Co. Ltd. | 248,000 | | 1,106 |
Tokyo Seimitsu Co. Ltd. (e) | 165,100 | | 3,895 |
TonenGeneral Sekiyu KK | 122,000 | | 1,229 |
Topcon Corp. | 87,400 | | 1,277 |
Toray Industries, Inc. | 157,000 | | 1,212 |
Trancom Co. Ltd. | 7,300 | | 111 |
Tyo, Inc. (e) | 113,000 | | 242 |
Ube Industries Ltd. | 683,000 | | 2,453 |
Unicom Group Holdings, Inc. | 121,300 | | 921 |
VarioSecure Networks, Inc. (e) | 648 | | 756 |
Common Stocks - continued |
| Shares | | Value
(000s) |
Japan - continued |
Wacom Co. Ltd. (e) | 1,144 | | $ 2,830 |
Yachiyo Industry Co. Ltd. | 119,200 | | 1,531 |
Yamada Denki Co. Ltd. | 54,740 | | 5,645 |
Yonkyu Co. Ltd. | 135,500 | | 1,053 |
Yume No Machi Souzou Iinkai Co. Ltd. | 527 | | 501 |
TOTAL JAPAN | | 484,861 |
Korea (South) - 0.9% |
LG Household & Health Care Ltd. | 4,230 | | 943 |
MegaStudy Co. Ltd. | 3,746 | | 1,382 |
NHN Corp. (a) | 5,675 | | 1,825 |
Samsung Engineering Co. Ltd. | 27,560 | | 3,713 |
STX Engine Co. Ltd. | 9,514 | | 948 |
STX Pan Ocean Co. Ltd. | 928,000 | | 2,387 |
Sung Kwang Bend Co. Ltd. | 13,764 | | 564 |
Taewoong Co. Ltd. | 23,528 | | 3,363 |
TOTAL KOREA (SOUTH) | | 15,125 |
Luxembourg - 0.2% |
SES SA FDR (France) unit | 142,650 | | 3,522 |
Malaysia - 0.2% |
KNM Group Bhd | 1,756,600 | | 3,109 |
Malta - 0.3% |
Unibet Group plc unit | 178,456 | | 5,758 |
Netherlands - 0.3% |
Engel East Europe NV | 975,032 | | 1,622 |
Koninklijke Boskalis Westminster NV (Certificaten Van Aandelen) | 53,740 | | 3,261 |
TOTAL NETHERLANDS | | 4,883 |
Norway - 2.2% |
Aker Kvaerner ASA | 150,140 | | 5,232 |
Pertra AS (A Shares) | 175,642 | | 2,651 |
Schibsted ASA (B Shares) | 48,600 | | 2,762 |
Stepstone ASA (a) | 5,397,154 | | 28,454 |
TOTAL NORWAY | | 39,099 |
Papua New Guinea - 0.5% |
Lihir Gold Ltd. (a) | 2,053,833 | | 8,154 |
Philippines - 0.3% |
Alliance Global Group, Inc. (a) | 10,090,000 | | 1,255 |
Common Stocks - continued |
| Shares | | Value
(000s) |
Philippines - continued |
SM Prime Holdings, Inc. | 6,628,000 | | $ 1,832 |
Vista Land & Lifescapes, Inc. | 14,466,000 | | 1,832 |
TOTAL PHILIPPINES | | 4,919 |
Portugal - 0.2% |
Banif SGPS SA | 484,850 | | 3,604 |
Singapore - 1.6% |
Advent Air Ltd. (f) | 14,719,299 | | 4,437 |
Banyan Tree Holdings Ltd. | 2,051,000 | | 2,996 |
Cosco Corp. Singapore Ltd. | 1,577,000 | | 8,564 |
Keppel Corp. Ltd. | 136,000 | | 1,398 |
Parkway Holdings Ltd. | 1,648,300 | | 4,781 |
Raffles Medical Group Ltd. | 905,000 | | 963 |
Straits Asia Resources Ltd. | 636,000 | | 1,178 |
Yangzijiang Shipbuilding Holdings Ltd. | 2,262,000 | | 4,028 |
TOTAL SINGAPORE | | 28,345 |
South Africa - 1.8% |
African Rainbow Minerals Ltd. | 291,610 | | 6,730 |
Investec Ltd. | 491,707 | | 6,117 |
JD Group Ltd. | 147,340 | | 1,412 |
Mvelaphanda Group Ltd. | 3,277,360 | | 5,295 |
Telkom SA Ltd. | 146,300 | | 3,984 |
Wilson Bayly Holmes-Ovcon Ltd. | 446,856 | | 9,008 |
TOTAL SOUTH AFRICA | | 32,546 |
Spain - 0.9% |
Grifols SA | 319,170 | | 8,439 |
Obrascon Huarte Lain SA | 166,010 | | 7,506 |
TOTAL SPAIN | | 15,945 |
Sweden - 2.2% |
Hexagon AB (B Shares) | 718,533 | | 17,302 |
Meda AB (A Shares) | 324,460 | | 4,890 |
Modern Times Group MTG AB (B Shares) | 199,460 | | 14,017 |
RNB Retail & Brands AB | 207,990 | | 2,398 |
TOTAL SWEDEN | | 38,607 |
Switzerland - 1.1% |
Actelion Ltd. (Reg.) (a) | 82,940 | | 4,121 |
Bucher Industries AG | 15,811 | | 3,754 |
Partners Group Holding | 32,420 | | 4,394 |
Common Stocks - continued |
| Shares | | Value
(000s) |
Switzerland - continued |
Sulzer AG (Reg.) | 2,070 | | $ 3,320 |
Vontobel Holdings AG | 86,450 | | 4,441 |
TOTAL SWITZERLAND | | 20,030 |
Taiwan - 0.3% |
Far Eastern Textile Ltd. | 734,000 | | 970 |
First Steamship Co. Ltd. (a) | 580,000 | | 1,610 |
Oriental Union Chemical Corp. | 642,000 | | 906 |
PixArt Imaging, Inc. | 6,600 | | 58 |
Sinyi Realty, Inc. | 617,837 | | 1,640 |
WPG Holding Co. Ltd. | 547,000 | | 903 |
TOTAL TAIWAN | | 6,087 |
Thailand - 0.1% |
Central Pattana PCL unit | 904,600 | | 690 |
Thoresen Thai Agencies PCL unit | 449,500 | | 809 |
TOTAL THAILAND | | 1,499 |
United Kingdom - 15.0% |
Advanced Fluid Connections PLC (a) | 7,009,687 | | 0 |
ADVFN PLC (a)(f) | 35,175,780 | | 2,066 |
AeroBox PLC (a) | 5,694,657 | | 0 |
Afren PLC (a) | 1,722,490 | | 3,322 |
African Consolidated Resources PLC (a) | 10,333,334 | | 2,847 |
African Copper PLC (a) | 1,677,884 | | 3,192 |
Air Partner PLC | 45,000 | | 1,118 |
Anglo Asian Mining PLC (a) | 3,657,000 | | 950 |
Appian Technology PLC (a) | 1,968,888 | | 297 |
Appian Technology PLC warrants 2/28/08 (a)(g) | 479,045 | | 45 |
Ascent Resources PLC warrants 12/22/07 (a) | 1,500,000 | | 159 |
Autonomy Corp. PLC (a) | 168,090 | | 3,434 |
Baltic Oil Terminals PLC (a) | 1,314,300 | | 2,883 |
Belitung Zinc Corp. PLC (g) | 7,435,490 | | 1,546 |
BioCare Solutions PLC (f) | 4,849,670 | | 1,260 |
Blackstar Investors PLC (a) | 1,826,860 | | 4,330 |
Block Shield Corp. PLC (a) | 1,653,400 | | 3,266 |
Cambrian Mining PLC | 4,026,100 | | 8,810 |
CareCapital Group PLC (a) | 511,000 | | 279 |
Celsis International PLC (a) | 443,648 | | 1,909 |
Central African Mining & Exploration Co. PLC (a) | 9,125,633 | | 5,407 |
Centurion Electronics PLC (a)(f) | 748,299 | | 89 |
Clapham House Group PLC (a) | 226,950 | | 1,500 |
Common Stocks - continued |
| Shares | | Value
(000s) |
United Kingdom - continued |
Corac Group PLC (a)(f) | 4,609,104 | | $ 5,414 |
Countermine PLC (a)(g) | 4,939 | | 265 |
Countermine PLC warrants 7/26/06 (a)(g) | 4,939 | | 0 |
CustomVis plc (a)(f) | 8,417,536 | | 591 |
Datacash Group PLC | 1,110,470 | | 6,649 |
Eclipse Energy Co. Ltd. (g) | 102,000 | | 1,590 |
Europa Oil & Gas Holdings PLC warrants 11/11/07 (a) | 500,000 | | 1 |
Forum Energy PLC (a) | 800,270 | | 507 |
Gemfields Resources PLC (a) | 3,909,100 | | 2,438 |
Global Coal Management PLC (a) | 1,052,149 | | 2,166 |
Gyrus Group PLC (a) | 365,900 | | 3,252 |
Hardide Ltd. (a) | 6,848,580 | | 1,602 |
Healthcare Enterprise Group PLC (a)(f) | 18,312,440 | | 373 |
Healthcare Enterprise Group PLC warrants 6/30/08 (a) | 1,851,769 | | 19 |
Hot Tuna International PLC (a) | 1,049,400 | | 166 |
Hot Tuna International PLC warrants 2/25/08 (a)(g) | 1,179,700 | | 0 |
Hydrodec Group PLC (a)(f) | 10,002,286 | | 3,795 |
Ideal Shopping Direct PLC | 661,592 | | 2,703 |
IG Group Holdings plc | 794,850 | | 6,875 |
Impact Holdings PLC (a)(f) | 10,414,000 | | 650 |
Inmarsat PLC | 314,800 | | 3,358 |
Inova Holding PLC (a) | 1,443,461 | | 231 |
Intertek Group PLC | 94,110 | | 2,013 |
iomart Group PLC | 1,618,840 | | 1,969 |
ITE Group PLC | 2,116,540 | | 7,712 |
ITM Power PLC (a) | 1,400,980 | | 3,291 |
Jubilee Platinum PLC (a) | 4,124,543 | | 8,189 |
Keronite PLC (a)(g) | 13,620,267 | | 1,699 |
KimCor Diamonds PLC warrants 3/15/08 (a) | 2,185,000 | | 159 |
Landround plc warrants 12/11/09 (a)(g) | 166,666 | | 11 |
London Asia Chinese Private Equity Fund Ltd. warrants 3/31/11 (a) | 105,400 | | 50 |
Max Petroleum PLC (a) | 11,111,220 | | 23,678 |
Meggitt PLC | 1,632,419 | | 11,582 |
Meldex International PLC (a)(e) | 4,394,616 | | 4,386 |
MicroEmissive Displays (a) | 2,821,600 | | 3,344 |
Motivcom PLC (f) | 1,820,500 | | 5,545 |
NDS Group PLC sponsored ADR (a) | 271,300 | | 16,169 |
Petrofac Ltd. | 336,540 | | 3,603 |
Proteome Sciences PLC (a) | 1,322,532 | | 1,299 |
Pureprofile Media PLC (g) | 1,108,572 | | 864 |
Pursuit Dynamics PLC (a) | 666,667 | | 3,659 |
Common Stocks - continued |
| Shares | | Value
(000s) |
United Kingdom - continued |
Rambler Metals & Mining PLC (a) | 600,000 | | $ 661 |
RGI International Ltd. | 589,470 | | 6,119 |
Rheochem PLC warrants 12/30/07 (a) | 4,364,150 | | 15 |
Sarantel Group PLC Class A (a) | 3,310,900 | | 344 |
Scottish & Southern Energy PLC | 209,000 | | 6,761 |
SDL plc (a) | 1,090,022 | | 6,799 |
Serco Group PLC | 439,640 | | 4,120 |
Sinclair Pharma PLC (a) | 1,128,371 | | 1,935 |
Sinosoft Technology PLC (a) | 2,051,400 | | 768 |
SPI Lasers PLC (a)(f) | 3,461,200 | | 3,778 |
Stem Cell Sciences PLC (a) | 716,649 | | 432 |
SubSea Resources PLC (a) | 4,678,800 | | 122 |
SubSea Resources PLC warrants 11/4/09 (a) | 1,805,625 | | 6 |
Target Resources PLC (a) | 1,020,000 | | 488 |
Target Resources PLC warrants 7/12/08 (a) | 1,020,000 | | 64 |
TMO Biotec (a)(g) | 1,000,000 | | 1,445 |
Toledo Mining Corp. PLC (a)(e) | 1,292,424 | | 6,785 |
Triple Plate Junction PLC (a) | 1,539,200 | | 672 |
UK Coal PLC (a) | 409,200 | | 4,339 |
Unite Group PLC | 256,110 | | 2,216 |
Vectura Group PLC (a) | 3,556,060 | | 5,157 |
Virotec International PLC (a) | 3,361,132 | | 445 |
VT Group PLC | 620,780 | | 7,770 |
York Pharma PLC (a) | 633,000 | | 1,421 |
Zenergy Power PLC (a) | 1,469,780 | | 8,495 |
ZincOx Resources PLC (a) | 693,100 | | 5,714 |
TOTAL UNITED KINGDOM | | 267,447 |
United States of America - 2.3% |
Cyberview Technology, Inc. (a)(f) | 996,527 | | 3,802 |
Frontera Resources Corp. (a) | 1,157,200 | | 1,660 |
Frontier Mining Ltd. (a)(f) | 6,771,600 | | 1,619 |
Phorm, Inc. (a)(f) | 664,000 | | 28,335 |
Spacelabs Healthcare, Inc. (a) | 707,250 | | 1,169 |
XL TechGroup, Inc. (a) | 1,329,250 | | 3,634 |
TOTAL UNITED STATES OF AMERICA | | 40,219 |
TOTAL COMMON STOCKS (Cost $1,200,018) | 1,706,391 |
Convertible Bonds - 0.3% |
| Principal
Amount (000s)(d) | | Value
(000s) |
Canada - 0.3% |
Western Canadian Coal Corp. 7.5% 3/24/11 (d)
(Cost $4,061) | CAD | 4,714 | | $ 4,443 |
Money Market Funds - 9.4% |
| Shares | | |
Fidelity Cash Central Fund, 4.97% (b) | 72,630,783 | | 72,631 |
Fidelity Securities Lending Cash Central Fund, 5.02% (b)(c) | 95,477,489 | | 95,477 |
TOTAL MONEY MARKET FUNDS (Cost $168,108) | 168,108 |
TOTAL INVESTMENT PORTFOLIO - 105.5% (Cost $1,372,187) | | 1,878,942 |
NET OTHER ASSETS - (5.5)% | | (97,201) |
NET ASSETS - 100% | $ 1,781,741 |
Currency Abbreviation |
CAD | - | Canadian dollar |
Legend |
(a) Non-income producing |
(b) Affiliated fund that is available only to investment companies and other accounts managed by Fidelity Investments. The rate quoted is the annualized seven-day yield of the fund at period end. A complete unaudited listing of the fund's holdings as of its most recent quarter end is available upon request. |
(c) Investment made with cash collateral received from securities on loan. |
(d) Principal amount is stated in United States dollars unless otherwise noted. |
(e) Security or a portion of the security is on loan at period end. |
(f) Affiliated company |
(g) Restricted securities - Investment in securities not registered under the Securities Act of 1933 (excluding 144A issues). At the end of the period, the value of restricted securities (excluding 144A issues) amounted to $17,345,000 or 1.0% of net assets. |
Additional information on each holding is as follows: |
Security | Acquisition Date | Acquisition Cost (000s) |
AirSea Lines | 8/4/06 | $ 1,199 |
AirSea Lines warrants 8/4/11 | 8/4/06 | $ 0 |
Appian Technology PLC warrants 2/28/08 | 2/18/05 | $ 0 |
Belitung Zinc Corp. PLC | 1/12/06 | $ 1,308 |
Security | Acquisition Date | Acquisition Cost (000s) |
Buried Hill Energy (Cyprus) PCL | 8/18/06 | $ 2,142 |
Countermine PLC | 12/22/05 | $ 443 |
Countermine PLC warrants 7/26/06 | 12/22/05 | $ 0 |
Eclipse Energy Co. Ltd. | 4/28/05 | $ 1,459 |
Hot Tuna International PLC warrants 2/25/08 | 2/14/06 | $ 0 |
Kalahari Energy | 9/1/06 | $ 1,814 |
Keronite PLC | 8/16/06 | $ 1,549 |
Landround plc warrants 12/11/09 | 12/12/06 | $ 0 |
Pureprofile Media PLC | 5/3/05 - 1/11/06 | $ 1,173 |
Rock Well Petroleum, Inc. | 4/13/06 | $ 1,004 |
Starfield Resources, Inc. warrants 1/20/08 | 1/17/06 | $ 0 |
Stealth Ventures Ltd. warrants 3/12/08 | 9/21/06 | $ 0 |
TMO Biotec | 10/27/05 | $ 535 |
Affiliated Central Funds |
Information regarding fiscal year to date income earned by the Fund from investments in Fidelity Central Funds is as follows: |
Fund | Income earned
(Amounts in thousands) |
Fidelity Cash Central Fund | $ 2,959 |
Fidelity Securities Lending Cash Central Fund | 1,663 |
Total | $ 4,622 |
Other Affiliated Issuers |
An affiliated company is a company in which the fund has ownership of at least 5% of the voting securities. Fiscal year to date transactions with companies which are or were affiliates are as follows: |
Affiliate
(Amounts in thousands) | Value, beginning of period | Purchases | Sales Proceeds | Dividend Income | Value,
end of
period |
121Media, Inc. | $ 11,748 | $ - | $ - | $ - | $ - |
Advent Air Ltd. | 2,948 | - | - | 80 | 4,437 |
ADVFN PLC | 1,120 | 922 | 29 | - | 2,066 |
Adwalker PLC | 413 | - | - | - | - |
Avanti Screenmedia Group PLC | 9,335 | - | 8,831 | - | - |
BDI Mining Corp. | 3,288 | - | 6,306 | - | - |
BioCare Solutions PLC | 2,270 | - | 150 | - | 1,260 |
Bioprogress PLC | 9,152 | - | 4,712 | - | - |
Cambrian Mining PLC | 15,845 | - | 5,408 | 182 | - |
Centurion Electronics PLC | 432 | - | 37 | - | 89 |
Corac Group PLC | 3,538 | - | 438 | - | 5,414 |
CustomVis plc | 134 | 715 | - | - | 591 |
Cyberscan Technology, Inc. | 4,562 | - | - | - | - |
Cyberview Technology, Inc. | - | - | - | - | 3,802 |
DA Group PLC | 1,236 | - | 953 | - | - |
Financial Payment Systems Ltd. | 1,485 | - | 385 | - | - |
Frontier Mining Ltd. | 1,808 | - | - | - | 1,619 |
Gasol PLC | 1,257 | - | 897 | - | - |
Gemfields Resources PLC | 5,589 | - | 1,823 | - | - |
GMA Resources PLC | 3,939 | - | 3,863 | - | - |
Affiliate
(Amounts in thousands) | Value, beginning of period | Purchases | Sales Proceeds | Dividend Income | Value,
end of
period |
Hardide Ltd. | $ 1,711 | $ - | $ 233 | $ - | $ - |
Healthcare Enterprise Group PLC | 1,010 | 431 | 411 | - | 373 |
Hydrodec Group PLC | 8,231 | - | 1,677 | - | 3,795 |
ID Data PLC | 925 | - | 1,169 | - | - |
Imagelinx PLC | 1,948 | 340 | 816 | - | - |
Impact Holdings PLC | 2,086 | - | - | - | 650 |
Inion OY | 1,677 | - | 111 | - | - |
Interbulk Group PLC | 1,682 | - | 1,528 | - | - |
International Ferro Metals | 17,682 | 1,265 | 32,938 | - | - |
Jubilee Platinum PLC | 8,789 | 1,994 | 5,851 | - | - |
KimCor Diamonds PLC | 1,185 | - | 736 | - | - |
Landround plc | 188 | 197 | 286 | - | - |
Metals Exploration PLC | 2,126 | - | 2,280 | - | - |
MicroEmissive Displays | 1,672 | 409 | 685 | - | - |
Mineral Commodities Ltd. | 948 | - | 730 | - | - |
Motivcom PLC | 3,085 | - | 186 | 51 | 5,545 |
Phorm, Inc. | - | 1,326 | - | - | 28,335 |
Platinum Mining Corp. of India PLC | 2,418 | - | 2,829 | - | - |
Rheochem PLC | 2,034 | - | 2,015 | - | - |
Sarantel Group PLC Class A | 677 | 463 | 37 | - | - |
Solomon Gold PLC | 905 | - | 502 | - | - |
SPI Lasers PLC | 2,024 | 1,863 | 709 | - | 3,778 |
Starfield Resources, Inc. | 3,247 | 908 | 2,924 | - | - |
SubSea Resources PLC | 2,630 | - | 79 | - | - |
Sylvania Resources Ltd. | 5,331 | 4,057 | 2,385 | - | 25,111 |
Sylvania Resources Ltd. (United Kingdom) | 3,616 | 5,253 | 7,089 | - | 13,425 |
Tanzanite One Ltd. | 9,086 | - | - | 524 | 8,937 |
Teleunit SpA | 1,122 | - | - | - | 1,025 |
Toledo Mining Corp. PLC | 3,742 | 511 | 1,770 | - | - |
Visual Defence, Inc. | 2,673 | - | 430 | - | 1,503 |
Xceldiam Ltd. | 1,946 | - | 65 | 3,814 | - |
Total | $ 176,495 | $ 20,654 | $ 104,303 | $ 4,651 | $ 111,755 |
See accompanying notes which are an integral part of the financial statements.
Annual Report
Financial Statements
Statement of Assets and Liabilities
Amounts in thousands (except per-share amounts) | October 31, 2007 |
Assets | | |
Investment in securities, at value (including securities loaned of $90,915) - See accompanying schedule: Unaffiliated issuers (cost $1,131,366) | $ 1,599,079 | |
Fidelity Central Funds (cost $168,108) | 168,108 | |
Other affiliated issuers (cost $72,713) | 111,755 | |
Total Investments (cost $1,372,187) | | $ 1,878,942 |
Receivable for investments sold | | 21,599 |
Receivable for fund shares sold | | 634 |
Dividends receivable | | 2,392 |
Interest receivable | | 38 |
Distributions receivable from Fidelity Central Funds | | 457 |
Prepaid expenses | | 1 |
Other receivables | | 218 |
Total assets | | 1,904,281 |
| | |
Liabilities | | |
Payable to custodian bank | $ 1,373 | |
Payable for investments purchased | 19,762 | |
Payable for fund shares redeemed | 2,863 | |
Accrued management fee | 1,563 | |
Distribution fees payable | 49 | |
Other affiliated payables | 358 | |
Other payables and accrued expenses | 1,095 | |
Collateral on securities loaned, at value | 95,477 | |
Total liabilities | | 122,540 |
| | |
Net Assets | | $ 1,781,741 |
Net Assets consist of: | | |
Paid in capital | | $ 1,016,289 |
Undistributed net investment income | | 7,171 |
Accumulated undistributed net realized gain (loss) on investments and foreign currency transactions | | 252,123 |
Net unrealized appreciation (depreciation) on investments and assets and liabilities in foreign currencies | | 506,158 |
Net Assets | | $ 1,781,741 |
See accompanying notes which are an integral part of the financial statements.
Annual Report
Financial Statements - continued
Statement of Assets and Liabilities - continued
Amounts in thousands (except per-share amounts) | October 31, 2007 |
Calculation of Maximum Offering Price
Class A:
Net Asset Value and redemption price per share ($38,585 ÷ 1,239 shares) | | $ 31.14 |
| | |
Maximum offering price per share (100/94.25 of $31.14) | | $ 33.04 |
Class T:
Net Asset Value and redemption price per share ($40,823 ÷ 1,318 shares) | | $ 30.96 |
| | |
Maximum offering price per share (100/96.50 of $30.96) | | $ 32.08 |
Class B:
Net Asset Value and offering price per share ($10,704 ÷ 351 shares)A | | $ 30.49 |
| | |
Class C:
Net Asset Value and offering price per share ($20,094 ÷ 656 shares)A | | $ 30.62 |
| | |
International Small Cap:
Net Asset Value, offering price and redemption price per share ($1,663,761 ÷ 52,912 shares) | | $ 31.44 |
| | |
Institutional Class:
Net Asset Value, offering price and redemption price per share ($7,774 ÷ 248 shares) | | $ 31.38 |
A Redemption price per share is equal to net asset value less any applicable contingent deferred sales charge.
See accompanying notes which are an integral part of the financial statements.
Annual Report
Statement of Operations
Amounts in thousands | Year ended October 31, 2007 |
Investment Income | | |
Dividends (including $4,651 earned from other affiliated issuers) | | $ 24,214 |
Interest | | 410 |
Income from Fidelity Central Funds (including $1,663 from security lending) | | 4,622 |
| | 29,246 |
Less foreign taxes withheld | | (1,717) |
Total income | | 27,529 |
| | |
Expenses | | |
Management fee
Basic fee | $ 14,855 | |
Performance adjustment | 336 | |
Transfer agent fees | 3,688 | |
Distribution fees | 586 | |
Accounting and security lending fees | 797 | |
Custodian fees and expenses | 641 | |
Independent trustees' compensation | 6 | |
Registration fees | 81 | |
Audit | 138 | |
Legal | 42 | |
Miscellaneous | 62 | |
Total expenses before reductions | 21,232 | |
Expense reductions | (743) | 20,489 |
Net investment income (loss) | | 7,040 |
Realized and Unrealized Gain (Loss) Net realized gain (loss) on: | | |
Investment securities: | | |
Unaffiliated issuers (net of foreign taxes of $21) | 294,358 | |
Other affiliated issuers | (4,327) | |
Foreign currency transactions | (128) | |
Total net realized gain (loss) | | 289,903 |
Change in net unrealized appreciation (depreciation) on: Investment securities (net of increase in deferred foreign taxes of $762) | 201,533 | |
Assets and liabilities in foreign currencies | 242 | |
Total change in net unrealized appreciation (depreciation) | | 201,775 |
Net gain (loss) | | 491,678 |
Net increase (decrease) in net assets resulting from operations | | $ 498,718 |
See accompanying notes which are an integral part of the financial statements.
Annual Report
Financial Statements - continued
Statement of Changes in Net Assets
Amounts in thousands | Year ended
October 31,
2007 | Year ended
October 31,
2006 |
Increase (Decrease) in Net Assets | | |
Operations | | |
Net investment income (loss) | $ 7,040 | $ 6,181 |
Net realized gain (loss) | 289,903 | 461,201 |
Change in net unrealized appreciation (depreciation) | 201,775 | (42,338) |
Net increase (decrease) in net assets resulting
from operations | 498,718 | 425,044 |
Distributions to shareholders from net investment income | (3,787) | (10,829) |
Distributions to shareholders from net realized gain | (351,004) | (234,438) |
Total distributions | (354,791) | (245,267) |
Share transactions - net increase (decrease) | (298,912) | (456,221) |
Redemption fees | 245 | 565 |
Total increase (decrease) in net assets | (154,740) | (275,879) |
| | |
Net Assets | | |
Beginning of period | 1,936,481 | 2,212,360 |
End of period (including undistributed net investment income of $7,171 and undistributed net investment income of $5,133, respectively) | $ 1,781,741 | $ 1,936,481 |
See accompanying notes which are an integral part of the financial statements.
Annual Report
Financial Highlights - Class A
Years ended October 31, | 2007 | 2006 | 2005 | 2004 | 2003 I |
Selected Per-Share Data | | | | | |
Net asset value, beginning of period | $ 28.79 | $ 26.69 | $ 21.25 | $ 17.69 | $ 12.35 |
Income from Investment Operations | | | | | |
Net investment income (loss) E | .03 | (.02) | .05 | .02 | .02 H |
Net realized and unrealized gain (loss) | 7.97 | 5.05 | 6.16 | 3.83 | 5.30 |
Total from investment operations | 8.00 | 5.03 | 6.21 | 3.85 | 5.32 |
Distributions from net investment income | - | (.05) | (.02) | (.02) | - |
Distributions from net realized gain | (5.65) | (2.89) | (.77) | (.31) | - |
Total distributions | (5.65) | (2.94) | (.79) | (.33) | - |
Redemption fees added to paid
in capital E | - K | .01 | .02 | .04 | .02 |
Net asset value, end of period | $ 31.14 | $ 28.79 | $ 26.69 | $ 21.25 | $ 17.69 |
Total Return B,C,D | 33.43% | 20.22% | 30.16% | 22.36% | 43.24% |
Ratios to Average Net Assets F,J | | | | | |
Expenses before reductions | 1.53% | 1.64% | 1.66% | 1.71% | 1.77% A |
Expenses net of fee waivers, if any | 1.53% | 1.64% | 1.66% | 1.71% | 1.77% A |
Expenses net of all reductions | 1.49% | 1.58% | 1.63% | 1.69% | 1.74% A |
Net investment income (loss) | .10% | (.08)% | .21% | .09% | .28% A |
Supplemental Data | | | | | |
Net assets, end of period
(in millions) | $ 39 | $ 37 | $ 35 | $ 13 | $ 5 |
Portfolio turnover rateG | 70% | 84% | 79% | 77% | 84% A |
A Annualized
B Total returns for periods of less than one year are not annualized.
C Total returns would have been lower had certain expenses not been reduced during the periods shown.
D Total returns do not include the effect of the sales charges.
E Calculated based on average shares outstanding during the period.
F Fees and expenses of the underlying Fidelity Central Funds are not included in the Fund's expense ratio. The Fund indirectly bears its proportionate share of the expenses of any underlying Fidelity Central Funds.
G Amount does not include the portfolio activity of any underlying Fidelity Central Funds.
H Investment income per share reflects a special dividend which amounted to $.01 per share.
I For the period May 27, 2003 (commencement of sale of shares) to October 31, 2003.
J Expense ratios reflect operating expenses of the class. Expenses before reductions do not reflect amounts reimbursed by the investment adviser or reductions from brokerage service arrangements or other expense offset arrangements and do not represent the amount paid by the class during periods when reimbursements or reductions occur. Expense ratios before reductions for start-up periods may not be representative of longer-term operating periods. Expenses net of fee waivers reflect expenses after reimbursement by the investment adviser but prior to reductions from brokerage service arrangements or other expense offset arrangements. Expenses net of all reductions represent the net expenses paid by the class.
K Amount represents less than $.01 per share.
See accompanying notes which are an integral part of the financial statements.
Annual Report
Financial Highlights - Class T
Years ended October 31, | 2007 | 2006 | 2005 | 2004 | 2003 I |
Selected Per-Share Data | | | | | |
Net asset value, beginning of period | $ 28.64 | $ 26.57 | $ 21.20 | $ 17.68 | $ 12.35 |
Income from Investment Operations | | | | | |
Net investment income (loss) E | (.04) | (.09) | (.01) | (.03) | - H,K |
Net realized and unrealized gain (loss) | 7.93 | 5.03 | 6.12 | 3.83 | 5.31 |
Total from investment operations | 7.89 | 4.94 | 6.11 | 3.80 | 5.31 |
Distributions from net investment income | - | - | - | (.01) | - |
Distributions from net realized gain | (5.57) | (2.88) | (.76) | (.31) | - |
Total distributions | (5.57) | (2.88) | (.76) | (.32) | - |
Redemption fees added to paid
in capital E | - K | .01 | .02 | .04 | .02 |
Net asset value, end of period | $ 30.96 | $ 28.64 | $ 26.57 | $ 21.20 | $ 17.68 |
Total Return B,C,D | 33.07% | 19.93% | 29.72% | 22.07% | 43.16% |
Ratios to Average Net Assets F,J | | | | | |
Expenses before reductions | 1.77% | 1.89% | 1.92% | 1.94% | 2.12% A |
Expenses net of fee waivers,
if any | 1.77% | 1.89% | 1.91% | 1.94% | 2.12% A |
Expenses net of all reductions | 1.73% | 1.83% | 1.88% | 1.92% | 2.09% A |
Net investment income (loss) | (.14)% | (.32)% | (.04)% | (.14)% | (.07)% A |
Supplemental Data | | | | | |
Net assets, end of period
(in millions) | $ 41 | $ 42 | $ 42 | $ 15 | $ 4 |
Portfolio turnover rate G | 70% | 84% | 79% | 77% | 84% A |
A Annualized
B Total returns for periods of less than one year are not annualized.
C Total returns would have been lower had certain expenses not been reduced during the periods shown.
D Total returns do not include the effect of the sales charges.
E Calculated based on average shares outstanding during the period.
F Fees and expenses of the underlying Fidelity Central Funds are not included in the Fund's expense ratio. The Fund indirectly bears its proportionate share of the expenses of any underlying Fidelity Central Funds.
G Amount does not include the portfolio activity of any underlying Fidelity Central Funds.
H Investment income per share reflects a special dividend which amounted to $.01 per share.
I For the period May 27, 2003 (commencement of sale of shares) to October 31, 2003.
J Expense ratios reflect operating expenses of the class. Expenses before reductions do not reflect amounts reimbursed by the investment adviser or reductions from brokerage service arrangements or other expense offset arrangements and do not represent the amount paid by the class during periods when reimbursements or reductions occur. Expense ratios before reductions for start-up periods may not be representative of longer-term operating periods. Expenses net of fee waivers reflect expenses after reimbursement by the investment adviser but prior to reductions from brokerage service arrangements or other expense offset arrangements. Expenses net of all reductions represent the net expenses paid by the class.
K Amount represents less than $.01 per share.
See accompanying notes which are an integral part of the financial statements.
Annual Report
Financial Highlights - Class B
Years ended October 31, | 2007 | 2006 | 2005 | 2004 | 2003 I |
Selected Per-Share Data | | | | | |
Net asset value, beginning of period | $ 28.26 | $ 26.24 | $ 20.99 | $ 17.62 | $ 12.35 |
Income from Investment Operations | | | | | |
Net investment income (loss) E | (.18) | (.24) | (.14) | (.16) | (.05) H |
Net realized and unrealized gain (loss) | 7.82 | 4.98 | 6.08 | 3.80 | 5.30 |
Total from investment operations | 7.64 | 4.74 | 5.94 | 3.64 | 5.25 |
Distributions from net realized gain | (5.41) | (2.73) | (.71) | (.31) | - |
Redemption fees added to paid
in capital E | - K | .01 | .02 | .04 | .02 |
Net asset value, end of period | $ 30.49 | $ 28.26 | $ 26.24 | $ 20.99 | $ 17.62 |
Total Return B,C,D | 32.38% | 19.28% | 29.13% | 21.21% | 42.67% |
Ratios to Average Net Assets F,J | | | | | |
Expenses before reductions | 2.30% | 2.48% | 2.49% | 2.63% | 2.76% A |
Expenses net of fee waivers, if any | 2.30% | 2.40% | 2.43% | 2.63% | 2.76% A |
Expenses net of all reductions | 2.26% | 2.34% | 2.40% | 2.60% | 2.73% A |
Net investment income (loss) | (.66)% | (.84)% | (.56)% | (.83)% | (.71)% A |
Supplemental Data | | | | | |
Net assets, end of period
(in millions) | $ 11 | $ 11 | $ 13 | $ 5 | $ 1 |
Portfolio turnover rate G | 70% | 84% | 79% | 77% | 84% A |
A Annualized
B Total returns for periods of less than one year are not annualized.
C Total returns would have been lower had certain expenses not been reduced during the periods shown.
D Total returns do not include the effect of the contingent deferred sales charge.
E Calculated based on average shares outstanding during the period.
F Fees and expenses of the underlying Fidelity Central Funds are not included in the Fund's expense ratio. The Fund indirectly bears its proportionate share of the expenses of any underlying Fidelity Central Funds.
G Amount does not include the portfolio activity of any underlying Fidelity Central Funds.
H Investment income per share reflects a special dividend which amounted to $.01 per share.
I For the period May 27, 2003 (commencement of sale of shares) to October 31, 2003.
J Expense ratios reflect operating expenses of the class. Expenses before reductions do not reflect amounts reimbursed by the investment adviser or reductions from brokerage service arrangements or other expense offset arrangements and do not represent the amount paid by the class during periods when reimbursements or reductions occur. Expense ratios before reductions for start-up periods may not be representative of longer-term operating periods. Expenses net of fee waivers reflect expenses after reimbursement by the investment adviser but prior to reductions from brokerage service arrangements or other expense offset arrangements. Expenses net of all reductions represent the net expenses paid by the class.
K Amount represents less than $.01 per share.
See accompanying notes which are an integral part of the financial statements.
Annual Report
Financial Highlights - Class C
Years ended October 31, | 2007 | 2006 | 2005 | 2004 | 2003 I |
Selected Per-Share Data | | | | | |
Net asset value, beginning of period | $ 28.33 | $ 26.31 | $ 21.04 | $ 17.64 | $ 12.35 |
Income from Investment Operations | | | | | |
Net investment income (loss) E | (.17) | (.23) | (.13) | (.12) | (.04) H |
Net realized and unrealized gain (loss) | 7.85 | 4.99 | 6.10 | 3.80 | 5.31 |
Total from investment operations | 7.68 | 4.76 | 5.97 | 3.68 | 5.27 |
Distributions from net investment income | - | - | - | (.01) | - |
Distributions from net realized gain | (5.39) | (2.75) | (.72) | (.31) | - |
Total distributions | (5.39) | (2.75) | (.72) | (.32) | - |
Redemption fees added to paid in capital E | - K | .01 | .02 | .04 | .02 |
Net asset value, end of period | $ 30.62 | $ 28.33 | $ 26.31 | $ 21.04 | $ 17.64 |
Total Return B,C,D | 32.39% | 19.34% | 29.22% | 21.43% | 42.83% |
Ratios to Average Net Assets F,J | | | | | |
Expenses before reductions | 2.26% | 2.38% | 2.41% | 2.43% | 2.57% A |
Expenses net of fee waivers,
if any | 2.26% | 2.38% | 2.41% | 2.43% | 2.57% A |
Expenses net of all reductions | 2.22% | 2.32% | 2.38% | 2.40% | 2.55% A |
Net investment income (loss) | (.62)% | (.81)% | (.54)% | (.62)% | (.52)% A |
Supplemental Data | | | | | |
Net assets, end of period
(in millions) | $ 20 | $ 21 | $ 25 | $ 9 | $ 1 |
Portfolio turnover rate G | 70% | 84% | 79% | 77% | 84% A |
A Annualized
B Total returns for periods of less than one year are not annualized.
C Total returns would have been lower had certain expenses not been reduced during the periods shown.
D Total returns do not include the effect of the contingent deferred sales charge.
E Calculated based on average shares outstanding during the period.
F Fees and expenses of the underlying Fidelity Central Funds are not included in the Fund's expense ratio. The Fund indirectly bears its proportionate share of the expenses of any underlying Fidelity Central Funds.
G Amount does not include the portfolio activity of any underlying Fidelity Central Funds.
H Investment income per share reflects a special dividend which amounted to $.01 per share.
I For the period May 27, 2003 (commencement of sale of shares) to October 31, 2003.
J Expense ratios reflect operating expenses of the class. Expenses before reductions do not reflect amounts reimbursed by the investment adviser or reductions from brokerage service arrangements or other expense offset arrangements and do not represent the amount paid by the class during periods when reimbursements or reductions occur. Expense ratios before reductions for start-up periods may not be representative of longer-term operating periods. Expenses net of fee waivers reflect expenses after reimbursement by the investment adviser but prior to reductions from brokerage service arrangements or other expense offset arrangements. Expenses net of all reductions represent the net expenses paid by the class.
K Amount represents less than $.01 per share.
See accompanying notes which are an integral part of the financial statements.
Annual Report
Financial Highlights - International Small Cap
Years ended October 31, | 2007 | 2006 | 2005 | 2004 | 2003 |
Selected Per-Share Data | | | | | |
Net asset value, beginning of period | $ 29.03 | $ 26.89 | $ 21.36 | $ 17.71 | $ 9.87 |
Income from Investment Operations | | | | | |
Net investment income (loss) C | .12 | .08 | .15 | .10 | .07 F |
Net realized and unrealized gain (loss) | 8.03 | 5.08 | 6.19 | 3.84 | 7.75 |
Total from investment operations | 8.15 | 5.16 | 6.34 | 3.94 | 7.82 |
Distributions from net investment income | (.07) | (.14) | (.06) | (.02) | - |
Distributions from net realized gain | (5.67) | (2.89) | (.77) | (.31) | (.02) |
Total distributions | (5.74) | (3.03) | (.83) | (.33) | (.02) |
Redemption fees added to paid in capital C | - H | .01 | .02 | .04 | .04 |
Net asset value, end of period | $ 31.44 | $ 29.03 | $ 26.89 | $ 21.36 | $ 17.71 |
Total Return A,B | 33.82% | 20.65% | 30.67% | 22.84% | 79.78% |
Ratios to Average Net Assets D,G | | | | | |
Expenses before reductions | 1.19% | 1.28% | 1.28% | 1.30% | 1.54% |
Expenses net of fee waivers,
if any | 1.19% | 1.28% | 1.28% | 1.30% | 1.54% |
Expenses net of all reductions | 1.15% | 1.22% | 1.25% | 1.28% | 1.51% |
Net investment income (loss) | .45% | .29% | .59% | .50% | .46% |
Supplemental Data | | | | | |
Net assets, end of period
(in millions) | $ 1,664 | $ 1,816 | $ 2,090 | $ 1,091 | $ 547 |
Portfolio turnover rate E | 70% | 84% | 79% | 77% | 84% |
A Total returns for periods of less than one year are not annualized.
B Total returns would have been lower had certain expenses not been reduced during the periods shown.
C Calculated based on average shares outstanding during the period.
D Fees and expenses of the underlying Fidelity Central Funds are not included in the Fund's expense ratio. The Fund indirectly bears its proportionate share of the expenses of any underlying Fidelity Central Funds.
E Amount does not include the portfolio activity of any underlying Fidelity Central Funds.
F Investment income per share reflects a special dividend which amounted to $.03 per share.
G Expense ratios reflect operating expenses of the class. Expenses before reductions do not reflect amounts reimbursed by the investment adviser or reductions from brokerage service arrangements or other expense offset arrangements and do not represent the amount paid by the class during periods when reimbursements or reductions occur. Expenses net of fee waivers reflect expenses after reimbursement by the investment adviser but prior to reductions from brokerage service arrangements or other expense offset arrangements. Expenses net of all reductions represent the net expenses paid by the class.
H Amount represents less than $.01 per share.
See accompanying notes which are an integral part of the financial statements.
Annual Report
Financial Highlights - Institutional Class
Years ended October 31, | 2007 | 2006 | 2005 | 2004 | 2003 H |
Selected Per-Share Data | | | | | |
Net asset value, beginning of period | $ 28.99 | $ 26.86 | $ 21.36 | $ 17.72 | $ 12.35 |
Income from Investment Operations | | | | | |
Net investment income (loss) D | .12 | .08 | .14 | .10 | .04 G |
Net realized and unrealized gain (loss) | 8.01 | 5.07 | 6.18 | 3.84 | 5.31 |
Total from investment operations | 8.13 | 5.15 | 6.32 | 3.94 | 5.35 |
Distributions from net investment income | (.07) | (.14) | (.07) | (.03) | - |
Distributions from net realized gain | (5.67) | (2.89) | (.77) | (.31) | - |
Total distributions | (5.74) | (3.03) | (.84) | (.34) | - |
Redemption fees added to paid in capital D | - J | .01 | .02 | .04 | .02 |
Net asset value, end of period | $ 31.38 | $ 28.99 | $ 26.86 | $ 21.36 | $ 17.72 |
Total Return B,C | 33.84% | 20.65% | 30.59% | 22.84% | 43.48% |
Ratios to Average Net Assets E,I |
| | | | |
Expenses before reductions | 1.18% | 1.29% | 1.30% | 1.32% | 1.51% A |
Expenses net of fee waivers,
if any | 1.18% | 1.29% | 1.30% | 1.32% | 1.51% A |
Expenses net of all reductions | 1.14% | 1.23% | 1.27% | 1.29% | 1.48% A |
Net investment income (loss) | .45% | .28% | .57% | .49% | .54% A |
Supplemental Data | | | | | |
Net assets, end of period
(in millions) | $ 8 | $ 9 | $ 7 | $ 3 | $ .4 |
Portfolio turnover rate F | 70% | 84% | 79% | 77% | 84% A |
A Annualized
B Total returns for periods of less than one year are not annualized.
C Total returns would have been lower had certain expenses not been reduced during the periods shown.
D Calculated based on average shares outstanding during the period.
E Fees and expenses of the underlying Fidelity Central Funds are not included in the Fund's expense ratio. The Fund indirectly bears its proportionate share of the expenses of any underlying Fidelity Central Funds.
F Amount does not include the portfolio activity of any underlying Fidelity Central Funds.
G Investment income per share reflects a special dividend which amounted to $.01 per share.
H For the period May 27, 2003 (commencement of sale of shares) to October 31, 2003.
I Expense ratios reflect operating expenses of the class. Expenses before reductions do not reflect amounts reimbursed by the investment adviser or reductions from brokerage service arrangements or other expense offset arrangements and do not represent the amount paid by the class during periods when reimbursements or reductions occur. Expense ratios before reductions for start-up periods may not be representative of longer-term operating periods. Expenses net of fee waivers reflect expenses after reimbursement by the investment adviser but prior to reductions from brokerage service arrangements or other expense offset arrangements. Expenses net of all reductions represent the net expenses paid by the class.
J Amount represents less than $.01 per share.
See accompanying notes which are an integral part of the financial statements.
Annual Report
Notes to Financial Statements
For the period ended October 31, 2007
(Amounts in thousands except ratios)
1. Organization.
Fidelity International Small Cap Fund (the Fund) is a fund of Fidelity Investment Trust (the trust) and is authorized to issue an unlimited number of shares. The trust is registered under the Investment Company Act of 1940, as amended (the 1940 Act), as an open-end management investment company organized as a Massachusetts business trust.
The Fund offers Class A, Class T, Class B, Class C, International Small Cap and Institutional Class shares, each of which has equal rights as to assets and voting privileges. Each class has exclusive voting rights with respect to matters that affect that class. Class B shares will automatically convert to Class A shares after a holding period of seven years from the initial date of purchase. Investment income, realized and unrealized capital gains and losses, the common expenses of the Fund, and certain fund-level expense reductions, if any, are allocated on a pro rata basis to each class based on the relative net assets of each class to the total net assets of the Fund. Each class differs with respect to transfer agent and distribution and service plan fees incurred. Certain expense reductions also differ by class.
2. Investments in Fidelity Central Funds.
The Fund may invest in Fidelity Central Funds, which are open-end investment companies available only to other investment companies and accounts managed by Fidelity Management & Research Company (FMR) and its affiliates. The Fund's Schedule of Investments lists each of the Fidelity Central Funds as an investment of the Fund, but does not include the underlying holdings of each Fidelity Central Fund. As an Investing Fund, the Fund indirectly bears its proportionate share of the expenses of the underlying Fidelity Central Funds.
The Money Market Central Funds seek preservation of capital and current income and are managed by Fidelity Investments Money Management, Inc. (FIMM), an affiliate of FMR.
A complete list of holdings for each Fidelity Central Fund is available upon request or at the SEC's web site at www.sec.gov. In addition, the financial statements of the Fidelity Central Funds, which are not covered by the Fund's Report of Independent Registered Public Accounting Firm, are available on the SEC's web site or upon request.
3. Significant Accounting Policies.
The financial statements have been prepared in conformity with accounting principles generally accepted in the United States of America, which require management to make certain estimates and assumptions at the date of the financial statements. The following summarizes the significant accounting policies of the Fund:
Annual Report
Notes to Financial Statements - continued
(Amounts in thousands except ratios)
3. Significant Accounting Policies - continued
Security Valuation. Investments are valued and net asset value (NAV) per share is calculated (NAV calculation) as of the close of business of the New York Stock Exchange (NYSE), normally 4:00 p.m. Eastern time. Wherever possible, the Fund uses independent pricing services approved by the Board of Trustees to value its investments.
Equity securities, including restricted securities, for which market quotations are readily available, are valued at the last reported sale price or official closing price as reported by an independent pricing service on the primary market or exchange on which they are traded. In the event there were no sales during the day or closing prices are not available, securities are valued at the last quoted bid price. Debt securities, including restricted securities, for which quotations are readily available, are valued by independent pricing services or by dealers who make markets in such securities. Pricing services consider yield or price of bonds of comparable quality, coupon, maturity and type as well as dealer supplied prices. Investments in open-end mutual funds, including the Fidelity Central Funds, are valued at their closing net asset value each business day. Short-term securities with remaining maturities of sixty days or less for which quotations are not readily available are valued at amortized cost, which approximates value.
When current market prices or quotations are not readily available or do not accurately reflect fair value, valuations may be determined in accordance with procedures adopted by the Board of Trustees. For example, when developments occur between the close of a market and the close of the NYSE that may materially affect the value of some or all of the securities, or when trading in a security is halted, those securities may be fair valued. Factors used in the determination of fair value may include monitoring news to identify significant market or security specific events such as changes in the value of U.S. securities markets, reviewing developments in foreign markets and evaluating the performance of ADRs, futures contracts and exchange-traded funds. Because the Fund's utilization of fair value pricing depends on market activity, the frequency with which fair value pricing is used cannot be predicted and may be utilized to a significant extent. The value of securities used for NAV calculation under fair value pricing may differ from published prices for the same securities.
Foreign Currency. The Fund uses foreign currency contracts to facilitate transactions in foreign-denominated securities. Losses from these transactions may arise from changes in the value of the foreign currency or if the counterparties do not perform under the contracts' terms.
Foreign-denominated assets, including investment securities, and liabilities are translated into U.S. dollars at the exchange rate at period end. Purchases and sales of investment securities, income and dividends received and expenses denominated in foreign currencies are translated into U.S. dollars at the exchange rate in effect on the transaction date.
Annual Report
3. Significant Accounting Policies - continued
Foreign Currency - continued
The effects of exchange rate fluctuations on investments are included with the net realized and unrealized gain (loss) on investment securities. Other foreign currency transactions resulting in realized and unrealized gain (loss) are disclosed separately.
Investment Transactions and Income. For financial reporting purposes, the Fund's investment holdings and NAV include trades executed through the end of the last business day of the period. The NAV for processing shareholder transactions includes trades executed through the end of the prior business day. Gains and losses on securities sold are determined on the basis of identified cost. Dividend income is recorded on the ex-dividend date, except for certain dividends from foreign securities where the ex-dividend date may have passed, which are recorded as soon as the Fund is informed of the ex-dividend date. Non-cash dividends included in dividend income, if any, are recorded at the fair market value of the securities received. Distributions received on securities that represent a return of capital or capital gain are recorded as a reduction of cost of investments and/or as a realized gain. The Fund estimates the components of distributions received that may be considered return of capital distributions or capital gain distributions. Interest income and distributions from the Fidelity Central Funds are accrued as earned. Interest income includes coupon interest and amortization of premium and accretion of discount on debt securities. Investment income is recorded net of foreign taxes withheld where recovery of such taxes is uncertain.
Expenses. Most expenses of the trust can be directly attributed to a fund. Expenses which cannot be directly attributed are apportioned among each Fund in the trust. Expense estimates are accrued in the period to which they relate and adjustments are made when actual amounts are known.
Income Tax Information and Distributions to Shareholders. Each year, the Fund intends to qualify as a regulated investment company by distributing all of its taxable income and realized gains under Subchapter M of the Internal Revenue Code. As a result, no provision for income taxes is required in the accompanying financial statements. Foreign taxes are provided for based on the Fund's understanding of the tax rules and rates that exist in the foreign markets in which it invests.
Distributions are recorded on the ex-dividend date. Income dividends and capital gain distributions are declared separately for each class. Income and capital gain distributions are determined in accordance with income tax regulations, which may differ from generally accepted accounting principles. In addition, the Fund will claim a portion of the payment made to redeeming shareholders as a distribution for income tax purposes.
Annual Report
Notes to Financial Statements - continued
(Amounts in thousands except ratios)
3. Significant Accounting Policies - continued
Income Tax Information and Distributions to Shareholders - continued
Capital accounts within the financial statements are adjusted for permanent book-tax differences. Certain adjustments have been made to the accounts relating to prior periods. Collectively, these adjustments have no impact on net assets or the results of operations. Temporary book-tax differences will reverse in a subsequent period.
Book-tax differences are primarily due to foreign currency transactions, certain foreign taxes, passive foreign investment companies (PFIC) and losses deferred due to wash sales.
The tax-basis components of distributable earnings and the federal tax cost as of period end were as follows:
Unrealized appreciation | $ 557,218 |
Unrealized depreciation | (127,347) |
Net unrealized appreciation (depreciation) | 429,871 |
Undistributed ordinary income | 79,370 |
Undistributed long-term capital gain | 220,528 |
| |
Cost for federal income tax purposes | $ 1,449,071 |
The tax character of distributions paid was as follows:
| October 31, 2007 | October 31, 2006 |
Ordinary Income | $ 43,869 | $ 66,631 |
Long-term Capital Gains | 310,922 | 178,636 |
Total | $ 354,791 | $ 245,267 |
Short-Term Trading (Redemption) Fees. Shares held in the Fund less than 90 days are subject to a redemption fee equal to 2.00% of the proceeds of the redeemed shares. All redemption fees, including any estimated redemption fees paid by FMR, are retained by the Fund and accounted for as an addition to paid in capital.
New Accounting Pronouncements. In July 2006, Financial Accounting Standards Board Interpretation No. 48, Accounting for Uncertainty in Income Taxes - an interpretation of FASB Statement 109 (FIN 48), was issued and is effective on the last business day of the semiannual reporting period for fiscal years beginning after December 15, 2006. FIN 48 sets forth a threshold for financial statement recognition, measurement and disclosure of a tax position taken or expected to be taken on a tax return. Management has concluded that the adoption of FIN 48 will not result in a material impact on the Fund's net assets, results of operations and financial statement disclosures.
Annual Report
3. Significant Accounting Policies - continued
New Accounting Pronouncements - continued
In addition, in September 2006, Statement of Financial Accounting Standards No. 157, Fair Value Measurements (SFAS 157), was issued and is effective for fiscal years beginning after November 15, 2007. SFAS 157 defines fair value, establishes a framework for measuring fair value and expands disclosures about fair value measurements. Management is currently evaluating the impact the adoption of SFAS 157 will have on the Fund's financial statement disclosures.
4. Operating Policies.
Repurchase Agreements. FMR has received an Exemptive Order from the Securities and Exchange Commission (the SEC) which permits the Fund and other affiliated entities of FMR to transfer uninvested cash balances into joint trading accounts which are then invested in repurchase agreements. The Fund may also invest directly with institutions in repurchase agreements. Repurchase agreements are collateralized by government or non-government securities. Upon settlement date, collateral is held in segregated accounts with custodian banks and may be obtained in the event of a default of the counterparty. The Fund monitors, on a daily basis, the value of the collateral to ensure it is at least equal to the principal amount of the repurchase agreement (including accrued interest). In the event of a default by the counterparty, realization of the collateral proceeds could be delayed, during which time the value of the collateral may decline.
Restricted Securities. The Fund may invest in securities that are subject to legal or contractual restrictions on resale. These securities generally may be resold in transactions exempt from registration or to the public if the securities are registered. Disposal of these securities may involve time-consuming negotiations and expense, and prompt sale at an acceptable price may be difficult. Information regarding restricted securities is included at the end of the Fund's Schedule of Investments.
5. Purchases and Sales of Investments.
Purchases and sales of securities, other than short-term securities and U.S. government securities, aggregated $1,176,947 and $1,820,033, respectively.
6. Fees and Other Transactions with Affiliates.
Management Fee. FMR and its affiliates provide the Fund with investment management related services for which the Fund pays a monthly management fee. The management fee is the sum of an individual fund fee rate that is based on an annual rate of .60% of the Fund's average net assets and a group fee rate that averaged ..26% during the
Annual Report
Notes to Financial Statements - continued
(Amounts in thousands except ratios)
6. Fees and Other Transactions with Affiliates - continued
Management Fee - continued
period. The group fee rate is based upon the average net assets of all the mutual funds advised by FMR. The group fee rate decreases as assets under management increase and increases as assets under management decrease. In addition, the management fee is subject to a performance adjustment (up to a maximum of ± .20% of the Fund's average net assets over a 36 month performance period). The upward or downward adjustment to the management fee is based on the relative investment performance of the retail class of the Fund, International Small Cap as compared to an appropriate benchmark index. For the period, the total annual management fee rate, including the performance adjustment, was .88% of the Fund's average net assets.
Distribution and Service Plan. In accordance with Rule 12b-1 of the 1940 Act, the Fund has adopted separate Distribution and Service Plans for each class of shares. Certain classes pay Fidelity Distributors Corporation (FDC), an affiliate of FMR, separate Distribution and Service Fees, each of which is based on an annual percentage of each class' average net assets. In addition, FDC may pay financial intermediaries for selling shares of the Fund and providing shareholder support services. For the period, the Distribution and Service Fee rates and the total amounts paid to and retained by FDC were as follows:
| Distribution
Fee | Service
Fee | Paid to
FDC | Retained
by FDC |
Class A | 0% | .25% | $ 89 | $ 5 |
Class T | .25% | .25% | 195 | - |
Class B | .75% | .25% | 107 | 80 |
Class C | .75% | .25% | 195 | 19 |
| | | $ 586 | $ 104 |
Sales Load. FDC receives a front-end sales charge of up to 5.75% for selling Class A shares, and 3.50% for selling Class T shares, some of which is paid to financial intermediaries for selling shares of the Fund. FDC receives the proceeds of contingent deferred sales charges levied on Class A, Class T, Class B, and Class C redemptions. These charges depend on the holding period. The deferred sales charges range from 5% to 1% for Class B, 1% for Class C, 1.00% to .50% for certain purchases of Class A shares and .25% for certain purchases of Class T shares.
Annual Report
6. Fees and Other Transactions with Affiliates - continued
Sales Load - continued
For the period, sales charge amounts retained by FDC were as follows:
| Retained
by FDC |
Class A | $ 4 |
Class T | 3 |
Class B* | 20 |
Class C* | 3 |
| $ 30 |
* When Class B and Class C shares are initially sold, FDC pays commissions from its own resources to financial intermediaries through which the sales are made.
Transfer Agent Fees. Fidelity Investments Institutional Operations Company, Inc. (FIIOC), an affiliate of FMR, is the transfer, dividend disbursing and shareholder servicing agent for each class of the Fund, except for International Small Cap. Fidelity Service Company, Inc. (FSC), an affiliate of FMR, is the transfer agent for International Small Cap shares. FIIOC and FSC receive account fees and asset-based fees that vary according to the account size and type of account of the shareholders of the respective classes of the Fund. FIIOC and FSC pay for typesetting, printing and mailing of shareholder reports, except proxy statements. For the period, the total transfer agent fees paid by each class to FIIOC or FSC, were as follows:
| Amount | % of
Average
Net Assets |
Class A | $ 107 | .30 |
Class T | 114 | .29 |
Class B | 34 | .32 |
Class C | 54 | .28 |
International Small Cap | 3,363 | .21 |
Institutional Class | 16 | .20 |
| $ 3,688 | |
Accounting and Security Lending Fees. FSC maintains the Fund's accounting records. The accounting fee is based on the level of average net assets for the month. Under a separate contract, FSC administers the security lending program. The security lending fee is based on the number and duration of lending transactions.
Annual Report
Notes to Financial Statements - continued
(Amounts in thousands except ratios)
7. Committed Line of Credit.
The Fund participates with other funds managed by FMR in a $4.2 billion credit facility (the "line of credit") to be utilized for temporary or emergency purposes to fund shareholder redemptions or for other short-term liquidity purposes. The Fund has agreed to pay commitment fees on its pro rata portion of the line of credit, which amounted to $4 and is reflected in Miscellaneous Expense on the Statement of Operations. During the period, there were no borrowings on this line of credit.
8. Security Lending.
The Fund lends portfolio securities from time to time in order to earn additional income. On the settlement date of the loan, the Fund receives collateral (in the form of U.S. Treasury obligations, letters of credit and/or cash) against the loaned securities and maintains collateral in an amount not less than 100% of the market value of the loaned securities during the period of the loan. The market value of the loaned securities is determined at the close of business of the Fund and any additional required collateral is delivered to the Fund on the next business day. If the borrower defaults on its obligation to return the securities loaned because of insolvency or other reasons, a fund could experience delays and costs in recovering the securities loaned or in gaining access to the collateral. Any cash collateral received is invested in the Fidelity Securities Lending Cash Central Fund. The value of loaned securities and cash collateral at period end are disclosed on the Fund's Statement of Assets and Liabilities. Security lending income represents the income earned on investing cash collateral, less fees and expenses associated with the loan, plus any premium payments that may be received on the loan of certain types of securities. Security lending income is presented in the Statement of Operations as a component of income from Fidelity Central Funds.
9. Expense Reductions.
Many of the brokers with whom FMR places trades on behalf of the Fund provided services to the Fund in addition to trade execution. These services included payments of certain expenses on behalf of the Fund totaling $673 for the period. During the period, these credits reduced the Fund's custody expenses by $1. During the period, credits reduced each class' transfer agent expense as noted in the table below.
| Transfer Agent
expense reduction | |
International Small Cap | $ 32 | |
Annual Report
10. Other.
The Fund's organizational documents provide former and current trustees and officers with a limited indemnification against liabilities arising in connection with the performance of their duties to the Fund. In the normal course of business, the Fund may also enter into contracts that provide general indemnifications. The Fund's maximum exposure under these arrangements is unknown as this would be dependent on future claims that may be made against the Fund. The risk of material loss from such claims is considered remote.
In September 2006, FIIOC, the Fund's transfer agent, notified the Fund that the Fund's books and records did not reflect a conversion of certain Class B to Class A shares upon their conversion date. In March 2007, FIIOC converted the relevant Class B shares to Class A shares and recorded the conversion in the books and records of the Fund which did not result in a material impact to the Fund's reported net assets or results of operations in the accompanying financial statements. FIIOC has remediated affected shareholders and reimbursed the Fund for all related audit and legal expenses.
The United States Securities and Exchange Commission ("SEC") is conducting an investigation of FMR (covering the years 2002 to 2004) arising from gifts, gratuities and business entertainment provided by certain brokers to certain individuals who were employed on FMR's domestic equity trading desk during that period. FMR is in discussions with the SEC staff regarding the possible resolution of the matter, but as of period-end no final resolution has been reached.
In December 2006, the Independent Trustees completed their own investigation of the matter with the assistance of independent counsel. The Independent Trustees and FMR agree that, despite the absence of proof that the Fidelity mutual funds experienced diminished execution quality as a result of the improper receipt of gifts and business entertainment, the conduct at issue was serious and is worthy of redress. Accordingly, the Independent Trustees have requested and FMR has agreed to pay $42 million to Fidelity mutual funds, plus interest to be determined at the time that payment is made. A method of allocating this payment among the funds has not yet been determined. The total payment to the Fund is not anticipated to have a material impact on the Fund's net assets. In addition, FMR reimbursed related legal expenses which are recorded in the accompanying Statement of Operations as an expense reduction.
Annual Report
Notes to Financial Statements - continued
(Amounts in thousands except ratios)
11. Distributions to Shareholders.
Distributions to shareholders of each class were as follows:
| Years ended October 31, |
| 2007 | 2006 |
From net investment income | | |
Class A | $ - | $ 62 |
International Small Cap | 3,765 | 10,726 |
Institutional Class | 22 | 42 |
Total | $ 3,787 | $ 10,829 |
From net realized gain | | |
Class A | $ 6,864 | $ 3,713 |
Class T | 7,706 | 4,531 |
Class B | 2,092 | 1,339 |
Class C | 3,882 | 2,560 |
International Small Cap | 328,782 | 221,459 |
Institutional Class | 1,678 | 836 |
Total | $ 351,004 | $ 234,438 |
12. Share Transactions.
Transactions for each class of shares were as follows:
| Shares | Dollars |
| Years ended October 31, | Years ended October 31, |
| 2007 | 2006 | 2007 | 2006 |
Class A | | | | |
Shares sold | 268 | 335 | $ 7,316 | $ 9,788 |
Reinvestment of distributions | 252 | 125 | 6,096 | 3,194 |
Shares redeemed | (556) | (490) | (14,980) | (14,008) |
Net increase (decrease) | (36) | (30) | $ (1,568) | $ (1,026) |
Class T | | | | |
Shares sold | 226 | 413 | $ 6,120 | $ 11,877 |
Reinvestment of distributions | 297 | 165 | 7,166 | 4,209 |
Shares redeemed | (671) | (679) | (17,855) | (19,325) |
Net increase (decrease) | (148) | (101) | $ (4,569) | $ (3,239) |
Class B | | | | |
Shares sold | 19 | 69 | $ 519 | $ 1,926 |
Reinvestment of distributions | 79 | 48 | 1,892 | 1,211 |
Shares redeemed | (149) | (202) | (3,957) | (5,665) |
Net increase (decrease) | (51) | (85) | $ (1,546) | $ (2,528) |
Annual Report
12. Share Transactions - continued
| Shares | Dollars |
| Years ended October 31, | Years ended October 31, |
| 2007 | 2006 | 2007 | 2006 |
Class C | | | | |
Shares sold | 56 | 146 | $ 1,462 | $ 4,106 |
Reinvestment of distributions | 124 | 80 | 2,967 | 2,033 |
Shares redeemed | (277) | (431) | (7,298) | (11,929) |
Net increase (decrease) | (97) | (205) | $ (2,869) | $ (5,790) |
International Small Cap | | | | |
Shares sold | 7,028 | 17,580 | $ 194,113 | $ 512,573 |
Reinvestment of distributions | 12,767 | 8,379 | 311,000 | 216,010 |
Shares redeemed | (29,445) | (41,151) | (791,655) | (1,173,251) |
Net increase (decrease) | (9,650) | (15,192) | $ (286,542) | $ (444,668) |
Institutional Class | | | | |
Shares sold | 47 | 124 | $ 1,226 | $ 3,656 |
Reinvestment of distributions | 39 | 20 | 938 | 506 |
Shares redeemed | (150) | (109) | (3,984) | (3,132) |
Net increase (decrease) | (64) | 35 | $ (1,820) | $ 1,030 |
Annual Report
Report of Independent Registered Public Accounting Firm
To the Trustees of Fidelity Investment Trust and Shareholders of Fidelity International Small Cap Fund:
We have audited the accompanying statement of assets and liabilities of Fidelity International Small Cap Fund (the Fund), a fund of Fidelity Investment Trust, including the schedule of investments, as of October 31, 2007, and the related statement of operations for the year then ended, the statement of changes in net assets for each of the two years in the period then ended, and the financial highlights for each of the four years in the period then ended and for the period from May 27, 2003 (commencement of operations) to October 31, 2003. These financial statements and financial highlights are the responsibility of the Fund's management. Our responsibility is to express an opinion on these financial statements and financial highlights based on our audits.
We conducted our audits in accordance with standards of the Public Company Accounting Oversight Board (United States). Those standards require that we plan and perform the audit to obtain reasonable assurance about whether the financial statements and financial highlights are free of material misstatement. The Fund is not required to have, nor were we engaged to perform, an audit of its internal control over financial reporting. Our audits included consideration of internal control over financial reporting as a basis for designing audit procedures that are appropriate in the circumstances, but not for the purpose of expressing an opinion on the effectiveness of the Fund's internal control over financial reporting. Accordingly, we express no such opinion. An audit also includes examining, on a test basis, evidence supporting the amounts and disclosures in the financial statements, assessing the accounting principles used and significant estimates made by management, as well as evaluating the overall financial statement presentation. Our procedures included confirmation of securities owned as of October 31, 2007, by correspondence with the custodians and brokers; where replies were not received from brokers, we performed other auditing procedures. We believe that our audits provide a reasonable basis for our opinion.
In our opinion, the financial statements and financial highlights referred to above present fairly, in all material respects, the financial position of Fidelity International Small Cap Fund as of October 31, 2007, the results of its operations for the year then ended, the changes in its net assets for each of the two years in the period then ended, and its financial highlights for each of the four years in the period then ended and for the period from May 27, 2003 (commencement of operations) to October 31, 2003, in conformity with accounting principles generally accepted in the United States of America.
/s/ Deloitte & Touche LLP
DELOITTE & TOUCHE LLP
Boston, Massachusetts
December 21, 2007
Annual Report
Trustees and Officers
The Trustees, Members of the Advisory Board, and executive officers of the trust and fund, as applicable, are listed below. The Board of Trustees governs the fund and is responsible for protecting the interests of shareholders. The Trustees are experienced executives who meet periodically throughout the year to oversee the fund's activities, review contractual arrangements with companies that provide services to the fund, and review the fund's performance. Except for James C. Curvey, each of the Trustees oversees 370 funds advised by FMR or an affiliate. Mr. Curvey oversees 340 funds advised by FMR or an affiliate.
The Trustees hold office without limit in time except that (a) any Trustee may resign; (b) any Trustee may be removed by written instrument, signed by at least two-thirds of the number of Trustees prior to such removal; (c) any Trustee who requests to be retired or who has become incapacitated by illness or injury may be retired by written instrument signed by a majority of the other Trustees; and (d) any Trustee may be removed at any special meeting of shareholders by a two-thirds vote of the outstanding voting securities of the trust. Each Trustee who is not an interested person (as defined in the 1940 Act) (Independent Trustee), shall retire not later than the last day of the calendar year in which his or her 72nd birthday occurs. The Independent Trustees may waive this mandatory retirement age policy with respect to individual Trustees. The executive officers and Advisory Board Members hold office without limit in time, except that any officer and Advisory Board Member may resign or may be removed by a vote of a majority of the Trustees at any regular meeting or any special meeting of the Trustees. Except as indicated, each individual has held the office shown or other offices in the same company for the past five years.
The fund's Statement of Additional Information (SAI) includes more information about the Trustees. To request a free copy, call Fidelity at 1-877-208-0098.
Interested Trustees*:
Correspondence intended for each Trustee who is an interested person may be sent to Fidelity Investments, 82 Devonshire Street, Boston, Massachusetts 02109.
Name, Age; Principal Occupation |
Edward C. Johnson 3d (77) |
| Year of Election or Appointment: 1984 Mr. Johnson is Chairman of the Board of Trustees. Mr. Johnson serves as President (2006-present), Chief Executive Officer, Chairman, and a Director of FMR LLC; Chairman and a Director of FMR; Chairman and a Director of Fidelity Research & Analysis Company (FRAC); Chairman and a Director of Fidelity Investments Money Management, Inc.; and Chairman (2001-present) and a Director of FMR Co., Inc. In addition, Mr. Johnson serves as Chairman and Director of Fidelity International Limited (FIL). |
Name, Age; Principal Occupation |
James C. Curvey (72) |
| Year of Election or Appointment: 2007 Mr. Curvey also serves as Trustee (2007-present) or Member of the Advisory Board (2007-present) of other investment companies advised by FMR. Mr. Curvey is a Director of FMR and FMR Co., Inc. (2007- present). Mr. Curvey is also Vice Chairman (2006-present) and Director of FMR LLC. Mr. Curvey joined Fidelity in 1982 and served in numerous senior management positions, including President and Chief Operating Officer of FMR LLC (1997-2000) and President of Fidelity Strategic Investments (2000-2002). In addition, he serves as a member of the Board of Directors of Geerlings & Wade, Inc. (wine distribution). |
* Trustees have been determined to be "Interested Trustees" by virtue of, among other things, their affiliation with the trust or various entities under common control with FMR. FMR Corp. merged with FMR LLC on October 1, 2007. Any references to FMR LLC for prior periods are deemed to be references to the prior entity.
Independent Trustees:
Correspondence intended for each Independent Trustee (that is, the Trustees other than the Interested Trustees) may be sent to Fidelity Investments, P.O. Box 55235, Boston, Massachusetts 02205-5235.
Name, Age; Principal Occupation |
Dennis J. Dirks (59) |
| Year of Election or Appointment: 2005 Prior to his retirement in May 2003, Mr. Dirks was Chief Operating Officer and a member of the Board of The Depository Trust & Clearing Corporation (DTCC) (1999-2003). He also served as President, Chief Operating Officer, and Board member of The Depository Trust Company (DTC) (1999-2003) and President and Board member of the National Securities Clearing Corporation (NSCC) (1999-2003). In addition, Mr. Dirks served as Chief Executive Officer and Board member of the Government Securities Clearing Corporation (2001-2003) and Chief Executive Officer and Board member of the Mortgage-Backed Securities Clearing Corporation (2001-2003). Mr. Dirks also serves as a Trustee and a member of the Finance Committee of Manhattan College (2005-
present) and a Trustee and a member of the Finance Committee of AHRC of Nassau County (2006-present). |
Albert R. Gamper, Jr. (65) |
| Year of Election or Appointment: 2006 Prior to his retirement in December 2004, Mr. Gamper served as Chairman of the Board of CIT Group Inc. (commercial finance). During his tenure with CIT Group Inc. Mr. Gamper served in numerous senior management positions, including Chairman (1987-1989; 1999-2001; 2002-2004), Chief Executive Officer (1987-2004), and President (1989-2002). He currently serves as a member of the Board of Directors of Public Service Enterprise Group (utilities, 2001-present), Chairman of the Board of Governors, Rutgers University (2004-present), and Chairman of the Board of Saint Barnabas Health Care System. |
George H. Heilmeier (71) |
| Year of Election or Appointment: 2004 Dr. Heilmeier is Chairman Emeritus of Telcordia Technologies (communication software and systems), where prior to his retirement, he served as company Chairman and Chief Executive Officer. He currently serves on the Boards of Directors of The Mitre Corporation (systems engineering and information technology support for the government), and HRL Laboratories (private research and development, 2004-present). He is Chairman of the General Motors Science & Technology Advisory Board and a Life Fellow of the Institute of Electrical and Electronics Engineers (IEEE). Dr. Heilmeier is a member of the Defense Science Board and the National Security Agency Advisory Board. He is also a member of the National Academy of Engineering, the American Academy of Arts and Sciences, and the Board of Overseers of the School of Engineering and Applied Science of the University of Pennsylvania. Previously, Dr. Heilmeier served as a Director of TRW Inc. (automotive, space, defense, and information technology, 1992-2002), Compaq (1994-2002), Automatic Data Processing, Inc. (ADP) (technology-based business outsourcing, 1995-2002), INET Technologies Inc. (telecommunications network surveillance, 2001-2004), and Teletech Holdings (customer management services). He is the recipient of the 2005 Kyoto Prize in Advanced Technology for his invention of the liquid crystal display, and a member of the Consumer Electronics Hall of Fame. |
James H. Keyes (67) |
| Year of Election or Appointment: 2007 Prior to his retirement in 2003, Mr. Keyes was Chairman, President, and Chief Executive Officer of Johnson Controls, Inc. (automotive supplier, 1993-2003). He currently serves as a member of the boards of LSI Logic Corporation (semiconductor technologies), Navistar International Corporation (manufacture and sale of trucks, buses, and diesel engines, 2002-present), and Pitney Bowes, Inc. (integrated mail, messaging, and document management solutions). |
Marie L. Knowles (61) |
| Year of Election or Appointment: 2001 Prior to Ms. Knowles' retirement in June 2000, she served as Executive Vice President and Chief Financial Officer of Atlantic Richfield Company (ARCO) (diversified energy, 1996-2000). From 1993 to 1996, she was a Senior Vice President of ARCO and President of ARCO Transportation Company. She served as a Director of ARCO from 1996 to 1998. She currently serves as a Director of Phelps Dodge Corporation (copper mining and manufacturing) and McKesson Corporation (healthcare service, 2002-present). Ms. Knowles is a Trustee of the Brookings Institution and the Catalina Island Conservancy and also serves as a member of the Advisory Board for the School of Engineering of the University of Southern California. |
Ned C. Lautenbach (63) |
| Year of Election or Appointment: 2000 Mr. Lautenbach is Chairman of the Independent Trustees (2006-present). Mr. Lautenbach has been a partner of Clayton, Dubilier & Rice, Inc. (private equity investment firm) since September 1998. Previously, Mr. Lautenbach was with the International Business Machines Corporation (IBM) from 1968 until his retirement in 1998. Mr. Lautenbach serves as a Director of Sony Corporation (2006-present) and Eaton Corporation (diversified industrial) as well as the Philharmonic Center for the Arts in Naples, Florida. He also is a member of the Board of Trustees of Fairfield University (2005-present), as well as a member of the Council on Foreign Relations. |
Cornelia M. Small (63) |
| Year of Election or Appointment: 2005 Ms. Small is a member (2000-present) and Chairperson (2002-present) of the Investment Committee, and a member (2002-present) of the Board of Trustees of Smith College. Previously, she served as Chief Investment Officer (1999-2000), Director of Global Equity Investments (1996-1999), and a member of the Board of Directors of Scudder, Stevens & Clark (1990-1997) and Scudder Kemper Investments (1997-
1999). In addition, Ms. Small served as Co-Chair (2000-2003) of the Annual Fund for the Fletcher School of Law and Diplomacy. |
William S. Stavropoulos (68) |
| Year of Election or Appointment: 2001 Mr. Stavropoulos is Chairman Emeritus of the Board of Directors of The Dow Chemical Company. Since joining The Dow Chemical Company in 1967, Mr. Stavropoulos served in numerous senior management positions, including President (1993-2000; 2002-2003), CEO (1995-2000; 2002-2004), and Chairman of the Executive Committee (2000-2004). Currently, he is a Director of NCR Corporation (data warehousing and technology solutions), Chemical Financial Corporation, Maersk Inc. (industrial conglomerate, 2002-present), Tyco International, Inc. (multinational manufacturing and services, 2007-present), and a member of the Advisory Board for Metalmark Capital (private equity investment firm, 2005-present). He is a special advisor to Clayton, Dubilier & Rice, Inc., a private equity investment firm. He also serves as a member of the Board of Trustees of the American Enterprise Institute for Public Policy Research. In addition, Mr. Stavropoulos is a member of The Business Council, J.P. Morgan International Council and the University of Notre Dame Advisory Council for the College of Science. |
Kenneth L. Wolfe (68) |
| Year of Election or Appointment: 2005 Prior to his retirement in 2001, Mr. Wolfe was Chairman and Chief Executive Officer of Hershey Foods Corporation (1993-2001). He currently serves as a member of the boards of Adelphia Communications Corporation (2003-present), Bausch & Lomb, Inc., and Revlon Inc. (2004-present). |
Annual Report
Trustees and Officers - continued
Advisory Board Members and Executive Officers**:
Correspondence intended for Mr. Mauriello, Mr. Thomas, and Mr. Wiley may be sent to Fidelity Investments, P.O. Box 55235, Boston, Massachusetts 02205-5235. Correspondence intended for each executive officer and Mr. Lynch may be sent to Fidelity Investments, 82 Devonshire Street, Boston, Massachusetts 02109.
Peter S. Lynch (63) |
| Year of Election or Appointment: 2003 Member of the Advisory Board of Fidelity Investment Trust. Mr. Lynch is Vice Chairman and a Director of FMR, and Vice Chairman (2001-
present) and a Director of FMR Co., Inc. Previously, Mr. Lynch served as a Trustee of the Fidelity funds (1990-2003). In addition, he serves as a Trustee of Boston College and as the Chairman of the Inner-City Scholarship Fund. |
Joseph Mauriello (63) |
| Year of Election or Appointment: 2007 Member of the Advisory Board of Fidelity Investment Trust. Prior to his retirement in January 2006, Mr. Mauriello served in numerous senior management positions including Deputy Chairman and Chief Operating Officer (2004-2005), and Vice Chairman of Financial Services (2002-
2004) of KPMG LLP US (professional services firm, 1965-2005). Mr. Mauriello currently serves as a member of the Board of Directors of XL Capital Ltd., (global insurance and re-insurance company, 2006-
present) and of Arcadia Resources Inc., (health care services and products, 2007-present). He also served as a Director of the Hamilton Funds of the Bank of New York (2006-2007). |
David M. Thomas (58) |
| Year of Election or Appointment: 2007 Member of the Advisory Board of Fidelity Investment Trust. Previously, Mr. Thomas served as Executive Chairman (2005-2006) and Chairman and Chief Executive Officer (2000-2005) of IMS Health, Inc. (pharmaceutical and healthcare information solutions). In addition, Mr. Thomas serves as a member of the Board of Directors of Fortune Brands, Inc. (consumer products holding company), and Interpublic Group of Companies, Inc. (marketing communication, 2004-present). |
Michael E. Wiley (57) |
| Year of Election or Appointment: 2007 Member of the Advisory Board of Fidelity Investment Trust. Mr. Wiley also serves as Sr. Energy Advisor of Katzenbach Partners, LLC (consulting firm, 2006-present) and a member of the Board of Trustees of the University of Tulsa (2000-2006; 2007-present). He serves as a Director of Tesoro Corporation (independent oil refiner and marketer, 2005-
present), and a Director of Bill Barrett Corporation (exploration and production company, 2005-present). In addition, he also serves as a Director of Post Oak Bank (privately-held bank, 2004-present), and an Advisory Director of Riverstone Holdings (private investment firm). Previously, Mr. Wiley served as Chairman, President, and CEO of Baker Hughes, Inc. (oilfield services company, 2000-2004), and as Director of Spinnaker Exploration Company (exploration and production company, 2001-2005). |
Kimberley H. Monasterio (43) |
| Year of Election or Appointment: 2007 President and Treasurer of the fund. Ms. Monasterio also serves as President and Treasurer of other Fidelity funds (2007-present) and is an employee of FMR (2004-present). Previously, Ms. Monasterio served as Deputy Treasurer of the Fidelity funds (2004-2006). Before joining Fidelity Investments, Ms. Monasterio served as Treasurer (2000-2004) and Chief Financial Officer (2002-2004) of the Franklin Templeton Funds and Senior Vice President of Franklin Templeton Services, LLC (2000-2004). |
Walter C. Donovan (45) |
| Year of Election or Appointment: 2007 Vice President of the fund. Mr. Donovan also serves as Vice President of Fidelity's Equity Funds (2007-present). Mr. Donovan also serves as Executive Vice President of FMR (2005-present) and FMR Co., Inc. (2005-present). Previously, Mr. Donovan served as Vice President of Fidelity's High Income Funds (2005-2007), Fixed-Income Funds (2005-
2006), certain Asset Allocation Funds (2005-2006), certain Balanced Funds (2005-2006), and as Vice President and Director of Fidelity's International Equity Trading group (1998-2005). |
Eric M. Wetlaufer (45) |
| Year of Election or Appointment: 2006 Vice President of the fund. Mr. Wetlaufer also serves as Vice President of certain International Equity Funds (2006-present). Mr. Wetlaufer is Senior Vice President of FMR (2006-present) and FMR Co., Inc. (2006-
present), and President and Director of Fidelity Management & Research (U.K.) Inc. (2006-present) and Fidelity Research & Analysis Company (2006-present). Before joining Fidelity Investments in 2005, Mr. Wetlaufer was a partner in Oxhead Capital Management (2004-
2005). Previously, Mr. Wetlaufer served as a Chief Investment Officer of Putnam Investments (1997-2003). |
Eric D. Roiter (58) |
| Year of Election or Appointment: 2002 Secretary of the fund. He also serves as Secretary of other Fidelity funds; Vice President, General Counsel, and Secretary of FMR Co., Inc. (2001-present) and FMR; Assistant Secretary of Fidelity Management & Research (U.K.) Inc. (2001-present), Fidelity Research & Analysis Company (2001-present), and Fidelity Investments Money Management, Inc. (2001-present). Mr. Roiter is an Adjunct Member, Faculty of Law, at Boston College Law School (2003-present). Previously, Mr. Roiter served as Vice President and Secretary of Fidelity Distributors Corporation (FDC) (1998-2005). |
Scott C. Goebel (39) |
| Year of Election or Appointment: 2007 Assistant Secretary of the fund. Mr. Goebel also serves as Assistant Secretary of other Fidelity funds (2007-present), and is an employee of FMR. |
R. Stephen Ganis (41) |
| Year of Election or Appointment: 2006 Anti-Money Laundering (AML) officer of the fund. Mr. Ganis also serves as AML officer of other Fidelity funds (2006-present) and FMR LLC (2003-present). Before joining Fidelity Investments, Mr. Ganis practiced law at Goodwin Procter, LLP (2000-2002). |
Joseph B. Hollis (59) |
| Year of Election or Appointment: 2006 Chief Financial Officer of the fund. Mr. Hollis also serves as Chief Financial Officer of other Fidelity funds. Mr. Hollis is President of Fidelity Pricing and Cash Management Services (FPCMS) (2005-present). Mr. Hollis also serves as President and Director of Fidelity Service Company, Inc. (2006-present). Previously, Mr. Hollis served as Senior Vice President of Cash Management Services (1999-2002) and Investment Management Operations (2002-2005). |
Kenneth A. Rathgeber (60) |
| Year of Election or Appointment: 2004 Chief Compliance Officer of the fund. Mr. Rathgeber also serves as Chief Compliance Officer of other Fidelity funds (2004-present) and Executive Vice President of Risk Oversight for Fidelity Investments (2002-
present). He is Chief Compliance Officer of FMR (2005-present), FMR Co., Inc. (2005-present), Fidelity Management & Research (U.K.) Inc. (2005-present), Fidelity Research & Analysis Company (2005-present), Fidelity Investments Money Management, Inc. (2005-present), and Strategic Advisers, Inc. (2005-present). Previously, Mr. Rathgeber served as Executive Vice President and Chief Operating Officer for Fidelity Investments Institutional Services Company, Inc. (1998-2002). |
Bryan A. Mehrmann (46) |
| Year of Election or Appointment: 2005 Deputy Treasurer of the fund. Mr. Mehrmann also serves as Deputy Treasurer of other Fidelity funds (2005-present) and is an employee of FMR. Previously, Mr. Mehrmann served as Vice President of Fidelity Investments Institutional Services Group (FIIS)/Fidelity Investments Institutional Operations Corporation, Inc. (FIIOC) Client Services (1998-2004). |
Kenneth B. Robins (38) |
| Year of Election or Appointment: 2005 Deputy Treasurer of the fund. Mr. Robins also serves as Deputy Treasurer of other Fidelity funds (2005-present) and is an employee of FMR (2004-present). Before joining Fidelity Investments, Mr. Robins worked at KPMG LLP, where he was a partner in KPMG's department of professional practice (2002-2004) and a Senior Manager (1999-2000). In addition, Mr. Robins served as Assistant Chief Accountant, United States Securities and Exchange Commission (2000-2002). |
Robert G. Byrnes (40) |
| Year of Election or Appointment: 2005 Assistant Treasurer of the fund. Mr. Byrnes also serves as Assistant Treasurer of other Fidelity funds (2005-present) and is an employee of FMR (2005-present). Previously, Mr. Byrnes served as Vice President of FPCMS (2003-2005). Before joining Fidelity Investments, Mr. Byrnes worked at Deutsche Asset Management where he served as Vice President of the Investment Operations Group (2000-2003). |
Peter L. Lydecker (53) |
| Year of Election or Appointment: 2004 Assistant Treasurer of the fund. Mr. Lydecker also serves as Assistant Treasurer of other Fidelity funds (2004) and is an employee of FMR. |
Paul M. Murphy (60) |
| Year of Election or Appointment: 2007 Assistant Treasurer of the fund. Mr. Murphy also serves as Assistant Treasurer of other Fidelity funds (2007-present) and is an employee of FMR (2007-present). Previously, Mr. Murphy served as Chief Financial Officer of the Fidelity Funds (2005-2006), Vice President and Associate General Counsel of FMR (2007), and Senior Vice President of Fidelity Pricing and Cash Management Services Group (FPCMS) (1994-2007). |
Gary W. Ryan (49) |
| Year of Election or Appointment: 2005 Assistant Treasurer of the fund. Mr. Ryan also serves as Assistant Treasurer of other Fidelity funds (2005-present) and is an employee of FMR (2005-present). Previously, Mr. Ryan served as Vice President of Fund Reporting in FPCMS (1999-2005). |
** FMR Corp. merged with FMR LLC on October 1, 2007. Any references to FMR LLC for prior periods are deemed to be references to the prior entity.
Annual Report
Distributions
The Board of Trustees of Advisor International Small Cap Fund voted to pay on December 10, 2007, to shareholders of record at the opening of business on December 7, 2007, a distribution of $5.176 per share derived from capital gains realized from sales of portfolio securities and a dividend of $.12 per share from net investment income.
The fund hereby designates as a capital gain dividend with respect to the taxable year ended October 31, 2007, $221,145,898, or, if subsequently determined to be different, the net capital gain of such year.
The amounts per share which represent income derived from sources within, and taxes paid to, foreign countries or possessions of the United States are $0.325 and $0.0270 for the dividend paid December 11, 2006.
The fund will notify shareholders in January 2008 of amounts for use in preparing 2007 income tax returns.
Annual Report
Board Approval of Investment Advisory Contracts and Management Fees
Fidelity International Small Cap Fund
Each year, typically in July, the Board of Trustees, including the Independent Trustees (together, the Board), votes on the renewal of the management contract and sub-advisory agreements (together, the Advisory Contracts) for the fund. The Board, assisted by the advice of fund counsel and Independent Trustees' counsel, requests and considers a broad range of information throughout the year.
The Board meets regularly each month except August and takes into account throughout the year matters bearing on Advisory Contracts. The Board, acting directly and through its separate committees, considers at each of its meetings factors that are relevant to the annual renewal of the fund's Advisory Contracts, including the services and support provided to the fund and its shareholders. At the time of the renewal, the Board had 12 standing committees, each composed of Independent Trustees with varying backgrounds, to which the Board has assigned specific subject matter responsibilities in order to enhance effective decision-making by the Board. Each committee has adopted a written charter outlining the structure and purposes of the committee. One such committee, the Equity Contract Committee, meets periodically as needed throughout the year to consider matters specifically related to the annual renewal of Advisory Contracts. The committee requests and receives information on, and makes recommendations to the Independent Trustees concerning, the approval and annual review of the Advisory Contracts.
At its July 2007 meeting, the Board of Trustees, including the Independent Trustees, unanimously determined to renew the Advisory Contracts for the fund. In reaching its determination, the Board considered all factors it believed relevant, including (i) the nature, extent, and quality of the services to be provided to the fund and its shareholders (including the investment performance of the fund); (ii) the competitiveness of the management fee and total expenses of the fund; (iii) the total costs of the services to be provided by and the profits to be realized by the investment adviser and its affiliates from the relationship with the fund; (iv) the extent to which economies of scale would be realized as the fund grows; and (v) whether fee levels reflect these economies of scale, if any, for the benefit of fund shareholders. The Board also approved amendments to the fund's agreements with foreign sub-advisers to clarify that each sub-adviser provides services as an independent contractor.
In determining whether to renew the Advisory Contracts for the fund, the Board ultimately reached a determination, with the assistance of fund counsel and Independent Trustees' counsel, that the renewal of the Advisory Contracts and the compensation to be received by Fidelity under the management contract is consistent with Fidelity's fiduciary duty under applicable law. In addition to evaluating the specific factors noted above, the Board, in reaching its determination, is aware that shareholders in the fund have a broad range of investment choices available to them, including a wide choice among mutual funds offered by competitors to Fidelity, and that the fund's shareholders, with the opportunity to review and weigh the disclosure provided by the fund in its prospectus and other public disclosures, have chosen to invest in this fund, managed by Fidelity.
Annual Report
Board Approval of Investment Advisory Contracts and
Management Fees - continued
Nature, Extent, and Quality of Services Provided. The Board considered staffing within the investment adviser, FMR, and the sub-advisers (together, the Investment Advisers), including the backgrounds of the fund's portfolio managers and the fund's investment objective and discipline. The Independent Trustees also had discussions with senior management of Fidelity's investment operations and investment groups. The Board considered the structure of the portfolio manager compensation program and whether this structure provides appropriate incentives.
Resources Dedicated to Investment Management and Support Services. The Board reviewed the size, education, and experience of the Investment Advisers' investment staff, their use of technology, and the Investment Advisers' approach to recruiting, training, and retaining portfolio managers and other research, advisory, and management personnel. The Board considered Fidelity's extensive global research capabilities that enable the Investment Advisers to aggregate data from various sources in an effort to produce positive investment results. The Board noted that Fidelity's analysts have access to a variety of technological tools that enable them to perform both fundamental and quantitative analysis and to specialize in various disciplines. The Board also considered that Fidelity's portfolio managers and analysts have access to daily portfolio attribution that allows for monitoring of a fund's portfolio, as well as an electronic communication system that provides immediate real-time access to research concerning issuers and credit enhancers.
Shareholder and Administrative Services. The Board considered (i) the nature, extent, quality, and cost of advisory, administrative, distribution, and shareholder services performed by the Investment Advisers and their affiliates under the Advisory Contracts and under separate agreements covering transfer agency, pricing and bookkeeping, and securities lending services for the fund; (ii) the nature and extent of the Investment Advisers' supervision of third party service providers, principally custodians and subcustodians; and (iii) the resources devoted to, and the record of compliance with, the fund's compliance policies and procedures. The Board reviewed the allocation of fund brokerage, including allocations to brokers affiliated with the Investment Advisers, the use of brokerage commissions to pay fund expenses, and the use of "soft" commission dollars to pay for research services. The Board also considered that Fidelity voluntarily pays for market data out of its own resources. The Board also considered the agreement reached between the Independent Trustees and Fidelity in December 2006 following an independent review of matters relating to receipt of travel, entertainment, gifts and gratuities in violation of Fidelity policies.
Annual Report
The Board noted that the growth of fund assets across the complex allows Fidelity to reinvest in the development of services designed to enhance the value or convenience of the Fidelity funds as investment vehicles. These services include 24-hour access to account information and market information through phone representatives and over the Internet, and investor education materials and asset allocation tools.
Investment in a Large Fund Family. The Board considered the benefits to shareholders of investing in a Fidelity fund, including the benefits of investing in a fund that is part of a large family of funds offering a variety of investment disciplines and providing for a large variety of mutual fund investor services. For example, fund shareholders are offered the privilege of exchanging shares of the fund for shares of other Fidelity funds, as set forth in the fund's prospectus, without paying a sales charge. The Board noted that, since the last Advisory Contract renewals in July 2006, Fidelity has taken a number of actions that benefited particular funds, including (i) dedicating additional resources to investment research and to restructure the investment research teams; (ii) contractually agreeing to reduce the management fee on Fidelity Advisor Floating Rate High Income Fund; (iii) contractually agreeing to reduce the management fees on Fidelity's California, Massachusetts, New Jersey, and New York AMT Tax-Free Money Market Funds, launching new Institutional Classes and Service Classes of these funds, and contractually agreeing to impose expense limitations on these funds; (iv) eliminating the exchange fee on the Fidelity Select Portfolios and reducing the pricing and bookkeeping fee rates for these funds; (v) reducing the maximum transfer agency fee rates on high income funds and certain equity funds; (vi) proposing amended management contracts that, if approved by shareholders, will add a performance adjustment component to the management fees paid by 18 Fidelity Advisor equity funds; (vii) contractually agreeing to reduce fees for Ultra-Short Central Fund and the money market Central Funds; (viii) waiving the Fidelity Advisor funds' contingent deferred sales charge on certain redemptions made through systematic withdrawal programs; and (ix) amending the management contracts for equity and fixed-income funds whose management contracts incorporate a "group fee" structure by adding four new fee "breakpoints" to the group fee rate schedules.
Investment Performance and Compliance. The Board considered whether the fund has operated within its investment objective, as well as its record of compliance with its investment restrictions. It also reviewed the fund's absolute investment performance for each class, as well as the fund's relative investment performance for each class measured against (i) a broad-based securities market index, and (ii) a peer group of mutual funds deemed appropriate by the Board over multiple periods. Because the fund had been in existence less than five calendar years, the following charts considered by the Board show, over the one- and three-year periods ended December 31, 2006, the cumulative total returns of Fidelity International Small Cap (retail class) and Class B of the fund, the cumulative total returns of a broad-based securities market index ("benchmark"), and a range of cumulative total returns of a peer group of mutual funds identified by Lipper Inc. as having an investment objective similar to that of the fund. The returns of Fidelity International Small Cap (retail class) and Class B show the performance of the highest and lowest performing classes, respectively (based on three-year performance). The box within each chart shows the 25th percentile return (bottom of box) and the 75th percentile return (top of box) of the peer group. Returns shown above the box are in the first quartile and returns shown below the box are in the fourth quartile. The percentage beaten numbers noted below each chart correspond to the percentile box and represent the percentage of funds in the peer group whose performance was equal to or lower than that of the class indicated.
Annual Report
Board Approval of Investment Advisory Contracts and
Management Fees - continued
Fidelity International Small Cap Fund

The Board reviewed the fund's relative investment performance against its peer group and stated that the performance of Fidelity International Small Cap (retail class) was in the fourth quartile for the one-year period and the third quartile for the three-year period. The Board also stated that the investment performance of the fund was lower than its benchmark for all the periods shown. The Board considered that the variations in performance among the fund's classes reflect the variations in class expenses, which result in lower performance for higher expense classes. The Board discussed with FMR actions to be taken by FMR to improve the fund's disappointing performance relative to its peer group. The Board will continue to closely monitor the performance of the fund in the coming year.
The Board also considered that the fund's management fee is subject to upward or downward adjustment depending upon whether, and to what extent, the fund's investment performance for the performance period exceeds, or is exceeded by, the record (over the same period) of a Board-approved performance adjustment index. The Board realizes that the performance adjustment provides FMR with a strong economic incentive to seek to achieve superior performance for the fund's shareholders and helps to more closely align the interests of FMR and the fund's shareholders.
Annual Report
The Board considered that FMR has taken steps to refocus and strengthen equity research, equity portfolio management, and compliance.
Based on its review, and giving particular weight to the nature and quality of the resources dedicated by the Investment Advisers to maintain and improve relative performance, the Board concluded that the nature, extent, and quality of the services provided to the fund will benefit the fund's shareholders, particularly in light of the Board's view that the fund's shareholders benefit from investing in a fund that is part of a large family of funds offering a variety of investment disciplines and services.
Competitiveness of Management Fee and Total Fund Expenses. The Board considered the fund's management fee and total expenses compared to "mapped groups" of competitive funds and classes. Fidelity creates "mapped groups" by combining similar Lipper investment objective categories that have comparable management fee characteristics. Combining Lipper investment objective categories aids the Board's management fee and total expense comparisons by broadening the competitive group used for comparison and by reducing the number of universes to which various Fidelity funds are compared. The Board also considered supplemental information about how the fund's management fee and total expenses ranked relative to groups based on Lipper classifications, which take into account a fund's market capitalization and style.
The Board considered two proprietary management fee comparisons for the 12-month (or shorter) periods shown in the chart below. The group of Lipper funds used by the Board for management fee comparisons is referred to below as the "Total Mapped Group" and, for the reasons explained above, is broader than the Lipper peer group used by the Board for performance comparisons. The Total Mapped Group comparison focuses on a fund's standing relative to the total universe of comparable funds available to investors, in terms of gross management fees before expense reimbursements or caps, and without giving effect to the fund's performance adjustment. "TMG %" represents the percentage of funds in the Total Mapped Group that had management fees that were lower than the fund's. For example, a TMG % of 23% means that 77% of the funds in the Total Mapped Group had higher management fees than the fund. The "Asset-Size Peer Group" (ASPG) comparison focuses on a fund's standing relative to non-Fidelity funds similar in size to the fund within the Total Mapped Group. The ASPG represents at least 15% of the funds in the Total Mapped Group with comparable asset size and management fee characteristics, subject to a minimum of 50 funds (or all funds in the Total Mapped Group if fewer than 50). Additional information, such as the ASPG quartile in which the fund's management fee ranked and the impact of the fund's performance adjustment, is also included in the chart and considered by the Board.
Annual Report
Board Approval of Investment Advisory Contracts and
Management Fees - continued
Fidelity International Small Cap Fund

The Board noted that the fund's management fee ranked below the median of its Total Mapped Group and below the median of its ASPG for 2006. The Board also noted the effect of the fund's positive performance adjustment on the fund's management fee ranking. The Board noted that the performance adjustment for each year represents calculations for performance periods that differ from the periods shown in the performance charts above.
Based on its review, the Board concluded that the fund's management fee was fair and reasonable in light of the services that the fund receives and the other factors considered.
In its review of each class's total expenses, the Board considered the fund's management fee as well as other fund or class expenses, as applicable, such as transfer agent fees, pricing and bookkeeping fees, fund-paid 12b-1 fees, and custodial, legal, and audit fees. The Board also noted the effects of any waivers and reimbursements on fees and expenses, as well as the fund's positive performance adjustment. As part of its review, the Board also considered current and historical total expenses of each class of the fund compared to competitive fund median expenses. Each class of the fund is compared to those funds and classes in the Total Mapped Group (used by the Board for management fee comparisons) that have a similar sales load structure.
The Board noted that the total expenses of each of Class A, Class B, Class C, Institutional Class and Fidelity International Small Cap (retail class) ranked below its competitive median for 2006, and the total expenses of Class T ranked above its competitive median for 2006. The Board noted that the fund offers multiple classes, each of which has a different sales load and 12b-1 fee structure, and that the multiple structures are intended to offer a range of pricing options for the intermediary market. The Board also noted that the total expenses of the classes vary primarily by the level of their 12b-1 fees, although differences in transfer agent fees may also cause expenses to vary from class to class.
Annual Report
In its review of total expenses, the Board also considered Fidelity fee structures and other information on clients that FMR and its affiliates service in other competitive markets, such as other mutual funds advised or subadvised by FMR or its affiliates, pension plan clients, and other institutional clients.
Based on its review, the Board concluded that the total expenses of each class of the fund were reasonable, although in one case above the median of the universe presented for comparison, in light of the services that the fund and its shareholders receive and the other factors considered.
Costs of the Services and Profitability. The Board considered the revenues earned and the expenses incurred by Fidelity in conducting the business of developing, marketing, distributing, managing, administering and servicing the fund and its shareholders. The Board also considered the level of Fidelity's profits in respect of all the Fidelity funds.
On an annual basis, FMR presents to the Board Fidelity's profitability for the fund. Fidelity calculates the profitability for each fund, as well as aggregate profitability for groups of Fidelity funds and all Fidelity funds, using a series of detailed revenue and cost allocation methodologies which originate with the audited books and records of Fidelity. The Audit Committee of the Board reviews any significant changes from the prior year's methodologies.
PricewaterhouseCoopers LLP (PwC), independent registered public accounting firm and auditor to Fidelity and certain Fidelity funds, has been engaged annually by the Board as part of the Board's assessment of the results of Fidelity's profitability analysis. PwC's engagement includes the review and assessment of Fidelity's methodologies used in determining the revenues and expenses attributable to Fidelity's mutual fund business, and completion of agreed-upon procedures surrounding the mathematical accuracy of fund profitability and its conformity to allocation methodologies. After considering PwC's reports issued under the engagement and information provided by Fidelity, the Board believes that while other allocation methods may also be reasonable, Fidelity's profitability methodologies are reasonable in all material respects.
The Board has also reviewed Fidelity's non-fund businesses and any fall-out benefits related to the mutual fund business as well as cases where Fidelity's affiliates may benefit from or be related to the fund's business.
Annual Report
Board Approval of Investment Advisory Contracts and
Management Fees - continued
The Board considered the costs of the services provided by and the profits realized by Fidelity in connection with the operation of the fund and determined that the amount of profit is a fair entrepreneurial profit for the management of the fund.
Economies of Scale. The Board considered whether there have been economies of scale in respect of the management of the Fidelity funds, whether the Fidelity funds (including the fund) have appropriately benefited from any such economies of scale, and whether there is potential for realization of any further economies of scale. The Board considered the extent to which the fund will benefit from economies of scale through increased services to the fund, through waivers or reimbursements, or through fee or expense reductions, including reductions that occur through operation of the transfer agent agreement. The transfer agent fee varies in part based on the number of accounts in the fund. If the number of accounts decreases or the average account size increases, the overall transfer agent fee rate decreases.
The Board recognized that the fund's management contract incorporates a "group fee" structure, which provides for lower group fee rates as total fund assets under FMR's management increase, and for higher group fee rates as total fund assets under FMR's management decrease. FMR determines the group fee rates based on a tiered asset "breakpoint" schedule. In connection with the renewal of the fund's management contract, the Board approved amendments to the fund's management contract that added four new fee breakpoints to the group fee rate schedule for assets under FMR's management above $1,386 billion. The Board considered that the group fee rate declines under both the present and amended schedules, but that under the amended schedule, the group fee rate declines faster as assets under FMR's management exceed $1,386 billion. The Board considered that the group fee is designed to deliver the benefits of economies of scale to fund shareholders when total fund assets increase, even if assets of any particular fund are unchanged or have declined, because some portion of Fidelity's costs are attributable to services provided to all Fidelity funds, and all funds benefit if those costs can be allocated among more assets. The Board also considered that although the fund is partially closed to new investors, it continues to incur investment management expenses, and marketing and distribution expenses related to the retention of existing shareholders and assets. The Board further noted that the fund may continue to realize benefits from the group fee structure, even though assets may not be expected to grow significantly at the fund level. The Board concluded that, given the group fee structure, fund shareholders will achieve a certain level of economies of scale as assets under FMR's management increase at the fund complex level, regardless of whether Fidelity achieves any such economies of scale.
The Board further concluded that any potential economies of scale are being shared between fund shareholders and Fidelity in an appropriate manner.
Annual Report
Additional Information Requested by the Board. In order to develop fully the factual basis for consideration of the Fidelity funds' Advisory Contracts, the Board requested and received additional information on several topics, including (i) fund performance trends and actions to be taken by FMR to improve certain funds' overall performance; (ii) Fidelity's portfolio manager compensation structure, including its effects on fund profitability and the extent to which portfolio manager compensation is linked to fund performance; (iii) Fidelity's fee structures; (iv) the funds' sub-advisory arrangements; and (v) accounts managed by Fidelity other than the Fidelity funds.
Based on its evaluation of all of the conclusions noted above, and after considering all material factors, the Board ultimately concluded that the advisory fee structures are fair and reasonable, and that the fund's Advisory Contracts should be renewed.
Annual Report
Annual Report
Investment Adviser
Fidelity Management & Research Company
Boston, MA
Investment Sub-Advisers
FMR Co., Inc.
Fidelity Management & Research
(U.K.) Inc.
Fidelity Research & Analysis
Company
Fidelity International
Investment Advisors
Fidelity Investments Japan Limited
Fidelity International Investment Advisors (U.K.) Limited
General Distributor
Fidelity Distributors Corporation
Boston, MA
Transfer and Service Agents
Fidelity Investments Institutional Operations Company, Inc.
Boston, MA
Fidelity Service Company, Inc.
Boston, MA
Custodian
Mellon Bank
Pittsburgh, PA
AISCI-UANN-1207
1.793572.104
(Fidelity Investment logo)(registered trademark)
Corporate Headquarters
82 Devonshire St., Boston, MA 02109
www.fidelity.com
Fidelity®
International Small Cap Opportunities
Fund
Annual Report
October 31, 2007
(2_fidelity_logos) (Registered_Trademark)
Contents
Chairman's Message | <Click Here> | Ned Johnson's message to shareholders. |
Performance | <Click Here> | How the fund has done over time. |
Management's Discussion | <Click Here> | The manager's review of fund performance, strategy and outlook. |
Shareholder Expense Example | <Click Here> | An example of shareholder expenses. |
Investment Changes | <Click Here> | A summary of major shifts in the fund's investments over the past six months. |
Investments | <Click Here> | A complete list of the fund's investments with their market values. |
Financial Statements | <Click Here> | Statements of assets and liabilities, operations, and changes in net assets,
as well as financial highlights. |
Notes | <Click Here> | Notes to the financial statements. |
Report of Independent Registered Public Accounting Firm | <Click Here> | |
Trustees and Officers | <Click Here> | |
Distributions | <Click Here> | |
Board Approval of Investment Advisory Contracts and Management Fees | <Click Here> | |
To view a fund's proxy voting guidelines and proxy voting record for the 12-month period ended June 30, visit http://www.fidelity.com (see "proxy voting guidelines") or visit the Securities and Exchange Commission's (SEC) web site at http://www.sec.gov. You may also call 1-800-544-8544 to request a free copy of the proxy voting guidelines.
Standard & Poor's, S&P and S&P 500 are registered service marks of The McGraw-Hill Companies, Inc. and have been licensed for use by Fidelity Distributors Corporation.
Other third party marks appearing herein are the property of their respective owners.
All other marks appearing herein are registered or unregistered trademarks or service marks of FMR LLC or an affiliated company.
Annual Report
This report and the financial statements contained herein are submitted for the general information of the shareholders of the fund. This report is not authorized for distribution to prospective investors in the fund unless preceded or accompanied by an effective prospectus.
A fund files its complete schedule of portfolio holdings with the SEC for the first and third quarters of each fiscal year on Form N-Q. Forms N-Q are available on the SEC's web site at http://www.sec.gov. A fund's Forms N-Q may be reviewed and copied at the SEC's Public Reference Room in Washington, DC. Information regarding the operation of the SEC's Public Reference Room may be obtained by calling 1-800-SEC-0330. For a complete list of a fund's portfolio holdings, view the most recent holdings listing, semiannual report, or annual report on Fidelity's web site at http://www.fidelity.com or http://www.advisor.fidelity.com, as applicable.
NOT FDIC INSURED · MAY LOSE VALUE · NO BANK GUARANTEE
Neither the fund nor Fidelity Distributors Corporation is a bank.
Annual Report
Chairman's Message
(photo_of_Edward_C_Johnson_3d)
Dear Shareholder:
Many stock and bond markets around the world have been unsettled of late; however, volatility can often lead to opportunity for patient investors. Financial markets are always unpredictable, but there are a number of time-tested principles that can put the historical odds in your favor.
One of the basic tenets is to invest for the long term. Over time, riding out the markets' inevitable ups and downs has proven much more effective than selling into panic or chasing the hottest trend. Even missing only a few of the markets' best days can significantly diminish investor returns. Patience also affords the benefits of compounding - of earning interest on additional income or reinvested dividends and capital gains. There are tax advantages and cost benefits to consider as well. The more you sell, the more taxes you pay, and the more you trade, the higher the costs. While staying the course doesn't eliminate risk, it can considerably lessen the effect of short-term declines.
You can further manage your investing risk through diversification. And today, more than ever, geographic diversification should be taken into account. Studies indicate that asset allocation is the single most important determinant of a portfolio's long-term success. The right mix of stocks, bonds and cash - aligned to your particular risk tolerance and investment objective - is very important. Age-appropriate rebalancing is also an essential aspect of asset allocation. For younger investors, an emphasis on equities - which historically have been the best-performing asset class over time - is encouraged. As investors near their specific goal, such as retirement or sending a child to college, consideration may be given to replacing volatile assets (e.g. common stocks) with more-stable fixed investments (bonds or savings plans).
A third investment principle - investing regularly - can help lower the average cost of your purchases. Investing a certain amount of money each month or quarter helps ensure you won't pay for all your shares at market highs. This strategy - known as dollar cost averaging - also reduces unconstructive "emotion" from investing, helping shareholders avoid selling weak performers just prior to an upswing, or chasing a hot performer just before a correction.
We invite you to contact us via the Internet, through our Investor Centers or over the phone. It is our privilege to provide you the information you need to make the investments that are right for you.
Sincerely,
/s/Edward C. Johnson 3d
Edward C. Johnson 3d
Annual Report
Performance: The Bottom Line
Average annual total return reflects the change in the value of an investment, assuming reinvestment of the class' dividend income and capital gains (the profits earned upon the sale of securities that have grown in value) and assuming a constant rate of performance each year. The $10,000 table and the fund's returns do not reflect the deduction of taxes that a shareholder would pay on fund distributions or the redemption of fund shares. During periods of reimbursement by Fidelity, a fund's total return will be greater than it would be had the reimbursement not occurred. How a fund did yesterday is no guarantee of how it will do tomorrow.
Average Annual Total Returns
Periods ended October 31, 2007 | Past 1
year | Life of Fund A |
International Small Cap Opportunities | 34.15% | 33.36% |
A From August 2, 2005
$10,000 Over Life of Fund
Let's say hypothetically that $10,000 was invested in International Small Cap Opportunities, a class of the fund, on August 2, 2005, when the fund started. The chart shows how the value of your investment would have changed, and also shows how the Morgan Stanley Capital InternationalSM Europe, Australasia, Far East (MSCI® EAFE®) Small Cap Index performed over the same period.
Annual Report
Management's Discussion of Fund Performance
Comments from Andrew Sassine, Portfolio Manager of Fidelity® International Small Cap Opportunities Fund
Foreign stocks, with a large assist from a weak U.S. dollar, generally had higher returns for U.S. investors than domestic equities during the 12-month period ending October 31, 2007. The backdrop for global stocks was solid, with robust economic growth and relatively high corporate profitability worldwide. Developed international equity markets, as measured by the Morgan Stanley Capital InternationalSM Europe, Australasia, and Far East (MSCI® EAFE®) Index - a performance monitor of established markets outside the United States and Canada - rose 25.09%. In comparison, the Standard & Poor's 500SM Index, a gauge of U.S. stocks, was up 14.56%. Among countries making up at least 1% of the EAFE benchmark, Finland had the best showing, soaring nearly 69%, while Hong Kong gained roughly 66%. The United Kingdom and Japan, the two largest components of the index, both underperformed. Fallout from the credit crunch and concerns about export growth tempered UK stocks, while Japan struggled with a slowdown in consumer spending and sluggish domestic growth. Emerging markets were the period's big winners, advancing 68.33% as measured by the MSCI Emerging Markets index.
International Small Cap Opportunities gained 34.15% for the period, well ahead of the 22.17% return of the MSCI EAFE Small Cap index. Productive stock selection drove most of the fund's outperformance. An overweighting in Germany, combined with particularly good stock selection in the industrials sector there, contributed nicely to relative performance. The fund's stakes in German capital goods firms GEA Group, a diversified engineering company, and Q-Cells, a manufacturer of solar cells, contributed nicely to the fund's significant outperformance. Favorable stock selection within our large exposure to Japan also drove the fund's upward momentum, with our holdings there returning 7.46%, compared with a 2.17% decline for the benchmark's constituent elements. Other contributors included Lihir Gold, a Papua New Guinea-based producer, which benefited from an increase in gold prices; and Nintendo, the Japanese video game maker. Unfavorable stock selection within financials, especially in diversified financials and real estate, detracted from relative performance. Among the detractors were KK daVinci Advisors, a property investment advisory business in Japan, and Soitec, a French semiconductor company, which was the fund's single-largest relative detractor during the period.
The views expressed above reflect those of the portfolio manager(s) only through the end of the period as stated on the cover of this report and do not necessarily represent the views of Fidelity or any other person in the Fidelity organization. Any such views are subject to change at any time based upon market or other conditions and Fidelity disclaims any responsibility to update such views. These views may not be relied on as investment advice and, because investment decisions for a Fidelity fund are based on numerous factors, may not be relied on as an indication of trading intent on behalf of any Fidelity fund.
Annual Report
Shareholder Expense Example
As a shareholder of the Fund, you incur two types of costs: (1) transaction costs, including sales charges (loads) on purchase payments or redemption proceeds, redemption fees, and (2) ongoing costs, including management fees, distribution and/or service (12b-1) fees and other Fund expenses. This Example is intended to help you understand your ongoing costs (in dollars) of investing in the Fund and to compare these costs with the ongoing costs of investing in other mutual funds.
The Example is based on an investment of $1,000 invested at the beginning of the period and held for the entire period (May 1, 2007 to October 31, 2007).
Actual Expenses
The first line of the accompanying table for each class of the Fund provides information about actual account values and actual expenses. You may use the information in this line, together with the amount you invested, to estimate the expenses that you paid over the period. Simply divide your account value by $1,000.00 (for example, an $8,600 account value divided by $1,000.00 = 8.6), then multiply the result by the number in the first line for a class of the Fund under the heading entitled "Expenses Paid During Period" to estimate the expenses you paid on your account during this period. A small balance maintenance fee of $12.00 that is charged once a year may apply for certain accounts with a value of less than $2,000. This fee is not included in the table below. If it was, the estimate of expenses you paid during the period would be higher, and your ending account value lower, by this amount. In addition, the Fund, as a shareholder in the underlying Fidelity Central Funds, will indirectly bear its pro rata share of the fees and expenses incurred by the underlying Fidelity Central Funds. These fees and expenses are not included in the Fund's annualized expense ratio used to calculate the expense estimate in the table below.
Hypothetical Example for Comparison Purposes
The second line of the accompanying table for each class of the Fund provides information about hypothetical account values and hypothetical expenses based on a Class' actual expense ratio and an assumed rate of return of 5% per year before expenses, which is not the Class' actual return. The hypothetical account values and expenses may not be used to estimate the actual ending account balance or expenses you paid for the period. You may use this information to compare the ongoing costs of investing in the Fund and other funds. To do so, compare this 5% hypothetical example with the 5% hypothetical examples that appear in the shareholder reports of the other funds. A small balance maintenance fee of $12.00 that is charged once a year may apply for certain accounts with a value of less than $2,000. This fee is not included in the table below. If it was, the estimate of expenses you paid during the period would be higher, and your ending account value lower, by this amount. In addition, the Fund, as a shareholder in the underlying Fidelity Central Funds, will indirectly bear its pro rata share of the fees and expenses incurred by the underlying Fidelity Central Funds. These fees and expenses are not included in the Fund's annualized expense ratio used to calculate the expense estimate in the table below.
Please note that the expenses shown in the table are meant to highlight your ongoing costs only and do not reflect any transaction costs. Therefore, the second line of the table is useful in comparing ongoing costs only, and will not help you determine the relative total costs of owning different funds. In addition, if these transactional costs were included, your costs would have been higher.
Annual Report
Shareholder Expense Example - continued
| Beginning
Account Value
May 1, 2007 | Ending
Account Value
October 31, 2007 | Expenses Paid
During Period*
May 1, 2007 to
October 31, 2007 |
Class A | | | |
Actual | $ 1,000.00 | $ 1,098.40 | $ 8.62 |
Hypothetical A | $ 1,000.00 | $ 1,016.99 | $ 8.29 |
Class T | | | |
Actual | $ 1,000.00 | $ 1,097.20 | $ 9.83 |
Hypothetical A | $ 1,000.00 | $ 1,015.83 | $ 9.45 |
Class B | | | |
Actual | $ 1,000.00 | $ 1,094.50 | $ 12.67 |
Hypothetical A | $ 1,000.00 | $ 1,013.11 | $ 12.18 |
Class C | | | |
Actual | $ 1,000.00 | $ 1,094.60 | $ 12.57 |
Hypothetical A | $ 1,000.00 | $ 1,013.21 | $ 12.08 |
International Small Cap Opportunities | | | |
Actual | $ 1,000.00 | $ 1,100.30 | $ 6.88 |
Hypothetical A | $ 1,000.00 | $ 1,018.65 | $ 6.61 |
Institutional Class | | | |
Actual | $ 1,000.00 | $ 1,100.90 | $ 6.83 |
Hypothetical A | $ 1,000.00 | $ 1,018.70 | $ 6.56 |
A 5% return per year before expenses
* Expenses are equal to each Class' annualized expense ratio (shown in the table below); multiplied by the average account value over the period, multiplied by 184/365 (to reflect the one-half year period).
| Annualized
Expense Ratio |
Class A | 1.63% |
Class T | 1.86% |
Class B | 2.40% |
Class C | 2.38% |
International Small Cap Opportunities | 1.30% |
Institutional Class | 1.29% |
Annual Report
Investment Changes
Geographic Diversification (% of fund's net assets) |
As of October 31, 2007 |
 | Japan 28.5% | |
 | United States of America 12.1% | |
 | United Kingdom 10.0% | |
 | Germany 8.6% | |
 | Norway 6.1% | |
 | Papua New Guinea 5.3% | |
 | Netherlands 4.5% | |
 | France 3.5% | |
 | Cayman Islands 3.0% | |
 | Other 18.4% | |

Percentages are adjusted for the effect of futures contracts, if applicable. |
|
As of April 30, 2007 |
| Japan 21.0% | |
| Germany 12.9% | |
| United States of America 8.5% | |
| United Kingdom 8.5% | |
| Norway 7.2% | |
| Australia 5.8% | |
| France 4.9% | |
| Netherlands 3.7% | |
| China 2.8% | |
| Other 24.7% | |

Percentages are adjusted for the effect of futures contracts, if applicable. |
Asset Allocation |
| % of fund's
net assets | % of fund's net assets
6 months ago |
Stocks | 95.0 | 99.0 |
Short-Term Investments and Net Other Assets | 5.0 | 1.0 |
Top Ten Stocks as of October 31, 2007 |
| % of fund's
net assets | % of fund's net assets
6 months ago |
Lihir Gold Ltd. (Papua New Guinea, Metals & Mining) | 5.3 | 2.1 |
Titanium Metals Corp. (United States of America, Metals & Mining) | 3.2 | 2.4 |
Renovo Group PLC (United Kingdom, Pharmaceuticals) | 2.2 | 1.5 |
AGCO Corp. (United States of America, Machinery) | 2.2 | 1.5 |
GEA Group AG (Germany, Machinery) | 2.0 | 1.9 |
Nexans SA (France, Electrical Equipment) | 2.0 | 0.6 |
Autonomy Corp. PLC (United Kingdom, Software) | 1.9 | 0.9 |
Tokuyama Corp. (Japan, Chemicals) | 1.8 | 1.4 |
Cermaq ASA (Norway, Food Products) | 1.8 | 1.4 |
SGL Carbon AG (Germany, Electrical Equipment) | 1.8 | 0.8 |
| 24.2 | |
Market Sectors as of October 31, 2007 |
| % of fund's
net assets | % of fund's net assets
6 months ago |
Industrials | 28.1 | 30.5 |
Information Technology | 17.0 | 15.1 |
Materials | 16.1 | 11.9 |
Consumer Staples | 10.6 | 11.4 |
Financials | 8.3 | 12.7 |
Health Care | 5.5 | 3.9 |
Energy | 4.6 | 6.7 |
Consumer Discretionary | 4.4 | 4.3 |
Telecommunication Services | 0.4 | 1.9 |
Utilities | 0.0 | 0.6 |
Annual Report
Investments October 31, 2007
Showing Percentage of Net Assets
Common Stocks - 95.0% |
| Shares | | Value |
Australia - 2.4% |
Downer EDI Ltd. | 3,797,343 | | $ 23,679,615 |
Gunns Ltd. | 954,690 | | 3,365,484 |
Oxiana Ltd. | 356,736 | | 1,421,724 |
Silex Systems Ltd. | 950,000 | | 6,919,372 |
United Group Ltd. | 199,999 | | 4,002,940 |
TOTAL AUSTRALIA | | 39,389,135 |
Austria - 0.3% |
Andritz AG | 74,896 | | 5,509,018 |
Belgium - 0.4% |
Umicore SA | 28,300 | | 7,052,179 |
Bermuda - 1.9% |
China Grand Forestry Resources Group Ltd. (a) | 19,000,000 | | 6,752,330 |
China LotSynergy Holdings Ltd. (a) | 11,568,000 | | 1,682,922 |
Pacific Basin Shipping Ltd. | 3,442,000 | | 7,711,465 |
Proactive Technology Holdings Ltd. (a) | 4,202,000 | | 4,547,928 |
Sinofert Holdings Ltd. | 10,836,000 | | 10,221,274 |
TOTAL BERMUDA | | 30,915,919 |
Brazil - 1.4% |
Cosan SA Industria E Comercio | 1,070,000 | | 16,729,380 |
Sao Martinho SA | 440,100 | | 5,718,426 |
TOTAL BRAZIL | | 22,447,806 |
Cayman Islands - 3.0% |
CNinsure, Inc. ADR (a) | 300,900 | | 7,609,761 |
Himax Technologies, Inc. sponsored ADR | 4,604,200 | | 17,495,960 |
LDK Solar Co. Ltd. Sponsored ADR (d) | 387,800 | | 15,360,758 |
Subsea 7, Inc. (a)(d) | 296,500 | | 8,701,901 |
TOTAL CAYMAN ISLANDS | | 49,168,380 |
China - 2.7% |
China Oilfield Services Ltd. (H Shares) | 1,500,000 | | 3,673,279 |
China Techfaith Wireless Communication Technology Ltd. sponsored ADR (a)(d) | 1,227,479 | | 8,776,475 |
First Tractor Co. Ltd. (H Shares) (a)(e) | 18,940,000 | | 11,999,397 |
Global Bio-Chem Technology Group Co. Ltd. | 50,703,300 | | 18,800,322 |
TOTAL CHINA | | 43,249,473 |
Common Stocks - continued |
| Shares | | Value |
Finland - 1.9% |
KCI Konecranes Oyj | 300,000 | | $ 13,430,376 |
Outotec Oyj | 225,406 | | 17,210,145 |
TOTAL FINLAND | | 30,640,521 |
France - 3.5% |
Neopost SA | 18,400 | | 2,137,165 |
Nexans SA | 195,000 | | 33,136,302 |
Soitec SA (a)(d) | 1,009,801 | | 19,238,446 |
Ubisoft Entertainment SA (a) | 40,000 | | 3,285,299 |
TOTAL FRANCE | | 57,797,212 |
Germany - 8.6% |
Bilfinger Berger AG | 100,600 | | 8,956,293 |
Demag Cranes AG | 283,000 | | 16,297,914 |
Deutz AG (a)(d) | 741,982 | | 10,190,844 |
GEA Group AG (a) | 884,800 | | 33,201,165 |
Hochtief AG | 31,712 | | 4,378,956 |
Kontron AG | 400,319 | | 10,143,888 |
MTU Aero Engines Holding AG | 230,554 | | 14,075,883 |
Q-Cells AG (a) | 116,285 | | 14,808,839 |
SGL Carbon AG (a) | 493,908 | | 28,816,162 |
TOTAL GERMANY | | 140,869,944 |
Greece - 0.9% |
Bank of Piraeus | 174,129 | | 6,983,058 |
Hellenic Technodomiki Tev SA | 500,000 | | 7,591,712 |
TOTAL GREECE | | 14,574,770 |
Hong Kong - 0.4% |
China State Construction International Holdings Ltd. | 3,400,000 | | 7,121,855 |
Italy - 0.7% |
Impregilo SpA (a) | 1,500,000 | | 12,017,796 |
Japan - 28.5% |
Acca Networks Co. Ltd. (d) | 2,361 | | 4,703,296 |
Access Co. Ltd. (a)(d) | 2,000 | | 9,612,789 |
Adeka Corp. | 98,500 | | 987,414 |
Air Water, Inc. | 1,273,000 | | 14,433,669 |
Alps Electric Co. Ltd. | 200,000 | | 2,504,490 |
Asics Corp. | 1,223,000 | | 19,506,429 |
Atrium Co. Ltd. | 172,000 | | 4,797,225 |
Brother Industries Ltd. | 300,000 | | 4,017,501 |
Capcom Co. Ltd. (d) | 180,000 | | 5,148,945 |
Common Stocks - continued |
| Shares | | Value |
Japan - continued |
CyberAgent, Inc. | 8,000 | | $ 5,534,586 |
E*TRADE Securities Co. Ltd. (d) | 10,000 | | 10,737,892 |
Hikari Tsushin, Inc. | 220,000 | | 6,719,450 |
Ichiyoshi Securities Co. Ltd. (d) | 734,700 | | 8,036,096 |
Iino Kaiun Kaisha Ltd. | 350,000 | | 4,955,413 |
JAFCO Co. Ltd. | 199,000 | | 8,203,361 |
Japan General Estate Co. Ltd. (d) | 297,200 | | 5,692,246 |
Japan Steel Works Ltd. | 647,000 | | 10,585,612 |
JGC Corp. | 750,000 | | 15,022,632 |
Joint Corp. (d) | 166,300 | | 4,726,458 |
Kenedix, Inc. (d) | 5,000 | | 11,035,874 |
KK daVinci Advisors (a) | 8,769 | | 9,150,571 |
Kurita Water Industries Ltd. | 264,000 | | 8,821,083 |
Leopalace21 Corp. | 245,000 | | 7,822,808 |
Makino Milling Machine Co. Ltd. | 200,000 | | 2,092,996 |
Miraial Co. Ltd. | 96,800 | | 4,443,273 |
Mitsumi Electric Co. Ltd. | 234,000 | | 10,784,696 |
Nabtesco Corp. | 457,000 | | 7,814,578 |
Namco Bandai Holdings, Inc. | 669,000 | | 10,316,650 |
Nidec Sankyo Corp. | 1,098,000 | | 8,589,446 |
Nintendo Co. Ltd. | 26,600 | | 16,704,800 |
Nippon Carbon Co. Ltd. | 1,282,000 | | 8,090,195 |
Okuma Corp. | 310,000 | | 4,369,299 |
Organo Corp. (d) | 429,000 | | 7,198,167 |
Osaka Titanium Technolo Co. Ltd. (d) | 95,000 | | 8,366,316 |
Pal Co. Ltd. (d) | 300,000 | | 6,028,914 |
Rakuten, Inc. | 20,000 | | 9,783,077 |
Risa Partners, Inc. (d) | 1,146 | | 2,562,567 |
SBI Holdings, Inc. | 30,000 | | 9,519,414 |
Shima Seiki Manufacturing Ltd. | 75,000 | | 3,841,648 |
Sojitz Corp. | 3,746,300 | | 17,200,555 |
Sparx Group Co. Ltd. (d) | 19,856 | | 12,623,535 |
Star Micronics Co. Ltd. | 100,000 | | 3,157,645 |
Sugi Pharmacy Co. Ltd. | 239,000 | | 6,924,033 |
Sumco Corp. | 341,100 | | 12,451,892 |
Sumco Techxiv Corp. | 109,500 | | 5,941,755 |
Sumitomo Bakelite Co. Ltd. | 300,000 | | 1,840,019 |
Tamron Co. Ltd. (d) | 50,000 | | 1,942,350 |
Teijin Ltd. | 2,250,000 | | 10,858,801 |
The Sumitomo Warehouse Co. Ltd. (d) | 288,000 | | 1,659,815 |
Toho Titanium Co. Ltd. (d) | 200,000 | | 7,310,416 |
Tokai Carbon Co. Ltd. | 1,007,000 | | 12,631,174 |
Common Stocks - continued |
| Shares | | Value |
Japan - continued |
Tokuyama Corp. (d) | 2,090,000 | | $ 29,198,797 |
Tokyo Tatemono Co. Ltd. | 643,000 | | 8,274,088 |
Toshiba Machine Co. Ltd. | 1,774,000 | | 13,552,801 |
Urban Corp. | 226,300 | | 3,964,968 |
Wacom Co. Ltd. (d) | 1,700 | | 4,204,732 |
Xebio Co. Ltd. | 55,000 | | 1,623,135 |
Zenrin Co. Ltd. (d) | 196,300 | | 5,855,039 |
TOTAL JAPAN | | 464,477,426 |
Luxembourg - 1.4% |
Acergy SA | 773,900 | | 22,396,666 |
Netherlands - 4.5% |
Advanced Metallurgical Group NV | 146,000 | | 10,417,596 |
Koninklijke Wessanen NV | 1,017,015 | | 17,165,708 |
Nutreco Holding NV | 299,000 | | 20,424,965 |
OPG Groep NV (A Shares)(Certificaten Van Aandelen) unit | 150,000 | | 5,191,775 |
QIAGEN NV (a)(d) | 845,000 | | 19,891,300 |
TOTAL NETHERLANDS | | 73,091,344 |
Norway - 6.1% |
Aker Kvaerner ASA | 227,500 | | 7,927,420 |
Aker Yards AS | 279,000 | | 4,614,041 |
Cermaq ASA | 1,898,500 | | 29,097,480 |
ElectroMagnetic GeoServices ASA (d) | 262,300 | | 4,179,009 |
Marine Harvest ASA (a)(d) | 27,707,000 | | 28,086,477 |
Norwegian Property ASA | 400,400 | | 4,998,938 |
Petroleum Geo-Services ASA | 331,600 | | 9,762,937 |
ProSafe ASA | 332,000 | | 5,889,574 |
TGS Nopec Geophysical Co. ASA (a) | 316,700 | | 5,311,283 |
TOTAL NORWAY | | 99,867,159 |
Papua New Guinea - 5.3% |
Lihir Gold Ltd. (a) | 14,300,867 | | 56,776,143 |
Lihir Gold Ltd. sponsored ADR | 720,000 | | 28,850,400 |
TOTAL PAPUA NEW GUINEA | | 85,626,543 |
Portugal - 0.7% |
Banif SGPS SA | 1,610,654 | | 11,970,935 |
Sweden - 0.6% |
Bergman & Beving AB (B Shares) | 285,000 | | 9,419,634 |
Switzerland - 1.1% |
BB Biotech AG | 200,000 | | 17,560,218 |
Common Stocks - continued |
| Shares | | Value |
Taiwan - 1.6% |
HannStar Display Corp. (a) | 55,715,292 | | $ 25,712,104 |
United Kingdom - 10.0% |
ARM Holdings PLC | 2,500,000 | | 7,718,473 |
ARM Holdings PLC sponsored ADR | 1,700,000 | | 15,793,000 |
Autonomy Corp. PLC (a) | 1,558,400 | | 31,832,917 |
Avis Europe PLC (a) | 8,235,698 | | 6,848,971 |
Gyrus Group PLC (a) | 1,267,171 | | 11,262,538 |
Invensys PLC (a) | 3,400,000 | | 23,114,878 |
Laird Group PLC | 462,461 | | 6,105,395 |
Max Petroleum PLC (a) | 4,000,000 | | 8,524,105 |
Morgan Crucible Co. PLC | 400,300 | | 2,642,374 |
Premier Foods PLC | 1,490,000 | | 6,985,504 |
Renovo Group PLC (a) | 8,652,203 | | 36,336,493 |
Wolfson Microelectronics PLC (a) | 1,100,000 | | 5,803,148 |
TOTAL UNITED KINGDOM | | 162,967,796 |
United States of America - 7.1% |
AGCO Corp. (a) | 604,000 | | 36,046,720 |
Chiquita Brands International, Inc. (a) | 1,087,400 | | 20,388,750 |
NII Holdings, Inc. (a) | 116,800 | | 6,774,400 |
Titanium Metals Corp. (a)(d) | 1,478,354 | | 52,038,061 |
TOTAL UNITED STATES OF AMERICA | | 115,247,931 |
TOTAL COMMON STOCKS (Cost $1,213,398,162) | 1,549,091,764 |
Money Market Funds - 17.9% |
| | | |
Fidelity Cash Central Fund, 4.97% (b) | 87,899,285 | | 87,899,285 |
Fidelity Securities Lending Cash Central Fund, 5.02% (b)(c) | 203,798,078 | | 203,798,078 |
TOTAL MONEY MARKET FUNDS (Cost $291,697,363) | 291,697,363 |
TOTAL INVESTMENT PORTFOLIO - 112.9% (Cost $1,505,095,525) | | 1,840,789,127 |
NET OTHER ASSETS - (12.9)% | | (210,114,339) |
NET ASSETS - 100% | $ 1,630,674,788 |
Legend |
(a) Non-income producing |
(b) Affiliated fund that is available only to investment companies and other accounts managed by Fidelity Investments. The rate quoted is the annualized seven-day yield of the fund at period end. A complete unaudited listing of the fund's holdings as of its most recent quarter end is available upon request. |
(c) Investment made with cash collateral received from securities on loan. |
(d) Security or a portion of the security is on loan at period end. |
(e) Affiliated company |
Affiliated Central Funds |
Information regarding fiscal year to date income earned by the Fund from investments in Fidelity Central Funds is as follows: |
Fund | Income earned |
Fidelity Cash Central Fund | $ 1,071,947 |
Fidelity Securities Lending Cash Central Fund | 3,230,403 |
Total | $ 4,302,350 |
Other Affiliated Issuers |
An affiliated company is a company in which the fund has ownership of at least 5% of the voting securities. Fiscal year to date transactions with companies which are or were affiliates are as follows: |
Affiliate | Value, beginning of period | Purchases | Sales Proceeds | Dividend Income | Value,
end of
period |
First Tractor Co. Ltd.
(H Shares) | $ - | $ 8,262,406 | $ - | $ - | $ 11,999,397 |
See accompanying notes which are an integral part of the financial statements.
Annual Report
Financial Statements
Statement of Assets and Liabilities
| October 31, 2007 |
Assets | | |
Investment in securities, at value (including securities loaned of $196,735,174) - See accompanying schedule: Unaffiliated issuers (cost $1,205,135,756) | $ 1,537,092,367 | |
Fidelity Central Funds (cost $291,697,363) | 291,697,363 | |
Other affiliated issuers (cost $8,262,406) | 11,999,397 | |
Total Investments (cost $1,505,095,525) | | $ 1,840,789,127 |
Cash | | 1,144,511 |
Foreign currency held at value (cost $27,135) | | 27,216 |
Receivable for investments sold | | 28,451,867 |
Receivable for fund shares sold | | 2,457,360 |
Dividends receivable | | 1,026,691 |
Distributions receivable from Fidelity Central Funds | | 419,873 |
Other receivables | | 194,384 |
Total assets | | 1,874,511,029 |
| | |
Liabilities | | |
Payable for investments purchased | $ 33,306,202 | |
Payable for fund shares redeemed | 4,823,887 | |
Accrued management fee | 1,328,025 | |
Distribution fees payable | 74,625 | |
Other affiliated payables | 339,595 | |
Other payables and accrued expenses | 165,829 | |
Collateral on securities loaned, at value | 203,798,078 | |
Total liabilities | | 243,836,241 |
| | |
Net Assets | | $ 1,630,674,788 |
Net Assets consist of: | | |
Paid in capital | | $ 1,111,748,526 |
Undistributed net investment income | | 5,724,841 |
Accumulated undistributed net realized gain (loss) on investments and foreign currency transactions | | 177,567,767 |
Net unrealized appreciation (depreciation) on investments and assets and liabilities in foreign currencies | | 335,633,654 |
Net Assets | | $ 1,630,674,788 |
See accompanying notes which are an integral part of the financial statements.
Annual Report
Financial Statements - continued
Statement of Assets and Liabilities - continued
| October 31, 2007 |
Calculation of Maximum Offering Price Class A: Net Asset Value and redemption price per share ($70,785,030 ÷ 3,730,934 shares) | | $ 18.97 |
| | |
Maximum offering price per share (100/94.25 of $18.97) | | $ 20.13 |
Class T: Net Asset Value and redemption price per share ($46,568,311 ÷ 2,470,157 shares) | | $ 18.85 |
| | |
Maximum offering price per share (100/96.50 of $18.85) | | $ 19.53 |
Class B: Net Asset Value and offering price per share ($10,975,101 ÷ 588,875 shares)A | | $ 18.64 |
| | |
Class C: Net Asset Value and offering price per share ($40,893,627 ÷ 2,195,080 shares)A | | $ 18.63 |
| | |
| | |
International Small Cap Opportunities: Net Asset Value, offering price and redemption price per share ($1,433,843,833 ÷ 75,093,223 shares) | | $ 19.09 |
| | |
Institutional Class: Net Asset Value, offering price and redemption price per share ($27,608,886 ÷ 1,446,444 shares) | | $ 19.09 |
A Redemption price per share is equal to net asset value less any applicable contingent deferred sales charge.
See accompanying notes which are an integral part of the financial statements.
Annual Report
Statement of Operations
| Year ended October 31, 2007 |
Investment Income | | |
Dividends | | $ 23,621,857 |
Interest | | 2,191 |
Income from Fidelity Central Funds (including $3,230,403 from security lending) | | 4,302,350 |
| | 27,926,398 |
Less foreign taxes withheld | | (2,109,992) |
Total income | | 25,816,406 |
| | |
Expenses | | |
Management fee
Basic fee | $ 13,126,935 | |
Performance adjustment | 2,024,924 | |
Transfer agent fees | 3,340,897 | |
Distribution fees | 777,090 | |
Accounting and security lending fees | 728,123 | |
Custodian fees and expenses | 381,680 | |
Independent trustees' compensation | 5,036 | |
Registration fees | 158,009 | |
Audit | 82,409 | |
Interest | 26,963 | |
Miscellaneous | 58,967 | |
Total expenses before reductions | 20,711,033 | |
Expense reductions | (619,468) | 20,091,565 |
Net investment income (loss) | | 5,724,841 |
Realized and Unrealized Gain (Loss) Net realized gain (loss) on: | | |
Investment securities: | | |
Unaffiliated issuers (net of foreign taxes of $(2,678)) | 184,750,494 | |
Foreign currency transactions | (160,375) | |
Total net realized gain (loss) | | 184,590,119 |
Change in net unrealized appreciation (depreciation) on: Investment securities | 219,262,212 | |
Assets and liabilities in foreign currencies | (58,778) | |
Total change in net unrealized appreciation (depreciation) | | 219,203,434 |
Net gain (loss) | | 403,793,553 |
Net increase (decrease) in net assets resulting from operations | | $ 409,518,394 |
See accompanying notes which are an integral part of the financial statements.
Annual Report
Financial Statements - continued
Statement of Changes in Net Assets
| Year ended
October 31,
2007 | Year ended
October 31,
2006 |
Increase (Decrease) in Net Assets | | |
Operations | | |
Net investment income (loss) | $ 5,724,841 | $ 3,177,589 |
Net realized gain (loss) | 184,590,119 | (953,704) |
Change in net unrealized appreciation (depreciation) | 219,203,434 | 115,235,200 |
Net increase (decrease) in net assets resulting
from operations | 409,518,394 | 117,459,085 |
Distributions to shareholders from net realized gain | - | (90,957) |
Share transactions - net increase (decrease) | 127,196,896 | 760,497,703 |
Redemption fees | 783,954 | 1,853,226 |
Total increase (decrease) in net assets | 537,499,244 | 879,719,057 |
| | |
Net Assets | | |
Beginning of period | 1,093,175,544 | 213,456,487 |
End of period (including undistributed net investment income of $5,724,841 and undistributed net investment income of $3,179,958, respectively) | $ 1,630,674,788 | $ 1,093,175,544 |
See accompanying notes which are an integral part of the financial statements.
Annual Report
Financial Highlights - Class A
Years ended October 31, | 2007 | 2006 | 2005 H |
Selected Per-Share Data | | | |
Net asset value, beginning of period | $ 14.18 | $ 10.41 | $ 10.00 |
Income from Investment Operations | | | |
Net investment income (loss) E | .02 | - J | -J |
Net realized and unrealized gain (loss) | 4.76 | 3.74 | .40 |
Total from investment operations | 4.78 | 3.74 | .40 |
Distributions from net realized gain | - | - J | - |
Redemption fees added to paid in capital E | .01 | .03 | .01 |
Net asset value, end of period | $ 18.97 | $ 14.18 | $ 10.41 |
Total Return B,C,D | 33.78% | 36.25% | 4.10% |
Ratios to Average Net AssetsF,I | | | |
Expenses before reductions | 1.63% | 1.63% | 2.67% A |
Expenses net of fee waivers, if any | 1.63% | 1.63% | 1.65% A |
Expenses net of all reductions | 1.59% | 1.51% | 1.54% A |
Net investment income (loss) | .10% | .02% | (.09)%A |
Supplemental Data | | | |
Net assets, end of period (000 omitted) | $ 70,785 | $ 35,674 | $ 5,533 |
Portfolio turnover rate G | 107% | 164% | 46% |
A Annualized
B Total returns for periods of less than one year are not annualized.
C Total returns would have been lower had certain expenses not been reduced during the periods shown.
D Total returns do not include the effect of the sales charges.
E Calculated based on average shares outstanding during the period.
F Fees and expenses of the underlying Fidelity Central Funds are not included in the Fund's expense ratio. The Fund indirectly bears its proportionate share of the expenses of any underlying Fidelity Central Funds.
G Amount does not include the portfolio activity of any underlying Fidelity Central Funds.
H For the period August 2, 2005 (commencement of operations) to October 31, 2005.
I Expense ratios reflect operating expenses of the class. Expenses before reductions do not reflect amounts reimbursed by the investment adviser or reductions from brokerage service arrangements or other expense offset arrangements and do not represent the amount paid by the class during periods when reimbursements or reductions occur. Expense ratios before reductions for start-up periods may not be representative of longer-term operating periods. Expenses net of fee waivers reflect expenses after reimbursement by the investment adviser but prior to reductions from brokerage service arrangements or other expense offset arrangements. Expenses net of all reductions represent the net expenses paid by the class.
J Amount represents less than $.01 per share.
See accompanying notes which are an integral part of the financial statements.
Annual Report
Financial Highlights - Class T
Years ended October 31, | 2007 | 2006 | 2005 H |
Selected Per-Share Data | | | |
Net asset value, beginning of period | $ 14.12 | $ 10.38 | $ 10.00 |
Income from Investment Operations | | | |
Net investment income (loss) E | (.02) | (.03) | (.01) |
Net realized and unrealized gain (loss) | 4.74 | 3.74 | .38 |
Total from investment operations | 4.72 | 3.71 | .37 |
Redemption fees added to paid in capital E | .01 | .03 | .01 |
Net asset value, end of period | $ 18.85 | $ 14.12 | $ 10.38 |
Total Return B,C,D | 33.50% | 36.03% | 3.80% |
Ratios to Average Net Assets F,I | | | |
Expenses before reductions | 1.85% | 1.85% | 2.92% A |
Expenses net of fee waivers, if any | 1.85% | 1.85% | 1.90% A |
Expenses net of all reductions | 1.81% | 1.74% | 1.78% A |
Net investment income (loss) | (.13)% | (.20)% | (.33)%A |
Supplemental Data | | | |
Net assets, end of period (000 omitted) | $ 46,568 | $ 28,309 | $ 2,704 |
Portfolio turnover rate G | 107% | 164% | 46% |
A Annualized
B Total returns for periods of less than one year are not annualized.
C Total returns would have been lower had certain expenses not been reduced during the periods shown.
D Total returns do not include the effect of the sales charges.
E Calculated based on average shares outstanding during the period.
F Fees and expenses of the underlying Fidelity Central Funds are not included in the Fund's expense ratio. The Fund indirectly bears its proportionate share of the expenses of any underlying Fidelity Central Funds.
G Amount does not include the portfolio activity of any underlying Fidelity Central Funds.
H For the period August 2, 2005 (commencement of operations) to October 31, 2005.
I Expense ratios reflect operating expenses of the class. Expenses before reductions do not reflect amounts reimbursed by the investment adviser or reductions from brokerage service arrangements or other expense offset arrangements and do not represent the amount paid by the class during periods when reimbursements or reductions occur. Expense ratios before reductions for start-up periods may not be representative of longer-term operating periods. Expenses net of fee waivers reflect expenses after reimbursement by the investment adviser but prior to reductions from brokerage service arrangements or other expense offset arrangements. Expenses net of all reductions represent the net expenses paid by the class.
See accompanying notes which are an integral part of the financial statements.
Annual Report
Financial Highlights - Class B
Years ended October 31, | 2007 | 2006 | 2005 H |
Selected Per-Share Data | | | |
Net asset value, beginning of period | $ 14.04 | $ 10.37 | $ 10.00 |
Income from Investment Operations | | | |
Net investment income (loss) E | (.11) | (.10) | (.02) |
Net realized and unrealized gain (loss) | 4.70 | 3.74 | .38 |
Total from investment operations | 4.59 | 3.64 | .36 |
Redemption fees added to paid in capital E | .01 | .03 | .01 |
Net asset value, end of period | $ 18.64 | $ 14.04 | $ 10.37 |
Total Return B,C,D | 32.76% | 35.39% | 3.70% |
Ratios to Average Net Assets F,I | | | |
Expenses before reductions | 2.40% | 2.45% | 3.43% A |
Expenses net of fee waivers, if any | 2.40% | 2.41% | 2.40% A |
Expenses net of all reductions | 2.36% | 2.30% | 2.27% A |
Net investment income (loss) | (.67)% | (.76)% | (.82)%A |
Supplemental Data | | | |
Net assets, end of period (000 omitted) | $ 10,975 | $ 7,709 | $ 1,705 |
Portfolio turnover rate G | 107% | 164% | 46% |
A Annualized
B Total returns for periods of less than one year are not annualized.
C Total returns would have been lower had certain expenses not been reduced during the periods shown.
D Total returns do not include the effect of the contingent deferred sales charge.
E Calculated based on average shares outstanding during the period.
F Fees and expenses of the underlying Fidelity Central Funds are not included in the Fund's expense ratio. The Fund indirectly bears its proportionate share of the expenses of any underlying Fidelity Central Funds.
G Amount does not include the portfolio activity of any underlying Fidelity Central Funds.
H For the period August 2, 2005 (commencement of operations) to October 31, 2005.
I Expense ratios reflect operating expenses of the class. Expenses before reductions do not reflect amounts reimbursed by the investment adviser or reductions from brokerage service arrangements or other expense offset arrangements and do not represent the amount paid by the class during periods when reimbursements or reductions occur. Expense ratios before reductions for start-up periods may not be representative of longer-term operating periods. Expenses net of fee waivers reflect expenses after reimbursement by the investment adviser but prior to reductions from brokerage service arrangements or other expense offset arrangements. Expenses net of all reductions represent the net expenses paid by the class.
See accompanying notes which are an integral part of the financial statements.
Annual Report
Financial Highlights - Class C
Years ended October 31, | 2007 | 2006 | 2005 H |
Selected Per-Share Data | | | |
Net asset value, beginning of period | $ 14.03 | $ 10.37 | $ 10.00 |
Income from Investment Operations | | | |
Net investment income (loss) E | (.11) | (.10) | (.02) |
Net realized and unrealized gain (loss) | 4.70 | 3.73 | .38 |
Total from investment operations | 4.59 | 3.63 | .36 |
Redemption fees added to paid in capital E | .01 | .03 | .01 |
Net asset value, end of period | $ 18.63 | $ 14.03 | $ 10.37 |
Total Return B,C,D | 32.79% | 35.29% | 3.70% |
Ratios to Average Net Assets F,I | | | |
Expenses before reductions | 2.38% | 2.38% | 3.32% A |
Expenses net of fee waivers, if any | 2.38% | 2.38% | 2.40% A |
Expenses net of all reductions | 2.34% | 2.27% | 2.29% A |
Net investment income (loss) | (.66)% | (.73)% | (.84)%A |
Supplemental Data | | | |
Net assets, end of period (000 omitted) | $ 40,894 | $ 26,320 | $ 3,317 |
Portfolio turnover rate G | 107% | 164% | 46% |
A Annualized
B Total returns for periods of less than one year are not annualized.
C Total returns would have been lower had certain expenses not been reduced during the periods shown.
D Total returns do not include the effect of the contingent deferred sales charge.
E Calculated based on average shares outstanding during the period.
F Fees and expenses of the underlying Fidelity Central Funds are not included in the Fund's expense ratio. The Fund indirectly bears its proportionate share of the expenses of any underlying Fidelity Central Funds.
G Amount does not include the portfolio activity of any underlying Fidelity Central Funds.
H For the period August 2, 2005 (commencement of operations) to October 31, 2005.
I Expense ratios reflect operating expenses of the class. Expenses before reductions do not reflect amounts reimbursed by the investment adviser or reductions from brokerage service arrangements or other expense offset arrangements and do not represent the amount paid by the class during periods when reimbursements or reductions occur. Expense ratios before reductions for start-up periods may not be representative of longer-term operating periods. Expenses net of fee waivers reflect expenses after reimbursement by the investment adviser but prior to reductions from brokerage service arrangements or other expense offset arrangements. Expenses net of all reductions represent the net expenses paid by the class.
See accompanying notes which are an integral part of the financial statements.
Annual Report
Financial Highlights - International Small Cap Opportunities
Years ended October 31, | 2007 | 2006 | 2005 G |
Selected Per-Share Data | | | |
Net asset value, beginning of period | $ 14.23 | $ 10.40 | $ 10.00 |
Income from Investment Operations | | | |
Net investment income (loss) D | .07 | .05 | - I |
Net realized and unrealized gain (loss) | 4.78 | 3.75 | .39 |
Total from investment operations | 4.85 | 3.80 | .39 |
Distributions from net realized gain | - | - I | - |
Redemption fees added to paid in capital D | .01 | .03 | .01 |
Net asset value, end of period | $ 19.09 | $ 14.23 | $ 10.40 |
Total Return B,C | 34.15% | 36.86% | 4.00% |
Ratios to Average Net Assets E,H | | | |
Expenses before reductions | 1.30% | 1.28% | 2.25% A |
Expenses net of fee waivers, if any | 1.30% | 1.28% | 1.40% A |
Expenses net of all reductions | 1.25% | 1.16% | 1.31% A |
Net investment income (loss) | .43% | .37% | .14% A |
Supplemental Data | | | |
Net assets, end of period (000 omitted) | $ 1,433,844 | $ 981,210 | $ 197,349 |
Portfolio turnover rate F | 107% | 164% | 46% |
A Annualized
B Total returns for periods of less than one year are not annualized.
C Total returns would have been lower had certain expenses not been reduced during the periods shown.
D Calculated based on average shares outstanding during the period.
E Fees and expenses of the underlying Fidelity Central Funds are not included in the Fund's expense ratio. The Fund indirectly bears its proportionate share of the expenses of any underlying Fidelity Central Funds.
F Amount does not include the portfolio activity of any underlying Fidelity Central Funds.
G For the period August 2, 2005 (commencement of operations) to October 31, 2005.
H Expense ratios reflect operating expenses of the class. Expenses before reductions do not reflect amounts reimbursed by the investment adviser or reductions from brokerage service arrangements or other expense offset arrangements and do not represent the amount paid by the class during periods when reimbursements or reductions occur. Expense ratios before reductions for start-up periods may not be representative of longer-term operating periods. Expenses net of fee waivers reflect expenses after reimbursement by the investment adviser but prior to reductions from brokerage service arrangements or other expense offset arrangements. Expenses net of all reductions represent the net expenses paid by the class.
I Amount represents less than $.01 per share.
See accompanying notes which are an integral part of the financial statements.
Annual Report
Financial Highlights - Institutional Class
Years ended October 31, | 2007 | 2006 | 2005 G |
Selected Per-Share Data | | | |
Net asset value, beginning of period | $ 14.22 | $ 10.40 | $ 10.00 |
Income from Investment Operations | | | |
Net investment income (loss) D | .08 | .05 | - I |
Net realized and unrealized gain (loss) | 4.78 | 3.74 | .39 |
Total from investment operations | 4.86 | 3.79 | .39 |
Distributions from net realized gain | - | - I | - |
Redemption fees added to paid in capital D | .01 | .03 | .01 |
Net asset value, end of period | $ 19.09 | $ 14.22 | $ 10.40 |
Total Return B,C | 34.25% | 36.77% | 4.00% |
Ratios to Average Net Assets E,H | | | |
Expenses before reductions | 1.29% | 1.25% | 2.25% A |
Expenses net of fee waivers, if any | 1.29% | 1.25% | 1.40% A |
Expenses net of all reductions | 1.25% | 1.14% | 1.29% A |
Net investment income (loss) | .44% | .40% | .16% A |
Supplemental Data | | | |
Net assets, end of period (000 omitted) | $ 27,609 | $ 13,954 | $ 2,849 |
Portfolio turnover rate F | 107% | 164% | 46% |
A Annualized
B Total returns for periods of less than one year are not annualized.
C Total returns would have been lower had certain expenses not been reduced during the periods shown.
D Calculated based on average shares outstanding during the period.
E Fees and expenses of the underlying Fidelity Central Funds are not included in the Fund's expense ratio. The Fund indirectly bears its proportionate share of the expenses of any underlying Fidelity Central Funds.
F Amount does not include the portfolio activity of any underlying Fidelity Central Funds.
G For the period August 2, 2005 (commencement of operations) to October 31, 2005.
H Expense ratios reflect operating expenses of the class. Expenses before reductions do not reflect amounts reimbursed by the investment adviser or reductions from brokerage service arrangements or other expense offset arrangements and do not represent the amount paid by the class during periods when reimbursements or reductions occur. Expense ratios before reductions for start-up periods may not be representative of longer-term operating periods. Expenses net of fee waivers reflect expenses after reimbursement by the investment adviser but prior to reductions from brokerage service arrangements or other expense offset arrangements. Expenses net of all reductions represent the net expenses paid by the class.
I Amount represents less than $.01 per share.
See accompanying notes which are an integral part of the financial statements.
Annual Report
Notes to Financial Statements
For the period ended October 31, 2007
1. Organization.
Fidelity International Small Cap Opportunities Fund (the Fund) is a fund of Fidelity Investment Trust (the trust) and is authorized to issue an unlimited number of shares. The trust is registered under the Investment Company Act of 1940, as amended (the 1940 Act), as an open-end management investment company organized as a Massachusetts business trust. The Fund offers Class A, Class T, Class B, Class C, International Small Cap Opportunities, and Institutional Class shares, each of which has equal rights as to assets and voting privileges. Each class has exclusive voting rights with respect to matters that affect that class. Class B shares will automatically convert to Class A shares after a holding period of seven years from the initial date of purchase. Investment income, realized and unrealized capital gains and losses, the common expenses of the Fund, and certain fund-level expense reductions, if any, are allocated on a pro rata basis to each class based on the relative net assets of each class to the total net assets of the Fund. Each class differs with respect to transfer agent and distribution and service plan fees incurred. Certain expense reductions also differ by class. The Fund's investments in emerging markets can be subject to social, economic, regulatory, and political uncertainties and can be volatile.
2. Investments in Fidelity Central Funds.
The Fund may invest in Fidelity Central Funds, which are open-end investment companies available only to other investment companies and accounts managed by Fidelity Management & Research Company (FMR) and its affiliates. The Fund's Schedule of Investments lists each of the Fidelity Central Funds as an investment of the Fund, but does not include the underlying holdings of each Fidelity Central Fund. As an Investing Fund, the Fund indirectly bears its proportionate share of the expenses of the underlying Fidelity Central Funds.
The Money Market Central Funds seek preservation of capital and current income and are managed by Fidelity Investments Money Management, Inc. (FIMM), an affiliate of FMR.
A complete list of holdings for each Fidelity Central Fund is available upon request or at the SEC's web site at www.sec.gov. In addition, the financial statements of the Fidelity Central Funds, which are not covered by the Fund's Report of Independent Registered Public Accounting Firm, are available on the SEC's web site or upon request.
3. Significant Accounting Policies.
The financial statements have been prepared in conformity with accounting principles generally accepted in the United States of America, which require management to make certain estimates and assumptions at the date of the financial statements. The following summarizes the significant accounting policies of the Fund:
Annual Report
Notes to Financial Statements - continued
3. Significant Accounting Policies - continued
Security Valuation. Investments are valued and net asset value (NAV) per share is calculated (NAV calculation) as of the close of business of the New York Stock Exchange (NYSE), normally 4:00 p.m. Eastern time. Wherever possible, the Fund uses independent pricing services approved by the Board of Trustees to value its investments.
Equity securities, including restricted securities, for which market quotations are readily available, are valued at the last reported sale price or official closing price as reported by an independent pricing service on the primary market or exchange on which they are traded. In the event there were no sales during the day or closing prices are not available, securities are valued at the last quoted bid price. Investments in open-end mutual funds, including the Fidelity Central Funds, are valued at their closing net asset value each business day. Short-term securities with remaining maturities of sixty days or less for which quotations are not readily available are valued at amortized cost, which approximates value.
When current market prices or quotations are not readily available or do not accurately reflect fair value, valuations may be determined in accordance with procedures adopted by the Board of Trustees. For example, when developments occur between the close of a market and the close of the NYSE that may materially affect the value of some or all of the securities, or when trading in a security is halted, those securities may be fair valued. Factors used in the determination of fair value may include monitoring news to identify significant market or security specific events such as changes in the value of U.S. securities markets, reviewing developments in foreign markets and evaluating the performance of ADRs, futures contracts and exchange-traded funds. Because the Fund's utilization of fair value pricing depends on market activity, the frequency with which fair value pricing is used cannot be predicted and may be utilized to a significant extent. The value of securities used for NAV calculation under fair value pricing may differ from published prices for the same securities.
Foreign Currency. The Fund uses foreign currency contracts to facilitate transactions in foreign-denominated securities. Losses from these transactions may arise from changes in the value of the foreign currency or if the counterparties do not perform under the contracts' terms.
Foreign-denominated assets, including investment securities, and liabilities are translated into U.S. dollars at the exchange rate at period end. Purchases and sales of investment securities, income and dividends received and expenses denominated in foreign currencies are translated into U.S. dollars at the exchange rate in effect on the transaction date.
Annual Report
3. Significant Accounting Policies - continued
Foreign Currency - continued
The effects of exchange rate fluctuations on investments are included with the net realized and unrealized gain (loss) on investment securities. Other foreign currency transactions resulting in realized and unrealized gain (loss) are disclosed separately.
Investment Transactions and Income. For financial reporting purposes, the Fund's investment holdings and NAV include trades executed through the end of the last business day of the period. The NAV for processing shareholder transactions includes trades executed through the end of the prior business day. Gains and losses on securities sold are determined on the basis of identified cost. Dividend income is recorded on the ex-dividend date, except for certain dividends from foreign securities where the ex-dividend date may have passed, which are recorded as soon as the Fund is informed of the ex-dividend date. Non-cash dividends included in dividend income, if any, are recorded at the fair market value of the securities received. Interest income and distributions from the Fidelity Central Funds are accrued as earned. Interest income includes coupon interest and amortization of premium and accretion of discount on debt securities. Investment income is recorded net of foreign taxes withheld where recovery of such taxes is uncertain.
Expenses. Most expenses of the trust can be directly attributed to a fund. Expenses which cannot be directly attributed are apportioned among each Fund in the trust. Expense estimates are accrued in the period to which they relate and adjustments are made when actual amounts are known.
Income Tax Information and Distributions to Shareholders. Each year, the Fund intends to qualify as a regulated investment company by distributing all of its taxable income and realized gains under Subchapter M of the Internal Revenue Code. As a result, no provision for income taxes is required in the accompanying financial statements. Foreign taxes are provided for based on the Fund's understanding of the tax rules and rates that exist in the foreign markets in which it invests.
Distributions are recorded on the ex-dividend date. Income dividends and capital gain distributions are declared separately for each class. Income and capital gain distributions are determined in accordance with income tax regulations, which may differ from generally accepted accounting principles. In addition, the Fund will claim a portion of the payment made to redeeming shareholders as a distribution for income tax purposes.
Capital accounts within the financial statements are adjusted for permanent book-tax differences. These adjustments have no impact on net assets or the results of operations. Temporary book-tax differences will reverse in a subsequent period.
Annual Report
Notes to Financial Statements - continued
3. Significant Accounting Policies - continued
Income Tax Information and Distributions to Shareholders - continued
Book-tax differences are primarily due to foreign currency transactions, passive foreign investment companies (PFIC), certain foreign taxes, capital loss carryforwards, and losses deferred due to wash sales.
The tax-basis components of distributable earnings and the federal tax cost as of period end were as follows:
Unrealized appreciation | $ 376,134,487 | |
Unrealized depreciation | (47,440,840) | |
Net unrealized appreciation (depreciation) | 328,693,647 | |
Undistributed ordinary income | 16,755,641 | |
Undistributed long-term capital gain | 142,362,068 | |
| | |
Cost for federal income tax purposes | $ 1,512,095,480 | |
The tax character of distributions paid was as follows:
| October 31, 2007 | October 31, 2006 |
Ordinary Income | $ - | $ 90,957 |
Short-Term Trading (Redemption) Fees. Shares held in the Fund less than 90 days are subject to a redemption fee equal to 2.00% of the proceeds of the redeemed shares. All redemption fees, including any estimated redemption fees paid by FMR, are retained by the Fund and accounted for as an addition to paid in capital.
New Accounting Pronouncements. In July 2006, Financial Accounting Standards Board Interpretation No. 48, Accounting for Uncertainty in Income Taxes - an interpretation of FASB Statement 109 (FIN 48), was issued and is effective on the last business day of the semiannual reporting period for fiscal years beginning after December 15, 2006. FIN 48 sets forth a threshold for financial statement recognition, measurement and disclosure of a tax position taken or expected to be taken on a tax return. Management has concluded that the adoption of FIN 48 will not result in a material impact on the Fund's net assets, results of operations and financial statement disclosures.
In addition, in September 2006, Statement of Financial Accounting Standards No. 157, Fair Value Measurements (SFAS 157), was issued and is effective for fiscal years beginning after November 15, 2007. SFAS 157 defines fair value, establishes a framework for measuring fair value and expands disclosures about fair value measurements. Management is currently evaluating the impact the adoption of SFAS 157 will have on the Fund's financial statement disclosures.
Annual Report
4. Operating Policies.
Repurchase Agreements. FMR has received an Exemptive Order from the Securities and Exchange Commission (the SEC) which permits the Fund and other affiliated entities of FMR to transfer uninvested cash balances into joint trading accounts which are then invested in repurchase agreements. The Fund may also invest directly with institutions in repurchase agreements. Repurchase agreements are collateralized by government or non-government securities. Upon settlement date, collateral is held in segregated accounts with custodian banks and may be obtained in the event of a default of the counterparty. The Fund monitors, on a daily basis, the value of the collateral to ensure it is at least equal to the principal amount of the repurchase agreement (including accrued interest). In the event of a default by the counterparty, realization of the collateral proceeds could be delayed, during which time the value of the collateral may decline.
5. Purchases and Sales of Investments.
Purchases and sales of securities, other than short-term securities, aggregated $1,662,112,013 and $1,600,989,161, respectively.
6. Fees and Other Transactions with Affiliates.
Management Fee. FMR and its affiliates provide the Fund with investment management related services for which the Fund pays a monthly management fee. The management fee is the sum of an individual fund fee rate that is based on an annual rate of .60% of the Fund's average net assets and a group fee rate that averaged ..26% during the period. The group fee rate is based upon the average net assets of all the mutual funds advised by FMR. The group fee rate decreases as assets under management increase and increases as assets under management decrease. In addition, the management fee is subject to a performance adjustment (up to a maximum of ±.20% of the Fund's average net assets over a 36 month performance period). The upward or downward adjustment to the management fee is based on the relative investment performance of the retail class of the Fund, International Small Cap Opportunities as compared to an appropriate benchmark index. The Fund's performance adjustment took effect in August 2006. Subsequent months will be added until the performance period includes 36 months. For the period, the total annual management fee rate, including the performance adjustment, was .99% of the Fund's average net assets.
Distribution and Service Plan. In accordance with Rule 12b-1 of the 1940 Act, the Fund has adopted separate Distribution and Service Plans for each class of shares. Certain classes pay Fidelity Distributors Corporation (FDC), an affiliate of FMR, separate Distribution and Service Fees, each of which is based on an annual percentage of each class' average net assets. In addition, FDC may pay financial intermediaries for selling shares of the Fund and providing shareholder support services. For the period,
Annual Report
Notes to Financial Statements - continued
6. Fees and Other Transactions with Affiliates - continued
Distribution and Service Plan - continued
the Distribution and Service Fee rates and the total amounts paid to and retained by FDC were as follows:
| Distribution
Fee | Service
Fee | Paid to
FDC | Retained
by FDC |
Class A | 0% | .25% | $ 131,681 | $ 13,131 |
Class T | .25% | .25% | 204,126 | 8,816 |
Class B | .75% | .25% | 97,469 | 74,563 |
Class C | .75% | .25% | 343,814 | 137,424 |
| | | $ 777,090 | $ 233,934 |
Sales Load. FDC receives a front-end sales charge of up to 5.75% for selling Class A shares, and 3.50% for selling Class T shares, some of which is paid to financial intermediaries for selling shares of the Fund. FDC receives the proceeds of contingent deferred sales charges levied on Class A, Class T, Class B, and Class C redemptions. These charges depend on the holding period. The deferred sales charges range from 5% to 1% for Class B, 1% for Class C, 1.00% to .50% for certain purchases of Class A shares and .25% for certain purchases of Class T shares.
For the period, sales charge amounts retained by FDC were as follows:
| Retained
by FDC |
Class A | $ 71,361 |
Class T | 16,861 |
Class B* | 18,023 |
Cass C* | 7,770 |
| $ 114,015 |
* When Class B and Class C shares are initially sold, FDC pays commissions from its own resources to financial intermediaries through which the sales are made.
Transfer Agent Fees. Fidelity Investments Institutional Operations Company, Inc. (FIIOC), an affiliate of FMR, is the transfer, dividend disbursing and shareholder servicing agent for each class of the Fund, except for International Small Cap Opportunities. Fidelity Service Company, Inc. (FSC), an affiliate of FMR, is the transfer agent for International Small Cap Opportunities shares. FIIOC and FSC receive account fees and asset-based fees that vary according to the account size and type of account of the shareholders of the respective classes of the Fund. FIIOC and FSC pay for typesetting, printing and mailing of shareholder reports, except proxy statements. For the period, the total transfer agent fees paid by each class to FIIOC or FSC, were as follows:
Annual Report
6. Fees and Other Transactions with Affiliates - continued
Transfer Agent Fees - continued
| Amount | % of
Average
Net Assets |
Class A | $ 157,033 | .30 |
Class T | 110,999 | .27 |
Class B | 30,834 | .32 |
Class C | 104,103 | .30 |
International Small Cap Opportunities | 2,895,757 | .21 |
Institutional Class | 42,171 | .20 |
| $ 3,340,897 | |
Accounting and Security Lending Fees. FSC maintains the Fund's accounting records. The accounting fee is based on the level of average net assets for the month. Under a separate contract, FSC administers the security lending program. The security lending fee is based on the number and duration of lending transactions.
Brokerage Commissions. The Fund placed a portion of its portfolio transactions with brokerage firms which are affiliates of the investment adviser. The commissions paid to these affiliated firms were $357 for the period.
Interfund Lending Program. Pursuant to an Exemptive Order issued by the SEC, the Fund, along with other registered investment companies having management contracts with FMR, may participate in an interfund lending program. This program provides an alternative credit facility allowing the funds to borrow from, or lend money to, other participating affiliated funds. At period end, there were no interfund loans outstanding. The Fund's activity in this program during the period for which loans were outstanding was as follows:
Borrower or Lender | Average Daily
Loan Balance | Weighted Average Interest Rate | Interest Expense |
Borrower | $ 12,170,667 | 5.32% | $ 26,963 |
7. Committed Line of Credit.
The Fund participates with other funds managed by FMR in a $4.2 billion credit facility (the "line of credit") to be utilized for temporary or emergency purposes to fund shareholder redemptions or for other short-term liquidity purposes. The Fund has agreed to pay commitment fees on its pro rata portion of the line of credit, which amounted to $3,037 and is reflected in Miscellaneous Expense on the Statement of Operations. During the period, there were no borrowings on this line of credit.
Annual Report
Notes to Financial Statements - continued
8. Security Lending.
The Fund lends portfolio securities from time to time in order to earn additional income. On the settlement date of the loan, the Fund receives collateral (in the form of U.S. Treasury obligations, letters of credit and/or cash) against the loaned securities and maintains collateral in an amount not less than 100% of the market value of the loaned securities during the period of the loan. The market value of the loaned securities is determined at the close of business of the Fund and any additional required collateral is delivered to the Fund on the next business day. If the borrower defaults on its obligation to return the securities loaned because of insolvency or other reasons, a fund could experience delays and costs in recovering the securities loaned or in gaining access to the collateral. Any cash collateral received is invested in the Fidelity Securities Lending Cash Central Fund. The value of loaned securities and cash collateral at period end are disclosed on the Fund's Statement of Assets and Liabilities. Security lending income represents the income earned on investing cash collateral, less fees and expenses associated with the loan, plus any premium payments that may be received on the loan of certain types of securities. Security lending income is presented in the Statement of Operations as a component of income from Fidelity Central Funds.
9. Expense Reductions.
FMR voluntarily agreed to reimburse each class to the extent annual operating expenses exceeded certain levels of average net assets as noted in the table below. Some expenses, for example interest expense, including commitment fees, are excluded from this reimbursement.
The following classes were in reimbursement during the period:
| Expense
Limitations | Reimbursement
from adviser |
Class B | 2.40% | $ 76 |
Many of the brokers with whom FMR places trades on behalf of the Fund provided services to the Fund in addition to trade execution. These services included payments of certain expenses on behalf of the Fund totaling $613,429 for the period. In addition, through arrangements with each class' transfer agent, credits realized as a result of uninvested cash balances were used to reduce the Fund's expenses. During the period, these credits reduced each class' transfer agent expense as noted in the table below.
| Transfer Agent
expense reduction | |
International Small Cap Opportunities | $ 5,963 | |
Annual Report
10. Other.
The Fund's organizational documents provide former and current trustees and officers with a limited indemnification against liabilities arising in connection with the performance of their duties to the Fund. In the normal course of business, the Fund may also enter into contracts that provide general indemnifications. The Fund's maximum exposure under these arrangements is unknown as this would be dependent on future claims that may be made against the Fund. The risk of material loss from such claims is considered remote.
In September 2006, FIIOC, a transfer agent of the Fund, notified the Fund that the Fund's books and records did not reflect a conversion of certain Class B to Class A shares upon their conversion date. In March 2007, FIIOC converted the relevant Class B shares to Class A shares and recorded the conversion in the books and records of the Fund which did not result in a material impact to the Fund's reported net assets or results of operations in the accompanying financial statements. FIIOC has remediated affected shareholders and reimbursed the Fund for all related audit and legal expenses.
11. Distributions to Shareholders.
Distributions to shareholders of each class were as follows:
Years ended October 31, | 2007 | 2006 |
From net realized gain | | |
Class A | $ - | $ 2,067 |
International Small Cap Opportunities | - | 87,898 |
Institutional Class | - | 992 |
Total | $ - | $ 90,957 |
12. Share Transactions.
Transactions for each class of shares were as follows:
| Shares | Dollars |
Years ended October 31, | 2007 | 2006 | 2007 | 2006 |
Class A | | | | |
Shares sold | 2,107,892 | 2,562,140 | $ 35,531,826 | $ 35,143,597 |
Reinvestment of distributions | - | 162 | - | 1,916 |
Shares redeemed | (892,381) | (578,488) | (14,908,147) | (7,816,655) |
Net increase (decrease) | 1,215,511 | 1,983,814 | $ 20,623,679 | $ 27,328,858 |
Class T | | | | |
Shares sold | 1,311,252 | 1,977,012 | $ 21,607,239 | $ 27,202,466 |
Shares redeemed | (845,477) | (233,065) | (14,215,111) | (3,118,693) |
Net increase (decrease) | 465,775 | 1,743,947 | $ 7,392,128 | $ 24,083,773 |
Annual Report
Notes to Financial Statements - continued
12. Share Transactions - continued
Transactions for each class of shares were as follows: - continued
| Shares | Dollars |
Years ended October 31, | 2007 | 2006 | 2007 | 2006 |
Class B | | | | |
Shares sold | 286,293 | 498,394 | $ 4,653,400 | $ 6,815,227 |
Shares redeemed | (246,522) | (113,628) | (4,027,585) | (1,550,424) |
Net increase (decrease) | 39,771 | 384,766 | $ 625,815 | $ 5,264,803 |
Class C | | | | |
Shares sold | 888,414 | 1,745,210 | $ 14,698,282 | $ 24,032,601 |
Shares redeemed | (569,219) | (189,077) | (9,379,169) | (2,515,739) |
Net increase (decrease) | 319,195 | 1,556,133 | $ 5,319,113 | $ 21,516,862 |
International Small Cap Opportunities | | | | |
Shares sold | 48,402,736 | 93,068,555 | $ 800,622,633 | $ 1,259,777,775 |
Reinvestment of distributions | - | 6,974 | - | 82,435 |
Shares redeemed | (42,286,931) | (43,072,008) | (715,447,148) | (586,736,058) |
Net increase (decrease) | 6,115,805 | 50,003,521 | $ 85,175,485 | $ 673,124,152 |
Institutional Class | | | | |
Shares sold | 903,141 | 1,299,662 | $ 15,436,027 | $ 17,883,260 |
Reinvestment of distributions | - | 83 | - | 980 |
Shares redeemed | (437,882) | (592,563) | (7,375,351) | (8,704,985) |
Net increase (decrease) | 465,259 | 707,182 | $ 8,060,676 | $ 9,179,255 |
Annual Report
Report of Independent Registered Public Accounting Firm
To the Trustees of Fidelity Investment Trust and Shareholders of Fidelity International Small Cap Opportunities Fund:
We have audited the accompanying statement of assets and liabilities of Fidelity International Small Cap Opportunities Fund (the Fund), a fund of Fidelity Investment Trust, including the schedule of investments, as of October 31, 2007, and the related statement of operations for the year then ended, the statement of changes in net assets for each of the two years in the period then ended, and the financial highlights for each of the three years in the period then ended. These financial statements and financial highlights are the responsibility of the Fund's management. Our responsibility is to express an opinion on these financial statements and financial highlights based on our audits.
We conducted our audits in accordance with standards of the Public Company Accounting Oversight Board (United States). Those standards require that we plan and perform the audit to obtain reasonable assurance about whether the financial statements and financial highlights are free of material misstatement. The Fund is not required to have, nor were we engaged to perform, an audit of its internal control over financial reporting. Our audits included consideration of internal control over financial reporting as a basis for designing audit procedures that are appropriate in the circumstances, but not for the purpose of expressing an opinion on the effectiveness of the Fund's internal control over financial reporting. Accordingly, we express no such opinion. An audit also includes examining, on a test basis, evidence supporting the amounts and disclosures in the financial statements, assessing the accounting principles used and significant estimates made by management, as well as evaluating the overall financial statement presentation. Our procedures included confirmation of securities owned as of October 31, 2007, by correspondence with the custodians and brokers; where replies were not received from brokers, we performed other auditing procedures. We believe that our audits provide a reasonable basis for our opinion.
In our opinion, the financial statements and financial highlights referred to above present fairly, in all material respects, the financial position of Fidelity International Small Cap Opportunities Fund as of October 31, 2007, the results of its operations for the year then ended, the changes in its net assets for each of the two years in the period then ended, and its financial highlights for each of the three years in the period then ended, in conformity with accounting principles generally accepted in the United States of America.
/s/ Deloitte & Touche LLP
DELOITTE & TOUCHE LLP
Boston, Massachusetts
December 18, 2007
Annual Report
Trustees and Officers
The Trustees, Members of the Advisory Board, and executive officers of the trust and fund, as applicable, are listed below. The Board of Trustees governs the fund and is responsible for protecting the interests of shareholders. The Trustees are experienced executives who meet periodically throughout the year to oversee the fund's activities, review contractual arrangements with companies that provide services to the fund, and review the fund's performance. Except for James C. Curvey, each of the Trustees oversees 370 funds advised by FMR or an affiliate. Mr. Curvey oversees 340 funds advised by FMR or an affiliate.
The Trustees hold office without limit in time except that (a) any Trustee may resign; (b) any Trustee may be removed by written instrument, signed by at least two-thirds of the number of Trustees prior to such removal; (c) any Trustee who requests to be retired or who has become incapacitated by illness or injury may be retired by written instrument signed by a majority of the other Trustees; and (d) any Trustee may be removed at any special meeting of shareholders by a two-thirds vote of the outstanding voting securities of the trust. Each Trustee who is not an interested person (as defined in the 1940 Act) (Independent Trustee), shall retire not later than the last day of the calendar year in which his or her 72nd birthday occurs. The Independent Trustees may waive this mandatory retirement age policy with respect to individual Trustees. The executive officers and Advisory Board Members hold office without limit in time, except that any officer and Advisory Board Member may resign or may be removed by a vote of a majority of the Trustees at any regular meeting or any special meeting of the Trustees. Except as indicated, each individual has held the office shown or other offices in the same company for the past five years.
The fund's Statement of Additional Information (SAI) includes more information about the Trustees. To request a free copy, call Fidelity at 1-800-544-8544.
Interested Trustees*:
Correspondence intended for each Trustee who is an interested person may be sent to Fidelity Investments, 82 Devonshire Street, Boston, Massachusetts 02109.
Name, Age; Principal Occupation |
Edward C. Johnson 3d (77) |
| Year of Election or Appointment: 1984 Mr. Johnson is Chairman of the Board of Trustees. Mr. Johnson serves as President (2006-present), Chief Executive Officer, Chairman, and a Director of FMR LLC; Chairman and a Director of FMR; Chairman and a Director of Fidelity Research & Analysis Company (FRAC); Chairman and a Director of Fidelity Investments Money Management, Inc.; and Chairman (2001-present) and a Director of FMR Co., Inc. In addition, Mr. Johnson serves as Chairman and Director of Fidelity International Limited (FIL). |
James C. Curvey (72) |
| Year of Election or Appointment: 2007 Member of the Advisory Board of Fidelity Investment Trust. Mr. Curvey also serves as a Trustee (2007-present) or Member of the Advisory Board (2007-present) of other investment companies advised by FMR. Mr. Curvey is a Director of FMR and FMR Co., Inc. (2007-present). Mr. Curvey is also Vice Chairman (2006-present) and Director of FMR LLC. Mr. Curvey joined Fidelity in 1982 and served in numerous senior management positions, including President and Chief Operating Officer of FMR LLC (1997-2000) and President of Fidelity Strategic Investments (2000-2002). In addition, he serves as a member of the Board of Directors of Geerlings & Wade, Inc. (wine distribution). |
* Trustees have been determined to be "Interested Trustees" by virtue of, among other things, their affiliation with the trust or various entities under common control with FMR. FMR Corp. merged with FMR LLC on October 1, 2007. Any references to FMR LLC for prior periods are deemed to be references to the prior entity.
Independent Trustees:
Correspondence intended for each Independent Trustee (that is, the Trustees other than the Interested Trustees) may be sent to Fidelity Investments, P.O. Box 55235, Boston, Massachusetts 02205-5235.
Name, Age; Principal Occupation |
Dennis J. Dirks (59) |
| Year of Election or Appointment: 2005 Prior to his retirement in May 2003, Mr. Dirks was Chief Operating Officer and a member of the Board of The Depository Trust & Clearing Corporation (DTCC) (1999-2003). He also served as President, Chief Operating Officer, and Board member of The Depository Trust Company (DTC) (1999-2003) and President and Board member of the National Securities Clearing Corporation (NSCC) (1999-2003). In addition, Mr. Dirks served as Chief Executive Officer and Board member of the Government Securities Clearing Corporation (2001-2003) and Chief Executive Officer and Board member of the Mortgage-Backed Securities Clearing Corporation (2001-2003). Mr. Dirks also serves as a Trustee and a member of the Finance Committee of Manhattan College (2005-present) and a Trustee and a member of the Finance Committee of AHRC of Nassau County (2006-present). |
Albert R. Gamper, Jr. (65) |
| Year of Election or Appointment: 2006 Prior to his retirement in December 2004, Mr. Gamper served as Chairman of the Board of CIT Group Inc. (commercial finance). During his tenure with CIT Group Inc. Mr. Gamper served in numerous senior management positions, including Chairman (1987-1989; 1999-2001; 2002-2004), Chief Executive Officer (1987-2004), and President (1989-2002). He currently serves as a member of the Board of Directors of Public Service Enterprise Group (utilities, 2001-present), Chairman of the Board of Governors, Rutgers University (2004-present), and Chairman of the Board of Saint Barnabas Health Care System. |
George H. Heilmeier (71) |
| Year of Election or Appointment: 2004 Dr. Heilmeier is Chairman Emeritus of Telcordia Technologies (communication software and systems), where prior to his retirement, he served as company Chairman and Chief Executive Officer. He currently serves on the Boards of Directors of The Mitre Corporation (systems engineering and information technology support for the government), and HRL Laboratories (private research and development, 2004-present). He is Chairman of the General Motors Science & Technology Advisory Board and a Life Fellow of the Institute of Electrical and Electronics Engineers (IEEE). Dr. Heilmeier is a member of the Defense Science Board and the National Security Agency Advisory Board. He is also a member of the National Academy of Engineering, the American Academy of Arts and Sciences, and the Board of Overseers of the School of Engineering and Applied Science of the University of Pennsylvania. Previously, Dr. Heilmeier served as a Director of TRW Inc. (automotive, space, defense, and information technology, 1992-2002), Compaq (1994-2002), Automatic Data Processing, Inc. (ADP) (technology-based business outsourcing, 1995-2002), INET Technologies Inc. (telecommunications network surveillance, 2001-2004), and Teletech Holdings (customer management services). He is the recipient of the 2005 Kyoto Prize in Advanced Technology for his invention of the liquid crystal display, and a member of the Consumer Electronics Hall of Fame. |
James H. Keyes (67) |
| Year of Election or Appointment: 2007 Prior to his retirement in 2003, Mr. Keyes was Chairman, President, and Chief Executive Officer of Johnson Controls, Inc. (automotive supplier, 1993-2003). He currently serves as a member of the boards of LSI Logic Corporation (semiconductor technologies), Navistar International Corporation (manufacture and sale of trucks, buses, and diesel engines, 2002-present), and Pitney Bowes, Inc. (integrated mail, messaging, and document management solutions). |
Marie L. Knowles (61) |
| Year of Election or Appointment: 2001 Prior to Ms. Knowles' retirement in June 2000, she served as Executive Vice President and Chief Financial Officer of Atlantic Richfield Company (ARCO) (diversified energy, 1996-2000). From 1993 to 1996, she was a Senior Vice President of ARCO and President of ARCO Transportation Company. She served as a Director of ARCO from 1996 to 1998. She currently serves as a Director of Phelps Dodge Corporation (copper mining and manufacturing) and McKesson Corporation (healthcare service, 2002-present). Ms. Knowles is a Trustee of the Brookings Institution and the Catalina Island Conservancy and also serves as a member of the Advisory Board for the School of Engineering of the University of Southern California. |
Ned C. Lautenbach (63) |
| Year of Election or Appointment: 2000 Mr. Lautenbach is Chairman of the Independent Trustees (2006-present). Mr. Lautenbach has been a partner of Clayton, Dubilier & Rice, Inc. (private equity investment firm) since September 1998. Previously, Mr. Lautenbach was with the International Business Machines Corporation (IBM) from 1968 until his retirement in 1998. Mr. Lautenbach serves as a Director of Sony Corporation (2006-present) and Eaton Corporation (diversified industrial) as well as the Philharmonic Center for the Arts in Naples, Florida. He also is a member of the Board of Trustees of Fairfield University (2005-present), as well as a member of the Council on Foreign Relations. |
Cornelia M. Small (63) |
| Year of Election or Appointment: 2005 Ms. Small is a member (2000-present) and Chairperson (2002-present) of the Investment Committee, and a member (2002-present) of the Board of Trustees of Smith College. Previously, she served as Chief Investment Officer (1999-2000), Director of Global Equity Investments (1996-1999), and a member of the Board of Directors of Scudder, Stevens & Clark (1990-1997) and Scudder Kemper Investments (1997-1999). In addition, Ms. Small served as Co-Chair (2000-2003) of the Annual Fund for the Fletcher School of Law and Diplomacy. |
William S. Stavropoulos (68) |
| Year of Election or Appointment: 2001 Mr. Stavropoulos is Chairman Emeritus of the Board of Directors of The Dow Chemical Company. Since joining The Dow Chemical Company in 1967, Mr. Stavropoulos served in numerous senior management positions, including President (1993-2000; 2002-2003), CEO (1995-2000; 2002-2004), and Chairman of the Executive Committee (2000-2004). Currently, he is a Director of NCR Corporation (data warehousing and technology solutions), Chemical Financial Corporation, Maersk Inc. (industrial conglomerate, 2002-present), Tyco International, Inc. (multinational manufacturing and services, 2007-present), and a member of the Advisory Board for Metalmark Capital (private equity investment firm, 2005-present). He is a special advisor to Clayton, Dubilier & Rice, Inc., a private equity investment firm. He also serves as a member of the Board of Trustees of the American Enterprise Institute for Public Policy Research. In addition, Mr. Stavropoulos is a member of The Business Council, J.P. Morgan International Council and the University of Notre Dame Advisory Council for the College of Science. |
Kenneth L. Wolfe (68) |
| Year of Election or Appointment: 2005 Prior to his retirement in 2001, Mr. Wolfe was Chairman and Chief Executive Officer of Hershey Foods Corporation (1993-2001). He currently serves as a member of the boards of Adelphia Communications Corporation (2003-present), Bausch & Lomb, Inc., and Revlon Inc. (2004-present). |
Advisory Board Members and Executive Officers**:
Correspondence intended for Mr. Mauriello, Mr. Thomas, and Mr. Wiley may be sent to Fidelity Investments, P.O. Box 55235, Boston, Massachusetts 02205-5235. Correspondence intended for each executive officer and Mr. Lynch may be sent to Fidelity Investments, 82 Devonshire Street, Boston, Massachusetts 02109.
Name, Age; Principal Occupation |
Peter S. Lynch (63) |
| Year of Election or Appointment: 2003 Member of the Advisory Board of Fidelity Investment Trust. Mr. Lynch is Vice Chairman and a Director of FMR, and Vice Chairman (2001-present) and a Director of FMR Co., Inc. Previously, Mr. Lynch served as a Trustee of the Fidelity funds (1990-2003). In addition, he serves as a Trustee of Boston College and as the Chairman of the Inner-City Scholarship Fund. |
Joseph Mauriello (63) |
| Year of Election or Appointment: 2007 Member of the Advisory Board of Fidelity Investment Trust. Prior to his retirement in January 2006, Mr. Mauriello served in numerous senior management positions including Deputy Chairman and Chief Operating Officer (2004-2005), and Vice Chairman of Financial Services (2002-2004) of KPMG LLP US (professional services firm, 1965-2005). Mr. Mauriello currently serves as a member of the Board of Directors of XL Capital Ltd., (global insurance and re-insurance company, 2006-present) and of Arcadia Resources Inc., (health care services and products, 2007-present). He also served as a Director of the Hamilton Funds of the Bank of New York (2006-2007). |
David M. Thomas (58) |
| Year of Election or Appointment: 2007 Member of the Advisory Board of Fidelity Investment Trust. Previously, Mr. Thomas served as Executive Chairman (2005-2006) and Chairman and Chief Executive Officer (2000-2005) of IMS Heath, Inc. (pharmaceutical and healthcare information solutions). In addition, Mr. Thomas serves as a member of the Board of Directors of Fortune Brands, Inc. (consumer products holding company), and Interpublic Group of Companies, Inc. (marketing communication, 2004-present). |
Michael E. Wiley (57) |
| Year of Election or Appointment: 2007 Member of the Advisory Board of Fidelity Investment Trust. Mr. Wiley also serves as Sr. Energy Advisor of Katzenbach Partners, LLC (consulting firm, 2006-present) and a member of the Board of Trustees of the University of Tulsa (2000-2006; 2007-present). He serves as a Director of Tesoro Corporation (independent oil refiner and marketer, 2005-present), and a Director of Bill Barrett Corporation (exploration and production company, 2005-present). In addition, he also serves as a Director of Post Oak Bank (privately-held bank, 2004-present), and an Advisory Director of Riverstone Holdings (private investment firm). Previously, Mr. Wiley served as Chairman, President, and CEO of Baker Hughes, Inc. (oilfield services company, 2000-2004), and as Director of Spinnaker Exploration Company (exploration and production company, 2001-2005). |
Kimberley H. Monasterio (43) |
| Year of Election or Appointment: 2007 President and Treasurer of International Small Cap Opportunities. Ms. Monasterio also serves as President and Treasurer of other Fidelity funds (2007-present) and is an employee of FMR (2004-present). Previously, Ms. Monasterio served as Deputy Treasurer of the Fidelity funds (2004-2006). Before joining Fidelity Investments, Ms. Monasterio served as Treasurer (2000-2004) and Chief Financial Officer (2002-2004) of the Franklin Templeton Funds and Senior Vice President of Franklin Templeton Services, LLC (2000-2004). |
Walter C. Donovan (45) |
| Year of Election or Appointment: 2007 Vice President of International Small Cap Opportunities. Mr. Donovan also serves as Vice President of Fidelity's Equity Funds (2007-present). Mr. Donovan also serves as Executive Vice President of FMR (2005-present) and FMR Co., Inc. (2005-present). Previously, Mr. Donovan served as Vice President of Fidelity's High Income Funds (2005-2007), Fixed-Income Funds (2005-2006), certain Asset Allocation Funds (2005-2006), certain Balanced Funds (2005-2006), and as Vice President and Director of Fidelity's International Equity Trading group (1998-2005). |
Eric M. Wetlaufer (45) |
| Year of Election or Appointment: 2006 Vice President of International Small Cap Opportunities. Mr. Wetlaufer also serves as Vice President of certain International Equity Funds (2006-present). Mr. Wetlaufer is Senior Vice President of FMR (2006-present) and FMR Co., Inc. (2006-present), and President and Director of Fidelity Management & Research (U.K.) Inc. (2006-present) and Fidelity Research & Analysis Company (2006-present). Before joining Fidelity Investments in 2005, Mr. Wetlaufer was a partner in Oxhead Capital Management (2004-2005). Previously, Mr. Wetlaufer served as a Chief Investment Officer of Putnam Investments (1997-2003). |
Eric D. Roiter (58) |
| Year of Election or Appointment: 2005 Secretary of International Small Cap Opportunities. He also serves as Secretary of other Fidelity funds; Vice President, General Counsel, and Secretary of FMR Co., Inc. (2001-present) and FMR; Assistant Secretary of Fidelity Management & Research (U.K.) Inc. (2001-present), Fidelity Research & Analysis Company (2001-present), and Fidelity Investments Money Management, Inc. (2001-present). Mr. Roiter is an Adjunct Member, Faculty of Law, at Boston College Law School (2003-present). Previously, Mr. Roiter served as Vice President and Secretary of Fidelity Distributors Corporation (FDC) (1998-2005). |
Scott C. Goebel (39) |
| Year of Election or Appointment: 2007 Assistant Secretary of International Small Cap Opportunities. Mr. Goebel also serves as Assistant Secretary of other Fidelity funds (2007-present), and is an employee of FMR. |
R. Stephen Ganis (41) |
| Year of Election or Appointment: 2006 Anti-Money Laundering (AML) officer of International Small Cap Opportunities. Mr. Ganis also serves as AML officer of other Fidelity funds (2006-present) and FMR LLC (2003-present). Before joining Fidelity Investments, Mr. Ganis practiced law at Goodwin Procter, LLP (2000-2002). |
Joseph B. Hollis (59) |
| Year of Election or Appointment: 2006 Chief Financial Officer of International Small Cap Opportunities. Mr. Hollis also serves as Chief Financial Officer of other Fidelity funds. Mr. Hollis is President of Fidelity Pricing and Cash Management Services (FPCMS) (2005-present). Mr. Hollis also serves as President and Director of Fidelity Service Company, Inc. (2006-present). Previously, Mr. Hollis served as Senior Vice President of Cash Management Services (1999-2002) and Investment Management Operations (2002-2005). |
Kenneth A. Rathgeber (60) |
| Year of Election or Appointment: 2005 Chief Compliance Officer of International Small Cap Opportunities. Mr. Rathgeber also serves as Chief Compliance Officer of other Fidelity funds (2004-present) and Executive Vice President of Risk Oversight for Fidelity Investments (2002-present). He is Chief Compliance Officer of FMR (2005-present), FMR Co., Inc. (2005-present), Fidelity Management & Research (U.K.) Inc. (2005-present), Fidelity Research & Analysis Company (2005-present), Fidelity Investments Money Management, Inc. (2005-present), and Strategic Advisers, Inc. (2005-present). Previously, Mr. Rathgeber served as Executive Vice President and Chief Operating Officer for Fidelity Investments Institutional Services Company, Inc. (1998-2002). |
Bryan A. Mehrmann (46) |
| Year of Election or Appointment: 2005 Deputy Treasurer of International Small Cap Opportunities. Mr. Mehrmann also serves as Deputy Treasurer of other Fidelity funds (2005-present) and is an employee of FMR. Previously, Mr. Mehrmann served as Vice President of Fidelity Investments Institutional Services Group (FIIS)/Fidelity Investments Institutional Operations Corporation, Inc. (FIIOC) Client Services (1998-2004). |
Kenneth B. Robins (38) |
| Year of Election or Appointment: 2005 Deputy Treasurer of International Small Cap Opportunities. Mr. Robins also serves as Deputy Treasurer of other Fidelity funds (2005-present) and is an employee of FMR (2004-present). Before joining Fidelity Investments, Mr. Robins worked at KPMG LLP, where he was a partner in KPMG's department of professional practice (2002-2004) and a Senior Manager (1999-2000). In addition, Mr. Robins served as Assistant Chief Accountant, United States Securities and Exchange Commission (2000-2002). |
Robert G. Byrnes (40) |
| Year of Election or Appointment: 2005 Assistant Treasurer of International Small Cap Opportunities. Mr. Byrnes also serves as Assistant Treasurer of other Fidelity funds (2005-present) and is an employee of FMR (2005-present). Previously, Mr. Byrnes served as Vice President of FPCMS (2003-2005). Before joining Fidelity Investments, Mr. Byrnes worked at Deutsche Asset Management where he served as Vice President of the Investment Operations Group (2000-2003). |
Peter L. Lydecker (53) |
| Year of Election or Appointment: 2005 Assistant Treasurer of International Small Cap Opportunities. Mr. Lydecker also serves as Assistant Treasurer of other Fidelity funds (2004) and is an employee of FMR. |
Paul M. Murphy (60) |
| Year of Election or Appointment: 2007 Assistant Treasurer of the fund. Mr. Murphy also serves as Assistant Treasurer of other Fidelity funds (2007-present) and is an employee of FMR (2007-present). Previously, Mr. Murphy served as Chief Financial Officer of the Fidelity Funds (2005-2006), Vice President and Associate General Counsel of FMR (2007), and Senior Vice President of Fidelity Pricing and Cash Management Services Group (FPCMS) (1994-2007). |
Gary W. Ryan (49) |
| Year of Election or Appointment: 2005 Assistant Treasurer of International Small Cap Opportunities. Mr. Ryan also serves as Assistant Treasurer of other Fidelity funds (2005-present) and is an employee of FMR (2005-present). Previously, Mr. Ryan served as Vice President of Fund Reporting in FPCMS (1999-2005). |
** FMR Corp. merged with FMR LLC on October 1, 2007. Any references to FMR LLC for prior periods are deemed to be references to the prior entity.
Annual Report
Distributions
The Board of Trustees of Fidelity International Small Cap Opportunities Fund voted to pay to shareholders of record at the opening of business on record date, the following distributions per share derived from capital gains realized from sales of portfolio securities, and dividends derived from net investment income:
| Pay Date | Record Date | Dividends | Capital Gains |
International Small Cap Opportunities | 12/10/07 | 12/07/07 | $0.064 | $1.878 |
The fund hereby designates as a capital gain dividend with respect to the taxable year ended October 31, 2007 $142,362,068, or, if subsequently determined to be different, the net capital gain of such year.
The fund will notify shareholders in January 2008 of amounts for use in preparing 2007 income tax returns.
Annual Report
Board Approval of Investment Advisory Contracts and Management Fees
Fidelity International Small Cap Opportunities Fund
Each year, typically in July, the Board of Trustees, including the Independent Trustees (together, the Board), votes on the renewal of the management contract and sub-advisory agreements (together, the Advisory Contracts) for the fund. The Board, assisted by the advice of fund counsel and Independent Trustees' counsel, requests and considers a broad range of information throughout the year.
The Board meets regularly each month except August and takes into account throughout the year matters bearing on Advisory Contracts. The Board, acting directly and through its separate committees, considers at each of its meetings factors that are relevant to the annual renewal of the fund's Advisory Contracts, including the services and support provided to the fund and its shareholders. At the time of the renewal, the Board had 12 standing committees, each composed of Independent Trustees with varying backgrounds, to which the Board has assigned specific subject matter responsibilities in order to enhance effective decision-making by the Board. Each committee has adopted a written charter outlining the structure and purposes of the committee. One such committee, the Equity Contract Committee, meets periodically as needed throughout the year to consider matters specifically related to the annual renewal of Advisory Contracts. The committee requests and receives information on, and makes recommendations to the Independent Trustees concerning, the approval and annual review of the Advisory Contracts.
At its July 2007 meeting, the Board of Trustees, including the Independent Trustees, unanimously determined to renew the Advisory Contracts for the fund. In reaching its determination, the Board considered all factors it believed relevant, including (i) the nature, extent, and quality of the services to be provided to the fund and its shareholders (including the investment performance of the fund); (ii) the competitiveness of the management fee and total expenses of the fund; (iii) the total costs of the services to be provided by and the profits to be realized by the investment adviser and its affiliates from the relationship with the fund; (iv) the extent to which economies of scale would be realized as the fund grows; and (v) whether fee levels reflect these economies of scale, if any, for the benefit of fund shareholders. The Board also approved amendments to the fund's agreements with foreign sub-advisers to clarify that each sub-adviser provides services as an independent contractor.
In determining whether to renew the Advisory Contracts for the fund, the Board ultimately reached a determination, with the assistance of fund counsel and Independent Trustees' counsel, that the renewal of the Advisory Contracts and the compensation to be received by Fidelity under the management contract is consistent with Fidelity's fiduciary duty under applicable law. In addition to evaluating the specific factors noted above, the Board, in reaching its determination, is aware that shareholders in the fund have a broad range of investment choices available to them, including a wide choice among mutual funds offered by competitors to Fidelity, and that the fund's shareholders, with the opportunity to review and weigh the disclosure provided by the fund in its prospectus and other public disclosures, have chosen to invest in this fund, managed by Fidelity.
Annual Report
Board Approval of Investment Advisory Contracts and
Management Fees - continued
Nature, Extent, and Quality of Services Provided. The Board considered staffing within the investment adviser, FMR, and the sub-advisers (together, the Investment Advisers), including the background of the fund's portfolio manager and the fund's investment objective and discipline. The Independent Trustees also had discussions with senior management of Fidelity's investment operations and investment groups. The Board considered the structure of the portfolio manager compensation program and whether this structure provides appropriate incentives.
Resources Dedicated to Investment Management and Support Services. The Board reviewed the size, education, and experience of the Investment Advisers' investment staff, their use of technology, and the Investment Advisers' approach to recruiting, training, and retaining portfolio managers and other research, advisory, and management personnel. The Board considered Fidelity's extensive global research capabilities that enable the Investment Advisers to aggregate data from various sources in an effort to produce positive investment results. The Board noted that Fidelity's analysts have access to a variety of technological tools that enable them to perform both fundamental and quantitative analysis and to specialize in various disciplines. The Board also considered that Fidelity's portfolio managers and analysts have access to daily portfolio attribution that allows for monitoring of a fund's portfolio, as well as an electronic communication system that provides immediate real-time access to research concerning issuers and credit enhancers.
Shareholder and Administrative Services. The Board considered (i) the nature, extent, quality, and cost of advisory, administrative, distribution, and shareholder services performed by the Investment Advisers and their affiliates under the Advisory Contracts and under separate agreements covering transfer agency, pricing and bookkeeping, and securities lending services for the fund; (ii) the nature and extent of the Investment Advisers' supervision of third party service providers, principally custodians and subcustodians; and (iii) the resources devoted to, and the record of compliance with, the fund's compliance policies and procedures. The Board reviewed the allocation of fund brokerage, including allocations to brokers affiliated with the Investment Advisers, the use of brokerage commissions to pay fund expenses, and the use of "soft" commission dollars to pay for research services. The Board also considered that Fidelity voluntarily pays for market data out of its own resources.
The Board noted that the growth of fund assets across the complex allows Fidelity to reinvest in the development of services designed to enhance the value or convenience of the Fidelity funds as investment vehicles. These services include 24-hour access to account information and market information through phone representatives and over the Internet, and investor education materials and asset allocation tools.
Annual Report
Investment in a Large Fund Family. The Board considered the benefits to shareholders of investing in a Fidelity fund, including the benefits of investing in a fund that is part of a large family of funds offering a variety of investment disciplines and providing for a large variety of mutual fund investor services. For example, fund shareholders are offered the privilege of exchanging shares of the fund for shares of other Fidelity funds, as set forth in the fund's prospectus, without paying a sales charge. The Board noted that, since the last Advisory Contract renewals in July 2006, Fidelity has taken a number of actions that benefited particular funds, including (i) dedicating additional resources to investment research and to restructure the investment research teams; (ii) contractually agreeing to reduce the management fee on Fidelity Advisor Floating Rate High Income Fund; (iii) contractually agreeing to reduce the management fees on Fidelity's California, Massachusetts, New Jersey, and New York AMT Tax-Free Money Market Funds, launching new Institutional Classes and Service Classes of these funds, and contractually agreeing to impose expense limitations on these funds; (iv) eliminating the exchange fee on the Fidelity Select Portfolios and reducing the pricing and bookkeeping fee rates for these funds; (v) reducing the maximum transfer agency fee rates on high income funds and certain equity funds; (vi) proposing amended management contracts that, if approved by shareholders, will add a performance adjustment component to the management fees paid by 18 Fidelity Advisor equity funds; (vii) contractually agreeing to reduce fees for Ultra-Short Central Fund and the money market Central Funds; (viii) waiving the Fidelity Advisor funds' contingent deferred sales charge on certain redemptions made through systematic withdrawal programs; and (ix) amending the management contracts for equity and fixed-income funds whose management contracts incorporate a "group fee" structure by adding four new fee "breakpoints" to the group fee rate schedules.
Investment Performance and Compliance. The Board considered whether the fund has operated within its investment objective, as well as its record of compliance with its investment restrictions. It also reviewed the fund's absolute investment performance for each class, as well as the fund's relative investment performance for each class measured against (i) a broad-based securities market index, and (ii) a peer group of mutual funds deemed appropriate by the Board. Because the fund had been in existence less than three calendar years, the following chart considered by the Board shows, for the one-year period ended December 31, 2006, the total returns of Fidelity International Small Cap Opportunities (retail class) and Class C of the fund, the total return of a broad-based securities market index ("benchmark"), and a range of total returns of a peer group of mutual funds identified by Lipper Inc. as having an investment objective similar to that of the fund. The returns of Fidelity International Small Cap Opportunities (retail class) and Class C show the performance of the highest and lowest performing classes, respectively. The box within the chart shows the 25th percentile return (bottom of box) and the 75th percentile return (top of box) of the peer group. Returns shown above the box are in the first quartile and returns shown below the box are in the fourth quartile. The percentage beaten numbers noted below the chart correspond to the percentile box and represent the percentage of funds in the peer group whose performance was equal to or lower than that of the class indicated.
Annual Report
Board Approval of Investment Advisory Contracts and
Management Fees - continued
Fidelity International Small Cap Opportunities Fund
The Board reviewed the fund's relative investment performance against its peer group and stated that the performance of Fidelity International Small Cap Opportunities (retail class) was in the third quartile for the period shown. The Board also stated that the investment performance of Fidelity International Small Cap Opportunities (retail class) compared favorably to its benchmark for the period shown. The Board considered that the variations in performance among the fund's classes reflect the variations in class expenses, which result in lower performance for higher expense classes. The Board stated that it is difficult to evaluate in any comprehensive fashion the performance of the fund, in light of its relatively recent commencement of operations.
The Board also considered that the fund's management fee is subject to upward or downward adjustment depending upon whether, and to what extent, the fund's investment performance for the performance period exceeds, or is exceeded by, the record (over the same period) of a Board-approved performance adjustment index. The Board realizes that the performance adjustment provides FMR with a strong economic incentive to seek to achieve superior performance for the fund's shareholders and helps to more closely align the interests of FMR and the fund's shareholders.
Annual Report
The Board considered that FMR has taken steps to refocus and strengthen equity research, equity portfolio management, and compliance.
Based on its review, and giving particular weight to the nature and quality of the resources dedicated by the Investment Advisers to maintain and improve relative performance, the Board concluded that the nature, extent, and quality of the services provided to the fund will benefit the fund's shareholders, particularly in light of the Board's view that the fund's shareholders benefit from investing in a fund that is part of a large family of funds offering a variety of investment disciplines and services.
Competitiveness of Management Fee and Total Fund Expenses. The Board considered the fund's management fee and total expenses compared to "mapped groups" of competitive funds and classes. Fidelity creates "mapped groups" by combining similar Lipper investment objective categories that have comparable management fee characteristics. Combining Lipper investment objective categories aids the Board's management fee and total expense comparisons by broadening the competitive group used for comparison and by reducing the number of universes to which various Fidelity funds are compared. The Board also considered supplemental information about how the fund's management fee and total expenses ranked relative to groups based on Lipper classifications, which take into account a fund's market capitalization and style.
The Board considered two proprietary management fee comparisons for the 12-month (or shorter) periods shown in the chart below. The group of Lipper funds used by the Board for management fee comparisons is referred to below as the "Total Mapped Group" and, for the reasons explained above, is broader than the Lipper peer group used by the Board for performance comparisons. The Total Mapped Group comparison focuses on a fund's standing relative to the total universe of comparable funds available to investors, in terms of gross management fees before expense reimbursements or caps, and without giving effect to the fund's performance adjustment. "TMG %" represents the percentage of funds in the Total Mapped Group that had management fees that were lower than the fund's. For example, a TMG % of 23% means that 77% of the funds in the Total Mapped Group had higher management fees than the fund. The "Asset-Size Peer Group" (ASPG) comparison focuses on a fund's standing relative to non-Fidelity funds similar in size to the fund within the Total Mapped Group. The ASPG represents at least 15% of the funds in the Total Mapped Group with comparable asset size and management fee characteristics, subject to a minimum of 50 funds (or all funds in the Total Mapped Group if fewer than 50). Additional information, such as the ASPG quartile in which the fund's management fee ranked and the impact of the fund's performance adjustment, is also included in the chart and considered by the Board.
Annual Report
Board Approval of Investment Advisory Contracts and
Management Fees - continued
Fidelity International Small Cap Opportunities Fund

The Board noted that the fund's management fee ranked below the median of its Total Mapped Group and below the median of its ASPG for 2006. The Board also noted the effect of the fund's positive performance adjustment on the fund's management fee ranking. The Board noted that the performance adjustment for 2006 represents calculations for performance periods that differ from the period shown in the performance chart above.
Based on its review, the Board concluded that the fund's management fee was fair and reasonable in light of the services that the fund receives and the other factors considered.
In its review of each class's total expenses, the Board considered the fund's management fee as well as other fund or class expenses, as applicable, such as transfer agent fees, pricing and bookkeeping fees, fund-paid 12b-1 fees, and custodial, legal, and audit fees. The Board also noted the effects of any waivers and reimbursements on fees and expenses, as well as the fund's positive performance adjustment. As part of its review, the Board also considered current and historical total expenses of each class of the fund compared to competitive fund median expenses. Each class of the fund is compared to those funds and classes in the Total Mapped Group (used by the Board for management fee comparisons) that have a similar sales load structure.
The Board noted that the total expenses of each of Class A, Class B, Class C, Institutional Class and Fidelity International Small Cap Opportunities (retail class) ranked below its competitive median for 2006, and the total expenses of Class T ranked above its competitive median for 2006. The Board noted that the fund offers multiple classes, each of which has a different sales load and 12b-1 fee structure, and that the multiple structures are intended to offer a range of pricing options for the intermediary market. The Board also noted that the total expenses of the classes vary primarily by the level of their 12b-1 fees, although differences in transfer agent fees may also cause expenses to vary from class to class.
Annual Report
In its review of total expenses, the Board also considered Fidelity fee structures and other information on clients that FMR and its affiliates service in other competitive markets, such as other mutual funds advised or subadvised by FMR or its affiliates, pension plan clients, and other institutional clients.
Based on its review, the Board concluded that the total expenses of each class of the fund were reasonable, although in one case above the median of the universe presented for comparison, in light of the services that the fund and its shareholders receive and the other factors considered.
Costs of the Services and Profitability. The Board considered the revenues earned and the expenses incurred by Fidelity in conducting the business of developing, marketing, distributing, managing, administering and servicing the fund and its shareholders. The Board also considered the level of Fidelity's profits in respect of all the Fidelity funds.
On an annual basis, FMR presents to the Board Fidelity's profitability for the fund. Fidelity calculates the profitability for each fund, as well as aggregate profitability for groups of Fidelity funds and all Fidelity funds, using a series of detailed revenue and cost allocation methodologies which originate with the audited books and records of Fidelity. The Audit Committee of the Board reviews any significant changes from the prior year's methodologies.
PricewaterhouseCoopers LLP (PwC), independent registered public accounting firm and auditor to Fidelity and certain Fidelity funds, has been engaged annually by the Board as part of the Board's assessment of the results of Fidelity's profitability analysis. PwC's engagement includes the review and assessment of Fidelity's methodologies used in determining the revenues and expenses attributable to Fidelity's mutual fund business, and completion of agreed-upon procedures surrounding the mathematical accuracy of fund profitability and its conformity to allocation methodologies. After considering PwC's reports issued under the engagement and information provided by Fidelity, the Board believes that while other allocation methods may also be reasonable, Fidelity's profitability methodologies are reasonable in all material respects.
The Board has also reviewed Fidelity's non-fund businesses and any fall-out benefits related to the mutual fund business as well as cases where Fidelity's affiliates may benefit from or be related to the fund's business.
The Board considered the costs of the services provided by and the profits realized by Fidelity in connection with the operation of the fund and determined that the amount of profit is a fair entrepreneurial profit for the management of the fund.
Annual Report
Board Approval of Investment Advisory Contracts and
Management Fees - continued
Economies of Scale. The Board considered whether there have been economies of scale in respect of the management of the Fidelity funds, whether the Fidelity funds (including the fund) have appropriately benefited from any such economies of scale, and whether there is potential for realization of any further economies of scale. The Board considered the extent to which the fund will benefit from economies of scale through increased services to the fund, through waivers or reimbursements, or through fee or expense reductions, including reductions that occur through operation of the transfer agent agreement. The transfer agent fee varies in part based on the number of accounts in the fund. If the number of accounts decreases or the average account size increases, the overall transfer agent fee rate decreases.
The Board recognized that the fund's management contract incorporates a "group fee" structure, which provides for lower group fee rates as total fund assets under FMR's management increase, and for higher group fee rates as total fund assets under FMR's management decrease. FMR determines the group fee rates based on a tiered asset "breakpoint" schedule. In connection with the renewal of the fund's management contract, the Board approved amendments to the fund's management contract that added four new fee breakpoints to the group fee rate schedule for assets under FMR's management above $1,386 billion. The Board considered that the group fee rate declines under both the present and amended schedules, but that under the amended schedule, the group fee rate declines faster as assets under FMR's management exceed $1,386 billion. The Board considered that the group fee is designed to deliver the benefits of economies of scale to fund shareholders when total fund assets increase, even if assets of any particular fund are unchanged or have declined, because some portion of Fidelity's costs are attributable to services provided to all Fidelity funds, and all funds benefit if those costs can be allocated among more assets. The Board concluded that, given the group fee structure, fund shareholders will achieve a certain level of economies of scale as assets under FMR's management increase at the fund complex level, regardless of whether Fidelity achieves any such economies of scale.
The Board further concluded that any potential economies of scale are being shared between fund shareholders and Fidelity in an appropriate manner.
Additional Information Requested by the Board. In order to develop fully the factual basis for consideration of the Fidelity funds' Advisory Contracts, the Board requested and received additional information on several topics, including (i) fund performance trends and actions to be taken by FMR to improve certain funds' overall performance; (ii) Fidelity's portfolio manager compensation structure, including its effects on fund profitability and the extent to which portfolio manager compensation is linked to fund performance; (iii) Fidelity's fee structures; (iv) the funds' sub-advisory arrangements; and (v) accounts managed by Fidelity other than the Fidelity funds.
Annual Report
Based on its evaluation of all of the conclusions noted above, and after considering all material factors, the Board ultimately concluded that the advisory fee structures are fair and reasonable, and that the fund's Advisory Contracts should be renewed.
Annual Report
To Visit Fidelity
For directions and hours,
please call 1-800-544-9797.
Arizona
7001 West Ray Road
Chandler, AZ
15445 N. Scottsdale Road
Scottsdale, AZ
California
815 East Birch Street
Brea, CA
1411 Chapin Avenue
Burlingame, CA
851 East Hamilton Avenue
Campbell, CA
19200 Von Karman Avenue
Irvine, CA
601 Larkspur Landing Circle
Larkspur, CA
10100 Santa Monica Blvd.
Los Angeles, CA
27101 Puerta Real
Mission Viejo, CA
73-575 El Paseo
Palm Desert, CA
251 University Avenue
Palo Alto, CA
123 South Lake Avenue
Pasadena, CA
16995 Bernardo Ctr. Drive
Rancho Bernardo, CA
1220 Roseville Parkway
Roseville, CA
1740 Arden Way
Sacramento, CA
7676 Hazard Center Drive
San Diego, CA
11943 El Camino Real
San Diego, CA
8 Montgomery Street
San Francisco, CA
3793 State Street
Santa Barbara, CA
1200 Wilshire Boulevard
Santa Monica, CA
21701 Hawthorne Boulevard
Torrance, CA
2001 North Main Street
Walnut Creek, CA
6300 Canoga Avenue
Woodland Hills, CA
Colorado
1625 Broadway
Denver, CO
9185 Westview Road
Lone Tree, CO
Connecticut
48 West Putnam Avenue
Greenwich, CT
265 Church Street
New Haven, CT
300 Atlantic Street
Stamford, CT
29 South Main Street
West Hartford, CT
Delaware
400 Delaware Avenue
Wilmington, DE
Florida
4400 N. Federal Highway
Boca Raton, FL
121 Alhambra Plaza
Coral Gables, FL
2948 N. Federal Highway
Ft. Lauderdale, FL
4671 Town Center Parkway
Jacksonville, FL
1907 West State Road 434
Longwood, FL
8880 Tamiami Trail, North
Naples, FL
3501 PGA Boulevard
Palm Beach Gardens, FL
3550 Tamiami Trail, South
Sarasota, FL
1502 N. Westshore Blvd.
Tampa, FL
2465 State Road 7
Wellington, FL
Georgia
3445 Peachtree Road, N.E.
Atlanta, GA
1000 Abernathy Road
Atlanta, GA
Illinois
One North LaSalle Street
Chicago, IL
875 North Michigan Ave.
Chicago, IL
1415 West 22nd Street
Oak Brook, IL
1572 East Golf Road
Schaumburg, IL
3232 Lake Avenue
Wilmette, IL
Indiana
4729 East 82nd Street
Indianapolis, IN
Kansas
5400 College Boulevard
Overland Park, KS
Maine
Three Canal Plaza
Portland, ME
Maryland
7315 Wisconsin Avenue
Bethesda, MD
One W. Pennsylvania Ave.
Towson, MD
Massachusetts
801 Boylston Street
Boston, MA
155 Congress Street
Boston, MA
300 Granite Street
Braintree, MA
44 Mall Road
Burlington, MA
238 Main Street
Cambridge, MA
405 Cochituate Road
Framingham, MA
416 Belmont Street
Worcester, MA
Annual Report
Michigan
500 E. Eisenhower Pkwy.
Ann Arbor, MI
280 Old N. Woodward Ave.
Birmingham, MI
43420 Grand River Avenue
Novi, MI
29155 Northwestern Hwy.
Southfield, MI
Minnesota
7600 France Avenue South
Edina, MN
Missouri
1524 South Lindbergh Blvd.
St. Louis, MO
Nevada
2225 Village Walk Drive
Henderson, NV
New Jersey
150 Essex Street
Millburn, NJ
56 South Street
Morristown, NJ
396 Route 17, North
Paramus, NJ
3518 Route 1 North
Princeton, NJ
530 Broad Street
Shrewsbury, NJ
New York
1055 Franklin Avenue
Garden City, NY
37 West Jericho Turnpike
Huntington Station, NY
1271 Avenue of the Americas
New York, NY
980 Madison Avenue
New York, NY
61 Broadway
New York, NY
350 Park Avenue
New York, NY
200 Fifth Avenue
New York, NY
733 Third Avenue
New York, NY
11 Penn Plaza
New York, NY
2070 Broadway
New York, NY
1075 Northern Blvd.
Roslyn, NY
799 Central Park Avenue
Scarsdale, NY
North Carolina
4611 Sharon Road
Charlotte, NC
7011 Fayetteville Road
Durham, NC
Ohio
3805 Edwards Road
Cincinnati, OH
1324 Polaris Parkway
Columbus, OH
28699 Chagrin Boulevard
Woodmere Village, OH
Oregon
7493 SW Bridgeport Road
Tigard, OR
Pennsylvania
600 West DeKalb Pike
King of Prussia, PA
1735 Market Street
Philadelphia, PA
12001 Perry Highway
Wexford, PA
Rhode Island
47 Providence Place
Providence, RI
Tennessee
6150 Poplar Avenue
Memphis, TN
Texas
10000 Research Boulevard
Austin, TX
4001 Northwest Parkway
Dallas, TX
12532 Memorial Drive
Houston, TX
2701 Drexel Drive
Houston, TX
6560 Fannin Street
Houston, TX
6500 N. MacArthur Blvd.
Irving, TX
6005 West Park Boulevard
Plano, TX
14100 San Pedro
San Antonio, TX
1576 East Southlake Blvd.
Southlake, TX
19740 IH 45 North
Spring, TX
Utah
279 West South Temple
Salt Lake City, UT
Virginia
1861 International Drive
McLean, VA
Washington
411 108th Avenue, N.E.
Bellevue, WA
1518 6th Avenue
Seattle, WA
Washington, DC
1900 K Street, N.W.
Washington, DC
Wisconsin
595 North Barker Road
Brookfield, WI
Fidelity Brokerage Services, Inc., 100 Summer St., Boston, MA 02110 Member NYSE/SIPC
Annual Report
To Write Fidelity
We'll give your correspondence immediate attention and send you written confirmation upon completion of your request.
(letter_graphic)
Making Changes
To Your Account
(such as changing name, address, bank, etc.)
Fidelity Investments
P.O. Box 770001
Cincinnati, OH 45277-0002
(letter_graphic)
For Non-Retirement
Accounts
Buying shares
Fidelity Investments
P.O. Box 770001
Cincinnati, OH 45277-0003
Overnight Express
Fidelity Investments
Attn: Distribution Services
100 Crosby Parkway - KC1H
Covington, KY 41015
Selling shares
Fidelity Investments
P.O. Box 770001
Cincinnati, OH 45277-0035
Overnight Express
Fidelity Investments
Attn: Distribution Services
100 Crosby Parkway - KC1H
Covington, KY 41015
General Correspondence
Fidelity Investments
P.O. Box 500
Merrimack, NH 03054-0500
(letter_graphic)
For Retirement
Accounts
Buying shares
Fidelity Investments
P.O. Box 770001
Cincinnati, OH 45277-0003
Selling shares
Fidelity Investments
P.O. Box 770001
Cincinnati, OH 45277-0035
Overnight Express
Fidelity Investments
Attn: Distribution Services
100 Crosby Parkway - KC1H
Covington, KY 41015
General Correspondence
Fidelity Investments
P.O. Box 500
Merrimack, NH 03054-0500
Annual Report
Managing Your Investments
Fidelity offers several ways to conveniently manage your personal investments via your telephone or PC. You can access your account information, conduct trades and research your investments 24 hours a day.
By Phone
Fidelity Automated Service Telephone provides a single toll-free number to access account balances, positions, quotes and trading. It's easy to navigate the service, and on your first call, the system will help you create a personal identification number (PIN) for security.
(phone_graphic)
Fidelity Automated
Service Telephone (FAST®)
1-800-544-5555
Press
1 For mutual fund and brokerage trading.
2 For quotes.*
3 For account balances and holdings.
4 To review orders and mutual
fund activity.
5 To change your PIN.
*0 To speak to a Fidelity representative.
By PC
Fidelity's web site on the Internet provides a wide range of information, including daily financial news, fund performance, interactive planning tools and news about Fidelity products and services.
(computer_graphic)
Fidelity's Web Site
www.fidelity.com
* When you call the quotes line, please remember that a fund's yield and return will vary and, except for money market funds, share price will also vary. This means that you may have a gain or loss when you sell your shares. There is no assurance that money market funds will be able to maintain a stable $1 share price; an investment in a money market fund is not insured or guaranteed by the U.S. government. Total returns are historical and include changes in share price, reinvestment of dividends and capital gains, and the effects of any sales charges.
Annual Report
Annual Report
Annual Report
Investment Adviser
Fidelity Management & Research Company
Boston, MA
Investment Sub-Advisers
FMR Co., Inc.
Fidelity Research & Analysis Company
Fidelity Management & Research
(U.K.) Inc.
Fidelity Investments Japan Limited
Fidelity International Investment
Advisors
Fidelity International Investment
Advisors (U.K.) Limited
General Distributor
Fidelity Distributors Corporation
Boston, MA
Transfer and Service Agent
Fidelity Service Company, Inc.
Boston, MA
Custodian
The Northern Trust Company
Chicago, IL
The Fidelity Telephone Connection
Mutual Fund 24-Hour Service
Exchanges/Redemptions
and Account Assistance 1-800-544-6666
Product Information 1-800-544-6666
Retirement Accounts 1-800-544-4774
(8 a.m. - 9 p.m.)
TDD Service 1-800-544-0118
for the deaf and hearing impaired
(9 a.m. - 9 p.m. Eastern time)
Fidelity Automated Service
Telephone (FAST®) (automated graphic) 1-800-544-5555
(automated graphic) Automated line for quickest service
ILS-UANN-1207
1.815061.103
(Fidelity Investment logo)(registered trademark)
Corporate Headquarters
82 Devonshire St., Boston, MA 02109
www.fidelity.com
(Fidelity Investment logo)(registered trademark)
Fidelity Advisor
International Small Cap Opportunities
Fund - Class A, Class T, Class B
and Class C
Annual Report
October 31, 2007
Class A, Class T, Class B
and Class C are classes of
Fidelity® International
Small Cap Opportunities Fund
(2_fidelity_logos) (Registered_Trademark)
Contents
Chairman's Message | <Click Here> | Ned Johnson's message to shareholders. |
Performance | <Click Here> | How the fund has done over time. |
Management's Discussion | <Click Here> | The manager's review of fund performance, strategy and outlook. |
Shareholder Expense Example | <Click Here> | An example of shareholder expenses. |
Investment Changes | <Click Here> | A summary of major shifts in the fund's investments over the past six months. |
Investments | <Click Here> | A complete list of the fund's investments with their market values. |
Financial Statements | <Click Here> | Statements of assets and liabilities, operations, and changes in net assets,
as well as financial highlights. |
Notes | <Click Here> | Notes to the financial statements. |
Report of Independent Registered Public Accounting Firm | <Click Here> | |
Trustees and Officers | <Click Here> | |
Distributions | <Click Here> | |
Board Approval of Investment Advisory Contracts and Management Fees | <Click Here> | |
To view a fund's proxy voting guidelines and proxy voting record for the 12-month period ended June 30, visit http://www.fidelity.com (see "proxy voting guidelines") or visit the Securities and Exchange Commission's (SEC) web site at http://www.sec.gov. You may also call 1-877-208-0098 to request a free copy of the proxy voting guidelines.
Standard & Poor's, S&P and S&P 500 are registered service marks of The McGraw-Hill Companies, Inc. and have been licensed for use by Fidelity Distributors Corporation.
Other third party marks appearing herein are the property of their respective owners.
All other marks appearing herein are registered or unregistered trademarks or service marks of FMR LLC or an affiliated company.
Annual Report
This report and the financial statements contained herein are submitted for the general information of the shareholders of the fund. This report is not authorized for distribution to prospective investors in the fund unless preceded or accompanied by an effective prospectus.
A fund files its complete schedule of portfolio holdings with the SEC for the first and third quarters of each fiscal year on Form N-Q. Forms N-Q are available on the SEC's web site at http://www.sec.gov. A fund's Forms N-Q may be reviewed and copied at the SEC's Public Reference Room in Washington, DC. Information regarding the operation of the SEC's Public Reference Room may be obtained by calling 1-800-SEC-0330. For a complete list of a fund's portfolio holdings, view the most recent holdings listing, semiannual report, or annual report on Fidelity's web site at http://www.fidelity.com or http://www.advisor.fidelity.com, as applicable.
NOT FDIC INSURED · MAY LOSE VALUE · NO BANK GUARANTEE
Neither the fund nor Fidelity Distributors Corporation is a bank.
Annual Report
Chairman's Message
(photo_of_Edward_C_Johnson_3d)
Dear Shareholder:
Many stock and bond markets around the world have been unsettled of late; however, volatility can often lead to opportunity for patient investors. Financial markets are always unpredictable, but there are a number of time-tested principles that can put the historical odds in your favor.
One of the basic tenets is to invest for the long term. Over time, riding out the markets' inevitable ups and downs has proven much more effective than selling into panic or chasing the hottest trend. Even missing only a few of the markets' best days can significantly diminish investor returns. Patience also affords the benefits of compounding - of earning interest on additional income or reinvested dividends and capital gains. There are tax advantages and cost benefits to consider as well. The more you sell, the more taxes you pay, and the more you trade, the higher the costs. While staying the course doesn't eliminate risk, it can considerably lessen the effect of short-term declines.
You can further manage your investing risk through diversification. And today, more than ever, geographic diversification should be taken into account. Studies indicate that asset allocation is the single most important determinant of a portfolio's long-term success. The right mix of stocks, bonds and cash - aligned to your particular risk tolerance and investment objective - is very important. Age-appropriate rebalancing is also an essential aspect of asset allocation. For younger investors, an emphasis on equities - which historically have been the best-performing asset class over time - is encouraged. As investors near their specific goal, such as retirement or sending a child to college, consideration may be given to replacing volatile assets (e.g. common stocks) with more-stable fixed investments (bonds or savings plans).
A third investment principle - investing regularly - can help lower the average cost of your purchases. Investing a certain amount of money each month or quarter helps ensure you won't pay for all your shares at market highs. This strategy - known as dollar cost averaging - also reduces unconstructive "emotion" from investing, helping shareholders avoid selling weak performers just prior to an upswing, or chasing a hot performer just before a correction.
We invite you to contact us via the Internet, through our Investor Centers or over the phone. It is our privilege to provide you the information you need to make the investments that are right for you.
Sincerely,
/s/Edward C. Johnson 3d
Edward C. Johnson 3d
Annual Report
Performance: The Bottom Line
Average annual total return reflects the change in the value of an investment, assuming reinvestment of the class' dividend income and capital gains (the profits earned upon the sale of securities that have grown in value) and assuming a constant rate of performance each year. The $10,000 table and the fund's returns do not reflect the deduction of taxes that a shareholder would pay on fund distributions or the redemption of fund shares. During periods of reimbursement by Fidelity, a fund's total return will be greater than it would be had the reimbursement not occurred. How a fund did yesterday is no guarantee of how it will do tomorrow.
Average Annual Total Returns
Periods ended October 31, 2007 | | Past 1
year | Life of
fund A |
Class A (incl. 5.75% sales charge) | | 26.09% | 29.53% |
Class T (incl. 3.50% sales charge) | | 28.83% | 30.51% |
Class B (incl. contingent deferred sales charge) B | | 27.76% | 30.99% |
Class C (incl. contingent deferred sales charge) C | | 31.79% | 31.90% |
A From August 2, 2005.
B Class B shares' contingent deferred sales charges included in the past one year and life of fund total return figures are 5% and 3%, respectively.
C Class C shares' contingent deferred sales charge included in the past one year and life of fund total return figures are 1% and 0%, respectively.
Annual Report
Fidelity Advisor International Small Cap Opportunities Fund -
Class A, T, B, and C
Performance - continued
$10,000 Over Life of Fund
Let's say hypothetically that $10,000 was invested in Fidelity Advisor International Small Cap Opportunities Fund - Class T on August 2, 2005, when the fund started, and the current 3.50% sales charge was paid. The chart shows how the value of your investment would have changed, and also shows how the Morgan Stanley Capital InternationalSM Europe, Australasia, Far East (MSCI® EAFE® ) Small Cap Index performed over the same period.
Annual Report
Management's Discussion of Fund Performance
Comments from Andrew Sassine, Portfolio Manager of Fidelity Advisor International Small Cap Opportunities Fund
Foreign stocks, with a large assist from a weak U.S. dollar, generally had higher returns for U.S. investors than domestic equities during the 12-month period ending October 31, 2007. The backdrop for global stocks was solid, with robust economic growth and relatively high corporate profitability worldwide. Developed international equity markets, as measured by the Morgan Stanley Capital InternationalSM Europe, Australasia, and Far East (MSCI® EAFE®) Index - a performance monitor of established markets outside the United States and Canada - rose 25.09%. In comparison, the Standard & Poor's 500SM Index, a gauge of U.S. stocks, was up 14.56%. Among countries making up at least 1% of the EAFE benchmark, Finland had the best showing, soaring nearly 69%, while Hong Kong gained roughly 66%. The United Kingdom and Japan, the two largest components of the index, both underperformed. Fallout from the credit crunch and concerns about export growth tempered UK stocks, while Japan struggled with a slowdown in consumer spending and sluggish domestic growth. Emerging markets were the period's big winners, advancing 68.33% as measured by the MSCI Emerging Markets index.
The fund's Class A, Class T, Class B and Class C shares gained 33.78%, 33.50%, 32.76% and 32.79%, respectively (excluding sales charges), for the period, well ahead of the 22.17% return of the MSCI EAFE Small Cap index. Productive stock selection drove most of the fund's outperformance. An overweighting in Germany, combined with particularly good stock selection in the industrials sector there, contributed nicely to relative performance. The fund's stakes in German capital goods firms GEA Group, a diversified engineering company, and Q-Cells, a manufacturer of solar cells, contributed nicely to the fund's significant outperformance. Favorable stock selection within our large exposure to Japan also drove the fund's upward momentum, with our holdings there returning 7.46%, compared with a 2.17% decline for the benchmark's constituent elements. Other contributors included Lihir Gold, a Papua New Guinea-based producer, which benefited from an increase in gold prices; and Nintendo, the Japanese video game maker. Unfavorable stock selection within financials, especially in diversified financials and real estate, detracted from relative performance. Among the detractors were KK daVinci Advisors, a property investment advisory business in Japan, and Soitec, a French semiconductor company, which was the fund's single-largest relative detractor during the period.
The views expressed above reflect those of the portfolio manager(s) only through the end of the period as stated on the cover of this report and do not necessarily represent the views of Fidelity or any other person in the Fidelity organization. Any such views are subject to change at any time based upon market or other conditions and Fidelity disclaims any responsibility to update such views. These views may not be relied on as investment advice and, because investment decisions for a Fidelity fund are based on numerous factors, may not be relied on as an indication of trading intent on behalf of any Fidelity fund.
Annual Report
Shareholder Expense Example
As a shareholder of the Fund, you incur two types of costs: (1) transaction costs, including sales charges (loads) on purchase payments or redemption proceeds, redemption fees, and (2) ongoing costs, including management fees, distribution and/or service (12b-1) fees and other Fund expenses. This Example is intended to help you understand your ongoing costs (in dollars) of investing in the Fund and to compare these costs with the ongoing costs of investing in other mutual funds.
The Example is based on an investment of $1,000 invested at the beginning of the period and held for the entire period (May 1, 2007 to October 31, 2007).
Actual Expenses
The first line of the accompanying table for each class of the Fund provides information about actual account values and actual expenses. You may use the information in this line, together with the amount you invested, to estimate the expenses that you paid over the period. Simply divide your account value by $1,000.00 (for example, an $8,600 account value divided by $1,000.00 = 8.6), then multiply the result by the number in the first line for a class of the Fund under the heading entitled "Expenses Paid During Period" to estimate the expenses you paid on your account during this period. A small balance maintenance fee of $12.00 that is charged once a year may apply for certain accounts with a value of less than $2,000. This fee is not included in the table below. If it was, the estimate of expenses you paid during the period would be higher, and your ending account value lower, by this amount. In addition, the Fund, as a shareholder in the underlying Fidelity Central Funds, will indirectly bear its pro rata share of the fees and expenses incurred by the underlying Fidelity Central Funds. These fees and expenses are not included in the Fund's annualized expense ratio used to calculate the expense estimate in the table below.
Hypothetical Example for Comparison Purposes
The second line of the accompanying table for each class of the Fund provides information about hypothetical account values and hypothetical expenses based on a Class' actual expense ratio and an assumed rate of return of 5% per year before expenses, which is not the Class' actual return. The hypothetical account values and expenses may not be used to estimate the actual ending account balance or expenses you paid for the period. You may use this information to compare the ongoing costs of investing in the Fund and other funds. To do so, compare this 5% hypothetical example with the 5% hypothetical examples that appear in the shareholder reports of the other funds. A small balance maintenance fee of $12.00 that is charged once a year may apply for certain accounts with a value of less than $2,000. This fee is not included in the table below. If it was, the estimate of expenses you paid during the period would be higher, and your ending account value lower, by this amount. In addition, the Fund, as a shareholder in the underlying Fidelity Central Funds, will indirectly bear its pro rata share of the fees and expenses incurred by the underlying Fidelity Central Funds. These fees and expenses are not included in the Fund's annualized expense ratio used to calculate the expense estimate in the table below.
Please note that the expenses shown in the table are meant to highlight your ongoing costs only and do not reflect any transaction costs. Therefore, the second line of the table is useful in comparing ongoing costs only, and will not help you determine the relative total costs of owning different funds. In addition, if these transactional costs were included, your costs would have been higher.
Annual Report
| Beginning
Account Value
May 1, 2007 | Ending
Account Value
October 31, 2007 | Expenses Paid
During Period*
May 1, 2007 to
October 31, 2007 |
Class A | | | |
Actual | $ 1,000.00 | $ 1,098.40 | $ 8.62 |
Hypothetical A | $ 1,000.00 | $ 1,016.99 | $ 8.29 |
Class T | | | |
Actual | $ 1,000.00 | $ 1,097.20 | $ 9.83 |
Hypothetical A | $ 1,000.00 | $ 1,015.83 | $ 9.45 |
Class B | | | |
Actual | $ 1,000.00 | $ 1,094.50 | $ 12.67 |
Hypothetical A | $ 1,000.00 | $ 1,013.11 | $ 12.18 |
Class C | | | |
Actual | $ 1,000.00 | $ 1,094.60 | $ 12.57 |
Hypothetical A | $ 1,000.00 | $ 1,013.21 | $ 12.08 |
International Small Cap Opportunities | | | |
Actual | $ 1,000.00 | $ 1,100.30 | $ 6.88 |
Hypothetical A | $ 1,000.00 | $ 1,018.65 | $ 6.61 |
Institutional Class | | | |
Actual | $ 1,000.00 | $ 1,100.90 | $ 6.83 |
Hypothetical A | $ 1,000.00 | $ 1,018.70 | $ 6.56 |
A 5% return per year before expenses
* Expenses are equal to each Class' annualized expense ratio (shown in the table below); multiplied by the average account value over the period, multiplied by 184/365 (to reflect the one-half year period).
| Annualized
Expense Ratio |
Class A | 1.63% |
Class T | 1.86% |
Class B | 2.40% |
Class C | 2.38% |
International Small Cap Opportunities | 1.30% |
Institutional Class | 1.29% |
Annual Report
Investment Changes
Geographic Diversification (% of fund's net assets) |
As of October 31, 2007 |
| Japan 28.5% | |
| United States of America 12.1% | |
| United Kingdom 10.0% | |
| Germany 8.6% | |
| Norway 6.1% | |
| Papua New Guinea 5.3% | |
| Netherlands 4.5% | |
| France 3.5% | |
| Cayman Islands 3.0% | |
| Other 18.4% | |

Percentages are adjusted for the effect of futures contracts, if applicable. |
|
As of April 30, 2007 |
| Japan 21.0% | |
| Germany 12.9% | |
| United States of America 8.5% | |
| United Kingdom 8.5% | |
| Norway 7.2% | |
| Australia 5.8% | |
| France 4.9% | |
| Netherlands 3.7% | |
| China 2.8% | |
| Other 24.7% | |

Percentages are adjusted for the effect of futures contracts, if applicable. |
Asset Allocation |
| % of fund's
net assets | % of fund's net assets
6 months ago |
Stocks | 95.0 | 99.0 |
Short-Term Investments and Net Other Assets | 5.0 | 1.0 |
Top Ten Stocks as of October 31, 2007 |
| % of fund's
net assets | % of fund's net assets
6 months ago |
Lihir Gold Ltd. (Papua New Guinea, Metals & Mining) | 5.3 | 2.1 |
Titanium Metals Corp. (United States of America, Metals & Mining) | 3.2 | 2.4 |
Renovo Group PLC (United Kingdom, Pharmaceuticals) | 2.2 | 1.5 |
AGCO Corp. (United States of America, Machinery) | 2.2 | 1.5 |
GEA Group AG (Germany, Machinery) | 2.0 | 1.9 |
Nexans SA (France, Electrical Equipment) | 2.0 | 0.6 |
Autonomy Corp. PLC (United Kingdom, Software) | 1.9 | 0.9 |
Tokuyama Corp. (Japan, Chemicals) | 1.8 | 1.4 |
Cermaq ASA (Norway, Food Products) | 1.8 | 1.4 |
SGL Carbon AG (Germany, Electrical Equipment) | 1.8 | 0.8 |
| 24.2 | |
Market Sectors as of October 31, 2007 |
| % of fund's
net assets | % of fund's net assets
6 months ago |
Industrials | 28.1 | 30.5 |
Information Technology | 17.0 | 15.1 |
Materials | 16.1 | 11.9 |
Consumer Staples | 10.6 | 11.4 |
Financials | 8.3 | 12.7 |
Health Care | 5.5 | 3.9 |
Energy | 4.6 | 6.7 |
Consumer Discretionary | 4.4 | 4.3 |
Telecommunication Services | 0.4 | 1.9 |
Utilities | 0.0 | 0.6 |
Annual Report
Investments October 31, 2007
Showing Percentage of Net Assets
Common Stocks - 95.0% |
| Shares | | Value |
Australia - 2.4% |
Downer EDI Ltd. | 3,797,343 | | $ 23,679,615 |
Gunns Ltd. | 954,690 | | 3,365,484 |
Oxiana Ltd. | 356,736 | | 1,421,724 |
Silex Systems Ltd. | 950,000 | | 6,919,372 |
United Group Ltd. | 199,999 | | 4,002,940 |
TOTAL AUSTRALIA | | 39,389,135 |
Austria - 0.3% |
Andritz AG | 74,896 | | 5,509,018 |
Belgium - 0.4% |
Umicore SA | 28,300 | | 7,052,179 |
Bermuda - 1.9% |
China Grand Forestry Resources Group Ltd. (a) | 19,000,000 | | 6,752,330 |
China LotSynergy Holdings Ltd. (a) | 11,568,000 | | 1,682,922 |
Pacific Basin Shipping Ltd. | 3,442,000 | | 7,711,465 |
Proactive Technology Holdings Ltd. (a) | 4,202,000 | | 4,547,928 |
Sinofert Holdings Ltd. | 10,836,000 | | 10,221,274 |
TOTAL BERMUDA | | 30,915,919 |
Brazil - 1.4% |
Cosan SA Industria E Comercio | 1,070,000 | | 16,729,380 |
Sao Martinho SA | 440,100 | | 5,718,426 |
TOTAL BRAZIL | | 22,447,806 |
Cayman Islands - 3.0% |
CNinsure, Inc. ADR (a) | 300,900 | | 7,609,761 |
Himax Technologies, Inc. sponsored ADR | 4,604,200 | | 17,495,960 |
LDK Solar Co. Ltd. Sponsored ADR (d) | 387,800 | | 15,360,758 |
Subsea 7, Inc. (a)(d) | 296,500 | | 8,701,901 |
TOTAL CAYMAN ISLANDS | | 49,168,380 |
China - 2.7% |
China Oilfield Services Ltd. (H Shares) | 1,500,000 | | 3,673,279 |
China Techfaith Wireless Communication Technology Ltd. sponsored ADR (a)(d) | 1,227,479 | | 8,776,475 |
First Tractor Co. Ltd. (H Shares) (a)(e) | 18,940,000 | | 11,999,397 |
Global Bio-Chem Technology Group Co. Ltd. | 50,703,300 | | 18,800,322 |
TOTAL CHINA | | 43,249,473 |
Common Stocks - continued |
| Shares | | Value |
Finland - 1.9% |
KCI Konecranes Oyj | 300,000 | | $ 13,430,376 |
Outotec Oyj | 225,406 | | 17,210,145 |
TOTAL FINLAND | | 30,640,521 |
France - 3.5% |
Neopost SA | 18,400 | | 2,137,165 |
Nexans SA | 195,000 | | 33,136,302 |
Soitec SA (a)(d) | 1,009,801 | | 19,238,446 |
Ubisoft Entertainment SA (a) | 40,000 | | 3,285,299 |
TOTAL FRANCE | | 57,797,212 |
Germany - 8.6% |
Bilfinger Berger AG | 100,600 | | 8,956,293 |
Demag Cranes AG | 283,000 | | 16,297,914 |
Deutz AG (a)(d) | 741,982 | | 10,190,844 |
GEA Group AG (a) | 884,800 | | 33,201,165 |
Hochtief AG | 31,712 | | 4,378,956 |
Kontron AG | 400,319 | | 10,143,888 |
MTU Aero Engines Holding AG | 230,554 | | 14,075,883 |
Q-Cells AG (a) | 116,285 | | 14,808,839 |
SGL Carbon AG (a) | 493,908 | | 28,816,162 |
TOTAL GERMANY | | 140,869,944 |
Greece - 0.9% |
Bank of Piraeus | 174,129 | | 6,983,058 |
Hellenic Technodomiki Tev SA | 500,000 | | 7,591,712 |
TOTAL GREECE | | 14,574,770 |
Hong Kong - 0.4% |
China State Construction International Holdings Ltd. | 3,400,000 | | 7,121,855 |
Italy - 0.7% |
Impregilo SpA (a) | 1,500,000 | | 12,017,796 |
Japan - 28.5% |
Acca Networks Co. Ltd. (d) | 2,361 | | 4,703,296 |
Access Co. Ltd. (a)(d) | 2,000 | | 9,612,789 |
Adeka Corp. | 98,500 | | 987,414 |
Air Water, Inc. | 1,273,000 | | 14,433,669 |
Alps Electric Co. Ltd. | 200,000 | | 2,504,490 |
Asics Corp. | 1,223,000 | | 19,506,429 |
Atrium Co. Ltd. | 172,000 | | 4,797,225 |
Brother Industries Ltd. | 300,000 | | 4,017,501 |
Capcom Co. Ltd. (d) | 180,000 | | 5,148,945 |
Common Stocks - continued |
| Shares | | Value |
Japan - continued |
CyberAgent, Inc. | 8,000 | | $ 5,534,586 |
E*TRADE Securities Co. Ltd. (d) | 10,000 | | 10,737,892 |
Hikari Tsushin, Inc. | 220,000 | | 6,719,450 |
Ichiyoshi Securities Co. Ltd. (d) | 734,700 | | 8,036,096 |
Iino Kaiun Kaisha Ltd. | 350,000 | | 4,955,413 |
JAFCO Co. Ltd. | 199,000 | | 8,203,361 |
Japan General Estate Co. Ltd. (d) | 297,200 | | 5,692,246 |
Japan Steel Works Ltd. | 647,000 | | 10,585,612 |
JGC Corp. | 750,000 | | 15,022,632 |
Joint Corp. (d) | 166,300 | | 4,726,458 |
Kenedix, Inc. (d) | 5,000 | | 11,035,874 |
KK daVinci Advisors (a) | 8,769 | | 9,150,571 |
Kurita Water Industries Ltd. | 264,000 | | 8,821,083 |
Leopalace21 Corp. | 245,000 | | 7,822,808 |
Makino Milling Machine Co. Ltd. | 200,000 | | 2,092,996 |
Miraial Co. Ltd. | 96,800 | | 4,443,273 |
Mitsumi Electric Co. Ltd. | 234,000 | | 10,784,696 |
Nabtesco Corp. | 457,000 | | 7,814,578 |
Namco Bandai Holdings, Inc. | 669,000 | | 10,316,650 |
Nidec Sankyo Corp. | 1,098,000 | | 8,589,446 |
Nintendo Co. Ltd. | 26,600 | | 16,704,800 |
Nippon Carbon Co. Ltd. | 1,282,000 | | 8,090,195 |
Okuma Corp. | 310,000 | | 4,369,299 |
Organo Corp. (d) | 429,000 | | 7,198,167 |
Osaka Titanium Technolo Co. Ltd. (d) | 95,000 | | 8,366,316 |
Pal Co. Ltd. (d) | 300,000 | | 6,028,914 |
Rakuten, Inc. | 20,000 | | 9,783,077 |
Risa Partners, Inc. (d) | 1,146 | | 2,562,567 |
SBI Holdings, Inc. | 30,000 | | 9,519,414 |
Shima Seiki Manufacturing Ltd. | 75,000 | | 3,841,648 |
Sojitz Corp. | 3,746,300 | | 17,200,555 |
Sparx Group Co. Ltd. (d) | 19,856 | | 12,623,535 |
Star Micronics Co. Ltd. | 100,000 | | 3,157,645 |
Sugi Pharmacy Co. Ltd. | 239,000 | | 6,924,033 |
Sumco Corp. | 341,100 | | 12,451,892 |
Sumco Techxiv Corp. | 109,500 | | 5,941,755 |
Sumitomo Bakelite Co. Ltd. | 300,000 | | 1,840,019 |
Tamron Co. Ltd. (d) | 50,000 | | 1,942,350 |
Teijin Ltd. | 2,250,000 | | 10,858,801 |
The Sumitomo Warehouse Co. Ltd. (d) | 288,000 | | 1,659,815 |
Toho Titanium Co. Ltd. (d) | 200,000 | | 7,310,416 |
Tokai Carbon Co. Ltd. | 1,007,000 | | 12,631,174 |
Common Stocks - continued |
| Shares | | Value |
Japan - continued |
Tokuyama Corp. (d) | 2,090,000 | | $ 29,198,797 |
Tokyo Tatemono Co. Ltd. | 643,000 | | 8,274,088 |
Toshiba Machine Co. Ltd. | 1,774,000 | | 13,552,801 |
Urban Corp. | 226,300 | | 3,964,968 |
Wacom Co. Ltd. (d) | 1,700 | | 4,204,732 |
Xebio Co. Ltd. | 55,000 | | 1,623,135 |
Zenrin Co. Ltd. (d) | 196,300 | | 5,855,039 |
TOTAL JAPAN | | 464,477,426 |
Luxembourg - 1.4% |
Acergy SA | 773,900 | | 22,396,666 |
Netherlands - 4.5% |
Advanced Metallurgical Group NV | 146,000 | | 10,417,596 |
Koninklijke Wessanen NV | 1,017,015 | | 17,165,708 |
Nutreco Holding NV | 299,000 | | 20,424,965 |
OPG Groep NV (A Shares)(Certificaten Van Aandelen) unit | 150,000 | | 5,191,775 |
QIAGEN NV (a)(d) | 845,000 | | 19,891,300 |
TOTAL NETHERLANDS | | 73,091,344 |
Norway - 6.1% |
Aker Kvaerner ASA | 227,500 | | 7,927,420 |
Aker Yards AS | 279,000 | | 4,614,041 |
Cermaq ASA | 1,898,500 | | 29,097,480 |
ElectroMagnetic GeoServices ASA (d) | 262,300 | | 4,179,009 |
Marine Harvest ASA (a)(d) | 27,707,000 | | 28,086,477 |
Norwegian Property ASA | 400,400 | | 4,998,938 |
Petroleum Geo-Services ASA | 331,600 | | 9,762,937 |
ProSafe ASA | 332,000 | | 5,889,574 |
TGS Nopec Geophysical Co. ASA (a) | 316,700 | | 5,311,283 |
TOTAL NORWAY | | 99,867,159 |
Papua New Guinea - 5.3% |
Lihir Gold Ltd. (a) | 14,300,867 | | 56,776,143 |
Lihir Gold Ltd. sponsored ADR | 720,000 | | 28,850,400 |
TOTAL PAPUA NEW GUINEA | | 85,626,543 |
Portugal - 0.7% |
Banif SGPS SA | 1,610,654 | | 11,970,935 |
Sweden - 0.6% |
Bergman & Beving AB (B Shares) | 285,000 | | 9,419,634 |
Switzerland - 1.1% |
BB Biotech AG | 200,000 | | 17,560,218 |
Common Stocks - continued |
| Shares | | Value |
Taiwan - 1.6% |
HannStar Display Corp. (a) | 55,715,292 | | $ 25,712,104 |
United Kingdom - 10.0% |
ARM Holdings PLC | 2,500,000 | | 7,718,473 |
ARM Holdings PLC sponsored ADR | 1,700,000 | | 15,793,000 |
Autonomy Corp. PLC (a) | 1,558,400 | | 31,832,917 |
Avis Europe PLC (a) | 8,235,698 | | 6,848,971 |
Gyrus Group PLC (a) | 1,267,171 | | 11,262,538 |
Invensys PLC (a) | 3,400,000 | | 23,114,878 |
Laird Group PLC | 462,461 | | 6,105,395 |
Max Petroleum PLC (a) | 4,000,000 | | 8,524,105 |
Morgan Crucible Co. PLC | 400,300 | | 2,642,374 |
Premier Foods PLC | 1,490,000 | | 6,985,504 |
Renovo Group PLC (a) | 8,652,203 | | 36,336,493 |
Wolfson Microelectronics PLC (a) | 1,100,000 | | 5,803,148 |
TOTAL UNITED KINGDOM | | 162,967,796 |
United States of America - 7.1% |
AGCO Corp. (a) | 604,000 | | 36,046,720 |
Chiquita Brands International, Inc. (a) | 1,087,400 | | 20,388,750 |
NII Holdings, Inc. (a) | 116,800 | | 6,774,400 |
Titanium Metals Corp. (a)(d) | 1,478,354 | | 52,038,061 |
TOTAL UNITED STATES OF AMERICA | | 115,247,931 |
TOTAL COMMON STOCKS (Cost $1,213,398,162) | 1,549,091,764 |
Money Market Funds - 17.9% |
| | | |
Fidelity Cash Central Fund, 4.97% (b) | 87,899,285 | | 87,899,285 |
Fidelity Securities Lending Cash Central Fund, 5.02% (b)(c) | 203,798,078 | | 203,798,078 |
TOTAL MONEY MARKET FUNDS (Cost $291,697,363) | 291,697,363 |
TOTAL INVESTMENT PORTFOLIO - 112.9% (Cost $1,505,095,525) | | 1,840,789,127 |
NET OTHER ASSETS - (12.9)% | | (210,114,339) |
NET ASSETS - 100% | $ 1,630,674,788 |
Legend |
(a) Non-income producing |
(b) Affiliated fund that is available only to investment companies and other accounts managed by Fidelity Investments. The rate quoted is the annualized seven-day yield of the fund at period end. A complete unaudited listing of the fund's holdings as of its most recent quarter end is available upon request. |
(c) Investment made with cash collateral received from securities on loan. |
(d) Security or a portion of the security is on loan at period end. |
(e) Affiliated company |
Affiliated Central Funds |
Information regarding fiscal year to date income earned by the Fund from investments in Fidelity Central Funds is as follows: |
Fund | Income earned |
Fidelity Cash Central Fund | $ 1,071,947 |
Fidelity Securities Lending Cash Central Fund | 3,230,403 |
Total | $ 4,302,350 |
Other Affiliated Issuers |
An affiliated company is a company in which the fund has ownership of at least 5% of the voting securities. Fiscal year to date transactions with companies which are or were affiliates are as follows: |
Affiliate | Value, beginning of period | Purchases | Sales Proceeds | Dividend Income | Value,
end of
period |
First Tractor Co. Ltd.
(H Shares) | $ - | $ 8,262,406 | $ - | $ - | $ 11,999,397 |
See accompanying notes which are an integral part of the financial statements.
Annual Report
Financial Statements
Statement of Assets and Liabilities
| October 31, 2007 |
Assets | | |
Investment in securities, at value (including securities loaned of $196,735,174) - See accompanying schedule: Unaffiliated issuers (cost $1,205,135,756) | $ 1,537,092,367 | |
Fidelity Central Funds (cost $291,697,363) | 291,697,363 | |
Other affiliated issuers (cost $8,262,406) | 11,999,397 | |
Total Investments (cost $1,505,095,525) | | $ 1,840,789,127 |
Cash | | 1,144,511 |
Foreign currency held at value (cost $27,135) | | 27,216 |
Receivable for investments sold | | 28,451,867 |
Receivable for fund shares sold | | 2,457,360 |
Dividends receivable | | 1,026,691 |
Distributions receivable from Fidelity Central Funds | | 419,873 |
Other receivables | | 194,384 |
Total assets | | 1,874,511,029 |
| | |
Liabilities | | |
Payable for investments purchased | $ 33,306,202 | |
Payable for fund shares redeemed | 4,823,887 | |
Accrued management fee | 1,328,025 | |
Distribution fees payable | 74,625 | |
Other affiliated payables | 339,595 | |
Other payables and accrued expenses | 165,829 | |
Collateral on securities loaned, at value | 203,798,078 | |
Total liabilities | | 243,836,241 |
| | |
Net Assets | | $ 1,630,674,788 |
Net Assets consist of: | | |
Paid in capital | | $ 1,111,748,526 |
Undistributed net investment income | | 5,724,841 |
Accumulated undistributed net realized gain (loss) on investments and foreign currency transactions | | 177,567,767 |
Net unrealized appreciation (depreciation) on investments and assets and liabilities in foreign currencies | | 335,633,654 |
Net Assets | | $ 1,630,674,788 |
See accompanying notes which are an integral part of the financial statements.
Annual Report
Statement of Assets and Liabilities - continued
| October 31, 2007 |
Calculation of Maximum Offering Price Class A: Net Asset Value and redemption price per share ($70,785,030 ÷ 3,730,934 shares) | | $ 18.97 |
| | |
Maximum offering price per share (100/94.25 of $18.97) | | $ 20.13 |
Class T: Net Asset Value and redemption price per share ($46,568,311 ÷ 2,470,157 shares) | | $ 18.85 |
| | |
Maximum offering price per share (100/96.50 of $18.85) | | $ 19.53 |
Class B: Net Asset Value and offering price per share ($10,975,101 ÷ 588,875 shares)A | | $ 18.64 |
| | |
Class C: Net Asset Value and offering price per share ($40,893,627 ÷ 2,195,080 shares)A | | $ 18.63 |
| | |
| | |
International Small Cap Opportunities: Net Asset Value, offering price and redemption price per share ($1,433,843,833 ÷ 75,093,223 shares) | | $ 19.09 |
| | |
Institutional Class: Net Asset Value, offering price and redemption price per share ($27,608,886 ÷ 1,446,444 shares) | | $ 19.09 |
A Redemption price per share is equal to net asset value less any applicable contingent deferred sales charge.
See accompanying notes which are an integral part of the financial statements.
Annual Report
Financial Statements - continued
Statement of Operations
| Year ended October 31, 2007 |
Investment Income | | |
Dividends | | $ 23,621,857 |
Interest | | 2,191 |
Income from Fidelity Central Funds (including $3,230,403 from security lending) | | 4,302,350 |
| | 27,926,398 |
Less foreign taxes withheld | | (2,109,992) |
Total income | | 25,816,406 |
| | |
Expenses | | |
Management fee
Basic fee | $ 13,126,935 | |
Performance adjustment | 2,024,924 | |
Transfer agent fees | 3,340,897 | |
Distribution fees | 777,090 | |
Accounting and security lending fees | 728,123 | |
Custodian fees and expenses | 381,680 | |
Independent trustees' compensation | 5,036 | |
Registration fees | 158,009 | |
Audit | 82,409 | |
Interest | 26,963 | |
Miscellaneous | 58,967 | |
Total expenses before reductions | 20,711,033 | |
Expense reductions | (619,468) | 20,091,565 |
Net investment income (loss) | | 5,724,841 |
Realized and Unrealized Gain (Loss) Net realized gain (loss) on: | | |
Investment securities: | | |
Unaffiliated issuers (net of foreign taxes of $(2,678)) | 184,750,494 | |
Foreign currency transactions | (160,375) | |
Total net realized gain (loss) | | 184,590,119 |
Change in net unrealized appreciation (depreciation) on: Investment securities | 219,262,212 | |
Assets and liabilities in foreign currencies | (58,778) | |
Total change in net unrealized appreciation (depreciation) | | 219,203,434 |
Net gain (loss) | | 403,793,553 |
Net increase (decrease) in net assets resulting from operations | | $ 409,518,394 |
See accompanying notes which are an integral part of the financial statements.
Annual Report
Statement of Changes in Net Assets
| Year ended
October 31,
2007 | Year ended
October 31,
2006 |
Increase (Decrease) in Net Assets | | |
Operations | | |
Net investment income (loss) | $ 5,724,841 | $ 3,177,589 |
Net realized gain (loss) | 184,590,119 | (953,704) |
Change in net unrealized appreciation (depreciation) | 219,203,434 | 115,235,200 |
Net increase (decrease) in net assets resulting
from operations | 409,518,394 | 117,459,085 |
Distributions to shareholders from net realized gain | - | (90,957) |
Share transactions - net increase (decrease) | 127,196,896 | 760,497,703 |
Redemption fees | 783,954 | 1,853,226 |
Total increase (decrease) in net assets | 537,499,244 | 879,719,057 |
| | |
Net Assets | | |
Beginning of period | 1,093,175,544 | 213,456,487 |
End of period (including undistributed net investment income of $5,724,841 and undistributed net investment income of $3,179,958, respectively) | $ 1,630,674,788 | $ 1,093,175,544 |
See accompanying notes which are an integral part of the financial statements.
Annual Report
Financial Highlights - Class A
Years ended October 31, | 2007 | 2006 | 2005 H |
Selected Per-Share Data | | | |
Net asset value, beginning of period | $ 14.18 | $ 10.41 | $ 10.00 |
Income from Investment Operations | | | |
Net investment income (loss) E | .02 | - J | -J |
Net realized and unrealized gain (loss) | 4.76 | 3.74 | .40 |
Total from investment operations | 4.78 | 3.74 | .40 |
Distributions from net realized gain | - | - J | - |
Redemption fees added to paid in capital E | .01 | .03 | .01 |
Net asset value, end of period | $ 18.97 | $ 14.18 | $ 10.41 |
Total Return B,C,D | 33.78% | 36.25% | 4.10% |
Ratios to Average Net AssetsF,I | | | |
Expenses before reductions | 1.63% | 1.63% | 2.67% A |
Expenses net of fee waivers, if any | 1.63% | 1.63% | 1.65% A |
Expenses net of all reductions | 1.59% | 1.51% | 1.54% A |
Net investment income (loss) | .10% | .02% | (.09)%A |
Supplemental Data | | | |
Net assets, end of period (000 omitted) | $ 70,785 | $ 35,674 | $ 5,533 |
Portfolio turnover rate G | 107% | 164% | 46% |
A Annualized
B Total returns for periods of less than one year are not annualized.
C Total returns would have been lower had certain expenses not been reduced during the periods shown.
D Total returns do not include the effect of the sales charges.
E Calculated based on average shares outstanding during the period.
F Fees and expenses of the underlying Fidelity Central Funds are not included in the Fund's expense ratio. The Fund indirectly bears its proportionate share of the expenses of any underlying Fidelity Central Funds.
G Amount does not include the portfolio activity of any underlying Fidelity Central Funds.
H For the period August 2, 2005 (commencement of operations) to October 31, 2005.
I Expense ratios reflect operating expenses of the class. Expenses before reductions do not reflect amounts reimbursed by the investment adviser or reductions from brokerage service arrangements or other expense offset arrangements and do not represent the amount paid by the class during periods when reimbursements or reductions occur. Expense ratios before reductions for start-up periods may not be representative of longer-term operating periods. Expenses net of fee waivers reflect expenses after reimbursement by the investment adviser but prior to reductions from brokerage service arrangements or other expense offset arrangements. Expenses net of all reductions represent the net expenses paid by the class.
J Amount represents less than $.01 per share.
See accompanying notes which are an integral part of the financial statements.
Annual Report
Financial Highlights - Class T
Years ended October 31, | 2007 | 2006 | 2005 H |
Selected Per-Share Data | | | |
Net asset value, beginning of period | $ 14.12 | $ 10.38 | $ 10.00 |
Income from Investment Operations | | | |
Net investment income (loss) E | (.02) | (.03) | (.01) |
Net realized and unrealized gain (loss) | 4.74 | 3.74 | .38 |
Total from investment operations | 4.72 | 3.71 | .37 |
Redemption fees added to paid in capital E | .01 | .03 | .01 |
Net asset value, end of period | $ 18.85 | $ 14.12 | $ 10.38 |
Total Return B,C,D | 33.50% | 36.03% | 3.80% |
Ratios to Average Net Assets F,I | | | |
Expenses before reductions | 1.85% | 1.85% | 2.92% A |
Expenses net of fee waivers, if any | 1.85% | 1.85% | 1.90% A |
Expenses net of all reductions | 1.81% | 1.74% | 1.78% A |
Net investment income (loss) | (.13)% | (.20)% | (.33)%A |
Supplemental Data | | | |
Net assets, end of period (000 omitted) | $ 46,568 | $ 28,309 | $ 2,704 |
Portfolio turnover rate G | 107% | 164% | 46% |
A Annualized
B Total returns for periods of less than one year are not annualized.
C Total returns would have been lower had certain expenses not been reduced during the periods shown.
D Total returns do not include the effect of the sales charges.
E Calculated based on average shares outstanding during the period.
F Fees and expenses of the underlying Fidelity Central Funds are not included in the Fund's expense ratio. The Fund indirectly bears its proportionate share of the expenses of any underlying Fidelity Central Funds.
G Amount does not include the portfolio activity of any underlying Fidelity Central Funds.
H For the period August 2, 2005 (commencement of operations) to October 31, 2005.
I Expense ratios reflect operating expenses of the class. Expenses before reductions do not reflect amounts reimbursed by the investment adviser or reductions from brokerage service arrangements or other expense offset arrangements and do not represent the amount paid by the class during periods when reimbursements or reductions occur. Expense ratios before reductions for start-up periods may not be representative of longer-term operating periods. Expenses net of fee waivers reflect expenses after reimbursement by the investment adviser but prior to reductions from brokerage service arrangements or other expense offset arrangements. Expenses net of all reductions represent the net expenses paid by the class.
See accompanying notes which are an integral part of the financial statements.
Annual Report
Financial Highlights - Class B
Years ended October 31, | 2007 | 2006 | 2005 H |
Selected Per-Share Data | | | |
Net asset value, beginning of period | $ 14.04 | $ 10.37 | $ 10.00 |
Income from Investment Operations | | | |
Net investment income (loss) E | (.11) | (.10) | (.02) |
Net realized and unrealized gain (loss) | 4.70 | 3.74 | .38 |
Total from investment operations | 4.59 | 3.64 | .36 |
Redemption fees added to paid in capital E | .01 | .03 | .01 |
Net asset value, end of period | $ 18.64 | $ 14.04 | $ 10.37 |
Total Return B,C,D | 32.76% | 35.39% | 3.70% |
Ratios to Average Net Assets F,I | | | |
Expenses before reductions | 2.40% | 2.45% | 3.43% A |
Expenses net of fee waivers, if any | 2.40% | 2.41% | 2.40% A |
Expenses net of all reductions | 2.36% | 2.30% | 2.27% A |
Net investment income (loss) | (.67)% | (.76)% | (.82)%A |
Supplemental Data | | | |
Net assets, end of period (000 omitted) | $ 10,975 | $ 7,709 | $ 1,705 |
Portfolio turnover rate G | 107% | 164% | 46% |
A Annualized
B Total returns for periods of less than one year are not annualized.
C Total returns would have been lower had certain expenses not been reduced during the periods shown.
D Total returns do not include the effect of the contingent deferred sales charge.
E Calculated based on average shares outstanding during the period.
F Fees and expenses of the underlying Fidelity Central Funds are not included in the Fund's expense ratio. The Fund indirectly bears its proportionate share of the expenses of any underlying Fidelity Central Funds.
G Amount does not include the portfolio activity of any underlying Fidelity Central Funds.
H For the period August 2, 2005 (commencement of operations) to October 31, 2005.
I Expense ratios reflect operating expenses of the class. Expenses before reductions do not reflect amounts reimbursed by the investment adviser or reductions from brokerage service arrangements or other expense offset arrangements and do not represent the amount paid by the class during periods when reimbursements or reductions occur. Expense ratios before reductions for start-up periods may not be representative of longer-term operating periods. Expenses net of fee waivers reflect expenses after reimbursement by the investment adviser but prior to reductions from brokerage service arrangements or other expense offset arrangements. Expenses net of all reductions represent the net expenses paid by the class.
See accompanying notes which are an integral part of the financial statements.
Annual Report
Financial Highlights - Class C
Years ended October 31, | 2007 | 2006 | 2005 H |
Selected Per-Share Data | | | |
Net asset value, beginning of period | $ 14.03 | $ 10.37 | $ 10.00 |
Income from Investment Operations | | | |
Net investment income (loss) E | (.11) | (.10) | (.02) |
Net realized and unrealized gain (loss) | 4.70 | 3.73 | .38 |
Total from investment operations | 4.59 | 3.63 | .36 |
Redemption fees added to paid in capital E | .01 | .03 | .01 |
Net asset value, end of period | $ 18.63 | $ 14.03 | $ 10.37 |
Total Return B,C,D | 32.79% | 35.29% | 3.70% |
Ratios to Average Net Assets F,I | | | |
Expenses before reductions | 2.38% | 2.38% | 3.32% A |
Expenses net of fee waivers, if any | 2.38% | 2.38% | 2.40% A |
Expenses net of all reductions | 2.34% | 2.27% | 2.29% A |
Net investment income (loss) | (.66)% | (.73)% | (.84)%A |
Supplemental Data | | | |
Net assets, end of period (000 omitted) | $ 40,894 | $ 26,320 | $ 3,317 |
Portfolio turnover rate G | 107% | 164% | 46% |
A Annualized
B Total returns for periods of less than one year are not annualized.
C Total returns would have been lower had certain expenses not been reduced during the periods shown.
D Total returns do not include the effect of the contingent deferred sales charge.
E Calculated based on average shares outstanding during the period.
F Fees and expenses of the underlying Fidelity Central Funds are not included in the Fund's expense ratio. The Fund indirectly bears its proportionate share of the expenses of any underlying Fidelity Central Funds.
G Amount does not include the portfolio activity of any underlying Fidelity Central Funds.
H For the period August 2, 2005 (commencement of operations) to October 31, 2005.
I Expense ratios reflect operating expenses of the class. Expenses before reductions do not reflect amounts reimbursed by the investment adviser or reductions from brokerage service arrangements or other expense offset arrangements and do not represent the amount paid by the class during periods when reimbursements or reductions occur. Expense ratios before reductions for start-up periods may not be representative of longer-term operating periods. Expenses net of fee waivers reflect expenses after reimbursement by the investment adviser but prior to reductions from brokerage service arrangements or other expense offset arrangements. Expenses net of all reductions represent the net expenses paid by the class.
See accompanying notes which are an integral part of the financial statements.
Annual Report
Financial Highlights - International Small Cap Opportunities
Years ended October 31, | 2007 | 2006 | 2005 G |
Selected Per-Share Data | | | |
Net asset value, beginning of period | $ 14.23 | $ 10.40 | $ 10.00 |
Income from Investment Operations | | | |
Net investment income (loss) D | .07 | .05 | - I |
Net realized and unrealized gain (loss) | 4.78 | 3.75 | .39 |
Total from investment operations | 4.85 | 3.80 | .39 |
Distributions from net realized gain | - | - I | - |
Redemption fees added to paid in capital D | .01 | .03 | .01 |
Net asset value, end of period | $ 19.09 | $ 14.23 | $ 10.40 |
Total Return B,C | 34.15% | 36.86% | 4.00% |
Ratios to Average Net Assets E,H | | | |
Expenses before reductions | 1.30% | 1.28% | 2.25% A |
Expenses net of fee waivers, if any | 1.30% | 1.28% | 1.40% A |
Expenses net of all reductions | 1.25% | 1.16% | 1.31% A |
Net investment income (loss) | .43% | .37% | .14% A |
Supplemental Data | | | |
Net assets, end of period (000 omitted) | $ 1,433,844 | $ 981,210 | $ 197,349 |
Portfolio turnover rate F | 107% | 164% | 46% |
A Annualized
B Total returns for periods of less than one year are not annualized.
C Total returns would have been lower had certain expenses not been reduced during the periods shown.
D Calculated based on average shares outstanding during the period.
E Fees and expenses of the underlying Fidelity Central Funds are not included in the Fund's expense ratio. The Fund indirectly bears its proportionate share of the expenses of any underlying Fidelity Central Funds.
F Amount does not include the portfolio activity of any underlying Fidelity Central Funds.
G For the period August 2, 2005 (commencement of operations) to October 31, 2005.
H Expense ratios reflect operating expenses of the class. Expenses before reductions do not reflect amounts reimbursed by the investment adviser or reductions from brokerage service arrangements or other expense offset arrangements and do not represent the amount paid by the class during periods when reimbursements or reductions occur. Expense ratios before reductions for start-up periods may not be representative of longer-term operating periods. Expenses net of fee waivers reflect expenses after reimbursement by the investment adviser but prior to reductions from brokerage service arrangements or other expense offset arrangements. Expenses net of all reductions represent the net expenses paid by the class.
I Amount represents less than $.01 per share.
See accompanying notes which are an integral part of the financial statements.
Annual Report
Financial Highlights - Institutional Class
Years ended October 31, | 2007 | 2006 | 2005 G |
Selected Per-Share Data | | | |
Net asset value, beginning of period | $ 14.22 | $ 10.40 | $ 10.00 |
Income from Investment Operations | | | |
Net investment income (loss) D | .08 | .05 | - I |
Net realized and unrealized gain (loss) | 4.78 | 3.74 | .39 |
Total from investment operations | 4.86 | 3.79 | .39 |
Distributions from net realized gain | - | - I | - |
Redemption fees added to paid in capital D | .01 | .03 | .01 |
Net asset value, end of period | $ 19.09 | $ 14.22 | $ 10.40 |
Total Return B,C | 34.25% | 36.77% | 4.00% |
Ratios to Average Net Assets E,H | | | |
Expenses before reductions | 1.29% | 1.25% | 2.25% A |
Expenses net of fee waivers, if any | 1.29% | 1.25% | 1.40% A |
Expenses net of all reductions | 1.25% | 1.14% | 1.29% A |
Net investment income (loss) | .44% | .40% | .16% A |
Supplemental Data | | | |
Net assets, end of period (000 omitted) | $ 27,609 | $ 13,954 | $ 2,849 |
Portfolio turnover rate F | 107% | 164% | 46% |
A Annualized
B Total returns for periods of less than one year are not annualized.
C Total returns would have been lower had certain expenses not been reduced during the periods shown.
D Calculated based on average shares outstanding during the period.
E Fees and expenses of the underlying Fidelity Central Funds are not included in the Fund's expense ratio. The Fund indirectly bears its proportionate share of the expenses of any underlying Fidelity Central Funds.
F Amount does not include the portfolio activity of any underlying Fidelity Central Funds.
G For the period August 2, 2005 (commencement of operations) to October 31, 2005.
H Expense ratios reflect operating expenses of the class. Expenses before reductions do not reflect amounts reimbursed by the investment adviser or reductions from brokerage service arrangements or other expense offset arrangements and do not represent the amount paid by the class during periods when reimbursements or reductions occur. Expense ratios before reductions for start-up periods may not be representative of longer-term operating periods. Expenses net of fee waivers reflect expenses after reimbursement by the investment adviser but prior to reductions from brokerage service arrangements or other expense offset arrangements. Expenses net of all reductions represent the net expenses paid by the class.
I Amount represents less than $.01 per share.
See accompanying notes which are an integral part of the financial statements.
Annual Report
Notes to Financial Statements
For the period ended October 31, 2007
1. Organization.
Fidelity International Small Cap Opportunities Fund (the Fund) is a fund of Fidelity Investment Trust (the trust) and is authorized to issue an unlimited number of shares. The trust is registered under the Investment Company Act of 1940, as amended (the 1940 Act), as an open-end management investment company organized as a Massachusetts business trust. The Fund offers Class A, Class T, Class B, Class C, International Small Cap Opportunities, and Institutional Class shares, each of which has equal rights as to assets and voting privileges. Each class has exclusive voting rights with respect to matters that affect that class. Class B shares will automatically convert to Class A shares after a holding period of seven years from the initial date of purchase. Investment income, realized and unrealized capital gains and losses, the common expenses of the Fund, and certain fund-level expense reductions, if any, are allocated on a pro rata basis to each class based on the relative net assets of each class to the total net assets of the Fund. Each class differs with respect to transfer agent and distribution and service plan fees incurred. Certain expense reductions also differ by class. The Fund's investments in emerging markets can be subject to social, economic, regulatory, and political uncertainties and can be volatile.
2. Investments in Fidelity Central Funds.
The Fund may invest in Fidelity Central Funds, which are open-end investment companies available only to other investment companies and accounts managed by Fidelity Management & Research Company (FMR) and its affiliates. The Fund's Schedule of Investments lists each of the Fidelity Central Funds as an investment of the Fund, but does not include the underlying holdings of each Fidelity Central Fund. As an Investing Fund, the Fund indirectly bears its proportionate share of the expenses of the underlying Fidelity Central Funds.
The Money Market Central Funds seek preservation of capital and current income and are managed by Fidelity Investments Money Management, Inc. (FIMM), an affiliate of FMR.
A complete list of holdings for each Fidelity Central Fund is available upon request or at the SEC's web site at www.sec.gov. In addition, the financial statements of the Fidelity Central Funds, which are not covered by the Fund's Report of Independent Registered Public Accounting Firm, are available on the SEC's web site or upon request.
3. Significant Accounting Policies.
The financial statements have been prepared in conformity with accounting principles generally accepted in the United States of America, which require management to make certain estimates and assumptions at the date of the financial statements. The following summarizes the significant accounting policies of the Fund:
Annual Report
3. Significant Accounting Policies - continued
Security Valuation. Investments are valued and net asset value (NAV) per share is calculated (NAV calculation) as of the close of business of the New York Stock Exchange (NYSE), normally 4:00 p.m. Eastern time. Wherever possible, the Fund uses independent pricing services approved by the Board of Trustees to value its investments.
Equity securities, including restricted securities, for which market quotations are readily available, are valued at the last reported sale price or official closing price as reported by an independent pricing service on the primary market or exchange on which they are traded. In the event there were no sales during the day or closing prices are not available, securities are valued at the last quoted bid price. Investments in open-end mutual funds, including the Fidelity Central Funds, are valued at their closing net asset value each business day. Short-term securities with remaining maturities of sixty days or less for which quotations are not readily available are valued at amortized cost, which approximates value.
When current market prices or quotations are not readily available or do not accurately reflect fair value, valuations may be determined in accordance with procedures adopted by the Board of Trustees. For example, when developments occur between the close of a market and the close of the NYSE that may materially affect the value of some or all of the securities, or when trading in a security is halted, those securities may be fair valued. Factors used in the determination of fair value may include monitoring news to identify significant market or security specific events such as changes in the value of U.S. securities markets, reviewing developments in foreign markets and evaluating the performance of ADRs, futures contracts and exchange-traded funds. Because the Fund's utilization of fair value pricing depends on market activity, the frequency with which fair value pricing is used cannot be predicted and may be utilized to a significant extent. The value of securities used for NAV calculation under fair value pricing may differ from published prices for the same securities.
Foreign Currency. The Fund uses foreign currency contracts to facilitate transactions in foreign-denominated securities. Losses from these transactions may arise from changes in the value of the foreign currency or if the counterparties do not perform under the contracts' terms.
Foreign-denominated assets, including investment securities, and liabilities are translated into U.S. dollars at the exchange rate at period end. Purchases and sales of investment securities, income and dividends received and expenses denominated in foreign currencies are translated into U.S. dollars at the exchange rate in effect on the transaction date.
Annual Report
Notes to Financial Statements - continued
3. Significant Accounting Policies - continued
Foreign Currency - continued
The effects of exchange rate fluctuations on investments are included with the net realized and unrealized gain (loss) on investment securities. Other foreign currency transactions resulting in realized and unrealized gain (loss) are disclosed separately.
Investment Transactions and Income. For financial reporting purposes, the Fund's investment holdings and NAV include trades executed through the end of the last business day of the period. The NAV for processing shareholder transactions includes trades executed through the end of the prior business day. Gains and losses on securities sold are determined on the basis of identified cost. Dividend income is recorded on the ex-dividend date, except for certain dividends from foreign securities where the ex-dividend date may have passed, which are recorded as soon as the Fund is informed of the ex-dividend date. Non-cash dividends included in dividend income, if any, are recorded at the fair market value of the securities received. Interest income and distributions from the Fidelity Central Funds are accrued as earned. Interest income includes coupon interest and amortization of premium and accretion of discount on debt securities. Investment income is recorded net of foreign taxes withheld where recovery of such taxes is uncertain.
Expenses. Most expenses of the trust can be directly attributed to a fund. Expenses which cannot be directly attributed are apportioned among each Fund in the trust. Expense estimates are accrued in the period to which they relate and adjustments are made when actual amounts are known.
Income Tax Information and Distributions to Shareholders. Each year, the Fund intends to qualify as a regulated investment company by distributing all of its taxable income and realized gains under Subchapter M of the Internal Revenue Code. As a result, no provision for income taxes is required in the accompanying financial statements. Foreign taxes are provided for based on the Fund's understanding of the tax rules and rates that exist in the foreign markets in which it invests.
Distributions are recorded on the ex-dividend date. Income dividends and capital gain distributions are declared separately for each class. Income and capital gain distributions are determined in accordance with income tax regulations, which may differ from generally accepted accounting principles. In addition, the Fund will claim a portion of the payment made to redeeming shareholders as a distribution for income tax purposes.
Capital accounts within the financial statements are adjusted for permanent book-tax differences. These adjustments have no impact on net assets or the results of operations. Temporary book-tax differences will reverse in a subsequent period.
Annual Report
3. Significant Accounting Policies - continued
Income Tax Information and Distributions to Shareholders - continued
Book-tax differences are primarily due to foreign currency transactions, passive foreign investment companies (PFIC), certain foreign taxes, capital loss carryforwards, and losses deferred due to wash sales.
The tax-basis components of distributable earnings and the federal tax cost as of period end were as follows:
Unrealized appreciation | $ 376,134,487 | |
Unrealized depreciation | (47,440,840) | |
Net unrealized appreciation (depreciation) | 328,693,647 | |
Undistributed ordinary income | 16,755,641 | |
Undistributed long-term capital gain | 142,362,068 | |
| | |
Cost for federal income tax purposes | $ 1,512,095,480 | |
The tax character of distributions paid was as follows:
| October 31, 2007 | October 31, 2006 |
Ordinary Income | $ - | $ 90,957 |
Short-Term Trading (Redemption) Fees. Shares held in the Fund less than 90 days are subject to a redemption fee equal to 2.00% of the proceeds of the redeemed shares. All redemption fees, including any estimated redemption fees paid by FMR, are retained by the Fund and accounted for as an addition to paid in capital.
New Accounting Pronouncements. In July 2006, Financial Accounting Standards Board Interpretation No. 48, Accounting for Uncertainty in Income Taxes - an interpretation of FASB Statement 109 (FIN 48), was issued and is effective on the last business day of the semiannual reporting period for fiscal years beginning after December 15, 2006. FIN 48 sets forth a threshold for financial statement recognition, measurement and disclosure of a tax position taken or expected to be taken on a tax return. Management has concluded that the adoption of FIN 48 will not result in a material impact on the Fund's net assets, results of operations and financial statement disclosures.
In addition, in September 2006, Statement of Financial Accounting Standards No. 157, Fair Value Measurements (SFAS 157), was issued and is effective for fiscal years beginning after November 15, 2007. SFAS 157 defines fair value, establishes a framework for measuring fair value and expands disclosures about fair value measurements. Management is currently evaluating the impact the adoption of SFAS 157 will have on the Fund's financial statement disclosures.
Annual Report
Notes to Financial Statements - continued
4. Operating Policies.
Repurchase Agreements. FMR has received an Exemptive Order from the Securities and Exchange Commission (the SEC) which permits the Fund and other affiliated entities of FMR to transfer uninvested cash balances into joint trading accounts which are then invested in repurchase agreements. The Fund may also invest directly with institutions in repurchase agreements. Repurchase agreements are collateralized by government or non-government securities. Upon settlement date, collateral is held in segregated accounts with custodian banks and may be obtained in the event of a default of the counterparty. The Fund monitors, on a daily basis, the value of the collateral to ensure it is at least equal to the principal amount of the repurchase agreement (including accrued interest). In the event of a default by the counterparty, realization of the collateral proceeds could be delayed, during which time the value of the collateral may decline.
5. Purchases and Sales of Investments.
Purchases and sales of securities, other than short-term securities, aggregated $1,662,112,013 and $1,600,989,161, respectively.
6. Fees and Other Transactions with Affiliates.
Management Fee. FMR and its affiliates provide the Fund with investment management related services for which the Fund pays a monthly management fee. The management fee is the sum of an individual fund fee rate that is based on an annual rate of .60% of the Fund's average net assets and a group fee rate that averaged ..26% during the period. The group fee rate is based upon the average net assets of all the mutual funds advised by FMR. The group fee rate decreases as assets under management increase and increases as assets under management decrease. In addition, the management fee is subject to a performance adjustment (up to a maximum of ±.20% of the Fund's average net assets over a 36 month performance period). The upward or downward adjustment to the management fee is based on the relative investment performance of the retail class of the Fund, International Small Cap Opportunities as compared to an appropriate benchmark index. The Fund's performance adjustment took effect in August 2006. Subsequent months will be added until the performance period includes 36 months. For the period, the total annual management fee rate, including the performance adjustment, was .99% of the Fund's average net assets.
Distribution and Service Plan. In accordance with Rule 12b-1 of the 1940 Act, the Fund has adopted separate Distribution and Service Plans for each class of shares. Certain classes pay Fidelity Distributors Corporation (FDC), an affiliate of FMR, separate Distribution and Service Fees, each of which is based on an annual percentage of each class' average net assets. In addition, FDC may pay financial intermediaries for selling shares of the Fund and providing shareholder support services. For the period,
Annual Report
6. Fees and Other Transactions with Affiliates - continued
Distribution and Service Plan - continued
the Distribution and Service Fee rates and the total amounts paid to and retained by FDC were as follows:
| Distribution
Fee | Service
Fee | Paid to
FDC | Retained
by FDC |
Class A | 0% | .25% | $ 131,681 | $ 13,131 |
Class T | .25% | .25% | 204,126 | 8,816 |
Class B | .75% | .25% | 97,469 | 74,563 |
Class C | .75% | .25% | 343,814 | 137,424 |
| | | $ 777,090 | $ 233,934 |
Sales Load. FDC receives a front-end sales charge of up to 5.75% for selling Class A shares, and 3.50% for selling Class T shares, some of which is paid to financial intermediaries for selling shares of the Fund. FDC receives the proceeds of contingent deferred sales charges levied on Class A, Class T, Class B, and Class C redemptions. These charges depend on the holding period. The deferred sales charges range from 5% to 1% for Class B, 1% for Class C, 1.00% to .50% for certain purchases of Class A shares and .25% for certain purchases of Class T shares.
For the period, sales charge amounts retained by FDC were as follows:
| Retained
by FDC |
Class A | $ 71,361 |
Class T | 16,861 |
Class B* | 18,023 |
Cass C* | 7,770 |
| $ 114,015 |
* When Class B and Class C shares are initially sold, FDC pays commissions from its own resources to financial intermediaries through which the sales are made.
Transfer Agent Fees. Fidelity Investments Institutional Operations Company, Inc. (FIIOC), an affiliate of FMR, is the transfer, dividend disbursing and shareholder servicing agent for each class of the Fund, except for International Small Cap Opportunities. Fidelity Service Company, Inc. (FSC), an affiliate of FMR, is the transfer agent for International Small Cap Opportunities shares. FIIOC and FSC receive account fees and asset-based fees that vary according to the account size and type of account of the shareholders of the respective classes of the Fund. FIIOC and FSC pay for typesetting, printing and mailing of shareholder reports, except proxy statements. For the period, the total transfer agent fees paid by each class to FIIOC or FSC, were as follows:
Annual Report
Notes to Financial Statements - continued
6. Fees and Other Transactions with Affiliates - continued
Transfer Agent Fees - continued
| Amount | % of
Average
Net Assets |
Class A | $ 157,033 | .30 |
Class T | 110,999 | .27 |
Class B | 30,834 | .32 |
Class C | 104,103 | .30 |
International Small Cap Opportunities | 2,895,757 | .21 |
Institutional Class | 42,171 | .20 |
| $ 3,340,897 | |
Accounting and Security Lending Fees. FSC maintains the Fund's accounting records. The accounting fee is based on the level of average net assets for the month. Under a separate contract, FSC administers the security lending program. The security lending fee is based on the number and duration of lending transactions.
Brokerage Commissions. The Fund placed a portion of its portfolio transactions with brokerage firms which are affiliates of the investment adviser. The commissions paid to these affiliated firms were $357 for the period.
Interfund Lending Program. Pursuant to an Exemptive Order issued by the SEC, the Fund, along with other registered investment companies having management contracts with FMR, may participate in an interfund lending program. This program provides an alternative credit facility allowing the funds to borrow from, or lend money to, other participating affiliated funds. At period end, there were no interfund loans outstanding. The Fund's activity in this program during the period for which loans were outstanding was as follows:
Borrower or Lender | Average Daily
Loan Balance | Weighted Average Interest Rate | Interest Expense |
Borrower | $ 12,170,667 | 5.32% | $ 26,963 |
7. Committed Line of Credit.
The Fund participates with other funds managed by FMR in a $4.2 billion credit facility (the "line of credit") to be utilized for temporary or emergency purposes to fund shareholder redemptions or for other short-term liquidity purposes. The Fund has agreed to pay commitment fees on its pro rata portion of the line of credit, which amounted to $3,037 and is reflected in Miscellaneous Expense on the Statement of Operations. During the period, there were no borrowings on this line of credit.
Annual Report
8. Security Lending.
The Fund lends portfolio securities from time to time in order to earn additional income. On the settlement date of the loan, the Fund receives collateral (in the form of U.S. Treasury obligations, letters of credit and/or cash) against the loaned securities and maintains collateral in an amount not less than 100% of the market value of the loaned securities during the period of the loan. The market value of the loaned securities is determined at the close of business of the Fund and any additional required collateral is delivered to the Fund on the next business day. If the borrower defaults on its obligation to return the securities loaned because of insolvency or other reasons, a fund could experience delays and costs in recovering the securities loaned or in gaining access to the collateral. Any cash collateral received is invested in the Fidelity Securities Lending Cash Central Fund. The value of loaned securities and cash collateral at period end are disclosed on the Fund's Statement of Assets and Liabilities. Security lending income represents the income earned on investing cash collateral, less fees and expenses associated with the loan, plus any premium payments that may be received on the loan of certain types of securities. Security lending income is presented in the Statement of Operations as a component of income from Fidelity Central Funds.
9. Expense Reductions.
FMR voluntarily agreed to reimburse each class to the extent annual operating expenses exceeded certain levels of average net assets as noted in the table below. Some expenses, for example interest expense, including commitment fees, are excluded from this reimbursement.
The following classes were in reimbursement during the period:
| Expense
Limitations | Reimbursement
from adviser |
Class B | 2.40% | $ 76 |
Many of the brokers with whom FMR places trades on behalf of the Fund provided services to the Fund in addition to trade execution. These services included payments of certain expenses on behalf of the Fund totaling $613,429 for the period. In addition, through arrangements with each class' transfer agent, credits realized as a result of uninvested cash balances were used to reduce the Fund's expenses. During the period, these credits reduced each class' transfer agent expense as noted in the table below.
| Transfer Agent
expense reduction | |
International Small Cap Opportunities | $ 5,963 | |
Annual Report
Notes to Financial Statements - continued
10. Other.
The Fund's organizational documents provide former and current trustees and officers with a limited indemnification against liabilities arising in connection with the performance of their duties to the Fund. In the normal course of business, the Fund may also enter into contracts that provide general indemnifications. The Fund's maximum exposure under these arrangements is unknown as this would be dependent on future claims that may be made against the Fund. The risk of material loss from such claims is considered remote.
In September 2006, FIIOC, a transfer agent of the Fund, notified the Fund that the Fund's books and records did not reflect a conversion of certain Class B to Class A shares upon their conversion date. In March 2007, FIIOC converted the relevant Class B shares to Class A shares and recorded the conversion in the books and records of the Fund which did not result in a material impact to the Fund's reported net assets or results of operations in the accompanying financial statements. FIIOC has remediated affected shareholders and reimbursed the Fund for all related audit and legal expenses.
11. Distributions to Shareholders.
Distributions to shareholders of each class were as follows:
Years ended October 31, | 2007 | 2006 |
From net realized gain | | |
Class A | $ - | $ 2,067 |
International Small Cap Opportunities | - | 87,898 |
Institutional Class | - | 992 |
Total | $ - | $ 90,957 |
12. Share Transactions.
Transactions for each class of shares were as follows:
| Shares | Dollars |
Years ended October 31, | 2007 | 2006 | 2007 | 2006 |
Class A | | | | |
Shares sold | 2,107,892 | 2,562,140 | $ 35,531,826 | $ 35,143,597 |
Reinvestment of distributions | - | 162 | - | 1,916 |
Shares redeemed | (892,381) | (578,488) | (14,908,147) | (7,816,655) |
Net increase (decrease) | 1,215,511 | 1,983,814 | $ 20,623,679 | $ 27,328,858 |
Class T | | | | |
Shares sold | 1,311,252 | 1,977,012 | $ 21,607,239 | $ 27,202,466 |
Shares redeemed | (845,477) | (233,065) | (14,215,111) | (3,118,693) |
Net increase (decrease) | 465,775 | 1,743,947 | $ 7,392,128 | $ 24,083,773 |
Annual Report
12. Share Transactions - continued
Transactions for each class of shares were as follows: - continued
| Shares | Dollars |
Years ended October 31, | 2007 | 2006 | 2007 | 2006 |
Class B | | | | |
Shares sold | 286,293 | 498,394 | $ 4,653,400 | $ 6,815,227 |
Shares redeemed | (246,522) | (113,628) | (4,027,585) | (1,550,424) |
Net increase (decrease) | 39,771 | 384,766 | $ 625,815 | $ 5,264,803 |
Class C | | | | |
Shares sold | 888,414 | 1,745,210 | $ 14,698,282 | $ 24,032,601 |
Shares redeemed | (569,219) | (189,077) | (9,379,169) | (2,515,739) |
Net increase (decrease) | 319,195 | 1,556,133 | $ 5,319,113 | $ 21,516,862 |
International Small Cap Opportunities | | | | |
Shares sold | 48,402,736 | 93,068,555 | $ 800,622,633 | $ 1,259,777,775 |
Reinvestment of distributions | - | 6,974 | - | 82,435 |
Shares redeemed | (42,286,931) | (43,072,008) | (715,447,148) | (586,736,058) |
Net increase (decrease) | 6,115,805 | 50,003,521 | $ 85,175,485 | $ 673,124,152 |
Institutional Class | | | | |
Shares sold | 903,141 | 1,299,662 | $ 15,436,027 | $ 17,883,260 |
Reinvestment of distributions | - | 83 | - | 980 |
Shares redeemed | (437,882) | (592,563) | (7,375,351) | (8,704,985) |
Net increase (decrease) | 465,259 | 707,182 | $ 8,060,676 | $ 9,179,255 |
Annual Report
Report of Independent Registered Public Accounting Firm
To the Trustees of Fidelity Investment Trust and Shareholders of Fidelity International Small Cap Opportunities Fund:
We have audited the accompanying statement of assets and liabilities of Fidelity International Small Cap Opportunities Fund (the Fund), a fund of Fidelity Investment Trust, including the schedule of investments, as of October 31, 2007, and the related statement of operations for the year then ended, the statement of changes in net assets for each of the two years in the period then ended, and the financial highlights for each of the three years in the period then ended. These financial statements and financial highlights are the responsibility of the Fund's management. Our responsibility is to express an opinion on these financial statements and financial highlights based on our audits.
We conducted our audits in accordance with standards of the Public Company Accounting Oversight Board (United States). Those standards require that we plan and perform the audit to obtain reasonable assurance about whether the financial statements and financial highlights are free of material misstatement. The Fund is not required to have, nor were we engaged to perform, an audit of its internal control over financial reporting. Our audits included consideration of internal control over financial reporting as a basis for designing audit procedures that are appropriate in the circumstances, but not for the purpose of expressing an opinion on the effectiveness of the Fund's internal control over financial reporting. Accordingly, we express no such opinion. An audit also includes examining, on a test basis, evidence supporting the amounts and disclosures in the financial statements, assessing the accounting principles used and significant estimates made by management, as well as evaluating the overall financial statement presentation. Our procedures included confirmation of securities owned as of October 31, 2007, by correspondence with the custodians and brokers; where replies were not received from brokers, we performed other auditing procedures. We believe that our audits provide a reasonable basis for our opinion.
In our opinion, the financial statements and financial highlights referred to above present fairly, in all material respects, the financial position of Fidelity International Small Cap Opportunities Fund as of October 31, 2007, the results of its operations for the year then ended, the changes in its net assets for each of the two years in the period then ended, and its financial highlights for each of the three years in the period then ended, in conformity with accounting principles generally accepted in the United States of America.
/s/ Deloitte & Touche LLP
DELOITTE & TOUCHE LLP
Boston, Massachusetts
December 18, 2007
Annual Report
Trustees and Officers
The Trustees, Members of the Advisory Board, and executive officers of the trust and fund, as applicable, are listed below. The Board of Trustees governs the fund and is responsible for protecting the interests of shareholders. The Trustees are experienced executives who meet periodically throughout the year to oversee the fund's activities, review contractual arrangements with companies that provide services to the fund, and review the fund's performance. Except for James C. Curvey, each of the Trustees oversees 370 funds advised by FMR or an affiliate. Mr. Curvey oversees 340 funds advised by FMR or an affiliate.
The Trustees hold office without limit in time except that (a) any Trustee may resign; (b) any Trustee may be removed by written instrument, signed by at least two-thirds of the number of Trustees prior to such removal; (c) any Trustee who requests to be retired or who has become incapacitated by illness or injury may be retired by written instrument signed by a majority of the other Trustees; and (d) any Trustee may be removed at any special meeting of shareholders by a two-thirds vote of the outstanding voting securities of the trust. Each Trustee who is not an interested person (as defined in the 1940 Act) (Independent Trustee), shall retire not later than the last day of the calendar year in which his or her 72nd birthday occurs. The Independent Trustees may waive this mandatory retirement age policy with respect to individual Trustees. The executive officers and Advisory Board Members hold office without limit in time, except that any officer and Advisory Board Member may resign or may be removed by a vote of a majority of the Trustees at any regular meeting or any special meeting of the Trustees. Except as indicated, each individual has held the office shown or other offices in the same company for the past five years.
The fund's Statement of Additional Information (SAI) includes more information about the Trustees. To request a free copy, call Fidelity at 1-877-208-0098.
Interested Trustees*:
Correspondence intended for each Trustee who is an interested person may be sent to Fidelity Investments, 82 Devonshire Street, Boston, Massachusetts 02109.
Name, Age; Principal Occupation |
Edward C. Johnson 3d (77) |
| Year of Election or Appointment: 1984 Mr. Johnson is Chairman of the Board of Trustees. Mr. Johnson serves as President (2006-present), Chief Executive Officer, Chairman, and a Director of FMR LLC; Chairman and a Director of FMR; Chairman and a Director of Fidelity Research & Analysis Company (FRAC); Chairman and a Director of Fidelity Investments Money Management, Inc.; and Chairman (2001-present) and a Director of FMR Co., Inc. In addition, Mr. Johnson serves as Chairman and Director of Fidelity International Limited (FIL). |
James C. Curvey (72) |
| Year of Election or Appointment: 2007 Member of the Advisory Board of Fidelity Investment Trust. Mr. Curvey also serves as a Trustee (2007-present) or Member of the Advisory Board (2007-present) of other investment companies advised by FMR. Mr. Curvey is a Director of FMR and FMR Co., Inc. (2007-present). Mr. Curvey is also Vice Chairman (2006-present) and Director of FMR LLC. Mr. Curvey joined Fidelity in 1982 and served in numerous senior management positions, including President and Chief Operating Officer of FMR LLC (1997-2000) and President of Fidelity Strategic Investments (2000-2002). In addition, he serves as a member of the Board of Directors of Geerlings & Wade, Inc. (wine distribution). |
* Trustees have been determined to be "Interested Trustees" by virtue of, among other things, their affiliation with the trust or various entities under common control with FMR. FMR Corp. merged with FMR LLC on October 1, 2007. Any references to FMR LLC for prior periods are deemed to be references to the prior entity.
Independent Trustees:
Correspondence intended for each Independent Trustee (that is, the Trustees other than the Interested Trustees) may be sent to Fidelity Investments, P.O. Box 55235, Boston, Massachusetts 02205-5235.
Name, Age; Principal Occupation |
Dennis J. Dirks (59) |
| Year of Election or Appointment: 2005 Prior to his retirement in May 2003, Mr. Dirks was Chief Operating Officer and a member of the Board of The Depository Trust & Clearing Corporation (DTCC) (1999-2003). He also served as President, Chief Operating Officer, and Board member of The Depository Trust Company (DTC) (1999-2003) and President and Board member of the National Securities Clearing Corporation (NSCC) (1999-2003). In addition, Mr. Dirks served as Chief Executive Officer and Board member of the Government Securities Clearing Corporation (2001-2003) and Chief Executive Officer and Board member of the Mortgage-Backed Securities Clearing Corporation (2001-2003). Mr. Dirks also serves as a Trustee and a member of the Finance Committee of Manhattan College (2005-present) and a Trustee and a member of the Finance Committee of AHRC of Nassau County (2006-present). |
Albert R. Gamper, Jr. (65) |
| Year of Election or Appointment: 2006 Prior to his retirement in December 2004, Mr. Gamper served as Chairman of the Board of CIT Group Inc. (commercial finance). During his tenure with CIT Group Inc. Mr. Gamper served in numerous senior management positions, including Chairman (1987-1989; 1999-2001; 2002-2004), Chief Executive Officer (1987-2004), and President (1989-2002). He currently serves as a member of the Board of Directors of Public Service Enterprise Group (utilities, 2001-present), Chairman of the Board of Governors, Rutgers University (2004-present), and Chairman of the Board of Saint Barnabas Health Care System. |
George H. Heilmeier (71) |
| Year of Election or Appointment: 2004 Dr. Heilmeier is Chairman Emeritus of Telcordia Technologies (communication software and systems), where prior to his retirement, he served as company Chairman and Chief Executive Officer. He currently serves on the Boards of Directors of The Mitre Corporation (systems engineering and information technology support for the government), and HRL Laboratories (private research and development, 2004-present). He is Chairman of the General Motors Science & Technology Advisory Board and a Life Fellow of the Institute of Electrical and Electronics Engineers (IEEE). Dr. Heilmeier is a member of the Defense Science Board and the National Security Agency Advisory Board. He is also a member of the National Academy of Engineering, the American Academy of Arts and Sciences, and the Board of Overseers of the School of Engineering and Applied Science of the University of Pennsylvania. Previously, Dr. Heilmeier served as a Director of TRW Inc. (automotive, space, defense, and information technology, 1992-2002), Compaq (1994-2002), Automatic Data Processing, Inc. (ADP) (technology-based business outsourcing, 1995-2002), INET Technologies Inc. (telecommunications network surveillance, 2001-2004), and Teletech Holdings (customer management services). He is the recipient of the 2005 Kyoto Prize in Advanced Technology for his invention of the liquid crystal display, and a member of the Consumer Electronics Hall of Fame. |
James H. Keyes (67) |
| Year of Election or Appointment: 2007 Prior to his retirement in 2003, Mr. Keyes was Chairman, President, and Chief Executive Officer of Johnson Controls, Inc. (automotive supplier, 1993-2003). He currently serves as a member of the boards of LSI Logic Corporation (semiconductor technologies), Navistar International Corporation (manufacture and sale of trucks, buses, and diesel engines, 2002-present), and Pitney Bowes, Inc. (integrated mail, messaging, and document management solutions). |
Marie L. Knowles (61) |
| Year of Election or Appointment: 2001 Prior to Ms. Knowles' retirement in June 2000, she served as Executive Vice President and Chief Financial Officer of Atlantic Richfield Company (ARCO) (diversified energy, 1996-2000). From 1993 to 1996, she was a Senior Vice President of ARCO and President of ARCO Transportation Company. She served as a Director of ARCO from 1996 to 1998. She currently serves as a Director of Phelps Dodge Corporation (copper mining and manufacturing) and McKesson Corporation (healthcare service, 2002-present). Ms. Knowles is a Trustee of the Brookings Institution and the Catalina Island Conservancy and also serves as a member of the Advisory Board for the School of Engineering of the University of Southern California. |
Ned C. Lautenbach (63) |
| Year of Election or Appointment: 2000 Mr. Lautenbach is Chairman of the Independent Trustees (2006-present). Mr. Lautenbach has been a partner of Clayton, Dubilier & Rice, Inc. (private equity investment firm) since September 1998. Previously, Mr. Lautenbach was with the International Business Machines Corporation (IBM) from 1968 until his retirement in 1998. Mr. Lautenbach serves as a Director of Sony Corporation (2006-present) and Eaton Corporation (diversified industrial) as well as the Philharmonic Center for the Arts in Naples, Florida. He also is a member of the Board of Trustees of Fairfield University (2005-present), as well as a member of the Council on Foreign Relations. |
Cornelia M. Small (63) |
| Year of Election or Appointment: 2005 Ms. Small is a member (2000-present) and Chairperson (2002-present) of the Investment Committee, and a member (2002-present) of the Board of Trustees of Smith College. Previously, she served as Chief Investment Officer (1999-2000), Director of Global Equity Investments (1996-1999), and a member of the Board of Directors of Scudder, Stevens & Clark (1990-1997) and Scudder Kemper Investments (1997-1999). In addition, Ms. Small served as Co-Chair (2000-2003) of the Annual Fund for the Fletcher School of Law and Diplomacy. |
William S. Stavropoulos (68) |
| Year of Election or Appointment: 2001 Mr. Stavropoulos is Chairman Emeritus of the Board of Directors of The Dow Chemical Company. Since joining The Dow Chemical Company in 1967, Mr. Stavropoulos served in numerous senior management positions, including President (1993-2000; 2002-2003), CEO (1995-2000; 2002-2004), and Chairman of the Executive Committee (2000-2004). Currently, he is a Director of NCR Corporation (data warehousing and technology solutions), Chemical Financial Corporation, Maersk Inc. (industrial conglomerate, 2002-present), Tyco International, Inc. (multinational manufacturing and services, 2007-present), and a member of the Advisory Board for Metalmark Capital (private equity investment firm, 2005-present). He is a special advisor to Clayton, Dubilier & Rice, Inc., a private equity investment firm. He also serves as a member of the Board of Trustees of the American Enterprise Institute for Public Policy Research. In addition, Mr. Stavropoulos is a member of The Business Council, J.P. Morgan International Council and the University of Notre Dame Advisory Council for the College of Science. |
Kenneth L. Wolfe (68) |
| Year of Election or Appointment: 2005 Prior to his retirement in 2001, Mr. Wolfe was Chairman and Chief Executive Officer of Hershey Foods Corporation (1993-2001). He currently serves as a member of the boards of Adelphia Communications Corporation (2003-present), Bausch & Lomb, Inc., and Revlon Inc. (2004-present). |
Advisory Board Members and Executive Officers**:
Correspondence intended for Mr. Mauriello, Mr. Thomas, and Mr. Wiley may be sent to Fidelity Investments, P.O. Box 55235, Boston, Massachusetts 02205-5235. Correspondence intended for each executive officer and Mr. Lynch may be sent to Fidelity Investments, 82 Devonshire Street, Boston, Massachusetts 02109.
Name, Age; Principal Occupation |
Peter S. Lynch (63) |
| Year of Election or Appointment: 2003 Member of the Advisory Board of Fidelity Investment Trust. Mr. Lynch is Vice Chairman and a Director of FMR, and Vice Chairman (2001-
present) and a Director of FMR Co., Inc. Previously, Mr. Lynch served as a Trustee of the Fidelity funds (1990-2003). In addition, he serves as a Trustee of Boston College and as the Chairman of the Inner-City Scholarship Fund. |
Joseph Mauriello (63) |
| Year of Election or Appointment: 2007 Member of the Advisory Board of Fidelity Investment Trust. Prior to his retirement in January 2006, Mr. Mauriello served in numerous senior management positions including Deputy Chairman and Chief Operating Officer (2004-2005), and Vice Chairman of Financial Services (2002-2004) of KPMG LLP US (professional services firm, 1965-2005). Mr. Mauriello currently serves as a member of the Board of Directors of XL Capital Ltd., (global insurance and re-insurance company, 2006-present) and of Arcadia Resources Inc., (health care services and products, 2007-present). He also served as a Director of the Hamilton Funds of the Bank of New York (2006-2007). |
David M. Thomas (58) |
| Year of Election or Appointment: 2007 Member of the Advisory Board of Fidelity Investment Trust. Previously, Mr. Thomas served as Executive Chairman (2005-2006) and Chairman and Chief Executive Officer (2000-2005) of IMS Heath, Inc. (pharmaceutical and healthcare information solutions). In addition, Mr. Thomas serves as a member of the Board of Directors of Fortune Brands, Inc. (consumer products holding company), and Interpublic Group of Companies, Inc. (marketing communication, 2004-present). |
Michael E. Wiley (57) |
| Year of Election or Appointment: 2007 Member of the Advisory Board of Fidelity Investment Trust. Mr. Wiley also serves as Sr. Energy Advisor of Katzenbach Partners, LLC (consulting firm, 2006-present) and a member of the Board of Trustees of the University of Tulsa (2000-2006; 2007-present). He serves as a Director of Tesoro Corporation (independent oil refiner and marketer, 2005-present), and a Director of Bill Barrett Corporation (exploration and production company, 2005-present). In addition, he also serves as a Director of Post Oak Bank (privately-held bank, 2004-present), and an Advisory Director of Riverstone Holdings (private investment firm). Previously, Mr. Wiley served as Chairman, President, and CEO of Baker Hughes, Inc. (oilfield services company, 2000-2004), and as Director of Spinnaker Exploration Company (exploration and production company, 2001-2005). |
Kimberley H. Monasterio (43) |
| Year of Election or Appointment: 2007 President and Treasurer of the fund. Ms. Monasterio also serves as President and Treasurer of other Fidelity funds (2007-present) and is an employee of FMR (2004-present). Previously, Ms. Monasterio served as Deputy Treasurer of the Fidelity funds (2004-2006). Before joining Fidelity Investments, Ms. Monasterio served as Treasurer (2000-2004) and Chief Financial Officer (2002-2004) of the Franklin Templeton Funds and Senior Vice President of Franklin Templeton Services, LLC (2000-2004). |
Walter C. Donovan (45) |
| Year of Election or Appointment: 2007 Vice President of the fund. Mr. Donovan also serves as Vice President of Fidelity's Equity Funds (2007-present). Mr. Donovan also serves as Executive Vice President of FMR (2005-present) and FMR Co., Inc. (2005-present). Previously, Mr. Donovan served as Vice President of Fidelity's High Income Funds (2005-2007), Fixed-Income Funds (2005-2006), certain Asset Allocation Funds (2005-2006), certain Balanced Funds (2005-2006), and as Vice President and Director of Fidelity's International Equity Trading group (1998-2005). |
Eric M. Wetlaufer (45) |
| Year of Election or Appointment: 2006 Vice President of the fund. Mr. Wetlaufer also serves as Vice President of certain International Equity Funds (2006-present). Mr. Wetlaufer is Senior Vice President of FMR (2006-present) and FMR Co., Inc. (2006-present), and President and Director of Fidelity Management & Research (U.K.) Inc. (2006-present) and Fidelity Research & Analysis Company (2006-present). Before joining Fidelity Investments in 2005, Mr. Wetlaufer was a partner in Oxhead Capital Management (2004-2005). Previously, Mr. Wetlaufer served as a Chief Investment Officer of Putnam Investments (1997-2003). |
Eric D. Roiter (58) |
| Year of Election or Appointment: 2005 Secretary of the fund. He also serves as Secretary of other Fidelity funds; Vice President, General Counsel, and Secretary of FMR Co., Inc. (2001-present) and FMR; Assistant Secretary of Fidelity Management & Research (U.K.) Inc. (2001-present), Fidelity Research & Analysis Company (2001-present), and Fidelity Investments Money Management, Inc. (2001-present). Mr. Roiter is an Adjunct Member, Faculty of Law, at Boston College Law School (2003-present). Previously, Mr. Roiter served as Vice President and Secretary of Fidelity Distributors Corporation (FDC) (1998-2005). |
Scott C. Goebel (39) |
| Year of Election or Appointment: 2007 Assistant Secretary of the fund. Mr. Goebel also serves as Assistant Secretary of other Fidelity funds (2007-present), and is an employee of FMR. |
R. Stephen Ganis (41) |
| Year of Election or Appointment: 2006 Anti-Money Laundering (AML) officer of the fund. Mr. Ganis also serves as AML officer of other Fidelity funds (2006-present) and FMR LLC (2003-present). Before joining Fidelity Investments, Mr. Ganis practiced law at Goodwin Procter, LLP (2000-2002). |
Joseph B. Hollis (59) |
| Year of Election or Appointment: 2006 Chief Financial Officer of the fund. Mr. Hollis also serves as Chief Financial Officer of other Fidelity funds. Mr. Hollis is President of Fidelity Pricing and Cash Management Services (FPCMS) (2005-present). Mr. Hollis also serves as President and Director of Fidelity Service Company, Inc. (2006-present). Previously, Mr. Hollis served as Senior Vice President of Cash Management Services (1999-2002) and Investment Management Operations (2002-2005). |
Kenneth A. Rathgeber (60) |
| Year of Election or Appointment: 2005 Chief Compliance Officer of the fund. Mr. Rathgeber also serves as Chief Compliance Officer of other Fidelity funds (2004-present) and Executive Vice President of Risk Oversight for Fidelity Investments (2002-present). He is Chief Compliance Officer of FMR (2005-present), FMR Co., Inc. (2005-present), Fidelity Management & Research (U.K.) Inc. (2005-present), Fidelity Research & Analysis Company (2005-present), Fidelity Investments Money Management, Inc. (2005-present), and Strategic Advisers, Inc. (2005-present). Previously, Mr. Rathgeber served as Executive Vice President and Chief Operating Officer for Fidelity Investments Institutional Services Company, Inc. (1998-2002). |
Bryan A. Mehrmann (46) |
| Year of Election or Appointment: 2005 Deputy Treasurer of the fund. Mr. Mehrmann also serves as Deputy Treasurer of other Fidelity funds (2005-present) and is an employee of FMR. Previously, Mr. Mehrmann served as Vice President of Fidelity Investments Institutional Services Group (FIIS)/Fidelity Investments Institutional Operations Corporation, Inc. (FIIOC) Client Services (1998-2004). |
Kenneth B. Robins (38) |
| Year of Election or Appointment: 2005 Deputy Treasurer of the fund. Mr. Robins also serves as Deputy Treasurer of other Fidelity funds (2005-present) and is an employee of FMR (2004-present). Before joining Fidelity Investments, Mr. Robins worked at KPMG LLP, where he was a partner in KPMG's department of professional practice (2002-2004) and a Senior Manager (1999-2000). In addition, Mr. Robins served as Assistant Chief Accountant, United States Securities and Exchange Commission (2000-2002). |
Robert G. Byrnes (40) |
| Year of Election or Appointment: 2005 Assistant Treasurer of the fund. Mr. Byrnes also serves as Assistant Treasurer of other Fidelity funds (2005-present) and is an employee of FMR (2005-present). Previously, Mr. Byrnes served as Vice President of FPCMS (2003-2005). Before joining Fidelity Investments, Mr. Byrnes worked at Deutsche Asset Management where he served as Vice President of the Investment Operations Group (2000-2003). |
Peter L. Lydecker (53) |
| Year of Election or Appointment: 2005 Assistant Treasurer of the fund. Mr. Lydecker also serves as Assistant Treasurer of other Fidelity funds (2004) and is an employee of FMR. |
Paul M. Murphy (60) |
| Year of Election or Appointment: 2007 Assistant Treasurer of the fund. Mr. Murphy also serves as Assistant Treasurer of other Fidelity funds (2007-present) and is an employee of FMR (2007-present). Previously, Mr. Murphy served as Chief Financial Officer of the Fidelity Funds (2005-2006), Vice President and Associate General Counsel of FMR (2007), and Senior Vice President of Fidelity Pricing and Cash Management Services Group (FPCMS) (1994-2007). |
Gary W. Ryan (49) |
| Year of Election or Appointment: 2005 Assistant Treasurer of the fund. Mr. Ryan also serves as Assistant Treasurer of other Fidelity funds (2005-present) and is an employee of FMR (2005-present). Previously, Mr. Ryan served as Vice President of Fund Reporting in FPCMS (1999-2005). |
** FMR Corp. merged with FMR LLC on October 1, 2007. Any references to FMR LLC for prior periods are deemed to be references to the prior entity.
Annual Report
Distributions
The Board of Trustees of Fidelity Advisor International Small Cap Opportunities Fund voted to pay to shareholders of record at the opening of business on record date, the following distributions per share derived from capital gains realized from sales of portfolio securities, and dividends derived from net investment income:
| Pay Date | Record Date | Dividends | Capital Gains |
Class A | 12/10/07 | 12/07/07 | $0.025 | $1.878 |
Class T | 12/10/07 | 12/07/07 | $0.00 | $1.852 |
Class B | 12/10/07 | 12/07/07 | $0.00 | $1.76 |
Class C | 12/10/07 | 12/07/07 | $0.00 | $1.775 |
The fund hereby designates as a capital gain dividend with respect to the taxable year ended October 31, 2007, $142,362,068, or, if subsequently determined to be different, the net capital gain of such year.
The fund will notify shareholders in January 2008 of amounts for use in preparing 2007 income tax returns.
Annual Report
Board Approval of Investment Advisory Contracts and Management Fees
Fidelity International Small Cap Opportunities Fund
Each year, typically in July, the Board of Trustees, including the Independent Trustees (together, the Board), votes on the renewal of the management contract and sub-advisory agreements (together, the Advisory Contracts) for the fund. The Board, assisted by the advice of fund counsel and Independent Trustees' counsel, requests and considers a broad range of information throughout the year.
The Board meets regularly each month except August and takes into account throughout the year matters bearing on Advisory Contracts. The Board, acting directly and through its separate committees, considers at each of its meetings factors that are relevant to the annual renewal of the fund's Advisory Contracts, including the services and support provided to the fund and its shareholders. At the time of the renewal, the Board had 12 standing committees, each composed of Independent Trustees with varying backgrounds, to which the Board has assigned specific subject matter responsibilities in order to enhance effective decision-making by the Board. Each committee has adopted a written charter outlining the structure and purposes of the committee. One such committee, the Equity Contract Committee, meets periodically as needed throughout the year to consider matters specifically related to the annual renewal of Advisory Contracts. The committee requests and receives information on, and makes recommendations to the Independent Trustees concerning, the approval and annual review of the Advisory Contracts.
At its July 2007 meeting, the Board of Trustees, including the Independent Trustees, unanimously determined to renew the Advisory Contracts for the fund. In reaching its determination, the Board considered all factors it believed relevant, including (i) the nature, extent, and quality of the services to be provided to the fund and its shareholders (including the investment performance of the fund); (ii) the competitiveness of the management fee and total expenses of the fund; (iii) the total costs of the services to be provided by and the profits to be realized by the investment adviser and its affiliates from the relationship with the fund; (iv) the extent to which economies of scale would be realized as the fund grows; and (v) whether fee levels reflect these economies of scale, if any, for the benefit of fund shareholders. The Board also approved amendments to the fund's agreements with foreign sub-advisers to clarify that each sub-adviser provides services as an independent contractor.
In determining whether to renew the Advisory Contracts for the fund, the Board ultimately reached a determination, with the assistance of fund counsel and Independent Trustees' counsel, that the renewal of the Advisory Contracts and the compensation to be received by Fidelity under the management contract is consistent with Fidelity's fiduciary duty under applicable law. In addition to evaluating the specific factors noted above, the Board, in reaching its determination, is aware that shareholders in the fund have a broad range of investment choices available to them, including a wide choice among mutual funds offered by competitors to Fidelity, and that the fund's shareholders, with the opportunity to review and weigh the disclosure provided by the fund in its prospectus and other public disclosures, have chosen to invest in this fund, managed by Fidelity.
Annual Report
Nature, Extent, and Quality of Services Provided. The Board considered staffing within the investment adviser, FMR, and the sub-advisers (together, the Investment Advisers), including the background of the fund's portfolio manager and the fund's investment objective and discipline. The Independent Trustees also had discussions with senior management of Fidelity's investment operations and investment groups. The Board considered the structure of the portfolio manager compensation program and whether this structure provides appropriate incentives.
Resources Dedicated to Investment Management and Support Services. The Board reviewed the size, education, and experience of the Investment Advisers' investment staff, their use of technology, and the Investment Advisers' approach to recruiting, training, and retaining portfolio managers and other research, advisory, and management personnel. The Board considered Fidelity's extensive global research capabilities that enable the Investment Advisers to aggregate data from various sources in an effort to produce positive investment results. The Board noted that Fidelity's analysts have access to a variety of technological tools that enable them to perform both fundamental and quantitative analysis and to specialize in various disciplines. The Board also considered that Fidelity's portfolio managers and analysts have access to daily portfolio attribution that allows for monitoring of a fund's portfolio, as well as an electronic communication system that provides immediate real-time access to research concerning issuers and credit enhancers.
Shareholder and Administrative Services. The Board considered (i) the nature, extent, quality, and cost of advisory, administrative, distribution, and shareholder services performed by the Investment Advisers and their affiliates under the Advisory Contracts and under separate agreements covering transfer agency, pricing and bookkeeping, and securities lending services for the fund; (ii) the nature and extent of the Investment Advisers' supervision of third party service providers, principally custodians and subcustodians; and (iii) the resources devoted to, and the record of compliance with, the fund's compliance policies and procedures. The Board reviewed the allocation of fund brokerage, including allocations to brokers affiliated with the Investment Advisers, the use of brokerage commissions to pay fund expenses, and the use of "soft" commission dollars to pay for research services. The Board also considered that Fidelity voluntarily pays for market data out of its own resources.
The Board noted that the growth of fund assets across the complex allows Fidelity to reinvest in the development of services designed to enhance the value or convenience of the Fidelity funds as investment vehicles. These services include 24-hour access to account information and market information through phone representatives and over the Internet, and investor education materials and asset allocation tools.
Annual Report
Board Approval of Investment Advisory Contracts and
Management Fees - continued
Investment in a Large Fund Family. The Board considered the benefits to shareholders of investing in a Fidelity fund, including the benefits of investing in a fund that is part of a large family of funds offering a variety of investment disciplines and providing for a large variety of mutual fund investor services. For example, fund shareholders are offered the privilege of exchanging shares of the fund for shares of other Fidelity funds, as set forth in the fund's prospectus, without paying a sales charge. The Board noted that, since the last Advisory Contract renewals in July 2006, Fidelity has taken a number of actions that benefited particular funds, including (i) dedicating additional resources to investment research and to restructure the investment research teams; (ii) contractually agreeing to reduce the management fee on Fidelity Advisor Floating Rate High Income Fund; (iii) contractually agreeing to reduce the management fees on Fidelity's California, Massachusetts, New Jersey, and New York AMT Tax-Free Money Market Funds, launching new Institutional Classes and Service Classes of these funds, and contractually agreeing to impose expense limitations on these funds; (iv) eliminating the exchange fee on the Fidelity Select Portfolios and reducing the pricing and bookkeeping fee rates for these funds; (v) reducing the maximum transfer agency fee rates on high income funds and certain equity funds; (vi) proposing amended management contracts that, if approved by shareholders, will add a performance adjustment component to the management fees paid by 18 Fidelity Advisor equity funds; (vii) contractually agreeing to reduce fees for Ultra-Short Central Fund and the money market Central Funds; (viii) waiving the Fidelity Advisor funds' contingent deferred sales charge on certain redemptions made through systematic withdrawal programs; and (ix) amending the management contracts for equity and fixed-income funds whose management contracts incorporate a "group fee" structure by adding four new fee "breakpoints" to the group fee rate schedules.
Investment Performance and Compliance. The Board considered whether the fund has operated within its investment objective, as well as its record of compliance with its investment restrictions. It also reviewed the fund's absolute investment performance for each class, as well as the fund's relative investment performance for each class measured against (i) a broad-based securities market index, and (ii) a peer group of mutual funds deemed appropriate by the Board. Because the fund had been in existence less than three calendar years, the following chart considered by the Board shows, for the one-year period ended December 31, 2006, the total returns of Fidelity International Small Cap Opportunities (retail class) and Class C of the fund, the total return of a broad-based securities market index ("benchmark"), and a range of total returns of a peer group of mutual funds identified by Lipper Inc. as having an investment objective similar to that of the fund. The returns of Fidelity International Small Cap Opportunities (retail class) and Class C show the performance of the highest and lowest performing classes, respectively. The box within the chart shows the 25th percentile return (bottom of box) and the 75th percentile return (top of box) of the peer group. Returns shown above the box are in the first quartile and returns shown below the box are in the fourth quartile. The percentage beaten numbers noted below the chart correspond to the percentile box and represent the percentage of funds in the peer group whose performance was equal to or lower than that of the class indicated.
Annual Report
Fidelity International Small Cap Opportunities Fund

The Board reviewed the fund's relative investment performance against its peer group and stated that the performance of Fidelity International Small Cap Opportunities (retail class) was in the third quartile for the period shown. The Board also stated that the investment performance of Fidelity International Small Cap Opportunities (retail class) compared favorably to its benchmark for the period shown. The Board considered that the variations in performance among the fund's classes reflect the variations in class expenses, which result in lower performance for higher expense classes. The Board stated that it is difficult to evaluate in any comprehensive fashion the performance of the fund, in light of its relatively recent commencement of operations.
The Board also considered that the fund's management fee is subject to upward or downward adjustment depending upon whether, and to what extent, the fund's investment performance for the performance period exceeds, or is exceeded by, the record (over the same period) of a Board-approved performance adjustment index. The Board realizes that the performance adjustment provides FMR with a strong economic incentive to seek to achieve superior performance for the fund's shareholders and helps to more closely align the interests of FMR and the fund's shareholders.
Annual Report
Board Approval of Investment Advisory Contracts and
Management Fees - continued
The Board considered that FMR has taken steps to refocus and strengthen equity research, equity portfolio management, and compliance.
Based on its review, and giving particular weight to the nature and quality of the resources dedicated by the Investment Advisers to maintain and improve relative performance, the Board concluded that the nature, extent, and quality of the services provided to the fund will benefit the fund's shareholders, particularly in light of the Board's view that the fund's shareholders benefit from investing in a fund that is part of a large family of funds offering a variety of investment disciplines and services.
Competitiveness of Management Fee and Total Fund Expenses. The Board considered the fund's management fee and total expenses compared to "mapped groups" of competitive funds and classes. Fidelity creates "mapped groups" by combining similar Lipper investment objective categories that have comparable management fee characteristics. Combining Lipper investment objective categories aids the Board's management fee and total expense comparisons by broadening the competitive group used for comparison and by reducing the number of universes to which various Fidelity funds are compared. The Board also considered supplemental information about how the fund's management fee and total expenses ranked relative to groups based on Lipper classifications, which take into account a fund's market capitalization and style.
The Board considered two proprietary management fee comparisons for the 12-month (or shorter) periods shown in the chart below. The group of Lipper funds used by the Board for management fee comparisons is referred to below as the "Total Mapped Group" and, for the reasons explained above, is broader than the Lipper peer group used by the Board for performance comparisons. The Total Mapped Group comparison focuses on a fund's standing relative to the total universe of comparable funds available to investors, in terms of gross management fees before expense reimbursements or caps, and without giving effect to the fund's performance adjustment. "TMG %" represents the percentage of funds in the Total Mapped Group that had management fees that were lower than the fund's. For example, a TMG % of 23% means that 77% of the funds in the Total Mapped Group had higher management fees than the fund. The "Asset-Size Peer Group" (ASPG) comparison focuses on a fund's standing relative to non-Fidelity funds similar in size to the fund within the Total Mapped Group. The ASPG represents at least 15% of the funds in the Total Mapped Group with comparable asset size and management fee characteristics, subject to a minimum of 50 funds (or all funds in the Total Mapped Group if fewer than 50). Additional information, such as the ASPG quartile in which the fund's management fee ranked and the impact of the fund's performance adjustment, is also included in the chart and considered by the Board.
Annual Report
Fidelity International Small Cap Opportunities Fund

The Board noted that the fund's management fee ranked below the median of its Total Mapped Group and below the median of its ASPG for 2006. The Board also noted the effect of the fund's positive performance adjustment on the fund's management fee ranking. The Board noted that the performance adjustment for 2006 represents calculations for performance periods that differ from the period shown in the performance chart above.
Based on its review, the Board concluded that the fund's management fee was fair and reasonable in light of the services that the fund receives and the other factors considered.
In its review of each class's total expenses, the Board considered the fund's management fee as well as other fund or class expenses, as applicable, such as transfer agent fees, pricing and bookkeeping fees, fund-paid 12b-1 fees, and custodial, legal, and audit fees. The Board also noted the effects of any waivers and reimbursements on fees and expenses, as well as the fund's positive performance adjustment. As part of its review, the Board also considered current and historical total expenses of each class of the fund compared to competitive fund median expenses. Each class of the fund is compared to those funds and classes in the Total Mapped Group (used by the Board for management fee comparisons) that have a similar sales load structure.
The Board noted that the total expenses of each of Class A, Class B, Class C, Institutional Class and Fidelity International Small Cap Opportunities (retail class) ranked below its competitive median for 2006, and the total expenses of Class T ranked above its competitive median for 2006. The Board noted that the fund offers multiple classes, each of which has a different sales load and 12b-1 fee structure, and that the multiple structures are intended to offer a range of pricing options for the intermediary market. The Board also noted that the total expenses of the classes vary primarily by the level of their 12b-1 fees, although differences in transfer agent fees may also cause expenses to vary from class to class.
Annual Report
Board Approval of Investment Advisory Contracts and
Management Fees - continued
In its review of total expenses, the Board also considered Fidelity fee structures and other information on clients that FMR and its affiliates service in other competitive markets, such as other mutual funds advised or subadvised by FMR or its affiliates, pension plan clients, and other institutional clients.
Based on its review, the Board concluded that the total expenses of each class of the fund were reasonable, although in one case above the median of the universe presented for comparison, in light of the services that the fund and its shareholders receive and the other factors considered.
Costs of the Services and Profitability. The Board considered the revenues earned and the expenses incurred by Fidelity in conducting the business of developing, marketing, distributing, managing, administering and servicing the fund and its shareholders. The Board also considered the level of Fidelity's profits in respect of all the Fidelity funds.
On an annual basis, FMR presents to the Board Fidelity's profitability for the fund. Fidelity calculates the profitability for each fund, as well as aggregate profitability for groups of Fidelity funds and all Fidelity funds, using a series of detailed revenue and cost allocation methodologies which originate with the audited books and records of Fidelity. The Audit Committee of the Board reviews any significant changes from the prior year's methodologies.
PricewaterhouseCoopers LLP (PwC), independent registered public accounting firm and auditor to Fidelity and certain Fidelity funds, has been engaged annually by the Board as part of the Board's assessment of the results of Fidelity's profitability analysis. PwC's engagement includes the review and assessment of Fidelity's methodologies used in determining the revenues and expenses attributable to Fidelity's mutual fund business, and completion of agreed-upon procedures surrounding the mathematical accuracy of fund profitability and its conformity to allocation methodologies. After considering PwC's reports issued under the engagement and information provided by Fidelity, the Board believes that while other allocation methods may also be reasonable, Fidelity's profitability methodologies are reasonable in all material respects.
The Board has also reviewed Fidelity's non-fund businesses and any fall-out benefits related to the mutual fund business as well as cases where Fidelity's affiliates may benefit from or be related to the fund's business.
The Board considered the costs of the services provided by and the profits realized by Fidelity in connection with the operation of the fund and determined that the amount of profit is a fair entrepreneurial profit for the management of the fund.
Annual Report
Economies of Scale. The Board considered whether there have been economies of scale in respect of the management of the Fidelity funds, whether the Fidelity funds (including the fund) have appropriately benefited from any such economies of scale, and whether there is potential for realization of any further economies of scale. The Board considered the extent to which the fund will benefit from economies of scale through increased services to the fund, through waivers or reimbursements, or through fee or expense reductions, including reductions that occur through operation of the transfer agent agreement. The transfer agent fee varies in part based on the number of accounts in the fund. If the number of accounts decreases or the average account size increases, the overall transfer agent fee rate decreases.
The Board recognized that the fund's management contract incorporates a "group fee" structure, which provides for lower group fee rates as total fund assets under FMR's management increase, and for higher group fee rates as total fund assets under FMR's management decrease. FMR determines the group fee rates based on a tiered asset "breakpoint" schedule. In connection with the renewal of the fund's management contract, the Board approved amendments to the fund's management contract that added four new fee breakpoints to the group fee rate schedule for assets under FMR's management above $1,386 billion. The Board considered that the group fee rate declines under both the present and amended schedules, but that under the amended schedule, the group fee rate declines faster as assets under FMR's management exceed $1,386 billion. The Board considered that the group fee is designed to deliver the benefits of economies of scale to fund shareholders when total fund assets increase, even if assets of any particular fund are unchanged or have declined, because some portion of Fidelity's costs are attributable to services provided to all Fidelity funds, and all funds benefit if those costs can be allocated among more assets. The Board concluded that, given the group fee structure, fund shareholders will achieve a certain level of economies of scale as assets under FMR's management increase at the fund complex level, regardless of whether Fidelity achieves any such economies of scale.
The Board further concluded that any potential economies of scale are being shared between fund shareholders and Fidelity in an appropriate manner.
Additional Information Requested by the Board. In order to develop fully the factual basis for consideration of the Fidelity funds' Advisory Contracts, the Board requested and received additional information on several topics, including (i) fund performance trends and actions to be taken by FMR to improve certain funds' overall performance; (ii) Fidelity's portfolio manager compensation structure, including its effects on fund profitability and the extent to which portfolio manager compensation is linked to fund performance; (iii) Fidelity's fee structures; (iv) the funds' sub-advisory arrangements; and (v) accounts managed by Fidelity other than the Fidelity funds.
Annual Report
Board Approval of Investment Advisory Contracts and
Management Fees - continued
Based on its evaluation of all of the conclusions noted above, and after considering all material factors, the Board ultimately concluded that the advisory fee structures are fair and reasonable, and that the fund's Advisory Contracts should be renewed.
Annual Report
Annual Report
Annual Report
Annual Report
Investment Adviser
Fidelity Management & Research Company
Boston, MA
Investment Sub-Advisers
FMR Co., Inc.
Fidelity Management & Research
(U.K.) Inc.
Fidelity Research & Analysis Company
Fidelity International Investment Advisors
Fidelity Investments Japan Limited
Fidelity International Investment Advisors (U.K.) Limited
General Distributor
Fidelity Distributors Corporation
Boston, MA
Transfer and Service Agents
Fidelity Investments Institutional
Operations Company, Inc.
Boston, MA
Fidelity Service Company, Inc.
Boston, MA
Custodian
The Northern Trust Company
Chicago, IL
AILS-UANN-1207
1.815089.102
(Fidelity Investment logo)(registered trademark)
Corporate Headquarters
82 Devonshire St., Boston, MA 02109
www.fidelity.com
(Fidelity Investment logo)(registered trademark)
Fidelity Advisor
International Small Cap Opportunities
Fund - Institutional Class
Annual Report
October 31, 2007
Institutional Class
is a class of Fidelity®
International Small Cap
Opportunities Fund
(2_fidelity_logos) (Registered_Trademark)
Contents
Chairman's Message | <Click Here> | Ned Johnson's message to shareholders. |
Performance | <Click Here> | How the fund has done over time. |
Management's Discussion | 6 | The manager's review of fund performance, strategy and outlook. |
Shareholder Expense Example | <Click Here> | An example of shareholder expenses. |
Investment Changes | <Click Here> | A summary of major shifts in the fund's investments over the past six months. |
Investments | <Click Here> | A complete list of the fund's investments with their market values. |
Financial Statements | <Click Here> | Statements of assets and liabilities, operations, and changes in net assets,
as well as financial highlights. |
Notes | <Click Here> | Notes to the financial statements. |
Report of Independent Registered Public Accounting Firm | <Click Here> | |
Trustees and Officers | <Click Here> | |
Distributions | <Click Here> | |
Board Approval of Investment Advisory Contracts and Management Fees | <Click Here> | |
To view a fund's proxy voting guidelines and proxy voting record for the 12-month period ended June 30, visit http://www.fidelity.com (see "proxy voting guidelines") or visit the Securities and Exchange Commission's (SEC) web site at http://www.sec.gov. You may also call 1-877-208-0098 to request a free copy of the proxy voting guidelines.
Standard & Poor's, S&P and S&P 500 are registered service marks of The McGraw-Hill Companies, Inc. and have been licensed for use by Fidelity Distributors Corporation.
Other third party marks appearing herein are the property of their respective owners.
All other marks appearing herein are registered or unregistered trademarks or service marks of FMR LLC or an affiliated company.
Annual Report
This report and the financial statements contained herein are submitted for the general information of the shareholders of the fund. This report is not authorized for distribution to prospective investors in the fund unless preceded or accompanied by an effective prospectus.
A fund files its complete schedule of portfolio holdings with the SEC for the first and third quarters of each fiscal year on Form N-Q. Forms N-Q are available on the SEC's web site at http://www.sec.gov. A fund's Forms N-Q may be reviewed and copied at the SEC's Public Reference Room in Washington, DC. Information regarding the operation of the SEC's Public Reference Room may be obtained by calling 1-800-SEC-0330. For a complete list of a fund's portfolio holdings, view the most recent holdings listing, semiannual report, or annual report on Fidelity's web site at http://www.fidelity.com or http://www.advisor.fidelity.com, as applicable.
NOT FDIC INSURED · MAY LOSE VALUE · NO BANK GUARANTEE
Neither the fund nor Fidelity Distributors Corporation is a bank.
Annual Report
Chairman's Message
(photo_of_Edward_C_Johnson_3d)
Dear Shareholder:
Many stock and bond markets around the world have been unsettled of late; however, volatility can often lead to opportunity for patient investors. Financial markets are always unpredictable, but there are a number of time-tested principles that can put the historical odds in your favor.
One of the basic tenets is to invest for the long term. Over time, riding out the markets' inevitable ups and downs has proven much more effective than selling into panic or chasing the hottest trend. Even missing only a few of the markets' best days can significantly diminish investor returns. Patience also affords the benefits of compounding - of earning interest on additional income or reinvested dividends and capital gains. There are tax advantages and cost benefits to consider as well. The more you sell, the more taxes you pay, and the more you trade, the higher the costs. While staying the course doesn't eliminate risk, it can considerably lessen the effect of short-term declines.
You can further manage your investing risk through diversification. And today, more than ever, geographic diversification should be taken into account. Studies indicate that asset allocation is the single most important determinant of a portfolio's long-term success. The right mix of stocks, bonds and cash - aligned to your particular risk tolerance and investment objective - is very important. Age-appropriate rebalancing is also an essential aspect of asset allocation. For younger investors, an emphasis on equities - which historically have been the best-performing asset class over time - is encouraged. As investors near their specific goal, such as retirement or sending a child to college, consideration may be given to replacing volatile assets (e.g. common stocks) with more-stable fixed investments (bonds or savings plans).
A third investment principle - investing regularly - can help lower the average cost of your purchases. Investing a certain amount of money each month or quarter helps ensure you won't pay for all your shares at market highs. This strategy - known as dollar cost averaging - also reduces unconstructive "emotion" from investing, helping shareholders avoid selling weak performers just prior to an upswing, or chasing a hot performer just before a correction.
We invite you to contact us via the Internet, through our Investor Centers or over the phone. It is our privilege to provide you the information you need to make the investments that are right for you.
Sincerely,
/s/Edward C. Johnson 3d
Edward C. Johnson 3d
Annual Report
Performance: The Bottom Line
Average annual total return reflects the change in the value of an investment, assuming reinvestment of the class' dividend income and capital gains (the profits earned upon the sale of securities that have grown in value) and assuming a constant rate of performance each year. The $10,000 table and the fund's returns do not reflect the deduction of taxes that a shareholder would pay on fund distributions or the redemption of fund shares. During periods of reimbursement by Fidelity, a fund's total return will be greater than it would be had the reimbursement not occurred. How a fund did yesterday is no guarantee of how it will do tomorrow.
Average Annual Total Returns
Periods ended October 31, 2007 | | Past 1
year | Life of
fund A |
Institutional Class | | 34.25% | 33.36% |
A From August 2, 2005.
$10,000 Over Life of Fund
Let's say hypothetically that $10,000 was invested in Fidelity Advisor International Small Cap Opportunities Fund - Institutional Class on August 2, 2005, when the fund started. The chart shows how the value of your investment would have changed, and also shows how the Morgan Stanley Capital InternationalSM Europe, Australasia, Far East (MSCI® EAFE®) Small Cap Index performed over the same period.
Annual Report
Management's Discussion of Fund Performance
Comments from Andrew Sassine, Portfolio Manager of Fidelity Advisor International Small Cap Opportunities Fund
Foreign stocks, with a large assist from a weak U.S. dollar, generally had higher returns for U.S. investors than domestic equities during the 12-month period ending October 31, 2007. The backdrop for global stocks was solid, with robust economic growth and relatively high corporate profitability worldwide. Developed international equity markets, as measured by the Morgan Stanley Capital InternationalSM Europe, Australasia, and Far East (MSCI® EAFE®) Index - a performance monitor of established markets outside the United States and Canada - rose 25.09%. In comparison, the Standard & Poor's 500SM Index, a gauge of U.S. stocks, was up 14.56%. Among countries making up at least 1% of the EAFE benchmark, Finland had the best showing, soaring nearly 69%, while Hong Kong gained roughly 66%. The United Kingdom and Japan, the two largest components of the index, both underperformed. Fallout from the credit crunch and concerns about export growth tempered UK stocks, while Japan struggled with a slowdown in consumer spending and sluggish domestic growth. Emerging markets were the period's big winners, advancing 68.33% as measured by the MSCI Emerging Markets index.
The fund's Institutional Class shares gained 34.25% for the period, well ahead of the 22.17% return of the MSCI EAFE Small Cap index. Productive stock selection drove most of the fund's outperformance. An overweighting in Germany, combined with particularly good stock selection in the industrials sector there, contributed nicely to relative performance. The fund's stakes in German capital goods firms GEA Group, a diversified engineering company, and Q-Cells, a manufacturer of solar cells, contributed nicely to the fund's significant outperformance. Favorable stock selection within our large exposure to Japan also drove the fund's upward momentum, with our holdings there returning 7.46%, compared with a 2.17% decline for the benchmark's constituent elements. Other contributors included Lihir Gold, a Papua New Guinea-based producer, which benefited from an increase in gold prices; and Nintendo, the Japanese video game maker. Unfavorable stock selection within financials, especially in diversified financials and real estate, detracted from relative performance. Among the detractors were KK daVinci Advisors, a property investment advisory business in Japan, and Soitec, a French semiconductor company, which was the fund's single-largest relative detractor during the period.
The views expressed above reflect those of the portfolio manager(s) only through the end of the period as stated on the cover of this report and do not necessarily represent the views of Fidelity or any other person in the Fidelity organization. Any such views are subject to change at any time based upon market or other conditions and Fidelity disclaims any responsibility to update such views. These views may not be relied on as investment advice and, because investment decisions for a Fidelity fund are based on numerous factors, may not be relied on as an indication of trading intent on behalf of any Fidelity fund.
Annual Report
Shareholder Expense Example
As a shareholder of the Fund, you incur two types of costs: (1) transaction costs, including sales charges (loads) on purchase payments or redemption proceeds, redemption fees, and (2) ongoing costs, including management fees, distribution and/or service (12b-1) fees and other Fund expenses. This Example is intended to help you understand your ongoing costs (in dollars) of investing in the Fund and to compare these costs with the ongoing costs of investing in other mutual funds.
The Example is based on an investment of $1,000 invested at the beginning of the period and held for the entire period (May 1, 2007 to October 31, 2007).
Actual Expenses
The first line of the accompanying table for each class of the Fund provides information about actual account values and actual expenses. You may use the information in this line, together with the amount you invested, to estimate the expenses that you paid over the period. Simply divide your account value by $1,000.00 (for example, an $8,600 account value divided by $1,000.00 = 8.6), then multiply the result by the number in the first line for a class of the Fund under the heading entitled "Expenses Paid During Period" to estimate the expenses you paid on your account during this period. A small balance maintenance fee of $12.00 that is charged once a year may apply for certain accounts with a value of less than $2,000. This fee is not included in the table below. If it was, the estimate of expenses you paid during the period would be higher, and your ending account value lower, by this amount. In addition, the Fund, as a shareholder in the underlying Fidelity Central Funds, will indirectly bear its pro rata share of the fees and expenses incurred by the underlying Fidelity Central Funds. These fees and expenses are not included in the Fund's annualized expense ratio used to calculate the expense estimate in the table below.
Hypothetical Example for Comparison Purposes
The second line of the accompanying table for each class of the Fund provides information about hypothetical account values and hypothetical expenses based on a Class' actual expense ratio and an assumed rate of return of 5% per year before expenses, which is not the Class' actual return. The hypothetical account values and expenses may not be used to estimate the actual ending account balance or expenses you paid for the period. You may use this information to compare the ongoing costs of investing in the Fund and other funds. To do so, compare this 5% hypothetical example with the 5% hypothetical examples that appear in the shareholder reports of the other funds. A small balance maintenance fee of $12.00 that is charged once a year may apply for certain accounts with a value of less than $2,000. This fee is not included in the table below. If it was, the estimate of expenses you paid during the period would be higher, and your ending account value lower, by this amount. In addition, the Fund, as a shareholder in the underlying Fidelity Central Funds, will indirectly bear its pro rata share of the fees and expenses incurred by the underlying Fidelity Central Funds. These fees and expenses are not included in the Fund's annualized expense ratio used to calculate the expense estimate in the table below.
Please note that the expenses shown in the table are meant to highlight your ongoing costs only and do not reflect any transaction costs. Therefore, the second line of the table is useful in comparing ongoing costs only, and will not help you determine the relative total costs of owning different funds. In addition, if these transactional costs were included, your costs would have been higher.
Annual Report
Shareholder Expense Example - continued
| Beginning
Account Value
May 1, 2007 | Ending
Account Value
October 31, 2007 | Expenses Paid
During Period*
May 1, 2007 to
October 31, 2007 |
Class A | | | |
Actual | $ 1,000.00 | $ 1,098.40 | $ 8.62 |
Hypothetical A | $ 1,000.00 | $ 1,016.99 | $ 8.29 |
Class T | | | |
Actual | $ 1,000.00 | $ 1,097.20 | $ 9.83 |
Hypothetical A | $ 1,000.00 | $ 1,015.83 | $ 9.45 |
Class B | | | |
Actual | $ 1,000.00 | $ 1,094.50 | $ 12.67 |
Hypothetical A | $ 1,000.00 | $ 1,013.11 | $ 12.18 |
Class C | | | |
Actual | $ 1,000.00 | $ 1,094.60 | $ 12.57 |
Hypothetical A | $ 1,000.00 | $ 1,013.21 | $ 12.08 |
International Small Cap Opportunities | | | |
Actual | $ 1,000.00 | $ 1,100.30 | $ 6.88 |
Hypothetical A | $ 1,000.00 | $ 1,018.65 | $ 6.61 |
Institutional Class | | | |
Actual | $ 1,000.00 | $ 1,100.90 | $ 6.83 |
Hypothetical A | $ 1,000.00 | $ 1,018.70 | $ 6.56 |
A 5% return per year before expenses
* Expenses are equal to each Class' annualized expense ratio (shown in the table below); multiplied by the average account value over the period, multiplied by 184/365 (to reflect the one-half year period).
| Annualized
Expense Ratio |
Class A | 1.63% |
Class T | 1.86% |
Class B | 2.40% |
Class C | 2.38% |
International Small Cap Opportunities | 1.30% |
Institutional Class | 1.29% |
Annual Report
Investment Changes
Geographic Diversification (% of fund's net assets) |
As of October 31, 2007 |
| Japan 28.5% | |
| United States of America 12.1% | |
| United Kingdom 10.0% | |
| Germany 8.6% | |
| Norway 6.1% | |
| Papua New Guinea 5.3% | |
| Netherlands 4.5% | |
| France 3.5% | |
| Cayman Islands 3.0% | |
| Other 18.4% | |

Percentages are adjusted for the effect of futures contracts, if applicable. |
|
As of April 30, 2007 |
| Japan 21.0% | |
| Germany 12.9% | |
| United States of America 8.5% | |
| United Kingdom 8.5% | |
| Norway 7.2% | |
| Australia 5.8% | |
| France 4.9% | |
| Netherlands 3.7% | |
| China 2.8% | |
| Other 24.7% | |

Percentages are adjusted for the effect of futures contracts, if applicable. |
Asset Allocation |
| % of fund's
net assets | % of fund's net assets
6 months ago |
Stocks | 95.0 | 99.0 |
Short-Term Investments and Net Other Assets | 5.0 | 1.0 |
Top Ten Stocks as of October 31, 2007 |
| % of fund's
net assets | % of fund's net assets
6 months ago |
Lihir Gold Ltd. (Papua New Guinea, Metals & Mining) | 5.3 | 2.1 |
Titanium Metals Corp. (United States of America, Metals & Mining) | 3.2 | 2.4 |
Renovo Group PLC (United Kingdom, Pharmaceuticals) | 2.2 | 1.5 |
AGCO Corp. (United States of America, Machinery) | 2.2 | 1.5 |
GEA Group AG (Germany, Machinery) | 2.0 | 1.9 |
Nexans SA (France, Electrical Equipment) | 2.0 | 0.6 |
Autonomy Corp. PLC (United Kingdom, Software) | 1.9 | 0.9 |
Tokuyama Corp. (Japan, Chemicals) | 1.8 | 1.4 |
Cermaq ASA (Norway, Food Products) | 1.8 | 1.4 |
SGL Carbon AG (Germany, Electrical Equipment) | 1.8 | 0.8 |
| 24.2 | |
Market Sectors as of October 31, 2007 |
| % of fund's
net assets | % of fund's net assets
6 months ago |
Industrials | 28.1 | 30.5 |
Information Technology | 17.0 | 15.1 |
Materials | 16.1 | 11.9 |
Consumer Staples | 10.6 | 11.4 |
Financials | 8.3 | 12.7 |
Health Care | 5.5 | 3.9 |
Energy | 4.6 | 6.7 |
Consumer Discretionary | 4.4 | 4.3 |
Telecommunication Services | 0.4 | 1.9 |
Utilities | 0.0 | 0.6 |
Annual Report
Investments October 31, 2007
Showing Percentage of Net Assets
Common Stocks - 95.0% |
| Shares | | Value |
Australia - 2.4% |
Downer EDI Ltd. | 3,797,343 | | $ 23,679,615 |
Gunns Ltd. | 954,690 | | 3,365,484 |
Oxiana Ltd. | 356,736 | | 1,421,724 |
Silex Systems Ltd. | 950,000 | | 6,919,372 |
United Group Ltd. | 199,999 | | 4,002,940 |
TOTAL AUSTRALIA | | 39,389,135 |
Austria - 0.3% |
Andritz AG | 74,896 | | 5,509,018 |
Belgium - 0.4% |
Umicore SA | 28,300 | | 7,052,179 |
Bermuda - 1.9% |
China Grand Forestry Resources Group Ltd. (a) | 19,000,000 | | 6,752,330 |
China LotSynergy Holdings Ltd. (a) | 11,568,000 | | 1,682,922 |
Pacific Basin Shipping Ltd. | 3,442,000 | | 7,711,465 |
Proactive Technology Holdings Ltd. (a) | 4,202,000 | | 4,547,928 |
Sinofert Holdings Ltd. | 10,836,000 | | 10,221,274 |
TOTAL BERMUDA | | 30,915,919 |
Brazil - 1.4% |
Cosan SA Industria E Comercio | 1,070,000 | | 16,729,380 |
Sao Martinho SA | 440,100 | | 5,718,426 |
TOTAL BRAZIL | | 22,447,806 |
Cayman Islands - 3.0% |
CNinsure, Inc. ADR (a) | 300,900 | | 7,609,761 |
Himax Technologies, Inc. sponsored ADR | 4,604,200 | | 17,495,960 |
LDK Solar Co. Ltd. Sponsored ADR (d) | 387,800 | | 15,360,758 |
Subsea 7, Inc. (a)(d) | 296,500 | | 8,701,901 |
TOTAL CAYMAN ISLANDS | | 49,168,380 |
China - 2.7% |
China Oilfield Services Ltd. (H Shares) | 1,500,000 | | 3,673,279 |
China Techfaith Wireless Communication Technology Ltd. sponsored ADR (a)(d) | 1,227,479 | | 8,776,475 |
First Tractor Co. Ltd. (H Shares) (a)(e) | 18,940,000 | | 11,999,397 |
Global Bio-Chem Technology Group Co. Ltd. | 50,703,300 | | 18,800,322 |
TOTAL CHINA | | 43,249,473 |
Common Stocks - continued |
| Shares | | Value |
Finland - 1.9% |
KCI Konecranes Oyj | 300,000 | | $ 13,430,376 |
Outotec Oyj | 225,406 | | 17,210,145 |
TOTAL FINLAND | | 30,640,521 |
France - 3.5% |
Neopost SA | 18,400 | | 2,137,165 |
Nexans SA | 195,000 | | 33,136,302 |
Soitec SA (a)(d) | 1,009,801 | | 19,238,446 |
Ubisoft Entertainment SA (a) | 40,000 | | 3,285,299 |
TOTAL FRANCE | | 57,797,212 |
Germany - 8.6% |
Bilfinger Berger AG | 100,600 | | 8,956,293 |
Demag Cranes AG | 283,000 | | 16,297,914 |
Deutz AG (a)(d) | 741,982 | | 10,190,844 |
GEA Group AG (a) | 884,800 | | 33,201,165 |
Hochtief AG | 31,712 | | 4,378,956 |
Kontron AG | 400,319 | | 10,143,888 |
MTU Aero Engines Holding AG | 230,554 | | 14,075,883 |
Q-Cells AG (a) | 116,285 | | 14,808,839 |
SGL Carbon AG (a) | 493,908 | | 28,816,162 |
TOTAL GERMANY | | 140,869,944 |
Greece - 0.9% |
Bank of Piraeus | 174,129 | | 6,983,058 |
Hellenic Technodomiki Tev SA | 500,000 | | 7,591,712 |
TOTAL GREECE | | 14,574,770 |
Hong Kong - 0.4% |
China State Construction International Holdings Ltd. | 3,400,000 | | 7,121,855 |
Italy - 0.7% |
Impregilo SpA (a) | 1,500,000 | | 12,017,796 |
Japan - 28.5% |
Acca Networks Co. Ltd. (d) | 2,361 | | 4,703,296 |
Access Co. Ltd. (a)(d) | 2,000 | | 9,612,789 |
Adeka Corp. | 98,500 | | 987,414 |
Air Water, Inc. | 1,273,000 | | 14,433,669 |
Alps Electric Co. Ltd. | 200,000 | | 2,504,490 |
Asics Corp. | 1,223,000 | | 19,506,429 |
Atrium Co. Ltd. | 172,000 | | 4,797,225 |
Brother Industries Ltd. | 300,000 | | 4,017,501 |
Capcom Co. Ltd. (d) | 180,000 | | 5,148,945 |
Common Stocks - continued |
| Shares | | Value |
Japan - continued |
CyberAgent, Inc. | 8,000 | | $ 5,534,586 |
E*TRADE Securities Co. Ltd. (d) | 10,000 | | 10,737,892 |
Hikari Tsushin, Inc. | 220,000 | | 6,719,450 |
Ichiyoshi Securities Co. Ltd. (d) | 734,700 | | 8,036,096 |
Iino Kaiun Kaisha Ltd. | 350,000 | | 4,955,413 |
JAFCO Co. Ltd. | 199,000 | | 8,203,361 |
Japan General Estate Co. Ltd. (d) | 297,200 | | 5,692,246 |
Japan Steel Works Ltd. | 647,000 | | 10,585,612 |
JGC Corp. | 750,000 | | 15,022,632 |
Joint Corp. (d) | 166,300 | | 4,726,458 |
Kenedix, Inc. (d) | 5,000 | | 11,035,874 |
KK daVinci Advisors (a) | 8,769 | | 9,150,571 |
Kurita Water Industries Ltd. | 264,000 | | 8,821,083 |
Leopalace21 Corp. | 245,000 | | 7,822,808 |
Makino Milling Machine Co. Ltd. | 200,000 | | 2,092,996 |
Miraial Co. Ltd. | 96,800 | | 4,443,273 |
Mitsumi Electric Co. Ltd. | 234,000 | | 10,784,696 |
Nabtesco Corp. | 457,000 | | 7,814,578 |
Namco Bandai Holdings, Inc. | 669,000 | | 10,316,650 |
Nidec Sankyo Corp. | 1,098,000 | | 8,589,446 |
Nintendo Co. Ltd. | 26,600 | | 16,704,800 |
Nippon Carbon Co. Ltd. | 1,282,000 | | 8,090,195 |
Okuma Corp. | 310,000 | | 4,369,299 |
Organo Corp. (d) | 429,000 | | 7,198,167 |
Osaka Titanium Technolo Co. Ltd. (d) | 95,000 | | 8,366,316 |
Pal Co. Ltd. (d) | 300,000 | | 6,028,914 |
Rakuten, Inc. | 20,000 | | 9,783,077 |
Risa Partners, Inc. (d) | 1,146 | | 2,562,567 |
SBI Holdings, Inc. | 30,000 | | 9,519,414 |
Shima Seiki Manufacturing Ltd. | 75,000 | | 3,841,648 |
Sojitz Corp. | 3,746,300 | | 17,200,555 |
Sparx Group Co. Ltd. (d) | 19,856 | | 12,623,535 |
Star Micronics Co. Ltd. | 100,000 | | 3,157,645 |
Sugi Pharmacy Co. Ltd. | 239,000 | | 6,924,033 |
Sumco Corp. | 341,100 | | 12,451,892 |
Sumco Techxiv Corp. | 109,500 | | 5,941,755 |
Sumitomo Bakelite Co. Ltd. | 300,000 | | 1,840,019 |
Tamron Co. Ltd. (d) | 50,000 | | 1,942,350 |
Teijin Ltd. | 2,250,000 | | 10,858,801 |
The Sumitomo Warehouse Co. Ltd. (d) | 288,000 | | 1,659,815 |
Toho Titanium Co. Ltd. (d) | 200,000 | | 7,310,416 |
Tokai Carbon Co. Ltd. | 1,007,000 | | 12,631,174 |
Common Stocks - continued |
| Shares | | Value |
Japan - continued |
Tokuyama Corp. (d) | 2,090,000 | | $ 29,198,797 |
Tokyo Tatemono Co. Ltd. | 643,000 | | 8,274,088 |
Toshiba Machine Co. Ltd. | 1,774,000 | | 13,552,801 |
Urban Corp. | 226,300 | | 3,964,968 |
Wacom Co. Ltd. (d) | 1,700 | | 4,204,732 |
Xebio Co. Ltd. | 55,000 | | 1,623,135 |
Zenrin Co. Ltd. (d) | 196,300 | | 5,855,039 |
TOTAL JAPAN | | 464,477,426 |
Luxembourg - 1.4% |
Acergy SA | 773,900 | | 22,396,666 |
Netherlands - 4.5% |
Advanced Metallurgical Group NV | 146,000 | | 10,417,596 |
Koninklijke Wessanen NV | 1,017,015 | | 17,165,708 |
Nutreco Holding NV | 299,000 | | 20,424,965 |
OPG Groep NV (A Shares)(Certificaten Van Aandelen) unit | 150,000 | | 5,191,775 |
QIAGEN NV (a)(d) | 845,000 | | 19,891,300 |
TOTAL NETHERLANDS | | 73,091,344 |
Norway - 6.1% |
Aker Kvaerner ASA | 227,500 | | 7,927,420 |
Aker Yards AS | 279,000 | | 4,614,041 |
Cermaq ASA | 1,898,500 | | 29,097,480 |
ElectroMagnetic GeoServices ASA (d) | 262,300 | | 4,179,009 |
Marine Harvest ASA (a)(d) | 27,707,000 | | 28,086,477 |
Norwegian Property ASA | 400,400 | | 4,998,938 |
Petroleum Geo-Services ASA | 331,600 | | 9,762,937 |
ProSafe ASA | 332,000 | | 5,889,574 |
TGS Nopec Geophysical Co. ASA (a) | 316,700 | | 5,311,283 |
TOTAL NORWAY | | 99,867,159 |
Papua New Guinea - 5.3% |
Lihir Gold Ltd. (a) | 14,300,867 | | 56,776,143 |
Lihir Gold Ltd. sponsored ADR | 720,000 | | 28,850,400 |
TOTAL PAPUA NEW GUINEA | | 85,626,543 |
Portugal - 0.7% |
Banif SGPS SA | 1,610,654 | | 11,970,935 |
Sweden - 0.6% |
Bergman & Beving AB (B Shares) | 285,000 | | 9,419,634 |
Switzerland - 1.1% |
BB Biotech AG | 200,000 | | 17,560,218 |
Common Stocks - continued |
| Shares | | Value |
Taiwan - 1.6% |
HannStar Display Corp. (a) | 55,715,292 | | $ 25,712,104 |
United Kingdom - 10.0% |
ARM Holdings PLC | 2,500,000 | | 7,718,473 |
ARM Holdings PLC sponsored ADR | 1,700,000 | | 15,793,000 |
Autonomy Corp. PLC (a) | 1,558,400 | | 31,832,917 |
Avis Europe PLC (a) | 8,235,698 | | 6,848,971 |
Gyrus Group PLC (a) | 1,267,171 | | 11,262,538 |
Invensys PLC (a) | 3,400,000 | | 23,114,878 |
Laird Group PLC | 462,461 | | 6,105,395 |
Max Petroleum PLC (a) | 4,000,000 | | 8,524,105 |
Morgan Crucible Co. PLC | 400,300 | | 2,642,374 |
Premier Foods PLC | 1,490,000 | | 6,985,504 |
Renovo Group PLC (a) | 8,652,203 | | 36,336,493 |
Wolfson Microelectronics PLC (a) | 1,100,000 | | 5,803,148 |
TOTAL UNITED KINGDOM | | 162,967,796 |
United States of America - 7.1% |
AGCO Corp. (a) | 604,000 | | 36,046,720 |
Chiquita Brands International, Inc. (a) | 1,087,400 | | 20,388,750 |
NII Holdings, Inc. (a) | 116,800 | | 6,774,400 |
Titanium Metals Corp. (a)(d) | 1,478,354 | | 52,038,061 |
TOTAL UNITED STATES OF AMERICA | | 115,247,931 |
TOTAL COMMON STOCKS (Cost $1,213,398,162) | 1,549,091,764 |
Money Market Funds - 17.9% |
| | | |
Fidelity Cash Central Fund, 4.97% (b) | 87,899,285 | | 87,899,285 |
Fidelity Securities Lending Cash Central Fund, 5.02% (b)(c) | 203,798,078 | | 203,798,078 |
TOTAL MONEY MARKET FUNDS (Cost $291,697,363) | 291,697,363 |
TOTAL INVESTMENT PORTFOLIO - 112.9% (Cost $1,505,095,525) | | 1,840,789,127 |
NET OTHER ASSETS - (12.9)% | | (210,114,339) |
NET ASSETS - 100% | $ 1,630,674,788 |
Legend |
(a) Non-income producing |
(b) Affiliated fund that is available only to investment companies and other accounts managed by Fidelity Investments. The rate quoted is the annualized seven-day yield of the fund at period end. A complete unaudited listing of the fund's holdings as of its most recent quarter end is available upon request. |
(c) Investment made with cash collateral received from securities on loan. |
(d) Security or a portion of the security is on loan at period end. |
(e) Affiliated company |
Affiliated Central Funds |
Information regarding fiscal year to date income earned by the Fund from investments in Fidelity Central Funds is as follows: |
Fund | Income earned |
Fidelity Cash Central Fund | $ 1,071,947 |
Fidelity Securities Lending Cash Central Fund | 3,230,403 |
Total | $ 4,302,350 |
Other Affiliated Issuers |
An affiliated company is a company in which the fund has ownership of at least 5% of the voting securities. Fiscal year to date transactions with companies which are or were affiliates are as follows: |
Affiliate | Value, beginning of period | Purchases | Sales Proceeds | Dividend Income | Value,
end of
period |
First Tractor Co. Ltd.
(H Shares) | $ - | $ 8,262,406 | $ - | $ - | $ 11,999,397 |
See accompanying notes which are an integral part of the financial statements.
Annual Report
Financial Statements
Statement of Assets and Liabilities
| October 31, 2007 |
Assets | | |
Investment in securities, at value (including securities loaned of $196,735,174) - See accompanying schedule: Unaffiliated issuers (cost $1,205,135,756) | $ 1,537,092,367 | |
Fidelity Central Funds (cost $291,697,363) | 291,697,363 | |
Other affiliated issuers (cost $8,262,406) | 11,999,397 | |
Total Investments (cost $1,505,095,525) | | $ 1,840,789,127 |
Cash | | 1,144,511 |
Foreign currency held at value (cost $27,135) | | 27,216 |
Receivable for investments sold | | 28,451,867 |
Receivable for fund shares sold | | 2,457,360 |
Dividends receivable | | 1,026,691 |
Distributions receivable from Fidelity Central Funds | | 419,873 |
Other receivables | | 194,384 |
Total assets | | 1,874,511,029 |
| | |
Liabilities | | |
Payable for investments purchased | $ 33,306,202 | |
Payable for fund shares redeemed | 4,823,887 | |
Accrued management fee | 1,328,025 | |
Distribution fees payable | 74,625 | |
Other affiliated payables | 339,595 | |
Other payables and accrued expenses | 165,829 | |
Collateral on securities loaned, at value | 203,798,078 | |
Total liabilities | | 243,836,241 |
| | |
Net Assets | | $ 1,630,674,788 |
Net Assets consist of: | | |
Paid in capital | | $ 1,111,748,526 |
Undistributed net investment income | | 5,724,841 |
Accumulated undistributed net realized gain (loss) on investments and foreign currency transactions | | 177,567,767 |
Net unrealized appreciation (depreciation) on investments and assets and liabilities in foreign currencies | | 335,633,654 |
Net Assets | | $ 1,630,674,788 |
See accompanying notes which are an integral part of the financial statements.
Annual Report
Financial Statements - continued
Statement of Assets and Liabilities - continued
| October 31, 2007 |
Calculation of Maximum Offering Price Class A: Net Asset Value and redemption price per share ($70,785,030 ÷ 3,730,934 shares) | | $ 18.97 |
| | |
Maximum offering price per share (100/94.25 of $18.97) | | $ 20.13 |
Class T: Net Asset Value and redemption price per share ($46,568,311 ÷ 2,470,157 shares) | | $ 18.85 |
| | |
Maximum offering price per share (100/96.50 of $18.85) | | $ 19.53 |
Class B: Net Asset Value and offering price per share ($10,975,101 ÷ 588,875 shares)A | | $ 18.64 |
| | |
Class C: Net Asset Value and offering price per share ($40,893,627 ÷ 2,195,080 shares)A | | $ 18.63 |
| | |
| | |
International Small Cap Opportunities: Net Asset Value, offering price and redemption price per share ($1,433,843,833 ÷ 75,093,223 shares) | | $ 19.09 |
| | |
Institutional Class: Net Asset Value, offering price and redemption price per share ($27,608,886 ÷ 1,446,444 shares) | | $ 19.09 |
A Redemption price per share is equal to net asset value less any applicable contingent deferred sales charge.
See accompanying notes which are an integral part of the financial statements.
Annual Report
Statement of Operations
| Year ended October 31, 2007 |
Investment Income | | |
Dividends | | $ 23,621,857 |
Interest | | 2,191 |
Income from Fidelity Central Funds (including $3,230,403 from security lending) | | 4,302,350 |
| | 27,926,398 |
Less foreign taxes withheld | | (2,109,992) |
Total income | | 25,816,406 |
| | |
Expenses | | |
Management fee
Basic fee | $ 13,126,935 | |
Performance adjustment | 2,024,924 | |
Transfer agent fees | 3,340,897 | |
Distribution fees | 777,090 | |
Accounting and security lending fees | 728,123 | |
Custodian fees and expenses | 381,680 | |
Independent trustees' compensation | 5,036 | |
Registration fees | 158,009 | |
Audit | 82,409 | |
Interest | 26,963 | |
Miscellaneous | 58,967 | |
Total expenses before reductions | 20,711,033 | |
Expense reductions | (619,468) | 20,091,565 |
Net investment income (loss) | | 5,724,841 |
Realized and Unrealized Gain (Loss) Net realized gain (loss) on: | | |
Investment securities: | | |
Unaffiliated issuers (net of foreign taxes of $(2,678)) | 184,750,494 | |
Foreign currency transactions | (160,375) | |
Total net realized gain (loss) | | 184,590,119 |
Change in net unrealized appreciation (depreciation) on: Investment securities | 219,262,212 | |
Assets and liabilities in foreign currencies | (58,778) | |
Total change in net unrealized appreciation (depreciation) | | 219,203,434 |
Net gain (loss) | | 403,793,553 |
Net increase (decrease) in net assets resulting from operations | | $ 409,518,394 |
See accompanying notes which are an integral part of the financial statements.
Annual Report
Financial Statements - continued
Statement of Changes in Net Assets
| Year ended
October 31,
2007 | Year ended
October 31,
2006 |
Increase (Decrease) in Net Assets | | |
Operations | | |
Net investment income (loss) | $ 5,724,841 | $ 3,177,589 |
Net realized gain (loss) | 184,590,119 | (953,704) |
Change in net unrealized appreciation (depreciation) | 219,203,434 | 115,235,200 |
Net increase (decrease) in net assets resulting
from operations | 409,518,394 | 117,459,085 |
Distributions to shareholders from net realized gain | - | (90,957) |
Share transactions - net increase (decrease) | 127,196,896 | 760,497,703 |
Redemption fees | 783,954 | 1,853,226 |
Total increase (decrease) in net assets | 537,499,244 | 879,719,057 |
| | |
Net Assets | | |
Beginning of period | 1,093,175,544 | 213,456,487 |
End of period (including undistributed net investment income of $5,724,841 and undistributed net investment income of $3,179,958, respectively) | $ 1,630,674,788 | $ 1,093,175,544 |
See accompanying notes which are an integral part of the financial statements.
Annual Report
Financial Highlights - Class A
Years ended October 31, | 2007 | 2006 | 2005 H |
Selected Per-Share Data | | | |
Net asset value, beginning of period | $ 14.18 | $ 10.41 | $ 10.00 |
Income from Investment Operations | | | |
Net investment income (loss) E | .02 | - J | -J |
Net realized and unrealized gain (loss) | 4.76 | 3.74 | .40 |
Total from investment operations | 4.78 | 3.74 | .40 |
Distributions from net realized gain | - | - J | - |
Redemption fees added to paid in capital E | .01 | .03 | .01 |
Net asset value, end of period | $ 18.97 | $ 14.18 | $ 10.41 |
Total Return B,C,D | 33.78% | 36.25% | 4.10% |
Ratios to Average Net AssetsF,I | | | |
Expenses before reductions | 1.63% | 1.63% | 2.67% A |
Expenses net of fee waivers, if any | 1.63% | 1.63% | 1.65% A |
Expenses net of all reductions | 1.59% | 1.51% | 1.54% A |
Net investment income (loss) | .10% | .02% | (.09)%A |
Supplemental Data | | | |
Net assets, end of period (000 omitted) | $ 70,785 | $ 35,674 | $ 5,533 |
Portfolio turnover rate G | 107% | 164% | 46% |
A Annualized
B Total returns for periods of less than one year are not annualized.
C Total returns would have been lower had certain expenses not been reduced during the periods shown.
D Total returns do not include the effect of the sales charges.
E Calculated based on average shares outstanding during the period.
F Fees and expenses of the underlying Fidelity Central Funds are not included in the Fund's expense ratio. The Fund indirectly bears its proportionate share of the expenses of any underlying Fidelity Central Funds.
G Amount does not include the portfolio activity of any underlying Fidelity Central Funds.
H For the period August 2, 2005 (commencement of operations) to October 31, 2005.
I Expense ratios reflect operating expenses of the class. Expenses before reductions do not reflect amounts reimbursed by the investment adviser or reductions from brokerage service arrangements or other expense offset arrangements and do not represent the amount paid by the class during periods when reimbursements or reductions occur. Expense ratios before reductions for start-up periods may not be representative of longer-term operating periods. Expenses net of fee waivers reflect expenses after reimbursement by the investment adviser but prior to reductions from brokerage service arrangements or other expense offset arrangements. Expenses net of all reductions represent the net expenses paid by the class.
J Amount represents less than $.01 per share.
See accompanying notes which are an integral part of the financial statements.
Annual Report
Financial Highlights - Class T
Years ended October 31, | 2007 | 2006 | 2005 H |
Selected Per-Share Data | | | |
Net asset value, beginning of period | $ 14.12 | $ 10.38 | $ 10.00 |
Income from Investment Operations | | | |
Net investment income (loss) E | (.02) | (.03) | (.01) |
Net realized and unrealized gain (loss) | 4.74 | 3.74 | .38 |
Total from investment operations | 4.72 | 3.71 | .37 |
Redemption fees added to paid in capital E | .01 | .03 | .01 |
Net asset value, end of period | $ 18.85 | $ 14.12 | $ 10.38 |
Total Return B,C,D | 33.50% | 36.03% | 3.80% |
Ratios to Average Net Assets F,I | | | |
Expenses before reductions | 1.85% | 1.85% | 2.92% A |
Expenses net of fee waivers, if any | 1.85% | 1.85% | 1.90% A |
Expenses net of all reductions | 1.81% | 1.74% | 1.78% A |
Net investment income (loss) | (.13)% | (.20)% | (.33)%A |
Supplemental Data | | | |
Net assets, end of period (000 omitted) | $ 46,568 | $ 28,309 | $ 2,704 |
Portfolio turnover rate G | 107% | 164% | 46% |
A Annualized
B Total returns for periods of less than one year are not annualized.
C Total returns would have been lower had certain expenses not been reduced during the periods shown.
D Total returns do not include the effect of the sales charges.
E Calculated based on average shares outstanding during the period.
F Fees and expenses of the underlying Fidelity Central Funds are not included in the Fund's expense ratio. The Fund indirectly bears its proportionate share of the expenses of any underlying Fidelity Central Funds.
G Amount does not include the portfolio activity of any underlying Fidelity Central Funds.
H For the period August 2, 2005 (commencement of operations) to October 31, 2005.
I Expense ratios reflect operating expenses of the class. Expenses before reductions do not reflect amounts reimbursed by the investment adviser or reductions from brokerage service arrangements or other expense offset arrangements and do not represent the amount paid by the class during periods when reimbursements or reductions occur. Expense ratios before reductions for start-up periods may not be representative of longer-term operating periods. Expenses net of fee waivers reflect expenses after reimbursement by the investment adviser but prior to reductions from brokerage service arrangements or other expense offset arrangements. Expenses net of all reductions represent the net expenses paid by the class.
See accompanying notes which are an integral part of the financial statements.
Annual Report
Financial Highlights - Class B
Years ended October 31, | 2007 | 2006 | 2005 H |
Selected Per-Share Data | | | |
Net asset value, beginning of period | $ 14.04 | $ 10.37 | $ 10.00 |
Income from Investment Operations | | | |
Net investment income (loss) E | (.11) | (.10) | (.02) |
Net realized and unrealized gain (loss) | 4.70 | 3.74 | .38 |
Total from investment operations | 4.59 | 3.64 | .36 |
Redemption fees added to paid in capital E | .01 | .03 | .01 |
Net asset value, end of period | $ 18.64 | $ 14.04 | $ 10.37 |
Total Return B,C,D | 32.76% | 35.39% | 3.70% |
Ratios to Average Net Assets F,I | | | |
Expenses before reductions | 2.40% | 2.45% | 3.43% A |
Expenses net of fee waivers, if any | 2.40% | 2.41% | 2.40% A |
Expenses net of all reductions | 2.36% | 2.30% | 2.27% A |
Net investment income (loss) | (.67)% | (.76)% | (.82)%A |
Supplemental Data | | | |
Net assets, end of period (000 omitted) | $ 10,975 | $ 7,709 | $ 1,705 |
Portfolio turnover rate G | 107% | 164% | 46% |
A Annualized
B Total returns for periods of less than one year are not annualized.
C Total returns would have been lower had certain expenses not been reduced during the periods shown.
D Total returns do not include the effect of the contingent deferred sales charge.
E Calculated based on average shares outstanding during the period.
F Fees and expenses of the underlying Fidelity Central Funds are not included in the Fund's expense ratio. The Fund indirectly bears its proportionate share of the expenses of any underlying Fidelity Central Funds.
G Amount does not include the portfolio activity of any underlying Fidelity Central Funds.
H For the period August 2, 2005 (commencement of operations) to October 31, 2005.
I Expense ratios reflect operating expenses of the class. Expenses before reductions do not reflect amounts reimbursed by the investment adviser or reductions from brokerage service arrangements or other expense offset arrangements and do not represent the amount paid by the class during periods when reimbursements or reductions occur. Expense ratios before reductions for start-up periods may not be representative of longer-term operating periods. Expenses net of fee waivers reflect expenses after reimbursement by the investment adviser but prior to reductions from brokerage service arrangements or other expense offset arrangements. Expenses net of all reductions represent the net expenses paid by the class.
See accompanying notes which are an integral part of the financial statements.
Annual Report
Financial Highlights - Class C
Years ended October 31, | 2007 | 2006 | 2005 H |
Selected Per-Share Data | | | |
Net asset value, beginning of period | $ 14.03 | $ 10.37 | $ 10.00 |
Income from Investment Operations | | | |
Net investment income (loss) E | (.11) | (.10) | (.02) |
Net realized and unrealized gain (loss) | 4.70 | 3.73 | .38 |
Total from investment operations | 4.59 | 3.63 | .36 |
Redemption fees added to paid in capital E | .01 | .03 | .01 |
Net asset value, end of period | $ 18.63 | $ 14.03 | $ 10.37 |
Total Return B,C,D | 32.79% | 35.29% | 3.70% |
Ratios to Average Net Assets F,I | | | |
Expenses before reductions | 2.38% | 2.38% | 3.32% A |
Expenses net of fee waivers, if any | 2.38% | 2.38% | 2.40% A |
Expenses net of all reductions | 2.34% | 2.27% | 2.29% A |
Net investment income (loss) | (.66)% | (.73)% | (.84)%A |
Supplemental Data | | | |
Net assets, end of period (000 omitted) | $ 40,894 | $ 26,320 | $ 3,317 |
Portfolio turnover rate G | 107% | 164% | 46% |
A Annualized
B Total returns for periods of less than one year are not annualized.
C Total returns would have been lower had certain expenses not been reduced during the periods shown.
D Total returns do not include the effect of the contingent deferred sales charge.
E Calculated based on average shares outstanding during the period.
F Fees and expenses of the underlying Fidelity Central Funds are not included in the Fund's expense ratio. The Fund indirectly bears its proportionate share of the expenses of any underlying Fidelity Central Funds.
G Amount does not include the portfolio activity of any underlying Fidelity Central Funds.
H For the period August 2, 2005 (commencement of operations) to October 31, 2005.
I Expense ratios reflect operating expenses of the class. Expenses before reductions do not reflect amounts reimbursed by the investment adviser or reductions from brokerage service arrangements or other expense offset arrangements and do not represent the amount paid by the class during periods when reimbursements or reductions occur. Expense ratios before reductions for start-up periods may not be representative of longer-term operating periods. Expenses net of fee waivers reflect expenses after reimbursement by the investment adviser but prior to reductions from brokerage service arrangements or other expense offset arrangements. Expenses net of all reductions represent the net expenses paid by the class.
See accompanying notes which are an integral part of the financial statements.
Annual Report
Financial Highlights - International Small Cap Opportunities
Years ended October 31, | 2007 | 2006 | 2005 G |
Selected Per-Share Data | | | |
Net asset value, beginning of period | $ 14.23 | $ 10.40 | $ 10.00 |
Income from Investment Operations | | | |
Net investment income (loss) D | .07 | .05 | - I |
Net realized and unrealized gain (loss) | 4.78 | 3.75 | .39 |
Total from investment operations | 4.85 | 3.80 | .39 |
Distributions from net realized gain | - | - I | - |
Redemption fees added to paid in capital D | .01 | .03 | .01 |
Net asset value, end of period | $ 19.09 | $ 14.23 | $ 10.40 |
Total Return B,C | 34.15% | 36.86% | 4.00% |
Ratios to Average Net Assets E,H | | | |
Expenses before reductions | 1.30% | 1.28% | 2.25% A |
Expenses net of fee waivers, if any | 1.30% | 1.28% | 1.40% A |
Expenses net of all reductions | 1.25% | 1.16% | 1.31% A |
Net investment income (loss) | .43% | .37% | .14% A |
Supplemental Data | | | |
Net assets, end of period (000 omitted) | $ 1,433,844 | $ 981,210 | $ 197,349 |
Portfolio turnover rate F | 107% | 164% | 46% |
A Annualized
B Total returns for periods of less than one year are not annualized.
C Total returns would have been lower had certain expenses not been reduced during the periods shown.
D Calculated based on average shares outstanding during the period.
E Fees and expenses of the underlying Fidelity Central Funds are not included in the Fund's expense ratio. The Fund indirectly bears its proportionate share of the expenses of any underlying Fidelity Central Funds.
F Amount does not include the portfolio activity of any underlying Fidelity Central Funds.
G For the period August 2, 2005 (commencement of operations) to October 31, 2005.
H Expense ratios reflect operating expenses of the class. Expenses before reductions do not reflect amounts reimbursed by the investment adviser or reductions from brokerage service arrangements or other expense offset arrangements and do not represent the amount paid by the class during periods when reimbursements or reductions occur. Expense ratios before reductions for start-up periods may not be representative of longer-term operating periods. Expenses net of fee waivers reflect expenses after reimbursement by the investment adviser but prior to reductions from brokerage service arrangements or other expense offset arrangements. Expenses net of all reductions represent the net expenses paid by the class.
I Amount represents less than $.01 per share.
See accompanying notes which are an integral part of the financial statements.
Annual Report
Financial Highlights - Institutional Class
Years ended October 31, | 2007 | 2006 | 2005 G |
Selected Per-Share Data | | | |
Net asset value, beginning of period | $ 14.22 | $ 10.40 | $ 10.00 |
Income from Investment Operations | | | |
Net investment income (loss) D | .08 | .05 | - I |
Net realized and unrealized gain (loss) | 4.78 | 3.74 | .39 |
Total from investment operations | 4.86 | 3.79 | .39 |
Distributions from net realized gain | - | - I | - |
Redemption fees added to paid in capital D | .01 | .03 | .01 |
Net asset value, end of period | $ 19.09 | $ 14.22 | $ 10.40 |
Total Return B,C | 34.25% | 36.77% | 4.00% |
Ratios to Average Net Assets E,H | | | |
Expenses before reductions | 1.29% | 1.25% | 2.25% A |
Expenses net of fee waivers, if any | 1.29% | 1.25% | 1.40% A |
Expenses net of all reductions | 1.25% | 1.14% | 1.29% A |
Net investment income (loss) | .44% | .40% | .16% A |
Supplemental Data | | | |
Net assets, end of period (000 omitted) | $ 27,609 | $ 13,954 | $ 2,849 |
Portfolio turnover rate F | 107% | 164% | 46% |
A Annualized
B Total returns for periods of less than one year are not annualized.
C Total returns would have been lower had certain expenses not been reduced during the periods shown.
D Calculated based on average shares outstanding during the period.
E Fees and expenses of the underlying Fidelity Central Funds are not included in the Fund's expense ratio. The Fund indirectly bears its proportionate share of the expenses of any underlying Fidelity Central Funds.
F Amount does not include the portfolio activity of any underlying Fidelity Central Funds.
G For the period August 2, 2005 (commencement of operations) to October 31, 2005.
H Expense ratios reflect operating expenses of the class. Expenses before reductions do not reflect amounts reimbursed by the investment adviser or reductions from brokerage service arrangements or other expense offset arrangements and do not represent the amount paid by the class during periods when reimbursements or reductions occur. Expense ratios before reductions for start-up periods may not be representative of longer-term operating periods. Expenses net of fee waivers reflect expenses after reimbursement by the investment adviser but prior to reductions from brokerage service arrangements or other expense offset arrangements. Expenses net of all reductions represent the net expenses paid by the class.
I Amount represents less than $.01 per share.
See accompanying notes which are an integral part of the financial statements.
Annual Report
Notes to Financial Statements
For the period ended October 31, 2007
1. Organization.
Fidelity International Small Cap Opportunities Fund (the Fund) is a fund of Fidelity Investment Trust (the trust) and is authorized to issue an unlimited number of shares. The trust is registered under the Investment Company Act of 1940, as amended (the 1940 Act), as an open-end management investment company organized as a Massachusetts business trust. The Fund offers Class A, Class T, Class B, Class C, International Small Cap Opportunities, and Institutional Class shares, each of which has equal rights as to assets and voting privileges. Each class has exclusive voting rights with respect to matters that affect that class. Class B shares will automatically convert to Class A shares after a holding period of seven years from the initial date of purchase. Investment income, realized and unrealized capital gains and losses, the common expenses of the Fund, and certain fund-level expense reductions, if any, are allocated on a pro rata basis to each class based on the relative net assets of each class to the total net assets of the Fund. Each class differs with respect to transfer agent and distribution and service plan fees incurred. Certain expense reductions also differ by class. The Fund's investments in emerging markets can be subject to social, economic, regulatory, and political uncertainties and can be volatile.
2. Investments in Fidelity Central Funds.
The Fund may invest in Fidelity Central Funds, which are open-end investment companies available only to other investment companies and accounts managed by Fidelity Management & Research Company (FMR) and its affiliates. The Fund's Schedule of Investments lists each of the Fidelity Central Funds as an investment of the Fund, but does not include the underlying holdings of each Fidelity Central Fund. As an Investing Fund, the Fund indirectly bears its proportionate share of the expenses of the underlying Fidelity Central Funds.
The Money Market Central Funds seek preservation of capital and current income and are managed by Fidelity Investments Money Management, Inc. (FIMM), an affiliate of FMR.
A complete list of holdings for each Fidelity Central Fund is available upon request or at the SEC's web site at www.sec.gov. In addition, the financial statements of the Fidelity Central Funds, which are not covered by the Fund's Report of Independent Registered Public Accounting Firm, are available on the SEC's web site or upon request.
3. Significant Accounting Policies.
The financial statements have been prepared in conformity with accounting principles generally accepted in the United States of America, which require management to make certain estimates and assumptions at the date of the financial statements. The following summarizes the significant accounting policies of the Fund:
Annual Report
Notes to Financial Statements - continued
3. Significant Accounting Policies - continued
Security Valuation. Investments are valued and net asset value (NAV) per share is calculated (NAV calculation) as of the close of business of the New York Stock Exchange (NYSE), normally 4:00 p.m. Eastern time. Wherever possible, the Fund uses independent pricing services approved by the Board of Trustees to value its investments.
Equity securities, including restricted securities, for which market quotations are readily available, are valued at the last reported sale price or official closing price as reported by an independent pricing service on the primary market or exchange on which they are traded. In the event there were no sales during the day or closing prices are not available, securities are valued at the last quoted bid price. Investments in open-end mutual funds, including the Fidelity Central Funds, are valued at their closing net asset value each business day. Short-term securities with remaining maturities of sixty days or less for which quotations are not readily available are valued at amortized cost, which approximates value.
When current market prices or quotations are not readily available or do not accurately reflect fair value, valuations may be determined in accordance with procedures adopted by the Board of Trustees. For example, when developments occur between the close of a market and the close of the NYSE that may materially affect the value of some or all of the securities, or when trading in a security is halted, those securities may be fair valued. Factors used in the determination of fair value may include monitoring news to identify significant market or security specific events such as changes in the value of U.S. securities markets, reviewing developments in foreign markets and evaluating the performance of ADRs, futures contracts and exchange-traded funds. Because the Fund's utilization of fair value pricing depends on market activity, the frequency with which fair value pricing is used cannot be predicted and may be utilized to a significant extent. The value of securities used for NAV calculation under fair value pricing may differ from published prices for the same securities.
Foreign Currency. The Fund uses foreign currency contracts to facilitate transactions in foreign-denominated securities. Losses from these transactions may arise from changes in the value of the foreign currency or if the counterparties do not perform under the contracts' terms.
Foreign-denominated assets, including investment securities, and liabilities are translated into U.S. dollars at the exchange rate at period end. Purchases and sales of investment securities, income and dividends received and expenses denominated in foreign currencies are translated into U.S. dollars at the exchange rate in effect on the transaction date.
Annual Report
3. Significant Accounting Policies - continued
Foreign Currency - continued
The effects of exchange rate fluctuations on investments are included with the net realized and unrealized gain (loss) on investment securities. Other foreign currency transactions resulting in realized and unrealized gain (loss) are disclosed separately.
Investment Transactions and Income. For financial reporting purposes, the Fund's investment holdings and NAV include trades executed through the end of the last business day of the period. The NAV for processing shareholder transactions includes trades executed through the end of the prior business day. Gains and losses on securities sold are determined on the basis of identified cost. Dividend income is recorded on the ex-dividend date, except for certain dividends from foreign securities where the ex-dividend date may have passed, which are recorded as soon as the Fund is informed of the ex-dividend date. Non-cash dividends included in dividend income, if any, are recorded at the fair market value of the securities received. Interest income and distributions from the Fidelity Central Funds are accrued as earned. Interest income includes coupon interest and amortization of premium and accretion of discount on debt securities. Investment income is recorded net of foreign taxes withheld where recovery of such taxes is uncertain.
Expenses. Most expenses of the trust can be directly attributed to a fund. Expenses which cannot be directly attributed are apportioned among each Fund in the trust. Expense estimates are accrued in the period to which they relate and adjustments are made when actual amounts are known.
Income Tax Information and Distributions to Shareholders. Each year, the Fund intends to qualify as a regulated investment company by distributing all of its taxable income and realized gains under Subchapter M of the Internal Revenue Code. As a result, no provision for income taxes is required in the accompanying financial statements. Foreign taxes are provided for based on the Fund's understanding of the tax rules and rates that exist in the foreign markets in which it invests.
Distributions are recorded on the ex-dividend date. Income dividends and capital gain distributions are declared separately for each class. Income and capital gain distributions are determined in accordance with income tax regulations, which may differ from generally accepted accounting principles. In addition, the Fund will claim a portion of the payment made to redeeming shareholders as a distribution for income tax purposes.
Capital accounts within the financial statements are adjusted for permanent book-tax differences. These adjustments have no impact on net assets or the results of operations. Temporary book-tax differences will reverse in a subsequent period.
Annual Report
Notes to Financial Statements - continued
3. Significant Accounting Policies - continued
Income Tax Information and Distributions to Shareholders - continued
Book-tax differences are primarily due to foreign currency transactions, passive foreign investment companies (PFIC), certain foreign taxes, capital loss carryforwards, and losses deferred due to wash sales.
The tax-basis components of distributable earnings and the federal tax cost as of period end were as follows:
Unrealized appreciation | $ 376,134,487 | |
Unrealized depreciation | (47,440,840) | |
Net unrealized appreciation (depreciation) | 328,693,647 | |
Undistributed ordinary income | 16,755,641 | |
Undistributed long-term capital gain | 142,362,068 | |
| | |
Cost for federal income tax purposes | $ 1,512,095,480 | |
The tax character of distributions paid was as follows:
| October 31, 2007 | October 31, 2006 |
Ordinary Income | $ - | $ 90,957 |
Short-Term Trading (Redemption) Fees. Shares held in the Fund less than 90 days are subject to a redemption fee equal to 2.00% of the proceeds of the redeemed shares. All redemption fees, including any estimated redemption fees paid by FMR, are retained by the Fund and accounted for as an addition to paid in capital.
New Accounting Pronouncements. In July 2006, Financial Accounting Standards Board Interpretation No. 48, Accounting for Uncertainty in Income Taxes - an interpretation of FASB Statement 109 (FIN 48), was issued and is effective on the last business day of the semiannual reporting period for fiscal years beginning after December 15, 2006. FIN 48 sets forth a threshold for financial statement recognition, measurement and disclosure of a tax position taken or expected to be taken on a tax return. Management has concluded that the adoption of FIN 48 will not result in a material impact on the Fund's net assets, results of operations and financial statement disclosures.
In addition, in September 2006, Statement of Financial Accounting Standards No. 157, Fair Value Measurements (SFAS 157), was issued and is effective for fiscal years beginning after November 15, 2007. SFAS 157 defines fair value, establishes a framework for measuring fair value and expands disclosures about fair value measurements. Management is currently evaluating the impact the adoption of SFAS 157 will have on the Fund's financial statement disclosures.
Annual Report
4. Operating Policies.
Repurchase Agreements. FMR has received an Exemptive Order from the Securities and Exchange Commission (the SEC) which permits the Fund and other affiliated entities of FMR to transfer uninvested cash balances into joint trading accounts which are then invested in repurchase agreements. The Fund may also invest directly with institutions in repurchase agreements. Repurchase agreements are collateralized by government or non-government securities. Upon settlement date, collateral is held in segregated accounts with custodian banks and may be obtained in the event of a default of the counterparty. The Fund monitors, on a daily basis, the value of the collateral to ensure it is at least equal to the principal amount of the repurchase agreement (including accrued interest). In the event of a default by the counterparty, realization of the collateral proceeds could be delayed, during which time the value of the collateral may decline.
5. Purchases and Sales of Investments.
Purchases and sales of securities, other than short-term securities, aggregated $1,662,112,013 and $1,600,989,161, respectively.
6. Fees and Other Transactions with Affiliates.
Management Fee. FMR and its affiliates provide the Fund with investment management related services for which the Fund pays a monthly management fee. The management fee is the sum of an individual fund fee rate that is based on an annual rate of .60% of the Fund's average net assets and a group fee rate that averaged ..26% during the period. The group fee rate is based upon the average net assets of all the mutual funds advised by FMR. The group fee rate decreases as assets under management increase and increases as assets under management decrease. In addition, the management fee is subject to a performance adjustment (up to a maximum of ±.20% of the Fund's average net assets over a 36 month performance period). The upward or downward adjustment to the management fee is based on the relative investment performance of the retail class of the Fund, International Small Cap Opportunities as compared to an appropriate benchmark index. The Fund's performance adjustment took effect in August 2006. Subsequent months will be added until the performance period includes 36 months. For the period, the total annual management fee rate, including the performance adjustment, was .99% of the Fund's average net assets.
Distribution and Service Plan. In accordance with Rule 12b-1 of the 1940 Act, the Fund has adopted separate Distribution and Service Plans for each class of shares. Certain classes pay Fidelity Distributors Corporation (FDC), an affiliate of FMR, separate Distribution and Service Fees, each of which is based on an annual percentage of each class' average net assets. In addition, FDC may pay financial intermediaries for selling shares of the Fund and providing shareholder support services. For the period,
Annual Report
Notes to Financial Statements - continued
6. Fees and Other Transactions with Affiliates - continued
Distribution and Service Plan - continued
the Distribution and Service Fee rates and the total amounts paid to and retained by FDC were as follows:
| Distribution
Fee | Service
Fee | Paid to
FDC | Retained
by FDC |
Class A | 0% | .25% | $ 131,681 | $ 13,131 |
Class T | .25% | .25% | 204,126 | 8,816 |
Class B | .75% | .25% | 97,469 | 74,563 |
Class C | .75% | .25% | 343,814 | 137,424 |
| | | $ 777,090 | $ 233,934 |
Sales Load. FDC receives a front-end sales charge of up to 5.75% for selling Class A shares, and 3.50% for selling Class T shares, some of which is paid to financial intermediaries for selling shares of the Fund. FDC receives the proceeds of contingent deferred sales charges levied on Class A, Class T, Class B, and Class C redemptions. These charges depend on the holding period. The deferred sales charges range from 5% to 1% for Class B, 1% for Class C, 1.00% to .50% for certain purchases of Class A shares and .25% for certain purchases of Class T shares.
For the period, sales charge amounts retained by FDC were as follows:
| Retained
by FDC |
Class A | $ 71,361 |
Class T | 16,861 |
Class B* | 18,023 |
Cass C* | 7,770 |
| $ 114,015 |
* When Class B and Class C shares are initially sold, FDC pays commissions from its own resources to financial intermediaries through which the sales are made.
Transfer Agent Fees. Fidelity Investments Institutional Operations Company, Inc. (FIIOC), an affiliate of FMR, is the transfer, dividend disbursing and shareholder servicing agent for each class of the Fund, except for International Small Cap Opportunities. Fidelity Service Company, Inc. (FSC), an affiliate of FMR, is the transfer agent for International Small Cap Opportunities shares. FIIOC and FSC receive account fees and asset-based fees that vary according to the account size and type of account of the shareholders of the respective classes of the Fund. FIIOC and FSC pay for typesetting, printing and mailing of shareholder reports, except proxy statements. For the period, the total transfer agent fees paid by each class to FIIOC or FSC, were as follows:
Annual Report
6. Fees and Other Transactions with Affiliates - continued
Transfer Agent Fees - continued
| Amount | % of
Average
Net Assets |
Class A | $ 157,033 | .30 |
Class T | 110,999 | .27 |
Class B | 30,834 | .32 |
Class C | 104,103 | .30 |
International Small Cap Opportunities | 2,895,757 | .21 |
Institutional Class | 42,171 | .20 |
| $ 3,340,897 | |
Accounting and Security Lending Fees. FSC maintains the Fund's accounting records. The accounting fee is based on the level of average net assets for the month. Under a separate contract, FSC administers the security lending program. The security lending fee is based on the number and duration of lending transactions.
Brokerage Commissions. The Fund placed a portion of its portfolio transactions with brokerage firms which are affiliates of the investment adviser. The commissions paid to these affiliated firms were $357 for the period.
Interfund Lending Program. Pursuant to an Exemptive Order issued by the SEC, the Fund, along with other registered investment companies having management contracts with FMR, may participate in an interfund lending program. This program provides an alternative credit facility allowing the funds to borrow from, or lend money to, other participating affiliated funds. At period end, there were no interfund loans outstanding. The Fund's activity in this program during the period for which loans were outstanding was as follows:
Borrower or Lender | Average Daily
Loan Balance | Weighted Average Interest Rate | Interest Expense |
Borrower | $ 12,170,667 | 5.32% | $ 26,963 |
7. Committed Line of Credit.
The Fund participates with other funds managed by FMR in a $4.2 billion credit facility (the "line of credit") to be utilized for temporary or emergency purposes to fund shareholder redemptions or for other short-term liquidity purposes. The Fund has agreed to pay commitment fees on its pro rata portion of the line of credit, which amounted to $3,037 and is reflected in Miscellaneous Expense on the Statement of Operations. During the period, there were no borrowings on this line of credit.
Annual Report
Notes to Financial Statements - continued
8. Security Lending.
The Fund lends portfolio securities from time to time in order to earn additional income. On the settlement date of the loan, the Fund receives collateral (in the form of U.S. Treasury obligations, letters of credit and/or cash) against the loaned securities and maintains collateral in an amount not less than 100% of the market value of the loaned securities during the period of the loan. The market value of the loaned securities is determined at the close of business of the Fund and any additional required collateral is delivered to the Fund on the next business day. If the borrower defaults on its obligation to return the securities loaned because of insolvency or other reasons, a fund could experience delays and costs in recovering the securities loaned or in gaining access to the collateral. Any cash collateral received is invested in the Fidelity Securities Lending Cash Central Fund. The value of loaned securities and cash collateral at period end are disclosed on the Fund's Statement of Assets and Liabilities. Security lending income represents the income earned on investing cash collateral, less fees and expenses associated with the loan, plus any premium payments that may be received on the loan of certain types of securities. Security lending income is presented in the Statement of Operations as a component of income from Fidelity Central Funds.
9. Expense Reductions.
FMR voluntarily agreed to reimburse each class to the extent annual operating expenses exceeded certain levels of average net assets as noted in the table below. Some expenses, for example interest expense, including commitment fees, are excluded from this reimbursement.
The following classes were in reimbursement during the period:
| Expense
Limitations | Reimbursement
from adviser |
Class B | 2.40% | $ 76 |
Many of the brokers with whom FMR places trades on behalf of the Fund provided services to the Fund in addition to trade execution. These services included payments of certain expenses on behalf of the Fund totaling $613,429 for the period. In addition, through arrangements with each class' transfer agent, credits realized as a result of uninvested cash balances were used to reduce the Fund's expenses. During the period, these credits reduced each class' transfer agent expense as noted in the table below.
| Transfer Agent
expense reduction | |
International Small Cap Opportunities | $ 5,963 | |
Annual Report
10. Other.
The Fund's organizational documents provide former and current trustees and officers with a limited indemnification against liabilities arising in connection with the performance of their duties to the Fund. In the normal course of business, the Fund may also enter into contracts that provide general indemnifications. The Fund's maximum exposure under these arrangements is unknown as this would be dependent on future claims that may be made against the Fund. The risk of material loss from such claims is considered remote.
In September 2006, FIIOC, a transfer agent of the Fund, notified the Fund that the Fund's books and records did not reflect a conversion of certain Class B to Class A shares upon their conversion date. In March 2007, FIIOC converted the relevant Class B shares to Class A shares and recorded the conversion in the books and records of the Fund which did not result in a material impact to the Fund's reported net assets or results of operations in the accompanying financial statements. FIIOC has remediated affected shareholders and reimbursed the Fund for all related audit and legal expenses.
11. Distributions to Shareholders.
Distributions to shareholders of each class were as follows:
Years ended October 31, | 2007 | 2006 |
From net realized gain | | |
Class A | $ - | $ 2,067 |
International Small Cap Opportunities | - | 87,898 |
Institutional Class | - | 992 |
Total | $ - | $ 90,957 |
12. Share Transactions.
Transactions for each class of shares were as follows:
| Shares | Dollars |
Years ended October 31, | 2007 | 2006 | 2007 | 2006 |
Class A | | | | |
Shares sold | 2,107,892 | 2,562,140 | $ 35,531,826 | $ 35,143,597 |
Reinvestment of distributions | - | 162 | - | 1,916 |
Shares redeemed | (892,381) | (578,488) | (14,908,147) | (7,816,655) |
Net increase (decrease) | 1,215,511 | 1,983,814 | $ 20,623,679 | $ 27,328,858 |
Class T | | | | |
Shares sold | 1,311,252 | 1,977,012 | $ 21,607,239 | $ 27,202,466 |
Shares redeemed | (845,477) | (233,065) | (14,215,111) | (3,118,693) |
Net increase (decrease) | 465,775 | 1,743,947 | $ 7,392,128 | $ 24,083,773 |
Annual Report
Notes to Financial Statements - continued
12. Share Transactions - continued
Transactions for each class of shares were as follows: - continued
| Shares | Dollars |
Years ended October 31, | 2007 | 2006 | 2007 | 2006 |
Class B | | | | |
Shares sold | 286,293 | 498,394 | $ 4,653,400 | $ 6,815,227 |
Shares redeemed | (246,522) | (113,628) | (4,027,585) | (1,550,424) |
Net increase (decrease) | 39,771 | 384,766 | $ 625,815 | $ 5,264,803 |
Class C | | | | |
Shares sold | 888,414 | 1,745,210 | $ 14,698,282 | $ 24,032,601 |
Shares redeemed | (569,219) | (189,077) | (9,379,169) | (2,515,739) |
Net increase (decrease) | 319,195 | 1,556,133 | $ 5,319,113 | $ 21,516,862 |
International Small Cap Opportunities | | | | |
Shares sold | 48,402,736 | 93,068,555 | $ 800,622,633 | $ 1,259,777,775 |
Reinvestment of distributions | - | 6,974 | - | 82,435 |
Shares redeemed | (42,286,931) | (43,072,008) | (715,447,148) | (586,736,058) |
Net increase (decrease) | 6,115,805 | 50,003,521 | $ 85,175,485 | $ 673,124,152 |
Institutional Class | | | | |
Shares sold | 903,141 | 1,299,662 | $ 15,436,027 | $ 17,883,260 |
Reinvestment of distributions | - | 83 | - | 980 |
Shares redeemed | (437,882) | (592,563) | (7,375,351) | (8,704,985) |
Net increase (decrease) | 465,259 | 707,182 | $ 8,060,676 | $ 9,179,255 |
Annual Report
Report of Independent Registered Public Accounting Firm
To the Trustees of Fidelity Investment Trust and Shareholders of Fidelity International Small Cap Opportunities Fund:
We have audited the accompanying statement of assets and liabilities of Fidelity International Small Cap Opportunities Fund (the Fund), a fund of Fidelity Investment Trust, including the schedule of investments, as of October 31, 2007, and the related statement of operations for the year then ended, the statement of changes in net assets for each of the two years in the period then ended, and the financial highlights for each of the three years in the period then ended. These financial statements and financial highlights are the responsibility of the Fund's management. Our responsibility is to express an opinion on these financial statements and financial highlights based on our audits.
We conducted our audits in accordance with standards of the Public Company Accounting Oversight Board (United States). Those standards require that we plan and perform the audit to obtain reasonable assurance about whether the financial statements and financial highlights are free of material misstatement. The Fund is not required to have, nor were we engaged to perform, an audit of its internal control over financial reporting. Our audits included consideration of internal control over financial reporting as a basis for designing audit procedures that are appropriate in the circumstances, but not for the purpose of expressing an opinion on the effectiveness of the Fund's internal control over financial reporting. Accordingly, we express no such opinion. An audit also includes examining, on a test basis, evidence supporting the amounts and disclosures in the financial statements, assessing the accounting principles used and significant estimates made by management, as well as evaluating the overall financial statement presentation. Our procedures included confirmation of securities owned as of October 31, 2007, by correspondence with the custodians and brokers; where replies were not received from brokers, we performed other auditing procedures. We believe that our audits provide a reasonable basis for our opinion.
In our opinion, the financial statements and financial highlights referred to above present fairly, in all material respects, the financial position of Fidelity International Small Cap Opportunities Fund as of October 31, 2007, the results of its operations for the year then ended, the changes in its net assets for each of the two years in the period then ended, and its financial highlights for each of the three years in the period then ended, in conformity with accounting principles generally accepted in the United States of America.
/s/ Deloitte & Touche LLP
DELOITTE & TOUCHE LLP
Boston, Massachusetts
December 18, 2007
Annual Report
Trustees and Officers
The Trustees, Members of the Advisory Board, and executive officers of the trust and fund, as applicable, are listed below. The Board of Trustees governs the fund and is responsible for protecting the interests of shareholders. The Trustees are experienced executives who meet periodically throughout the year to oversee the fund's activities, review contractual arrangements with companies that provide services to the fund, and review the fund's performance. Except for James C. Curvey, each of the Trustees oversees 370 funds advised by FMR or an affiliate. Mr. Curvey oversees 340 funds advised by FMR or an affiliate.
The Trustees hold office without limit in time except that (a) any Trustee may resign; (b) any Trustee may be removed by written instrument, signed by at least two-thirds of the number of Trustees prior to such removal; (c) any Trustee who requests to be retired or who has become incapacitated by illness or injury may be retired by written instrument signed by a majority of the other Trustees; and (d) any Trustee may be removed at any special meeting of shareholders by a two-thirds vote of the outstanding voting securities of the trust. Each Trustee who is not an interested person (as defined in the 1940 Act) (Independent Trustee), shall retire not later than the last day of the calendar year in which his or her 72nd birthday occurs. The Independent Trustees may waive this mandatory retirement age policy with respect to individual Trustees. The executive officers and Advisory Board Members hold office without limit in time, except that any officer and Advisory Board Member may resign or may be removed by a vote of a majority of the Trustees at any regular meeting or any special meeting of the Trustees. Except as indicated, each individual has held the office shown or other offices in the same company for the past five years.
The fund's Statement of Additional Information (SAI) includes more information about the Trustees. To request a free copy, call Fidelity at 1-877-208-0098.
Interested Trustees*:
Correspondence intended for each Trustee who is an interested person may be sent to Fidelity Investments, 82 Devonshire Street, Boston, Massachusetts 02109.
Name, Age; Principal Occupation |
Edward C. Johnson 3d (77) |
| Year of Election or Appointment: 1984 Mr. Johnson is Chairman of the Board of Trustees. Mr. Johnson serves as President (2006-present), Chief Executive Officer, Chairman, and a Director of FMR LLC; Chairman and a Director of FMR; Chairman and a Director of Fidelity Research & Analysis Company (FRAC); Chairman and a Director of Fidelity Investments Money Management, Inc.; and Chairman (2001-present) and a Director of FMR Co., Inc. In addition, Mr. Johnson serves as Chairman and Director of Fidelity International Limited (FIL). |
James C. Curvey (72) |
| Year of Election or Appointment: 2007 Member of the Advisory Board of Fidelity Investment Trust. Mr. Curvey also serves as a Trustee (2007-present) or Member of the Advisory Board (2007-present) of other investment companies advised by FMR. Mr. Curvey is a Director of FMR and FMR Co., Inc. (2007-present). Mr. Curvey is also Vice Chairman (2006-present) and Director of FMR LLC. Mr. Curvey joined Fidelity in 1982 and served in numerous senior management positions, including President and Chief Operating Officer of FMR LLC (1997-2000) and President of Fidelity Strategic Investments (2000-2002). In addition, he serves as a member of the Board of Directors of Geerlings & Wade, Inc. (wine distribution). |
* Trustees have been determined to be "Interested Trustees" by virtue of, among other things, their affiliation with the trust or various entities under common control with FMR. FMR Corp. merged with FMR LLC on October 1, 2007. Any references to FMR LLC for prior periods are deemed to be references to the prior entity.
Independent Trustees:
Correspondence intended for each Independent Trustee (that is, the Trustees other than the Interested Trustees) may be sent to Fidelity Investments, P.O. Box 55235, Boston, Massachusetts 02205-5235.
Name, Age; Principal Occupation |
Dennis J. Dirks (59) |
| Year of Election or Appointment: 2005 Prior to his retirement in May 2003, Mr. Dirks was Chief Operating Officer and a member of the Board of The Depository Trust & Clearing Corporation (DTCC) (1999-2003). He also served as President, Chief Operating Officer, and Board member of The Depository Trust Company (DTC) (1999-2003) and President and Board member of the National Securities Clearing Corporation (NSCC) (1999-2003). In addition, Mr. Dirks served as Chief Executive Officer and Board member of the Government Securities Clearing Corporation (2001-2003) and Chief Executive Officer and Board member of the Mortgage-Backed Securities Clearing Corporation (2001-2003). Mr. Dirks also serves as a Trustee and a member of the Finance Committee of Manhattan College (2005-present) and a Trustee and a member of the Finance Committee of AHRC of Nassau County (2006-present). |
Albert R. Gamper, Jr. (65) |
| Year of Election or Appointment: 2006 Prior to his retirement in December 2004, Mr. Gamper served as Chairman of the Board of CIT Group Inc. (commercial finance). During his tenure with CIT Group Inc. Mr. Gamper served in numerous senior management positions, including Chairman (1987-1989; 1999-2001; 2002-2004), Chief Executive Officer (1987-2004), and President (1989-2002). He currently serves as a member of the Board of Directors of Public Service Enterprise Group (utilities, 2001-present), Chairman of the Board of Governors, Rutgers University (2004-present), and Chairman of the Board of Saint Barnabas Health Care System. |
George H. Heilmeier (71) |
| Year of Election or Appointment: 2004 Dr. Heilmeier is Chairman Emeritus of Telcordia Technologies (communication software and systems), where prior to his retirement, he served as company Chairman and Chief Executive Officer. He currently serves on the Boards of Directors of The Mitre Corporation (systems engineering and information technology support for the government), and HRL Laboratories (private research and development, 2004-present). He is Chairman of the General Motors Science & Technology Advisory Board and a Life Fellow of the Institute of Electrical and Electronics Engineers (IEEE). Dr. Heilmeier is a member of the Defense Science Board and the National Security Agency Advisory Board. He is also a member of the National Academy of Engineering, the American Academy of Arts and Sciences, and the Board of Overseers of the School of Engineering and Applied Science of the University of Pennsylvania. Previously, Dr. Heilmeier served as a Director of TRW Inc. (automotive, space, defense, and information technology, 1992-2002), Compaq (1994-2002), Automatic Data Processing, Inc. (ADP) (technology-based business outsourcing, 1995-2002), INET Technologies Inc. (telecommunications network surveillance, 2001-2004), and Teletech Holdings (customer management services). He is the recipient of the 2005 Kyoto Prize in Advanced Technology for his invention of the liquid crystal display, and a member of the Consumer Electronics Hall of Fame. |
James H. Keyes (67) |
| Year of Election or Appointment: 2007 Prior to his retirement in 2003, Mr. Keyes was Chairman, President, and Chief Executive Officer of Johnson Controls, Inc. (automotive supplier, 1993-2003). He currently serves as a member of the boards of LSI Logic Corporation (semiconductor technologies), Navistar International Corporation (manufacture and sale of trucks, buses, and diesel engines, 2002-present), and Pitney Bowes, Inc. (integrated mail, messaging, and document management solutions). |
Marie L. Knowles (61) |
| Year of Election or Appointment: 2001 Prior to Ms. Knowles' retirement in June 2000, she served as Executive Vice President and Chief Financial Officer of Atlantic Richfield Company (ARCO) (diversified energy, 1996-2000). From 1993 to 1996, she was a Senior Vice President of ARCO and President of ARCO Transportation Company. She served as a Director of ARCO from 1996 to 1998. She currently serves as a Director of Phelps Dodge Corporation (copper mining and manufacturing) and McKesson Corporation (healthcare service, 2002-present). Ms. Knowles is a Trustee of the Brookings Institution and the Catalina Island Conservancy and also serves as a member of the Advisory Board for the School of Engineering of the University of Southern California. |
Ned C. Lautenbach (63) |
| Year of Election or Appointment: 2000 Mr. Lautenbach is Chairman of the Independent Trustees (2006-present). Mr. Lautenbach has been a partner of Clayton, Dubilier & Rice, Inc. (private equity investment firm) since September 1998. Previously, Mr. Lautenbach was with the International Business Machines Corporation (IBM) from 1968 until his retirement in 1998. Mr. Lautenbach serves as a Director of Sony Corporation (2006-present) and Eaton Corporation (diversified industrial) as well as the Philharmonic Center for the Arts in Naples, Florida. He also is a member of the Board of Trustees of Fairfield University (2005-present), as well as a member of the Council on Foreign Relations. |
Cornelia M. Small (63) |
| Year of Election or Appointment: 2005 Ms. Small is a member (2000-present) and Chairperson (2002-present) of the Investment Committee, and a member (2002-present) of the Board of Trustees of Smith College. Previously, she served as Chief Investment Officer (1999-2000), Director of Global Equity Investments (1996-1999), and a member of the Board of Directors of Scudder, Stevens & Clark (1990-1997) and Scudder Kemper Investments (1997-1999). In addition, Ms. Small served as Co-Chair (2000-2003) of the Annual Fund for the Fletcher School of Law and Diplomacy. |
William S. Stavropoulos (68) |
| Year of Election or Appointment: 2001 Mr. Stavropoulos is Chairman Emeritus of the Board of Directors of The Dow Chemical Company. Since joining The Dow Chemical Company in 1967, Mr. Stavropoulos served in numerous senior management positions, including President (1993-2000; 2002-2003), CEO (1995-2000; 2002-2004), and Chairman of the Executive Committee (2000-2004). Currently, he is a Director of NCR Corporation (data warehousing and technology solutions), Chemical Financial Corporation, Maersk Inc. (industrial conglomerate, 2002-present), Tyco International, Inc. (multinational manufacturing and services, 2007-present), and a member of the Advisory Board for Metalmark Capital (private equity investment firm, 2005-present). He is a special advisor to Clayton, Dubilier & Rice, Inc., a private equity investment firm. He also serves as a member of the Board of Trustees of the American Enterprise Institute for Public Policy Research. In addition, Mr. Stavropoulos is a member of The Business Council, J.P. Morgan International Council and the University of Notre Dame Advisory Council for the College of Science. |
Kenneth L. Wolfe (68) |
| Year of Election or Appointment: 2005 Prior to his retirement in 2001, Mr. Wolfe was Chairman and Chief Executive Officer of Hershey Foods Corporation (1993-2001). He currently serves as a member of the boards of Adelphia Communications Corporation (2003-present), Bausch & Lomb, Inc., and Revlon Inc. (2004-present). |
Advisory Board Members and Executive Officers**:
Correspondence intended for Mr. Mauriello, Mr. Thomas, and Mr. Wiley may be sent to Fidelity Investments, P.O. Box 55235, Boston, Massachusetts 02205-5235. Correspondence intended for each executive officer and Mr. Lynch may be sent to Fidelity Investments, 82 Devonshire Street, Boston, Massachusetts 02109.
Name, Age; Principal Occupation |
Peter S. Lynch (63) |
| Year of Election or Appointment: 2003 Member of the Advisory Board of Fidelity Investment Trust. Mr. Lynch is Vice Chairman and a Director of FMR, and Vice Chairman (2001-
present) and a Director of FMR Co., Inc. Previously, Mr. Lynch served as a Trustee of the Fidelity funds (1990-2003). In addition, he serves as a Trustee of Boston College and as the Chairman of the Inner-City Scholarship Fund. |
Joseph Mauriello (63) |
| Year of Election or Appointment: 2007 Member of the Advisory Board of Fidelity Investment Trust. Prior to his retirement in January 2006, Mr. Mauriello served in numerous senior management positions including Deputy Chairman and Chief Operating Officer (2004-2005), and Vice Chairman of Financial Services (2002-2004) of KPMG LLP US (professional services firm, 1965-2005). Mr. Mauriello currently serves as a member of the Board of Directors of XL Capital Ltd., (global insurance and re-insurance company, 2006-present) and of Arcadia Resources Inc., (health care services and products, 2007-present). He also served as a Director of the Hamilton Funds of the Bank of New York (2006-2007). |
David M. Thomas (58) |
| Year of Election or Appointment: 2007 Member of the Advisory Board of Fidelity Investment Trust. Previously, Mr. Thomas served as Executive Chairman (2005-2006) and Chairman and Chief Executive Officer (2000-2005) of IMS Heath, Inc. (pharmaceutical and healthcare information solutions). In addition, Mr. Thomas serves as a member of the Board of Directors of Fortune Brands, Inc. (consumer products holding company), and Interpublic Group of Companies, Inc. (marketing communication, 2004-present). |
Michael E. Wiley (57) |
| Year of Election or Appointment: 2007 Member of the Advisory Board of Fidelity Investment Trust. Mr. Wiley also serves as Sr. Energy Advisor of Katzenbach Partners, LLC (consulting firm, 2006-present) and a member of the Board of Trustees of the University of Tulsa (2000-2006; 2007-present). He serves as a Director of Tesoro Corporation (independent oil refiner and marketer, 2005-present), and a Director of Bill Barrett Corporation (exploration and production company, 2005-present). In addition, he also serves as a Director of Post Oak Bank (privately-held bank, 2004-present), and an Advisory Director of Riverstone Holdings (private investment firm). Previously, Mr. Wiley served as Chairman, President, and CEO of Baker Hughes, Inc. (oilfield services company, 2000-2004), and as Director of Spinnaker Exploration Company (exploration and production company, 2001-2005). |
Kimberley H. Monasterio (43) |
| Year of Election or Appointment: 2007 President and Treasurer of the fund. Ms. Monasterio also serves as President and Treasurer of other Fidelity funds (2007-present) and is an employee of FMR (2004-present). Previously, Ms. Monasterio served as Deputy Treasurer of the Fidelity funds (2004-2006). Before joining Fidelity Investments, Ms. Monasterio served as Treasurer (2000-2004) and Chief Financial Officer (2002-2004) of the Franklin Templeton Funds and Senior Vice President of Franklin Templeton Services, LLC (2000-2004). |
Walter C. Donovan (45) |
| Year of Election or Appointment: 2007 Vice President of the fund. Mr. Donovan also serves as Vice President of Fidelity's Equity Funds (2007-present). Mr. Donovan also serves as Executive Vice President of FMR (2005-present) and FMR Co., Inc. (2005-present). Previously, Mr. Donovan served as Vice President of Fidelity's High Income Funds (2005-2007), Fixed-Income Funds (2005-2006), certain Asset Allocation Funds (2005-2006), certain Balanced Funds (2005-2006), and as Vice President and Director of Fidelity's International Equity Trading group (1998-2005). |
Eric M. Wetlaufer (45) |
| Year of Election or Appointment: 2006 Vice President of the fund. Mr. Wetlaufer also serves as Vice President of certain International Equity Funds (2006-present). Mr. Wetlaufer is Senior Vice President of FMR (2006-present) and FMR Co., Inc. (2006-present), and President and Director of Fidelity Management & Research (U.K.) Inc. (2006-present) and Fidelity Research & Analysis Company (2006-present). Before joining Fidelity Investments in 2005, Mr. Wetlaufer was a partner in Oxhead Capital Management (2004-2005). Previously, Mr. Wetlaufer served as a Chief Investment Officer of Putnam Investments (1997-2003). |
Eric D. Roiter (58) |
| Year of Election or Appointment: 2005 Secretary of the fund. He also serves as Secretary of other Fidelity funds; Vice President, General Counsel, and Secretary of FMR Co., Inc. (2001-present) and FMR; Assistant Secretary of Fidelity Management & Research (U.K.) Inc. (2001-present), Fidelity Research & Analysis Company (2001-present), and Fidelity Investments Money Management, Inc. (2001-present). Mr. Roiter is an Adjunct Member, Faculty of Law, at Boston College Law School (2003-present). Previously, Mr. Roiter served as Vice President and Secretary of Fidelity Distributors Corporation (FDC) (1998-2005). |
Scott C. Goebel (39) |
| Year of Election or Appointment: 2007 Assistant Secretary of the fund. Mr. Goebel also serves as Assistant Secretary of other Fidelity funds (2007-present), and is an employee of FMR. |
R. Stephen Ganis (41) |
| Year of Election or Appointment: 2006 Anti-Money Laundering (AML) officer of the fund. Mr. Ganis also serves as AML officer of other Fidelity funds (2006-present) and FMR LLC (2003-present). Before joining Fidelity Investments, Mr. Ganis practiced law at Goodwin Procter, LLP (2000-2002). |
Joseph B. Hollis (59) |
| Year of Election or Appointment: 2006 Chief Financial Officer of the fund. Mr. Hollis also serves as Chief Financial Officer of other Fidelity funds. Mr. Hollis is President of Fidelity Pricing and Cash Management Services (FPCMS) (2005-present). Mr. Hollis also serves as President and Director of Fidelity Service Company, Inc. (2006-present). Previously, Mr. Hollis served as Senior Vice President of Cash Management Services (1999-2002) and Investment Management Operations (2002-2005). |
Kenneth A. Rathgeber (60) |
| Year of Election or Appointment: 2005 Chief Compliance Officer of the fund. Mr. Rathgeber also serves as Chief Compliance Officer of other Fidelity funds (2004-present) and Executive Vice President of Risk Oversight for Fidelity Investments (2002-present). He is Chief Compliance Officer of FMR (2005-present), FMR Co., Inc. (2005-present), Fidelity Management & Research (U.K.) Inc. (2005-present), Fidelity Research & Analysis Company (2005-present), Fidelity Investments Money Management, Inc. (2005-present), and Strategic Advisers, Inc. (2005-present). Previously, Mr. Rathgeber served as Executive Vice President and Chief Operating Officer for Fidelity Investments Institutional Services Company, Inc. (1998-2002). |
Bryan A. Mehrmann (46) |
| Year of Election or Appointment: 2005 Deputy Treasurer of the fund. Mr. Mehrmann also serves as Deputy Treasurer of other Fidelity funds (2005-present) and is an employee of FMR. Previously, Mr. Mehrmann served as Vice President of Fidelity Investments Institutional Services Group (FIIS)/Fidelity Investments Institutional Operations Corporation, Inc. (FIIOC) Client Services (1998-2004). |
Kenneth B. Robins (38) |
| Year of Election or Appointment: 2005 Deputy Treasurer of the fund. Mr. Robins also serves as Deputy Treasurer of other Fidelity funds (2005-present) and is an employee of FMR (2004-present). Before joining Fidelity Investments, Mr. Robins worked at KPMG LLP, where he was a partner in KPMG's department of professional practice (2002-2004) and a Senior Manager (1999-2000). In addition, Mr. Robins served as Assistant Chief Accountant, United States Securities and Exchange Commission (2000-2002). |
Robert G. Byrnes (40) |
| Year of Election or Appointment: 2005 Assistant Treasurer of the fund. Mr. Byrnes also serves as Assistant Treasurer of other Fidelity funds (2005-present) and is an employee of FMR (2005-present). Previously, Mr. Byrnes served as Vice President of FPCMS (2003-2005). Before joining Fidelity Investments, Mr. Byrnes worked at Deutsche Asset Management where he served as Vice President of the Investment Operations Group (2000-2003). |
Peter L. Lydecker (53) |
| Year of Election or Appointment: 2005 Assistant Treasurer of the fund. Mr. Lydecker also serves as Assistant Treasurer of other Fidelity funds (2004) and is an employee of FMR. |
Paul M. Murphy (60) |
| Year of Election or Appointment: 2007 Assistant Treasurer of the fund. Mr. Murphy also serves as Assistant Treasurer of other Fidelity funds (2007-present) and is an employee of FMR (2007-present). Previously, Mr. Murphy served as Chief Financial Officer of the Fidelity Funds (2005-2006), Vice President and Associate General Counsel of FMR (2007), and Senior Vice President of Fidelity Pricing and Cash Management Services Group (FPCMS) (1994-2007). |
Gary W. Ryan (49) |
| Year of Election or Appointment: 2005 Assistant Treasurer of the fund. Mr. Ryan also serves as Assistant Treasurer of other Fidelity funds (2005-present) and is an employee of FMR (2005-present). Previously, Mr. Ryan served as Vice President of Fund Reporting in FPCMS (1999-2005). |
** FMR Corp. merged with FMR LLC on October 1, 2007. Any references to FMR LLC for prior periods are deemed to be references to the prior entity.
Annual Report
Distributions
The Board of Trustees of Fidelity Advisor International Small Cap Opportunities Fund voted to pay to shareholders of record at the opening of business on record date, the following distributions per share derived from capital gains realized from sales of portfolio securities, and dividends derived from net investment income:
| Pay Date | Record Date | Dividends | Capital Gains |
Institutional Class | 12/10/07 | 12/07/07 | $0.074 | $1.878 |
The fund hereby designates as a capital gain dividend with respect to the taxable year ended October 31, 2007, $142,362,068, or, if subsequently determined to be different, the net capital gain of such year.
The fund will notify shareholders in January 2008 of amounts for use in preparing 2007 income tax returns.
Annual Report
Board Approval of Investment Advisory Contracts and Management Fees
Fidelity International Small Cap Opportunities Fund
Each year, typically in July, the Board of Trustees, including the Independent Trustees (together, the Board), votes on the renewal of the management contract and sub-advisory agreements (together, the Advisory Contracts) for the fund. The Board, assisted by the advice of fund counsel and Independent Trustees' counsel, requests and considers a broad range of information throughout the year.
The Board meets regularly each month except August and takes into account throughout the year matters bearing on Advisory Contracts. The Board, acting directly and through its separate committees, considers at each of its meetings factors that are relevant to the annual renewal of the fund's Advisory Contracts, including the services and support provided to the fund and its shareholders. At the time of the renewal, the Board had 12 standing committees, each composed of Independent Trustees with varying backgrounds, to which the Board has assigned specific subject matter responsibilities in order to enhance effective decision-making by the Board. Each committee has adopted a written charter outlining the structure and purposes of the committee. One such committee, the Equity Contract Committee, meets periodically as needed throughout the year to consider matters specifically related to the annual renewal of Advisory Contracts. The committee requests and receives information on, and makes recommendations to the Independent Trustees concerning, the approval and annual review of the Advisory Contracts.
At its July 2007 meeting, the Board of Trustees, including the Independent Trustees, unanimously determined to renew the Advisory Contracts for the fund. In reaching its determination, the Board considered all factors it believed relevant, including (i) the nature, extent, and quality of the services to be provided to the fund and its shareholders (including the investment performance of the fund); (ii) the competitiveness of the management fee and total expenses of the fund; (iii) the total costs of the services to be provided by and the profits to be realized by the investment adviser and its affiliates from the relationship with the fund; (iv) the extent to which economies of scale would be realized as the fund grows; and (v) whether fee levels reflect these economies of scale, if any, for the benefit of fund shareholders. The Board also approved amendments to the fund's agreements with foreign sub-advisers to clarify that each sub-adviser provides services as an independent contractor.
In determining whether to renew the Advisory Contracts for the fund, the Board ultimately reached a determination, with the assistance of fund counsel and Independent Trustees' counsel, that the renewal of the Advisory Contracts and the compensation to be received by Fidelity under the management contract is consistent with Fidelity's fiduciary duty under applicable law. In addition to evaluating the specific factors noted above, the Board, in reaching its determination, is aware that shareholders in the fund have a broad range of investment choices available to them, including a wide choice among mutual funds offered by competitors to Fidelity, and that the fund's shareholders, with the opportunity to review and weigh the disclosure provided by the fund in its prospectus and other public disclosures, have chosen to invest in this fund, managed by Fidelity.
Annual Report
Board Approval of Investment Advisory Contracts and
Management Fees - continued
Nature, Extent, and Quality of Services Provided. The Board considered staffing within the investment adviser, FMR, and the sub-advisers (together, the Investment Advisers), including the background of the fund's portfolio manager and the fund's investment objective and discipline. The Independent Trustees also had discussions with senior management of Fidelity's investment operations and investment groups. The Board considered the structure of the portfolio manager compensation program and whether this structure provides appropriate incentives.
Resources Dedicated to Investment Management and Support Services. The Board reviewed the size, education, and experience of the Investment Advisers' investment staff, their use of technology, and the Investment Advisers' approach to recruiting, training, and retaining portfolio managers and other research, advisory, and management personnel. The Board considered Fidelity's extensive global research capabilities that enable the Investment Advisers to aggregate data from various sources in an effort to produce positive investment results. The Board noted that Fidelity's analysts have access to a variety of technological tools that enable them to perform both fundamental and quantitative analysis and to specialize in various disciplines. The Board also considered that Fidelity's portfolio managers and analysts have access to daily portfolio attribution that allows for monitoring of a fund's portfolio, as well as an electronic communication system that provides immediate real-time access to research concerning issuers and credit enhancers.
Shareholder and Administrative Services. The Board considered (i) the nature, extent, quality, and cost of advisory, administrative, distribution, and shareholder services performed by the Investment Advisers and their affiliates under the Advisory Contracts and under separate agreements covering transfer agency, pricing and bookkeeping, and securities lending services for the fund; (ii) the nature and extent of the Investment Advisers' supervision of third party service providers, principally custodians and subcustodians; and (iii) the resources devoted to, and the record of compliance with, the fund's compliance policies and procedures. The Board reviewed the allocation of fund brokerage, including allocations to brokers affiliated with the Investment Advisers, the use of brokerage commissions to pay fund expenses, and the use of "soft" commission dollars to pay for research services. The Board also considered that Fidelity voluntarily pays for market data out of its own resources.
The Board noted that the growth of fund assets across the complex allows Fidelity to reinvest in the development of services designed to enhance the value or convenience of the Fidelity funds as investment vehicles. These services include 24-hour access to account information and market information through phone representatives and over the Internet, and investor education materials and asset allocation tools.
Annual Report
Investment in a Large Fund Family. The Board considered the benefits to shareholders of investing in a Fidelity fund, including the benefits of investing in a fund that is part of a large family of funds offering a variety of investment disciplines and providing for a large variety of mutual fund investor services. For example, fund shareholders are offered the privilege of exchanging shares of the fund for shares of other Fidelity funds, as set forth in the fund's prospectus, without paying a sales charge. The Board noted that, since the last Advisory Contract renewals in July 2006, Fidelity has taken a number of actions that benefited particular funds, including (i) dedicating additional resources to investment research and to restructure the investment research teams; (ii) contractually agreeing to reduce the management fee on Fidelity Advisor Floating Rate High Income Fund; (iii) contractually agreeing to reduce the management fees on Fidelity's California, Massachusetts, New Jersey, and New York AMT Tax-Free Money Market Funds, launching new Institutional Classes and Service Classes of these funds, and contractually agreeing to impose expense limitations on these funds; (iv) eliminating the exchange fee on the Fidelity Select Portfolios and reducing the pricing and bookkeeping fee rates for these funds; (v) reducing the maximum transfer agency fee rates on high income funds and certain equity funds; (vi) proposing amended management contracts that, if approved by shareholders, will add a performance adjustment component to the management fees paid by 18 Fidelity Advisor equity funds; (vii) contractually agreeing to reduce fees for Ultra-Short Central Fund and the money market Central Funds; (viii) waiving the Fidelity Advisor funds' contingent deferred sales charge on certain redemptions made through systematic withdrawal programs; and (ix) amending the management contracts for equity and fixed-income funds whose management contracts incorporate a "group fee" structure by adding four new fee "breakpoints" to the group fee rate schedules.
Investment Performance and Compliance. The Board considered whether the fund has operated within its investment objective, as well as its record of compliance with its investment restrictions. It also reviewed the fund's absolute investment performance for each class, as well as the fund's relative investment performance for each class measured against (i) a broad-based securities market index, and (ii) a peer group of mutual funds deemed appropriate by the Board. Because the fund had been in existence less than three calendar years, the following chart considered by the Board shows, for the one-year period ended December 31, 2006, the total returns of Fidelity International Small Cap Opportunities (retail class) and Class C of the fund, the total return of a broad-based securities market index ("benchmark"), and a range of total returns of a peer group of mutual funds identified by Lipper Inc. as having an investment objective similar to that of the fund. The returns of Fidelity International Small Cap Opportunities (retail class) and Class C show the performance of the highest and lowest performing classes, respectively. The box within the chart shows the 25th percentile return (bottom of box) and the 75th percentile return (top of box) of the peer group. Returns shown above the box are in the first quartile and returns shown below the box are in the fourth quartile. The percentage beaten numbers noted below the chart correspond to the percentile box and represent the percentage of funds in the peer group whose performance was equal to or lower than that of the class indicated.
Annual Report
Board Approval of Investment Advisory Contracts and
Management Fees - continued
Fidelity International Small Cap Opportunities Fund

The Board reviewed the fund's relative investment performance against its peer group and stated that the performance of Fidelity International Small Cap Opportunities (retail class) was in the third quartile for the period shown. The Board also stated that the investment performance of Fidelity International Small Cap Opportunities (retail class) compared favorably to its benchmark for the period shown. The Board considered that the variations in performance among the fund's classes reflect the variations in class expenses, which result in lower performance for higher expense classes. The Board stated that it is difficult to evaluate in any comprehensive fashion the performance of the fund, in light of its relatively recent commencement of operations.
The Board also considered that the fund's management fee is subject to upward or downward adjustment depending upon whether, and to what extent, the fund's investment performance for the performance period exceeds, or is exceeded by, the record (over the same period) of a Board-approved performance adjustment index. The Board realizes that the performance adjustment provides FMR with a strong economic incentive to seek to achieve superior performance for the fund's shareholders and helps to more closely align the interests of FMR and the fund's shareholders.
Annual Report
The Board considered that FMR has taken steps to refocus and strengthen equity research, equity portfolio management, and compliance.
Based on its review, and giving particular weight to the nature and quality of the resources dedicated by the Investment Advisers to maintain and improve relative performance, the Board concluded that the nature, extent, and quality of the services provided to the fund will benefit the fund's shareholders, particularly in light of the Board's view that the fund's shareholders benefit from investing in a fund that is part of a large family of funds offering a variety of investment disciplines and services.
Competitiveness of Management Fee and Total Fund Expenses. The Board considered the fund's management fee and total expenses compared to "mapped groups" of competitive funds and classes. Fidelity creates "mapped groups" by combining similar Lipper investment objective categories that have comparable management fee characteristics. Combining Lipper investment objective categories aids the Board's management fee and total expense comparisons by broadening the competitive group used for comparison and by reducing the number of universes to which various Fidelity funds are compared. The Board also considered supplemental information about how the fund's management fee and total expenses ranked relative to groups based on Lipper classifications, which take into account a fund's market capitalization and style.
The Board considered two proprietary management fee comparisons for the 12-month (or shorter) periods shown in the chart below. The group of Lipper funds used by the Board for management fee comparisons is referred to below as the "Total Mapped Group" and, for the reasons explained above, is broader than the Lipper peer group used by the Board for performance comparisons. The Total Mapped Group comparison focuses on a fund's standing relative to the total universe of comparable funds available to investors, in terms of gross management fees before expense reimbursements or caps, and without giving effect to the fund's performance adjustment. "TMG %" represents the percentage of funds in the Total Mapped Group that had management fees that were lower than the fund's. For example, a TMG % of 23% means that 77% of the funds in the Total Mapped Group had higher management fees than the fund. The "Asset-Size Peer Group" (ASPG) comparison focuses on a fund's standing relative to non-Fidelity funds similar in size to the fund within the Total Mapped Group. The ASPG represents at least 15% of the funds in the Total Mapped Group with comparable asset size and management fee characteristics, subject to a minimum of 50 funds (or all funds in the Total Mapped Group if fewer than 50). Additional information, such as the ASPG quartile in which the fund's management fee ranked and the impact of the fund's performance adjustment, is also included in the chart and considered by the Board.
Annual Report
Board Approval of Investment Advisory Contracts and
Management Fees - continued
Fidelity International Small Cap Opportunities Fund
The Board noted that the fund's management fee ranked below the median of its Total Mapped Group and below the median of its ASPG for 2006. The Board also noted the effect of the fund's positive performance adjustment on the fund's management fee ranking. The Board noted that the performance adjustment for 2006 represents calculations for performance periods that differ from the period shown in the performance chart above.
Based on its review, the Board concluded that the fund's management fee was fair and reasonable in light of the services that the fund receives and the other factors considered.
In its review of each class's total expenses, the Board considered the fund's management fee as well as other fund or class expenses, as applicable, such as transfer agent fees, pricing and bookkeeping fees, fund-paid 12b-1 fees, and custodial, legal, and audit fees. The Board also noted the effects of any waivers and reimbursements on fees and expenses, as well as the fund's positive performance adjustment. As part of its review, the Board also considered current and historical total expenses of each class of the fund compared to competitive fund median expenses. Each class of the fund is compared to those funds and classes in the Total Mapped Group (used by the Board for management fee comparisons) that have a similar sales load structure.
The Board noted that the total expenses of each of Class A, Class B, Class C, Institutional Class and Fidelity International Small Cap Opportunities (retail class) ranked below its competitive median for 2006, and the total expenses of Class T ranked above its competitive median for 2006. The Board noted that the fund offers multiple classes, each of which has a different sales load and 12b-1 fee structure, and that the multiple structures are intended to offer a range of pricing options for the intermediary market. The Board also noted that the total expenses of the classes vary primarily by the level of their 12b-1 fees, although differences in transfer agent fees may also cause expenses to vary from class to class.
Annual Report
In its review of total expenses, the Board also considered Fidelity fee structures and other information on clients that FMR and its affiliates service in other competitive markets, such as other mutual funds advised or subadvised by FMR or its affiliates, pension plan clients, and other institutional clients.
Based on its review, the Board concluded that the total expenses of each class of the fund were reasonable, although in one case above the median of the universe presented for comparison, in light of the services that the fund and its shareholders receive and the other factors considered.
Costs of the Services and Profitability. The Board considered the revenues earned and the expenses incurred by Fidelity in conducting the business of developing, marketing, distributing, managing, administering and servicing the fund and its shareholders. The Board also considered the level of Fidelity's profits in respect of all the Fidelity funds.
On an annual basis, FMR presents to the Board Fidelity's profitability for the fund. Fidelity calculates the profitability for each fund, as well as aggregate profitability for groups of Fidelity funds and all Fidelity funds, using a series of detailed revenue and cost allocation methodologies which originate with the audited books and records of Fidelity. The Audit Committee of the Board reviews any significant changes from the prior year's methodologies.
PricewaterhouseCoopers LLP (PwC), independent registered public accounting firm and auditor to Fidelity and certain Fidelity funds, has been engaged annually by the Board as part of the Board's assessment of the results of Fidelity's profitability analysis. PwC's engagement includes the review and assessment of Fidelity's methodologies used in determining the revenues and expenses attributable to Fidelity's mutual fund business, and completion of agreed-upon procedures surrounding the mathematical accuracy of fund profitability and its conformity to allocation methodologies. After considering PwC's reports issued under the engagement and information provided by Fidelity, the Board believes that while other allocation methods may also be reasonable, Fidelity's profitability methodologies are reasonable in all material respects.
The Board has also reviewed Fidelity's non-fund businesses and any fall-out benefits related to the mutual fund business as well as cases where Fidelity's affiliates may benefit from or be related to the fund's business.
The Board considered the costs of the services provided by and the profits realized by Fidelity in connection with the operation of the fund and determined that the amount of profit is a fair entrepreneurial profit for the management of the fund.
Annual Report
Board Approval of Investment Advisory Contracts and
Management Fees - continued
Economies of Scale. The Board considered whether there have been economies of scale in respect of the management of the Fidelity funds, whether the Fidelity funds (including the fund) have appropriately benefited from any such economies of scale, and whether there is potential for realization of any further economies of scale. The Board considered the extent to which the fund will benefit from economies of scale through increased services to the fund, through waivers or reimbursements, or through fee or expense reductions, including reductions that occur through operation of the transfer agent agreement. The transfer agent fee varies in part based on the number of accounts in the fund. If the number of accounts decreases or the average account size increases, the overall transfer agent fee rate decreases.
The Board recognized that the fund's management contract incorporates a "group fee" structure, which provides for lower group fee rates as total fund assets under FMR's management increase, and for higher group fee rates as total fund assets under FMR's management decrease. FMR determines the group fee rates based on a tiered asset "breakpoint" schedule. In connection with the renewal of the fund's management contract, the Board approved amendments to the fund's management contract that added four new fee breakpoints to the group fee rate schedule for assets under FMR's management above $1,386 billion. The Board considered that the group fee rate declines under both the present and amended schedules, but that under the amended schedule, the group fee rate declines faster as assets under FMR's management exceed $1,386 billion. The Board considered that the group fee is designed to deliver the benefits of economies of scale to fund shareholders when total fund assets increase, even if assets of any particular fund are unchanged or have declined, because some portion of Fidelity's costs are attributable to services provided to all Fidelity funds, and all funds benefit if those costs can be allocated among more assets. The Board concluded that, given the group fee structure, fund shareholders will achieve a certain level of economies of scale as assets under FMR's management increase at the fund complex level, regardless of whether Fidelity achieves any such economies of scale.
The Board further concluded that any potential economies of scale are being shared between fund shareholders and Fidelity in an appropriate manner.
Additional Information Requested by the Board. In order to develop fully the factual basis for consideration of the Fidelity funds' Advisory Contracts, the Board requested and received additional information on several topics, including (i) fund performance trends and actions to be taken by FMR to improve certain funds' overall performance; (ii) Fidelity's portfolio manager compensation structure, including its effects on fund profitability and the extent to which portfolio manager compensation is linked to fund performance; (iii) Fidelity's fee structures; (iv) the funds' sub-advisory arrangements; and (v) accounts managed by Fidelity other than the Fidelity funds.
Annual Report
Based on its evaluation of all of the conclusions noted above, and after considering all material factors, the Board ultimately concluded that the advisory fee structures are fair and reasonable, and that the fund's Advisory Contracts should be renewed.
Annual Report
Annual Report
Annual Report
Annual Report
Annual Report
Annual Report
Annual Report
Investment Adviser
Fidelity Management & Research Company
Boston, MA
Investment Sub-Advisers
FMR Co., Inc.
Fidelity Management & Research
(U.K.) Inc.
Fidelity Research & Analysis Company
Fidelity International Investment Advisors
Fidelity Investments Japan Limited
Fidelity International Investment Advisors (U.K.) Limited
General Distributor
Fidelity Distributors Corporation
Boston, MA
Transfer and Service Agents
Fidelity Investments Institutional
Operations Company, Inc.
Boston, MA
Fidelity Service Company, Inc.
Boston, MA
Custodian
The Northern Trust Company
Chicago, IL
AILSI-UANN-1207
1.815081.102
(Fidelity Investment logo)(registered trademark)
Corporate Headquarters
82 Devonshire St., Boston, MA 02109
www.fidelity.com
Fidelity®
International Value
Fund
Annual Report
October 31, 2007
(2_fidelity_logos) (Registered_Trademark)
Contents
Chairman's Message | <Click Here> | Ned Johnson's message to shareholders. |
Performance | <Click Here> | How the fund has done over time. |
Management's Discussion | <Click Here> | The manager's review of fund performance, strategy and outlook. |
Shareholder Expense Example | <Click Here> | An example of shareholder expenses. |
Investment Changes | <Click Here> | A summary of major shifts in the fund's investments over the past six months. |
Investments | <Click Here> | A complete list of the fund's investments with their market values. |
Financial Statements | <Click Here> | Statements of assets and liabilities, operations, and changes in net assets,
as well as financial highlights. |
Notes | <Click Here> | Notes to the financial statements. |
Report of Independent Registered Public Accounting Firm | <Click Here> | |
Trustees and Officers | <Click Here> | |
Distributions | <Click Here> | |
Board Approval of Investment Advisory Contracts and Management Fees | <Click Here> | |
To view a fund's proxy voting guidelines and proxy voting record for the 12-month period ended June 30, visit http://www.fidelity.com (search for "proxy voting guidelines") or visit the Securities and Exchange Commission's (SEC) web site at http://www.sec.gov. You may also call 1-800-544-8544 to request a free copy of the proxy voting guidelines.
Standard & Poor's, S&P and S&P 500 are registered service marks of The McGraw-Hill Companies, Inc. and have been licensed for use by Fidelity Distributors Corporation.
Other third party marks appearing herein are the property of their respective owners.
All other marks appearing herein are registered or unregistered trademarks or service marks of FMR LLC or an affiliated company.
Annual Report
This report and the financial statements contained herein are submitted for the general information of the shareholders of the fund. This report is not authorized for distribution to prospective investors in the fund unless preceded or accompanied by an effective prospectus.
A fund files its complete schedule of portfolio holdings with the SEC for the first and third quarters of each fiscal year on Form N-Q. Forms N-Q are available on the SEC's web site at http://www.sec.gov. A fund's Forms N-Q may be reviewed and copied at the SEC's Public Reference Room in Washington, DC. Information regarding the operation of the SEC's Public Reference Room may be obtained by calling 1-800-SEC-0330. For a complete list of a fund's portfolio holdings, view the most recent holdings listing, semiannual report, or annual report on Fidelity's web site at http://www.fidelity.com or http://www.advisor.fidelity.com, as applicable.
NOT FDIC INSURED · MAY LOSE VALUE · NO BANK GUARANTEE
Neither the fund nor Fidelity Distributors Corporation is a bank.
Annual Report
Chairman's Message
(photo_of_Edward_C_Johnson_3d)
Dear Shareholder:
Many stock and bond markets around the world have been unsettled of late; however, volatility can often lead to opportunity for patient investors. Financial markets are always unpredictable, but there are a number of time-tested principles that can put the historical odds in your favor.
One of the basic tenets is to invest for the long term. Over time, riding out the markets' inevitable ups and downs has proven much more effective than selling into panic or chasing the hottest trend. Even missing only a few of the markets' best days can significantly diminish investor returns. Patience also affords the benefits of compounding - of earning interest on additional income or reinvested dividends and capital gains. There are tax advantages and cost benefits to consider as well. The more you sell, the more taxes you pay, and the more you trade, the higher the costs. While staying the course doesn't eliminate risk, it can considerably lessen the effect of short-term declines.
You can further manage your investing risk through diversification. And today, more than ever, geographic diversification should be taken into account. Studies indicate that asset allocation is the single most important determinant of a portfolio's long-term success. The right mix of stocks, bonds and cash - aligned to your particular risk tolerance and investment objective - is very important. Age-appropriate rebalancing is also an essential aspect of asset allocation. For younger investors, an emphasis on equities - which historically have been the best-performing asset class over time - is encouraged. As investors near their specific goal, such as retirement or sending a child to college, consideration may be given to replacing volatile assets (e.g. common stocks) with more-stable fixed investments (bonds or savings plans).
A third investment principle - investing regularly - can help lower the average cost of your purchases. Investing a certain amount of money each month or quarter helps ensure you won't pay for all your shares at market highs. This strategy - known as dollar cost averaging - also reduces unconstructive "emotion" from investing, helping shareholders avoid selling weak performers just prior to an upswing, or chasing a hot performer just before a correction.
We invite you to contact us via the Internet, through our Investor Centers or over the phone. It is our privilege to provide you the information you need to make the investments that are right for you.
Sincerely,
/s/Edward C. Johnson 3d
Edward C. Johnson 3d
Annual Report
Performance: The Bottom Line
Average annual total return reflects the change in the value of an investment, assuming reinvestment of the fund's dividend income and capital gains (the profits earned upon the sale of securities that have grown in value) and assuming a constant rate of performance each year. The $10,000 table and the fund's returns do not reflect the deduction of taxes that a shareholder would pay on fund distributions or the redemption of fund shares. During periods of reimbursement by Fidelity, a fund's total return will be greater than it would be had the reimbursement not occurred. How a fund did yesterday is no guarantee of how it will do tomorrow.
Average Annual Total Returns
Periods ended October 31, 2007 | | Past 1
year | Life of
FundA |
International Value | | 23.81% | 20.62% |
A From May 18, 2006
$10,000 Over Life of Fund
Let's say hypothetically that $10,000 was invested in International Value Fund on May 18, 2006, when the fund started. The chart shows how the value of your investment would have changed, and also shows how the Morgan Stanley Capital InternationalSM Europe, Australasia, Far East (MSCI® EAFE®) Value Index performed over the same period.
Annual Report
Management's Discussion of Fund Performance
Comments from George Stairs, Portfolio Manager of Fidelity® International Value Fund
Foreign stocks, with a large assist from a weak U.S. dollar, generally had higher returns for U.S. investors than domestic equities during the 12-month period ending October 31, 2007. The backdrop for global stocks was solid, with robust economic growth and relatively high corporate profitability worldwide. Developed international equity markets, as measured by the Morgan Stanley Capital InternationalSM Europe, Australasia, and Far East (MSCI® EAFE®) Index - a performance monitor of established markets outside the United States and Canada - rose 25.09%. In comparison, the Standard & Poor's 500SM Index, a gauge of U.S. stocks, was up 14.56%. Among countries making up at least 1% of the EAFE benchmark, Finland had the best showing, soaring nearly 69%, while Hong Kong gained roughly 66%. The United Kingdom and Japan, the two largest components of the index, both underperformed. Fallout from the credit crunch and concerns about export growth tempered UK stocks, while Japan struggled with a slowdown in consumer spending and sluggish domestic growth. Emerging markets were the period's big winners, advancing 68.33% as measured by the MSCI Emerging Markets index.
International Value performed well, returning 23.81% for the year and solidly outpacing the 21.53% gain of the benchmark MSCI EAFE Value index on the basis of productive stock picking across a variety of sectors. The best results came from within the energy, industrials, materials and utilities sectors, with good picks in consumer staples and consumer discretionary also helping. Geographically, our best results came from the Americas, mainly Brazil, Cayman Islands and Canada, with good picks in the European region as well, particularly in the United Kingdom and France. Among the top-performing stocks were Japanese trading firm Mitsui & Co.; UK-listed miner BHP Billiton; Brazilian energy producer Petrobras; and German electric utility E.ON. The fund's relative return was tempered by a few unfavorable picks in the financials sector, especially among banks, as well as by some weak holdings in the pharmaceuticals, biotechnology and life science segment of health care. Notable detractors included Japanese leasing and consumer lending firm ORIX; Japanese megabank Mizuho Financial; and an underweighted position in Dutch banking company ABN AMRO, which rose on takeover speculation. ABN AMRO was no longer in the portfolio at period end.
The views expressed above reflect those of the portfolio manager(s) only through the end of the period as stated on the cover of this report and do not necessarily represent the views of Fidelity or any other person in the Fidelity organization. Any such views are subject to change at any time based upon market or other conditions and Fidelity disclaims any responsibility to update such views. These views may not be relied on as investment advice and, because investment decisions for a Fidelity fund are based on numerous factors, may not be relied on as an indication of trading intent on behalf of any Fidelity fund.
Annual Report
Shareholder Expense Example
As a shareholder of the Fund, you incur two types of costs: (1) transaction costs, including sales charges (loads) on purchase payments or redemption proceeds, redemption fees, and (2) ongoing costs, including management fees, distribution and/or service (12b-1) fees and other Fund expenses. This Example is intended to help you understand your ongoing costs (in dollars) of investing in the Fund and to compare these costs with the ongoing costs of investing in other mutual funds.
The Example is based on an investment of $1,000 invested at the beginning of the period and held for the entire period (May 1, 2007 to October 31, 2007).
Actual Expenses
The first line of the accompanying table for each class of the Fund provides information about actual account values and actual expenses. You may use the information in this line, together with the amount you invested, to estimate the expenses that you paid over the period. Simply divide your account value by $1,000.00 (for example, an $8,600 account value divided by $1,000.00 = 8.6), then multiply the result by the number in the first line for a class of the Fund under the heading entitled "Expenses Paid During Period" to estimate the expenses you paid on your account during this period. A small balance maintenance fee of $12.00 that is charged once a year may apply for certain accounts with a value of less than $2,000. This fee is not included in the table below. If it was, the estimate of expenses you paid during the period would be higher, and your ending account value lower, by this amount. In addition, the Fund, as a shareholder in the underlying Fidelity Central Funds, will indirectly bear its pro rata share of the fees and expenses incurred by the underlying Fidelity Central Funds. These fees and expenses are not included in the Fund's annualized expense ratio used to calculate the expense estimate in the table below.
Hypothetical Example for Comparison Purposes
The second line of the accompanying table for each class of the Fund provides information about hypothetical account values and hypothetical expenses based on a Class' actual expense ratio and an assumed rate of return of 5% per year before expenses, which is not the Class' actual return. The hypothetical account values and expenses may not be used to estimate the actual ending account balance or expenses you paid for the period. You may use this information to compare the ongoing costs of investing in the Fund and other funds. To do so, compare this 5% hypothetical example with the 5% hypothetical examples that appear in the shareholder reports of the other funds. A small balance maintenance fee of $12.00 that is charged once a year may apply for certain accounts with a value of less than $2,000. This fee is not included in the table below. If it was, the estimate of expenses you paid during the period would be higher, and your ending account value lower, by this amount. In addition, the Fund, as a shareholder in the underlying Fidelity Central Funds, will indirectly bear its pro rata share of the fees and expenses incurred by the underlying Fidelity Central Funds. These fees and expenses are not included in the Fund's annualized expense ratio used to calculate the expense estimate in the table below.
Annual Report
Shareholder Expense Example - continued
Please note that the expenses shown in the table are meant to highlight your ongoing costs only and do not reflect any transaction costs. Therefore, the second line of the table is useful in comparing ongoing costs only, and will not help you determine the relative total costs of owning different funds. In addition, if these transactional costs were included, your costs would have been higher.
| Beginning
Account Value
May 1, 2007 | Ending
Account Value
October 31, 2007 | Expenses Paid
During Period*
May 1, 2007 to
October 31, 2007 |
Class A | | | |
Actual | $ 1,000.00 | $ 1,082.30 | $ 7.14 |
HypotheticalA | $ 1,000.00 | $ 1,018.35 | $ 6.92 |
Class T | | | |
Actual | $ 1,000.00 | $ 1,080.70 | $ 8.23 |
HypotheticalA | $ 1,000.00 | $ 1,017.29 | $ 7.98 |
Class B | | | |
Actual | $ 1,000.00 | $ 1,078.40 | $ 10.90 |
HypotheticalA | $ 1,000.00 | $ 1,014.72 | $ 10.56 |
Class C | | | |
Actual | $ 1,000.00 | $ 1,077.60 | $ 10.68 |
HypotheticalA | $ 1,000.00 | $ 1,014.92 | $ 10.36 |
International Value | | | |
Actual | $ 1,000.00 | $ 1,083.80 | $ 5.20 |
HypotheticalA | $ 1,000.00 | $ 1,020.21 | $ 5.04 |
Institutional Class | | | |
Actual | $ 1,000.00 | $ 1,083.70 | $ 4.83 |
HypotheticalA | $ 1,000.00 | $ 1,020.57 | $ 4.69 |
A 5% return per year before expenses
* Expenses are equal to each Class' annualized expense ratio (shown in the table below); multiplied by the average account value over the period, multiplied by 184/365 (to reflect the one-half year period).
| Annualized
Expense Ratio |
Class A | 1.36% |
Class T | 1.57% |
Class B | 2.08% |
Class C | 2.04% |
International Value | .99% |
Institutional Class | .92% |
Annual Report
Investment Changes
Geographic Diversification (% of fund's net assets) |
As of October 31, 2007 |
 | Japan 18.8% | |
 | United Kingdom 16.3% | |
 | France 11.8% | |
 | Germany 11.1% | |
 | Switzerland 8.8% | |
 | Spain 4.8% | |
 | Cayman Islands 3.8% | |
 | Norway 3.3% | |
 | Australia 2.4% | |
 | Other 18.9% | |

Percentages are adjusted for the effect of futures contracts, if applicable. |
|
As of April 30, 2007 |
| Japan 18.4% | |
| United Kingdom 16.5% | |
| France 11.3% | |
| Germany 10.9% | |
| Switzerland 9.6% | |
| Spain 4.5% | |
| United States of America 3.2% | |
| Netherlands 3.1% | |
| Australia 2.8% | |
| Other 19.7% | |

Percentages are adjusted for the effect of futures contracts, if applicable. |
Asset Allocation |
| % of fund's
net assets | % of fund's net assets
6 months ago |
Stocks | 98.9 | 97.0 |
Short-Term Investments and Net Other Assets | 1.1 | 3.0 |
Top Ten Stocks as of October 31, 2007 |
| % of fund's
net assets | % of fund's net assets
6 months ago |
E.ON AG (Germany, Electric Utilities) | 3.4 | 2.7 |
GlobalSantaFe Corp. (Cayman Islands, Energy Equipment & Services) | 2.5 | 1.9 |
Mitsui & Co. Ltd. (Japan, Trading Companies & Distributors) | 2.4 | 2.1 |
UBS AG (NY Shares) (Switzerland, Capital Markets) | 2.3 | 1.9 |
Toyota Motor Corp. (Japan, Automobiles) | 2.2 | 2.1 |
DaimlerChrysler AG (Germany, Automobiles) | 2.2 | 0.3 |
ING Groep NV sponsored ADR (Netherlands, Diversified Financial Services) | 2.2 | 2.4 |
AXA SA sponsored ADR (France, Insurance) | 2.2 | 2.0 |
Societe Generale Series A (France, Commercial Banks) | 2.1 | 2.7 |
Banco Santander Central Hispano SA (Spain, Commercial Banks) | 2.1 | 1.5 |
| 23.6 | |
Market Sectors as of October 31, 2007 |
| % of fund's
net assets | % of fund's net assets
6 months ago |
Financials | 37.2 | 40.0 |
Energy | 11.2 | 6.3 |
Industrials | 9.9 | 10.1 |
Consumer Discretionary | 9.7 | 8.6 |
Utilities | 7.7 | 6.3 |
Materials | 7.4 | 7.3 |
Consumer Staples | 5.1 | 6.6 |
Information Technology | 4.9 | 5.7 |
Health Care | 3.3 | 3.6 |
Telecommunication Services | 2.5 | 2.5 |
Annual Report
Investments October 31, 2007
Showing Percentage of Net Assets
Common Stocks - 98.7% |
| Shares | | Value |
Australia - 2.4% |
AMP Ltd. | 362,775 | | $ 3,473,529 |
Macquarie Airports unit | 460,311 | | 1,891,729 |
Macquarie Bank Ltd. | 19,000 | | 1,517,452 |
Macquarie Infrastructure Group unit | 597,721 | | 1,774,282 |
National Australia Bank Ltd. | 28,843 | | 1,166,925 |
TOTAL AUSTRALIA | | 9,823,917 |
Brazil - 2.0% |
Petroleo Brasileiro SA - Petrobras sponsored ADR | 59,700 | | 5,709,111 |
TAM SA (PN) sponsored ADR (ltd. vtg.) (d) | 47,200 | | 1,392,400 |
Uniao de Bancos Brasileiros SA (Unibanco) GDR | 5,400 | | 853,416 |
TOTAL BRAZIL | | 7,954,927 |
Canada - 1.1% |
Finning International, Inc. | 38,300 | | 1,318,312 |
First Quantum Minerals Ltd. | 18,100 | | 1,949,363 |
RONA, Inc. (a) | 56,500 | | 1,277,563 |
TOTAL CANADA | | 4,545,238 |
Cayman Islands - 3.8% |
Chaoda Modern Agriculture (Holdings) Ltd. | 1,184,000 | | 1,080,556 |
GlobalSantaFe Corp. | 123,900 | | 10,039,617 |
Subsea 7, Inc. (a) | 140,500 | | 4,123,498 |
TOTAL CAYMAN ISLANDS | | 15,243,671 |
France - 11.8% |
Accor SA | 18,100 | | 1,727,327 |
Alcatel-Lucent SA | 140,700 | | 1,363,383 |
AXA SA sponsored ADR | 193,800 | | 8,668,674 |
BNP Paribas SA | 27,700 | | 3,053,626 |
Compagnie de St. Gobain | 11,300 | | 1,211,323 |
Gaz de France | 44,700 | | 2,538,645 |
Renault SA | 8,400 | | 1,410,494 |
Societe Generale Series A | 51,435 | | 8,666,798 |
Suez SA (France) | 46,700 | | 3,035,500 |
Total SA: | | | |
Series B | 33,300 | | 2,684,313 |
sponsored ADR | 102,500 | | 8,262,525 |
Unibail-Rodamco | 11,872 | | 2,951,890 |
Vallourec SA | 7,000 | | 2,028,929 |
TOTAL FRANCE | | 47,603,427 |
Common Stocks - continued |
| Shares | | Value |
Germany - 10.9% |
Allianz AG sponsored ADR | 323,500 | | $ 7,311,100 |
BASF AG sponsored ADR | 25,300 | | 3,519,230 |
DaimlerChrysler AG | 80,200 | | 8,834,030 |
E.ON AG (d) | 70,700 | | 13,807,706 |
GFK AG (d) | 32,200 | | 1,299,707 |
Heidelberger Druckmaschinen AG | 22,700 | | 927,106 |
Lanxess AG | 48,100 | | 2,402,121 |
Muenchener Rueckversicherungs-Gesellschaft AG (Reg.) | 30,900 | | 5,928,168 |
TOTAL GERMANY | | 44,029,168 |
Greece - 0.8% |
Alpha Bank AE | 31,900 | | 1,180,375 |
Cosmote Mobile Telecommunications SA | 20,000 | | 690,208 |
Greek Organization of Football Prognostics SA | 36,200 | | 1,478,993 |
TOTAL GREECE | | 3,349,576 |
Hong Kong - 1.2% |
Swire Pacific Ltd. (A Shares) | 352,800 | | 5,038,579 |
India - 0.7% |
Satyam Computer Services Ltd. sponsored ADR | 94,100 | | 2,855,935 |
Ireland - 1.0% |
Bank of Ireland | 113,471 | | 2,104,887 |
CRH PLC sponsored ADR (d) | 53,900 | | 2,134,979 |
TOTAL IRELAND | | 4,239,866 |
Italy - 1.4% |
Fiat SpA | 51,700 | | 1,668,089 |
Unicredito Italiano SpA | 490,600 | | 4,193,610 |
TOTAL ITALY | | 5,861,699 |
Japan - 18.8% |
Aeon Co. Ltd. | 196,100 | | 3,087,557 |
Asahi Breweries Ltd. | 63,100 | | 1,043,779 |
Canon, Inc. | 86,650 | | 4,381,891 |
Cosmo Bio Co. Ltd. | 13 | | 9,201 |
Denso Corp. | 61,800 | | 2,511,175 |
East Japan Railway Co. | 470 | | 3,872,403 |
Ibiden Co. Ltd. | 7,500 | | 635,876 |
Japan Tobacco, Inc. | 199 | | 1,160,152 |
JGC Corp. | 25,000 | | 500,754 |
JSR Corp. | 53,700 | | 1,394,667 |
Konica Minolta Holdings, Inc. | 156,500 | | 2,740,217 |
Common Stocks - continued |
| Shares | | Value |
Japan - continued |
Kubota Corp. | 294,000 | | $ 2,468,774 |
Leopalace21 Corp. | 50,200 | | 1,602,877 |
Misawa Homes Co. Ltd. (a)(d) | 48,500 | | 478,916 |
Mitsubishi Estate Co. Ltd. | 48,000 | | 1,439,269 |
Mitsui & Co. Ltd. | 375,000 | | 9,728,882 |
Nippon Building Fund, Inc. | 48 | | 696,438 |
Nippon Oil Corp. | 74,000 | | 655,537 |
ORIX Corp. | 31,850 | | 6,534,689 |
Osaka Gas Co. Ltd. | 1,409,000 | | 5,482,926 |
Shin-Etsu Chemical Co. Ltd. | 16,400 | | 1,052,223 |
Sumitomo Mitsui Financial Group, Inc. | 109 | | 893,048 |
Sumitomo Realty & Development Co. Ltd. | 30,000 | | 1,059,084 |
Sumitomo Trust & Banking Co. Ltd. | 197,000 | | 1,469,151 |
Takeda Pharmaceutical Co. Ltd. | 88,600 | | 5,535,553 |
Tokuyama Corp. (d) | 176,000 | | 2,458,846 |
Toyota Motor Corp. | 154,800 | | 8,857,656 |
Toyota Motor Corp. sponsored ADR | 15,600 | | 1,785,264 |
Xebio Co. Ltd. | 47,600 | | 1,404,749 |
Yamada Denki Co. Ltd. | 10,970 | | 1,131,278 |
TOTAL JAPAN | | 76,072,832 |
Kazakhstan - 0.5% |
JSC Halyk Bank of Kazakhstan unit | 104,300 | | 1,925,378 |
Korea (South) - 0.7% |
Kookmin Bank sponsored ADR | 15,200 | | 1,241,688 |
Samsung Electronics Co. Ltd. GDR | 4,833 | | 1,474,065 |
TOTAL KOREA (SOUTH) | | 2,715,753 |
Luxembourg - 0.1% |
ArcelorMittal SA (NY Shares) Class A | 7,600 | | 607,620 |
Mexico - 0.3% |
America Movil SAB de CV Series L sponsored ADR | 20,800 | | 1,360,112 |
Netherlands - 2.4% |
Heineken NV (Bearer) | 12,600 | | 879,480 |
ING Groep NV sponsored ADR | 194,700 | | 8,759,553 |
TOTAL NETHERLANDS | | 9,639,033 |
Norway - 3.3% |
DnB Nor ASA | 156,400 | | 2,579,223 |
Fred Olsen Energy ASA (d) | 45,000 | | 2,289,202 |
Common Stocks - continued |
| Shares | | Value |
Norway - continued |
Orkla ASA (A Shares) | 226,250 | | $ 4,203,322 |
Petroleum Geo-Services ASA | 146,350 | | 4,308,823 |
TOTAL NORWAY | | 13,380,570 |
Philippines - 0.2% |
Philippine Long Distance Telephone Co. sponsored ADR | 12,000 | | 823,200 |
Russia - 1.1% |
OAO Gazprom sponsored ADR | 91,300 | | 4,587,825 |
Singapore - 0.7% |
DBS Group Holdings Ltd. | 175,000 | | 2,739,062 |
South Africa - 1.0% |
Impala Platinum Holdings Ltd. | 102,600 | | 3,852,039 |
Spain - 4.8% |
Banco Bilbao Vizcaya Argentaria SA sponsored ADR | 192,100 | | 4,848,604 |
Banco Santander SA | 391,000 | | 8,497,212 |
Banco Santander SA sponsored ADR | 84,500 | | 1,834,495 |
Gestevision Telecinco SA | 75,200 | | 2,162,653 |
Telefonica SA sponsored ADR | 22,300 | | 2,217,735 |
TOTAL SPAIN | | 19,560,699 |
Sweden - 1.9% |
Atlas Copco AB (A Shares) | 52,800 | | 882,943 |
Svenska Cellulosa AB (SCA) (B Shares) | 184,600 | | 3,254,015 |
Telefonaktiebolaget LM Ericsson (B Shares) | 1,189,000 | | 3,572,945 |
TOTAL SWEDEN | | 7,709,903 |
Switzerland - 8.8% |
Credit Suisse Group sponsored ADR | 54,200 | | 3,669,340 |
Nestle SA (Reg.) | 17,839 | | 8,241,618 |
Novartis AG sponsored ADR | 15,400 | | 818,818 |
Roche Holding AG (participation certificate) | 40,954 | | 6,999,039 |
Swiss Life Holding | 7,868 | | 2,173,668 |
Swiss Reinsurance Co. (Reg.) | 33,669 | | 3,159,648 |
UBS AG (NY Shares) | 173,900 | | 9,336,691 |
Zurich Financial Services AG (Reg.) | 3,949 | | 1,188,996 |
TOTAL SWITZERLAND | | 35,587,818 |
Taiwan - 0.5% |
Novatek Microelectronics Corp. | 329,898 | | 1,517,358 |
Siliconware Precision Industries Co. Ltd. | 226,000 | | 476,487 |
TOTAL TAIWAN | | 1,993,845 |
Common Stocks - continued |
| Shares | | Value |
United Kingdom - 16.3% |
3i Group plc | 123,110 | | $ 2,777,078 |
Anglo American PLC (United Kingdom) | 19,000 | | 1,309,095 |
BAE Systems PLC | 246,100 | | 2,548,038 |
Barclays PLC | 478,700 | | 6,085,474 |
BHP Billiton PLC | 143,000 | | 5,443,639 |
BP PLC | 172,000 | | 2,235,713 |
British American Tobacco PLC | 85,800 | | 3,289,572 |
HBOS plc | 240,800 | | 4,370,546 |
HSBC Holdings PLC (United Kingdom) (Reg.) | 158,900 | | 3,162,746 |
Informa PLC | 181,800 | | 2,022,146 |
Land Securities Group PLC | 59,200 | | 2,023,431 |
Misys PLC | 104,900 | | 527,238 |
National Grid PLC | 385,200 | | 6,418,813 |
Prudential PLC | 141,728 | | 2,304,238 |
Rolls-Royce Group PLC | 434,919 | | 4,864,695 |
Royal Bank of Scotland Group PLC | 672,000 | | 7,216,133 |
Tesco PLC | 168,800 | | 1,730,201 |
Vedanta Resources PLC | 20,200 | | 923,930 |
Vodafone Group PLC sponsored ADR | 129,112 | | 5,070,228 |
Yell Group PLC | 180,100 | | 1,703,688 |
TOTAL UNITED KINGDOM | | 66,026,642 |
United States of America - 0.2% |
Virgin Media, Inc. | 27,900 | | 616,869 |
TOTAL COMMON STOCKS (Cost $343,850,130) | 399,745,203 |
Nonconvertible Preferred Stocks - 0.2% |
| | | |
Germany - 0.2% |
ProSiebenSat.1 Media AG | 28,000 | | 818,224 |
United Kingdom - 0.0% |
Rolls-Royce Group PLC B Shares | 19,821,007 | | 41,209 |
TOTAL NONCONVERTIBLE PREFERRED STOCKS (Cost $929,031) | 859,433 |
Money Market Funds - 2.7% |
| Shares | | Value |
Fidelity Cash Central Fund, 4.97% (b) | 2,981,514 | | $ 2,981,514 |
Fidelity Securities Lending Cash Central Fund, 5.02% (b)(c) | 7,703,170 | | 7,703,170 |
TOTAL MONEY MARKET FUNDS (Cost $10,684,684) | 10,684,684 |
TOTAL INVESTMENT PORTFOLIO - 101.6% (Cost $355,463,845) | 411,289,320 |
NET OTHER ASSETS - (1.6)% | (6,396,381) |
NET ASSETS - 100% | $ 404,892,939 |
Legend |
(a) Non-income producing |
(b) Affiliated fund that is available only to investment companies and other accounts managed by Fidelity Investments. The rate quoted is the annualized seven-day yield of the fund at period end. A complete unaudited listing of the fund's holdings as of its most recent quarter end is available upon request. |
(c) Investment made with cash collateral received from securities on loan. |
(d) Security or a portion of the security is on loan at period end. |
Affiliated Central Funds |
Information regarding fiscal year to date income earned by the Fund from investments in Fidelity Central Funds is as follows: |
Fund | Income earned |
Fidelity Cash Central Fund | $ 495,581 |
Fidelity Securities Lending Cash Central Fund | 347,002 |
Total | $ 842,583 |
See accompanying notes which are an integral part of the financial statements.
Annual Report
Financial Statements
Statement of Assets and Liabilities
| October 31, 2007 |
Assets | | |
Investment in securities, at value (including securities loaned of $7,446,355) - See accompanying schedule: Unaffiliated issuers (cost $344,779,161) | $ 400,604,636 | |
Fidelity Central Funds (cost $10,684,684) | 10,684,684 | |
Total Investments (cost $355,463,845) | | $ 411,289,320 |
Foreign currency held at value (cost $10,790) | | 10,726 |
Receivable for investments sold | | 4,120,382 |
Receivable for fund shares sold | | 1,047,639 |
Dividends receivable | | 718,112 |
Distributions receivable from Fidelity Central Funds | | 7,659 |
Prepaid expenses | | 44 |
Other receivables | | 13,873 |
Total assets | | 417,207,755 |
| | |
Liabilities | | |
Payable for investments purchased | $ 969,463 | |
Payable for fund shares redeemed | 3,211,020 | |
Accrued management fee | 251,364 | |
Distribution fees payable | 10,680 | |
Other affiliated payables | 95,991 | |
Other payables and accrued expenses | 73,128 | |
Collateral on securities loaned, at value | 7,703,170 | |
Total liabilities | | 12,314,816 |
| | |
Net Assets | | $ 404,892,939 |
Net Assets consist of: | | |
Paid in capital | | $ 319,315,967 |
Undistributed net investment income | | 6,624,232 |
Accumulated undistributed net realized gain (loss) on investments and foreign currency transactions | | 23,121,828 |
Net unrealized appreciation (depreciation) on investments and assets and liabilities in foreign currencies | | 55,830,912 |
Net Assets | | $ 404,892,939 |
See accompanying notes which are an integral part of the financial statements.
Annual Report
Financial Statements - continued
Statement of Assets and Liabilities - continued
| October 31, 2007 |
Calculation of Maximum Offering Price
Class A:
Net Asset Value and redemption price per share ($6,051,508 ÷ 464,877 shares) | | $ 13.02 |
| | |
Maximum offering price per share (100/94.25 of $13.02) | | $ 13.81 |
Class T:
Net Asset Value and redemption price per share ($5,081,307 ÷ 391,278 shares) | | $ 12.99 |
| | |
Maximum offering price per share (100/96.50 of $12.99) | | $ 13.46 |
Class B:
Net Asset Value and offering price per share ($2,651,396 ÷ 205,042 shares)A | | $ 12.93 |
| | |
Class C:
Net Asset Value and offering price per share ($5,995,905 ÷ 464,024 shares)A | | $ 12.92 |
| | |
| | |
International Value:
Net Asset Value, offering price and redemption price per share ($381,148,142 ÷ 29,177,219 shares) | | $ 13.06 |
| | |
Institutional Class:
Net Asset Value, offering price and redemption price per share ($3,964,681 ÷ 303,335 shares) | | $ 13.07 |
A Redemption price per share is equal to net asset value less any applicable contingent deferred sales charge.
See accompanying notes which are an integral part of the financial statements.
Annual Report
Statement of Operations
| Year ended October 31, 2007 |
Investment Income | | |
Dividends | | $ 10,911,623 |
Income from Fidelity Central Funds | | 842,583 |
| | 11,754,206 |
Less foreign taxes withheld | | (950,853) |
Total income | | 10,803,353 |
| | |
Expenses | | |
Management fee
Basic fee | $ 2,678,334 | |
Performance adjustment | (49,312) | |
Transfer agent fees | 795,281 | |
Distribution fees | 97,190 | |
Accounting and security lending fees | 200,380 | |
Custodian fees and expenses | 73,738 | |
Independent trustees' compensation | 1,212 | |
Registration fees | 149,976 | |
Audit | 60,592 | |
Legal | 2,605 | |
Interest | 1,715 | |
Miscellaneous | 11,367 | |
Total expenses before reductions | 4,023,078 | |
Expense reductions | (66,233) | 3,956,845 |
Net investment income (loss) | | 6,846,508 |
Realized and Unrealized Gain (Loss) Net realized gain (loss) on: | | |
Investment securities: | | |
Unaffiliated issuers (net of foreign taxes of $32,830) | 23,720,618 | |
Foreign currency transactions | 2,737 | |
Total net realized gain (loss) | | 23,723,355 |
Change in net unrealized appreciation (depreciation) on: Investment securities (net of decrease in deferred foreign taxes of $7,086) | 43,764,016 | |
Assets and liabilities in foreign currencies | 5,403 | |
Total change in net unrealized appreciation (depreciation) | | 43,769,419 |
Net gain (loss) | | 67,492,774 |
Net increase (decrease) in net assets resulting from operations | | $ 74,339,282 |
See accompanying notes which are an integral part of the financial statements.
Annual Report
Financial Statements - continued
Statement of Changes in Net Assets
| Year ended
October 31,
2007 | For the period
May 18, 2006
(commencement of operations) to
October 31,
2006 |
Increase (Decrease) in Net Assets | | |
Operations | | |
Net investment income (loss) | $ 6,846,508 | $ 808,421 |
Net realized gain (loss) | 23,723,355 | (6,746) |
Change in net unrealized appreciation (depreciation) | 43,769,419 | 12,061,493 |
Net increase (decrease) in net assets resulting
from operations | 74,339,282 | 12,863,168 |
Distributions to shareholders from net investment income | (978,516) | - |
Distributions to shareholders from net realized gain | (557,946) | - |
Total distributions | (1,536,462) | - |
Share transactions - net increase (decrease) | 101,052,444 | 218,123,163 |
Redemption fees | 30,746 | 20,598 |
Total increase (decrease) in net assets | 173,886,010 | 231,006,929 |
| | |
Net Assets | | |
Beginning of period | 231,006,929 | - |
End of period (including undistributed net investment income of $6,624,232 and undistributed net investment income of $808,421, respectively) | $ 404,892,939 | $ 231,006,929 |
See accompanying notes which are an integral part of the financial statements.
Annual Report
Financial Highlights - Class A
Years ended October 31, | 2007 | 2006 I |
Selected Per-Share Data | | |
Net asset value, beginning of period | $ 10.60 | $ 10.00 |
Income from Investment Operations | | |
Net investment income (loss) E | .18 | .06 H |
Net realized and unrealized gain (loss) | 2.29 | .54 |
Total from investment operations | 2.47 | .60 |
Distributions from net investment income | (.03) | - |
Distributions from net realized gain | (.02) | - |
Total distributions | (.05) | - |
Redemption fees added to paid in capital E | - K | - K |
Net asset value, end of period | $ 13.02 | $ 10.60 |
Total Return B, C, D | 23.43% | 6.00% |
Ratios to Average Net Assets F, J | | |
Expenses before reductions | 1.38% | 1.75% A |
Expenses net of fee waivers, if any | 1.38% | 1.50% A |
Expenses net of all reductions | 1.37% | 1.46% A |
Net investment income (loss) | 1.49% | 1.29% A, H |
Supplemental Data | | |
Net assets, end of period (000 omitted) | $ 6,052 | $ 1,537 |
Portfolio turnover rate G | 59% | 29% A |
A Annualized
B Total returns for periods of less than one year are not annualized.
C Total returns would have been lower had certain expenses not been reduced during the periods shown.
D Total returns do not include the effect of the sales charges.
E Calculated based on average shares outstanding during the period.
F Fees and expenses of the underlying Fidelity Central Funds are not included in the Fund's expense ratio. The Fund indirectly bears its proportionate share of the expenses of any underlying Fidelity Central Funds.
G Amount does not include the portfolio activity of any underlying Fidelity Central Funds.
H Investment income per share reflects a special dividend which amounted to $.03 per share. Excluding the special dividend, the ratio of net investment income (loss) to average net assets would have been .63%.
I For the period May 18, 2006 (commencement of operations) to October 31, 2006.
J Expense ratios reflect operating expenses of the class. Expenses before reductions do not reflect amounts reimbursed by the investment adviser or reductions from brokerage service arrangements or other expense offset arrangements and do not represent the amount paid by the class during periods when reimbursements or reductions occur. Expense ratios before reductions for start-up periods may not be representative of longer-term operating periods. Expenses net of fee waivers reflect expenses after reimbursement by the investment adviser but prior to reductions from brokerage service arrangements or other expense offset arrangements. Expenses net of all reductions represent the net expenses paid by the class.
K Amount represents less than $.01 per share.
See accompanying notes which are an integral part of the financial statements.
Annual Report
Financial Highlights - Class T
Years ended October 31, | 2007 | 2006 I |
Selected Per-Share Data | | |
Net asset value, beginning of period | $ 10.59 | $ 10.00 |
Income from Investment Operations | | |
Net investment income (loss) E | .15 | .05 H |
Net realized and unrealized gain (loss) | 2.29 | .54 |
Total from investment operations | 2.44 | .59 |
Distributions from net investment income | (.02) | - |
Distributions from net realized gain | (.02) | - |
Total distributions | (.04) | - |
Redemption fees added to paid in capital E | - K | - K |
Net asset value, end of period | $ 12.99 | $ 10.59 |
Total Return B, C, D | 23.13% | 5.90% |
Ratios to Average Net Assets F, J | | |
Expenses before reductions | 1.60% | 2.01% A |
Expenses net of fee waivers, if any | 1.60% | 1.75% A |
Expenses net of all reductions | 1.58% | 1.71% A |
Net investment income (loss) | 1.27% | 1.04% A, H |
Supplemental Data | | |
Net assets, end of period (000 omitted) | $ 5,081 | $ 1,789 |
Portfolio turnover rate G | 59% | 29% A |
A Annualized
B Total returns for periods of less than one year are not annualized.
C Total returns would have been lower had certain expenses not been reduced during the periods shown.
D Total returns do not include the effect of the sales charges.
E Calculated based on average shares outstanding during the period.
F Fees and expenses of the underlying Fidelity Central Funds are not included in the Fund's expense ratio. The Fund indirectly bears its proportionate share of the expenses of any underlying Fidelity Central Funds.
G Amount does not include the portfolio activity of any underlying Fidelity Central Funds.
H Investment income per share reflects a special dividend which amounted to $.03 per share. Excluding the special dividend, the ratio of net investment income (loss) to average net assets would have been .38%.
I For the period May 18, 2006 (commencement of operations) to October 31, 2006.
J Expense ratios reflect operating expenses of the class. Expenses before reductions do not reflect amounts reimbursed by the investment adviser or reductions from brokerage service arrangements or other expense offset arrangements and do not represent the amount paid by the class during periods when reimbursements or reductions occur. Expense ratios before reductions for start-up periods may not be representative of longer-term operating periods. Expenses net of fee waivers reflect expenses after reimbursement by the investment adviser but prior to reductions from brokerage service arrangements or other expense offset arrangements. Expenses net of all reductions represent the net expenses paid by the class.
K Amount represents less than $.01 per share.
See accompanying notes which are an integral part of the financial statements.
Annual Report
Financial Highlights - Class B
Years ended October 31, | 2007 | 2006 I |
Selected Per-Share Data | | |
Net asset value, beginning of period | $ 10.56 | $ 10.00 |
Income from Investment Operations | | |
Net investment income (loss) E | .09 | .02 H |
Net realized and unrealized gain (loss) | 2.29 | .54 |
Total from investment operations | 2.38 | .56 |
Distributions from net realized gain | (.01) | - |
Redemption fees added to paid in capital E | - K | - K |
Net asset value, end of period | $ 12.93 | $ 10.56 |
Total Return B, C, D | 22.59% | 5.60% |
Ratios to Average Net Assets F, J | | |
Expenses before reductions | 2.10% | 2.50% A |
Expenses net of fee waivers, if any | 2.10% | 2.25% A |
Expenses net of all reductions | 2.08% | 2.21% A |
Net investment income (loss) | .77% | .54% A, H |
Supplemental Data | | |
Net assets, end of period (000 omitted) | $ 2,651 | $ 1,304 |
Portfolio turnover rate G | 59% | 29% A |
A Annualized
B Total returns for periods of less than one year are not annualized.
C Total returns would have been lower had certain expenses not been reduced during the periods shown.
D Total returns do not include the effect of the contingent deferred sales charge.
E Calculated based on average shares outstanding during the period.
F Fees and expenses of the underlying Fidelity Central Funds are not included in the Fund's expense ratio. The Fund indirectly bears its proportionate share of the expenses of any underlying Fidelity Central Funds.
G Amount does not include the portfolio activity of any underlying Fidelity Central Funds.
H Investment income per share reflects a special dividend which amounted to $.03 per share. Excluding the special dividend, the ratio of net investment income (loss) to average net assets would have been (.12) %.
I For the period May 18, 2006 (commencement of operations) to October 31, 2006.
J Expense ratios reflect operating expenses of the class. Expenses before reductions do not reflect amounts reimbursed by the investment adviser or reductions from brokerage service arrangements or other expense offset arrangements and do not represent the amount paid by the class during periods when reimbursements or reductions occur. Expense ratios before reductions for start-up periods may not be representative of longer-term operating periods. Expenses net of fee waivers reflect expenses after reimbursement by the investment adviser but prior to reductions from brokerage service arrangements or other expense offset arrangements. Expenses net of all reductions represent the net expenses paid by the class.
K Amount represents less than $.01 per share.
See accompanying notes which are an integral part of the financial statements.
Annual Report
Financial Highlights - Class C
Years ended October 31, | 2007 | 2006 I |
Selected Per-Share Data | | |
Net asset value, beginning of period | $ 10.56 | $ 10.00 |
Income from Investment Operations | | |
Net investment income (loss) E | .09 | .02 H |
Net realized and unrealized gain (loss) | 2.29 | .54 |
Total from investment operations | 2.38 | .56 |
Distributions from net realized gain | (.02) | - |
Redemption fees added to paid in capital E | - K | - K |
Net asset value, end of period | $ 12.92 | $ 10.56 |
Total Return B, C, D | 22.56% | 5.60% |
Ratios to Average Net Assets F, J | | |
Expenses before reductions | 2.07% | 2.47% A |
Expenses net of fee waivers, if any | 2.07% | 2.25% A |
Expenses net of all reductions | 2.05% | 2.21% A |
Net investment income (loss) | .80% | .54% A, H |
Supplemental Data | | |
Net assets, end of period (000 omitted) | $ 5,996 | $ 2,183 |
Portfolio turnover rate G | 59% | 29% A |
A Annualized
B Total returns for periods of less than one year are not annualized.
C Total returns would have been lower had certain expenses not been reduced during the periods shown.
D Total returns do not include the effect of the contingent deferred sales charge.
E Calculated based on average shares outstanding during the period.
F Fees and expenses of the underlying Fidelity Central Funds are not included in the Fund's expense ratio. The Fund indirectly bears its proportionate share of the expenses of any underlying Fidelity Central Funds.
G Amount does not include the portfolio activity of any underlying Fidelity Central Funds.
H Investment income per share reflects a special dividend which amounted to $.03 per share. Excluding the special dividend, the ratio of net investment income (loss) to average net assets would have been (.12) %.
I For the period May 18, 2006 (commencement of operations) to October 31, 2006.
J Expense ratios reflect operating expenses of the class. Expenses before reductions do not reflect amounts reimbursed by the investment adviser or reductions from brokerage service arrangements or other expense offset arrangements and do not represent the amount paid by the class during periods when reimbursements or reductions occur. Expense ratios before reductions for start-up periods may not be representative of longer-term operating periods. Expenses net of fee waivers reflect expenses after reimbursement by the investment adviser but prior to reductions from brokerage service arrangements or other expense offset arrangements. Expenses net of all reductions represent the net expenses paid by the class.
K Amount represents less than $.01 per share.
See accompanying notes which are an integral part of the financial statements.
Annual Report
Financial Highlights - International Value
Years ended October 31, | 2007 | 2006 H |
Selected Per-Share Data | | |
Net asset value, beginning of period | $ 10.61 | $ 10.00 |
Income from Investment Operations | | |
Net investment income (loss) D | .22 | .07 G |
Net realized and unrealized gain (loss) | 2.29 | .54 |
Total from investment operations | 2.51 | .61 |
Distributions from net investment income | (.04) | - |
Distributions from net realized gain | (.02) | - |
Total distributions | (.06) | - |
Redemption fees added to paid in capital D | - J | - J |
Net asset value, end of period | $ 13.06 | $ 10.61 |
Total Return B, C | 23.81% | 6.10% |
Ratios to Average Net Assets E, I | | |
Expenses before reductions | 1.03% | 1.50% A |
Expenses net of fee waivers, if any | 1.03% | 1.25% A |
Expenses net of all reductions | 1.02% | 1.21% A |
Net investment income (loss) | 1.84% | 1.54% A, G |
Supplemental Data | | |
Net assets, end of period (000 omitted) | $ 381,148 | $ 221,130 |
Portfolio turnover rate F | 59% | 29% A |
A Annualized
B Total returns for periods of less than one year are not annualized.
C Total returns would have been lower had certain expenses not been reduced during the periods shown.
D Calculated based on average shares outstanding during the period.
E Fees and expenses of the underlying Fidelity Central Funds are not included in the Fund's expense ratio. The Fund indirectly bears its proportionate share of the expenses of any underlying Fidelity Central Funds.
F Amount does not include the portfolio activity of any underlying Fidelity Central Funds.
G Investment income per share reflects a special dividend which amounted to $.03 per share. Excluding the special dividend, the ratio of net investment income (loss) to average net assets would have been .88%.
H For the period May 18, 2006 (commencement of operations) to October 31, 2006.
I Expense ratios reflect operating expenses of the class. Expenses before reductions do not reflect amounts reimbursed by the investment adviser or reductions from brokerage service arrangements or other expense offset arrangements and do not represent the amount paid by the class during periods when reimbursements or reductions occur. Expense ratios before reductions for start-up periods may not be representative of longer-term operating periods. Expenses net of fee waivers reflect expenses after reimbursement by the investment adviser but prior to reductions from brokerage service arrangements or other expense offset arrangements. Expenses net of all reductions represent the net expenses paid by the class.
J Amount represents less than $.01 per share.
See accompanying notes which are an integral part of the financial statements.
Annual Report
Financial Highlights - Institutional Class
Years ended October 31, | 2007 | 2006 H |
Selected Per-Share Data | | |
Net asset value, beginning of period | $ 10.61 | $ 10.00 |
Income from Investment Operations | | |
Net investment income (loss) D | .22 | .07 G |
Net realized and unrealized gain (loss) | 2.30 | .54 |
Total from investment operations | 2.52 | .61 |
Distributions from net investment income | (.04) | - |
Distributions from net realized gain | (.02) | - |
Total distributions | (.06) | - |
Redemption fees added to paid in capital D | - J | - J |
Net asset value, end of period | $ 13.07 | $ 10.61 |
Total Return B, C | 23.91% | 6.10% |
Ratios to Average Net Assets E, I | | |
Expenses before reductions | .98% | 1.38% A |
Expenses net of fee waivers, if any | .98% | 1.25% A |
Expenses net of all reductions | .96% | 1.21% A |
Net investment income (loss) | 1.89% | 1.54% A, G |
Supplemental Data | | |
Net assets, end of period (000 omitted) | $ 3,965 | $ 3,064 |
Portfolio turnover rate F | 59% | 29% A |
A Annualized
B Total returns for periods of less than one year are not annualized.
C Total returns would have been lower had certain expenses not been reduced during the periods shown.
D Calculated based on average shares outstanding during the period.
E Fees and expenses of the underlying Fidelity Central Funds are not included in the Fund's expense ratio. The Fund indirectly bears its proportionate share of the expenses of any underlying Fidelity Central Funds.
F Amount does not include the portfolio activity of any underlying Fidelity Central Funds.
G Investment income per share reflects a special dividend which amounted to $.03 per share. Excluding the special dividend, the ratio of net investment income (loss) to average net assets would have been .88%.
H For the period May 18, 2006 (commencement of operations) to October 31, 2006.
I Expense ratios reflect operating expenses of the class. Expenses before reductions do not reflect amounts reimbursed by the investment adviser or reductions from brokerage service arrangements or other expense offset arrangements and do not represent the amount paid by the class during periods when reimbursements or reductions occur. Expense ratios before reductions for start-up periods may not be representative of longer-term operating periods. Expenses net of fee waivers reflect expenses after reimbursement by the investment adviser but prior to reductions from brokerage service arrangements or other expense offset arrangements. Expenses net of all reductions represent the net expenses paid by the class.
J Amount represents less than $.01 per share.
See accompanying notes which are an integral part of the financial statements.
Annual Report
Notes to Financial Statements
For the period ended October 31, 2007
1. Organization.
Fidelity International Value Fund (the Fund) is a fund of Fidelity Investment Trust (the trust) and is authorized to issue an unlimited number of shares. The trust is registered under the Investment Company Act of 1940, as amended (the 1940 Act), as an open-end management investment company organized as a Massachusetts business trust.
The Fund offers Class A, Class T, Class B, Class C, International Value Fund, and Institutional Class shares, each of which has equal rights as to assets and voting privileges. Each class has exclusive voting rights with respect to matters that affect that class. Class B shares will automatically convert to Class A shares after a holding period of seven years from the initial date of purchase. Investment income, realized and unrealized capital gains and losses, the common expenses of the Fund, and certain fund-level expense reductions, if any, are allocated on a pro rata basis to each class based on the relative net assets of each class to the total net assets of the Fund. Each class differs with respect to transfer agent and distribution and service plan fees incurred. Certain expense reductions also differ by class.
The Fund's investments in emerging markets can be subject to social, economic, regulatory, and political uncertainties and can be extremely volatile.
2. Investments in Fidelity Central Funds.
The Fund may invest in Fidelity Central Funds, which are open-end investment companies available only to other investment companies and accounts managed by Fidelity Management & Research Company (FMR) and its affiliates. The Fund's Schedule of Investments lists each of the Fidelity Central Funds as an investment of the Fund, but does not include the underlying holdings of each Fidelity Central Fund. As an Investing Fund, the Fund indirectly bears its proportionate share of the expenses of the underlying Fidelity Central Funds.
The Money Market Central Funds seek preservation of capital and current income and are managed by Fidelity Investments Money Management, Inc. (FIMM), an affiliate of FMR.
A complete list of holdings for each Fidelity Central Fund is available upon request or at the SEC's web site at www.sec.gov. In addition, the financial statements of the Fidelity Central Funds, which are not covered by the Fund's Report of Independent Registered Public Accounting Firm, are available on the SEC's web site or upon request.
Annual Report
Notes to Financial Statements - continued
3. Significant Accounting Policies.
The financial statements have been prepared in conformity with accounting principles generally accepted in the United States of America, which require management to make certain estimates and assumptions at the date of the financial statements. The following summarizes the significant accounting policies of the Fund:
Security Valuation. Investments are valued and net asset value (NAV) per share is calculated (NAV calculation) as of the close of business of the New York Stock Exchange (NYSE), normally 4:00 p.m. Eastern time. Wherever possible, the Fund uses independent pricing services approved by the Board of Trustees to value its investments.
Equity securities, including restricted securities, for which market quotations are readily available, are valued at the last reported sale price or official closing price as reported by an independent pricing service on the primary market or exchange on which they are traded. In the event there were no sales during the day or closing prices are not available, securities are valued at the last quoted bid price. Investments in open-end mutual funds, including the Fidelity Central Funds, are valued at their closing net asset value each business day. Short-term securities with remaining maturities of sixty days or less for which quotations are not readily available are valued at amortized cost, which approximates value.
When current market prices or quotations are not readily available or do not accurately reflect fair value, valuations may be determined in accordance with procedures adopted by the Board of Trustees. For example, when developments occur between the close of a market and the close of the NYSE that may materially affect the value of some or all of the securities, or when trading in a security is halted, those securities may be fair valued. Factors used in the determination of fair value may include monitoring news to identify significant market or security specific events such as changes in the value of U.S. securities markets, reviewing developments in foreign markets and evaluating the performance of ADRs, futures contracts and exchange-traded funds. Because the Fund's utilization of fair value pricing depends on market activity, the frequency with which fair value pricing is used cannot be predicted and may be utilized to a significant extent. The value of securities used for NAV calculation under fair value pricing may differ from published prices for the same securities.
Foreign Currency. The Fund uses foreign currency contracts to facilitate transactions in foreign-denominated securities. Losses from these transactions may arise from changes in the value of the foreign currency or if the counterparties do not perform under the contracts' terms.
Foreign-denominated assets, including investment securities, and liabilities are translated into U.S. dollars at the exchange rate at period end. Purchases and sales of investment securities, income and dividends received and expenses denominated in foreign
Annual Report
3. Significant Accounting Policies - continued
Foreign Currency - continued
currencies are translated into U.S. dollars at the exchange rate in effect on the transaction date.
The effects of exchange rate fluctuations on investments are included with the net realized and unrealized gain (loss) on investment securities. Other foreign currency transactions resulting in realized and unrealized gain (loss) are disclosed separately.
Investment Transactions and Income. For financial reporting purposes, the Fund's investment holdings and NAV include trades executed through the end of the last business day of the period. The NAV for processing shareholder transactions includes trades executed through the end of the prior business day. Gains and losses on securities sold are determined on the basis of identified cost. Dividend income is recorded on the ex-dividend date, except for certain dividends from foreign securities where the ex-dividend date may have passed, which are recorded as soon as the Fund is informed of the ex-dividend date. Non-cash dividends included in dividend income, if any, are recorded at the fair market value of the securities received. Interest income and distributions from the Fidelity Central Funds are accrued as earned. Interest income includes coupon interest and amortization of premium and accretion of discount on debt securities. Investment income is recorded net of foreign taxes withheld where recovery of such taxes is uncertain.
Expenses. Most expenses of the trust can be directly attributed to a fund. Expenses which cannot be directly attributed are apportioned among each Fund in the trust. Expense estimates are accrued in the period to which they relate and adjustments are made when actual amounts are known.
Income Tax Information and Distributions to Shareholders. Each year, the Fund intends to qualify as a regulated investment company by distributing all of its taxable income and realized gains under Subchapter M of the Internal Revenue Code. As a result, no provision for income taxes is required in the accompanying financial statements. Foreign taxes are provided for based on the Fund's understanding of the tax rules and rates that exist in the foreign markets in which it invests.
Distributions are recorded on the ex-dividend date. Income dividends and capital gain distributions are declared separately for each class. Income and capital gain distributions are determined in accordance with income tax regulations, which may differ from generally accepted accounting principles. In addition, the Fund will claim a portion of the payment made to redeeming shareholders as a distribution for income tax purposes.
Annual Report
Notes to Financial Statements - continued
3. Significant Accounting Policies - continued
Income Tax Information and Distributions to Shareholders - continued
Capital accounts within the financial statements are adjusted for permanent book-tax differences. These adjustments have no impact on net assets or the results of operations. Temporary book-tax differences will reverse in a subsequent period.
Book-tax differences are primarily due to short-term capital gains, foreign currency transactions, certain foreign taxes, passive foreign investment companies (PFIC) and losses deferred due to wash sales.
The tax-basis components of distributable earnings and the federal tax cost as of period end were as follows:
Unrealized appreciation | $ 64,830,652 | |
Unrealized depreciation | (10,069,522) | |
Net unrealized appreciation (depreciation) | 54,761,130 | |
Undistributed ordinary income | 13,452,360 | |
Undistributed long-term capital gain | 10,388,114 | |
| | |
Cost for federal income tax purposes | $ 356,528,190 | |
The tax character of distributions paid was as follows:
| October 31, 2007 | October 31, 2006 |
Ordinary Income | $ 1,536,462 | $ - |
Short-Term Trading (Redemption) Fees. Shares held in the Fund less than 30 days are subject to a redemption fee equal to 1.00% of the proceeds of the redeemed shares. All redemption fees, including any estimated redemption fees paid by FMR, are retained by the Fund and accounted for as an addition to paid in capital.
New Accounting Pronouncements. In July 2006, Financial Accounting Standards Board Interpretation No. 48, Accounting for Uncertainty in Income Taxes - an interpretation of FASB Statement 109 (FIN 48), was issued and is effective on the last business day of the semiannual reporting period for fiscal years beginning after December 15, 2006. FIN 48 sets forth a threshold for financial statement recognition, measurement and disclosure of a tax position taken or expected to be taken on a tax return. Management has concluded that the adoption of FIN 48 will not result in a material impact on the Fund's net assets, results of operations and financial statement disclosures.
In addition, in September 2006, Statement of Financial Accounting Standards No. 157, Fair Value Measurements (SFAS 157), was issued and is effective for fiscal years beginning after November 15, 2007. SFAS 157 defines fair value, establishes a framework for
Annual Report
3. Significant Accounting Policies - continued
New Accounting Pronouncements - continued
measuring fair value and expands disclosures about fair value measurements. Management is currently evaluating the impact the adoption of SFAS 157 will have on the Fund's financial statement disclosures.
4. Operating Policies.
Repurchase Agreements. FMR has received an Exemptive Order from the Securities and Exchange Commission (the SEC) which permits the Fund and other affiliated entities of FMR to transfer uninvested cash balances into joint trading accounts which are then invested in repurchase agreements. The Fund may also invest directly with institutions in repurchase agreements. Repurchase agreements are collateralized by government or non-government securities. Upon settlement date, collateral is held in segregated accounts with custodian banks and may be obtained in the event of a default of the counterparty. The Fund monitors, on a daily basis, the value of the collateral to ensure it is at least equal to the principal amount of the repurchase agreement (including accrued interest). In the event of a default by the counterparty, realization of the collateral proceeds could be delayed, during which time the value of the collateral may decline.
5. Purchases and Sales of Investments.
Purchases and sales of securities, other than short-term securities, aggregated $321,090,708 and $214,366,719, respectively.
6. Fees and Other Transactions with Affiliates.
Management Fee. FMR and its affiliates provide the Fund with investment management related services for which the Fund pays a monthly management fee. The management fee is the sum of an individual fund fee rate that is based on an annual rate of .45% of the Fund's average net assets and a group fee rate that averaged ..26% during the period. The group fee rate is based upon the average net assets of all the mutual funds advised by FMR. The group fee rate decreases as assets under management increase and increases as assets under management decrease. In addition, the management fee is subject to a performance adjustment (up to a maximum of ± .20% of the Fund's average net assets over a 36 month performance period). The upward or downward adjustment to the management fee is based on the relative investment performance of the retail class of the Fund, International Value as compared to an appropriate benchmark index. The Fund's performance adjustment took effect in May 2007. Subsequent months will be
Annual Report
Notes to Financial Statements - continued
6. Fees and Other Transactions with Affiliates - continued
Management Fee - continued
added until the performance period includes 36 months. For the period, the total annual management fee rate, including the performance adjustment, was .69% of the Fund's average net assets.
Distribution and Service Plan. In accordance with Rule 12b-1 of the 1940 Act, the Fund has adopted separate Distribution and Service Plans for each class of shares. Certain classes pay Fidelity Distributors Corporation (FDC), an affiliate of FMR, separate Distribution and Service Fees, each of which is based on an annual percentage of each class' average net assets. In addition, FDC may pay financial intermediaries for selling shares of the Fund and providing shareholder support services. For the period, the Distribution and Service Fee rates and the total amounts paid to and retained by FDC were as follows:
| Distribution
Fee | Service
Fee | Paid to
FDC | Retained
by FDC |
Class A | 0% | .25% | $ 13,197 | $ 3,129 |
Class T | .25% | .25% | 17,684 | 5,582 |
Class B | .75% | .25% | 20,458 | 18,191 |
Class C | .75% | .25% | 45,851 | 26,965 |
| | | $ 97,190 | $ 53,867 |
Sales Load. FDC receives a front-end sales charge of up to 5.75% for selling Class A shares, and 3.50% for selling Class T shares, some of which is paid to financial intermediaries for selling shares of the Fund. FDC receives the proceeds of contingent deferred sales charges levied on Class A, Class T, Class B, and Class C redemptions. These charges depend on the holding period. The deferred sales charges range from 5% to 1% for Class B, 1% for Class C, 1.00% to .50% for certain purchases of Class A shares and .25% for certain purchases of Class T shares.
For the period, sales charge amounts retained by FDC were as follows:
| Retained
by FDC |
Class A | $ 13,601 |
Class T | 2,905 |
Class B* | 1,703 |
Class C* | 5,153 |
| $ 23,362 |
* When Class B and Class C shares are initially sold, FDC pays commissions from its own resources to financial intermediaries through which the sales are made.
Annual Report
6. Fees and Other Transactions with Affiliates - continued
Transfer Agent Fees. Fidelity Investments Institutional Operations Company, Inc. (FIIOC), an affiliate of FMR, is the transfer, dividend disbursing and shareholder servicing agent for each class of the Fund. FIIOC receives account fees and asset-based fees that vary according to the account size and type of account of the shareholders of the respective classes of the Fund. FIIOC pays for typesetting, printing and mailing of shareholder reports, except proxy statements. For the period, the total transfer agent fees paid by each class to FIIOC, were as follows:
| Amount | % of
Average
Net Assets |
Class A | $ 16,340 | .31 |
Class T | 9,701 | .27 |
Class B | 5,621 | .27 |
Class C | 11,287 | .24 |
International Value | 746,853 | .21 |
Institutional Class | 5,479 | .15 |
| $ 795,281 | |
Accounting and Security Lending Fees. Fidelity Service Company, Inc. (FSC), an affiliate of FMR, maintains the Fund's accounting records. The accounting fee is based on the level of average net assets for the month. Under a separate contract, FSC administers the security lending program. The security lending fee is based on the number and duration of lending transactions.
Brokerage Commissions. The Fund placed a portion of its portfolio transactions with brokerage firms which are affiliates of the investment adviser. The commissions paid to these affiliated firms were $169 for the period.
Interfund Lending Program. Pursuant to an Exemptive Order issued by the SEC, the Fund, along with other registered investment companies having management contracts with FMR, may participate in an interfund lending program. This program provides an alternative credit facility allowing the funds to borrow from, or lend money to, other participating affiliated funds. At period end, there were no interfund loans outstanding. The Fund's activity in this program during the period for which loans were outstanding was as follows:
Borrower or Lender | Average Daily Loan Balance | Weighted Average Interest Rate | Interest
Expense |
Borrower | $ 6,253,000 | 4.94% | $ 1,715 |
Annual Report
Notes to Financial Statements - continued
7. Committed Line of Credit.
The Fund participates with other funds managed by FMR in a $4.2 billion credit facility (the "line of credit") to be utilized for temporary or emergency purposes to fund shareholder redemptions or for other short-term liquidity purposes. The Fund has agreed to pay commitment fees on its pro rata portion of the line of credit, which amounted to $434 and is reflected in Miscellaneous Expense on the Statement of Operations. During the period, there were no borrowings on this line of credit.
8. Security Lending.
The Fund lends portfolio securities from time to time in order to earn additional income. On the settlement date of the loan, the Fund receives collateral (in the form of U.S. Treasury obligations, letters of credit and/or cash) against the loaned securities and maintains collateral in an amount not less than 100% of the market value of the loaned securities during the period of the loan. The market value of the loaned securities is determined at the close of business of the Fund and any additional required collateral is delivered to the Fund on the next business day. If the borrower defaults on its obligation to return the securities loaned because of insolvency or other reasons, a fund could experience delays and costs in recovering the securities loaned or in gaining access to the collateral. Any cash collateral received is invested in the Fidelity Securities Lending Cash Central Fund. The value of loaned securities and cash collateral at period end are disclosed on the Fund's Statement of Assets and Liabilities. Security lending income represents the income earned on investing cash collateral, less fees and expenses associated with the loan, plus any premium payments that may be received on the loan of certain types of securities. Security lending income is presented in the Statement of Operations as a component of income from Fidelity Central Funds. Net income from lending portfolio securities during the period amounted to $347,002.
9. Expense Reductions.
Many of the brokers with whom FMR places trades on behalf of the Fund provided services to the Fund in addition to trade execution. These services included payments of certain expenses on behalf of the Fund totaling $64,985 for the period. In addition, through arrangements with the Fund's custodian and each class' transfer agent, credits realized as a result of uninvested cash balances were used to reduce the Fund's expenses. During the period, these credits reduced the Fund's custody expenses by $1,231. During the period, credits reduced each class' transfer agent expense as noted in the table below.
| Transfer Agent
expense reduction | |
Class A | $ 17 | |
Annual Report
10. Other.
The Fund's organizational documents provide former and current trustees and officers with a limited indemnification against liabilities arising in connection with the performance of their duties to the Fund. In the normal course of business, the Fund may also enter into contracts that provide general indemnifications. The Fund's maximum exposure under these arrangements is unknown as this would be dependent on future claims that may be made against the Fund. The risk of material loss from such claims is considered remote.
In September 2006, FIIOC, the Fund's transfer agent, notified the Fund that the Fund's books and records did not reflect a conversion of certain Class B to Class A shares upon their conversion date. In March 2007, FIIOC converted the relevant Class B shares to Class A shares and recorded the conversion in the books and records of the Fund which did not result in a material impact to the Fund's reported net assets or results of operations in the accompanying financial statements. FIIOC has remediated affected shareholders and reimbursed the Fund for all related audit and legal expenses.
11. Distributions to Shareholders.
Distributions to shareholders of each class were as follows:
| Years ended October 31, |
| 2007 | 2006 |
From net investment income | | |
Class A | $ 5,613 | $ - |
Class T | 4,267 | - |
International Value | 956,069 | - |
Institutional Class | 12,567 | - |
Total | $ 978,516 | $ - |
From net realized gain | | |
Class A | $ 3,983 | $ - |
Class T | 4,693 | - |
Class B | 1,788 | - |
Class C | 4,566 | - |
International Value | 536,333 | - |
Institutional Class | 6,583 | - |
Total | $ 557,946 | $ - |
Annual Report
Notes to Financial Statements - continued
12. Share Transactions.
Transactions for each class of shares were as follows:
| Shares | Dollars |
| Years ended October 31, | Years ended October 31, |
| 2007 | 2006 A | 2007 | 2006 A |
Class A | | | | |
Shares sold | 556,341 | 146,231 | $ 6,434,905 | $ 1,461,870 |
Reinvestment of distributions | 863 | - | 9,431 | - |
Shares redeemed | (237,384) | (1,174) | (2,953,175) | (12,358) |
Net increase (decrease) | 319,820 | 145,057 | $ 3,491,161 | $ 1,449,512 |
Class T | | | | |
Shares sold | 281,943 | 169,119 | $ 3,296,913 | $ 1,688,142 |
Reinvestment of distributions | 806 | - | 8,796 | - |
Shares redeemed | (60,435) | (155) | (714,379) | (1,528) |
Net increase (decrease) | 222,314 | 168,964 | $ 2,591,330 | $ 1,686,614 |
Class B | | | | |
Shares sold | 114,852 | 123,455 | $ 1,342,524 | $ 1,231,876 |
Reinvestment of distributions | 151 | - | 1,653 | - |
Shares redeemed | (33,404) | (12) | (398,508) | (126) |
Net increase (decrease) | 81,599 | 123,443 | $ 945,669 | $ 1,231,750 |
Class C | | | | |
Shares sold | 337,076 | 207,502 | $ 3,929,869 | $ 2,072,374 |
Reinvestment of distributions | 319 | - | 3,483 | - |
Shares redeemed | (80,082) | (791) | (988,817) | (7,647) |
Net increase (decrease) | 257,313 | 206,711 | $ 2,944,535 | $ 2,064,727 |
International Value | | | | |
Shares sold | 26,426,338 | 22,776,737 | $ 309,978,984 | $ 228,163,833 |
Reinvestment of distributions | 127,337 | - | 1,391,798 | - |
Shares redeemed | (18,219,061) | (1,934,132) | (220,454,791) | (19,338,324) |
Net increase (decrease) | 8,334,614 | 20,842,605 | $ 90,915,991 | $ 208,825,509 |
Institutional Class | | | | |
Shares sold | 75,655 | 288,807 | $ 870,496 | $ 2,865,051 |
Reinvestment of distributions | 692 | - | 7,564 | - |
Shares redeemed | (61,819) | - | (714,302) | - |
Net increase (decrease) | 14,528 | 288,807 | $ 163,758 | $ 2,865,051 |
A For the period May 18, 2006 (commencement of operations) to October 31, 2006.
Annual Report
Report of Independent Registered Public Accounting Firm
To the Trustees of Fidelity Investment Trust and Shareholders of Fidelity International Value Fund:
We have audited the accompanying statement of assets and liabilities of Fidelity International Value Fund (the Fund), a fund of Fidelity Investment Trust, including the schedule of investments as of October 31, 2007, and the related statement of operations for the year then ended and the statement of changes in net assets and the financial highlights for the year then ended and the period May 18, 2006 (commencement of operations) to October 31, 2006 ended. These financial statements and financial highlights are the responsibility of the Fund's management. Our responsibility is to express an opinion on these financial statements and financial highlights based on our audits.
We conducted our audits in accordance with standards of the Public Company Accounting Oversight Board (United States). Those standards require that we plan and perform the audit to obtain reasonable assurance about whether the financial statements and financial highlights are free of material misstatement. The Fund is not required to have, nor were we engaged to perform, an audit of its internal control over financial reporting. Our audits included consideration of internal control over financial reporting as a basis for designing audit procedures that are appropriate in the circumstances, but not for the purpose of expressing an opinion on the effectiveness of the Fund's internal control over financial reporting. Accordingly, we express no such opinion. An audit also includes examining, on a test basis, evidence supporting the amounts and disclosures in the financial statements, assessing the accounting principles used and significant estimates made by management, as well as evaluating the overall financial statement presentation. Our procedures included confirmation of securities owned as of October 31, 2007, by correspondence with the custodians and brokers; where replies were not received from brokers, we performed other auditing procedures. We believe that our audits provide a reasonable basis for our opinion.
In our opinion, the financial statements and financial highlights referred to above present fairly, in all material respects, the financial position of Fidelity International Value Fund as of October 31, 2007, the results of its operations for the year then ended and the changes in its net assets and its financial highlights for the year then ended and the period May 18, 2006 (commencement of operations) to October 31, 2006, in conformity with accounting principles generally accepted in the United States of America.
/s/ Deloitte & Touche LLP
DELOITTE & TOUCHE LLP
Boston, Massachusetts
December 18, 2007
Annual Report
Trustees and Officers
The Trustees, Members of the Advisory Board, and executive officers of the trust and fund, as applicable, are listed below. The Board of Trustees governs the fund and is responsible for protecting the interests of shareholders. The Trustees are experienced executives who meet periodically throughout the year to oversee the fund's activities, review contractual arrangements with companies that provide services to the fund, and review the fund's performance. Except for James C. Curvey, each of the Trustees oversees 370 funds advised by FMR or an affiliate. Mr. Curvey oversees 340 funds advised by FMR or an affiliate.
The Trustees hold office without limit in time except that (a) any Trustee may resign; (b) any Trustee may be removed by written instrument, signed by at least two-thirds of the number of Trustees prior to such removal; (c) any Trustee who requests to be retired or who has become incapacitated by illness or injury may be retired by written instrument signed by a majority of the other Trustees; and (d) any Trustee may be removed at any special meeting of shareholders by a two-thirds vote of the outstanding voting securities of the trust. Each Trustee who is not an interested person (as defined in the 1940 Act) (Independent Trustee), shall retire not later than the last day of the calendar year in which his or her 72nd birthday occurs. The Independent Trustees may waive this mandatory retirement age policy with respect to individual Trustees. The executive officers and Advisory Board Members hold office without limit in time, except that any officer and Advisory Board Member may resign or may be removed by a vote of a majority of the Trustees at any regular meeting or any special meeting of the Trustees. Except as indicated, each individual has held the office shown or other offices in the same company for the past five years.
The fund's Statement of Additional Information (SAI) includes more information about the Trustees. To request a free copy, call Fidelity at 1-800-544-8544.
Interested Trustees*:
Correspondence intended for each Trustee who is an interested person may be sent to Fidelity Investments, 82 Devonshire Street, Boston, Massachusetts 02109.
Name, Age; Principal Occupation |
Edward C. Johnson 3d (77) |
| Year of Election or Appointment: 1984 Mr. Johnson is Chairman of the Board of Trustees. Mr. Johnson serves as President (2006-present), Chief Executive Officer, Chairman, and a Director of FMR LLC; Chairman and a Director of FMR; Chairman and a Director of Fidelity Research & Analysis Company (FRAC); Chairman and a Director of Fidelity Investments Money Management, Inc.; and Chairman (2001-present) and a Director of FMR Co., Inc. In addition, Mr. Johnson serves as Chairman and Director of Fidelity International Limited (FIL). |
James C. Curvey (72) |
| Year of Election or Appointment: 2007 Mr. Curvey also serves as Trustee (2007-present) or Member of the Advisory Board (2007-present) of other investment companies advised by FMR. Mr. Curvey is a Director of FMR and FMR Co., Inc. (2007-
present). Mr. Curvey is also Vice Chairman (2006-present) and Director of FMR LLC. Mr. Curvey joined Fidelity in 1982 and served in numerous senior management positions, including President and Chief Operating Officer of FMR LLC (1997-2000) and President of Fidelity Strategic Investments (2000-2002). In addition, he serves as a member of the Board of Directors of Geerlings & Wade, Inc. (wine distribution). |
* Trustees have been determined to be "Interested Trustees" by virtue of, among other things, their affiliation with the trust or various entities under common control with FMR. FMR Corp. merged with FMR LLC on October 1, 2007. Any references to FMR LLC for prior periods are deemed to be references to the prior entity.
Independent Trustees:
Correspondence intended for each Independent Trustee (that is, the Trustees other than the Interested Trustees) may be sent to Fidelity Investments, P.O. Box 55235, Boston, Massachusetts 02205-5235.
Name, Age; Principal Occupation |
Dennis J. Dirks (59) |
| Year of Election or Appointment: 2005 Prior to his retirement in May 2003, Mr. Dirks was Chief Operating Officer and a member of the Board of The Depository Trust & Clearing Corporation (DTCC) (1999-2003). He also served as President, Chief Operating Officer, and Board member of The Depository Trust Company (DTC) (1999-2003) and President and Board member of the National Securities Clearing Corporation (NSCC) (1999-2003). In addition, Mr. Dirks served as Chief Executive Officer and Board member of the Government Securities Clearing Corporation (2001-2003) and Chief Executive Officer and Board member of the Mortgage-Backed Securities Clearing Corporation (2001-2003). Mr. Dirks also serves as a Trustee and a member of the Finance Committee of Manhattan College (2005-present) and a Trustee and a member of the Finance Committee of AHRC of Nassau County (2006-present). |
Albert R. Gamper, Jr. (65) |
| Year of Election or Appointment: 2006 Prior to his retirement in December 2004, Mr. Gamper served as Chairman of the Board of CIT Group Inc. (commercial finance). During his tenure with CIT Group Inc. Mr. Gamper served in numerous senior management positions, including Chairman (1987-1989; 1999-2001; 2002-2004), Chief Executive Officer (1987-2004), and President (1989-2002). He currently serves as a member of the Board of Directors of Public Service Enterprise Group (utilities, 2001-present), Chairman of the Board of Governors, Rutgers University (2004-present), and Chairman of the Board of Saint Barnabas Health Care System. |
George H. Heilmeier (71) |
| Year of Election or Appointment: 2004 Dr. Heilmeier is Chairman Emeritus of Telcordia Technologies (communication software and systems), where prior to his retirement, he served as company Chairman and Chief Executive Officer. He currently serves on the Boards of Directors of The Mitre Corporation (systems engineering and information technology support for the government), and HRL Laboratories (private research and development, 2004-present). He is Chairman of the General Motors Science & Technology Advisory Board and a Life Fellow of the Institute of Electrical and Electronics Engineers (IEEE). Dr. Heilmeier is a member of the Defense Science Board and the National Security Agency Advisory Board. He is also a member of the National Academy of Engineering, the American Academy of Arts and Sciences, and the Board of Overseers of the School of Engineering and Applied Science of the University of Pennsylvania. Previously, Dr. Heilmeier served as a Director of TRW Inc. (automotive, space, defense, and information technology, 1992-2002), Compaq (1994-2002), Automatic Data Processing, Inc. (ADP) (technology-based business outsourcing, 1995-2002), INET Technologies Inc. (telecommunications network surveillance, 2001-2004), and Teletech Holdings (customer management services). He is the recipient of the 2005 Kyoto Prize in Advanced Technology for his invention of the liquid crystal display, and a member of the Consumer Electronics Hall of Fame. |
James H. Keyes (67) |
| Year of Election or Appointment: 2007 Prior to his retirement in 2003, Mr. Keyes was Chairman, President, and Chief Executive Officer of Johnson Controls, Inc. (automotive supplier, 1993-2003). He currently serves as a member of the boards of LSI Logic Corporation (semiconductor technologies), Navistar International Corporation (manufacture and sale of trucks, buses, and diesel engines, 2002-present), and Pitney Bowes, Inc. (integrated mail, messaging, and document management solutions). |
Marie L. Knowles (61) |
| Year of Election or Appointment: 2001 Prior to Ms. Knowles' retirement in June 2000, she served as Executive Vice President and Chief Financial Officer of Atlantic Richfield Company (ARCO) (diversified energy, 1996-2000). From 1993 to 1996, she was a Senior Vice President of ARCO and President of ARCO Transportation Company. She served as a Director of ARCO from 1996 to 1998. She currently serves as a Director of Phelps Dodge Corporation (copper mining and manufacturing) and McKesson Corporation (healthcare service, 2002-present). Ms. Knowles is a Trustee of the Brookings Institution and the Catalina Island Conservancy and also serves as a member of the Advisory Board for the School of Engineering of the University of Southern California. |
Ned C. Lautenbach (63) |
| Year of Election or Appointment: 2000 Mr. Lautenbach is Chairman of the Independent Trustees (2006-present). Mr. Lautenbach has been a partner of Clayton, Dubilier & Rice, Inc. (private equity investment firm) since September 1998. Previously, Mr. Lautenbach was with the International Business Machines Corporation (IBM) from 1968 until his retirement in 1998. Mr. Lautenbach serves as a Director of Sony Corporation (2006-present) and Eaton Corporation (diversified industrial) as well as the Philharmonic Center for the Arts in Naples, Florida. He also is a member of the Board of Trustees of Fairfield University (2005-present), as well as a member of the Council on Foreign Relations. |
Cornelia M. Small (63) |
| Year of Election or Appointment: 2005 Ms. Small is a member (2000-present) and Chairperson (2002-present) of the Investment Committee, and a member (2002-present) of the Board of Trustees of Smith College. Previously, she served as Chief Investment Officer (1999-2000), Director of Global Equity Investments (1996-1999), and a member of the Board of Directors of Scudder, Stevens & Clark (1990-1997) and Scudder Kemper Investments (1997-
1999). In addition, Ms. Small served as Co-Chair (2000-2003) of the Annual Fund for the Fletcher School of Law and Diplomacy. |
William S. Stavropoulos (68) |
| Year of Election or Appointment: 2001 Mr. Stavropoulos is Chairman Emeritus of the Board of Directors of The Dow Chemical Company. Since joining The Dow Chemical Company in 1967, Mr. Stavropoulos served in numerous senior management positions, including President (1993-2000; 2002-2003), CEO (1995-2000; 2002-2004), and Chairman of the Executive Committee (2000-2004). Currently, he is a Director of NCR Corporation (data warehousing and technology solutions), Chemical Financial Corporation, Maersk Inc. (industrial conglomerate, 2002-present), Tyco International, Inc. (multinational manufacturing and services, 2007-present), and a member of the Advisory Board for Metalmark Capital (private equity investment firm, 2005-present). He is a special advisor to Clayton, Dubilier & Rice, Inc., a private equity investment firm. He also serves as a member of the Board of Trustees of the American Enterprise Institute for Public Policy Research. In addition, Mr. Stavropoulos is a member of The Business Council, J.P. Morgan International Council and the University of Notre Dame Advisory Council for the College of Science. |
Kenneth L. Wolfe (68) |
| Year of Election or Appointment: 2005 Prior to his retirement in 2001, Mr. Wolfe was Chairman and Chief Executive Officer of Hershey Foods Corporation (1993-2001). He currently serves as a member of the boards of Adelphia Communications Corporation (2003-present), Bausch & Lomb, Inc., and Revlon Inc. (2004-present). |
Advisory Board Members and Executive Officers**:
Correspondence intended for Mr. Mauriello, Mr. Thomas, and Mr. Wiley may be sent to Fidelity Investments, P.O. Box 55235, Boston, Massachusetts 02205-5235. Correspondence intended for each executive officer and Mr. Lynch may be sent to Fidelity Investments, 82 Devonshire Street, Boston, Massachusetts 02109.
Name, Age; Principal Occupation |
Peter S. Lynch (63) |
| Year of Election or Appointment: 2003 Member of the Advisory Board of Fidelity Investment Trust. Mr. Lynch is Vice Chairman and a Director of FMR, and Vice Chairman (2001-
present) and a Director of FMR Co., Inc. Previously, Mr. Lynch served as a Trustee of the Fidelity funds (1990-2003). In addition, he serves as a Trustee of Boston College and as the Chairman of the Inner-City Scholarship Fund. |
Joseph Mauriello (63) |
| Year of Election or Appointment: 2007 Member of the Advisory Board of Fidelity Investment Trust. Prior to his retirement in January 2006, Mr. Mauriello served in numerous senior management positions including Deputy Chairman and Chief Operating Officer (2004-2005), and Vice Chairman of Financial Services (2002-2004) of KPMG LLP US (professional services firm, 1965-2005). Mr. Mauriello currently serves as a member of the Board of Directors of XL Capital Ltd., (global insurance and re-insurance company, 2006-present) and of Arcadia Resources Inc., (health care services and products, 2007-present). He also served as a Director of the Hamilton Funds of the Bank of New York (2006-2007). |
David M. Thomas (58) |
| Year of Election or Appointment: 2007 Member of the Advisory Board of Fidelity Investment Trust. Previously, Mr. Thomas served as Executive Chairman (2005-2006) and Chairman and Chief Executive Officer (2000-2005) of IMS Health, Inc. (pharmaceutical and healthcare information solutions). In addition, Mr. Thomas serves as a member of the Board of Directors of Fortune Brands, Inc. (consumer products holding company), and Interpublic Group of Companies, Inc. (marketing communication, 2004-present). |
Michael E. Wiley (57) |
| Year of Election or Appointment: 2007 Member of the Advisory Board of Fidelity Investment Trust. Mr. Wiley also serves as Sr. Energy Advisor of Katzenbach Partners, LLC (consulting firm, 2006-present) and a member of the Board of Trustees of the University of Tulsa (2000-2006; 2007-present). He serves as a Director of Tesoro Corporation (independent oil refiner and marketer, 2005-
present), and a Director of Bill Barrett Corporation (exploration and production company, 2005-present). In addition, he also serves as a Director of Post Oak Bank (privately-held bank, 2004-present), and an Advisory Director of Riverstone Holdings (private investment firm). Previously, Mr. Wiley served as Chairman, President, and CEO of Baker Hughes, Inc. (oilfield services company, 2000-2004), and as Director of Spinnaker Exploration Company (exploration and production company, 2001-2005). |
Kimberley H. Monasterio (43) |
| Year of Election or Appointment: 2007 President and Treasurer of International Value. Ms. Monasterio also serves as President and Treasurer of other Fidelity funds (2007-present) and is an employee of FMR (2004-present). Previously, Ms. Monasterio served as Deputy Treasurer of the Fidelity funds (2004-2006). Before joining Fidelity Investments, Ms. Monasterio served as Treasurer (2000-2004) and Chief Financial Officer (2002-2004) of the Franklin Templeton Funds and Senior Vice President of Franklin Templeton Services, LLC (2000-2004). |
Walter C. Donovan (45) |
| Year of Election or Appointment: 2007 Vice President of International Value. Mr. Donovan also serves as Vice President of Fidelity's Equity Funds (2007-present). Mr. Donovan also serves as Executive Vice President of FMR (2005-present) and FMR Co., Inc. (2005-present). Previously, Mr. Donovan served as Vice President of Fidelity's High Income Funds (2005-2007), Fixed-Income Funds (2005-
2006), certain Asset Allocation Funds (2005-2006), certain Balanced Funds (2005-2006), and as Vice President and Director of Fidelity's International Equity Trading group (1998-2005). |
Eric M. Wetlaufer (45) |
| Year of Election or Appointment: 2006 Vice President of International Value. Mr. Wetlaufer also serves as Vice President of certain International Equity Funds (2006-present). Mr. Wetlaufer is Senior Vice President of FMR (2006-present) and FMR Co., Inc. (2006-present), and President and Director of Fidelity Management & Research (U.K.) Inc. (2006-present) and Fidelity Research & Analysis Company (2006-present). Before joining Fidelity Investments in 2005, Mr. Wetlaufer was a partner in Oxhead Capital Management (2004-2005). Previously, Mr. Wetlaufer served as a Chief Investment Officer of Putnam Investments (1997-2003). |
Eric D. Roiter (58) |
| Year of Election or Appointment: 2006 Secretary of International Value. He also serves as Secretary of other Fidelity funds; Vice President, General Counsel, and Secretary of FMR Co., Inc. (2001-present) and FMR; Assistant Secretary of Fidelity Management & Research (U.K.) Inc. (2001-present), Fidelity Research & Analysis Company (2001-present), and Fidelity Investments Money Management, Inc. (2001-present). Mr. Roiter is an Adjunct Member, Faculty of Law, at Boston College Law School (2003-present). Previously, Mr. Roiter served as Vice President and Secretary of Fidelity Distributors Corporation (FDC) (1998-2005). |
Scott C. Goebel (39) |
| Year of Election or Appointment: 2007 Assistant Secretary of International Value. Mr. Goebel also serves as Assistant Secretary of other Fidelity funds (2007-present), and is an employee of FMR. |
R. Stephen Ganis (41) |
| Year of Election or Appointment: 2006 Anti-Money Laundering (AML) officer of International Value. Mr. Ganis also serves as AML officer of other Fidelity funds (2006-present) and FMR LLC (2003-present). Before joining Fidelity Investments, Mr. Ganis practiced law at Goodwin Procter, LLP (2000-2002). |
Joseph B. Hollis (59) |
| Year of Election or Appointment: 2006 Chief Financial Officer of International Value. Mr. Hollis also serves as Chief Financial Officer of other Fidelity funds. Mr. Hollis is President of Fidelity Pricing and Cash Management Services (FPCMS) (2005-
present). Mr. Hollis also serves as President and Director of Fidelity Service Company, Inc. (2006-present). Previously, Mr. Hollis served as Senior Vice President of Cash Management Services (1999-2002) and Investment Management Operations (2002-2005). |
Kenneth A. Rathgeber (60) |
| Year of Election or Appointment: 2006 Chief Compliance Officer of International Value. Mr. Rathgeber also serves as Chief Compliance Officer of other Fidelity funds (2004-
present) and Executive Vice President of Risk Oversight for Fidelity Investments (2002-present). He is Chief Compliance Officer of FMR (2005-present), FMR Co., Inc. (2005-present), Fidelity Management & Research (U.K.) Inc. (2005-present), Fidelity Research & Analysis Company (2005-present), Fidelity Investments Money Management, Inc. (2005-present), and Strategic Advisers, Inc. (2005-present). Previously, Mr. Rathgeber served as Executive Vice President and Chief Operating Officer for Fidelity Investments Institutional Services Company, Inc. (1998-2002). |
Bryan A. Mehrmann (46) |
| Year of Election or Appointment: 2006 Deputy Treasurer of International Value. Mr. Mehrmann also serves as Deputy Treasurer of other Fidelity funds (2005-present) and is an employee of FMR. Previously, Mr. Mehrmann served as Vice President of Fidelity Investments Institutional Services Group (FIIS)/Fidelity Investments Institutional Operations Corporation, Inc. (FIIOC) Client Services (1998-2004). |
Kenneth B. Robins (38) |
| Year of Election or Appointment: 2006 Deputy Treasurer of International Value. Mr. Robins also serves as Deputy Treasurer of other Fidelity funds (2005-present) and is an employee of FMR (2004-present). Before joining Fidelity Investments, Mr. Robins worked at KPMG LLP, where he was a partner in KPMG's department of professional practice (2002-2004) and a Senior Manager (1999-2000). In addition, Mr. Robins served as Assistant Chief Accountant, United States Securities and Exchange Commission (2000-2002). |
Robert G. Byrnes (40) |
| Year of Election or Appointment: 2006 Assistant Treasurer of International Value. Mr. Byrnes also serves as Assistant Treasurer of other Fidelity funds (2005-present) and is an employee of FMR (2005-present). Previously, Mr. Byrnes served as Vice President of FPCMS (2003-2005). Before joining Fidelity Investments, Mr. Byrnes worked at Deutsche Asset Management where he served as Vice President of the Investment Operations Group (2000-2003). |
Peter L. Lydecker (53) |
| Year of Election or Appointment: 2006 Assistant Treasurer of International Value. Mr. Lydecker also serves as Assistant Treasurer of other Fidelity funds (2004) and is an employee of FMR. |
Paul M. Murphy (60) |
| Year of Election or Appointment: 2007 Assistant Treasurer of International Value. Mr. Murphy also serves as Assistant Treasurer of other Fidelity funds (2007-present) and is an employee of FMR (2007-present). Previously, Mr. Murphy served as Chief Financial Officer of the Fidelity Funds (2005-2006), Vice President and Associate General Counsel of FMR (2007), and Senior Vice President of Fidelity Pricing and Cash Management Services Group (FPCMS) (1994-2007). |
Gary W. Ryan (49) |
| Year of Election or Appointment: 2006 Assistant Treasurer of International Value. Mr. Ryan also serves as Assistant Treasurer of other Fidelity funds (2005-present) and is an employee of FMR (2005-present). Previously, Mr. Ryan served as Vice President of Fund Reporting in FPCMS (1999-2005). |
** FMR Corp. merged with FMR LLC on October 1, 2007. Any references to FMR LLC for prior periods are deemed to be references to the prior entity.
Annual Report
Distributions
The Board of Trustees of Fidelity International Value Fund voted to pay on December 10, 2007, to shareholders of record at the opening of business on December 7, 2007, a distribution of $0.62 per share derived from capital gains realized from sales of portfolio securities and a dividend of $0.188 per share from net investment income.
The fund hereby designates as a capital gain dividend with respect to the taxable year ended October 31, 2007, $10,388,114 or, if subsequently determined to be different, the net capital gain of such year.
The fund designates 97% of the dividends distributed in December 2006 during the fiscal year as amounts which may be taken into account as a dividend for the purposes of the maximum rate under section 1(h)(11) of the Internal Revenue Code.
The amounts per share which represent income derived from sources within, and taxes paid to, foreign countries or possessions of the United States are as follows:
| Pay Date | Income | Taxes |
International Value Fund | 12/11/2006 | $0.016 | $0.0029 |
The fund will notify shareholders in January 2008 of amounts for use in preparing 2007 income tax returns.
Annual Report
Board Approval of Investment Advisory Contracts and Management Fees
Fidelity International Value Fund
Each year, typically in July, the Board of Trustees, including the Independent Trustees (together, the Board), votes on the renewal of the management contract and sub-advisory agreements (together, the Advisory Contracts) for the fund. The Board, assisted by the advice of fund counsel and Independent Trustees' counsel, requests and considers a broad range of information throughout the year.
The Board meets regularly each month except August and takes into account throughout the year matters bearing on Advisory Contracts. The Board, acting directly and through its separate committees, considers at each of its meetings factors that are relevant to the annual renewal of the fund's Advisory Contracts, including the services and support provided to the fund and its shareholders. At the time of the renewal, the Board had 12 standing committees, each composed of Independent Trustees with varying backgrounds, to which the Board has assigned specific subject matter responsibilities in order to enhance effective decision-making by the Board. Each committee has adopted a written charter outlining the structure and purposes of the committee. One such committee, the Equity Contract Committee, meets periodically as needed throughout the year to consider matters specifically related to the annual renewal of Advisory Contracts. The committee requests and receives information on, and makes recommendations to the Independent Trustees concerning, the approval and annual review of the Advisory Contracts.
At its July 2007 meeting, the Board of Trustees, including the Independent Trustees, unanimously determined to renew the Advisory Contracts for the fund. In reaching its determination, the Board considered all factors it believed relevant, including (i) the nature, extent, and quality of the services to be provided to the fund and its shareholders (including the investment performance of the fund); (ii) the competitiveness of the management fee and total expenses of the fund; (iii) the total costs of the services to be provided by and the profits to be realized by the investment adviser and its affiliates from the relationship with the fund; (iv) the extent to which economies of scale would be realized as the fund grows; and (v) whether fee levels reflect these economies of scale, if any, for the benefit of fund shareholders. The Board also approved amendments to the fund's agreements with foreign sub-advisers to clarify that each sub-adviser provides services as an independent contractor.
In determining whether to renew the Advisory Contracts for the fund, the Board ultimately reached a determination, with the assistance of fund counsel and Independent Trustees' counsel, that the renewal of the Advisory Contracts and the compensation to be received by Fidelity under the management contract is consistent with Fidelity's fiduciary duty under applicable law. In addition to evaluating the specific factors noted above, the Board, in reaching its determination, is aware that shareholders in the fund have a broad range of investment choices available to them, including a wide choice among mutual funds offered by competitors to Fidelity, and that the fund's shareholders, with the opportunity to review and weigh the disclosure provided by the fund in its prospectus and other public disclosures, have chosen to invest in this fund, managed by Fidelity.
Annual Report
Nature, Extent, and Quality of Services Provided. The Board considered staffing within the investment adviser, FMR, and the sub-advisers (together, the Investment Advisers), including the background of the fund's portfolio manager and the fund's investment objective and discipline. The Independent Trustees also had discussions with senior management of Fidelity's investment operations and investment groups. The Board considered the structure of the portfolio manager compensation program and whether this structure provides appropriate incentives.
Resources Dedicated to Investment Management and Support Services. The Board reviewed the size, education, and experience of the Investment Advisers' investment staff, their use of technology, and the Investment Advisers' approach to recruiting, training, and retaining portfolio managers and other research, advisory, and management personnel. The Board considered Fidelity's extensive global research capabilities that enable the Investment Advisers to aggregate data from various sources in an effort to produce positive investment results. The Board noted that Fidelity's analysts have access to a variety of technological tools that enable them to perform both fundamental and quantitative analysis and to specialize in various disciplines. The Board also considered that Fidelity's portfolio managers and analysts have access to daily portfolio attribution that allows for monitoring of a fund's portfolio, as well as an electronic communication system that provides immediate real-time access to research concerning issuers and credit enhancers.
Shareholder and Administrative Services. The Board considered (i) the nature, extent, quality, and cost of advisory, administrative, distribution, and shareholder services performed by the Investment Advisers and their affiliates under the Advisory Contracts and under separate agreements covering transfer agency, pricing and bookkeeping, and securities lending services for the fund; (ii) the nature and extent of the Investment Advisers' supervision of third party service providers, principally custodians and subcustodians; and (iii) the resources devoted to, and the record of compliance with, the fund's compliance policies and procedures. The Board reviewed the allocation of fund brokerage, including allocations to brokers affiliated with the Investment Advisers, the use of brokerage commissions to pay fund expenses, and the use of "soft" commission dollars to pay for research services. The Board also considered that Fidelity voluntarily pays for market data out of its own resources.
The Board noted that the growth of fund assets across the complex allows Fidelity to reinvest in the development of services designed to enhance the value or convenience of the Fidelity funds as investment vehicles. These services include 24-hour access to account information and market information through phone representatives and over the Internet, and investor education materials and asset allocation tools.
Annual Report
Board Approval of Investment Advisory Contracts and
Management Fees - continued
Investment in a Large Fund Family. The Board considered the benefits to shareholders of investing in a Fidelity fund, including the benefits of investing in a fund that is part of a large family of funds offering a variety of investment disciplines and providing for a large variety of mutual fund investor services. For example, fund shareholders are offered the privilege of exchanging shares of the fund for shares of other Fidelity funds, as set forth in the fund's prospectus, without paying a sales charge. The Board noted that, since July 2006, Fidelity has taken a number of actions that benefited particular funds, including (i) dedicating additional resources to investment research and to restructure the investment research teams; (ii) contractually agreeing to reduce the management fee on Fidelity Advisor Floating Rate High Income Fund; (iii) contractually agreeing to reduce the management fees on Fidelity's California, Massachusetts, New Jersey, and New York AMT Tax-Free Money Market Funds, launching new Institutional Classes and Service Classes of these funds, and contractually agreeing to impose expense limitations on these funds; (iv) eliminating the exchange fee on the Fidelity Select Portfolios and reducing the pricing and bookkeeping fee rates for these funds; (v) reducing the maximum transfer agency fee rates on high income funds and certain equity funds; (vi) proposing amended management contracts that, if approved by shareholders, will add a performance adjustment component to the management fees paid by 18 Fidelity Advisor equity funds; (vii) contractually agreeing to reduce fees for Ultra-Short Central Fund and the money market Central Funds; (viii) waiving the Fidelity Advisor funds' contingent deferred sales charge on certain redemptions made through systematic withdrawal programs; and (ix) amending the management contracts for equity and fixed-income funds whose management contracts incorporate a "group fee" structure by adding four new fee "breakpoints" to the group fee rate schedules.
Investment Performance and Compliance. The Board considered whether the fund has operated within its investment objective, as well as its record of compliance with its investment restrictions. The Board noted that it is not possible to evaluate performance in any comprehensive fashion because the fund had been in operation for less than one calendar year. Once the fund has been in operation for at least one calendar year, the Board will review the fund's absolute investment performance for each class, as well as the fund's relative investment performance for each class measured against a broad-based securities market index and a peer group of mutual funds.
The Board considered that FMR has taken steps to refocus and strengthen equity research, equity portfolio management, and compliance.
Based on its review, and giving particular weight to the nature and quality of the resources dedicated by the Investment Advisers to maintain and improve relative performance, the Board concluded that the nature, extent, and quality of the services provided to the fund will benefit the fund's shareholders, particularly in light of the Board's view that the fund's shareholders benefit from investing in a fund that is part of a large family of funds offering a variety of investment disciplines and services.
Annual Report
Competitiveness of Management Fee and Total Fund Expenses. The Board considered the fund's management fee and total expenses compared to "mapped groups" of competitive funds and classes. Fidelity creates "mapped groups" by combining similar Lipper investment objective categories that have comparable management fee characteristics. Combining Lipper investment objective categories aids the Board's management fee and total expense comparisons by broadening the competitive group used for comparison and by reducing the number of universes to which various Fidelity funds are compared. The Board also considered supplemental information about how the fund's management fee and total expenses ranked relative to groups based on Lipper classifications, which take into account a fund's market capitalization and style.
The Board considered two proprietary management fee comparisons for the period of the fund's operations shown in the chart below. The group of Lipper funds used by the Board for management fee comparisons is referred to below as the "Total Mapped Group." The Total Mapped Group comparison focuses on a fund's standing relative to the total universe of comparable funds available to investors, in terms of gross management fees before expense reimbursements or caps. "TMG %" represents the percentage of funds in the Total Mapped Group that had management fees that were lower than the fund's. For example, a TMG % of 15% means that 85% of the funds in the Total Mapped Group had higher management fees than the fund. The "Asset-Size Peer Group" (ASPG) comparison focuses on a fund's standing relative to non-Fidelity funds similar in size to the fund within the Total Mapped Group. The ASPG represents at least 15% of the funds in the Total Mapped Group with comparable asset size and management fee characteristics, subject to a minimum of 50 funds (or all funds in the Total Mapped Group if fewer than 50). Additional information, such as the ASPG quartile in which the fund's management fee ranked, is also included in the chart and considered by the Board.
Annual Report
Board Approval of Investment Advisory Contracts and
Management Fees - continued
Fidelity International Value Fund
The Board noted that the fund's management fee ranked below the median of its Total Mapped Group and below the median of its ASPG for the period.
Based on its review, the Board concluded that the fund's management fee was fair and reasonable in light of the services that the fund receives and the other factors considered.
In its review of each class's total expenses, the Board considered the fund's management fee as well as other fund or class expenses, as applicable, such as transfer agent fees, pricing and bookkeeping fees, fund-paid 12b-1 fees, and custodial, legal, and audit fees. The Board also noted the effects of any waivers and reimbursements on fees and expenses. As part of its review, the Board also considered current and historical total expenses of each class of the fund compared to competitive fund median expenses. Each class of the fund is compared to those funds and classes in the Total Mapped Group (used by the Board for management fee comparisons) that have a similar sales load structure.
The Board noted that the total expenses of each of Class A and Fidelity International Value (retail class) ranked below its competitive median for the period, the total expenses of each of Class B and Class C ranked equal to its competitive median for the period, and the total expenses of each of Class T and Institutional Class ranked above its competitive median for the period. The Board noted that the fund offers multiple classes, each of which has a different sales load and 12b-1 fee structure, and that the multiple structures are intended to offer a range of pricing options for the intermediary market. The Board also noted that the total expenses of the classes vary primarily by the level of their 12b-1 fees, although differences in transfer agent fees may also cause expenses to vary from class to class.
Annual Report
In its review of total expenses, the Board also considered Fidelity fee structures and other information on clients that FMR and its affiliates service in other competitive markets, such as other mutual funds advised or subadvised by FMR or its affiliates, pension plan clients, and other institutional clients.
Based on its review, the Board concluded that the total expenses of each class of the fund were reasonable, although in some cases above the median of the universe presented for comparison, in light of the services that the fund and its shareholders receive and the other factors considered.
Costs of the Services and Profitability. The Board considered the revenues earned and the expenses incurred by Fidelity in conducting the business of developing, marketing, distributing, managing, administering and servicing the fund and its shareholders. The Board also considered the level of Fidelity's profits in respect of all the Fidelity funds.
On an annual basis, FMR presents to the Board Fidelity's profitability for the fund. Fidelity calculates the profitability for each fund, as well as aggregate profitability for groups of Fidelity funds and all Fidelity funds, using a series of detailed revenue and cost allocation methodologies which originate with the audited books and records of Fidelity. The Audit Committee of the Board reviews any significant changes from the prior year's methodologies.
PricewaterhouseCoopers LLP (PwC), independent registered public accounting firm and auditor to Fidelity and certain Fidelity funds, has been engaged annually by the Board as part of the Board's assessment of the results of Fidelity's profitability analysis. PwC's engagement includes the review and assessment of Fidelity's methodologies used in determining the revenues and expenses attributable to Fidelity's mutual fund business, and completion of agreed-upon procedures surrounding the mathematical accuracy of fund profitability and its conformity to allocation methodologies. After considering PwC's reports issued under the engagement and information provided by Fidelity, the Board believes that while other allocation methods may also be reasonable, Fidelity's profitability methodologies are reasonable in all material respects.
The Board has also reviewed Fidelity's non-fund businesses and any fall-out benefits related to the mutual fund business as well as cases where Fidelity's affiliates may benefit from or be related to the fund's business.
The Board considered the costs of the services provided by and the profits realized by Fidelity in connection with the operation of the fund and determined that the amount of profit is a fair entrepreneurial profit for the management of the fund.
Economies of Scale. The Board considered whether there have been economies of scale in respect of the management of the Fidelity funds, whether the Fidelity funds (including the fund) have appropriately benefited from any such economies of scale, and whether there is potential for realization of any further economies of scale. The Board considered the extent to which the fund will benefit from economies of scale through increased services to the fund, through waivers or reimbursements, or through fee or expense reductions, including reductions that occur through operation of the transfer agent agreement. The transfer agent fee varies in part based on the number of accounts in the fund. If the number of accounts decreases or the average account size increases, the overall transfer agent fee rate decreases.
Annual Report
Board Approval of Investment Advisory Contracts and
Management Fees - continued
The Board recognized that the fund's management contract incorporates a "group fee" structure, which provides for lower group fee rates as total fund assets under FMR's management increase, and for higher group fee rates as total fund assets under FMR's management decrease. FMR determines the group fee rates based on a tiered asset "breakpoint" schedule. In connection with the renewal of the fund's management contract, the Board approved amendments to the fund's management contract that added four new fee breakpoints to the group fee rate schedule for assets under FMR's management above $1,386 billion. The Board considered that the group fee rate declines under both the present and amended schedules, but that under the amended schedule, the group fee rate declines faster as assets under FMR's management exceed $1,386 billion. The Board considered that the group fee is designed to deliver the benefits of economies of scale to fund shareholders when total fund assets increase, even if assets of any particular fund are unchanged or have declined, because some portion of Fidelity's costs are attributable to services provided to all Fidelity funds, and all funds benefit if those costs can be allocated among more assets. The Board concluded that, given the group fee structure, fund shareholders will achieve a certain level of economies of scale as assets under FMR's management increase at the fund complex level, regardless of whether Fidelity achieves any such economies of scale.
The Board further concluded that any potential economies of scale are being shared between fund shareholders and Fidelity in an appropriate manner.
Additional Information Requested by the Board. In order to develop fully the factual basis for consideration of the Fidelity funds' Advisory Contracts, the Board requested and received additional information on several topics, including (i) fund performance trends and actions to be taken by FMR to improve certain funds' overall performance; (ii) Fidelity's portfolio manager compensation structure, including its effects on fund profitability and the extent to which portfolio manager compensation is linked to fund performance; (iii) Fidelity's fee structures; (iv) the funds' sub-advisory arrangements; and (v) accounts managed by Fidelity other than the Fidelity funds.
Based on its evaluation of all of the conclusions noted above, and after considering all material factors, the Board ultimately concluded that the advisory fee structures are fair and reasonable, and that the fund's Advisory Contracts should be renewed.
Annual Report
Managing Your Investments
Fidelity offers several ways to conveniently manage your personal investments via your telephone or PC. You can access your account information, conduct trades and research your investments 24 hours a day.
By Phone
Fidelity Automated Service Telephone provides a single toll-free number to access account balances, positions, quotes and trading. It's easy to navigate the service, and on your first call, the system will help you create a personal identification number (PIN) for security.
(phone_graphic)
Fidelity Automated
Service Telephone (FAST®)
1-800-544-5555
Press
1 For mutual fund and brokerage trading.
2 For quotes.*
3 For account balances and holdings.
4 To review orders and mutual
fund activity.
5 To change your PIN.
*0 To speak to a Fidelity representative.
By PC
Fidelity's web site on the Internet provides a wide range of information, including daily financial news, fund performance, interactive planning tools and news about Fidelity products and services.
(computer_graphic)
Fidelity's Web Site
www.fidelity.com
* When you call the quotes line, please remember that a fund's yield and return will vary and, except for money market funds, share price will also vary. This means that you may have a gain or loss when you sell your shares. There is no assurance that money market funds will be able to maintain a stable $1 share price; an investment in a money market fund is not insured or guaranteed by the U.S. government. Total returns are historical and include changes in share price, reinvestment of dividends and capital gains, and the effects of any sales charges.
Annual Report
Investment Adviser
Fidelity Management & Research Company
Boston, MA
Investment Sub-Advisers
FMR Co., Inc.
Fidelity Management & Research
(U.K.) Inc.
Fidelity Research & Analysis Company
Fidelity International Investment
Advisors
Fidelity Investments Japan Limited
Fidelity International Investment
Advisors (U.K.) Limited
General Distributor
Fidelity Distributors Corporation
Boston, MA
Transfer and Service Agent
Fidelity Service Company, Inc.
Boston, MA
Custodian
The Northern Trust Company
Chicago, Illinois
The Fidelity Telephone Connection
Mutual Fund 24-Hour Service
Exchanges/Redemptions
and Account Assistance 1-800-544-6666
Product Information 1-800-544-8888
Retirement Accounts 1-800-544-4774
(8 a.m. - 9 p.m.)
TDD Service 1-800-544-0118
for the deaf and hearing impaired
(9 a.m. - 9 p.m. Eastern time)
Fidelity Automated Service
Telephone (FAST®) (automated graphic) 1-800-544-5555
(automated graphic) Automated line for quickest service
FIV-UANN-1207
1.827481.101
(Fidelity Investment logo)(registered trademark)
Corporate Headquarters
82 Devonshire St., Boston, MA 02109
www.fidelity.com
(Fidelity Investment logo)(registered trademark)
Fidelity Advisor
International Value
Fund - Class A, Class T, Class B
and Class C
Annual Report
October 31, 2007
Class A, Class T, Class B, and Class C are classes of Fidelity® International Value Fund
(2_fidelity_logos) (Registered_Trademark)
Contents
Chairman's Message | <Click Here> | Ned Johnson's message to shareholders. |
Performance | <Click Here> | How the fund has done over time. |
Management's Discussion | <Click Here> | The manager's review of fund performance, strategy and outlook. |
Shareholder Expense Example | <Click Here> | An example of shareholder expenses. |
Investment Changes | <Click Here> | A summary of major shifts in the fund's investments over the past six months. |
Investments | <Click Here> | A complete list of the fund's investments with their market values. |
Financial Statements | <Click Here> | Statements of assets and liabilities, operations, and changes in net assets,
as well as financial highlights. |
Notes | <Click Here> | Notes to the financial statements. |
Report of Independent Registered Public Accounting Firm | <Click Here> | |
Trustees and Officers | <Click Here> | |
Distributions | <Click Here> | |
Board Approval of Investment Advisory Contracts and Management Fees | <Click Here> | |
To view a fund's proxy voting guidelines and proxy voting record for the 12-month period ended June 30, visit http://www.fidelity.com (search for "proxy voting guidelines") or visit the Securities and Exchange Commission's (SEC) web site at http://www.sec.gov. You may also call 1-877-208-0098 to request a free copy of the proxy voting guidelines.
Standard & Poor's, S&P and S&P 500 are registered service marks of The McGraw-Hill Companies, Inc. and have been licensed for use by Fidelity Distributors Corporation.
Other third party marks appearing herein are the property of their respective owners.
All other marks appearing herein are registered or unregistered trademarks or service marks of FMR LLC or an affiliated company.
Annual Report
This report and the financial statements contained herein are submitted for the general information of the shareholders of the fund. This report is not authorized for distribution to prospective investors in the fund unless preceded or accompanied by an effective prospectus.
A fund files its complete schedule of portfolio holdings with the SEC for the first and third quarters of each fiscal year on Form N-Q. Forms N-Q are available on the SEC's web site at http://www.sec.gov. A fund's Forms N-Q may be reviewed and copied at the SEC's Public Reference Room in Washington, DC. Information regarding the operation of the SEC's Public Reference Room may be obtained by calling 1-800-SEC-0330. For a complete list of a fund's portfolio holdings, view the most recent holdings listing, semiannual report, or annual report on Fidelity's web site at http://www.fidelity.com or http://www.advisor.fidelity.com, as applicable.
NOT FDIC INSURED · MAY LOSE VALUE · NO BANK GUARANTEE
Neither the fund nor Fidelity Distributors Corporation is a bank.
Annual Report
Chairman's Message
(photo_of_Edward_C_Johnson_3d)
Dear Shareholder:
Many stock and bond markets around the world have been unsettled of late; however, volatility can often lead to opportunity for patient investors. Financial markets are always unpredictable, but there are a number of time-tested principles that can put the historical odds in your favor.
One of the basic tenets is to invest for the long term. Over time, riding out the markets' inevitable ups and downs has proven much more effective than selling into panic or chasing the hottest trend. Even missing only a few of the markets' best days can significantly diminish investor returns. Patience also affords the benefits of compounding - of earning interest on additional income or reinvested dividends and capital gains. There are tax advantages and cost benefits to consider as well. The more you sell, the more taxes you pay, and the more you trade, the higher the costs. While staying the course doesn't eliminate risk, it can considerably lessen the effect of short-term declines.
You can further manage your investing risk through diversification. And today, more than ever, geographic diversification should be taken into account. Studies indicate that asset allocation is the single most important determinant of a portfolio's long-term success. The right mix of stocks, bonds and cash - aligned to your particular risk tolerance and investment objective - is very important. Age-appropriate rebalancing is also an essential aspect of asset allocation. For younger investors, an emphasis on equities - which historically have been the best-performing asset class over time - is encouraged. As investors near their specific goal, such as retirement or sending a child to college, consideration may be given to replacing volatile assets (e.g. common stocks) with more-stable fixed investments (bonds or savings plans).
A third investment principle - investing regularly - can help lower the average cost of your purchases. Investing a certain amount of money each month or quarter helps ensure you won't pay for all your shares at market highs. This strategy - known as dollar cost averaging - also reduces unconstructive "emotion" from investing, helping shareholders avoid selling weak performers just prior to an upswing, or chasing a hot performer just before a correction.
We invite you to contact us via the Internet, through our Investor Centers or over the phone. It is our privilege to provide you the information you need to make the investments that are right for you.
Sincerely,
/s/Edward C. Johnson 3d
Edward C. Johnson 3d
Annual Report
Performance: The Bottom Line
Average annual total return reflects the change in the value of an investment, assuming reinvestment of the fund's dividend income and capital gains (the profits earned upon the sale of securities that have grown in value) and assuming a constant rate of performance each year. The $10,000 table and the fund's returns do not reflect the deduction of taxes that a shareholder would pay on fund distributions or the redemption of fund shares. During periods of reimbursement by Fidelity, a fund's total return will be greater than it would be had the reimbursement not occurred. How a fund did yesterday is no guarantee of how it will do tomorrow.
Average Annual Total Returns
Periods ended October 31, 2007 | Past 1
year | Life of
fund A |
Class A (incl. 5.75% sales charge) | 16.33% | 15.49% |
Class T (incl. 3.50% sales charge) | 18.82% | 17.11% |
Class B (incl. contingent deferred sales charge)B | 17.59% | 16.87% |
Class C (incl. contingent deferred sales charge)C | 21.56% | 19.40% |
A From May 18, 2006.
B Class B shares' contingent deferred sales charges included in the past one year and life of fund total return figures are 5% and 4%, respectively.
C Class C shares' contingent deferred sales charges included in the past one year and life of fund total return figures are 1% and 0%, respectively.
Annual Report
Performance - continued
$10,000 Over Life of Fund
Let's say hypothetically that $10,000 was invested in Fidelity Advisor International Value Fund - Class T on May 18, 2006, when the fund started, and the current 3.50% sales charge was paid. The chart shows how the value of your investment would have changed, and also shows how the Morgan Stanley Capital InternationalSM Europe, Australasia, Far East (MSCI® EAFE®) Value Index performed over the same period.
Annual Report
Management's Discussion of Fund Performance
Comments from George Stairs, Portfolio Manager of Fidelity Advisor International Value Fund
Foreign stocks, with a large assist from a weak U.S. dollar, generally had higher returns for U.S. investors than domestic equities during the 12-month period ending October 31, 2007. The backdrop for global stocks was solid, with robust economic growth and relatively high corporate profitability worldwide. Developed international equity markets, as measured by the Morgan Stanley Capital InternationalSM Europe, Australasia, and Far East (MSCI® EAFE®) Index - a performance monitor of established markets outside the United States and Canada - rose 25.09%. In comparison, the Standard & Poor's 500SM Index, a gauge of U.S. stocks, was up 14.56%. Among countries making up at least 1% of the EAFE benchmark, Finland had the best showing, soaring nearly 69%, while Hong Kong gained roughly 66%. The United Kingdom and Japan, the two largest components of the index, both underperformed. Fallout from the credit crunch and concerns about export growth tempered UK stocks, while Japan struggled with a slowdown in consumer spending and sluggish domestic growth. Emerging markets were the period's big winners, advancing 68.33% as measured by the MSCI Emerging Markets index.
The fund's Class A, Class T, Class B and Class C shares performed well for the year, returning 23.43%, 23.13%, 22.59% and 22.56%, respectively (excluding sales charges). These gains solidly outpaced the 21.53% return of the benchmark MSCI EAFE Value index on the basis of productive stock picking across a variety of sectors. The best results came from within the energy, industrials, materials and utilities sectors, with good picks in consumer staples and consumer discretionary also helping. Geographically, our best results came from the Americas, mainly Brazil, Cayman Islands and Canada, with good picks in the European region as well, particularly in the United Kingdom and France. Among the top-performing stocks were Japanese trading firm Mitsui & Co.; UK-listed miner BHP Billiton; Brazilian energy producer Petrobras; and German electric utility E.ON. The fund's relative return was tempered by a few unfavorable picks in the financials sector, especially among banks, as well as by some weak holdings in the pharmaceuticals, biotechnology and life science segment of health care. Notable detractors included Japanese leasing and consumer lending firm ORIX; Japanese megabank Mizuho Financial; and an underweighted position in Dutch banking company ABN AMRO, which rose on takeover speculation. ABN AMRO was no longer in the portfolio at period end.
The views expressed above reflect those of the portfolio manager(s) only through the end of the period as stated on the cover of this report and do not necessarily represent the views of Fidelity or any other person in the Fidelity organization. Any such views are subject to change at any time based upon market or other conditions and Fidelity disclaims any responsibility to update such views. These views may not be relied on as investment advice and, because investment decisions for a Fidelity fund are based on numerous factors, may not be relied on as an indication of trading intent on behalf of any Fidelity fund.
Annual Report
Shareholder Expense Example
As a shareholder of the Fund, you incur two types of costs: (1) transaction costs, including sales charges (loads) on purchase payments or redemption proceeds, redemption fees, and (2) ongoing costs, including management fees, distribution and/or service (12b-1) fees and other Fund expenses. This Example is intended to help you understand your ongoing costs (in dollars) of investing in the Fund and to compare these costs with the ongoing costs of investing in other mutual funds.
The Example is based on an investment of $1,000 invested at the beginning of the period and held for the entire period (May 1, 2007 to October 31, 2007).
Actual Expenses
The first line of the accompanying table for each class of the Fund provides information about actual account values and actual expenses. You may use the information in this line, together with the amount you invested, to estimate the expenses that you paid over the period. Simply divide your account value by $1,000.00 (for example, an $8,600 account value divided by $1,000.00 = 8.6), then multiply the result by the number in the first line for a class of the Fund under the heading entitled "Expenses Paid During Period" to estimate the expenses you paid on your account during this period. A small balance maintenance fee of $12.00 that is charged once a year may apply for certain accounts with a value of less than $2,000. This fee is not included in the table below. If it was, the estimate of expenses you paid during the period would be higher, and your ending account value lower, by this amount. In addition, the Fund, as a shareholder in the underlying Fidelity Central Funds, will indirectly bear its pro rata share of the fees and expenses incurred by the underlying Fidelity Central Funds. These fees and expenses are not included in the Fund's annualized expense ratio used to calculate the expense estimate in the table below.
Hypothetical Example for Comparison Purposes
The second line of the accompanying table for each class of the Fund provides information about hypothetical account values and hypothetical expenses based on a Class' actual expense ratio and an assumed rate of return of 5% per year before expenses, which is not the Class' actual return. The hypothetical account values and expenses may not be used to estimate the actual ending account balance or expenses you paid for the period. You may use this information to compare the ongoing costs of investing in the Fund and other funds. To do so, compare this 5% hypothetical example with the 5% hypothetical examples that appear in the shareholder reports of the other funds. A small balance maintenance fee of $12.00 that is charged once a year may apply for certain accounts with a value of less than $2,000. This fee is not included in the table below. If it was, the estimate of expenses you paid during the period would be higher, and your ending account value lower, by this amount. In addition, the Fund, as a shareholder in the underlying Fidelity Central Funds, will indirectly bear its pro rata share of the fees and expenses incurred by the underlying Fidelity Central Funds. These fees and expenses are not included in the Fund's annualized expense ratio used to calculate the expense estimate in the table below.
Annual Report
Please note that the expenses shown in the table are meant to highlight your ongoing costs only and do not reflect any transaction costs. Therefore, the second line of the table is useful in comparing ongoing costs only, and will not help you determine the relative total costs of owning different funds. In addition, if these transactional costs were included, your costs would have been higher.
| Beginning
Account Value
May 1, 2007 | Ending
Account Value
October 31, 2007 | Expenses Paid
During Period*
May 1, 2007 to
October 31, 2007 |
Class A | | | |
Actual | $ 1,000.00 | $ 1,082.30 | $ 7.14 |
HypotheticalA | $ 1,000.00 | $ 1,018.35 | $ 6.92 |
Class T | | | |
Actual | $ 1,000.00 | $ 1,080.70 | $ 8.23 |
HypotheticalA | $ 1,000.00 | $ 1,017.29 | $ 7.98 |
Class B | | | |
Actual | $ 1,000.00 | $ 1,078.40 | $ 10.90 |
HypotheticalA | $ 1,000.00 | $ 1,014.72 | $ 10.56 |
Class C | | | |
Actual | $ 1,000.00 | $ 1,077.60 | $ 10.68 |
HypotheticalA | $ 1,000.00 | $ 1,014.92 | $ 10.36 |
International Value | | | |
Actual | $ 1,000.00 | $ 1,083.80 | $ 5.20 |
HypotheticalA | $ 1,000.00 | $ 1,020.21 | $ 5.04 |
Institutional Class | | | |
Actual | $ 1,000.00 | $ 1,083.70 | $ 4.83 |
HypotheticalA | $ 1,000.00 | $ 1,020.57 | $ 4.69 |
A 5% return per year before expenses
* Expenses are equal to each Class' annualized expense ratio (shown in the table below); multiplied by the average account value over the period, multiplied by 184/365 (to reflect the one-half year period).
| Annualized
Expense Ratio |
Class A | 1.36% |
Class T | 1.57% |
Class B | 2.08% |
Class C | 2.04% |
International Value | .99% |
Institutional Class | .92% |
Annual Report
Investment Changes
Geographic Diversification (% of fund's net assets) |
As of October 31, 2007 |
| Japan 18.8% | |
| United Kingdom 16.3% | |
| France 11.8% | |
| Germany 11.1% | |
| Switzerland 8.8% | |
| Spain 4.8% | |
| Cayman Islands 3.8% | |
| Norway 3.3% | |
| Australia 2.4% | |
| Other 18.9% | |

Percentages are adjusted for the effect of futures contracts, if applicable. |
|
As of April 30, 2007 |
| Japan 18.4% | |
| United Kingdom 16.5% | |
| France 11.3% | |
| Germany 10.9% | |
| Switzerland 9.6% | |
| Spain 4.5% | |
| United States of America 3.2% | |
| Netherlands 3.1% | |
| Australia 2.8% | |
| Other 19.7% | |

Percentages are adjusted for the effect of futures contracts, if applicable. |
Asset Allocation |
| % of fund's
net assets | % of fund's net assets
6 months ago |
Stocks | 98.9 | 97.0 |
Short-Term Investments and Net Other Assets | 1.1 | 3.0 |
Top Ten Stocks as of October 31, 2007 |
| % of fund's
net assets | % of fund's net assets
6 months ago |
E.ON AG (Germany, Electric Utilities) | 3.4 | 2.7 |
GlobalSantaFe Corp. (Cayman Islands, Energy Equipment & Services) | 2.5 | 1.9 |
Mitsui & Co. Ltd. (Japan, Trading Companies & Distributors) | 2.4 | 2.1 |
UBS AG (NY Shares) (Switzerland, Capital Markets) | 2.3 | 1.9 |
Toyota Motor Corp. (Japan, Automobiles) | 2.2 | 2.1 |
DaimlerChrysler AG (Germany, Automobiles) | 2.2 | 0.3 |
ING Groep NV sponsored ADR (Netherlands, Diversified Financial Services) | 2.2 | 2.4 |
AXA SA sponsored ADR (France, Insurance) | 2.2 | 2.0 |
Societe Generale Series A (France, Commercial Banks) | 2.1 | 2.7 |
Banco Santander Central Hispano SA (Spain, Commercial Banks) | 2.1 | 1.5 |
| 23.6 | |
Market Sectors as of October 31, 2007 |
| % of fund's
net assets | % of fund's net assets
6 months ago |
Financials | 37.2 | 40.0 |
Energy | 11.2 | 6.3 |
Industrials | 9.9 | 10.1 |
Consumer Discretionary | 9.7 | 8.6 |
Utilities | 7.7 | 6.3 |
Materials | 7.4 | 7.3 |
Consumer Staples | 5.1 | 6.6 |
Information Technology | 4.9 | 5.7 |
Health Care | 3.3 | 3.6 |
Telecommunication Services | 2.5 | 2.5 |
Annual Report
Investments October 31, 2007
Showing Percentage of Net Assets
Common Stocks - 98.7% |
| Shares | | Value |
Australia - 2.4% |
AMP Ltd. | 362,775 | | $ 3,473,529 |
Macquarie Airports unit | 460,311 | | 1,891,729 |
Macquarie Bank Ltd. | 19,000 | | 1,517,452 |
Macquarie Infrastructure Group unit | 597,721 | | 1,774,282 |
National Australia Bank Ltd. | 28,843 | | 1,166,925 |
TOTAL AUSTRALIA | | 9,823,917 |
Brazil - 2.0% |
Petroleo Brasileiro SA - Petrobras sponsored ADR | 59,700 | | 5,709,111 |
TAM SA (PN) sponsored ADR (ltd. vtg.) (d) | 47,200 | | 1,392,400 |
Uniao de Bancos Brasileiros SA (Unibanco) GDR | 5,400 | | 853,416 |
TOTAL BRAZIL | | 7,954,927 |
Canada - 1.1% |
Finning International, Inc. | 38,300 | | 1,318,312 |
First Quantum Minerals Ltd. | 18,100 | | 1,949,363 |
RONA, Inc. (a) | 56,500 | | 1,277,563 |
TOTAL CANADA | | 4,545,238 |
Cayman Islands - 3.8% |
Chaoda Modern Agriculture (Holdings) Ltd. | 1,184,000 | | 1,080,556 |
GlobalSantaFe Corp. | 123,900 | | 10,039,617 |
Subsea 7, Inc. (a) | 140,500 | | 4,123,498 |
TOTAL CAYMAN ISLANDS | | 15,243,671 |
France - 11.8% |
Accor SA | 18,100 | | 1,727,327 |
Alcatel-Lucent SA | 140,700 | | 1,363,383 |
AXA SA sponsored ADR | 193,800 | | 8,668,674 |
BNP Paribas SA | 27,700 | | 3,053,626 |
Compagnie de St. Gobain | 11,300 | | 1,211,323 |
Gaz de France | 44,700 | | 2,538,645 |
Renault SA | 8,400 | | 1,410,494 |
Societe Generale Series A | 51,435 | | 8,666,798 |
Suez SA (France) | 46,700 | | 3,035,500 |
Total SA: | | | |
Series B | 33,300 | | 2,684,313 |
sponsored ADR | 102,500 | | 8,262,525 |
Unibail-Rodamco | 11,872 | | 2,951,890 |
Vallourec SA | 7,000 | | 2,028,929 |
TOTAL FRANCE | | 47,603,427 |
Common Stocks - continued |
| Shares | | Value |
Germany - 10.9% |
Allianz AG sponsored ADR | 323,500 | | $ 7,311,100 |
BASF AG sponsored ADR | 25,300 | | 3,519,230 |
DaimlerChrysler AG | 80,200 | | 8,834,030 |
E.ON AG (d) | 70,700 | | 13,807,706 |
GFK AG (d) | 32,200 | | 1,299,707 |
Heidelberger Druckmaschinen AG | 22,700 | | 927,106 |
Lanxess AG | 48,100 | | 2,402,121 |
Muenchener Rueckversicherungs-Gesellschaft AG (Reg.) | 30,900 | | 5,928,168 |
TOTAL GERMANY | | 44,029,168 |
Greece - 0.8% |
Alpha Bank AE | 31,900 | | 1,180,375 |
Cosmote Mobile Telecommunications SA | 20,000 | | 690,208 |
Greek Organization of Football Prognostics SA | 36,200 | | 1,478,993 |
TOTAL GREECE | | 3,349,576 |
Hong Kong - 1.2% |
Swire Pacific Ltd. (A Shares) | 352,800 | | 5,038,579 |
India - 0.7% |
Satyam Computer Services Ltd. sponsored ADR | 94,100 | | 2,855,935 |
Ireland - 1.0% |
Bank of Ireland | 113,471 | | 2,104,887 |
CRH PLC sponsored ADR (d) | 53,900 | | 2,134,979 |
TOTAL IRELAND | | 4,239,866 |
Italy - 1.4% |
Fiat SpA | 51,700 | | 1,668,089 |
Unicredito Italiano SpA | 490,600 | | 4,193,610 |
TOTAL ITALY | | 5,861,699 |
Japan - 18.8% |
Aeon Co. Ltd. | 196,100 | | 3,087,557 |
Asahi Breweries Ltd. | 63,100 | | 1,043,779 |
Canon, Inc. | 86,650 | | 4,381,891 |
Cosmo Bio Co. Ltd. | 13 | | 9,201 |
Denso Corp. | 61,800 | | 2,511,175 |
East Japan Railway Co. | 470 | | 3,872,403 |
Ibiden Co. Ltd. | 7,500 | | 635,876 |
Japan Tobacco, Inc. | 199 | | 1,160,152 |
JGC Corp. | 25,000 | | 500,754 |
JSR Corp. | 53,700 | | 1,394,667 |
Konica Minolta Holdings, Inc. | 156,500 | | 2,740,217 |
Common Stocks - continued |
| Shares | | Value |
Japan - continued |
Kubota Corp. | 294,000 | | $ 2,468,774 |
Leopalace21 Corp. | 50,200 | | 1,602,877 |
Misawa Homes Co. Ltd. (a)(d) | 48,500 | | 478,916 |
Mitsubishi Estate Co. Ltd. | 48,000 | | 1,439,269 |
Mitsui & Co. Ltd. | 375,000 | | 9,728,882 |
Nippon Building Fund, Inc. | 48 | | 696,438 |
Nippon Oil Corp. | 74,000 | | 655,537 |
ORIX Corp. | 31,850 | | 6,534,689 |
Osaka Gas Co. Ltd. | 1,409,000 | | 5,482,926 |
Shin-Etsu Chemical Co. Ltd. | 16,400 | | 1,052,223 |
Sumitomo Mitsui Financial Group, Inc. | 109 | | 893,048 |
Sumitomo Realty & Development Co. Ltd. | 30,000 | | 1,059,084 |
Sumitomo Trust & Banking Co. Ltd. | 197,000 | | 1,469,151 |
Takeda Pharmaceutical Co. Ltd. | 88,600 | | 5,535,553 |
Tokuyama Corp. (d) | 176,000 | | 2,458,846 |
Toyota Motor Corp. | 154,800 | | 8,857,656 |
Toyota Motor Corp. sponsored ADR | 15,600 | | 1,785,264 |
Xebio Co. Ltd. | 47,600 | | 1,404,749 |
Yamada Denki Co. Ltd. | 10,970 | | 1,131,278 |
TOTAL JAPAN | | 76,072,832 |
Kazakhstan - 0.5% |
JSC Halyk Bank of Kazakhstan unit | 104,300 | | 1,925,378 |
Korea (South) - 0.7% |
Kookmin Bank sponsored ADR | 15,200 | | 1,241,688 |
Samsung Electronics Co. Ltd. GDR | 4,833 | | 1,474,065 |
TOTAL KOREA (SOUTH) | | 2,715,753 |
Luxembourg - 0.1% |
ArcelorMittal SA (NY Shares) Class A | 7,600 | | 607,620 |
Mexico - 0.3% |
America Movil SAB de CV Series L sponsored ADR | 20,800 | | 1,360,112 |
Netherlands - 2.4% |
Heineken NV (Bearer) | 12,600 | | 879,480 |
ING Groep NV sponsored ADR | 194,700 | | 8,759,553 |
TOTAL NETHERLANDS | | 9,639,033 |
Norway - 3.3% |
DnB Nor ASA | 156,400 | | 2,579,223 |
Fred Olsen Energy ASA (d) | 45,000 | | 2,289,202 |
Common Stocks - continued |
| Shares | | Value |
Norway - continued |
Orkla ASA (A Shares) | 226,250 | | $ 4,203,322 |
Petroleum Geo-Services ASA | 146,350 | | 4,308,823 |
TOTAL NORWAY | | 13,380,570 |
Philippines - 0.2% |
Philippine Long Distance Telephone Co. sponsored ADR | 12,000 | | 823,200 |
Russia - 1.1% |
OAO Gazprom sponsored ADR | 91,300 | | 4,587,825 |
Singapore - 0.7% |
DBS Group Holdings Ltd. | 175,000 | | 2,739,062 |
South Africa - 1.0% |
Impala Platinum Holdings Ltd. | 102,600 | | 3,852,039 |
Spain - 4.8% |
Banco Bilbao Vizcaya Argentaria SA sponsored ADR | 192,100 | | 4,848,604 |
Banco Santander SA | 391,000 | | 8,497,212 |
Banco Santander SA sponsored ADR | 84,500 | | 1,834,495 |
Gestevision Telecinco SA | 75,200 | | 2,162,653 |
Telefonica SA sponsored ADR | 22,300 | | 2,217,735 |
TOTAL SPAIN | | 19,560,699 |
Sweden - 1.9% |
Atlas Copco AB (A Shares) | 52,800 | | 882,943 |
Svenska Cellulosa AB (SCA) (B Shares) | 184,600 | | 3,254,015 |
Telefonaktiebolaget LM Ericsson (B Shares) | 1,189,000 | | 3,572,945 |
TOTAL SWEDEN | | 7,709,903 |
Switzerland - 8.8% |
Credit Suisse Group sponsored ADR | 54,200 | | 3,669,340 |
Nestle SA (Reg.) | 17,839 | | 8,241,618 |
Novartis AG sponsored ADR | 15,400 | | 818,818 |
Roche Holding AG (participation certificate) | 40,954 | | 6,999,039 |
Swiss Life Holding | 7,868 | | 2,173,668 |
Swiss Reinsurance Co. (Reg.) | 33,669 | | 3,159,648 |
UBS AG (NY Shares) | 173,900 | | 9,336,691 |
Zurich Financial Services AG (Reg.) | 3,949 | | 1,188,996 |
TOTAL SWITZERLAND | | 35,587,818 |
Taiwan - 0.5% |
Novatek Microelectronics Corp. | 329,898 | | 1,517,358 |
Siliconware Precision Industries Co. Ltd. | 226,000 | | 476,487 |
TOTAL TAIWAN | | 1,993,845 |
Common Stocks - continued |
| Shares | | Value |
United Kingdom - 16.3% |
3i Group plc | 123,110 | | $ 2,777,078 |
Anglo American PLC (United Kingdom) | 19,000 | | 1,309,095 |
BAE Systems PLC | 246,100 | | 2,548,038 |
Barclays PLC | 478,700 | | 6,085,474 |
BHP Billiton PLC | 143,000 | | 5,443,639 |
BP PLC | 172,000 | | 2,235,713 |
British American Tobacco PLC | 85,800 | | 3,289,572 |
HBOS plc | 240,800 | | 4,370,546 |
HSBC Holdings PLC (United Kingdom) (Reg.) | 158,900 | | 3,162,746 |
Informa PLC | 181,800 | | 2,022,146 |
Land Securities Group PLC | 59,200 | | 2,023,431 |
Misys PLC | 104,900 | | 527,238 |
National Grid PLC | 385,200 | | 6,418,813 |
Prudential PLC | 141,728 | | 2,304,238 |
Rolls-Royce Group PLC | 434,919 | | 4,864,695 |
Royal Bank of Scotland Group PLC | 672,000 | | 7,216,133 |
Tesco PLC | 168,800 | | 1,730,201 |
Vedanta Resources PLC | 20,200 | | 923,930 |
Vodafone Group PLC sponsored ADR | 129,112 | | 5,070,228 |
Yell Group PLC | 180,100 | | 1,703,688 |
TOTAL UNITED KINGDOM | | 66,026,642 |
United States of America - 0.2% |
Virgin Media, Inc. | 27,900 | | 616,869 |
TOTAL COMMON STOCKS (Cost $343,850,130) | 399,745,203 |
Nonconvertible Preferred Stocks - 0.2% |
| | | |
Germany - 0.2% |
ProSiebenSat.1 Media AG | 28,000 | | 818,224 |
United Kingdom - 0.0% |
Rolls-Royce Group PLC B Shares | 19,821,007 | | 41,209 |
TOTAL NONCONVERTIBLE PREFERRED STOCKS (Cost $929,031) | 859,433 |
Money Market Funds - 2.7% |
| Shares | | Value |
Fidelity Cash Central Fund, 4.97% (b) | 2,981,514 | | $ 2,981,514 |
Fidelity Securities Lending Cash Central Fund, 5.02% (b)(c) | 7,703,170 | | 7,703,170 |
TOTAL MONEY MARKET FUNDS (Cost $10,684,684) | 10,684,684 |
TOTAL INVESTMENT PORTFOLIO - 101.6% (Cost $355,463,845) | 411,289,320 |
NET OTHER ASSETS - (1.6)% | (6,396,381) |
NET ASSETS - 100% | $ 404,892,939 |
Legend |
(a) Non-income producing |
(b) Affiliated fund that is available only to investment companies and other accounts managed by Fidelity Investments. The rate quoted is the annualized seven-day yield of the fund at period end. A complete unaudited listing of the fund's holdings as of its most recent quarter end is available upon request. |
(c) Investment made with cash collateral received from securities on loan. |
(d) Security or a portion of the security is on loan at period end. |
Affiliated Central Funds |
Information regarding fiscal year to date income earned by the Fund from investments in Fidelity Central Funds is as follows: |
Fund | Income earned |
Fidelity Cash Central Fund | $ 495,581 |
Fidelity Securities Lending Cash Central Fund | 347,002 |
Total | $ 842,583 |
See accompanying notes which are an integral part of the financial statements.
Annual Report
Financial Statements
Statement of Assets and Liabilities
| October 31, 2007 |
Assets | | |
Investment in securities, at value (including securities loaned of $7,446,355) - See accompanying schedule: Unaffiliated issuers (cost $344,779,161) | $ 400,604,636 | |
Fidelity Central Funds (cost $10,684,684) | 10,684,684 | |
Total Investments (cost $355,463,845) | | $ 411,289,320 |
Foreign currency held at value (cost $10,790) | | 10,726 |
Receivable for investments sold | | 4,120,382 |
Receivable for fund shares sold | | 1,047,639 |
Dividends receivable | | 718,112 |
Distributions receivable from Fidelity Central Funds | | 7,659 |
Prepaid expenses | | 44 |
Other receivables | | 13,873 |
Total assets | | 417,207,755 |
| | |
Liabilities | | |
Payable for investments purchased | $ 969,463 | |
Payable for fund shares redeemed | 3,211,020 | |
Accrued management fee | 251,364 | |
Distribution fees payable | 10,680 | |
Other affiliated payables | 95,991 | |
Other payables and accrued expenses | 73,128 | |
Collateral on securities loaned, at value | 7,703,170 | |
Total liabilities | | 12,314,816 |
| | |
Net Assets | | $ 404,892,939 |
Net Assets consist of: | | |
Paid in capital | | $ 319,315,967 |
Undistributed net investment income | | 6,624,232 |
Accumulated undistributed net realized gain (loss) on investments and foreign currency transactions | | 23,121,828 |
Net unrealized appreciation (depreciation) on investments and assets and liabilities in foreign currencies | | 55,830,912 |
Net Assets | | $ 404,892,939 |
See accompanying notes which are an integral part of the financial statements.
Annual Report
Statement of Assets and Liabilities - continued
| October 31, 2007 |
Calculation of Maximum Offering Price
Class A:
Net Asset Value and redemption price per share ($6,051,508 ÷ 464,877 shares) | | $ 13.02 |
| | |
Maximum offering price per share (100/94.25 of $13.02) | | $ 13.81 |
Class T:
Net Asset Value and redemption price per share ($5,081,307 ÷ 391,278 shares) | | $ 12.99 |
| | |
Maximum offering price per share (100/96.50 of $12.99) | | $ 13.46 |
Class B:
Net Asset Value and offering price per share ($2,651,396 ÷ 205,042 shares)A | | $ 12.93 |
| | |
Class C:
Net Asset Value and offering price per share ($5,995,905 ÷ 464,024 shares)A | | $ 12.92 |
| | |
| | |
International Value:
Net Asset Value, offering price and redemption price per share ($381,148,142 ÷ 29,177,219 shares) | | $ 13.06 |
| | |
Institutional Class:
Net Asset Value, offering price and redemption price per share ($3,964,681 ÷ 303,335 shares) | | $ 13.07 |
A Redemption price per share is equal to net asset value less any applicable contingent deferred sales charge.
See accompanying notes which are an integral part of the financial statements.
Annual Report
Financial Statements - continued
Statement of Operations
| Year ended October 31, 2007 |
Investment Income | | |
Dividends | | $ 10,911,623 |
Income from Fidelity Central Funds | | 842,583 |
| | 11,754,206 |
Less foreign taxes withheld | | (950,853) |
Total income | | 10,803,353 |
| | |
Expenses | | |
Management fee
Basic fee | $ 2,678,334 | |
Performance adjustment | (49,312) | |
Transfer agent fees | 795,281 | |
Distribution fees | 97,190 | |
Accounting and security lending fees | 200,380 | |
Custodian fees and expenses | 73,738 | |
Independent trustees' compensation | 1,212 | |
Registration fees | 149,976 | |
Audit | 60,592 | |
Legal | 2,605 | |
Interest | 1,715 | |
Miscellaneous | 11,367 | |
Total expenses before reductions | 4,023,078 | |
Expense reductions | (66,233) | 3,956,845 |
Net investment income (loss) | | 6,846,508 |
Realized and Unrealized Gain (Loss) Net realized gain (loss) on: | | |
Investment securities: | | |
Unaffiliated issuers (net of foreign taxes of $32,830) | 23,720,618 | |
Foreign currency transactions | 2,737 | |
Total net realized gain (loss) | | 23,723,355 |
Change in net unrealized appreciation (depreciation) on: Investment securities (net of decrease in deferred foreign taxes of $7,086) | 43,764,016 | |
Assets and liabilities in foreign currencies | 5,403 | |
Total change in net unrealized appreciation (depreciation) | | 43,769,419 |
Net gain (loss) | | 67,492,774 |
Net increase (decrease) in net assets resulting from operations | | $ 74,339,282 |
See accompanying notes which are an integral part of the financial statements.
Annual Report
Statement of Changes in Net Assets
| Year ended
October 31,
2007 | For the period
May 18, 2006
(commencement of operations) to
October 31,
2006 |
Increase (Decrease) in Net Assets | | |
Operations | | |
Net investment income (loss) | $ 6,846,508 | $ 808,421 |
Net realized gain (loss) | 23,723,355 | (6,746) |
Change in net unrealized appreciation (depreciation) | 43,769,419 | 12,061,493 |
Net increase (decrease) in net assets resulting
from operations | 74,339,282 | 12,863,168 |
Distributions to shareholders from net investment income | (978,516) | - |
Distributions to shareholders from net realized gain | (557,946) | - |
Total distributions | (1,536,462) | - |
Share transactions - net increase (decrease) | 101,052,444 | 218,123,163 |
Redemption fees | 30,746 | 20,598 |
Total increase (decrease) in net assets | 173,886,010 | 231,006,929 |
| | |
Net Assets | | |
Beginning of period | 231,006,929 | - |
End of period (including undistributed net investment income of $6,624,232 and undistributed net investment income of $808,421, respectively) | $ 404,892,939 | $ 231,006,929 |
See accompanying notes which are an integral part of the financial statements.
Annual Report
Financial Highlights - Class A
Years ended October 31, | 2007 | 2006 I |
Selected Per-Share Data | | |
Net asset value, beginning of period | $ 10.60 | $ 10.00 |
Income from Investment Operations | | |
Net investment income (loss) E | .18 | .06 H |
Net realized and unrealized gain (loss) | 2.29 | .54 |
Total from investment operations | 2.47 | .60 |
Distributions from net investment income | (.03) | - |
Distributions from net realized gain | (.02) | - |
Total distributions | (.05) | - |
Redemption fees added to paid in capital E | - K | - K |
Net asset value, end of period | $ 13.02 | $ 10.60 |
Total Return B, C, D | 23.43% | 6.00% |
Ratios to Average Net Assets F, J | | |
Expenses before reductions | 1.38% | 1.75% A |
Expenses net of fee waivers, if any | 1.38% | 1.50% A |
Expenses net of all reductions | 1.37% | 1.46% A |
Net investment income (loss) | 1.49% | 1.29% A, H |
Supplemental Data | | |
Net assets, end of period (000 omitted) | $ 6,052 | $ 1,537 |
Portfolio turnover rate G | 59% | 29% A |
A Annualized
B Total returns for periods of less than one year are not annualized.
C Total returns would have been lower had certain expenses not been reduced during the periods shown.
D Total returns do not include the effect of the sales charges.
E Calculated based on average shares outstanding during the period.
F Fees and expenses of the underlying Fidelity Central Funds are not included in the Fund's expense ratio. The Fund indirectly bears its proportionate share of the expenses of any underlying Fidelity Central Funds.
G Amount does not include the portfolio activity of any underlying Fidelity Central Funds.
H Investment income per share reflects a special dividend which amounted to $.03 per share. Excluding the special dividend, the ratio of net investment income (loss) to average net assets would have been .63%.
I For the period May 18, 2006 (commencement of operations) to October 31, 2006.
J Expense ratios reflect operating expenses of the class. Expenses before reductions do not reflect amounts reimbursed by the investment adviser or reductions from brokerage service arrangements or other expense offset arrangements and do not represent the amount paid by the class during periods when reimbursements or reductions occur. Expense ratios before reductions for start-up periods may not be representative of longer-term operating periods. Expenses net of fee waivers reflect expenses after reimbursement by the investment adviser but prior to reductions from brokerage service arrangements or other expense offset arrangements. Expenses net of all reductions represent the net expenses paid by the class.
K Amount represents less than $.01 per share.
See accompanying notes which are an integral part of the financial statements.
Annual Report
Financial Highlights - Class T
Years ended October 31, | 2007 | 2006 I |
Selected Per-Share Data | | |
Net asset value, beginning of period | $ 10.59 | $ 10.00 |
Income from Investment Operations | | |
Net investment income (loss) E | .15 | .05 H |
Net realized and unrealized gain (loss) | 2.29 | .54 |
Total from investment operations | 2.44 | .59 |
Distributions from net investment income | (.02) | - |
Distributions from net realized gain | (.02) | - |
Total distributions | (.04) | - |
Redemption fees added to paid in capital E | - K | - K |
Net asset value, end of period | $ 12.99 | $ 10.59 |
Total Return B, C, D | 23.13% | 5.90% |
Ratios to Average Net Assets F, J | | |
Expenses before reductions | 1.60% | 2.01% A |
Expenses net of fee waivers, if any | 1.60% | 1.75% A |
Expenses net of all reductions | 1.58% | 1.71% A |
Net investment income (loss) | 1.27% | 1.04% A, H |
Supplemental Data | | |
Net assets, end of period (000 omitted) | $ 5,081 | $ 1,789 |
Portfolio turnover rate G | 59% | 29% A |
A Annualized
B Total returns for periods of less than one year are not annualized.
C Total returns would have been lower had certain expenses not been reduced during the periods shown.
D Total returns do not include the effect of the sales charges.
E Calculated based on average shares outstanding during the period.
F Fees and expenses of the underlying Fidelity Central Funds are not included in the Fund's expense ratio. The Fund indirectly bears its proportionate share of the expenses of any underlying Fidelity Central Funds.
G Amount does not include the portfolio activity of any underlying Fidelity Central Funds.
H Investment income per share reflects a special dividend which amounted to $.03 per share. Excluding the special dividend, the ratio of net investment income (loss) to average net assets would have been .38%.
I For the period May 18, 2006 (commencement of operations) to October 31, 2006.
J Expense ratios reflect operating expenses of the class. Expenses before reductions do not reflect amounts reimbursed by the investment adviser or reductions from brokerage service arrangements or other expense offset arrangements and do not represent the amount paid by the class during periods when reimbursements or reductions occur. Expense ratios before reductions for start-up periods may not be representative of longer-term operating periods. Expenses net of fee waivers reflect expenses after reimbursement by the investment adviser but prior to reductions from brokerage service arrangements or other expense offset arrangements. Expenses net of all reductions represent the net expenses paid by the class.
K Amount represents less than $.01 per share.
See accompanying notes which are an integral part of the financial statements.
Annual Report
Financial Highlights - Class B
Years ended October 31, | 2007 | 2006 I |
Selected Per-Share Data | | |
Net asset value, beginning of period | $ 10.56 | $ 10.00 |
Income from Investment Operations | | |
Net investment income (loss) E | .09 | .02 H |
Net realized and unrealized gain (loss) | 2.29 | .54 |
Total from investment operations | 2.38 | .56 |
Distributions from net realized gain | (.01) | - |
Redemption fees added to paid in capital E | - K | - K |
Net asset value, end of period | $ 12.93 | $ 10.56 |
Total Return B, C, D | 22.59% | 5.60% |
Ratios to Average Net Assets F, J | | |
Expenses before reductions | 2.10% | 2.50% A |
Expenses net of fee waivers, if any | 2.10% | 2.25% A |
Expenses net of all reductions | 2.08% | 2.21% A |
Net investment income (loss) | .77% | .54% A, H |
Supplemental Data | | |
Net assets, end of period (000 omitted) | $ 2,651 | $ 1,304 |
Portfolio turnover rate G | 59% | 29% A |
A Annualized
B Total returns for periods of less than one year are not annualized.
C Total returns would have been lower had certain expenses not been reduced during the periods shown.
D Total returns do not include the effect of the contingent deferred sales charge.
E Calculated based on average shares outstanding during the period.
F Fees and expenses of the underlying Fidelity Central Funds are not included in the Fund's expense ratio. The Fund indirectly bears its proportionate share of the expenses of any underlying Fidelity Central Funds.
G Amount does not include the portfolio activity of any underlying Fidelity Central Funds.
H Investment income per share reflects a special dividend which amounted to $.03 per share. Excluding the special dividend, the ratio of net investment income (loss) to average net assets would have been (.12) %.
I For the period May 18, 2006 (commencement of operations) to October 31, 2006.
J Expense ratios reflect operating expenses of the class. Expenses before reductions do not reflect amounts reimbursed by the investment adviser or reductions from brokerage service arrangements or other expense offset arrangements and do not represent the amount paid by the class during periods when reimbursements or reductions occur. Expense ratios before reductions for start-up periods may not be representative of longer-term operating periods. Expenses net of fee waivers reflect expenses after reimbursement by the investment adviser but prior to reductions from brokerage service arrangements or other expense offset arrangements. Expenses net of all reductions represent the net expenses paid by the class.
K Amount represents less than $.01 per share.
See accompanying notes which are an integral part of the financial statements.
Annual Report
Financial Highlights - Class C
Years ended October 31, | 2007 | 2006 I |
Selected Per-Share Data | | |
Net asset value, beginning of period | $ 10.56 | $ 10.00 |
Income from Investment Operations | | |
Net investment income (loss) E | .09 | .02 H |
Net realized and unrealized gain (loss) | 2.29 | .54 |
Total from investment operations | 2.38 | .56 |
Distributions from net realized gain | (.02) | - |
Redemption fees added to paid in capital E | - K | - K |
Net asset value, end of period | $ 12.92 | $ 10.56 |
Total Return B, C, D | 22.56% | 5.60% |
Ratios to Average Net Assets F, J | | |
Expenses before reductions | 2.07% | 2.47% A |
Expenses net of fee waivers, if any | 2.07% | 2.25% A |
Expenses net of all reductions | 2.05% | 2.21% A |
Net investment income (loss) | .80% | .54% A, H |
Supplemental Data | | |
Net assets, end of period (000 omitted) | $ 5,996 | $ 2,183 |
Portfolio turnover rate G | 59% | 29% A |
A Annualized
B Total returns for periods of less than one year are not annualized.
C Total returns would have been lower had certain expenses not been reduced during the periods shown.
D Total returns do not include the effect of the contingent deferred sales charge.
E Calculated based on average shares outstanding during the period.
F Fees and expenses of the underlying Fidelity Central Funds are not included in the Fund's expense ratio. The Fund indirectly bears its proportionate share of the expenses of any underlying Fidelity Central Funds.
G Amount does not include the portfolio activity of any underlying Fidelity Central Funds.
H Investment income per share reflects a special dividend which amounted to $.03 per share. Excluding the special dividend, the ratio of net investment income (loss) to average net assets would have been (.12) %.
I For the period May 18, 2006 (commencement of operations) to October 31, 2006.
J Expense ratios reflect operating expenses of the class. Expenses before reductions do not reflect amounts reimbursed by the investment adviser or reductions from brokerage service arrangements or other expense offset arrangements and do not represent the amount paid by the class during periods when reimbursements or reductions occur. Expense ratios before reductions for start-up periods may not be representative of longer-term operating periods. Expenses net of fee waivers reflect expenses after reimbursement by the investment adviser but prior to reductions from brokerage service arrangements or other expense offset arrangements. Expenses net of all reductions represent the net expenses paid by the class.
K Amount represents less than $.01 per share.
See accompanying notes which are an integral part of the financial statements.
Annual Report
Financial Highlights - International Value
Years ended October 31, | 2007 | 2006 H |
Selected Per-Share Data | | |
Net asset value, beginning of period | $ 10.61 | $ 10.00 |
Income from Investment Operations | | |
Net investment income (loss) D | .22 | .07 G |
Net realized and unrealized gain (loss) | 2.29 | .54 |
Total from investment operations | 2.51 | .61 |
Distributions from net investment income | (.04) | - |
Distributions from net realized gain | (.02) | - |
Total distributions | (.06) | - |
Redemption fees added to paid in capital D | - J | - J |
Net asset value, end of period | $ 13.06 | $ 10.61 |
Total Return B, C | 23.81% | 6.10% |
Ratios to Average Net Assets E, I | | |
Expenses before reductions | 1.03% | 1.50% A |
Expenses net of fee waivers, if any | 1.03% | 1.25% A |
Expenses net of all reductions | 1.02% | 1.21% A |
Net investment income (loss) | 1.84% | 1.54% A, G |
Supplemental Data | | |
Net assets, end of period (000 omitted) | $ 381,148 | $ 221,130 |
Portfolio turnover rate F | 59% | 29% A |
A Annualized
B Total returns for periods of less than one year are not annualized.
C Total returns would have been lower had certain expenses not been reduced during the periods shown.
D Calculated based on average shares outstanding during the period.
E Fees and expenses of the underlying Fidelity Central Funds are not included in the Fund's expense ratio. The Fund indirectly bears its proportionate share of the expenses of any underlying Fidelity Central Funds.
F Amount does not include the portfolio activity of any underlying Fidelity Central Funds.
G Investment income per share reflects a special dividend which amounted to $.03 per share. Excluding the special dividend, the ratio of net investment income (loss) to average net assets would have been .88%.
H For the period May 18, 2006 (commencement of operations) to October 31, 2006.
I Expense ratios reflect operating expenses of the class. Expenses before reductions do not reflect amounts reimbursed by the investment adviser or reductions from brokerage service arrangements or other expense offset arrangements and do not represent the amount paid by the class during periods when reimbursements or reductions occur. Expense ratios before reductions for start-up periods may not be representative of longer-term operating periods. Expenses net of fee waivers reflect expenses after reimbursement by the investment adviser but prior to reductions from brokerage service arrangements or other expense offset arrangements. Expenses net of all reductions represent the net expenses paid by the class.
J Amount represents less than $.01 per share.
See accompanying notes which are an integral part of the financial statements.
Annual Report
Financial Highlights - Institutional Class
Years ended October 31, | 2007 | 2006 H |
Selected Per-Share Data | | |
Net asset value, beginning of period | $ 10.61 | $ 10.00 |
Income from Investment Operations | | |
Net investment income (loss) D | .22 | .07 G |
Net realized and unrealized gain (loss) | 2.30 | .54 |
Total from investment operations | 2.52 | .61 |
Distributions from net investment income | (.04) | - |
Distributions from net realized gain | (.02) | - |
Total distributions | (.06) | - |
Redemption fees added to paid in capital D | - J | - J |
Net asset value, end of period | $ 13.07 | $ 10.61 |
Total Return B, C | 23.91% | 6.10% |
Ratios to Average Net Assets E, I | | |
Expenses before reductions | .98% | 1.38% A |
Expenses net of fee waivers, if any | .98% | 1.25% A |
Expenses net of all reductions | .96% | 1.21% A |
Net investment income (loss) | 1.89% | 1.54% A, G |
Supplemental Data | | |
Net assets, end of period (000 omitted) | $ 3,965 | $ 3,064 |
Portfolio turnover rate F | 59% | 29% A |
A Annualized
B Total returns for periods of less than one year are not annualized.
C Total returns would have been lower had certain expenses not been reduced during the periods shown.
D Calculated based on average shares outstanding during the period.
E Fees and expenses of the underlying Fidelity Central Funds are not included in the Fund's expense ratio. The Fund indirectly bears its proportionate share of the expenses of any underlying Fidelity Central Funds.
F Amount does not include the portfolio activity of any underlying Fidelity Central Funds.
G Investment income per share reflects a special dividend which amounted to $.03 per share. Excluding the special dividend, the ratio of net investment income (loss) to average net assets would have been .88%.
H For the period May 18, 2006 (commencement of operations) to October 31, 2006.
I Expense ratios reflect operating expenses of the class. Expenses before reductions do not reflect amounts reimbursed by the investment adviser or reductions from brokerage service arrangements or other expense offset arrangements and do not represent the amount paid by the class during periods when reimbursements or reductions occur. Expense ratios before reductions for start-up periods may not be representative of longer-term operating periods. Expenses net of fee waivers reflect expenses after reimbursement by the investment adviser but prior to reductions from brokerage service arrangements or other expense offset arrangements. Expenses net of all reductions represent the net expenses paid by the class.
J Amount represents less than $.01 per share.
See accompanying notes which are an integral part of the financial statements.
Annual Report
Notes to Financial Statements
For the period ended October 31, 2007
1. Organization.
Fidelity International Value Fund (the Fund) is a fund of Fidelity Investment Trust (the trust) and is authorized to issue an unlimited number of shares. The trust is registered under the Investment Company Act of 1940, as amended (the 1940 Act), as an open-end management investment company organized as a Massachusetts business trust.
The Fund offers Class A, Class T, Class B, Class C, International Value Fund, and Institutional Class shares, each of which has equal rights as to assets and voting privileges. Each class has exclusive voting rights with respect to matters that affect that class. Class B shares will automatically convert to Class A shares after a holding period of seven years from the initial date of purchase. Investment income, realized and unrealized capital gains and losses, the common expenses of the Fund, and certain fund-level expense reductions, if any, are allocated on a pro rata basis to each class based on the relative net assets of each class to the total net assets of the Fund. Each class differs with respect to transfer agent and distribution and service plan fees incurred. Certain expense reductions also differ by class.
The Fund's investments in emerging markets can be subject to social, economic, regulatory, and political uncertainties and can be extremely volatile.
2. Investments in Fidelity Central Funds.
The Fund may invest in Fidelity Central Funds, which are open-end investment companies available only to other investment companies and accounts managed by Fidelity Management & Research Company (FMR) and its affiliates. The Fund's Schedule of Investments lists each of the Fidelity Central Funds as an investment of the Fund, but does not include the underlying holdings of each Fidelity Central Fund. As an Investing Fund, the Fund indirectly bears its proportionate share of the expenses of the underlying Fidelity Central Funds.
The Money Market Central Funds seek preservation of capital and current income and are managed by Fidelity Investments Money Management, Inc. (FIMM), an affiliate of FMR.
A complete list of holdings for each Fidelity Central Fund is available upon request or at the SEC's web site at www.sec.gov. In addition, the financial statements of the Fidelity Central Funds, which are not covered by the Fund's Report of Independent Registered Public Accounting Firm, are available on the SEC's web site or upon request.
Annual Report
3. Significant Accounting Policies.
The financial statements have been prepared in conformity with accounting principles generally accepted in the United States of America, which require management to make certain estimates and assumptions at the date of the financial statements. The following summarizes the significant accounting policies of the Fund:
Security Valuation. Investments are valued and net asset value (NAV) per share is calculated (NAV calculation) as of the close of business of the New York Stock Exchange (NYSE), normally 4:00 p.m. Eastern time. Wherever possible, the Fund uses independent pricing services approved by the Board of Trustees to value its investments.
Equity securities, including restricted securities, for which market quotations are readily available, are valued at the last reported sale price or official closing price as reported by an independent pricing service on the primary market or exchange on which they are traded. In the event there were no sales during the day or closing prices are not available, securities are valued at the last quoted bid price. Investments in open-end mutual funds, including the Fidelity Central Funds, are valued at their closing net asset value each business day. Short-term securities with remaining maturities of sixty days or less for which quotations are not readily available are valued at amortized cost, which approximates value.
When current market prices or quotations are not readily available or do not accurately reflect fair value, valuations may be determined in accordance with procedures adopted by the Board of Trustees. For example, when developments occur between the close of a market and the close of the NYSE that may materially affect the value of some or all of the securities, or when trading in a security is halted, those securities may be fair valued. Factors used in the determination of fair value may include monitoring news to identify significant market or security specific events such as changes in the value of U.S. securities markets, reviewing developments in foreign markets and evaluating the performance of ADRs, futures contracts and exchange-traded funds. Because the Fund's utilization of fair value pricing depends on market activity, the frequency with which fair value pricing is used cannot be predicted and may be utilized to a significant extent. The value of securities used for NAV calculation under fair value pricing may differ from published prices for the same securities.
Foreign Currency. The Fund uses foreign currency contracts to facilitate transactions in foreign-denominated securities. Losses from these transactions may arise from changes in the value of the foreign currency or if the counterparties do not perform under the contracts' terms.
Foreign-denominated assets, including investment securities, and liabilities are translated into U.S. dollars at the exchange rate at period end. Purchases and sales of investment securities, income and dividends received and expenses denominated in foreign
Annual Report
Notes to Financial Statements - continued
3. Significant Accounting Policies - continued
Foreign Currency - continued
currencies are translated into U.S. dollars at the exchange rate in effect on the transaction date.
The effects of exchange rate fluctuations on investments are included with the net realized and unrealized gain (loss) on investment securities. Other foreign currency transactions resulting in realized and unrealized gain (loss) are disclosed separately.
Investment Transactions and Income. For financial reporting purposes, the Fund's investment holdings and NAV include trades executed through the end of the last business day of the period. The NAV for processing shareholder transactions includes trades executed through the end of the prior business day. Gains and losses on securities sold are determined on the basis of identified cost. Dividend income is recorded on the ex-dividend date, except for certain dividends from foreign securities where the ex-dividend date may have passed, which are recorded as soon as the Fund is informed of the ex-dividend date. Non-cash dividends included in dividend income, if any, are recorded at the fair market value of the securities received. Interest income and distributions from the Fidelity Central Funds are accrued as earned. Interest income includes coupon interest and amortization of premium and accretion of discount on debt securities. Investment income is recorded net of foreign taxes withheld where recovery of such taxes is uncertain.
Expenses. Most expenses of the trust can be directly attributed to a fund. Expenses which cannot be directly attributed are apportioned among each Fund in the trust. Expense estimates are accrued in the period to which they relate and adjustments are made when actual amounts are known.
Income Tax Information and Distributions to Shareholders. Each year, the Fund intends to qualify as a regulated investment company by distributing all of its taxable income and realized gains under Subchapter M of the Internal Revenue Code. As a result, no provision for income taxes is required in the accompanying financial statements. Foreign taxes are provided for based on the Fund's understanding of the tax rules and rates that exist in the foreign markets in which it invests.
Distributions are recorded on the ex-dividend date. Income dividends and capital gain distributions are declared separately for each class. Income and capital gain distributions are determined in accordance with income tax regulations, which may differ from generally accepted accounting principles. In addition, the Fund will claim a portion of the payment made to redeeming shareholders as a distribution for income tax purposes.
Annual Report
3. Significant Accounting Policies - continued
Income Tax Information and Distributions to Shareholders - continued
Capital accounts within the financial statements are adjusted for permanent book-tax differences. These adjustments have no impact on net assets or the results of operations. Temporary book-tax differences will reverse in a subsequent period.
Book-tax differences are primarily due to short-term capital gains, foreign currency transactions, certain foreign taxes, passive foreign investment companies (PFIC) and losses deferred due to wash sales.
The tax-basis components of distributable earnings and the federal tax cost as of period end were as follows:
Unrealized appreciation | $ 64,830,652 | |
Unrealized depreciation | (10,069,522) | |
Net unrealized appreciation (depreciation) | 54,761,130 | |
Undistributed ordinary income | 13,452,360 | |
Undistributed long-term capital gain | 10,388,114 | |
| | |
Cost for federal income tax purposes | $ 356,528,190 | |
The tax character of distributions paid was as follows:
| October 31, 2007 | October 31, 2006 |
Ordinary Income | $ 1,536,462 | $ - |
Short-Term Trading (Redemption) Fees. Shares held in the Fund less than 30 days are subject to a redemption fee equal to 1.00% of the proceeds of the redeemed shares. All redemption fees, including any estimated redemption fees paid by FMR, are retained by the Fund and accounted for as an addition to paid in capital.
New Accounting Pronouncements. In July 2006, Financial Accounting Standards Board Interpretation No. 48, Accounting for Uncertainty in Income Taxes - an interpretation of FASB Statement 109 (FIN 48), was issued and is effective on the last business day of the semiannual reporting period for fiscal years beginning after December 15, 2006. FIN 48 sets forth a threshold for financial statement recognition, measurement and disclosure of a tax position taken or expected to be taken on a tax return. Management has concluded that the adoption of FIN 48 will not result in a material impact on the Fund's net assets, results of operations and financial statement disclosures.
In addition, in September 2006, Statement of Financial Accounting Standards No. 157, Fair Value Measurements (SFAS 157), was issued and is effective for fiscal years beginning after November 15, 2007. SFAS 157 defines fair value, establishes a framework for
Annual Report
Notes to Financial Statements - continued
3. Significant Accounting Policies - continued
New Accounting Pronouncements - continued
measuring fair value and expands disclosures about fair value measurements. Management is currently evaluating the impact the adoption of SFAS 157 will have on the Fund's financial statement disclosures.
4. Operating Policies.
Repurchase Agreements. FMR has received an Exemptive Order from the Securities and Exchange Commission (the SEC) which permits the Fund and other affiliated entities of FMR to transfer uninvested cash balances into joint trading accounts which are then invested in repurchase agreements. The Fund may also invest directly with institutions in repurchase agreements. Repurchase agreements are collateralized by government or non-government securities. Upon settlement date, collateral is held in segregated accounts with custodian banks and may be obtained in the event of a default of the counterparty. The Fund monitors, on a daily basis, the value of the collateral to ensure it is at least equal to the principal amount of the repurchase agreement (including accrued interest). In the event of a default by the counterparty, realization of the collateral proceeds could be delayed, during which time the value of the collateral may decline.
5. Purchases and Sales of Investments.
Purchases and sales of securities, other than short-term securities, aggregated $321,090,708 and $214,366,719, respectively.
6. Fees and Other Transactions with Affiliates.
Management Fee. FMR and its affiliates provide the Fund with investment management related services for which the Fund pays a monthly management fee. The management fee is the sum of an individual fund fee rate that is based on an annual rate of .45% of the Fund's average net assets and a group fee rate that averaged ..26% during the period. The group fee rate is based upon the average net assets of all the mutual funds advised by FMR. The group fee rate decreases as assets under management increase and increases as assets under management decrease. In addition, the management fee is subject to a performance adjustment (up to a maximum of ± .20% of the Fund's average net assets over a 36 month performance period). The upward or downward adjustment to the management fee is based on the relative investment performance of the retail class of the Fund, International Value as compared to an appropriate benchmark index. The Fund's performance adjustment took effect in May 2007. Subsequent months will be
Annual Report
6. Fees and Other Transactions with Affiliates - continued
Management Fee - continued
added until the performance period includes 36 months. For the period, the total annual management fee rate, including the performance adjustment, was .69% of the Fund's average net assets.
Distribution and Service Plan. In accordance with Rule 12b-1 of the 1940 Act, the Fund has adopted separate Distribution and Service Plans for each class of shares. Certain classes pay Fidelity Distributors Corporation (FDC), an affiliate of FMR, separate Distribution and Service Fees, each of which is based on an annual percentage of each class' average net assets. In addition, FDC may pay financial intermediaries for selling shares of the Fund and providing shareholder support services. For the period, the Distribution and Service Fee rates and the total amounts paid to and retained by FDC were as follows:
| Distribution
Fee | Service
Fee | Paid to
FDC | Retained
by FDC |
Class A | 0% | .25% | $ 13,197 | $ 3,129 |
Class T | .25% | .25% | 17,684 | 5,582 |
Class B | .75% | .25% | 20,458 | 18,191 |
Class C | .75% | .25% | 45,851 | 26,965 |
| | | $ 97,190 | $ 53,867 |
Sales Load. FDC receives a front-end sales charge of up to 5.75% for selling Class A shares, and 3.50% for selling Class T shares, some of which is paid to financial intermediaries for selling shares of the Fund. FDC receives the proceeds of contingent deferred sales charges levied on Class A, Class T, Class B, and Class C redemptions. These charges depend on the holding period. The deferred sales charges range from 5% to 1% for Class B, 1% for Class C, 1.00% to .50% for certain purchases of Class A shares and .25% for certain purchases of Class T shares.
For the period, sales charge amounts retained by FDC were as follows:
| Retained
by FDC |
Class A | $ 13,601 |
Class T | 2,905 |
Class B* | 1,703 |
Class C* | 5,153 |
| $ 23,362 |
* When Class B and Class C shares are initially sold, FDC pays commissions from its own resources to financial intermediaries through which the sales are made.
Annual Report
Notes to Financial Statements - continued
6. Fees and Other Transactions with Affiliates - continued
Transfer Agent Fees. Fidelity Investments Institutional Operations Company, Inc. (FIIOC), an affiliate of FMR, is the transfer, dividend disbursing and shareholder servicing agent for each class of the Fund. FIIOC receives account fees and asset-based fees that vary according to the account size and type of account of the shareholders of the respective classes of the Fund. FIIOC pays for typesetting, printing and mailing of shareholder reports, except proxy statements. For the period, the total transfer agent fees paid by each class to FIIOC, were as follows:
| Amount | % of
Average
Net Assets |
Class A | $ 16,340 | .31 |
Class T | 9,701 | .27 |
Class B | 5,621 | .27 |
Class C | 11,287 | .24 |
International Value | 746,853 | .21 |
Institutional Class | 5,479 | .15 |
| $ 795,281 | |
Accounting and Security Lending Fees. Fidelity Service Company, Inc. (FSC), an affiliate of FMR, maintains the Fund's accounting records. The accounting fee is based on the level of average net assets for the month. Under a separate contract, FSC administers the security lending program. The security lending fee is based on the number and duration of lending transactions.
Brokerage Commissions. The Fund placed a portion of its portfolio transactions with brokerage firms which are affiliates of the investment adviser. The commissions paid to these affiliated firms were $169 for the period.
Interfund Lending Program. Pursuant to an Exemptive Order issued by the SEC, the Fund, along with other registered investment companies having management contracts with FMR, may participate in an interfund lending program. This program provides an alternative credit facility allowing the funds to borrow from, or lend money to, other participating affiliated funds. At period end, there were no interfund loans outstanding. The Fund's activity in this program during the period for which loans were outstanding was as follows:
Borrower or Lender | Average Daily Loan Balance | Weighted Average Interest Rate | Interest
Expense |
Borrower | $ 6,253,000 | 4.94% | $ 1,715 |
Annual Report
7. Committed Line of Credit.
The Fund participates with other funds managed by FMR in a $4.2 billion credit facility (the "line of credit") to be utilized for temporary or emergency purposes to fund shareholder redemptions or for other short-term liquidity purposes. The Fund has agreed to pay commitment fees on its pro rata portion of the line of credit, which amounted to $434 and is reflected in Miscellaneous Expense on the Statement of Operations. During the period, there were no borrowings on this line of credit.
8. Security Lending.
The Fund lends portfolio securities from time to time in order to earn additional income. On the settlement date of the loan, the Fund receives collateral (in the form of U.S. Treasury obligations, letters of credit and/or cash) against the loaned securities and maintains collateral in an amount not less than 100% of the market value of the loaned securities during the period of the loan. The market value of the loaned securities is determined at the close of business of the Fund and any additional required collateral is delivered to the Fund on the next business day. If the borrower defaults on its obligation to return the securities loaned because of insolvency or other reasons, a fund could experience delays and costs in recovering the securities loaned or in gaining access to the collateral. Any cash collateral received is invested in the Fidelity Securities Lending Cash Central Fund. The value of loaned securities and cash collateral at period end are disclosed on the Fund's Statement of Assets and Liabilities. Security lending income represents the income earned on investing cash collateral, less fees and expenses associated with the loan, plus any premium payments that may be received on the loan of certain types of securities. Security lending income is presented in the Statement of Operations as a component of income from Fidelity Central Funds. Net income from lending portfolio securities during the period amounted to $347,002.
9. Expense Reductions.
Many of the brokers with whom FMR places trades on behalf of the Fund provided services to the Fund in addition to trade execution. These services included payments of certain expenses on behalf of the Fund totaling $64,985 for the period. In addition, through arrangements with the Fund's custodian and each class' transfer agent, credits realized as a result of uninvested cash balances were used to reduce the Fund's expenses. During the period, these credits reduced the Fund's custody expenses by $1,231. During the period, credits reduced each class' transfer agent expense as noted in the table below.
| Transfer Agent
expense reduction | |
Class A | $ 17 | |
Annual Report
Notes to Financial Statements - continued
10. Other.
The Fund's organizational documents provide former and current trustees and officers with a limited indemnification against liabilities arising in connection with the performance of their duties to the Fund. In the normal course of business, the Fund may also enter into contracts that provide general indemnifications. The Fund's maximum exposure under these arrangements is unknown as this would be dependent on future claims that may be made against the Fund. The risk of material loss from such claims is considered remote.
In September 2006, FIIOC, the Fund's transfer agent, notified the Fund that the Fund's books and records did not reflect a conversion of certain Class B to Class A shares upon their conversion date. In March 2007, FIIOC converted the relevant Class B shares to Class A shares and recorded the conversion in the books and records of the Fund which did not result in a material impact to the Fund's reported net assets or results of operations in the accompanying financial statements. FIIOC has remediated affected shareholders and reimbursed the Fund for all related audit and legal expenses.
11. Distributions to Shareholders.
Distributions to shareholders of each class were as follows:
| Years ended October 31, |
| 2007 | 2006 |
From net investment income | | |
Class A | $ 5,613 | $ - |
Class T | 4,267 | - |
International Value | 956,069 | - |
Institutional Class | 12,567 | - |
Total | $ 978,516 | $ - |
From net realized gain | | |
Class A | $ 3,983 | $ - |
Class T | 4,693 | - |
Class B | 1,788 | - |
Class C | 4,566 | - |
International Value | 536,333 | - |
Institutional Class | 6,583 | - |
Total | $ 557,946 | $ - |
Annual Report
12. Share Transactions.
Transactions for each class of shares were as follows:
| Shares | Dollars |
| Years ended October 31, | Years ended October 31, |
| 2007 | 2006 A | 2007 | 2006 A |
Class A | | | | |
Shares sold | 556,341 | 146,231 | $ 6,434,905 | $ 1,461,870 |
Reinvestment of distributions | 863 | - | 9,431 | - |
Shares redeemed | (237,384) | (1,174) | (2,953,175) | (12,358) |
Net increase (decrease) | 319,820 | 145,057 | $ 3,491,161 | $ 1,449,512 |
Class T | | | | |
Shares sold | 281,943 | 169,119 | $ 3,296,913 | $ 1,688,142 |
Reinvestment of distributions | 806 | - | 8,796 | - |
Shares redeemed | (60,435) | (155) | (714,379) | (1,528) |
Net increase (decrease) | 222,314 | 168,964 | $ 2,591,330 | $ 1,686,614 |
Class B | | | | |
Shares sold | 114,852 | 123,455 | $ 1,342,524 | $ 1,231,876 |
Reinvestment of distributions | 151 | - | 1,653 | - |
Shares redeemed | (33,404) | (12) | (398,508) | (126) |
Net increase (decrease) | 81,599 | 123,443 | $ 945,669 | $ 1,231,750 |
Class C | | | | |
Shares sold | 337,076 | 207,502 | $ 3,929,869 | $ 2,072,374 |
Reinvestment of distributions | 319 | - | 3,483 | - |
Shares redeemed | (80,082) | (791) | (988,817) | (7,647) |
Net increase (decrease) | 257,313 | 206,711 | $ 2,944,535 | $ 2,064,727 |
International Value | | | | |
Shares sold | 26,426,338 | 22,776,737 | $ 309,978,984 | $ 228,163,833 |
Reinvestment of distributions | 127,337 | - | 1,391,798 | - |
Shares redeemed | (18,219,061) | (1,934,132) | (220,454,791) | (19,338,324) |
Net increase (decrease) | 8,334,614 | 20,842,605 | $ 90,915,991 | $ 208,825,509 |
Institutional Class | | | | |
Shares sold | 75,655 | 288,807 | $ 870,496 | $ 2,865,051 |
Reinvestment of distributions | 692 | - | 7,564 | - |
Shares redeemed | (61,819) | - | (714,302) | - |
Net increase (decrease) | 14,528 | 288,807 | $ 163,758 | $ 2,865,051 |
A For the period May 18, 2006 (commencement of operations) to October 31, 2006.
Annual Report
Report of Independent Registered Public Accounting Firm
To the Trustees of Fidelity Investment Trust and Shareholders of Fidelity International Value Fund:
We have audited the accompanying statement of assets and liabilities of Fidelity International Value Fund (the Fund), a fund of Fidelity Investment Trust, including the schedule of investments as of October 31, 2007, and the related statement of operations for the year then ended and the statement of changes in net assets and the financial highlights for the year then ended and the period May 18, 2006 (commencement of operations) to October 31, 2006 ended. These financial statements and financial highlights are the responsibility of the Fund's management. Our responsibility is to express an opinion on these financial statements and financial highlights based on our audits.
We conducted our audits in accordance with standards of the Public Company Accounting Oversight Board (United States). Those standards require that we plan and perform the audit to obtain reasonable assurance about whether the financial statements and financial highlights are free of material misstatement. The Fund is not required to have, nor were we engaged to perform, an audit of its internal control over financial reporting. Our audits included consideration of internal control over financial reporting as a basis for designing audit procedures that are appropriate in the circumstances, but not for the purpose of expressing an opinion on the effectiveness of the Fund's internal control over financial reporting. Accordingly, we express no such opinion. An audit also includes examining, on a test basis, evidence supporting the amounts and disclosures in the financial statements, assessing the accounting principles used and significant estimates made by management, as well as evaluating the overall financial statement presentation. Our procedures included confirmation of securities owned as of October 31, 2007, by correspondence with the custodians and brokers; where replies were not received from brokers, we performed other auditing procedures. We believe that our audits provide a reasonable basis for our opinion.
In our opinion, the financial statements and financial highlights referred to above present fairly, in all material respects, the financial position of Fidelity International Value Fund as of October 31, 2007, the results of its operations for the year then ended and the changes in its net assets and its financial highlights for the year then ended and the period May 18, 2006 (commencement of operations) to October 31, 2006, in conformity with accounting principles generally accepted in the United States of America.
/s/ Deloitte & Touche LLP
DELOITTE & TOUCHE LLP
Boston, Massachusetts
December 18, 2007
Annual Report
Trustees and Officers
The Trustees, Members of the Advisory Board, and executive officers of the trust and fund, as applicable, are listed below. The Board of Trustees governs the fund and is responsible for protecting the interests of shareholders. The Trustees are experienced executives who meet periodically throughout the year to oversee the fund's activities, review contractual arrangements with companies that provide services to the fund, and review the fund's performance. Except for James C. Curvey, each of the Trustees oversees 370 funds advised by FMR or an affiliate. Mr. Curvey oversees 340 funds advised by FMR or an affiliate.
The Trustees hold office without limit in time except that (a) any Trustee may resign; (b) any Trustee may be removed by written instrument, signed by at least two-thirds of the number of Trustees prior to such removal; (c) any Trustee who requests to be retired or who has become incapacitated by illness or injury may be retired by written instrument signed by a majority of the other Trustees; and (d) any Trustee may be removed at any special meeting of shareholders by a two-thirds vote of the outstanding voting securities of the trust. Each Trustee who is not an interested person (as defined in the 1940 Act) (Independent Trustee), shall retire not later than the last day of the calendar year in which his or her 72nd birthday occurs. The Independent Trustees may waive this mandatory retirement age policy with respect to individual Trustees. The executive officers and Advisory Board Members hold office without limit in time, except that any officer and Advisory Board Member may resign or may be removed by a vote of a majority of the Trustees at any regular meeting or any special meeting of the Trustees. Except as indicated, each individual has held the office shown or other offices in the same company for the past five years.
The fund's Statement of Additional Information (SAI) includes more information about the Trustees. To request a free copy, call Fidelity at 1-877-208-0098.
Interested Trustees*:
Correspondence intended for each Trustee who is an interested person may be sent to Fidelity Investments, 82 Devonshire Street, Boston, Massachusetts 02109.
Name, Age; Principal Occupation |
Edward C. Johnson 3d (77) |
| Year of Election or Appointment: 1984 Mr. Johnson is Chairman of the Board of Trustees. Mr. Johnson serves as President (2006-present), Chief Executive Officer, Chairman, and a Director of FMR LLC; Chairman and a Director of FMR; Chairman and a Director of Fidelity Research & Analysis Company (FRAC); Chairman and a Director of Fidelity Investments Money Management, Inc.; and Chairman (2001-present) and a Director of FMR Co., Inc. In addition, Mr. Johnson serves as Chairman and Director of Fidelity International Limited (FIL). |
James C. Curvey (72) |
| Year of Election or Appointment: 2007 Mr. Curvey also serves as Trustee (2007-present) or Member of the Advisory Board (2007-present) of other investment companies advised by FMR. Mr. Curvey is a Director of FMR and FMR Co., Inc. (2007-present). Mr. Curvey is also Vice Chairman (2006-present) and Director of FMR LLC. Mr. Curvey joined Fidelity in 1982 and served in numerous senior management positions, including President and Chief Operating Officer of FMR LLC (1997-2000) and President of Fidelity Strategic Investments (2000-2002). In addition, he serves as a member of the Board of Directors of Geerlings & Wade, Inc. (wine distribution). |
* Trustees have been determined to be "Interested Trustees" by virtue of, among other things, their affiliation with the trust or various entities under common control with FMR. FMR Corp. merged with FMR LLC on October 1, 2007. Any references to FMR LLC for prior periods are deemed to be references to the prior entity.
Independent Trustees:
Correspondence intended for each Independent Trustee (that is, the Trustees other than the Interested Trustees) may be sent to Fidelity Investments, P.O. Box 55235, Boston, Massachusetts 02205-5235.
Name, Age; Principal Occupation |
Dennis J. Dirks (59) |
| Year of Election or Appointment: 2005 Prior to his retirement in May 2003, Mr. Dirks was Chief Operating Officer and a member of the Board of The Depository Trust & Clearing Corporation (DTCC) (1999-2003). He also served as President, Chief Operating Officer, and Board member of The Depository Trust Company (DTC) (1999-2003) and President and Board member of the National Securities Clearing Corporation (NSCC) (1999-2003). In addition, Mr. Dirks served as Chief Executive Officer and Board member of the Government Securities Clearing Corporation (2001-2003) and Chief Executive Officer and Board member of the Mortgage-Backed Securities Clearing Corporation (2001-2003). Mr. Dirks also serves as a Trustee and a member of the Finance Committee of Manhattan College (2005-
present) and a Trustee and a member of the Finance Committee of AHRC of Nassau County (2006-present). |
Albert R. Gamper, Jr. (65) |
| Year of Election or Appointment: 2006 Prior to his retirement in December 2004, Mr. Gamper served as Chairman of the Board of CIT Group Inc. (commercial finance). During his tenure with CIT Group Inc. Mr. Gamper served in numerous senior management positions, including Chairman (1987-1989; 1999-2001; 2002-2004), Chief Executive Officer (1987-2004), and President (1989-2002). He currently serves as a member of the Board of Directors of Public Service Enterprise Group (utilities, 2001-present), Chairman of the Board of Governors, Rutgers University (2004-present), and Chairman of the Board of Saint Barnabas Health Care System. |
George H. Heilmeier (71) |
| Year of Election or Appointment: 2004 Dr. Heilmeier is Chairman Emeritus of Telcordia Technologies (communication software and systems), where prior to his retirement, he served as company Chairman and Chief Executive Officer. He currently serves on the Boards of Directors of The Mitre Corporation (systems engineering and information technology support for the government), and HRL Laboratories (private research and development, 2004-present). He is Chairman of the General Motors Science & Technology Advisory Board and a Life Fellow of the Institute of Electrical and Electronics Engineers (IEEE). Dr. Heilmeier is a member of the Defense Science Board and the National Security Agency Advisory Board. He is also a member of the National Academy of Engineering, the American Academy of Arts and Sciences, and the Board of Overseers of the School of Engineering and Applied Science of the University of Pennsylvania. Previously, Dr. Heilmeier served as a Director of TRW Inc. (automotive, space, defense, and information technology, 1992-2002), Compaq (1994-2002), Automatic Data Processing, Inc. (ADP) (technology-based business outsourcing, 1995-2002), INET Technologies Inc. (telecommunications network surveillance, 2001-2004), and Teletech Holdings (customer management services). He is the recipient of the 2005 Kyoto Prize in Advanced Technology for his invention of the liquid crystal display, and a member of the Consumer Electronics Hall of Fame. |
James H. Keyes (67) |
| Year of Election or Appointment: 2007 Prior to his retirement in 2003, Mr. Keyes was Chairman, President, and Chief Executive Officer of Johnson Controls, Inc. (automotive supplier, 1993-2003). He currently serves as a member of the boards of LSI Logic Corporation (semiconductor technologies), Navistar International Corporation (manufacture and sale of trucks, buses, and diesel engines, 2002-present), and Pitney Bowes, Inc. (integrated mail, messaging, and document management solutions). |
Marie L. Knowles (61) |
| Year of Election or Appointment: 2001 Prior to Ms. Knowles' retirement in June 2000, she served as Executive Vice President and Chief Financial Officer of Atlantic Richfield Company (ARCO) (diversified energy, 1996-2000). From 1993 to 1996, she was a Senior Vice President of ARCO and President of ARCO Transportation Company. She served as a Director of ARCO from 1996 to 1998. She currently serves as a Director of Phelps Dodge Corporation (copper mining and manufacturing) and McKesson Corporation (healthcare service, 2002-present). Ms. Knowles is a Trustee of the Brookings Institution and the Catalina Island Conservancy and also serves as a member of the Advisory Board for the School of Engineering of the University of Southern California. |
Ned C. Lautenbach (63) |
| Year of Election or Appointment: 2000 Mr. Lautenbach is Chairman of the Independent Trustees (2006-present). Mr. Lautenbach has been a partner of Clayton, Dubilier & Rice, Inc. (private equity investment firm) since September 1998. Previously, Mr. Lautenbach was with the International Business Machines Corporation (IBM) from 1968 until his retirement in 1998. Mr. Lautenbach serves as a Director of Sony Corporation (2006-present) and Eaton Corporation (diversified industrial) as well as the Philharmonic Center for the Arts in Naples, Florida. He also is a member of the Board of Trustees of Fairfield University (2005-present), as well as a member of the Council on Foreign Relations. |
Cornelia M. Small (63) |
| Year of Election or Appointment: 2005 Ms. Small is a member (2000-present) and Chairperson (2002-present) of the Investment Committee, and a member (2002-present) of the Board of Trustees of Smith College. Previously, she served as Chief Investment Officer (1999-2000), Director of Global Equity Investments (1996-1999), and a member of the Board of Directors of Scudder, Stevens & Clark (1990-1997) and Scudder Kemper Investments (1997-1999). In addition, Ms. Small served as Co-Chair (2000-2003) of the Annual Fund for the Fletcher School of Law and Diplomacy. |
William S. Stavropoulos (68) |
| Year of Election or Appointment: 2001 Mr. Stavropoulos is Chairman Emeritus of the Board of Directors of The Dow Chemical Company. Since joining The Dow Chemical Company in 1967, Mr. Stavropoulos served in numerous senior management positions, including President (1993-2000; 2002-2003), CEO (1995-2000; 2002-2004), and Chairman of the Executive Committee (2000-2004). Currently, he is a Director of NCR Corporation (data warehousing and technology solutions), Chemical Financial Corporation, Maersk Inc. (industrial conglomerate, 2002-present), Tyco International, Inc. (multinational manufacturing and services, 2007-present), and a member of the Advisory Board for Metalmark Capital (private equity investment firm, 2005-present). He is a special advisor to Clayton, Dubilier & Rice, Inc., a private equity investment firm. He also serves as a member of the Board of Trustees of the American Enterprise Institute for Public Policy Research. In addition, Mr. Stavropoulos is a member of The Business Council, J.P. Morgan International Council and the University of Notre Dame Advisory Council for the College of Science. |
Kenneth L. Wolfe (68) |
| Year of Election or Appointment: 2005 Prior to his retirement in 2001, Mr. Wolfe was Chairman and Chief Executive Officer of Hershey Foods Corporation (1993-2001). He currently serves as a member of the boards of Adelphia Communications Corporation (2003-present), Bausch & Lomb, Inc., and Revlon Inc. (2004-present). |
Advisory Board Members and Executive Officers**:
Correspondence intended for Mr. Mauriello, Mr. Thomas, and Mr. Wiley may be sent to Fidelity Investments, P.O. Box 55235, Boston, Massachusetts 02205-5235. Correspondence intended for each executive officer and Mr. Lynch may be sent to Fidelity Investments, 82 Devonshire Street, Boston, Massachusetts 02109.
Name, Age; Principal Occupation |
Peter S. Lynch (63) |
| Year of Election or Appointment: 2003 Member of the Advisory Board of Fidelity Investment Trust. Mr. Lynch is Vice Chairman and a Director of FMR, and Vice Chairman (2001-present) and a Director of FMR Co., Inc. Previously, Mr. Lynch served as a Trustee of the Fidelity funds (1990-2003). In addition, he serves as a Trustee of Boston College and as the Chairman of the Inner-City Scholarship Fund. |
Joseph Mauriello (63) |
| Year of Election or Appointment: 2007 Member of the Advisory Board of Fidelity Investment Trust. Prior to his retirement in January 2006, Mr. Mauriello served in numerous senior management positions including Deputy Chairman and Chief Operating Officer (2004-2005), and Vice Chairman of Financial Services (2002-2004) of KPMG LLP US (professional services firm, 1965-2005). Mr. Mauriello currently serves as a member of the Board of Directors of XL Capital Ltd., (global insurance and re-insurance company, 2006-present) and of Arcadia Resources Inc., (health care services and products, 2007-present). He also served as a Director of the Hamilton Funds of the Bank of New York (2006-2007). |
David M. Thomas (58) |
| Year of Election or Appointment: 2007 Member of the Advisory Board of Fidelity Investment Trust. Previously, Mr. Thomas served as Executive Chairman (2005-2006) and Chairman and Chief Executive Officer (2000-2005) of IMS Health, Inc. (pharmaceutical and healthcare information solutions). In addition, Mr. Thomas serves as a member of the Board of Directors of Fortune Brands, Inc. (consumer products holding company), and Interpublic Group of Companies, Inc. (marketing communication, 2004-present). |
Michael E. Wiley (57) |
| Year of Election or Appointment: 2007 Member of the Advisory Board of Fidelity Investment Trust. Mr. Wiley also serves as Sr. Energy Advisor of Katzenbach Partners, LLC (consulting firm, 2006-present) and a member of the Board of Trustees of the University of Tulsa (2000-2006; 2007-present). He serves as a Director of Tesoro Corporation (independent oil refiner and marketer, 2005-present), and a Director of Bill Barrett Corporation (exploration and production company, 2005-present). In addition, he also serves as a Director of Post Oak Bank (privately-held bank, 2004-present), and an Advisory Director of Riverstone Holdings (private investment firm). Previously, Mr. Wiley served as Chairman, President, and CEO of Baker Hughes, Inc. (oilfield services company, 2000-2004), and as Director of Spinnaker Exploration Company (exploration and production company, 2001-2005). |
Kimberley H. Monasterio (43) |
| Year of Election or Appointment: 2007 President and Treasurer of the fund. Ms. Monasterio also serves as President and Treasurer of other Fidelity funds (2007-present) and is an employee of FMR (2004-present). Previously, Ms. Monasterio served as Deputy Treasurer of the Fidelity funds (2004-2006). Before joining Fidelity Investments, Ms. Monasterio served as Treasurer (2000-2004) and Chief Financial Officer (2002-2004) of the Franklin Templeton Funds and Senior Vice President of Franklin Templeton Services, LLC (2000-2004). |
Walter C. Donovan (45) |
| Year of Election or Appointment: 2007 Vice President of the fund. Mr. Donovan also serves as Vice President of Fidelity's Equity Funds (2007-present). Mr. Donovan also serves as Executive Vice President of FMR (2005-present) and FMR Co., Inc. (2005-
present). Previously, Mr. Donovan served as Vice President of Fidelity's High Income Funds (2005-2007), Fixed-Income Funds (2005-2006), certain Asset Allocation Funds (2005-2006), certain Balanced Funds (2005-
2006), and as Vice President and Director of Fidelity's International Equity Trading group (1998-2005). |
Eric M. Wetlaufer (45) |
| Year of Election or Appointment: 2006 Vice President of the fund. Mr. Wetlaufer also serves as Vice President of certain International Equity Funds (2006-present). Mr. Wetlaufer is Senior Vice President of FMR (2006-present) and FMR Co., Inc. (2006-present), and President and Director of Fidelity Management & Research (U.K.) Inc. (2006-present) and Fidelity Research & Analysis Company (2006-
present). Before joining Fidelity Investments in 2005, Mr. Wetlaufer was a partner in Oxhead Capital Management (2004-2005). Previously, Mr. Wetlaufer served as a Chief Investment Officer of Putnam Investments (1997-2003). |
Eric D. Roiter (58) |
| Year of Election or Appointment: 2006 Secretary of the fund. He also serves as Secretary of other Fidelity funds; Vice President, General Counsel, and Secretary of FMR Co., Inc. (2001-present) and FMR; Assistant Secretary of Fidelity Management & Research (U.K.) Inc. (2001-present), Fidelity Research & Analysis Company (2001-present), and Fidelity Investments Money Management, Inc. (2001-present). Mr. Roiter is an Adjunct Member, Faculty of Law, at Boston College Law School (2003-present). Previously, Mr. Roiter served as Vice President and Secretary of Fidelity Distributors Corporation (FDC) (1998-2005). |
Scott C. Goebel (39) |
| Year of Election or Appointment: 2007 Assistant Secretary of the fund. Mr. Goebel also serves as Assistant Secretary of other Fidelity funds (2007-present), and is an employee of FMR. |
R. Stephen Ganis (41) |
| Year of Election or Appointment: 2006 Anti-Money Laundering (AML) officer of the fund. Mr. Ganis also serves as AML officer of other Fidelity funds (2006-present) and FMR LLC (2003-present). Before joining Fidelity Investments, Mr. Ganis practiced law at Goodwin Procter, LLP (2000-2002). |
Joseph B. Hollis (59) |
| Year of Election or Appointment: 2006 Chief Financial Officer of the fund. Mr. Hollis also serves as Chief Financial Officer of other Fidelity funds. Mr. Hollis is President of Fidelity Pricing and Cash Management Services (FPCMS) (2005-present). Mr. Hollis also serves as President and Director of Fidelity Service Company, Inc. (2006-present). Previously, Mr. Hollis served as Senior Vice President of Cash Management Services (1999-2002) and Investment Management Operations (2002-2005). |
Kenneth A. Rathgeber (60) |
| Year of Election or Appointment: 2006 Chief Compliance Officer of the fund. Mr. Rathgeber also serves as Chief Compliance Officer of other Fidelity funds (2004-present) and Executive Vice President of Risk Oversight for Fidelity Investments (2002-
present). He is Chief Compliance Officer of FMR (2005-present), FMR Co., Inc. (2005-present), Fidelity Management & Research (U.K.) Inc. (2005-present), Fidelity Research & Analysis Company (2005-present), Fidelity Investments Money Management, Inc. (2005-present), and Strategic Advisers, Inc. (2005-present). Previously, Mr. Rathgeber served as Executive Vice President and Chief Operating Officer for Fidelity Investments Institutional Services Company, Inc. (1998-2002). |
Bryan A. Mehrmann (46) |
| Year of Election or Appointment: 2006 Deputy Treasurer of the fund. Mr. Mehrmann also serves as Deputy Treasurer of other Fidelity funds (2005-present) and is an employee of FMR. Previously, Mr. Mehrmann served as Vice President of Fidelity Investments Institutional Services Group (FIIS)/Fidelity Investments Institutional Operations Corporation, Inc. (FIIOC) Client Services (1998-2004). |
Kenneth B. Robins (38) |
| Year of Election or Appointment: 2006 Deputy Treasurer of the fund. Mr. Robins also serves as Deputy Treasurer of other Fidelity funds (2005-present) and is an employee of FMR (2004-present). Before joining Fidelity Investments, Mr. Robins worked at KPMG LLP, where he was a partner in KPMG's department of professional practice (2002-2004) and a Senior Manager (1999-2000). In addition, Mr. Robins served as Assistant Chief Accountant, United States Securities and Exchange Commission (2000-2002). |
Robert G. Byrnes (40) |
| Year of Election or Appointment: 2006 Assistant Treasurer of the fund. Mr. Byrnes also serves as Assistant Treasurer of other Fidelity funds (2005-present) and is an employee of FMR (2005-present). Previously, Mr. Byrnes served as Vice President of FPCMS (2003-2005). Before joining Fidelity Investments, Mr. Byrnes worked at Deutsche Asset Management where he served as Vice President of the Investment Operations Group (2000-2003). |
Peter L. Lydecker (53) |
| Year of Election or Appointment: 2006 Assistant Treasurer of the fund. Mr. Lydecker also serves as Assistant Treasurer of other Fidelity funds (2004) and is an employee of FMR. |
Paul M. Murphy (60) |
| Year of Election or Appointment: 2007 Assistant Treasurer of the fund. Mr. Murphy also serves as Assistant Treasurer of other Fidelity funds (2007-present) and is an employee of FMR (2007-present). Previously, Mr. Murphy served as Chief Financial Officer of the Fidelity Funds (2005-2006), Vice President and Associate General Counsel of FMR (2007), and Senior Vice President of Fidelity Pricing and Cash Management Services Group (FPCMS) (1994-2007). |
Gary W. Ryan (49) |
| Year of Election or Appointment: 2006 Assistant Treasurer of the fund. Mr. Ryan also serves as Assistant Treasurer of other Fidelity funds (2005-present) and is an employee of FMR (2005-present). Previously, Mr. Ryan served as Vice President of Fund Reporting in FPCMS (1999-2005). |
** FMR Corp. merged with FMR LLC on October 1, 2007. Any references to FMR LLC for prior periods are deemed to be references to the prior entity.
Annual Report
Distributions
The Board of Trustees of Advisor International Value Fund voted to pay to shareholders of record at the opening of business on record date, the following distributions per share derived from capital gains realized from sales of portfolio securities, and dividends derived from net investment income:
| Pay Date | Record Date | Dividends | Capital Gains |
Class A | 12/10/07 | 12/7/07 | $0.149 | $0.62 |
Class T | 12/10/07 | 12/7/07 | $0.135 | $0.62 |
Class B | 12/10/07 | 12/7/07 | $0.076 | $0.62 |
Class C | 12/10/07 | 12/7/07 | $0.079 | $0.62 |
The fund hereby designates as a capital gain dividend with respect to the taxable year ended October 31, 2007, $10,388,114, or, if subsequently determined to be different, the net capital gain of such year.
Class A, Class T, Class B, and Class C designates 100% of the dividends distributed during the fiscal year as amounts which may be taken into account as a dividend for purposes of the maximum rate under section 1(h)(11) of the Internal Revenue Code.
The amounts per share which represent income derived from sources within, and taxes paid to, foreign countries or possessions of the United States are as follows:
| Pay Date | Income | Taxes |
Class A | 12/11/2006 | $0.014 | $0.0029 |
Class T | 12/11/2006 | $0.011 | $0.0029 |
Class B | 12/11/2006 | $0.004 | $0.0029 |
Class C | 12/11/2006 | $0.005 | $0.0029 |
The fund will notify shareholders in January 2008 of amounts for use in preparing 2007 income tax returns.
Annual Report
Board Approval of Investment Advisory Contracts and Management Fees
Fidelity International Value Fund
Each year, typically in July, the Board of Trustees, including the Independent Trustees (together, the Board), votes on the renewal of the management contract and sub-advisory agreements (together, the Advisory Contracts) for the fund. The Board, assisted by the advice of fund counsel and Independent Trustees' counsel, requests and considers a broad range of information throughout the year.
The Board meets regularly each month except August and takes into account throughout the year matters bearing on Advisory Contracts. The Board, acting directly and through its separate committees, considers at each of its meetings factors that are relevant to the annual renewal of the fund's Advisory Contracts, including the services and support provided to the fund and its shareholders. At the time of the renewal, the Board had 12 standing committees, each composed of Independent Trustees with varying backgrounds, to which the Board has assigned specific subject matter responsibilities in order to enhance effective decision-making by the Board. Each committee has adopted a written charter outlining the structure and purposes of the committee. One such committee, the Equity Contract Committee, meets periodically as needed throughout the year to consider matters specifically related to the annual renewal of Advisory Contracts. The committee requests and receives information on, and makes recommendations to the Independent Trustees concerning, the approval and annual review of the Advisory Contracts.
At its July 2007 meeting, the Board of Trustees, including the Independent Trustees, unanimously determined to renew the Advisory Contracts for the fund. In reaching its determination, the Board considered all factors it believed relevant, including (i) the nature, extent, and quality of the services to be provided to the fund and its shareholders (including the investment performance of the fund); (ii) the competitiveness of the management fee and total expenses of the fund; (iii) the total costs of the services to be provided by and the profits to be realized by the investment adviser and its affiliates from the relationship with the fund; (iv) the extent to which economies of scale would be realized as the fund grows; and (v) whether fee levels reflect these economies of scale, if any, for the benefit of fund shareholders. The Board also approved amendments to the fund's agreements with foreign sub-advisers to clarify that each sub-adviser provides services as an independent contractor.
In determining whether to renew the Advisory Contracts for the fund, the Board ultimately reached a determination, with the assistance of fund counsel and Independent Trustees' counsel, that the renewal of the Advisory Contracts and the compensation to be received by Fidelity under the management contract is consistent with Fidelity's fiduciary duty under applicable law. In addition to evaluating the specific factors noted above, the Board, in reaching its determination, is aware that shareholders in the fund have a broad range of investment choices available to them, including a wide choice among mutual funds offered by competitors to Fidelity, and that the fund's shareholders, with the opportunity to review and weigh the disclosure provided by the fund in its prospectus and other public disclosures, have chosen to invest in this fund, managed by Fidelity.
Annual Report
Board Approval of Investment Advisory Contracts and
Management Fees - continued
Nature, Extent, and Quality of Services Provided. The Board considered staffing within the investment adviser, FMR, and the sub-advisers (together, the Investment Advisers), including the background of the fund's portfolio manager and the fund's investment objective and discipline. The Independent Trustees also had discussions with senior management of Fidelity's investment operations and investment groups. The Board considered the structure of the portfolio manager compensation program and whether this structure provides appropriate incentives.
Resources Dedicated to Investment Management and Support Services. The Board reviewed the size, education, and experience of the Investment Advisers' investment staff, their use of technology, and the Investment Advisers' approach to recruiting, training, and retaining portfolio managers and other research, advisory, and management personnel. The Board considered Fidelity's extensive global research capabilities that enable the Investment Advisers to aggregate data from various sources in an effort to produce positive investment results. The Board noted that Fidelity's analysts have access to a variety of technological tools that enable them to perform both fundamental and quantitative analysis and to specialize in various disciplines. The Board also considered that Fidelity's portfolio managers and analysts have access to daily portfolio attribution that allows for monitoring of a fund's portfolio, as well as an electronic communication system that provides immediate real-time access to research concerning issuers and credit enhancers.
Shareholder and Administrative Services. The Board considered (i) the nature, extent, quality, and cost of advisory, administrative, distribution, and shareholder services performed by the Investment Advisers and their affiliates under the Advisory Contracts and under separate agreements covering transfer agency, pricing and bookkeeping, and securities lending services for the fund; (ii) the nature and extent of the Investment Advisers' supervision of third party service providers, principally custodians and subcustodians; and (iii) the resources devoted to, and the record of compliance with, the fund's compliance policies and procedures. The Board reviewed the allocation of fund brokerage, including allocations to brokers affiliated with the Investment Advisers, the use of brokerage commissions to pay fund expenses, and the use of "soft" commission dollars to pay for research services. The Board also considered that Fidelity voluntarily pays for market data out of its own resources.
The Board noted that the growth of fund assets across the complex allows Fidelity to reinvest in the development of services designed to enhance the value or convenience of the Fidelity funds as investment vehicles. These services include 24-hour access to account information and market information through phone representatives and over the Internet, and investor education materials and asset allocation tools.
Annual Report
Investment in a Large Fund Family. The Board considered the benefits to shareholders of investing in a Fidelity fund, including the benefits of investing in a fund that is part of a large family of funds offering a variety of investment disciplines and providing for a large variety of mutual fund investor services. For example, fund shareholders are offered the privilege of exchanging shares of the fund for shares of other Fidelity funds, as set forth in the fund's prospectus, without paying a sales charge. The Board noted that, since July 2006, Fidelity has taken a number of actions that benefited particular funds, including (i) dedicating additional resources to investment research and to restructure the investment research teams; (ii) contractually agreeing to reduce the management fee on Fidelity Advisor Floating Rate High Income Fund; (iii) contractually agreeing to reduce the management fees on Fidelity's California, Massachusetts, New Jersey, and New York AMT Tax-Free Money Market Funds, launching new Institutional Classes and Service Classes of these funds, and contractually agreeing to impose expense limitations on these funds; (iv) eliminating the exchange fee on the Fidelity Select Portfolios and reducing the pricing and bookkeeping fee rates for these funds; (v) reducing the maximum transfer agency fee rates on high income funds and certain equity funds; (vi) proposing amended management contracts that, if approved by shareholders, will add a performance adjustment component to the management fees paid by 18 Fidelity Advisor equity funds; (vii) contractually agreeing to reduce fees for Ultra-Short Central Fund and the money market Central Funds; (viii) waiving the Fidelity Advisor funds' contingent deferred sales charge on certain redemptions made through systematic withdrawal programs; and (ix) amending the management contracts for equity and fixed-income funds whose management contracts incorporate a "group fee" structure by adding four new fee "breakpoints" to the group fee rate schedules.
Investment Performance and Compliance. The Board considered whether the fund has operated within its investment objective, as well as its record of compliance with its investment restrictions. The Board noted that it is not possible to evaluate performance in any comprehensive fashion because the fund had been in operation for less than one calendar year. Once the fund has been in operation for at least one calendar year, the Board will review the fund's absolute investment performance for each class, as well as the fund's relative investment performance for each class measured against a broad-based securities market index and a peer group of mutual funds.
The Board considered that FMR has taken steps to refocus and strengthen equity research, equity portfolio management, and compliance.
Based on its review, and giving particular weight to the nature and quality of the resources dedicated by the Investment Advisers to maintain and improve relative performance, the Board concluded that the nature, extent, and quality of the services provided to the fund will benefit the fund's shareholders, particularly in light of the Board's view that the fund's shareholders benefit from investing in a fund that is part of a large family of funds offering a variety of investment disciplines and services.
Annual Report
Board Approval of Investment Advisory Contracts and
Management Fees - continued
Competitiveness of Management Fee and Total Fund Expenses. The Board considered the fund's management fee and total expenses compared to "mapped groups" of competitive funds and classes. Fidelity creates "mapped groups" by combining similar Lipper investment objective categories that have comparable management fee characteristics. Combining Lipper investment objective categories aids the Board's management fee and total expense comparisons by broadening the competitive group used for comparison and by reducing the number of universes to which various Fidelity funds are compared. The Board also considered supplemental information about how the fund's management fee and total expenses ranked relative to groups based on Lipper classifications, which take into account a fund's market capitalization and style.
The Board considered two proprietary management fee comparisons for the period of the fund's operations shown in the chart below. The group of Lipper funds used by the Board for management fee comparisons is referred to below as the "Total Mapped Group." The Total Mapped Group comparison focuses on a fund's standing relative to the total universe of comparable funds available to investors, in terms of gross management fees before expense reimbursements or caps. "TMG %" represents the percentage of funds in the Total Mapped Group that had management fees that were lower than the fund's. For example, a TMG % of 15% means that 85% of the funds in the Total Mapped Group had higher management fees than the fund. The "Asset-Size Peer Group" (ASPG) comparison focuses on a fund's standing relative to non-Fidelity funds similar in size to the fund within the Total Mapped Group. The ASPG represents at least 15% of the funds in the Total Mapped Group with comparable asset size and management fee characteristics, subject to a minimum of 50 funds (or all funds in the Total Mapped Group if fewer than 50). Additional information, such as the ASPG quartile in which the fund's management fee ranked, is also included in the chart and considered by the Board.
Annual Report
Fidelity International Value Fund

The Board noted that the fund's management fee ranked below the median of its Total Mapped Group and below the median of its ASPG for the period.
Based on its review, the Board concluded that the fund's management fee was fair and reasonable in light of the services that the fund receives and the other factors considered.
In its review of each class's total expenses, the Board considered the fund's management fee as well as other fund or class expenses, as applicable, such as transfer agent fees, pricing and bookkeeping fees, fund-paid 12b-1 fees, and custodial, legal, and audit fees. The Board also noted the effects of any waivers and reimbursements on fees and expenses. As part of its review, the Board also considered current and historical total expenses of each class of the fund compared to competitive fund median expenses. Each class of the fund is compared to those funds and classes in the Total Mapped Group (used by the Board for management fee comparisons) that have a similar sales load structure.
The Board noted that the total expenses of each of Class A and Fidelity International Value (retail class) ranked below its competitive median for the period, the total expenses of each of Class B and Class C ranked equal to its competitive median for the period, and the total expenses of each of Class T and Institutional Class ranked above its competitive median for the period. The Board noted that the fund offers multiple classes, each of which has a different sales load and 12b-1 fee structure, and that the multiple structures are intended to offer a range of pricing options for the intermediary market. The Board also noted that the total expenses of the classes vary primarily by the level of their 12b-1 fees, although differences in transfer agent fees may also cause expenses to vary from class to class.
Annual Report
Board Approval of Investment Advisory Contracts and
Management Fees - continued
In its review of total expenses, the Board also considered Fidelity fee structures and other information on clients that FMR and its affiliates service in other competitive markets, such as other mutual funds advised or subadvised by FMR or its affiliates, pension plan clients, and other institutional clients.
Based on its review, the Board concluded that the total expenses of each class of the fund were reasonable, although in some cases above the median of the universe presented for comparison, in light of the services that the fund and its shareholders receive and the other factors considered.
Costs of the Services and Profitability. The Board considered the revenues earned and the expenses incurred by Fidelity in conducting the business of developing, marketing, distributing, managing, administering and servicing the fund and its shareholders. The Board also considered the level of Fidelity's profits in respect of all the Fidelity funds.
On an annual basis, FMR presents to the Board Fidelity's profitability for the fund. Fidelity calculates the profitability for each fund, as well as aggregate profitability for groups of Fidelity funds and all Fidelity funds, using a series of detailed revenue and cost allocation methodologies which originate with the audited books and records of Fidelity. The Audit Committee of the Board reviews any significant changes from the prior year's methodologies.
PricewaterhouseCoopers LLP (PwC), independent registered public accounting firm and auditor to Fidelity and certain Fidelity funds, has been engaged annually by the Board as part of the Board's assessment of the results of Fidelity's profitability analysis. PwC's engagement includes the review and assessment of Fidelity's methodologies used in determining the revenues and expenses attributable to Fidelity's mutual fund business, and completion of agreed-upon procedures surrounding the mathematical accuracy of fund profitability and its conformity to allocation methodologies. After considering PwC's reports issued under the engagement and information provided by Fidelity, the Board believes that while other allocation methods may also be reasonable, Fidelity's profitability methodologies are reasonable in all material respects.
The Board has also reviewed Fidelity's non-fund businesses and any fall-out benefits related to the mutual fund business as well as cases where Fidelity's affiliates may benefit from or be related to the fund's business.
The Board considered the costs of the services provided by and the profits realized by Fidelity in connection with the operation of the fund and determined that the amount of profit is a fair entrepreneurial profit for the management of the fund.
Economies of Scale. The Board considered whether there have been economies of scale in respect of the management of the Fidelity funds, whether the Fidelity funds (including the fund) have appropriately benefited from any such economies of scale, and whether there is potential for realization of any further economies of scale. The Board considered the extent to which the fund will benefit from economies of scale through increased services to the fund, through waivers or reimbursements, or through fee or expense reductions, including reductions that occur through operation of the transfer agent agreement. The transfer agent fee varies in part based on the number of accounts in the fund. If the number of accounts decreases or the average account size increases, the overall transfer agent fee rate decreases.
Annual Report
The Board recognized that the fund's management contract incorporates a "group fee" structure, which provides for lower group fee rates as total fund assets under FMR's management increase, and for higher group fee rates as total fund assets under FMR's management decrease. FMR determines the group fee rates based on a tiered asset "breakpoint" schedule. In connection with the renewal of the fund's management contract, the Board approved amendments to the fund's management contract that added four new fee breakpoints to the group fee rate schedule for assets under FMR's management above $1,386 billion. The Board considered that the group fee rate declines under both the present and amended schedules, but that under the amended schedule, the group fee rate declines faster as assets under FMR's management exceed $1,386 billion. The Board considered that the group fee is designed to deliver the benefits of economies of scale to fund shareholders when total fund assets increase, even if assets of any particular fund are unchanged or have declined, because some portion of Fidelity's costs are attributable to services provided to all Fidelity funds, and all funds benefit if those costs can be allocated among more assets. The Board concluded that, given the group fee structure, fund shareholders will achieve a certain level of economies of scale as assets under FMR's management increase at the fund complex level, regardless of whether Fidelity achieves any such economies of scale.
The Board further concluded that any potential economies of scale are being shared between fund shareholders and Fidelity in an appropriate manner.
Additional Information Requested by the Board. In order to develop fully the factual basis for consideration of the Fidelity funds' Advisory Contracts, the Board requested and received additional information on several topics, including (i) fund performance trends and actions to be taken by FMR to improve certain funds' overall performance; (ii) Fidelity's portfolio manager compensation structure, including its effects on fund profitability and the extent to which portfolio manager compensation is linked to fund performance; (iii) Fidelity's fee structures; (iv) the funds' sub-advisory arrangements; and (v) accounts managed by Fidelity other than the Fidelity funds.
Based on its evaluation of all of the conclusions noted above, and after considering all material factors, the Board ultimately concluded that the advisory fee structures are fair and reasonable, and that the fund's Advisory Contracts should be renewed.
Annual Report
Annual Report
Annual Report
Annual Report
Annual Report
Annual Report
Annual Report
Investment Adviser
Fidelity Management & Research Company
Boston, MA
Investment Sub-Advisers
FMR Co., Inc.
Fidelity Management & Research
(U.K.) Inc.
Fidelity Research & Analysis Company
Fidelity International
Investment Advisors
Fidelity Investments Japan Limited
Fidelity International Investment Advisors (U.K.) Limited
General Distributor
Fidelity Distributors Corporation
Boston, MA
Transfer and Service Agents
Fidelity Investments Institutional Operations Company, Inc.
Boston, MA
Fidelity Service Company, Inc.
Boston, MA
Custodian
The Northern Trust Company
Chicago, IL
AFIV-UANN-1207
1.827496.101
(Fidelity Investment logo)(registered trademark)
Corporate Headquarters
82 Devonshire St., Boston, MA 02109
www.fidelity.com
(Fidelity Investment logo)(registered trademark)
Fidelity Advisor
International Value
Fund - Institutional Class
Annual Report
October 31, 2007
Institutional Class is
a class of Fidelity®
International Value Fund
(2_fidelity_logos) (Registered_Trademark)
Contents
Chairman's Message | <Click Here> | Ned Johnson's message to shareholders. |
Performance | <Click Here> | How the fund has done over time. |
Management's Discussion | <Click Here> | The manager's review of fund performance, strategy and outlook. |
Shareholder Expense Example | <Click Here> | An example of shareholder expenses. |
Investment Changes | <Click Here> | A summary of major shifts in the fund's investments over the past six months. |
Investments | <Click Here> | A complete list of the fund's investments with their market values. |
Financial Statements | <Click Here> | Statements of assets and liabilities, operations, and changes in net assets,
as well as financial highlights. |
Notes | <Click Here> | Notes to the financial statements. |
Report of Independent Registered Public Accounting Firm | <Click Here> | |
Trustees and Officers | <Click Here> | |
Distributions | <Click Here> | |
Board Approval of Investment Advisory Contracts and Management Fees | <Click Here> | |
To view a fund's proxy voting guidelines and proxy voting record for the 12-month period ended June 30, visit http://www.fidelity.com (search for "proxy voting guidelines") or visit the Securities and Exchange Commission's (SEC) web site at http://www.sec.gov. You may also call 1-800-544-8544 to request a free copy of the proxy voting guidelines.
Standard & Poor's, S&P and S&P 500 are registered service marks of The McGraw-Hill Companies, Inc. and have been licensed for use by Fidelity Distributors Corporation.
Other third party marks appearing herein are the property of their respective owners.
All other marks appearing herein are registered or unregistered trademarks or service marks of FMR LLC or an affiliated company.
Annual Report
This report and the financial statements contained herein are submitted for the general information of the shareholders of the fund. This report is not authorized for distribution to prospective investors in the fund unless preceded or accompanied by an effective prospectus.
A fund files its complete schedule of portfolio holdings with the SEC for the first and third quarters of each fiscal year on Form N-Q. Forms N-Q are available on the SEC's web site at http://www.sec.gov. A fund's Forms N-Q may be reviewed and copied at the SEC's Public Reference Room in Washington, DC. Information regarding the operation of the SEC's Public Reference Room may be obtained by calling 1-800-SEC-0330. For a complete list of a fund's portfolio holdings, view the most recent holdings listing, semiannual report, or annual report on Fidelity's web site at http://www.fidelity.com or http://www.advisor.fidelity.com, as applicable.
NOT FDIC INSURED · MAY LOSE VALUE · NO BANK GUARANTEE
Neither the fund nor Fidelity Distributors Corporation is a bank.
Annual Report
Chairman's Message
(photo_of_Edward_C_Johnson_3d)
Dear Shareholder:
Many stock and bond markets around the world have been unsettled of late; however, volatility can often lead to opportunity for patient investors. Financial markets are always unpredictable, but there are a number of time-tested principles that can put the historical odds in your favor.
One of the basic tenets is to invest for the long term. Over time, riding out the markets' inevitable ups and downs has proven much more effective than selling into panic or chasing the hottest trend. Even missing only a few of the markets' best days can significantly diminish investor returns. Patience also affords the benefits of compounding - of earning interest on additional income or reinvested dividends and capital gains. There are tax advantages and cost benefits to consider as well. The more you sell, the more taxes you pay, and the more you trade, the higher the costs. While staying the course doesn't eliminate risk, it can considerably lessen the effect of short-term declines.
You can further manage your investing risk through diversification. And today, more than ever, geographic diversification should be taken into account. Studies indicate that asset allocation is the single most important determinant of a portfolio's long-term success. The right mix of stocks, bonds and cash - aligned to your particular risk tolerance and investment objective - is very important. Age-appropriate rebalancing is also an essential aspect of asset allocation. For younger investors, an emphasis on equities - which historically have been the best-performing asset class over time - is encouraged. As investors near their specific goal, such as retirement or sending a child to college, consideration may be given to replacing volatile assets (e.g. common stocks) with more-stable fixed investments (bonds or savings plans).
A third investment principle - investing regularly - can help lower the average cost of your purchases. Investing a certain amount of money each month or quarter helps ensure you won't pay for all your shares at market highs. This strategy - known as dollar cost averaging - also reduces unconstructive "emotion" from investing, helping shareholders avoid selling weak performers just prior to an upswing, or chasing a hot performer just before a correction.
We invite you to contact us via the Internet, through our Investor Centers or over the phone. It is our privilege to provide you the information you need to make the investments that are right for you.
Sincerely,
/s/Edward C. Johnson 3d
Edward C. Johnson 3d
Annual Report
Performance: The Bottom Line
Average annual total return reflects the change in the value of an investment, assuming reinvestment of the fund's dividend income and capital gains (the profits earned upon the sale of securities that have grown in value) and assuming a constant rate of performance each year. The $10,000 table and the fund's returns do not reflect the deduction of taxes that a shareholder would pay on fund distributions or the redemption of fund shares. During periods of reimbursement by Fidelity, a fund's total return will be greater than it would be had the reimbursement not occurred. How a fund did yesterday is no guarantee of how it will do tomorrow.
Average Annual Total Returns
Periods ended October 31, 2007 | Past 1
year | Life of
fundA |
Institutional Class | 23.91% | 20.69% |
A From May 18, 2006.
$10,000 Over Life of Fund
Let's say hypothetically that $10,000 was invested in Fidelity Advisor International Value Fund - Institutional Class on May 18, 2006, when the fund started. The chart shows how the value of your investment would have changed, and also shows how the Morgan Stanley Capital InternationalSM Europe, Australasia, Far East (MSCI® EAFE®) Value Index performed over the same period.
Annual Report
Management's Discussion of Fund Performance
Comments from George Stairs, Portfolio Manager of Fidelity Advisor International Value Fund
Foreign stocks, with a large assist from a weak U.S. dollar, generally had higher returns for U.S. investors than domestic equities during the 12-month period ending October 31, 2007. The backdrop for global stocks was solid, with robust economic growth and relatively high corporate profitability worldwide. Developed international equity markets, as measured by the Morgan Stanley Capital InternationalSM Europe, Australasia, and Far East (MSCI® EAFE®) Index - a performance monitor of established markets outside the United States and Canada - rose 25.09%. In comparison, the Standard & Poor's 500SM Index, a gauge of U.S. stocks, was up 14.56%. Among countries making up at least 1% of the EAFE benchmark, Finland had the best showing, soaring nearly 69%, while Hong Kong gained roughly 66%. The United Kingdom and Japan, the two largest components of the index, both underperformed. Fallout from the credit crunch and concerns about export growth tempered UK stocks, while Japan struggled with a slowdown in consumer spending and sluggish domestic growth. Emerging markets were the period's big winners, advancing 68.33% as measured by the MSCI Emerging Markets index.
The fund's Institutional Class shares performed well, returning 23.91% for the year and solidly outpacing the 21.53% gain of the benchmark MSCI EAFE Value index on the basis of productive stock picking across a variety of sectors. The best results came from within the energy, industrials, materials and utilities sectors, with good picks in consumer staples and consumer discretionary also helping. Geographically, our best results came from the Americas, mainly Brazil, Cayman Islands and Canada, with good picks in the European region as well, particularly in the United Kingdom and France. Among the top-performing stocks were Japanese trading firm Mitsui & Co.; UK-listed miner BHP Billiton; Brazilian energy producer Petrobras; and German electric utility E.ON. The fund's relative return was tempered by a few unfavorable picks in the financials sector, especially among banks, as well as by some weak holdings in the pharmaceuticals, biotechnology and life science segment of health care. Notable detractors included Japanese leasing and consumer lending firm ORIX; Japanese megabank Mizuho Financial; and an underweighted position in Dutch banking company ABN AMRO, which rose on takeover speculation. ABN AMRO was no longer in the portfolio at period end.
The views expressed above reflect those of the portfolio manager(s) only through the end of the period as stated on the cover of this report and do not necessarily represent the views of Fidelity or any other person in the Fidelity organization. Any such views are subject to change at any time based upon market or other conditions and Fidelity disclaims any responsibility to update such views. These views may not be relied on as investment advice and, because investment decisions for a Fidelity fund are based on numerous factors, may not be relied on as an indication of trading intent on behalf of any Fidelity fund.
Annual Report
Shareholder Expense Example
As a shareholder of the Fund, you incur two types of costs: (1) transaction costs, including sales charges (loads) on purchase payments or redemption proceeds, redemption fees, and (2) ongoing costs, including management fees, distribution and/or service (12b-1) fees and other Fund expenses. This Example is intended to help you understand your ongoing costs (in dollars) of investing in the Fund and to compare these costs with the ongoing costs of investing in other mutual funds.
The Example is based on an investment of $1,000 invested at the beginning of the period and held for the entire period (May 1, 2007 to October 31, 2007).
Actual Expenses
The first line of the accompanying table for each class of the Fund provides information about actual account values and actual expenses. You may use the information in this line, together with the amount you invested, to estimate the expenses that you paid over the period. Simply divide your account value by $1,000.00 (for example, an $8,600 account value divided by $1,000.00 = 8.6), then multiply the result by the number in the first line for a class of the Fund under the heading entitled "Expenses Paid During Period" to estimate the expenses you paid on your account during this period. A small balance maintenance fee of $12.00 that is charged once a year may apply for certain accounts with a value of less than $2,000. This fee is not included in the table below. If it was, the estimate of expenses you paid during the period would be higher, and your ending account value lower, by this amount. In addition, the Fund, as a shareholder in the underlying Fidelity Central Funds, will indirectly bear its pro rata share of the fees and expenses incurred by the underlying Fidelity Central Funds. These fees and expenses are not included in the Fund's annualized expense ratio used to calculate the expense estimate in the table below.
Hypothetical Example for Comparison Purposes
The second line of the accompanying table for each class of the Fund provides information about hypothetical account values and hypothetical expenses based on a Class' actual expense ratio and an assumed rate of return of 5% per year before expenses, which is not the Class' actual return. The hypothetical account values and expenses may not be used to estimate the actual ending account balance or expenses you paid for the period. You may use this information to compare the ongoing costs of investing in the Fund and other funds. To do so, compare this 5% hypothetical example with the 5% hypothetical examples that appear in the shareholder reports of the other funds. A small balance maintenance fee of $12.00 that is charged once a year may apply for certain accounts with a value of less than $2,000. This fee is not included in the table below. If it was, the estimate of expenses you paid during the period would be higher, and your ending account value lower, by this amount. In addition, the Fund, as a shareholder in the underlying Fidelity Central Funds, will indirectly bear its pro rata share of the fees and expenses incurred by the underlying Fidelity Central Funds. These fees and expenses are not included in the Fund's annualized expense ratio used to calculate the expense estimate in the table below.
Annual Report
Shareholder Expense Example - continued
Please note that the expenses shown in the table are meant to highlight your ongoing costs only and do not reflect any transaction costs. Therefore, the second line of the table is useful in comparing ongoing costs only, and will not help you determine the relative total costs of owning different funds. In addition, if these transactional costs were included, your costs would have been higher.
| Beginning
Account Value
May 1, 2007 | Ending
Account Value
October 31, 2007 | Expenses Paid
During Period*
May 1, 2007 to
October 31, 2007 |
Class A | | | |
Actual | $ 1,000.00 | $ 1,082.30 | $ 7.14 |
HypotheticalA | $ 1,000.00 | $ 1,018.35 | $ 6.92 |
Class T | | | |
Actual | $ 1,000.00 | $ 1,080.70 | $ 8.23 |
HypotheticalA | $ 1,000.00 | $ 1,017.29 | $ 7.98 |
Class B | | | |
Actual | $ 1,000.00 | $ 1,078.40 | $ 10.90 |
HypotheticalA | $ 1,000.00 | $ 1,014.72 | $ 10.56 |
Class C | | | |
Actual | $ 1,000.00 | $ 1,077.60 | $ 10.68 |
HypotheticalA | $ 1,000.00 | $ 1,014.92 | $ 10.36 |
International Value | | | |
Actual | $ 1,000.00 | $ 1,083.80 | $ 5.20 |
HypotheticalA | $ 1,000.00 | $ 1,020.21 | $ 5.04 |
Institutional Class | | | |
Actual | $ 1,000.00 | $ 1,083.70 | $ 4.83 |
HypotheticalA | $ 1,000.00 | $ 1,020.57 | $ 4.69 |
A 5% return per year before expenses
* Expenses are equal to each Class' annualized expense ratio (shown in the table below); multiplied by the average account value over the period, multiplied by 184/365 (to reflect the one-half year period).
| Annualized
Expense Ratio |
Class A | 1.36% |
Class T | 1.57% |
Class B | 2.08% |
Class C | 2.04% |
International Value | .99% |
Institutional Class | .92% |
Annual Report
Investment Changes
Geographic Diversification (% of fund's net assets) |
As of October 31, 2007 |
| Japan 18.8% | |
| United Kingdom 16.3% | |
| France 11.8% | |
| Germany 11.1% | |
| Switzerland 8.8% | |
| Spain 4.8% | |
| Cayman Islands 3.8% | |
| Norway 3.3% | |
| Australia 2.4% | |
| Other 18.9% | |

Percentages are adjusted for the effect of futures contracts, if applicable. |
|
As of April 30, 2007 |
| Japan 18.4% | |
| United Kingdom 16.5% | |
| France 11.3% | |
| Germany 10.9% | |
| Switzerland 9.6% | |
| Spain 4.5% | |
| United States of America 3.2% | |
| Netherlands 3.1% | |
| Australia 2.8% | |
| Other 19.7% | |

Percentages are adjusted for the effect of futures contracts, if applicable. |
Asset Allocation |
| % of fund's
net assets | % of fund's net assets
6 months ago |
Stocks | 98.9 | 97.0 |
Short-Term Investments and Net Other Assets | 1.1 | 3.0 |
Top Ten Stocks as of October 31, 2007 |
| % of fund's
net assets | % of fund's net assets
6 months ago |
E.ON AG (Germany, Electric Utilities) | 3.4 | 2.7 |
GlobalSantaFe Corp. (Cayman Islands, Energy Equipment & Services) | 2.5 | 1.9 |
Mitsui & Co. Ltd. (Japan, Trading Companies & Distributors) | 2.4 | 2.1 |
UBS AG (NY Shares) (Switzerland, Capital Markets) | 2.3 | 1.9 |
Toyota Motor Corp. (Japan, Automobiles) | 2.2 | 2.1 |
DaimlerChrysler AG (Germany, Automobiles) | 2.2 | 0.3 |
ING Groep NV sponsored ADR (Netherlands, Diversified Financial Services) | 2.2 | 2.4 |
AXA SA sponsored ADR (France, Insurance) | 2.2 | 2.0 |
Societe Generale Series A (France, Commercial Banks) | 2.1 | 2.7 |
Banco Santander Central Hispano SA (Spain, Commercial Banks) | 2.1 | 1.5 |
| 23.6 | |
Market Sectors as of October 31, 2007 |
| % of fund's
net assets | % of fund's net assets
6 months ago |
Financials | 37.2 | 40.0 |
Energy | 11.2 | 6.3 |
Industrials | 9.9 | 10.1 |
Consumer Discretionary | 9.7 | 8.6 |
Utilities | 7.7 | 6.3 |
Materials | 7.4 | 7.3 |
Consumer Staples | 5.1 | 6.6 |
Information Technology | 4.9 | 5.7 |
Health Care | 3.3 | 3.6 |
Telecommunication Services | 2.5 | 2.5 |
Annual Report
Investments October 31, 2007
Showing Percentage of Net Assets
Common Stocks - 98.7% |
| Shares | | Value |
Australia - 2.4% |
AMP Ltd. | 362,775 | | $ 3,473,529 |
Macquarie Airports unit | 460,311 | | 1,891,729 |
Macquarie Bank Ltd. | 19,000 | | 1,517,452 |
Macquarie Infrastructure Group unit | 597,721 | | 1,774,282 |
National Australia Bank Ltd. | 28,843 | | 1,166,925 |
TOTAL AUSTRALIA | | 9,823,917 |
Brazil - 2.0% |
Petroleo Brasileiro SA - Petrobras sponsored ADR | 59,700 | | 5,709,111 |
TAM SA (PN) sponsored ADR (ltd. vtg.) (d) | 47,200 | | 1,392,400 |
Uniao de Bancos Brasileiros SA (Unibanco) GDR | 5,400 | | 853,416 |
TOTAL BRAZIL | | 7,954,927 |
Canada - 1.1% |
Finning International, Inc. | 38,300 | | 1,318,312 |
First Quantum Minerals Ltd. | 18,100 | | 1,949,363 |
RONA, Inc. (a) | 56,500 | | 1,277,563 |
TOTAL CANADA | | 4,545,238 |
Cayman Islands - 3.8% |
Chaoda Modern Agriculture (Holdings) Ltd. | 1,184,000 | | 1,080,556 |
GlobalSantaFe Corp. | 123,900 | | 10,039,617 |
Subsea 7, Inc. (a) | 140,500 | | 4,123,498 |
TOTAL CAYMAN ISLANDS | | 15,243,671 |
France - 11.8% |
Accor SA | 18,100 | | 1,727,327 |
Alcatel-Lucent SA | 140,700 | | 1,363,383 |
AXA SA sponsored ADR | 193,800 | | 8,668,674 |
BNP Paribas SA | 27,700 | | 3,053,626 |
Compagnie de St. Gobain | 11,300 | | 1,211,323 |
Gaz de France | 44,700 | | 2,538,645 |
Renault SA | 8,400 | | 1,410,494 |
Societe Generale Series A | 51,435 | | 8,666,798 |
Suez SA (France) | 46,700 | | 3,035,500 |
Total SA: | | | |
Series B | 33,300 | | 2,684,313 |
sponsored ADR | 102,500 | | 8,262,525 |
Unibail-Rodamco | 11,872 | | 2,951,890 |
Vallourec SA | 7,000 | | 2,028,929 |
TOTAL FRANCE | | 47,603,427 |
Common Stocks - continued |
| Shares | | Value |
Germany - 10.9% |
Allianz AG sponsored ADR | 323,500 | | $ 7,311,100 |
BASF AG sponsored ADR | 25,300 | | 3,519,230 |
DaimlerChrysler AG | 80,200 | | 8,834,030 |
E.ON AG (d) | 70,700 | | 13,807,706 |
GFK AG (d) | 32,200 | | 1,299,707 |
Heidelberger Druckmaschinen AG | 22,700 | | 927,106 |
Lanxess AG | 48,100 | | 2,402,121 |
Muenchener Rueckversicherungs-Gesellschaft AG (Reg.) | 30,900 | | 5,928,168 |
TOTAL GERMANY | | 44,029,168 |
Greece - 0.8% |
Alpha Bank AE | 31,900 | | 1,180,375 |
Cosmote Mobile Telecommunications SA | 20,000 | | 690,208 |
Greek Organization of Football Prognostics SA | 36,200 | | 1,478,993 |
TOTAL GREECE | | 3,349,576 |
Hong Kong - 1.2% |
Swire Pacific Ltd. (A Shares) | 352,800 | | 5,038,579 |
India - 0.7% |
Satyam Computer Services Ltd. sponsored ADR | 94,100 | | 2,855,935 |
Ireland - 1.0% |
Bank of Ireland | 113,471 | | 2,104,887 |
CRH PLC sponsored ADR (d) | 53,900 | | 2,134,979 |
TOTAL IRELAND | | 4,239,866 |
Italy - 1.4% |
Fiat SpA | 51,700 | | 1,668,089 |
Unicredito Italiano SpA | 490,600 | | 4,193,610 |
TOTAL ITALY | | 5,861,699 |
Japan - 18.8% |
Aeon Co. Ltd. | 196,100 | | 3,087,557 |
Asahi Breweries Ltd. | 63,100 | | 1,043,779 |
Canon, Inc. | 86,650 | | 4,381,891 |
Cosmo Bio Co. Ltd. | 13 | | 9,201 |
Denso Corp. | 61,800 | | 2,511,175 |
East Japan Railway Co. | 470 | | 3,872,403 |
Ibiden Co. Ltd. | 7,500 | | 635,876 |
Japan Tobacco, Inc. | 199 | | 1,160,152 |
JGC Corp. | 25,000 | | 500,754 |
JSR Corp. | 53,700 | | 1,394,667 |
Konica Minolta Holdings, Inc. | 156,500 | | 2,740,217 |
Common Stocks - continued |
| Shares | | Value |
Japan - continued |
Kubota Corp. | 294,000 | | $ 2,468,774 |
Leopalace21 Corp. | 50,200 | | 1,602,877 |
Misawa Homes Co. Ltd. (a)(d) | 48,500 | | 478,916 |
Mitsubishi Estate Co. Ltd. | 48,000 | | 1,439,269 |
Mitsui & Co. Ltd. | 375,000 | | 9,728,882 |
Nippon Building Fund, Inc. | 48 | | 696,438 |
Nippon Oil Corp. | 74,000 | | 655,537 |
ORIX Corp. | 31,850 | | 6,534,689 |
Osaka Gas Co. Ltd. | 1,409,000 | | 5,482,926 |
Shin-Etsu Chemical Co. Ltd. | 16,400 | | 1,052,223 |
Sumitomo Mitsui Financial Group, Inc. | 109 | | 893,048 |
Sumitomo Realty & Development Co. Ltd. | 30,000 | | 1,059,084 |
Sumitomo Trust & Banking Co. Ltd. | 197,000 | | 1,469,151 |
Takeda Pharmaceutical Co. Ltd. | 88,600 | | 5,535,553 |
Tokuyama Corp. (d) | 176,000 | | 2,458,846 |
Toyota Motor Corp. | 154,800 | | 8,857,656 |
Toyota Motor Corp. sponsored ADR | 15,600 | | 1,785,264 |
Xebio Co. Ltd. | 47,600 | | 1,404,749 |
Yamada Denki Co. Ltd. | 10,970 | | 1,131,278 |
TOTAL JAPAN | | 76,072,832 |
Kazakhstan - 0.5% |
JSC Halyk Bank of Kazakhstan unit | 104,300 | | 1,925,378 |
Korea (South) - 0.7% |
Kookmin Bank sponsored ADR | 15,200 | | 1,241,688 |
Samsung Electronics Co. Ltd. GDR | 4,833 | | 1,474,065 |
TOTAL KOREA (SOUTH) | | 2,715,753 |
Luxembourg - 0.1% |
ArcelorMittal SA (NY Shares) Class A | 7,600 | | 607,620 |
Mexico - 0.3% |
America Movil SAB de CV Series L sponsored ADR | 20,800 | | 1,360,112 |
Netherlands - 2.4% |
Heineken NV (Bearer) | 12,600 | | 879,480 |
ING Groep NV sponsored ADR | 194,700 | | 8,759,553 |
TOTAL NETHERLANDS | | 9,639,033 |
Norway - 3.3% |
DnB Nor ASA | 156,400 | | 2,579,223 |
Fred Olsen Energy ASA (d) | 45,000 | | 2,289,202 |
Common Stocks - continued |
| Shares | | Value |
Norway - continued |
Orkla ASA (A Shares) | 226,250 | | $ 4,203,322 |
Petroleum Geo-Services ASA | 146,350 | | 4,308,823 |
TOTAL NORWAY | | 13,380,570 |
Philippines - 0.2% |
Philippine Long Distance Telephone Co. sponsored ADR | 12,000 | | 823,200 |
Russia - 1.1% |
OAO Gazprom sponsored ADR | 91,300 | | 4,587,825 |
Singapore - 0.7% |
DBS Group Holdings Ltd. | 175,000 | | 2,739,062 |
South Africa - 1.0% |
Impala Platinum Holdings Ltd. | 102,600 | | 3,852,039 |
Spain - 4.8% |
Banco Bilbao Vizcaya Argentaria SA sponsored ADR | 192,100 | | 4,848,604 |
Banco Santander SA | 391,000 | | 8,497,212 |
Banco Santander SA sponsored ADR | 84,500 | | 1,834,495 |
Gestevision Telecinco SA | 75,200 | | 2,162,653 |
Telefonica SA sponsored ADR | 22,300 | | 2,217,735 |
TOTAL SPAIN | | 19,560,699 |
Sweden - 1.9% |
Atlas Copco AB (A Shares) | 52,800 | | 882,943 |
Svenska Cellulosa AB (SCA) (B Shares) | 184,600 | | 3,254,015 |
Telefonaktiebolaget LM Ericsson (B Shares) | 1,189,000 | | 3,572,945 |
TOTAL SWEDEN | | 7,709,903 |
Switzerland - 8.8% |
Credit Suisse Group sponsored ADR | 54,200 | | 3,669,340 |
Nestle SA (Reg.) | 17,839 | | 8,241,618 |
Novartis AG sponsored ADR | 15,400 | | 818,818 |
Roche Holding AG (participation certificate) | 40,954 | | 6,999,039 |
Swiss Life Holding | 7,868 | | 2,173,668 |
Swiss Reinsurance Co. (Reg.) | 33,669 | | 3,159,648 |
UBS AG (NY Shares) | 173,900 | | 9,336,691 |
Zurich Financial Services AG (Reg.) | 3,949 | | 1,188,996 |
TOTAL SWITZERLAND | | 35,587,818 |
Taiwan - 0.5% |
Novatek Microelectronics Corp. | 329,898 | | 1,517,358 |
Siliconware Precision Industries Co. Ltd. | 226,000 | | 476,487 |
TOTAL TAIWAN | | 1,993,845 |
Common Stocks - continued |
| Shares | | Value |
United Kingdom - 16.3% |
3i Group plc | 123,110 | | $ 2,777,078 |
Anglo American PLC (United Kingdom) | 19,000 | | 1,309,095 |
BAE Systems PLC | 246,100 | | 2,548,038 |
Barclays PLC | 478,700 | | 6,085,474 |
BHP Billiton PLC | 143,000 | | 5,443,639 |
BP PLC | 172,000 | | 2,235,713 |
British American Tobacco PLC | 85,800 | | 3,289,572 |
HBOS plc | 240,800 | | 4,370,546 |
HSBC Holdings PLC (United Kingdom) (Reg.) | 158,900 | | 3,162,746 |
Informa PLC | 181,800 | | 2,022,146 |
Land Securities Group PLC | 59,200 | | 2,023,431 |
Misys PLC | 104,900 | | 527,238 |
National Grid PLC | 385,200 | | 6,418,813 |
Prudential PLC | 141,728 | | 2,304,238 |
Rolls-Royce Group PLC | 434,919 | | 4,864,695 |
Royal Bank of Scotland Group PLC | 672,000 | | 7,216,133 |
Tesco PLC | 168,800 | | 1,730,201 |
Vedanta Resources PLC | 20,200 | | 923,930 |
Vodafone Group PLC sponsored ADR | 129,112 | | 5,070,228 |
Yell Group PLC | 180,100 | | 1,703,688 |
TOTAL UNITED KINGDOM | | 66,026,642 |
United States of America - 0.2% |
Virgin Media, Inc. | 27,900 | | 616,869 |
TOTAL COMMON STOCKS (Cost $343,850,130) | 399,745,203 |
Nonconvertible Preferred Stocks - 0.2% |
| | | |
Germany - 0.2% |
ProSiebenSat.1 Media AG | 28,000 | | 818,224 |
United Kingdom - 0.0% |
Rolls-Royce Group PLC B Shares | 19,821,007 | | 41,209 |
TOTAL NONCONVERTIBLE PREFERRED STOCKS (Cost $929,031) | 859,433 |
Money Market Funds - 2.7% |
| Shares | | Value |
Fidelity Cash Central Fund, 4.97% (b) | 2,981,514 | | $ 2,981,514 |
Fidelity Securities Lending Cash Central Fund, 5.02% (b)(c) | 7,703,170 | | 7,703,170 |
TOTAL MONEY MARKET FUNDS (Cost $10,684,684) | 10,684,684 |
TOTAL INVESTMENT PORTFOLIO - 101.6% (Cost $355,463,845) | 411,289,320 |
NET OTHER ASSETS - (1.6)% | (6,396,381) |
NET ASSETS - 100% | $ 404,892,939 |
Legend |
(a) Non-income producing |
(b) Affiliated fund that is available only to investment companies and other accounts managed by Fidelity Investments. The rate quoted is the annualized seven-day yield of the fund at period end. A complete unaudited listing of the fund's holdings as of its most recent quarter end is available upon request. |
(c) Investment made with cash collateral received from securities on loan. |
(d) Security or a portion of the security is on loan at period end. |
Affiliated Central Funds |
Information regarding fiscal year to date income earned by the Fund from investments in Fidelity Central Funds is as follows: |
Fund | Income earned |
Fidelity Cash Central Fund | $ 495,581 |
Fidelity Securities Lending Cash Central Fund | 347,002 |
Total | $ 842,583 |
See accompanying notes which are an integral part of the financial statements.
Annual Report
Financial Statements
Statement of Assets and Liabilities
| October 31, 2007 |
Assets | | |
Investment in securities, at value (including securities loaned of $7,446,355) - See accompanying schedule: Unaffiliated issuers (cost $344,779,161) | $ 400,604,636 | |
Fidelity Central Funds (cost $10,684,684) | 10,684,684 | |
Total Investments (cost $355,463,845) | | $ 411,289,320 |
Foreign currency held at value (cost $10,790) | | 10,726 |
Receivable for investments sold | | 4,120,382 |
Receivable for fund shares sold | | 1,047,639 |
Dividends receivable | | 718,112 |
Distributions receivable from Fidelity Central Funds | | 7,659 |
Prepaid expenses | | 44 |
Other receivables | | 13,873 |
Total assets | | 417,207,755 |
| | |
Liabilities | | |
Payable for investments purchased | $ 969,463 | |
Payable for fund shares redeemed | 3,211,020 | |
Accrued management fee | 251,364 | |
Distribution fees payable | 10,680 | |
Other affiliated payables | 95,991 | |
Other payables and accrued expenses | 73,128 | |
Collateral on securities loaned, at value | 7,703,170 | |
Total liabilities | | 12,314,816 |
| | |
Net Assets | | $ 404,892,939 |
Net Assets consist of: | | |
Paid in capital | | $ 319,315,967 |
Undistributed net investment income | | 6,624,232 |
Accumulated undistributed net realized gain (loss) on investments and foreign currency transactions | | 23,121,828 |
Net unrealized appreciation (depreciation) on investments and assets and liabilities in foreign currencies | | 55,830,912 |
Net Assets | | $ 404,892,939 |
See accompanying notes which are an integral part of the financial statements.
Annual Report
Financial Statements - continued
Statement of Assets and Liabilities - continued
| October 31, 2007 |
Calculation of Maximum Offering Price
Class A:
Net Asset Value and redemption price per share ($6,051,508 ÷ 464,877 shares) | | $ 13.02 |
| | |
Maximum offering price per share (100/94.25 of $13.02) | | $ 13.81 |
Class T:
Net Asset Value and redemption price per share ($5,081,307 ÷ 391,278 shares) | | $ 12.99 |
| | |
Maximum offering price per share (100/96.50 of $12.99) | | $ 13.46 |
Class B:
Net Asset Value and offering price per share ($2,651,396 ÷ 205,042 shares)A | | $ 12.93 |
| | |
Class C:
Net Asset Value and offering price per share ($5,995,905 ÷ 464,024 shares)A | | $ 12.92 |
| | |
| | |
International Value:
Net Asset Value, offering price and redemption price per share ($381,148,142 ÷ 29,177,219 shares) | | $ 13.06 |
| | |
Institutional Class:
Net Asset Value, offering price and redemption price per share ($3,964,681 ÷ 303,335 shares) | | $ 13.07 |
A Redemption price per share is equal to net asset value less any applicable contingent deferred sales charge.
See accompanying notes which are an integral part of the financial statements.
Annual Report
Statement of Operations
| Year ended October 31, 2007 |
Investment Income | | |
Dividends | | $ 10,911,623 |
Income from Fidelity Central Funds | | 842,583 |
| | 11,754,206 |
Less foreign taxes withheld | | (950,853) |
Total income | | 10,803,353 |
| | |
Expenses | | |
Management fee
Basic fee | $ 2,678,334 | |
Performance adjustment | (49,312) | |
Transfer agent fees | 795,281 | |
Distribution fees | 97,190 | |
Accounting and security lending fees | 200,380 | |
Custodian fees and expenses | 73,738 | |
Independent trustees' compensation | 1,212 | |
Registration fees | 149,976 | |
Audit | 60,592 | |
Legal | 2,605 | |
Interest | 1,715 | |
Miscellaneous | 11,367 | |
Total expenses before reductions | 4,023,078 | |
Expense reductions | (66,233) | 3,956,845 |
Net investment income (loss) | | 6,846,508 |
Realized and Unrealized Gain (Loss) Net realized gain (loss) on: | | |
Investment securities: | | |
Unaffiliated issuers (net of foreign taxes of $32,830) | 23,720,618 | |
Foreign currency transactions | 2,737 | |
Total net realized gain (loss) | | 23,723,355 |
Change in net unrealized appreciation (depreciation) on: Investment securities (net of decrease in deferred foreign taxes of $7,086) | 43,764,016 | |
Assets and liabilities in foreign currencies | 5,403 | |
Total change in net unrealized appreciation (depreciation) | | 43,769,419 |
Net gain (loss) | | 67,492,774 |
Net increase (decrease) in net assets resulting from operations | | $ 74,339,282 |
See accompanying notes which are an integral part of the financial statements.
Annual Report
Financial Statements - continued
Statement of Changes in Net Assets
| Year ended
October 31,
2007 | For the period
May 18, 2006
(commencement of operations) to
October 31,
2006 |
Increase (Decrease) in Net Assets | | |
Operations | | |
Net investment income (loss) | $ 6,846,508 | $ 808,421 |
Net realized gain (loss) | 23,723,355 | (6,746) |
Change in net unrealized appreciation (depreciation) | 43,769,419 | 12,061,493 |
Net increase (decrease) in net assets resulting
from operations | 74,339,282 | 12,863,168 |
Distributions to shareholders from net investment income | (978,516) | - |
Distributions to shareholders from net realized gain | (557,946) | - |
Total distributions | (1,536,462) | - |
Share transactions - net increase (decrease) | 101,052,444 | 218,123,163 |
Redemption fees | 30,746 | 20,598 |
Total increase (decrease) in net assets | 173,886,010 | 231,006,929 |
| | |
Net Assets | | |
Beginning of period | 231,006,929 | - |
End of period (including undistributed net investment income of $6,624,232 and undistributed net investment income of $808,421, respectively) | $ 404,892,939 | $ 231,006,929 |
See accompanying notes which are an integral part of the financial statements.
Annual Report
Financial Highlights - Class A
Years ended October 31, | 2007 | 2006 I |
Selected Per-Share Data | | |
Net asset value, beginning of period | $ 10.60 | $ 10.00 |
Income from Investment Operations | | |
Net investment income (loss) E | .18 | .06 H |
Net realized and unrealized gain (loss) | 2.29 | .54 |
Total from investment operations | 2.47 | .60 |
Distributions from net investment income | (.03) | - |
Distributions from net realized gain | (.02) | - |
Total distributions | (.05) | - |
Redemption fees added to paid in capital E | - K | - K |
Net asset value, end of period | $ 13.02 | $ 10.60 |
Total Return B, C, D | 23.43% | 6.00% |
Ratios to Average Net Assets F, J | | |
Expenses before reductions | 1.38% | 1.75% A |
Expenses net of fee waivers, if any | 1.38% | 1.50% A |
Expenses net of all reductions | 1.37% | 1.46% A |
Net investment income (loss) | 1.49% | 1.29% A, H |
Supplemental Data | | |
Net assets, end of period (000 omitted) | $ 6,052 | $ 1,537 |
Portfolio turnover rate G | 59% | 29% A |
A Annualized
B Total returns for periods of less than one year are not annualized.
C Total returns would have been lower had certain expenses not been reduced during the periods shown.
D Total returns do not include the effect of the sales charges.
E Calculated based on average shares outstanding during the period.
F Fees and expenses of the underlying Fidelity Central Funds are not included in the Fund's expense ratio. The Fund indirectly bears its proportionate share of the expenses of any underlying Fidelity Central Funds.
G Amount does not include the portfolio activity of any underlying Fidelity Central Funds.
H Investment income per share reflects a special dividend which amounted to $.03 per share. Excluding the special dividend, the ratio of net investment income (loss) to average net assets would have been .63%.
I For the period May 18, 2006 (commencement of operations) to October 31, 2006.
J Expense ratios reflect operating expenses of the class. Expenses before reductions do not reflect amounts reimbursed by the investment adviser or reductions from brokerage service arrangements or other expense offset arrangements and do not represent the amount paid by the class during periods when reimbursements or reductions occur. Expense ratios before reductions for start-up periods may not be representative of longer-term operating periods. Expenses net of fee waivers reflect expenses after reimbursement by the investment adviser but prior to reductions from brokerage service arrangements or other expense offset arrangements. Expenses net of all reductions represent the net expenses paid by the class.
K Amount represents less than $.01 per share.
See accompanying notes which are an integral part of the financial statements.
Annual Report
Financial Highlights - Class T
Years ended October 31, | 2007 | 2006 I |
Selected Per-Share Data | | |
Net asset value, beginning of period | $ 10.59 | $ 10.00 |
Income from Investment Operations | | |
Net investment income (loss) E | .15 | .05 H |
Net realized and unrealized gain (loss) | 2.29 | .54 |
Total from investment operations | 2.44 | .59 |
Distributions from net investment income | (.02) | - |
Distributions from net realized gain | (.02) | - |
Total distributions | (.04) | - |
Redemption fees added to paid in capital E | - K | - K |
Net asset value, end of period | $ 12.99 | $ 10.59 |
Total Return B, C, D | 23.13% | 5.90% |
Ratios to Average Net Assets F, J | | |
Expenses before reductions | 1.60% | 2.01% A |
Expenses net of fee waivers, if any | 1.60% | 1.75% A |
Expenses net of all reductions | 1.58% | 1.71% A |
Net investment income (loss) | 1.27% | 1.04% A, H |
Supplemental Data | | |
Net assets, end of period (000 omitted) | $ 5,081 | $ 1,789 |
Portfolio turnover rate G | 59% | 29% A |
A Annualized
B Total returns for periods of less than one year are not annualized.
C Total returns would have been lower had certain expenses not been reduced during the periods shown.
D Total returns do not include the effect of the sales charges.
E Calculated based on average shares outstanding during the period.
F Fees and expenses of the underlying Fidelity Central Funds are not included in the Fund's expense ratio. The Fund indirectly bears its proportionate share of the expenses of any underlying Fidelity Central Funds.
G Amount does not include the portfolio activity of any underlying Fidelity Central Funds.
H Investment income per share reflects a special dividend which amounted to $.03 per share. Excluding the special dividend, the ratio of net investment income (loss) to average net assets would have been .38%.
I For the period May 18, 2006 (commencement of operations) to October 31, 2006.
J Expense ratios reflect operating expenses of the class. Expenses before reductions do not reflect amounts reimbursed by the investment adviser or reductions from brokerage service arrangements or other expense offset arrangements and do not represent the amount paid by the class during periods when reimbursements or reductions occur. Expense ratios before reductions for start-up periods may not be representative of longer-term operating periods. Expenses net of fee waivers reflect expenses after reimbursement by the investment adviser but prior to reductions from brokerage service arrangements or other expense offset arrangements. Expenses net of all reductions represent the net expenses paid by the class.
K Amount represents less than $.01 per share.
See accompanying notes which are an integral part of the financial statements.
Annual Report
Financial Highlights - Class B
Years ended October 31, | 2007 | 2006 I |
Selected Per-Share Data | | |
Net asset value, beginning of period | $ 10.56 | $ 10.00 |
Income from Investment Operations | | |
Net investment income (loss) E | .09 | .02 H |
Net realized and unrealized gain (loss) | 2.29 | .54 |
Total from investment operations | 2.38 | .56 |
Distributions from net realized gain | (.01) | - |
Redemption fees added to paid in capital E | - K | - K |
Net asset value, end of period | $ 12.93 | $ 10.56 |
Total Return B, C, D | 22.59% | 5.60% |
Ratios to Average Net Assets F, J | | |
Expenses before reductions | 2.10% | 2.50% A |
Expenses net of fee waivers, if any | 2.10% | 2.25% A |
Expenses net of all reductions | 2.08% | 2.21% A |
Net investment income (loss) | .77% | .54% A, H |
Supplemental Data | | |
Net assets, end of period (000 omitted) | $ 2,651 | $ 1,304 |
Portfolio turnover rate G | 59% | 29% A |
A Annualized
B Total returns for periods of less than one year are not annualized.
C Total returns would have been lower had certain expenses not been reduced during the periods shown.
D Total returns do not include the effect of the contingent deferred sales charge.
E Calculated based on average shares outstanding during the period.
F Fees and expenses of the underlying Fidelity Central Funds are not included in the Fund's expense ratio. The Fund indirectly bears its proportionate share of the expenses of any underlying Fidelity Central Funds.
G Amount does not include the portfolio activity of any underlying Fidelity Central Funds.
H Investment income per share reflects a special dividend which amounted to $.03 per share. Excluding the special dividend, the ratio of net investment income (loss) to average net assets would have been (.12) %.
I For the period May 18, 2006 (commencement of operations) to October 31, 2006.
J Expense ratios reflect operating expenses of the class. Expenses before reductions do not reflect amounts reimbursed by the investment adviser or reductions from brokerage service arrangements or other expense offset arrangements and do not represent the amount paid by the class during periods when reimbursements or reductions occur. Expense ratios before reductions for start-up periods may not be representative of longer-term operating periods. Expenses net of fee waivers reflect expenses after reimbursement by the investment adviser but prior to reductions from brokerage service arrangements or other expense offset arrangements. Expenses net of all reductions represent the net expenses paid by the class.
K Amount represents less than $.01 per share.
See accompanying notes which are an integral part of the financial statements.
Annual Report
Financial Highlights - Class C
Years ended October 31, | 2007 | 2006 I |
Selected Per-Share Data | | |
Net asset value, beginning of period | $ 10.56 | $ 10.00 |
Income from Investment Operations | | |
Net investment income (loss) E | .09 | .02 H |
Net realized and unrealized gain (loss) | 2.29 | .54 |
Total from investment operations | 2.38 | .56 |
Distributions from net realized gain | (.02) | - |
Redemption fees added to paid in capital E | - K | - K |
Net asset value, end of period | $ 12.92 | $ 10.56 |
Total Return B, C, D | 22.56% | 5.60% |
Ratios to Average Net Assets F, J | | |
Expenses before reductions | 2.07% | 2.47% A |
Expenses net of fee waivers, if any | 2.07% | 2.25% A |
Expenses net of all reductions | 2.05% | 2.21% A |
Net investment income (loss) | .80% | .54% A, H |
Supplemental Data | | |
Net assets, end of period (000 omitted) | $ 5,996 | $ 2,183 |
Portfolio turnover rate G | 59% | 29% A |
A Annualized
B Total returns for periods of less than one year are not annualized.
C Total returns would have been lower had certain expenses not been reduced during the periods shown.
D Total returns do not include the effect of the contingent deferred sales charge.
E Calculated based on average shares outstanding during the period.
F Fees and expenses of the underlying Fidelity Central Funds are not included in the Fund's expense ratio. The Fund indirectly bears its proportionate share of the expenses of any underlying Fidelity Central Funds.
G Amount does not include the portfolio activity of any underlying Fidelity Central Funds.
H Investment income per share reflects a special dividend which amounted to $.03 per share. Excluding the special dividend, the ratio of net investment income (loss) to average net assets would have been (.12) %.
I For the period May 18, 2006 (commencement of operations) to October 31, 2006.
J Expense ratios reflect operating expenses of the class. Expenses before reductions do not reflect amounts reimbursed by the investment adviser or reductions from brokerage service arrangements or other expense offset arrangements and do not represent the amount paid by the class during periods when reimbursements or reductions occur. Expense ratios before reductions for start-up periods may not be representative of longer-term operating periods. Expenses net of fee waivers reflect expenses after reimbursement by the investment adviser but prior to reductions from brokerage service arrangements or other expense offset arrangements. Expenses net of all reductions represent the net expenses paid by the class.
K Amount represents less than $.01 per share.
See accompanying notes which are an integral part of the financial statements.
Annual Report
Financial Highlights - International Value
Years ended October 31, | 2007 | 2006 H |
Selected Per-Share Data | | |
Net asset value, beginning of period | $ 10.61 | $ 10.00 |
Income from Investment Operations | | |
Net investment income (loss) D | .22 | .07 G |
Net realized and unrealized gain (loss) | 2.29 | .54 |
Total from investment operations | 2.51 | .61 |
Distributions from net investment income | (.04) | - |
Distributions from net realized gain | (.02) | - |
Total distributions | (.06) | - |
Redemption fees added to paid in capital D | - J | - J |
Net asset value, end of period | $ 13.06 | $ 10.61 |
Total Return B, C | 23.81% | 6.10% |
Ratios to Average Net Assets E, I | | |
Expenses before reductions | 1.03% | 1.50% A |
Expenses net of fee waivers, if any | 1.03% | 1.25% A |
Expenses net of all reductions | 1.02% | 1.21% A |
Net investment income (loss) | 1.84% | 1.54% A, G |
Supplemental Data | | |
Net assets, end of period (000 omitted) | $ 381,148 | $ 221,130 |
Portfolio turnover rate F | 59% | 29% A |
A Annualized
B Total returns for periods of less than one year are not annualized.
C Total returns would have been lower had certain expenses not been reduced during the periods shown.
D Calculated based on average shares outstanding during the period.
E Fees and expenses of the underlying Fidelity Central Funds are not included in the Fund's expense ratio. The Fund indirectly bears its proportionate share of the expenses of any underlying Fidelity Central Funds.
F Amount does not include the portfolio activity of any underlying Fidelity Central Funds.
G Investment income per share reflects a special dividend which amounted to $.03 per share. Excluding the special dividend, the ratio of net investment income (loss) to average net assets would have been .88%.
H For the period May 18, 2006 (commencement of operations) to October 31, 2006.
I Expense ratios reflect operating expenses of the class. Expenses before reductions do not reflect amounts reimbursed by the investment adviser or reductions from brokerage service arrangements or other expense offset arrangements and do not represent the amount paid by the class during periods when reimbursements or reductions occur. Expense ratios before reductions for start-up periods may not be representative of longer-term operating periods. Expenses net of fee waivers reflect expenses after reimbursement by the investment adviser but prior to reductions from brokerage service arrangements or other expense offset arrangements. Expenses net of all reductions represent the net expenses paid by the class.
J Amount represents less than $.01 per share.
See accompanying notes which are an integral part of the financial statements.
Annual Report
Financial Highlights - Institutional Class
Years ended October 31, | 2007 | 2006 H |
Selected Per-Share Data | | |
Net asset value, beginning of period | $ 10.61 | $ 10.00 |
Income from Investment Operations | | |
Net investment income (loss) D | .22 | .07 G |
Net realized and unrealized gain (loss) | 2.30 | .54 |
Total from investment operations | 2.52 | .61 |
Distributions from net investment income | (.04) | - |
Distributions from net realized gain | (.02) | - |
Total distributions | (.06) | - |
Redemption fees added to paid in capital D | - J | - J |
Net asset value, end of period | $ 13.07 | $ 10.61 |
Total Return B, C | 23.91% | 6.10% |
Ratios to Average Net Assets E, I | | |
Expenses before reductions | .98% | 1.38% A |
Expenses net of fee waivers, if any | .98% | 1.25% A |
Expenses net of all reductions | .96% | 1.21% A |
Net investment income (loss) | 1.89% | 1.54% A, G |
Supplemental Data | | |
Net assets, end of period (000 omitted) | $ 3,965 | $ 3,064 |
Portfolio turnover rate F | 59% | 29% A |
A Annualized
B Total returns for periods of less than one year are not annualized.
C Total returns would have been lower had certain expenses not been reduced during the periods shown.
D Calculated based on average shares outstanding during the period.
E Fees and expenses of the underlying Fidelity Central Funds are not included in the Fund's expense ratio. The Fund indirectly bears its proportionate share of the expenses of any underlying Fidelity Central Funds.
F Amount does not include the portfolio activity of any underlying Fidelity Central Funds.
G Investment income per share reflects a special dividend which amounted to $.03 per share. Excluding the special dividend, the ratio of net investment income (loss) to average net assets would have been .88%.
H For the period May 18, 2006 (commencement of operations) to October 31, 2006.
I Expense ratios reflect operating expenses of the class. Expenses before reductions do not reflect amounts reimbursed by the investment adviser or reductions from brokerage service arrangements or other expense offset arrangements and do not represent the amount paid by the class during periods when reimbursements or reductions occur. Expense ratios before reductions for start-up periods may not be representative of longer-term operating periods. Expenses net of fee waivers reflect expenses after reimbursement by the investment adviser but prior to reductions from brokerage service arrangements or other expense offset arrangements. Expenses net of all reductions represent the net expenses paid by the class.
J Amount represents less than $.01 per share.
See accompanying notes which are an integral part of the financial statements.
Annual Report
Notes to Financial Statements
For the period ended October 31, 2007
1. Organization.
Fidelity International Value Fund (the Fund) is a fund of Fidelity Investment Trust (the trust) and is authorized to issue an unlimited number of shares. The trust is registered under the Investment Company Act of 1940, as amended (the 1940 Act), as an open-end management investment company organized as a Massachusetts business trust.
The Fund offers Class A, Class T, Class B, Class C, International Value Fund, and Institutional Class shares, each of which has equal rights as to assets and voting privileges. Each class has exclusive voting rights with respect to matters that affect that class. Class B shares will automatically convert to Class A shares after a holding period of seven years from the initial date of purchase. Investment income, realized and unrealized capital gains and losses, the common expenses of the Fund, and certain fund-level expense reductions, if any, are allocated on a pro rata basis to each class based on the relative net assets of each class to the total net assets of the Fund. Each class differs with respect to transfer agent and distribution and service plan fees incurred. Certain expense reductions also differ by class.
The Fund's investments in emerging markets can be subject to social, economic, regulatory, and political uncertainties and can be extremely volatile.
2. Investments in Fidelity Central Funds.
The Fund may invest in Fidelity Central Funds, which are open-end investment companies available only to other investment companies and accounts managed by Fidelity Management & Research Company (FMR) and its affiliates. The Fund's Schedule of Investments lists each of the Fidelity Central Funds as an investment of the Fund, but does not include the underlying holdings of each Fidelity Central Fund. As an Investing Fund, the Fund indirectly bears its proportionate share of the expenses of the underlying Fidelity Central Funds.
The Money Market Central Funds seek preservation of capital and current income and are managed by Fidelity Investments Money Management, Inc. (FIMM), an affiliate of FMR.
A complete list of holdings for each Fidelity Central Fund is available upon request or at the SEC's web site at www.sec.gov. In addition, the financial statements of the Fidelity Central Funds, which are not covered by the Fund's Report of Independent Registered Public Accounting Firm, are available on the SEC's web site or upon request.
Annual Report
Notes to Financial Statements - continued
3. Significant Accounting Policies.
The financial statements have been prepared in conformity with accounting principles generally accepted in the United States of America, which require management to make certain estimates and assumptions at the date of the financial statements. The following summarizes the significant accounting policies of the Fund:
Security Valuation. Investments are valued and net asset value (NAV) per share is calculated (NAV calculation) as of the close of business of the New York Stock Exchange (NYSE), normally 4:00 p.m. Eastern time. Wherever possible, the Fund uses independent pricing services approved by the Board of Trustees to value its investments.
Equity securities, including restricted securities, for which market quotations are readily available, are valued at the last reported sale price or official closing price as reported by an independent pricing service on the primary market or exchange on which they are traded. In the event there were no sales during the day or closing prices are not available, securities are valued at the last quoted bid price. Investments in open-end mutual funds, including the Fidelity Central Funds, are valued at their closing net asset value each business day. Short-term securities with remaining maturities of sixty days or less for which quotations are not readily available are valued at amortized cost, which approximates value.
When current market prices or quotations are not readily available or do not accurately reflect fair value, valuations may be determined in accordance with procedures adopted by the Board of Trustees. For example, when developments occur between the close of a market and the close of the NYSE that may materially affect the value of some or all of the securities, or when trading in a security is halted, those securities may be fair valued. Factors used in the determination of fair value may include monitoring news to identify significant market or security specific events such as changes in the value of U.S. securities markets, reviewing developments in foreign markets and evaluating the performance of ADRs, futures contracts and exchange-traded funds. Because the Fund's utilization of fair value pricing depends on market activity, the frequency with which fair value pricing is used cannot be predicted and may be utilized to a significant extent. The value of securities used for NAV calculation under fair value pricing may differ from published prices for the same securities.
Foreign Currency. The Fund uses foreign currency contracts to facilitate transactions in foreign-denominated securities. Losses from these transactions may arise from changes in the value of the foreign currency or if the counterparties do not perform under the contracts' terms.
Foreign-denominated assets, including investment securities, and liabilities are translated into U.S. dollars at the exchange rate at period end. Purchases and sales of investment securities, income and dividends received and expenses denominated in foreign
Annual Report
3. Significant Accounting Policies - continued
Foreign Currency - continued
currencies are translated into U.S. dollars at the exchange rate in effect on the transaction date.
The effects of exchange rate fluctuations on investments are included with the net realized and unrealized gain (loss) on investment securities. Other foreign currency transactions resulting in realized and unrealized gain (loss) are disclosed separately.
Investment Transactions and Income. For financial reporting purposes, the Fund's investment holdings and NAV include trades executed through the end of the last business day of the period. The NAV for processing shareholder transactions includes trades executed through the end of the prior business day. Gains and losses on securities sold are determined on the basis of identified cost. Dividend income is recorded on the ex-dividend date, except for certain dividends from foreign securities where the ex-dividend date may have passed, which are recorded as soon as the Fund is informed of the ex-dividend date. Non-cash dividends included in dividend income, if any, are recorded at the fair market value of the securities received. Interest income and distributions from the Fidelity Central Funds are accrued as earned. Interest income includes coupon interest and amortization of premium and accretion of discount on debt securities. Investment income is recorded net of foreign taxes withheld where recovery of such taxes is uncertain.
Expenses. Most expenses of the trust can be directly attributed to a fund. Expenses which cannot be directly attributed are apportioned among each Fund in the trust. Expense estimates are accrued in the period to which they relate and adjustments are made when actual amounts are known.
Income Tax Information and Distributions to Shareholders. Each year, the Fund intends to qualify as a regulated investment company by distributing all of its taxable income and realized gains under Subchapter M of the Internal Revenue Code. As a result, no provision for income taxes is required in the accompanying financial statements. Foreign taxes are provided for based on the Fund's understanding of the tax rules and rates that exist in the foreign markets in which it invests.
Distributions are recorded on the ex-dividend date. Income dividends and capital gain distributions are declared separately for each class. Income and capital gain distributions are determined in accordance with income tax regulations, which may differ from generally accepted accounting principles. In addition, the Fund will claim a portion of the payment made to redeeming shareholders as a distribution for income tax purposes.
Annual Report
Notes to Financial Statements - continued
3. Significant Accounting Policies - continued
Income Tax Information and Distributions to Shareholders - continued
Capital accounts within the financial statements are adjusted for permanent book-tax differences. These adjustments have no impact on net assets or the results of operations. Temporary book-tax differences will reverse in a subsequent period.
Book-tax differences are primarily due to short-term capital gains, foreign currency transactions, certain foreign taxes, passive foreign investment companies (PFIC) and losses deferred due to wash sales.
The tax-basis components of distributable earnings and the federal tax cost as of period end were as follows:
Unrealized appreciation | $ 64,830,652 | |
Unrealized depreciation | (10,069,522) | |
Net unrealized appreciation (depreciation) | 54,761,130 | |
Undistributed ordinary income | 13,452,360 | |
Undistributed long-term capital gain | 10,388,114 | |
| | |
Cost for federal income tax purposes | $ 356,528,190 | |
The tax character of distributions paid was as follows:
| October 31, 2007 | October 31, 2006 |
Ordinary Income | $ 1,536,462 | $ - |
Short-Term Trading (Redemption) Fees. Shares held in the Fund less than 30 days are subject to a redemption fee equal to 1.00% of the proceeds of the redeemed shares. All redemption fees, including any estimated redemption fees paid by FMR, are retained by the Fund and accounted for as an addition to paid in capital.
New Accounting Pronouncements. In July 2006, Financial Accounting Standards Board Interpretation No. 48, Accounting for Uncertainty in Income Taxes - an interpretation of FASB Statement 109 (FIN 48), was issued and is effective on the last business day of the semiannual reporting period for fiscal years beginning after December 15, 2006. FIN 48 sets forth a threshold for financial statement recognition, measurement and disclosure of a tax position taken or expected to be taken on a tax return. Management has concluded that the adoption of FIN 48 will not result in a material impact on the Fund's net assets, results of operations and financial statement disclosures.
In addition, in September 2006, Statement of Financial Accounting Standards No. 157, Fair Value Measurements (SFAS 157), was issued and is effective for fiscal years beginning after November 15, 2007. SFAS 157 defines fair value, establishes a framework for
Annual Report
3. Significant Accounting Policies - continued
New Accounting Pronouncements - continued
measuring fair value and expands disclosures about fair value measurements. Management is currently evaluating the impact the adoption of SFAS 157 will have on the Fund's financial statement disclosures.
4. Operating Policies.
Repurchase Agreements. FMR has received an Exemptive Order from the Securities and Exchange Commission (the SEC) which permits the Fund and other affiliated entities of FMR to transfer uninvested cash balances into joint trading accounts which are then invested in repurchase agreements. The Fund may also invest directly with institutions in repurchase agreements. Repurchase agreements are collateralized by government or non-government securities. Upon settlement date, collateral is held in segregated accounts with custodian banks and may be obtained in the event of a default of the counterparty. The Fund monitors, on a daily basis, the value of the collateral to ensure it is at least equal to the principal amount of the repurchase agreement (including accrued interest). In the event of a default by the counterparty, realization of the collateral proceeds could be delayed, during which time the value of the collateral may decline.
5. Purchases and Sales of Investments.
Purchases and sales of securities, other than short-term securities, aggregated $321,090,708 and $214,366,719, respectively.
6. Fees and Other Transactions with Affiliates.
Management Fee. FMR and its affiliates provide the Fund with investment management related services for which the Fund pays a monthly management fee. The management fee is the sum of an individual fund fee rate that is based on an annual rate of .45% of the Fund's average net assets and a group fee rate that averaged ..26% during the period. The group fee rate is based upon the average net assets of all the mutual funds advised by FMR. The group fee rate decreases as assets under management increase and increases as assets under management decrease. In addition, the management fee is subject to a performance adjustment (up to a maximum of ± .20% of the Fund's average net assets over a 36 month performance period). The upward or downward adjustment to the management fee is based on the relative investment performance of the retail class of the Fund, International Value as compared to an appropriate benchmark index. The Fund's performance adjustment took effect in May 2007. Subsequent months will be
Annual Report
Notes to Financial Statements - continued
6. Fees and Other Transactions with Affiliates - continued
Management Fee - continued
added until the performance period includes 36 months. For the period, the total annual management fee rate, including the performance adjustment, was .69% of the Fund's average net assets.
Distribution and Service Plan. In accordance with Rule 12b-1 of the 1940 Act, the Fund has adopted separate Distribution and Service Plans for each class of shares. Certain classes pay Fidelity Distributors Corporation (FDC), an affiliate of FMR, separate Distribution and Service Fees, each of which is based on an annual percentage of each class' average net assets. In addition, FDC may pay financial intermediaries for selling shares of the Fund and providing shareholder support services. For the period, the Distribution and Service Fee rates and the total amounts paid to and retained by FDC were as follows:
| Distribution
Fee | Service
Fee | Paid to
FDC | Retained
by FDC |
Class A | 0% | .25% | $ 13,197 | $ 3,129 |
Class T | .25% | .25% | 17,684 | 5,582 |
Class B | .75% | .25% | 20,458 | 18,191 |
Class C | .75% | .25% | 45,851 | 26,965 |
| | | $ 97,190 | $ 53,867 |
Sales Load. FDC receives a front-end sales charge of up to 5.75% for selling Class A shares, and 3.50% for selling Class T shares, some of which is paid to financial intermediaries for selling shares of the Fund. FDC receives the proceeds of contingent deferred sales charges levied on Class A, Class T, Class B, and Class C redemptions. These charges depend on the holding period. The deferred sales charges range from 5% to 1% for Class B, 1% for Class C, 1.00% to .50% for certain purchases of Class A shares and .25% for certain purchases of Class T shares.
For the period, sales charge amounts retained by FDC were as follows:
| Retained
by FDC |
Class A | $ 13,601 |
Class T | 2,905 |
Class B* | 1,703 |
Class C* | 5,153 |
| $ 23,362 |
* When Class B and Class C shares are initially sold, FDC pays commissions from its own resources to financial intermediaries through which the sales are made.
Annual Report
6. Fees and Other Transactions with Affiliates - continued
Transfer Agent Fees. Fidelity Investments Institutional Operations Company, Inc. (FIIOC), an affiliate of FMR, is the transfer, dividend disbursing and shareholder servicing agent for each class of the Fund. FIIOC receives account fees and asset-based fees that vary according to the account size and type of account of the shareholders of the respective classes of the Fund. FIIOC pays for typesetting, printing and mailing of shareholder reports, except proxy statements. For the period, the total transfer agent fees paid by each class to FIIOC, were as follows:
| Amount | % of
Average
Net Assets |
Class A | $ 16,340 | .31 |
Class T | 9,701 | .27 |
Class B | 5,621 | .27 |
Class C | 11,287 | .24 |
International Value | 746,853 | .21 |
Institutional Class | 5,479 | .15 |
| $ 795,281 | |
Accounting and Security Lending Fees. Fidelity Service Company, Inc. (FSC), an affiliate of FMR, maintains the Fund's accounting records. The accounting fee is based on the level of average net assets for the month. Under a separate contract, FSC administers the security lending program. The security lending fee is based on the number and duration of lending transactions.
Brokerage Commissions. The Fund placed a portion of its portfolio transactions with brokerage firms which are affiliates of the investment adviser. The commissions paid to these affiliated firms were $169 for the period.
Interfund Lending Program. Pursuant to an Exemptive Order issued by the SEC, the Fund, along with other registered investment companies having management contracts with FMR, may participate in an interfund lending program. This program provides an alternative credit facility allowing the funds to borrow from, or lend money to, other participating affiliated funds. At period end, there were no interfund loans outstanding. The Fund's activity in this program during the period for which loans were outstanding was as follows:
Borrower or Lender | Average Daily Loan Balance | Weighted Average Interest Rate | Interest
Expense |
Borrower | $ 6,253,000 | 4.94% | $ 1,715 |
Annual Report
Notes to Financial Statements - continued
7. Committed Line of Credit.
The Fund participates with other funds managed by FMR in a $4.2 billion credit facility (the "line of credit") to be utilized for temporary or emergency purposes to fund shareholder redemptions or for other short-term liquidity purposes. The Fund has agreed to pay commitment fees on its pro rata portion of the line of credit, which amounted to $434 and is reflected in Miscellaneous Expense on the Statement of Operations. During the period, there were no borrowings on this line of credit.
8. Security Lending.
The Fund lends portfolio securities from time to time in order to earn additional income. On the settlement date of the loan, the Fund receives collateral (in the form of U.S. Treasury obligations, letters of credit and/or cash) against the loaned securities and maintains collateral in an amount not less than 100% of the market value of the loaned securities during the period of the loan. The market value of the loaned securities is determined at the close of business of the Fund and any additional required collateral is delivered to the Fund on the next business day. If the borrower defaults on its obligation to return the securities loaned because of insolvency or other reasons, a fund could experience delays and costs in recovering the securities loaned or in gaining access to the collateral. Any cash collateral received is invested in the Fidelity Securities Lending Cash Central Fund. The value of loaned securities and cash collateral at period end are disclosed on the Fund's Statement of Assets and Liabilities. Security lending income represents the income earned on investing cash collateral, less fees and expenses associated with the loan, plus any premium payments that may be received on the loan of certain types of securities. Security lending income is presented in the Statement of Operations as a component of income from Fidelity Central Funds. Net income from lending portfolio securities during the period amounted to $347,002.
9. Expense Reductions.
Many of the brokers with whom FMR places trades on behalf of the Fund provided services to the Fund in addition to trade execution. These services included payments of certain expenses on behalf of the Fund totaling $64,985 for the period. In addition, through arrangements with the Fund's custodian and each class' transfer agent, credits realized as a result of uninvested cash balances were used to reduce the Fund's expenses. During the period, these credits reduced the Fund's custody expenses by $1,231. During the period, credits reduced each class' transfer agent expense as noted in the table below.
| Transfer Agent
expense reduction | |
Class A | $ 17 | |
Annual Report
10. Other.
The Fund's organizational documents provide former and current trustees and officers with a limited indemnification against liabilities arising in connection with the performance of their duties to the Fund. In the normal course of business, the Fund may also enter into contracts that provide general indemnifications. The Fund's maximum exposure under these arrangements is unknown as this would be dependent on future claims that may be made against the Fund. The risk of material loss from such claims is considered remote.
In September 2006, FIIOC, the Fund's transfer agent, notified the Fund that the Fund's books and records did not reflect a conversion of certain Class B to Class A shares upon their conversion date. In March 2007, FIIOC converted the relevant Class B shares to Class A shares and recorded the conversion in the books and records of the Fund which did not result in a material impact to the Fund's reported net assets or results of operations in the accompanying financial statements. FIIOC has remediated affected shareholders and reimbursed the Fund for all related audit and legal expenses.
11. Distributions to Shareholders.
Distributions to shareholders of each class were as follows:
| Years ended October 31, |
| 2007 | 2006 |
From net investment income | | |
Class A | $ 5,613 | $ - |
Class T | 4,267 | - |
International Value | 956,069 | - |
Institutional Class | 12,567 | - |
Total | $ 978,516 | $ - |
From net realized gain | | |
Class A | $ 3,983 | $ - |
Class T | 4,693 | - |
Class B | 1,788 | - |
Class C | 4,566 | - |
International Value | 536,333 | - |
Institutional Class | 6,583 | - |
Total | $ 557,946 | $ - |
Annual Report
Notes to Financial Statements - continued
12. Share Transactions.
Transactions for each class of shares were as follows:
| Shares | Dollars |
| Years ended October 31, | Years ended October 31, |
| 2007 | 2006 A | 2007 | 2006 A |
Class A | | | | |
Shares sold | 556,341 | 146,231 | $ 6,434,905 | $ 1,461,870 |
Reinvestment of distributions | 863 | - | 9,431 | - |
Shares redeemed | (237,384) | (1,174) | (2,953,175) | (12,358) |
Net increase (decrease) | 319,820 | 145,057 | $ 3,491,161 | $ 1,449,512 |
Class T | | | | |
Shares sold | 281,943 | 169,119 | $ 3,296,913 | $ 1,688,142 |
Reinvestment of distributions | 806 | - | 8,796 | - |
Shares redeemed | (60,435) | (155) | (714,379) | (1,528) |
Net increase (decrease) | 222,314 | 168,964 | $ 2,591,330 | $ 1,686,614 |
Class B | | | | |
Shares sold | 114,852 | 123,455 | $ 1,342,524 | $ 1,231,876 |
Reinvestment of distributions | 151 | - | 1,653 | - |
Shares redeemed | (33,404) | (12) | (398,508) | (126) |
Net increase (decrease) | 81,599 | 123,443 | $ 945,669 | $ 1,231,750 |
Class C | | | | |
Shares sold | 337,076 | 207,502 | $ 3,929,869 | $ 2,072,374 |
Reinvestment of distributions | 319 | - | 3,483 | - |
Shares redeemed | (80,082) | (791) | (988,817) | (7,647) |
Net increase (decrease) | 257,313 | 206,711 | $ 2,944,535 | $ 2,064,727 |
International Value | | | | |
Shares sold | 26,426,338 | 22,776,737 | $ 309,978,984 | $ 228,163,833 |
Reinvestment of distributions | 127,337 | - | 1,391,798 | - |
Shares redeemed | (18,219,061) | (1,934,132) | (220,454,791) | (19,338,324) |
Net increase (decrease) | 8,334,614 | 20,842,605 | $ 90,915,991 | $ 208,825,509 |
Institutional Class | | | | |
Shares sold | 75,655 | 288,807 | $ 870,496 | $ 2,865,051 |
Reinvestment of distributions | 692 | - | 7,564 | - |
Shares redeemed | (61,819) | - | (714,302) | - |
Net increase (decrease) | 14,528 | 288,807 | $ 163,758 | $ 2,865,051 |
A For the period May 18, 2006 (commencement of operations) to October 31, 2006.
Annual Report
Report of Independent Registered Public Accounting Firm
To the Trustees of Fidelity Investment Trust and Shareholders of Fidelity International Value Fund:
We have audited the accompanying statement of assets and liabilities of Fidelity International Value Fund (the Fund), a fund of Fidelity Investment Trust, including the schedule of investments as of October 31, 2007, and the related statement of operations for the year then ended and the statement of changes in net assets and the financial highlights for the year then ended and the period May 18, 2006 (commencement of operations) to October 31, 2006 ended. These financial statements and financial highlights are the responsibility of the Fund's management. Our responsibility is to express an opinion on these financial statements and financial highlights based on our audits.
We conducted our audits in accordance with standards of the Public Company Accounting Oversight Board (United States). Those standards require that we plan and perform the audit to obtain reasonable assurance about whether the financial statements and financial highlights are free of material misstatement. The Fund is not required to have, nor were we engaged to perform, an audit of its internal control over financial reporting. Our audits included consideration of internal control over financial reporting as a basis for designing audit procedures that are appropriate in the circumstances, but not for the purpose of expressing an opinion on the effectiveness of the Fund's internal control over financial reporting. Accordingly, we express no such opinion. An audit also includes examining, on a test basis, evidence supporting the amounts and disclosures in the financial statements, assessing the accounting principles used and significant estimates made by management, as well as evaluating the overall financial statement presentation. Our procedures included confirmation of securities owned as of October 31, 2007, by correspondence with the custodians and brokers; where replies were not received from brokers, we performed other auditing procedures. We believe that our audits provide a reasonable basis for our opinion.
In our opinion, the financial statements and financial highlights referred to above present fairly, in all material respects, the financial position of Fidelity International Value Fund as of October 31, 2007, the results of its operations for the year then ended and the changes in its net assets and its financial highlights for the year then ended and the period May 18, 2006 (commencement of operations) to October 31, 2006, in conformity with accounting principles generally accepted in the United States of America.
/s/ Deloitte & Touche LLP
DELOITTE & TOUCHE LLP
Boston, Massachusetts
December 18, 2007
Annual Report
Trustees and Officers
The Trustees, Members of the Advisory Board, and executive officers of the trust and fund, as applicable, are listed below. The Board of Trustees governs the fund and is responsible for protecting the interests of shareholders. The Trustees are experienced executives who meet periodically throughout the year to oversee the fund's activities, review contractual arrangements with companies that provide services to the fund, and review the fund's performance. Except for James C. Curvey, each of the Trustees oversees 370 funds advised by FMR or an affiliate. Mr. Curvey oversees 340 funds advised by FMR or an affiliate.
The Trustees hold office without limit in time except that (a) any Trustee may resign; (b) any Trustee may be removed by written instrument, signed by at least two-thirds of the number of Trustees prior to such removal; (c) any Trustee who requests to be retired or who has become incapacitated by illness or injury may be retired by written instrument signed by a majority of the other Trustees; and (d) any Trustee may be removed at any special meeting of shareholders by a two-thirds vote of the outstanding voting securities of the trust. Each Trustee who is not an interested person (as defined in the 1940 Act) (Independent Trustee), shall retire not later than the last day of the calendar year in which his or her 72nd birthday occurs. The Independent Trustees may waive this mandatory retirement age policy with respect to individual Trustees. The executive officers and Advisory Board Members hold office without limit in time, except that any officer and Advisory Board Member may resign or may be removed by a vote of a majority of the Trustees at any regular meeting or any special meeting of the Trustees. Except as indicated, each individual has held the office shown or other offices in the same company for the past five years.
The fund's Statement of Additional Information (SAI) includes more information about the Trustees. To request a free copy, call Fidelity at 1-877-208-0098.
Interested Trustees*:
Correspondence intended for each Trustee who is an interested person may be sent to Fidelity Investments, 82 Devonshire Street, Boston, Massachusetts 02109.
Name, Age; Principal Occupation |
Edward C. Johnson 3d (77) |
| Year of Election or Appointment: 1984 Mr. Johnson is Chairman of the Board of Trustees. Mr. Johnson serves as President (2006-present), Chief Executive Officer, Chairman, and a Director of FMR LLC; Chairman and a Director of FMR; Chairman and a Director of Fidelity Research & Analysis Company (FRAC); Chairman and a Director of Fidelity Investments Money Management, Inc.; and Chairman (2001-present) and a Director of FMR Co., Inc. In addition, Mr. Johnson serves as Chairman and Director of Fidelity International Limited (FIL). |
James C. Curvey (72) |
| Year of Election or Appointment: 2007 Mr. Curvey also serves as Trustee (2007-present) or Member of the Advisory Board (2007-present) of other investment companies advised by FMR. Mr. Curvey is a Director of FMR and FMR Co., Inc. (2007-present). Mr. Curvey is also Vice Chairman (2006-present) and Director of FMR LLC. Mr. Curvey joined Fidelity in 1982 and served in numerous senior management positions, including President and Chief Operating Officer of FMR LLC (1997-2000) and President of Fidelity Strategic Investments (2000-2002). In addition, he serves as a member of the Board of Directors of Geerlings & Wade, Inc. (wine distribution). |
* Trustees have been determined to be "Interested Trustees" by virtue of, among other things, their affiliation with the trust or various entities under common control with FMR. FMR Corp. merged with FMR LLC on October 1, 2007. Any references to FMR LLC for prior periods are deemed to be references to the prior entity.
Independent Trustees:
Correspondence intended for each Independent Trustee (that is, the Trustees other than the Interested Trustees) may be sent to Fidelity Investments, P.O. Box 55235, Boston, Massachusetts 02205-5235.
Name, Age; Principal Occupation |
Dennis J. Dirks (59) |
| Year of Election or Appointment: 2005 Prior to his retirement in May 2003, Mr. Dirks was Chief Operating Officer and a member of the Board of The Depository Trust & Clearing Corporation (DTCC) (1999-2003). He also served as President, Chief Operating Officer, and Board member of The Depository Trust Company (DTC) (1999-2003) and President and Board member of the National Securities Clearing Corporation (NSCC) (1999-2003). In addition, Mr. Dirks served as Chief Executive Officer and Board member of the Government Securities Clearing Corporation (2001-2003) and Chief Executive Officer and Board member of the Mortgage-Backed Securities Clearing Corporation (2001-2003). Mr. Dirks also serves as a Trustee and a member of the Finance Committee of Manhattan College (2005-
present) and a Trustee and a member of the Finance Committee of AHRC of Nassau County (2006-present). |
Albert R. Gamper, Jr. (65) |
| Year of Election or Appointment: 2006 Prior to his retirement in December 2004, Mr. Gamper served as Chairman of the Board of CIT Group Inc. (commercial finance). During his tenure with CIT Group Inc. Mr. Gamper served in numerous senior management positions, including Chairman (1987-1989; 1999-2001; 2002-2004), Chief Executive Officer (1987-2004), and President (1989-2002). He currently serves as a member of the Board of Directors of Public Service Enterprise Group (utilities, 2001-present), Chairman of the Board of Governors, Rutgers University (2004-present), and Chairman of the Board of Saint Barnabas Health Care System. |
George H. Heilmeier (71) |
| Year of Election or Appointment: 2004 Dr. Heilmeier is Chairman Emeritus of Telcordia Technologies (communication software and systems), where prior to his retirement, he served as company Chairman and Chief Executive Officer. He currently serves on the Boards of Directors of The Mitre Corporation (systems engineering and information technology support for the government), and HRL Laboratories (private research and development, 2004-present). He is Chairman of the General Motors Science & Technology Advisory Board and a Life Fellow of the Institute of Electrical and Electronics Engineers (IEEE). Dr. Heilmeier is a member of the Defense Science Board and the National Security Agency Advisory Board. He is also a member of the National Academy of Engineering, the American Academy of Arts and Sciences, and the Board of Overseers of the School of Engineering and Applied Science of the University of Pennsylvania. Previously, Dr. Heilmeier served as a Director of TRW Inc. (automotive, space, defense, and information technology, 1992-2002), Compaq (1994-2002), Automatic Data Processing, Inc. (ADP) (technology-based business outsourcing, 1995-2002), INET Technologies Inc. (telecommunications network surveillance, 2001-2004), and Teletech Holdings (customer management services). He is the recipient of the 2005 Kyoto Prize in Advanced Technology for his invention of the liquid crystal display, and a member of the Consumer Electronics Hall of Fame. |
James H. Keyes (67) |
| Year of Election or Appointment: 2007 Prior to his retirement in 2003, Mr. Keyes was Chairman, President, and Chief Executive Officer of Johnson Controls, Inc. (automotive supplier, 1993-2003). He currently serves as a member of the boards of LSI Logic Corporation (semiconductor technologies), Navistar International Corporation (manufacture and sale of trucks, buses, and diesel engines, 2002-present), and Pitney Bowes, Inc. (integrated mail, messaging, and document management solutions). |
Marie L. Knowles (61) |
| Year of Election or Appointment: 2001 Prior to Ms. Knowles' retirement in June 2000, she served as Executive Vice President and Chief Financial Officer of Atlantic Richfield Company (ARCO) (diversified energy, 1996-2000). From 1993 to 1996, she was a Senior Vice President of ARCO and President of ARCO Transportation Company. She served as a Director of ARCO from 1996 to 1998. She currently serves as a Director of Phelps Dodge Corporation (copper mining and manufacturing) and McKesson Corporation (healthcare service, 2002-present). Ms. Knowles is a Trustee of the Brookings Institution and the Catalina Island Conservancy and also serves as a member of the Advisory Board for the School of Engineering of the University of Southern California. |
Ned C. Lautenbach (63) |
| Year of Election or Appointment: 2000 Mr. Lautenbach is Chairman of the Independent Trustees (2006-present). Mr. Lautenbach has been a partner of Clayton, Dubilier & Rice, Inc. (private equity investment firm) since September 1998. Previously, Mr. Lautenbach was with the International Business Machines Corporation (IBM) from 1968 until his retirement in 1998. Mr. Lautenbach serves as a Director of Sony Corporation (2006-present) and Eaton Corporation (diversified industrial) as well as the Philharmonic Center for the Arts in Naples, Florida. He also is a member of the Board of Trustees of Fairfield University (2005-present), as well as a member of the Council on Foreign Relations. |
Cornelia M. Small (63) |
| Year of Election or Appointment: 2005 Ms. Small is a member (2000-present) and Chairperson (2002-present) of the Investment Committee, and a member (2002-present) of the Board of Trustees of Smith College. Previously, she served as Chief Investment Officer (1999-2000), Director of Global Equity Investments (1996-1999), and a member of the Board of Directors of Scudder, Stevens & Clark (1990-1997) and Scudder Kemper Investments (1997-1999). In addition, Ms. Small served as Co-Chair (2000-2003) of the Annual Fund for the Fletcher School of Law and Diplomacy. |
William S. Stavropoulos (68) |
| Year of Election or Appointment: 2001 Mr. Stavropoulos is Chairman Emeritus of the Board of Directors of The Dow Chemical Company. Since joining The Dow Chemical Company in 1967, Mr. Stavropoulos served in numerous senior management positions, including President (1993-2000; 2002-2003), CEO (1995-2000; 2002-2004), and Chairman of the Executive Committee (2000-2004). Currently, he is a Director of NCR Corporation (data warehousing and technology solutions), Chemical Financial Corporation, Maersk Inc. (industrial conglomerate, 2002-present), Tyco International, Inc. (multinational manufacturing and services, 2007-present), and a member of the Advisory Board for Metalmark Capital (private equity investment firm, 2005-present). He is a special advisor to Clayton, Dubilier & Rice, Inc., a private equity investment firm. He also serves as a member of the Board of Trustees of the American Enterprise Institute for Public Policy Research. In addition, Mr. Stavropoulos is a member of The Business Council, J.P. Morgan International Council and the University of Notre Dame Advisory Council for the College of Science. |
Kenneth L. Wolfe (68) |
| Year of Election or Appointment: 2005 Prior to his retirement in 2001, Mr. Wolfe was Chairman and Chief Executive Officer of Hershey Foods Corporation (1993-2001). He currently serves as a member of the boards of Adelphia Communications Corporation (2003-present), Bausch & Lomb, Inc., and Revlon Inc. (2004-present). |
Advisory Board Members and Executive Officers**:
Correspondence intended for Mr. Mauriello, Mr. Thomas, and Mr. Wiley may be sent to Fidelity Investments, P.O. Box 55235, Boston, Massachusetts 02205-5235. Correspondence intended for each executive officer and Mr. Lynch may be sent to Fidelity Investments, 82 Devonshire Street, Boston, Massachusetts 02109.
Name, Age; Principal Occupation |
Peter S. Lynch (63) |
| Year of Election or Appointment: 2003 Member of the Advisory Board of Fidelity Investment Trust. Mr. Lynch is Vice Chairman and a Director of FMR, and Vice Chairman (2001-present) and a Director of FMR Co., Inc. Previously, Mr. Lynch served as a Trustee of the Fidelity funds (1990-2003). In addition, he serves as a Trustee of Boston College and as the Chairman of the Inner-City Scholarship Fund. |
Joseph Mauriello (63) |
| Year of Election or Appointment: 2007 Member of the Advisory Board of Fidelity Investment Trust. Prior to his retirement in January 2006, Mr. Mauriello served in numerous senior management positions including Deputy Chairman and Chief Operating Officer (2004-2005), and Vice Chairman of Financial Services (2002-2004) of KPMG LLP US (professional services firm, 1965-2005). Mr. Mauriello currently serves as a member of the Board of Directors of XL Capital Ltd., (global insurance and re-insurance company, 2006-present) and of Arcadia Resources Inc., (health care services and products, 2007-present). He also served as a Director of the Hamilton Funds of the Bank of New York (2006-2007). |
David M. Thomas (58) |
| Year of Election or Appointment: 2007 Member of the Advisory Board of Fidelity Investment Trust. Previously, Mr. Thomas served as Executive Chairman (2005-2006) and Chairman and Chief Executive Officer (2000-2005) of IMS Health, Inc. (pharmaceutical and healthcare information solutions). In addition, Mr. Thomas serves as a member of the Board of Directors of Fortune Brands, Inc. (consumer products holding company), and Interpublic Group of Companies, Inc. (marketing communication, 2004-present). |
Michael E. Wiley (57) |
| Year of Election or Appointment: 2007 Member of the Advisory Board of Fidelity Investment Trust. Mr. Wiley also serves as Sr. Energy Advisor of Katzenbach Partners, LLC (consulting firm, 2006-present) and a member of the Board of Trustees of the University of Tulsa (2000-2006; 2007-present). He serves as a Director of Tesoro Corporation (independent oil refiner and marketer, 2005-present), and a Director of Bill Barrett Corporation (exploration and production company, 2005-present). In addition, he also serves as a Director of Post Oak Bank (privately-held bank, 2004-present), and an Advisory Director of Riverstone Holdings (private investment firm). Previously, Mr. Wiley served as Chairman, President, and CEO of Baker Hughes, Inc. (oilfield services company, 2000-2004), and as Director of Spinnaker Exploration Company (exploration and production company, 2001-2005). |
Kimberley H. Monasterio (43) |
| Year of Election or Appointment: 2007 President and Treasurer of the fund. Ms. Monasterio also serves as President and Treasurer of other Fidelity funds (2007-present) and is an employee of FMR (2004-present). Previously, Ms. Monasterio served as Deputy Treasurer of the Fidelity funds (2004-2006). Before joining Fidelity Investments, Ms. Monasterio served as Treasurer (2000-2004) and Chief Financial Officer (2002-2004) of the Franklin Templeton Funds and Senior Vice President of Franklin Templeton Services, LLC (2000-2004). |
Walter C. Donovan (45) |
| Year of Election or Appointment: 2007 Vice President of the fund. Mr. Donovan also serves as Vice President of Fidelity's Equity Funds (2007-present). Mr. Donovan also serves as Executive Vice President of FMR (2005-present) and FMR Co., Inc. (2005-
present). Previously, Mr. Donovan served as Vice President of Fidelity's High Income Funds (2005-2007), Fixed-Income Funds (2005-2006), certain Asset Allocation Funds (2005-2006), certain Balanced Funds (2005-
2006), and as Vice President and Director of Fidelity's International Equity Trading group (1998-2005). |
Eric M. Wetlaufer (45) |
| Year of Election or Appointment: 2006 Vice President of the fund. Mr. Wetlaufer also serves as Vice President of certain International Equity Funds (2006-present). Mr. Wetlaufer is Senior Vice President of FMR (2006-present) and FMR Co., Inc. (2006-present), and President and Director of Fidelity Management & Research (U.K.) Inc. (2006-present) and Fidelity Research & Analysis Company (2006-
present). Before joining Fidelity Investments in 2005, Mr. Wetlaufer was a partner in Oxhead Capital Management (2004-2005). Previously, Mr. Wetlaufer served as a Chief Investment Officer of Putnam Investments (1997-2003). |
Eric D. Roiter (58) |
| Year of Election or Appointment: 2006 Secretary of the fund. He also serves as Secretary of other Fidelity funds; Vice President, General Counsel, and Secretary of FMR Co., Inc. (2001-present) and FMR; Assistant Secretary of Fidelity Management & Research (U.K.) Inc. (2001-present), Fidelity Research & Analysis Company (2001-present), and Fidelity Investments Money Management, Inc. (2001-present). Mr. Roiter is an Adjunct Member, Faculty of Law, at Boston College Law School (2003-present). Previously, Mr. Roiter served as Vice President and Secretary of Fidelity Distributors Corporation (FDC) (1998-2005). |
Scott C. Goebel (39) |
| Year of Election or Appointment: 2007 Assistant Secretary of the fund. Mr. Goebel also serves as Assistant Secretary of other Fidelity funds (2007-present), and is an employee of FMR. |
R. Stephen Ganis (41) |
| Year of Election or Appointment: 2006 Anti-Money Laundering (AML) officer of the fund. Mr. Ganis also serves as AML officer of other Fidelity funds (2006-present) and FMR LLC (2003-present). Before joining Fidelity Investments, Mr. Ganis practiced law at Goodwin Procter, LLP (2000-2002). |
Joseph B. Hollis (59) |
| Year of Election or Appointment: 2006 Chief Financial Officer of the fund. Mr. Hollis also serves as Chief Financial Officer of other Fidelity funds. Mr. Hollis is President of Fidelity Pricing and Cash Management Services (FPCMS) (2005-present). Mr. Hollis also serves as President and Director of Fidelity Service Company, Inc. (2006-present). Previously, Mr. Hollis served as Senior Vice President of Cash Management Services (1999-2002) and Investment Management Operations (2002-2005). |
Kenneth A. Rathgeber (60) |
| Year of Election or Appointment: 2006 Chief Compliance Officer of the fund. Mr. Rathgeber also serves as Chief Compliance Officer of other Fidelity funds (2004-present) and Executive Vice President of Risk Oversight for Fidelity Investments (2002-
present). He is Chief Compliance Officer of FMR (2005-present), FMR Co., Inc. (2005-present), Fidelity Management & Research (U.K.) Inc. (2005-present), Fidelity Research & Analysis Company (2005-present), Fidelity Investments Money Management, Inc. (2005-present), and Strategic Advisers, Inc. (2005-present). Previously, Mr. Rathgeber served as Executive Vice President and Chief Operating Officer for Fidelity Investments Institutional Services Company, Inc. (1998-2002). |
Bryan A. Mehrmann (46) |
| Year of Election or Appointment: 2006 Deputy Treasurer of the fund. Mr. Mehrmann also serves as Deputy Treasurer of other Fidelity funds (2005-present) and is an employee of FMR. Previously, Mr. Mehrmann served as Vice President of Fidelity Investments Institutional Services Group (FIIS)/Fidelity Investments Institutional Operations Corporation, Inc. (FIIOC) Client Services (1998-2004). |
Kenneth B. Robins (38) |
| Year of Election or Appointment: 2006 Deputy Treasurer of the fund. Mr. Robins also serves as Deputy Treasurer of other Fidelity funds (2005-present) and is an employee of FMR (2004-present). Before joining Fidelity Investments, Mr. Robins worked at KPMG LLP, where he was a partner in KPMG's department of professional practice (2002-2004) and a Senior Manager (1999-2000). In addition, Mr. Robins served as Assistant Chief Accountant, United States Securities and Exchange Commission (2000-2002). |
Robert G. Byrnes (40) |
| Year of Election or Appointment: 2006 Assistant Treasurer of the fund. Mr. Byrnes also serves as Assistant Treasurer of other Fidelity funds (2005-present) and is an employee of FMR (2005-present). Previously, Mr. Byrnes served as Vice President of FPCMS (2003-2005). Before joining Fidelity Investments, Mr. Byrnes worked at Deutsche Asset Management where he served as Vice President of the Investment Operations Group (2000-2003). |
Peter L. Lydecker (53) |
| Year of Election or Appointment: 2006 Assistant Treasurer of the fund. Mr. Lydecker also serves as Assistant Treasurer of other Fidelity funds (2004) and is an employee of FMR. |
Paul M. Murphy (60) |
| Year of Election or Appointment: 2007 Assistant Treasurer of the fund. Mr. Murphy also serves as Assistant Treasurer of other Fidelity funds (2007-present) and is an employee of FMR (2007-present). Previously, Mr. Murphy served as Chief Financial Officer of the Fidelity Funds (2005-2006), Vice President and Associate General Counsel of FMR (2007), and Senior Vice President of Fidelity Pricing and Cash Management Services Group (FPCMS) (1994-2007). |
Gary W. Ryan (49) |
| Year of Election or Appointment: 2006 Assistant Treasurer of the fund. Mr. Ryan also serves as Assistant Treasurer of other Fidelity funds (2005-present) and is an employee of FMR (2005-present). Previously, Mr. Ryan served as Vice President of Fund Reporting in FPCMS (1999-2005). |
** FMR Corp. merged with FMR LLC on October 1, 2007. Any references to FMR LLC for prior periods are deemed to be references to the prior entity.
Annual Report
Distributions
The Board of Trustees of Fidelity International Value Fund voted to pay to shareholders of record at the opening of business on record date, the following distributions per share derived from capital gains realized from sales of portfolio securities, and dividends derived from net investment income:
| Pay Date | Record Date | Dividends | Capital Gains |
Institutional Class | 12/10/07 | 12/07/07 | $0.195 | $0.62 |
The fund hereby designates as a capital gain dividend with respect to the taxable year ended October 31, 2007 $10,388,114, or, if subsequently determined to be different, the net capital gain of such year.
Institutional Class designates 97% of the dividends distributed in December during the fiscal year as amounts which may be taken into account as a dividend for purposes of the maximum rate under section 1(h)(11) of the Internal Revenue Code.
The amounts per share which represent income derived from sources within, and taxes paid to, foreign countries or possessions of the United States are as follows:
| Pay Date | Income | Taxes |
Institutional Class | 12/11/06 | $0.016 | $0.0029 |
The fund will notify shareholders in January 2008 of amounts for use in preparing 2007 income tax returns.
Annual Report
Board Approval of Investment Advisory Contracts and Management Fees
Fidelity International Value Fund
Each year, typically in July, the Board of Trustees, including the Independent Trustees (together, the Board), votes on the renewal of the management contract and sub-advisory agreements (together, the Advisory Contracts) for the fund. The Board, assisted by the advice of fund counsel and Independent Trustees' counsel, requests and considers a broad range of information throughout the year.
The Board meets regularly each month except August and takes into account throughout the year matters bearing on Advisory Contracts. The Board, acting directly and through its separate committees, considers at each of its meetings factors that are relevant to the annual renewal of the fund's Advisory Contracts, including the services and support provided to the fund and its shareholders. At the time of the renewal, the Board had 12 standing committees, each composed of Independent Trustees with varying backgrounds, to which the Board has assigned specific subject matter responsibilities in order to enhance effective decision-making by the Board. Each committee has adopted a written charter outlining the structure and purposes of the committee. One such committee, the Equity Contract Committee, meets periodically as needed throughout the year to consider matters specifically related to the annual renewal of Advisory Contracts. The committee requests and receives information on, and makes recommendations to the Independent Trustees concerning, the approval and annual review of the Advisory Contracts.
At its July 2007 meeting, the Board of Trustees, including the Independent Trustees, unanimously determined to renew the Advisory Contracts for the fund. In reaching its determination, the Board considered all factors it believed relevant, including (i) the nature, extent, and quality of the services to be provided to the fund and its shareholders (including the investment performance of the fund); (ii) the competitiveness of the management fee and total expenses of the fund; (iii) the total costs of the services to be provided by and the profits to be realized by the investment adviser and its affiliates from the relationship with the fund; (iv) the extent to which economies of scale would be realized as the fund grows; and (v) whether fee levels reflect these economies of scale, if any, for the benefit of fund shareholders. The Board also approved amendments to the fund's agreements with foreign sub-advisers to clarify that each sub-adviser provides services as an independent contractor.
In determining whether to renew the Advisory Contracts for the fund, the Board ultimately reached a determination, with the assistance of fund counsel and Independent Trustees' counsel, that the renewal of the Advisory Contracts and the compensation to be received by Fidelity under the management contract is consistent with Fidelity's fiduciary duty under applicable law. In addition to evaluating the specific factors noted above, the Board, in reaching its determination, is aware that shareholders in the fund have a broad range of investment choices available to them, including a wide choice among mutual funds offered by competitors to Fidelity, and that the fund's shareholders, with the opportunity to review and weigh the disclosure provided by the fund in its prospectus and other public disclosures, have chosen to invest in this fund, managed by Fidelity.
Annual Report
Nature, Extent, and Quality of Services Provided. The Board considered staffing within the investment adviser, FMR, and the sub-advisers (together, the Investment Advisers), including the background of the fund's portfolio manager and the fund's investment objective and discipline. The Independent Trustees also had discussions with senior management of Fidelity's investment operations and investment groups. The Board considered the structure of the portfolio manager compensation program and whether this structure provides appropriate incentives.
Resources Dedicated to Investment Management and Support Services. The Board reviewed the size, education, and experience of the Investment Advisers' investment staff, their use of technology, and the Investment Advisers' approach to recruiting, training, and retaining portfolio managers and other research, advisory, and management personnel. The Board considered Fidelity's extensive global research capabilities that enable the Investment Advisers to aggregate data from various sources in an effort to produce positive investment results. The Board noted that Fidelity's analysts have access to a variety of technological tools that enable them to perform both fundamental and quantitative analysis and to specialize in various disciplines. The Board also considered that Fidelity's portfolio managers and analysts have access to daily portfolio attribution that allows for monitoring of a fund's portfolio, as well as an electronic communication system that provides immediate real-time access to research concerning issuers and credit enhancers.
Shareholder and Administrative Services. The Board considered (i) the nature, extent, quality, and cost of advisory, administrative, distribution, and shareholder services performed by the Investment Advisers and their affiliates under the Advisory Contracts and under separate agreements covering transfer agency, pricing and bookkeeping, and securities lending services for the fund; (ii) the nature and extent of the Investment Advisers' supervision of third party service providers, principally custodians and subcustodians; and (iii) the resources devoted to, and the record of compliance with, the fund's compliance policies and procedures. The Board reviewed the allocation of fund brokerage, including allocations to brokers affiliated with the Investment Advisers, the use of brokerage commissions to pay fund expenses, and the use of "soft" commission dollars to pay for research services. The Board also considered that Fidelity voluntarily pays for market data out of its own resources.
The Board noted that the growth of fund assets across the complex allows Fidelity to reinvest in the development of services designed to enhance the value or convenience of the Fidelity funds as investment vehicles. These services include 24-hour access to account information and market information through phone representatives and over the Internet, and investor education materials and asset allocation tools.
Annual Report
Board Approval of Investment Advisory Contracts and
Management Fees - continued
Investment in a Large Fund Family. The Board considered the benefits to shareholders of investing in a Fidelity fund, including the benefits of investing in a fund that is part of a large family of funds offering a variety of investment disciplines and providing for a large variety of mutual fund investor services. For example, fund shareholders are offered the privilege of exchanging shares of the fund for shares of other Fidelity funds, as set forth in the fund's prospectus, without paying a sales charge. The Board noted that, since July 2006, Fidelity has taken a number of actions that benefited particular funds, including (i) dedicating additional resources to investment research and to restructure the investment research teams; (ii) contractually agreeing to reduce the management fee on Fidelity Advisor Floating Rate High Income Fund; (iii) contractually agreeing to reduce the management fees on Fidelity's California, Massachusetts, New Jersey, and New York AMT Tax-Free Money Market Funds, launching new Institutional Classes and Service Classes of these funds, and contractually agreeing to impose expense limitations on these funds; (iv) eliminating the exchange fee on the Fidelity Select Portfolios and reducing the pricing and bookkeeping fee rates for these funds; (v) reducing the maximum transfer agency fee rates on high income funds and certain equity funds; (vi) proposing amended management contracts that, if approved by shareholders, will add a performance adjustment component to the management fees paid by 18 Fidelity Advisor equity funds; (vii) contractually agreeing to reduce fees for Ultra-Short Central Fund and the money market Central Funds; (viii) waiving the Fidelity Advisor funds' contingent deferred sales charge on certain redemptions made through systematic withdrawal programs; and (ix) amending the management contracts for equity and fixed-income funds whose management contracts incorporate a "group fee" structure by adding four new fee "breakpoints" to the group fee rate schedules.
Investment Performance and Compliance. The Board considered whether the fund has operated within its investment objective, as well as its record of compliance with its investment restrictions. The Board noted that it is not possible to evaluate performance in any comprehensive fashion because the fund had been in operation for less than one calendar year. Once the fund has been in operation for at least one calendar year, the Board will review the fund's absolute investment performance for each class, as well as the fund's relative investment performance for each class measured against a broad-based securities market index and a peer group of mutual funds.
The Board considered that FMR has taken steps to refocus and strengthen equity research, equity portfolio management, and compliance.
Based on its review, and giving particular weight to the nature and quality of the resources dedicated by the Investment Advisers to maintain and improve relative performance, the Board concluded that the nature, extent, and quality of the services provided to the fund will benefit the fund's shareholders, particularly in light of the Board's view that the fund's shareholders benefit from investing in a fund that is part of a large family of funds offering a variety of investment disciplines and services.
Annual Report
Competitiveness of Management Fee and Total Fund Expenses. The Board considered the fund's management fee and total expenses compared to "mapped groups" of competitive funds and classes. Fidelity creates "mapped groups" by combining similar Lipper investment objective categories that have comparable management fee characteristics. Combining Lipper investment objective categories aids the Board's management fee and total expense comparisons by broadening the competitive group used for comparison and by reducing the number of universes to which various Fidelity funds are compared. The Board also considered supplemental information about how the fund's management fee and total expenses ranked relative to groups based on Lipper classifications, which take into account a fund's market capitalization and style.
The Board considered two proprietary management fee comparisons for the period of the fund's operations shown in the chart below. The group of Lipper funds used by the Board for management fee comparisons is referred to below as the "Total Mapped Group." The Total Mapped Group comparison focuses on a fund's standing relative to the total universe of comparable funds available to investors, in terms of gross management fees before expense reimbursements or caps. "TMG %" represents the percentage of funds in the Total Mapped Group that had management fees that were lower than the fund's. For example, a TMG % of 15% means that 85% of the funds in the Total Mapped Group had higher management fees than the fund. The "Asset-Size Peer Group" (ASPG) comparison focuses on a fund's standing relative to non-Fidelity funds similar in size to the fund within the Total Mapped Group. The ASPG represents at least 15% of the funds in the Total Mapped Group with comparable asset size and management fee characteristics, subject to a minimum of 50 funds (or all funds in the Total Mapped Group if fewer than 50). Additional information, such as the ASPG quartile in which the fund's management fee ranked, is also included in the chart and considered by the Board.
Annual Report
Board Approval of Investment Advisory Contracts and
Management Fees - continued
Fidelity International Value Fund

The Board noted that the fund's management fee ranked below the median of its Total Mapped Group and below the median of its ASPG for the period.
Based on its review, the Board concluded that the fund's management fee was fair and reasonable in light of the services that the fund receives and the other factors considered.
In its review of each class's total expenses, the Board considered the fund's management fee as well as other fund or class expenses, as applicable, such as transfer agent fees, pricing and bookkeeping fees, fund-paid 12b-1 fees, and custodial, legal, and audit fees. The Board also noted the effects of any waivers and reimbursements on fees and expenses. As part of its review, the Board also considered current and historical total expenses of each class of the fund compared to competitive fund median expenses. Each class of the fund is compared to those funds and classes in the Total Mapped Group (used by the Board for management fee comparisons) that have a similar sales load structure.
The Board noted that the total expenses of each of Class A and Fidelity International Value (retail class) ranked below its competitive median for the period, the total expenses of each of Class B and Class C ranked equal to its competitive median for the period, and the total expenses of each of Class T and Institutional Class ranked above its competitive median for the period. The Board noted that the fund offers multiple classes, each of which has a different sales load and 12b-1 fee structure, and that the multiple structures are intended to offer a range of pricing options for the intermediary market. The Board also noted that the total expenses of the classes vary primarily by the level of their 12b-1 fees, although differences in transfer agent fees may also cause expenses to vary from class to class.
Annual Report
In its review of total expenses, the Board also considered Fidelity fee structures and other information on clients that FMR and its affiliates service in other competitive markets, such as other mutual funds advised or subadvised by FMR or its affiliates, pension plan clients, and other institutional clients.
Based on its review, the Board concluded that the total expenses of each class of the fund were reasonable, although in some cases above the median of the universe presented for comparison, in light of the services that the fund and its shareholders receive and the other factors considered.
Costs of the Services and Profitability. The Board considered the revenues earned and the expenses incurred by Fidelity in conducting the business of developing, marketing, distributing, managing, administering and servicing the fund and its shareholders. The Board also considered the level of Fidelity's profits in respect of all the Fidelity funds.
On an annual basis, FMR presents to the Board Fidelity's profitability for the fund. Fidelity calculates the profitability for each fund, as well as aggregate profitability for groups of Fidelity funds and all Fidelity funds, using a series of detailed revenue and cost allocation methodologies which originate with the audited books and records of Fidelity. The Audit Committee of the Board reviews any significant changes from the prior year's methodologies.
PricewaterhouseCoopers LLP (PwC), independent registered public accounting firm and auditor to Fidelity and certain Fidelity funds, has been engaged annually by the Board as part of the Board's assessment of the results of Fidelity's profitability analysis. PwC's engagement includes the review and assessment of Fidelity's methodologies used in determining the revenues and expenses attributable to Fidelity's mutual fund business, and completion of agreed-upon procedures surrounding the mathematical accuracy of fund profitability and its conformity to allocation methodologies. After considering PwC's reports issued under the engagement and information provided by Fidelity, the Board believes that while other allocation methods may also be reasonable, Fidelity's profitability methodologies are reasonable in all material respects.
The Board has also reviewed Fidelity's non-fund businesses and any fall-out benefits related to the mutual fund business as well as cases where Fidelity's affiliates may benefit from or be related to the fund's business.
The Board considered the costs of the services provided by and the profits realized by Fidelity in connection with the operation of the fund and determined that the amount of profit is a fair entrepreneurial profit for the management of the fund.
Economies of Scale. The Board considered whether there have been economies of scale in respect of the management of the Fidelity funds, whether the Fidelity funds (including the fund) have appropriately benefited from any such economies of scale, and whether there is potential for realization of any further economies of scale. The Board considered the extent to which the fund will benefit from economies of scale through increased services to the fund, through waivers or reimbursements, or through fee or expense reductions, including reductions that occur through operation of the transfer agent agreement. The transfer agent fee varies in part based on the number of accounts in the fund. If the number of accounts decreases or the average account size increases, the overall transfer agent fee rate decreases.
Annual Report
Board Approval of Investment Advisory Contracts and
Management Fees - continued
The Board recognized that the fund's management contract incorporates a "group fee" structure, which provides for lower group fee rates as total fund assets under FMR's management increase, and for higher group fee rates as total fund assets under FMR's management decrease. FMR determines the group fee rates based on a tiered asset "breakpoint" schedule. In connection with the renewal of the fund's management contract, the Board approved amendments to the fund's management contract that added four new fee breakpoints to the group fee rate schedule for assets under FMR's management above $1,386 billion. The Board considered that the group fee rate declines under both the present and amended schedules, but that under the amended schedule, the group fee rate declines faster as assets under FMR's management exceed $1,386 billion. The Board considered that the group fee is designed to deliver the benefits of economies of scale to fund shareholders when total fund assets increase, even if assets of any particular fund are unchanged or have declined, because some portion of Fidelity's costs are attributable to services provided to all Fidelity funds, and all funds benefit if those costs can be allocated among more assets. The Board concluded that, given the group fee structure, fund shareholders will achieve a certain level of economies of scale as assets under FMR's management increase at the fund complex level, regardless of whether Fidelity achieves any such economies of scale.
The Board further concluded that any potential economies of scale are being shared between fund shareholders and Fidelity in an appropriate manner.
Additional Information Requested by the Board. In order to develop fully the factual basis for consideration of the Fidelity funds' Advisory Contracts, the Board requested and received additional information on several topics, including (i) fund performance trends and actions to be taken by FMR to improve certain funds' overall performance; (ii) Fidelity's portfolio manager compensation structure, including its effects on fund profitability and the extent to which portfolio manager compensation is linked to fund performance; (iii) Fidelity's fee structures; (iv) the funds' sub-advisory arrangements; and (v) accounts managed by Fidelity other than the Fidelity funds.
Based on its evaluation of all of the conclusions noted above, and after considering all material factors, the Board ultimately concluded that the advisory fee structures are fair and reasonable, and that the fund's Advisory Contracts should be renewed.
Annual Report
Annual Report
Investment Adviser
Fidelity Management & Research Company
Boston, MA
Investment Sub-Advisers
FMR Co., Inc.
Fidelity Management & Research
(U.K.) Inc.
Fidelity Research & Analysis Company
Fidelity International
Investment Advisors
Fidelity Investments Japan Limited
Fidelity International Investment Advisors (U.K.) Limited
General Distributor
Fidelity Distributors Corporation
Boston, MA
Transfer and Service Agents
Fidelity Investments Institutional Operations Company, Inc.
Boston, MA
Fidelity Service Company, Inc.
Boston, MA
Custodian
The Northern Trust Company
Chicago, IL
AFIVI-UANN-1207
1.827488.101
(Fidelity Investment logo)(registered trademark)
Corporate Headquarters
82 Devonshire St., Boston, MA 02109
www.fidelity.com
Item 2. Code of Ethics
As of the end of the period, October 31, 2007, Fidelity Investment Trust (the trust) has adopted a code of ethics, as defined in Item 2 of Form N-CSR, that applies to its President and Treasurer and its Chief Financial Officer. A copy of the code of ethics is filed as an exhibit to this Form N-CSR.
Item 3. Audit Committee Financial Expert
The Board of Trustees of the trust has determined that Marie L. Knowles is an audit committee financial expert, as defined in Item 3 of Form N-CSR. Ms. Knowles is independent for purposes of Item 3 of Form N-CSR.
Item 4. Principal Accountant Fees and Services
(a) Audit Fees.
For the fiscal years ended October 31, 2007 and October 31, 2006, the aggregate Audit Fees billed by PricewaterhouseCoopers LLP (PwC) for professional services rendered for the audits of the financial statements, or services that are normally provided in connection with statutory and regulatory filings or engagements for those fiscal years, for Fidelity Canada Fund, Fidelity China Region Fund, Fidelity Emerging Markets Fund, Fidelity Europe Fund, Fidelity International Discovery Fund, Fidelity Japan Fund, Fidelity Japan Smaller Companies Fund, Fidelity Latin America Fund, Fidelity Nordic Fund, Fidelity Overseas Fund, Fidelity Pacific Basin Fund and Fidelity Southeast Asia Fund (the funds) and for all funds in the Fidelity Group of Funds are shown in the table below.
Fund | 2007A | 2006A |
Fidelity Canada Fund | $70,000 | $62,000 |
Fidelity China Region Fund | $56,000 | $53,000 |
Fidelity Emerging Markets Fund | $86,000 | $117,000 |
Fidelity Europe Fund | $75,000 | $71,000 |
Fidelity International Discovery Fund | $98,000 | $80,000 |
Fidelity Japan Fund | $63,000 | $60,000 |
Fidelity Japan Smaller Companies Fund | $50,000 | $51,000 |
Fidelity Latin America Fund | $83,000 | $76,000 |
Fidelity Nordic Fund | $53,000 | $47,000 |
Fidelity Overseas Fund | $90,000 | $109,000 |
Fidelity Pacific Basin Fund | $60,000 | $58,000 |
Fidelity Southeast Asia Fund | $79,000 | $74,000 |
All funds in the Fidelity Group of Funds audited by PwC | $14,400,000 | $13,400,000 |
A | Aggregate amounts may reflect rounding. |
For the fiscal years ended October 31, 2007 and October 31, 2006, the aggregate Audit Fees billed by Deloitte & Touche LLP, the member firms of Deloitte Touche Tohmatsu, and their respective affiliates (collectively, "Deloitte Entities") for professional services rendered for the audits of the financial statements, or services that are normally provided in connection with statutory and regulatory filings or engagements for those fiscal years, for Fidelity Aggressive International Fund, Fidelity Diversified International Fund, Fidelity Europe Capital Appreciation Fund, Fidelity International Small Cap Fund, Fidelity International Small Cap Opportunities Fund, Fidelity International Value Fund and Fidelity Worldwide Fund (the funds) and for all funds in the Fidelity Group of Funds are shown in the table below.
Fund | 2007A | 2006A,B |
Fidelity Aggressive International Fund | $48,000 | $45,000 |
Fidelity Diversified International Fund | $138,000 | $120,000 |
Fidelity Europe Capital Appreciation Fund | $46,000 | $39,000 |
Fidelity International Small Cap Fund | $95,000 | $70,000 |
Fidelity International Small Cap Opportunities Fund | $53,000 | $41,000 |
Fidelity International Value Fund | $46,000 | $43,000 |
Fidelity Worldwide Fund | $51,000 | $45,000 |
All funds in the Fidelity Group of Funds audited by Deloitte Entities | $7,300,000 | $6,500,000 |
A | Aggregate amounts may reflect rounding. |
B | Fidelity International Value Fund commenced operations on May 18, 2006. |
(b) Audit-Related Fees.
In each of the fiscal years ended October 31, 2007 and October 31, 2006, the aggregate Audit-Related Fees billed by PwC for services rendered for assurance and related services to each fund that are reasonably related to the performance of the audit or review of the fund's financial statements, but not reported as Audit Fees, are shown in the table below.
Fund | 2007A | 2006 A |
Fidelity Canada Fund | $0 | $0 |
Fidelity China Region Fund | $0 | $0 |
Fidelity Emerging Markets Fund | $0 | $0 |
Fidelity Europe Fund | $0 | $0 |
Fidelity International Discovery Fund | $0 | $0 |
Fidelity Japan Fund | $0 | $0 |
Fidelity Japan Smaller Companies Fund | $0 | $0 |
Fidelity Latin America Fund | $0 | $0 |
Fidelity Nordic Fund | $0 | $0 |
Fidelity Overseas Fund | $0 | $0 |
Fidelity Pacific Basin Fund | $0 | $0 |
Fidelity Southeast Asia Fund | $0 | $0 |
A | Aggregate amounts may reflect rounding. |
In each of the fiscal years ended October 31, 2007 and October 31, 2006, the aggregate Audit-Related Fees billed by Deloitte Entities for services rendered for assurance and related services to each fund that are reasonably related to the performance of the audit or review of the fund's financial statements, but not reported as Audit Fees, are shown in the table below.
Fund | 2007A | 2006 A,B |
Fidelity Aggressive International Fund | $0 | $0 |
Fidelity Diversified International Fund | $0 | $0 |
Fidelity Europe Capital Appreciation Fund | $0 | $0 |
Fidelity International Small Cap Fund | $0 | $0 |
Fidelity International Small Cap Opportunities Fund | $0 | $0 |
Fidelity International Value Fund | $0 | $0 |
Fidelity Worldwide Fund | $0 | $0 |
A | Aggregate amounts may reflect rounding. |
B | Fidelity International Value Fund commenced operations on May 18, 2006. |
In each of the fiscal years ended October 31, 2007 and October 31, 2006, the aggregate Audit-Related Fees that were billed by PwC and Deloitte Entities that were required to be approved by the Audit Committee for services rendered on behalf of Fidelity Management & Research Company (FMR) and entities controlling, controlled by, or under common control with FMR (not including any sub-adviser whose role is primarily portfolio management and is subcontracted with or overseen by another investment adviser) that provide ongoing services to the funds ("Fund Service Providers") for assurance and related services that relate directly to the operations and financial reporting of each fund that are reasonably related to the performance of the audit or review of the fund's financial statements, but not reported as Audit Fees, are shown in the table below.
Billed By | 2007 A | 2006A |
PwC | $0 | $0 |
Deloitte Entities | $0 | $0 |
A | Aggregate amounts may reflect rounding. |
Fees included in the audit-related category comprise assurance and related services (e.g., due diligence services) that are traditionally performed by the independent registered public accounting firm. These audit-related services include due diligence related to mergers and acquisitions, accounting consultations and audits in connection with acquisitions, internal control reviews, attest services that are not required by statute or regulation and consultation concerning financial accounting and reporting standards.
(c) Tax Fees.
In each of the fiscal years ended October 31, 2007 and October 31, 2006, the aggregate Tax Fees billed by PwC for professional services rendered for tax compliance, tax advice, and tax planning for each fund is shown in the table below.
Fund | 2007A | 2006A |
Fidelity Canada Fund | $4,800 | $4,600 |
Fidelity China Region Fund | $4,800 | $4,600 |
Fidelity Emerging Markets Fund | $58,700 | $22,900 |
Fidelity Europe Fund | $4,800 | $4,600 |
Fidelity International Discovery Fund | $47,100 | $15,800 |
Fidelity Japan Fund | $4,800 | $7,600 |
Fidelity Japan Smaller Companies Fund | $4,800 | $4,600 |
Fidelity Latin America Fund | $4,800 | $4,600 |
Fidelity Nordic Fund | $4,800 | $4,600 |
Fidelity Overseas Fund | $4,800 | $4,600 |
Fidelity Pacific Basin Fund | $68,400 | $27,600 |
Fidelity Southeast Asia Fund | $17,600 | $6,100 |
A | Aggregate amounts may reflect rounding. |
In each of the fiscal years ended October 31, 2007 and October 31, 2006, the aggregate Tax Fees billed by Deloitte Entities for professional services rendered for tax compliance, tax advice, and tax planning for each fund is shown in the table below.
Fund | 2007A | 2006A,B |
Fidelity Aggressive International Fund | $6,200 | $4,000 |
Fidelity Diversified International Fund | $6,200 | $4,000 |
Fidelity Europe Capital Appreciation Fund | $5,200 | $4,200 |
Fidelity International Small Cap Fund | $6,200 | $4,000 |
Fidelity International Small Cap Opportunities Fund | $5,200 | $3,800 |
Fidelity International Value Fund | $5,200 | $3,900 |
Fidelity Worldwide Fund | $5,200 | $4,000 |
A | Aggregate amounts may reflect rounding. |
B | Fidelity International Value Fund commenced operations on May 18, 2006. |
In each of the fiscal years ended October 31, 2007 and October 31, 2006, the aggregate Tax Fees billed by PwC and Deloitte Entities that were required to be approved by the Audit Committee for professional services rendered on behalf of the Fund Service Providers for tax compliance, tax advice, and tax planning that relate directly to the operations and financial reporting of each fund is shown in the table below.
Billed By | 2007A | 2006A |
PwC | $0 | $0 |
Deloitte Entities | $0 | $0 |
A | Aggregate amounts may reflect rounding. |
Fees included in the Tax Fees category comprise all services performed by professional staff in the independent registered public accounting firm's tax division except those services related to the audit. Typically, this category would include fees for tax compliance, tax planning, and tax advice. Tax compliance, tax advice, and tax planning services include preparation of original and amended tax returns, claims for refund and tax payment-planning services, assistance with tax audits and appeals, tax advice related to mergers and acquisitions and requests for rulings or technical advice from taxing authorities.
(d) All Other Fees.
In each of the fiscal years ended October 31, 2007 and October 31, 2006, the aggregate Other Fees billed by PwC for all other non-audit services rendered to the funds is shown in the table below.
Fund | 2007A | 2006A |
Fidelity Canada Fund | $3,400 | $3,000 |
Fidelity China Region Fund | $1,900 | $1,600 |
Fidelity Emerging Markets Fund | $3,800 | $3,000 |
Fidelity Europe Fund | $4,300 | $3,400 |
Fidelity International Discovery Fund | $8,400 | $5,400 |
Fidelity Japan Fund | $2,400 | $2,500 |
Fidelity Japan Smaller Companies Fund | $1,800 | $2,500 |
Fidelity Latin America Fund | $4,000 | $3,000 |
Fidelity Nordic Fund | $1,600 | $1,400 |
Fidelity Overseas Fund | $6,600 | $5,500 |
Fidelity Pacific Basin Fund | $1,900 | $1,900 |
Fidelity Southeast Asia Fund | $3,000 | $2,000 |
A | Aggregate amounts may reflect rounding. |
In each of the fiscal years ended October 31, 2007 and October 31, 2006, the aggregate Other Fees billed by Deloitte Entities for all other non-audit services rendered to the funds is shown in the table below.
Fund | 2007A | 2006A,B |
Fidelity Aggressive International Fund | $0 | $0 |
Fidelity Diversified International Fund | $0 | $0 |
Fidelity Europe Capital Appreciation Fund | $0 | $0 |
Fidelity International Small Cap Fund | $0 | $0 |
Fidelity International Small Cap Opportunities Fund | $0 | $0 |
Fidelity International Value Fund | $0 | $0 |
Fidelity Worldwide Fund | $0 | $0 |
A | Aggregate amounts may reflect rounding. |
B | Fidelity International Value Fund commenced operations on May 18, 2006. |
In each of the fiscal years ended October 31, 2007 and October 31, 2006, the aggregate Other Fees billed by PwC and Deloitte Entities that were required to be approved by the Audit Committee for all other non-audit services rendered on behalf of the Fund Service Providers that relate directly to the operations and financial reporting of each fund is shown in the table below.
Billed By | 2007A | 2006A |
PwC | $275,000 | $20,000 |
Deloitte Entities | $260,000 | $255,000 |
A | Aggregate amounts may reflect rounding. |
Fees included in the All Other Fees category include services related to internal control reviews, strategy and other consulting, financial information systems design and implementation, consulting on other information systems, and other tax services unrelated to the fund.
(e) (1) | Audit Committee Pre-Approval Policies and Procedures: |
The trust's Audit Committee must pre-approve all audit and non-audit services provided by the independent registered public accounting firm relating to the operations or financial reporting of the funds. Prior to the commencement of any audit or non-audit services to a fund, the Audit Committee reviews the services to determine whether they are appropriate and permissible under applicable law.
The trust's Audit Committee has adopted policies and procedures to, among other purposes, provide a framework for the Committee's consideration of non-audit services by the audit firms that audit the Fidelity funds. The policies and procedures require that any non-audit service provided by a fund audit firm to a Fidelity Fund and any non-audit service provided by a fund auditor to a Fund Service Provider that relates directly to the operations and financial reporting of a Fidelity fund (Covered Service) are subject to approval by the Audit Committee before such service is provided. Non-audit services provided by a fund audit firm for a Fund Service Provider that do not relate directly to the operations and financial reporting of a Fidelity fund (Non-Covered Service) but that are expected to exceed $50,000 are also subject to pre-approval by the Audit Committee.
All Covered Services, as well as Non-Covered Services that are expected to exceed $50,000, must be approved in advance of provision of the service either: (i) by formal resolution of the Audit Committee, or (ii) by oral or written approval of the service by the Chair of the Audit Committee (or if the Chair is unavailable, such other member of the Audit Committee as may be designated by the Chair to act in the Chair's absence). The approval contemplated by (ii) above is permitted where the Treasurer determines that action on such an engagement is necessary before the next meeting of the Audit Committee. Neither pre-approval nor advance notice of Non-Covered Service engagements for which fees are not expected to exceed $50,000 is required; such engagements are to be reported to the Audit Committee monthly.
(e) (2) | Services approved pursuant to paragraph (c)(7)(i)(C) of Rule 2-01 of Regulation S-X: |
Audit-Related Fees:
There were no amounts that were approved by the Audit Committee pursuant to the de minimis exception for the fiscal years ended October 31, 2007 and October 31, 2006 on behalf of each fund.
There were no amounts that were required to be approved by the Audit Committee pursuant to the de minimis exception for the fiscal years ended October 31, 2007 and October 31, 2006 on behalf of the Fund Service Providers that relate directly to the operations and financial reporting of each fund.
Tax Fees:
There were no amounts that were approved by the Audit Committee pursuant to the de minimis exception for the fiscal years ended October 31, 2007 and October 31, 2006 on behalf of each fund.
There were no amounts that were required to be approved by the Audit Committee pursuant to the de minimis exception for the fiscal years ended October 31, 2007 and October 31, 2006 on behalf of the Fund Service Providers that relate directly to the operations and financial reporting of each fund.
All Other Fees:
There were no amounts that were approved by the Audit Committee pursuant to the de minimis exception for the fiscal years ended October 31, 2007 and October 31, 2006 on behalf of each fund.
There were no amounts that were required to be approved by the Audit Committee pursuant to the de minimis exception for the fiscal years ended October 31, 2007 and October 31, 2006 on behalf of the Fund Service Providers that relate directly to the operations and financial reporting of each fund.
(f) Not applicable.
(g) For the fiscal years ended October 31, 2007 and October 31, 2006, the aggregate fees billed by PwC of $2,275,000A and $870,000A for non-audit services rendered on behalf of the funds, FMR (not including any sub-adviser whose role is primarily portfolio management and is subcontracted with or overseen by another investment adviser) and Fund Service Providers relating to Covered Services and Non-Covered Services are shown in the table below.
| 2007A | 2006A |
Covered Services | $550,000 | $170,000 |
Non-Covered Services | $1,725,000 | $700,000 |
A | Aggregate amounts may reflect rounding. |
For the fiscal years ended October 31, 2007 and October 31, 2006, the aggregate fees billed by Deloitte Entities of $705,000A and $815,000A for non-audit services rendered on behalf of the fund, FMR (not including any sub-adviser whose role is primarily portfolio management and is subcontracted with or overseen by another investment adviser) and Fund Service Providers relating to Covered Services and Non-Covered Services are shown in the table below.
| 2007A | 2006A |
Covered Services | $300,000 | $285,000 |
Non-Covered Services | $405,000 | $530,000 |
A | Aggregate amounts may reflect rounding. |
(h) The trust's Audit Committee has considered Non-Covered Services that were not pre-approved that were provided by PwC and Deloitte Entities to Fund Service Providers to be compatible with maintaining the independence of PwC and Deloitte Entities in their audit of the funds, taking into account representations from PwC and Deloitte Entities, in accordance with Independence Standards Board Standard No.1, regarding their independence from the funds and their related entities.
Item 5. Audit Committee of Listed Registrants
Not applicable.
Item 6. Schedule of Investments
Not applicable.
Item 7. Disclosure of Proxy Voting Policies and Procedures for Closed-End Management Investment Companies
Not applicable.
Item 8. Portfolio Managers of Closed-End Management Investment Companies
Not applicable.
Item 9. Purchase of Equity Securities by Closed-End Management Investment Company and Affiliated Purchasers
Not applicable.
Item 10. Submission of Matters to a Vote of Security Holders
There were no material changes to the procedures by which shareholders may recommend nominees to the trust's Board of Trustees.
Item 11. Controls and Procedures
(a)(i) The President and Treasurer and the Chief Financial Officer have concluded that the trust's disclosure controls and procedures (as defined in Rule 30a-3(c) under the Investment Company Act) provide reasonable assurances that material information relating to the trust is made known to them by the appropriate persons, based on their evaluation of these controls and procedures as of a date within 90 days of the filing date of this report.
(a)(ii) There was no change in the trust's internal control over financial reporting (as defined in Rule 30a-3(d) under the Investment Company Act) that occurred during the second fiscal quarter of the period covered by this report that has materially affected, or is reasonably likely to materially affect, the trust's internal control over financial reporting.
Item 12. Exhibits
(a) | (1) | Code of Ethics pursuant to Item 2 of Form N-CSR is filed and attached hereto as EX-99.CODE ETH. |
(a) | (2) | Certification pursuant to Rule 30a-2(a) under the Investment Company Act of 1940 (17 CFR 270.30a-2(a)) is filed and attached hereto as Exhibit 99.CERT. |
(a) | (3) | Not applicable. |
(b) | | Certification pursuant to Rule 30a-2(b) under the Investment Company Act of 1940 (17 CFR 270.30a-2(b)) is furnished and attached hereto as Exhibit 99.906CERT. |
SIGNATURES
Pursuant to the requirements of the Securities Exchange Act of 1934 and the Investment Company Act of 1940, the registrant has duly caused this report to be signed on its behalf by the undersigned, thereunto duly authorized.
Fidelity Investment Trust
By: | /s/Kimberley Monasterio |
| Kimberley Monasterio |
| President and Treasurer |
| |
Date: | December 28, 2007 |
Pursuant to the requirements of the Securities Exchange Act of 1934 and the Investment Company Act of 1940, this report has been signed below by the following persons on behalf of the registrant and in the capacities and on the dates indicated.
By: | /s/Kimberley Monasterio |
| Kimberley Monasterio |
| President and Treasurer |
| |
Date: | December 28, 2007 |
By: | /s/Joseph B. Hollis |
| Joseph B. Hollis |
| Chief Financial Officer |
| |
Date: | December 28, 2007 |